Exhibit 99.2

1 HOLDINGS COMPUTING May 2022 Flash June 2022
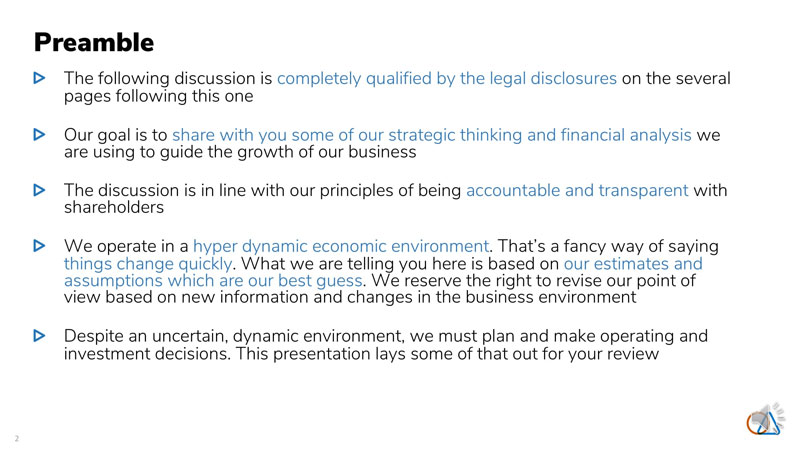
2 Preamble The following discussion is completely qualified by the legal disclosures on the several pages following this one Our goal is to share with you some of our strategic thinking and financial analysis we are using to guide the growth of our business The discussion is in line with our principles of being accountable and transparent with shareholders We operate in a hyper dynamic economic environment. That’s a fancy way of saying things change quickly. What we are telling you here is based on our estimates and assumptions which are our best guess. We reserve the right to revise our point of view based on new information and changes in the business environment Despite an uncertain, dynamic environment, we must plan and make operating and investment decisions. This presentation lays some of that out for your review

3 Legal Disclosure & Disclaimer This presentation includes forward-looking statements within the meaning of the Private Securities Litigation Reform Act that reflect our current views with respect to, among other things, our operations, business strategy, interpretation of prior development activities, plans to develop and commercialize our products and services, potential market opportunity, financial performance and needs for additional financing. We have used words like “anticipate,” “believe,” “could,” “estimate,” “expect,” “future,” “intend,” “may,” “plan,” “potential,” “project,” “will,” and similar terms and phrases to identify forward-looking statements in this presentation. The forward-looking statements contained in this presentation are based on management’s current expectations and are subject to substantial risks, uncertainty and changes in circumstances. Actual results may differ materially from those expressed by these expectations due to risks and uncertainties, including, among others, those related to our ability to obtain additional capital on favorable terms to us, or at all, the success, timing and cost of ongoing or future operations, the lengthy and unpredictable nature of the project development, and technology process and businesses in which we currently engage or may engage. These risks and uncertainties include, but may not be limited to, those described in our filings with the SEC. Forward-looking statements speak only as of the date of this presentation, and we undertake no obligation to review or update any forward-looking statement except as may be required by applicable law.
4 Legal Disclosure & Disclaimer The material in this presentation has been prepared by Soluna and is general background information about Soluna’s activities, current as at the date of this presentation and is provided for information purposes only. It should be read in conjunction with Soluna’s periodic and continuous disclosure announcements filed with the Securities and Exchange Commission. This presentation provides information in summary form only and is not intended to be complete. Soluna makes no representation or warranty, express or implied, as to the accuracy, completeness, fairness or reliability of any of the information, illustrations, examples, opinions, forecasts, reports, estimates and conclusions contained in this presentation. It is not intended to be relied upon as advice or a recommendation to investors or potential investors and does not take into account the investment objectives, financial situation, taxation situation or needs of any particular investor. Due care and consideration should be undertaken when considering and analyzing Soluna’s future performance and business prospects. THIS PRESENTATION IS NOT INTENDED TO SERVE AS A FORECAST OF ANY SUCH FUTURE PERFORMANCE OR PROSPECTS. An investor must not act on any matter contained in this document but must make its own assessment of Soluna and conduct its own investigations and analysis. Investors should assess their own individual financial circumstances and consider talking to a financial adviser, professional adviser or consultant before making any investment decision. This document does not constitute an offer, invitation, solicitation or recommendation with respect to the purchase or sale of any security in Soluna nor does it constitute financial product advice. This document is not a prospectus, product disclosure statement or other offer document under United States federal or state securities law or under any other law. This document has not been filed, registered or approved by regulatory authorities in any jurisdiction. Any projection, forecast, estimate or other “forward-looking” statement in this presentation only illustrates hypothetical performance under specified assumptions of events or conditions that have been clearly delineated herein. Such projections, forecasts, estimates or other “forward-looking” statements are not reliable indicators of future performance. Hypothetical or illustrative performance information contained in these materials may not be relied upon as a promise, prediction or projection of future performance and are subject to significant assumptions and limitations. In addition, not all relevant events or conditions may have been considered in developing such assumptions. READERS OF THIS DOCUMENT SHOULD UNDERSTAND THE ASSUMPTIONS AND EVALUATE WHETHER THEY ARE APPROPRIATE FOR THEIR PURPOSES. SOME EVENTS OR CONDITIONS MAY NOT HAVE BEEN CONSIDERED IN SUCH ASSUMPTIONS. ACTUAL EVENTS OR CONDITIONS WILL VARY AND MAY DIFFER MATERIALLY FROM SUCH ASSUMPTIONS. READERS SHOULD UNDERSTAND SUCH ASSUMPTIONS AND EVALUATE WHETHER THEY ARE APPROPRIATE FOR THEIR PURPOSES. This presentation may include figures related to past performance or simulated past performance as well as forecasted or simulated future performance. Soluna disclaims any obligation to update their views of such risks and uncertainties or to publicly announce the results of any revision to the forward-looking statements made herein.
5 Legal Disclosure & Disclaimer Use of Projections and Illustrations This presentation contains certain financial forecasts and illustrations. Neither Soluna’s [nor Soluna Holdings] independent auditors have studied, reviewed, compiled or performed any procedures with respect to the projections for the purpose of their inclusion in this presentation. The material in this presentation is for illustrative purposes only and should not be relied upon as being necessarily indicative of future results. To supplement our consolidated financial statements, which are prepared and presented in accordance with GAAP, we use the following non-GAAP financial measures: non-gaap revenue, cash contribution margin, cash contribution margin excluding tornado, cash contribution margin excl. tornado & shutdown, adjusted cost of cryptocurrency revenue and adjusted EBITDA contribution. The presentation of this financial information is not intended to be considered in isolation or as a substitute for, or superior to, the financial information prepared and presented in accordance with GAAP. Use of Estimates in Monthly Presentations Numbers presented BEFORE the release of Form 10-Q for second quarter ended June 30th, 2022, are monthly estimates and subject to change upon final accounting adjustments and entries. These monthly estimates are presented as an illustration of management’s review of key metrics that help in understanding the performance of the Company. Readers are strongly encouraged to review this presentation in connection with the Company’s Quarterly Report on Form 10-Q for the period ended March 31, 2022 and the Company’s Annual Report on Form 10-K for the year ended December 31, 2021.
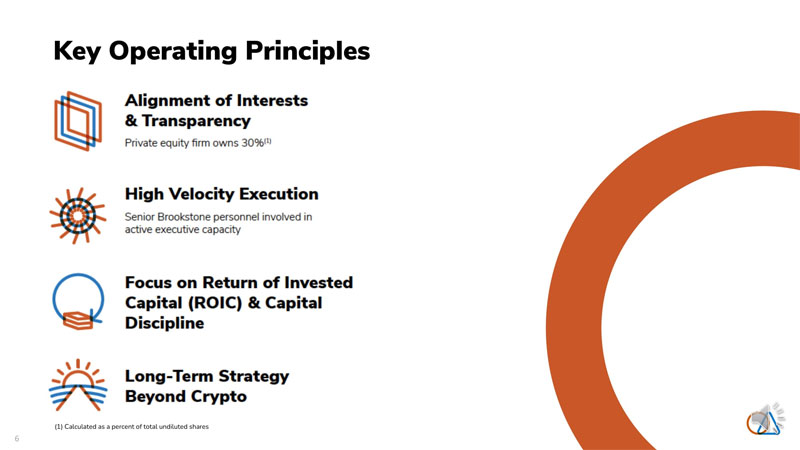
6 Key Operating Principles (1) Calculated as a percent of total undiluted shares
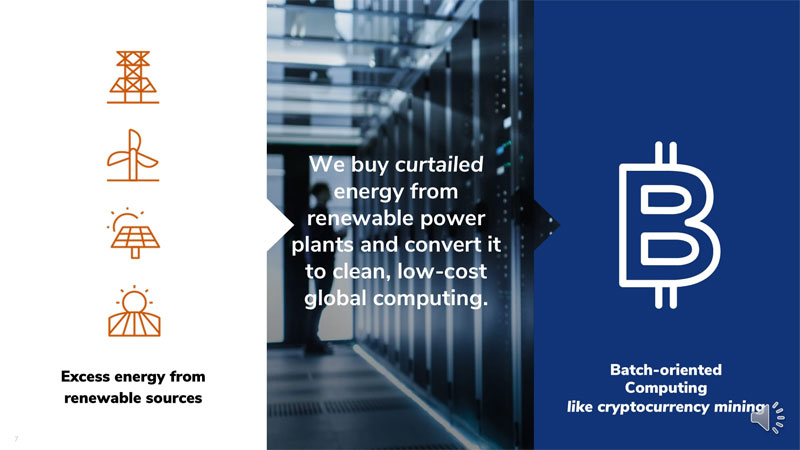
7 Batch-oriented Computing like cryptocurrency mining Excess energy from renewable sources We buy curtailed energy from renewable power plants and convert it to clean, low-cost global computing. 7
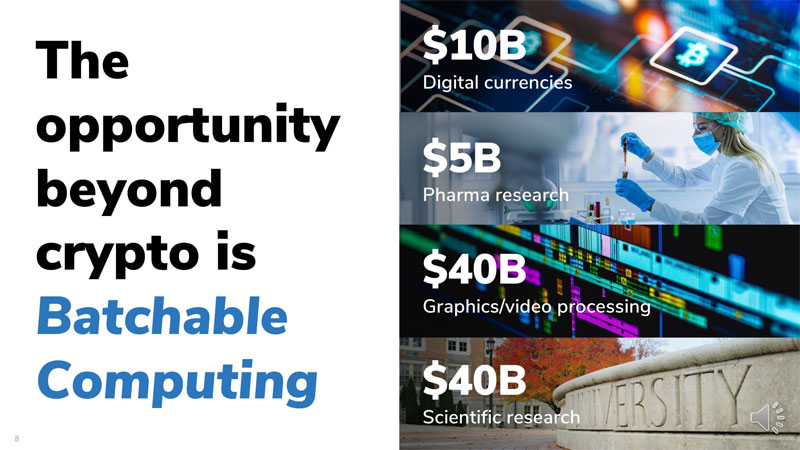
8 The opportunity beyond crypto is Batchable Computing Digital currencies $10B Pharma research $5B Graphics/video processing $40B Scientific research $40B

9 Agenda Business Update May 2022 Results In Detail In this presentation, we will be covering the following items:

10 Business Update
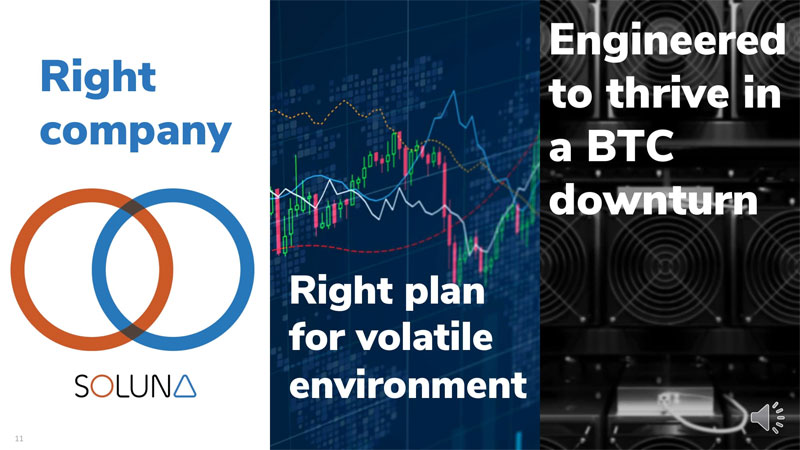
11 Engineered to thrive in a BTC downturn Right company Right plan for volatile environment
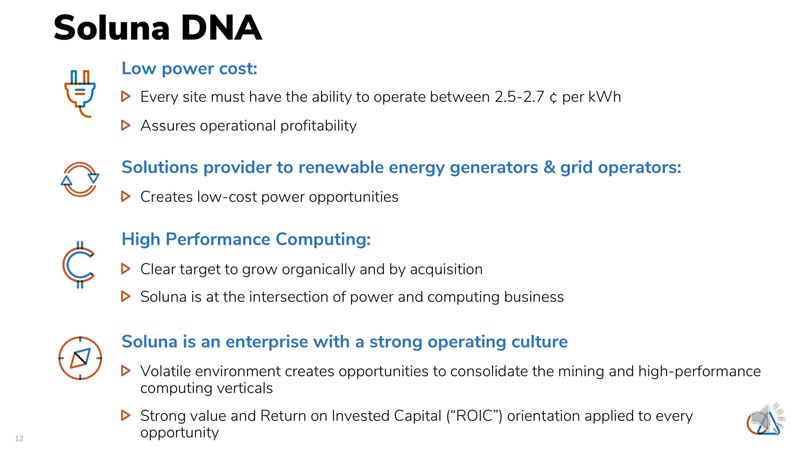
12 Low power cost: Every site must have the ability to operate between 2.5-2.7 ¢ per kWh Assures operational profitability Solutions provider to renewable energy generators & grid operators: Creates low-cost power opportunities High Performance Computing: Clear target to grow organically and by acquisition Soluna is at the intersection of power and computing business Soluna is an enterprise with a strong operating culture Volatile environment creates opportunities to consolidate the mining and high-performance computing verticals Strong value and Return on Invested Capital (“ROIC”) orientation applied to every opportunity Soluna DNA
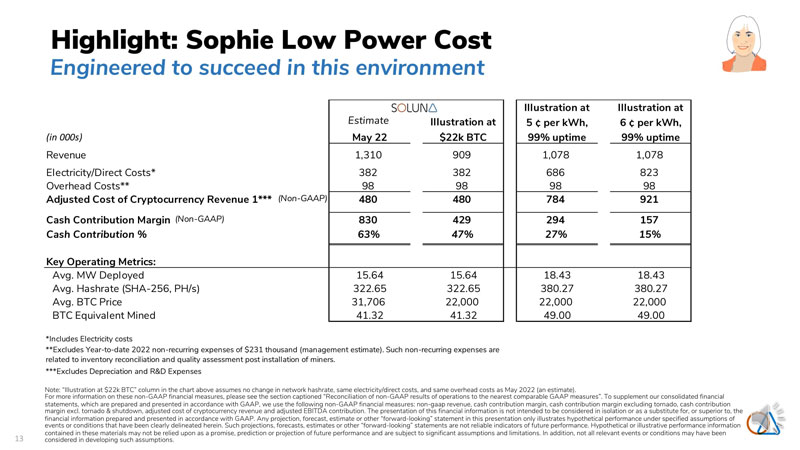
13 Highlight: Sophie Low Power Cost Note: “Illustration at $22k BTC” column in the chart above assumes no change in network hashrate, same electricity/direct costs, and same overhead costs as May 2022 (an estimate). For more information on these non-GAAP financial measures, please see the section captioned “Reconciliation of non-GAAP results of operations to the nearest comparable GAAP measures”. To supplement our consolidated financial statements, which are prepared and presented in accordance with GAAP, we use the following non-GAAP financial measures: non-gaap revenue, cash contribution margin, cash contribution margin excluding tornado, cash contribution margin excl. tornado & shutdown, adjusted cost of cryptocurrency revenue and adjusted EBITDA contribution. The presentation of this financial information is not intended to be considered in isolation or as a substitute for, or superior to, the financial information prepared and presented in accordance with GAAP. Any projection, forecast, estimate or other “forward-looking” statement in this presentation only illustrates hypothetical performance under specified assumptions of events or conditions that have been clearly delineated herein. Such projections, forecasts, estimates or other “forward-looking” statements are not reliable indicators of future performance. Hypothetical or illustrative performance information contained in these materials may not be relied upon as a promise, prediction or projection of future performance and are subject to significant assumptions and limitations. In addition, not all relevant events or conditions may have been considered in developing such assumptions. Illustration at Illustration at Estimate Illustration at 5 ¢ per kWh, 6 ¢ per kWh, (in 000s) May 22 $22k BTC 99% uptime 99% uptime Revenue 1,310 909 1,078 1,078 Electricity/Direct Costs* 382 382 686 823 Overhead Costs** 98 98 98 98 Adjusted Cost of Cryptocurrency Revenue 1*** (Non-GAAP) 480 480 784 921 Cash Contribution Margin (Non-GAAP) 830 429 294 157 Cash Contribution % 63% 47% 27% 15% Key Operating Metrics: Avg. MW Deployed 15.64 15.64 18.43 18.43 Avg. Hashrate (SHA-256, PH/s) 322.65 322.65 380.27 380.27 Avg. BTC Price 31,706 22,000 22,000 22,000 BTC Equivalent Mined 41.32 41.32 49.00 49.00 *Includes Electricity costs ***Excludes Depreciation and R&D Expenses **Excludes Year-to-date 2022 non-recurring expenses of $231 thousand (management estimate). Such non-recurring expenses are related to inventory reconciliation and quality assessment post installation of miners. Engineered to succeed in this environment
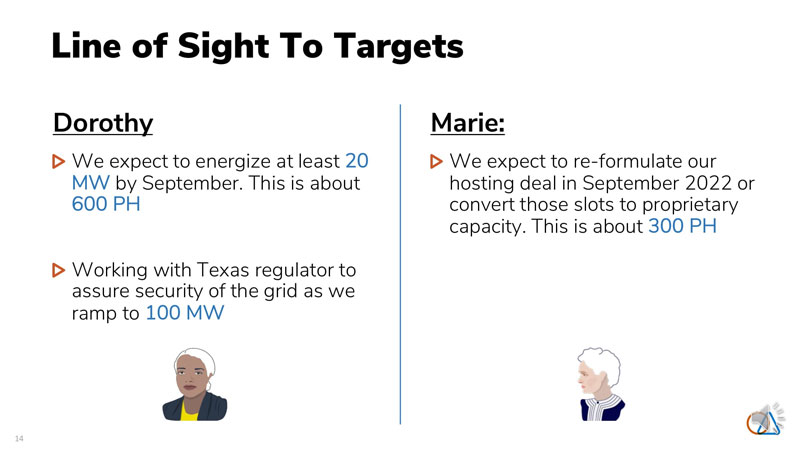
14 Line of Sight To Targets Dorothy We expect to energize at least 20 MW by September. This is about 600 PH Working with Texas regulator to assure security of the grid as we ramp to 100 MW Marie: We expect to re-formulate our hosting deal in September 2022 or convert those slots to proprietary capacity. This is about 300 PH
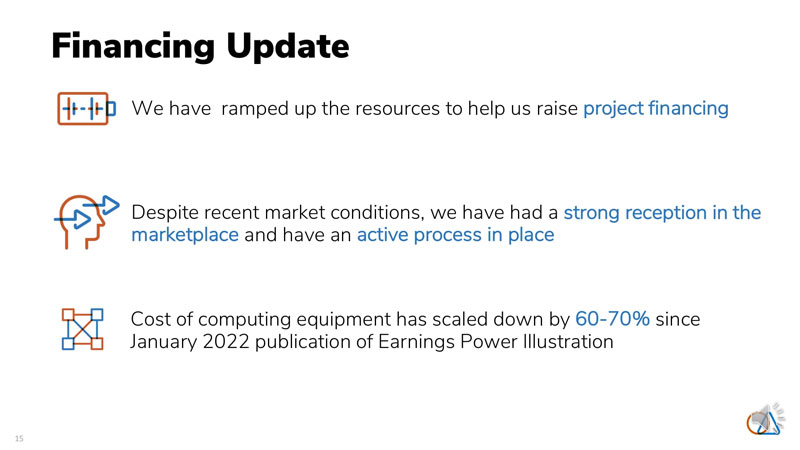
15 We have ramped up the resources to help us raise project financing Financing Update Despite recent market conditions, we have had a strong reception in the marketplace and have an active process in place Cost of computing equipment has scaled down by 60-70% since January 2022 publication of Earnings Power Illustration
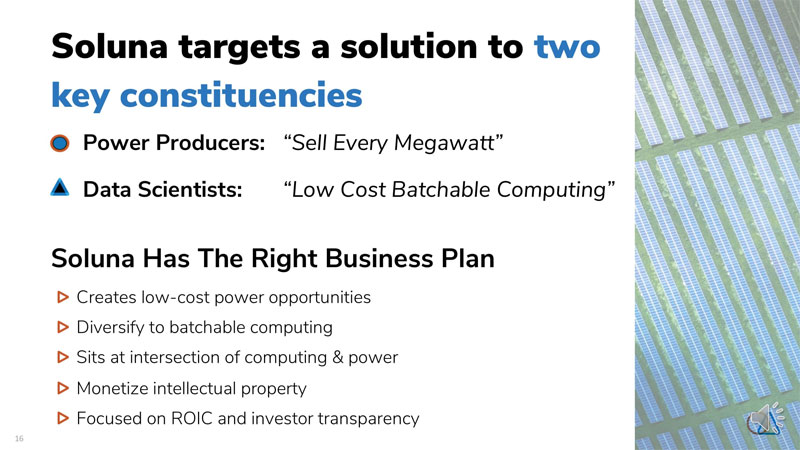
16 Soluna targets a solution to two key constituencies Power Producers: “Sell Every Megawatt” Data Scientists: “Low Cost Batchable Computing” Soluna Has The Right Business Plan Creates low-cost power opportunities Diversify to batchable computing Sits at intersection of computing & power Monetize intellectual property Focused on ROIC and investor transparency

17 May 2022 Results in Detail
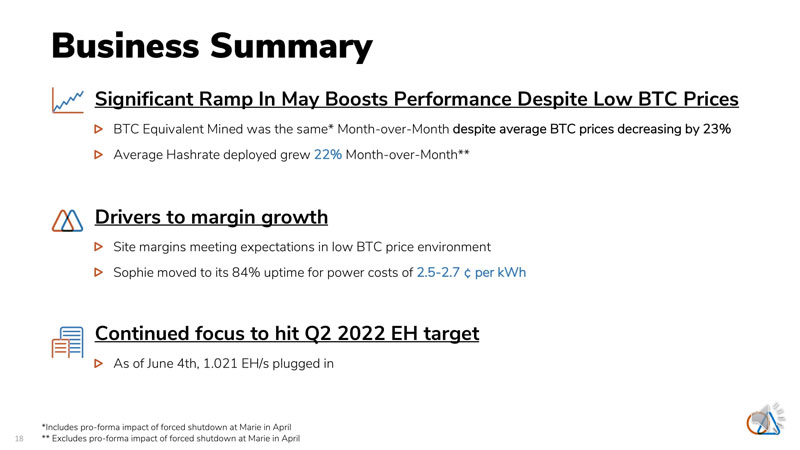
18 Business Summary Significant Ramp In May Boosts Performance Despite Low BTC Prices BTC Equivalent Mined was the same* Month-over-Month despite average BTC prices decreasing by 23% Average Hashrate deployed grew 22% Month-over-Month** Drivers to margin growth Site margins meeting expectations in low BTC price environment Sophie moved to its 84% uptime for power costs of 2.5-2.7 ¢ per kWh Continued focus to hit Q2 2022 EH target As of June 4th, 1.021 EH/s plugged in *Includes pro-forma impact of forced shutdown at Marie in April ** Excludes pro-forma impact of forced shutdown at Marie in April
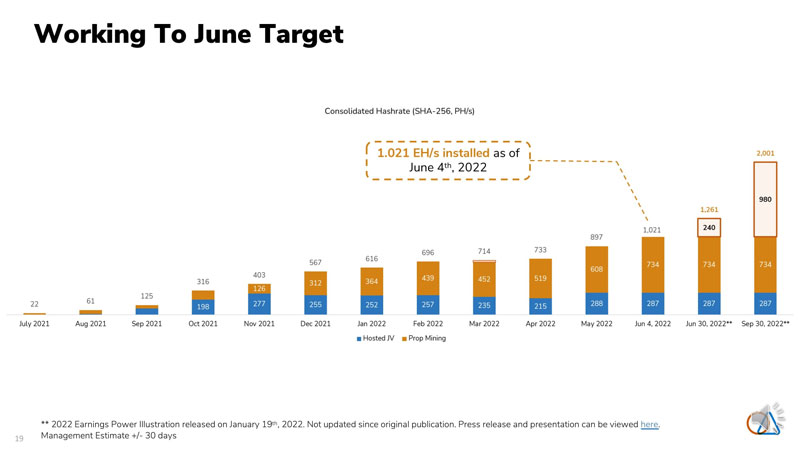
19 Working To June Target ** 2022 Earnings Power Illustration released on January 19th, 2022. Not updated since original publication. Press release and presentation can be viewed here. Management Estimate +/- 30 days 1.021 EH/s installed as of June 4th, 2022

20 We will review each facility Then look at the consolidated results Facility Results Review
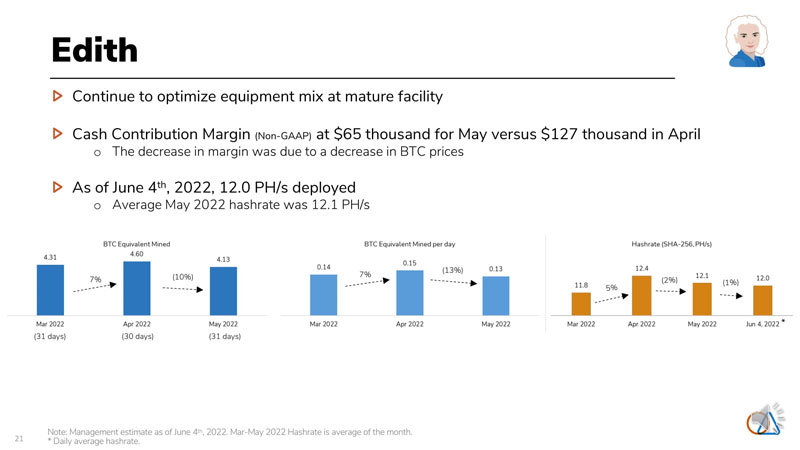
21 Edith Continue to optimize equipment mix at mature facility Cash Contribution Margin (Non-GAAP) at $65 thousand for May versus $127 thousand in April o The decrease in margin was due to a decrease in BTC prices As of June 4th, 2022, 12.0 PH/s deployed o Average May 2022 hashrate was 12.1 PH/s Note: Management estimate as of June 4th, 2022. Mar-May 2022 Hashrate is average of the month. * Daily average hashrate. (31 days) (30 days) 7% (31 days) (10%) 7% (13%) 5% (2%) * (1%)
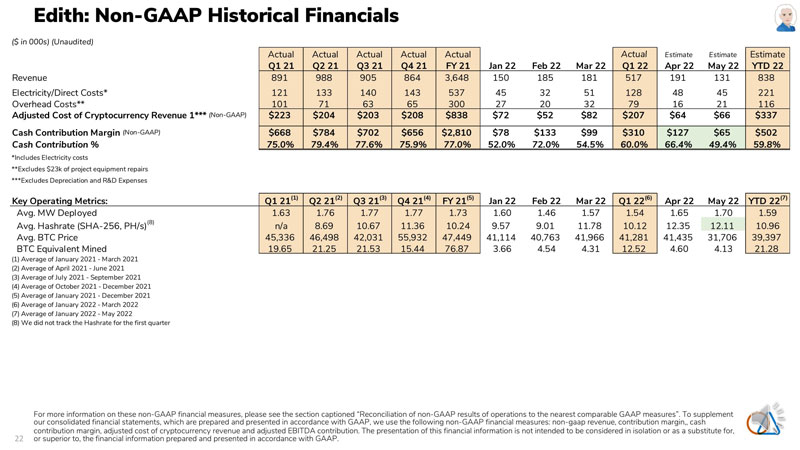
22 Edith: Non-GAAP Historical Financials For more information on these non-GAAP financial measures, please see the section captioned “Reconciliation of non-GAAP results of operations to the nearest comparable GAAP measures”. To supplement our consolidated financial statements, which are prepared and presented in accordance with GAAP, we use the following non-GAAP financial measures: non-gaap revenue, contribution margin,, cash contribution margin, adjusted cost of cryptocurrency revenue and adjusted EBITDA contribution. The presentation of this financial information is not intended to be considered in isolation or as a substitute for, or superior to, the financial information prepared and presented in accordance with GAAP. ($ in 000s) (Unaudited) Actual Actual Actual Actual Actual Actual Estimate Estimate Estimate Q1 21 Q2 21 Q3 21 Q4 21 FY 21 Jan 22 Feb 22 Mar 22 Q1 22 Apr 22 May 22 YTD 22 Revenue 891 988 905 864 3,648 150 185 181 517 191 131 838 Electricity/Direct Costs* 121 133 140 143 537 45 32 51 128 48 45 221 Overhead Costs** 101 71 63 65 300 27 20 32 79 16 21 116 Adjusted Cost of Cryptocurrency Revenue 1*** (Non-GAAP) $223 $204 $203 $208 $838 $72 $52 $82 $207 $64 $66 $337 Cash Contribution Margin (Non-GAAP) $668 $784 $702 $656 $2,810 $78 $133 $99 $310 $127 $65 $502 Cash Contribution % 75.0% 79.4% 77.6% 75.9% 77.0% 52.0% 72.0% 54.5% 60.0% 66.4% 49.4% 59.8% *Includes Electricity costs **Excludes $23k of project equipment repairs ***Excludes Depreciation and R&D Expenses Key Operating Metrics: Q1 21(1) Q2 21(2) Q3 21(3) Q4 21(4) FY 21(5) Jan 22 Feb 22 Mar 22 Q1 22(6) Apr 22 May 22 YTD 22(7) Avg. MW Deployed 1.63 1.76 1.77 1.77 1.73 1.60 1.46 1.57 1.54 1.65 1.70 1.59 Avg. Hashrate (SHA-256, PH/s)(8) n/a 8.69 10.67 11.36 10.24 9.57 9.01 11.78 10.12 12.35 12.11 10.96 Avg. BTC Price 45,336 46,498 42,031 55,932 47,449 41,114 40,763 41,966 41,281 41,435 31,706 39,397 BTC Equivalent Mined 19.65 21.25 21.53 15.44 76.87 3.66 4.54 4.31 12.52 4.60 4.13 21.28 (1) Average of January 2021 - March 2021 (2) Average of April 2021 - June 2021 (3) Average of July 2021 - September 2021 (4) Average of October 2021 - December 2021 (5) Average of January 2021 - December 2021 (6) Average of January 2022 - March 2022 (7) Average of January 2022 - May 2022 (8) We did not track the Hashrate for the first quarter
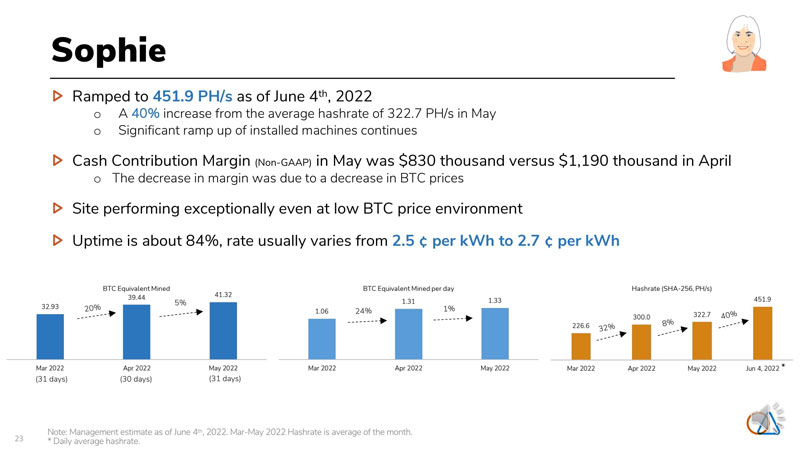
23 Sophie Ramped to 451.9 PH/s as of June 4th, 2022 o A 40% increase from the average hashrate of 322.7 PH/s in May o Significant ramp up of installed machines continues Cash Contribution Margin (Non-GAAP) in May was $830 thousand versus $1,190 thousand in April o The decrease in margin was due to a decrease in BTC prices Site performing exceptionally even at low BTC price environment Uptime is about 84%, rate usually varies from 2.5 ¢ per kWh to 2.7 ¢ per kWh 20% 5% 24% (31 days) (30 days) (31 days) 32% * Note: Management estimate as of June 4th, 2022. Mar-May 2022 Hashrate is average of the month. * Daily average hashrate. 1% 8% 40%
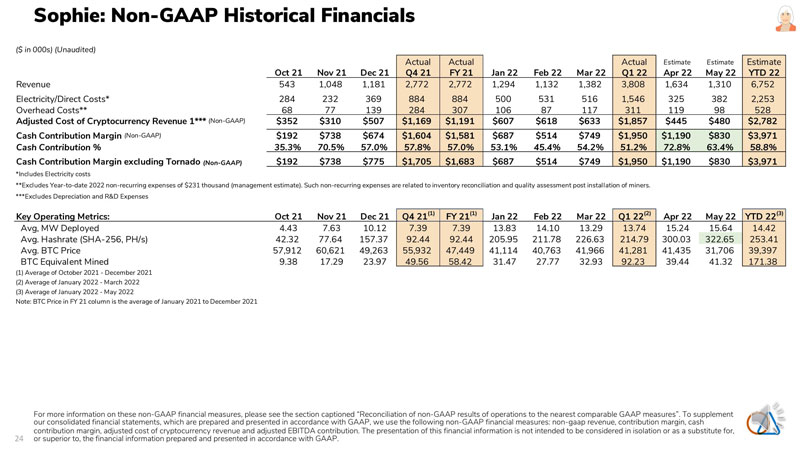
24 Sophie: Non-GAAP Historical Financials For more information on these non-GAAP financial measures, please see the section captioned “Reconciliation of non-GAAP results of operations to the nearest comparable GAAP measures”. To supplement our consolidated financial statements, which are prepared and presented in accordance with GAAP, we use the following non-GAAP financial measures: non-gaap revenue, contribution margin, cash contribution margin, adjusted cost of cryptocurrency revenue and adjusted EBITDA contribution. The presentation of this financial information is not intended to be considered in isolation or as a substitute for, or superior to, the financial information prepared and presented in accordance with GAAP. ($ in 000s) (Unaudited) Actual Actual Actual Estimate Estimate Estimate Oct 21 Nov 21 Dec 21 Q4 21 FY 21 Jan 22 Feb 22 Mar 22 Q1 22 Apr 22 May 22 YTD 22 Revenue 543 1,048 1,181 2,772 2,772 1,294 1,132 1,382 3,808 1,634 1,310 6,752 Electricity/Direct Costs* 284 232 369 884 884 500 531 516 1,546 325 382 2,253 Overhead Costs** 68 77 139 284 307 106 87 117 311 119 98 528 Adjusted Cost of Cryptocurrency Revenue 1*** (Non-GAAP) $352 $310 $507 $1,169 $1,191 $607 $618 $633 $1,857 $445 $480 $2,782 Cash Contribution Margin (Non-GAAP) $192 $738 $674 $1,604 $1,581 $687 $514 $749 $1,950 $1,190 $830 $3,971 Cash Contribution % 35.3% 70.5% 57.0% 57.8% 57.0% 53.1% 45.4% 54.2% 51.2% 72.8% 63.4% 58.8% Cash Contribution Margin excluding Tornado (Non-GAAP) $192 $738 $775 $1,705 $1,683 $687 $514 $749 $1,950 $1,190 $830 $3,971 *Includes Electricity costs **Excludes Year-to-date 2022 non-recurring expenses of $231 thousand (management estimate). Such non-recurring expenses are related to inventory reconciliation and quality assessment post installation of miners. ***Excludes Depreciation and R&D Expenses Key Operating Metrics: Oct 21 Nov 21 Dec 21 Q4 21(1) FY 21(1) Jan 22 Feb 22 Mar 22 Q1 22(2) Apr 22 May 22 YTD 22(3) Avg, MW Deployed 4.43 7.63 10.12 7.39 7.39 13.83 14.10 13.29 13.74 15.24 15.64 14.42 Avg. Hashrate (SHA-256, PH/s) 42.32 77.64 157.37 92.44 92.44 205.95 211.78 226.63 214.79 300.03 322.65 253.41 Avg. BTC Price 57,912 60,621 49,263 55,932 47,449 41,114 40,763 41,966 41,281 41,435 31,706 39,397 BTC Equivalent Mined 9.38 17.29 23.97 49.56 58.42 31.47 27.77 32.93 92.23 39.44 41.32 171.38 (1) Average of October 2021 - December 2021 (2) Average of January 2022 - March 2022 (3) Average of January 2022 - May 2022 Note: BTC Price in FY 21 column is the average of January 2021 to December 2021
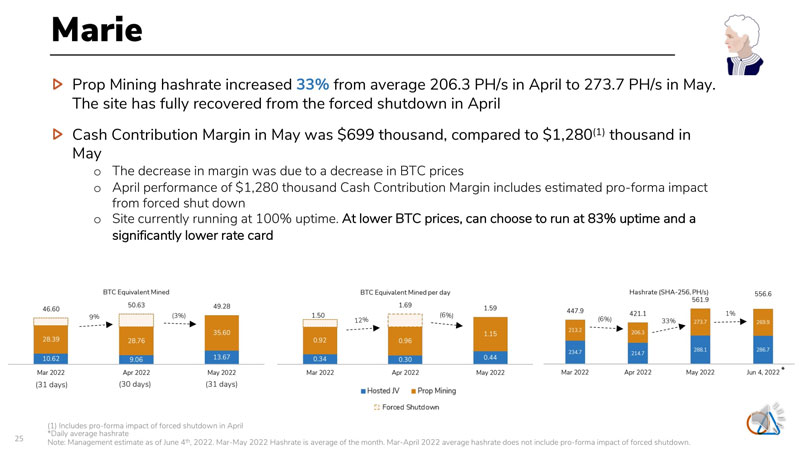
25 Marie Prop Mining hashrate increased 33% from average 206.3 PH/s in April to 273.7 PH/s in May. The site has fully recovered from the forced shutdown in April Cash Contribution Margin in May was $699 thousand, compared to $1,280(1) thousand in May o The decrease in margin was due to a decrease in BTC prices o April performance of $1,280 thousand Cash Contribution Margin includes estimated pro-forma impact from forced shut down o Site currently running at 100% uptime. At lower BTC prices, can choose to run at 83% uptime and a significantly lower rate card (31 days) (30 days) (31 days) (6%) 9% 12% 1% * (1) Includes pro-forma impact of forced shutdown in April *Daily average hashrate Note: Management estimate as of June 4th, 2022. Mar-May 2022 Hashrate is average of the month. Mar-April 2022 average hashrate does not include pro-forma impact of forced shutdown. (3%) (6%) 33%
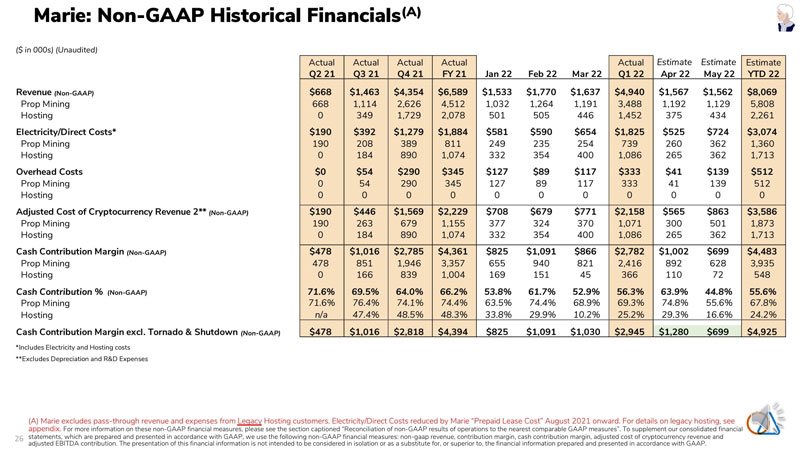
26 Marie: Non-GAAP Historical Financials(A) (A) Marie excludes pass-through revenue and expenses from Legacy Hosting customers. Electricity/Direct Costs reduced by Marie “Prepaid Lease Cost” August 2021 onward. For details on legacy hosting, see appendix. For more information on these non-GAAP financial measures, please see the section captioned “Reconciliation of non-GAAP results of operations to the nearest comparable GAAP measures”. To supplement our consolidated financial statements, which are prepared and presented in accordance with GAAP, we use the following non-GAAP financial measures: non-gaap revenue, contribution margin, cash contribution margin, adjusted cost of cryptocurrency revenue and adjusted EBITDA contribution. The presentation of this financial information is not intended to be considered in isolation or as a substitute for, or superior to, the financial information prepared and presented in accordance with GAAP. ($ in 000s) (Unaudited) Actual Actual Actual Actual Actual Estimate Estimate Estimate Q2 21 Q3 21 Q4 21 FY 21 Jan 22 Feb 22 Mar 22 Q1 22 Apr 22 May 22 YTD 22 Revenue (Non-GAAP) $668 $1,463 $4,354 $6,589 $1,533 $1,770 $1,637 $4,940 $1,567 $1,562 $8,069 Prop Mining 668 1,114 2,626 4,512 1,032 1,264 1,191 3,488 1,192 1,129 5,808 Hosting 0 349 1,729 2,078 501 505 446 1,452 375 434 2,261 Electricity/Direct Costs* $190 $392 $1,279 $1,884 $581 $590 $654 $1,825 $525 $724 $3,074 Prop Mining 190 208 389 811 249 235 254 739 260 362 1,360 Hosting 0 184 890 1,074 332 354 400 1,086 265 362 1,713 Overhead Costs $0 $54 $290 $345 $127 $89 $117 $333 $41 $139 $512 Prop Mining 0 54 290 345 127 89 117 333 41 139 512 Hosting 0 0 0 0 0 0 0 0 0 0 0 Adjusted Cost of Cryptocurrency Revenue 2** (Non-GAAP) $190 $446 $1,569 $2,229 $708 $679 $771 $2,158 $565 $863 $3,586 Prop Mining 190 263 679 1,155 377 324 370 1,071 300 501 1,873 Hosting 0 184 890 1,074 332 354 400 1,086 265 362 1,713 Cash Contribution Margin (Non-GAAP) $478 $1,016 $2,785 $4,361 $825 $1,091 $866 $2,782 $1,002 $699 $4,483 Prop Mining 478 851 1,946 3,357 655 940 821 2,416 892 628 3,935 Hosting 0 166 839 1,004 169 151 45 366 110 72 548 Cash Contribution % (Non-GAAP) 71.6% 69.5% 64.0% 66.2% 53.8% 61.7% 52.9% 56.3% 63.9% 44.8% 55.6% Prop Mining 71.6% 76.4% 74.1% 74.4% 63.5% 74.4% 68.9% 69.3% 74.8% 55.6% 67.8% Hosting n/a 47.4% 48.5% 48.3% 33.8% 29.9% 10.2% 25.2% 29.3% 16.6% 24.2% Cash Contribution Margin excl. Tornado & Shutdown (Non-GAAP) $478 $1,016 $2,818 $4,394 $825 $1,091 $1,030 $2,945 $1,280 $699 $4,925 *Includes Electricity and Hosting costs **Excludes Depreciation and R&D Expenses
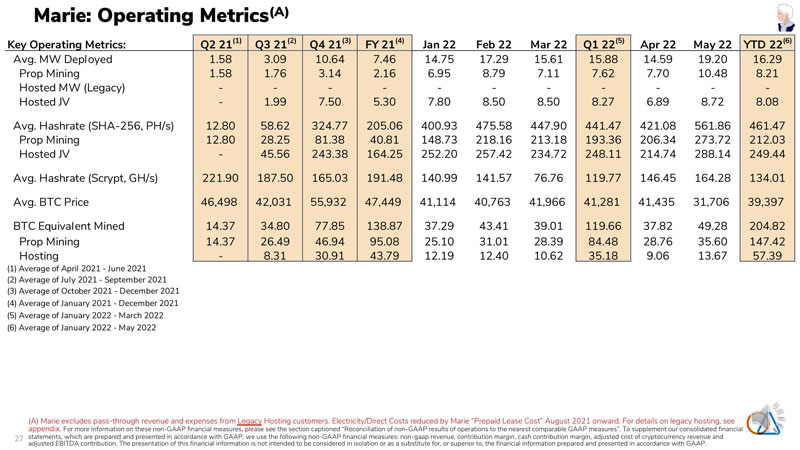
27 Marie: Operating Metrics(A) (A) Marie excludes pass-through revenue and expenses from Legacy Hosting customers. Electricity/Direct Costs reduced by Marie “Prepaid Lease Cost” August 2021 onward. For details on legacy hosting, see appendix. For more information on these non-GAAP financial measures, please see the section captioned “Reconciliation of non-GAAP results of operations to the nearest comparable GAAP measures”. To supplement our consolidated financial statements, which are prepared and presented in accordance with GAAP, we use the following non-GAAP financial measures: non-gaap revenue, contribution margin, cash contribution margin, adjusted cost of cryptocurrency revenue and adjusted EBITDA contribution. The presentation of this financial information is not intended to be considered in isolation or as a substitute for, or superior to, the financial information prepared and presented in accordance with GAAP. Key Operating Metrics: Q2 21(1) Q3 21(2) Q4 21(3) FY 21(4) Jan 22 Feb 22 Mar 22 Q1 22(5) Apr 22 May 22 YTD 22(6) Avg. MW Deployed 1.58 3.09 10.64 7.46 14.75 17.29 15.61 15.88 14.59 19.20 16.29 Prop Mining 1.58 1.76 3.14 2.16 6.95 8.79 7.11 7.62 7.70 10.48 8.21 Hosted MW (Legacy) - - - - - - - - - - - Hosted JV - 1.99 7.50 5.30 7.80 8.50 8.50 8.27 6.89 8.72 8.08 Avg. Hashrate (SHA-256, PH/s) 12.80 58.62 324.77 205.06 400.93 475.58 447.90 441.47 421.08 561.86 461.47 Prop Mining 12.80 28.25 81.38 40.81 148.73 218.16 213.18 193.36 206.34 273.72 212.03 Hosted JV - 45.56 243.38 164.25 252.20 257.42 234.72 248.11 214.74 288.14 249.44 Avg. Hashrate (Scrypt, GH/s) 221.90 187.50 165.03 191.48 140.99 141.57 76.76 119.77 146.45 164.28 134.01 Avg. BTC Price 46,498 42,031 55,932 47,449 41,114 40,763 41,966 41,281 41,435 31,706 39,397 BTC Equivalent Mined 14.37 34.80 77.85 138.87 37.29 43.41 39.01 119.66 37.82 49.28 204.82 Prop Mining 14.37 26.49 46.94 95.08 25.10 31.01 28.39 84.48 28.76 35.60 147.42 Hosting - 8.31 30.91 43.79 12.19 12.40 10.62 35.18 9.06 13.67 57.39 (1) Average of April 2021 - June 2021 (2) Average of July 2021 - September 2021 (3) Average of October 2021 - December 2021 (4) Average of January 2021 - December 2021 (5) Average of January 2022 - March 2022 (6) Average of January 2022 - May 2022
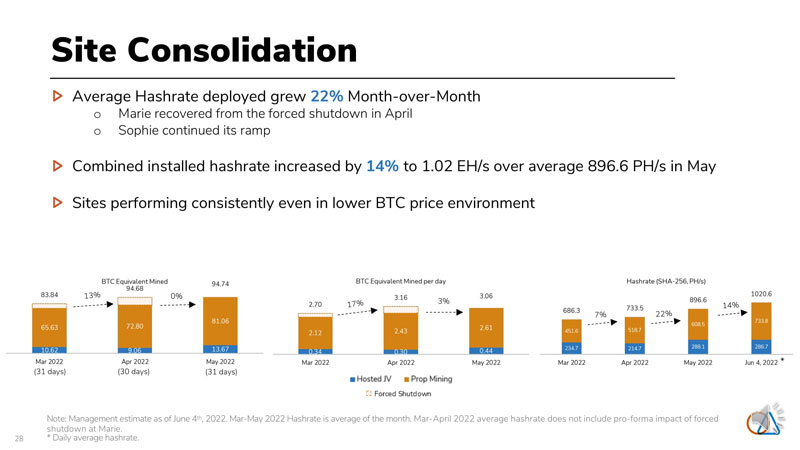
28 Site Consolidation Average Hashrate deployed grew 22% Month-over-Month o Marie recovered from the forced shutdown in April o Sophie continued its ramp Combined installed hashrate increased by 14% to 1.02 EH/s over average 896.6 PH/s in May Sites performing consistently even in lower BTC price environment 13% 0% 17% 7% (31 days) (30 days) (31 days) * Note: Management estimate as of June 4th, 2022. Mar-May 2022 Hashrate is average of the month. Mar-April 2022 average hashrate does not include pro-forma impact of forced shutdown at Marie. * Daily average hashrate. 3% 22% 14%
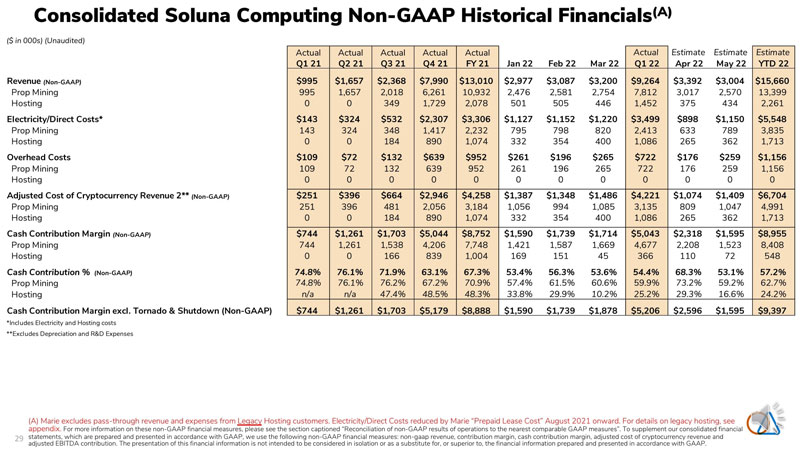
29 Consolidated Soluna Computing Non-GAAP Historical Financials(A) (A) Marie excludes pass-through revenue and expenses from Legacy Hosting customers. Electricity/Direct Costs reduced by Marie “Prepaid Lease Cost” August 2021 onward. For details on legacy hosting, see appendix. For more information on these non-GAAP financial measures, please see the section captioned “Reconciliation of non-GAAP results of operations to the nearest comparable GAAP measures”. To supplement our consolidated financial statements, which are prepared and presented in accordance with GAAP, we use the following non-GAAP financial measures: non-gaap revenue, contribution margin, cash contribution margin, adjusted cost of cryptocurrency revenue and adjusted EBITDA contribution. The presentation of this financial information is not intended to be considered in isolation or as a substitute for, or superior to, the financial information prepared and presented in accordance with GAAP. ($ in 000s) (Unaudited) Actual Actual Actual Actual Actual Actual Estimate Estimate Estimate Q1 21 Q2 21 Q3 21 Q4 21 FY 21 Jan 22 Feb 22 Mar 22 Q1 22 Apr 22 May 22 YTD 22 Revenue (Non-GAAP) $995 $1,657 $2,368 $7,990 $13,010 $2,977 $3,087 $3,200 $9,264 $3,392 $3,004 $15,660 Prop Mining 995 1,657 2,018 6,261 10,932 2,476 2,581 2,754 7,812 3,017 2,570 13,399 Hosting 0 0 349 1,729 2,078 501 505 446 1,452 375 434 2,261 Electricity/Direct Costs* $143 $324 $532 $2,307 $3,306 $1,127 $1,152 $1,220 $3,499 $898 $1,150 $5,548 Prop Mining 143 324 348 1,417 2,232 795 798 820 2,413 633 789 3,835 Hosting 0 0 184 890 1,074 332 354 400 1,086 265 362 1,713 Overhead Costs $109 $72 $132 $639 $952 $261 $196 $265 $722 $176 $259 $1,156 Prop Mining 109 72 132 639 952 261 196 265 722 176 259 1,156 Hosting 0 0 0 0 0 0 0 0 0 0 0 0 Adjusted Cost of Cryptocurrency Revenue 2** (Non-GAAP) $251 $396 $664 $2,946 $4,258 $1,387 $1,348 $1,486 $4,221 $1,074 $1,409 $6,704 Prop Mining 251 396 481 2,056 3,184 1,056 994 1,085 3,135 809 1,047 4,991 Hosting 0 0 184 890 1,074 332 354 400 1,086 265 362 1,713 Cash Contribution Margin (Non-GAAP) $744 $1,261 $1,703 $5,044 $8,752 $1,590 $1,739 $1,714 $5,043 $2,318 $1,595 $8,955 Prop Mining 744 1,261 1,538 4,206 7,748 1,421 1,587 1,669 4,677 2,208 1,523 8,408 Hosting 0 0 166 839 1,004 169 151 45 366 110 72 548 Cash Contribution % (Non-GAAP) 74.8% 76.1% 71.9% 63.1% 67.3% 53.4% 56.3% 53.6% 54.4% 68.3% 53.1% 57.2% Prop Mining 74.8% 76.1% 76.2% 67.2% 70.9% 57.4% 61.5% 60.6% 59.9% 73.2% 59.2% 62.7% Hosting n/a n/a 47.4% 48.5% 48.3% 33.8% 29.9% 10.2% 25.2% 29.3% 16.6% 24.2% Cash Contribution Margin excl. Tornado & Shutdown (Non-GAAP) $744 $1,261 $1,703 $5,179 $8,888 $1,590 $1,739 $1,878 $5,206 $2,596 $1,595 $9,397 *Includes Electricity and Hosting costs **Excludes Depreciation and R&D Expenses
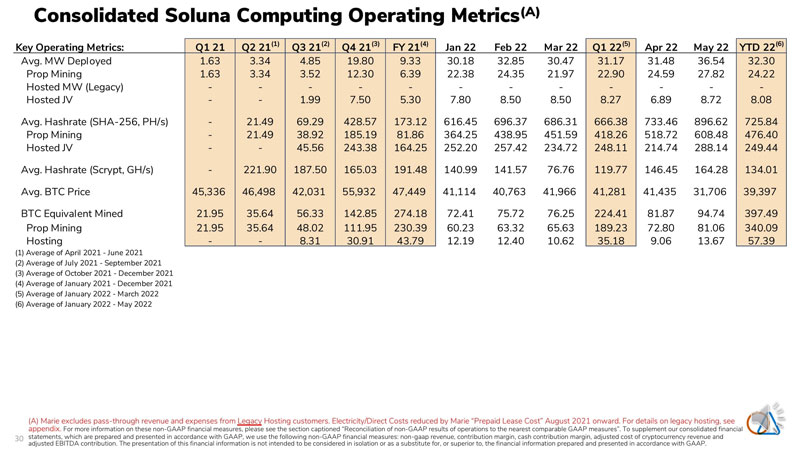
30 Consolidated Soluna Computing Operating Metrics(A) (A) Marie excludes pass-through revenue and expenses from Legacy Hosting customers. Electricity/Direct Costs reduced by Marie “Prepaid Lease Cost” August 2021 onward. For details on legacy hosting, see appendix. For more information on these non-GAAP financial measures, please see the section captioned “Reconciliation of non-GAAP results of operations to the nearest comparable GAAP measures”. To supplement our consolidated financial statements, which are prepared and presented in accordance with GAAP, we use the following non-GAAP financial measures: non-gaap revenue, contribution margin, cash contribution margin, adjusted cost of cryptocurrency revenue and adjusted EBITDA contribution. The presentation of this financial information is not intended to be considered in isolation or as a substitute for, or superior to, the financial information prepared and presented in accordance with GAAP. Key Operating Metrics: Q1 21 Q2 21(1) Q3 21(2) Q4 21(3) FY 21(4) Jan 22 Feb 22 Mar 22 Q1 22(5) Apr 22 May 22 YTD 22(6) Avg. MW Deployed 1.63 3.34 4.85 19.80 9.33 30.18 32.85 30.47 31.17 31.48 36.54 32.30 Prop Mining 1.63 3.34 3.52 12.30 6.39 22.38 24.35 21.97 22.90 24.59 27.82 24.22 Hosted MW (Legacy) - - - - - - - - - - - - Hosted JV - - 1.99 7.50 5.30 7.80 8.50 8.50 8.27 6.89 8.72 8.08 Avg. Hashrate (SHA-256, PH/s) - 21.49 69.29 428.57 173.12 616.45 696.37 686.31 666.38 733.46 896.62 725.84 Prop Mining - 21.49 38.92 185.19 81.86 364.25 438.95 451.59 418.26 518.72 608.48 476.40 Hosted JV - - 45.56 243.38 164.25 252.20 257.42 234.72 248.11 214.74 288.14 249.44 Avg. Hashrate (Scrypt, GH/s) - 221.90 187.50 165.03 191.48 140.99 141.57 76.76 119.77 146.45 164.28 134.01 Avg. BTC Price 45,336 46,498 42,031 55,932 47,449 41,114 40,763 41,966 41,281 41,435 31,706 39,397 BTC Equivalent Mined 21.95 35.64 56.33 142.85 274.18 72.41 75.72 76.25 224.41 81.87 94.74 397.49 Prop Mining 21.95 35.64 48.02 111.95 230.39 60.23 63.32 65.63 189.23 72.80 81.06 340.09 Hosting - - 8.31 30.91 43.79 12.19 12.40 10.62 35.18 9.06 13.67 57.39 (1) Average of April 2021 - June 2021 (2) Average of July 2021 - September 2021 (3) Average of October 2021 - December 2021 (4) Average of January 2021 - December 2021 (5) Average of January 2022 - March 2022 (6) Average of January 2022 - May 2022

31 Appendix
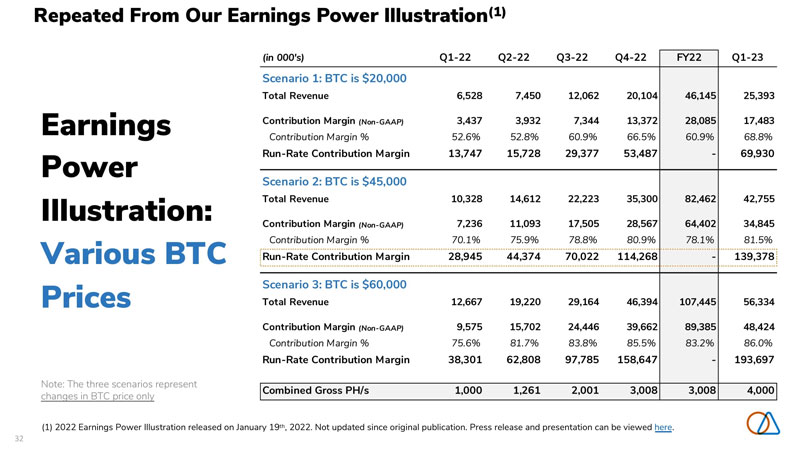
32 Earnings Power Illustration: Various BTC Prices Note: The three scenarios represent changes in BTC price only (in 000’s) Q1-22 Q2-22 Q3-22 Q4-22 FY22 Q1-23 Scenario 1: BTC is $20,000 Total Revenue 6,528 7,450 12,062 20,104 46,145 25,393 Contribution Margin (Non-GAAP) 3,437 3,932 7,344 13,372 28,085 17,483 Contribution Margin % 52.6% 52.8% 60.9% 66.5% 60.9% 68.8% Run-Rate Contribution Margin 13,747 15,728 29,377 53,487 - 69,930 Scenario 2: BTC is $45,000 Total Revenue 10,328 14,612 22,223 35,300 82,462 42,755 Contribution Margin (Non-GAAP) 7,236 11,093 17,505 28,567 64,402 34,845 Contribution Margin % 70.1% 75.9% 78.8% 80.9% 78.1% 81.5% Run-Rate Contribution Margin 28,945 44,374 70,022 114,268 - 139,378 Scenario 3: BTC is $60,000 Total Revenue 12,667 19,220 29,164 46,394 107,445 56,334 Contribution Margin (Non-GAAP) 9,575 15,702 24,446 39,662 89,385 48,424 Contribution Margin % 75.6% 81.7% 83.8% 85.5% 83.2% 86.0% Run-Rate Contribution Margin 38,301 62,808 97,785 158,647 - 193,697 Combined Gross PH/s 1,000 1,261 2,001 3,008 3,008 4,000 (1) 2022 Earnings Power Illustration released on January 19th, 2022. Not updated since original publication. Press release and presentation can be viewed here. Repeated From Our Earnings Power Illustration(1)
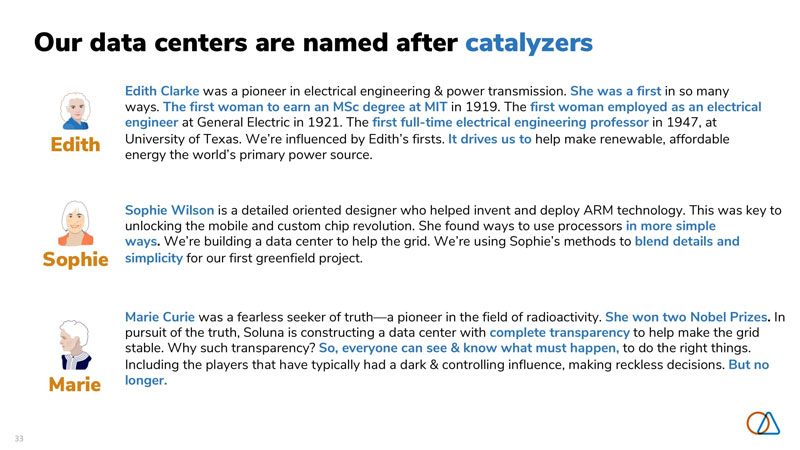
33 Our data centers are named after catalyzers Edith Sophie Marie Marie Curie was a fearless seeker of truth—a pioneer in the field of radioactivity. She won two Nobel Prizes. In pursuit of the truth, Soluna is constructing a data center with complete transparency to help make the grid stable. Why such transparency? So, everyone can see & know what must happen, to do the right things. Including the players that have typically had a dark & controlling influence, making reckless decisions. But no longer. Sophie Wilson is a detailed oriented designer who helped invent and deploy ARM technology. This was key to unlocking the mobile and custom chip revolution. She found ways to use processors in more simple ways. We’re building a data center to help the grid. We’re using Sophie’s methods to blend details and simplicity for our first greenfield project. Edith Clarke was a pioneer in electrical engineering & power transmission. She was a first in so many ways. The first woman to earn an MSc degree at MIT in 1919. The first woman employed as an electrical engineer at General Electric in 1921. The first full-time electrical engineering professor in 1947, at University of Texas. We’re influenced by Edith’s firsts. It drives us to help make renewable, affordable energy the world’s primary power source.
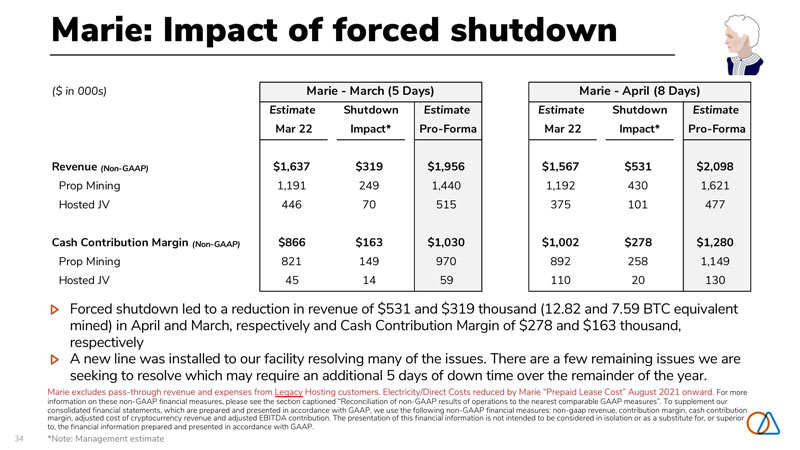
34 Marie: Impact of forced shutdown *Note: Management estimate Forced shutdown led to a reduction in revenue of $531 and $319 thousand (12.82 and 7.59 BTC equivalent mined) in April and March, respectively and Cash Contribution Margin of $278 and $163 thousand, respectively A new line was installed to our facility resolving many of the issues. There are a few remaining issues we are seeking to resolve which may require an additional 5 days of down time over the remainder of the year. Marie excludes pass-through revenue and expenses from Legacy Hosting customers. Electricity/Direct Costs reduced by Marie “Prepaid Lease Cost” August 2021 onward. For more information on these non-GAAP financial measures, please see the section captioned “Reconciliation of non-GAAP results of operations to the nearest comparable GAAP measures”. To supplement our consolidated financial statements, which are prepared and presented in accordance with GAAP, we use the following non-GAAP financial measures: non-gaap revenue, contribution margin, cash contribution margin, adjusted cost of cryptocurrency revenue and adjusted EBITDA contribution. The presentation of this financial information is not intended to be considered in isolation or as a substitute for, or superior to, the financial information prepared and presented in accordance with GAAP. ($ in 000s) Estimate Shutdown Estimate Estimate Shutdown Estimate Mar 22 Impact* Pro-Forma Mar 22 Impact* Pro-Forma Revenue (Non-GAAP) $1,637 $319 $1,956 $1,567 $531 $2,098 Prop Mining 1,191 249 1,440 1,192 430 1,621 Hosted JV 446 70 515 375 101 477 Cash Contribution Margin (Non-GAAP) $866 $163 $1,030 $1,002 $278 $1,280 Prop Mining 821 149 970 892 258 1,149 Hosted JV 45 14 59 110 20 130 Marie - March (5 Days) Marie - April (8 Days)
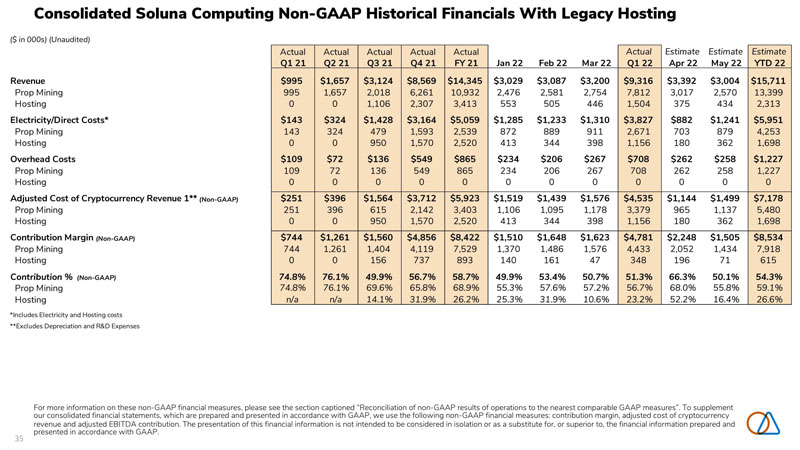
35 Consolidated Soluna Computing Non-GAAP Historical Financials With Legacy Hosting For more information on these non-GAAP financial measures, please see the section captioned “Reconciliation of non-GAAP results of operations to the nearest comparable GAAP measures”. To supplement our consolidated financial statements, which are prepared and presented in accordance with GAAP, we use the following non-GAAP financial measures: contribution margin, adjusted cost of cryptocurrency revenue and adjusted EBITDA contribution. The presentation of this financial information is not intended to be considered in isolation or as a substitute for, or superior to, the financial information prepared and presented in accordance with GAAP. ($ in 000s) (Unaudited) Actual Actual Actual Actual Actual Actual Estimate Estimate Estimate Q1 21 Q2 21 Q3 21 Q4 21 FY 21 Jan 22 Feb 22 Mar 22 Q1 22 Apr 22 May 22 YTD 22 Revenue $995 $1,657 $3,124 $8,569 $14,345 $3,029 $3,087 $3,200 $9,316 $3,392 $3,004 $15,711 Prop Mining 995 1,657 2,018 6,261 10,932 2,476 2,581 2,754 7,812 3,017 2,570 13,399 Hosting 0 0 1,106 2,307 3,413 553 505 446 1,504 375 434 2,313 Electricity/Direct Costs* $143 $324 $1,428 $3,164 $5,059 $1,285 $1,233 $1,310 $3,827 $882 $1,241 $5,951 Prop Mining 143 324 479 1,593 2,539 872 889 911 2,671 703 879 4,253 Hosting 0 0 950 1,570 2,520 413 344 398 1,156 180 362 1,698 Overhead Costs $109 $72 $136 $549 $865 $234 $206 $267 $708 $262 $258 $1,227 Prop Mining 109 72 136 549 865 234 206 267 708 262 258 1,227 Hosting 0 0 0 0 0 0 0 0 0 0 0 0 Adjusted Cost of Cryptocurrency Revenue 1** (Non-GAAP) $251 $396 $1,564 $3,712 $5,923 $1,519 $1,439 $1,576 $4,535 $1,144 $1,499 $7,178 Prop Mining 251 396 615 2,142 3,403 1,106 1,095 1,178 3,379 965 1,137 5,480 Hosting 0 0 950 1,570 2,520 413 344 398 1,156 180 362 1,698 Contribution Margin (Non-GAAP) $744 $1,261 $1,560 $4,856 $8,422 $1,510 $1,648 $1,623 $4,781 $2,248 $1,505 $8,534 Prop Mining 744 1,261 1,404 4,119 7,529 1,370 1,486 1,576 4,433 2,052 1,434 7,918 Hosting 0 0 156 737 893 140 161 47 348 196 71 615 Contribution % (Non-GAAP) 74.8% 76.1% 49.9% 56.7% 58.7% 49.9% 53.4% 50.7% 51.3% 66.3% 50.1% 54.3% Prop Mining 74.8% 76.1% 69.6% 65.8% 68.9% 55.3% 57.6% 57.2% 56.7% 68.0% 55.8% 59.1% Hosting n/a n/a 14.1% 31.9% 26.2% 25.3% 31.9% 10.6% 23.2% 52.2% 16.4% 26.6% *Includes Electricity and Hosting costs **Excludes Depreciation and R&D Expenses
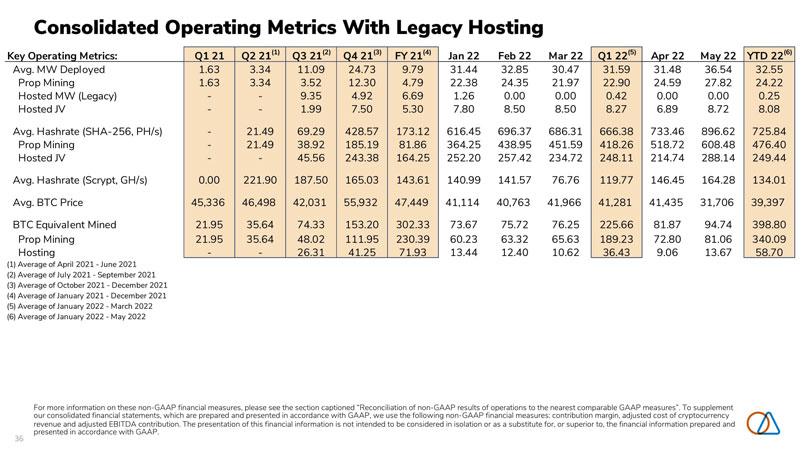
36 Consolidated Operating Metrics With Legacy Hosting For more information on these non-GAAP financial measures, please see the section captioned “Reconciliation of non-GAAP results of operations to the nearest comparable GAAP measures”. To supplement our consolidated financial statements, which are prepared and presented in accordance with GAAP, we use the following non-GAAP financial measures: contribution margin, adjusted cost of cryptocurrency revenue and adjusted EBITDA contribution. The presentation of this financial information is not intended to be considered in isolation or as a substitute for, or superior to, the financial information prepared and presented in accordance with GAAP. Key Operating Metrics: Q1 21 Q2 21(1) Q3 21(2) Q4 21(3) FY 21(4) Jan 22 Feb 22 Mar 22 Q1 22(5) Apr 22 May 22 YTD 22(6) Avg. MW Deployed 1.63 3.34 11.09 24.73 9.79 31.44 32.85 30.47 31.59 31.48 36.54 32.55 Prop Mining 1.63 3.34 3.52 12.30 4.79 22.38 24.35 21.97 22.90 24.59 27.82 24.22 Hosted MW (Legacy) - - 9.35 4.92 6.69 1.26 0.00 0.00 0.42 0.00 0.00 0.25 Hosted JV - - 1.99 7.50 5.30 7.80 8.50 8.50 8.27 6.89 8.72 8.08 Avg. Hashrate (SHA-256, PH/s) - 21.49 69.29 428.57 173.12 616.45 696.37 686.31 666.38 733.46 896.62 725.84 Prop Mining - 21.49 38.92 185.19 81.86 364.25 438.95 451.59 418.26 518.72 608.48 476.40 Hosted JV - - 45.56 243.38 164.25 252.20 257.42 234.72 248.11 214.74 288.14 249.44 Avg. Hashrate (Scrypt, GH/s) 0.00 221.90 187.50 165.03 143.61 140.99 141.57 76.76 119.77 146.45 164.28 134.01 Avg. BTC Price 45,336 46,498 42,031 55,932 47,449 41,114 40,763 41,966 41,281 41,435 31,706 39,397 BTC Equivalent Mined 21.95 35.64 74.33 153.20 302.33 73.67 75.72 76.25 225.66 81.87 94.74 398.80 Prop Mining 21.95 35.64 48.02 111.95 230.39 60.23 63.32 65.63 189.23 72.80 81.06 340.09 Hosting - - 26.31 41.25 71.93 13.44 12.40 10.62 36.43 9.06 13.67 58.70 (1) Average of April 2021 - June 2021 (2) Average of July 2021 - September 2021 (3) Average of October 2021 - December 2021 (4) Average of January 2021 - December 2021 (5) Average of January 2022 - March 2022 (6) Average of January 2022 - May 2022
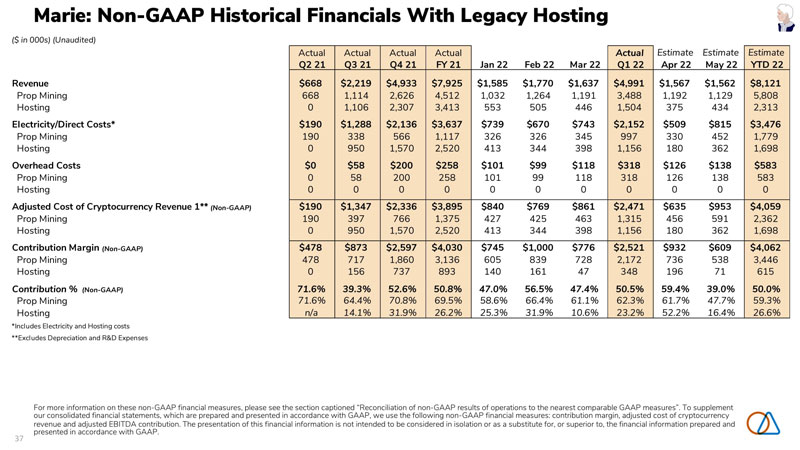
37 Marie: Non-GAAP Historical Financials With Legacy Hosting For more information on these non-GAAP financial measures, please see the section captioned “Reconciliation of non-GAAP results of operations to the nearest comparable GAAP measures”. To supplement our consolidated financial statements, which are prepared and presented in accordance with GAAP, we use the following non-GAAP financial measures: contribution margin, adjusted cost of cryptocurrency revenue and adjusted EBITDA contribution. The presentation of this financial information is not intended to be considered in isolation or as a substitute for, or superior to, the financial information prepared and presented in accordance with GAAP. ($ in 000s) (Unaudited) Actual Actual Actual Actual Actual Estimate Estimate Estimate Q2 21 Q3 21 Q4 21 FY 21 Jan 22 Feb 22 Mar 22 Q1 22 Apr 22 May 22 YTD 22 Revenue $668 $2,219 $4,933 $7,925 $1,585 $1,770 $1,637 $4,991 $1,567 $1,562 $8,121 Prop Mining 668 1,114 2,626 4,512 1,032 1,264 1,191 3,488 1,192 1,129 5,808 Hosting 0 1,106 2,307 3,413 553 505 446 1,504 375 434 2,313 Electricity/Direct Costs* $190 $1,288 $2,136 $3,637 $739 $670 $743 $2,152 $509 $815 $3,476 Prop Mining 190 338 566 1,117 326 326 345 997 330 452 1,779 Hosting 0 950 1,570 2,520 413 344 398 1,156 180 362 1,698 Overhead Costs $0 $58 $200 $258 $101 $99 $118 $318 $126 $138 $583 Prop Mining 0 58 200 258 101 99 118 318 126 138 583 Hosting 0 0 0 0 0 0 0 0 0 0 0 Adjusted Cost of Cryptocurrency Revenue 1** (Non-GAAP) $190 $1,347 $2,336 $3,895 $840 $769 $861 $2,471 $635 $953 $4,059 Prop Mining 190 397 766 1,375 427 425 463 1,315 456 591 2,362 Hosting 0 950 1,570 2,520 413 344 398 1,156 180 362 1,698 Contribution Margin (Non-GAAP) $478 $873 $2,597 $4,030 $745 $1,000 $776 $2,521 $932 $609 $4,062 Prop Mining 478 717 1,860 3,136 605 839 728 2,172 736 538 3,446 Hosting 0 156 737 893 140 161 47 348 196 71 615 Contribution % (Non-GAAP) 71.6% 39.3% 52.6% 50.8% 47.0% 56.5% 47.4% 50.5% 59.4% 39.0% 50.0% Prop Mining 71.6% 64.4% 70.8% 69.5% 58.6% 66.4% 61.1% 62.3% 61.7% 47.7% 59.3% Hosting n/a 14.1% 31.9% 26.2% 25.3% 31.9% 10.6% 23.2% 52.2% 16.4% 26.6% *Includes Electricity and Hosting costs **Excludes Depreciation and R&D Expenses
38 Reconciliation of non-GAAP results of operations to the nearest comparable GAAP measures
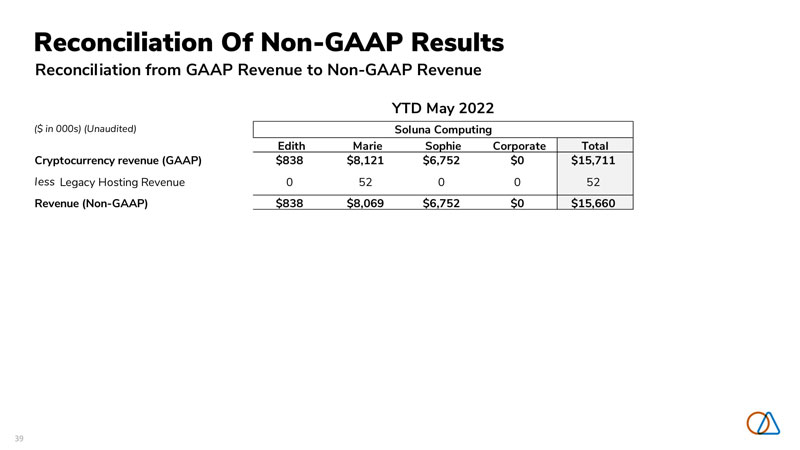
39 Reconciliation Of Non-GAAP Results Reconciliation from GAAP Revenue to Non-GAAP Revenue YTD May 2022 ($ in 000s) (Unaudited) Soluna Computing Edith Marie Sophie Corporate Total Cryptocurrency revenue (GAAP) $838 $8,121 $6,752 $0 $15,711 less Legacy Hosting Revenue 0 52 0 0 52 Revenue (Non-GAAP) $838 $8,069 $6,752 $0 $15,660
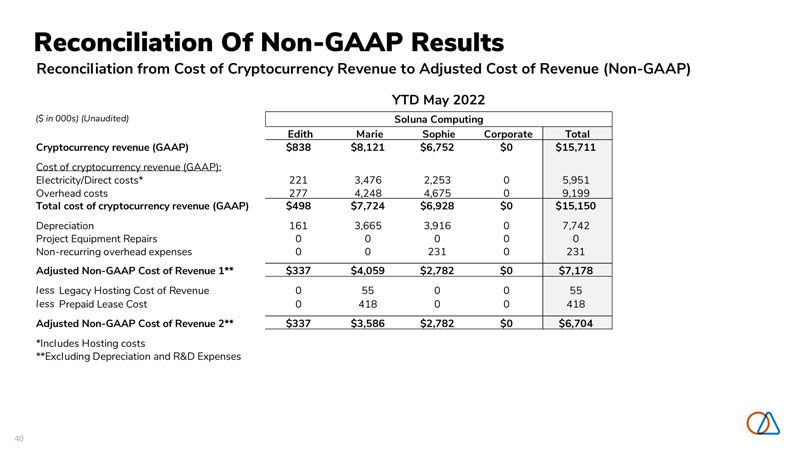
40 Reconciliation Of Non-GAAP Results Reconciliation from Cost of Cryptocurrency Revenue to Adjusted Cost of Revenue (Non-GAAP) YTD May 2022 ($ in 000s) (Unaudited) Soluna Computing Edith Marie Sophie Corporate Total Cryptocurrency revenue (GAAP) $838 $8,121 $6,752 $0 $15,711 Cost of cryptocurrency revenue (GAAP): Electricity/Direct costs* 221 3,476 2,253 0 5,951 Overhead costs 277 4,248 4,675 0 9,199 Total cost of cryptocurrency revenue (GAAP) $498 $7,724 $6,928 $0 $15,150 Depreciation 161 3,665 3,916 0 7,742 Project Equipment Repairs 0 0 0 0 0 Non-recurring overhead expenses 0 0 231 0 231 Adjusted Non-GAAP Cost of Revenue 1** $337 $4,059 $2,782 $0 $7,178 less Legacy Hosting Cost of Revenue 0 55 0 0 55 less Prepaid Lease Cost 0 418 0 0 418 Adjusted Non-GAAP Cost of Revenue 2** $337 $3,586 $2,782 $0 $6,704 *Includes Hosting costs **Excluding Depreciation and R&D Expenses

41 Reconciliation Of Non-GAAP Results Contribution Margin & Cash Contribution Margin (Non-GAAP) YTD May 2022 ($ in 000s) (Unaudited) Soluna Computing Edith Marie Sophie Corporate Total Cryptocurrency revenue (GAAP) $838 $8,121 $6,752 $0 $15,711 Cost of cryptocurrency revenue (GAAP) 498 7,724 6,928 0 15,150 Depreciation 161 3,665 3,916 0 7,742 Project Equipment Repairs 0 0 0 0 0 Non-recurring overhead expenses 0 0 231 0 231 Contribution Margin (Non-GAAP)* $502 $4,062 $3,971 $0 $8,534 plus Prepaid Lease Cost 0 418 0 0 418 plus Legacy Hosting Contribution Margin 0 3 0 0 3 Cash Contribution Margin (Non-GAAP)* $502 $4,483 $3,971 $0 $8,955 plus Forced Shutdown (Management Estimate) 0 441 0 0 441 Cash Contribution Margin (Non-GAAP) excluding Tornado & Shutdown* $502 $4,925 $3,971 $0 $9,397 *Excludes R&D Expenses, SG&A Expenses
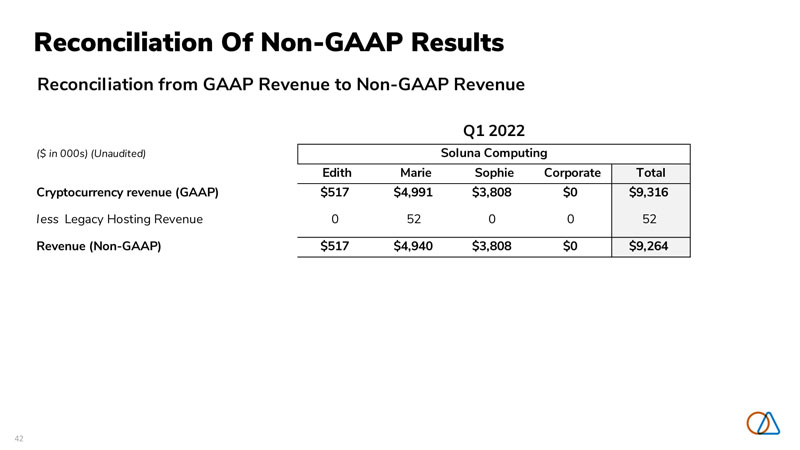
42 Reconciliation Of Non-GAAP Results Reconciliation from GAAP Revenue to Non-GAAP Revenue ($ in 000s) (Unaudited) Edith Marie Sophie Corporate Total Cryptocurrency revenue (GAAP) $517 $4,991 $3,808 $0 $9,316 less Legacy Hosting Revenue 0 52 0 0 52 Revenue (Non-GAAP) $517 $4,940 $3,808 $0 $9,264 Q1 2022 Soluna Computing
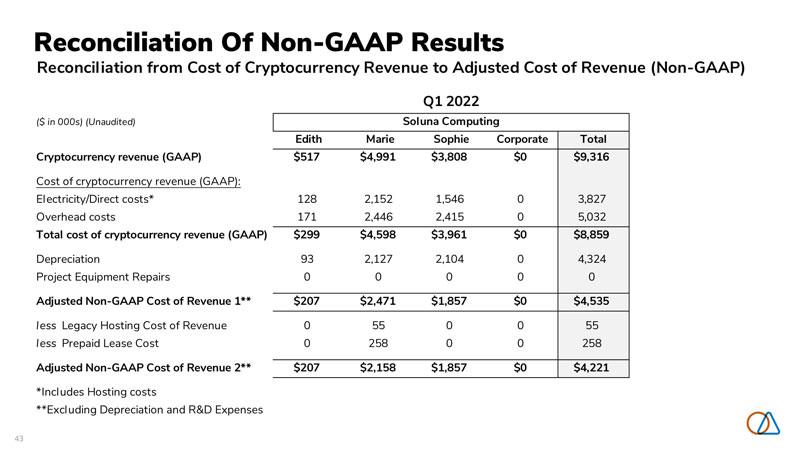
43 Reconciliation Of Non-GAAP Results Reconciliation from Cost of Cryptocurrency Revenue to Adjusted Cost of Revenue (Non-GAAP) ($ in 000s) (Unaudited) Edith Marie Sophie Corporate Total Cryptocurrency revenue (GAAP) $517 $4,991 $3,808 $0 $9,316 Cost of cryptocurrency revenue (GAAP): Electricity/Direct costs* 128 2,152 1,546 0 3,827 Overhead costs 171 2,446 2,415 0 5,032 Total cost of cryptocurrency revenue (GAAP) $299 $4,598 $3,961 $0 $8,859 Depreciation 93 2,127 2,104 0 4,324 Project Equipment Repairs 0 0 0 0 0 Adjusted Non-GAAP Cost of Revenue 1** $207 $2,471 $1,857 $0 $4,535 less Legacy Hosting Cost of Revenue 0 55 0 0 55 less Prepaid Lease Cost 0 258 0 0 258 Adjusted Non-GAAP Cost of Revenue 2** $207 $2,158 $1,857 $0 $4,221 *Includes Hosting costs **Excluding Depreciation and R&D Expenses Q1 2022 Soluna Computing
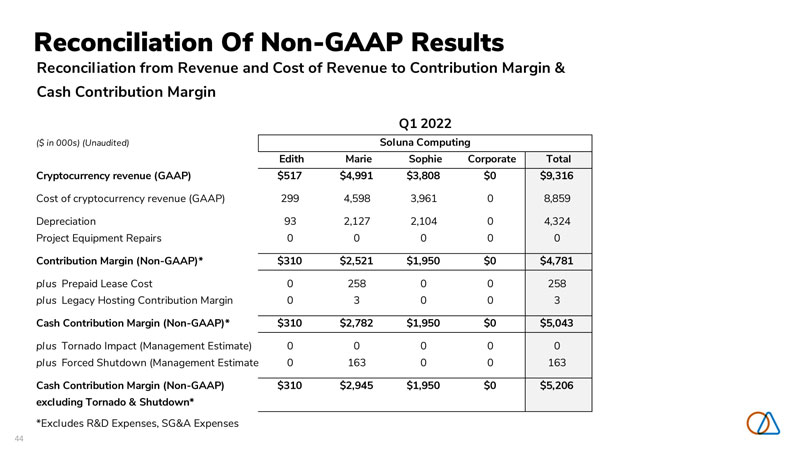
44 Reconciliation Of Non-GAAP Results ($ in 000s) (Unaudited) Edith Marie Sophie Corporate Total Cryptocurrency revenue (GAAP) $517 $4,991 $3,808 $0 $9,316 Cost of cryptocurrency revenue (GAAP) 299 4,598 3,961 0 8,859 Depreciation 93 2,127 2,104 0 4,324 Project Equipment Repairs 0 0 0 0 0 Contribution Margin (Non-GAAP)* $310 $2,521 $1,950 $0 $4,781 plus Prepaid Lease Cost 0 258 0 0 258 plus Legacy Hosting Contribution Margin 0 3 0 0 3 Cash Contribution Margin (Non-GAAP)* $310 $2,782 $1,950 $0 $5,043 plus Tornado Impact (Management Estimate) 0 0 0 0 0 plus Forced Shutdown (Management Estimate) 0 163 0 0 163 Cash Contribution Margin (Non-GAAP) excluding Tornado & Shutdown* $310 $2,945 $1,950 $0 $5,206 *Excludes R&D Expenses, SG&A Expenses Reconciliation from Revenue and Cost of Revenue to Contribution Margin & Cash Contribution Margin Q1 2022 Soluna Computing
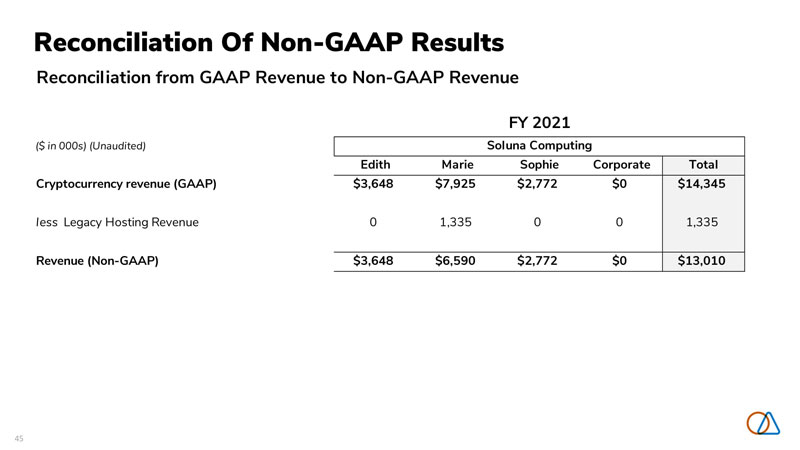
45 Reconciliation Of Non-GAAP Results Reconciliation from GAAP Revenue to Non-GAAP Revenue ($ in 000s) (Unaudited) Edith Marie Sophie Corporate Total Cryptocurrency revenue (GAAP) $3,648 $7,925 $2,772 $0 $14,345 less Legacy Hosting Revenue 0 1,335 0 0 1,335 Revenue (Non-GAAP) $3,648 $6,590 $2,772 $0 $13,010 FY 2021 Soluna Computing
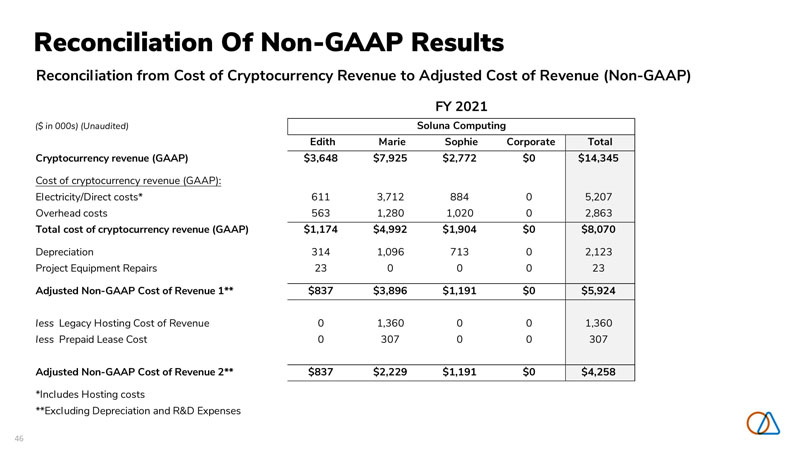
46 Reconciliation from Cost of Cryptocurrency Revenue to Adjusted Cost of Revenue (Non-GAAP) ($ in 000s) (Unaudited) Edith Marie Sophie Corporate Total Cryptocurrency revenue (GAAP) $3,648 $7,925 $2,772 $0 $14,345 Cost of cryptocurrency revenue (GAAP): Electricity/Direct costs* 611 3,712 884 0 5,207 Overhead costs 563 1,280 1,020 0 2,863 Total cost of cryptocurrency revenue (GAAP) $1,174 $4,992 $1,904 $0 $8,070 Depreciation 314 1,096 713 0 2,123 Project Equipment Repairs 23 0 0 0 23 Adjusted Non-GAAP Cost of Revenue 1** $837 $3,896 $1,191 $0 $5,924 less Legacy Hosting Cost of Revenue 0 1,360 0 0 1,360 less Prepaid Lease Cost 0 307 0 0 307 Adjusted Non-GAAP Cost of Revenue 2** $837 $2,229 $1,191 $0 $4,258 *Includes Hosting costs **Excluding Depreciation and R&D Expenses FY 2021 Soluna Computing Reconciliation Of Non-GAAP Results
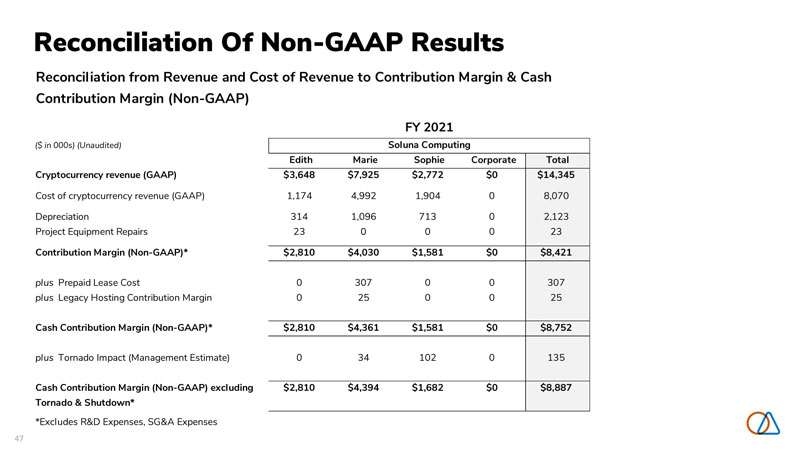
47 Reconciliation Of Non-GAAP Results ($ in 000s) (Unaudited) Edith Marie Sophie Corporate Total Cryptocurrency revenue (GAAP) $3,648 $7,925 $2,772 $0 $14,345 Cost of cryptocurrency revenue (GAAP) 1,174 4,992 1,904 0 8,070 Depreciation 314 1,096 713 0 2,123 Project Equipment Repairs 23 0 0 0 23 Contribution Margin (Non-GAAP)* $2,810 $4,030 $1,581 $0 $8,421 plus Prepaid Lease Cost 0 307 0 0 307 plus Legacy Hosting Contribution Margin 0 25 0 0 25 Cash Contribution Margin (Non-GAAP)* $2,810 $4,361 $1,581 $0 $8,752 plus Tornado Impact (Management Estimate) 0 34 102 0 135 Cash Contribution Margin (Non-GAAP) excluding Tornado & Shutdown* $2,810 $4,394 $1,682 $0 $8,887 *Excludes R&D Expenses, SG&A Expenses FY 2021 Soluna Computing Reconciliation from Revenue and Cost of Revenue to Contribution Margin & Cash Contribution Margin (Non-GAAP)
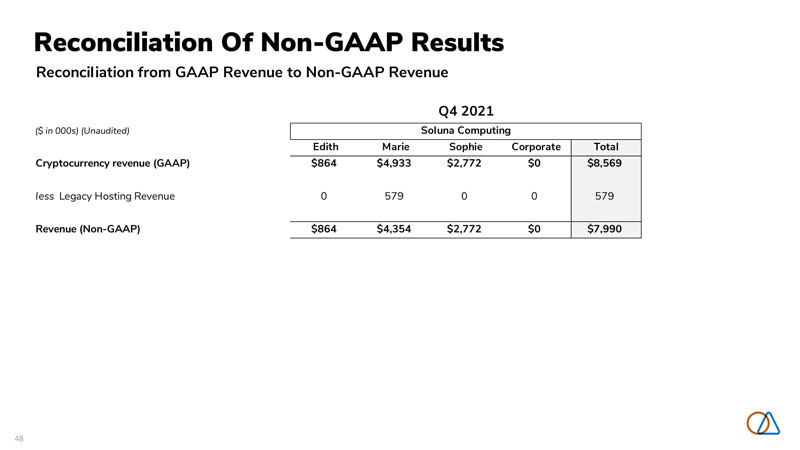
48 Reconciliation Of Non-GAAP Results Reconciliation from GAAP Revenue to Non-GAAP Revenue ($ in 000s) (Unaudited) Edith Marie Sophie Corporate Total Cryptocurrency revenue (GAAP) $864 $4,933 $2,772 $0 $8,569 less Legacy Hosting Revenue 0 579 0 0 579 Revenue (Non-GAAP) $864 $4,354 $2,772 $0 $7,990 Q4 2021 Soluna Computing
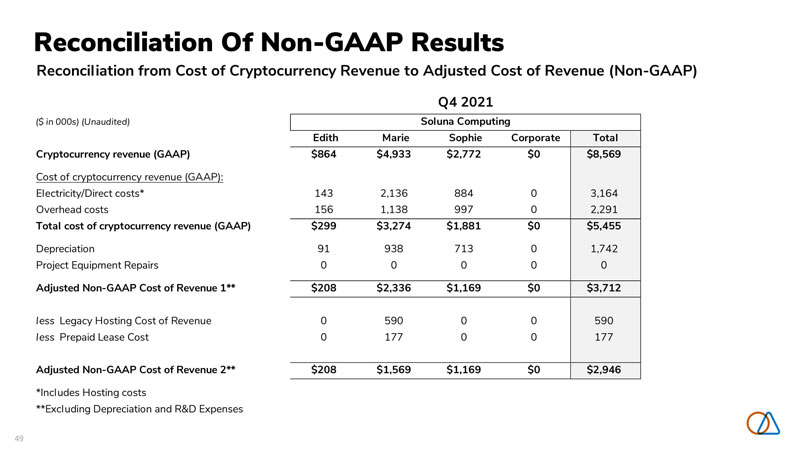
49 Reconciliation Of Non-GAAP Results Reconciliation from Cost of Cryptocurrency Revenue to Adjusted Cost of Revenue (Non-GAAP) ($ in 000s) (Unaudited) Edith Marie Sophie Corporate Total Cryptocurrency revenue (GAAP) $864 $4,933 $2,772 $0 $8,569 Cost of cryptocurrency revenue (GAAP): Electricity/Direct costs* 143 2,136 884 0 3,164 Overhead costs 156 1,138 997 0 2,291 Total cost of cryptocurrency revenue (GAAP) $299 $3,274 $1,881 $0 $5,455 Depreciation 91 938 713 0 1,742 Project Equipment Repairs 0 0 0 0 0 Adjusted Non-GAAP Cost of Revenue 1** $208 $2,336 $1,169 $0 $3,712 less Legacy Hosting Cost of Revenue 0 590 0 0 590 less Prepaid Lease Cost 0 177 0 0 177 Adjusted Non-GAAP Cost of Revenue 2** $208 $1,569 $1,169 $0 $2,946 *Includes Hosting costs **Excluding Depreciation and R&D Expenses Q4 2021 Soluna Computing
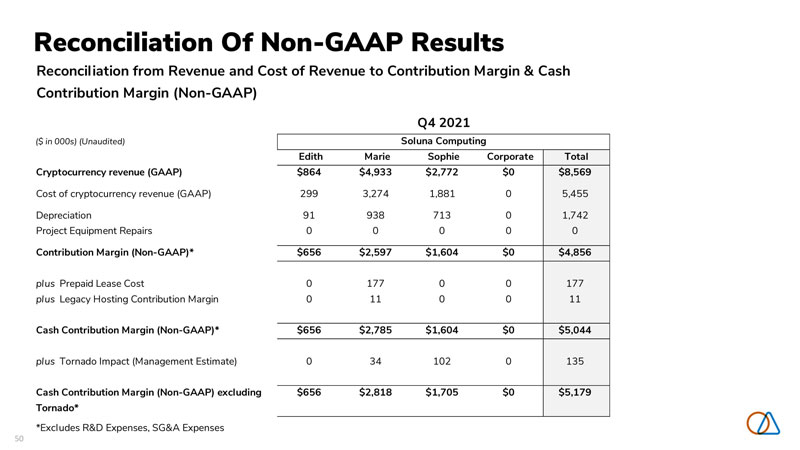
50 Reconciliation Of Non-GAAP Results ($ in 000s) (Unaudited) Edith Marie Sophie Corporate Total Cryptocurrency revenue (GAAP) $864 $4,933 $2,772 $0 $8,569 Cost of cryptocurrency revenue (GAAP) 299 3,274 1,881 0 5,455 Depreciation 91 938 713 0 1,742 Project Equipment Repairs 0 0 0 0 0 Contribution Margin (Non-GAAP)* $656 $2,597 $1,604 $0 $4,856 plus Prepaid Lease Cost 0 177 0 0 177 plus Legacy Hosting Contribution Margin 0 11 0 0 11 Cash Contribution Margin (Non-GAAP)* $656 $2,785 $1,604 $0 $5,044 plus Tornado Impact (Management Estimate) 0 34 102 0 135 Cash Contribution Margin (Non-GAAP) excluding Tornado* $656 $2,818 $1,705 $0 $5,179 *Excludes R&D Expenses, SG&A Expenses Soluna Computing Q4 2021 Reconciliation from Revenue and Cost of Revenue to Contribution Margin & Cash Contribution Margin (Non-GAAP)
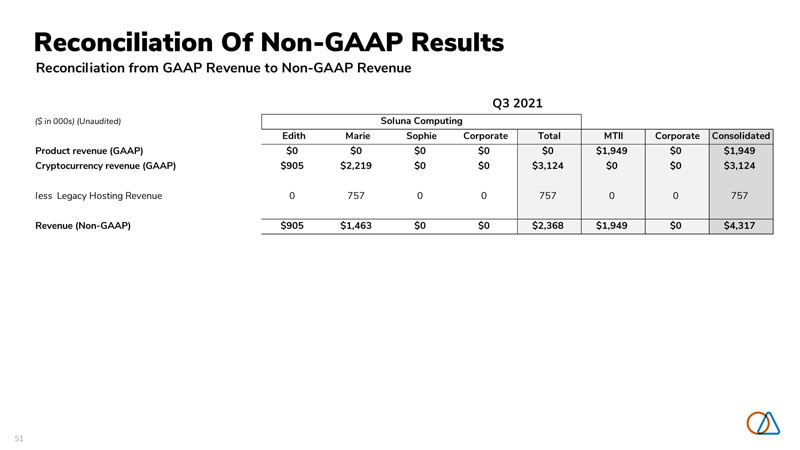
51 Reconciliation from GAAP Revenue to Non-GAAP Revenue ($ in 000s) (Unaudited) Edith Marie Sophie Corporate Total MTII Corporate Consolidated Product revenue (GAAP) $0 $0 $0 $0 $0 $1,949 $0 $1,949 Cryptocurrency revenue (GAAP) $905 $2,219 $0 $0 $3,124 $0 $0 $3,124 less Legacy Hosting Revenue 0 757 0 0 757 0 0 757 Revenue (Non-GAAP) $905 $1,463 $0 $0 $2,368 $1,949 $0 $4,317 Q3 2021 Soluna Computing Reconciliation Of Non-GAAP Results
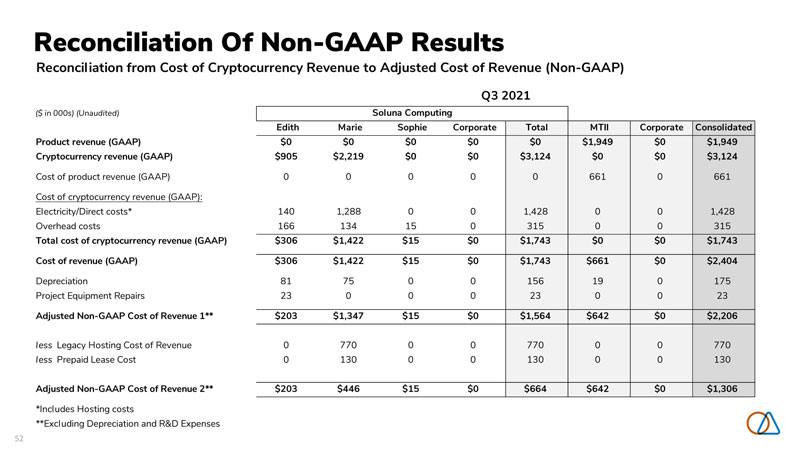
52 Reconciliation from Cost of Cryptocurrency Revenue to Adjusted Cost of Revenue (Non-GAAP) ($ in 000s) (Unaudited) Edith Marie Sophie Corporate Total MTII Corporate Consolidated Product revenue (GAAP) $0 $0 $0 $0 $0 $1,949 $0 $1,949 Cryptocurrency revenue (GAAP) $905 $2,219 $0 $0 $3,124 $0 $0 $3,124 Cost of product revenue (GAAP) 0 0 0 0 0 661 0 661 Cost of cryptocurrency revenue (GAAP): Electricity/Direct costs* 140 1,288 0 0 1,428 0 0 1,428 Overhead costs 166 134 15 0 315 0 0 315 Total cost of cryptocurrency revenue (GAAP) $306 $1,422 $15 $0 $1,743 $0 $0 $1,743 Cost of revenue (GAAP) $306 $1,422 $15 $0 $1,743 $661 $0 $2,404 Depreciation 81 75 0 0 156 19 0 175 Project Equipment Repairs 23 0 0 0 23 0 0 23 Adjusted Non-GAAP Cost of Revenue 1** $203 $1,347 $15 $0 $1,564 $642 $0 $2,206 less Legacy Hosting Cost of Revenue 0 770 0 0 770 0 0 770 less Prepaid Lease Cost 0 130 0 0 130 0 0 130 Adjusted Non-GAAP Cost of Revenue 2** $203 $446 $15 $0 $664 $642 $0 $1,306 *Includes Hosting costs **Excluding Depreciation and R&D Expenses Q3 2021 Soluna Computing Reconciliation Of Non-GAAP Results
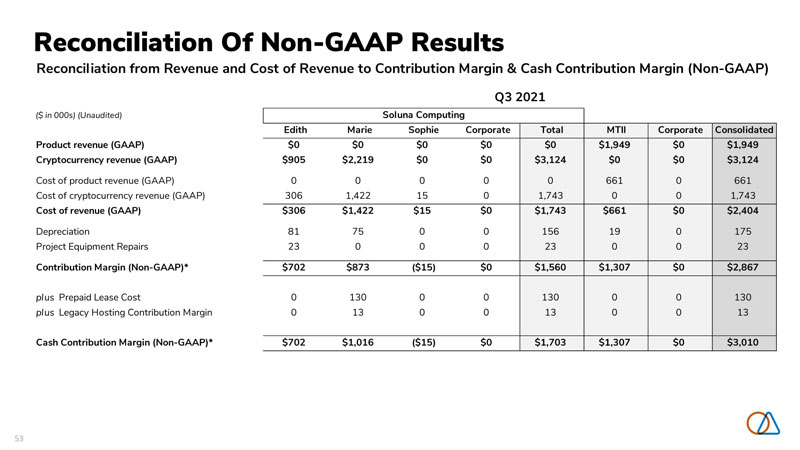
53 ($ in 000s) (Unaudited) Edith Marie Sophie Corporate Total MTII Corporate Consolidated Product revenue (GAAP) $0 $0 $0 $0 $0 $1,949 $0 $1,949 Cryptocurrency revenue (GAAP) $905 $2,219 $0 $0 $3,124 $0 $0 $3,124 Cost of product revenue (GAAP) 0 0 0 0 0 661 0 661 Cost of cryptocurrency revenue (GAAP) 306 1,422 15 0 1,743 0 0 1,743 Cost of revenue (GAAP) $306 $1,422 $15 $0 $1,743 $661 $0 $2,404 Depreciation 81 75 0 0 156 19 0 175 Project Equipment Repairs 23 0 0 0 23 0 0 23 Contribution Margin (Non-GAAP)* $702 $873 ($15) $0 $1,560 $1,307 $0 $2,867 plus Prepaid Lease Cost 0 130 0 0 130 0 0 130 plus Legacy Hosting Contribution Margin 0 13 0 0 13 0 0 13 Cash Contribution Margin (Non-GAAP)* $702 $1,016 ($15) $0 $1,703 $1,307 $0 $3,010 Q3 2021 Reconciliation from Revenue and Cost of Revenue to Contribution Margin & Cash Contribution Margin (Non-GAAP) Soluna Computing Reconciliation Of Non-GAAP Results
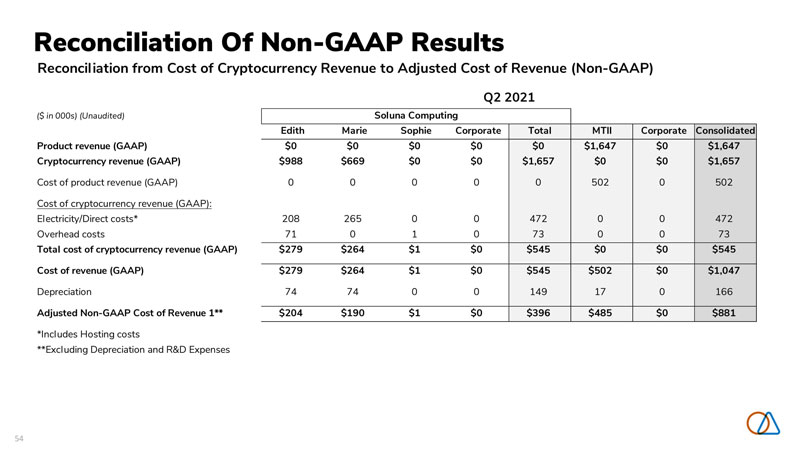
54 Reconciliation from Cost of Cryptocurrency Revenue to Adjusted Cost of Revenue (Non-GAAP) ($ in 000s) (Unaudited) Edith Marie Sophie Corporate Total MTII Corporate Consolidated Product revenue (GAAP) $0 $0 $0 $0 $0 $1,647 $0 $1,647 Cryptocurrency revenue (GAAP) $988 $669 $0 $0 $1,657 $0 $0 $1,657 Cost of product revenue (GAAP) 0 0 0 0 0 502 0 502 Cost of cryptocurrency revenue (GAAP): Electricity/Direct costs* 208 265 0 0 472 0 0 472 Overhead costs 71 0 1 0 73 0 0 73 Total cost of cryptocurrency revenue (GAAP) $279 $264 $1 $0 $545 $0 $0 $545 Cost of revenue (GAAP) $279 $264 $1 $0 $545 $502 $0 $1,047 Depreciation 74 74 0 0 149 17 0 166 Adjusted Non-GAAP Cost of Revenue 1** $204 $190 $1 $0 $396 $485 $0 $881 *Includes Hosting costs **Excluding Depreciation and R&D Expenses Q2 2021 Soluna Computing Reconciliation Of Non-GAAP Results

55 Reconciliation from Revenue and Cost of Revenue to Contribution Margin (Non-GAAP) ($ in 000s) (Unaudited) Edith Marie Sophie Corporate Total MTII Corporate Consolidated Product revenue (GAAP) $0 $0 $0 $0 $0 $1,647 $0 $1,647 Cryptocurrency revenue (GAAP) $988 $669 $0 $0 $1,657 $0 $0 $1,657 Cost of product revenue (GAAP) 0 0 0 0 0 502 0 502 Cost of cryptocurrency revenue (GAAP) 279 264 1 0 545 0 0 545 Cost of revenue (GAAP) $279 $264 $1 $0 $545 $502 $0 $1,047 Depreciation 74 74 0 0 149 17 0 166 Contribution Margin (Non-GAAP)* $784 $478 ($1) $0 $1,261 $1,162 $0 $2,423 *Excludes R&D Expenses, SG&A Expenses Soluna Computing Q2 2021 Reconciliation Of Non-GAAP Results

56 Reconciliation from Cost of Cryptocurrency Revenue to Adjusted Cost of Revenue (Non-GAAP) ($ in 000s) (Unaudited) Edith Marie Sophie Corporate Total MTII Corporate Consolidated Product revenue (GAAP) $0 $0 $0 $0 $0 $1,337 $0 $1,337 Cryptocurrency revenue (GAAP) $891 $104 $0 $0 $995 $0 $0 $995 Cost of product revenue (GAAP) 0 0 0 0 0 452 0 452 Cost of cryptocurrency revenue (GAAP): Electricity/Direct costs* 120 23 0 0 143 0 0 143 Overhead costs 170 9 6 0 185 0 0 185 Total cost of cryptocurrency revenue (GAAP) $290 $31 $7 $0 $328 $0 $0 $328 Cost of revenue (GAAP) $290 $31 $7 $0 $328 $452 $0 $780 Depreciation 68 8 0 0 76 17 0 93 Adjusted Non-GAAP Cost of Revenue 1** $222 $23 $7 $0 $251 $435 $0 $687 *Includes Hosting costs **Excluding Depreciation and R&D Expenses Q1 2021 Soluna Computing Reconciliation Of Non-GAAP Results
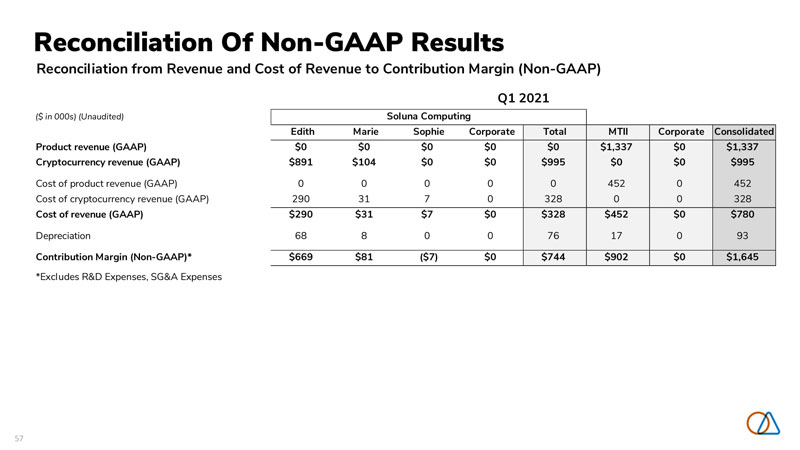
57 Reconciliation from Revenue and Cost of Revenue to Contribution Margin (Non-GAAP) ($ in 000s) (Unaudited) Edith Marie Sophie Corporate Total MTII Corporate Consolidated Product revenue (GAAP) $0 $0 $0 $0 $0 $1,337 $0 $1,337 Cryptocurrency revenue (GAAP) $891 $104 $0 $0 $995 $0 $0 $995 Cost of product revenue (GAAP) 0 0 0 0 0 452 0 452 Cost of cryptocurrency revenue (GAAP) 290 31 7 0 328 0 0 328 Cost of revenue (GAAP) $290 $31 $7 $0 $328 $452 $0 $780 Depreciation 68 8 0 0 76 17 0 93 Contribution Margin (Non-GAAP)* $669 $81 ($7) $0 $744 $902 $0 $1,645 *Excludes R&D Expenses, SG&A Expenses Soluna Computing Q1 2021 Reconciliation Of Non-GAAP Results

58 The future of renewable energy is computing.

59 Learn more at solunacomputing.com