EXHIBIT (c)(2)
| | | |
| Gencor Industries, Inc. | | CONFIDENTIAL |
|
10.07.03
PRESENTATION TO THE BOARD OF DIRECTORS
This presentation and its analyses are only for the use of the Board of Directors and are not intended to, nor should they be, relied upon by any other party, including stockholders of Gencor Industries, Inc. The consent of Capitalink is required prior to the disclosure to any third party of this presentation, its analyses, or of the assessments made by Capitalink. These materials are based solely on information contained in publicly available documents and certain other information provided to Capitalink by management and the Board of Directors. Capitalink has not attempted to investigate or verify the accuracy or completeness of such publicly available information or other information provided to Capitalink. Capitalink has relied upon the accuracy and completeness of such publicly available information and other information supplied to Capitalink. These materials are being furnished, and should be considered only in connection with, the oral presentation being provided by Capitalink in connection herewith. The preparation of these materials was completed on October 3, 2003 based on information publicly available or supplied to Capitalink through such date. Capitalink is not obligated to update this presentation or its analyses to reflect any information that becomes publicly available or that is provided to Capitalink after such date.
| | | |
| Gencor Industries, Inc. | | CONFIDENTIAL |
|
TABLE OF CONTENTS
| | | | | |
TRANSACTION OVERVIEW | | | 3 | |
| |
COMPANY OVERVIEW | | | 12 | |
| |
COMPANY FINANCIAL PERFORMANCE | | | 16 | |
| |
COMPANY MARKET PERFORMANCE | | | 29 | |
| |
VALUATION ANALYSIS | | | 41 | |
Page 2
| | | |
| Gencor Industries, Inc. | | CONFIDENTIAL |
|
TRANSACTION OVERVIEW
Page 3
| | | |
| Gencor Industries, Inc. | | CONFIDENTIAL |
|
TRANSACTION OVERVIEW
INTRODUCTION
| | • | | The Board of Directors of Gencor Industries, Inc. (“Gencor” or the “Company”) has retained Capitalink, L.C. (“Capitalink”) as financial advisor and to render an opinion as to the fairness, from a financial point of view, of an offer by the Company to purchase all of the Company’s outstanding shares of common stock that are not beneficially owned by the Continuing Stockholders (as defined herein) for per share consideration of $2.00 in cash and a $1.00 principal amount junior subordinated promissory note (the “Offer”). |
| |
| | • | | The “Continuing Stockholders” are E.J. Elliott (Chairman of the Board of Directors and President of the Company), John E. Elliott (EVP and Director of the Company), Marc Elliott (President of the Company’s Construction Equipment Group), the Elliott Foundation and their affiliates. |
| |
| | • | | The Continuing Stockholders, which as a group own approximately 35.7% of the outstanding shares of the Company’s common stock currently issued and outstanding (assuming the Company’s Class B stock was converted), do not intend to tender any of their shares pursuant to the Offer. |
| |
| | • | | Assuming a majority of the stock not held by the Continuing Stockholders are tendered pursuant to the Offer the Company intends to terminate the registration of the Company’s common stock under the Securities Exchange Act of 1934, as amended (the “Act”). If less than a majority of the shares not held by the Continuing Stockholders are tendered pursuant to the Offer and the remaining record number of stockholders, including the Continuing Stockholders, would be greater than 300, the Company will accept those common shares tendered pursuant to the Offer, but will not terminate the registration of the Company’s common stock under the Act. In the event that less than a majority of the shares not held by the Continuing Stockholders are tendered pursuant to the Offer and the remaining record number of stockholders, including the Continuing Stockholders, would be less than 300, the Company will not accept any common stock tendered pursuant to the Offer. |
| |
| | • | | The Company’s common stock is publicly traded on the pink sheets under the symbol “GNCI.PK”, and as of October 3, 2003, there were 6,884,070 shares of the Company’s common stock outstanding (excluding treasury shares). As of this date, the Company also had 1,798,398 Class B shares. As a class, holders of Class B stock hold 75% of the voting power to elect the Company’s Board of Directors and with respect to |
Page 4
| | | |
| Gencor Industries, Inc. | | CONFIDENTIAL |
|
TRANSACTION OVERVIEW
INTRODUCTION
| | | | any other decision requiring stockholder approval. Common stock and Class B have equal rights with respect to dividends, preferences, and rights, including rights in liquidation. |
| |
| | • | | The closing price of the Company’s common stock on October 3, 2003 (date presentation materials completed) was $2.45. |
Page 5
| | | |
| Gencor Industries, Inc. | | CONFIDENTIAL |
|
TRANSACTION OVERVIEW
SUMMARY OF PROPOSED TRANSACTION TERMS
| | | |
| Proposed Consideration: | | For each share, $2.00 in cash and a $1.00 principal amount junior subordinated promissory note (the “Note”). |
| | | |
| Terms of the Consideration: | | Cash paid and Note issued at closing. The Note bears interest at 10% per year, payable semi-annually. Principal is paid in full on December 31, 2006. It is not intended that the Notes will be registered with the Securities and Exchange Commission (the “SEC”) nor be listed for trading on an exchange or qualify the Notes for trading on an automated quotation system operated by a national securities association. Therefore, a trading market is not expected to develop for the Notes. |
| | | |
| Offer Structure: | | The Company is offering to buy back its outstanding shares of common stock in a self-tender offer and exchange offer. The Continuing Stockholders do not intend to tender any of their shares pursuant to the Offer. |
| | | |
| Offer Conditions: | | Assuming a majority of the shares not held by the Continuing Stockholders are tendered pursuant to the Offer the Company intends to engage in a second step transaction and purchase the remaining outstanding shares held by stockholders other than the Continuing Stockholders and to terminate the registration of the Company’s common stock under the Act. If less than a majority of the shares not held by the Continuing Stockholders are tendered pursuant to the Offer and the remaining number of stockholders, including the Continuing Stockholders, would be greater than 300, the Company will accept those common stock tendered pursuant to the Offer, but will not terminate the registration of the Company’s common stock under the Act. In the event that less than a majority of the shares not held by the Continuing Stockholders are tendered pursuant to the Offer and the remaining number of stockholders, including the Continuing Stockholders, would |
Page 6
| | | |
| Gencor Industries, Inc. | | CONFIDENTIAL |
|
TRANSACTION OVERVIEW
SUMMARY OF PROPOSED TRANSACTION TERMS
| | | |
| | | be less than 300, the Company will not accept any common shares tendered pursuant to the Offer. |
| | | |
| SEC Registration: | | In the event certain previously noted conditions are met, the Company will terminate the registration of its common stock under the Act, and will no longer be required to file periodic reports with the SEC. As a result, no current information about the Company will be publicly available. |
| | | |
| Tax Implications: | | For those stockholders who tender pursuant to the Offer, the receipt of cash and Notes in exchange for shares of the Company’s common stock will be a taxable transaction for United States federal income tax purposes under the Internal Revenue Code of 1986, as amended. In addition it may be a taxable transaction under applicable state, local, foreign and other tax laws. |
| | | |
| Expiration Date: | | The Offer expires 20 business days after commencement of the Offer. |
| | | |
| Appraisal Rights: | | Appraisal rights are not available in the Offer. |
Page 7
| | | |
| Gencor Industries, Inc. | | CONFIDENTIAL |
|
TRANSACTION OVERVIEW
STOCKHOLDER REVIEW
Common Stock Ownership
(Share amounts are in thousands)
| | | | | | | | | | | | | | | | | | | | | | | | | | | | | | | | | | | | | | | | | | | | |
| | | | | | | | | | as of October 1, 2003 | | | | | | | | | | | | | | | | | | Total Ownership % |
| | | | | | | | | |
| | Common Stock Ownership % | | Class B Ownership % | | Assuming Class B Conv. |
| | | | | | | | | | Common | | Class B | | Total | |
| |
| |
|
| | | | | | Avg | | Stock | | Stock | | Assuming | | | | | | Fully | | | | | | Fully | | | | | | Fully |
| | | | | | Ex. Price | | Equiv. | | Equiv. | | Class B Conv. | | Primary | | Diluted | | Primary | | Diluted | | Primary | | Diluted |
| | | | | |
| |
| |
| |
| |
| |
| |
| |
| |
| |
|
Common Shares Outstanding | | | | | | | | | | | | | | | | | | | | | | | | | | | | | | | | | | | | | | | | |
| | Continuing Shareholders | | | | | | | | | | | | | | | | | | | | | | | | | | | | | | | | | | | | | | | | |
| | | E.J. Elliot | | | | | | | 702 | | | | 1,348 | | | | 2,050 | | | | 10.2 | % | | | 9.0 | % | | | 75.0 | % | | | 55.4 | % | | | 23.6 | % | | | 20.1 | % |
| | | Elliot Foundation | | | | | | | 49 | | | | - | | | | 49 | | | | 0.7 | % | | | 0.6 | % | | | 0.0 | % | | | 0.0 | % | | | 0.6 | % | | | 0.5 | % |
| | | John E. Elliot | | | | | | | 458 | | | | 132 | | | | 590 | | | | 6.7 | % | | | 5.9 | % | | | 7.3 | % | | | 5.4 | % | | | 6.8 | % | | | 5.8 | % |
| | | Marc G. Elliot | | | | | | | 120 | | | | 102 | | | | 222 | | | | 1.7 | % | | | 1.5 | % | | | 5.6 | % | | | 4.2 | % | | | 2.6 | % | | | 2.2 | % |
| | | Other Affiliates | | | | | | | 189 | | | | - | | | | 189 | | | | 2.7 | % | | | 2.4 | % | | | 0.0 | % | | | 0.0 | % | | | 2.2 | % | | | 1.9 | % |
| | | | | | | |
| | | |
| | | |
| | | |
| | | |
| | | |
| | | |
| | | |
| | | |
| |
| | | Total Continuing Shareholders | | | | | | | 1,518 | | | | 1,581 | | | | 3,099 | | | | 22.1 | % | | | 19.5 | % | | | 87.9 | % | | | 65.0 | % | | | 35.7 | % | | | 30.4 | % |
| | | | | | | |
| | | |
| | | |
| | | |
| | | |
| | | |
| | | |
| | | |
| | | |
| |
| | Non-Continuing Shareholders | | | | | | | | | | | | | | | | | | | | | | | | | | | | | | | | | | | | | | | | |
| | | Scott Runkel | | | | | | | - | | | | - | | | | - | | | | 0.0 | % | | | 0.0 | % | | | 0.0 | % | | | 0.0 | % | | | 0.0 | % | | | 0.0 | % |
| | | Jeanne Lyons | | | | | | | 2 | | | | - | | | | 2 | | | | 0.0 | % | | | 0.0 | % | | | 0.0 | % | | | 0.0 | % | | | 0.0 | % | | | 0.0 | % |
| | | David F. Brashears | | | | | | | 41 | | | | - | | | | 41 | | | | 0.6 | % | | | 0.5 | % | | | 0.0 | % | | | 0.0 | % | | | 0.5 | % | | | 0.4 | % |
| | | All Others | | | | | | | 5,323 | | | | 217 | | | | 5,540 | | | | 77.3 | % | | | 68.5 | % | | | 12.1 | % | | | 8.9 | % | | | 63.8 | % | | | 54.3 | % |
| | | | | | | |
| | | |
| | | |
| | | |
| | | |
| | | |
| | | |
| | | |
| | | |
| |
| | | Total Non-Continuing Shareholders | | | | | | | 5,366 | | | | 217 | | | | 5,583 | | | | 77.9 | % | | | 69.0 | % | | | 12.1 | % | | | 8.9 | % | | | 64.3 | % | | | 54.7 | % |
| | | | | | | |
| | | |
| | | |
| | | |
| | | |
| | | |
| | | |
| | | |
| | | |
| |
| | | | Total Primary | | | | | | | 6,884 | | | | 1,798 | | | | 8,682 | | | | 100.0 | % | | | 88.6 | % | | | 100.0 | % | | | 73.9 | % | | | 100.0 | % | | | 85.1 | % |
| | | | | | | |
| | | |
| | | |
| | | |
| | | |
| | | |
| | | |
| | | |
| | | |
| |
Other Securities Issuable | | | | | | | | | | | | | | | | | | | | | | | | | | | | | | | | | | | | | | | | |
| | Continuing Shareholders | | | | | | | | | | | | | | | | | | | | | | | | | | | | | | | | | | | | | | | | |
| | | E.J. Elliot | | $ | 2.08 | | | | 590 | | | | - | | | | 590 | | | | | | | | 7.6 | % | | | | | | | 0.0 | % | | | | | | | 5.8 | % |
| | | John E. Elliot | | $ | 2.08 | | | | - | | | | 318 | | | | 318 | | | | | | | | 0.0 | % | | | | | | | 13.1 | % | | | | | | | 3.1 | % |
| | | Marc G. Elliot | | $ | 2.08 | | | | - | | | | 318 | | | | 318 | | | | | | | | 0.0 | % | | | | | | | 13.1 | % | | | | | | | 3.1 | % |
| | | Other Affiliates | | na | | | | - | | | | - | | | | - | | | | | | | | 0.0 | % | | | | | | | 0.0 | % | | | | | | | 0.0 | % |
| | | | | | | |
| | | |
| | | |
| | | | | | | |
| | | | | | | |
| | | | | | | |
| |
| | | Total Continuing Shareholders | | | | | | | 590 | | | | 636 | | | | 1,226 | | | | | | | | 7.6 | % | | | | | | | 26.1 | % | | | | | | | 12.0 | % |
| | | | | | | |
| | | |
| | | |
| | | | | | | |
| | | | | | | |
| | | | | | | |
| |
| | Non-Continuing Shareholders | | | | | | | | | | | | | | | | | | | | | | | | | | | | | | | | | | | | | | | | |
| | | Scott Runkel | | $ | 0.87 | | | | 100 | | | | - | | | | 100 | | | | | | | | 1.3 | % | | | | | | | 0.0 | % | | | | | | | 1.0 | % |
| | | Jeanne Lyons | | $ | 1.65 | | | | 10 | | | | - | | | | 10 | | | | | | | | 0.1 | % | | | | | | | 0.0 | % | | | | | | | 0.1 | % |
| | | David F. Brashears | | $ | 1.75 | | | | 140 | | | | - | | | | 140 | | | | | | | | 1.8 | % | | | | | | | 0.0 | % | | | | | | | 1.4 | % |
| | | All Others | | $ | 1.65 | | | | 50 | | | | - | | | | 50 | | | | | | | | 0.6 | % | | | | | | | 0.0 | % | | | | | | | 0.5 | % |
| | | | | | | |
| | | |
| | | |
| | | | | | | |
| | | | | | | |
| | | | | | | |
| |
| | | Total Non-Continuing Shareholders | | | | | | | 300 | | | | - | | | | 300 | | | | | | | | 3.9 | % | | | | | | | 0.0 | % | | | | | | | 2.9 | % |
| | | | | | | |
| | | |
| | | |
| | | | | | | |
| | | | | | | |
| | | | | | | |
| |
| | | | | | | | 1,480 | | | | 1,272 | | | | 2,752 | | | | | | | | 19.0 | % | | | | | | | 52.3 | % | | | | | | | 27.0 | % |
| | | | | | | |
| | | |
| | | |
| | | | | | | |
| | | | | | | |
| | | | | | | |
| |
| | | | Fully Diluted | | | | | | | 7,774 | | | | 2,434 | | | | 10,208 | | | | | | | | 100.0 | % | | | | | | | 100.0 | % | | | | | | | 100.0 | % |
| | | | | | | |
| | | |
| | | |
| | | | | | | |
| | | | | | | |
| | | | | | | |
| |
Sources of information: Company SEC filings and Company management.
Page 8
| | | |
| Gencor Industries, Inc. | | CONFIDENTIAL |
|
TRANSACTION OVERVIEW
SCOPE OF ENGAGEMENT
| | • | | In arriving at its opinion, Capitalink took into account its assessment of general economic, market and financial conditions as well as its experience in connection with similar transactions and securities valuations generally and, among other things: |
| | | |
| | o | Reviewed documents relating to the Offer. |
| |
| | o | Reviewed publicly available financial information and other data with respect to the Company, including the Annual Report on Form 10-K for the fiscal year ended September 30, 2002, the Quarterly Report on Form 10-Q for the quarter ended June 30, 2003, and the preliminary July 31, 2003 monthly internal financial statements. |
| |
| | o | Reviewed and analyzed the estimated present value of the Notes. |
| |
| | o | Reviewed and analyzed the Company’s projected unlevered free cash flows and prepared discounted cash flows. |
| |
| | o | Reviewed and analyzed certain financial characteristics of companies that were deemed to have characteristics comparable to those of the Company. |
| |
| | o | Reviewed and analyzed certain financial characteristics of comparable transactions that involved the acquisition of companies that were deemed to have characteristics comparable to those of the Company. |
| |
| | o | Reviewed and analyzed the premiums paid in transactions involving the acquisition of a majority ownership interest in publicly traded companies. |
| |
| | o | Reviewed and analyzed the premiums implied by the per share consideration in the Offer. |
| |
| | o | Reviewed and analyzed a range of possible scenarios and cash flow implications regarding the Company’s synthetic fuel investments. |
| |
| | o | Reviewed and discussed with representatives of the management of the Company certain financial and operating information furnished by them, including financial analyses and projections and related assumptions with respect to the business, operations and prospects of the Company. |
| |
| | o | Considered the historical financial results and present financial condition of the Company. |
| |
| | o | Reviewed certain publicly available information concerning the trading of, and the trading market for, the common stock of the Company. |
| |
| | o | Inquired about and discussed the Offer and other matters related thereto with Company management, the Board of Directors and its legal counsel. |
| |
| | o | Performed such other analyses and examinations as were deemed appropriate. |
Page 9
| | | |
| Gencor Industries, Inc. | | CONFIDENTIAL |
|
TRANSACTION OVERVIEW
SCOPE OF ENGAGEMENT
| | • | | The Capitalink opinion is necessarily based upon market, economic and other conditions, as they exist on, and could be evaluated as of October 7, 2003. Accordingly, although subsequent developments may affect its opinion, Capitalink does not assume any obligation to update, review or reaffirm its opinion. |
| |
| | • | | Capitalink assumes that the Offer will be consummated substantially in accordance with the terms set forth, without any further amendments thereto, and without waiver by the Company of any of the conditions to any obligations or in the alternative that any such amendments, revisions or waivers thereto will not be detrimental to the Company or the Non-Continuing stockholders of the Company. |
| |
| | • | | Capitalink has relied upon and assumed the accuracy and completeness of all of the financial and other information that was used by it without assuming any responsibility for any independent verification of any such information and has further relied upon the assurances of Company management that it is not aware of any facts or circumstances that would make any such information inaccurate or misleading. With respect to the financial projections utilized, Capitalink assumed that such projections have been reasonably prepared on a basis reflecting the best currently available estimates and judgments, and that such projections provide a reasonable basis upon which it could form an opinion. |
| |
| | • | | Capitalink has not made a physical inspection of the properties and facilities of the Company and has not made or obtained any evaluations or appraisals of the assets and liabilities (contingent or otherwise) of the Company. |
| |
| | • | | Capitalink assumed that the Offer will be consummated in a manner that complies in all respects with the applicable provisions of the Securities Act of 1933, as amended, the Securities Exchange Act of 1934, as amended, and all other applicable federal and state statues, rules and regulations. In addition, based upon discussions with the Company, it is assumed that the Offer will be a taxable event to the Company’s stockholders. |
| |
| | • | | Capitalink has not been requested to opine as to, and the opinion does not in any manner address, the underlying business decision of the Company to proceed with or affect the Offer. |
Page 10
| | | |
| Gencor Industries, Inc. | | CONFIDENTIAL |
|
TRANSACTION OVERVIEW
SCOPE OF ENGAGEMENT
| | • | | Capitalink was not asked to consider, and its opinion does not address, the relative merits of the Offer as compared to any alternative business strategy that might exist for the Company. Capitalink was not engaged to seek alternatives to the Offer that might exist for the Company. |
| |
| | • | | The opinion is for the use and benefit of the Board of Directors in connection with its consideration of Offer and is not intended to be and does not constitute a recommendation to any stockholder of the Company as to whether such stockholder should tender their respective shares of common stock. We do not express any opinion as to the underlying valuation or future performance of the Company or the price at which the Company’s common stock would trade at any time in the future. |
Page 11
| | | |
| Gencor Industries, Inc. | | CONFIDENTIAL |
|
COMPANY OVERVIEW
Page 12
| | | |
| Gencor Industries, Inc. | | CONFIDENTIAL |
|
OVERVIEW OF COMPANY
SUMMARY
| | • | | Gencor is a manufacturer of heavy machinery used in the production of asphalt and highway construction materials, synthetic fuels and environmental control equipment. |
| |
| | • | | Gencor’s origins began in 1968 with the merger of Mechtron Corporation with General Combustion, Inc. and Genco Manufacturing, Inc. Over the next twenty years, the Company began a series of acquisitions in fields related to asphalt production. In 1996, the Company expanded their acquisitions to include the food processing machinery industry. |
| |
| | • | | On September 13, 2000, the Company filed voluntary petitions commencing cases under Chapter 11 of the United States Bankruptcy Code. The Company emerged from Chapter 11 during the first quarter of 2002 and filed the Amended Plan on July 11, 2001, which satisfied all of the Company’s debts in full. The Company sold off their non-core businesses, including those related to the food processing machinery sector. |
| |
| | • | | Currently, the Company’s products are manufactured in one facility in the United Kingdom and two facilities in the United States. The Company believes it has the largest installed base of asphalt production plants in the United States. |
| |
| | • | | The Company’s principal core products include: asphalt plants; combustion systems; and fluid heat transfer systems: |
| | | |
| | o | Asphalt Plants: Gencor manufactures hot-mix asphalt plants used in the production of asphalt paving materials; related asphalt plant equipment such as hot-mix storage silos, fabric filtration systems, cold-feed bins; all other plant components; fully mobile batch plants; mobile shredders; and trommel screens. |
| |
| | o | Combustion Systems: Gencor manufactures combustion systems for the asphalt and aggregate drying industries; manufactures soil decontamination machinery; combustion systems for rotary dryers, kilns, fume; and liquid incinerators, boilers and tank heaters. |
Page 13
| | | |
| Gencor Industries, Inc. | | CONFIDENTIAL |
|
OVERVIEW OF COMPANY
SUMMARY
| | | |
| | o | Fluid Heat Transfer Systems: Gencor manufactures thermal fluid heat transfer systems and specialty storage tanks. Heaters are available for vertical, horizontal and underground tanks in steel, stainless steel and other materials designed to meet large or small specific job requirements. |
| | • | | The Company’s asphalt-related business is seasonal in nature primarily because its products are used by the highway construction industry. Orders for the Company’s products are generally placed between November and February; and the majority of shipments are delivered before May. |
| |
| | • | | The Company’s products are sold through a combination of Company sales representatives and independent dealers and agents located worldwide. |
| |
| | • | | Gencor is engaged in product engineering and development efforts to expand its product lines and to further develop more energy-efficient and environmentally compatible systems. Significant developments include the use of cost-effective, non-fossil fuels, refuse-derived fuel, coal and coal mixtures, the economical recycling of old asphalt and new designs of environmentally compatible asphalt plants. |
| |
| | • | | Gencor has previously received cash distributions from its 45% interest in Carbontronics LLC and its 25% interests in each of Carbontronics II LLC and Carbontronics Fuels LLC (collectively “Carbontronics”). Such income is based on the applicable provisions of Section 29 of the Internal Revenue Code, pursuant to which tax credits are available as a result of the production of synthetic fuel, an alternative energy source. To qualify for such Section 29 tax credits, a taxpayer has to meet a long and stringent list of controls and requirements, which for each producer of synthetic fuels culminates in a Private Letter Ruling (PLR) issued by the Internal Revenue Service (“IRS”). As a consequence, the historical performance of the entities comprising the Company’s interests in synfuel production has been one of frequent disruptions, and total unpredictability as to when and if any income and distribution thereof may occur. Further, the limited partners of these entities have the right to suspend any and all payments under certain conditions and circumstances, including initiations of IRS review (“Tax Event”). |
| |
| | • | | After the three quarterly distributions of fiscal year 2003, in June 2003 the IRS announced that it had reason to question the scientific validity of certain test procedures and results that have been presented to it by |
Page 14
| | | |
| Gencor Industries, Inc. | | CONFIDENTIAL |
|
OVERVIEW OF COMPANY
SUMMARY
| | | | taxpayers with interests in synfuel operations as evidence that the required “significant chemical change” has, indeed, occurred so as to quality as synthetic fuel. The IRS has suspended the issuance of PLR’s and it may revoke existing PLR’s that relied on the procedures and results under review if it determines that those test procedures and results do not demonstrate that a significant chemical change has occurred. |
| |
| | • | | In August 2003, the Company received noticed of a Tax Event and the IRS has requested Carbontronic records proposing to examine chemical change issues. Based upon these recent events, the Company can not predict if, and when, it might expect any additional distributions from Carbontronics |
| |
| | • | | Capitalink noted several general factors to be considered in connection with the status of Gencor as a publicly traded company: |
| | | |
| | o | The Company’s common stock historically has a limited trading volume and therefore a lack of liquidity for the Company’s stockholders. |
| |
| | o | The Company is not part of a high-growth industry that attracts investor interest and a high trading multiple. |
| |
| | o | The Company has not realized the benefits of public company status (i.e., ability to raise capital, use of stock as currency in acquisitions), but incurs the increased expenses necessary to comply with reporting requirements and other public company obligations. |
Page 15
| | | |
| Gencor Industries, Inc. | | CONFIDENTIAL |
|
COMPANY FINANCIAL PERFORMANCE
Page 16
| | | |
| Gencor Industries, Inc. | | CONFIDENTIAL |
|
COMPANY FINANCIAL PERFORMANCE
| | • | | Capitalink reviewed the Company’s historical and estimated financial data for the four fiscal years (“FY”) ended September 30, 2002, the nine months ended June 30, 2003 and preliminary data for the month of July 31, 2003. In addition, Capitalink reviewed the Company’s projections for the FY ending September 30, 2004 through September 30, 2007. |
| |
| | • | | Gencor’s operations can be divided into two main operations; (i) the core business operations, which includes the domestic and international asphalt plant manufacturing business, and (ii) their interest in Carbontronics. Capitalink’s analysis will analyze each of these operations separately. |
| |
| | • | | Revenue for the Company’s core business fell significantly over the reviewed period - from $101.4 million in FY1999 to $64.7 million for the latest twelve months (“LTM”) ended June 30, 2003. The fall in revenues was primarily due to several factors including the sale of the Company’s profitable food machinery business in FY2001, the general downturn in the economy partially stemming from the affects of September 11th, and the deterioration and closure of much of the Company’s international business. |
| |
| | • | | Despite the fall in revenues over the past five years, the Company’s gross margin has remained fairly stable between approximately 25% and 28%. However, the Company’s earning before interest, taxes, depreciation and amortization (“EBITDA”) for its core operating business has gradually fallen from a high of $12.9 million in FY2000 to $3.3 million for the LTM ended June 30, 2003, primarily due to the reasons outlined above. |
| |
| | • | | Over the past few years, the Company has also received approximately $15.2 million in cash distributions from its investment in Carbontronics. Based upon these recent events, the Company can not predict if, and when, it might expect any additional distributions from Carbontronics. The IRS is taking steps to attempt to revoke synthetic fuel tax credits and audit the chemical composition of those entities currently generating tax credits, including Carbontronics. |
| |
| | • | | Despite little growth in the Company’s core business, the Company’s capital position has improved significantly over the past two years since filing for Chapter 11 in FY2001. Prior to filing, the Company had approximately $105.9 million in interest bearing debt as of December 31, 2000. By the end of FY2001, after |
Page 17
| | | |
| Gencor Industries, Inc. | | CONFIDENTIAL |
|
COMPANY FINANCIAL PERFORMANCE
| | | | filing and through the sale of its food machinery business, total interest bearing debt fell to $35.8 million. As of June 30, 2003 interest-bearing debt was approximately $15.5 million. |
| |
| | • | | The Company’s stockholders equity has also improved significantly from $(7.4) million as of September 30, 2000 to $12.9 million as of June 30, 2003. The improvement in the Company’s debt position and stockholders equity is primarily a result of the steady performance of the Company’s core operations, and the cash generated from Carbontronics. |
| |
| | • | | Capitalink also reviewed the preliminary results for the month of July 2003 for the Company. For the LTM ended July 31, 2003, revenue was $58.9 million and EBITDA fell to $2.9 million. As of July 31, 2003, the Company also had approximately $9.9 million in interest bearing debt and $8.5 million in cash. |
| |
| | • | | In August 2003, Gencor refinanced their existing debt with PNC Bank, providing them with a $20.0 million debt facility with interest paid at prime (currently at 4.0%). |
Page 18
| | | |
| Gencor Industries, Inc. | | CONFIDENTIAL |
|
COMPANY FINANCIAL PERFORMANCE
Normalized Comparative Summary Income Statements - Core Business
($ in thousands except per share)
| | | | | | | | | | | | | | | | | | | | | | | | | | | | | | | |
| | | | | | | | | | | | | | | | | | | | | for the 9 months ended | | LTM |
| | | | | for years ended September 30 | | June 30, | | June 30, |
| | | | |
| |
| |
|
| | | | | 1999 | | 2000 | | 2001 | | 2002 | | 2002 | | 2003 | | 2003 |
| | | | |
| |
| |
| |
| |
| |
| |
|
| Revenue | | | | | | | | | | | | | | | | | | | | | | | | | | | | |
| | Domestic | | $ | 68,195 | | | $ | 70,391 | | | $ | 53,124 | | | $ | 41,207 | | | $ | 32,774 | | | $ | 38,664 | | | $ | 47,097 | |
| | International | | | 33,204 | | | | 26,417 | | | | 18,010 | | | | 26,278 | | | | 18,384 | | | | 9,660 | | | | 17,554 | |
| | | |
| | | |
| | | |
| | | |
| | | |
| | | |
| | | |
| |
| | | Total Revenue | | | 101,399 | | | | 96,808 | | | | 71,134 | | | | 67,485 | | | | 51,158 | | | | 48,324 | | | | 64,651 | |
| Cost of Goods Sold | | | | | | | | | | | | | | | | | | | | | | | | | | | | |
| | Domestic | | | 59,161 | | | | 47,297 | | | | 37,272 | | | | 29,394 | | | | 23,198 | | | | 27,137 | | | | 33,333 | |
| | International | | | 26,754 | | | | 22,212 | | | | 15,998 | | | | 21,538 | | | | 14,981 | | | | 8,454 | | | | 15,011 | |
| | | |
| | | |
| | | |
| | | |
| | | |
| | | |
| | | |
| |
| | Total Cost of Goods Sold | | | 85,915 | | | | 69,509 | | | | 53,270 | | | | 50,932 | | | | 38,179 | | | | 35,591 | | | | 48,344 | |
| | | |
| | | |
| | | |
| | | |
| | | |
| | | |
| | | |
| |
| | | Gross Profit | | | 15,484 | | | | 27,299 | | | | 17,864 | | | | 16,553 | | | | 12,979 | | | | 12,733 | | | | 16,307 | |
| | Selling, General & Admin | | | 26,193 | | | | 16,978 | | | | 14,311 | | | | 12,491 | | | | 9,553 | | | | 9,170 | | | | 12,108 | |
| | Product Engineering & Development | | | 4,404 | | | | 2,783 | | | | 2,351 | | | | 1,701 | | | | 1,300 | | | | 1,309 | | | | 1,710 | |
| | | |
| | | |
| | | |
| | | |
| | | |
| | | |
| | | |
| |
| | | Total Operating Expenses | | | 30,597 | | | | 19,761 | | | | 16,662 | | | | 14,192 | | | | 10,853 | | | | 10,479 | | | | 13,818 | |
| | | |
| | | |
| | | |
| | | |
| | | |
| | | |
| | | |
| |
| | | Operating Income (Loss) | | | (15,113 | ) | | | 7,538 | | | | 1,202 | | | | 2,361 | | | | 2,126 | | | | 2,254 | | | | 2,489 | |
| Interest Income (Expense) | | | (3,124 | ) | | | (2,839 | ) | | | (476 | ) | | | (2,131 | ) | | | (1,619 | ) | | | (1,143 | ) | | | (1,655 | ) |
| Other Income (Expense) | | | (883 | ) | | | 111 | | | | (117 | ) | | | (92 | ) | | | 28 | | | | 12 | | | | (108 | ) |
| | | |
| | | |
| | | |
| | | |
| | | |
| | | |
| | | |
| |
| | | Pre-tax Income (Loss) | | | (19,120 | ) | | | 4,810 | | | | 609 | | | | 138 | | | | 535 | | | | 1,123 | | | | 726 | |
| Income Tax (Benefit) | | | (6,576 | ) | | | (148 | ) | | | - | | | | (39 | ) | | | 256 | | | | 1,116 | | | | 821 | |
| | | |
| | | |
| | | |
| | | |
| | | |
| | | |
| | | |
| |
| | | Normalized Net Income | | $ | (12,544 | ) | | $ | 4,958 | | | $ | 609 | | | $ | 177 | | | $ | 279 | | | $ | 7 | | | $ | (95 | ) |
| | | |
| | | |
| | | |
| | | |
| | | |
| | | |
| | | |
| |
Normalized EBIT | | $ | (15,996 | ) | | $ | 7,649 | | | $ | 1,085 | | | $ | 2,269 | | | $ | 2,154 | | | $ | 2,266 | | | $ | 2,381 | |
| | Total Depreciation & Amortization | | $ | 4,731 | | | $ | 5,240 | | | $ | 4,021 | | | $ | 1,378 | | | $ | 1,170 | | | $ | 706 | | | $ | 914 | |
Normalized EBITDA | | $ | (11,265 | ) | | $ | 12,889 | | | $ | 5,106 | | | $ | 3,647 | | | $ | 3,324 | | | $ | 2,972 | | | $ | 3,295 | |
| | Capital Expenditures, net of Disposals (CAPEX, net) | | $ | 1,613 | | | $ | 1,624 | | | $ | 88 | | | $ | 304 | | | $ | 219 | | | $ | 84 | | | $ | 169 | |
Normalized EBITDA - CAPEX | | $ | (12,878 | ) | | $ | 11,265 | | | $ | 5,018 | | | $ | 3,343 | | | $ | 3,105 | | | $ | 2,888 | | | $ | 3,126 | |
Earnings per Share | | | | | | | | | | | | | | | | | | | | | | | | | | | | |
| | Basic Normalized EPS | | $ | (1.44 | ) | | $ | 0.57 | | | $ | 0.07 | | | $ | 0.02 | | | $ | 0.03 | | | $ | - | | | $ | (0.01 | ) |
| | Basic Reported EPS | | $ | (2.75 | ) | | $ | 0.09 | | | $ | 1.03 | | | $ | 0.24 | | | $ | 0.18 | | | $ | 0.87 | | | $ | 0.93 | |
| | Weighted Average Shares Outstanding (thousands) | | | 8,682 | | | | 8,682 | | | | 8,682 | | | | 8,682 | | | | 8,682 | | | | 8,682 | | | | 8,682 | |
| | Diluted Normalized EPS | | $ | (1.44 | ) | | $ | 0.57 | | | $ | 0.07 | | | $ | 0.02 | | | $ | 0.03 | | | $ | - | | | $ | (0.01 | ) |
| | Diluted Reported EPS | | $ | (2.75 | ) | | $ | 0.09 | | | $ | 1.03 | | | $ | 0.23 | | | $ | 0.17 | | | $ | 0.85 | | | $ | 0.92 | |
| | Weighted Average Shares Outstanding (thousands) | | | 8,682 | | | | 8,682 | | | | 8,682 | | | | 9,072 | | | | 9,186 | | | | 8,872 | | | | 8,758 | |
Normalizing Reconciliation | | | | | | | | | | | | | | | | | | | | | | | | | | | | |
| | Restructuring/Goodwill Impairment | | $ | - | | | $ | (3,690 | ) | | $ | (5,072 | ) | | $ | (302 | ) | | $ | (302 | ) | | $ | - | | | $ | - | |
| | Other Unusual (Expense) Gain Items | | | - | | | | - | | | | 215 | | | | 1,954 | | | | 1,954 | | | | 12,228 | | | | 12,228 | |
| | Income Tax Shelter (Charge) from Unusual Items | | | - | | | | - | | | | - | | | | - | | | | (578 | ) | | | (4,700 | ) | | | (4,122 | ) |
| | | |
| | | |
| | | |
| | | |
| | | |
| | | |
| | | |
| |
| | | Unusual (Expense) Gain Items, net of Taxes | | | - | | | | (3,690 | ) | | | (4,857 | ) | | | 1,652 | | | | 1,074 | | | | 7,528 | | | | 8,106 | |
| | Discontinued Operations, net of Taxes | | | (11,322 | ) | | | (476 | ) | | | 9,336 | | | | 241 | | | | 172 | | | | - | | | | 69 | |
| | Extraordinary Items, net of Taxes | | | - | | | | - | | | | 3,835 | | | | - | | | | - | | | | - | | | | - | |
| | | |
| | | |
| | | |
| | | |
| | | |
| | | |
| | | |
| |
| | | Total Reconciling Items, net of Taxes | | $ | (11,322 | ) | | $ | (4,166 | ) | | $ | 8,314 | | | $ | 1,893 | | | $ | 1,246 | | | $ | 7,528 | | | $ | 8,175 | |
| | | |
| | | |
| | | |
| | | |
| | | |
| | | |
| | | |
| |
| Reported Income Tax (Benefit) | | $ | (6,576 | ) | | $ | (148 | ) | | $ | - | | | $ | (39 | ) | | $ | 834 | | | $ | 5,816 | | | $ | 4,943 | |
| Reported Net Income (Loss) | | $ | (23,866 | ) | | $ | 792 | | | $ | 8,923 | | | $ | 2,070 | | | $ | 1,525 | | | $ | 7,535 | | | $ | 8,080 | |
| Comprehensive Gain/(Loss) | | $ | (2,449 | ) | | $ | (3,940 | ) | | $ | 774 | | | $ | 951 | | | $ | 743 | | | $ | (23 | ) | | $ | 185 | |
| Reported Comprehensive Net Income (Loss) | | $ | (26,315 | ) | | $ | (3,148 | ) | | $ | 9,697 | | | $ | 3,021 | | | $ | 2,268 | | | $ | 7,512 | | | $ | 8,265 | |
Sources of information: Company financial statements and management
Page 19
| | | |
| Gencor Industries, Inc. | | CONFIDENTIAL |
|
COMPANY FINANCIAL PERFORMANCE
Normalized Common Sized Summary Income Statements - Core Business
| | | | | | | | | | | | | | | | | | | | | | | | | | | | | | | |
| | | | | | | | | | | | | | | | | | | | | for the 9 months ended | | LTM |
| | | | | for years ended September 30 | | June 30, | | June 30, |
| | | | |
| |
| |
|
| | | | | 1999 | | 2000 | | 2001 | | 2002 | | 2002 | | 2003 | | 2003 |
| | | | |
| |
| |
| |
| |
| |
| |
|
| Revenue | | | | | | | | | | | | | | | | | | | | | | | | | | | | |
| | Domestic | | | 67.3 | % | | | 72.7 | % | | | 74.7 | % | | | 61.1 | % | | | 64.1 | % | | | 80.0 | % | | | 72.8 | % |
| | International | | | 32.7 | % | | | 27.3 | % | | | 25.3 | % | | | 38.9 | % | | | 35.9 | % | | | 20.0 | % | | | 27.2 | % |
| | | |
| | | |
| | | |
| | | |
| | | |
| | | |
| | | |
| |
| | | Total Revenue | | | 100.0 | % | | | 100.0 | % | | | 100.0 | % | | | 100.0 | % | | | 100.0 | % | | | 100.0 | % | | | 100.0 | % |
| Cost of Goods Sold | | | | | | | | | | | | | | | | | | | | | | | | | | | | |
| | Domestic | | | 58.3 | % | | | 48.9 | % | | | 52.4 | % | | | 43.6 | % | | | 45.3 | % | | | 56.2 | % | | | 51.6 | % |
| | International | | | 26.4 | % | | | 22.9 | % | | | 22.5 | % | | | 31.9 | % | | | 29.3 | % | | | 17.5 | % | | | 23.2 | % |
| | | |
| | | |
| | | |
| | | |
| | | |
| | | |
| | | |
| |
| | | Total Cost of Goods Sold | | | 84.7 | % | | | 71.8 | % | | | 74.9 | % | | | 75.5 | % | | | 74.6 | % | | | 73.7 | % | | | 74.8 | % |
| | | |
| | | |
| | | |
| | | |
| | | |
| | | |
| | | |
| |
| | | Gross Profit | | | 15.3 | % | | | 28.2 | % | | | 25.1 | % | | | 24.5 | % | | | 25.4 | % | | | 26.3 | % | | | 25.2 | % |
| | Selling, General & Admin | | | 25.8 | % | | | 17.5 | % | | | 20.1 | % | | | 18.5 | % | | | 18.7 | % | | | 19.0 | % | | | 18.7 | % |
| | Product Engineering & Development | | | 4.3 | % | | | 2.9 | % | | | 3.3 | % | | | 2.5 | % | | | 2.5 | % | | | 2.7 | % | | | 2.6 | % |
| | | |
| | | |
| | | |
| | | |
| | | |
| | | |
| | | |
| |
| | | Total Operating Expenses | | | 30.2 | % | | | 20.4 | % | | | 23.4 | % | | | 21.0 | % | | | 21.2 | % | | | 21.7 | % | | | 21.4 | % |
| | | |
| | | |
| | | |
| | | |
| | | |
| | | |
| | | |
| |
| | | Operating Income (Loss) | | | -14.9 | % | | | 7.8 | % | | | 1.7 | % | | | 3.5 | % | | | 4.2 | % | | | 4.7 | % | | | 3.8 | % |
| Interest Income (Expense) | | | -3.1 | % | | | -2.9 | % | | | -0.7 | % | | | -3.2 | % | | | -3.2 | % | | | -2.4 | % | | | -2.6 | % |
| Other Income (Expense) | | | -0.9 | % | | | 0.1 | % | | | -0.2 | % | | | -0.1 | % | | | 0.1 | % | | | 0.0 | % | | | -0.2 | % |
| | | |
| | | |
| | | |
| | | |
| | | |
| | | |
| | | |
| |
| | | Pre-tax Income (Loss) | | | -18.9 | % | | | 5.0 | % | | | 0.9 | % | | | 0.2 | % | | | 1.0 | % | | | 2.3 | % | | | 1.1 | % |
| Income Tax (Benefit) | | | -6.5 | % | | | -0.2 | % | | | 0.0 | % | | | -0.1 | % | | | 0.5 | % | | | 2.3 | % | | | 1.3 | % |
| | | |
| | | |
| | | |
| | | |
| | | |
| | | |
| | | |
| |
| | | Normalized Net Income | | | -12.4 | % | | | 5.1 | % | | | 0.9 | % | | | 0.3 | % | | | 0.5 | % | | | 0.0 | % | | | -0.1 | % |
| | | |
| | | |
| | | |
| | | |
| | | |
| | | |
| | | |
| |
Normalized EBIT | | | -15.8 | % | | | 7.9 | % | | | 1.5 | % | | | 3.4 | % | | | 4.2 | % | | | 4.7 | % | | | 3.7 | % |
| | Total Depreciation & Amortization | | | 4.7 | % | | | 5.4 | % | | | 5.7 | % | | | 2.0 | % | | | 2.3 | % | | | 1.5 | % | | | 1.4 | % |
Normalized EBITDA | | | -11.1 | % | | | 13.3 | % | | | 7.2 | % | | | 5.4 | % | | | 6.5 | % | | | 6.2 | % | | | 5.1 | % |
| | Capital Expenditures, net of Disposals (CAPEX, net) | | | 1.6 | % | | | 1.7 | % | | | 0.1 | % | | | 0.5 | % | | | 0.4 | % | | | 0.2 | % | | | 0.3 | % |
Normalized EBITDA - CAPEX | | | -12.7 | % | | | 11.6 | % | | | 7.1 | % | | | 5.0 | % | | | 6.1 | % | | | 6.0 | % | | | 4.8 | % |
Normalizing Reconciliation | | | | | | | | | | | | | | | | | | | | | | | | | | | | |
| | Restructuring/Goodwill Impairment | | | 0.0 | % | | | -3.8 | % | | | -7.1 | % | | | -0.4 | % | | | -0.6 | % | | | 0.0 | % | | | 0.0 | % |
| | Other Unusual (Expense) Gain Items | | | 0.0 | % | | | 0.0 | % | | | 0.3 | % | | | 2.9 | % | | | 3.8 | % | | | 25.3 | % | | | 18.9 | % |
| | Income Tax Shelter (Charge) from Unusual Items | | | 0.0 | % | | | 0.0 | % | | | 0.0 | % | | | 0.0 | % | | | -1.1 | % | | | -9.7 | % | | | -6.4 | % |
| | | |
| | | |
| | | |
| | | |
| | | |
| | | |
| | | |
| |
| | | Unusual (Expense) Gain Items, net of Taxes | | | 0.0 | % | | | -3.8 | % | | | -6.8 | % | | | 2.4 | % | | | 2.1 | % | | | 15.6 | % | | | 12.5 | % |
| Discontinued Operations, net of Taxes | | | -11.2 | % | | | -0.5 | % | | | 13.1 | % | | | 0.4 | % | | | 0.3 | % | | | 0.0 | % | | | 0.1 | % |
| Extraordinary Items, net of Taxes | | | 0.0 | % | | | 0.0 | % | | | 5.4 | % | | | 0.0 | % | | | 0.0 | % | | | 0.0 | % | | | 0.0 | % |
| | | |
| | | |
| | | |
| | | |
| | | |
| | | |
| | | |
| |
| | | Total Reconciling Items, net of Taxes | | | -11.2 | % | | | -4.3 | % | | | 11.7 | % | | | 2.8 | % | | | 2.4 | % | | | 15.6 | % | | | 12.6 | % |
| | | |
| | | |
| | | |
| | | |
| | | |
| | | |
| | | |
| |
| Reported Income Tax (Benefit) | | | -6.5 | % | | | -0.2 | % | | | 0.0 | % | | | -0.1 | % | | | 1.6 | % | | | 12.0 | % | | | 7.6 | % |
| Reported Net Income (Loss) | | | -23.5 | % | | | 0.8 | % | | | 12.5 | % | | | 3.1 | % | | | 3.0 | % | | | 15.6 | % | | | 12.5 | % |
| Comprehensive Gain/(Loss) | | | -2.4 | % | | | -4.1 | % | | | 1.1 | % | | | 1.4 | % | | | 1.5 | % | | | 0.0 | % | | | 0.3 | % |
| Reported Comprehensive Net Income (Loss) | | | -23.5 | % | | | 0.8 | % | | | 12.5 | % | | | 3.1 | % | | | 3.0 | % | | | 15.6 | % | | | 12.8 | % |
Sources of information: Company financial statements and management
Page 20
| | | |
| Gencor Industries, Inc. | | CONFIDENTIAL |
|
COMPANY FINANCIAL PERFORMANCE
Comparative Summary Balance Sheets - Core Business
($ in thousands, except per share)
| | | | | | | | | | | | | | | | | | | | | | | | | | | |
| | | | | as of September 30, | | as of June 30, |
| | | | |
| |
|
| | | 1999 | | 2000 | | 2001 | | 2002 | | 2002 | | 2003 |
| Assets | |
| |
| |
| |
| |
| |
|
| Current Assets | | | | | | | | | | | | | | | | | | | | | | | | |
| | Cash & Equivalents | | $ | 9,581 | | | $ | 17,971 | | | $ | 14,158 | | | $ | 12,305 | | | $ | 12,574 | | | $ | 16,113 | |
| | Accounts Receivable | | | 29,665 | | | | 22,469 | | | | 8,672 | | | | 8,512 | | | | 12,157 | | | | 4,390 | |
| | Inventory | | | 2,813 | | | | 1,661 | | | | 23,105 | | | | 19,012 | | | | 18,014 | | | | 14,156 | |
| | Deferred Income Taxes | | | 39,780 | | | | 41,394 | | | | - | | | | - | | | | - | | | | - | |
| | Prepaid & Other | | | 11,585 | | | | 2,374 | | | | 2,021 | | | | 1,938 | | | | 1,367 | | | | 1,115 | |
| | | |
| | | |
| | | |
| | | |
| | | |
| | | |
| |
| | | Total Current Assets | | | 93,424 | | | | 85,869 | | | | 47,956 | | | | 41,767 | | | | 44,112 | | | | 35,774 | |
| Property & Equipment | | | 65,078 | | | | 63,935 | | | | 33,930 | | | | 33,673 | | | | 33,601 | | | | 33,760 | |
| Less Accumulated Depreciation | | | (29,301 | ) | | | (30,368 | ) | | | (17,156 | ) | | | (17,980 | ) | | | (17,861 | ) | | | (18,629 | ) |
| | | |
| | | |
| | | |
| | | |
| | | |
| | | |
| |
| | | Property & Equipment, net | | | 35,777 | | | | 33,567 | | | | 16,774 | | | | 15,693 | | | | 15,740 | | | | 15,131 | |
| Goodwill, net | | | 13,107 | | | | 12,018 | | | | 379 | | | | 364 | | | | 375 | | | | 364 | |
| Other Assets | | | 9,639 | | | | 8,492 | | | | 4,478 | | | | 4,360 | | | | 4,374 | | | | 4,292 | |
| | | |
| | | |
| | | |
| | | |
| | | |
| | | |
| |
| | | $ | 151,947 | | | $ | 139,946 | | | $ | 69,587 | | | $ | 62,184 | | | $ | 64,601 | | | $ | 55,561 | |
| | | |
| | | |
| | | |
| | | |
| | | |
| | | |
| |
Liabilities & Stockholders’ Equity | | | | | | | | | | | | | | | | | | | | | | | | |
| Current Liabilities | | | | | | | | | | | | | | | | | | | | | | | | |
| | Accounts Payable | | $ | 21,457 | | | $ | 17,079 | | | $ | 8,788 | | | $ | 9,000 | | | $ | 7,664 | | | $ | 6,289 | |
| | Accrued Expenses | | | 18,362 | | | | 14,629 | | | | 15,513 | | | | 9,947 | | | | 11,724 | | | | 8,440 | |
| | Income Taxes Payable | | | 2,358 | | | | 1,362 | | | | 3,470 | | | | 3,534 | | | | 4,533 | | | | 8,318 | |
| | Interest Bearing Debt | | | 102,115 | | | | 105,867 | | | | 1,495 | | | | 6,264 | | | | 3,270 | | | | 5,439 | |
| | Customer Deposits | | | 5,445 | | | | 1,735 | | | | 405 | | | | 498 | | | | 618 | | | | 893 | |
| | | |
| | | |
| | | |
| | | |
| | | |
| | | |
| |
| | | Total Current Liabilities | | | 149,737 | | | | 140,672 | | | | 29,671 | | | | 29,243 | | | | 27,809 | | | | 29,379 | |
| Long Term Interest Bearing Debt | | | - | | | | - | | | | 34,333 | | | | 24,337 | | | | 28,941 | | | | 10,020 | |
| Post-retirement benefits | | | 2,630 | | | | 2,950 | | | | - | | | | - | | | | - | | | | - | |
| Other Long Term | | | 3,855 | | | | 3,747 | | | | 3,309 | | | | 3,309 | | | | 3,309 | | | | 3,309 | |
| | | |
| | | |
| | | |
| | | |
| | | |
| | | |
| |
| | | Total Liabilities | | | 156,222 | | | | 147,369 | | | | 67,313 | | | | 56,889 | | | | 60,059 | | | | 42,708 | |
| Stockholders’ Equity | | | | | | | | | | | | | | | | | | | | | | | | |
| | Common stock | | | 697 | | | | 697 | | | | 697 | | | | 697 | | | | 697 | | | | 697 | |
| | Class B Stock | | | 189 | | | | 189 | | | | 189 | | | | 189 | | | | 189 | | | | 189 | |
| | Paid in Capital | | | 11,343 | | | | 11,343 | | | | 11,343 | | | | 11,343 | | | | 11,343 | | | | 11,343 | |
| | Accumulated Earnings (Deficit) | | | (10,902 | ) | | | (10,110 | ) | | | (1,187 | ) | | | 883 | | | | 338 | | | | 8,418 | |
| | Accumulated Other Comprehensive Loss | | | (3,803 | ) | | | (7,743 | ) | | | (6,969 | ) | | | (6,018 | ) | | | (6,226 | ) | | | (5,995 | ) |
| | Treasury Stock & Stock Receivable | | | (1,799 | ) | | | (1,799 | ) | | | (1,799 | ) | | | (1,799 | ) | | | (1,799 | ) | | | (1,799 | ) |
| | | |
| | | |
| | | |
| | | |
| | | |
| | | |
| |
| | | Total Stockholders’ Equity | | | (4,275 | ) | | | (7,423 | ) | | | 2,274 | | | | 5,295 | | | | 4,542 | | | | 12,853 | |
| | | |
| | | |
| | | |
| | | |
| | | |
| | | |
| |
| | | $ | 151,947 | | | $ | 139,946 | | | $ | 69,587 | | | $ | 62,184 | | | $ | 64,601 | | | $ | 55,561 | |
| | | |
| | | |
| | | |
| | | |
| | | |
| | | |
| |
| Net Working Capital | | $ | (56,313 | ) | | $ | (54,803 | ) | | $ | 18,285 | | | $ | 12,524 | | | $ | 16,303 | | | $ | 6,395 | |
| Common Shares Outstanding (thousands) | | | 8,682 | | | | 8,682 | | | | 8,682 | | | | 8,682 | | | | 8,682 | | | | 8,682 | |
| Book Value per Share | | $ | (0.49 | ) | | $ | (0.85 | ) | | $ | 0.26 | | | $ | 0.61 | | | $ | 0.52 | | | $ | 1.48 | |
| Tangible Book Value Per Share | | $ | (2.00 | ) | | $ | (2.24 | ) | | $ | 0.22 | | | $ | 0.57 | | | $ | 0.48 | | | $ | 1.44 | |
Sources of information: Company financial statements and management
Page 21
| | | |
| Gencor Industries, Inc. | | CONFIDENTIAL |
|
COMPANY FINANCIAL PERFORMANCE
Common Sized Summary Balance Sheets - Core Business
| | | | | | | | | | | | | | | | | | | | | | | | | | | |
| | | | | as of September 30, | | as of June 30, |
| | | | |
| |
|
| | | 1999 | | 2000 | | 2001 | | 2002 | | 2002 | | 2003 |
| Assets | |
| |
| |
| |
| |
| |
|
| Current Assets | | | | | | | | | | | | | | | | | | | | | | | | |
| | Cash & Equivalents | | | 6.3 | % | | | 12.8 | % | | | 20.3 | % | | | 19.8 | % | | | 19.5 | % | | | 29.0 | % |
| | Accounts Receivable | | | 19.5 | % | | | 16.1 | % | | | 12.5 | % | | | 13.7 | % | | | 18.8 | % | | | 7.9 | % |
| | Inventory | | | 1.9 | % | | | 1.2 | % | | | 33.2 | % | | | 30.6 | % | | | 27.9 | % | | | 25.5 | % |
| | Deferred Income Taxes | | | 26.2 | % | | | 29.6 | % | | | 0.0 | % | | | 0.0 | % | | | 0.0 | % | | | 0.0 | % |
| | Prepaid & Other | | | 7.6 | % | | | 1.7 | % | | | 2.9 | % | | | 3.1 | % | | | 2.1 | % | | | 2.0 | % |
| | | |
| | | |
| | | |
| | | |
| | | |
| | | |
| |
| | | Total Current Assets | | | 61.5 | % | | | 61.4 | % | | | 68.9 | % | | | 67.2 | % | | | 68.3 | % | | | 64.4 | % |
| Property & Equipment | | | 42.8 | % | | | 45.7 | % | | | 48.8 | % | | | 54.2 | % | | | 52.0 | % | | | 60.8 | % |
| Less Accumulated Depreciation | | | -19.3 | % | | | -21.7 | % | | | -24.7 | % | | | -28.9 | % | | | -27.6 | % | | | -33.5 | % |
| | | |
| | | |
| | | |
| | | |
| | | |
| | | |
| |
| | | Property & Equipment, net | | | 23.5 | % | | | 24.0 | % | | | 24.1 | % | | | 25.2 | % | | | 24.4 | % | | | 27.2 | % |
| Goodwill, net | | | 8.6 | % | | | 8.6 | % | | | 0.5 | % | | | 0.6 | % | | | 0.6 | % | | | 0.7 | % |
| Other Assets | | | 6.3 | % | | | 6.1 | % | | | 6.4 | % | | | 7.0 | % | | | 6.8 | % | | | 7.7 | % |
| | | |
| | | |
| | | |
| | | |
| | | |
| | | |
| |
| | | | 100.0 | % | | | 100.0 | % | | | 100.0 | % | | | 100.0 | % | | | 100.0 | % | | | 100.0 | % |
| | | |
| | | |
| | | |
| | | |
| | | |
| | | |
| |
Liabilities & Stockholders’ Equity | | | | | | | | | | | | | | | | | | | | | | | | |
| Current Liabilities | | | | | | | | | | | | | | | | | | | | | | | | |
| | Accounts Payable | | | 14.1 | % | | | 12.2 | % | | | 12.6 | % | | | 14.5 | % | | | 11.9 | % | | | 11.3 | % |
| | Accrued Expenses | | | 12.1 | % | | | 10.5 | % | | | 22.3 | % | | | 16.0 | % | | | 18.1 | % | | | 15.2 | % |
| | Income Taxes Payable | | | 1.6 | % | | | 1.0 | % | | | 5.0 | % | | | 5.7 | % | | | 7.0 | % | | | 15.0 | % |
| | Interest Bearing Debt | | | 67.2 | % | | | 75.6 | % | | | 2.1 | % | | | 10.1 | % | | | 5.1 | % | | | 9.8 | % |
| | Customer Deposits | | | 3.6 | % | | | 1.2 | % | | | 0.6 | % | | | 0.8 | % | | | 1.0 | % | | | 1.6 | % |
| | | |
| | | |
| | | |
| | | |
| | | |
| | | |
| |
| | | Total Current Liabilities | | | 98.5 | % | | | 100.5 | % | | | 42.6 | % | | | 47.0 | % | | | 43.0 | % | | | 52.9 | % |
| Long Term Interest Bearing Debt | | | 0.0 | % | | | 0.0 | % | | | 49.3 | % | | | 39.1 | % | | | 44.8 | % | | | 18.0 | % |
| Post-retirement benefits | | | 1.7 | % | | | 2.1 | % | | | 0.0 | % | | | 0.0 | % | | | 0.0 | % | | | 0.0 | % |
| Other Long Term | | | 2.5 | % | | | 2.7 | % | | | 4.8 | % | | | 5.3 | % | | | 5.1 | % | | | 6.0 | % |
| | | |
| | | |
| | | |
| | | |
| | | |
| | | |
| |
| | | Total Liabilities | | | 102.8 | % | | | 105.3 | % | | | 96.7 | % | | | 91.5 | % | | | 93.0 | % | | | 76.9 | % |
| Stockholders’ Equity | | | | | | | | | | | | | | | | | | | | | | | | |
| | Common stock | | | 0.5 | % | | | 0.5 | % | | | 1.0 | % | | | 1.1 | % | | | 1.1 | % | | | 1.3 | % |
| | Class B Stock | | | 0.1 | % | | | 0.1 | % | | | 0.3 | % | | | 0.3 | % | | | 0.3 | % | | | 0.3 | % |
| | Paid in Capital | | | 7.5 | % | | | 8.1 | % | | | 16.3 | % | | | 18.2 | % | | | 17.6 | % | | | 20.4 | % |
| | Accumulated Earnings (Deficit) | | | -7.2 | % | | | -7.2 | % | | | -1.7 | % | | | 1.4 | % | | | 0.5 | % | | | 15.2 | % |
| | Treasury Stock & Stock Receivable | | | -1.2 | % | | | -1.3 | % | | | -2.6 | % | | | -2.9 | % | | | -2.8 | % | | | -3.2 | % |
| | | |
| | | |
| | | |
| | | |
| | | |
| | | |
| |
| | | Total Stockholders’ Equity | | | -2.8 | % | | | -5.3 | % | | | 3.3 | % | | | 8.5 | % | | | 7.0 | % | | | 23.1 | % |
| | | |
| | | |
| | | |
| | | |
| | | |
| | | |
| |
| | | | 100.0 | % | | | 100.0 | % | | | 100.0 | % | | | 100.0 | % | | | 100.0 | % | | | 100.0 | % |
| | | |
| | | |
| | | |
| | | |
| | | |
| | | |
| |
| Net Working Capital | | | -37.1 | % | | | -39.2 | % | | | 26.3 | % | | | 20.1 | % | | | 25.2 | % | | | 11.5 | % |
Sources of information: Company financial statements and management
Page 22
| | | |
| Gencor Industries, Inc. | | CONFIDENTIAL |
|
COMPANY FINANCIAL PERFORMANCE
Comparative Financial Analysis - Core Business
($ in thousands, except per share)
| | | | | | | | | | | | | | | | | | | | | | | | | | | | | | |
| | | | | | | | | | | | | | | | | | | | as of & for the 9 months ended | | as of & for LTM |
| | | | as of & for years ended September 30 | | June 30, | | June 30, |
| | | |
| |
| |
|
| | | | 1999 | | 2000 | | 2001 | | 2002 | | 2002 | | 2003 | | 2003 |
| | | |
| |
| |
| |
| |
| |
| |
|
Financial Review | | | | | | | | | | | | | | | | | | | | | | | | | | | | |
| | Revenue | | $ | 101,399 | | | $ | 96,808 | | | $ | 71,134 | | | $ | 67,485 | | | $ | 51,158 | | | $ | 48,324 | | | $ | 64,651 | |
| | Gross Profit | | $ | 15,484 | | | $ | 27,299 | | | $ | 17,864 | | | $ | 16,553 | | | $ | 12,979 | | | $ | 12,733 | | | $ | 16,307 | |
| | Total Operating Expenses | | $ | 30,597 | | | $ | 19,761 | | | $ | 16,662 | | | $ | 14,192 | | | $ | 10,853 | | | $ | 10,479 | | | $ | 13,818 | |
| | Operating Income | | $ | (15,113 | ) | | $ | 7,538 | | | $ | 1,202 | | | $ | 2,361 | | | $ | 2,126 | | | $ | 2,254 | | | $ | 2,489 | |
| | Pre-tax Income (Loss) | | $ | (19,120 | ) | | $ | 4,810 | | | $ | 609 | | | $ | 138 | | | $ | 535 | | | $ | 1,123 | | | $ | 726 | |
| | Normalized Net Income (Loss) | | $ | (12,544 | ) | | $ | 4,958 | | | $ | 609 | | | $ | 177 | | | $ | 279 | | | $ | 7 | | | $ | (95 | ) |
| | Normalized EBIT | | $ | (15,996 | ) | | $ | 7,649 | | | $ | 1,085 | | | $ | 2,269 | | | $ | 2,154 | | | $ | 2,266 | | | $ | 2,381 | |
| | Normalized EBITDA | | $ | (11,265 | ) | | $ | 12,889 | | | $ | 5,106 | | | $ | 3,647 | | | $ | 3,324 | | | $ | 2,972 | | | $ | 3,295 | |
| | Normalized Basic EPS | | $ | (2.75 | ) | | $ | 0.09 | | | $ | 1.03 | | | $ | 0.24 | | | $ | 0.18 | | | $ | 0.87 | | | $ | 0.93 | |
| | Normalized Diluted EPS | | $ | (2.75 | ) | | $ | 0.09 | | | $ | 1.03 | | | $ | 0.23 | | | $ | 0.17 | | | $ | 0.85 | | | $ | 0.92 | |
| | Total Assets | | $ | 151,947 | | | $ | 139,946 | | | $ | 69,587 | | | $ | 62,184 | | | $ | 64,601 | | | $ | 55,561 | | | $ | 55,561 | |
| | Net Worth | | $ | (4,275 | ) | | $ | (7,423 | ) | | $ | 2,274 | | | $ | 5,295 | | | $ | 4,542 | | | $ | 12,853 | | | $ | 12,853 | |
| | Tangible Net Worth | | $ | (17,382 | ) | | $ | (19,441 | ) | | $ | 1,895 | | | $ | 4,931 | | | $ | 4,167 | | | $ | 12,489 | | | $ | 12,489 | |
| | Total Interest Bearing Debt | | $ | 102,115 | | | $ | 105,867 | | | $ | 35,828 | | | $ | 30,601 | | | $ | 32,211 | | | $ | 15,459 | | | $ | 15,459 | |
| | Net Interest Bearing Debt | | $ | 92,534 | | | $ | 87,896 | | | $ | 21,670 | | | $ | 18,296 | | | $ | 19,637 | | | $ | (654 | ) | | $ | (654 | ) |
| | Total Capitalization | | $ | 97,840 | | | $ | 98,444 | | | $ | 38,102 | | | $ | 35,896 | | | $ | 36,753 | | | $ | 28,312 | | | $ | 28,312 | |
Financial Strength | | | | | | | | | | | | | | | | | | | | | | | | | | | | |
| | Quick Ratio | | | 0.6 | | | | 0.6 | | | | 0.8 | | | | 0.8 | | | | 0.9 | | | | 0.7 | | | | 0.7 | |
| | Current Ratio | | | 0.6 | | | | 0.6 | | | | 1.6 | | | | 1.4 | | | | 1.6 | | | | 1.2 | | | na | |
| | Total Liabilities to Net Worth | | | -3654.3 | % | | | -1985.3 | % | | | 2960.1 | % | | | 1074.4 | % | | | 1322.3 | % | | | 332.3 | % | | | 332.3 | % |
| | Total Interest Bearing Debt to Net Worth | | | -2388.7 | % | | | -1426.2 | % | | | 1575.5 | % | | | 577.9 | % | | | 709.2 | % | | | 120.3 | % | | | 120.3 | % |
| | Total Interest Bearing Debt to Total Capitalization | | | 104.4 | % | | | 107.5 | % | | | 94.0 | % | | | 85.2 | % | | | 87.6 | % | | | 54.6 | % | | | 54.6 | % |
| | Net Interest Bearing Debt to Total Capitalization | | | 94.6 | % | | | 89.3 | % | | | 56.9 | % | | | 51.0 | % | | | 53.4 | % | | | -2.3 | % | | | -2.3 | % |
| | Interest Expense to Interest Bearing Debt | | | 3.1 | % | | | 2.7 | % | | | 1.3 | % | | | 7.0 | % | | | 5.0 | % | | | 7.4 | % | | | 10.7 | % |
| | Total Interest Bearing Debt to Normalized EBITDA | | na | | | | 8.2 | | | | 7.0 | | | | 8.4 | | | | 9.7 | | | | 5.2 | | | | 4.7 | |
| | Normalized EBITDA to Interest Expense | | na | | | | 4.5 | | | | 10.7 | | | | 1.7 | | | | 2.1 | | | | 2.6 | | | | 2.0 | |
| | Normalized EBITDA-CAPEX, net to Interest Exp. | | na | | | | 4.0 | | | | 10.5 | | | | 1.6 | | | | 1.9 | | | | 2.5 | | | | 1.9 | |
Effectiveness and Efficiency | | | | | | | | | | | | | | | | | | | | | | | | | | | | |
| | Accounts Receivable Turnover | | na | | | | 3.7 | | | | 4.6 | | | | 7.9 | | | | 3.7 | | | | 2.1 | | | | 7.8 | |
| | Inventory Turnover | | na | | | | 31.1 | | | | 4.3 | | | | 2.4 | | | | 1.9 | | | | 2.1 | | | | 3.0 | |
| | Asset Turnover | | na | | | | 0.7 | | | | 0.7 | | | | 1.0 | | | | 0.8 | | | | 0.8 | | | | 1.1 | |
| | Days Sales Outstanding | | na | | | | 98.3 | | | | 79.9 | | | | 46.5 | | | | 74.5 | | | | 127.2 | | | | 46.7 | |
| | Days Inventory Outstanding | | na | | | | 11.7 | | | | 84.8 | | | | 150.9 | | | | 147.0 | | | | 127.2 | | | | 121.4 | |
| | Days Payable Outstanding | | na | | | | 78.8 | | | | 67.5 | | | | 49.8 | | | | 45.8 | | | | 45.3 | | | | 41.0 | |
| | Normalized EBIT to Average Assets | | na | | | | 5.2 | % | | | 1.0 | % | | | 3.4 | % | | na | | | na | | | | 4.0 | % |
| | Normalized EBIT to Net Worth | | na | | | | -130.8 | % | | | -42.1 | % | | | 60.0 | % | | na | | | na | | | | 27.4 | % |
| | Normalized EBITDA to Average Assets | | na | | | | 8.8 | % | | | 4.9 | % | | | 5.5 | % | | na | | | na | | | | 5.5 | % |
| | Normalized EBITDA to Net Worth | | na | | | | -220.4 | % | | | -198.3 | % | | | 96.4 | % | | na | | | na | | | | 37.9 | % |
| | Normalized Net Income to Average Assets | | na | | | | 3.4 | % | | | 0.6 | % | | | 0.3 | % | | na | | | na | | | | -0.2 | % |
| | Normalized Net Income to Net Worth | | na | | | | -84.8 | % | | | -23.7 | % | | | 4.7 | % | | na | | | na | | | | -1.1 | % |
Sources of information: Company financial statements and management
Page 23
| | | |
| Gencor Industries, Inc. | | CONFIDENTIAL |
|
COMPANY FINANCIAL PERFORMANCE
Comparative Financial Analysis Continued - Core Business
($ in thousands, except per share)
| | | | | | | | | | | | | | | | | | | | | | | | | | | | | | |
| | | | | | | | | | | | | | | | | | | | as of & for the 9 months ended | | as of & for LTM |
| | | | as of & for years ended September 30 | | June 30, | | June 30, |
| | | |
| |
| |
|
| | | | 1999 | | 2000 | | 2001 | | 2002 | | 2002 | | 2003 | | 2003 |
| | | |
| |
| |
| |
| |
| |
| |
|
Profitability Ratios (as % of Revenue) | | | | | | | | | | | | | | | | | | | | | | | | | | | | |
| | Gross Profit Margin | | | 15.3 | % | | | 28.2 | % | | | 25.1 | % | | | 24.5 | % | | | 25.4 | % | | | 26.3 | % | | | 25.2 | % |
| | SG&A | | | 25.8 | % | | | 17.5 | % | | | 20.1 | % | | | 18.5 | % | | | 18.7 | % | | | 19.0 | % | | | 18.7 | % |
| | Total Operating Expenses | | | 30.2 | % | | | 20.4 | % | | | 23.4 | % | | | 21.0 | % | | | 21.2 | % | | | 21.7 | % | | | 21.4 | % |
| | Operating Income | | | -14.9 | % | | | 7.8 | % | | | 1.7 | % | | | 3.5 | % | | | 4.2 | % | | | 4.7 | % | | | 3.8 | % |
| | Pre-tax Income (Loss) | | | -18.9 | % | | | 5.0 | % | | | 0.9 | % | | | 0.2 | % | | | 1.0 | % | | | 2.3 | % | | | 1.1 | % |
| | Normalized Net Income (Loss) | | | -12.4 | % | | | 5.1 | % | | | 0.9 | % | | | 0.3 | % | | | 0.5 | % | | | 0.0 | % | | | -0.1 | % |
| | Normalized EBIT | | | -15.8 | % | | | 7.9 | % | | | 1.5 | % | | | 3.4 | % | | | 4.2 | % | | | 4.7 | % | | | 3.7 | % |
| | Normalized EBITDA | | | -11.1 | % | | | 13.3 | % | | | 7.2 | % | | | 5.4 | % | | | 6.5 | % | | | 6.2 | % | | | 5.1 | % |
Growth Rates | | | | | | | | | | | | | | | | | | | | | | | | | | | | |
| | Revenue | | na | | | | -4.5 | % | | | -26.5 | % | | | -5.1 | % | | na | | | | -5.5 | % | | | -4.2 | % |
| | Gross Profit | | na | | | | 76.3 | % | | | -34.6 | % | | | -7.3 | % | | na | | | | -1.9 | % | | | -1.5 | % |
| | Operating Income | | na | | | na | | | | -84.1 | % | | | 96.4 | % | | na | | | | 6.0 | % | | | 5.4 | % |
| | Pre-tax Income (Loss) | | na | | | na | | | | -87.3 | % | | | -77.3 | % | | na | | | | 109.9 | % | | | 426.1 | % |
| | Normalized Net Income (Loss) | | na | | | na | | | | -87.7 | % | | | -70.9 | % | | na | | | | -97.6 | % | | | -153.9 | % |
| | Normalized EBIT | | na | | | na | | | | -85.8 | % | | | 109.1 | % | | na | | | | 5.2 | % | | | 4.9 | % |
| | Normalized EBITDA | | na | | | na | | | | -60.4 | % | | | -28.6 | % | | na | | | | -10.6 | % | | | -9.7 | % |
| | Normalized Basic EPS | | na | | | na | | | | 1044.4 | % | | | -76.7 | % | | na | | | | 383.3 | % | | | 287.5 | % |
| | Normalized Diluted EPS | | na | | | na | | | | 1044.4 | % | | | -77.7 | % | | na | | | | 400.0 | % | | | 300.0 | % |
| | Total Assets | | na | | | | -7.9 | % | | | -50.3 | % | | | -10.6 | % | | na | | | | -14.0 | % | | | -10.7 | % |
| | Net Worth | | na | | | na | | | na | | | | 132.8 | % | | na | | | | 183.0 | % | | | 142.7 | % |
| | Tangible Net Worth | | na | | | na | | | na | | | | 160.2 | % | | na | | | | 199.7 | % | | | 153.3 | % |
| | CAPEX, net | | na | | | | 0.7 | % | | | -94.6 | % | | | 245.5 | % | | na | | | | -61.6 | % | | | -44.4 | % |
Cumulative Average Growth Rate (CAGR) Statistics | | | | | | | | | | | | | | | | | | | | | | | | | | | | |
| | Revenue | | na | | | | -4.5 | % | | | -16.2 | % | | | -12.7 | % | | na | | | na | | | na | |
| | Gross Profit | | na | | | | 76.3 | % | | | 7.4 | % | | | 2.3 | % | | na | | | na | | | na | |
| | Operating Income | | na | | | na | | | na | | | na | | | na | | | na | | | na | |
| | Pre-tax Income (Loss) | | na | | | na | | | na | | | na | | | na | | | na | | | na | |
| | Normalized Net Income (Loss) | | na | | | na | | | na | | | na | | | na | | | na | | | na | |
| | Normalized EBIT | | na | | | na | | | na | | | na | | | na | | | na | | | na | |
| | Normalized EBITDA | | na | | | na | | | na | | | na | | | na | | | na | | | na | |
| | Normalized Basic EPS | | na | | | na | | | na | | | na | | | na | | | na | | | na | |
| | Normalized Diluted EPS | | na | | | na | | | na | | | na | | | na | | | na | | | na | |
| | Total Assets | | na | | | | -7.9 | % | | | -32.3 | % | | | -25.8 | % | | na | | | na | | | na | |
| | Net Worth | | na | | | na | | | na | | | na | | | na | | | na | | | na | |
| | Tangible Net Worth | | na | | | na | | | na | | | na | | | na | | | na | | | na | |
| | CAPEX, net | | na | | | | 0.7 | % | | | -76.6 | % | | | -42.7 | % | | na | | | na | | | na | |
Depreciation & Capital Spending | | | | | | | | | | | | | | | | | | | | | | | | | | | | |
| | Depreciation to CAPEX, net | | | 293.3 | % | | | 322.7 | % | | | 4569.3 | % | | | 453.3 | % | | | 534.2 | % | | | 840.5 | % | | | 540.8 | % |
| | CAPEX, net to Revenue | | | 1.6 | % | | | 1.7 | % | | | 0.1 | % | | | 0.5 | % | | | 0.4 | % | | | 0.2 | % | | | 0.3 | % |
Sources of information: Company financial statements and management
Page 24
| | | |
| Gencor Industries, Inc. | | CONFIDENTIAL |
|
COMPANY FINANCIAL PERFORMANCE
Selected Normalized Income Statement Graphs - Core Business
($ in thousands, except per share)
Sources of information: Company financial statements and management
Page 25
| | |
| Gencor Industries, Inc. | CONFIDENTIAL |
|
COMPANY FINANCIAL PERFORMANCE
Selected Normalized Profitability and Cost (as % of Revenue) Graphs - Core Business
Sources of information: Company financial statements and management
Page 26
| | |
| Gencor Industries, Inc. | CONFIDENTIAL |
|
COMPANY FINANCIAL PERFORMANCE
Selected Normalized Financial Strength Graphs - Core Business
($ in thousands)
Sources of information: Company financial statements and management
Page 27
| | |
| Gencor Industries, Inc. | CONFIDENTIAL |
|
COMPANY FINANCIAL PERFORMANCE
Selected Normalized Efficiency Graphs - Core Business
Sources of information: Company financial statements and management
Page 28
| | |
| Gencor Industries, Inc. | CONFIDENTIAL |
|
COMPANY MARKET PERFORMANCE
Page 29
| | |
| Gencor Industries, Inc. | CONFIDENTIAL |
|
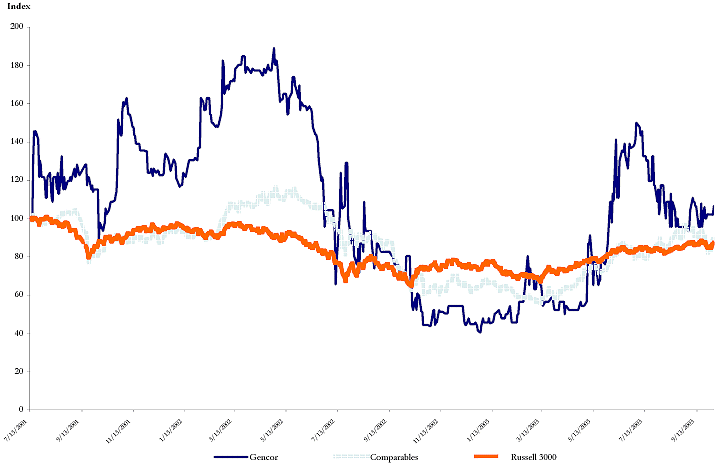
COMPANY MARKET PERFORMANCE
| | • | | Capitalink reviewed the daily closing market price and trading volume of the Company’s common stock over two time periods: |
| | • | | One year look back period (October 3, 2002 through October 3, 2003). |
| | • | | Period since Amended Plan of Reorganization was approved (the period since July 12, 2001). |
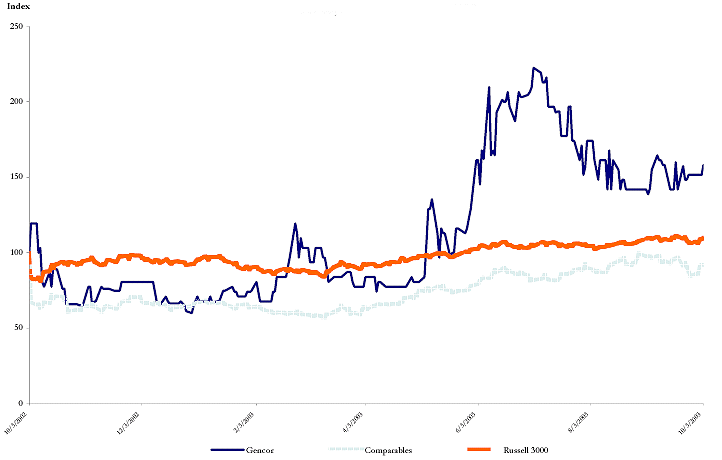
| | • | | Capitalink compared the daily closing market price performance of the Company’s common stock for both periods to both the Comparable Companies (as defined below) and the Russell 3000 Index. |
| | • | | Capitalink calculated total trading volumes at various closing price ranges of the Company’s common stock. In addition, the number of trading days, and the respective percentages, at certain trading volumes, was set forth. |
| | • | | Capitalink noted the following characteristics of the Company’s common stock: |
| | • | | For the one year look back period: |
| | • | | The Company’s stock has experienced limited liquidity with the average and median daily number of shares traded was 3,652 and 1,400 respectively. It was further noted that there was no volume on 52 trading days or approximately 20.6% of the available trading days. |
| | • | | During this period, the Company’s share price ranged from a high of $3.45 to a low of $0.93. The Company’s common stock closed at $2.45 on October 3, 2003. |
| | • | | During this period, the Company’s common stock increased 58.1%, while the Comparable Companies index fell 8.2% and the Russell 3000 Index rose 10.1%. |
| | • | | For the period since July 12, 2001: |
| | • | | The Company’s average and median daily number of shares traded was 5,608 and 2,100 respectively. It was further noted that there was no volume on 16.5% of the available trading days. |
| | • | | During this period, the Company’s share price ranged from a high of $4.35 to a low of $0.93. |
| | • | | During this period, the Company’s common stock increased 6.5%, while the Comparable Companies index fell 10.8% and the Russell 3000 Index fell 12.3%. |
Page 30
| | |
| Gencor Industries, Inc. | CONFIDENTIAL |
|
COMPANY MARKET PERFORMANCE
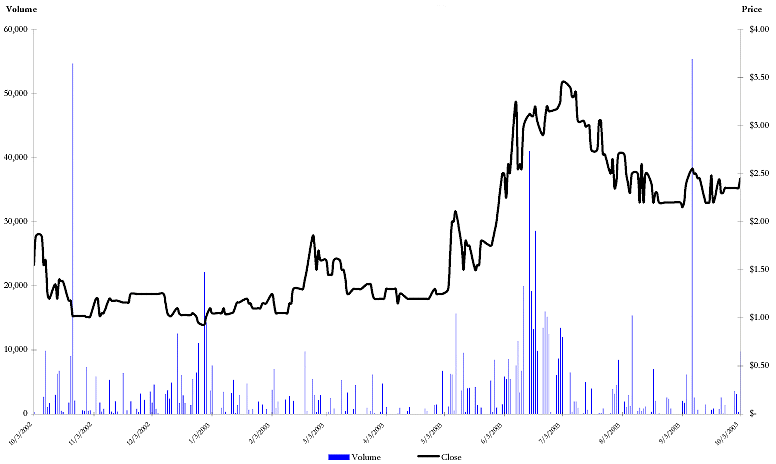
Gencor Closing Price & Trading Volume History
October 03, 2002 - October 03, 2003
| | | | | | | | | | | | | | | | | | | | | | | |
| Start | | End | | High | | Average | | Median | | Low | | Avg. Volume | | Median Volume |
| |
| |
| |
| |
| |
| |
| |
|
| 3-Oct-02 $1.5500 | | 3-Oct-03 $2.4500 | | 3-Jul-03 $3.4500 | | $
| 1.7544
|
| | $
| 1.4000
|
| | 30-Dec-02 $0.9300 | |
| 3,652
|
| |
| 1,400
|
|
Sources of information: Commodity Systems, Inc.
Page 31
| | |
| Gencor Industries, Inc. | CONFIDENTIAL |
|
COMPANY MARKET PERFORMANCE
Gencor vs Comparable Company Index (1) and Russell 3000 Index
October 03, 2002 - October 03, 2003
| | | | | | | | | | | | | |
| % Change | | Gencor | | Comparables | | Russell 3000 |
| First Half of Period | | | -16.1 | % | | | -36.4 | % | | | -8.0 | % |
| Second Half of Period | | | 88.5 | % | | | 44.2 | % | | | 19.6 | % |
| Full Period | | | 58.1 | % | | | -8.2 | % | | | 10.1 | % |
(1) Reflects the market cap weighted prices of the comparable companies utilized in the Comparable Company Analysis.
Sources of information: Commodity Systems, Inc.
Page 32
| | |
| Gencor Industries, Inc. | CONFIDENTIAL |
|
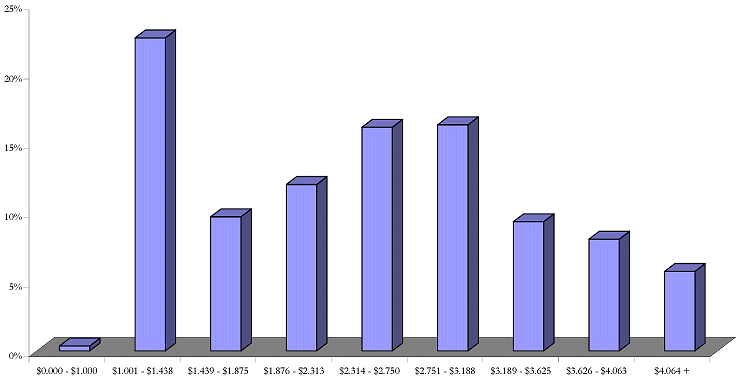
COMPANY MARKET PERFORMANCE
Gencor Closing Price Ranges as Percentage of Total Trading Days
October 03, 2002 - October 03, 2003
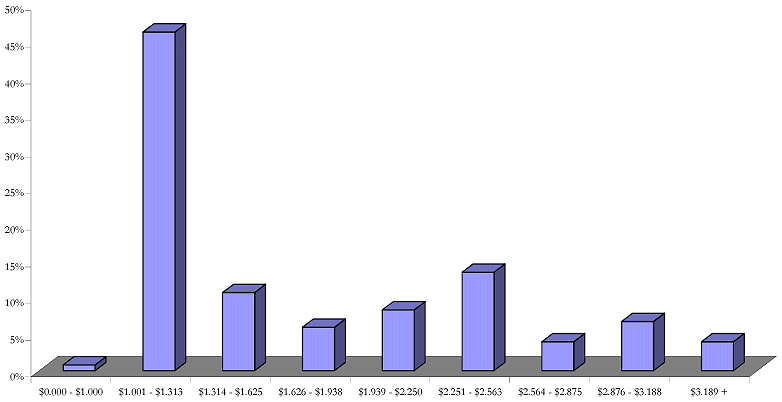
| | | | | | | | | | | | | | | | | | | | | | | | | | | | | | | | | | | | | |
| Price Range | | $0.000 - $1.000 | | $1.001 - $1.313 | | $1.314 - $1.625 | | $1.626 - $1.938 | | $1.939 - $2.250 | | $2.251 - $2.563 | | $2.564 - $2.875 | | $2.876 - $3.188 | | $3.189 + |
| |
| |
| |
| |
| |
| |
| |
| |
| |
|
| Days in Range | | | 2 | | | | 117 | | | | 27 | | | | 15 | | | | 21 | | | | 34 | | | | 10 | | | | 17 | | | | 10 | |
| Percentage | | | 0.8 | % | | | 46.2 | % | | | 10.7 | % | | | 5.9 | % | | | 8.3 | % | | | 13.4 | % | | | 4.0 | % | | | 6.7 | % | | | 4.0 | % |
Sources of information: Commodity Systems, Inc.
Page 33
| | |
| Gencor Industries, Inc. | CONFIDENTIAL |
|
COMPANY MARKET PERFORMANCE
Gencor Trading Volume per Price Range as Percentage of Total Volume
October 03, 2002 - October 03, 2003
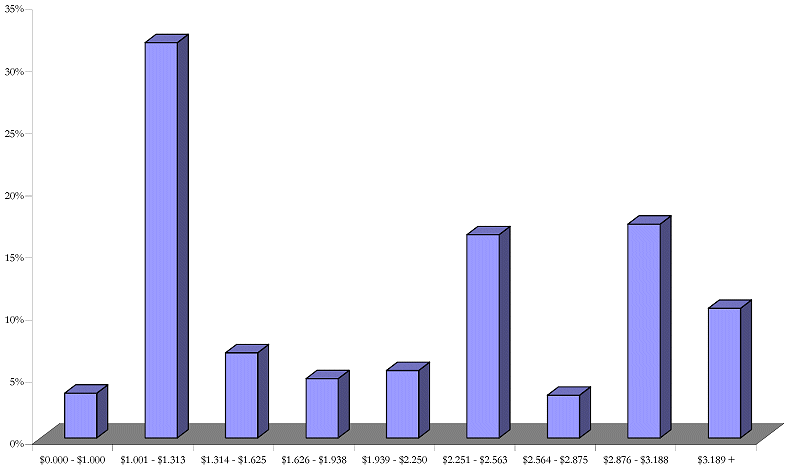
| | | | | | | | | | | | | | | | | | | | | | | | | | | | | | | | | | | | | |
| Price Range | | $0.000 - $1.000 | | $1.001 - $1.313 | | $1.314 - $1.625 | | $1.626 - $1.938 | | $1.939 - $2.250 | | $2.251 - $2.563 | | $2.564 - $2.875 | | $2.876 - $3.188 | | $3.189 + |
| |
| |
| |
| |
| |
| |
| |
| |
| |
|
| Days in Range | | | 33,300 | | | | 294,300 | | | | 63,400 | | | | 44,100 | | | | 50,200 | | | | 151,300 | | | | 31,800 | | | | 159,100 | | | | 96,500 | |
| Percentage | | | 3.6 | % | | | 31.9 | % | | | 6.9 | % | | | 4.8 | % | | | 5.4 | % | | | 16.4 | % | | | 3.4 | % | | | 17.2 | % | | | 10.4 | % |
Sources of information: Commodity Systems, Inc.
Page 34
| | |
| Gencor Industries, Inc. | CONFIDENTIAL |
|
COMPANY MARKET PERFORMANCE
Gencor Trading Volume Ranges as a Percentage of Total Volume
October 03, 2002 - October 03, 2003
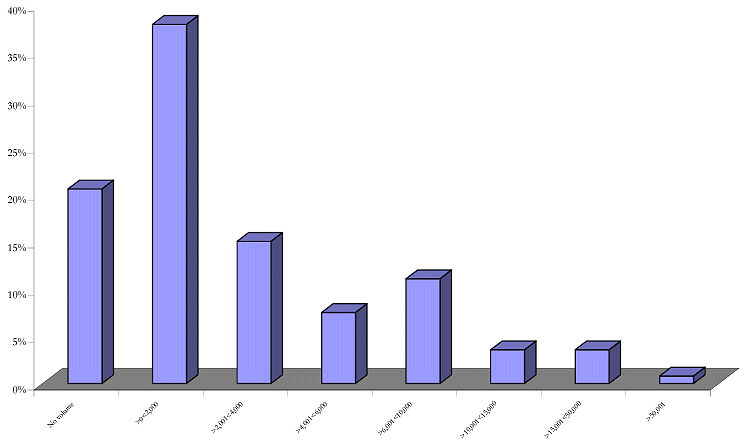
| | | | | | | | | | | | | | | | | | | | | | | | | | | | | | | | | |
| | | No volume | | >0<2,000 | | >2,001<4,000 | | >4,001<6,000 | | >6,001<10,000 | | >10,001<15,000 | | >15,001<50,000 | | >50,001 |
| | |
| |
| |
| |
| |
| |
| |
| |
|
| Days in Range | | | 52 | | | | 96 | | | | 38 | | | | 19 | | | | 28 | | | | 9 | | | | 9 | | | | 2 | |
| Percentage | | | 20.6 | % | | | 37.9 | % | | | 15.0 | % | | | 7.5 | % | | | 11.1 | % | | | 3.6 | % | | | 3.6 | % | | | 0.8 | % |
Sources of information: Commodity Systems, Inc.
Page 35
| | |
| Gencor Industries, Inc. | CONFIDENTIAL |
|
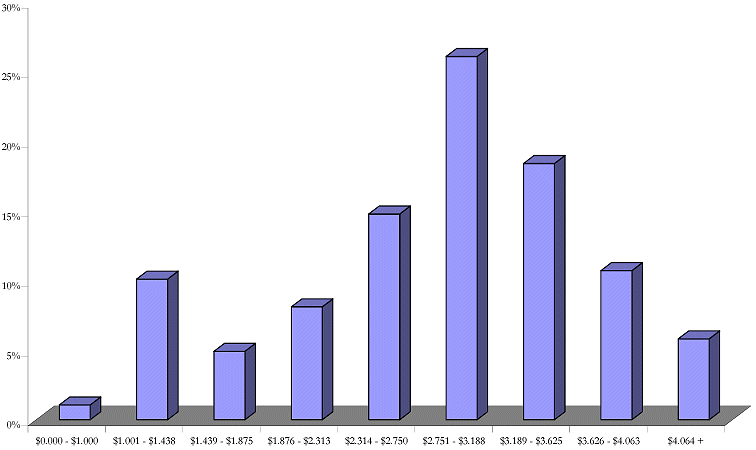
COMPANY MARKET PERFORMANCE
Gencor Closing Price & Trading Volume History
July 12, 2001 - October 03, 2003

| | | | | | | | | | | | | | | | | | | | | | | | | | | | | |
| Start | | End | | High | | Average | | Median | | Low | | Avg. Volume | | Median Volume |
| |
| |
| |
| |
| |
| |
| |
|
| 12-Jul-01 $2.3000 | | 3-Oct-03 $2.4500 | | 29-Apr-02 $4.3500 | | $ | 2.4353 | | | $ | 2.5000 | | | 30-Dec-02 $0.9300 | | | 5,608 | | | | 2,100 | |
Sources of information: Commodity Systems, Inc.
Page 36
| | |
| Gencor Industries, Inc. | CONFIDENTIAL |
|
COMPANY MARKET PERFORMANCE
Gencor vs Comparable Company Index (1) and Russell 3000 Index
July 12, 2001 - October 03, 2003
| | | | | | | | | | | | | |
| | | Gencor | | Comparables | | Russell 3000 |
| | |
| |
| |
|
| % Change | | | 6.5 | % | | | -10.8 | % | | | -12.3 | % |
(1) Reflects the market cap weighted prices of the comparable companies utilized in the Comparable Company Analysis.
Sources of information: Commodity Systems, Inc.
Page 37
| | |
| Gencor Industries, Inc. | CONFIDENTIAL |
|
COMPANY MARKET PERFORMANCE
Gencor Closing Price Ranges as Percentage of Total Trading Days
July 12, 2001 - October 03, 2003
| | | | | | | | | | | | | | | | | | | | | | | | | | | | | | | | | | | | | |
| Price Range | | $0.000 - $1.000 | | $1.001 - $1.438 | | $1.439 - $1.875 | | $1.876 - $2.313 | | $2.314 - $2.750 | | $2.751 - $3.188 | | $3.189 - $3.625 | | $3.626 - $4.063 | | $4.064 + |
| |
| |
| |
| |
| |
| |
| |
| |
| |
|
| Days in Range | | | 2 | | | | 126 | | | | 54 | | | | 67 | | | | 90 | | | | 91 | | | | 52 | | | | 45 | | | | 32 | |
| Percentage | | | 0.4 | % | | | 22.5 | % | | | 9.7 | % | | | 12.0 | % | | | 16.1 | % | | | 16.3 | % | | | 9.3 | % | | | 8.1 | % | | | 5.7 | % |
Sources of information: Commodity Systems, Inc.
Page 38
| | |
| Gencor Industries, Inc. | CONFIDENTIAL |
|
COMPANY MARKET PERFORMANCE
Gencor Trading Volume per Price Range as Percentage of Total Volume
July 12, 2001 - October 03, 2003
| | | | | | | | | | | | | | | | | | | | | | | | | | | | | | | | | | | | | |
| Price Range | | $0.000 - $1.000 | | $1.001 - $1.438 | | $1.439 - $1.875 | | $1.876 - $2.313 | | $2.314 - $2.750 | | $2.751 - $3.188 | | $3.189 - $3.625 | | $3.626 - $4.063 | | $4.064 + |
| |
| |
| |
| |
| |
| |
| |
| |
| |
|
| Volume | | | 33,300 | | | | 316,700 | | | | 154,100 | | | | 254,300 | | | | 463,300 | | | | 818,200 | | | | 577,100 | | | | 335,700 | | | | 182,300 | |
| Percentage | | | 1.1 | % | | | 10.1 | % | | | 4.9 | % | | | 8.1 | % | | | 14.8 | % | | | 26.1 | % | | | 18.4 | % | | | 10.7 | % | | | 5.8 | % |
Sources of information: Commodity Systems, Inc.
Page 39
| | |
| Gencor Industries, Inc. | CONFIDENTIAL |
|
COMPANY MARKET PERFORMANCE
Gencor Trading Volume Ranges as a Percentage of Total Volume
July 12, 2001 - October 03, 2003
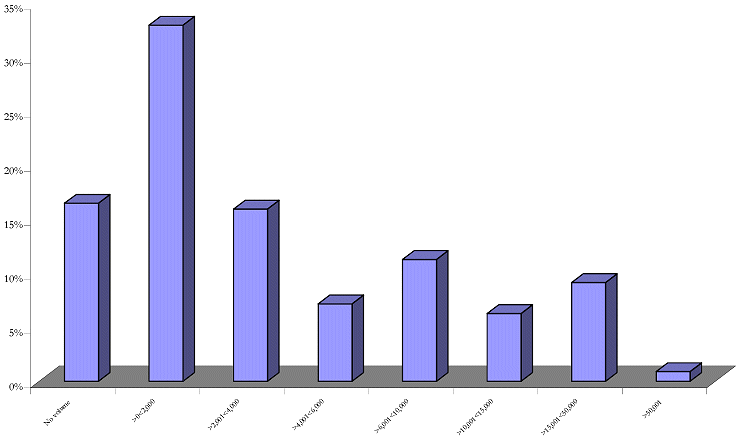
| | | | | | | | | | | | | | | | | | | | | | | | | | | | | | | | | |
| | | No volume | | >0<2,000 | | >2,001<4,000 | | >4,001<6,000 | | >6,001<10,000 | | >10,001<15,000 | | >15,001<50,000 | | >50,001 |
| | |
| |
| |
| |
| |
| |
| |
| |
|
| Days in Range | | | 92 | | | | 184 | | | | 89 | | | | 40 | | | | 63 | | | | 35 | | | | 51 | | | | 5 | |
| Percentage | | | 16.5 | % | | | 32.9 | % | | | 15.9 | % | | | 7.2 | % | | | 11.3 | % | | | 6.3 | % | | | 9.1 | % | | | 0.9 | % |
Sources of information: Commodity Systems, Inc.
Page 40
| | |
| Gencor Industries, Inc. | CONFIDENTIAL |
|
VALUATION ANALYSIS
Page 41
| | |
| Gencor Industries, Inc. | CONFIDENTIAL |
|
VALUATION ANALYSIS
METHODOLOGIES
| | • | | Based upon a review of the Company’s historical financial data, projections, and certain other qualitative data, Capitalink utilized several valuation methodologies to determine a range of values for the Company. |
| | • | | Capitalink did not form a conclusion as to whether any individual analysis, considered in isolation, supported or failed to support an opinion as to the fairness, from a financial point of view, of the Offer. |
| | • | | Capitalink did not place any particular reliance or weight on any individual analysis, but instead concluded that the analyses, taken as a whole, supported its determination. Accordingly, the analyses must be considered as a whole and selecting portions of analyses or the factors considered, without considering all analyses and factors collectively, could create an incomplete and incorrect view of the process underlying the analyses in connection with the preparation of the opinion. |
| | • | | The financial reviews and analyses include information presented in tabular format. In order to fully understand Capitalink’s financial review and analyses, the tables must be read together with the text of the presentation. The tables alone are not a complete description of the financial review and analyses and considering the tables alone could create a misleading or incomplete view of Capitalink’s financial review and analyses. |
| | • | | The methodologies utilized by Capitalink included: |
| | • | | A review of the historical and projected financial information of the Company as prepared by management. |
| | • | | A review and comparison of the trading of, and the trading market for, the common stock of the Company, the Comparable Companies and a general market index over the last twelve months, and since July 12, 2001. |
| | • | | A review of the estimated present value of the Note. |
| | • | | A review of a discounted cash flow analysis of the Company, with sensitivity analyses based on a range of assumptions. |
| | • | | A review and comparison of trading multiples for deemed comparable publicly-traded companies for the Company. |
Page 42
| | |
| Gencor Industries, Inc. | CONFIDENTIAL |
|
VALUATION ANALYSIS
METHODOLOGIES
| | • | | A review and comparison of transaction multiples for deemed comparable transactions for the Company. |
| | • | | A review and comparison of the premiums paid in transactions involving the acquisition of a controlling ownership interest in publicly traded companies. |
| | • | | A review of the premiums implied by the per share consideration in the Offer. |
| | • | | Reviewed and analyzed a range of possible scenarios and cash flow implications of the Company’s Carbontronics investments. |
Page 43
| | |
| Gencor Industries, Inc. | CONFIDENTIAL |
|
VALUATION ANALYSIS
SUMMARY
Illustrative Indicated Reference Range Summary
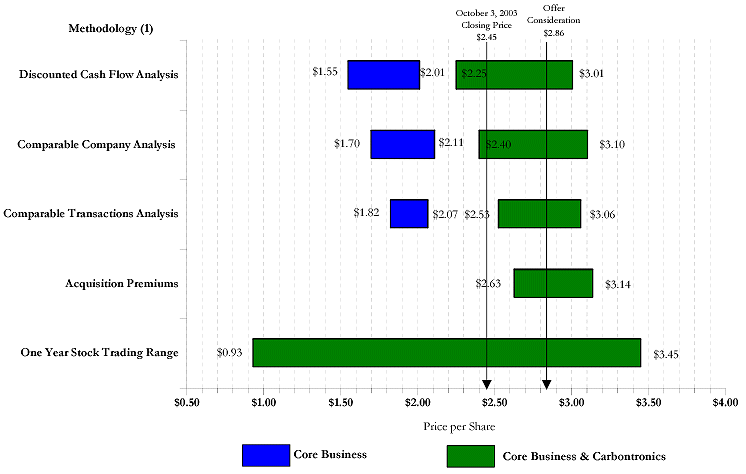
(1) Please reference the appropriate Analysis for further discussion and sources of information.
Page 44
| | | |
| Gencor Industries, Inc. | | CONFIDENTIAL |
|
VALUATION ANALYSIS
SUMMARY
Indicated Reference Range Summary
($ in thousands, except per share)
| | | | | | | | | | | | | | | | | | | | | | | | | | | | |
| | | | | | | | | | | | | | | | | | Indicated Common Stock | | Enterprise Value of | | Indicated Common Stock |
| | | | | | | | | | Selected Multiple | | Enterprise Value of | | Share Price of | | Core Business | | Share Price of Core Business |
| Methodology (1) | | Statistic | | Range | | Core Business | | Core Business | | & Carbontronics | | & Carbontronics |
| |
| |
| |
| |
| |
| |
|
Discounted Cash Flow Analysis | | | | | | | | | | | | | | | | | | | | | | | | |
| | LTM Revenue Terminal Multiple | | | | | | | | | | $ | 12,568 - $16,872 | | | $ | 1.32 - $1.72 | | | $ | 19,744 - $27,017 | | | $ | 2.02 - $2.71 | |
| | LTM EBITDA Terminal Multiple | | | | | | | | | | $ | 16,023 - $20,536 | | | $ | 1.64 - $2.06 | | | $ | 23,198 - $30,682 | | | $ | 2.34 - $3.05 | |
| | Perpetual Growth Method | | | | | | | | | | $ | 16,468 - $22,618 | | | $ | 1.68 - $2.25 | | | $ | 23,644 - $32,763 | | | $ | 2.39 - $3.25 | |
| | | | Indicated Reference Range | | | | | | | | | | $ | 15,020 - $20,009 | | | $ | 1.55 - $2.01 | | | $ | 22,195 - $30,154 | | | $ | 2.25 - $3.01 | |
Comparable Company Analysis | | | | | | | | | | | | | | | | | | | | | | | | |
| | Enterprise Value as Multiple of: | | | | | | | | | | | | | | | | | | | | | | | | |
| | | LTM 7/31/03 Revenue | | $ | 58,950 | | | | 0.35x - 0.45x | | | $ | 20,633 - $26,528 | | | $ | 2.07 - $2.62 | | | $ | 27,808 - $36,673 | | | $ | 2.77 - $3.61 | |
| | | CFY Revenue | | $ | 55,843 | | | | 0.4x - 0.5x | | | $ | 19,545 - $25,129 | | | $ | 1.97 - $2.49 | | | $ | 26,720 - $35,274 | | | $ | 2.67 - $3.48 | |
| | | NFY Revenue | | $ | 51,014 | | | | 0.3x 0.4x | | | $ | 15,304 $20,406 | | | $ | 1.57 $2.05 | | | $ | 22,480 - $30,551 | | | $ | 2.28 - $3.04 | |
| | | LTM 7/31/03 EBITDA | | $ | 2,880 | | | | 5.0x 6.0x | | | $ | 14,400 $17,280 | | | $ | 1.49 $1.76 | | | $ | 21,575 - $27,425 | | | $ | 2.19 - $2.75 | |
| | | CFY EBITDA | | $ | 2,758 | | | | 4.5x - 5.5x | | | $ | 12,411 $15,169 | | | $ | 1.30 $1.56 | | | $ | 19,586 - $25,314 | | | $ | 2.01 - $2.56 | |
| | | NFY EBITDA | | $ | 4,370 | | | | 4.0x - 5.0x | | | $ | 17,480 $21,850 | | | $ | 1.78 $2.18 | | | $ | 24,655 - $31,995 | | | $ | 2.48 - $3.18 | |
| | | | Indicated Reference Range | | | | | | | | | | $ | 16,629 - $21,060 | | | $ | 1.70 - $2.11 | | | $ | 23,804 - $31,205 | | | $ | 2.40 - $3.10 | |
Comparable Transactions Analysis | | | | | | | | | | | | | | | | | | | | | | | | |
| | Enterprise Value as Multiple of: | | | | | | | | | | | | | | | | | | | | | | | | |
| | | LTM 7/31/03 Revenue | | $ | 58,950 | | | | 0.36x - 0.41x | | | $ | 21,251 - $23,908 | | | $ | 2.13 - $2.37 | | | $ | 28,426 - $34,053 | | | $ | 2.83 - $3.37 | |
| | | LTM 7/31/03 EBITDA | | $ | 2,880 | | | | 5.1x - 6.0x | | | $ | 14,702 - $17,280 | | | $ | 1.52 - $1.76 | | | $ | 21,878 - $27,425 | | | $ | 2.22 - $2.75 | |
| | | | Indicated Reference Range | | | | | | | | | | $ | 17,977 - $20,594 | | | $ | 1.82 - $2.07 | | | $ | 25,152 - $30,739 | | | $ | 2.53 - $3.06 | |
Acquisition Premiums | | | | | | | | | | | | | | | | | | | | | | | | |
| | Prior One Day | | $ | 2.35 | | | | 18.9% - 35.5 | % | | | | | | | | | | | | | | $ | 2.79 - $3.18 | |
| | Prior 5 Day | | $ | 2.30 | | | | 11.1% - 37.5 | % | | | | | | | | | | | | | | $ | 2.55 - $3.16 | |
| | Prior 30 Day | | $ | 2.15 | | | | 17.8% - 42.5 | % | | | | | | | | | | | | | | $ | 2.53 - $3.06 | |
| | | | Indicated Reference Range | | | | | | | | | | | | | | | | | | | | | | $ | 2.63 - $3.14 | |
Premiums Paid Analysis | | | | | | | | | | | | | | | | | | | | | | | | |
| | As of October 03, 2003 | | | 16.7 | % | | | | | | | | | | | | | | | | | | | | |
| | Prior Day Closing Price | | | 21.7 | % | | | | | | | | | | | | | | | | | | | | |
| | Prior 5 Trading Day Average Closing Price | | | 20.7 | % | | | | | | | | | | | | | | | | | | | | |
| | Prior 10 Trading Day Average Closing Price | | | 21.2 | % | | | | | | | | | | | | | | | | | | | | |
| | Prior 20 Trading Day Average Closing Price | | | 20.9 | % | | | | | | | | | | | | | | | | | | | | |
| | Prior 30 Trading Day Average Closing Price | | | 23.5 | % | | | | | | | | | | | | | | | | | | | | |
| | Prior 60 Trading Day Average Closing Price | | | 16.1 | % | | | | | | | | | | | | | | | | | | | | |
| | Prior 90 Trading Day Average Closing Price | | | 7.3 | % | | | | | | | | | | | | | | | | | | | | |
| | Prior Six Month Average Closing Price | | | 24.6 | % | | | | | | | | | | | | | | | | | | | | |
| | Prior Year Average Closing Price | | | 60.6 | % | | | | | | | | | | | | | | | | | | | | |
(1) Please reference the appropriate Analysis for further discussion and sources of information.
Page 45
| | |
| Gencor Industries, Inc. | CONFIDENTIAL |
|
VALUATION ANALYSIS
NOTE ANALYSIS
| | • | | In order to effectively compare the consideration in the Offer to implied ranges of value derived in certain of its financial analyses, Capitalink determined a range of net present values of the Notes. |
| | • | | In determining a range of net present values of the Notes, an appropriate discount rate should reflect current general economic and market risks in addition to specific risks associated with the investment. |
| | • | | Capitalink noted that the Notes would be unsecured and subordinate to all of the Company’s existing debt to banks and other lenders and to all other future debt that the Company designates as debt senior to the Notes. In addition, Capitalink noted that the Company does not intend to register the Notes with the SEC nor list the Notes for trading on an exchange or qualify the Notes for trading on an automated quotation system operated by a national securities association. Therefore, Capitalink assumed that a trading market was not expected to develop for the Notes. |
| | • | | Capitalink noted that as of July 31, 2003, the Company had senior debt of approximately $9.8 million and approximately $8.5 million in cash. |
| | • | | In order to determine an appropriate range of discount rates to utilize in the present value calculation, Capitalink undertook a search for other obligations with similar risk characteristics consistent with the Notes. In this regard, Capitalink utilized corporate obligations rated BB or lower in its analysis: |
| | • | | Based on the Standard and Poor’s Speculative Grade Credit Index on October 1, 2003, the yield of a speculative three-year corporate bond is 969.6 basis points over an estimated three-year current treasury yield of 2.5%. This results in a yield of 12.2%. |
| | • | | An examination of all substantial risk corporate bonds [B+ to CCC- grade] maturing in 3 – 5 years resulted in a range of yields between 5.7% and 15.61%. |
| | • | | It was noted that all of the obligations in the review were, or had at one time been, publicly traded and that there was no trading market expected to develop for the Notes. This lack of liquidity should be reflected in a higher yield for the Notes. |
Page 46
| | |
| Gencor Industries, Inc. | CONFIDENTIAL |
|
VALUATION ANALYSIS
NOTE ANALYSIS
| | • | | Capitalink determined an appropriate discount rate to be 16.5% given the Company’s estimated WACC of 17.5% and the current prevailing yields on speculative bonds. Discounting the Note at such rate generated an indicated value for the Note of approximately $0.86. |
| | • | | Capitalink added the indicated value of the Note to the $2.00 cash per share to obtain the total value of the Offer of approximately $2.86 (the “Offer Consideration”). |
Page 47
| | |
| Gencor Industries, Inc. | CONFIDENTIAL |
|
VALUATION ANALYSIS
NOTE ANALYSIS
Notes Analysis - Indicated Value
($ in thousands, except per share)
| | | | | | | |
| Note Information |
|
| | | Per share principal amount of Note | | $
| 1.00
|
|
| | | Interest Rate | |
| 10.0
| %
|
| | | Interest paid | |
| Semi-annually
|
|
| | | Principal payments: | | | | |
| | | End of year 1 | |
| 0.0
| %
|
| | | End of year 2 | |
| 0.0
| %
|
| | | End of year 3 | |
| 100.0
| %
|
| | | Security Interest | | | Subordinate to all of the Company’s existing debt to banks and other lenders and to all other future debt that the Company designates as debt senior to the Notes. |
| | | | | | | |
| | | | | | | | | | | | | | | | | | | | | | | | | | |
| Expected Cash Flows per Share |
|
| | | | Year |
| | | |
|
| | | | 0.5 | | 1.0 | | 1.5 | | 2.0 | | 2.5 | | 3.0 |
| | | |
| |
| |
| |
| |
| |
|
| | Interest | | $ | 0.05 | | | $ | 0.05 | | | $ | 0.05 | | | $ | 0.05 | | | $ | 0.05 | | | $ | 0.05 | |
| | Principal | | | - | | | | - | | | | - | | | | - | | | | - | | | | 1.00 | |
| | Total | | $ | 0.05 | | | $ | 0.05 | | | $ | 0.05 | | | $ | 0.05 | | | $ | 0.05 | | | $ | 1.05 | |
| | | | | | | | | | | | | | | | | | | | | | | | | |
| | Principal balance at period end | | $ | 1.00 | | | $ | 1.00 | | | $ | 1.00 | | | $ | 1.00 | | | $ | 1.00 | | | $ | - | |
| | | | | | | | | | | | | | | | | | | | | | | | | | | | | | |
| Range of Estimated Present Values |
|
| | | | Assumed Discount Rate |
| | | |
|
| | | | 14.0% | | 15.0% | | 16.0% | | 16.5% | | 17.0% | | 18.0% | | 19.0% |
| | | |
| |
| |
| |
| |
| |
| |
|
| | Estimated per share | | $ | 0.915 | | | $ | 0.894 | | | $ | 0.874 | | | $ | 0.864 | | | $ | 0.854 | | | $ | 0.835 | | | $ | 0.817 | |
| | | | | | | | | | | | | | | | | | | | | | | | | | | | | |
Sources of information: Company management
Page 48
| | |
| Gencor Industries, Inc. | CONFIDENTIAL |
|
VALUATION ANALYSIS
NOTE ANALYSIS
Notes Analysis - Bond Yields Review
| | | | | | | | | | | | | | | | | | | | | |
| Yields on Speculative Bonds |
|
| | | | | | | Credit Spread | | | | |
| | | S&P | |
| | 3 Yr | | Implied Spec |
| Date | | SG Index | | BP | | % | | Govt Bond | | 3 Yr Bond |
| |
| |
| |
| |
| |
|
| 9/26/2003 | | | 969.6 | | | | 969.6 | | | | 9.7 | % | | | 2.5 | % | | | 12.2 | % |
| | | | | | | | | | | | | |
| YTM of Corporate Bonds with 3 to 5 years to maturity |
|
| | | | | | | YTM Range |
| Investment | | Number of | |
|
| Rating | | Issues | | High | | Low |
| |
| |
| |
|
| AAA | | | 27 | | | | 5.05 | % | | | 2.08 | % |
| AA | | | 8 | | | | 3.83 | % | | | 2.41 | % |
| A | | | 85 | | | | 6.24 | % | | | 2.28 | % |
| BBB | | | 39 | | | | 5.57 | % | | | 2.37 | % |
| BB | | | 4 | | | | 7.69 | % | | | 5.70 | % |
| B | | | 5 | | | | 15.61 | % | | | 6.53 | % |
| CCC | | | 2 | | | | 14.14 | % | | | 13.13 | % |
| CC | | | 0 | | | na | | na |
| C | | | 0 | | | na | | na |
| NR | | | 0 | | | na | | na |
| | | |
| | | | | | | | | |
| | | | 170 | | | | | | | | | |
| | | |
| | | | | | | | | |
Sources of information: Yahoo Finance and Standard & Poor’s Credit Indices
Page 49
| | |
| Gencor Industries, Inc. | CONFIDENTIAL |
|
VALUATION ANALYSIS
DISCOUNTED CASH FLOW ANALYSIS
| | • | | The discounted cash flow analysis estimates value based upon a company’s projected future free cash flow discounted at a rate reflecting risks inherent in its business and capital structure. Unlevered free cash flow represents the amount of cash generated and available for principal, interest and dividend payments after providing for ongoing business operations. |
| | • | | While the discounted cash flow analysis is the most scientific of the methodologies, it is dependent on projections and is further dependent on numerous industry-specific and macroeconomic factors. |
| | • | | Capitalink performed discounted cash flow analyses based on the projected cash flows for the Company’s core asphalt plant manufacturing business. Capitalink utilized the forecasts provided by Company management, which show a gradual increase in domestic sales and a decline in international sales between 2003 and 2006. Total combined sales for the forecast period fall from $58.3 million to $55.9 million from FY2003 to FY2006. For the forecast period, the Company projects a gradual increase in EBITDA from approximately $3.2 million for FY2003, to approximately $5.6 million for FY2006. |
| | • | | In order to arrive at a present value, Capitalink utilized discount rates ranging from 16.5% to 18.5%. This was based on an estimated weighted average cost of capital (“WACC”) of 17.5% (based on the Company’s existing debt and an 24.4% estimated cost of equity). |
| | • | | Capitalink presented a range of terminal values at the end of the forecast period by applying a range of multiples to each of the operations FY2006 projected revenue and EBITDA. |
| | • | | In addition, Capitalink presented a perpetual growth scenario whereby ranges of growth rates were applied to the operation’s FY2006 free cash flows in order to determine a terminal value, rather than multiples. |
| | • | | In each of the scenarios noted above, a range of enterprise values was derived for the Company’s core business. |
Page 50
| | |
| Gencor Industries, Inc. | CONFIDENTIAL |
|
VALUATION ANALYSIS
DISCOUNTED CASH FLOW ANALYSIS
| | • | | The results of the discounted cash flow analysis under the three terminal value scenarios were as follows: |
| | • | | Utilizing the revenue terminal scenario (range of 0.35 times to 0.45 times), Capitalink calculated a range of indicated enterprise value from $12.5 million to $16.7 million. |
| | • | | Utilizing the EBITDA terminal scenario (range of 4.5 times to 5.5 times), Capitalink calculated a range of indicated enterprise values from $15.9 million to $20.4 million. |
| | • | | Utilizing a perpetual growth scenario (growth rates of 5.5% to 6.5%), Capitalink calculated a range of indicated enterprise values from $16.3 million to $22.4 million. |
| | • | | The total enterprise values above were then reduced by the Company’s net debt to arrive at an equity value range. The Company’s estimated net debt as of July 31, 2003 was approximately ($1.6) million, which includes approximately $9.9 million in interest bearing debt, $8.5 million in cash, and an estimated $2.9 million from the exercise of in-the-money (“ITM”) options. |
| | • | | Taking into account the enterprise value ranges in all three terminal value scenarios, the Company’s net debt, common stock equivalents of 10.2 million, and applying a 5% discount to reflect the limited voting power of the Company’s common stock, Capitalink calculated a range of indicated common stock shares prices of between $1.54 and $2.00. |
Page 51
| | |
| Gencor Industries, Inc. | CONFIDENTIAL |
|
VALUATION ANALYSIS
DISCOUNTED CASH FLOW ANALYSIS
DCF Analysis - Indicated Reference Range - Core Business
($ in thousands, except per share)
| | | | | | | | | | | | | | | | | |
| | | | | | | | | | | | | | | Indicated Common Stock |
| | | Selected Multiple Range | | Indicated EV Value | | Indicated Equity Value (1) | | Share Price (2) (3) |
| | |
| |
| |
| |
|
| LTM Revenue Terminal Multiple | | | 0.35x - 0.45x | | | $ | 12,568 - $16,872 | | | $ | 14,179 $18,483 | | | $ | 1.32 - $1.72 | |
| LTM EBITDA Terminal Multiple | | | 4.5x - 5.5x | | | $ | 16,023 - $20,536 | | | $ | 17,634 $22,147 | | | $ | 1.64 - $2.06 | |
| Perpetual Growth Method | | | 5.50% - 6.50 | % | | $ | 16,468 - $22,618 | | | $ | 18,079 $24,229 | | | $ | 1.68 - $2.25 | |
| | | | | | | | | | | | | | | | | |
Indicated Reference Range | | | | | | $ | 15,020 - $20,009 | | | $ | 16,631 - $21,620 | | | $ | 1.55 - $2.01 | |
(1) Adjusted for ($1,611) net debt as of July 31, 2003, which includes cash from in the money options/warrants outstanding.
(2) Based upon and assumes 10,208 shares and in the money options/warrants outstanding.
(3) In order to reflect its limited voting power, a 5% discount has been applied to the common shares.
Page 52
| | |
| Gencor Industries, Inc. | CONFIDENTIAL |
|
VALUATION ANALYSIS
DISCOUNTED CASH FLOW ANALYSIS
DCF Analysis - Estimated Ranges - Core Business
($ in thousands, except per share)
| | | | | | | | | | | | | | | | | | | | | | | | | | | | | | | | | | | | | | | | | | | | | | | | | | | | | | | | | | | | | |
| Discount | | | | | | |
| Rate | | Estimated Range of Enterprise Values | | Terminal Value as % of Enterprise Values | | Estimated Range of Equity Values |
| |
| |
| |
|
| Revenue Terminal Value Analysis | | | | | | | | | | | | | | | | | | | | | | | | | | | | | | | | | | | | | | | | |
|
| | | | 0.350x | | | | 0.375x | | | | 0.400x | | | | 0.425x | | | | 0.450x | | | | 0.350x | | | | 0.375x | | | | 0.400x | | | | 0.425x | | | | 0.450x | | | | 0.350x | | | | 0.375x | | | | 0.400x | | | | 0.425x | | | | 0.450x | |
| | | |
| | | |
| | | |
| | | |
| | | |
| | | |
| | | |
| | | |
| | | |
| | | |
| | | |
| | | |
| | | |
| | | |
| | | |
| |
| 16.5% | | $ | 13,353 | | | $ | 14,233 | | | $ | 15,113 | | | $ | 15,992 | | | $ | 16,872 | | | | 92.2 | % | | | 92.7 | % | | | 93.1 | % | | | 93.5 | % | | | 93.8 | % | | $ | 14,964 | | | $ | 15,844 | | | $ | 16,724 | | | $ | 17,603 | | | $ | 18,483 | |
| 17.0% | | $ | 13,152 | | | $ | 14,020 | | | $ | 14,889 | | | $ | 15,757 | | | $ | 16,625 | | | | 92.4 | % | | | 92.9 | % | | | 93.3 | % | | | 93.7 | % | | | 94.0 | % | | $ | 14,763 | | | $ | 15,631 | | | $ | 16,500 | | | $ | 17,368 | | | $ | 18,236 | |
| 17.5% | | $ | 12,954 | | | $ | 13,811 | | | $ | 14,668 | | | $ | 15,525 | | | $ | 16,382 | | | | 92.6 | % | | | 93.1 | % | | | 93.5 | % | | | 93.8 | % | | | 94.2 | % | | $ | 14,565 | | | $ | 15,422 | | | $ | 16,279 | | | $ | 17,136 | | | $ | 17,993 | |
| 18.0% | | $ | 12,760 | | | $ | 13,606 | | | $ | 14,452 | | | $ | 15,298 | | | $ | 16,144 | | | | 92.8 | % | | | 93.3 | % | | | 93.7 | % | | | 94.0 | % | | | 94.3 | % | | $ | 14,371 | | | $ | 15,217 | | | $ | 16,063 | | | $ | 16,909 | | | $ | 17,755 | |
| 18.5% | | $ | 12,568 | | | $ | 13,404 | | | $ | 14,239 | | | $ | 15,074 | | | $ | 15,909 | | | | 93.0 | % | | | 93.5 | % | | | 93.9 | % | | | 94.2 | % | | | 94.5 | % | | $ | 14,179 | | | $ | 15,015 | | | $ | 15,850 | | | $ | 16,685 | | | $ | 17,520 | |
| | | | | | | | | | | | | | | | | | | | | | | | | | | | | | | | | | | | | | | | | | | | | | | | | | | | | | | | | | | | | |
| | | | | | | Average | | $ | 14,672 | | | | | | | | | | | | | | | Average | | | 93.4 | % | | | | | | | | | | | | | | Average | | $ | 16,283 | | | | | | | | | |
| | | | | | | | | | | | | | | | | | | | | | | | | | | | | | | | | | | | | | | | | | | | | | | | | | | | | | | | | | | | | |
| EBITDA Terminal Value Analysis | | | | | | | | | | | | | | | | | | | | | | | | | | | | | | | | | | | | | | | | |
| | | | | | | | | | | | | | | | | | | | | | | | | | | | | | | | | | | | | | | | | | | | | | | | | | | | | | | | | | | | | |
| | | | 4.50x | | | | 4.75x | | | | 5.00x | | | | 5.25x | | | | 5.50x | | | | 4.50x | | | | 4.75x | | | | 5.00x | | | | 5.25x | | | | 5.50x | | | | 4.50x | | | | 4.75x | | | | 5.00x | | | | 5.25x | | | | 5.50x | |
| | | |
| | | |
| | | |
| | | |
| | | |
| | | |
| | | |
| | | |
| | | |
| | | |
| | | |
| | | |
| | | |
| | | |
| | | |
| |
| 16.5% | | $ | 16,991 | | | $ | 17,878 | | | $ | 18,764 | | | $ | 19,650 | | | $ | 20,536 | | | | 93.9 | % | | | 94.2 | % | | | 94.5 | % | | | 94.7 | % | | | 94.9 | % | | $ | 18,602 | | | $ | 19,489 | | | $ | 20,375 | | | $ | 21,261 | | | $ | 22,147 | |
| 17.0% | | $ | 16,743 | | | $ | 17,618 | | | $ | 18,493 | | | $ | 19,367 | | | $ | 20,242 | | | | 94.0 | % | | | 94.3 | % | | | 94.6 | % | | | 94.9 | % | | | 95.1 | % | | $ | 18,354 | | | $ | 19,229 | | | $ | 20,104 | | | $ | 20,978 | | | $ | 21,853 | |
| 17.5% | | $ | 16,499 | | | $ | 17,362 | | | $ | 18,226 | | | $ | 19,089 | | | $ | 19,953 | | | | 94.2 | % | | | 94.5 | % | | | 94.8 | % | | | 95.0 | % | | | 95.2 | % | | $ | 18,110 | | | $ | 18,973 | | | $ | 19,837 | | | $ | 20,700 | | | $ | 21,564 | |
| 18.0% | | $ | 16,259 | | | $ | 17,111 | | | $ | 17,964 | | | $ | 18,816 | | | $ | 19,669 | | | | 94.4 | % | | | 94.7 | % | | | 94.9 | % | | | 95.1 | % | | | 95.3 | % | | $ | 17,870 | | | $ | 18,722 | | | $ | 19,575 | | | $ | 20,427 | | | $ | 21,280 | |
| 18.5% | | $ | 16,023 | | | $ | 16,864 | | | $ | 17,706 | | | $ | 18,547 | | | $ | 19,389 | | | | 94.5 | % | | | 94.8 | % | | | 95.1 | % | | | 95.3 | % | | | 95.5 | % | | $ | 17,634 | | | $ | 18,475 | | | $ | 19,317 | | | $ | 20,158 | | | $ | 21,000 | |
| | | | | | | | | | | | | | | | | | | | | | | | | | | | | | | | | | | | | | | | | | | | | | | | | | | | | | | | | | | | | |
| | | | | | | Average | | $ | 18,230 | | | | | | | | | | | | | | | Average | | | 94.7 | % | | | | | | | | | | | | | | Average | | $ | 19,841 | | | | | | | | | |
| | | | | | | | | | | | | | | | | | | | | | | | | | | | | | | | | | | | | | | | | | | | | | | | | | | | | | | | | | | | | |
| Perpetual Growth Terminal Value Analysis | | | | | | | | | | | | | | | | | | | | | | | | | | | | | | | | | | | | | | | | |
| | | | | | | | | | | | | | | | | | | | | | | | | | | | | | | | | | | | | | | | | | | | | | | | | | | | | | | | | | | | | |
| | | | 5.50% | | | | 5.75% | | | | 6.0% | | | | 6.25% | | | | 6.50% | | | | 5.50% | | | | 5.7% | | | | 6.00% | | | | 6.25% | | | | 6.50% | | | | 5.50% | | | | 5.75% | | | | 6.00% | | | | 6.25% | | | | 6.50% | |
| | | |
| | | |
| | | |
| | | |
| | | |
| | | |
| | | |
| | | |
| | | |
| | | |
| | | |
| | | |
| | | |
| | | |
| | | |
| |
| 16.5% | | $ | 20,447 | | | $ | 20,951 | | | $ | 21,480 | | | $ | 22,035 | | | $ | 22,618 | | | | 94.9 | % | | | 95.0 | % | | | 95.2 | % | | | 95.3 | % | | | 95.4 | % | | $ | 22,058 | | | $ | 22,562 | | | $ | 23,091 | | | $ | 23,646 | | | $ | 24,229 | |
| 17.0% | | $ | 19,321 | | | $ | 19,778 | | | $ | 20,257 | | | $ | 20,758 | | | $ | 21,282 | | | | 94.8 | % | | | 95.0 | % | | | 95.1 | % | | | 95.2 | % | | | 95.3 | % | | $ | 20,932 | | | $ | 21,389 | | | $ | 21,868 | | | $ | 22,369 | | | $ | 22,893 | |
| 17.5% | | $ | 18,290 | | | $ | 18,706 | | | $ | 19,141 | | | $ | 19,595 | | | $ | 20,069 | | | | 94.8 | % | | | 94.9 | % | | | 95.0 | % | | | 95.1 | % | | | 95.2 | % | | $ | 19,901 | | | $ | 20,317 | | | $ | 20,752 | | | $ | 21,206 | | | $ | 21,680 | |
| 18.0% | | $ | 17,342 | | | $ | 17,723 | | | $ | 18,119 | | | $ | 18,532 | | | $ | 18,963 | | | | 94.7 | % | | | 94.8 | % | | | 94.9 | % | | | 95.1 | % | | | 95.2 | % | | $ | 18,953 | | | $ | 19,334 | | | $ | 19,730 | | | $ | 20,143 | | | $ | 20,574 | |
| 18.5% | | $ | 16,468 | | | $ | 16,817 | | | $ | 17,180 | | | $ | 17,557 | | | $ | 17,950 | | | | 94.7 | % | | | 94.8 | % | | | 94.9 | % | | | 95.0 | % | | | 95.1 | % | | $ | 18,079 | | | $ | 18,428 | | | $ | 18,791 | | | $ | 19,168 | | | $ | 19,561 | |
| | | | | | | | | | | | | | | | | | | | | | | | | | | | | | | | | | | | | | | | | | | | | | | | | | | | | | | | | | | | | |
| | | | | | | Average | | $ | 19,255 | | | | | | | | | | | | | | | Average | | | 95.0 | % | | | | | | | | | | | | | | Average | | $ | 20,866 | | | | | | | | | |
All Discounted amounts have been calculated utilizing a mid-year convention.
Sources of information: Company financials, projections and management.
Page 53
| | |
| Gencor Industries, Inc. | CONFIDENTIAL |
|
VALUATION ANALYSIS
DISCOUNTED CASH FLOW ANALYSIS
DCF Analysis - Free Cash Flow Projections - Core Business
($ in thousands)
| | | | | | | | | | | | | | | | | | | | | | | | | | | | | | | |
| | | | | Actual | | Projected |
| | | | |
| |
|
| | | | | | | | | | | | | | | | | FYE Sep 30 |
| | | | | FYE | | 10 ME (1) | | 2 ME | |
|
| | | | | Sep-02 | | Jul-03 | | Sep-03 | | 2003 | | 2004 | | 2005 | | 2006 |
| | | | |
| |
| |
| |
| |
| |
| |
|
Free Cash Flows | | | | | | | | | | | | | | | | | | | | | | | | | | | | |
| | | | | | | | | | | | | | | | | | | | | | | | | | | | | |
| | Revenue | | | | | | | | | | | | | | | | | | | | | | | | | | | | |
| | | Domestic Sales | | $ | 41,207 | | | $ | 40,937 | | | $ | 7,100 | | | $ | 48,037 | | | $ | 48,514 | | | $ | 50,940 | | | $ | 53,487 | |
| | | International Sales | | | 26,278 | | | | 9,879 | | | | 420 | | | | 10,299 | | | | 2,500 | | | | 2,500 | | | | 2,500 | |
| | | |
| | | |
| | | |
| | | |
| | | |
| | | |
| | | |
| |
| | | | 67,485 | | | | 50,816 | | | | 7,520 | | | | 58,336 | | | | 51,014 | | | | 53,440 | | | | 55,987 | |
| | Cost of Goods Sold | | | | | | | | | | | | | | | | | | | | | | | | | | | | |
| | | Domestic Sales | | | 28,978 | | | | 28,743 | | | | 4,979 | | | | 33,722 | | | | 34,060 | | | | 35,782 | | | | 37,591 | |
| | | International Sales | | | 21,538 | | | | 8,627 | | | | 316 | | | | 8,943 | | | | 1,875 | | | | 1,875 | | | | 1,875 | |
| | | |
| | | |
| | | |
| | | |
| | | |
| | | |
| | | |
| |
| | | | 50,516 | | | | 37,370 | | | | 5,295 | | | | 42,665 | | | | 35,935 | | | | 37,657 | | | | 39,466 | |
| | | |
| | | |
| | | |
| | | |
| | | |
| | | |
| | | |
| |
| | Gross Profit | | | 16,969 | | | | 13,446 | | | | 2,225 | | | | 15,671 | | | | 15,079 | | | | 15,783 | | | | 16,521 | |
| | Operating Expenses | | | 13,226 | | | | 10,884 | | | | 1,566 | | | | 12,450 | | | | 10,709 | | | | 10,524 | | | | 10,880 | |
| | | |
| | | |
| | | |
| | | |
| | | |
| | | |
| | | |
| |
| | EBITDA | | | 3,743 | | | | 2,562 | | | | 659 | | | | 3,221 | | | | 4,370 | | | | 5,259 | | | | 5,641 | |
| | | Deprec. & Amort | | | 1,382 | | | | 740 | | | | 127 | | | | 867 | | | | 800 | | | | 725 | | | | 725 | |
| | | |
| | | |
| | | |
| | | |
| | | |
| | | |
| | | |
| |
| | EBIT | | | 2,361 | | | | 1,822 | | | | 532 | | | | 2,354 | | | | 3,570 | | | | 4,534 | | | | 4,916 | |
| | | Income Taxes | | | 826 | | | | 638 | | | | 186 | | | | 824 | | | | 1,250 | | | | 1,587 | | | | 1,721 | |
| | | |
| | | |
| | | |
| | | |
| | | |
| | | |
| | | |
| |
| | Unlevered After-tax Income | | | 1,535 | | | | 1,184 | | | | 346 | | | | 1,530 | | | | 2,321 | | | | 2,947 | | | | 3,195 | |
| | | Add: Deprec. & Amort | | | 1,382 | | | | 740 | | | | 127 | | | | 867 | | | | 800 | | | | 725 | | | | 725 | |
| | | Add: Change in Net WC | | | (665 | ) | | | 10,623 | | | | (2,870 | ) | | | 7,753 | | | | (3,170 | ) | | | - | | | | 100 | |
| | | Less: Capital Expenditures | | | 304 | | | | 84 | | | | 165 | | | | 249 | | | | 660 | | | | 720 | | | | 792 | |
| | | |
| | | |
| | | |
| | | |
| | | |
| | | |
| | | |
| |
| | Unlevered Free Cash Flows | | $ | 1,948 | | | $ | 12,463 | | | $ | (2,562 | ) | | $ | 9,901 | | | $ | (710 | ) | | $ | 2,952 | | | $ | 3,228 | |
| | | |
| | | |
| | | |
| | | |
| | | |
| | | |
| | | |
| |
| | | | | | | | | | | | | | | | | | | | | | | |
| | | | | | | | | Projected |
| | | | | | | | |
|
| | | | | Actual | | FYE Sep 30 |
| | | | | FYE | |
|
| | | | | Sep-02 | | 2003 | | 2004 | | 2005 | | 2006 |
| | | | |
| |
| |
| |
| |
|
Growth Analysis | | | | | | | | | | | | | | | | | | | | |
| | | | | | | | | | | | | | | | | | | | | |
| | Revenue | | | | | | | | | | | | | | | | | | | | |
| | | Domestic Sales | | na | | | 16.6 | % | | | 1.0 | % | | | 5.0 | % | | | 5.0 | % |
| | | International Sales | | na | | | -60.8 | % | | | -75.7 | % | | | 0.0 | % | | | 0.0 | % |
| | | na | | | -13.6 | % | | | -12.6 | % | | | 4.8 | % | | | 4.8 | % |
| | Cost of Goods Sold | | | | | | | | | | | | | | | | | | | | |
| | | Domestic Sales | | na | | | 16.4 | % | | | 1.0 | % | | | 5.1 | % | | | 5.1 | % |
| | | International Sales | | na | | | -58.5 | % | | | -79.0 | % | | | 0.0 | % | | | 0.0 | % |
| | | na | | | -15.5 | % | | | -15.8 | % | | | 4.8 | % | | | 4.8 | % |
| | Gross Profit | | na | | | -7.6 | % | | | -3.8 | % | | | 4.7 | % | | | 4.7 | % |
| | Operating Expenses | | na | | | -5.9 | % | | | -14.0 | % | | | -1.7 | % | | | 3.4 | % |
| | EBITDA | | na | | | -13.9 | % | | | 35.7 | % | | | 20.3 | % | | | 7.3 | % |
| | | Deprec. & Amort | | na | | | -37.3 | % | | | -7.7 | % | | | -9.4 | % | | | 0.0 | % |
| | EBIT | | na | | | -0.3 | % | | | 51.7 | % | | | 27.0 | % | | | 8.4 | % |
| | | Income Taxes | | na | | | -0.3 | % | | | 51.7 | % | | | 27.0 | % | | | 8.4 | % |
| | Unlevered After-tax Income | | na | | | -0.3 | % | | | 51.7 | % | | | 27.0 | % | | | 8.4 | % |
| | | Add: Deprec. & Amort | | na | | | -37.3 | % | | | -7.7 | % | | | -9.4 | % | | | 0.0 | % |
| | | Add: Change in Net WC | | na | | na | | | -140.9 | % | | na | | na |
| | | Less: Capital Expenditures | | na | | | -18.1 | % | | | 165.1 | % | | | 9.1 | % | | | 10.0 | % |
| | Unlevered Free Cash Flows | | na | | | 408.4 | % | | | -107.2 | % | | na | | | 9.4 | % |
| | | | | | | | | | | | | | | | | | | | | |
Profitability Analysis | | | | | | | | | | | | | | | | | | | | |
|
| | Gross Margin - Domestic | | | 29.7 | % | | | 29.8 | % | | | 29.8 | % | | | 29.8 | % | | | 29.7 | % |
| | Gross Margin - International | | | 18.0 | % | | | 13.2 | % | | | 25.0 | % | | | 25.0 | % | | | 25.0 | % |
| | Gross Margin | | | 25.1 | % | | | 26.9 | % | | | 29.6 | % | | | 29.5 | % | | | 29.5 | % |
| | EBITDA | | | 5.5 | % | | | 5.5 | % | | | 8.6 | % | | | 9.8 | % | | | 10.1 | % |
| | EBIT | | | 3.5 | % | | | 4.0 | % | | | 7.0 | % | | | 8.5 | % | | | 8.8 | % |
| | Unlevered After-tax Income | | | 2.3 | % | | | 2.6 | % | | | 4.5 | % | | | 5.5 | % | | | 5.7 | % |
(1) Operating expenses exclude $1.2 million charge related to write-off of overseas business.
Sources of information: Company financials, projections and management.
Page 54
| | |
| Gencor Industries, Inc. | CONFIDENTIAL |
|
VALUATION ANALYSIS
DISCOUNTED CASH FLOW ANALYSIS
DCF Analysis - Working Capital and Income Tax - Core Business
($ in thousands)
| | | | | | | | | | | | | | | | | | | | | | | | | | | |
| | | | | Actual | | Projected |
| | | | |
| |
|
| | | | | | | | | | | | | | | | | FYE Sep 30 |
| | | | | FYE | | 10 ME (1) | | 2 ME | |
|
| | | | | Sep-02 | | Jul-03 | | Sep-03 | | 2004 | | 2005 | | 2006 |
| | | | |
| |
| |
| |
| |
| |
|
Non-Cash Working Capital Assumptions | | | | | | | | | | | | | | | | | | | | | | | | |
|
| | | AR Days Outstanding | | | 46 | | | na | | | 23 | | | | 26 | | | | 25 | | | | 24 | |
| | | A/R - % Sales | | | 12.6 | % | | na | | | 6.2 | % | | | 7.2 | % | | | 6.9 | % | | | 6.5 | % |
| | | | | | | | | | | | | | | | | | | | | | | | | |
| | | Days Inventory Outs. | | | 137 | | | na | | | 111 | | | | 148 | | | | 141 | | | | 134 | |
| | | Inv - % CGS | | | 37.6 | % | | na | | | 30.5 | % | | | 40.4 | % | | | 38.6 | % | | | 36.8 | % |
| | | | | | | | | | | | | | | | | | | | | | | | | |
| | | Prepay - % CGS & Op Exp | | | 3.0 | % | | na | | | 2.7 | % | | | 3.3 | % | | | 3.2 | % | | | 3.0 | % |
| | | | | | | | | | | | | | | | | | | | | | | | | |
| | | AP Days Outstanding | | | 53 | | | na | | | 20 | | | | 36 | | | | 35 | | | | 34 | |
| | | A/P - % CGS & Op Exp | | | 14.4 | % | | na | | | 5.6 | % | | | 9.9 | % | | | 9.5 | % | | | 9.3 | % |
| | | | | | | | | | | | | | | | | | | | | | | | | |
| | | Acc Exp & Other - % CGS & | | | 21.9 | % | | na | | | 29.9 | % | | | 28.8 | % | | | 27.9 | % | | | 26.7 | % |
| | | | | | | | | | | | | | | | | | | | | | | | | |
Non-Cash Net Working Capital | | | | | | | | | | | | | | | | | | | | | | | | |
| | | | | | | | | | | | | | | | | | | | | | | | | |
| | Accounts Receivable | | $ | 8,512 | | | $ | 3,411 | | | $ | 3,637 | | | $ | 3,667 | | | $ | 3,667 | | | $ | 3,667 | |
| | Inventory | | | 19,012 | | | | 12,031 | | | | 13,031 | | | | 14,531 | | | | 14,531 | | | | 14,531 | |
| | Prepayments | | | 1,938 | | | | 1,396 | | | | 1,462 | | | | 1,533 | | | | 1,533 | | | | 1,533 | |
| | Accounts Payable | | | 9,196 | | | | 3,126 | | | | 3,094 | | | | 4,598 | | | | 4,598 | | | | 4,698 | |
| | Acc Exp & Other | | | 13,979 | | | | 18,048 | | | | 16,502 | | | | 13,429 | | | | 13,429 | | | | 13,429 | |
| | | |
| | | |
| | | |
| | | |
| | | |
| | | |
| |
| | Non-Cash Net WC | | $ | 6,287 | | | $ | (4,336 | ) | | $ | (1,466 | ) | | $ | 1,704 | | | $ | 1,704 | | | $ | 1,604 | |
| | | |
| | | |
| | | |
| | | |
| | | |
| | | |
| |
| | Change in Non-Cash Net WC | | $ | (665 | ) | | $ | 10,623 | | | $ | (2,870 | ) | | $ | (3,170 | ) | | $ | - | | | $ | 100 | |
| | | |
| | | |
| | | |
| | | |
| | | |
| | | |
| |
| | | | | | | | | | | | | | | | | | | | | | | | | | |
| | | | Actual | | Projected |
| | | |
| |
|
| | | | | | | | | | | | | | | | FYE Sep 30 |
| | | | FYE | | 10 ME (1) | | 2 ME | |
|
| | | | Sep-02 | | Jul-03 | | Sep-03 | | 2004 | | 2005 | | 2006 |
| | | |
| |
| |
| |
| |
| |
|
Income Tax Expense and Assumptions | | | | | | | | | | | | | | | | | | | | | | | | |
|
| | Statutory Tax Rate | | | 35.0 | % | | | 35.0 | % | | | 35.0 | % | | | 35.0 | % | | | 35.0 | % | | | 35.0 | % |
| | Effective Tax Rate | | | 35.0 | % | | | 35.0 | % | | | 35.0 | % | | | 35.0 | % | | | 35.0 | % | | | 35.0 | % |
| | | | | | | | | | | | | | | | | | | | | | | | | |
| | Current Period Tax | | $ | 826 | | | $ | 638 | | | $ | 186 | | | $ | 1,250 | | | $ | 1,587 | | | $ | 1,721 | |
| | NOL Usage | | | - | | | | - | | | | - | | | | - | | | | - | | | | - | |
| | | |
| | | |
| | | |
| | | |
| | | |
| | | |
| |
| | Income Tax Expense | | $ | 826 | | | $ | 638 | | | $ | 186 | | | $ | 1,250 | | | $ | 1,587 | | | $ | 1,721 | |
| | | |
| | | |
| | | |
| | | |
| | | |
| | | |
| |
| | Ending NOL Balance | | | | | | $ | - | | | $ | - | | | $ | - | | | $ | - | | | $ | - | |
| | | | | | | |
| | | |
| | | |
| | | |
| | | |
| |
Sources of information: Company financials, projections and management.
Page 55
| | |
| Gencor Industries, Inc. | CONFIDENTIAL |
|
VALUATION ANALYSIS
DISCOUNTED CASH FLOW ANALYSIS
DCF Analysis - Cost of Capital, Net Debt & Stock Equivalents - Core Business
($ in thousands, except per share)
Cost of Equity
| | | | | | |
| Riskless (1) | | | | |
| | 20 year treasury coupon (Rf) | | | 4.9 | % |
| Risk (2) | | | | |
| | Equity risk premium (EP) | | | 7.0 | % |
| | Industry risk premium (IP) | | | 0.3 | % |
| | Size Premium (SP) | | | 9.2 | % |
| Company Specific | | | | |
| | Business Execution Risk | | | 3.0 | % |
| | | |
| |
| | | | 24.4 | % |
| | | |
| |
Cost of Debt
| | | | | | | | | | | | | | | | | |
| | | Nominal | | | | | | % of | | Weighted |
| Type of Debt | | Rate | | Amount | | of Debt | | Cost of Debt |
| |
| |
| |
| |
|
| Senior Secured Credit | | | 4.00 | % | | $ | 9,852 | | | | 100.0 | % | | | 4.0 | % |
| | | | | | | |
| | | |
| | | |
| |
| | | | | | | $ | 9,852 | | | | 100.0 | % | | | 4.0 | % |
| | | | | | | |
| | | |
| | | |
| |
Weighted Average Cost of Capital
| | | | | | | | | | | | | | | | | | | | | | | | | | | | | | | | | | | | | |
| | | | | | | | | | | | | | | | | | | Industry Avg | | | | | | | | |
| | | Shares Outs. | | Stock Price | | Market | | % of | | % of | | Nominal | | Effective | | Cost of | | Weighted |
| | | (in thousands) | | 03-Oct-03 | | Value | | Total Capital | | Total Capital (3) | | Rate | | Tax Rate | | Capital | | Cost of Capital |
| | |
| |
| |
| |
| |
| |
| |
| |
| |
|
| Debt | | | | | | | | | | $ | 9,852 | | | | 31.7 | % | | | 27.0 | % | | | 4.0 | % | | | 35.0 | % | | | 2.6 | % | | | 0.8 | % |
| Equity | | | 8,682 | | | $ | 2.4500 | | | | 21,271 | | | | 68.3 | % | | | 73.0 | % | | | 24.4 | % | | | | | | | 24.4 | % | | | 16.7 | % |
| | | | | | | | | | | |
| | | |
| | | |
| | | | | | | | | | | | | | | |
| |
| | | | | | | | | | | $ | 31,123 | | | | 100.0 | % | | | 100.0 | % | | | | | | | | | | | | | | | 17.5 | % |
| | | | | | | | | | | |
| | | |
| | | |
| | | | | | | | | | | | | | | |
| |
Net Debt
| | | | | | |
| | | | as of |
| | | | 31-Jul-03 |
| | | |
|
| Debt & Other Obligations | | | | |
| | Interest Bearing Debt | | $ | 9,852 | |
| | Minority Interests | | | - | |
| | Preferred Stock | | | - | |
| | | |
| |
| | | | 9,852 | |
| | | |
| |
| Less Cash | | | | |
| | Cash on Hand | | | 8,485 | |
| | Assumed cash from exercise of options | | | 2,978 | |
| | Assumed cash from Other | | | - | |
| | | |
| |
| | | | 11,463 | |
| | | |
| |
| Net Debt | | $ | (1,611 | ) |
| | | |
| |
Common Stock Equivalents
| | | | | | | | | | | | | | |
| | | | | | | | | | | | as of |
| | | | | | | | | | | | 31-Jul-03 |
| | | | | | | | | | | |
|
| Common Stock Equivalents (in thousands) | | | | | | | | | | | | |
| | Common Stock Outstanding | | | | | | | | | | | 8,682 | |
| | Stock issued re Other | | | | | | | | | | | - | |
| | | | | | | | | | | |
| |
| | | | | | | | | | | | 8,682 | |
| | | | | | | | | | | |
| |
| | | | | | | Proceeds | | | | |
| | Options in the money: | | Common Stock | | $ | 1,658 | | | | 890 | |
| | | Class B | | $ | 1,320 | | | | 636 | |
| | | | | | | | | | | |
| |
| | | | | | | | | | | | 1,526 | |
| | | | | | | | | | | |
| |
| Total Common Stock Equivalents | | | | | | | | | | | 10,208 | |
| | | | | | | | | | | |
| |
(1) As reported by the Federal Reserve Board on a weekly-average basis for the week ended September 22, 2003.
(2) Sourced from the Ibbotson SBBI Valuation Edition 2003 Yearbook.
(3) Based on median debt to total capitalization of SIC code 353 (Construction, Mining, and Materials Handling Machinery and Equipment).
Sources of information: Company financials, projections & management, Ibbotson 2003 SBBI and Federal Reserve Board.
Page 56
| | |
| Gencor Industries, Inc. | CONFIDENTIAL |
|
VALUATION ANALYSIS
SELECTED COMPARABLE COMPANY ANALYSIS
| | • | | The selected comparable company analysis compares the trading multiples of the Company with those of other publicly traded companies that are similar with respect to business and revenue model, operating sector, size and target customer base. |
| | • | | Capitalink located six companies that it deemed comparable to the Company with respect to their industry sector and operating model (the “Comparable Companies”). Only one of the Comparable Companies manufactures road-building equipment as its primary activity. However, all of the Comparable Companies are involved in the manufacture of heavy equipment, used in the road construction, mining, marine sector and are classified under the SIC code 353 (construction, mining, and materials handling machinery and equipment). |
| | • | | Based on size (in terms of enterprise value and revenues), Gencor is in the lower range of the Comparable Companies. As of October 3, 2003, the enterprise values for the Comparable Companies ranged from approximately $10.7 million to approximately $1.9 billion and revenue ranged from approximately $10.9 million to approximately $3.5 billion. In comparison, Gencor had an enterprise value and LTM revenue of approximately $20.6 million and $64.7 million, respectively. |
| | • | | Multiples utilizing market value, and enterprise value were used in the analyses. The differences between the two are as follows: |
| | • | | Market value equals price per share times number of shares outstanding, |
| | • | | Enterprise value equals market value plus interest bearing debt, preferred stock and minority interest, less cash and equivalents. |
| | • | | Market values were used to calculate multiples of earnings per share (“EPS”), common equity, and net tangible common equity, while enterprise values were used to calculate multiples of LTM, current financial year (“CFY”), and next financial year (“NFY”) revenue, and EBITDA, and total assets. |
Page 57
| | |
| Gencor Industries, Inc. | CONFIDENTIAL |
|
VALUATION ANALYSIS
SELECTED COMPARABLE COMPANY ANALYSIS
| | • | | For comparison purposes, all operating profits including EBITDA were normalized to exclude unusual and extra-ordinary expenses and income. Gencor earnings generated by its investment in Carbontronics were also excluded in order to derive an indicated value for the core business operations. |
| | • | | The Comparable Company analysis generated a wide range of multiples: |
| | • | | The mean enterprise value to LTM, CFY and NFY revenue was 0.72, 0.67 and 0.63 times, respectively, for the Comparable Companies and 0.32, 0.37, and 0.40 times, respectively, for the Company. |
| | • | | The mean enterprise value to LTM, CFY and NFY EBITDA was 10.3, 11.0 and 8.1 times, respectively, for the Comparable Companies and 6.3, 7.5, and 4.7 times, respectively, for the Company. |
| | • | | Capitalink noted that the EBITDA margin for the Company was slightly below the average of the Comparable Companies (5.1% compared with 6.8%). In addition, the average change in revenues for the latest financial year for the Comparable Companies was an increase of 15.2%, compared with a fall of 5.1% for the Company. |
| | • | | Capitalink expects Gencor’s valuation multiples to be below the Comparable Company’s due to the smaller size of the Company, revenue concentration, falling historical revenue growth and limited future growth. |
| | • | | Capitalink selected an appropriate multiple range for the Company by examining the range provided by the Comparable Companies and taking into account the Company specific factors as previously discussed. Capitalink then applied this multiple range to Gencor’s LTM, CFY and NFY revenue and EBITDA as follows: |
| | • | | Between 0.35 times and 0.45 times LTM revenue. |
| | • | | Between 0.35 times and 0.45 times CFY revenue. |
| | • | | Between 0.30 times and 0.40 times NFY revenue. |
| | • | | Between 5.0 times and 6.0 times LTM EBITDA. |
| | • | | Between 4.5 times and 5.5 times CFY EBITDA. |
Page 58
| | |
| Gencor Industries, Inc. | CONFIDENTIAL |
|
VALUATION ANALYSIS
SELECTED COMPARABLE COMPANY ANALYSIS
| | • | | Between 4.0 times and 4.5 times NFY EBITDA. |
| | • | | Based on the selected multiple ranges, Capitalink calculated a range of enterprise values between $16.1 million and $20.2 million for the core business. After deducting net debt of $(1.6) million, dividing by approximately 10.2 million shares outstanding (including ITM options), and applying a 5% discount for the limited voting power of the common stock, Capitalink calculated a range of indicated common stock share prices of between $1.65 and $2.03. |
| | • | | An analysis of publicly traded comparable companies is not mathematical; rather it involves complex consideration and judgments concerning differences in financial and operating characteristics of the Comparable Companies and other factors that could affect the public trading of the Comparable Companies. |
Page 59
| | |
| Gencor Industries, Inc. | CONFIDENTIAL |
|
VALUATION ANALYSIS
SELECTED COMPARABLE COMPANY ANALYSIS
Comparable Company Analysis - Indicated Reference Range - Core Business
($ in thousands, except per share)
| | | | | | | | | | | | | | | | | | | | | | |
| | | | | | | | Selected Multiple Range | | | | | | | | | | |
| | | | | | | |
| | | | | | | | | | Indicated Common Stock |
| | | | Statistic | | Low - High | | Indicated EV Value | | Indicated Equity Value (1) | | Share Price (2) (3) |
| | | |
| |
| |
| |
| |
|
Total Enterprise Value (EV) Multiple | | | | | | | | | | | | | | | | | | | | |
| | LTM 7/31/03 Revenue | | $ | 58,950 | | | | 0.35x - 0.45x | | | $ | 20,633 - $26,528 | | | $ | 22,244 - $28,139 | | | $ | 2.07 - $2.62 | |
| | CFY Revenue | | $ | 55,843 | | | | 0.35x - 0.45x | | | $ | 19,545 - $25,129 | | | $ | 21,156 - $26,740 | | | $ | 1.97 - $2.49 | |
| | NFY Revenue | | $ | 51,014 | | | | 0.30x - 0.40x | | | $ | 15,304 - $20,406 | | | $ | 16,915 - $22,017 | | | $ | 1.57 - $2.05 | |
| | LTM 7/31/03 EBITDA | | $ | 2,880 | | | | 5.0x - 6.0x | | | $ | 14,400 - $17,280 | | | $ | 16,011 - $18,891 | | | $ | 1.49 - $1.76 | |
| | CFY EBITDA | | $ | 2,758 | | | | 4.5x - 5.5x | | | $ | 12,411 - $15,169 | | | $ | 14,022 - $16,780 | | | $ | 1.30 - $1.56 | |
| | NFY EBITDA | | $ | 4,370 | | | | 4.0x - 5.0x | | | $ | 17,480 - $21,850 | | | $ | 19,091 - $23,461 | | | $ | 1.78 - $2.18 | |
| | | | | | | | | | | | | | | | | | | | | |
Indicated Reference Range | | | | | | | | | | $ | 16,629 - $21,060 | | | $ | 18,240 - $22,671 | | | $ | 1.70 - $2.11 | |
(1) Adjusted for ($1,611) net debt as of July 31, 2003, which includes cash from in the money options/warrants outstanding.
(2) Based upon and assumes 10,208 shares and in the money options/warrants outstanding.
(3) In order to reflect its limited voting power, a 5% discount has been applied to the common stock.
Page 60
| | |
| Gencor Industries, Inc. | CONFIDENTIAL |
|
VALUATION ANALYSIS
SELECTED COMPARABLE COMPANY ANALYSIS
Comparable Company Analysis - Valuation Multiples - Core Business
($ in thousands, except per share data)
| | | | | | | | | | | | | | | | | | | | | | | | | | | | | | | | | |
| | | | | | | | | | | | | | | | | | | | | | | MV as a Multiple of |
| | | | | | | | | | | % Below/Above | | Market | | Enterprise | |
|
| | | | | | | Stock Price | | 52-week | | Value | | Value | | EPS | | Common | | Net Tang |
| Company | | Ticker | | 3-Oct-03 | | High-Low | | MV | | EV (1) | | LTM | | Equity | | Com Eq |
| |
| |
| |
| |
| |
| |
| |
| |
|
| Terex Corp. | | TEX | | $ | 19.680 | | | | 16.3% - 107.2 | % | | $ | 950,544 | | | $ | 1,996,844 | | | | 109.3 | x | | | 1.2 | x | | | 5.3 | x |
| Manitowoc Company, Inc. | | MTW | | | 22.700 | | | | 35.5% - 35.9 | % | | | 599,666 | | | | 1,236,004 | | | | 22.7 | | | | 2.0 | | | na |
| Joy Global Inc. | | JOYG | | | 17.420 | | | | -6.2% - 127.7 | % | | | 853,563 | | | | 970,021 | | | | 102.5 | | | | 2.3 | | | | 4.7 | |
| Astec Industries, Inc. | | ASTE | | | 10.330 | | | | 18.8% - 98.3 | % | | | 203,491 | | | | 280,372 | | | na | | | 1.1 | | | | 1.3 | |
| Gehl Company | | GEHL | | | 11.370 | | | | 7.0% - 51.4 | % | | | 60,886 | | | | 122,016 | | | | 17.2 | | | | 0.6 | | | | 0.7 | |
| Art’s Way Manufacturing | | ARTW | | | 4.871 | | | | 7.0% - 80.4 | % | | | 9,440 | | | | 10,687 | | | | 9.6 | | | | 2.7 | | | | 2.7 | |
| | | | | | | | | | | | | | | | | | | | | | | | | | | | | | | | | |
| | | | | | | | | | | High | | $ | 950,544 | | | $ | 1,996,844 | | | | 109.3 | x | | | 2.7 | x | | | 5.3 | x |
| | | | | | | | | | | Mean | | | 446,265 | | | | 769,324 | | | | 52.3 | | | | 1.6 | | | | 3.0 | |
| | | | | | | | | | | Median | | | 401,578 | | | | 625,196 | | | | 22.7 | | | | 1.6 | | | | 2.7 | |
| | | | | | | | | | | Low | | | 9,440 | | | | 10,687 | | | | 9.6 | | | | 0.6 | | | | 0.7 | |
| | | | | | | | | | | | | | | | | | | | | | | | | | | | | | | | | |
| Gencor Industries, Inc. | | GNCI | | | 2.450 | | | | 29.0% - 226.7 | % | | $ | 21,271 | | | $ | 20,617 | | | na | | | 1.7 | x | | | 1.7 | x |
[Additional columns below]
[Continued from above table, first column(s) repeated]
| | | | | | | | | | | | | | | | | | | | | | | | | | | | | | | | | | | | | |
| | | EV as a Multiple of | | |
| | |
| | |
| | | Revenue (2) | | | | | | EBITDA (2) | | | | | | 5 Yr EPS |
| | |
| | EBIT | |
| | Total | | Growth |
| Company | | LTM | | Est CFY | | Est NFY | | LTM | | LTM | | Est CFY | | Est NFY | | Assets | | Proj (2) |
| |
| |
| |
| |
| |
| |
| |
| |
| |
|
| Terex Corp. | | | 0.57 | x | | | 0.58 | x | | | 0.56 | x | | | 23.7 | x | | | 14.3 | x | | | 7.7 | x | | | 6.7 | x | | | 0.6 | x | | | 12.0 | % |
| Manitowoc Company, Inc. | | | 0.77 | | | | 0.78 | | | | 0.75 | | | | 12.4 | | | | 8.2 | | | | 9.2 | | | | 8.0 | | | | 0.7 | | | | 10.0 | % |
| Joy Global Inc. | | | 0.87 | | | | 0.84 | | | | 0.77 | | | | 24.0 | | | | 10.4 | | | | 10.3 | | | | 7.7 | | | | 0.7 | | | | 8.0 | % |
| Astec Industries, Inc. | | | 0.60 | | | | 0.63 | | | | 0.58 | | | na | | na | | | 18.9 | | | | 10.3 | | | | 0.8 | | | | 7.0 | % |
| Gehl Company | | | 0.52 | | | | 0.52 | | | | 0.50 | | | | 18.4 | | | | 10.7 | | | | 8.7 | | | | 7.6 | | | | 0.5 | | | | 12.0 | % |
| Art’s Way Manufacturing | | | 0.98 | | | na | | na | | | 9.8 | | | | 7.8 | | | na | | na | | | 1.4 | | | na |
| | | | | | | | | | | | | | | | | | | | | | | | | | | | | | | | | | | | | |
| | | | 0.98 | x | | | 0.84 | x | | | 0.77 | x | | | 24.0 | x | | | 14.3 | x | | | 18.9 | x | | | 10.3 | x | | | 1.4 | x | | | 12.0 | % |
| | | | 0.72 | | | | 0.67 | | | | 0.63 | | | | 17.7 | | | | 10.3 | | | | 11.0 | | | | 8.1 | | | | 0.8 | | | | 9.8 | % |
| | | | 0.69 | | | | 0.63 | | | | 0.58 | | | | 18.4 | | | | 10.4 | | | | 9.2 | | | | 7.7 | | | | 0.7 | | | | 10.0 | % |
| | | | 0.52 | | | | 0.52 | | | | 0.50 | | | | 9.8 | | | | 7.8 | | | | 7.7 | | | | 6.7 | | | | 0.5 | | | | 7.0 | % |
| | | | | | | | | | | | | | | | | | | | | | | | | | | | | | | | | | | | | |
| Gencor Industries, Inc. | | | 0.32 | x | | | 0.37 | x | | | 0.40 | x | | | 8.7 | x | | | 6.3 | x | | | 7.5 | x | | | 4.7 | x | | | 0.4 | x | | na |
(1) Enterprise Value equals Market Value plus total debt, preferred stock, and minority interests, less cash.
(2) Sources of estimates: Multex Estimates and other various securities analysts��� estimates and reports.
Sources of information: SEC Edgar filings, Multex, Capital IQ, Yahoo and Commodity Systems.
Page 61
| | |
| Gencor Industries, Inc. | CONFIDENTIAL |
|
VALUATION ANALYSIS
SELECTED COMPARABLE COMPANY ANALYSIS
Comparable Company Analysis - Margin and Other Analyses - Core Business
($ in thousands)
| | | | | | | | | | | | | | | | | | | | | | | | | | | | | | | | | | | | | | | | | | | | | | | | | | |
| | | | LTM (1) |
| | | |
|
| | | | | | | | as Percentage of Revenue | | Return on | | | | | | | | |
| | | | | | | |
| |
| | Accts | | | | | | Days |
| | | | | | | | Gross | | | | | | Operating | | | | | | | | | | Net | | Average | | Average | | Receivable | | Inventory | | Sales |
| Company | | Revenue | | Margin | | S G & A | | Margin | | EBITDA | | EBIT | | Income | | Assets | | Common Eq | | Turnover | | Turnover | | Outstanding |
| |
| |
| |
| |
| |
| |
| |
| |
| |
| |
| |
| |
|
| Terex Corp. | | $ | 3,484,500 | | | | 12.0 | % | | | 9.7 | % | | | 2.3 | % | | | 4.0 | % | | | 2.4 | % | | | 0.4 | % | | | 0.4 | % | | | 1.8 | % | | | 6.1x | | | | 3.0x | | | | 59.7 | |
| Manitowoc Company, Inc. | | | 1,608,228 | | | | 21.4 | % | | | 15.2 | % | | | 6.1 | % | | | 9.4 | % | | | 6.2 | % | | | 1.7 | % | | | 1.6 | % | | | 8.9 | % | | | 6.5 | | | | 4.7 | | | | 56.2 | |
| Joy Global Inc. | | | 1,111,106 | | | | 23.8 | % | | | 20.3 | % | | | 3.5 | % | | | 8.4 | % | | | 3.6 | % | | | 0.8 | % | | | 0.7 | % | | | 2.4 | % | | | 6.3 | | | | 2.0 | | | | 58.3 | |
| Astec Industries, Inc. | | | 463,446 | | | | 15.1 | % | | | 15.6 | % | | | -2.2 | % | | | 1.5 | % | | | -1.9 | % | | | -1.9 | % | | | -2.2 | % | | | -4.5 | % | | | 8.7 | | | | 3.4 | | | | 42.0 | |
| Gehl Company | | | 232,890 | | | | 20.6 | % | | | 17.7 | % | | | 2.9 | % | | | 4.9 | % | | | 2.8 | % | | | 1.5 | % | | | 1.5 | % | | | 3.6 | % | | | 2.2 | | | | 5.0 | | | | 169.0 | |
| Art’s Way Manufacturing | | | 10,945 | | | | 27.3 | % | | | 17.1 | % | | | 10.2 | % | | | 12.4 | % | | | 10.0 | % | | | 8.8 | % | | | 14.0 | % | | | 29.0 | % | | | 12.3 | | | | 2.1 | | | | 29.6 | |
| | | | | | | | | | | | | | | | | | | | | | | | | | | | | | | | | | | | | | | | | | | | | | | | | |
| | High | | $ | 3,484,500 | | | | 27.3 | % | | | 20.3 | % | | | 10.2 | % | | | 12.4 | % | | | 10.0 | % | | | 8.8 | % | | | 14.0 | % | | | 29.0 | % | | | 12.3x | | | | 5.0x | | | | 169.0 | |
| | Mean | | | 1,151,853 | | | | 20.0 | % | | | 16.0 | % | | | 3.8 | % | | | 6.8 | % | | | 3.9 | % | | | 1.9 | % | | | 2.7 | % | | | 6.9 | % | | | 7.0 | | | | 3.4 | | | | 69.1 | |
| | Median | | | 787,276 | | | | 21.0 | % | | | 16.4 | % | | | 3.2 | % | | | 6.7 | % | | | 3.2 | % | | | 1.2 | % | | | 1.1 | % | | | 3.0 | % | | | 6.4 | | | | 3.2 | | | | 57.3 | |
| | Low | | | 10,945 | | | | 12.0 | % | | | 9.7 | % | | | -2.2 | % | | | 1.5 | % | | | -1.9 | % | | | -1.9 | % | | | -2.2 | % | | | -4.5 | % | | | 2.2 | | | | 2.0 | | | | 29.6 | |
| | | | | | | | | | | | | | | | | | | | | | | | | | | | | | | | | | | | | | | | | | | | | | | | | |
| Gencor Industries, Inc. | | $ | 64,651 | | | | 25.2 | % | | | 18.7 | % | | | 3.8 | % | | | 5.1 | % | | | 3.7 | % | | | -0.1 | % | | | -0.2 | % | | | -1.1 | % | | | 10.0x | | | | 2.9x | | | | 36.4 | |
[Additional columns below]
[Continued from above table, first column(s) repeated]
| | | | | | | | | | | | | | | | | | |
| | | | as of Latest Available Filing |
| | | |
|
| | | | | | | | Total Debt | | Total Debt | | Latest FY |
| | | | Current | | to Total | | to | | Revenue |
| Company | | Ratio | | Capitalization | | EBITDA | | Growth |
| |
| |
| |
| |
|
| Terex Corp. | | | 2.0 | | | | 65.3 | % | | | 10.5x | | | | 54.3 | % |
| Manitowoc Company, Inc. | | | 1.4 | | | | 68.4 | % | | | 4.4 | | | | 34.4 | % |
| Joy Global Inc. | | | 1.9 | | | | 37.6 | % | | | 2.4 | | | | 0.2 | % |
| Astec Industries, Inc. | | | 2.5 | | | | 31.5 | % | | | 12.7 | | | | 5.4 | % |
| Gehl Company | | | 2.9 | | | | 40.0 | % | | | 5.8 | | | | -3.3 | % |
| Art’s Way Manufacturing | | | 3.1 | | | | 38.8 | % | | | 1.6 | | | | 0.1 | % |
| | | | | | | | | | | | | | | | | |
| | High | | | 3.1 | | | | 68.4 | % | | | 12.7x | | | | 54.3 | % |
| | Mean | | | 2.3 | | | | 46.9 | % | | | 6.2 | | | | 15.2 | % |
| | Median | | | 2.2 | | | | 39.4 | % | | | 5.1 | | | | 2.8 | % |
| | Low | | | 1.4 | | | | 31.5 | % | | | 1.6 | | | | -3.3 | % |
| | | | | | | | | | | | | | | | | |
| Gencor Industries, Inc. | | | 1.2 | | | | 54.6 | % | | | 4.7x | | | | -5.1 | % |
(1) May exclude special items, such as extraordinary and non-recurring expenses. See individual company overviews for details of exclusions, if any.
Sources of information: SEC Edgar filings, Multex, Capital IQ, Yahoo and Commodity Systems.
Page 62
| | |
| Gencor Industries, Inc. | CONFIDENTIAL |
|
VALUATION ANALYSIS
SELECTED COMPARABLE COMPANY ANALYSIS
Comparable Company Analysis - Income Statement Overview - Core Business
($ in thousands, except per share data)
| | | | | | | | | | | | | | | | | | | | | | | | | | |
| | | | Revenue | | EBITDA (1) | | EBIT (1) |
| | | |
| |
| |
|
| | | | | | | | Latest | | | | | | Latest | | | | | | Latest |
| Company | | LTM | | 10-K | | LTM | | 10-K | | LTM | | 10-K |
| |
| |
| |
| |
| |
| |
|
| Terex Corp. | | $ | 3,484,500 | | | $ | 2,797,400 | | | $ | 139,400 | | | $ | 104,600 | | | $ | 84,300 | | | $ | 64,400 | |
| Manitowoc Company, Inc. | | | 1,608,228 | | | | 1,406,577 | | | | 151,386 | | | | 165,521 | | | | 100,059 | | | | 126,352 | |
| Joy Global Inc. | | | 1,111,106 | | | | 1,150,847 | | | | 93,217 | | | | 43,994 | | | | 40,380 | | | | (15,143 | ) |
| Astec Industries, Inc. | | | 463,446 | | | | 480,589 | | | | 6,961 | | | | 20,205 | | | | (8,976 | ) | | | 4,993 | |
| Gehl Company | | | 232,890 | | | | 232,565 | | | | 11,446 | | | | 9,439 | | | | 6,617 | | | | 4,626 | |
| Art’s Way Manufacturing | | | 10,945 | | | | 10,899 | | | | 1,362 | | | | 995 | | | | 1,092 | | | | 743 | |
| | | | | | | | | | | | | | | | | | | | | | | | | |
| | High | | $ | 3,484,500 | | | $ | 2,797,400 | | | $ | 151,386 | | | $ | 165,521 | | | $ | 100,059 | | | $ | 126,352 | |
| | Mean | | | 1,151,853 | | | | 1,013,146 | | | | 67,295 | | | | 57,459 | | | | 37,245 | | | | 30,995 | |
| | Median | | | 787,276 | | | | 815,718 | | | | 52,332 | | | | 32,100 | | | | 23,499 | | | | 4,810 | |
| | Low | | | 10,945 | | | | 10,899 | | | | 1,362 | | | | 995 | | | | (8,976 | ) | | | (15,143 | ) |
| | | | | | | | | | | | | | | | | | | | | | | | | |
| Gencor Industries, Inc. | | $ | 64,651 | | | $ | 67,485 | | | $ | 3,295 | | | $ | 3,647 | | | $ | 2,381 | | | $ | 2,269 | |
[Additional columns below]
[Continued from above table, first column(s) repeated]
| | | | | | | | | | | | | | | | | | | | | | | | | | |
| | | | Net Income (1) | | EPS (1) | | | | |
| | | |
| |
| | Latest | | Latest |
| | | | | | | | Latest | | | | | | Latest | | Available | | Available |
| Company | | LTM | | 10-K | | LTM | | 10-K | | 10-Q | | 10-K |
| |
| |
| |
| |
| |
| |
|
| Terex Corp. | | $ | 13,728 | | | $ | (14,572 | ) | | $ | 0.18 | | | $ | (0.34 | ) | | 30-Jun-03 | | 31-Dec-02 |
| Manitowoc Company, Inc. | | | 26,587 | | | | 47,260 | | | | 1.00 | | | | 1.88 | | | 30-Jun-03 | | 31-Dec-02 |
| Joy Global Inc. | | | 8,715 | | | | (30,387 | ) | | | 0.17 | | | | (0.61 | ) | | 2-Aug-03 | | 2-Nov-02 |
| Astec Industries, Inc. | | | (8,676 | ) | | | (1,429 | ) | | | (0.44 | ) | | | (0.07 | ) | | 30-Jun-03 | | 31-Dec-02 |
| Gehl Company | | | 3,555 | | | | 1,998 | | | | 0.66 | | | | 0.37 | | | 29-Jun-03 | | 31-Dec-02 |
| Art’s Way Manufacturing | | | 962 | | | | 569 | | | | 0.51 | | | | 0.31 | | | 31-May-03 | | 30-Nov-02 |
| | | | | | | | | | | | | | | | | | | | | | | | | |
| | High | | $ | 26,587 | | | $ | 47,260 | | | $ | 1.00 | | | $ | 1.88 | | | | | | | | | |
| | Mean | | | 7,479 | | | | 573 | | | | 0.35 | | | | 0.26 | | | | | | | | | |
| | Median | | | 6,135 | | | | (430 | ) | | | 0.35 | | | | 0.12 | | | | | | | | | |
| | Low | | | (8,676 | ) | | | (30,387 | ) | | | (0.44 | ) | | | (0.61 | ) | | | | | | | | |
| | | | | | | | | | | | | | | | | | | | | | | | | |
| Gencor Industries, Inc. | | $ | (95 | ) | | $ | 177 | | | $ | (0.01 | ) | | $ | 0.02 | | | 30-Jun-03 | | 30-Sep-02 |
(1) May exclude special items, such as extraordinary and non-recurring expenses. See individual company overviews for details of exclusions, if any.
Sources of information: SEC Edgar filings, Multex, Capital IQ, Yahoo and Commodity Systems.
Page 63
| | |
| Gencor Industries, Inc. | CONFIDENTIAL |
|
VALUATION ANALYSIS
SELECTED COMPARABLE COMPANY ANALYSIS
Comparable Company Analysis - Balance Sheet Overview - Core Business
($ in thousands)
| | | | | | | | | | | | | | | | | | | | | | | | | | |
| | | | As of Latest Available Filing |
| | | |
|
| | | | Cash & | | Accounts | | | | | | Total Current | | | | | | Intangibles, |
| Company | | Mrkt Sec | | Receivables | | Inventory | | Assets | | PPE, net | | net |
| |
| |
| |
| |
| |
| |
|
| Terex Corp. | | $ | 420,400 | | | $ | 561,100 | | | $ | 955,200 | | | $ | 2,174,000 | | | $ | 313,900 | | | $ | 601,100 | |
| Manitowoc Company, Inc. | | | 26,574 | | | | 269,327 | | | | 282,419 | | | | 731,244 | | | | 314,293 | | | | 520,771 | |
| Joy Global Inc. | | | 103,474 | | | | 183,687 | | | | 432,209 | | | | 755,502 | | | | 225,420 | | | | 184,401 | |
| Astec Industries, Inc. | | | 11,280 | | | | 57,609 | | | | 113,740 | | | | 205,833 | | | | 115,357 | | | | 36,093 | |
| Gehl Company | | | 4,742 | | | | 118,098 | | | | 36,550 | | | | 176,162 | | | | 45,056 | | | | 11,748 | |
| Art’s Way Manufacturing | | | 980 | | | | 1,183 | | | | 4,155 | | | | 6,389 | | | | 835 | | | | - | |
| | | | | | | | | | | | | | | | | | | | | | | | | |
| | High | | $ | 420,400 | | | $ | 561,100 | | | $ | 955,200 | | | $ | 2,174,000 | | | $ | 314,293 | | | $ | 601,100 | |
| | Mean | | | 94,575 | | | | 198,501 | | | | 304,046 | | | | 674,855 | | | | 169,144 | | | | 225,686 | |
| | Median | | | 18,927 | | | | 150,893 | | | | 198,080 | | | | 468,539 | | | | 170,389 | | | | 110,247 | |
| | Low | | | 980 | | | | 1,183 | | | | 4,155 | | | | 6,389 | | | | 835 | | | | - | |
| | | | | | | | | | | | | | | | | | | | | | | | | |
| Gencor Industries, Inc. | | $ | 16,113 | | | $ | 4,390 | | | $ | 14,156 | | | $ | 35,774 | | | $ | 15,131 | | | $ | 364 | |
[Additional columns below]
[Continued from above table, first column(s) repeated]
| | | | | | | | | | | | | | | | | | | | | | | | | | |
| | | | As of Latest Available Filing | | |
| | | |
| | Latest |
| | | | Total | | Total Current | | Total | | Total | | Net Tangible | | Available |
| Company | | Assets | | Liabilities | | Debt | | Common Eq | | Common Eq | | Filing |
| |
| |
| |
| |
| |
| |
|
| Terex Corp. | | $ | 3,570,700 | | | $ | 1,093,600 | | | $ | 1,466,700 | | | $ | 779,000 | | | $ | 177,900 | | | 30-Jun-03 |
| Manitowoc Company, Inc. | | | 1,651,982 | | | | 534,547 | | | | 662,912 | | | | 305,560 | | | | (215,211 | ) | | 30-Jun-03 |
| Joy Global Inc. | | | 1,302,705 | | | | 404,392 | | | | 219,932 | | | | 365,114 | | | | 180,713 | | | 2-Aug-03 |
| Astec Industries, Inc. | | | 363,530 | | | | 82,381 | | | | 88,161 | | | | 191,905 | | | | 155,812 | | | 30-Jun-03 |
| Gehl Company | | | 248,003 | | | | 60,716 | | | | 65,872 | | | | 98,679 | | | | 86,931 | | | 29-Jun-03 |
| Art’s Way Manufacturing | | | 7,866 | | | | 2,092 | | | | 2,227 | | | | 3,509 | | | | 3,509 | | | 31-May-03 |
| | | | | | | | | | | | | | | | | | | | | | | | | |
| | High | | $ | 3,570,700 | | | $ | 1,093,600 | | | $ | 1,466,700 | | | $ | 779,000 | | | $ | 180,713 | | | | | |
| | Mean | | | 1,190,798 | | | | 362,955 | | | | 417,634 | | | | 290,628 | | | | 64,942 | | | | | |
| | Median | | | 833,118 | | | | 243,387 | | | | 154,047 | | | | 248,733 | | | | 121,372 | | | | | |
| | Low | | | 7,866 | | | | 2,092 | | | | 2,227 | | | | 3,509 | | | | (215,211 | ) | | | | |
| | | | | | | | | | | | | | | | | | | | | | | | | |
| Gencor Industries, Inc. | | $ | 55,561 | | | $ | 29,379 | | | $ | 15,459 | | | $ | 12,853 | | | $ | 12,489 | | | 30-Jun-03 |
Sources of information: SEC Edgar filings, Multex, Capital IQ, Yahoo and Commodity Systems.
Page 64
\
| | | |
| Gencor Industries, Inc. | | CONFIDENTIAL |
|
VALUATION ANALYSIS
SELECTED COMPARABLE COMPANY ANALYSIS
| | | |
| Terex Corp. Overview | | ($ in thousands, except per share) |
Company Information
| | | | | | | |
| Name | | Terex Corp. | | Address | | 500 Post Road East, Suite 320 |
| Symbol | | TEX | | City, State Zip | | Westport, CT 06880 |
| Latest Fiscal YE | 31-Dec-02 | | Telephone | | (203) 222-7170 |
| Latest Rprt Per | 30-Jun-03 | | Website | | http://www.terex.com/ |
Market Information
| | | | | | | | | | | | | | |
As of Date | | 3-Oct-03 | | Market Cap | | $ | 950,544 | |
| | Exchange | | NYSE | | Total Invested Capital (TIC) | | $ | 2,417,244 | |
| | Stock Price | | $ | 19.68 | | | Enterprise Value (EV) | | $ | 1,996,844 | |
| | 52 Week High | | $ | 23.50 | | | | | | | | | |
| | 52 Week Low | | $ | 9.50 | | | Insider Ownership | | | 9.00 | % |
| | Avg. Daily Volume (000’s) | | | 282 | | | Institutional | | | | |
| | Beta | | | 1.13 | | | % Owned | | | 84.00 | % |
| | Shares Outstanding (000’s) | | | 48,300 | | | Number of Institutions | | | | |
Valuation Analysis
| | | | | | | | | | | | | | |
| | | | Multiple of |
| | | |
|
| | | | Market Cap | | TIC | | EV |
| | | |
| |
| |
|
Latest Twelve Months | | | | | | | | | | | | |
| | Revenue | | | 0.27x | | | | 0.69x | | | | 0.57x | |
| | EBIT | | | 11.3x | | | | 28.7x | | | | 23.7x | |
| | EBITDA | | | 6.8x | | | | 17.3x | | | | 14.3x | |
| | Normalized Net Income | | | 69.2x | | | | 176.1x | | | | 145.5x | |
| | Basic Normalized EPS | | | 109.3x | | | na | | na |
Projected | | | | | | | | | | | | |
| | Dec-03 Mean Revenue | | | 0.28x | | | | 0.71x | | | | 0.58x | |
| | Dec-04 Mean Revenue | | | 0.27x | | | | 0.68x | | | | 0.56x | |
| | Dec-03 Mean EBITDA | | | 3.7x | | | | 9.4x | | | | 7.7x | |
| | Dec-04 Mean EBITDA | | | 3.2x | | | | 8.1x | | | | 6.7x | |
| | Dec-03 Mean EPS | | | 14.3x | | | na | | na |
| | Dec-04 Mean EPS | | | 9.9x | | | na | | na |
Most Recent Filing | | | | | | | | | | | | |
| | Assets | | | 0.3x | | | | 0.7x | | | | 0.6x | |
| | Common Equity | | | 1.2x | | | na | | na |
| | Tangible Common Equity | | | 5.3x | | | na | | na |
Mean Consensus Estimates
| | | | | | | | | | | | | | | | | |
| Year Ending | | # Ests | | Revenue | | EBITDA | | EPS |
| |
| |
| |
| |
|
| December-03 | | | 6 | | | $ | 3,420,800 | | | $ | 257,900 | | | $ | 1.38 | |
| December-04 | | | 5 | | | $ | 3,572,700 | | | $ | 297,600 | | | $ | 1.98 | |
| LT Growth | | | 4 | | | na | | na | | | 12.00 | % |
|
Income and Cashflow Statement Data
| | | | | | | | | | | | | | | | | | | | | | | | |
| | | | | | | | | | Six Months Ended | | Fiscal Years Ended |
| | | | | | LTM | |
| |
|
| | | | | | Jun-03 | | Jun-03 | | Jun-02 | | Dec-02 | | Dec-01 |
| | | | | |
| |
| |
| |
| |
|
Revenue | | $ | 3,484,500 | | | $ | 1,886,700 | | | $ | 1,199,600 | | | $ | 2,797,400 | | | $ | 1,812,500 | |
| | Cost of Revenue | | | 3,065,700 | | | | 1,618,400 | | | | 993,400 | | | | 2,440,700 | | | | 1,540,100 | |
| | | |
| | | |
| | | |
| | | |
| | | |
| |
| | | | Gross Profit | | | 418,800 | | | | 268,300 | | | | 206,200 | | | | 356,700 | | | | 272,400 | |
| | Selling, General & Administrative | | | 339,600 | | | | 177,600 | | | | 126,100 | | | | 288,100 | | | | 168,200 | |
| | Other Operating | | | - | | | | - | | | | - | | | | - | | | | - | |
| | | |
| | | |
| | | |
| | | |
| | | |
| |
| | | | Operating Income | | | 79,200 | | | | 90,700 | | | | 80,100 | | | | 68,600 | | | | 104,200 | |
| | Interest Income / (Expense), net | | | (92,500 | ) | | | (48,200 | ) | | | (41,100 | ) | | | (85,400 | ) | | | (79,000 | ) |
| | Other Income / (Expense), net | | | 5,100 | | | | (2,700 | ) | | | (12,000 | ) | | | (4,200 | ) | | | 3,200 | |
| | | |
| | | |
| | | |
| | | |
| | | |
| |
| | | | Pre-tax Income | | | (8,200 | ) | | | 39,800 | | | | 27,000 | | | | (21,000 | ) | | | 28,400 | |
| | Taxes | | | (21,928 | ) | | | (6,800 | ) | | | 8,700 | | | | (6,428 | ) | | | 9,382 | |
| | | |
| | | |
| | | |
| | | |
| | | |
| |
| | | | After-tax Income | | | 13,728 | | | | 46,600 | | | | 18,300 | | | | (14,572 | ) | | | 19,018 | |
| | Minority Interest | | | - | | | | - | | | | - | | | | - | | | | - | |
| | Equity in Affiliates | | | - | | | | - | | | | - | | | | - | | | | - | |
| | | |
| | | |
| | | |
| | | |
| | | |
| |
| | | | Normalized Net Income | | | 13,728 | | | | 46,600 | | | | 18,300 | | | | (14,572 | ) | | | 19,018 | |
| | Preferred Dividends | | | - | | | | - | | | | - | | | | - | | | | - | |
| | | |
| | | |
| | | |
| | | |
| | | |
| |
| | | Normalized Net Income to Common | | $ | 13,728 | | | $ | 46,600 | | | $ | 18,300 | | | $ | (14,572 | ) | | $ | 19,018 | |
| | | |
| | | |
| | | |
| | | |
| | | |
| |
| | | | Normalized EBIT | | $ | 84,300 | | | $ | 88,000 | | | $ | 68,100 | | | $ | 64,400 | | | $ | 107,400 | |
| Depreciation & Amortization | | $ | 55,100 | | | $ | 33,400 | | | $ | 18,500 | | | $ | 40,200 | | | $ | 36,500 | |
| | | | Normalized EBITDA | | $ | 139,400 | | | $ | 121,400 | | | $ | 86,600 | | | $ | 104,600 | | | $ | 143,900 | |
| | | | CAPEX | | $ | 33,200 | | | $ | 14,100 | | | $ | 10,100 | | | $ | 29,200 | | | $ | 13,500 | |
| | | | EBITDA - CAPEX | | $ | 106,200 | | | $ | 107,300 | | | $ | 76,500 | | | $ | 75,400 | | | $ | 130,400 | |
| GAAP Operating Cash Flow | | $ | 246,100 | | | $ | 184,400 | | | $ | 8,600 | | | $ | 70,300 | | | $ | (5,500 | ) |
| Basic Reported Weighted Avg Shares Out (000’s) | | | | | | | 48,000 | | | | 40,400 | | | | 43,200 | | | | 28,100 | |
| | | | Basic Normalized EPS | | $ | 0.18 | | | $ | 0.97 | | | $ | 0.45 | | | $ | (0.34 | ) | | $ | 0.68 | |
| | | | Basic Reported EPS | | $ | (1.31 | ) | | $ | (0.76 | ) | | $ | (2.52 | ) | | $ | (3.07 | ) | | $ | 0.46 | |
| Diluted Reported Weighted Avg Shares Out (000’s) | | | | | | | 48,000 | | | | 41,200 | | | | 43,200 | | | | 28,900 | |
Diluted Normalized EPS | | $ | 0.19 | | | $ | 0.97 | | | $ | 0.44 | | | $ | (0.34 | ) | | $ | 0.66 | |
| | | | Diluted Reported EPS | | $ | (1.35 | ) | | $ | (0.76 | ) | | $ | (2.48 | ) | | $ | (3.07 | ) | | $ | 0.44 | |
| | | | | | | | | | | | | | | | | | | | | |
|
Normalized Reconciliation
|
|
| | Restructuring/Goodwill Impairment | | $ | (51,300 | ) | | $ | (51,300 | ) | | $ | - | | | $ | - | | | $ | - | |
| | Other Unusual (Expense) Gain Items | | | (38,000 | ) | | | (33,200 | ) | | | - | | | | (4,800 | ) | | | (3,800 | ) |
| | Tax Shelter (Charge) on Unusual Items | | | 1,872 | | | | - | | | | - | | | | 1,872 | | | | 1,482 | |
| | | |
| | | |
| | | |
| | | |
| | | |
| |
| | Unusual (Exp) Gain Items, net of Taxes | | | (87,428 | ) | | | (84,500 | ) | | | - | | | | (2,928 | ) | | | (2,318 | ) |
| | Accounting Changes, net of Taxes | | | - | | | | - | | | | (113,400 | ) | | | (113,400 | ) | | | - | |
| | Discontinued Operations, net of Taxes | | | 8,200 | | | | 1,300 | | | | (6,900 | ) | | | - | | | | - | |
| | Extraordinary Items, net of Taxes | | | (1,600 | ) | | | - | | | | - | | | | (1,600 | ) | | | (3,900 | ) |
| | | |
| | | |
| | | |
| | | |
| | | |
| |
| | Total Reconciling Items, net of Taxes | | $ | (80,828 | ) | | $ | (83,200 | ) | | $ | (120,300 | ) | | $ | (117,928 | ) | | $ | (6,218 | ) |
| | | |
| | | |
| | | |
| | | |
| | | |
| |
| | | Reported Income Tax (Benefit) | | $ | (23,800 | ) | | $ | (6,800 | ) | | $ | 8,700 | | | $ | (8,300 | ) | | $ | 7,900 | |
| | | Reported Net Income (Loss) | | $ | (67,100 | ) | | $ | (36,600 | ) | | $ | (102,000 | ) | | $ | (132,500 | ) | | $ | 12,800 | |
|
Revenue Breakdown
|
|
| | Road Construction Equipment | | $ | 881,600 | | | $ | 392,600 | | | $ | 356,200 | | | $ | 845,200 | | | $ | 631,700 | |
| | Other Heavy Construction | | | 2,271,100 | | | | 1,211,800 | | | | 865,700 | | | | 1,925,000 | | | | 1,231,600 | |
| | Other | | | 331,800 | | | | 282,300 | | | | (22,300 | ) | | | 27,200 | | | | (50,800 | ) |
| | | |
| | | |
| | | |
| | | |
| | | |
| |
| | | $ | 3,484,500 | | | $ | 1,886,700 | | | $ | 1,199,600 | | | $ | 2,797,400 | | | $ | 1,812,500 | |
| | | |
| | | |
| | | |
| | | |
| | | |
| |
| | Road Construction Equipment | | | 25.3 | % | | | 20.8 | % | | | 29.7 | % | | | 30.2 | % | | | 34.9 | % |
| | Other Heavy Construction | | | 65.2 | % | | | 64.2 | % | | | 72.2 | % | | | 68.8 | % | | | 68.0 | % |
| | Other | | | 9.5 | % | | | 15.0 | % | | | -1.9 | % | | | 1.0 | % | | | -2.8 | % |
|
Sources of information: SEC Edgar filings, Multex, Capital IQ, Yahoo and Commodity Systems.
Page 65
| | | |
| Gencor Industries, Inc. | | CONFIDENTIAL |
|
VALUATION ANALYSIS
SELECTED COMPARABLE COMPANY ANALYSIS
| | | |
| Terex Corp. Overview (continued) | | ($ in thousands, except per share) |
Balance Sheet Data
| | | | | | | | | | | | | | | |
| | | | | Jun-03 | | Dec-02 | | Dec-01 |
| | | | |
| |
| |
|
| | Cash & Mkt Securities | | $ | 420,400 | | | $ | 352,200 | | | $ | 250,400 | |
| | Accounts Receivable | | | 561,100 | | | | 578,600 | | | | 351,100 | |
| | Inventory | | | 955,200 | | | | 1,106,300 | | | | 704,800 | |
| | Other Current Assets | | | 237,300 | | | | 184,000 | | | | 76,700 | |
| | | |
| | | |
| | | |
| |
| | | Total Current Assets | | | 2,174,000 | | | | 2,221,100 | | | | 1,383,000 | |
| | PPE, net | | | 313,900 | | | | 309,400 | | | | 173,900 | |
| | Intangibles, net | | | 601,100 | | | | 622,900 | | | | 620,100 | |
| | Deferred Income Taxes | | na | | | 153,500 | | | | 75,400 | |
| | Other Assets | | | 481,700 | | | | 318,800 | | | | 134,600 | |
| | | |
| | | |
| | | |
| |
| | | Total Assets | | $ | 3,570,700 | | | $ | 3,625,700 | | | $ | 2,387,000 | |
| | | |
| | | |
| | | |
| |
| | Accounts Payable | | $ | 577,600 | | | $ | 542,900 | | | $ | 291,000 | |
| | Accrued Expenses | | | 165,100 | | | | 160,000 | | | | 100,100 | |
| | Deferred Revenues | | | - | | | | - | | | | - | |
| | Short Term Debt | | | 69,700 | | | | 74,100 | | | | 34,700 | |
| | Short Term Capital Leases | | | - | | | | - | | | | - | |
| | Other Current Liabilities | | | 281,200 | | | | 329,200 | | | | 201,300 | |
| | | |
| | | |
| | | |
| |
| | | Total Current Liabilities | | | 1,093,600 | | | | 1,106,200 | | | | 627,100 | |
| | Other LT Liabilities | | | 301,100 | | | | 263,200 | | | | 143,800 | |
| | Long Term Debt | | | 1,397,000 | | | | 1,487,100 | | | | 1,020,700 | |
| | Long Term Capital Leases | | | - | | | | - | | | | - | |
| | Minority Interests | | | - | | | | - | | | | - | |
| | Pref Stock (Liq Value) | | | - | | | | - | | | | - | |
| | | |
| �� | | |
| | | |
| |
| | | Total Liabilities & Pref Stock | | | 2,791,700 | | | | 2,856,500 | | | | 1,791,600 | |
| | | |
| | | |
| | | |
| |
| | Common Equity | | | 779,000 | | | | 769,200 | | | | 595,400 | |
| | | |
| | | |
| | | |
| |
| | | Total Liabilities & Equity | | $ | 3,570,700 | | | $ | 3,625,700 | | | $ | 2,387,000 | |
| | | |
| | | |
| | | |
| |
| | Common Shares Outstanding (000’s) | | | 48,200 | | | | 47,400 | | | | 36,400 | |
| | Cash Value per share | | $ | 8.72 | | | $ | 7.43 | | | $ | 6.88 | |
| | Common Book Value per share | | $ | 16.16 | | | $ | 16.23 | | | $ | 16.36 | |
| | Common Tangible Book Value per share | | $ | 3.69 | | | $ | 3.09 | | | $ | (0.68 | ) |
| | Total Debt | | $ | 1,466,700 | | | $ | 1,561,200 | | | $ | 1,055,400 | |
| | Net Debt | | $ | 1,046,300 | | | $ | 1,209,000 | | | $ | 805,000 | |
| | Total Capitalization | | $ | 2,245,700 | | | $ | 2,330,400 | | | $ | 1,650,800 | |
|
Balance Sheet Analysis
|
|
Effectiveness and Efficiency | | | | | | | | | | | | |
| | A/R Turnover | | | 6.1x | | | | 6.0x | | | | 5.2x | |
| | Inventory Turnover | | | 3.0x | | | | 2.7x | | | | 2.2x | |
| | Asset Turnover | | | 1.0x | | | | 0.9x | | | | 0.8x | |
| | Days Sales Outstanding | | | 59.7 | | | | 60.7 | | | | 70.7 | |
| | Days Inventory Outstanding | | | 122.7 | | | | 135.4 | | | | 167.0 | |
| | Days Payable Outstanding | | | 60.1 | | | | 55.8 | | | | 62.2 | |
| | Normalized Return on Avg Assets | | | 0.4 | % | | | -0.5 | % | | | na | |
| | Normalized Return on Avg Common Equity | | | 1.8 | % | | | -2.1 | % | | | na | |
Financial Strength | | | | | | | | | | | | |
| | Current Ratio | | | 2.0 | | | | 2.0 | | | | 2.2 | |
| | Quick Ratio | | | 1.1 | | | | 1.0 | | | | 1.1 | |
| | Total Debt/Total Capitalization | | | 65.3 | % | | | 67.0 | % | | | 63.9 | % |
| | Total Debt/TIC | | | 60.7 | % | | | 64.6 | % | | | 43.7 | % |
| | Total Debt/EBITDA | | | 10.5x | | | | 14.9x | | | | 7.3x | |
| | Total Debt/EBITDA-CAPEX | | | 13.8x | | | | 20.7x | | | | 8.1x | |
| | EBITDA/Interest Expense | | | 1.5x | | | | 1.2x | | | | 1.8x | |
| | EBITDA-CAPEX/Interest Expense | | | 1.1x | | | | 0.9x | | | | 1.7x | |
Income and Cashflow Analysis
| | | | | | | | | | | | | | | | | | | | | | |
| | | | | | | | Six Months Ended | | Fiscal Years Ended |
| | | | LTM | |
| |
|
| | | | Jun-03 | | Jun-03 | | Jun-02 | | Dec-02 | | Dec-01 |
| | | |
| |
| |
| |
| |
|
Profitability & Cost Ratios (as % of Revenue) | | | | | | | | | | | | | | | | | | | | |
| | Gross Margin | | | 12.0 | % | | | 14.2 | % | | | 17.2 | % | | | 12.8 | % | | | 15.0 | % |
| | S,G & A | | | 9.7 | % | | | 9.4 | % | | | 10.5 | % | | | 10.3 | % | | | 9.3 | % |
| | Operating Income | | | 2.3 | % | | | 4.8 | % | | | 6.7 | % | | | 2.5 | % | | | 5.7 | % |
| | Pre-Tax | | | -0.2 | % | | | 2.1 | % | | | 2.3 | % | | | -0.8 | % | | | 1.6 | % |
| | EBIT | | | 2.4 | % | | | 4.7 | % | | | 5.7 | % | | | 2.3 | % | | | 5.9 | % |
| | EBITDA | | | 4.0 | % | | | 6.4 | % | | | 7.2 | % | | | 3.7 | % | | | 7.9 | % |
| | Normalized Net Income to Common | | | 0.4 | % | | | 2.5 | % | | | 1.5 | % | | | -0.5 | % | | | 1.0 | % |
| | Reported Net Income | | | -1.9 | % | | | -1.9 | % | | | -8.5 | % | | | -4.7 | % | | | 0.7 | % |
| | CAPEX | | | 1.0 | % | | | 0.7 | % | | | 0.8 | % | | | 1.0 | % | | | 0.7 | % |
Period Growth Rates | | | | | | | | | | | | | | | | | | | | |
| | Revenue | | | | | | | 57.3 | % | | | | | | | 54.3 | % | | | | |
| | EBIT | | | | | | | 29.2 | % | | | | | | | -40.0 | % | | | | |
| | EBITDA | | | | | | | 40.2 | % | | | | | | | -27.3 | % | | | | |
Notes
| • | | Unusual expenses include amortization of debt issuance costs (removed from calculation of EBITDA) |
| |
| • | | Unrealized losses resulted from extraordinary loss on retirement of debt and changes in accounting principles |
| |
| • | | Road construction equipment revenue includes mining revenue (as no breakout available for 6 months) |
| |
| • | | Road construction revenue for 2002 and 2001 year is $562.4 m and $365.5 m, respectively. |
| |
| • | | Normalization for 6 months 2003 include $51.3m goodwill impairment and $30.6 m writeoff on inventory, mostly related to the roadbuilding group. |
| |
| • | | Terex announces roadbuilding revenue down by 25% in the June quarter. |
Other Analysis
Company Description
Terex Corporation is a manufacturer of a range of equipment primarily for the construction, infrastructure and surface mining industries. The Company operates in five business segments: Terex Construction, Terex Cranes, Terex Roadbuilding, Utility Products and Other, Terex Aerial Work Platforms and Terex Mining. The Company’s products are manufactured at plants in the United States, Canada, Europe, Australia, Asia and South America, and are sold primarily through a worldwide distribution network serving the global construction, infrastructure and surface mining markets.
Sources of information: SEC Edgar filings, Multex, Capital IQ, Yahoo and Commodity Systems.
Page 66
| | | |
| Gencor Industries, Inc. | | CONFIDENTIAL |
|
VALUATION ANALYSIS
SELECTED COMPARABLE COMPANY ANALYSIS
| | | |
| Manitowoc Company, Inc. Overview | | ($ in thousands, except per share) |
Company Information
| | | | | | | |
| Name | | Manitowoc Company, Inc. | | Address | | 2400 S. 44 Street |
| Symbol | | MTW | | City, State Zip | | Manitowoc, WI 54221 |
| Latest Fiscal YE | | 31-Dec-02 | | Telephone | | (920) 684-4410 |
| Latest Rprt Per | | 30-Jun-03 | | Website | | http://www.manitowoc.com/ |
Market Information
| | | | | | | | | | | | | | |
As of Date | | 3-Oct-03 | | Market Cap | | $ | 599,666 | |
| | Exchange | | NYSE | | Total Invested Capital (TIC) | | $ | 1,262,578 | |
| | Stock Price | | $ | 22.70 | | | Enterprise Value (EV) | | $ | 1,236,004 | |
| | 52 Week High | | $ | 35.20 | | | | | | | | | |
| | 52 Week Low | | $ | 16.70 | | | Insider Ownership | | | 17.00 | % |
| | Avg. Daily Volume (000’s) | | | 149 | | | Institutional | | | | |
| | Beta | | | 1.14 | | | % Owned | | | 86.00 | % |
| | Shares Outstanding (000’s) | | | 26,417 | | | Number of Institutions | | | 308 | |
Valuation Analysis
| | | | | | | | | | | | | | |
| | | | Multiple of |
| | | |
|
| | | | Market Cap | | TIC | | EV |
| | | |
| |
| |
|
Latest Twelve Months | | | | | | | | | | | | |
| | Revenue | | | 0.37x | | | | 0.79x | | | | 0.77x | |
| | EBIT | | | 5.99x | | | | 12.62x | | | | 12.35x | |
| | EBITDA | | | 3.96x | | | | 8.34x | | | | 8.16x | |
| | Normalized Net Income | | | 22.55x | | | | 47.49x | | | | 46.49x | |
| | Basic Normalized EPS | | | 22.70x | | | na | | na |
Projected | | | | | | | | | | | | |
| | Dec-03 Mean Revenue | | | 0.38x | | | | 0.80x | | | | 0.78x | |
| | Dec-04 Mean Revenue | | | 0.36x | | | | 0.76x | | | | 0.75x | |
| | Dec-03 Mean EBITDA | | | 4.46x | | | | 9.39x | | | | 9.20x | |
| | Dec-04 Mean EBITDA | | | 3.90x | | | | 8.22x | | | | 8.05x | |
| | Dec-03 Mean EPS | | | 28.38x | | | na | | na |
| | Dec-04 Mean EPS | | | 17.13x | | | na | | na |
Most Recent Filing | | | | | | | | | | | | |
| | Assets | | | 0.36x | | | | 0.76x | | | | 0.75x | |
| | Common Equity | | | 1.96x | | | na | | na |
| | Tangible Common Equity | | na | | na | | na |
Mean Consensus Estimates
| | | | | | | | | | | | | | | | | |
| Year Ending | | # Ests | | Revenue | | EBITDA | | EPS |
| |
| |
| |
| |
|
| December-03 | | | 2 | | | $ | 1,585,200 | | | $ | 134,400 | | | $ | 0.80 | |
| December-04 | | | 2 | | | $ | 1,655,000 | | | $ | 153,600 | | | $ | 1.33 | |
| LT Growth | | | 1 | | | na | | na | | | 10.00 | % |
|
Income and Cashflow Statement Data
| | | | | | | | | | | | | | | | | | | | | | | |
| | | | | | | | | Six Months Ended | | Fiscal Years Ended |
| | | | | LTM | |
| |
|
| | | | | Jun-03 | | Jun-03 | | Jun-02 | | Dec-02 | | Dec-01 |
| | | | |
| |
| |
| |
| |
|
Revenue | | $ | 1,608,228 | | | $ | 812,951 | | | $ | 611,300 | | | $ | 1,406,577 | | | $ | 1,046,558 | |
| | Cost of Revenue | | | 1,263,477 | | | | 638,459 | | | | 455,201 | | | | 1,080,219 | | | | 770,194 | |
| | | |
| | | |
| | | |
| | | |
| | | |
| |
| | | Gross Profit | | | 344,751 | | | | 174,492 | | | | 156,099 | | | | 326,358 | | | | 276,364 | |
| | Selling, General & Administrative | | | 243,920 | | | | 131,351 | | | | 87,393 | | | | 199,962 | | | | 147,140 | |
| | Other Operating | | | 2,387 | | | | 1,438 | | | | 1,052 | | | | 2,001 | | | | 11,094 | |
| | | |
| | | |
| | | |
| | | |
| | | |
| |
| | | Operating Income | | | 98,444 | | | | 41,703 | | | | 67,654 | | | | 124,395 | | | | 118,130 | |
| | Interest Income / (Expense), net | | | (59,967 | ) | | | (29,960 | ) | | | (21,956 | ) | | | (51,963 | ) | | | (37,408 | ) |
| | Other Income / (Expense), net | | | 1,615 | | | | 95 | | | | 437 | | | | 1,957 | | | | (1,247 | ) |
| | | |
| | | |
| | | |
| | | |
| | | |
| |
| | | Pre-tax Income | | | 40,092 | | | | 11,838 | | | | 46,135 | | | | 74,389 | | | | 79,475 | |
| | Taxes | | | 13,505 | | | | 4,368 | | | | 17,992 | | | | 27,129 | | | | 30,734 | |
| | | |
| | | |
| | | |
| | | |
| | | |
| |
| | | After-tax Income | | | 26,587 | | | | 7,470 | | | | 28,143 | | | | 47,260 | | | | 48,741 | |
| | Minority Interest | | | - | | | | - | | | | - | | | | - | | | | - | |
| | Equity in Affiliates | | | - | | | | - | | | | - | | | | - | | | | - | |
| | | |
| | | |
| | | |
| | | |
| | | |
| |
| | | Normalized Net Income | | | 26,587 | | | | 7,470 | | | | 28,143 | | | | 47,260 | | | | 48,741 | |
| | Preferred Dividends | | | - | | | | - | | | | - | | | | - | | | | - | |
| | | |
| | | |
| | | |
| | | |
| | | |
| |
| | | Normalized Net Income to Common | | $ | 26,587 | | | $ | 7,470 | | | $ | 28,143 | | | $ | 47,260 | | | $ | 48,741 | |
| | | |
| | | |
| | | |
| | | |
| | | |
| |
| | | Normalized EBIT | | $ | 100,059 | | | $ | 41,798 | | | $ | 68,091 | | | $ | 126,352 | | | $ | 116,883 | |
| Depreciation & Amortization | | $ | 51,327 | | | $ | 26,684 | | | $ | 14,526 | | | $ | 39,169 | | | $ | 34,306 | |
| | | Normalized EBITDA | | $ | 151,386 | | | $ | 68,482 | | | $ | 82,617 | | | $ | 165,521 | | | $ | 151,189 | |
| | | CAPEX | | $ | 31,354 | | | $ | 11,145 | | | $ | 12,787 | | | $ | 32,996 | | | $ | 29,104 | |
| | | EBITDA - CAPEX | | $ | 120,032 | | | $ | 57,337 | | | $ | 69,830 | | | $ | 132,525 | | | $ | 122,085 | |
| GAAP Operating Cash Flow | | $ | 14,033 | | | $ | 23,533 | | | $ | 5,857 | | | $ | (3,643 | ) | | $ | 410 | |
| Basic Reported Weighted Avg Shares Out (000’s) | | | | | | | 26,543 | | | | 24,302 | | | | 25,192 | | | | 24,270 | |
| | | Basic Normalized EPS | | $ | 1.00 | | | $ | 0.28 | | | $ | 1.16 | | | $ | 1.88 | | | $ | 2.01 | |
| | | Basic Reported EPS | | $ | (0.32 | ) | | $ | 0.07 | | | $ | (0.42 | ) | | $ | (0.81 | ) | | $ | 1.88 | |
| Diluted Reported Weighted Avg Shares Out (000’s) | | | | | | | 26,603 | | | | 24,835 | | | | 25,782 | | | | 24,548 | |
Diluted Normalized EPS | | $ | 0.98 | | | $ | 0.28 | | | $ | 1.13 | | | $ | 1.83 | | | $ | 1.99 | |
| | | Diluted Reported EPS | | $ | (0.32 | ) | | $ | 0.07 | | | $ | (0.41 | ) | | $ | (0.80 | ) | | $ | 1.86 | |
|
Normalized Reconciliation
|
|
| | Restructuring/Goodwill Impairment | | $ | (9,078 | ) | | $ | (9,078 | ) | | $ | - | | | $ | - | | | $ | - | |
| | Other Unusual (Expense) Gain Items | | | (7,709 | ) | | | - | | | | (3,900 | ) | | | (11,609 | ) | | | - | |
| | Tax Shelter (Charge) on Unusual Items | | | 6,547 | | | | 3,540 | | | | 1,521 | | | | 4,528 | | | | - | |
| | | |
| | | |
| | | |
| | | |
| | | |
| |
| | Unusual (Exp) Gain Items, net of Taxes | | | (10,240 | ) | | | (5,538 | ) | | | (2,379 | ) | | | (7,081 | ) | | | - | |
| | Accounting Changes, net of Taxes | | | - | | | | - | | | | (36,800 | ) | | | (36,800 | ) | | | | |
| | Discontinued Operations, net of Taxes | | | (24,872 | ) | | | (84 | ) | | | 907 | | | | (23,881 | ) | | | 131 | |
| | Extraordinary Items, net of Taxes | | | - | | | | - | | | | - | | | | - | | | | (3,324 | ) |
| | | |
| | | |
| | | |
| | | |
| | | |
| |
| | Total Reconciling Items, net of Taxes | | $ | (35,112 | ) | | $ | (5,622 | ) | | $ | (38,272 | ) | | $ | (67,762 | ) | | $ | (3,193 | ) |
| | | |
| | | |
| | | |
| | | |
| | | |
| |
| Reported Income Tax (Benefit) | | $ | 6,958 | | | $ | 828 | | | $ | 16,471 | | | $ | 22,601 | | | $ | 30,734 | |
Reported Net Income (Loss) | | $ | (8,525 | ) | | $ | 1,848 | | | $ | (10,129 | ) | | $ | (20,502 | ) | | $ | 45,548 | |
|
Revenue Breakdown
|
|
| | Road Construction Equipment | | $ | - | | | $ | - | | | $ | - | | | $ | - | | | $ | - | |
| | Other Heavy Construction | | | 1,608,228 | | | | 812,951 | | | | 611,300 | | | | 1,406,577 | | | | 1,046,558 | |
| | Other | | | - | | | | - | | | | - | | | | - | | | | - | |
| | | |
| | | |
| | | |
| | | |
| | | |
| |
| | | $ | 1,608,228 | | | $ | 812,951 | | | $ | 611,300 | | | $ | 1,406,577 | | | $ | 1,046,558 | |
| | | |
| | | |
| | | |
| | | |
| | | |
| |
| | Road Construction Equipment | | | 0.0 | % | | | 0.0 | % | | | 0.0 | % | | | 0.0 | % | | | 0.0 | % |
| | Other Heavy Construction | | | 100.0 | % | | | 100.0 | % | | | 100.0 | % | | | 100.0 | % | | | 100.0 | % |
| | Other | | | 0.0 | % | | | 0.0 | % | | | 0.0 | % | | | 0.0 | % | | | 0.0 | % |
|
Sources of information: SEC Edgar filings, Multex, Capital IQ, Yahoo and Commodity Systems.
Page 67
| | | |
| Gencor Industries, Inc. | | CONFIDENTIAL |
|
VALUATION ANALYSIS
SELECTED COMPARABLE COMPANY ANALYSIS
| | | |
| Manitowoc Company, Inc. Overview (continued) | | ($ in thousands, except per share) |
Balance Sheet Data
| | | | | | | | | | | | | | | |
| | | | | Jun-03 | | Dec-02 | | Dec-01 |
| | | | |
| |
| |
|
| | Cash & Mkt Securities | | $ | 26,574 | | | $ | 30,406 | | | $ | 25,732 | |
| | Accounts Receivable | | | 269,327 | | | | 226,091 | | | | 141,211 | |
| | Inventory | | | 282,419 | | | | 255,218 | | | | 123,056 | |
| | Other Current Assets | | | 152,924 | | | | 135,449 | | | | 41,091 | |
| | | |
| | | |
| | | |
| |
| | | Total Current Assets | | | 731,244 | | | | 647,164 | | | | 331,090 | |
| | PPE, net | | | 314,293 | | | | 319,301 | | | | 175,384 | |
| | Intangibles, net | | | 520,771 | | | | 507,637 | | | | 507,739 | |
| | Deferred Income Taxes | | | 19,637 | | | | 19,662 | | | | - | |
| | Other Assets | | | 66,037 | | | | 83,359 | | | | 66,599 | |
| | | |
| | | |
| | | |
| |
| | | Total Assets | | $ | 1,651,982 | | | $ | 1,577,123 | | | $ | 1,080,812 | |
| | | |
| | | |
| | | |
| |
| | Accounts Payable | | $ | 427,365 | | | $ | 386,490 | | | $ | 236,131 | |
| | Accrued Expenses | | | - | | | | - | | | | - | |
| | Deferred Revenues | | | - | | | | - | | | | - | |
| | Short Term Debt | | | 40,016 | | | | 42,632 | | | | 42,048 | |
| | Short Term Capital Leases | | | - | | | | - | | | | - | |
| | Other Current Liabilities | | | 67,166 | | | | 31,276 | | | | 17,982 | |
| | | |
| | | |
| | | |
| |
| | | Total Current Liabilities | | | 534,547 | | | | 460,398 | | | | 296,161 | |
| | Other LT Liabilities | | | 188,979 | | | | 198,063 | | | | 74,334 | |
| | Long Term Debt | | | 622,896 | | | | 623,547 | | | | 446,522 | |
| | Long Term Capital Leases | | | - | | | | - | | | | - | |
| | Minority Interests | | | - | | | | - | | | | - | |
| | Pref Stock (Liq Value) | | | - | | | | - | | | | - | |
| | | |
| | | |
| | | |
| |
| | | Total Liabilities & Pref Stock | | | 1,346,422 | | | | 1,282,008 | | | | 817,017 | |
| | | |
| | | |
| | | |
| |
| | Common Equity | | | 305,560 | | | | 295,115 | | | | 263,795 | |
| | | |
| | | |
| | | |
| |
| | | Total Liabilities & Equity | | $ | 1,651,982 | | | $ | 1,577,123 | | | $ | 1,080,812 | |
| | | |
| | | |
| | | |
| |
| | Common Shares Outstanding (000’s) | | | 26,417 | | | | 26,412 | | | | 24,053 | |
| | Cash Value per share | | $ | 1.01 | | | $ | 1.15 | | | $ | 1.07 | |
| | Common Book Value per share | | $ | 11.57 | | | $ | 11.17 | | | $ | 10.97 | |
| | Common Tangible Book Value per share | | $ | (8.15 | ) | | $ | (8.05 | ) | | $ | (10.14 | ) |
| | Total Debt | | $ | 662,912 | | | $ | 666,179 | | | $ | 488,570 | |
| | Net Debt | | $ | 636,338 | | | $ | 635,773 | | | $ | 462,838 | |
| | Total Capitalization | | $ | 968,472 | | | $ | 961,294 | | | $ | 752,365 | |
|
Balance Sheet Analysis
|
|
Effectiveness and Efficiency | | | | | | | | | | | | |
| | A/R Turnover | | | 6.5x | | | | 7.7x | | | | 7.4x | |
| | Inventory Turnover | | | 4.7x | | | | 5.7x | | | | 6.3x | |
| | Asset Turnover | | | 1.0x | | | | 1.1x | | | | 1.0x | |
| | Days Sales Outstanding | | | 56.2 | | | | 47.7 | | | | 49.2 | |
| | Days Inventory Outstanding | | | 77.7 | | | | 63.9 | | | | 58.3 | |
| | Days Payable Outstanding | | | 98.4 | | | | 88.6 | | | | 92.8 | |
| | Normalized Return on Avg Assets | | | 1.6 | % | | | 3.6 | % | | | na | |
| | Normalized Return on Avg Common Equity | | | 8.9 | % | | | 16.9 | % | | | na | |
Financial Strength | | | | | | | | | | | | |
| | Current Ratio | | | 1.4 | | | | 1.4 | | | | 1.1 | |
| | Quick Ratio | | | 0.8 | | | | 0.9 | | | | 0.7 | |
| | Total Debt/Total Capitalization | | | 68.4 | % | | | 69.3 | % | | | 64.9 | % |
| | Total Debt/TIC | | | 52.5 | % | | | 52.8 | % | | | 38.7 | % |
| | Total Debt/EBITDA | | | 4.4x | | | | 4.0x | | | | 3.2x | |
| | Total Debt/EBITDA-CAPEX | | | 5.5x | | | | 5.0x | | | | 4.0x | |
| | EBITDA/Interest Expense | | | 2.5x | | | | 3.2x | | | | 4.0x | |
| | EBITDA-CAPEX/Interest Expense | | | 2.0x | | | | 2.6x | | | | 3.3x | |
Income and Cashflow Analysis
| | | | | | | | | | | | | | | | | | | | | | |
| | | | | | | | Six Months Ended | | Fiscal Years Ended |
| | | | LTM | |
| |
|
| | | | Jun-03 | | Jun-03 | | Jun-02 | | Dec-02 | | Dec-01 |
| | | |
| |
| |
| |
| |
|
Profitability & Cost Ratios (as % of Revenue) | | | | | | | | | | | | | | | | | | | | |
| | Gross Margin | | | 21.4 | % | | | 21.5 | % | | | 25.5 | % | | | 23.2 | % | | | 26.4 | % |
| | S, G & A | | | 15.2 | % | | | 16.2 | % | | | 14.3 | % | | | 14.2 | % | | | 14.1 | % |
| | Operating Income | | | 6.1 | % | | | 5.1 | % | | | 11.1 | % | | | 8.8 | % | | | 11.3 | % |
| | Pre-Tax | | | 2.5 | % | | | 1.5 | % | | | 7.5 | % | | | 5.3 | % | | | 7.6 | % |
| | EBIT | | | 6.2 | % | | | 5.1 | % | | | 11.1 | % | | | 9.0 | % | | | 11.2 | % |
| | EBITDA | | | 9.4 | % | | | 8.4 | % | | | 13.5 | % | | | 11.8 | % | | | 14.4 | % |
| | Normalized Net Income to Common | | | 1.7 | % | | | 0.9 | % | | | 4.6 | % | | | 3.4 | % | | | 4.7 | % |
| | Reported Net Income | | | -0.5 | % | | | 0.2 | % | | | -1.7 | % | | | -1.5 | % | | | 4.4 | % |
| | CAPEX | | | 1.9 | % | | | 1.4 | % | | | 2.1 | % | | | 2.3 | % | | | 2.8 | % |
Period Growth Rates | | | | | | | | | | | | | | | | | | | | |
| | Revenue | | | | | | | 33.0 | % | | | | | | | 34.4 | % | | | | |
| | EBIT | | | | | | | -38.6 | % | | | | | | | 8.1 | % | | | | |
| | EBITDA | | | | | | | -17.1 | % | | | | | | | 9.5 | % | | | | |
Notes
Unrealized gains included both plant consolidation costs and restructuring costs
There is a approximately 821MM Liability for the company’s liability to clean up a superfund site
July 10th, Manitowoc announced the following:
| • | | poor second quarter results, up to $20 million in restructuring charges, plan to cut jobs. |
| |
| • | | for full year, they expect earnings per share to be between 80c and $1 per share (Excluding charges) |
Other Analysis
Company Description
Manitowoc Company, Inc. is a diversified industrial manufacturer that operates in three principal markets: cranes and related products, foodservice equipment and marine. The Company’s crane business is a global provider of engineered lift solutions, offering lifting equipment in industrial manufacturing industry. Manitowoc Company designs, manufactures and markets a comprehensive line of crawler cranes, mobile telescopic cranes, tower cranes, boom trucks and aerial work platforms with capacities up to 1,433 tons. The Company’s foodservice business is a manufacturer of cold-side commercial foodservice products, including ice-making machines, walk-in and reach-in refrigerators/freezers, fountain beverage delivery systems and other foodservice refrigeration products. The marine segment provides new construction, ship repair and maintenance services for freshwater and saltwater vessels from four shipyards on the United States Great Lakes.
Sources of information: SEC Edgar filings, Multex, Capital IQ, Yahoo and Commodity Systems.
Page 68
| | | |
| Gencor Industries, Inc. | | CONFIDENTIAL |
|
VALUATION ANALYSIS
SELECTED COMPARABLE COMPANY ANALYSIS
| | | |
| Joy Global Inc. Overview | | ($ in thousands, except per share) |
Company Information
| | | | | | | |
| Name | | Joy Global Inc. | | Address | | 100 East Wisconsin Ave., Suite 2780 |
| Symbol | | JOYG | | City, State Zip | | Milwaukee, WI 53202 |
| Latest Fiscal YE | | 2-Nov-02 | | Telephone | | (414) 319-8500 |
| Latest Rprt Per | | 2-Aug-03 | | Website | | http://www.joyglobal.com/ |
Market Information
| | | | | | | | | | | | | | |
As of Date | | 3-Oct-03 | | Market Cap | | $ | 853,563 | |
| | Exchange | | Nasdaq | | Total Invested Capital (TIC) | | $ | 1,073,495 | |
| | Stock Price | | $ | 17.42 | | | Enterprise Value (EV) | | $ | 970,021 | |
| | 52 Week High | | $ | 16.40 | | | | | | | | | |
| | 52 Week Low | | $ | 7.65 | | | Insider Ownership | | | 0.00 | % |
| | Avg. Daily Volume (000’s) | | | 183 | | | Institutional | | | | |
| | Beta | | | (87.49 | ) | | % Owned | | | 95.00 | % |
| | Shares Outstanding (000’s) | | | 48,999 | | | Number of Institutions | | | 251 | |
Valuation Analysis
| | | | | | | | | | | | | | |
| | | | Multiple of |
| | | |
|
| | | | Market Cap | | TIC | | EV |
| | | |
| |
| |
|
Latest Twelve Months | | | | | | | | | | | | |
| | Revenue | | | 0.77x | | | | 0.97 | x | | | 0.87 | x |
| | EBIT | | | 21.14x | | | | 26.58 | x | | | 24.02 | x |
| | EBITDA | | | 9.16x | | | | 11.52 | x | | | 10.41 | x |
| | Normalized Net Income | | | 97.94x | | | | 123.18 | x | | | 111.30 | x |
| | Basic Normalized EPS | | | 102.47x | | | | na | | | | na |
Projected | | | | | | | | | | | | |
| | Dec-03 Mean Revenue | | | 0.74x | | | | 0.93 | x | | | 0.84 | x |
| | Dec-04 Mean Revenue | | | 0.68x | | | | 0.86 | x | | | 0.77 | x |
| | Dec-03 Mean EBITDA | | | 9.03x | | | | 11.36 | x | | | 10.26 | x |
| | Dec-04 Mean EBITDA | | | 6.81x | | | | 8.57 | x | | | 7.74 | x |
| | Dec-03 Mean EPS | | | 76.40x | | | | na | | | | na | |
| | Dec-04 Mean EPS | | | 26.27x | | | | na | | | | na | |
Most Recent Filing | | | | | | | | | | | | |
| | Assets | | | 0.66x | | | | 0.82 | x | | | 0.74 | x |
| | Common Equity | | | 2.34x | | | | na | | | | na | |
| | Tangible Common Equity | | | 4.72x | | | | na | | | | na | |
Mean Consensus Estimates
| | | | | | | | | | | | | | | | | |
| Year Ending | | # Ests | | Revenue | | EBITDA | | EPS |
| |
| |
| |
| |
|
| December-03 | | | 5 | | | $ | 1,148,800 | | | $ | 94,500 | | | $ | 0.23 | |
| December-04 | | | 3 | | | $ | 1,252,700 | | | $ | 125,300 | | | $ | 0.66 | |
| LT Growth | | | 2 | | | na | | na | | | 8.00 | % |
|
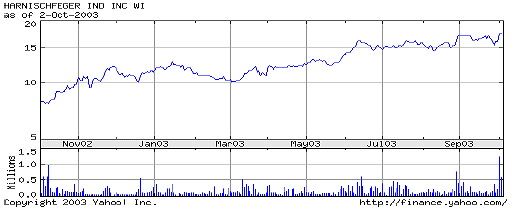
Income and Cashflow Statement Data
| | | | | | | | | | | | | | | | | | | | | | | |
| | | | | | | | | Nine Months Ended | | Fiscal Years Ended |
| | | | | LTM | |
| |
|
| | | | | Aug-03 | | Aug-03 | | Aug-02 | | Nov-02 | | Nov-01 |
| | | | |
| |
| |
| |
| |
|
Revenue | | $ | 1,111,106 | | | $ | 838,140 | | | $ | 877,881 | | | $ | 1,150,847 | | | $ | 1,148,173 | |
| | Cost of Revenue | | | 846,653 | | | | 637,802 | | | | 745,439 | | | | 954,290 | | | | 937,704 | |
| | | |
| | | |
| | | |
| | | |
| | | |
| |
| | | Gross Profit | | | 264,453 | | | | 200,338 | | | | 132,442 | | | | 196,557 | | | | 210,469 | |
| | Selling, General & Administrative | | | 225,966 | | | | 175,484 | | | | 162,339 | | | | 212,821 | | | | 221,792 | |
| | Other Operating | | | - | | | | - | | | | - | | | | - | | | | - | |
| | | |
| | | |
| | | |
| | | | | | | | | |
| | | Operating Income | | | 38,487 | | | | 24,854 | | | | (29,897 | ) | | | (16,264 | ) | | | (11,323 | ) |
| | Interest Income / (Expense), net | | | (22,557 | ) | | | (16,895 | ) | | | (22,143 | ) | | | (27,805 | ) | | | (37,466 | ) |
| | Other Income / (Expense), net | | | 1,893 | | | | 1,996 | | | | 1,224 | | | | 1,121 | | | | 2,966 | |
| | | |
| | | |
| | | |
| | | |
| | | |
| |
| | | Pre-tax Income | | | 17,823 | | | | 9,955 | | | | (50,816 | ) | | | (42,948 | ) | | | (45,823 | ) |
| | Taxes | | | 8,855 | | | | 2,525 | | | | (20,565 | ) | | | (14,235 | ) | | | (13,555 | ) |
| | | |
| | | |
| | | |
| | | |
| | | |
| |
| | | After-tax Income | | | 8,968 | | | | 7,430 | | | | (30,251 | ) | | | (28,713 | ) | | | (32,268 | ) |
| | Minority Interest | | | (253 | ) | | | - | | | | (1,421 | ) | | | (1,674 | ) | | | (2,279 | ) |
| | Equity in Affiliates | | | - | | | | - | | | | - | | | | - | | | | - | |
| | | |
| | | |
| | | |
| | | |
| | | |
| |
| | | Normalized Net Income | | | 8,715 | | | | 7,430 | | | | (31,672 | ) | | | (30,387 | ) | | | (34,547 | ) |
| | Preferred Dividends | | | - | | | | - | | | | - | | | | - | | | | - | |
| | | |
| | | |
| | | |
| | | |
| | | |
| |
| | | Normalized Net Income to Common | | $ | 8,715 | | | $ | 7,430 | | | $ | (31,672 | ) | | $ | (30,387 | ) | | $ | (34,547 | ) |
| | | |
| | | |
| | | |
| | | |
| | | |
| |
| | | Normalized EBIT | | $ | 40,380 | | | $ | 26,850 | | | $ | (28,673 | ) | | $ | (15,143 | ) | | $ | (8,357 | ) |
| | | Depreciation & Amortization | | $ | 52,837 | | | $ | 16,000 | | | $ | 22,300 | | | $ | 59,137 | | | $ | 56,419 | |
| | | Normalized EBITDA | | $ | 93,217 | | | $ | 42,850 | | | $ | (6,373 | ) | | $ | 43,994 | | | $ | 48,062 | |
| | | CAPEX | | $ | 23,884 | | | $ | 17,368 | | | $ | 12,571 | | | $ | 19,087 | | | $ | 22,258 | |
| | | EBITDA - CAPEX | | $ | 69,333 | | | $ | 25,482 | | | $ | (18,944 | ) | | $ | 24,907 | | | $ | 25,804 | |
| GAAP Operating Cash Flow | | $ | 109,108 | | | $ | 48,628 | | | $ | 67,061 | | | $ | 127,541 | | | $ | (41,661 | ) |
| Basic Reported Weighted Avg Shares Out (000’s) | | | | | | | 50,229 | | | | 50,150 | | | | 50,169 | | | | 50,000 | |
| | | Basic Normalized EPS | | $ | 0.17 | | | $ | 0.15 | | | $ | (0.63 | ) | | $ | (0.61 | ) | | $ | (0.69 | ) |
| | | Basic Reported EPS | | $ | 0.19 | | | $ | 0.07 | | | $ | (0.68 | ) | | $ | (0.56 | ) | | $ | 27.03 | |
| Diluted Reported Weighted Avg Shares Out (000’s) | | | | | | | 50,393 | | | | 50,150 | | | | 50,169 | | | | 50,000 | |
| | | Diluted Normalized EPS | | $ | 0.17 | | | $ | 0.15 | | | $ | (0.63 | ) | | $ | (0.61 | ) | | $ | (0.69 | ) |
| | | Diluted Reported EPS | | $ | 0.19 | | | $ | 0.07 | | | $ | (0.68 | ) | | $ | (0.56 | ) | | $ | 27.03 | |
|
Normalized Reconciliation
|
|
| | Restructuring/Goodwill Impairment | | $ | (9,519 | ) | | $ | (3,758 | ) | | $ | 5,761 | | | $ | - | | | $ | - | |
| | Other Unusual (Expense) Gain Items | | | 15,069 | | | | (261 | ) | | | (8,100 | ) | | | 7,230 | | | | 8,623 | |
| | Tax Shelter (Charge) on Unusual Items | | | - | | | | - | | | | - | | | | - | | | | - | |
| | | |
| | | |
| | | |
| | | |
| | | |
| |
| | Unusual (Exp) Gain Items, net of Taxes | | | 5,550 | | | | (4,019 | ) | | | (2,339 | ) | | | 7,230 | | | | 8,623 | |
| | Accounting Changes, net of Taxes | | | - | | | | - | | | | - | | | | - | | | | - | |
| | Discontinued Operations, net of Taxes | | | - | | | | - | | | | - | | | | - | | | | 253,183 | |
| | Extraordinary Items, net of Taxes | | | (4,860 | ) | | | - | | | | - | | | | (4,860 | ) | | | 1,124,083 | |
| | | |
| | | |
| | | |
| | | |
| | | |
| |
| | Total Reconciling Items, net of Taxes | | $ | 690 | | | $ | (4,019 | ) | | $ | (2,339 | ) | | $ | 2,370 | | | $ | 1,385,889 | |
| | | |
| | | |
| | | |
| | | |
| | | |
| |
| | | Reported Income Tax (Benefit) | | $ | 8,855 | | | $ | 2,525 | | | $ | (20,565 | ) | | $ | (14,235 | ) | | $ | (13,555 | ) |
| | | Reported Net Income (Loss) | | $ | 9,405 | | | $ | 3,411 | | | $ | (34,011 | ) | | $ | (28,017 | ) | | $ | 1,351,342 | |
|
Revenue Breakdown
|
|
| | Road Construction Equipment | | $ | - | | | $ | - | | | $ | - | | | $ | - | | | $ | - | |
| | Other Heavy Construction | | | 1,111,106 | | | | 838,140 | | | | 877,881 | | | | 1,150,847 | | | | 1,148,173 | |
| | Other | | | - | | | | - | | | | - | | | | - | | | | - | |
| | | |
| | | |
| | | |
| | | |
| | | |
| |
| | | $ | 1,111,106 | | | $ | 838,140 | | | $ | 877,881 | | | $ | 1,150,847 | | | $ | 1,148,173 | |
| | | |
| | | |
| | | |
| | | |
| | | |
| |
| | Road Construction Equipment | | | 0.0 | % | | | 0.0 | % | | | 0.0 | % | | | 0.0 | % | | | 0.0 | % |
| | Other Heavy Construction | | | 100.0 | % | | | 100.0 | % | | | 100.0 | % | | | 100.0 | % | | | 100.0 | % |
| | Other | | | 0.0 | % | | | 0.0 | % | | | 0.0 | % | | | 0.0 | % | | | 0.0 | % |
|
Sources of information: SEC Edgar filings, Multex, Capital IQ, Yahoo and Commodity Systems.
Page 69
| | | |
| Gencor Industries, Inc. | | CONFIDENTIAL |
|
VALUATION ANALYSIS
SELECTED COMPARABLE COMPANY ANALYSIS
| | | |
| Joy Global Inc. Overview (continued) | | ($ in thousands, except per share) |
Balance Sheet Data
| | | | | | | | | | | | | | | |
| | | | | Aug-03 | | Nov-02 | | Nov-01 |
| | | | |
| |
| |
|
| | Cash & Mkt Securities | | $ | 103,474 | | | $ | 71,159 | | | $ | 59,065 | |
| | Accounts Receivable | | | 183,687 | | | | 171,534 | | | | 209,455 | |
| | Inventory | | | 432,209 | | | | 418,557 | | | | 513,854 | |
| | Other Current Assets | | | 36,132 | | | | 38,857 | | | | 16,225 | |
| | | |
| | | |
| | | |
| |
| | | Total Current Assets | | | 755,502 | | | | 700,107 | | | | 798,599 | |
| | PPE, net | | | 225,420 | | | | 233,174 | | | | 251,916 | |
| | Intangibles, net | | | 184,401 | | | | 190,541 | | | | 243,595 | |
| | Deferred Income Taxes | | | - | | | | 64,890 | | | | - | |
| | Other Assets | | | 137,382 | | | | 68,627 | | | | 77,604 | |
| | | |
| | | |
| | | |
| |
| | | Total Assets | | $ | 1,302,705 | | | $ | 1,257,339 | | | $ | 1,371,714 | |
| | | |
| | | |
| | | |
| |
| | Accounts Payable | | $ | 84,140 | | | $ | 73,492 | | | $ | 75,607 | |
| | Accrued Expenses | | | 96,104 | | | | 89,996 | | | | 91,610 | |
| | Deferred Revenues | | | 56,001 | | | | 26,244 | | | | 15,482 | |
| | Short Term Debt | | | 17,066 | | | | 3,032 | | | | 1,733 | |
| | Short Term Capital Leases | | | - | | | | - | | | | - | |
| | Other Current Liabilities | | | 151,081 | | | | 124,641 | | | | 170,854 | |
| | | |
| | | |
| | | |
| |
| | | Total Current Liabilities | | | 404,392 | | | | 317,405 | | | | 355,286 | |
| | Other LT Liabilities | | | 330,333 | | | | 363,003 | | | | 236,024 | |
| | Long Term Debt | | | 202,866 | | | | 215,085 | | | | 288,203 | |
| | Long Term Capital Leases | | | - | | | | - | | | | - | |
| | Minority Interests | | | - | | | | 11,230 | | | | 8,494 | |
| | Pref Stock (Liq Value) | | | - | | | | - | | | | - | |
| | | |
| | | |
| | | |
| |
| | | Total Liabilities & Pref Stock | | | 937,591 | | | | 906,723 | | | | 888,007 | |
| | | |
| | | |
| | | |
| |
| | Common Equity | | | 365,114 | | | | 350,616 | | | | 483,707 | |
| | | |
| | | |
| | | |
| |
| | | Total Liabilities & Equity | | $ | 1,302,705 | | | $ | 1,257,339 | | | $ | 1,371,714 | |
| | | |
| | | |
| | | |
| |
| | Common Shares Outstanding (000’s) | | | 50,228 | | | | 50,228 | | | | 50,000 | |
| | Cash Value per share | | $ | 2.06 | | | $ | 1.42 | | | $ | 1.18 | |
| | Common Book Value per share | | $ | 7.27 | | | $ | 6.98 | | | $ | 9.67 | |
| | Common Tangible Book Value per share | | $ | 3.60 | | | $ | 3.19 | | | $ | 4.80 | |
| | Total Debt | | $ | 219,932 | | | $ | 229,347 | | | $ | 298,430 | |
| | Net Debt | | $ | 116,458 | | | $ | 158,188 | | | $ | 239,365 | |
| | Total Capitalization | | $ | 585,046 | | | $ | 579,963 | | | $ | 782,137 | |
|
Balance Sheet Analysis
|
|
Effectiveness and Efficiency | | | | | | | | | | | | |
| | A/R Turnover | | | 6.3 | x | | | 6.0 | x | | | 5.5 | x |
| | Inventory Turnover | | | 2.0 | x | | | 2.0 | x | | | 1.8 | x |
| | Asset Turnover | | | 0.9 | x | | | 0.9 | x | | | 0.8 | x |
| | Days Sales Outstanding | | | 58.3 | | | | 60.4 | | | | 66.6 | |
| | Days Inventory Outstanding | | | 183.4 | | | | 178.3 | | | | 200.0 | |
| | Days Payable Outstanding | | | 26.8 | | | | 23.3 | | | | 23.8 | |
| | Normalized Return on Avg Assets | | | 0.7 | % | | | -2.3 | % | | | na | |
| | Normalized Return on Avg Common Equity | | | 2.4 | % | | | -7.3 | % | | | na | |
Financial Strength | | | | | | | | | | | | |
| | Current Ratio | | | 1.9 | | | | 2.2 | | | | 2.2 | |
| | Quick Ratio | | | 0.8 | | | | 0.9 | | | | 0.8 | |
| | Total Debt/Total Capitalization | | | 37.6 | % | | | 39.5 | % | | | 38.2 | % |
| | Total Debt/TIC | | | 20.5 | % | | | 21.4 | % | | | 27.8 | % |
| | Total Debt/EBITDA | | | 2.4 | x | | | 5.2 | x | | | 6.2 | x |
| | Total Debt/EBITDA-CAPEX | | | 3.2 | x | | | 9.2 | x | | | 11.6 | x |
| | EBITDA/Interest Expense | | | 4.1 | x | | | 1.6 | x | | | 1.3 | x |
| | EBITDA-CAPEX/Interest Expense | | | 3.1 | x | | | 0.9 | x | | | 0.7 | x |
Income and Cashflow Analysis
| | | | | | | | | | | | | | | | | | | | | | |
| | | | | | | | Nine Months Ended | | Fiscal Years Ended |
| | | | LTM | |
| |
|
| | | | Aug-03 | | Aug-03 | | Aug-02 | | Nov-02 | | Nov-01 |
| | | |
| |
| |
| |
| |
|
Profitability & Cost Ratios (as % of Revenue) | | | | | | | | | | | | | | | | | | | | |
| | Gross Margin | | | 23.8 | % | | | 23.9 | % | | | 15.1 | % | | | 17.1 | % | | | 18.3 | % |
| | S,G & A | | | 20.3 | % | | | 20.9 | % | | | 18.5 | % | | | 18.5 | % | | | 19.3 | % |
| | Operating Income | | | 3.5 | % | | | 3.0 | % | | | -3.4 | % | | | -1.4 | % | | | -1.0 | % |
| | Pre-Tax | | | 1.6 | % | | | 1.2 | % | | | -5.8 | % | | | -3.7 | % | | | -4.0 | % |
| | EBIT | | | 3.6 | % | | | 3.2 | % | | | -3.3 | % | | | -1.3 | % | | | -0.7 | % |
| | EBITDA | | | 8.4 | % | | | 5.1 | % | | | -0.7 | % | | | 3.8 | % | | | 4.2 | % |
| | Normalized Net Income to Common | | | 0.8 | % | | | 0.9 | % | | | -3.6 | % | | | -2.6 | % | | | -3.0 | % |
| | Reported Net Income | | | 0.8 | % | | | 0.4 | % | | | -3.9 | % | | | -2.4 | % | | | 117.7 | % |
| | CAPEX | | | 2.1 | % | | | 2.1 | % | | | 1.4 | % | | | 1.7 | % | | | 1.9 | % |
Period Growth Rates | | | | | | | | | | | | | | | | | | | | |
| | Revenue | | | | | | | -4.5 | % | | | | | | | 0.2 | % | | | | |
| | EBIT | | | | | | | -193.6 | % | | | | | | | 81.2 | % | | | | |
| | EBITDA | | | | | | | -772.4 | % | | | | | | | -8.5 | % | | | | |
Notes
Unsual expenses include reorganization items,and loss on early retirement of debt.
Extraordinary items include gain on debt discharge of $1.12b.
Other Analysis
Company Description
Joy Global Inc., through its subsidiaries, manufactures and markets products classified into two business segments: underground mining machinery (Joy Mining Machinery) and surface mining equipment (P and H Mining Equipment). The Company is a major manufacturer of underground mining equipment for the extraction of coal and other bedded minerals and offers comprehensive service locations near major mining regions worldwide. P and H is a major producer of surface mining equipment for the extraction of ores and minerals and provides extensive operational support for many types of equipment used in surface mining. On June 7, 1999, Joy’s predecessor company, Harnischfeger Industries, Inc, filed voluntary petitions for reorganization under the Bankruptcy Code in the United States Bankruptcy Court. By order dated May 29, 2001, the Bankruptcy Court confirmed the Company’s Plan of Reorganization.
Sources of information: SEC Edgar filings, Multex, Capital IQ, Yahoo and Commodity Systems.
Page 70
| | | |
| Gencor Industries, Inc. | | CONFIDENTIAL |
|
VALUATION ANALYSIS
SELECTED COMPARABLE COMPANY ANALYSIS
| | | |
| Astec Industries, Inc. Overview | | ($ in thousands, except per share) |
Company Information
| | | | | | | |
| Name | | Astec Industries, Inc. | | Address | | 4101 Jerome Avenue, P.O. Box 72787 |
| Symbol | | ASTE | | City, State Zip | | Chattanooga, TN 37407 |
| Latest Fiscal YE | | 31-Dec-02 | | Telephone | | (423) 867-4210 |
| Latest Rprt Per | | 30-Jun-03 | | Website | | http://www.astecindustries.com/ |
Market Information
| | | | | | | | | | | | | | |
As of Date | | 3-Oct-03 | | Market Cap | | $ | 203,491 | |
| | Exchange | | Nasdaq | | Total Invested Capital (TIC) | | $ | 291,652 | |
| | Stock Price | | $ | 10.33 | | | Enterprise Value (EV) | | $ | 280,372 | |
| | 52 Week High | | $ | 12.72 | | | | | | | | | |
| | 52 Week Low | | $ | 5.21 | | | Insider Ownership | | | 16.00 | % |
| | Avg. Daily Volume (000’s) | | | 46 | | | Institutional | | | | |
| | Beta | | | 1.34 | | | % Owned | | | 56.00 | % |
| | Shares Outstanding (000’s) | | | 19,699 | | | Number of Institutions | | | 192 | |
Valuation Analysis
| | | | | | | | | | | | | | |
| | | | Multiple of |
| | | |
|
| | | | Market Cap | | TIC | | EV |
| | | |
| |
| |
|
Latest Twelve Months | | | | | | | | | | | | |
| | Revenue | | | 0.44x | | | | 0.63x | | | | 0.60x | |
| | EBIT | | na | | na | | na |
| | EBITDA | | | 29.23x | | | | 41.90x | | | | 40.28x | |
| | Normalized Net Income | | na | | na | | na |
| | Basic Normalized EPS | | na | | na | | na |
Projected | | | | | | | | | | | | |
| | Dec-03 Mean Revenue | | | 0.46x | | | | 0.65x | | | | 0.63x | |
| | Dec-04 Mean Revenue | | | 0.42x | | | | 0.61x | | | | 0.58x | |
| | Dec-03 Mean EBITDA | | | 13.75x | | | | 19.71x | | | | 18.94x | |
| | Dec-04 Mean EBITDA | | | 7.48x | | | | 10.72x | | | | 10.31x | |
| | Dec-03 Mean EPS | | na | | na | | na |
| | Dec-04 Mean EPS | | | 20.46x | | | na | | na |
Most Recent Filing | | | | | | | | | | | | |
| | Assets | | | 0.56x | | | | 0.80x | | | | 0.77x | |
| | Common Equity | | | 1.06x | | | na | | na |
| | Tangible Common Equity | | | 1.31x | | | na | | na |
Mean Consensus Estimates
| | | | | | | | | | | | | | | | | |
| Year Ending | | # Ests | | Revenue | | EBITDA | | EPS |
| |
| |
| |
| |
|
| December-03 | | | 2 | | | $ | 447,000 | | | $ | 14,800 | | | $ | (0.07 | ) |
| December-04 | | | 1 | | | $ | 482,000 | | | $ | 27,200 | | | $ | 0.51 | |
| LT Growth | | | 1 | | | na | | na | | | 7.00 | % |
|
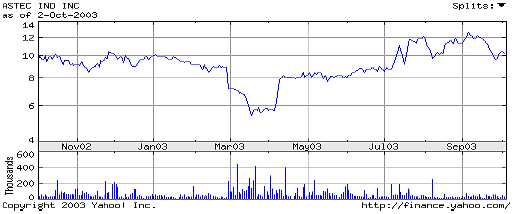
Income and Cashflow Statement Data
| | | | | | | | | | | | | | | | | | | | | | | | |
| | | | | | | | | | Six Months Ended | | Fiscal Years Ended |
| | | | | | LTM | |
| |
|
| | | | | | Jun-03 | | Jun-03 | | Jun-02 | | Dec-02 | | Dec-01 |
| | | | | |
| |
| |
| |
| |
|
Revenue | | $ | 463,446 | | | $ | 231,968 | | | $ | 249,111 | | | $ | 480,589 | | | $ | 455,839 | |
| | Cost of Revenue | | | 393,482 | | | | 191,433 | | | | 194,610 | | | | 396,659 | | | | 364,915 | |
| | | |
| | | |
| | | |
| | | |
| | | |
| |
| | | | Gross Profit | | | 69,964 | | | | 40,535 | | | | 54,501 | | | | 83,930 | | | | 90,924 | |
| | Selling, General & Administrative | | | 72,369 | | | | 39,898 | | | | 39,936 | | | | 72,407 | | | | 71,691 | |
| | Other Operating | | | 7,772 | | | | - | | | | - | | | | 7,772 | | | | 9,651 | |
| | | |
| | | |
| | | |
| | | |
| | | |
| |
| | | | Operating Income | | | (10,177 | ) | | | 637 | | | | 14,565 | | | | 3,751 | | | | 9,582 | |
| | Interest Income / (Expense), net | | | (8,117 | ) | | | (4,438 | ) | | | (5,162 | ) | | | (8,841 | ) | | | (7,782 | ) |
| | Other Income / (Expense), net | | | 1,201 | | | | 1,087 | | | | 1,128 | | | | 1,242 | | | | 2,039 | |
| | | |
| | | |
| | | |
| | | |
| | | |
| |
| | | | Pre-tax Income | | | (17,093 | ) | | | (2,714 | ) | | | 10,531 | | | | (3,848 | ) | | | 3,839 | |
| | Taxes | | | (8,502 | ) | | | (2,540 | ) | | | 3,451 | | | | (2,511 | ) | | | 1,481 | |
| | | |
| | | |
| | | |
| | | |
| | | |
| |
| | | | After-tax Income | | | (8,591 | ) | | | (174 | ) | | | 7,080 | | | | (1,337 | ) | | | 2,358 | |
| | Minority Interest | | | (85 | ) | | | (31 | ) | | | (38 | ) | | | (92 | ) | | | (124 | ) |
| | Equity in Affiliates | | | - | | | | - | | | | - | | | | - | | | | (242 | ) |
| | | |
| | | |
| | | |
| | | |
| | | |
| |
| | | | Normalized Net Income | | | (8,676 | ) | | | (205 | ) | | | 7,042 | | | | (1,429 | ) | | | 1,992 | |
| | Preferred Dividends | | | - | | | | - | | | | - | | | | - | | | | - | |
| | | |
| | | |
| | | |
| | | |
| | | |
| |
| | | | Normalized Net Income to Common | | $ | (8,676 | ) | | $ | (205 | ) | | $ | 7,042 | | | $ | (1,429 | ) | | $ | 1,992 | |
| | | |
| | | |
| | | |
| | | |
| | | |
| |
| | | | Normalized EBIT | | $ | (8,976 | ) | | $ | 1,724 | | | $ | 15,693 | | | $ | 4,993 | | | $ | 11,379 | |
| Depreciation & Amortization | | $ | 15,937 | | | $ | 7,232 | | | $ | 6,507 | | | $ | 15,212 | | | $ | 17,046 | |
| | | | Normalized EBITDA | | $ | 6,961 | | | $ | 8,956 | | | $ | 22,200 | | | $ | 20,205 | | | $ | 28,425 | |
| | | | CAPEX | | $ | 3,962 | | | $ | 2,688 | | | $ | 18,000 | | | $ | 19,274 | | | $ | 8,057 | |
| | | | EBITDA - CAPEX | | $ | 2,999 | | | $ | 6,268 | | | $ | 4,200 | | | $ | 931 | | | $ | 20,368 | |
| GAAP Operating Cash Flow | | $ | 5,218 | | | $ | (1,684 | ) | | $ | 25,935 | | | $ | 32,837 | | | $ | 1,452 | |
| Basic Reported Weighted Avg Shares Out (000’s) | | | | | | | 19,682 | | | | 19,639 | | | | 19,658 | | | | 19,442 | |
| | | | Basic Normalized EPS | | $ | (0.44 | ) | | $ | (0.01 | ) | | $ | 0.36 | | | $ | (0.07 | ) | | $ | 0.10 | |
| | | | Basic Reported EPS | | $ | (0.81 | ) | | $ | (0.21 | ) | | $ | 0.36 | | | $ | (0.24 | ) | | $ | 0.10 | |
| Diluted Reported Weighted Avg Shares Out (000’s) | | | | | | | 19,682 | | | | 19,994 | | | | 19,658 | | | | 19,753 | |
| | | | Diluted Normalized EPS | | $ | (0.43 | ) | | $ | (0.01 | ) | | $ | 0.35 | | | $ | (0.07 | ) | | $ | 0.10 | |
| | | | Diluted Reported EPS | | $ | (0.80 | ) | | $ | (0.21 | ) | | $ | 0.35 | | | $ | (0.24 | ) | | $ | 0.10 | |
|
Normalized Reconciliation
|
|
| | Restructuring/Goodwill Impairment | | $ | - | | | $ | - | | | $ | - | | | $ | - | | | $ | - | |
| | Other Unusual (Expense) Gain Items | | | (7,114 | ) | | | (3,837 | ) | | | - | | | | (3,277 | ) | | | - | |
| | Tax Shelter (Charge) on Unusual Items | | | - | | | | - | | | | - | | | | - | | | | - | |
| | | |
| | | |
| | | |
| | | |
| | | |
| |
| | Unusual (Exp) Gain Items, net of Taxes | | | (7,114 | ) | | | (3,837 | ) | | | - | | | | (3,277 | ) | | | - | |
| | Accounting Changes, net of Taxes | | | - | | | | - | | | | - | | | | - | | | | - | |
| | Discontinued Operations, net of Taxes | | | - | | | | - | | | | - | | | | - | | | | - | |
| | Extraordinary Items, net of Taxes | | | - | | | | - | | | | - | | | | - | | | | - | |
| | | |
| | | |
| | | |
| | | |
| | | |
| |
| | Total Reconciling Items, net of Taxes | | $ | (7,114 | ) | | $ | (3,837 | ) | | $ | - | | | $ | (3,277 | ) | | $ | - | |
| | | |
| | | |
| | | |
| | | |
| | | |
| |
| | | Reported Income Tax (Benefit) | | $ | (8,502 | ) | | $ | (2,540 | ) | | $ | 3,451 | | | $ | (2,511 | ) | | $ | 1,481 | |
| | | Reported Net Income (Loss) | | $ | (15,790 | ) | | $ | (4,042 | ) | | $ | 7,042 | | | $ | (4,706 | ) | | $ | 1,992 | |
|
Revenue Breakdown
|
|
| | Road Construction Equipment | | $ | 225,543 | | | $ | 116,314 | | | $ | 128,628 | | | $ | 237,857 | | | $ | 221,163 | |
| | Other Heavy Construction | | | 235,072 | | | | 114,885 | | | | 118,628 | | | | 238,815 | | | | 231,523 | |
| | Other | | | 2,831 | | | | 769 | | | | 1,855 | | | | 3,917 | | | | 3,153 | |
| | | |
| | | |
| | | |
| | | |
| | | |
| |
| | | $ | 463,446 | | | $ | 231,968 | | | $ | 249,111 | | | $ | 480,589 | | | $ | 455,839 | |
| | | |
| | | |
| | | |
| | | |
| | | |
| |
| | Road Construction Equipment | | | 48.7 | % | | | 50.1 | % | | | 51.6 | % | | | 49.5 | % | | | 48.5 | % |
| | Other Heavy Construction | | | 50.7 | % | | | 49.5 | % | | | 47.6 | % | | | 49.7 | % | | | 50.8 | % |
| | Other | | | 0.6 | % | | | 0.3 | % | | | 0.7 | % | | | 0.8 | % | | | 0.7 | % |
|
Sources of information: SEC Edgar filings, Multex, Capital IQ, Yahoo and Commodity Systems.
Page 71
| | | |
| Gencor Industries, Inc. | | CONFIDENTIAL |
|
VALUATION ANALYSIS
SELECTED COMPARABLE COMPANY ANALYSIS
| | | |
| Astec Industries, Inc. Overview (continued) | | ($ in thousands, except per share) |
Balance Sheet Data
| | | | | | | | | | | | | | | |
| | | | | Jun-03 | | Dec-02 | | Dec-01 |
| | | | |
| |
| |
|
| | Cash & Mkt Securities | | $ | 11,280 | | | $ | 30,341 | | | $ | 6,670 | |
| | Accounts Receivable | | | 57,609 | | | | 48,965 | | | | 53,057 | |
| | Inventory | | | 113,740 | | | | 120,238 | | | | 128,996 | |
| | Other Current Assets | | | 23,204 | | | | 50,331 | | | | 36,537 | |
| | | |
| | | |
| | | |
| |
| | | Total Current Assets | | | 205,833 | | | | 249,875 | | | | 225,260 | |
| | PPE, net | | | 115,357 | | | | 125,799 | | | | 123,394 | |
| | Intangibles, net | | | 36,093 | | | | 36,093 | | | | 36,115 | |
| | Deferred Income Taxes | | | - | | | | - | | | | - | |
| | Other Assets | | | 6,247 | | | | 4,736 | | | | 15,922 | |
| | | |
| | | |
| | | |
| |
| | | Total Assets | | $ | 363,530 | | | $ | 416,503 | | | $ | 400,691 | |
| | | |
| | | |
| | | |
| |
| | Accounts Payable | | $ | 34,158 | | | $ | 33,680 | | | $ | 26,246 | |
| | Accrued Expenses | | | 3,739 | | | | 6,110 | | | | 6,667 | |
| | Deferred Revenues | | | - | | | | - | | | | - | |
| | Short Term Debt | | | 9,555 | | | | 3,220 | | | | 2,368 | |
| | Short Term Capital Leases | | | - | | | | - | | | | - | |
| | Other Current Liabilities | | | 34,929 | | | | 33,641 | | | | 27,831 | |
| | | |
| | | |
| | | |
| |
| | | Total Current Liabilities | | | 82,381 | | | | 76,651 | | | | 63,112 | |
| | Other LT Liabilities | �� | | 10,638 | | | | 15,315 | | | | 12,597 | |
| | Long Term Debt | | | 78,155 | | | | 130,645 | | | | 127,285 | |
| | Long Term Capital Leases | | | - | | | | - | | | | - | |
| | Minority Interests | | | 451 | | | | 460 | | | | 350 | |
| | Pref Stock (Liq Value) | | | - | | | | - | | | | - | |
| | | |
| | | |
| | | |
| |
| | | Total Liabilities & Pref Stock | | | 171,625 | | | | 223,071 | | | | 203,344 | |
| | | |
| | | |
| | | |
| |
| | Common Equity | | | 191,905 | | | | 193,432 | | | | 197,347 | |
| | | |
| | | |
| | | |
| |
| | | Total Liabilities & Equity | | $ | 363,530 | | | $ | 416,503 | | | $ | 400,691 | |
| | | |
| | | |
| | | |
| |
| | Common Shares Outstanding (000’s) | | | 19,678 | | | | 19,677 | | | | 19,603 | |
| | Cash Value per share | | $ | 0.57 | | | $ | 1.54 | | | $ | 0.34 | |
| | Common Book Value per share | | $ | 9.75 | | | $ | 9.83 | | | $ | 10.07 | |
| | Common Tangible Book Value per share | | $ | 7.92 | | | $ | 8.00 | | | $ | 8.22 | |
| | Total Debt | | $ | 88,161 | | | $ | 134,325 | | | $ | 130,003 | |
| | Net Debt | | $ | 76,881 | | | $ | 103,984 | | | $ | 123,333 | |
| | Total Capitalization | | $ | 280,066 | | | $ | 327,757 | | | $ | 327,350 | |
|
Balance Sheet Analysis
|
|
Effectiveness and Efficiency | | | | | | | | | | | | |
| | A/R Turnover | | | 8.7x | | | | 9.4x | | | | 8.6x | |
| | Inventory Turnover | | | 3.4x | | | | 3.2x | | | | 2.8x | |
| | Asset Turnover | | | 1.2x | | | | 1.2x | | | | 1.1x | |
| | Days Sales Outstanding | | | 42.0 | | | | 38.7 | | | | 42.5 | |
| | Days Inventory Outstanding | | | 108.5 | | | | 114.7 | | | | 129.0 | |
| | Days Payable Outstanding | | | 26.1 | | | | 22.9 | | | | 21.5 | |
| | Normalized Return on Avg Assets | | | -2.2 | % | | | -0.3 | % | | na |
| | Normalized Return on Avg Common Equity | | | -4.5 | % | | | -0.7 | % | | na |
Financial Strength | | | | | | | | | | | | |
| | Current Ratio | | | 2.5 | | | | 3.3 | | | | 3.6 | |
| | Quick Ratio | | | 1.1 | | | | 1.7 | | | | 1.5 | |
| | Total Debt/Total Capitalization | | | 31.5 | % | | | 41.0 | % | | | 39.7 | % |
| | Total Debt/TIC | | | 30.2 | % | | | 46.1 | % | | | 44.6 | % |
| | Total Debt/EBITDA | | | 12.7x | | | | 6.6x | | | | 4.6x | |
| | Total Debt/EBITDA-CAPEX | | | 29.4x | | | | 144.3x | | | | 6.4x | |
| | EBITDA/Interest Expense | | | 0.9x | | | | 2.3x | | | | 3.7x | |
| | EBITDA-CAPEX/Interest Expense | | | 0.4x | | | | 0.1x | | | | 2.6x | |
Income and Cashflow Analysis
| | | | | | | | | | | | | | | | | | | | | | |
| | | | | | | | Six Months Ended | | Fiscal Years Ended |
| | | | LTM | |
| |
|
| | | | Jun-03 | | Jun-03 | | Jun-02 | | Dec-02 | | Dec-01 |
| | | |
| |
| |
| |
| |
|
Profitability & Cost Ratios (as % of Revenue) | | | | | | | | | | | | | | | | | | | | |
| | Gross Margin | | | 15.1 | % | | | 17.5 | % | | | 21.9 | % | | | 17.5 | % | | | 19.9 | % |
| | S,G & A | | | 15.6 | % | | | 17.2 | % | | | 16.0 | % | | | 15.1 | % | | | 15.7 | % |
| | Operating Income | | | -2.2 | % | | | 0.3 | % | | | 5.8 | % | | | 0.8 | % | | | 2.1 | % |
| | Pre-Tax | | | -3.7 | % | | | -1.2 | % | | | 4.2 | % | | | -0.8 | % | | | 0.8 | % |
| | EBIT | | | -1.9 | % | | | 0.7 | % | | | 6.3 | % | | | 1.0 | % | | | 2.5 | % |
| | EBITDA | | | 1.5 | % | | | 3.9 | % | | | 8.9 | % | | | 4.2 | % | | | 6.2 | % |
| | Normalized Net Income to Common | | | -1.9 | % | | | -0.1 | % | | | 2.8 | % | | | -0.3 | % | | | 0.4 | % |
| | Reported Net Income | | | -3.4 | % | | | -1.7 | % | | | 2.8 | % | | | -1.0 | % | | | 0.4 | % |
| | CAPEX | | | 0.9 | % | | | 1.2 | % | | | 7.2 | % | | | 4.0 | % | | | 1.8 | % |
Period Growth Rates | | | | | | | | | | | | | | | | | | | | |
| | Revenue | | | | | | | -6.9 | % | | | | | | | 5.4 | % | | | | |
| | EBIT | | | | | | | -89.0 | % | | | | | | | -56.1 | % | | | | |
| | EBITDA | | | | | | | -59.7 | % | | | | | | | -28.9 | % | | | | |
Notes
Unusual expense includes relocation and start up expenses
June 30, 2003 results are based on news annoucements. Depreciation and amortization expense is estimated to derive EBITDA for the second quarter.
Other Analysis
Company Description
Astec Industries, Inc. designs, engineers, manufactures and markets equipment and components used primarily in road building and related construction activities. The Company’s products are used in each phase of road building, from quarrying and crushing the aggregate to testing the mix for application of the road surface. Astec also manufactures certain equipment and components unrelated to road construction, including trenching, auger boring, directional drilling, environmental remediation and industrial heat transfer equipment. The Company operates in four business segments: asphalt group, aggregate and mining group, mobile asphalt paving group and underground group.
Sources of information: SEC Edgar filings, Multex, Capital IQ, Yahoo and Commodity Systems.
Page 72
| | | |
| Gencor Industries, Inc. | | CONFIDENTIAL |
|
VALUATION ANALYSIS
SELECTED COMPARABLE COMPANY ANALYSIS
Company Information
| | | | | |
| Gehl Company Overview | | | | ($ in thousands, except per share) |
| | | | | | | |
| Name | | Gehl Company | | Address | | 143 Water Street |
| Symbol | | GEHL | | City, State Zip | | West Bend, WI 53095 |
| Latest Fiscal YE | | 31-Dec-02 | | Telephone | | (262) 334-9461 |
| Latest Rprt Per | | 29-Jun-03 | | Website | | http://www.gehl.com/ |
Market Information
| | | | | | | | | | | | | | |
As of Date | | 3-Oct-03 | | Market Cap | | $ | 60,886 | |
| | Exchange | | Nasdaq | | Total Invested Capital (TIC) | | $ | 126,758 | |
| | Stock Price | | $ | 11.37 | | | Enterprise Value (EV) | | $ | 122,016 | |
| | 52 Week High | | $ | 12.22 | | | | | | | | | |
| | 52 Week Low | | $ | 7.51 | | | Insider Ownership | | | 2.00 | % |
| | Avg. Daily Volume (000’s) | | | 11 | | | Institutional | | | | |
| | Beta | | | 0.26 | | | % Owned | | | 36.00 | % |
| | Shares Outstanding (000’s) | | | 5,355 | | | Number of Institutions | | | 44 | |
Valuation Analysis
| | | | | | | | | | | | | | |
| | | | Multiple of |
| | | |
|
| | | | Market Cap | | TIC | | EV |
| | | |
| |
| |
|
Latest Twelve Months | | | | | | | | | | | | |
| | Revenue | | | 0.26x | | | | 0.54x | | | | 0.52x | |
| | EBIT | | | 9.20x | | | | 19.16x | | | | 18.44x | |
| | EBITDA | | | 5.32x | | | | 11.07x | | | | 10.66x | |
| | Normalized Net Income | | | 17.13x | | | | 35.65x | | | | 34.32x | |
| | Basic Normalized EPS | | | 17.23x | | | na | | na |
Projected | | | | | | | | | | | | |
| | Dec-03 Mean Revenue | | | 0.26x | | | | 0.54x | | | | 0.52x | |
| | Dec-04 Mean Revenue | | | 0.25x | | | | 0.52x | | | | 0.50x | |
| | Dec-03 Mean EBITDA | | | 4.35x | | | | 9.05x | | | | 8.72x | |
| | Dec-04 Mean EBITDA | | | 3.81x | | | | 7.92x | | | | 7.63x | |
| | Dec-03 Mean EPS | | | 15.16x | | | na | | na |
| | Dec-04 Mean EPS | | | 11.97x | | | na | | na |
Most Recent Filing | | | | | | | | | | | | |
| | Assets | | | 0.25x | | | | 0.51x | | | | 0.49x | |
| | Common Equity | | | 0.62x | | | na | | na |
| | Tangible Common Equity | | | 0.70x | | | na | | na |
Mean Consensus Estimates
| | | | | | | | | | | | | | | | | |
| Year Ending | | # Ests | | Revenue | | EBITDA | | EPS |
| |
| |
| |
| |
|
| December-03 | | | 1 | | | $ | 233,800 | | | $ | 14,000 | | | $ | 0.75 | |
| December-04 | | | 1 | | | $ | 242,400 | | | $ | 16,000 | | | $ | 0.95 | |
| LT Growth | | | 1 | | | na | | na | | | 12.00 | % |
|
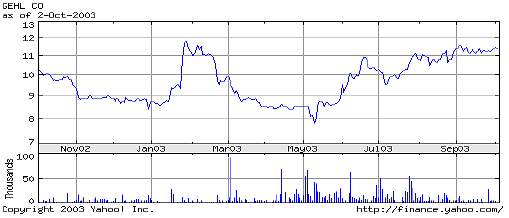
Income and Cashflow Statement Data
| | | | | | | | | | | | | | | | | | | | | | | | |
| | | | | | | | | | Six Months Ended | | Fiscal Years Ended |
| | | | | | LTM | |
| |
|
| | | | | | Jun-03 | | Jun-03 | | Jun-02 | | Dec-02 | | Dec-01 |
Revenue | | $ | 232,890 | | | $ | 127,082 | | | $ | 126,757 | | | $ | 232,565 | | | $ | 240,394 | |
| | Cost of Revenue | | | 184,902 | | | | 100,353 | | | | 99,171 | | | | 183,720 | | | | 187,069 | |
| | | |
| | | |
| | | |
| | | |
| | | |
| |
| | | | Gross Profit | | | 47,988 | | | | 26,729 | | | | 27,586 | | | | 48,845 | | | | 53,325 | |
| | Selling, General & Administrative | | | 41,322 | | | | 21,852 | | | | 23,263 | | | | 42,733 | | | | 39,569 | |
| | Other Operating | | | - | | | | - | | | | - | | | | - | | | | - | |
| | | |
| | | |
| | | |
| | | |
| | | |
| |
| | | | Operating Income | | | 6,666 | | | | 4,877 | | | | 4,323 | | | | 6,112 | | | | 13,756 | |
| | Interest Income / (Expense), net | | | (1,769 | ) | | | (852 | ) | | | (1,149 | ) | | | (2,066 | ) | | | (2,275 | ) |
| | Other Income / (Expense), net | | | (49 | ) | | | 384 | | | | (1,053 | ) | | | (1,486 | ) | | | (3,122 | ) |
| | | |
| | | |
| | | |
| | | |
| | | |
| |
| | | | Pre-tax Income | | | 4,848 | | | | 4,409 | | | | 2,121 | | | | 2,560 | | | | 8,359 | |
| | Taxes | | | 1,293 | | | | 1,473 | | | | 742 | | | | 562 | | | | 1,241 | |
| | | |
| | | |
| | | |
| | | |
| | | |
| |
| | | | After-tax Income | | | 3,555 | | | | 2,936 | | | | 1,379 | | | | 1,998 | | | | 7,118 | |
| | Minority Interest | | | - | | | | - | | | | - | | | | - | | | | - | |
| | Equity in Affiliates | | | - | | | | - | | | | - | | | | - | | | | - | |
| | | |
| | | |
| | | |
| | | |
| | | |
| |
| | | | Normalized Net Income | | | 3,555 | | | | 2,936 | | | | 1,379 | | | | 1,998 | | | | 7,118 | |
| | Preferred Dividends | | | - | | | | - | | | | - | | | | - | | | | - | |
| | | |
| | | |
| | | |
| | | |
| | | |
| |
| | | | Normalized Net Income to Common | | $ | 3,555 | | | $ | 2,936 | | | $ | 1,379 | | | $ | 1,998 | | | $ | 7,118 | |
| | | |
| | | |
| | | |
| | | |
| | | |
| |
| | | | Normalized EBIT | | $ | 6,617 | | | $ | 5,261 | | | $ | 3,270 | | | $ | 4,626 | | | $ | 10,634 | |
| Depreciation & Amortization | | $ | 4,829 | | | $ | 2,563 | | | $ | 2,547 | | | $ | 4,813 | | | $ | 5,416 | |
| | | | Normalized EBITDA | | $ | 11,446 | | | $ | 7,824 | | | $ | 5,817 | | | $ | 9,439 | | | $ | 16,050 | |
| | | | CAPEX | | $ | 3,860 | | | $ | 920 | | | $ | 3,850 | | | $ | 6,790 | | | $ | 4,135 | |
| | | | EBITDA - CAPEX | | $ | 7,586 | | | $ | 6,904 | | | $ | 1,967 | | | $ | 2,649 | | | $ | 11,915 | |
| GAAP Operating Cash Flow | | $ | 11,442 | | | $ | (3,679 | ) | | $ | 1,647 | | | $ | 16,768 | | | $ | (106 | ) |
| Basic Reported Weighted Avg Shares Out (000’s) | | | | | | | 5,360 | | | | 5,387 | | | | 5,390 | | | | 5,345 | |
| | | | Basic Normalized EPS | | $ | 0.66 | | | $ | 0.55 | | | $ | 0.26 | | | $ | 0.37 | | | $ | 1.33 | |
| | | | Basic Reported EPS | | $ | 0.49 | | | $ | 0.51 | | | $ | 0.21 | | | $ | 0.19 | | | $ | 0.43 | |
| Diluted Reported Weighted Avg Shares Out (000’s) | | | | | | | 5,372 | | | | 5,516 | | | | 5,466 | | | | 5,507 | |
| | | | Diluted Normalized EPS | | $ | 0.67 | | | $ | 0.55 | | | $ | 0.25 | | | $ | 0.37 | | | $ | 1.29 | |
| | | | Diluted Reported EPS | | $ | 0.50 | | | $ | 0.51 | | | $ | 0.20 | | | $ | 0.19 | | | $ | 0.42 | |
|
Normalized Reconciliation
|
|
| | Restructuring/Goodwill Impairment | | $ | (844 | ) | | $ | (281 | ) | | $ | (392 | ) | | $ | (955 | ) | | $ | (4,813 | ) |
| | Other Unusual (Expense) Gain Items | | | - | | | | - | | | | - | | | | - | | | | - | |
| | Tax Shelter (Charge) on Unusual Items | | | (43 | ) | | | 94 | | | | 137 | | | | - | | | | - | |
| | | |
| | | |
| | | |
| | | |
| | | |
| |
| | Unusual (Exp) Gain Items, net of Taxes | | | (887 | ) | | | (187 | ) | | | (255 | ) | | | (955 | ) | | | (4,813 | ) |
| | Accounting Changes, net of Taxes | | | - | | | | - | | | | - | | | | - | | | | - | |
| | Discontinued Operations, net of Taxes | | | - | | | | - | | | | - | | | | - | | | | - | |
| | Extraordinary Items, net of Taxes | | | - | | | | - | | | | - | | | | - | | | | - | |
| | | |
| | | |
| | | |
| | | |
| | | |
| |
| | Total Reconciling Items, net of Taxes | | $ | (887 | ) | | $ | (187 | ) | | $ | (255 | ) | | $ | (955 | ) | | $ | (4,813 | ) |
| | | |
| | | |
| | | |
| | | |
| | | |
| |
| | | Reported Income Tax (Benefit) | | $ | 1,336 | | | $ | 1,379 | | | $ | 605 | | | $ | 562 | | | $ | 1,241 | |
| | | Reported Net Income (Loss) | | $ | 2,668 | | | $ | 2,749 | | | $ | 1,124 | | | $ | 1,043 | | | $ | 2,305 | |
|
Revenue Breakdown
|
|
| | Road Construction Equipment | | $ | - | | | $ | - | | | $ | - | | | $ | - | | | $ | - | |
| | Other Heavy Construction | | | 232,890 | | | | 127,082 | | | | 126,757 | | | | 232,565 | | | | 240,394 | |
| | Other | | | - | | | | - | | | | - | | | | - | | | | - | |
| | | |
| | | |
| | | |
| | | |
| | | |
| |
| | | $ | 232,890 | | | $ | 127,082 | | | $ | 126,757 | | | $ | 232,565 | | | $ | 240,394 | |
| | | |
| | | |
| | | |
| | | |
| | | |
| |
| | Road Construction Equipment | | | 0.0 | % | | | 0.0 | % | | | 0.0 | % | | | 0.0 | % | | | 0.0 | % |
| | Other Heavy Construction | | | 100.0 | % | | | 100.0 | % | | | 100.0 | % | | | 100.0 | % | | | 100.0 | % |
| | Other | | | 0.0 | % | | | 0.0 | % | | | 0.0 | % | | | 0.0 | % | | | 0.0 | % |
|
Sources of information: SEC Edgar filings, Multex, Capital IQ, Yahoo and Commodity Systems.
Page 73
| | | |
| Gencor Industries, Inc. | | CONFIDENTIAL |
|
VALUATION ANALYSIS
SELECTED COMPARABLE COMPANY ANALYSIS
| | | |
| Gehl Company Overview (continued) | | ($ in thousands, except per share) |
Balance Sheet Data
| | | | | | | | | | | | | | | |
| | | | | Jun-03 | | Dec-02 | | Dec-01 |
| | | | |
| |
| |
|
| | Cash & Mkt Securities | | $ | 4,742 | | | $ | 2,243 | | | $ | 2,248 | |
| | Accounts Receivable | | | 118,098 | | | | 97,627 | | | | 90,714 | |
| | Inventory | | | 36,550 | | | | 36,771 | | | | 52,161 | |
| | Other Current Assets | | | 16,772 | | | | 16,373 | | | | 18,801 | |
| | | |
| | | |
| | | |
| |
| | | Total Current Assets | | | 176,162 | | | | 153,014 | | | | 163,924 | |
| | PPE, net | | | 45,056 | | | | 46,697 | | | | 43,431 | |
| | Intangibles, net | | | 11,748 | | | | 11,696 | | | | 12,248 | |
| | Deferred Income Taxes | | | - | | | | - | | | | - | |
| | Other Assets | | | 15,037 | | | | 14,662 | | | | 17,806 | |
| | | |
| | | |
| | | |
| |
| | | Total Assets | | $ | 248,003 | | | $ | 226,069 | | | $ | 237,409 | |
| | | |
| | | |
| | | |
| |
| | Accounts Payable | | $ | 33,544 | | | $ | 27,540 | | | $ | 30,644 | |
| | Accrued Expenses | | | 21,300 | | | | 20,315 | | | | 25,661 | |
| | Deferred Revenues | | | - | | | | - | | | | - | |
| | Short Term Debt | | | 1,446 | | | | 1,779 | | | | 161 | |
| | Short Term Capital Leases | | | - | | | | - | | | | - | |
| | Other Current Liabilities | | | 4,426 | | | | - | | | | - | |
| | | |
| | | |
| | | |
| |
| | | Total Current Liabilities | | | 60,716 | | | | 49,634 | | | | 56,466 | |
| | Other LT Liabilities | | | 24,182 | | | | 24,162 | | | | 16,685 | |
| | Long Term Debt | | | 64,426 | | | | 56,135 | | | | 64,237 | |
| | Long Term Capital Leases | | | - | | | | - | | | | - | |
| | Minority Interests | | | - | | | | - | | | | - | |
| | Pref Stock (Liq Value) | | | - | | | | - | | | | - | |
| | | |
| | | |
| | | |
| |
| | | Total Liabilities & Pref Stock | | | 149,324 | | | | 129,931 | | | | 137,388 | |
| | | |
| | | |
| | | |
| |
| | Common Equity | | | 98,679 | | | | 96,138 | | | | 100,021 | |
| | | |
| | | |
| | | |
| |
| | | Total Liabilities & Equity | | $ | 248,003 | | | $ | 226,069 | | | $ | 237,409 | |
| | | |
| | | |
| | | |
| |
| | Common Shares Outstanding (000’s) | | | 5,355 | | | | 5,374 | | | | 5,360 | |
| | Cash Value per share | | $ | 0.89 | | | $ | 0.42 | | | $ | 0.42 | |
| | Common Book Value per share | | $ | 18.43 | | | $ | 17.89 | | | $ | 18.66 | |
| | Common Tangible Book Value per share | | $ | 16.23 | | | $ | 15.71 | | | $ | 16.38 | |
| | Total Debt | | $ | 65,872 | | | $ | 57,914 | | | $ | 64,398 | |
| | Net Debt | | $ | 61,130 | | | $ | 55,671 | | | $ | 62,150 | |
| | Total Capitalization | | $ | 164,551 | | | $ | 154,052 | | | $ | 164,419 | |
|
Balance Sheet Analysis
|
|
Effectiveness and Efficiency | | | | | | | | | | | | |
| | A/R Turnover | | | 2.2x | | | | 2.5x | | | | 2.7x | |
| | Inventory Turnover | | | 5.0x | | | | 4.1x | | | | 3.6x | |
| | Asset Turnover | | | 1.0x | | | | 1.0x | | | | 1.0x | |
| | Days Sales Outstanding | | | 169.0 | | | | 147.8 | | | | 137.7 | |
| | Days Inventory Outstanding | | | 72.4 | | | | 88.3 | | | | 101.8 | |
| | Days Payable Outstanding | | | 49.3 | | | | 46.9 | | | | 49.4 | |
| | Normalized Return on Avg Assets | | | 1.5 | % | | | 0.9 | % | | na |
| | Normalized Return on Avg Common Equity | | | 3.6 | % | | | 2.0 | % | | na |
Financial Strength | | | | | | | | | | | | |
| | Current Ratio | | | 2.9 | | | | 3.1 | | | | 2.9 | |
| | Quick Ratio | | | 2.3 | | | | 2.3 | | | | 2.0 | |
| | Total Debt/Total Capitalization | | | 40.0 | % | | | 37.6 | % | | | 39.2 | % |
| | Total Debt/TIC | | | 52.0 | % | | | 45.7 | % | | | 50.8 | % |
| | Total Debt/EBITDA | | | 5.8x | | | | 6.1x | | | | 4.0x | |
| | Total Debt/EBITDA-CAPEX | | | 8.7x | | | | 21.9x | | | | 5.4x | |
| | EBITDA/Interest Expense | | | 6.5x | | | | 4.6x | | | | 7.1x | |
| | EBITDA-CAPEX/Interest Expense | | | 4.3x | | | | 1.3x | | | | 5.2x | |
Income and Cashflow Analysis
| | | | | | | | | | | | | | | | | | | | | | |
| | | | | | | | Six Months Ended | | Fiscal Years Ended |
| | | | LTM | |
| |
|
| | | | Jun-03 | | Jun-03 | | Jun-02 | | Dec-02 | | Dec-01 |
| | | |
| |
| |
| |
| |
|
Profitability & Cost Ratios (as % of Revenue) | | | | | | | | | | | | | | | | | | | | |
| | Gross Margin | | | 20.6 | % | | | 21.0 | % | | | 21.8 | % | | | 21.0 | % | | | 22.2 | % |
| | S,G & A | | | 17.7 | % | | | 17.2 | % | | | 18.4 | % | | | 18.4 | % | | | 16.5 | % |
| | Operating Income | | | 2.9 | % | | | 3.8 | % | | | 3.4 | % | | | 2.6 | % | | | 5.7 | % |
| | Pre-Tax | | | 2.1 | % | | | 3.5 | % | | | 1.7 | % | | | 1.1 | % | | | 3.5 | % |
| | EBIT | | | 2.8 | % | | | 4.1 | % | | | 2.6 | % | | | 2.0 | % | | | 4.4 | % |
| | EBITDA | | | 4.9 | % | | | 6.2 | % | | | 4.6 | % | | | 4.1 | % | | | 6.7 | % |
| | Normalized Net Income to Common | | | 1.5 | % | | | 2.3 | % | | | 1.1 | % | | | 0.9 | % | | | 3.0 | % |
| | Reported Net Income | | | 1.1 | % | | | 2.2 | % | | | 0.9 | % | | | 0.4 | % | | | 1.0 | % |
| | CAPEX | | | 1.7 | % | | | 0.7 | % | | | 3.0 | % | | | 2.9 | % | | | 1.7 | % |
Period Growth Rates | | | | | | | | | | | | | | | | | | | | |
| | Revenue | | | | | | | 0.3 | % | | | | | | | -3.3 | % | | | | |
| | EBIT | | | | | | | 60.9 | % | | | | | | | -56.5 | % | | | | |
| | EBITDA | | | | | | | 34.5 | % | | | | | | | -41.2 | % | | | | |
Notes
*Restructuring expenses and strategic review costs are normalized out from earnings.
*Latest quarter results were taken from the 8-K filed on July 24, 2003
*Current Liabilities stated are as of Q1 fiscal 2003, with an adjusting entry made under Other Current Liabilities to reconcile the numbers to the second quarter.
Other Analysis
Company Description
Gehl Company designs, manufactures, sells and finances equipment used in the light construction equipment and the agriculture equipment industries. The Company operates in two business segments: construction equipment and agriculture equipment. Construction equipment consists of skid loaders, telescopic handlers, asphalt pavers, compact excavators, compact track loaders, all-wheel-steer loaders and compact loaders and is sold to contractors, sub-contractors, owner operators, rental stores and municipalities. Agriculture equipment include haymaking, forage harvesting, materials handling (skid loaders, telescopic handlers, compact excavators, compact tracked loaders, all-wheel-steer loaders, compact loaders and attachments), manure handling and feedmaking equipment. In addition to the equipment it manufactures, Gehl markets equipment acquired from third-party suppliers. Products acquired from these suppliers accounted for less than 13% of the Company’s net sales in 2002.
Sources of information: SEC Edgar filings, Multex, Capital IQ, Yahoo and Commodity Systems.
Page 74
| | | |
| Gencor Industries, Inc. | | CONFIDENTIAL |
|
VALUATION ANALYSIS
SELECTED COMPARABLE COMPANY ANALYSIS
| | | |
| Art’s Way Manufacturing Overview | | ($ in thousands, except per share) |
Company Information
| | | | | | | |
| Name | | Art’s Way Manufacturing | | Address | | Hwy 9 West, P.O. Box 288 |
| Symbol | | ARTW | | City, State Zip | | Armstrong, IA 50514 |
| Latest Fiscal YE | | 30-Nov-02 | | Telephone | | (712) 864-3131 |
| Latest Rprt Per | | 31-May-03 | | Website | | http://www.artsway-mfg.com/ |
Market Information
| | | | | | | | | | | | | | |
As of Date | | 3-Oct-03 | | Market Cap | | $ | 9,440 | |
| | Exchange | | Nasdaq | | Total Invested Capital (TIC) | | $ | 11,667 | |
| | Stock Price | | $ | 4.87 | | | Enterprise Value (EV) | | $ | 10,687 | |
| | 52 Week High | | $ | 5.24 | | | | | | | | | |
| | 52 Week Low | | $ | 2.70 | | | Insider Ownership | | | 23.00 | % |
| | Avg. Daily Volume (000’s) | | | 1 | | | Institutional | | | | |
| | Beta | | | (0.26 | ) | | % Owned | | | 9.00 | % |
| | Shares Outstanding (000’s) | | | 1,938 | | | Number of Institutions | | | 6 | |
Valuation Analysis
| | | | | | | | | | | | | | |
| | | | Multiple of |
| | | |
|
| | | | Market Cap | | TIC | | EV |
| | | |
| |
| |
|
Latest Twelve Months | | | | | | | | | | | | |
| | Revenue | | | 0.86x | | | | 1.07x | | | | 0.98x | |
| | EBIT | | | 8.64x | | | | 10.68x | | | | 9.79x | |
| | EBITDA | | | 6.93x | | | | 8.57x | | | | 7.85x | |
| | Normalized Net Income | | | 9.81x | | | | 12.13x | | | | 11.11x | |
| | Basic Normalized EPS | | | 9.55x | | | na | | na |
Projected | | | | | | | | | | | | |
| | Dec-03 Mean Revenue | | na | | na | | na |
| | Dec-04 Mean Revenue | | na | | na | | na |
| | Dec-03 Mean EBITDA | | na | | na | | na |
| | Dec-04 Mean EBITDA | | na | | na | | na |
| | Dec-03 Mean EPS | | na | | na | | na |
| | Dec-04 Mean EPS | | na | | na | | na |
Most Recent Filing | | | | | | | | | | | | |
| | Assets | | | 1.20x | | | | 1.48x | | | | 1.36x | |
| | Common Equity | | | 2.69x | | | na | | na |
| | Tangible Common Equity | | | 2.69x | | | na | | na |
Mean Consensus Estimates
| | | | | | | | | | | | | | | | | |
| Year Ending | | # Ests | | Revenue | | EBITDA | | EPS |
| |
| |
| |
| |
|
| December-03 | | na | | $ | - | | | $ | - | | | $ | - | |
| December-04 | | na | | $ | - | | | $ | - | | | $ | - | |
| LT Growth | | na | | na | | na | | na |
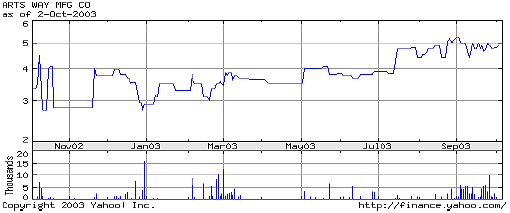
Income and Cashflow Statement Data
| | | | | | | | | | | | | | | | | | | | | | | | |
| | | | | | | | | | Six Months Ended | | Fiscal Years Ended |
| | | | | | LTM | |
| |
|
| | | | | | May-03 | | May-03 | | May-02 | | Nov-02 | | Nov-01 |
| | | | | |
| |
| |
| |
| |
|
Revenue | | $ | 10,945 | | | $ | 4,941 | | | $ | 4,895 | | | $ | 10,899 | | | $ | 10,891 | |
| | Cost of Revenue | | | 7,953 | | | | 3,505 | | | | 3,682 | | | | 8,130 | | | | 8,768 | |
| | | |
| | | |
| | | |
| | | |
| | | |
| |
| | | | Gross Profit | | | 2,992 | | | | 1,436 | | | | 1,213 | | | | 2,769 | | | | 2,123 | |
| | Selling, General & Administrative | | | 1,873 | | | | 994 | | | | 1,089 | | | | 1,968 | | | | 2,409 | |
| | Other Operating | | | - | | | | - | | | | - | | | | - | | | | - | |
| | | |
| | | |
| | | |
| | | |
| | | |
| |
| | | | Operating Income | | | 1,119 | | | | 442 | | | | 124 | | | | 801 | | | | (286 | ) |
| | Interest Income / (Expense), net | | | (124 | ) | | | (49 | ) | | | (95 | ) | | | (170 | ) | | | (411 | ) |
| | Other Income / (Expense), net | | | (27 | ) | | | (16 | ) | | | (47 | ) | | | (58 | ) | | | 9 | |
| | | |
| | | |
| | | |
| | | |
| | | |
| |
| | | | Pre-tax Income | | | 968 | | | | 377 | | | | (18 | ) | | | 573 | | | | (688 | ) |
| | Taxes | | | 6 | | | | 2 | | | | - | | | | 4 | | | | 64 | |
| | | |
| | | |
| | | |
| | | |
| | | |
| |
| | | | After-tax Income | | | 962 | | | | 375 | | | | (18 | ) | | | 569 | | | | (752 | ) |
| | Minority Interest | | | - | | | | - | | | | - | | | | - | | | | - | |
| | Equity in Affiliates | | | - | | | | - | | | | - | | | | - | | | | - | |
| | | |
| | | |
| | | |
| | | |
| | | |
| |
| | | | Normalized Net Income | | | 962 | | | | 375 | | | | (18 | ) | | | 569 | | | | (752 | ) |
| | Preferred Dividends | | | - | | | | - | | | | - | | | | - | | | | - | |
| | | |
| | | |
| | | |
| | | |
| | | |
| |
| | | | Normalized Net Income to Common | | $ | 962 | | | $ | 375 | | | $ | (18 | ) | | $ | 569 | | | $ | (752 | ) |
| | | |
| | | |
| | | |
| | | |
| | | |
| |
| | | | Normalized EBIT | | $ | 1,092 | | | $ | 426 | | | $ | 77 | | | $ | 743 | | | $ | (277 | ) |
| Depreciation & Amortization | | $ | 270 | | | $ | 140 | | | $ | 122 | | | $ | 252 | | | $ | 453 | |
| | | | Normalized EBITDA | | $ | 1,362 | | | $ | 566 | | | $ | 199 | | | $ | 995 | | | $ | 176 | |
| | | | CAPEX | | $ | 142 | | | $ | - | | | $ | - | | | $ | 142 | | | $ | 58 | |
| | | | EBITDA - CAPEX | | $ | 1,220 | | | $ | 566 | | | $ | 199 | | | $ | 853 | | | $ | 118 | |
| GAAP Operating Cash Flow | | $ | 585 | | | $ | (99 | ) | | $ | 841 | | | $ | 1,525 | | | $ | 901 | |
| Basic Reported Weighted Avg Shares Out (000’s) | | | | | | | 1,938 | | | | 1,678 | | | | 1,808 | | | | 1,280 | |
| | | | Basic Normalized EPS | | $ | 0.51 | | | $ | 0.19 | | | $ | (0.01 | ) | | $ | 0.31 | | | $ | (0.59 | ) |
| | | | Basic Reported EPS | | $ | 0.51 | | | $ | 0.19 | | | $ | (0.01 | ) | | $ | 0.31 | | | $ | (1.86 | ) |
| Diluted Reported Weighted Avg Shares Out (000’s) | | | | | | | 1,949 | | | | 1,678 | | | | 1,811 | | | | 1,280 | |
| | | | Diluted Normalized EPS | | $ | 0.51 | | | $ | 0.19 | | | $ | (0.01 | ) | | $ | 0.31 | | | $ | (0.59 | ) |
| | | | Diluted Reported EPS | | $ | 0.51 | | | $ | 0.19 | | | $ | (0.01 | ) | | $ | 0.31 | | | $ | (1.86 | ) |
|
Normalized Reconciliation
|
|
| | Restructuring/Goodwill Impairment | | $ | - | | | $ | - | | | $ | - | | | $ | - | | | $ | - | |
| | Other Unusual (Expense) Gain Items | | | - | | | | - | | | | - | | | | - | | | | (1,629 | ) |
| | Tax Shelter (Charge) on Unusual Items | | | - | | | | - | | | | - | | | | - | | | | - | |
| | | |
| | | |
| | | |
| | | |
| | | |
| |
| | Unusual (Exp) Gain Items, net of Taxes | | | - | | | | - | | | | - | | | | - | | | | (1,629 | ) |
| | Accounting Changes, net of Taxes | | | - | | | | - | | | | - | | | | - | | | | - | |
| | Discontinued Operations, net of Taxes | | | - | | | | - | | | | - | | | | - | | | | - | |
| | Extraordinary Items, net of Taxes | | | - | | | | - | | | | - | | | | - | | | | - | |
| | | |
| | | |
| | | |
| | | |
| | | |
| |
| | Total Reconciling Items, net of Taxes | | $ | - | | | $ | - | | | $ | - | | | $ | - | | | $ | (1,629 | ) |
| | | |
| | | |
| | | |
| | | |
| | | |
| |
| | | Reported Income Tax (Benefit) | | $ | 6 | | | $ | 2 | | | $ | - | | | $ | 4 | | | $ | 64 | |
| | | Reported Net Income (Loss) | | $ | 962 | | | $ | 375 | | | $ | (18 | ) | | $ | 569 | | | $ | (2,381 | ) |
|
Revenue Breakdown
|
|
| | Road Construction Equipment | | $ | - | | | $ | - | | | $ | - | | | $ | - | | | $ | - | |
| | Other Heavy Construction | | | 10,945 | | | | 4,941 | | | | 4,895 | | | | 10,899 | | | | 10,891 | |
| | Other | | | - | | | | - | | | | - | | | | - | | | | - | |
| | | |
| | | |
| | | |
| | | |
| | | |
| |
| | | $ | 10,945 | | | $ | 4,941 | | | $ | 4,895 | | | $ | 10,899 | | | $ | 10,891 | |
| | | |
| | | |
| | | |
| | | |
| | | |
| |
| | Road Construction Equipment | | | 0.0 | % | | | 0.0 | % | | | 0.0 | % | | | 0.0 | % | | | 0.0 | % |
| | Other Heavy Construction | | | 100.0 | % | | | 100.0 | % | | | 100.0 | % | | | 100.0 | % | | | 100.0 | % |
| | Other | | | 0.0 | % | | | 0.0 | % | | | 0.0 | % | | | 0.0 | % | | | 0.0 | % |
|
Sources of information: SEC Edgar filings, Multex, Capital IQ, Yahoo and Commodity Systems.
Page 75
| | | |
| Gencor Industries, Inc. | | CONFIDENTIAL |
|
VALUATION ANALYSIS
SELECTED COMPARABLE COMPANY ANALYSIS
| | | |
| Art’s Way Manufacturing Overview (continued) | | ($ in thousands, except per share) |
Balance Sheet Data
| | | | | | | | | | | | | | | |
| | | | | May-03 | | Nov-02 | | Nov-01 |
| | | | |
| |
| |
|
| | Cash & Mkt Securities | | $ | 980 | | | $ | 75 | | | $ | 4 | |
| | Accounts Receivable | | | 1,183 | | | | 593 | | | | 922 | |
| | Inventory | | | 4,155 | | | | 3,577 | | | | 4,315 | |
| | Other Current Assets | | | 71 | | | | 95 | | | | 54 | |
| | | |
| | | |
| | | |
| |
| | | Total Current Assets | | | 6,389 | | | | 4,340 | | | | 5,295 | |
| | PPE, net | | | 835 | | | | 975 | | | | 1,084 | |
| | Intangibles, net | | | - | | | | - | | | | - | |
| | Deferred Income Taxes | | | - | | | | - | | | | - | |
| | Other Assets | | | 642 | | | | 606 | | | | 376 | |
| | | |
| | | |
| | | |
| |
| | | Total Assets | | $ | 7,866 | | | $ | 5,921 | | | $ | 6,755 | |
| | | |
| | | |
| | | |
| |
| | Accounts Payable | | $ | 252 | | | $ | 523 | | | $ | 984 | |
| | Accrued Expenses | | | 734 | | | | 631 | | | | 634 | |
| | Deferred Revenues | | | - | | | | - | | | | - | |
| | Short Term Debt | | | 122 | | | | 676 | | | | 3,036 | |
| | Short Term Capital Leases | | | - | | | | - | | | | - | |
| | Other Current Liabilities | | | 984 | | | | 250 | | | | 65 | |
| | | |
| | | |
| | | |
| |
| | | Total Current Liabilities | | | 2,092 | | | | 2,080 | | | | 4,719 | |
| | Other LT Liabilities | | | 160 | | | | 187 | | | | - | |
| | Long Term Debt | | | 2,105 | | | | 521 | | | | 272 | |
| | Long Term Capital Leases | | | - | | | | - | | | | - | |
| | Minority Interests | | | - | | | | - | | | | - | |
| | Pref Stock (Liq Value) | | | - | | | | - | | | | - | |
| | | |
| | | |
| | | |
| |
| | | Total Liabilities & Pref Stock | | | 4,357 | | | | 2,788 | | | | 4,991 | |
| | | |
| | | |
| | | |
| |
| | Common Equity | | | 3,509 | | | | 3,133 | | | | 1,764 | |
| | | |
| | | |
| | | |
| |
| | | Total Liabilities & Equity | | $ | 7,866 | | | $ | 5,921 | | | $ | 6,755 | |
| | | |
| | | |
| | | |
| |
| | Common Shares Outstanding (000’s) | | | 1,938 | | | | 1,938 | | | | 1,298 | |
| | Cash Value per share | | $ | 0.51 | | | $ | 0.04 | | | $ | 0.00 | |
| | Common Book Value per share | | $ | 1.81 | | | $ | 1.62 | | | $ | 1.36 | |
| | Common Tangible Book Value per share | | $ | 1.81 | | | $ | 1.62 | | | $ | 1.36 | |
| | Total Debt | | $ | 2,227 | | | $ | 1,197 | | | $ | 3,308 | |
| | Net Debt | | $ | 1,247 | | | $ | 1,122 | | | $ | 3,304 | |
| | Total Capitalization | | $ | 5,736 | | | $ | 4,330 | | | $ | 5,072 | |
|
Balance Sheet Analysis
|
|
Effectiveness and Efficiency | | | | | | | | | | | | |
| | A/R Turnover | | | 12.3x | | | | 14.4x | | | | 11.8x | |
| | Inventory Turnover | | | 2.1x | | | | 2.1x | | | | 2.0x | |
| | Asset Turnover | | | 1.6x | | | | 1.7x | | | | 1.6x | |
| | Days Sales Outstanding | | | 29.6 | | | | 25.4 | | | | 30.9 | |
| | Days Inventory Outstanding | | | 177.4 | | | | 177.2 | | | | 179.6 | |
| | Days Payable Outstanding | | | 14.4 | | | | 27.2 | | | | 32.1 | |
| | Normalized Return on Avg Assets | | | 14.0 | % | | | 9.0 | % | | na |
| | Normalized Return on Avg Common Equity | | | 29.0 | % | | | 23.2 | % | | na |
Financial Strength | | | | | | | | | | | | |
| | Current Ratio | | | 3.1 | | | | 2.1 | | | | 1.1 | |
| | Quick Ratio | | | 1.1 | | | | 0.4 | | | | 0.2 | |
| | Total Debt/Total Capitalization | | | 38.8 | % | | | 27.6 | % | | | 65.2 | % |
| | Total Debt/TIC | | | 19.1 | % | | | 10.3 | % | | | 28.4 | % |
| | Total Debt/EBITDA | | | 1.6x | | | | 1.2x | | | | 18.8x | |
| | Total Debt/EBITDA-CAPEX | | | 1.8x | | | | 1.4x | | | | 28.0x | |
| | EBITDA/Interest Expense | | | 11.0x | | | | 5.9x | | | | 0.4x | |
| | EBITDA-CAPEX/Interest Expense | | | 9.8x | | | | 5.0x | | | | 0.3x | |
Income and Cashflow Analysis
| | | | | | | | | | | | | | | | | | | | | | |
| | | | | | | | Six Months Ended | | Fiscal Years Ended |
| | | | LTM | |
| |
|
| | | | May-03 | | May-03 | | May-02 | | Nov-02 | | Nov-01 |
| | | |
| |
| |
| |
| |
|
Profitability & Cost Ratios (as % of Revenue) | | | | | | | | | | | | | | | | | | | | |
| | Gross Margin | | | 27.3 | % | | | 29.1 | % | | | 24.8 | % | | | 25.4 | % | | | 19.5 | % |
| | S,G & A | | | 17.1 | % | | | 20.1 | % | | | 22.2 | % | | | 18.1 | % | | | 22.1 | % |
| | Operating Income | | | 10.2 | % | | | 8.9 | % | | | 2.5 | % | | | 7.3 | % | | | -2.6 | % |
| | Pre-Tax | | | 8.8 | % | | | 7.6 | % | | | -0.4 | % | | | 5.3 | % | | | -6.3 | % |
| | EBIT | | | 10.0 | % | | | 8.6 | % | | | 1.6 | % | | | 6.8 | % | | | -2.5 | % |
| | EBITDA | | | 12.4 | % | | | 11.5 | % | | | 4.1 | % | | | 9.1 | % | | | 1.6 | % |
| | Normalized Net Income to Common | | | 8.8 | % | | | 7.6 | % | | | -0.4 | % | | | 5.2 | % | | | -6.9 | % |
| | Reported Net Income | | | 8.8 | % | | | 7.6 | % | | | -0.4 | % | | | 5.2 | % | | | -21.9 | % |
| | CAPEX | | | 1.3 | % | | | 0.0 | % | | | 0.0 | % | | | 1.3 | % | | | 0.5 | % |
Period Growth Rates | | | | | | | | | | | | | | | | | | | | |
| | Revenue | | | | | | | 0.9 | % | | | | | | | 0.1 | % | | | | |
| | EBIT | | | | | | | 453.2 | % | | | | | | | -368.2 | % | | | | |
| | EBITDA | | | | | | | 184.4 | % | | | | | | | 465.3 | % | | | | |
Notes
Unusual expense includes loss on inventory disposition and asset impairment writedown
Other Analysis
Company Description
Art’s-Way Manufacturing Co., Inc. manufactures specialized farm machinery under its own and private labels. Equipment manufactured by the Company under its own label includes: portable and stationary animal feed processing equipment and related attachments used to mill and mix feed grains into custom animal feed rations; a high bulk mixing wagon to mix animal feeds containing silage, hay, and grain; a line of mowers and stalk shredders; minimum till seed bed preparation equipment; sugar beet and potato harvesting equipment; and a line of land maintenance equipment, edible bean equipment, and grain drill equipment. Art’s-Way labeled products are sold by farm equipment dealers throughout the United States.
Sources of information: SEC Edgar filings, Multex, Capital IQ, Yahoo and Commodity Systems.
Page 76
| | | |
| Gencor Industries, Inc. | | CONFIDENTIAL |
|
VALUATION ANALYSIS
SELECTED COMPARABLE COMPANY ANALYSIS
| | | |
| Gencor Industries, Inc. Overview | | ($ in thousands, except per share) |
Company Information
| | | | | | | |
| Name | | Gencor Industries, Inc. | | Address | | 5201 N. Orange Blossom Trail |
| Symbol | | GNCI | | City, State Zip | | Orlando, FL 32810 |
| Latest Fiscal YE | | 30-Sep-02 | | Telephone | | (407) 290-6000 |
| Latest Rprt Per | | 30-Jun-03 | | Website | | http://www.gencor.com/ |
Market Information
| | | | | | | | | | | | | | |
As of Date | | 3-Oct-03 | | Market Cap | | $ | 21,271 | |
| | Exchange | | OTC | | Total Invested Capital (TIC) | | $ | 36,730 | |
| | Stock Price | | $ | 2.45 | | | Enterprise Value (EV) | | $ | 20,617 | |
| | 52 Week High | | $ | 3.45 | | | | | | | | | |
| | 52 Week Low | | $ | 0.75 | | | Insider Ownership | | | 25.00 | % |
| | Avg. Daily Volume (000’s) | | | 5 | | | Institutional | | | | |
| | Beta | | | 0.02 | | | % Owned | | | 0.00 | % |
| | Shares Outstanding (000’s) | | | 8,682 | | | Number of Institutions | | | - | |
Valuation Analysis
| | | | | | | | | | | | | | |
| | | | Multiple of |
| | | |
|
| | | | Market Cap | | TIC | | EV |
| | | |
| |
| |
|
Latest Twelve Months | | | | | | | | | | | | |
| | Revenue | | | 0.33x | | | | 0.57x | | | | 0.32x | |
| | EBIT | | | 8.93x | | | | 15.43x | | | | 8.66x | |
| | EBITDA | | | 6.46x | | | | 11.15x | | | | 6.26x | |
| | Normalized Net Income | | na | | na | | na |
| | Basic Normalized EPS | | na | | na | | na |
Projected | | | | | | | | | | | | |
| | Sep-03 Mean Revenue | | | 0.38x | | | | 0.66x | | | | 0.37x | |
| | Sep-04 Mean Revenue | | | 0.42x | | | | 0.72x | | | | 0.40x | |
| | Sep-03 Mean EBITDA | | | 7.71x | | | | 13.32x | | | | 7.48x | |
| | Sep-04 Mean EBITDA | | | 4.87x | | | | 8.41x | | | | 4.72x | |
| | Sep-03 Mean EPS | | na | | na | | na |
| | Sep-04 Mean EPS | | na | | na | | na |
Most Recent Filing | | | | | | | | | | | | |
| | Assets | | | 0.38x | | | | 0.66x | | | | 0.37x | |
| | Common Equity | | | 1.65x | | | na | | na |
| | Tangible Common Equity | | | 1.70x | | | na | | na |
Mean Consensus Estimates
| | | | | | | | | | | | | | | | | |
| Year Ending | | # Ests | | Revenue | | EBITDA | | EPS |
| |
| |
| |
| |
|
| September-03 | | na | | $ | 55,843 | | | $ | 2,758 | | | $ | - | |
| September-04 | | na | | $ | 51,014 | | | $ | 4,370 | | | $ | - | |
| LT Growth | | | na | | | | na | | | | na | | | | na | |
|

Income and Cashflow Statement Data
| | | | | | | | | | | | | | | | | | | | | | | | |
| | | | | | | | | | Nine Months Ended | | Fiscal Years Ended |
| | | | | | LTM | |
| |
|
| | | | | | Jun-03 | | Jun-03 | | Jun-02 | | Sep-02 | | Sep-01 |
| | | | | |
| |
| |
| |
| |
|
Revenue | | $ | 64,651 | | | $ | 48,324 | | | $ | 51,158 | | | $ | 67,485 | | | $ | 71,134 | |
| | Cost of Revenue | | | 48,344 | | | | 35,591 | | | | 38,179 | | | | 50,932 | | | | 53,270 | |
| | | |
| | | |
| | | |
| | | |
| | | |
| |
| | | | Gross Profit | | | 16,307 | | | | 12,733 | | | | 12,979 | | | | 16,553 | | | | 17,864 | |
| | Selling, General & Administrative | | | 12,108 | | | | 9,170 | | | | 9,553 | | | | 12,491 | | | | 14,311 | |
| | Other Operating | | | 1,710 | | | | 1,309 | | | | 1,300 | | | | 1,701 | | | | 2,351 | |
| | | |
| | | |
| | | |
| | | |
| | | |
| |
| | | | Operating Income | | | 2,489 | | | | 2,254 | | | | 2,126 | | | | 2,361 | | | | 1,202 | |
| | Interest Income / (Expense), net | | | (1,655 | ) | | | (1,143 | ) | | | (1,619 | ) | | | (2,131 | ) | | | (476 | ) |
| | Other Income / (Expense), net | | | (108 | ) | | | 12 | | | | 28 | | | | (92 | ) | | | (117 | ) |
| | | |
| | | |
| | | |
| | | |
| | | |
| |
| | | | Pre-tax Income | | | 726 | | | | 1,123 | | | | 535 | | | | 138 | | | | 609 | |
| | Taxes | | | 821 | | | | 1,116 | | | | 256 | | | | (39 | ) | | | - | |
| | | |
| | | |
| | | |
| | | |
| | | |
| |
| | | | After-tax Income | | | (95 | ) | | | 7 | | | | 279 | | | | 177 | | | | 609 | |
| | Minority Interest | | | - | | | | - | | | | - | | | | - | | | | - | |
| | Equity in Affiliates | | | - | | | | - | | | | - | | | | - | | | | - | |
| | | |
| | | |
| | | |
| | | |
| | | |
| |
| | | | Normalized Net Income | | | (95 | ) | | | 7 | | | | 279 | | | | 177 | | | | 609 | |
| | Preferred Dividends | | | - | | | | - | | | | - | | | | - | | | | - | |
| | | |
| | | |
| | | |
| | | |
| | | |
| |
| | | | Normalized Net Income to Common | | $ | (95 | ) | | $ | 7 | | | $ | 279 | | | $ | 177 | | | $ | 609 | |
| | | |
| | | |
| | | |
| | | |
| | | |
| |
| | | | Normalized EBIT | | $ | 2,381 | | | $ | 2,266 | | | $ | 2,154 | | | $ | 2,269 | | | $ | 1,085 | |
| Depreciation & Amortization | | $ | 914 | | | $ | 706 | | | $ | 1,170 | | | $ | 1,378 | | | $ | 4,021 | |
| | | | Normalized EBITDA | | $ | 3,295 | | | $ | 2,972 | | | $ | 3,324 | | | $ | 3,647 | | | $ | 5,106 | |
| | | | CAPEX | | $ | 169 | | | $ | 84 | | | $ | 219 | | | $ | 304 | | | $ | 88 | |
| | | | EBITDA - CAPEX | | $ | 3,126 | | | $ | 2,888 | | | $ | 3,105 | | | $ | 3,343 | | | $ | 5,018 | |
| GAAP Operating Cash Flow | | $ | 6,650 | | | $ | 5,351 | | | $ | (515 | ) | | $ | 784 | | | $ | 11,441 | |
| Basic Reported Weighted Avg Shares Out (000’s) | | | | | | | 8,682 | | | | 8,682 | | | | 8,682 | | | | 8,682 | |
| | | | Basic Normalized EPS | | $ | (0.01 | ) | | $ | - | | | $ | 0.03 | | | $ | 0.02 | | | $ | 0.07 | |
| | | | Basic Reported EPS | | $ | 0.93 | | | $ | 0.87 | | | $ | 0.18 | | | $ | 0.24 | | | $ | 1.03 | |
| Diluted Reported Weighted Avg Shares Out (000’s) | | | | | | | 8,682 | | | | 9,072 | | | | 9,072 | | | | 8,682 | |
| | | | Diluted Normalized EPS | | $ | (0.01 | ) | | $ | - | | | $ | 0.03 | | | $ | 0.02 | | | $ | 0.07 | |
| | | | Diluted Reported EPS | | $ | 0.93 | | | $ | 0.87 | | | $ | 0.17 | | | $ | 0.23 | | | $ | 1.03 | |
|
Normalized Reconciliation
|
|
| | Restructuring/Goodwill Impairment | | $ | - | | | $ | - | | | $ | (302 | ) | | $ | (302 | ) | | $ | (5,072 | ) |
| | Other Unusual (Expense) Gain Items | | | 11,372 | | | | 12,228 | | | | 1,954 | | | | 1,098 | | | | 215 | |
| | Tax Shelter (Charge) on Unusual Items | | | (4,122 | ) | | | (4,700 | ) | | | (578 | ) | | | - | | | | - | |
| | | |
| | | |
| | | |
| | | |
| | | |
| |
| | Unusual (Exp) Gain Items, net of Taxes | | | 7,250 | | | | 7,528 | | | | 1,074 | | | | 796 | | | | (4,857 | ) |
| | Accounting Changes, net of Taxes | | | - | | | | - | | | | - | | | | - | | | | - | |
| | Discontinued Operations, net of Taxes | | | 69 | | | | - | | | | 172 | | | | 241 | | | | 5,695 | |
| | Extraordinary Items, net of Taxes | | | - | | | | - | | | | - | | | | - | | | | 7,476 | |
| | | |
| | | |
| | | |
| | | |
| | | |
| |
| | Total Reconciling Items, net of Taxes | | $ | 7,319 | | | $ | 7,528 | | | $ | 1,246 | | | $ | 1,037 | | | $ | 8,314 | |
| | | |
| | | |
| | | |
| | | |
| | | |
| |
| | | Reported Income Tax (Benefit) | | $ | 4,943 | | | $ | 5,816 | | | $ | 834 | | | $ | (39 | ) | | $ | - | |
| | | Reported Net Income (Loss) | | $ | 8,080 | | | $ | 7,535 | | | $ | 1,525 | | | $ | 2,070 | | | $ | 8,923 | |
|
Revenue Breakdown
|
|
| | Road Construction Equipment | | $ | 64,651 | | | $ | 48,324 | | | $ | 51,158 | | | $ | 67,485 | | | $ | 71,134 | |
| | Other Heavy Construction | | | - | | | | - | | | | - | | | | - | | | | - | |
| | | |
| | | |
| | | |
| | | |
| | | |
| |
| | Other | | | - | | | | - | | | | - | | | | - | | | | - | |
| | | |
| | | |
| | | |
| | | |
| | | |
| |
| | | $ | 64,651 | | | $ | 48,324 | | | $ | 51,158 | | | $ | 67,485 | | | $ | 71,134 | |
| | | |
| | | |
| | | |
| | | |
| | | |
| |
| | Road Construction Equipment | | | 100.0 | % | | | 100.0 | % | | | 100.0 | % | | | 100.0 | % | | | 100.0 | % |
| | Other Heavy Construction | | | 0.0 | % | | | 0.0 | % | | | 0.0 | % | | | 0.0 | % | | | 0.0 | % |
| | Other | | | 0.0 | % | | | 0.0 | % | | | 0.0 | % | | | 0.0 | % | | | 0.0 | % |
|
Sources of information: SEC Edgar filings, Multex, Capital IQ, Yahoo and Commodity Systems.
Page 77
| | | |
| Gencor Industries, Inc. | | CONFIDENTIAL |
|
VALUATION ANALYSIS
SELECTED COMPARABLE COMPANY ANALYSIS
| | | |
| Gencor Industries, Inc. Overview (continued) | | ($ in thousands, except per share) |
Balance Sheet Data
| | | | | | | | | | | | | | | | | | | | | | | |
| | | | | Jun-03 | | Sep-02 | | Sep-01 | | | | | | | | |
| | | | |
| |
| |
| | | | | | | | |
| | Cash & Mkt Securities | | $ | 16,113 | | | $ | 12,305 | | | $ | 14,158 | | | | | | | | | |
| | Accounts Receivable | | | 4,390 | | | | 8,512 | | | | 8,672 | | | | | | | | | |
| | Inventory | | | 14,156 | | | | 19,012 | | | | 23,105 | | | | | | | | | |
| | Other Current Assets | | | 1,115 | | | | 1,938 | | | | 2,021 | | | | | | | | | |
| | | |
| | | |
| | | |
| | | | | | | | | |
| | | Total Current Assets | | | 35,774 | | | | 41,767 | | | | 47,956 | | | | | | | | | |
| | PPE, net | | | 15,131 | | | | 15,693 | | | | 16,774 | | | | | | | | | |
| | Intangibles, net | | | 364 | | | | 364 | | | | 379 | | | | | | | | | |
| | Deferred Income Taxes | | | - | | | | - | | | | - | | | | | | | | | |
| | Other Assets | | | 4,292 | | | | 4,360 | | | | 4,478 | | | | | | | | | |
| | | |
| | | |
| | | |
| | | | | | | | | |
| | | Total Assets | | $ | 55,561 | | | $ | 62,184 | | | $ | 69,587 | | | | | | | | | |
| | | |
| | | |
| | | |
| | | | | | | | | |
| | Accounts Payable | | $ | 6,289 | | | $ | 9,000 | | | $ | 8,788 | | | | | | | | | |
| | Accrued Expenses | | | 8,440 | | | | 9,947 | | | | 15,513 | | | | | | | | | |
| | Deferred Revenues | | | - | | | | - | | | | - | | | | | | | | | |
| | Short Term Debt | | | 5,439 | | | | 6,264 | | | | 1,495 | | | | | | | | | |
| | Short Term Capital Leases | | | - | | | | - | | | | - | | | | | | | | | |
| | Other Current Liabilities | | | 9,211 | | | | 4,032 | | | | 3,875 | | | | | | | | | |
| | | |
| | | |
| | | |
| | | | | | | | | |
| | | Total Current Liabilities | | | 29,379 | | | | 29,243 | | | | 29,671 | | | | | | | | | |
| | Other LT Liabilities | | | 3,309 | | | | 3,309 | | | | 3,309 | | | | | | | | | |
| | Long Term Debt | | | 10,020 | | | | 24,337 | | | | 34,333 | | | | | | | | | |
| | Long Term Capital Leases | | | - | | | | - | | | | - | | | | | | | | | |
| | Minority Interests | | | - | | | | - | | | | - | | | | | | | | | |
| | Pref Stock (Liq Value) | | | - | | | | - | | | | - | | | | | | | | | |
| | | |
| | | |
| | | |
| | | | | | | | | |
| | | Total Liabilities & Pref Stock | | | 42,708 | | | | 56,889 | | | | 67,313 | | | | | | | | | |
| | | |
| | | |
| | | |
| | | | | | | | | |
| | Common Equity | | | 12,853 | | | | 5,295 | | | | 2,274 | | | | | | | | | |
| | | |
| | | |
| | | |
| | | | | | | | | |
| | | Total Liabilities & Equity | | $ | 55,561 | | | $ | 62,184 | | | $ | 69,587 | | | | | | | | | |
| | | |
| | | |
| | | |
| | | | | | | | | |
| | Common Shares Outstanding (000’s) | | | 8,682 | | | | 8,682 | | | | 8,682 | | | | | | | | | |
| | Cash Value per share | | $ | 1.86 | | | $ | 1.42 | | | $ | 1.63 | | | | | | | | | |
| | Common Book Value per share | | $ | 1.48 | | | $ | 0.61 | | | $ | 0.26 | | | | | | | | | |
| | Common Tangible Book Value per share | | $ | 1.44 | | | $ | 0.57 | | | $ | 0.22 | | | | | | | | | |
| | Total Debt | | $ | 15,459 | | | $ | 30,601 | | | $ | 35,828 | | | | | | | | | |
| | Net Debt | | $ | (654 | ) | | $ | 18,296 | | | $ | 21,670 | | | | | | | | | |
| | Total Capitalization | | $ | 28,312 | | | $ | 35,896 | | | $ | 38,102 | | | | | | | | | |
|
Balance Sheet Analysis
|
|
Effectiveness and Efficiency | | | | | | | | | | | | | | | | | | | | |
| | A/R Turnover | | | 10.0x | | | | 7.9x | | | | 8.2x | | | | | | | | | |
| | Inventory Turnover | | | 2.9x | | | | 2.4x | | | | 2.3x | | | | | | | | | |
| | Asset Turnover | | | 1.1x | | | | 1.0x | | | | 1.0x | | | | | | | | | |
| | Days Sales Outstanding | | | 36.4 | | | | 46.5 | | | | 44.5 | | | | | | | | | |
| | Days Inventory Outstanding | | | 125.2 | | | | 150.9 | | | | 158.3 | | | | | | | | | |
| | Days Payable Outstanding | | | 44.9 | | | | 49.8 | | | | 45.9 | | | | | | | | | |
| | Normalized Return on Avg Assets | | | -0.2% | | | | 0.3% | | | | na | | | | | | | | | |
| | Normalized Return on Avg Common Equity | | | -1.1% | | | | 4.7% | | | | na | | | | | | | | | |
Financial Strength | | | | | | | | | | | | | | | | | | | | |
| | Current Ratio | | | 1.2 | | | | 1.4 | | | | 1.6 | | | | | | | | | |
| | Quick Ratio | | | 0.7 | | | | 0.8 | | | | 0.8 | | | | | | | | | |
| | Total Debt/Total Capitalization | | | 54.6% | | | | 85.2% | | | | 94.0% | | | | | | | | | |
| | Total Debt/TIC | | | 42.1% | | | | 83.3% | | | | 97.5% | | | | | | | | | |
| | Total Debt/EBITDA | | | 4.7x | | | | 8.4x | | | | 7.0x | | | | | | | | | |
| | Total Debt/EBITDA-CAPEX | | | 4.9x | | | | 9.2x | | | | 7.1x | | | | | | | | | |
| | EBITDA/Interest Expense | | | 2.0x | | | | 1.7x | | | | 10.7x | | | | | | | | | |
| | EBITDA-CAPEX/Interest Expense | | | 1.9x | | | | 1.6x | | | | 10.5x | | | | | | | | | |
Income and Cashflow Analysis
| | | | | | | | | | | | | | | | | | | | | | |
| | | | | | | | Nine Months Ended | | Fiscal Years Ended |
| | | | LTM | |
| |
|
| | | | Jun-03 | | Jun-03 | | Jun-02 | | Sep-02 | | Sep-01 |
| | | |
| |
| |
| |
| |
|
Profitability & Cost Ratios (as % of Revenue) | | | | | | | | | | | | | | | | | | | | |
| | Gross Margin | | | 25.2 | % | | | 26.3 | % | | | 25.4 | % | | | 24.5 | % | | | 25.1 | % |
| | S,G & A | | | 18.7 | % | | | 19.0 | % | | | 18.7 | % | | | 18.5 | % | | | 20.1 | % |
| | Operating Income | | | 3.8 | % | | | 4.7 | % | | | 4.2 | % | | | 3.5 | % | | | 1.7 | % |
| | Pre-Tax | | | 1.1 | % | | | 2.3 | % | | | 1.0 | % | | | 0.2 | % | | | 0.9 | % |
| | EBIT | | | 3.7 | % | | | 4.7 | % | | | 4.2 | % | | | 3.4 | % | | | 1.5 | % |
| | EBITDA | | | 5.1 | % | | | 6.2 | % | | | 6.5 | % | | | 5.4 | % | | | 7.2 | % |
| | Normalized Net Income to Common | | | -0.1 | % | | | 0.0 | % | | | 0.5 | % | | | 0.3 | % | | | 0.9 | % |
| | Reported Net Income | | | 12.5 | % | | | 15.6 | % | | | 3.0 | % | | | 3.1 | % | | | 12.5 | % |
| | CAPEX | | | 0.3 | % | | | 0.2 | % | | | 0.4 | % | | | 0.5 | % | | | 0.1 | % |
Period Growth Rates | | | | | | | | | | | | | | | | | | | | |
| | Revenue | | | | | | | -5.5 | % | | | | | | | -5.1 | % | | | | |
| | EBIT | | | | | | | 5.2 | % | | | | | | | 109.1 | % | | | | |
| | EBITDA | | | | | | | -10.6 | % | | | | | | | -28.6 | % | | | | |
Notes
Unusual expenses include restructuring costs (professional fees and redundancy costs) related to the reorganization of the Company.
Unusual gains for nine months ended June 2003 include cash distributions form Carbontronics investment.
Discontinued operations include sale of the Company’s food equipment manufacturing segments
Other Analysis
Company Description
Gencor Industries, Inc., together with its subsidiaries, is a manufacturer of heavy machinery used in the production of highway construction materials, synthetic fuels and environmental control equipment. The Company’s principal core products include asphalt plants, combustion systems and fluid heat transfer systems. The Company’s products are manufactured in two facilities in the United States and two facilities located in the United Kingdom. On September 13, 2000, the Company and certain of its subsidiaries (the Debtors) filed voluntary petitions commencing cases under Chapter 11 of the United States Bankruptcy Code. The Company and certain of its subsidiaries began operating its businesses as debtors-in-possession. On April 13, 2001, the Debtors filed the Amended Plan of Reorganization of Gencor Industries, Inc. (the Amended Plan). The Amended Plan was confirmed on July 11, 2001. The Company emerged from Chapter 11 during the first quarter of 2002.
Sources of information: SEC Edgar filings, Multex, Capital IQ, Yahoo and Commodity Systems.
Page 78
| | | |
| Gencor Industries, Inc. | | CONFIDENTIAL |
|
VALUATION ANALYSIS
SELECTED COMPARABLE TRANSACTION ANALYSIS
| | • | | The comparable transaction analysis involves a review of merger, acquisition and asset purchase transactions involving target companies that are in related industries to Gencor. |
| |
| | • | | The comparable transaction analysis generally provides the widest range of value due to the varying importance of an acquisition to a buyer (i.e., a strategic buyer willing to pay more than a financial buyer) in addition to the potential differences in the transaction process (i.e., competitiveness among potential buyers). |
| |
| | • | | Information is typically not disclosed for transactions involving a private seller, even when the buyer is a public company, unless the acquisition is deemed to be “material” for the acquirer. As a result, the selected comparable transaction analysis is limited to transactions involving the acquisition of a public company, or substantially all of its assets, or the acquisition of a large private company, or substantially all of its assets, by a public company. |
| |
| | • | | Capitalink located nine transactions announced since March 2001 involving target companies in related industries to Gencor (the “Comparable Transactions”) and for which detailed financial information was available. Target companies were involved in the manufacture of heavy construction equipment and machinery and were classified under the SIC 353 (construction, mining and materials handling machinery and equipment). |
| |
| | • | | Based on the information disclosed with respect to the targets in the each of the Comparable Transactions, Capitalink calculated and compared enterprise values as multiples of LTM revenue, LTM EBITDA and total assets. |
| |
| | • | | A review of the analysis indicates mean enterprise value multiples to LTM revenue and LTM EBITDA of 0.59 times and 8.3 times, respectively. The mean enterprise to total assets multiple was 0.5 times. |
| |
| | • | | Capitalink determined a range of indicated enterprise values for Gencor by selecting a range of valuation multiples based on the Comparable Transactions, and applying them to the Company’s LTM Revenue and LTM EBITDA as of July 31, 2003. |
Page 79
| | | |
| Gencor Industries, Inc. | | CONFIDENTIAL |
|
VALUATION ANALYSIS
SELECTED COMPARABLE TRANSACTION ANALYSIS
| | • | | As with the Comparable Company analysis, Gencor’s unique characteristics, smaller size, business concentration, declining revenue growth and limited future growth would suggest the Company be valued below the average of the Comparable Transaction multiples. |
| |
| | • | | Therefore taking into account those factors, Capitalink selected an appropriate multiple range for the Company as follows: |
| | |
| | o | Between 0.36 times and 0.41 times LTM revenue. |
| |
| | o | Between 5.1 times and 6.0 times LTM EBITDA. |
| | • | | Based on the selected multiple ranges, Capitalink calculated a range of enterprise values between $17.9 million and $20.6 million for the core business. After deducting net debt of $(1.6) million, dividing by approximately 10.2 million shares outstanding (including ITM options), and applying a 5% discount for the limited voting power of the common stock, Capitalink calculated a range of indicated common stock prices of between $1.87 and $2.07. |
| |
| | • | | None of the Comparable Transactions are identical to Offer. Accordingly, an analysis of comparable business combinations is not mathematical; rather it involves complex considerations and judgments concerning differences in financial and operating characteristics of the Comparable Transactions and other factors that could affect the respective acquisition values. |
Page 80
| | | |
| Gencor Industries, Inc. | | CONFIDENTIAL |
|
VALUATION ANALYSIS
SELECTED COMPARABLE TRANSACTION ANALYSIS
Comparable Transaction Analysis - Indicated Reference Range - Core Business
($ in thousands, except per share)
| | | | | | | | | | | | | | | | | | | | | | |
| | | | | | | | Selected
Multiple
Range | | | | | | | | | | Indicated
Common
Stock |
| | | | | | | |
| | | | | | | | | |
|
| | | |
Statistic | | Low - High | |
Indicated
EV Value | | Indicated
Equity
Value (1) | |
Share
Price (2) (3) |
| | | |
| |
| |
| |
| |
|
Total Enterprise Value (EV) Multiple | | | | | | | | | | | | | | | | | | | | |
| | LTM 7/31/03 Revenue | | $ | 58,950 | | | | 0.36x - 0.41x | | | $ | 21,251 - $23,908 | | | $ | 22,862 - $25,519 | | | $ | 2.13 - $2.37 | |
| | LTM 7/31/03 EBITDA | | $ | 2,880 | | | | 5.1x - 6.0x | | | $ | 14,702 - $17,280 | | | $ | 16,313 - $18,891 | | | $ | 1.52 - $1.76 | |
Indicated Reference Range | | | | | | | | | | $ | 17,977 - $20,594 | | | $ | 19,588 - $22,205 | | | $ | 1.82 - $2.07 | |
| (1) | | Adjusted for ($1,611) net debt as of July 31, 2003, which includes cash from in the money options/warrants outstanding. |
| (2) | | Based upon and assumes 10,208 shares and in the money options/warrants outstanding. |
| (3) | | In order to reflect its limited voting power, a 5% discount has been applied to the common stock. |
Page 81
| | | |
| Gencor Industries, Inc. | | CONFIDENTIAL |
|
VALUATION ANALYSIS
SELECTED COMPARABLE TRANSACTION ANALYSIS
Comparable Transaction Analysis - Core Business
($ in millions)
| | | | | | | | | | | | | | | | | | | | | | | | | | | | | | | | | | | | | | | | | | | | | | | | | | | | | |
| | | | | | | | | | | | | | | TTM | | MRQ | | | | | | | | | | TPP | | | | | | | | | | | | |
| | | | | | | | | | | | | | |
| |
| | Total | | | | | | Multiple | | | | | | EV Multiple of | | | | |
| | | | | | | | | | | | | | | | | | | | | | | | | | | Net | | Price | | Enterprise | | of Net | |
|
| Announced | | Closing | | | | | | Target/ | | | | | | | | | | Total | | Tangible | | Paid | | Value | | Tangible | | | | | | | | Total |
| Date | | Date | | Acquiror | | Transaction Description | | Revenue | | EBITDA | | Assets | | Equity | | TPP (1) | | EV (2) | | Equity | | Revenue | | EBITDA | | Assets |
| |
| |
| |
| |
| |
| |
| |
| |
| |
| |
| |
| |
| |
|
| 17-Jul-03 | | 28-Aug-03 | | The Carlyle Group, Inc. | | Kito Corp. (Japan) | | $ | 175.59 | | | na | | $ | 265.52 | | | $ | 115.40 | | | $ | 48.98 | | | $ | 48.98 | | | | 0.4x | | | | 0.28 | x | | na | | | 0.2x | |
| | | | | | | | | | | Manufactures and markets hoists, cranes and automated warehouses | | | | | | | | | | | | | | | | | | | | | | | | | | | | | | | | |
| 6-Jan-03 | | 6-Jan-03 | | K-Tron International, Inc. | | Pennsylvania Crusher Corp. | | | 34.76 | | | na | | na | | na | | | 23.50 | | | | 23.50 | | | na | | | 0.68 | | | na | | na |
| | | | | | | (Nasdaq: KTII) | | Manufacture crushing machinery | | | | | | | | | | | | | | | | | | | | | | | | | | | | | | | | |
| 18-Jun-02 | | 9-Aug-02 | | Sandvik AB | | Milacron Inc - Valenite Inc. | | | 200.00 | | | na | | na | | na | | | 175.00 | | | | 175.00 | | | na | | | 0.88 | | | na | | na |
| | | | | | | (OTC: SDVKF) | | Produces tools for coal mining | | | | | | | | | | | | | | | | | | | | | | | | | | | | | | | | |
| 19-Aug-02 | | 5-Nov-02 | | Berkshire Hathaway Inc. | | CTB International Corp. | | | 225.99 | | | | 35.26 | | | na | | na | | | 140.00 | | | | 180.00 | | | na | | | 0.80 | | | | 5.1 | | | na |
| | | | | | | (NYSE: BRK) | | Designer, manufacturer & marketer of mechanized systems used for the grain and poultry industry. | | | | | | | | | | | | | | | | | | | | | | | | | | | | | | | | |
| 15-Aug-02 | | 3-Oct-02 | | Federal Signal Corp. | | Wittke, Inc. (TSE: WKE) | | | 105.03 | | | | 8.49 | | | na | | na | | | 62.48 | | | | 62.48 | | | na | | | 0.59 | | | | 7.4 | | | na |
| | | | | | | (NYSE: FSS) | | Manufacturer and designer of truck-mounted equipment and parts eg. Truck bodies, street sweepers | | | | | | | | | | | | | | | | | | | | | | | | | | | | | | | | |
| 17-May-02 | | 30-Aug-02 | | Terex Corp. | | Siemens AG - Demag Mobile Cranes | | | 360.00 | | | na | | na | | na | | | 146.00 | | | | 146.00 | | | na | | | 0.41 | | | na | | na |
| | | | | | | (NYSE: TEX) | | Manufactures and distributes telescopic and lattice boom cranes | | | | | | | | | | | | | | | | | | | | | | | | | | | | | | | | |
| 18-Mar-02 | | 8-Aug-02 | | Manitowc Co. | | Grove Worldwide, Inc. | | | 717.58 | | | | (3.14 | ) | | | 517.84 | | | | 95.00 | | | | 73.13 | | | | 258.68 | | | | 0.8 | | | | 0.36 | | | na | | | 0.5 | |
| | | | | | | (NYSE: MTW) | | Makes hydraulic cranes, truck-mounted cranes, and aerial work platforms | | | | | | | | | | | | | | | | | | | | | | | | | | | | | | | | |
| 28-Jun-01 | | 1-Oct-01 | | Terex Corp. | | CMI Corp. | | | 216.37 | | | | (5.11 | ) | | | 176.22 | | | | 43.12 | | | | 61.81 | | | | 156.10 | | | | 1.4 | | | | 0.72 | | | na | | | 0.9 | |
| | | | | | | (NYSE: TEX) | | Makes equipment for construction and maintenance of highways, city streets, and airport runways | | | | | | | | | | | | | | | | | | | | | | | | | | | | | | | | |
| 14-Mar-01 | | 16-Aug-01 | | Washington Mills Co. | | Exolon-ESK Co. | | | 50.48 | | | | 2.45 | | | | 58.53 | | | | 29.57 | | | | 13.75 | | | | 30.32 | | | | 0.5 | | | | 0.60 | | | | 12.4 | | | | 0.5 | |
| | | | | | | na | | Manufacture and wholesale construction machinery used principally for abrasive, refractory and metallurgical applications | | | | | | | | | | | | | | | | | | | | | | | | | | | | | | | | |
| | | | | | | | | | | | | | | | | | | | | | | | | | |
|
| | | | | | | | | | | | | | | | | | | | | | | | | | | High | | $ | 175.00 | | | $ | 258.68 | | | | 1.4 | x | | | 0.88 | x | | | 12.4 | x | | | 0.9 | x |
| | | | | | | | | | | | | | | | | | | | | | | | | | | Mean | | | 82.74 | | | | 120.12 | | | | 0.8 | | | | 0.59 | | | | 8.3 | | | | 0.5 | |
| | | | | | | | | | | | | | | | | | | | | | | | | | | Median | | | 62.48 | | | | 146.00 | | | | 0.6 | | | | 0.60 | | | | 7.4 | | | | 0.5 | |
| | | | | | | | | | | | | | | | | | | | | | | | | | | Low | | | 13.75 | | | | 23.50 | | | | 0.4 | | | | 0.28 | | | | 5.1 | | | | 0.2 | |
| | | | | | | | | | | | | | | | | | | | | | | | | | |
|
| (1) | | Total Price Paid equals common equity value of interest acquired. |
| (2) | | Enterprise Value equals Total Price Paid plus total debt, preferred stock, and minority interests, less cash. |
Sources of information: SEC Edgar Filings, Press Releases, CapitalIQ, Multex, Mergerstat, Thomson Financial, & Done Deals.
Page 82
| | | |
| Gencor Industries, Inc. | | CONFIDENTIAL |
|
VALUATION ANALYSIS
ACQUISITION PREMIUMS ANALYSIS
| | • | | The acquisition premiums analysis involves the comparison of the premium derived in the Offer to premiums in other transactions where a controlling interest of a public company was acquired. Capitalink reviewed the one-day, five-day and 30-day premiums for all control interest transactions where: |
| | |
| | o | The transaction was announced on or after January 2000, |
| |
| | o | The transaction value is less than or equal to $50.0 million, |
| |
| | o | The acquiring party previously had less than 50% shareholding in the target company, and |
| |
| | o | The target company is based in the United States. |
| | • | | Capitalink reviewed approximately 444 transactions that met this criteria and calculated the mean and median of the acquisition premiums. They were 41.6% and 35.5%, for the one day premium, 45.8% and 37.5% for the five day premium, and 53.6% and 42.5% for the 30 day premium. |
| |
| | • | | Capitalink also identified four transactions announced since March 2000, in which the targets were in related industries to the Company and for which information on premiums paid were available. The mean and median acquisition premiums paid were from 18.9% and 1.3% for the one day premium, 24.0% and 11.1% for the five day premium and 34.7% and 17.8% for the 30 day premium. |
| |
| | • | | Based on the premiums paid in the scenario set forth above, Capitalink derived an indicated range of per share market values for the Company using the prior one-day, five-day and 30-day share price as of October 3, 2003. Based on the selected multiple ranges, Capitalink calculated a range of indicated common stock share prices of $2.65 to $3.16 per share for Gencor (including Carbontronics). |
Page 83
| | | |
| Gencor Industries, Inc. | | CONFIDENTIAL |
|
VALUATION ANALYSIS
ACQUISITION PREMIUMS ANALYSIS
Acquisition Premiums Analysis - Indicated Reference Range
($ in thousands, except per share)
| | | | | | | | | | | | | | |
| | | | | | | | Selected Multiple Range | | | | |
| | | | | | | |
| | Indicated Common Stock |
| | | | Statistic | | Low - High | | Share Price |
| | | |
| |
| |
|
Acquisitions Premiums | | | | | | | | | | | | |
| | Prior One Day | | $ | 2.35 | | | | 18.9% - 35.5 | % | | $ | 2.79 - $3.18 | |
| | Prior 5 Day | | $ | 2.30 | | | | 11.1% - 37.5 | % | | $ | 2.55 - $3.16 | |
| | Prior 30 Day | | $ | 2.15 | | | | 17.8% - 42.5 | % | | $ | 2.53 - $3.06 | |
Indicated Reference Range | | | | | | | | | | $ | 2.63 - $3.14 | |
Sources of information: BVMarketdata, Commodity Systems, Inc. and Mergerstat, Inc.
Page 84
| | | |
| Gencor Industries, Inc. | | CONFIDENTIAL |
|
VALUATION ANALYSIS
ACQUISITION PREMIUMS ANALYSIS | | |
Acquisition Premiums Analysis - Premiums
Acquisition Premiums - All Acquisitions <$50 m (1)
| | | | | | | | | | | | | | | | | |
| | | | | | | Acquisition Premium |
| | | | | | |
|
| | | | | | | 1 Day | | 5 Day | | 30 Day |
| | | | | | |
| |
| |
|
| | | High | | | 519.0 | % | | | 522.0 | % | | | 519.0 | % |
| | | Mean | | | 41.6 | % | | | 45.8 | % | | | 53.6 | % |
| | | Median | | | 35.5 | % | | | 37.5 | % | | | 42.5 | % |
| | | Low | | | -96.0 | % | | | -97.0 | % | | | -98.0 | % |
Industry Acquisitions
| | | | | | | | | | | | | | | | | | | | | |
| | | | | | | | | | | Acquisition Premium |
| | | | | | | | | | |
|
| Date | | Acquiror | | Target | | 1 Day | | 5 Day | | 30 Day |
| |
| |
| |
| |
| |
|
| 9/15/2002 | | Federal Signal Corp | | Wittke Inc. | | | -7.3 | % | | | 8.1 | % | | | -7.3 | % |
| 6/28/2001 | | Terex Corp | | CMI Corp | | | 10.0 | % | | | 14.0 | % | | | 43.0 | % |
| 3/22/2000 | | Tuboscope Inc | | Varco International Inc | | | -11.0 | % | | | -4.0 | % | | | -9.0 | % |
| 3/16/2000 | | National-Oilwell Inc | | IRI International Corp | | | 84.0 | % | | | 78 | % | | | 112 | % |
| | | | | | |
|
| | | | | | | High | | | 84.0 | % | | | 78.0 | % | | | 112.0 | % |
| | | | | | | Mean | | | 18.9 | % | | | 24.0 | % | | | 34.7 | % |
| | | | | | | Median | | | 1.3 | % | | | 11.1 | % | | | 17.8 | % |
| | | | | | | Low | | | -11.0 | % | | | -4.0 | % | | | -9.0 | % |
| | | | | | |
|
| (1) | | Includes 444 control acquisitions (purchases of >50%) from January 2000 with deal value < $50 million. |
Page 85
| | | |
| Gencor Industries, Inc. | | CONFIDENTIAL |
|
VALUATION ANALYSIS
PREMIUMS PAID ANALYSIS
| | • | | The premiums paid analysis involves the comparison of the Offer to the average closing price of the Company’s common stock over varying time periods prior to October 3, 2003. |
| |
| | • | | The analysis suggests that for the periods calculated, the Offer represents a premium (10.0% to 63.4%) over the average closing share price for each period. The premium as of October 3, 2003 was 21.3%. |
| |
| | • | | In addition, the daily premium or discount over the period October 3, 2002 to October 3, 2003 was graphed based on the Offer Consideration. For the full prior one-year period, the Offer Consideration represented a significant premium for most of the prevailing daily share prices. |
Page 86
| | | |
| Gencor Industries, Inc. | | CONFIDENTIAL |
|
VALUATION ANALYSIS
PREMIUMS PAID ANALYSIS
Premiums Paid Analysis - Premium Review
| | | | | | | | | | |
| Offer Consideration | | $ | 2.8600 | | | | | |
| | | | | | | | | | |
| | | | Closing Price | | Premium |
| | | | per Share | | (Discount) |
| | | |
| |
|
As of October 03, 2003 | | $ | 2.4500 | | | | 16.7 | % |
| Sensitivity Analysis: | | | | | | | | |
| | Prior Day Closing Price | | $ | 2.3500 | | | | 21.7 | % |
| | Prior 5 Trading Day Average Closing Price | | $ | 2.3700 | | | | 20.7 | % |
| | Prior 10 Trading Day Average Closing Price | | $ | 2.3590 | | | | 21.2 | % |
| | Prior 20 Trading Day Average Closing Price | | $ | 2.3660 | | | | 20.9 | % |
| | Prior 30 Trading Day Average Closing Price | | $ | 2.3160 | | | | 23.5 | % |
| | Prior 60 Trading Day Average Closing Price | | $ | 2.4633 | | | | 16.1 | % |
| | Prior 90 Trading Day Average Closing Price | | $ | 2.6666 | | | | 7.3 | % |
| | Prior Six Month Average Closing Price | | $ | 2.2962 | | | | 24.6 | % |
| | Prior Year Average Closing Price | | $ | 1.7805 | | | | 60.6 | % |
Sources of information: Share price data provided by Commodity Systems, Inc.
Page 87
| | | |
| Gencor Industries, Inc. | | CONFIDENTIAL |
|
VALUATION ANALYSIS
Premiums Paid Analysis
Gencor - Daily Premium (Discount)
October 03, 2002 - October 03, 2003
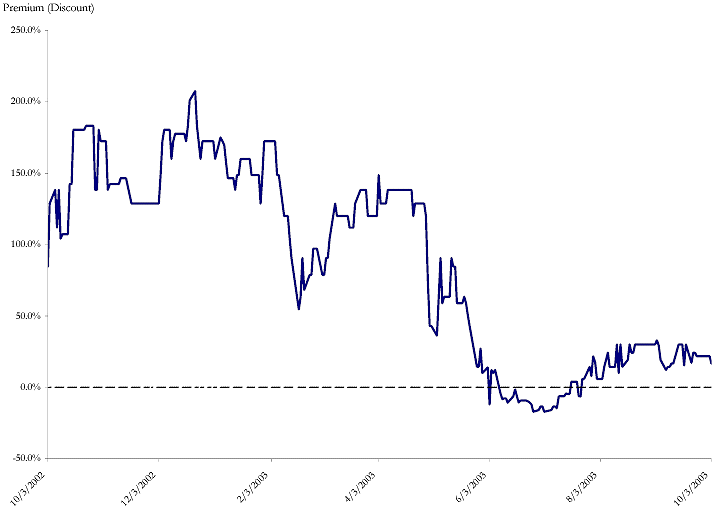
Sources of information: Share price data provided by Commodity Systems, Inc.
Page 88
| | | |
| Gencor Industries, Inc. | | CONFIDENTIAL |
|
VALUATION ANALYSIS
Carbontronics Investment Analysis
| | • | | Capitalink performed a scenario analysis to determine an appropriate range of value for the Company’s Carbontronics investment. Utilizing the projected cash flow for Carbontronics (derived as of April 22, 2003), Capitalink set forth a set of seven scenarios by applying a range of confidence factors to determine the projected cash flow received each year. |
| |
| | • | | Post-tax cash flows were derived and discounted using the Company’s WACC of 17.5% for each of the seven scenarios. |
| |
| | • | | Capitalink estimated the probability of receiving the cash flow each year based the following information: |
| | |
| | o | Historical cash flow received, |
| |
| | o | Current correspondence with respect to the IRS review on Carbontronics’ records and chemical change issues, suggesting the tax credits (both prior and future) may be at risk. |
| |
| | o | Steps taken by the IRS to revoke the synthetic fuel tax credits. |
| |
| | o | Notice received of a Tax Event with all distributions being put on hold. |
| |
| | o | The Company’s can not currently predict when, and if, there will be any future distributions. |
| | • | | A pessimistic and neutral range of probabilities were determined and used to weight each of the seven scenarios and derive a range of indicated values of between $7.2 million and $10.2 million. The range of values was divided by the total number of shares outstanding of approximately 10.2 million (including ITM options), to derive a range of indicated values per common stock for Carbontronics of between $0.70 and $1.00 (after taking a 5% discount for the limited voting power of the common stock). |
Page 89
| | | |
| Gencor Industries, Inc. | | CONFIDENTIAL |
|
VALUATION ANALYSIS
Carbontronics Investment Analysis
Carbontronics Investment - Indicated Reference Range
($ in thousands, except per share)
| | | | | | | | | |
| | | | | | | Indicated Common Stock |
| | | Indicated Equity Value | | Share Price (1) (2) |
| | |
| |
|
Indicated Reference Range | | $ | 7,175 - $10,145 | | | $ | 0.70 - $0.99 | |
| (1) | | Based upon and assumes 10,208 shares and in the money options/warrants outstanding. |
| (2) | | In order to reflect its limited voting power, a 5% discount has been applied to the common shares. |
Page 90
| | | |
| Gencor Industries, Inc. | | CONFIDENTIAL |
|
VALUATION ANALYSIS
Carbontronics Investment Analysis
Carbontronics Investment - Analysis
($ in thousands)
| | | | | | | | | | | | | | | | | | | | | | | | | | | | | | | | | | | | | | | | | | | | | | | | | | | |
Assumptions: | |
| Tax Rate | | | 17.5 | % | |
| Discount Rate | | | 35.0 | % | |
| | | | | | | | | | | | | | | | | | | | | | | | | | | | | | | | | | | | | | | | | | | | | | | | | | | |
| | | | | | | | | | | | | | | | | | | | | | | | | | | | | | | | | | | | | Pessimistic | | Neutral |
| | | | | Projected (1) | | | | | |
| |
|
| | | | |
| | | | | | | | | | Weighted | | | | | | Weighted |
| | | | | | | | | Fiscal Years Ending December 31, | | | | | | Net | | | | | | Net | | | | | | Net |
| | | | | 3 Months | |
| | | | | | Present | | Expected | | Present | | Expected | | Present |
| | | | | 2003 | | 2004 | | 2005 | | 2006 | | 2007 | | 2008 | | Total | | Value (2) | | Probabilit | | Value | | Probabilit | | Value |
| | | | |
| |
| |
| |
| |
| |
| |
| |
| |
| |
| |
| |
|
Gencor Cashflow | | $ | 4,171 | | | $ | 18,305 | | | $ | 19,026 | | | $ | 19,759 | | | $ | 20,505 | | | $ | 31,325 | | | | #### | | | | | | | | | | | | | | | | | | | | | |
| | Scenario One | | | | | | | | | | | | | | | | | | | | | | | | | | | | | | | | | | | | | | | | | | | | | | | | |
| | | | | | | | | | | | | | | | | | | | |
| | | % of Cashflow | | | 75.0 | % | | | 75.0 | % | | | 75.0 | % | | | 75.0 | % | | | 75.0 | % | | | 75.0 | % | | | | | | | | | | | | | | | | | | | | | | | | |
| | | Adjusted Cashflow | | $ | 3,128 | | | $ | 13,729 | | | $ | 14,270 | | | $ | 14,819 | | | $ | 15,379 | | | $ | 23,494 | | | $ | 84,818 | | | | | | | | | | | | | | | | | | | | | |
| | | After Tax Adjusted Cashflow | | $ | 2,033 | | | $ | 8,924 | | | $ | 9,275 | | | $ | 9,633 | | | $ | 9,996 | | | $ | 15,271 | | | $ | 55,132 | | | $ | 33,661 | | | | 0.0 | % | | $ | - | | | | 5.0 | % | | $ | 1,683 | |
| | Scenario Two | | | | | | | | | | | | | | | | | | | | | | | | | | | | | | | | | | | | | | | | | | | | | | | | |
| | | % of Cashflow | | | 25.0 | % | | | 25.0 | % | | | 50.0 | % | | | 50.0 | % | | | 100.0 | % | | | 100.0 | % | | | | | | | | | | | | | | | | | | | | | | | | |
| | | Adjusted Cashflow | | $ | 1,043 | | | $ | 4,576 | | | $ | 9,513 | | | $ | 9,880 | | | $ | 20,505 | | | $ | 31,325 | | | $ | 76,842 | | | | | | | | | | | | | | | | | | | | | |
| | | After Tax Adjusted Cashflow | | $ | 678 | | | $ | 2,975 | | | $ | 6,183 | | | $ | 6,422 | | | $ | 13,328 | | | $ | 20,361 | | | $ | 49,947 | | | $ | 27,177 | | | | 0.0 | % | | $ | - | | | | 5.0 | % | | $ | 1,359 | |
| | Scenario Three | | | | | | | | | | | | | | | | | | | | | | | | | | | | | | | | | | | | | | | | | | | | | | | | |
| | | % of Cashflow | | | 25.0 | % | | | 25.0 | % | | | 50.0 | % | | | 50.0 | % | | | 50.0 | % | | | 50.0 | % | | | | | | | | | | | | | | | | | | | | | | | | |
| | | Adjusted Cashflow | | $ | 1,043 | | | $ | 4,576 | | | $ | 9,513 | | | $ | 9,880 | | | $ | 10,253 | | | $ | 15,663 | | | $ | 50,927 | | | | | | | | | | | | | | | | | | | | | |
| | | After Tax Adjusted Cashflow | | $ | 678 | | | $ | 2,975 | | | $ | 6,183 | | | $ | 6,422 | | | $ | 6,664 | | | $ | 10,181 | | | $ | 33,102 | | | $ | 19,295 | | | | 2.5 | % | | $ | 828 | | | | 5.0 | % | | $ | 965 | |
| | Scenario Four | | | | | | | | | | | | | | | | | | | | | | | | | | | | | | | | | | | | | | | | | | | | | | | | |
| | | % of Cashflow | | | 25.0 | % | | | 25.0 | % | | | 25.0 | % | | | 25.0 | % | | | 25.0 | % | | | 25.0 | % | | | | | | | | | | | | | | | | | | | | | | | | |
| | | Adjusted Cashflow | | $ | 1,043 | | | $ | 4,576 | | | $ | 4,757 | | | $ | 4,940 | | | $ | 5,126 | | | $ | 7,831 | | | $ | 28,273 | | | | | | | | | | | | | | | | | | | | | |
| | | After Tax Adjusted Cashflow | | $ | 678 | | | $ | 2,975 | | | $ | 3,092 | | | $ | 3,211 | | | $ | 3,332 | | | $ | 5,090 | | | $ | 18,377 | | | $ | 11,220 | | | | 17.5 | % | | $ | 3,216 | | | | 40.0 | % | | $ | 4,488 | |
| | | | | | | | | | | | | | | | | | | | |
| | Scenario Five | | | | | | | | | | | | | | | | | | | | | | | | | | | | | | | | | | | | | | | | | | | | | | | | |
| | | % of Cashflow | | | 25.0 | % | | | 20.0 | % | | | 15.0 | % | | | 10.0 | % | | | 5.0 | % | | | 0.0 | % | | | | | | | | | | | | | | | | | | | | | | | | |
| | | Adjusted Cashflow | | $ | 1,043 | | | $ | 3,661 | | | $ | 2,854 | | | $ | 1,976 | | | $ | 1,025 | | | $ | - | | | $ | 10,559 | | | | | | | | | | | | | | | | | | | | | |
| | | After Tax Adjusted Cashflow | | $ | 678 | | | $ | 2,380 | | | $ | 1,855 | | | $ | 1,284 | | | $ | 666 | | | $ | - | | | $ | 6,863 | | | $ | 5,084 | | | | 25.0 | % | | $ | 1,716 | | | | 20.0 | % | | $ | 1,017 | |
| | | | | | | | | | | | | | | | | | | | |
| | Scenario Six | | | | | | | | | | | | | | | | | | | | | | | | | | | | | | | | | | | | | | | | | | | | | | | | |
| | | % of Cashflow | | | 0.0 | % | | | 10.0 | % | | | 10.0 | % | | | 10.0 | % | | | 10.0 | % | | | 10.0 | % | | | | | | | | | | | | | | | | | | | | | | | | |
| | | Adjusted Cashflow | | $ | - | | | $ | 1,831 | | | $ | 1,903 | | | $ | 1,976 | | | $ | 2,051 | | | $ | 3,133 | | | $ | 10,892 | | | | | | | | | | | | | | | | | | | | | |
| | | After Tax Adjusted Cashflow | | $ | - | | | $ | 1,190 | | | $ | 1,237 | | | $ | 1,284 | | | $ | 1,333 | | | $ | 2,036 | | | $ | 7,080 | | | $ | 4,222 | | | | 20.0 | % | | $ | 1,416 | | | | 15.0 | % | | $ | 633 | |
| | | | | | | | | | | | | | | | | | | | |
| | Scenario Seven | | | | | | | | | | | | | | | | | | | | | | | | | | | | | | | | | | | | | | | | | | | | | | | | |
| | | % of Cashflow | | | 0.0 | % | | | 0.0 | % | | | 0.0 | % | | | 0.0 | % | | | 0.0 | % | | | 0.0 | % | | | | | | | | | | | | | | | | | | | | | | | | |
| | | Adjusted Cashflow | | $ | - | | | $ | - | | | $ | - | | | $ | - | | | $ | - | | | $ | - | | | $ | - | | | | | | | | | | | | | | | | | | | | | |
| | | After Tax Adjusted Cashflow | | $ | - | | | $ | - | | | $ | - | | | $ | - | | | $ | - | | | $ | - | | | $ | - | | | $ | - | | | | 35.0 | % | | $ | - | | | | 10.0 | % | | $ | - | |
| | | | | | | | | | | | | | | | | | | | | | | | | | | | | | | | | | |
|
Indicated Value | | | | | | | | | | | | | | | | | | | | | | | | | | | | | | | | | | | 100.0 | % | | $ | 7,175 | | | | 100.0 | % | | $ | 10,145 | |
| | | | | | | | | | | | | | | | | | | | | | | | | | | | | | | | | | | | | | | |
| | | | | | | |
| |
| (1) | | Projections revised and prepared as of April 22, 2003. |
| (2) | | Discounted amounts have been calculated utilizing a mid-year convention. |
Sources of information: Company management.
Page 91