Financial Section
Contents
| | | | | |
| Financial Review | | | | |
| Description of Merck’s Business | | | 20 | |
| Overview | | | 20 | |
| Voluntary Product Withdrawal | | | 21 | |
| Competition and the Health Care Environment | | | 21 | |
| Operating Results | | | 22 | |
| Selected Joint Venture and Affiliate Information | | | 28 | |
| Capital Expenditures | | | 29 | |
| Analysis of Liquidity and Capital Resources | | | 29 | |
| Financial Instruments Market Risk Disclosures | | | 30 | |
| Critical Accounting Policies and Other Matters | | | 31 | |
| Recently Issued Accounting Standards | | | 34 | |
| Cautionary Factors That May Affect Future Results | | | 35 | |
| Cash Dividends Paid per Common Share | | | 35 | |
| Common Stock Market Prices | | | 35 | |
| Condensed Interim Financial Data | | | 35 | |
| Consolidated Statement of Income | | | 36 | |
| Consolidated Statement of Retained Earnings | | | 36 | |
| Consolidated Statement of Comprehensive Income | | | 36 | |
| Consolidated Balance Sheet | | | 37 | |
| Consolidated Statement of Cash Flows | | | 38 | |
| Notes to Consolidated Financial Statements | | | 39 | |
| Management’s Report | | | 58 | |
| Audit Committee’s Report | | | 58 | |
| Report of Independent Registered Public Accounting Firm | | | 59 | |
| Compensation and Benefits Committee’s Report | | | 59 | |
| Selected Financial Data | | | 60 | |
| | | | | |
| | | | | |
| | | | | |
Financial Review
Description of Merck’s Business
Merck is a global research-driven pharmaceutical company that discovers, develops, manufactures and markets a broad range of innovative products to improve human and animal health, directly and through its joint ventures. Merck sells its products primarily to drug wholesalers and retailers, hospitals, clinics, government agencies and managed health care providers such as health maintenance organizations and other institutions. The Company’s professional representatives communicate the effectiveness, safety and value of our products to health care professionals in private practice, group practices and managed care organizations.
Overview
The decision announced on September 30, 2004 to voluntarily withdrawVioxxfrom the market, as discussed further below, reflects the depth and sincerity of Merck’s commitment to patients. The Company made the decision to withdrawVioxxbased on the science available at that time and given the availability of alternative therapies and the questions raised by the data. Throughout Merck’s history, it has been the Company’s rigorous adherence to scientific investigation, openness and integrity that has enabled it to bring new medicines to people who need them. Having responded swiftly and effectively to the voluntary withdrawal ofVioxx, Merck has turned its focus to the future.
Merck’s efforts to expand its pipeline by moving into new therapeutic categories, increasing its licensing activities and accelerating early- and late-stage development, are producing positive results. With the exception of the delay in approval ofArcoxiain the United States, the Company is on or ahead of schedule with its planned regulatory submissions and Phase III development programs. In 2004, Bristol-Myers Squibb Company (BMS) submitted an application to the Food and Drug Administration (FDA) for muraglitazar, a new class of oral agents for the treatment of Type 2 diabetes. Merck and BMS will jointly commercialize muraglitazar on a global basis. In addition, Merck submitted an application forProQuad, a new childhood vaccine that adds chickenpox to the existing measles, mumps and rubella vaccine. Merck currently has five product candidates in Phase III development: three vaccines; MK-431, Merck’s DPP-IV inhibitor for the treatment of Type 2 diabetes; and gaboxadol, an insomnia compound licensed from H. Lundbeck A/S. Merck plans to submit its three Phase III vaccines for FDA approval in 2005.
Merck plans to drive sales through new and established products, new indications and formulations, and clinical trials that bolster products’ safety and efficacy profiles.Vytorin, developed and marketed by the Merck/Schering-Plough partnership, has gained rapid acceptance among patients, physicians and payers since its July 2004 U.S. approval and is being rapidly adopted for first-line use. The Company is seeking new indications forSingulair, its asthma and seasonal allergy medicine. Also, Merck expects to enhance its osteoporosis franchise with the addition ofFosamaxplus vitamin D, a compound that combines alendronate (the active ingredient inFosamax) and vitamin D. The Company disagrees with the January 2005 court ruling that found Merck’s U.S. patent claims forFosamaxOnce Weekly to be invalid, and will request reconsideration by the Court of Appeals.
Merck is in the process of redesigning many of its critical business processes. By improving efficiencies in many areas, including procurement, manufacturing, capital investment and inventory management, Merck is positioned to realize significant cost reductions in the future. The new U.S. wholesaler distribution program launched in 2003 has succeeded in leveling the quarterly volume fluctuations that once made it difficult to streamline production and reduce inventory levels.
| | |
| 20 | | Merck & Co., Inc. Annual Report 2004 |
Also, by the end of 2004, Merck eliminated 5,100 positions exceeding the target of 4,400 positions announced in October 2003. This action is expected to result in about $300 million in savings in 2005 without impacting either key productivity initiatives or Merck’s ability to meet its business objectives.
Earnings per common share assuming dilution for 2004 were $2.61, including the impact of the withdrawal ofVioxxand reserves established solely for future legal defense costs forVioxx Litigation (as defined in Note 11 to the financial statements). The Company anticipates full-year 2005 earnings per common share assuming dilution of $2.42 to $2.52. This guidance does not reflect the establishment of any reserves for any potential liability relating to theVioxxLitigation or any additional reserves for legal defense costs. This guidance also does not reflect any changes in the way Merck accounts for stock-based compensation as a result of recently issued accounting standards. Furthermore, this guidance does not include any one-time impacts that may result from the repatriation of permanently reinvested off-shore earnings under the American Jobs Creation Act of 2004.
Voluntary Product Withdrawal
On September 30, 2004, Merck announced a voluntary worldwide withdrawal ofVioxx, its arthritis and acute pain medication. (See Notes 3 and 11 to the financial statements for further information.) The Company’s decision, which was effective immediately, was based on new three-year data from a prospective, randomized, placebo-controlled clinical trial, APPROVe (Adenomatous Polyp Prevention onVioxx).
The trial, which was stopped, was designed to evaluate the efficacy ofVioxx25 mg in preventing the recurrence of colorectal polyps in patients with a history of colorectal adenomas and to further assess the cardiovascular safety ofVioxx. In this study, there was an increased relative risk for confirmed cardiovascular events, such as heart attack and stroke, beginning after 18 months of treatment in the patients takingVioxxcompared to those taking placebo. The results for the first 18 months of the APPROVe study did not show any increased risk of confirmed cardiovascular events onVioxx, and in this respect, were similar to the results of two placebo-controlled studies described in the most recent U.S. labeling forVioxx.
Merck presented data from APPROVe at the American College of Rheumatology (ACR) Annual Scientific Meeting in San Antonio on October 18, 2004. The Company had requested the opportunity to present the data at the ACR meeting.
The Company estimates that there were 105 million U.S. prescriptions written forVioxxfrom May 1999 through August 2004. Based on this estimate, the Company estimates that the number of patients who have takenVioxxin the United States since its 1999 launch is approximately 20 million. The number of patients outside the United States who have takenVioxxis undetermined at this time.
In October 2004, the Company received a letter from Senator Charles Grassley, chairman of the Senate Committee on Finance, requesting certain documents and information related toVioxx. The Company also received requests for information from other Congressional committees. The Company intends to cooperate with these inquiries so that the Company can continue to describe the reasons for the Company’s voluntary withdrawal ofVioxxand to answer any questions related to the Company’s development and extensive testing of the medicine and its disclosures of the results of its studies.
Also, in October 2004, the Company received a letter from a group of five state Attorneys General raising concerns that the Company’s return and refund program for unusedVioxxwill not provide consumers with adequate notice and will be unduly burdensome. The Company is cooperating with the Attorneys General to respond to their concerns.
On February 16-18, 2005, the FDA held a joint meeting of the Arthritis Advisory Committee and the Drug Safety and Risk Management Advisory Committee. The committees discussed the overall benefit to risk considerations (including cardiovascular and gastrointestinal safety concerns) for COX-2 selective nonsteriodal anti-inflammatory drugs and related agents. On February 18, the members of the committees were asked to vote on whether the overall risk versus benefit profile forVioxxsupports marketing in the United States. The members of the committees voted 17 to 15 in support of the marketing ofVioxxin the United States. The Company looks forward to discussions with the FDA and other regulatory authorities aboutVioxx.
As previously announced, the Board of Directors of the Company appointed a Special Committee to review the Company’s actions prior to its voluntary withdrawal ofVioxx,to act for the Board in responding to shareholder litigation matters related to the withdrawal ofVioxxand to advise the Board with respect to any action that should be taken as a result of the review.
Competition and the Health Care Environment
The markets in which the Company conducts its business are highly competitive and often highly regulated. Global efforts toward health care cost containment continue to exert pressure on product pricing and access.
In the United States, the government made significant progress in expanding health care access by enacting the Medicare Prescription Drug, Improvement and Modernization Act of 2003, which was signed into law in December 2003. This statute added a voluntary drug discount card for Medicare beneficiaries in June 2004 and will add prescription drug coverage on January 1, 2006. Implementation of the new benefit will support the Company’s goal of improving access to medicines by expanding insurance coverage, while preserving market-based incentives for pharmaceutical innovation. At the same time, the benefit is designed to assure that prescription drug costs will be controlled by competitive pressures and by encouraging the appropriate use of medicines. The Company has taken a leadership role in contributing to the success of the new Medicare-endorsed discount cards by providing its medicines free for low-income Medicare beneficiaries who exhaust their $600 transitional assistance allowance in Medicare-endorsed drug discount cards. This action is consistent with the Company’s long-standing Patient Assistance Program, which provides free medicines to patients in the United States who lack drug coverage and cannot afford their medicines. During 2005, the Company will be negotiating with prescription drug plans under the new Medicare drug benefit to offer Merck products to Medicare beneficiaries beginning January 1, 2006 under the terms of the new benefit.
In addressing cost containment outside of Medicare, the Company has made a continuing effort to demonstrate that its medicines can help save costs in over-all patient health care. In addition, pricing flexibility across the Company’s product portfolio has encouraged growing use of its medicines and mitigated the effects of increasing cost pressures.
Outside the United States, in difficult environments encumbered by government cost-containment actions, the Company has worked in partnership with payers on allocating scarce resources to optimize health care outcomes, limiting the potentially detrimental effects of government policies on sales growth and supporting the discovery and development of innovative products to benefit patients. The Company also is working with governments in many emerging markets in Eastern Europe, Latin America and Asia to encourage them to increase their investments in health and thereby improve their citizens’ access to medicines. Countries within the European Union (EU), recognizing the economic importance of the research-based pharmaceutical industry and the value of innovative medicines to society, are working with industry representatives and the
| | |
| Merck & Co., Inc. Annual Report 2004 | | 21 |
European Commission on proposals to complete the “Single Market” in pharmaceuticals and improve the competitive climate through a variety of means including market deregulation.
The Company is committed to improving access to medicines and enhancing the quality of life for people around the world. Merck’s African Comprehensive HIV/AIDS Partnerships (ACHAP) in Botswana, in collaboration with the government of Botswana and the Bill & Melinda Gates Foundation, is striving to develop a comprehensive and sustainable approach to HIV prevention, care and treatment. To further catalyze access to HIV medicines in developing countries, in October 2002 the Company introduced a new 600 mg tablet formulation of its antiretroviral medicineStocrinat a price of less than one dollar per day in the least developed countries and those hardest hit by the HIV/AIDS epidemic. By the end of 2004, more than 190,000 patients in 68 developing countries were being treated with antiretroviral regimens containing eitherCrixivanorStocrin. Through these and other actions, Merck is working with partners in the public and private sectors alike to focus on the most critical barriers to access to medicines in the developing world: the need for sustainable financing, increased international assistance and additional investments in education, training and health infrastructure and capacity in developing countries.
There has been an increasing amount of focus on privacy issues in countries around the world, including the United States and the EU. In the United States and the EU, governments have pursued legislative and regulatory initiatives regarding privacy, including federal privacy regulations and recently enacted state privacy laws concerning health and other personal information, which have affected the Company’s operations.
Although no one can predict the outcome of these and other legislative, regulatory and advocacy initiatives, the Company is well positioned to respond to the evolving health care environment and market forces.
The Company anticipates that the worldwide trend toward cost-containment will continue, resulting in ongoing pressures on health care budgets. As the Company continues to successfully launch new products, contribute to health care debates and monitor reforms, its new products, policies and strategies should enable it to maintain a strong position in the changing economic environment.
Operating Results
Sales
Worldwide sales for 2004 increased 2% in total over 2003, reflecting a 3% favorable effect from foreign exchange, a 1% favorable effect from price changes and a volume decline of 2%. In connection with the Company’s voluntary worldwide withdrawal ofVioxxon September 30, sales for 2004 were unfavorably impacted by $491.6 million for estimated customer returns of product previously sold and approximately $700 to $750 million in foregone sales in the fourth quarter. (See Note 3 to the financial statements for further information.) The overall increase in sales over 2003 reflects strong growth ofSingulairfor asthma and seasonal allergic rhinitis,Fosamaxfor osteoporosis, andCozaar/Hyzaarfor high blood pressure. Sales growth for 2004 also includes a favorable comparison to 2003, which was affected by $565 million of wholesaler buy-out. Following the implementation of the new distribution program for U.S. wholesalers in the fourth quarter of 2003, fluctuations in 2004 sales caused by wholesaler investment buying have significantly moderated. The overall growth was offset in part by lower revenues from the Company’s relationship with AstraZeneca LP (AZLP) primarily driven by generic and over-the-counter competition ofPrilosec.
Domestic sales growth was 1%, while foreign sales grew 3%, including an eight percentage point favorable effect from foreign exchange. Domestic and foreign sales include the unfavorable effect associated with the voluntary
worldwide withdrawal ofVioxxand foreign sales were negatively affected by the impact of patent expirations forZocorin 2003 in certain countries in Europe, including the United Kingdom and Germany, Japan and Canada. Foreign sales represented 41% of total sales in 2004.
Worldwide sales for 2003 increased 5% in total over 2002, reflecting a 4% favorable effect from foreign exchange and a 1% favorable effect from price changes. Foreign sales represented 41% of total sales in 2003.
Sales(1)by category of the Company’s products were as follows:
| | | | | | | | | | | | | |
| ($ in millions) | | 2004 | | | 2003 | | | 2002 | |
| |
| Atherosclerosis | | $ | 5,223.0 | | | $ | 5,077.9 | | | $ | 5,552.1 | |
| Hypertension/heart failure | | | 3,646.7 | | | | 3,421.6 | | | | 3,477.8 | |
| Osteoporosis | | | 3,159.6 | | | | 2,676.6 | | | | 2,243.1 | |
| Respiratory | | | 2,622.0 | | | | 2,009.4 | | | | 1,489.8 | |
| Anti-inflammatory/analgesics | | | 1,779.6 | | | | 2,677.3 | | | | 2,587.2 | |
| Anti-bacterial/anti-fungal | | | 1,200.9 | | | | 1,028.5 | | | | 821.0 | |
| Vaccines/biologicals | | | 1,036.1 | | | | 1,056.1 | | | | 1,028.3 | |
| Urology | | | 733.1 | | | | 605.5 | | | | 547.3 | |
| Ophthalmologicals | | | 726.5 | | | | 675.1 | | | | 621.5 | |
| Human immunodeficiency virus (HIV) | | | 255.5 | | | | 290.6 | | | | 294.3 | |
| Other | | | 2,555.6 | | | | 2,967.3 | | | | 2,783.4 | |
| |
| | | $ | 22,938.6 | | | $ | 22,485.9 | | | $ | 21,445.8 | |
| |
(1) `Presented net of discounts and returns.
The Company’s products include therapeutic and preventive agents, generally sold by prescription, for the treatment of human disorders. Among these are atherosclerosis products, of whichZocoris the largest-selling; hyper- tension/heart failure products, the most significant of which areCozaar,Hyzaar, andVasotec; an osteoporosis product,Fosamax, for treatment and prevention of osteoporosis; a respiratory product,Singulair, a leukotriene receptor antagonist for treatment of asthma and for relief of symptoms of seasonal allergic rhinitis; anti-inflammatory/analgesics, which includeVioxx, which was voluntarily withdrawn worldwide on September 30, 2004, andArcoxia, agents that specifically inhibit the COX-2 enzyme, which is responsible for pain and inflammation (coxib); anti-bacterial/anti-fungal products, which includesPrimaxin,CancidasandInvanz; vaccines/biologicals, of whichVarivax, a live virus vaccine for the prevention of chickenpox,M-M-RII, a pediatric vaccine for measles, mumps and rubella,Pneumovax, a vaccine for the prevention of pneumococcal, andRecombivax HB (hepatitis B vaccine recombinant) are the largest-selling; a urology product,Proscar, for treatment of symptomatic benign prostate enlargement; ophthalmologicals, of whichCosoptandTrusoptare the largest-selling; and HIV products, which includeStocrinandCrixivanfor the treatment of human immunodeficiency viral infection in adults.
Other primarily includes sales of other human pharmaceuticals, pharmaceutical and animal health supply sales to the Company’s joint ventures and revenue from the Company’s relationship with AZLP, primarily relating to sales ofNexiumandPrilosec. Revenue from AZLP was $1.5 billion, $1.9 billion and $1.5 billion in 2004, 2003 and 2002, respectively.
Singulair, Merck’s once-a-day oral medication indicated for the treatment of chronic asthma and the relief of symptoms of seasonal allergic rhinitis (hay fever), continued its strong performance in 2004.Singulairis the No. 1 asthma controller in terms of total prescriptions in the United States as patients, physicians and managed care organizations continue to recognize the valueSingulairoffers to those who suffer from asthma or seasonal allergic rhinitis. Total 2004 sales ofSingulairwere $2.6 billion, an increase of 30% over 2003.Singulairperformance includes a favorable comparison to 2003, which was affected by U.S. wholesaler
| | |
| 22 | | Merck & Co., Inc. Annual Report 2004 |
buy-out. U.S. mail-order-adjusted prescription levels forSingulairincreased by approximately 21% in 2004.
Merck is seeking new indications forSingulair. A new indication for perennial allergic rhinitis was filed with the FDA in the second half of 2004. Merck also plans to file for additional indications forSingulairfor the prevention of exercise-induced bronchospasm in 2005, for acute asthma during the second half of 2006 and for respiratory syncytial viral bronchiolitis in 2008.
Fosamax, the most prescribed medicine worldwide for the treatment of postmenopausal, male and glucocorticoid-induced osteoporosis, continued its strong growth in 2004 with sales of $3.2 billion, an increase of 18% over 2003.Fosamaxperformance includes a favorable comparison to 2003, which was affected by U.S. wholesaler buy-out. U.S. mail-order-adjusted prescription levels forFosamaxincreased by approximately 1% in 2004.
In April, theJournal of Internal Medicinepublished findings from the first international head-to-head study that compared the efficacy ofFosamaxOnce Weekly (alendronate) 70 mg to Evista (raloxifene) 60 mg once daily, which showed thatFosamaxprovided significantly greater increases in bone mineral density (BMD) at the lumbar spine and total hip.
Results from theFosamaxActonel Comparison Trial (FACT) were presented in October at the American Society for Bone and Mineral Research meeting. This is the first head-to-head study conducted in the United States comparing FDA-approved once-weekly osteoporosis treatments in postmenopausal women with osteoporosis. FACT showed thatFosamaxdemonstrated significantly greater increases in BMD at all sites measured as early as six months and greater reductions in markers of bone-turnover than once-weekly Actonel.Fosamaxincreased BMD 62 percent more than Actonel at the hip trochanter (hip bone), with similar tolerability. BMD is a major determinant of bone strength. The lower the BMD score, the greater the risk of fracture.
Merck expects to enhance its osteoporosis franchise with the addition ofFosamaxplus vitamin D, a compound that combines alendronate (the active ingredient inFosamax) and vitamin D. The Company submitted a New Drug Application (NDA) to the FDA for the product in 2004. Vitamin D is critical for calcium absorption, which aids bone strength. An estimated 50 percent of osteoporosis patients have inadequate levels of vitamin D, and compliance among those prescribed supplements is poor. CombiningFosamaxand vitamin D could help ensure an adequate weekly dose of vitamin D in a convenient manner for patients with osteoporosis.
In 2003, the FDA granted an additional six months of market exclusivity in the United States toFosamaxuntil February 2008 andFosamaxOnce Weekly until January 2019. However, on January 28, 2005, the U.S. Court of Appeals for the Federal Circuit in Washington, D.C. found the Company’s patent claims for once-weekly administration ofFosamaxto be invalid. Based on the Court of Appeals’ decision,Fosamaxwill lose its market exclusivity in the United States in February 2008 and the Company expects a decline in U.S.Fosamaxsales at that time. Prior to the decision, Merck’s patent for once-weekly administration ofFosamaxwas set to expire in July 2018. Merck disagrees with the decision of the Court of Appeals and will request reconsideration by the Court of Appeals.
Global sales forCozaar, and its companion agent,Hyzaar(a combination ofCozaarand the diuretic hydrochlorothiazide), for the treatment of hypertension were strong in 2004, reaching $2.8 billion, a 14% increase over 2003. U.S. mail-order-adjusted prescription levels forCozaarandHyzaarincreased by approximately 5% in 2004.
CozaarandHyzaarcompete in the fastest-growing class in the antihypertensive market, angiotension II antagonists (AIIA).Cozaarcontinues to be the largest-selling branded AIIA in Europe and the second-most-frequently prescribed AIIA in the United States.
A new formulation is expected to help drive future growth forCozaar/Hyzaar.Hyzaar100/12.5 mg was submitted for approval to the FDA in December to better address the need for titration flexibility as an intermediate step betweenCozaar100 mg andHyzaar100/25 mg. Filings for this new formulation in markets outside the United States are anticipated throughout 2005.
Zocor, Merck’s statin for modifying cholesterol, achieved worldwide sales of $5.2 billion in 2004, an increase of 4% from 2003.Zocorperformance includes a favorable comparison to 2003, which was affected by U.S. wholesaler buy-out. Excluding this effect,Zocorexperienced a volume decline. Sales ofZocorwere affected by patent expirations outside the United States and increased competition in the U.S. cholesterol-modifying market. Mail-order-adjusted prescription levels in the United States forZocorincreased by approximately 2% in 2004.Zocoris available for 93 percent of managed care lives; and 79 percent of the targeted managed care contracts have been renewed through 2006. In June 2006,Zocorwill lose its market exclusivity in the United States and the Company expects a decline in U.S.Zocorsales.
The Company continues to promote the landmark Heart Protection Study (HPS) to physicians and consumers. The HPS demonstrated thatZocor40 mg, along with diet, is proven to reduce the risk of heart attacks and stroke in people with heart disease, regardless of cholesterol level.
In July, the National Cholesterol Education Program (NCEP) issued a report recommending modifications to the Adult Treatment Panel III (ATP III) guidelines. The report, which was based on five major studies, including the HPS, was endorsed by the American Heart Association, the American College of Cardiology, and the National Heart, Lung and Blood Institute. The new report may lead to an increase in the number of people for whom cholesterol-lowering medicines should be considered. Under the NCEP ATP III guidelines, an estimated 36 million people would be eligible for cholesterol-lowering medication such asZocorfor cholesterol management. According to the new report, in high risk persons, the recommended LDL-C goal is <100 mg/dL. The report also indicates that when risk is very high, such as for a patient with established cardiovascular disease plus multiple major risk factors (especially diabetes), an LDL-C goal of <70 mg/dL is a reasonable clinical strategy for physicians.
Sales ofArcoxia, the Company’s once-a-day coxib, reached $230.2 million outside the United States in 2004.Arcoxiahas been launched in 51 countries in Europe, Latin America and Asia. In October, the Company received an “approvable” letter from the FDA for the Company’s NDA forArcoxia. The FDA informed the Company in the letter that before approval of the NDA can be issued, additional safety and efficacy data forArcoxiaare required.
Also in October, the European Medicines Evaluation Agency (EMEA) announced that it would conduct a review of all COX-2 inhibitors, includingArcoxia, in light of the worldwide withdrawal ofVioxx. The EMEA said that it had been asked to conduct the review by the European Commission as a “precautionary measure” and that it would look at all aspects of the cardiovascular safety of COX-2 inhibitors, including thrombotic and cardio-renal events. On January 18, 2005, the EMEA’s Committee on Medicinal Products for Human Use (CHMP) held hearings in connection with its review. Additional meetings were held by CHMP in mid-February to continue its review to determine whether there is a need to make EU-wide changes to the products’ marketing authorizations, including labeling, and to determine whether additional studies are needed. On February 17, 2005, CHMP announced that it had concluded that the available data show an increased risk of cardiovascular adverse events for COX-2 inhibitors as a class relative to placebo and some NSAIDS. According to CHMP, the data also suggested an association between duration of use and dose and the probability of suffering a cardiovascular event and therefore recommended use of the lowest effective dose of COX-2 inhibitors for the shortest possible duration of treatment.
| | |
| Merck & Co., Inc. Annual Report 2004 | | 23 |
Further, CHMP introduced a contra-indication for all COX-2 inhibitors in patients with ischemic heart disease or stroke, and expanded the contra-indication for certain patients having higher classes of congestive heart failure. Specifically with respect toArcoxia, CHMP also introduced a contra-indication in patients with hypertension whose blood pressure is not under control, and advised thatArcoxiamay be associated with more frequent and severe effects on blood pressure, particularly at higher doses, than some other COX-2 inhibitors, and recommended monitoring of blood pressure for all patients takingArcoxia. CHMP stated that these are interim measures pending the finalization of the class review which is expected in April 2005. Finally, CHMP concluded that more research is needed in the field to evaluate the cardiovascular safety of COX-2 inhibitors, and that ongoing cardiovascular trials should continue as planned.
Merck is working with other regulatory agencies in the countries whereArcoxiais approved to assess whether changes to the prescribing information for the coxib class of drugs, includingArcoxia, are warranted.
Other products experiencing growth in 2004 includeCancidasto treat certain life-threatening fungal infections,Proscarfor the treatment of symptomatic benign prostate enlargement,Cosoptto treat glaucoma,Stocrinfor treatment of HIV infections,Propeciafor male pattern hair loss,Invanzfor the treatment of selected moderate to severe infection in adults andEmendfor prevention of acute and delayed nausea and vomiting associated with highly emetogenic cancer chemotherapy. Also contributing to Merck’s total sales in 2004 was revenue resulting from the Company’s relationship with AZLP, primarily relating to sales ofNexium.
Global sales ofZetia(brandedEzetroloutside the United States), the cholesterol-absorption inhibitor developed and marketed by the Merck/Schering-Plough partnership, reached $1.1 billion in 2004. In December,Zetiaaccounted for approximately 6% of total prescriptions in the lipid-lowering market, according to IMS Health, and is reimbursed for nearly 90 percent of all patients in managed care plans in the United States. To date,Ezetrolhas been launched in more than 50 countries outside of the United States and continues to achieve solid sales and market share growth.
Vytorin(marketed asInegyin many countries outside of the United States), developed and marketed by the Merck/Schering-Plough partnership, was approved by the FDA in July.Vytorin accounted for nearly 4% of new prescriptions in December in the U.S. lipid-lowering market, according to IMS Health. Worldwide sales ofVytorinwere $132.4 million in 2004. In addition to the United States,Vytorinhas been approved in 15 countries.
Vytorinis the only single tablet to provide powerful LDL cholesterol reduction through dual inhibition of the two sources of cholesterol by inhibiting the production of cholesterol in the liver and blocking absorption of cholesterol in the intestine, including cholesterol from food. In two separate clinical trials,Vytorinprovided greater reductions in LDL cholesterol than Lipitor orZocoracross the dosing ranges.
In November, Merck and Schering-Plough announced a new clinical trial forVytorin, IMPROVE IT (Improved Reduction of Outcomes:VytorinEfficacy International Trial). This trial will evaluateVytorinin reducing major cardiovascular events through intensive lipid lowering of LDL cholesterol in 10,000 patients with acute coronary syndrome. IMPROVE IT is the fourth large-scale outcomes trial being conducted onVytorin.
The Company records the results from its interest in the Merck/Schering-Plough partnership in Equity income from affiliates.
Costs, Expenses and Other
| | | | | | | | | | | | | | | | | | | | |
| ($ in millions) | | 2004 | | | Change | | 2003 | | | Change | | 2002 | |
| |
| Materials and production | | $ | 4,959.8 | | | | +12 | % | | $ | 4,436.9 | | | | +11 | % | | $ | 4,004.9 | |
| Marketing and administrative | | | 7,346.3 | | | | +15 | % | | | 6,394.9 | | | | +13 | % | | | 5,652.2 | |
| Research and development | | | 4,010.2 | | | | +22 | % | | | 3,279.9 | | | | +23 | % | | | 2,677.2 | |
| Equity income from affiliates | | | (1,008.2 | ) | | | * | | | | (474.2 | ) | | | -26 | % | | | (644.7 | ) |
| Other (income) expense, net | | | (344.0 | ) | | | +69 | % | | | (203.2 | ) | | | * | | | | 104.5 | |
| |
| | | $ | 14,964.1 | | | | +11 | % | | $ | 13,434.3 | | | | +14 | % | | $ | 11,794.1 | |
| |
* 100% or greater.
Materials and Production
In 2004, materials and production costs increased 12% compared to a 2% sales growth rate. Excluding the effects of exchange and inflation, these costs increased 8%, compared to a decrease of 2% in sales volume. The increase in these costs relative to the sales volume change reflects the unfavorable effects associated with the withdrawal ofVioxxand the impact of changes in product mix. In 2003, materials and production costs increased 11%, compared to a 5% sales growth rate. Excluding the effects of exchange and inflation, these costs increased 7%, compared to sales volume at the same level as 2002. The increase in these costs relative to the sales volume reflects the effect of changes in product mix as well as a change in the mix of domestic and foreign sales, attributable in part to the implementation of the new distribution program for U.S. wholesalers in 2003. Gross margin was 78.4% in 2004 compared to 80.3% in 2003 and 81.3% in 2002. The withdrawal ofVioxxhad an unfavorable effect on the gross margin in 2004.
Marketing and Administrative
In 2004, marketing and administrative expenses increased 15%. Excluding the effects of exchange and inflation, these costs increased 8% including the impact of an additional $604.0 million reserve solely for future legal defense costs forVioxxLitigation and $141.4 million of estimated costs to undertake the withdrawal ofVioxx. Excluding such costs, as well as restructuring costs related to previously announced position eliminations described below of $104.6 million and $194.6 million in 2004 and 2003, respectively, marketing and administrative
expenses decreased 2%.
| | |
| 24 | | Merck & Co., Inc. Annual Report 2004 |
The $604.0 million charge taken in the fourth quarter of 2004 increased the Company’s reserve solely for its future legal defense costs related to theVioxxLitigation to $675.0 million as of December 31. This reserve is based on certain assumptions and is the minimum amount that the Company believes at this time it can reasonably estimate will be spent over a multi-year period. The Company will continue to monitor its legal defense costs and review the adequacy of the associated reserves. The Company has not established any reserves for any potential liability relating to theVioxxLitigation. (See Note 3 to the financial statements for further information.)
In October 2003, Merck announced plans to eliminate 4,400 positions as part of a cost-reduction initiative that was completed at the end of 2004. As of December 31, the Company had eliminated 5,100 positions, as the Company identified additional opportunities to eliminate positions and reduce costs. Most of the additional eliminations came from contractor positions. This action is expected to result in approximately $300 million in savings in 2005 without impacting either key productivity initiatives or Merck’s ability to meet its business objectives. Merck has also redeployed sales representatives that had previously supportedVioxxto capitalize on opportunities to grow its in-line products and support upcoming launches.
In 2003, marketing and administrative expenses increased 13%. Excluding the effects of exchange, inflation and the impact of $194.6 million for restructuring costs related to position eliminations, these costs increased by 1%.
Research and Development
Research and development expenses increased 22% in 2004. Excluding the effects of exchange and inflation, these expenses increased 18%. Research and development expense growth reflects the Company’s ongoing commitment to both basic and clinical research, as well as the impact of the Company’s external collaborations to augment Merck’s internal research efforts, such as those with H. Lundbeck A/S (Lundbeck), Bristol-Myers Squibb Company (BMS), Vertex Pharmaceuticals Incorporated (Vertex), DOV Pharmaceutical, Inc. (DOV), Nastech Pharmaceutical Inc. (Nastech) and Ono Pharmaceutical Co., Ltd. (Ono). Also contributing to the increase is higher acquired research expense primarily related to the acquisition of Aton Pharma, Inc. (Aton) in 2004 compared with the acquired research expense related to the increase in the Company’s ownership of Banyu Pharmaceutical Co., Ltd. (Banyu) in 2003.
The Company’s efforts to expand its pipeline by moving into new therapeutic categories, increasing its licensing activities and accelerating early- and late-stage development continue to produce positive results.
In November, the Company announced it had filed a Biologics LicenseApplication forProQuad [Measles, Mumps, Rubella and Varicella (Oka/Merck) Virus Vaccine Live] with the FDA.ProQuadis an investigational vaccine for simultaneous vaccination against measles, mumps, rubella and varicella in children 12 months to 12 years of age.ProQuadcombines two established Merck vaccines,M-M-RII (Measles, Mumps, Rubella Virus Vaccine Live) andVarivax[Varicella (Oka/Merck) Virus Vaccine Live].
In a new study presented at the National Immunization Conference in May, a single dose ofProQuadin 4- to 6-year-olds used in place of the routinely administered second dose ofM-M-RII was generally well-tolerated and resulted in antibody response similar to those developed withM-M-RII andVarivaxseparately.
Merck’s late-stage pipeline includes three Phase III vaccines which are expected to be submitted for FDA approval in 2005. The three vaccines are:RotaTeq, a vaccine to protect against rotavirus disease;Gardasil, a vaccine to prevent the incidence of human papillomavirus (HPV) infection and the associated development of cervical cancer and genital warts; and a vaccine for the prevention of zoster (shingles) and the reduction of pain associated with it. These vaccines will provide significant new opportunities for Merck in the pediatric, adolescent and adult vaccine markets.
It is estimated that, by age 5, all children worldwide become infected by rotavirus, a highly contagious virus that causes gastroenteritis and results in the hospitalization of nearly 50,000 children under age 5 annually in the United States. Worldwide, rotavirus is responsible for an estimated 500,000 deaths each year. The planned filing of theRotaTeqvaccine with the FDA is in the second quarter of 2005.
HPV is the predominant causative agent of cervical cancer, which results in approximately 288,000 deaths worldwide each year. Merck expects to fileGardasilwith the FDA during the second half of 2005 for the prevention of HPV, related cervical cancer and genital warts. There are an estimated 86 million women in the United States and European Union between the ages of 9 and 24, the expected age range for the initial indication ofGardasil.
The analysis of data of an investigational HPV vaccine studied by Merck was presented at the Interscience Conference on Antimicrobial Agents and Chemotherapy in November. The vaccine studied in this clinical trial was an investigational monovalent vaccine developed to prevent infection by HPV type 16; it is a component of Merck’s investigational quadrivalent HPV (types 6, 11, 16, 18) L1 VLP vaccine,Gardasil. In the study of 2,391 women aged 16 to 23 who were HPV 16-naïve at baseline, the vaccine was 100 percent efficacious in preventing the development of HPV 16-related CIN 2/3 (high-grade cervical pre-cancer, the immediate precursor to invasive cervical cancer). Administration of the HPV 16 vaccine also resulted in a 94-percent reduction in the combined incidence of persistent HPV 16 infection and HPV 16-related cervical precancerous lesions (Cervical Intraepithelial Neoplasia = CIN). These are the final results of this study after the completion of 48 months of follow-up on all active study participants.
On February 2, 2005, the Company announced that it and GlaxoSmithKline (GSK) entered into a cross-license and settlement agreement for certain patent rights related to HPV vaccines. Pursuant to the agreement, GSK will receive an upfront payment and royalties from the Company based upon sales ofGardasil, upon development and launch. The agreement resolves competing intellectual property claims related to the Company’s and GSK’s vaccine candidates. The Company will continue with its research, development and, after appropriate regulatory reviews, commercialization activities, if approved, forGardasil.
Shingles, the reactivation of the chickenpox virus (herpes zoster) in adults, affects an estimated 800,000 people in the United States annually. Merck plans to seek approval for its zoster vaccine for people age 50 and older, of which there are approximately 210 million in the United States and European Union. The planned filing of the zoster vaccine with the FDA is in the second quarter of 2005.
The Company is also studying a DPP-IV inhibitor, a glucose-lowering mechanism, used alone and in combination for the treatment of Type 2 diabetes. The compound is currently in Phase III clinical studies and the Company expects to submit an NDA to the FDA in 2006.
| | |
| Merck & Co., Inc. Annual Report 2004 | | 25 |
Merck’s early-stage pipeline includes candidates in each of the following areas: Alzheimer’s disease, arthritis, atherosclerosis, cancer, diabetes, endocrine disorders, glaucoma, infectious diseases, obesity, osteoporosis, psychiatric disease, neurodegenerative disease, pain, respiratory disease, urogenital disorders and vaccines.
Merck continues to augment its internal research efforts by capitalizing on external growth opportunities, ranging from research collaborations, preclinical and clinical compounds and technology transactions that will drive both near- and long-term growth. The Company completed 50 transactions in 2004 across a range of therapeutic areas, including neuroscience, diabetes, obesity and oncol- ogy, as well as early-stage technology transactions. This compares with 10 total transactions in 1999. Merck continues to evaluate more than 40 other opportunities, and is actively monitoring the landscape for a range of targeted acquisitions that meet the Company’s strategic criteria.
In February, the Company announced that it had entered into an agreement with Lundbeck for the exclusive development and commercialization in the United States of gaboxadol, a compound licensed to Lundbeck by a third party that is currently in Phase III development for the treatment of sleep disorders. Under the terms of the agreement, Lundbeck received an initial payment of $70.0 million and, during the term of the agreement, could receive up to $200.0 million in additional milestone payments. Merck and Lundbeck will jointly complete the ongoing Phase III clinical program, with Merck funding the majority of the remaining development activities. The companies anticipate that Merck will file an NDA with the FDA between late 2006 and early 2007. Following FDA approval, the companies plan to co-promote gaboxadol in the United States. Lundbeck will receive a share of gaboxadol sales in the United States. In June, Merck and Lundbeck announced an extension of their agreement for the exclusive development and commercialization of gaboxadol to Japan. Merck and Lundbeck will jointly conduct the clinical program required for filing an NDA in Japan, with Merck funding the majority of the development activities. Following approval, the companies plan to co-promote gaboxadol in Japan. Lundbeck will receive a share of Japanese gaboxadol sales.
In April, Merck and BMS entered into a worldwide collaborative agreement for muraglitazar, BMS’s product for use in treating patients with Type 2 diabetes. Merck and BMS will globally develop and market muraglitazar. BMS submitted an NDA to the FDA in December for muraglitazar. Muraglitazar has the potential to be the first in a novel class of drugs known as glitazars. This class of dual alpha/gamma PPAR agonists, including muraglitazar, is thought to control blood sugar. In clinical trials, muraglitazar has reduced blood glucose levels, decreased triglyceride levels, and increased high-density lipoprotein (HDL) cholesterol levels in Type 2 diabetes patients and has been generally well-tolerated. An estimated 18 million people in the United States currently suffer from Type 2 diabetes. BMS received a $100.0 million upfront payment and, during the term of the agreement, could receive up to $275.0 million in additio nal payments based on the achievement of certain regulatory milestones. Merck and BMS share equally in development and commercialization costs for muraglitazar. Both companies will co-promote the product to physicians on a global basis, and Merck will receive payments based on net sales levels.
In June, Merck and Vertex entered into a global collaboration to develop and commercialize VX-680, Vertex’s lead Aurora kinase inhibitor that is in Phase I clinical development for the treatment of cancer. Aurora kinases are implicated
in the onset and progression of many different human cancers, and novel Aurora kinase inhibitors such as VX-680 have the potential to play an important future role in the treatment and management of a wide range of tumor types. Vertex received a $20.0 million upfront payment and, during the term of the agreement, could receive up to an additional $14.0 million in research funding over the next two years. In addition, Vertex could receive additional milestone payments based upon the achievement of significant development events, regulatory filings and other events and approvals.
In August, Merck and DOV announced an agreement for the development and commercialization of DOV’s novel triple-uptake inhibitors being developed for depression and related psychiatric disorders. DOV received a $35.0 million upfront payment and, during the term of the agreement, could receive additional milestone payments based upon the achievement of significant development events, regulatory filings and other events and approvals. Merck has licensed exclusive worldwide rights to DOV 21,947, which is in Phase I, for all therapeutic indications.
In September, Merck and Nastech announced a global alliance to develop and commercialize Peptide YY (PYY) 3-36 Nasal Spray, Nastech’s product for the treatment of obesity, which is currently in Phase I development. The investigational PYY3-36 Nasal Spray is designed to deliver the natural, appetite-regulating hormone PYY directly to the bloodstream.
In November, Merck and Ono announced that they signed an agreement granting Merck the worldwide license for ONO-2506 ((2R)-2-propyloctanoic acid), a novel intravenous compound currently in Phase II development for the treatment of acute stroke. Under the terms of the agreement, Ono received an initial upfront payment and, during the term of the agreement, could receive milestone payments in addition to royalties on net sales. In addition, Ono received exclusive rights in Japan to develop and marketEmend(aprepitant), Merck’s drug for use in combination with other antiemetic agents for prevention of acute and delayed nausea and vomiting associated with initial and repeat courses of highly emetogenic cancer chemotherapy, including cisplatin. Ono also received rights in Japan to co-market a second brand of MK-431, Merck’s investigational oral compound for the treatment of diabetes, under a yet to be determined trademark.
In March, the Company acquired Aton, a privately held biotechnology company focusing on the development of novel treatments for cancer and other serious diseases. Aton’s clinical pipeline of histone deacetylase inhibitors represents a class of anti-tumor agents with potential for efficacy based on a novel mechanism of action. The lead product candidate, suberoylanilide hydroxamic acid (SAHA) is currently in Phase II clinical trials for the treatment of cutaneous T-cell lymphoma. The acquisition resulted in $125.5 million of acquired research expense. Former shareholders of Aton may receive additional payments which are contingent upon regulatory filing, approval, and sales of certain Aton products.
The chart below reflects the Company’s current research pipeline as of February 15, 2005. Candidates shown in Phase III include specific products. Candidates shown in Phase I and II include the most advanced compound with a specific mechanism in a given therapeutic area. Back-up compounds, regardless of their phase of development, additional indications in the same therapeutic areas and additional line extensions or formulations for in-line products are not shown. Preclinical areas shown are those where the Company has initiated Good Laboratory Practices studies in compounds with mechanisms distinct from those in Phase I and II. The Company’s programs are generally designed to focus on the development of novel medicines to address large, unmet medical needs.
| | |
| 26 | | Merck & Co., Inc. Annual Report 2004 |
| | | |
| Research Pipeline | | |
| |
| Preclinical | | |
| |
| Alzheimer’s Disease | | |
| Antibacterials | | |
| Antiviral | | |
| Arthritis | | |
| Atherosclerosis | | |
| Cancer | | |
| Cardiovascular Disease | | |
| Diabetes | | |
| Glaucoma | | |
| Immunology | | |
| Insomnia | | |
| Osteoporosis | | |
| Pain | | |
| Respiratory Disease | | |
| Vaccines | | |
| |
| Phase I | | |
| |
| Alzheimer’s Disease | | c-7617 |
| Arthritis | | c-7198, c-9101 |
| Cancer | | c-8585, VX-680* |
| CINV | | c-9280 |
| Diabetes | | c-0730 |
| Endocrine | | c-0239, c-0302, c-7717 |
| Glaucoma | | c-3859 |
| Obesity | | Nastech PYY3-36* |
| Osteoporosis | | c-3578 |
| Pain | | c-8928, c-6740, c-1246 |
| Parkinson’s Disease | | c-6161 |
| Psychiatric Disease | | DOV* |
| Urinary Incontinence | | c-4699, c-0172 |
| |
| Phase II | | |
| |
| AIDS | | c-1605 |
| Alzheimer’s Disease | | c-9136 |
| Arthritis | | c-4462, c-9787 |
| Atherosclerosis | | c-8834, c-1602 |
| Cancer (CTCL) | | SAHA* |
| Diabetes | | c-3347 |
| HIV Vaccine | | |
| Multiple Sclerosis | | c-6448 |
| Obesity | | c-2624, c-2735, c-5093 |
| Pediatric Vaccine | | |
| Psychiatric Disease | | c-9054 |
| Respiratory Disease | | c-3193, c-3885 |
| Stroke | | ONO 2506* |
| |
| Phase III | | |
| |
| HPV and Related Cervical Cancer and Genital Warts | | Gardasil |
| Diabetes | | MK-431 |
| Rotavirus Gastroenteritis | | RotaTeq |
| Insomnia | | Gaboxadol* |
| Shingles | | Zoster Vaccine |
| |
| 2004 U.S. Submissions | | |
| |
| Diabetes | | Muraglitazar* |
| Osteoporosis | | FosamaxPlus Vitamin D |
| Pediatric Vaccine | | ProQuad |
* Licensed
Research and development expenses increased 23% in 2003. Excluding the effects of exchange and inflation, these expenses increased 17%.
Research and development in the pharmaceutical industry is inherently a long-term process. The following data show an unbroken trend of year-to-year increases in the Company’s research and development spending. For the period 1995 to 2004, the compounded annual growth rate in research and development was 13%.

Equity Income from Affiliates
Equity income from affiliates reflects the performance of the Company’s joint ventures and partnership returns from AZLP. In 2004, the increase in equity income from affiliates reflects the successful performance ofZetiathrough the Merck/Schering-Plough partnership as well as higher partnership returns from AZLP relative to 2003. Equity income also includes the results ofVytorin launches in 2004 through the Merck/Schering-Plough partnership. In 2003, the decrease in equity income from affiliates reflected lower partnership returns from AZLP, primarily resulting from the impact of generic competition forPrilosec.
| | |
| | | |
| Merck & Co., Inc. Annual Report 2004 | | 27 |
Other (Income) Expense, Net
The increase in other (income) expense, net, in 2004 primarily reflects a $176.8 million gain from the sale of the Company’s 50-percent equity stake in its European joint venture with Johnson & Johnson. In 2003, the increase in other (income) expense, net, was primarily attributable to an $84.0 million gain on the sale ofAggrastatproduct rights in the United States, lower minority interest expense resulting from the Banyu shares acquisitions, and realized gains on the Company’s investment portfolios relating to the favorable interest rate environment.
| | | | | | | | | | | | | | | | | | | | | |
| Earnings | |
| ($ in millions except | | | | | | | | | | | | | | | |
| per share amounts) | | 2004 | | | Change | | | 2003 | | | Change | | | 2002 | |
| |
| Income from continuing operations | | $ | 5,813.4 | | | | -12% | | | $ | 6,589.6 | | | | -3% | | | $ | 6,794.8 | |
| As a % of sales | | | 25.3% | | | | | | | | 29.3% | | | | | | | | 31.7% | |
| Net income | | | 5,813.4 | | | | | | | | 6,830.9 | | | | | | | | 7,149.5 | |
| As a % of average total assets | | | 14.0% | | | | | | | | 14.9% | | | | | | | | 15.5% | |
| Earnings per common share assuming dilution from continuing operations | | $ | 2.61 | | | | -11% | | | $ | 2.92 | | | | -2% | | | $ | 2.98 | |
| |
The Company’s effective income tax rate was 27.1% in 2004, 27.2% in 2003, and 29.6% in 2002. The lower tax rate in 2004 and 2003 resulted from a change in mix of domestic and foreign income, which in 2004 included the impact of theVioxxwithdrawal, and in 2003 included the impact of restructuring costs and the wholesaler distribution program.
On August 19, 2003, Merck completed the spin-off of Medco Health Solutions, Inc. (Medco Health). The income of Medco Health is presented separately as discontinued operations and was $241.3 million in 2003 and $354.7 million in 2002.
Income from continuing operations declined 12% in 2004 compared to a 3% decline in 2003. Income from continuing operations as a percentage of sales was 25.3% in 2004 compared to 29.3% in 2003 and 31.7% in 2002. The decline in the ratios from 2002 is driven by increased spending in research and development as well as the effect of changes in product mix. The reduction in 2004 also reflects the unfavorable effect of the withdrawal ofVioxx, and was partially offset by the increase in Equity income from affiliates. The reduction in 2003 also reflects the impact of the implementation of a new wholesaler distribution program and restructuring costs related to position eliminations. Net income as a percentage of average total assets was 14.0% in 2004, 14.9% in 2003 and 15.5% in 2002.
Earnings per common share assuming dilution from continuing operations declined 11% in 2004 compared to a decline of 2% in 2003. The lower relative declines of earnings per common share assuming dilution from continuing operations compared to income from continuing operations are a result of treasury stock purchases.
Selected Joint Venture and Affiliate Information
To expand its research base and realize synergies from combining capabilities, opportunities and assets, the Company has formed a number of joint ventures. (See Note 9 to the financial statements for further information.)
In 2000, the Company and Schering-Plough Corporation (Schering-Plough) entered into agreements to create separate equally-owned partnerships to develop and market in the United States new prescription medicines in the cholesterol-management and respiratory therapeutic areas. In 2001, the cholesterolmanagement partnership agreements were expanded to include all the countries of the world, excluding Japan. In 2002, ezetimibe, the first in a new class of cholesterol-lowering agents, was launched in the United States asZetia(brandedEzetroloutside the United States). As of December 2004,Ezetrolhas been launched in more than 50 countries outside the United States. Sales totaled $1.1 billion in 2004, $469.4 million in 2003 and $25.3 million in 2002. In July 2004, a combination product containing the active ingredients of bothZetiaandZocor, was approved in the United States asVytorin(marketed asInegyin many countries outside of the United States).Vytorinhas been approved in 15 countries outside the United States. Sales totaled $132.4 million in 2004. The results from the Company’s interest in the Merck/Schering-Plough partnership are recorded in Equity income from affiliates and were income of $132.0 million in 2004 and losses of $92.5 million and $147.4 million in 2003 and 2002, respectively.
In 1982, the Company entered into an agreement with Astra AB (Astra) to develop and market Astra products in the United States. In 1994, the Company and Astra formed an equally-owned joint venture that developed and marketed most of Astra’s new prescription medicines in the United States includingPrilosec, the first of a class of medications known as proton pump inhibitors, which slows the production of acid from the cells of the stomach lining.
In 1998, the Company and Astra restructured the joint venture whereby the Company acquired Astra’s interest in the joint venture, renamed KBI Inc. (KBI), and contributed KBI’s operating assets to a new U.S. limited partnership named Astra Pharmaceuticals, L.P. (the Partnership), in which the Company maintains a limited partner interest. The Partnership, renamed AstraZeneca LP (AZLP), became the exclusive distributor of the products for which KBI retained rights.
Merck earns ongoing revenue based on sales of current and future KBI products and such revenue was $1.5 billion, $1.9 billion and $1.5 billion in 2004, 2003 and 2002, respectively, primarily relating to sales ofNexiumandPrilosec. In addition, Merck earns certain Partnership returns, which are recorded in Equity income from affiliates. Such returns include a priority return provided for in the Partnership Agreement, variable returns based, in part, upon sales of certain former Astra USA, Inc. products, and a preferential return representing Merck’s share of undistributed AZLP GAAP earnings. These returns aggregated $646.5 million, $391.5 million and $640.2 million in 2004, 2003 and 2002, respectively. The lower amount in 2003 is attributable to a reduction in the preferential return, primarily resulting from the impact of generic competition forPrilosec.
Merck & Co., Inc. Annual Report 2004
In 1997, Merck and Rhône-Poulenc S.A. (now Sanofi-Aventis S.A.) combined their animal health and poultry genetics businesses to form Merial Limited (Merial), a fully integrated animal health company, which is a stand-alone joint venture, equally owned by each party. Merial provides a comprehensive range of pharmaceuticals and vaccines to enhance the health, well-being and performance of a wide range of animal species. Sales of joint venture products were as follows:
| | | | | | | | | | | | | |
| ($ in millions) | | 2004 | | | 2003 | | | 2002 | |
| |
| Fipronil products | | $ | 679.1 | | | $ | 577.2 | | | $ | 486.2 | |
| Avermectin products | | | 452.4 | | | | 476.7 | | | | 462.1 | |
| Other products | | | 841.8 | | | | 779.8 | | | | 705.7 | |
| |
| | | $ | 1,973.3 | | | $ | 1,833.7 | | | $ | 1,654.0 | |
| |
In 1994, Merck and Pasteur Mérieux Connaught (now Sanofi Pasteur S.A.) established a 50% owned joint venture to market vaccines in Europe and to collaborate in the development of combination vaccines for distribution in Europe. Sales of joint venture products were as follows:
| | | | | | | | | | | | | |
| ($ in millions) | | 2004 | | | 2003 | | | 2002 | |
| |
| Hepatitis vaccines | | $ | 80.5 | | | $ | 73.6 | | | $ | 69.4 | |
| Viral vaccines | | | 54.0 | | | | 51.5 | | | | 34.6 | |
| Other vaccines | | | 672.5 | | | | 543.9 | | | | 442.4 | |
| |
| | | $ | 807.0 | | | $ | 669.0 | | | $ | 546.4 | |
| |
In 1989, Merck formed a joint venture with Johnson & Johnson to develop and market a broad range of nonprescription medicines for U.S. consumers. This 50% owned joint venture was expanded into Europe in 1993, and into Canada in 1996. In March 2004, Merck sold its 50% equity stake in its European joint venture to Johnson & Johnson for $244.0 million and recorded a $176.8 million gain as Other (income) expense, net. Merck will continue to benefit through royalties on certain products and also regained the rights to potential future products that switch from prescription to over-the-counter status in Europe. Sales of joint venture products were as follows:
| | | | | | | | | | | | | |
| ($ in millions) | | 2004* | | | 2003 | | | 2002 | |
| |
| Gastrointestinal products | | $ | 269.2 | | | $ | 299.6 | | | $ | 299.0 | |
| Other products | | | 46.1 | | | | 146.2 | | | | 114.0 | |
| |
| | | $ | 315.3 | | | $ | 445.8 | | | $ | 413.0 | |
| |
* Includes sales of the European joint venture up through March 2004.
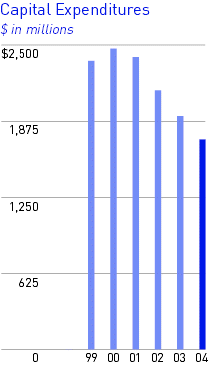
Capital Expenditures
Capital expenditures were $1.7 billion in 2004 and $1.9 billion in 2003. Expenditures in the United States were $1.1 billion in 2004 and $1.3 billion in 2003. Expenditures during 2004 included $677.8 million for production facilities, $675.9 million for research and development facilities, $50.2 million for environmental projects, and $322.2 million for administrative, safety and general site projects. Capital expenditures approved but not yet spent at December 31, 2004 were $1.1 billion. Capital expenditures for 2005 are estimated to be $1.5 billion.
Depreciation was $1.3 billion in 2004 and $1.1 billion in 2003, of which $908.4 million and $790.0 million, respectively, applied to locations in the United States.
Analysis of Liquidity and Capital Resources
Merck’s strong financial profile enables the Company to fully fund research and development, focus on external alliances, support in-line products and maximize upcoming launches while providing significant cash returns to shareholders. Cash provided by operating activities of $8.8 billion continues to be the Company’s primary source of funds to finance capital expenditures, treasury stock purchases and dividends paid to stockholders. At December 31, 2004, the total of worldwide cash and investments was $13.8 billion, including $7.1 billion of cash, cash equivalents and short-term investments, and $6.7 billion of long-term investments.
Selected Data
| | | | | | | | | | | | | |
| |
| ($in millions) | | 2004 | | | 2003 | | | 2002 | |
| |
| Working capital | | $ | 1,731.1 | | | $ | 1,957.6 | | | $ | 2,011.2 | |
| Total debt to total liabilities and equity | | | 16.1 | % | | | 16.7 | % | | | 18.0 | % |
| Cash provided by operations to total debt | | | 1.3:1 | | | | 1.2:1 | | | | 1.0:1 | |
| |
Working capital levels are more than adequate to meet the operating requirements of the Company. The ratios of total debt to total liabilities and equity and cash provided by operations to total debt reflect the strength of the Company’s operating cash flows and the ability of the Company to cover its contractual obligations.
The Company’s contractual obligations as of December 31, 2004 are as follows:
Payments Due by Period
| | | | | | | | | | | | | | | | | | | | | |
| |
| | | | | | | | | | | 2006- | | | 2008- | | | There- | |
| ($ in millions) | | Total | | | 2005 | | | 2007 | | | 2009 | | | after | |
| |
| Loans payable and current portion of long-term debt | | $ | 2,181.2 | | | $ | 2,181.2 | | | $ | — | | | $ | — | | | $ | — | |
| Long-term debt | | | 4,691.5 | | | | — | | | | 895.8 | | | | 1,696.5 | | | | 2,099.2 | |
| Operating leases | | | 305.2 | | | | 91.7 | | | | 94.1 | | | | 51.0 | | | | 68.4 | |
| |
| | | $ | 7,177.9 | | | $ | 2,272.9 | | | $ | 989.9 | | | $ | 1,747.5 | | | $ | 2,167.6 | |
| |
| | |
| | | |
| Merck & Co., Inc. Annual Report 2004 | | 29 |
Loans payable and current portion of long-term debt includes $500.0 million of notes with a final maturity in 2011, which, on an annual basis, will either be repurchased from the holders at the option of the remarketing agent and remarketed, or redeemed by the Company. Loans payable and current portion of long-term debt also reflects $345.9 million of long-dated notes that are subject to repayment at the option of the holders on an annual basis. Required funding obligations for 2005 relating to the Company’s pension and other postretirement benefit plans are not expected to be material.
In 2001, the Company’s $1.5 billion shelf registration statement filed with the Securities and Exchange Commission (the SEC) for the issuance of debt securities became effective. In February 2004, the Company issued $350.0 million of 2.5% three-year notes under the shelf. At the same time, the Company entered into an interest rate swap contract that effectively converts the 2.5% fixed-rate notes to floating-rate instruments. In February and March 2004, the Company issued a total of $50.0 million of variable-rate notes under the shelf. In December 2004, the Company’s new $3.0 billion shelf registration statement filed with the the SEC for the issuance of debt securities became effective and in February 2005, the Company issued an additional $1.0 billion of 4.75% ten-year notes under the shelf. The remaining capacity under the Company’s shelf registration statement is approximately $2.8 billion.
In February 2005, the Company established a $1.5 billion, 5-year revolving credit facility to provide backup liquidity for its commercial paper borrowing facility and for general corporate purposes. The Company has not drawn funding from this facility.
After the Company’s voluntary withdrawal ofVioxxon September 30, 2004, Moody’s and Standard & Poor’s each conducted a review of the Company’s long-term credit ratings. Upon completion of those reviews, the Company’s long-term credit ratings were downgraded to Aa3 from Moody’s and AA- from Standard & Poor’s. These ratings continue to allow access to the capital markets and flexibility in obtaining funds on competitive terms. The Company continues to maintain a conservative financial profile. Total cash and investments of $13.8 billion exceeds the sum of loans payable and long-term debt of $6.9 billion. The Company also has long-term credit ratings that remain among the top 4% of rated non-financial corporations. Despite this strong financial profile, certain contingent events, if realized, which are discussed in Note 11, could have a material adverse impact on the Company’s liquidity and capital resources. The Company does not participate in any off-balance sheet arrangements involving unconsolidated subsidiaries that provide financing or potentially expose the Company to unrecorded financial obligations.
In December 2004, the Company redeemed variable-rate preferred units of a subsidiary at $1.5 billion of par value plus accrued dividends. Also in December 2004, the Company extended a $300.0 million variable-rate borrowing that was due in 2004 for an additional five years.
In July 2002, the Board of Directors approved purchases over time of up to $10.0 billion of Merck shares. From 2002 to 2004, the Company purchased $3.6 billion of treasury shares under previously authorized completed programs, and $1.5 billion under the 2002 program. Total treasury stock purchased in 2004 was $974.6 million.
Financial Instruments Market Risk Disclosures
Foreign Currency Risk Management
While the U.S. dollar is the functional currency of the Company’s foreign subsidiaries, a significant portion of the Company’s revenues are denominated in foreign currencies. Merck relies on sustained cash flows generated from foreign sources to support its long-term commitment to U.S. dollar-based research and development. To the extent the dollar value of cash flows is diminished as a result of a strengthening dollar, the Company’s ability to fund research and other dollar- based strategic initiatives at a consistent level may be impaired. The Company has established revenue hedging and balance sheet risk management programs to protect against volatility of future foreign currency cash flows and changes in fair value caused by volatility in foreign exchange rates.
The objective of the revenue hedging program is to reduce the potential for longer-term unfavorable changes in foreign exchange to decrease the U.S. dollar value of future cash flows derived from foreign currency denominated sales, primarily the euro and Japanese yen. To achieve this objective, the Company will partially hedge anticipated third-party sales that are expected to occur over its planning cycle, typically no more than three years into the future. The Company will layer in hedges over time, increasing the portion of sales hedged as it gets closer to the expected date of the transaction, such that it is probable the hedged transaction will occur. The portion of sales hedged is based on assessments of cost-benefit profiles that consider natural offsetting exposures, revenue and exchange rate volatilities and correlations, and the cost of hedging instruments. The hedged anticipated sales are a specified component of a portfolio of similarly denominated foreign currency-based sales transactions, each of which responds to the hedged risk in the same manner. Merck manages its anticipated transaction exposure principally with purchased local currency put options, which provide the Company with a right, but not an obligation, to sell foreign currencies in the future at a predetermined price. If the U.S. dollar strengthens relative to the currency of the hedged anticipated sales, total changes in the options’ cash flows fully offset the decline in the expected future U.S. dollar cash flows of the hedged foreign currency sales. Conversely, if the U.S. dollar weakens, the options’ value reduces to zero, but the Company benefits from the increase in the value of the anticipated foreign currency cash flows. While a weaker U.S. dollar would result in a net benefit, the market value of the Company’s hedges would have declined by $45.2 million and $16.3 million, respectively, from a uniform 10% weakening of the U.S. dollar at December 31, 2004 and 2003. The market value was determined using a foreign exchange option pricing model and holding all factors except exchange rates constant. Because Merck principally uses purchased local currency put options, a uniform weakening of the U.S. dollar will yield the largest overall potential loss in the market value of these options. The sensitivity measurement assumes that a change in one foreign currency relative to the U.S. dollar would not affect other foreign currencies relative to the U.S. dollar. Although not predictive in nature, the Company believes that a 10% threshold reflects reasonably possible near-term changes in Merck’s major foreign currency exposures relative to the U.S. dollar. The cash flows from these contracts are reported as operating activities in the Consolidated Statement of Cash Flows.
The primary objective of the balance sheet risk management program is to protect the U.S. dollar value of foreign currency denominated net monetary assets from the effects of volatility in foreign exchange that might occur prior to their conversion to U.S. dollars. Merck principally utilizes forward exchange contracts, which enable the Company to buy and sell foreign currencies in the future at fixed
Merck & Co., Inc. Annual Report 2004
exchange rates and economically offset the consequences of changes in foreign exchange on the amount of U.S. dollar cash flows derived from the net assets. Merck routinely enters into contracts to fully offset the effects of exchange on exposures denominated in developed country currencies, primarily the euro and Japanese yen. For exposures in developing country currencies, the Company will enter into forward contracts on a more limited basis and only when it is deemed economical to do so based on a cost-benefit analysis that considers the magnitude of the exposure, the volatility of the exchange rate and the cost of the hedging instrument. The Company will also minimize the effect of exchange on monetary assets and liabilities by managing operating activities and net asset positions at the local level. The Company also uses forward contracts to hedge the changes in fair value of certain foreign currency denominated available-for- sale securities attributable to fluctuations in foreign currency exchange rates. A sensitivity analysis to changes in the value of the U.S. dollar on foreign currency denominated derivatives, investments and monetary assets and liabilities indicated that if the U.S. dollar uniformly strengthened by 10% against all currency exposures of the Company at December 31, 2004 and 2003, Income from continuing operations before taxes would have declined by $7.8 million and $5.6 million, respectively. Because Merck is in a net long position relative to its major foreign currencies after consideration of forward contracts, a uniform strengthening of the U.S. dollar will yield the largest overall potential net loss in earnings due to exchange. This measurement assumes that a change in one foreign currency relative to the U.S. dollar would not affect other foreign currencies relative to the U.S. dollar. Although not predictive in nature, the Company believes that a 10% threshold reflects reasonably possible near-term changes in Merck’s major foreign currency exposures relative to the U.S. dollar. The cash flows from these contracts are reported as operating activities in the Consolidated Statement of Cash Flows.
Interest Rate Risk Management
In addition to the revenue hedging and balance sheet risk management programs, the Company may use interest rate swap contracts on certain investing and borrowing transactions to manage its net exposure to interest rate changes and to reduce its overall cost of borrowing. The Company does not use leveraged swaps and, in general, does not leverage any of its investment activities that would put principal capital at risk. At December 31, 2004, the Company was a party to four pay-floating, receive-fixed interest rate swap contracts designated as fair value hedges of fixed rate notes maturing in 2005, 2006, 2007 and 2013, respectively. The notional amounts of these swaps, which match the amount of the hedged fixed rate notes, were $500 million, $500 million, $350 million and $500 million, respectively. The swaps effectively convert the fixed-rate obligations to floating- rate instruments. The cash flows from these contracts are reported as operating activities in the Consolidated Statement of Cash Flows.
The Company’s investment portfolio includes cash equivalents and short- term investments, the market values of which are not significantly impacted by changes in interest rates. The market value of the Company’s medium- to long- term fixed-rate investments is modestly impacted by changes in U.S. interest rates. Changes in medium- to long-term U.S. interest rates would have a more significant impact on the market value of the Company’s fixed-rate borrowings, which generally have longer maturities. A sensitivity analysis to measure potential changes in the market value of the Company’s investments, debt and related swap contracts from a change in interest rates indicated that a one percentage
point increase in interest rates at December 31, 2004 and 2003 would have positively impacted the net aggregate market value of these instruments by $75.4 million and $92.9 million, respectively. A one percentage point decrease at December 31, 2004 and 2003 would have negatively impacted the net aggregate market value by $115.4 million and $138.3 million, respectively. The fair value of the Company’s debt was determined using pricing models reflecting one percentage point shifts in the appropriate yield curves. The fair value of the Company’s investments was determined using a combination of pricing and duration models. Whereas duration is a linear approximation that works well for modest changes in yields and generates a symmetrical result, pricing models reflecting the convexity of the price/yield relationship provide greater precision and reflect the asymmetry of price movements for interest rate changes in opposite directions. The impact of convexity is more pronounced in longer-term maturities and low interest-rate environments.
Critical Accounting Policies and Other Matters
The consolidated financial statements include certain amounts that are based on management’s best estimates and judgments. Estimates are used in determining such items as provisions for sales discounts and returns, depreciable and amortizable lives, recoverability of inventories produced in preparation for product launches, amounts recorded for contingencies, environmental liabilities and other reserves, pension and other postretirement benefit plan assumptions, and taxes on income. Because of the uncertainty inherent in such estimates, actual results may differ from these estimates. Application of the following accounting policies result in accounting estimates having the potential for the most significant impact on the financial statements.
Revenue Recognition
Revenues from sales of products are recognized when title and risk of loss passes to the customer. Revenues for domestic pharmaceutical sales are recognized at the time of shipment, while for many foreign subsidiaries, as well as for vaccine sales, revenues are recognized at the time of delivery. Recognition of revenue also requires reasonable assurance of collection of sales proceeds and completion of all performance obligations. Domestically, sales discounts are issued to customers as direct discounts at the point-of-sale or indirectly through an intermediary wholesale purchaser, known as chargebacks, or indirectly in the form of rebates. Additionally, sales are generally made with a limited right of return under certain conditions. Revenues are recorded net of provisions for sales discounts and returns, which are established at the time of sale.
The provision for aggregate indirect customer discounts covers chargebacks and rebates. Chargebacks are discounts that occur when a contracted customer purchases directly through an intermediary wholesale purchaser. The contracted customer generally purchases product at its contracted price plus a mark-up from the wholesaler. The wholesaler, in turn, charges the Company back for the difference between the price initially paid by the wholesaler and the contract price paid to the wholesaler by the customer. The provision for chargebacks is based on expected sell-through levels by the Company’s wholesale customers to contracted customers, as well as estimated wholesaler inventory levels. Rebates are amounts owed based upon definitive contractual agreements or legal requirements with private sector and public sector (Medicaid) benefit providers, after the final dispensing of the product by a pharmacy to a benefit plan participant. The provision is based on expected payments, which are driven by patient usage and contract performance by the benefit provider customers.
| | |
| | | |
| Merck & Co., Inc. Annual Report 2004 | | 31 |
The Company assumes a first-in, first-out movement of inventory within the supply chain for purposes of estimating its aggregate indirect customer discount accrual. In addition, the Company uses historical customer segment mix, adjusted for other known events, in order to estimate the expected provision. Amounts accrued for aggregate indirect customer discounts are evaluated on a quarterly basis through comparison of information provided by the wholesalers and other customers to the amounts accrued. Adjustments are recorded when trends or significant events indicate that a change in the estimated provision is appropriate.
The Company continually monitors its provision for aggregate indirect customer discounts. There were no material adjustments to estimates associated with the aggregate indirect customer discount provision in 2004, 2003 and 2002.
Summarized information about changes in the aggregate indirect customer discount accrual is as follows:
| | | | | | | | | |
| | | 2004 | | | 2003 | |
| |
| Balance, January 1 | | $ | 752.2 | | | $ | 570.8 | |
| Current provision | | | 4,031.6 | | | | 3,233.1 | |
| Adjustments relating to prior years | | | 57.7 | | | | (4.3 | ) |
| Payments | | | (3,811.2 | ) | | | (3,047.4 | ) |
| |
| Balance, December 31 | | $ | 1,030.3 | | | $ | 752.2 | |
| |
Accruals for chargebacks are reflected as a direct reduction to accounts receivable and accruals for rebates as accrued expenses. The accrued balances relative to these provisions included in Accounts receivable and Accrued and other current liabilities were $133.7 million and $896.6 million, respectively, at December 31, 2004, and $110.4 million and $641.8 million, respectively, at December 31, 2003.
The Company maintains a returns policy that allows its customers to return product within a specified period prior to and subsequent to the expiration date (generally, six months before and twelve months after product expiration). The estimate of the provision for returns is based upon historical experience with actual returns. Additionally, the Company considers factors such as levels of inventory in the distribution channel, product dating and expiration period, whether products have been discontinued, entrance in the market of additional generic competition, changes in formularies or launch of over-the-counter products, to name a few. The product returns provision, as well as actual returns, was approximately 0.5% of net sales in 2004, 2003 and 2002.
Through the distribution program for U.S. wholesalers, implemented in 2003, the Company incents wholesalers to align purchases with underlying demand and maintain inventories within specified levels. The terms of the program allow the wholesalers to earn fees upon providing visibility into their inventory levels as well as by achieving certain performance parameters, such as, inventory management, customer service levels, reducing shortage claims and reducing product returns. Information provided through the wholesaler distribution program includes items such as sales trends, inventory on-hand, on-order quantity and product returns. Wholesalers generally provide only the above mentioned data to the Company, as there is no regulatory requirement to report lot level information to manufacturers, which is the level of information needed to determine the remaining shelf life and original sale date of inventory. Given current wholesaler inventory levels, which are generally less than a month, the Company believes that collection of order lot information across all wholesale customers would have limited use in estimating sales discounts and returns.
Inventories Produced in Preparation for Product Launches
The Company capitalizes inventories produced in preparation for product launches sufficient to support initial market demand. Typically, capitalization of such inventory does not begin until the related product candidates are in Phase III clinical trials and are considered to have a high probability of regulatory approval. At December 31, 2004, inventories produced in preparation for product launches consisted of three vaccine products, all of which are in Phase III clinical trials, as well as a new formulation for an existing vaccine product. The Company continues to monitor the status of each respective product within the regulatory approval process; however, the Company generally does not disclose specific timing for regulatory approval. If the Company is aware of any specific risks or contingencies other than the normal regulatory approval process or if there are any specific issues identified during the research process relating to safety, efficacy, manufacturing, marketing or labeling, the related inventory would generally not be capitalized. There are no significant issues with respect to any of these products. Expiry dates of the inventory are impacted by the stage of completion. The Company manages the levels of inventory at each stage to optimize the shelf life of the inventory in relation to anticipated market demand in order to avoid product expiry issues. The shelf lives for these products range from a minimum of 8 to 13 years. Anticipated future sales of the products support the realization of the inventory value as the inventory shelf life is sufficient to meet initial product launch requirements.
In addition, the Company produced inventory in preparation for the launch ofArcoxiain the United States.Arcoxiahas been launched in 51 countries in Europe, Latin America and Asia. In October 2004, the Company received an “approvable” letter from the FDA for the Company’s NDA forArcoxia. The FDA informed the Company in the letter that before approval of the NDA can be issued, additional safety and efficacy data forArcoxiaare required. In addition, Merck is working with regulatory agencies in the countries whereArcoxiais approved to assess whether changes to the prescribing information for the coxib class of drugs, includingArcoxia, are warranted. While the minimum shelf life forArcoxiais approximately 4 years, anticipated worldwide market demand in countries whereArcoxiahas been approved supports the value of inventory capitalized. The build-up of inventory forArcoxiaand inventories produced in preparation for product launches did not have a material effect on the Company’s liquidity.
Contingencies and Environmental Liabilities
The Company is involved in various claims and legal proceedings of a nature considered normal to its business, including product liability, intellectual property and commercial litigation, as well as additional matters such as antitrust actions. (See Note 11 to the financial statements for further information.) The Company records accruals for contingencies when it is probable that a liability has been incurred and the amount can be reasonably estimated. These accruals are adjusted periodically as assessments change or additional information becomes available. For product liability claims, a portion of the overall accrual is actuarially determined and considers such factors as past experience, number of claims reported and estimates of claims incurred but not yet reported. Individually significant contingent losses are accrued when probable and reasonably estimable.
Legal defense costs expected to be incurred in connection with a loss contingency are accrued when probable and reasonably estimable. At December 31, 2004, the Company’s reserve solely for its future legal defense costs related to theVioxxLitigation was $675.0 million. This reserve is based on certain assumptions and is the minimum amount that the Company believes, at this time, it can reasonably estimate will be spent over a multi-year period. The Company
Merck & Co., Inc. Annual Report 2004
significantly increased the reserve solely for future legal defense costs forVioxxwhen it had the ability to reasonably estimate its future legal defense costs for theVioxxLitigation. Some of the significant factors that were considered in the establishment of the reserve for theVioxx Litigation were as follows: the actual costs incurred by the Company up to that time; the development of the Company’s legal defense strategy and structure in light of the expanded scope of theVioxxLitigation; the number of cases being brought against the Company; and the anticipated timing, progression, and related costs of pre-trial activities and trials in theVioxxProduct Liability Lawsuits. The Company will continue to monitor its legal defense costs and review the adequacy of the associated reserves. The Company has not established any reserves for any potential liability relating to theVioxxLitigation.
The Company is a party to a number of proceedings brought under the Comprehensive Environmental Response, Compensation and Liability Act, comonly known as Superfund. When a legitimate claim for contribution is asserted, a liability is initially accrued based upon the estimated transaction costs to manage the site. Accruals are adjusted as feasibility studies and related cost assessments of remedial techniques are completed, and as the extent to which other potentially responsible parties (PRPs) who may be jointly and severally liable can be expected to contribute is determined.
The Company is also remediating environmental contamination resulting from past industrial activity at certain of its sites and takes an active role in identifying and providing for these costs. A worldwide survey was initially performed to assess all sites for potential contamination resulting from past industrial activities. Where assessment indicated that physical investigation was warranted, such investigation was performed, providing a better evaluation of the need for remedial action. Where such need was identified, remedial action was then initiated. Estimates of the extent of contamination at each site were initially made at the pre-investigation stage and liabilities for the potential cost of remediation were accrued at that time. As more definitive information became available during the course of investigations and/or remedial efforts at each site, estimates were refined and accruals were adjusted accordingly. These estimates and related accruals continue to be refined annually.
The Company believes that it is in compliance in all material respects with applicable environmental laws and regulations. Expenditures for remediation and environmental liabilities were $24.5 million in 2004, and are estimated at $65.6 million for the years 2005 through 2009. In management’s opinion, the liabilities for all environmental matters that are probable and reasonably estimable have been accrued and totaled $127.5 million and $158.1 million at December 31, 2004 and December 31, 2003, respectively. These liabilities are undiscounted, do not consider potential recoveries from insurers or other parties and will be paid out over the periods of remediation for the applicable sites, which are expected to occur primarily over the next 15 years. Although it is not possible to predict with certainty the outcome of these matters, or the ultimate costs of remediation, management does not believe that any reasonably possible expenditures that may be incurred in excess of the liabilities accrued should exceed $75.0 million in the aggregate. Management also does not believe that these expenditures should result in a material adverse effect on the Company’s financial position, results of operations, liquidity or capital resources for any year.
Pensions and Other Postretirement Benefit Plans
Net pension and other postretirement benefit cost totaled $521.5 million in 2004 and $499.2 million in 2003. Pension and other postretirement benefit plan information for financial reporting purposes is calculated using actuarial assumptions including a discount rate for plan benefit obligations and an expected rate of return on plan assets.
The Company reassesses its benefit plan assumptions on a regular basis. For both the pension and other postretirement benefit plans, the discount rate is evaluated annually and modified to reflect the prevailing market rate at December 31 of a portfolio of high-quality fixed-income debt instruments that would provide the future cash flows needed to pay the benefits included in the benefit obligation as they come due. At December 31, 2004, the Company changed its discount rate to 6.0% and 5.75% from 6.25% for its U.S. pension and other postretirement benefit plans, respectively.
The expected rate of return for both the pension and other postretirement benefit plans represents the average rate of return to be earned on plan assets over the period the benefits included in the benefit obligation are to be paid. In developing the expected rate of return, the Company considers long-term compound annualized returns of historical market data as well as actual returns on the Company’s plan assets and applies adjustments that reflect more recent capital market experience. Using this reference information, the Company develops forward-looking return expectations for each asset category and a weighted average expected long-term rate of return for a targeted portfolio allocated across these investment categories. The expected portfolio performance reflects the contribution of active management as appropriate. As a result of this analysis, for 2005, the Company’s expected rate of return of 8.75% remained unchanged from 2004 for its U.S. pension and other postretirement benefit plans.
The target investment portfolio of the Company’s U.S. pension and other postretirement benefit plans is allocated 45% to 60% in U.S. equities, 20% to 30% in international equities, 13% to 18% in fixed-income investments, 2% to 6% in real estate, and up to 8% in cash and other investments. The portfolio’s equity weighting is consistent with the long-term nature of the plans’ benefit obligation. The expected annual standard deviation of returns of the target portfolio, which approximates 13%, reflects both the equity allocation and the diversification benefits among the asset classes in which the portfolio invests.
Actuarial assumptions are based upon management’s best estimates and judgment. A reasonably possible change of plus (minus) 25 basis points in the discount rate assumption, with other assumptions held constant, would have an estimated $35.2 million favorable (unfavorable) impact on net pension and postretirement benefit cost. A reasonably possible change of plus (minus) 25 basis points in the expected rate of return assumption, with other assumptions held constant, would have an estimated $11.3 million favorable (unfavorable) impact on net pension and postretirement benefit cost. The Company does not expect to have a minimum pension funding requirement under the Internal Revenue Code during 2005. The preceding hypothetical changes in the discount rate and expected rate of return assumptions would not impact the Company’s funding requirements.
| | |
| | | |
| Merck & Co., Inc. Annual Report 2004 | | 33 |
Unrecognized net loss amounts reflect experience differentials primarily relating to differences between expected and actual returns on plan assets as well as the effects of changes in actuarial assumptions. Expected returns are based on a calculated market-related value of assets. Under this methodology, asset gains/losses resulting from actual returns that differ from the Company’s expected returns are recognized in the market-related value of assets ratably over a five-year period. Total unrecognized net loss amounts in excess of certain thresholds are amortized into net pension and other postretirement benefit cost over the average remaining service life of employees. Amortization of total unrecognized net losses for the Company’s U.S. plans at December 31, 2004 is expected to increase net pension and other postretirement benefit cost by approximately $125.0 million annually from 2005 through 2009.
Taxes on Income
The Company’s effective tax rate is based on pre-tax income, statutory tax rates and tax planning opportunities available in the various jurisdictions in which the Company operates. In the event that there is a significant unusual or one-time item recognized, or expected to be recognized, in the Company’s operating results, the tax attributable to that item would be separately calculated and recorded at the same time as the unusual or one-time item. Significant judgment is required in determining the Company’s effective tax rate and in evaluating its tax positions. The Company establishes reserves when, despite its belief that the tax return positions are fully supportable, certain positions are likely to be challenged and that it may not succeed. (See Note 17 to the financial statements for further information.) The Company adjusts these reserves in light of changing facts and circumstances, such as the closing of a tax audit. The effective tax rate includes the impact of reserve provisions and changes to reserves that are considered appropriate, as well as related interest. This rate is then applied to the Company’s quarterly operating results.
Tax regulations require items to be included in the tax return at different times than the items are reflected in the financial statements. As a result, the effective tax rate reflected in the financial statements is different than that reported in the tax return. Some of these differences are permanent, such as expenses that are not deductible on the tax return, and some are timing differences, such as depreciation expense. Timing differences create deferred tax assets and liabilities. Deferred tax assets generally represent items that can be used as a tax deduction or credit in the tax return in future years for which the Company has already recorded the tax benefit in the financial statements. The Company establishes valuation allowances for its deferred tax assets when the amount of expected future taxable income is not likely to support the use of the deduction or credit. Deferred tax liabilities generally represent tax expense recognized in the financial statements for which payment has been deferred or expense for which the Company has already taken a deduction on the tax return, but has not yet recognized as expense in the financial statements.
At December 31, 2004, foreign earnings of $20.1 billion and domestic earnings of $880.9 million have been retained indefinitely by subsidiary companies for reinvestment. No provision is made for income taxes that would be payable upon the distribution of such earnings. On October 22, 2004, the American Jobs Creation Act of 2004 (the AJCA) was signed into law. The AJCA creates a temporary incentive for U.S. multinationals to repatriate accumulated income earned outside the United States as of December 31, 2002. On December 21, 2004, the Financial Accounting Standards Board (the FASB) issued FASB Staff Position, Accounting and Disclosure Guidance for the Foreign Earnings Repatriation Provision within the American Jobs Creation Act of 2004 (FSP No. 109-2). FSP No. 109-2 allows companies additional time to evaluate the effect of the law. Through December 31, 2004, the Company has not provided deferred taxes on foreign earnings because such earnings were intended to be indefinitely reinvested outside the United States. Whether the Company will ultimately take advantage of the temporary incentive depends on a number of factors including analyzing U.S. Internal Revenue Service guidance before a decision is made. The Company expects to be in a position to finalize its decisions regarding the temporary incentive during 2005. Until that time, the Company will make no change in its current intention to indefinitely reinvest accumulated earnings of its foreign subsidiaries. If it becomes apparent that the Company will repatriate all or any of these earnings in an amount of up to $15 billion, a one-time tax charge to the Company’s results of operations of up to approximately $1 billion could occur. The ultimate tax charge is dependent on a number of factors currently under consideration, including the passage of pending legislation, which contains certain technical corrections to the AJCA. The Company has not changed its intention to indefinitely reinvest accumulated earnings earned subsequent to December 31, 2002. No provision will be made for income taxes that would be payable upon the distribution of such earnings and it is not practicable to determine the amount of the related unrecognized deferred income tax liability.
Recently Issued Accounting Standards
In November 2004, the FASB issued Statement No. 151, Inventory Costs–an amendment of ARB No. 43, Chapter 4 (FAS 151), which is effective beginning January 1, 2006. FAS 151 requires that abnormal amounts of idle facility expense, freight, handling costs and wasted material be recognized as current period charges. The Statement also requires that the allocation of fixed production overhead be based on the normal capacity of the production facilities. The effect of this Statement on the Company’s financial position or results of operations has not yet been determined.
In December 2004, the FASB issued Statement No. 123R, Share-Based Payment (FAS 123R), which is effective beginning July 1, 2005. FAS 123R requires all share-based payments to employees to be expensed over the requisite service period based on the grant-date fair value of the awards. The Statement allows for either prospective or retrospective adoption and requires that the unvested portion of all outstanding awards upon adoption be recognized using the same fair value and attribution methodologies previously determined under Statement No. 123, Accounting for Stock-Based Compensation. The Company is currently evaluating transition alternatives and valuation methodologies for future grants. As a result, pro forma compensation expense, as reflected in Note 2, may not be indicative of future expense to be recognized under FAS 123R. The effect of adoption of FAS 123R on the Company’s financial position or results of operations has not yet been determined.
Merck & Co., Inc. Annual Report 2004
Cautionary Factors That May Affect Future Results
This annual report and other written reports and oral statements made from time to time by the Company may contain so-called “forward-looking statements,” all of which are subject to risks and uncertainties. One can identify these forwardlooking statements by their use of words such as “expects,” “plans,” “will,” “estimates,” “forecasts,” “projects” and other words of similar meaning. One can also identify them by the fact that they do not relate strictly to historical or current facts. These statements are likely to address the Company’s growth strategy, financial results, product approvals and development programs. One must carefully consider any such statement and should understand that many factors could cause actual results to differ from the Company’s forward-looking statements. These factors include inaccurate assumptions and a broad variety of other risks and uncertainties, including some that are known and some that are not. No forward-looking statement can be guaranteed and actual future results may vary materially.
The Company does not assume the obligation to update any forward-looking statement. One should carefully evaluate such statements in light of factors described in the Company’s filings with the Securities and Exchange Commission, especially on Forms 10-K, 10-Q and 8-K. In Item 1 of the Company’s annual report on Form 10-K for the year ended December 31, 2004, which will be filed in March 2005, the Company discusses in more detail various important factors that could cause actual results to differ from expected or historic results. The Company notes these factors for investors as permitted by the Private Securities Litigation Reform Act of 1995. Prior to the filing of the Form 10-K for the year ended December 31, 2004, reference should be made to Item 1 of the Company’s annual report on Form 10-K for the year ended December 31, 2003. One should understand that it is not possible to predict or identify all such factors. Consequently, the reader should not consider any such list to be a complete statement of all potential risks or uncertainties.
Cash Dividends Paid per Common Share
| | | | | | | | | | | | | | | | | | | | | |
| |
| | | Year | | | 4th Q | | | 3rd Q | | | 2nd Q | | | 1st Q | |
| |
| 2004 | | $ | 1.49 | | | $ | .38 | | | $ | .37 | | | $ | .37 | | | $ | .37 | |
| 2003 | | $ | 1.45 | | | $ | .37 | | | $ | .36 | | | $ | .36 | | | $ | .36 | |
| |
Common Stock Market Prices
| | | | | | | | | | | | | | | | | |
| |
| 2004 | | 4th Q | | | 3rd Q | | | 2nd Q | | | 1st Q | |
| |
| High | | $ | 34.32 | | | $ | 47.73 | | | $ | 48.78 | | | $ | 49.33 | |
| Low | | | 25.60 | | | | 32.46 | | | | 44.28 | | | | 42.85 | |
| |
| 2003 | | | | | | | | | | | | | | | | |
| |
| High | | $ | 51.95 | | | $ | 62.69 | | | $ | 63.50 | | | $ | 60.24 | |
| Low | | | 40.57 | | | | 49.48 | | | | 54.10 | | | | 49.90 | |
| |
The principal market for trading of the common stock is the New York Stock Exchange (NYSE) under the symbol MRK. The common stock market price information above is based on historical NYSE market prices and has not been adjusted to reflect the spin-off of Medco Health, in which holders of Merck common stock at the close of business on August 12, 2003 received .1206 shares of Medco Health common stock for every one share of Merck common stock held on that date. On August 20, 2003, Merck common stock began to trade on a postdistribution basis.
Condensed Interim Financial Data
| | | | | | | | | | | | | | | | | |
| |
| ($ in millions except | | | | | | | | | | | | |
| per share amounts) | | 4th Q(1) | | | 3rd Q(2) | | | 2nd Q | | | 1st Q | |
| |
| 2004 | | | | | | | | | | | | | | | | |
| |
| Sales | | $ | 5,748.0 | | | $ | 5,538.1 | | | $ | 6,021.7 | | | $ | 5,630.8 | |
| Materials and production costs | | | 1,283.6 | | | | 1,364.2 | | | | 1,163.7 | | | | 1,148.2 | |
| Marketing and administrative expenses | | | 2,365.8 | | | | 1,752.9 | | | | 1,616.2 | | | | 1,611.4 | |
| Research and development expenses | | | 1,108.6 | | | | 919.3 | | | | 986.0 | | | | 996.3 | |
| Equity income from affiliates | | | (285.9 | ) | | | (307.1 | ) | | | (220.5 | ) | | | (194.7 | ) |
| Other (income) expense, net | | | (103.9 | ) | | | (4.2 | ) | | | 37.5 | | | | (273.3 | ) |
| Income from continuing operations before taxes | | | 1,379.8 | | | | 1,813.0 | | | | 2,438.8 | | | | 2,342.9 | |
| Net income | | | 1,101.1 | | | | 1,325.6 | | | | 1,768.1 | | | | 1,618.6 | |
| Basic earnings per common share | | $ | .50 | | | $ | .60 | | | $ | .80 | | | $ | .73 | |
| Earnings per common share assuming dilution | | $ | .50 | | | $ | .60 | | | $ | .79 | | | $ | .73 | |
| |
| 2003 | | | | | | | | | | | | | | | | |
| |
| Sales | | $ | 5,627.1 | | | $ | 5,762.0 | | | $ | 5,525.4 | | | $ | 5,571.4 | |
| Materials and production costs | | | 1,227.2 | | | | 1,083.4 | | | | 1,020.1 | | | | 1,106.2 | |
| Marketing and administrative expenses | | | 1,827.4 | | | | 1,463.6 | | | | 1,589.9 | | | | 1,513.9 | |
| Research and development expenses | | | 906.3 | | | | 776.5 | | | | 786.4 | | | | 810.7 | |
| Equity income from affiliates | | | (6.0 | ) | | | (183.4 | ) | | | (187.4 | ) | | | (97.3 | ) |
| Other (income) expense, net | | | (88.7 | ) | | | 17.1 | | | | (153.4 | ) | | | 21.7 | |
| Income from continuing operations before taxes | | | 1,760.9 | | | | 2,604.8 | | | | 2,469.8 | | | | 2,216.2 | |
| Income from continuing operations | | | 1,395.2 | | | | 1,865.0 | | | | 1,784.5 | | | | 1,545.0 | |
| Income from discontinued operations, net of taxes | | | — | | | | (6.7 | ) | | | 82.5 | | | | 165.4 | |
| Net income | | | 1,395.2 | | | | 1,858.3 | | | | 1,867.0 | | | | 1,710.4 | |
| Basic earnings per common share Continuing operations | | $ | .63 | | | $ | .83 | | | $ | .80 | | | $ | .69 | |
| Discontinued operations | | | — | | | | — | | | | .04 | | | | .07 | |
| Net income | | | .63 | | | | .83 | | | | .83 | (3) | | | .76 | |
| Earnings per common share assuming dilution Continuing operations | | $ | .62 | | | $ | .83 | | | $ | .79 | | | $ | .68 | |
| Discontinued operations | | | — | | | | — | | | | .04 | | | | .07 | |
| Net income | | | .62 | | | | .82 | (3) | | | .83 | | | | .76 | (3) |
| |
(1)Amounts for 2003 include the impact of the implementation of a new distribution program for U.S. wholesalers and restructuring costs related to position eliminations.
(2) Amounts for 2004 include the impact of the withdrawal of Vioxx. (See Note 3.)
(3) Amount does not add as a result of rounding.
| | |
| | | |
| Merck & Co., Inc. Annual Report 2004 | | 35 |
| | | |
| Consolidated Statement of Income | | |
| Merck & Co., Inc. and Subsidiaries | | |
Years Ended December 31 | | |
($ in millions except per share amounts) | | |
| | | | | | | | | | | | | |
| | | 2004 | | | 2003 | | | 2002 | |
| |
| Sales | | $ | 22,938.6 | | | $ | 22,485.9 | | | $ | 21,445.8 | |
| |
| Costs, Expenses and Other | | | | | | | | | | | | |
| Materials and production | | | 4,959.8 | | | | 4,436.9 | | | | 4,004.9 | |
| Marketing and administrative | | | 7,346.3 | | | | 6,394.9 | | | | 5,652.2 | |
| Research and development | | | 4,010.2 | | | | 3,279.9 | | | | 2,677.2 | |
| Equity income from affiliates | | | (1,008.2 | ) | | | (474.2 | ) | | | (644.7 | ) |
| Other (income) expense, net | | | (344.0 | ) | | | (203.2 | ) | | | 104.5 | |
| |
| | | | 14,964.1 | | | | 13,434.3 | | | | 11,794.1 | |
| |
| Income from Continuing Operations Before Taxes | | | 7,974.5 | | | | 9,051.6 | | | | 9,651.7 | |
| Taxes on Income | | | 2,161.1 | | | | 2,462.0 | | | | 2,856.9 | |
| |
| Income from Continuing Operations | | | 5,813.4 | | | | 6,589.6 | | | | 6,794.8 | |
| Income from Discontinued Operations, Net of Taxes | | | — | | | | 241.3 | | | | 354.7 | |
| |
| Net Income | | $ | 5,813.4 | | | $ | 6,830.9 | | | $ | 7,149.5 | |
| |
| Basic Earnings per Common Share | | | | | | | | | | | | |
| Continuing Operations | | $ | 2.62 | | | $ | 2.95 | | | $ | 3.01 | |
| Discontinued Operations | | | — | | | | .11 | | | | .16 | |
| |
| Net Income | | $ | 2.62 | | | $ | 3.05 | * | | $ | 3.17 | |
| |
| Earnings per Common Share Assuming Dilution | | | | | | | | | | | | |
| Continuing Operations | | $ | 2.61 | | | $ | 2.92 | | | $ | 2.98 | |
| Discontinued Operations | | | — | | | | .11 | | | | .16 | |
| |
| Net Income | | $ | 2.61 | | | $ | 3.03 | | | $ | 3.14 | |
| |
*Amount does not add as a result of rounding.
Consolidated Statement of Retained Earnings
Merck & Co., Inc. and Subsidiaries
Years Ended December 31
($ in millions)
| | | | | | | | | | | | | |
| | | 2004 | | | 2003 | | | 2002 | |
| |
| Balance, January 1 | | $ | 34,142.0 | | | $ | 35,434.9 | | | $ | 31,489.6 | |
| |
| Net Income | | | 5,813.4 | | | | 6,830.9 | | | | 7,149.5 | |
| Common Stock Dividends Declared | | | (3,329.1 | ) | | | (3,264.7 | ) | | | (3,204.2 | ) |
| Spin-off of Medco Health | | | — | | | | (4,859.1 | ) | | | — | |
| |
| Balance, December 31 | | $ | 36,626.3 | | | $ | 34,142.0 | | | $ | 35,434.9 | |
| |
Consolidated Statement of Comprehensive Income
Merck & Co., Inc. and Subsidiaries
Years Ended December 31
($ in millions)
| | | | | | | | | | | | | |
| | | 2004 | | | 2003 | | | 2002 | |
| |
| Net Income | | $ | 5,813.4 | | | $ | 6,830.9 | | | $ | 7,149.5 | |
| |
| Other Comprehensive (Loss) Income | | | | | | | | | | | | |
| Net unrealized loss on derivatives, net of tax and net income realization | | | (31.7 | ) | | | (21.3 | ) | | | (20.0 | ) |
| Net unrealized (loss) gain on investments, net of tax and net income realization | | | (100.9 | ) | | | (46.3 | ) | | | 73.1 | |
| Minimum pension liability, net of tax | | | (4.9 | ) | | | 231.9 | | | | (162.5 | ) |
| Cumulative translation adjustment relating to equity investees, net of tax | | | 26.1 | | | | — | | | | — | |
| |
| | | | (111.4 | ) | | | 164.3 | | | | (109.4 | ) |
| |
| Comprehensive Income | | $ | 5,702.0 | | | $ | 6,995.2 | | | $ | 7,040.1 | |
| |
The accompanying notes are an integral part of these consolidated financial statements.
36
Consolidated Balance Sheet
Merck & Co., Inc. and Subsidiaries
December 31
($ in millions)
| | | | | | | | | |
| | | 2004 | | | 2003 | |
| |
Assets | | | | | | | | |
| Current Assets | | | | | | | | |
| Cash and cash equivalents | | $ | 2,878.8 | | | $ | 1,201.0 | |
| Short-term investments | | | 4,211.1 | | | | 2,972.0 | |
| Accounts receivable | | | 3,627.7 | | | | 4,023.6 | |
| Inventories | | | 1,898.7 | | | | 2,554.7 | |
| Prepaid expenses and taxes | | | 858.9 | | | | 775.9 | |
| |
| Total current assets | | | 13,475.2 | | | | 11,527.2 | |
| |
| Investments | | | 6,727.1 | | | | 7,941.2 | |
| |
| Property, Plant and Equipment (at cost) | | | | | | | | |
| Land | | | 366.6 | | | | 356.7 | |
| Buildings | | | 8,874.3 | | | | 8,016.9 | |
| Machinery, equipment and office furnishings | | | 11,926.1 | | | | 11,018.2 | |
| Construction in progress | | | 1,641.6 | | | | 1,901.9 | |
| |
| | | | 22,808.6 | | | | 21,293.7 | |
| Less allowance for depreciation | | | 8,094.9 | | | | 7,124.7 | |
| |
| | | | 14,713.7 | | | | 14,169.0 | |
| |
| Goodwill | | | 1,085.7 | | | | 1,085.4 | |
| |
| Other Intangibles, Net | | | 679.2 | | | | 864.0 | |
| |
| Other Assets | | | 5,891.9 | | | | 5,000.7 | |
| |
| | | $ | 42,572.8 | | | $ | 40,587.5 | |
| |
Liabilities and Stockholders’ Equity | | | | | | | | |
| Current Liabilities | | | | | | | | |
| Loans payable and current portion of long-term debt | | $ | 2,181.2 | | | $ | 1,700.0 | |
| Trade accounts payable | | | 421.4 | | | | 735.2 | |
| Accrued and other current liabilities | | | 5,288.1 | | | | 3,772.8 | |
| Income taxes payable | | | 3,012.3 | | | | 2,538.9 | |
| Dividends payable | | | 841.1 | | | | 822.7 | |
| |
| Total current liabilities | | | 11,744.1 | | | | 9,569.6 | |
| |
| Long-Term Debt | | | 4,691.5 | | | | 5,096.0 | |
| |
| Deferred Income Taxes and Noncurrent Liabilities | | | 6,442.1 | | | | 6,430.3 | |
| |
| Minority Interests | | | 2,406.9 | | | | 3,915.2 | |
| |
| Stockholders’ Equity | | | | | | | | |
| Common stock, one cent par value | | | | | | | | |
| Authorized - 5,400,000,000 shares | | | | | | | | |
| Issued - 2,976,230,393 shares | | | 29.8 | | | | 29.8 | |
| Other paid-in capital | | | 6,869.8 | | | | 6,956.6 | |
| Retained earnings | | | 36,626.3 | | | | 34,142.0 | |
| Accumulated other comprehensive (loss) income | | | (45.9 | ) | | | 65.5 | |
| |
| | | | 43,480.0 | | | | 41,193.9 | |
| Less treasury stock, at cost | | | | | | | | |
| 767,591,491 shares - 2004 | | | | | | | | |
| 754,466,884 shares - 2003 | | | 26,191.8 | | | | 25,617.5 | |
| |
| Total stockholders’ equity | | | 17,288.2 | | | | 15,576.4 | |
| |
| | | $ | 42,572.8 | | | $ | 40,587.5 | |
| |
The accompanying notes are an integral part of this consolidated financial statement.
37
Consolidated Statement of Cash Flows
Merck & Co., Inc. and Subsidiaries
Years Ended December 31
($ in millions)
| | | | | | | | | | | | | |
| | | 2004 | | | 2003 | | | 2002 | |
| |
Cash Flows from Operating Activities of Continuing Operations | | | | | | | | | | | | |
| Net income | | $ | 5,813.4 | | | $ | 6,830.9 | | | $ | 7,149.5 | |
| Less: Income from discontinued operations, net of taxes | | | — | | | | (241.3 | ) | | | (354.7 | ) |
| |
| Income from continuing operations | | | 5,813.4 | | | | 6,589.6 | | | | 6,794.8 | |
| Adjustments to reconcile income from continuing operations to net cash provided by operating activities of continuing operations: | | | | | | | | | | | | |
| Depreciation and amortization | | | 1,450.7 | | | | 1,314.2 | | | | 1,231.2 | |
| Deferred income taxes | | | 48.9 | | | | 131.7 | | | | 387.5 | |
| Other | | | (35.4 | ) | | | (98.1 | ) | | | (116.9 | ) |
| Net changes in assets and liabilities: | | | | | | | | | | | | |
| Accounts receivable | | | 173.1 | | | | 320.9 | | | | 130.2 | |
| Inventories | | | 331.9 | | | | (435.3 | ) | | | (41.5 | ) |
| Trade accounts payable | | | (323.8 | ) | | | (21.6 | ) | | | 325.4 | |
| Accrued and other current liabilities | | | 1,382.3 | | | | 505.4 | | | | 97.0 | |
| Income taxes payable | | | 453.9 | | | | 494.1 | | | | 459.9 | |
| Noncurrent liabilities | | | (445.4 | ) | | | (255.3 | ) | | | (359.9 | ) |
| Other | | | (50.5 | ) | | | (119.1 | ) | | | (197.1 | ) |
| |
| Net Cash Provided by Operating Activities of Continuing Operations | | | 8,799.1 | | | | 8,426.5 | | | | 8,710.6 | |
| |
Cash Flows from Investing Activities of Continuing Operations | | | | | | | | | | | | |
| Capital expenditures | | | (1,726.1 | ) | | | (1,915.9 | ) | | | (2,128.1 | ) |
| Purchase of securities, subsidiaries and other investments | | | (82,256.4 | ) | | | (61,586.9 | ) | | | (37,443.6 | ) |
| Proceeds from sale of securities, subsidiaries and other investments | | | 82,363.8 | | | | 60,823.4 | | | | 35,807.4 | |
| Acquisitions of Banyu shares | | | (12.8 | ) | | | (1,527.8 | ) | | | — | |
| Other | | | (6.6 | ) | | | (25.0 | ) | | | (3.7 | ) |
| |
| Net Cash Used by Investing Activities of Continuing Operations | | | (1,638.1 | ) | | | (4,232.2 | ) | | | (3,768.0 | ) |
| |
Cash Flows from Financing Activities of Continuing Operations | | | | | | | | | | | | |
| Net change in short-term borrowings | | | (252.4 | ) | | | (2,347.2 | ) | | | (508.4 | ) |
| Proceeds from issuance of debt | | | 405.1 | | | | 1,300.3 | | | | 2,618.5 | |
| Payments on debt | | | (37.3 | ) | | | (736.2 | ) | | | (2,504.9 | ) |
| Redemption of preferred units of subsidiary | | | (1,500.0 | ) | | | — | | | | — | |
| Purchase of treasury stock | | | (974.6 | ) | | | (2,034.1 | ) | | | (2,091.3 | ) |
| Dividends paid to stockholders | | | (3,310.7 | ) | | | (3,250.4 | ) | | | (3,191.6 | ) |
| Proceeds from exercise of stock options | | | 240.3 | | | | 388.2 | | | | 318.3 | |
| Other | | | (161.8 | ) | | | (148.5 | ) | | | (172.5 | ) |
| |
| Net Cash Used by Financing Activities of Continuing Operations | | | (5,591.4 | ) | | | (6,827.9 | ) | | | (5,531.9 | ) |
| |
| Effect of Exchange Rate Changes on Cash and Cash Equivalents | | | 108.2 | | | | 155.7 | | | | 113.2 | |
| |
Discontinued Operations | | | | | | | | | | | | |
| Net cash provided by Medco Health | | | — | | | | 248.0 | | | | 575.1 | |
| Dividend received from Medco Health, net of intercompany settlements and cash transferred | | | — | | | | 1,187.9 | | | | — | |
| |
| Net Cash Provided by Discontinued Operations | | | — | | | | 1,435.9 | | | | 575.1 | |
| |
| Net Increase (Decrease) in Cash and Cash Equivalents | | | 1,677.8 | | | | (1,042.0 | ) | | | 99.0 | |
| Cash and Cash Equivalents at Beginning of Year | | | 1,201.0 | | | | 2,243.0 | | | | 2,144.0 | |
| |
| Cash and Cash Equivalents at End of Year | | $ | 2,878.8 | | | $ | 1,201.0 | | | $ | 2,243.0 | |
| |
The accompanying notes are an integral part of this consolidated financial statement.
38
Notes to Consolidated
Financial Statements
Merck & Co., Inc. and Subsidiaries
($ in millions except per share amounts)
1. Nature of Operations
Merck is a global research-driven pharmaceutical company that discovers, develops, manufactures and markets a broad range of innovative products to improve human and animal health, directly and through its joint ventures. The Company’s products include therapeutic and preventive agents, generally sold by prescription, for the treatment of human disorders.
2. Summary of Accounting Policies
Principles of Consolidation— The consolidated financial statements include the accounts of the Company and all of its subsidiaries in which a controlling interest is maintained. Controlling interest is determined by majority ownership interest and the absence of substantive third-party participating rights or, in the case of variable interest entities, by majority exposure to expected losses, residual returns or both. For those consolidated subsidiaries where Merck ownership is less than 100%, the outside stockholders’ interests are shown as Minority interests. Investments in affiliates over which the Company has significant influence but not a controlling interest, such as interests in entities owned equally by the Company and a third party that are under shared control, are carried on the equity basis.
Foreign Currency Translation— The U.S. dollar is the functional currency for the Company’s foreign subsidiaries.
Cash and Cash Equivalents— Cash equivalents are comprised of certain highly liquid investments with original maturities of less than three months.
Inventories —Substantially all domestic pharmaceutical inventories are valued at the lower of last-in, first-out (LIFO) cost or market for both book and tax purposes. Foreign pharmaceutical inventories are valued at the lower of first-in, first-out (FIFO) cost or market. Inventories consist of currently marketed products and certain products awaiting regulatory approval. In evaluating the recoverability of inventories produced in preparation for product launches, the Company considers the probability that revenue will be obtained from the future sale of the related inventory together with the status of the product within the regulatory approval process.
Investments— Investments classified as available-for-sale are reported at fair value, with unrealized gains or losses, to the extent not hedged, reported net of tax and minority interests, in Accumulated other comprehensive income. Investments in debt securities classified as held-to-maturity, consistent with management’s intent, are reported at cost. Impairment losses are charged to Other (income) expense, net, for other-than-temporary declines in fair value. The Company considers available evidence in evaluating potential impairment of its investments, including the duration and extent to which fair value is less than cost and the Company’s ability and intent to hold the investment.
Revenue Recognition— Revenues from sales of products are recognized when title and risk of loss passes to the customer. Revenues for domestic pharmaceutical sales are recognized at the time of shipment, while for many foreign subsidiaries, as well as for vaccine sales, revenues are recognized at the time of delivery. Recognition of revenue also requires reasonable assurance of collection of sales proceeds and completion of all performance obligations. Domestically, sales discounts are issued to customers as direct discounts at the point-of-sale or indirectly through an intermediary wholesale purchaser, known as chargebacks, or indirectly in the form of rebates. Additionally, sales are generally made with a limited right of return under certain conditions. Revenues are recorded net of provisions for sales discounts and returns, which are established at the time of sale. Accruals for chargebacks are reflected as a direct reduction to accounts receivable and accruals for rebates as accrued expenses. The accrued balances relative to these provisions included in Accounts receivable and Accrued and other current liabilities were $133.7 million and $896.6 million, respectively, at December 31, 2004 and $110.4 million and $641.8 million, respectively, at December 31, 2003.
Depreciation— Depreciation is provided over the estimated useful lives of the assets, principally using the straight-line method. For tax purposes, accelerated methods are used. The estimated useful lives primarily range from 10 to 50 years for Buildings, and from 3 to 15 years for Machinery, equipment and office furnishings.
Goodwill and Other Intangibles— Goodwill represents the excess of acquisition costs over the fair value of net assets of businesses purchased. Goodwill is not amortized, but rather, assigned to reporting units within the Company’s segments and evaluated for impairment on at least an annual basis, using a fair value based test. Other acquired intangibles are recorded at cost and are amortized on a straight-line basis over their estimated useful lives. (See Note 8.) When events or circumstances warrant a review, the Company will assess recoverability from future operations of other intangibles using undiscounted cash flows derived from the lowest appropriate asset groupings, generally the subsidiary level. Impairments are recognized in operating results to the extent that carrying value exceeds fair value, which is determined based on the net present value of estimated future cash flows.
39
Research and Development– Research and development is expensed as incurred. Upfront and milestone payments made to third parties in connection with research and development collaborations prior to regulatory approval are expensed as incurred. Payments made to third parties subsequent to regulatory approval are capitalized and amortized over the shorter of the remaining license or product patent life.
Stock-Based Compensation— Employee stock-based compensation is recognized using the intrinsic value method. Generally, employee stock options are granted to purchase shares of Company stock at the fair market value at the time of grant. Accordingly, no compensation expense is recognized for the Company’s stock-based compensation plans other than for its performance-based awards, restricted stock units and options granted to employees of certain equity method investees.
The effect on net income and earnings per common share if the Company had applied the fair value method for recognizing employee stock-based compensation is as follows:
| | | | | | | | | | | | | |
| Years Ended December 31 | | 2004 | | | 2003 | | | 2002 | |
| |
| Net income, as reported | | $ | 5,813.4 | | | $ | 6,830.9 | | | $ | 7,149.5 | |
| Compensation expense, net of tax: | | | | | | | | | | | | |
| Reported | | | 16.7 | | | | 4.9 | | | | 1.2 | |
| Fair value method | | | (491.8 | ) | | | (559.4 | ) | | | (487.9 | ) |
| |
| Pro forma net income | | $ | 5,338.3 | | | $ | 6,276.4 | | | $ | 6,662.8 | |
| |
| Earnings per common share from continuing operations: | | | | | | | | | | | | |
| Assuming dilution – as reported | | $ | 2.61 | | | $ | 2.92 | | | $ | 2.98 | |
| Assuming dilution – pro forma | | $ | 2.39 | | | $ | 2.73 | | | $ | 2.81 | |
| Earnings per common share: | | | | | | | | | | | | |
| Basic – as reported | | $ | 2.62 | | | $ | 3.05 | | | $ | 3.17 | |
| Basic – pro forma | | $ | 2.41 | | | $ | 2.81 | | | $ | 2.95 | |
| Assuming dilution – as reported | | $ | 2.61 | | | $ | 3.03 | | | $ | 3.14 | |
| Assuming dilution – pro forma | | $ | 2.39 | | | $ | 2.79 | | | $ | 2.93 | |
| |
Prior to 2004, pro forma compensation expense for options with graded vesting terms was calculated using the Black-Scholes model based on a single-option valuation approach using the straight-line method of amortization. In 2004, the Company revised the assumptions utilized by the Black-Scholes model in determining pro forma compensation expense based on historical data, such that expense is determined using separate expected term assumptions for each vesting tranche. As a result, pro forma compensation expense for any stock options granted since January 1, 2004 has been calculated using the accelerated amortization method prescribed in Financial Accounting Standards Board (FASB) Interpretation No. 28, Accounting for Stock Appreciation Rights and Other Variable Stock Option or Award Plans.
In 2003, in connection with the Medco Health Solutions, Inc. (Medco Health) spin-off, options granted to Medco Health employees prior to February 2002 and some options granted after February 2002 became fully vested in accordance with the original terms of the grants. As a result, 2003 pro forma compensation expense reflects the accelerated vesting of these options. In addition, certain stock options granted to Medco Health employees in 2003 and 2002 were converted to Medco Health options with terms and amounts that maintained the option holders’ positions. Therefore, pro forma compensation expense for these options is reflected only through the date of the spin-off.
The average fair value of employee and non-employee director options granted during 2004, 2003 and 2002 was $10.50, $12.54 and $17.53, respectively. This fair value was estimated using the Black-Scholes option-pricing model based on the weighted average market price at grant date of $45.51 in 2004, $50.07 in 2003 and $61.16 in 2002 and the following weighted average assumptions:
| | | | | | | | | | | | | |
| Years Ended December 31 | | 2004 | | | 2003 | | | 2002 | |
| |
| Dividend yield | | | 3.4 | % | | | 2.7 | % | | | 2.3 | % |
| Risk-free interest rate | | | 3.1 | % | | | 2.9 | % | | | 4.3 | % |
| Volatility | | | 30 | % | | | 31 | % | | | 31 | % |
| Expected life (years) | | | 5.7 | | | | 5.8 | | | | 5.7 | |
| |
Legal Defense Costs —Legal defense costs expected to be incurred in connection with a loss contingency are accrued when probable and reasonably estimable.
Use of Estimates— The consolidated financial statements are prepared in conformity with accounting principles generally accepted in the United States (GAAP) and, accordingly, include certain amounts that are based on management’s best estimates and judgments. Estimates are used in determining such items as provisions for sales discounts and returns, depreciable and amortizable lives, recoverability of inventories produced in preparation for product launches, amounts recorded for contingencies, environmental liabilities and other reserves, pension and other postretirement benefit plan assumptions, and taxes on income. Because of the uncertainty inherent in such estimates, actual results may differ from these estimates.
Reclassifications— Certain reclassifications have been made to prior year amounts to conform with current year presentation.
3. Voluntary Product Withdrawal
On September 30, 2004, the Company announced a voluntary worldwide withdrawal ofVioxx, its arthritis and acute pain medication. The Company’s decision, which was effective immediately, was based on new three-year data from a prospective, randomized, placebo-controlled clinical trial, APPROVe (Adenomatous Polyp Prevention onVioxx).
40
In connection with the withdrawal, the Company recorded an unfavorable adjustment to net income of $552.6 million, or $.25 per share. The adjustment to pre-tax income was $726.2 million. Of this amount, $491.6 million related to estimated customer returns of product previously sold and was recorded as a reduction of Sales, $93.2 million related to write-offs of inventory held by the Company and was recorded in Materials and production expense, and $141.4 million related to estimated costs to undertake the withdrawal of the product and was recorded in Marketing and administrative expense. The tax benefit of this adjustment was $173.6 million, which reflects the geographical mix ofVioxxreturns and the cost of the withdrawal. The adjustment did not include charges for future legal defense costs. (See Note 11.) At December 31, 2004, $173.8 million of the remaining accrued balance was reported in Accrued and other current liabilities and $235.0 million was reported as a reduction to Accounts receivable.
4. Restructuring
In October 2003, the Company announced plans to eliminate 4,400 positions as part of a cost-reduction initiative that was completed at the end of 2004. As of December 31, 2004, the Company had eliminated 5,100 positions, as the Company identified additional opportunities to eliminate positions and reduce costs. Most of the additional eliminations came from contractor positions. The Company recorded restructuring costs of $104.6 million for 2004 and $194.6 million for 2003 in Marketing and administrative expense. Of these amounts, in 2004 and 2003, respectively, $82.0 million and $101.8 million related to employee severance benefits, $20.9 million and $86.0 million related to curtailment, settlement and termination charges on the Company’s pension and other postretirement benefit plans (see Note 15) and $1.7 million and $6.8 million related to a modification in the terms of certain employees’ stock option grants.
Summarized information relative to the employee severance benefits accrual is as follows:
| | | | | | | | | |
| | | 2004 | | | 2003 | |
| |
| Balance, January 1 | | $ | 78.3 | | | $ | — | |
| Expense | | | 82.0 | | | | 101.8 | |
| Payments | | | (115.5 | ) | | | (23.5 | ) |
| |
| Balance, December 31 | | $ | 44.8 | | | $ | 78.3 | |
| |
At December 31, 2004, the accrued balance primarily relates to committed employee severance benefits obligations, which, in accordance with certain local laws, will be paid over time.
5. Strategic Initiatives
In November 2004, Merck and Ono Pharmaceutical Co., Ltd. (Ono) announced that they signed an agreement granting Merck the worldwide license for ONO-2506 (2R)-2-propyloctanoic acid, a novel intravenous compound currently in Phase II development for the treatment of acute stroke. Under the terms of the agreement, Ono received an initial upfront payment and, during the term of the agreement, could receive milestone payments in addition to royalties on net sales. In addition, Ono received exclusive rights in Japan to develop and marketEmend(aprepitant), Merck’s drug for use in combination with other antiemetic agents for prevention of acute and delayed nausea and vomiting associated with initial and repeat courses of highly emetogenic cancer chemotherapy, including cisplatin. Ono also received rights in Japan to co-market a second brand of MK-431, Merck’s investigational oral compound for the treatment of diabetes, under a yet to be determined trademark.
In April 2004, Merck and Bristol-Myers Squibb Company (BMS) entered into a worldwide collaborative agreement for muraglitazar, BMS’s product for use in treating patients with Type 2 diabetes. Merck and BMS will globally develop and market muraglitazar. BMS submitted a New Drug Application (NDA) to the Food and Drug Administration (FDA) in December for muraglitazar. Under the terms of the agreement, BMS received a $100.0 million upfront payment and, during the term of the agreement, could receive up to $275.0 million in additional payments based upon the achievement of certain regulatory milestones. The Company recorded the upfront payment as Research and development expense. The companies will share equally in future development and commercialization costs.
In March 2004, the Company acquired Aton Pharma, Inc. (Aton), a privately held biotechnology company focusing on the development of novel treatments for cancer and other serious diseases. Aton’s clinical pipeline of histone deacetylase inhibitors represents a class of anti-tumor agents with potential for efficacy based on a novel mechanism of action. Aton’s lead product candidate, suberoylanilide hydroxamic acid, known as SAHA, has been extensively studied for the treatment of cutaneous T-cell lymphoma. Consideration for the acquisition consisted of an upfront payment and may include contingent payments based upon the regulatory filing, approval and sale of products. In connection with the transaction, the Company recorded a charge of $125.5 million for acquired research associated with products in development for which, at the acquisition date, technological feasibility had not been established and no alternative future use existed. This charge was recorded in Research and development expense and was determined based upon the present value of projected future cash flows utilizing an income approach reflecting the appropriate risk-adjusted discount rate based on the product candidate’s stage of completion and its probability of technical and marketing success. The remaining net assets acquired in this transaction were not material. Because Aton was a development stage company that had not commenced its planned principal operations, the transaction was accounted for as an acquisition of assets rather than as a business combination and, therefore, goodwill was not recorded. Aton’s results of operations have been included with the Company’s since the acquisition date.
In February 2004, Merck and H. Lundbeck A/S (Lundbeck) entered into an agreement for the exclusive U.S. development and commercialization of gaboxadol, a compound for the treatment of sleep disorders. Under the terms of the agreement, Lundbeck received an initial payment of $70.0 million and, during the term of the agreement, could receive up to $200.0 million in additional milestone payments in the future. The Company recorded the upfront payment as Research and development expense. Merck will fund the majority of the remaining development activities. In June 2004, Merck and Lundbeck extended their agreement for the exclusive development and commercialization of gaboxadol to Japan.
41
In 2003, the Company, through its wholly owned subsidiary, MSD (Japan) Co., Ltd., launched tender offers to acquire the remaining 49% of the common shares of Banyu Pharmaceutical Co., Ltd. (Banyu) that it did not already own for an aggregate purchase price of approximately $1.5 billion. Substantially all shares were acquired in 2003 and on March 30, 2004, Merck completed its acquisition of Banyu. Full ownership of Banyu strengthens Merck’s position in Japan, the world’s second-largest pharmaceutical market.
The Company’s acquisitions of the Banyu shares were accounted for under the purchase method. Pro forma information is not provided as the impact of the transactions does not have a material effect on the Company’s consolidated results of operations. The aggregate purchase price was allocated based upon the fair values of the portion of assets and liabilities acquired. The allocation of the aggregate purchase price resulted in the reversal of $1.0 billion of minority interest liability and recognition of $332.0 million in other intangibles, $240.5 million in goodwill, $153.0 million in deferred income tax liabilities and $34.5 million in other net assets, principally property, plant and equipment. Other intangibles included $301.1 million of in-line product rights having a 10-year weighted average useful life and $30.9 million representing a 20-year life tradename. In connection with the transactions, the Company also incurred a charge of $101.8 million for acquired research, recorded as Research and development expense, associated with products in development for which, at the acquisition date, technological feasibility had not been established and no alternative future use existed. Approximately $64.0 million of the total acquired research charge related to Merck products that Banyu was developing for sale in the Japanese market. For any of these products, Merck could choose not to exclusively license the rights to Banyu and, in that event, generally would reimburse Banyu for its associated research and development expenditures. Accordingly, these products were valued using a cost approach, adjusted to reflect the probability of regulatory approval. The remaining portion of the acquired research charge represented Banyu-developed product candidates. The fair value of each product was determined based upon the present value of projected future cash flows utilizing an income approach reflecting the appropriate risk-adjusted discount rate based on the applicable product’s stage of completion and its probability of technical and marketing success.
On August 19, 2003, Merck completed the spin-off of Medco Health. The income of Medco Health is presented separately as discontinued operations. The spin-off was effected by way of a pro rata dividend to Merck stockholders. Holders of Merck common stock at the close of business on August 12, 2003, received a dividend of .1206 shares of Medco Health common stock for every one share of Merck common stock held on that date. No fractional shares of Medco Health common stock were issued. Shareholders entitled to a fractional share of Medco Health common stock in the distribution received the cash value instead. Based on a letter ruling Merck received from the U.S. Internal Revenue Service (IRS), receipt of Medco Health shares in the distribution was tax-free for U.S. federal income tax purposes, but any cash received in lieu of fractional shares was taxable.
Prior to the spin-off, Merck received a $2.0 billion dividend from Medco Health and Merck paid $564.7 million in settlement of the net intercompany payable to Medco Health. In addition, at the date of the spin-off, $247.4 million of cash and cash equivalents were included in the net assets of Medco Health that were spun off.
Summarized financial information for discontinued operations is as follows:
| | | | | | | | | |
| Years Ended December 31 | | 2003* | | | 2002 | |
| |
| Total net revenues | | $ | 20,328.7 | | | $ | 30,344.5 | |
| Income before taxes | | | 369.6 | | | | 561.9 | |
| Taxes on income | | | 128.3 | | | | 207.2 | |
| Income, net of taxes | | | 241.3 | | | | 354.7 | |
| |
* Includes operations up through August 19, 2003.
The following is a summary of the assets and liabilities of discontinued operations that were spun off:
| | | | | |
| | | August 19, | |
| | | 2003 | |
| |
| Assets | | | | |
| |
| Cash and cash equivalents | | $ | 247.4 | |
| Other current assets | | | 2,728.4 | |
| Property, plant and equipment, net | | | 816.3 | |
| Goodwill | | | 3,310.2 | |
| Other intangibles, net | | | 2,351.9 | |
| Other assets | | | 138.4 | |
| |
| | | $ | 9,592.6 | |
| |
| Liabilities | | | | |
| |
| Current liabilities | | $ | 2,176.2 | |
| Long-term debt | | | 1,362.3 | |
| Deferred income taxes | | | 1,195.0 | |
| |
| | | $ | 4,733.5 | |
| |
| Net Assets Transferred | | $ | 4,859.1 | |
| |
6. Financial Instruments
Foreign Currency Risk Management
While the U.S. dollar is the functional currency of the Company’s foreign subsidiaries, a significant portion of the Company’s revenues are denominated in foreign currencies. Merck relies on sustained cash flows generated from foreign sources to support its long-term commitment to U.S. dollar-based research and development. To the extent the dollar value of cash flows is diminished as a result of a strengthening dollar, the Company’s ability to fund research and other dollar-based strategic initiatives at a consistent level may be impaired. The Company has established revenue hedging and balance sheet risk management programs to protect against volatility of future foreign currency cash flows and changes in fair value caused by volatility in foreign exchange rates.
The objective of the revenue hedging program is to reduce the potential for longer-term unfavorable changes in foreign exchange to decrease the U.S. dollar value of future cash flows derived from foreign currency denominated sales, primarily the euro and Japanese yen. To achieve this objective, the Company will partially hedge anticipated third-party sales that are expected to occur over its planning cycle, typically no more than three years into the future. The Company will layer in hedges over time, increasing the portion of sales hedged as it gets closer to the expected date of the transaction, such that it is probable that the hedged transaction will occur. The portion of sales hedged is based on assessments of cost-benefit profiles that consider natural offsetting exposures, revenue and exchange rate volatilities and correlations, and the cost of hedging instruments. The hedged anticipated sales are a specified component of a portfolio of similarly denominated foreign currency-based sales transactions, each of which responds to the hedged risk in the same manner. Merck manages its anticipated transaction exposure principally with purchased local currency put options, which provide the Company with a right, but not an obligation, to sell foreign currencies in the future at a predetermined price. If the U.S. dollar strengthens relative to the currency of the hedged anticipated sales, total changes in the options’ cash flows fully offset the decline in the expected future U.S. dollar cash flows of the
42
hedged foreign currency sales. Conversely, if the U.S. dollar weakens, the options’ value reduces to zero, but the Company benefits from the increase in the value of the anticipated foreign currency cash flows.
The designated hedge relationship is based on total changes in the options’ cash flows. Accordingly, the entire fair value change in the options is deferred in Accumulated other comprehensive income (AOCI) and reclassified into Sales when the hedged anticipated revenue is recognized. The hedge relationship is perfectly effective and therefore no hedge ineffectiveness is recorded. The fair values of currency options are reported in Accounts receivable or Other assets.
The primary objective of the balance sheet risk management program is to protect the U.S. dollar value of foreign currency denominated net monetary assets from the effects of volatility in foreign exchange that might occur prior to their conversion to U.S. dollars. Merck principally utilizes forward exchange contracts, which enable the Company to buy and sell foreign currencies in the future at fixed exchange rates and economically offset the consequences of changes in foreign exchange on the amount of U.S. dollar cash flows derived from the net assets. Merck routinely enters into contracts to fully offset the effects of exchange on exposures denominated in developed country currencies, primarily the euro and Japanese yen. For exposures in developing country currencies, the Company will enter into forward contracts on a more limited basis, and only when it is deemed economical to do so based on a cost-benefit analysis that considers the magnitude of the exposure, the volatility of the exchange rate and the cost of the hedging instrument. The Company will also minimize the effect of exchange on monetary assets and liabilities by managing operating activities and net asset positions at the local level.
Foreign currency denominated monetary assets and liabilities are remeasured at spot rates in effect on the balance sheet date with the effects of changes in spot rates reported in Other (income) expense, net. The forward contracts are not designated as hedges and are marked to market through Other (income) expense, net. Accordingly, fair value changes in the forward contracts help mitigate the changes in the value of the remeasured assets and liabilities attributable to changes in foreign currency exchange rates, except to the extent of the spot-forward differences. These differences are not significant due to the short-term nature of the contracts, which typically have average maturities at inception of less than one year.
The Company also uses forward contracts to hedge the changes in fair value of certain foreign currency denominated available-for-sale securities attributable to fluctuations in foreign currency exchange rates. Changes in the fair value of the hedged securities due to fluctuations in spot rates are offset in Other (income) expense, net, by the fair value changes in the forward contracts attributable to spot rate fluctuations. Hedge ineffectiveness was not material during 2004, 2003 and 2002. Changes in the contracts’ fair value due to spot-forward differences are excluded from the designated hedge relationship and recognized in Other (income) expense, net. These amounts were not significant for the years ended December 31, 2004, 2003 and 2002.
The fair values of forward exchange contracts are reported in the following four balance sheet line items: Accounts receivable (current portion of gain position), Other assets (non-current portion of gain position), Accrued and other current liabilities (current portion of loss position), or Deferred income taxes and noncurrent liabilities (non-current portion of loss position).
Interest Rate Risk Management
The Company may use interest rate swap contracts on certain investing and borrowing transactions to manage its net exposure to interest rate changes and to reduce its overall cost of borrowing. The Company does not use leveraged swaps and, in general, does not leverage any of its investment activities that would put principal capital at risk.
At December 31, 2004, the Company was a party to four pay-floating, receive-fixed interest rate swap contracts designated as fair value hedges of fixed-rate notes maturing in 2005, 2006, 2007 and 2013, respectively. The notional amounts of these swaps, which match the amount of the hedged fixed-rate notes, were $500 million, $500 million, $350 million and $500 million, respectively. The swaps effectively convert the fixed-rate obligations to floating-rate instruments. The fair value changes in the notes are fully offset in interest expense by the fair value changes in the swap contracts.
In July 2004, a seven-year combined interest rate and currency swap contract that the Company was a party to matured, with an immaterial impact. This contract was used to convert a foreign currency denominated investment to a U.S. dollar investment. The interest rate component of the swap was not designated as a hedge. The currency swap component was designated as a hedge of the changes in fair value of the investment attributable to exchange. Accordingly, changes in the fair value of the investment due to fluctuations in spot rates were offset in Other (income) expense, net, by fair value changes in the currency swap. Hedge ineffectiveness was not significant during 2004, 2003 and 2002.
The fair values of these contracts are reported in Accounts receivable, Other assets, Accrued and other current liabilities, or Deferred income taxes and noncurrent liabilities.
Fair Value of Financial Instruments
Summarized below are the carrying values and fair values of the Company’s financial instruments at December 31, 2004 and 2003. Fair values were estimated based on market prices, where available, or dealer quotes.
| | | | | | | | | | | | | | | | | |
| | | 2004 | | | 2003 | |
| | | Carrying | | | Fair | | | Carrying | | | Fair | |
| | | Value | | | Value | | | Value | | | Value | |
| |
Assets | | | | | | | | | | | | | | | | |
| |
| Cash and cash equivalents | | $ | 2,878.8 | | | $ | 2,878.8 | | | $ | 1,201.0 | | | $ | 1,201.0 | |
| Short-term investments | | | 4,211.1 | | | | 4,211.1 | | | | 2,972.0 | | | | 2,972.0 | |
| Long-term investments | | | 6,727.1 | | | | 6,727.1 | | | | 7,941.2 | | | | 7,941.2 | |
| Purchased currency options | | | 34.0 | | | | 34.0 | | | | 19.4 | | | | 19.4 | |
| Forward exchange contracts | | | 13.4 | | | | 13.4 | | | | 7.5 | | | | 7.5 | |
| Interest rate swaps | | | 59.1 | | | | 59.1 | | | | 100.3 | | | | 100.3 | |
| |
Liabilities | | | | | | | | | | | | | | | | |
| |
| Loans payable and current portion of long-term debt | | $ | 2,181.2 | | | $ | 2,201.5 | | | $ | 1,700.0 | | | $ | 1,714.1 | |
| Long-term debt | | | 4,691.5 | | | | 4,820.9 | | | | 5,096.0 | | | | 5,375.7 | |
| Written currency options | | | 3.8 | | | | 3.8 | | | | — | | | | — | |
| Forward exchange contracts and currency swap | | | 75.5 | | | | 75.5 | | | | 153.6 | | | | 153.6 | |
| |
43
A summary of the carrying values and fair values of the Company’s investments at December 31 is as follows:
| | | | | | | | | | | | | | | | | |
| | | 2004 | | | 2003 | |
| | | Carrying | | | Fair | | | Carrying | | | Fair | |
| | | Value | | | Value | | | Value | | | Value | |
| |
| Available-for-sale | | | | | | | | | | | | | | | | |
| Debt securities | | $ | 10,524.0 | | | $ | 10,524.0 | | | $ | 10,042.6 | | | $ | 10,042.6 | |
| Equity securities | | | 404.2 | | | | 404.2 | | | | 837.5 | | | | 837.5 | |
| Held-to-maturity securities | | | 10.0 | | | | 10.0 | | | | 33.1 | | | | 33.1 | |
| |
A summary at December 31 of the gross unrealized gains and losses on the Company’s available-for-sale investments recorded, net of tax and minority interests, in AOCI is as follows:
| | | | | | | | | | | | | | | | | |
| | | 2004 | | | 2003 | |
| | | Gross Unrealized | | | Gross Unrealized | |
| | | Gains | | | Losses | | | Gains | | | Losses | |
| |
| Debt securities | | $ | 20.7 | | | $ | (38.5 | ) | | $ | 71.9 | | | $ | (19.3 | ) |
| Equity securities | | | 35.1 | | | | (0.7 | ) | | | 108.9 | | | | (16.9 | ) |
| |
Available-for-sale debt securities and held-to-maturity securities maturing within one year totaled $4.2 billion and $10.0 million, respectively, at December 31, 2004. Of the remaining debt securities, $6.1 billion mature within five years.
Concentrations of Credit Risk
As part of its ongoing control procedures, the Company monitors concentrations of credit risk associated with corporate issuers of securities and financial institutions with which it conducts business. Credit risk is minimal as credit exposure limits are established to avoid a concentration with any single issuer or institution. Four U.S. customers represented, in aggregate, approximately one-fourth of the Company’s accounts receivable at December 31, 2004. The Company monitors the creditworthiness of its customers to which it grants credit terms in the normal course of business. Bad debts have been minimal. The Company does not normally require collateral or other security to support credit sales.
7. Inventories
Inventories at December 31 consisted of:
| | | | | | | | | |
| | | 2004 | | | 2003 | |
| |
| Finished goods | | $ | 376.8 | | | $ | 552.5 | |
| Raw materials and work in process | | | 2,166.8 | | | | 2,309.8 | |
| Supplies | | | 94.7 | | | | 90.5 | |
| |
| Total (approximates current cost) | | | 2,638.3 | | | | 2,952.8 | |
| Reduction to LIFO cost | | | (100.9 | ) | | | — | |
| |
| | | $ | 2,537.4 | | | $ | 2,952.8 | |
| |
| Recognized as: | | | | | | | | |
| Inventories | | $ | 1,898.7 | | | $ | 2,554.7 | |
| Other assets | | | 638.7 | | | | 398.1 | |
| |
Inventories valued under the LIFO method comprised approximately 57% and 51% of inventories at December 31, 2004 and 2003, respectively. Amounts recognized as Other assets are comprised entirely of raw materials and work in process inventories, which include vaccine inventories produced in preparation for product launches, and inventories for other products, principally vaccines andArcoxia, not expected to be sold within one year.
8. Other Intangibles
Other intangibles at December 31 consisted of:
| | | | | | | | | |
| | | 2004 | | | 2003 | |
| |
| Patents and product rights | | $ | 1,656.3 | | | $ | 1,656.3 | |
| Other | | | 177.0 | | | | 169.8 | |
| |
| Total acquired cost | | $ | 1,833.3 | | | $ | 1,826.1 | |
| |
| Patents and product rights | | $ | 1,042.5 | | | $ | 865.4 | |
| Other | | | 111.6 | | | | 96.7 | |
| |
| Total accumulated amortization | | $ | 1,154.1 | | | $ | 962.1 | |
| |
Aggregate amortization expense, substantially all of which is recorded in Materials and production expense, was $192.0 million in 2004, $184.6 million in 2003, and $163.7 million in 2002. The estimated aggregate amortization expense for each of the next five years is as follows: 2005, $163.6 million; 2006, $142.1 million; 2007, $136.5 million; 2008, $85.4 million; and 2009, $35.7 million.
9. Joint Ventures and Other Equity Method Affiliates
In 2000, the Company and Schering-Plough Corporation (Schering-Plough) entered into agreements to create separate equally-owned partnerships to develop and market in the United States new prescription medicines in the cholesterol-management and respiratory therapeutic areas. In 2001, the cholesterol-management partnership agreements were expanded to include all the countries of the world, excluding Japan. In 2002, ezetimibe, the first in a new class of cholesterol-lowering agents, was launched in the United States asZetia(brandedEzetroloutside the United States). As of December 2004,Ezetrolhas been launched in more than 50 countries outside the United States. Sales totaled $1.1 billion in 2004, $469.4 million in 2003 and $25.3 million in 2002. In July 2004, the combination product containing the active ingredients of bothZetiaandZocor, was approved in the United States asVytorin(marketed asInegyin many countries outside of the United States).Vytorinhas been approved in 15 countries outside the United States. Sales totaled $132.4 million in 2004. The results from the Company’s interest in the Merck/Schering-Plough partnership are recorded in Equity income from affiliates and were income of $132.0 million in 2004 and losses of $92.5 million and $147.4 million in 2003 and 2002, respectively.
44
In 2002, Merck’s respiratory partnership with Schering-Plough reported on results of Phase III clinical trials of a fixed combination tablet containingSingulairandClaritin, Schering-Plough’s nonsedating antihistamine, which did not demonstrate sufficient added benefits in the treatment of seasonal allergic rhinitis.
In 1982, Merck entered into an agreement with Astra AB (Astra) to develop and market Astra’s products under a royalty-bearing license. In 1993, the Company’s total sales of Astra products reached a level that triggered the first step in the establishment of a joint venture business carried on by Astra Merck Inc. (AMI), in which Merck and Astra each owned a 50% share. This joint venture, formed in 1994, developed and marketed most of Astra’s new prescription medicines in the United States includingPrilosec,the first of a class of medications known as proton pump inhibitors, which slows the production of acid from the cells of the stomach lining.
In 1998, Merck and Astra completed the restructuring of the ownership and operations of the joint venture whereby the Company acquired Astra’s interest in AMI, renamed KBI Inc. (KBI), and contributed KBI’s operating assets to a new U.S. limited partnership, Astra Pharmaceuticals L.P. (the Partnership), in exchange for a 1% limited partner interest. Astra contributed the net assets of its wholly owned subsidiary, Astra USA, Inc., to the Partnership in exchange for a 99% general partner interest. The Partnership, renamed AstraZeneca LP (AZLP) upon Astra’s 1999 merger with Zeneca Group Plc (the AstraZeneca merger), became the exclusive distributor of the products for which KBI retained rights.
While maintaining a 1% limited partner interest in AZLP, Merck has consent and protective rights intended to preserve its business and economic interests, including restrictions on the power of the general partner to make certain distributions or dispositions. Furthermore, in limited events of default, additional rights will be granted to the Company, including powers to direct the actions of, or remove and replace, the Partnership’s chief executive officer and chief financial officer. Merck earns ongoing revenue based on sales of current and future KBI products and such revenue was $1.5 billion, $1.9 billion and $1.5 billion in 2004, 2003 and 2002, respectively, primarily relating to sales ofNexiumandPrilosec. In addition, Merck earns certain Partnership returns, which are recorded in Equity income from affiliates. Such returns include a priority return provided for in the Partnership Agreement, variable returns based, in part, upon sales of certain former Astra USA, Inc. products, and a preferential return representing Merck’s share of undistributed AZLP GAAP earnings. These returns aggregated $646.5 million, $391.5 million and $640.2 million in 2004, 2003 and 2002, respectively. The decrease in 2003 is attributable to a reduction in the preferential return, primarily resulting from the impact of generic competition forPrilosec.The AstraZeneca merger triggers a partial redemption of Merck’s limited partnership interest in 2008. Upon this redemption, AZLP will distribute to KBI an amount based primarily on a multiple of Merck’s average annual variable returns derived from sales of the former Astra USA, Inc. products for the three years prior to the redemption (the Limited Partner Share of Agreed Value).
In conjunction with the 1998 restructuring, for a payment of $443.0 million, which was deferred, Astra purchased an option (the Asset Option) to buy Merck’s interest in the KBI products, excluding the gastrointestinal medicinesNexiumandPrilosec. The Asset Option is exercisable in 2010 at an exercise price equal to the net present value as of March 31, 2008 of projected future pretax revenue to be received by the Company from the KBI products (the Appraised Value). Merck also has the right to require Astra to purchase such interest in 2008 at the Appraised Value. In addition, the Company granted Astra an option to buy Merck’s common stock interest in KBI at an exercise price based on the net present value of estimated future net sales ofNexiumandPrilosec. This option is exercisable two years after Astra’s purchase of Merck’s interest in the KBI products.
The 1999 AstraZeneca merger constituted a Trigger Event under the KBI restructuring agreements. As a result of the merger, in exchange for Merck’s relinquishment of rights to future Astra products with no existing or pending U.S. patents at the time of the merger, Astra paid $967.4 million (the Advance Payment), which is subject to a true-up calculation in 2008 that may require repayment of all or a portion of this amount. The True-Up Amount is directly dependent on the fair market value in 2008 of the Astra product rights retained by the Company. Accordingly, recognition of this contingent income has been deferred until the realizable amount, if any, is determinable, which is not anticipated prior to 2008.
Under the provisions of the KBI restructuring agreements, because a Trigger Event has occurred, the sum of the Limited Partner Share of Agreed Value, the Appraised Value and the True-Up Amount is guaranteed to be a minimum of $4.7 billion. Distribution of the Limited Partner Share of Agreed Value and payment of the True-Up Amount will occur in 2008. AstraZeneca’s purchase of Merck’s interest in the KBI products is contingent upon the exercise of either Merck’s option in 2008 or AstraZeneca’s option in 2010 and, therefore, payment of the Appraised Value may or may not occur.
In 1997, Merck and Rhône-Poulenc S.A. (now Sanofi-Aventis S.A.) combined their animal health and poultry genetics businesses to form Merial Limited (Merial), a fully integrated animal health company, which is a stand-alone joint venture, equally owned by each party. Merial provides a comprehensive range of pharmaceuticals and vaccines to enhance the health, well-being and performance of a wide range of animal species. Merial sales were $2.0 billion for 2004, $1.8 billion for 2003 and $1.7 billion for 2002.
In 1994, Merck and Pasteur Mérieux Connaught (now Sanofi Pasteur S.A.) established an equally-owned joint venture to market vaccines in Europe and to collaborate in the development of combination vaccines for distribution in Europe. Joint venture vaccine sales were $807.0 million for 2004, $669.0 million for 2003 and $546.4 million for 2002.
In 1989, Merck formed a joint venture with Johnson & Johnson to develop and market a broad range of nonprescription medicines for U.S. consumers. This 50% owned venture was expanded into Europe in 1993, and into Canada in 1996. In March 2004, Merck sold its 50% equity stake in its European joint venture to Johnson & Johnson for $244.0 million and recorded a $176.8 million gain as Other (income) expense, net. (See Note 16.) Merck will continue to benefit through royalties on certain products and also regained the rights to potential future products that switch from prescription to over-the-counter status in Europe. Sales of product marketed by the joint venture, including sales of the European joint venture up through March 2004, were $315.3 million for 2004, $445.8 million for 2003 and $413.0 million for 2002.
45
Investments in affiliates accounted for using the equity method, including the above joint ventures, totaled $2.5 billion at December 31, 2004 and $2.2 billion at December 2003. These amounts are reported in Other assets. Dividends and distributions received from these affiliates were $587.0 million in 2004, $553.4 million in 2003 and $488.6 million in 2002.
Summarized information for those affiliates is as follows:
| | | | | | | | | | | | | |
| Years Ended December 31 | | 2004 | | | 2003 | | | 2002 | |
| |
| Sales | | $ | 9,821.1 | | | $ | 9,067.2 | | | $ | 8,819.2 | |
| Materials and production costs | | | 4,140.9 | | | | 3,946.1 | | | | 3,473.6 | |
| Other expense, net | | | 3,691.4 | | | | 3,745.6 | | | | 3,495.1 | |
| Income before taxes | | | 1,988.8 | | | | 1,375.5 | | | | 1,850.5 | |
| |
| | | | | | | | | |
| December 31 | | 2004 | | | 2003 | |
| |
| Current assets | | $ | 5,906.0 | | | $ | 5,806.3 | |
| Noncurrent assets | | | 1,447.5 | | | | 1,624.9 | |
| Current liabilities | | | 3,401.4 | | | | 3,868.0 | |
| Noncurrent liabilities | | | 433.1 | | | | 785.0 | |
| |
10. Loans Payable, Long-Term Debt and Other Commitments
Loans payable at December 31, 2004 and 2003 included $299.6 million and $549.7 million, respectively, of commercial paper borrowings, $345.9 million and $296.0 million, respectively, of long-dated notes that are subject to repayment at the option of the holders on an annual basis and $500.0 million of notes with annual interest rate resets and a final maturity in 2011. On an annual basis, these notes will either be repurchased from the holders at the option of the remarketing agent and remarketed, or redeemed by the Company. At December 31, 2004, loans payable also included $1.0 billion of fixed-rate notes due in 2005, and at December 31, 2003, loans payable also included a $300.0 million variable-rate borrowing due in 2004. In December 2004, this variable-rate borrowing was extended for an additional five years. The weighted average interest rate for all of these borrowings was 3.9% and 2.5% at December 31, 2004 and 2003, respectively.
Long-term debt at December 31 consisted of:
| | | | | | | | | |
| | | 2004 | | | 2003 | |
| |
| 6.0% Astra note due 2008 | | $ | 1,380.0 | | | $ | 1,380.0 | |
| 4.4% notes due 2013 | | | 527.2 | | | | 526.9 | |
| 5.3% notes due 2006 | | | 526.8 | | | | 548.5 | |
| 6.4% debentures due 2028 | | | 499.2 | | | | 499.1 | |
| 6.0% debentures due 2028 | | | 496.7 | | | | 496.6 | |
| 2.5% notes due 2007 | | | 345.9 | | | | — | |
| Variable-rate borrowing due 2009 | | | 300.0 | | | | — | |
| 6.3% debentures due 2026 | | | 247.5 | | | | 247.4 | |
| 4.1% notes due 2005 | | | — | | | | 523.9 | |
| 6.8% euronotes due 2005 | | | — | | | | 499.8 | |
| Other | | | 368.2 | | | | 373.8 | |
| |
| | | $ | 4,691.5 | | | $ | 5,096.0 | |
| |
The Company was a party to interest rate swap contracts which effectively convert the 4.4%, 5.3%, 2.5% and 4.1% fixed-rate notes to floating-rate instruments. (See Note 6.)
Other at December 31, 2004 and 2003 consisted primarily of $328.6 million and $332.6 million, respectively, of borrowings at variable rates averaging 2.0% and 0.8%, respectively. Of these borrowings, $158.7 million are subject to repayment at the option of the holders beginning in 2011 and $106.0 million are subject to repayment at the option of the holders beginning in 2010. In both years, Other also included foreign borrowings at varying rates up to 13.0%.
The aggregate maturities of long-term debt for each of the next five years are as follows: 2005, $1.0 billion; 2006, $540.1 million; 2007, $355.7 million; 2008, $1.4 billion; 2009, $307.5 million.
Rental expense under the Company’s operating leases, net of sublease income, was $215.0 million in 2004. The minimum aggregate rental commitments under noncancellable leases are as follows: 2005, $91.7 million; 2006, $58.2 million; 2007, $35.9 million; 2008, $28.0 million; 2009, $23.0 million and thereafter, $68.4 million. The Company has no significant capital leases.
11. Contingencies and Environmental Liabilities
The Company is involved in various claims and legal proceedings of a nature considered normal to its business, including product liability, intellectual property and commercial litigation, as well as additional matters such as antitrust actions. The Company records accruals for contingencies when it is probable that a liability has been incurred and the amount can be reasonably estimated. These accruals are adjusted periodically as assessments change or additional information becomes available. For product liability claims, a portion of the overall accrual is actuarially determined and considers such factors as past experience, number of claims reported and estimates of claims incurred but not yet reported. Individually significant contingent losses are accrued when probable and reasonably estimable. Legal defense costs expected to be incurred in connection with a loss contingency are accrued when probable and reasonably estimable.
The Company’s decision to obtain insurance coverage is dependent on market conditions, including cost and availability, existing at the time such decisions are made. As a result of a number of factors, product liability insurance has become less available while the cost has increased significantly. The Company has evaluated its risks and has determined that the cost of obtaining product liability insurance outweighs the likely benefits of the coverage that is available and as such, has no insurance for certain product liabilities effective August 1, 2004, including liability for products first sold after that date. The Company will continue to evaluate its insurance needs and the costs, availability and benefits of product liability insurance in the future.
46
Vioxx Litigation
Product Liability Lawsuits
As previously disclosed, federal and state product liability lawsuits involving individual claims, as well as several putative class actions have been filed against the Company with respect toVioxx. As of January 31, 2005 the Company has been served or is aware that it has been named as a defendant in approximately 850 lawsuits, which include approximately 2,425 plaintiff groups alleging personal injuries resulting from the use ofVioxx. Certain of these lawsuits include allegations regarding gastrointestinal bleeding, cardiovascular events, thrombotic events or kidney damage. The Company has also been named as a defendant in approximately 90 putative class actions alleging personal injuries or seeking (i) medical monitoring as a result of the putative class members’ use ofVioxx, (ii) disgorgement of certain profits under common law unjust enrichment theories, and/or (iii) various remedies under state consumer fraud and fair business practice statutes, including recovering the cost ofVioxxpurchased by individuals and third-party payors such as union health plans (all of the actions discussed in this paragraph are collectively referred to as the “VioxxProduct Liability Lawsuits”). The actions filed in the state courts of California and New Jersey, respectively, have been transferred to a single judge in each state for coordinated proceedings. In addition, the Company filed a motion with the Judicial Panel on Multidistrict Litigation (the “JPML”) seeking to transfer to a single federal judge and coordinate for pre-trial purposes all federal cases alleging personal injury and/or economic loss relating to the purchase or use ofVioxx; several plaintiffs in certainVioxxProduct Liability Lawsuits pending in federal court have made similar requests. On February 16, 2005, the JPML granted the motions to transfer allVioxxProduct Liability Lawsuits pending in federal courts nationwide into one Multidistrict Litigation (“MDL”) for coordinated pre-trial proceedings. The MDL has been transferred to the United States District Court for the Eastern District for Louisiana before District Judge Eldon E. Fallon.
Shareholder Lawsuits
As previously disclosed, in addition to theVioxxProduct Liability Lawsuits, a number of purported class action lawsuits were filed in late 2003 and early 2004 by several shareholders in the United States District Court for the Eastern District of Louisiana naming as defendants the Company and several current or former officers and directors of the Company. These cases have been consolidated. After the announcement of the withdrawal ofVioxx, the Company was named as a defendant in additional purported securities class action lawsuits filed in federal courts in New Jersey, Pennsylvania, and Louisiana. These actions allege that the defendants made false and misleading statements regardingVioxxin violation of Sections 10(b) and 20(a) of the Securities Exchange Act of 1934, including with respect to the withdrawal ofVioxx, and seek unspecified compensatory damages and the costs of suit, including attorneys’ fees. Plaintiffs request certification of a class of purchasers of Company stock during various periods between May 21, 1999 and October 29, 2004. In addition, two shareholders filed an individual securities action in the United States District Court for the Central District of Illinois seeking compensatory damages and costs. Certain complaints include allegations under Sections 11, 12 and 15 of the Securities Act of 1933 that certain officers and directors made incomplete and misleading statements in a registration statement and certain prospectuses filed in connection with the Merck Stock Investment Plan, a dividend reinvestment plan (all of the actions discussed in this paragraph are collectively referred to as the “VioxxSecurities Lawsuits”). Several plaintiffs have dismissed their complaints without prejudice. As of January 31, 2005, a total of 14VioxxSecurities Lawsuits were pending in various federal courts.
As previously disclosed, in March 2004, two shareholder derivative actions were filed in the United States District Court for the Eastern District of Louisiana naming the Company as a nominal defendant and certain members of the Board (past and present), together with certain executive officers, as defendants. The complaints arise out of substantially the same factual allegations that are made in theVioxxSecurities Lawsuits. The derivative suits, which are purportedly brought to assert rights of the Company, assert claims against the Board members and officers for breach of fiduciary duty, waste of corporate assets, unjust enrichment, abuse of control and gross mismanagement. After the withdrawal ofVioxx, additional shareholder derivative actions were filed in the New Jersey Superior Court for Hunterdon County and in the United States District Court for the District of New Jersey against the Company and certain officers and members of the Board (past and present) (all of the actions discussed in this paragraph are collectively referred to as the “VioxxDerivative Lawsuits”). Two of theVioxx Derivative Lawsuits include allegations that certain directors made false and misleading statements in connection with certain Proxy Statements filed with the SEC in violation of Section 14(a) of the Securities Act of 1933. As of January 31, 2005, a total of sevenVioxxDerivative Lawsuits were pending.
On October 29, 2004, two individual shareholders made a demand on the Board to take legal action against Mr. Raymond Gilmartin, Chairman, President and Chief Executive Officer and other individuals for allegedly causing damage to the Company with respect to the allegedly improper marketing ofVioxx. In response to that demand letter, the Board of Directors determined at its November 23, 2004 meeting that the Board would take the shareholders’ request under consideration and it remains under consideration.
In addition to these shareholder actions, since the announcement of the withdrawal ofVioxx, putative class actions have been filed against the Company in the United States District Court for the Eastern District of Louisiana and in the United States District Court for the District of New Jersey (the “VioxxERISA Lawsuits” and, together with theVioxxSecurities Lawsuits and theVioxxDerivative Lawsuits, the “VioxxShareholder Lawsuits”) on behalf of certain of the Company’s current and former employees who are participants in certain of the Company’s retirement plans asserting claims under the Employee Retirement Income Security Act (“ERISA”). The lawsuits make similar allegations to the allegations contained in theVioxxSecurities Lawsuits. As of January 31, 2005, a total of elevenVioxxERISA Lawsuits were pending.
In October 2004, the plaintiff in one of theVioxxERISA Lawsuits filed a motion with the JPML to transfer to a single federal judge and coordinate for pretrial purposes all of theVioxx ERISA Lawsuits. In November 2004, the Company responded to that motion and filed its own motion seeking coordination of all of theVioxxShareholder Lawsuits. The hearing on those motions was held on January 27, 2005.
International Lawsuits
In addition to the lawsuits discussed above, the Company has been named as a defendant in actions in various countries in Europe, Australia, Canada, Brazil and Israel related toVioxx.
47
Additional Lawsuits
Based on media reports and other sources, the Company anticipates that additionalVioxxProduct Liability Lawsuits andVioxxShareholder Lawsuits (collectively, the “VioxxLawsuits”) will be filed against it and/or certain of its current and former officers and directors in the future.
Insurance
The Company has product liability insurance for claims brought in theVioxxProduct Liability Lawsuits of up to approximately $630 million after deductibles and co-insurance. This insurance provides coverage for legal defense costs and potential damage amounts that have been or will be incurred in connection with theVioxxProduct Liability Lawsuits. The Company believes that this insurance coverage extends to additionalVioxxProduct Liability Lawsuits that may be filed in the future. Certain of the Company’s insurers have reserved their rights to take a contrary position with respect to certain coverage and there could be disputes with insurers about coverage matters. The Company currently believes that it has at least approximately $190 million of Directors and Officers insurance coverage for theVioxxSecurities Lawsuits andVioxx Derivative Lawsuits, and at least approximately $275 million of insurance coverage for theVioxx ERISA Lawsuits. Additional insurance coverage for these claims may also be available under upper level excess policies that provide coverage for a variety of risks. There may be disputes with insurers about the availability of some or all of this insurance coverage. At this time, the Company believes it is reasonably possible its insurance coverage with respect to theVioxx Lawsuits will not be adequate to cover its defense costs and any losses.
Investigations
In November 2004, the Company was advised by the staff of the Securities and Exchange Commission (“SEC”) that it was commencing an informal inquiry concerningVioxx. On January 28, 2005, the Company announced that it received notice that the SEC issued a formal notice of investigation. Also, the Company received a subpoena from the U.S. Department of Justice requesting information related to the Company’s research, marketing and selling activities with respect toVioxxin a federal health care investigation under criminal statutes. There are also ongoing investigations by certain Congressional committees. Also, the District Attorney’s Office in Munich, Germany notified the Company’s subsidiary in Germany that it received complaints and commenced an investigation in order to determine whether any criminal charges should be brought in Germany concerningVioxx(together with the previously mentioned investigations, the “Vioxx Investigations”). The Company will cooperate with all of theVioxxInvestigations. The Company cannot predict the outcome of these inquiries; however, they could result in a potential civil disposition from the SEC and/or potential civil or criminal dispositions from the Justice Department.
Reserves
The Company currently anticipates that one or more of theVioxxProduct Liability Lawsuits may go to trial in the first half of 2005. The Company cannot predict the timing of any trials with respect to theVioxxShareholder Lawsuits. The Company believes that it has meritorious defenses to theVioxxLawsuits and will vigorously defend against them. In view of the inherent difficulty of predicting the outcome of litigation, particularly where there are many claimants and the claimants seek indeterminate damages, the Company is unable to predict the outcome of these matters, and at this time cannot reasonably estimate the possible loss or range of loss with respect to theVioxxLawsuits. The Company has not established any reserves for any potential liability relating to theVioxxLawsuits or theVioxx Investigations (collectively the “VioxxLitigation”). The Company has established a reserve of $675 million solely for its future legal defense costs related to theVioxxLitigation. This reserve is based on certain assumptions and is the minimum amount that the Company believes at this time it can reasonably estimate will be spent over a multi-year period. The Company significantly increased the reserve when it had the ability to reasonably estimate its future legal defense costs for theVioxxLitigation. Some of the significant factors that were considered in the establishment of the reserve for theVioxxLitigation were as follows: the actual costs incurred by the Company up to that time; the development of the Company’s legal defense strategy and structure in light of the expanded scope of theVioxxLitigation; the number of cases being brought against the Company; and the anticipated timing, progression, and related costs of pre-trial activities and trials in theVioxxProduct Liability Lawsuits. The Company will continue to monitor its legal defense costs and review the adequacy of the associated reserves. Unfavorable outcomes in theVioxxLawsuits or resulting from theVioxxInvestigations could have a material adverse effect on the Company’s financial position, liquidity and results of operations.
Commercial Litigation
Beginning in 1993, the Company was named in a number of antitrust suits, certain of which were certified as class actions, instituted by most of the nation’s retail pharmacies and consumers in several states. In 1994, these actions, except for those pending in state courts, were consolidated for pre-trial purposes in the federal court in Chicago, Illinois. In 1996, the Company and several other defendants settled the federal class action, which represented the single largest group of claims. Since that time, the Company has settled substantially all of the remaining cases on satisfactory terms; the few remaining cases have been inactive for several years. The Company has not engaged in any conspiracy and no admission of wrongdoing was made nor was included in any settlement agreements.
As previously disclosed, the Company was joined in ongoing litigation alleging manipulation by pharmaceutical manufacturers of Average Wholesale Prices (AWP), which are sometimes used in calculations that determine public and private sector reimbursement levels. In 2002, the Judicial Panel on Multi-District Litigation ordered the transfer and consolidation of all pending federal AWP cases to federal court in Boston, Massachusetts. Plaintiffs filed one consolidated class action complaint, which aggregated the claims previously filed in various federal district court actions and also expanded the number of manufacturers to include some which, like the Company, had not been defendants in any prior pending case. In May 2003, the court granted the Company’s motion to dismiss
48
the consolidated class action and dismissed the Company from the class action case. Subsequent to the Company’s dismissal, the plaintiffs filed an amended consolidated class action complaint, which did not name the Company as a defendant. The Company and thirty other pharmaceutical manufacturers remain defendants in six similar complaints pending in federal court in Massachusetts filed by the New York Counties of Suffolk, Rockland, Nassau, Westchester, Onondaga and New York City and three cases pending in Kentucky, Alabama and Wisconsin. The Company and the other defendants have filed and argued their motion to dismiss the Suffolk case and are awaiting the court’s final decision on the motion. In addition, the Company is a defendant in cases brought on behalf of the citizens of Kentucky and Wisconsin alleging fraudulent practices regarding AWP, which the Company will vigorously defend.
As previously disclosed, the Company has been named as a defendant in antitrust cases in federal court in Minnesota and in state court in California, each alleging an unlawful conspiracy among different sets of pharmaceutical manufacturers to protect high prices in the United States by impeding importation into the United States of lower-priced pharmaceuticals from Canada. The Company and the other defendants have filed a motion to dismiss the action.
As previously disclosed, a suit in federal court in Alabama by two providers of health services to needy patients alleges that 15 pharmaceutical companies overcharged the plaintiffs and a class of those similarly situated, for pharmaceuticals purchased by the plaintiffs under the program established by Section 340B of the Public Health Service Act. The Company and the other defendants have filed a motion to dismiss the complaint on numerous grounds.
As previously disclosed, in January 2003, the U.S. Department of Justice notified the federal court in New Orleans, Louisiana that it was not going to intervene at that time in a pending Federal False Claims Act case that was filed under seal in December 1999 against the Company. The court issued an order unsealing the complaint, which was filed by a physician in Louisiana, and ordered that the complaint be served. The complaint, which alleged that the Company’s discounting ofPepcidin certain Louisiana hospitals led to increases in costs to Medicaid, was dismissed. An amended complaint was filed under seal and the case has been administratively closed by the Court until the seal is lifted. The allegations contained in the amended complaint are unknown.
Governmental Proceedings
As previously disclosed, the Company has received a subpoena from the U.S. Department of Justice in connection with its investigation of the Company’s marketing and selling activities. The Company has also reported that it has received a Civil Investigative Demand from the Attorney General of Texas regarding the Company’s marketing and selling activities relating to Texas. In April 2004, the Company received a subpoena from the office of the Inspector General for the District of Columbia in connection with an investigation of the Company’s interactions with physicians in the District of Columbia, Maryland, and Virginia. In November 2004, the Company received a letter request from the Department of Justice in connection with its investigation of the Company’s pricing ofPepcid. The Company is cooperating with all of these investigations. The Company cannot predict the outcome of these investigations; however, it is possible that unfavorable outcomes could have a material adverse effect on the Company’s financial position, liquidity and results of operations. In addition, from time to time, other federal or state regulators may seek information about practices in the pharmaceutical industry in inquiries other than the investigations discussed in this paragraph. It is not feasible to predict the outcome of any such inquiries.
Vaccine Litigation
The Company is a party in claims brought under the Consumer Protection Act of 1987 in the United Kingdom, which allege that certain children suffer from a variety of conditions as a result of being vaccinated with various bivalent vaccines for measles and rubella and/or trivalent vaccines for measles, mumps and rubella, including the Company’sM-M-RII. The conditions include autism, with or without inflammatory bowel disease, epilepsy, diabetes, encephalitis, encephalopathy, deafness, chronic fatigue syndrome and transverse myelitis. In early September 2003, the Legal Services Commission (the “LSC”) announced its decision to withdraw public funding of the litigation brought by the claimants. This decision was confirmed on appeal by the Funding Review Committee (“FRC”) on September 30, 2003. The claimants’ application for judicial review of the decision to withdraw public funding was dismissed in February 2004 and the April 2004 trial date was vacated. The lead claimants have decided not to apply to the Court of Appeal for permission to appeal the decision. As a result, legal aid for all lead claimants has now been discharged. The non-lead claimants were subject to a “show cause” procedure to withdraw legal aid unless the claimants could show cause as to why it should not be withdrawn. The FRC heard 37 of the “show cause” appeals by the non-lead claimants in October 2004. The appeals involving autism (26) were unsuccessful, but funding was reinstated for 11 appeals involving other non-autism conditions, such as epilepsy, deafness, encephalitis and transverse myelitis. In light of the 11 successful appeals, the LSC has reconsidered the cases of some other claimants and, to date, funding has been reinstated in an additional 86 non-lead, non-autism cases, to the limited extent necessary to allow solicitors to provide a report on the individual cases to the LSC. It is not yet known how many of the 97 appeals involve claimants suing the Company. All claimants for all conditions have until February 28, 2005 to give notice of their intention to continue or discontinue with their claims, irrespective of whether or not they have secured legal aid funding. Directions for further conduct of the litigation will be made at a case management hearing scheduled to take place on March 17 and 18, 2005. The Company will vigorously defend against these lawsuits.
As previously disclosed, the Company is also a party to individual and class action product liability lawsuits and claims in the United States involving pediatric vaccines (i.e., hepatitis B vaccine andhaemophilus influenzatype b vaccine) that contained thimerosal, a preservative used in vaccines. Merck has not distributed thimerosal-containing pediatric vaccines in the United States since the fall of 2001. As of December 31, 2004, there were approximately 300 active thimerosal related lawsuits with approximately 820 plaintiffs. Other defendants include vaccine manufacturers who produced pediatric vaccines containing thimerosal as well as manufacturers of thimerosal. In these actions, the plaintiffs allege, among other things, that they have suffered neurological injuries as a result of exposure to thimerosal from pediatric vaccines. Two state court cases and two Federal District Court cases are scheduled for trial in 2005. The Company will vigorously defend against these lawsuits; however, it is possible that unfavorable outcomes could have a material adverse effect on the Company’s financial position, liquidity and results of operations.
49
The Company has been successful in having cases of this type either dismissed or stayed on the ground that the action is prohibited under the National Vaccine Injury Compensation Program (NVICP). The NVICP prohibits any person from filing or maintaining a civil action (in state or federal court) seeking damages against a vaccine manufacturer for vaccine-related injuries unless a petition is first filed in the United States Court of Federal Claims (hereinafter “the Vaccine Court”). Under the NVICP, before filing a civil action against a vaccine manufacturer, the petitioner must either (a) pursue his or her petition to conclusion in Vaccine Court and then timely file an election to proceed with a civil action in lieu of accepting the Vaccine Court’s adjudication of the petition or (b) timely exercise a right to withdraw the petition prior to Vaccine Court adjudication in accordance with certain statutorily prescribed time periods. The Company is aware that there are numerous cases pending in Vaccine Court involving allegations that thimerosal-containing vaccines and/or theM-M-RII vaccine cause autism spectrum disorders. The Company is not a party to these Vaccine Court proceedings because the petitions are brought against the Department of Health and Human Services.
Patent Litigation
From time to time, generic manufacturers of pharmaceutical products file Abbreviated New Drug Applications (ANDAs) with the FDA seeking to market generic forms of the Company’s products prior to the expiration of relevant patents owned by the Company. Generic pharmaceutical manufacturers have submitted ANDAs to the FDA seeking to market in the United States a generic form ofFosamax,PrilosecandPropeciaprior to the expiration of the Company’s (and AstraZeneca’s in the case ofPrilosec) patents concerning these products. The generic companies’ ANDAs generally include allegations of non-infringement, invalidity and unenforceability of the patents. Generic manufacturers have received FDA approval to market a generic form ofPrilosec. The Company has filed patent infringement suits in federal court against companies filing ANDAs for generic alendronate and finasteride, and AstraZeneca and the Company have filed patent infringement suits in federal court against companies filing ANDAs for generic omeprazole. Similar patent challenges exist in certain foreign jurisdictions. The Company intends to vigorously defend its patents, which it believes are valid, against infringement by generic companies attempting to market products prior to the expiration dates of such patents. As with any litigation, there can be no assurance of the outcomes, which, if adverse, could result in significantly shortened periods of exclusivity for these products.
A trial in the United States with respect to the alendronate daily product concluded in November 2001. In November 2002, a decision was issued by the U.S. District Court in Delaware finding the Company’s patent valid and infringed. On October 30, 2003, the U.S. Court of Appeals for the Federal Circuit affirmed the validity and infringement of the Company’s basic U.S. patent covering the use of alendronate in any form. A request for rehearing was denied. A trial in the United States involving the alendronate weekly product was held in March 2003. On August 28, 2003, the U.S. District Court in Delaware, upheld the validity of the Company’s U.S. patent covering the weekly administration of alendronate. However, on January 28, 2005, the U.S. Court of Appeals for the Federal Circuit in Washington, D.C. found the Company’s patent claims for once-weekly administration ofFosamaxto be invalid. Based on the Court of Appeals’ decision,Fosamaxwill lose its market exclusivity in the United States in February 2008 and the Company expects a decline in U.S.Fosamaxsales at that time. Prior to the decision, Merck’s patent for once-weekly administration ofFosamaxwas set to expire in July 2018. Merck disagrees with the decision of the Court of Appeals and will request reconsideration by the Court of Appeals.
In January 2003, the High Court of Justice for England and Wales held that patents of the Company protecting the alendronate daily and weekly products were invalid in the United Kingdom. On November 6, 2003, the Court of Appeals of England and Wales affirmed the ruling by the High Court of Justice for England and Wales. European countries permit companies seeking approval of a generic product to reference data of the innovative product in certain circumstances under data exclusivity regulations. The Company has been granted leave to appeal a decision of the UK regulatory authority that its data for weekly alendronate may be referenced by companies seeking approval of generic weekly alendronate products. The Company has also filed an appeal of a grant by the Swedish regulatory authority of approval of generic weekly alendronate products which referenced the Company’s data on weekly alendronate for their approval.
As previously announced by the Company, on July 20, 2004, the Opposition Division (the “Opposition Division”) of the European Patent Office (the “EPO”) rendered an oral decision to revoke the Company’s patent in Europe that covers the weekly administration of alendronate. On August 19, 2004, the written opinion was issued confirming the oral decision revoking the Company’s patent. On September 16, 2004, the Company filed an appeal of this decision. Based on other patents, the alendronate weekly product is protected in most major European markets until at least 2007.
On October 5, 2004, in an action in Australia challenging the validity of the Company’s Australian patent for the weekly administration of alendronate, the patent was found to be invalid. The Company has appealed the decision.
In addition, in Japan a proceeding has been filed challenging the validity of the Company’s Japanese patent for the weekly administration of alendronate.
In the case of omeprazole, the trial court in the United States rendered an opinion in October 2002 upholding the validity of the Company’s and AstraZeneca’s patents covering the stabilized formulation of omeprazole and ruling that one defendant’s omeprazole product did not infringe those patents. The other three defendants’ products were found to infringe the formulation patents. In December 2003, the U.S. Court of Appeals for the Federal Circuit affirmed the decision of the trial court. With respect to certain other generic manufacturers’ omeprazole products, no trial date has yet been set.
In the case of finasteride, an ANDA has been filed seeking approval of a generic version ofPropeciaand alleging invalidity of the Company’s patents. The Company filed a patent infringement lawsuit in the District Court of Delaware in September 2004. A trial is not anticipated before 2006.
Other Litigation
As previously disclosed, on July 6, 2004, the United States District Court for the District of New Jersey granted a motion by the Company, Medco Health Solutions, Inc. (“Medco Health”) and certain officers and directors to dismiss a purported class action complaint involving claims related to the Company’s revenue recognition practice for retail co-payments paid by individuals to whom Medco Health provides pharmaceutical benefits as well as other allegations. The complaint was dismissed with prejudice. On August 20, 2004 the same court granted the Company’s motion to dismiss with prejudice a related shareholder derivative action. Plaintiffs in both actions have appealed the decisions.
50
Prior to the spin-off of Medco Health, the Company and Medco Health agreed to settle, on a class action basis, a series of lawsuits asserting violations of ERISA (the Gruer Cases). The Company, Medco Health and certain plaintiffs’ counsel filed the settlement agreement with the federal district court in New York, where cases commenced by a number of plaintiffs, including participants in a number of pharmaceutical benefit plans for which Medco Health is the pharmacy benefit manager, as well as trustees of such plans, have been consolidated. The proposed class settlement has been agreed to by plaintiffs in five of the cases filed against Medco Health and the Company. Under the proposed settlement, the Company and Medco Health have agreed to pay a total of $42.5 million, and Medco Health has agreed to modify certain business practices or to continue certain specified business practices for a period of five years. The financial compensation is intended to benefit members of the settlement class, which includes ERISA plans for which Medco Health administered a pharmacy benefit at any time since December 17, 1994. In 2003, the district court preliminarily approved the settlement and held hearings to hear objections to the fairness of the proposed settlement. The district court approved the settlement in 2004, but has not yet determined the number of class member plans that have properly elected not to participate in the settlement. The settlement becomes final only if and when all appeals have been resolved. Three notices of appeal have been filed and the appellate court is expected to hear arguments regarding the appeals in March 2005 and decide the appeals thereafter. Currently, certain class member plans have indicated that they will not participate in the settlement. Cases initiated by three such plans and two individuals remain pending in the Southern District of New York. Plaintiffs in these cases have asserted claims based on ERISA as well as other federal and state laws that are the same as or similar to the claims that had been asserted by settling class members in the Gruer Cases. The Company and Medco Health are named as defendants in these cases. Medco Health and the Company agreed to the proposed settlement in order to avoid the significant cost and distraction of prolonged litigation.
After the spin-off of Medco Health, Medco Health assumed substantially all of the liability exposure for the matters discussed in the foregoing paragraph. These cases are being defended by Medco Health.
There are various other legal proceedings, principally product liability and intellectual property suits involving the Company, which are pending. While it is not feasible to predict the outcome of such proceedings or the proceedings discussed in this Note, in the opinion of the Company, all such proceedings, are either adequately covered by insurance or, if not so covered, should not ultimately result in any liability that would have a material adverse effect on the financial position, liquidity or results of operations of the Company, other than proceedings for which a separate assessment is provided in this Note.
Environmental Matters
The Company is a party to a number of proceedings brought under the Comprehensive Environmental Response, Compensation and Liability Act, commonly known as Superfund. When a legitimate claim for contribution is asserted, a liability is initially accrued based upon the estimated transaction costs to manage the site. Accruals are adjusted as feasibility studies and related cost assessments of remedial techniques are completed, and as the extent to which other potentially responsible parties (PRPs) who may be jointly and severally liable can be expected to contribute is determined.
The Company is also remediating environmental contamination resulting from past industrial activity at certain of its sites and takes an active role in identifying and providing for these costs. A worldwide survey was initially performed to assess all sites for potential contamination resulting from past industrial activities. Where assessment indicated that physical investigation was warranted, such investigation was performed, providing a better evaluation of the need for remedial action. Where such need was identified, remedial action was then initiated. Estimates of the extent of contamination at each site were initially made at the pre-investigation stage and liabilities for the potential cost of remediation were accrued at that time. As more definitive information became available during the course of investigations and/or remedial efforts at each site, estimates were refined and accruals were adjusted accordingly. These estimates and related accruals continue to be refined annually.
In management’s opinion, the liabilities for all environmental matters that are probable and reasonably estimable have been accrued and totaled $127.5 million and $158.1 million at December 31, 2004 and 2003, respectively. These liabilities are undiscounted, do not consider potential recoveries from insurers or other parties and will be paid out over the periods of remediation for the applicable sites, which are expected to occur primarily over the next 15 years. Although it is not possible to predict with certainty the outcome of these matters, or the ultimate costs of remediation, management does not believe that any reasonably possible expenditures that may be incurred in excess of the liabilities accrued should exceed $75.0 million in the aggregate. Management also does not believe that these expenditures should result in a material adverse effect on the Company’s financial position, results of operations, liquidity or capital resources for any year.
12. Preferred Stock of Subsidiary Companies
In December 2004, the Company redeemed variable-rate preferred units of a subsidiary at $1.5 billion of par value plus accrued dividends. Because these preferred securities were held at the subsidiary level, they were previously included in Minority interests in the consolidated financial statements for 2003.
In connection with the 1998 restructuring of AMI (see Note 9), the Company assumed a $2.4 billion par value preferred stock obligation with a dividend rate of 5% per annum, which is carried by KBI and included in Minority interests. While a small portion of the preferred stock carried by KBI is convertible into KBI common shares, none of the preferred securities are convertible into the Company’s common shares and, therefore, they are not included as common shares issuable for purposes of computing Earnings per common share assuming dilution. (See Note 18.)
13. Stockholders’ Equity
Other paid-in capital decreased by $86.8 million in 2004, and increased by $12.9 million and $36.5 million in 2003 and 2002, respectively. The changes primarily reflect the impact of shares issued upon exercise of stock options and related income tax benefits.
A summary of treasury stock transactions (shares in millions) is as follows:
| | | | | | | | | | | | | | | | | | | | | | | | | |
| | | 2004 | | | 2003 | | | 2002 | |
| | | Shares | | | Cost | | | Shares | | | Cost | | | Shares | | | Cost | |
| |
| Balance, Jan. 1 | | | 754.5 | | | $ | 25,617.5 | | | | 731.2 | | | $ | 24,109.1 | | | | 703.4 | | | $ | 22,387.1 | |
| Purchases | | | 24.9 | | | | 974.6 | | | | 39.0 | | | | 2,034.1 | | | | 39.2 | | | | 2,091.3 | |
Issuances(1) | | | (11.8 | ) | | | (400.3 | ) | | | (15.7 | ) | | | (525.7 | ) | | | (11.4 | ) | | | (369.3 | ) |
| |
| Balance, Dec. 31 | | | 767.6 | | | $ | 26,191.8 | | | | 754.5 | | | $ | 25,617.5 | | | | 731.2 | | | $ | 24,109.1 | |
| |
(1) Issued primarily under stock option plans.
51
At December 31, 2004 and 2003, 10 million shares of preferred stock, without par value, were authorized; none were issued.
14. Stock-Based Compensation Plans
The Company has stock-based compensation plans under which employees, non-employee directors and employees of certain of the Company’s equity method investees may be granted options to purchase shares of Company common stock at the fair market value at the time of the grant. These plans were approved by the Company’s shareholders. Option grants beginning in 2002 generally vest ratably over three years, while grants prior to 2002 generally vest after five years. The options expire ten years from the date of grant, subject to terms applicable to such awards.
In 2004, as part of an ongoing compensation review, the Company made certain changes to its stock-based compensation plans. Under the new approach, the Company began granting performance share units (PSUs) and restricted stock units (RSUs), in addition to stock options, to certain management level employees. The financial value of individual stock-based incentive grants under the new approach was designed to be equivalent to the prior approach, only the mix of stock-based compensation awards changed. Both PSU and RSU payouts will be in shares of Company stock after the end of a three-year period, subject to terms applicable to such awards. Additionally, PSU payouts will be contingent on the Company’s performance against a pre-set objective or set of objectives. The Company granted 509,062 PSUs with a weighted-average grant date fair value of $48.23 and 2,472,794 RSUs with a weighted-average grant date fair value of $41.09 in 2004.
In 2003, in connection with the Medco Health spin-off, the number and exercise prices of outstanding options were proportionately adjusted to maintain the option holders’ positions before and after the spin-off. As a result of the adjustment, the number of outstanding options increased by 12.6 million and the average exercise price decreased by approximately $3.22. In addition, certain stock options granted to Medco Health employees in 2003 and 2002 were converted to Medco Health options with terms and amounts that maintained the option holders’ positions.
Summarized information relative to the Company’s stock option plans (options in thousands) is as follows:
| | | | | | | | | |
| | | Number | | | Average | |
| | | of Options | | | Price(1) | |
| |
| Outstanding at December 31, 2001 | | | 197,200.7 | | | $ | 56.98 | |
| Granted | | | 37,809.4 | | | | 61.18 | |
| Exercised | | | (11,048.3 | ) | | | 28.82 | |
| Forfeited | | | (5,852.5 | ) | | | 69.20 | |
| |
| Outstanding at December 31, 2002 | | | 218,109.3 | | | | 58.80 | |
| Granted | | | 32,595.7 | | | | 52.74 | |
| Exercised | | | (15,482.2 | ) | | | 25.07 | |
Forfeited or converted(2) | | | (11,970.7 | ) | | | 63.18 | |
| Medco Health spin-off adjustment | | | 12,626.2 | | | | (3.22 | ) |
| |
| Outstanding at December 31, 2003 | | | 235,878.3 | | | | 56.80 | |
Granted | | | 31,377.9 | | | | 45.58 | |
Exercised | | | (11,668.0 | ) | | | 20.60 | |
Forfeited | | | (10,824.1 | ) | | | 59.78 | |
| |
Outstanding at December 31, 2004 | | | 244,764.1 | | | $ | 56.96 | |
| |
(1) Weighted average exercise price.
(2) Includes 4.8 million options that were converted to Medco Health options.
The number of options and average price of options exercisable at December 31, 2004, 2003 and 2002 were 129.1 million options at $55.83, 101.4 million options at $47.47 and 70.7 million options at $35.97, respectively. At December 31, 2004 and 2003, 99.9 million shares and 120.4 million shares, respectively, were available for future grants under the terms of the Company’s stock-based compensation plans.
Summarized information about stock options outstanding and exercisable at December 31, 2004 (options in thousands) is as follows:
| | | | | | | | | | | | | | | | | | | | | |
| Exercise | | Outstanding | | | Exercisable | |
| Price | | Number | | | Average | | | Average | | | Number | | | Average | |
| Range | | of Options | | | Life(1) | | | Price(2) | | | of Options | | | Price(2) | |
| |
Under $15 | | | 2,199.0 | | | | 3.54 | | | $ | 11.75 | | | | 2,199.0 | | | $ | 11.75 | |
$15 to 25 | | | 5,290.0 | | | | 0.42 | | | | 19.92 | | | | 5,241.1 | | | | 19.91 | |
$25 to 40 | | | 16,051.2 | | | | 3.41 | | | | 30.51 | | | | 11,876.4 | | | | 31.05 | |
$40 to 50 | | | 77,542.9 | | | | 6.96 | | | | 48.31 | | | | 30,652.5 | | | | 47.52 | |
$50 to 65 | | | 84,344.4 | | | | 5.32 | | | | 60.12 | | | | 46,380.8 | | | | 59.49 | |
$65 to 80 | | | 58,214.6 | | | | 4.99 | | | | 75.69 | | | | 32,227.0 | | | | 75.91 | |
Over $80 | | | 1,122.0 | | | | 3.84 | | | | 86.20 | | | | 555.1 | | | | 87.27 | |
| |
| | | | 244,764.1 | | | | | | | | | | | | 129,131.9 | | | | | |
| |
(1) Weighted average contractual life remaining in years.
(2) Weighted average exercise price.
52
15. Pension and Other Postretirement Benefit Plans
The Company has defined benefit pension plans covering eligible employees in the United States and in certain of its international subsidiaries. Pension benefits in the United States are based on a formula that considers final average pay and years of credited service. In addition, the Company provides medical, dental and life insurance benefits, principally to its eligible U.S. retirees and similar benefits to their dependents, through its other postretirement benefit plans. The Company uses a December 31 measurement date for substantially all of its pension plans and for its other postretirement benefit plans.
In 2004, in accordance with FASB Staff Position No. 106-2, Accounting and Disclosure Requirements Related to the Medicare Prescription Drug, Improvement and Modernization Act of 2003 (the Act), the Company began accounting for the effect of the federal subsidy under the Act, which reduced the benefit obligation of certain of its other postretirement benefit plans by $169.0 million. The service cost, interest cost and net amortization components of net postretirement benefit cost were reduced by $7.9 million, $10.5 million and $12.6 million, respectively. While the Company is recognizing the subsidy in accordance with current accounting requirements, it will continue to evaluate the Act and regulations that follow to determine the optimal approach to incorporating the impact of the Act.
The Company changed participant contributions and the service recognized for eligibility for its other postretirement benefit plans. These amendments generated curtailment gains of $12.3 million in 2004, $10.2 million in 2003 and $54.2 million in 2002.
The Company recorded a settlement loss of $28.3 million on its pension plans and a curtailment loss of $11.7 million on its other postretirement benefit plans in 2003 resulting from reductions in employment levels primarily in connection with restructuring activities. The Company also recorded termination charges in 2004 and 2003 of $18.4 million and $37.9 million, respectively, on its pension plans and $3.1 million and $8.1 million, respectively, on its other postretirement benefit plans related to expanded eligibility for certain employees exiting primarily under the restructuring action. (See Note 4.)
In addition, the Company recorded a settlement loss of $23.0 million in 2004 on certain of its domestic pension plans resulting from employees electing to receive their pension benefits as lump sum payments.
The net cost for the Company’s pension plans consisted of the following components:
| | | | | | | | | | | | | |
| Years Ended December 31 | | 2004 | | | 2003 | | | 2002 | |
| |
| Service cost | | $ | 307.7 | | | $ | 263.4 | | | $ | 218.8 | |
| Interest cost | | | 286.0 | | | | 260.6 | | | | 229.9 | |
| Expected return on plan assets | | | (367.7 | ) | | | (341.2 | ) | | | (314.3 | ) |
| Net amortization | | | 130.0 | | | | 115.9 | | | | 49.1 | |
| Settlements | | | 23.0 | | | | 28.3 | | | | — | |
| Termination benefits | | | 18.4 | | | | 37.9 | | | | — | |
| |
| Net pension cost | | $ | 397.4 | | | $ | 364.9 | | | $ | 183.5 | |
| |
The net pension cost attributable to U.S. plans included in the above table was $283.0 million in 2004, $264.8 million in 2003 and $108.0 million in 2002.
The net cost of postretirement benefits other than pensions consisted of the following components:
| | | | | | | | | | | | | |
| Years Ended December 31 | | 2004 | | | 2003 | | | 2002 | |
| |
| Service cost | | $ | 86.0 | | | $ | 68.3 | | | $ | 46.6 | |
| Interest cost | | | 105.7 | | | | 90.4 | | | | 71.4 | |
| Expected return on plan assets | | | (89.4 | ) | | | (62.0 | ) | | | (78.6 | ) |
| Net amortization | | | 31.0 | | | | 28.0 | | | | (11.7 | ) |
| Curtailments | | | (12.3 | ) | | | 1.5 | | | | (54.2 | ) |
| Termination benefits | | | 3.1 | | | | 8.1 | | | | — | |
| |
| Net postretirement benefit cost | | $ | 124.1 | | | $ | 134.3 | | | $ | (26.5 | ) |
| |
The cost of health care and life insurance benefits for active employees was $295.3 million in 2004, $273.0 million in 2003 and $241.7 million in 2002.
Summarized information about the changes in plan assets and benefit obligation is as follows:
| | | | | | | | | | | | | | | | | |
| | | | | | | | | | | Other | |
| | | | | | | | | | | Postretirement | |
| | | Pension Benefits | | | Benefits | |
| | | 2004 | | | 2003 | | | 2004 | | | 2003 | |
| |
| Fair value of plan assets at January 1 | | $ | 4,282.7 | | | $ | 3,105.4 | | | $ | 949.5 | | | $ | 678.8 | |
| Actual return on plan assets | | | 718.8 | | | | 1,033.3 | | | | 150.7 | | | | 223.7 | |
| Company contributions | | | 761.5 | | | | 641.3 | | | | 94.4 | | | | 63.5 | |
| Benefits paid from plan assets | | | (296.1 | ) | | | (425.3 | ) | | | (29.3 | ) | | | (16.5 | ) |
| Discontinued operations | | | — | | | | (80.5 | ) | | | — | | | | — | |
| Other | | | 14.0 | | | | 8.5 | | | | — | | | | — | |
| |
| Fair value of plan assets at December 31 | | $ | 5,480.9 | | | $ | 4,282.7 | | | $ | 1,165.3 | | | $ | 949.5 | |
| |
| Benefit obligation at January 1 | | $ | 5,071.9 | | | $ | 4,410.1 | | | $ | 1,840.4 | | | $ | 1,329.6 | |
| Subsidy under the Act | | | — | | | | — | | | | (169.0 | ) | | | — | |
| Service cost | | | 307.7 | | | | 263.4 | | | | 86.0 | | | | 68.3 | |
| Interest cost | | | 286.0 | | | | 260.6 | | | | 105.7 | | | | 90.4 | |
| Actuarial losses | | | 511.2 | | | | 624.0 | | | | 152.0 | | | | 486.9 | |
| Benefits paid | | | (327.1 | ) | | | (466.0 | ) | | | (65.1 | ) | | | (58.2 | ) |
| Plan amendments | | | 4.6 | | | | 27.3 | | | | (60.7 | ) | | | — | |
| Curtailments | | | — | | | | — | | | | — | | | | 19.4 | |
| Termination benefits | | | 18.4 | | | | 37.9 | | | | 3.1 | | | | 8.1 | |
| Discontinued operations | | | — | | | | (85.2 | ) | | | — | | | | (104.1 | ) |
| Other | | | 6.8 | | | | (0.2 | ) | | | — | | | | — | |
| |
| Benefit obligation at December 31 | | $ | 5,879.5 | | | $ | 5,071.9 | | | $ | 1,892.4 | | | $ | 1,840.4 | |
| |
53
The fair value of U.S. pension plan assets included in the preceding table was $3.5 billion in 2004 and $2.7 billion in 2003. The pension benefit obligation of U.S. plans included in this table was $3.7 billion in 2004 and $3.2 billion in 2003.
A reconciliation of the plans’ funded status to the net asset (liability) recognized at December 31 is as follows:
| | | | | | | | | | | | | | | | | |
| | | | | | | | | | | Other | |
| | | | | | | | | | | Postretirement | |
| | | Pension Benefits | | | Benefits | |
| | | 2004 | | | 2003 | | | 2004 | | | 2003 | |
| |
| Plan assets less than benefit obligation | | $ | (398.6 | ) | | $ | (789.2 | ) | | $ | (727.0 | ) | | $ | (890.9 | ) |
| Unrecognized net loss | | | 2,200.2 | | | | 2,155.0 | | | | 755.1 | | | | 879.5 | |
| Unrecognized plan changes | | | 99.2 | | | | 105.2 | | | | (201.3 | ) | | | (171.0 | ) |
| |
| Net asset (liability) | | $ | 1,900.8 | | | $ | 1,471.0 | | | $ | (173.2 | ) | | $ | (182.4 | ) |
| |
| Recognized as: | | | | | | | | | | | | | | | | |
| Other assets | | $ | 2,281.3 | | | $ | 1,789.9 | | | $ | — | | | $ | — | |
| Accrued and other current liabilities | | | (15.8 | ) | | | (24.4 | ) | | | (24.9 | ) | | | (24.9 | ) |
| Deferred income taxes and noncurrent liabilities | | | (387.7 | ) | | | (310.2 | ) | | | (148.3 | ) | | | (157.5 | ) |
| Accumulated other comprehensive loss | | | 23.0 | | | | 15.7 | | | | — | | | | — | |
| |
The weighted average asset allocations of the investment portfolio for the pension and other postretirement benefit plans at December 31 are as follows:
| | | | | | | | | | | | | | | | | |
| | | | | | | | | | | Other | |
| | | | | | | | | | | Postretirement | |
| | | Pension Benefits | | | Benefits | |
| | | 2004 | | | 2003 | | | 2004 | | | 2003 | |
| |
| U.S. equities | | | 41 | % | | | 41 | % | | | 55 | % | | | 56 | % |
| International equities | | | 30 | | | | 30 | | | | 27 | | | | 26 | |
| Fixed income investments | | | 21 | | | | 21 | | | | 16 | | | | 16 | |
| Real estate | | | 6 | | | | 7 | | | | 1 | | | | 1 | |
| Cash and other investments | | | 2 | | | | 1 | | | | 1 | | | | 1 | |
| |
| | | | 100 | % | | | 100 | % | | | 100 | % | | | 100 | % |
| |
The target investment portfolios for the Company’s pension plans are determined by country based on the nature of the liabilities and considering the demographic composition of the plan participants (average age, years of service and active versus retiree status) and in accordance with local regulations. The weighted average target allocation was 40% in U.S. equities, 30% in international equities, 22% in fixed income investments, 7% in real estate and other investments, and 1% in cash. Other investments include insurance contracts for certain international pension plans.
The target investment portfolio for the Company’s other postretirement benefit plans is allocated 45% to 60% in U.S. equities, 20% to 30% in international equities, 13% to 17% in fixed-income investments, and up to 8% in cash and other investments. The portfolio’s asset allocation is consistent with the long-term nature of the plans’ benefit obligation, and is well diversified among the asset classes in which the portfolio invests.
Contributions to the pension plans and other postretirement benefit plans during 2005 are expected to be $415.0 million and $106.3 million, respectively.
Expected benefit payments are as follows:
| | | | | | | | | |
| | | | | | | Other |
| | | | | | | Postretirement |
| | | Pension Benefits | | Benefits |
| |
| 2005 | | $ | 203.5 | | | $ | 76.9 | |
| 2006 | | | 231.2 | | | | 83.6 | |
| 2007 | | | 241.0 | | | | 90.4 | |
| 2008 | | | 263.6 | | | | 97.1 | |
| 2009 | | | 292.3 | | | | 104.6 | |
| 2010-2014 | | | 1,906.4 | | | | 650.3 | |
| |
Expected benefit payments are based on the same assumptions used to measure the benefit obligations and include estimated future employee service. Expected receipts of the subsidy under the Act, which are not reflected in the expected other postretirement benefit payments included in the preceding table, are as follows: 2006, $5.4 million; 2007, $6.1 million; 2008, $6.7 million; 2009, $7.4 million; 2010-2014, $47.9 million.
At December 31, 2004 and 2003, the accumulated benefit obligation was $4.5 billion and $3.8 billion, respectively, for all pension plans and $2.7 billion and $2.3 billion, respectively, for U.S. pension plans. The Company had a minimum pension liability of $24.6 million and $19.8 million at December 31, 2004 and 2003, respectively, representing the extent to which the accumulated benefit obligation exceeded plan assets for certain of the Company’s pension plans.
For pension plans with benefit obligations in excess of plan assets at December 31, 2004 and 2003, the fair value of plan assets was $1.1 billion and $3.4 billion, respectively, and the benefit obligation was $1.8 billion and $4.2 billion, respectively. For those plans with accumulated benefit obligations in excess of plan assets at December 31, 2004 and 2003, the fair value of plan assets was $106.0 million and $92.2 million, respectively, and the accumulated benefit obligation was $393.9 million and $327.2 million, respectively.
Unrecognized net loss amounts reflect experience differentials primarily relating to differences between expected and actual returns on plan assets as well as the effects of changes in actuarial assumptions. Unrecognized net loss amounts in excess of certain thresholds are amortized into net pension and other postretirement benefit cost over the average remaining service life of employees. Amortization of unrecognized net losses for the Company’s U.S. plans at December 31, 2004 is expected to increase net pension and other postretirement benefit cost by approximately $125.0 million annually from 2005 through 2009.
54
The Company reassesses its benefit plan assumptions on a regular basis. The weighted average assumptions used in determining pension plan information are as follows:
| | | | | | | | | | | | | |
| December 31 | | 2004 | | | 2003 | | | 2002 | |
| |
Net cost | | | | | | | | | | | | |
| |
| Discount rate | | | 5.65 | % | | | 5.90 | % | | | 6.40 | % |
| Expected rate of return on plan assets | | | 7.70 | | | | 7.70 | | | | 8.90 | |
| Salary growth rate | | | 4.1 | | | | 4.1 | | | | 4.2 | |
| |
Benefit obligation | | | | | | | | | | | | |
| |
| Discount rate | | | 5.40 | % | | | 5.65 | % | | | 5.90 | % |
| Salary growth rate | | | 4.1 | | | | 4.1 | | | | 4.2 | |
| |
Assumptions used in determining U.S. pension plan and other postretirement benefit plan information are as follows:
| | | | | | | | | | | | | |
| December 31 | | 2004 | | | 2003 | | | 2002 | |
| |
Net cost | | | | | | | | | | | | |
| |
| Discount rate | | | 6.25 | % | | | 6.50 | % | | | 7.25 | % |
| Expected rate of return on plan assets | | | 8.75 | | | | 8.75 | | | | 10.0 | |
| Salary growth rate | | | 4.5 | | | | 4.5 | | | | 4.5 | |
| |
Benefit obligation | | | | | | | | | | | | |
| |
| Discount rate | | | 6.00 | %* | | | 6.25 | % | | | 6.50 | % |
| Salary growth rate | | | 4.5 | | | | 4.5 | | | | 4.5 | |
| |
* 5.75% used for other postretirement benefit plans.
The expected rate of return for both the pension and other postretirement benefit plans represents the average rate of return to be earned on plan assets over the period the benefits included in the benefit obligation are to be paid and is determined on a country basis. In developing the expected rate of return within each country, the long-term historical returns data is considered as well as actual returns on the plan assets and other capital markets experience. Using this reference information, the long-term return expectations for each asset category and a weighted average expected return for each country’s target portfolio is developed, according to the allocation among those investment categories. The expected portfolio performance reflects the contribution of active management as appropriate. For 2005, the Company’s expected rate of return of 8.75% will remain unchanged from 2004 for its U.S. pension and other postretirement benefit plans.
The health care cost trend rate assumptions for other postretirement benefit plans are as follows:
| | | | | | | | | |
| December 31 | | 2004 | | | 2003 | |
| |
| Health care cost trend rate assumed for next year | | | 10.0 | % | | | 11.0 | % |
| Rate to which the cost trend rate is assumed to decline | | | 5.0 | % | | | 5.0 | % |
| Year that the rate reached the ultimate trend rate | | | 2013 | | | | 2013 | |
| |
A one percentage point change in the health care cost trend rate would have had the following effects:
| | | | | | | | | |
| | | One Percentage Point | |
| | | Increase | | | Decrease | |
| |
Effect on total service and interest cost components | | $ | 36.7 | | | $ | (28.8 | ) |
Effect on benefit obligation | | | 302.4 | | | | (243.5 | ) |
| |
16. Other (Income) Expense, Net
| | | | | | | | | | | | | |
| Years Ended December 31 | | 2004 | | | 2003 | | | 2002 | |
| |
| Interest income | | $ | (300.1 | ) | | $ | (308.7 | ) | | $ | (415.1 | ) |
| Interest expense | | | 293.7 | | | | 350.9 | | | | 390.6 | |
| Exchange gains | | | (18.4 | ) | | | (28.4 | ) | | | (7.8 | ) |
| Minority interests | | | 154.2 | | | | 168.7 | | | | 214.2 | |
| Other, net | | | (473.4 | ) | | | (385.7 | ) | | | (77.4 | ) |
| |
| | | $ | (344.0 | ) | | $ | (203.2 | ) | | $ | 104.5 | |
| |
Minority interests include third parties’ share of exchange gains and losses arising from translation of the financial statements into U.S. dollars. Reduced minority interests in 2004 and 2003 is attributable to the effect of the Banyu shares acquisitions. (See Note 5.)
Other, net in 2004 reflects the $176.8 million gain from the sale of the Company’s 50-percent equity stake in its European joint venture with Johnson & Johnson. The increase in other, net in 2003 primarily reflects an $84.0 million gain on the sale ofAggrastatproduct rights in the United States and realized gains on the Company’s investment portfolios relating to the favorable interest rate environment.
Interest paid was $284.6 million in 2004, $359.4 million in 2003 and $401.4 million in 2002.
17. Taxes on Income
A reconciliation between the Company’s effective tax rate and the U.S. statutory rate is as follows:
| | | | | | | | | | | | | | | | | |
| | | 2004 | | | Tax Rate | |
| | | Amount | | | 2004 | | | 2003 | | | 2002 | |
| |
| U.S. statutory rate applied to income from continuing operations before taxes | | $ | 2,791.1 | | | | 35.0 | % | | | 35.0 | % | | | 35.0 | % |
| Differential arising from: | | | | | | | | | | | | | | | | |
| Foreign earnings | | | (794.9 | ) | | | (10.0 | ) | | | (10.2 | ) | | | (6.5 | ) |
| Tax exemption for Puerto Rico operations | | | (129.0 | ) | | | (1.6 | ) | | | (0.9 | ) | | | (0.9 | ) |
| State taxes | | | 101.5 | | | | 1.3 | | | | 1.7 | | | | 1.9 | |
| Other | | | 192.4 | | | | 2.4 | | | | 1.6 | | | | 0.1 | |
| |
| | | $ | 2,161.1 | | | | 27.1 | % | | | 27.2 | % | | | 29.6 | % |
| |
55
Domestic companies contributed approximately 30% in 2004, 34% in 2003 and 47% in 2002 to consolidated income from continuing operations before taxes.
Taxes on income from continuing operations consisted of:
| | | | | | | | | | | | | |
| Years Ended December 31 | | 2004 | | | 2003 | | | 2002 | |
| |
Current provision | | | | | | | | | | | | |
| Federal | | $ | 1,420.0 | | | $ | 1,464.2 | | | $ | 1,563.8 | |
| Foreign | | | 530.9 | | | | 611.3 | | | | 609.3 | |
| State | | | 161.3 | | | | 254.8 | | | | 296.3 | |
| |
| | | | 2,112.2 | | | | 2,330.3 | | | | 2,469.4 | |
| |
Deferred provision | | | | | | | | | | | | |
| Federal | | | 95.6 | | | | 21.3 | | | | 361.8 | |
| Foreign | | | (32.3 | ) | | | 96.5 | | | | (8.0 | ) |
| State | | | (14.4 | ) | | | 13.9 | | | | 33.7 | |
| |
| | | | 48.9 | | | | 131.7 | | | | 387.5 | |
| |
| | | $ | 2,161.1 | | | $ | 2,462.0 | | | $ | 2,856.9 | |
| |
Deferred income taxes at December 31 consisted of:
| | | | | | | | | | | | | | | | | |
| | | 2004 | | | 2003 | |
| | | Assets | | | Liabilities | | | Assets | | | Liabilities | |
| |
| Other intangibles | | $ | 60.7 | | | $ | 286.1 | | | $ | 84.7 | | | $ | 306.0 | |
| Inventory related | | | 749.7 | | | | 473.0 | | | | 639.0 | | | | 355.2 | |
| Accelerated depreciation | | | — | | | | 1,479.7 | | | | — | | | | 1,353.9 | |
| Advance payment | | | 338.6 | | | | — | | | | 338.6 | | | | — | |
| Equity investments | | | 189.3 | | | | 548.7 | | | | 260.0 | | | | 565.6 | |
| Pensions and OPEB | | | 168.6 | | | | 811.9 | | | | 122.3 | | | | 602.0 | |
| Compensation related | | | 182.5 | | | | — | | | | 156.9 | | | | — | |
Vioxxlegal cost reserve | | | 205.2 | | | | — | | | | 35.7 | | | | — | |
| Net operating losses | | | 212.3 | | | | — | | | | 155.2 | | | | — | |
| Other | | | 1,144.4 | | | | 314.2 | | | | 1,042.5 | | | | 287.5 | |
| |
| Subtotal | | | 3,251.3 | | | | 3,913.6 | | | | 2,834.9 | | | | 3,470.2 | |
| Valuation allowance | | | — | | | | — | | | | (2.2 | ) | | | — | |
| |
| Total deferred taxes | | $ | 3,251.3 | | | $ | 3,913.6 | | | $ | 2,832.7 | | | $ | 3,470.2 | |
| |
| Net deferred tax liabilities | | | | | | $ | 662.3 | | | | | | | $ | 637.5 | |
| |
| Recognized as: | | | | | | | | | | | | | | | | |
| Prepaid expenses and taxes | | | | | | $ | (652.6 | ) | | | | | | $ | (590.8 | ) |
| Other assets | | | | | | | (10.5 | ) | | | | | | | (7.5 | ) |
| Income taxes payable | | | | | | | 156.2 | | | | | | | | 110.2 | |
| Deferred income taxes and noncurrent liabilities | | | | | | | 1,169.2 | | | | | | | | 1,125.6 | |
| |
Income taxes paid in 2004, 2003 and 2002 were $1.9 billion, $2.0 billion and $1.8 billion, respectively. Stock option exercises reduced income taxes paid in 2004, 2003 and 2002 by $121.7 million, $167.8 million and $82.5 million, respectively.
At December 31, 2004, foreign earnings of $20.1 billion and domestic earnings of $880.9 million have been retained indefinitely by subsidiary companies for reinvestment. No provision is made for income taxes that would be payable upon the distribution of such earnings. These earnings include income from manufacturing operations in Ireland, which were tax-exempt through 1990 and are taxed at 10% thereafter. In addition, the Company has subsidiaries operating in Puerto Rico and Singapore under tax incentive grants that expire in 2015 and 2026, respectively.
On October 22, 2004, the American Jobs Creation Act of 2004 (the AJCA) was signed into law. The AJCA creates a temporary incentive for U.S. multinationals to repatriate accumulated income earned outside the United States as of December 31, 2002. On December 21, 2004, the FASB issued FASB Staff Position, Accounting and Disclosure Guidance for the Foreign Earnings Repatriation Provision within the American Jobs Creation Act of 2004 (FSP No. 109-2). FSP No. 109-2 allows companies additional time to evaluate the effect of the law. Through December 31, 2004, the Company has not provided deferred taxes on foreign earnings because such earnings were intended to be indefinitely reinvested outside the United States. Whether the Company will ultimately take advantage of the temporary incentive depends on a number of factors including analyzing IRS guidance before a decision is made. The Company expects to be in a position to finalize its decisions regarding the temporary incentive during 2005. Until that time, the Company will make no change in its current intention to indefinitely reinvest accumulated earnings of its foreign subsidiaries. If it becomes apparent that the Company will repatriate all or any of these earnings in an amount of up to $15 billion, a one-time tax charge to the Company’s consolidated results of operations of up to approximately $1 billion could occur. The ultimate tax charge is dependent on a number of factors currently under consideration, including the passage of pending legislation, which contains certain technical corrections to the AJCA. The Company has not changed its intention to indefinitely reinvest accumulated earnings earned subsequent to December 31, 2002. No provision will be made for income taxes that would be payable upon the distribution of such earnings and it is not practicable to determine the amount of the related unrecognized deferred income tax liability.
The Company’s federal income tax returns have been audited through 1992. As previously disclosed, the IRS has substantially completed its examination of the Company’s tax returns for the years 1993 to 1996 and on April 28, 2004 issued a preliminary notice of deficiency with respect to a partnership transaction entered into in 1993. Specifically, the IRS is proposing to disallow certain royalty and other expenses claimed as deductions on the 1993-1996 tax returns of the Company. The Company anticipates receiving a similar notice for 1997-1999, shortly. If the IRS ultimately prevails in its positions, the Company’s income tax due for the years 1993-1999 would increase by approximately $970 million plus interest of approximately $490 million. The IRS will likely make similar claims for years subsequent to 1999 in future audits with respect to this transaction. The potential disallowance for these later years, computed on a similar basis to the 1993-1999 disallowances, would be approximately $540 million plus interest of approximately $40 million. The IRS has proposed penalties on the Company with respect to all periods that have been examined and the Company anticipates the IRS would seek to impose penalties on all other periods.
The Company vigorously disagrees with the proposed adjustments and intends to aggressively contest this matter through applicable IRS and judicial procedures, as appropriate. Although the final resolution of the proposed adjustments is uncertain and involves unsettled areas of the law, based on currently available information, the Company has provided for the best estimate of the probable tax liability for this matter. While the resolution of the issue may result in tax liabilities which are significantly higher or lower than the reserves established for this matter, management currently believes that the resolution will not have a material effect on the Company’s financial position or liquidity. However, an unfavorable resolution could have a material effect on the Company’s results of operations or cash flows in the quarter in which an adjustment is recorded or the tax is due or paid.
56
18. Earnings per Share
The weighted average common shares used in the computations of basic earnings per common share and earnings per common share assuming dilution (shares in millions) are as follows:
| | | | | | | | | | | | | |
| Years Ended December 31 | | 2004 | | | 2003 | | | 2002 | |
| |
| Average common shares outstanding | | | 2,219.0 | | | | 2,236.7 | | | | 2,257.5 | |
Common shares issuable(1) | | | 7.4 | | | | 16.4 | | | | 19.5 | |
| |
| Average common shares outstanding assuming dilution | | | 2,226.4 | | | | 2,253.1 | | | | 2,277.0 | |
| |
(1) Issuable primarily under stock-based compensation plans.
In 2004, 2003 and 2002, 233.1 million, 203.4 million and 149.9 million common shares issuable under the Company’s stock-based compensation plans were excluded from the computation of earnings per common share assuming dilution because the effect would have been antidilutive.
19. Comprehensive Income
The components of Other comprehensive (loss) income are as follows:
| | | | | | | | | | | | | |
| | | | | | | | | | | After | |
| | | Pretax(1) | | | Tax | | | Tax | |
| |
Year Ended December 31, 2004 | | | | | | | | | | | | |
| |
Net unrealized loss on derivatives | | $ | (117.8 | ) | | $ | 48.2 | | | $ | (69.6 | ) |
Net loss realization | | | 64.2 | | | | (26.3 | ) | | | 37.9 | |
| |
Derivatives | | | (53.6 | ) | | | 21.9 | | | | (31.7 | ) |
| |
Net unrealized gain on investments | | | (38.4 | ) | | | (9.6 | ) | | | (48.0 | ) |
Net income realization | | | (89.7 | ) | | | 36.8 | | | | (52.9 | ) |
| |
Investments | | | (128.1 | ) | | | 27.2 | | | | (100.9 | ) |
| |
Minimum pension liability | | | (7.2 | ) | | | 2.3 | | | | (4.9 | ) |
| |
Cumulative translation adjustment relating to equity investees | | | 40.2 | | | | (14.1 | ) | | | 26.1 | |
| |
| | | $ | (148.7 | ) | | $ | 37.3 | | | $ | (111.4 | ) |
| |
Year Ended December 31, 2003 | | | | | | | | | | | | |
| |
| Net unrealized loss on derivatives | | $ | (87.6 | ) | | $ | 35.9 | | | $ | (51.7 | ) |
| Net loss realization | | | 51.5 | | | | (21.1 | ) | | | 30.4 | |
| |
| Derivatives | | | (36.1 | ) | | | 14.8 | | | | (21.3 | ) |
| |
| Net unrealized gain on investments | | | 105.0 | | | | (33.8 | ) | | | 71.2 | |
| Net income realization | | | (114.3 | ) | | | (3.2 | ) | | | (117.5 | ) |
| |
| Investments | | | (9.3 | ) | | | (37.0 | ) | | | (46.3 | ) |
| |
| Minimum pension liability | | | 424.5 | | | | (192.6 | ) | | | 231.9 | |
| |
| | | $ | 379.1 | | | $ | (214.8 | ) | | $ | 164.3 | |
| |
Year Ended December 31, 2002 | | | | | | | | | | | | |
| |
| Net unrealized loss on derivatives | | $ | (31.8 | ) | | $ | 13.0 | | | $ | (18.8 | ) |
| Net income realization | | | (2.0 | ) | | | 0.8 | | | | (1.2 | ) |
| |
| Derivatives | | | (33.8 | ) | | | 13.8 | | | | (20.0 | ) |
| |
| Net unrealized gain on investments | | | 128.6 | | | | 24.5 | | | | 153.1 | |
| Net income realization | | | (86.6 | ) | | | 6.6 | | | | (80.0 | ) |
| |
| Investments | | | 42.0 | | | | 31.1 | | | | 73.1 | |
| |
| Minimum pension liability | | | (263.2 | ) | | | 100.7 | | | | (162.5 | ) |
| |
| | | $ | (255.0 | ) | | $ | 145.6 | | | $ | (109.4 | ) |
| |
(1) Net of applicable minority interest.
The components of Accumulated other comprehensive (loss) income are as follows:
| | | | | | | | | |
| December 31 | | 2004 | | | 2003 | |
| |
| Net unrealized loss on derivatives | | $ | (65.7 | ) | | $ | (34.0 | ) |
| Net unrealized gain on investments | | | 9.2 | | | | 110.1 | |
| Minimum pension liability | | | (15.5 | ) | | | (10.6 | ) |
| Cumulative translation adjustment relating to equity investees | | | 26.1 | | | | — | |
| |
| | | $ | (45.9 | ) | | $ | 65.5 | |
| |
At December 31, 2004, $37.6 million of the net unrealized loss on derivatives is associated with options maturing in the next 12 months, which hedge anticipated foreign currency denominated sales over that same period.
20. Segment Reporting
The Company’s operations are principally managed on a products basis. The Merck Pharmaceutical segment includes products marketed either directly or through joint ventures. These products consist of therapeutic and preventive agents, sold by prescription, for the treatment of human disorders. Merck sells these human health products primarily to drug wholesalers and retailers, hospitals, government agencies and managed health care providers such as health maintenance organizations and other institutions.
All Other includes other non-reportable human and animal health segments. Revenues and profits for these segments are as follows:
| | | | | | | | | | | | | |
| | | Merck | | | | | | | |
| | | Pharm- | | | All | | | | |
| | | aceutical | | | Other | | | Total | |
| |
Year Ended December 31, 2004 | | | | | | | | | | | | |
| |
Segment revenues | | $ | 21,493.5 | | | $ | 1,221.2 | | | $ | 22,714.7 | |
Segment profits | | | 13,507.1 | | | | 1,184.5 | | | | 14,691.6 | |
Included in segment profits: | | | | | | | | | | | | |
Equity income from affiliates | | | 512.8 | | | | 307.7 | | | | 820.5 | |
Depreciation and amortization | | | (151.8 | ) | | | (4.3 | ) | | | (156.1 | ) |
| |
Year Ended December 31, 2003 | | | | | | | | | | | | |
| |
| Segment revenues | | $ | 21,038.1 | | | $ | 1,218.8 | | | $ | 22,256.9 | |
| Segment profits | | | 13,451.7 | | | | 1,131.4 | | | | 14,583.1 | |
| Included in segment profits: | | | | | | | | | | | | |
| Equity income from affiliates | | | 304.0 | | | | 245.8 | | | | 549.8 | |
| Depreciation and amortization | | | (143.5 | ) | | | (4.0 | ) | | | (147.5 | ) |
| |
Year Ended December 31, 2002 | | | | | | | | | | | | |
| |
| Segment revenues | | $ | 19,946.2 | | | $ | 1,244.5 | | | $ | 21,190.7 | |
| Segment profits | | | 12,868.0 | | | | 1,111.5 | | | | 13,979.5 | |
| Included in segment profits: | | | | | | | | | | | | |
| Equity income from affiliates | | | 203.0 | | | | 217.6 | | | | 420.6 | |
| Depreciation and amortization | | | (137.8 | ) | | | (3.9 | ) | | | (141.7 | ) |
| |
57
Segment profits are comprised of segment revenues less certain elements of materials and production costs and operating expenses, including components of equity income (loss) from affiliates and depreciation and amortization expenses. For internal management reporting presented to the chief operating decision maker, the Company does not allocate the vast majority of indirect production costs, research and development expenses and general and administrative expenses, as well as the cost of financing these activities. Separate divisions maintain responsibility for monitoring and managing these costs, including depreciation related to fixed assets utilized by these divisions and, therefore, they are not included in segment profits.
A reconciliation of total segment revenues to consolidated Sales is as follows:
| | | | | | | | | | | | | |
| Years Ended December 31 | | 2004 | | | 2003 | | | 2002 | |
| |
| Segment revenues | | $ | 22,714.7 | | | $ | 22,256.9 | | | $ | 21,190.7 | |
| Other revenues | | | 223.9 | | | | 229.0 | | | | 255.1 | |
| |
| | | $ | 22,938.6 | | | $ | 22,485.9 | | | $ | 21,445.8 | |
| |
Other revenues are primarily comprised of miscellaneous corporate revenues, sales related to divested products or businesses and other supply sales.
Sales(1) by category of the Company’s products were as follows:
| | | | | | | | | | | | | |
| | | 2004 | | | 2003 | | | 2002 | |
| |
| Atherosclerosis | | $ | 5,223.0 | | | $ | 5,077.9 | | | $ | 5,552.1 | |
| Hypertension/heart failure | | | 3,646.7 | | | | 3,421.6 | | | | 3,477.8 | |
| Osteoporosis | | | 3,159.6 | | | | 2,676.6 | | | | 2,243.1 | |
| Respiratory | | | 2,622.0 | | | | 2,009.4 | | | | 1,489.8 | |
Anti-inflammatory/analgesics(2) | | | 1,779.6 | | | | 2,677.3 | | | | 2,587.2 | |
| Anti-bacterial/anti-fungal | | | 1,200.9 | | | | 1,028.5 | | | | 821.0 | |
| Vaccines/biologicals | | | 1,036.1 | | | | 1,056.1 | | | | 1,028.3 | |
| Urology | | | 733.1 | | | | 605.5 | | | | 547.3 | |
| Ophthalmologicals | | | 726.5 | | | | 675.1 | | | | 621.5 | |
| Human immunodeficiency virus (HIV) | | | 255.5 | | | | 290.6 | | | | 294.3 | |
| Other | | | 2,555.6 | | | | 2,967.3 | | | | 2,783.4 | |
| |
| | | $ | 22,938.6 | | | $ | 22,485.9 | | | $ | 21,445.8 | |
| |
(1) Presented net of discounts and returns.
(2) Includes Vioxx, which was voluntarily withdrawn worldwide on September 30, 2004.
Other primarily includes sales of other human pharmaceuticals, pharmaceutical and animal health supply sales to the Company’s joint ventures and revenue from the Company’s relationship with AZLP, primarily relating to sales ofNexiumandPrilosec. Revenue from AZLP was $1.5 billion, $1.9 billion and $1.5 billion in 2004, 2003 and 2002, respectively.
Consolidated revenues by geographic area where derived are as follows:
| | | | | | | | | | | | | |
| Years Ended December 31 | | 2004 | | | 2003 | | | 2002 | |
| |
| United States | | $ | 13,472.0 | | | $ | 13,321.1 | | | $ | 13,156.6 | |
| Europe, Middle East and Africa | | | 5,440.8 | | | | 5,341.3 | | | | 4,707.7 | |
| Japan | | | 1,668.2 | | | | 1,600.9 | | | | 1,438.7 | |
| Other | | | 2,357.6 | | | | 2,222.6 | | | | 2,142.8 | |
| |
| | | $ | 22,938.6 | | | $ | 22,485.9 | | | $ | 21,445.8 | |
| |
A reconciliation of total segment profits to consolidated Income from continuing operations before taxes is as follows:
| | | | | | | | | | | | | |
| Years Ended December 31 | | 2004 | | | 2003 | | | 2002 | |
| |
| Segment profits | | $ | 14,691.6 | | | $ | 14,583.1 | | | $ | 13,979.5 | |
| Other profits | | | 24.6 | | | | 156.6 | | | | 197.9 | |
| Adjustments | | | 481.3 | | | | 453.5 | | | | 432.3 | |
| Unallocated: | | | | | | | | | | | | |
| Interest income | | | 300.1 | | | | 308.7 | | | | 415.1 | |
| Interest expense | | | (293.7 | ) | | | (350.9 | ) | | | (390.6 | ) |
| Equity income (loss) from affiliates | | | 187.7 | | | | (75.6 | ) | | | 224.1 | |
| Depreciation and amortization | | | (1,294.6 | ) | | | (1,166.7 | ) | | | (1,089.5 | ) |
| Research and development | | | (4,010.2 | ) | | | (3,279.9 | ) | | | (2,677.2 | ) |
| Other expenses, net | | | (2,112.3 | ) | | | (1,577.2 | ) | | | (1,439.9 | ) |
| |
| | | $ | 7,974.5 | | | $ | 9,051.6 | | | $ | 9,651.7 | |
| |
Other profits are primarily comprised of miscellaneous corporate profits as well as operating profits related to divested products or businesses and other supply sales. Adjustments represent the elimination of the effect of double counting certain items of income and expense. Equity income (loss) from affiliates includes taxes paid at the joint venture level and a portion of equity income that is not reported in segment profits. Other expenses, net, include expenses from corporate and manufacturing cost centers and other miscellaneous income (expense), net.
Property, plant and equipment, net by geographic area where located is as follows:
| | | | | | | | | | | | | |
| December 31 | | 2004 | | | 2003 | | | 2002 | |
| |
| United States | | $ | 10,712.9 | | | $ | 10,383.3 | | | $ | 10,757.7 | |
| Europe, Middle East and Africa | | | 2,012.8 | | | | 1,846.3 | | | | 1,659.7 | |
| Japan | | | 605.8 | | | | 599.1 | | | | 499.8 | |
| Other | | | 1,382.2 | | | | 1,340.3 | | | | 1,278.4 | |
| |
| | | $ | 14,713.7 | | | $ | 14,169.0 | | | $ | 14,195.6 | |
| |
The Company does not disaggregate assets on a products and services basis for internal management reporting and, therefore, such information is not presented.
58
Management’s Report
Management’s Responsibility For Financial Statements
Responsibility for the integrity and objectivity of the Company’s financial statements rests with management. The financial statements report on management’s stewardship of Company assets. These statements are prepared in conformity with generally accepted accounting principles and, accordingly, include amounts that are based on management’s best estimates and judgments. Nonfinancial information included in the Annual Report has also been prepared by management and is consistent with the financial statements.
To assure that financial information is reliable and assets are safeguarded, management maintains an effective system of internal controls and procedures, important elements of which include: careful selection, training and development of operating and financial managers; an organization that provides appropriate division of responsibility; and communications aimed at assuring that Company policies and procedures are understood throughout the organization. A staff of internal auditors regularly monitors the adequacy and application of internal controls on a worldwide basis.
To ensure that personnel continue to understand the system of internal controls and procedures, and policies concerning good and prudent business practices, the Company periodically conducts the Management’s Stewardship Program for key management and financial personnel. This program reinforces the importance and understanding of internal controls by reviewing key corporate policies, procedures and systems. In addition, the Company has compliance programs, including an ethical business practices program to reinforce the Company’s long-standing commitment to high ethical standards in the conduct of its business.
The financial statements and other financial information included in the Annual Report fairly present, in all material respects, the Company’s financial condition, results of operations and cash flows. Our formal certification to the Securities and Exchange Commission is included in the Company’s Form 10-K filing.
Management’s Report on Internal Control Over Financial Reporting
Management is responsible for establishing and maintaining adequate internal control over financial reporting, as such term is defined in Exchange Act Rule 13a-15(f). Management conducted an evaluation of the effectiveness of internal control over financial reporting based on the framework inInternal Control–Integrated Frameworkissued by the Committee of Sponsoring Organizations of the Treadway Commission (COSO). Based on this evaluation, management concluded that internal control over financial reporting was effective as of December 31, 2004 based on criteria inInternal Control–Integrated Frameworkissued by COSO. Management’s assessment of the effectiveness of internal control over financial reporting as of December 31, 2004 has been audited by PricewaterhouseCoopers LLP, an independent registered public accounting firm, and PricewaterhouseCoopers LLP has issued an attestation report on management’s assessment of the effectiveness of the Company’s internal control over financial reporting, which is included herein.
| | | |
| |  |
Raymond V. Gilmartin
Chairman, President and
Chief Executive Officer
| | Judy C. Lewent
Executive Vice President &
Chief Financial Officer
President, Human Health Asia |
Audit Committee’s Report
The Audit Committee, comprised of independent directors, met with the independent registered public accounting firm (the independent auditors), management and internal auditors to assure that all were carrying out their respective responsibilities. The Audit Committee discussed with and received a letter from the independent auditors confirming their independence. Both the independent auditors and the internal auditors had full access to the Committee, including regular meetings without management present.
The Audit Committee met with the independent auditors to discuss their fees and the scope and results of their audit work, including the adequacy of internal controls and the quality of financial reporting. The Committee also
discussed with the independent auditors their judgments regarding the quality and acceptability of the Company’s accounting principles, the clarity of its disclosures and the degree of aggressiveness or conservatism of its accounting principles and underlying estimates. The Audit Committee reviewed and discussed the audited financial statements with management and recommended to the Board of Directors that these financial statements be included in the Company’s Form 10-K filing with the Securities and Exchange Commission.
| | | |
Peter C. Wendell
Chairperson | | Thomas E. Shenk
Samuel O. Thier
Wendell P. Weeks |
| | |
| | | |
| Merck & Co., Inc. Annual Report 2004 | | 59 |
Report of Independent Registered Public Accounting Firm
To the Stockholders and the
Board of Directors of Merck & Co., Inc.:
We have completed an integrated audit of Merck & Co., Inc.’s 2004 consolidated financial statements and of its internal control over financial reporting as of December 31, 2004 and audits of its 2003 and 2002 consolidated financial statements in accordance with the standards of the Public Company Accounting Oversight Board (United States). Our opinions, based on our audits, are presented below.
Consolidated Financial Statements
In our opinion, the accompanying consolidated balance sheets and the related consolidated statements of income, of retained earnings, of comprehensive income and of cash flows present fairly, in all material respects, the financial position of Merck & Co., Inc. and its subsidiaries (the “Company”) at December 31, 2004 and 2003, and the results of their operations and their cash flows for each of the three years in the period ended December 31, 2004 in conformity with accounting principles generally accepted in the United States of America. These financial statements are the responsibility of the Company’s management. Our responsibility is to express an opinion on these financial statements based on our audits. We conducted our audits of these statements in accordance with the standards of the Public Company Accounting Oversight Board (United States). Those standards require that we plan and perform the audit to obtain reasonable assurance about whether the financial statements are free of material misstatement. An audit of financial statements includes examining, on a test basis, evidence supporting the amounts and disclosures in the financial statements, assessing the accounting principles used and significant estimates made by management, and evaluating the overall financial statement presentation. We believe that our audits provide a reasonable basis for our opinion.
Internal Control Over Financial Reporting
Also, in our opinion, management’s assessment, included in the accompanying Management’s Report on Internal Control Over Financial Reporting that the Company maintained effective internal control over financial reporting as of December 31, 2004 based on criteria established inInternal Control–Integrated Frameworkissued by the Committee of Sponsoring Organizations of the Treadway Commission (COSO), is fairly stated, in all material respects, based on those criteria. Furthermore, in our opinion, the Company maintained, in all material respects, effective internal control over financial reporting as of December
31, 2004, based on criteria established inInternal Control–Integrated Frameworkissued by the COSO. The Company’s management is responsible for maintaining effective internal control over financial reporting and for its assessment of the effectiveness of internal control over financial reporting. Our responsibility is to express opinions on management’s assessment and on the effectiveness of the Company’s internal control over financial reporting based on our audit. We conducted our audit of internal control over financial reporting in accordance with the standards of the Public Company Accounting Oversight Board (United States). Those standards require that we plan and perform the audit to obtain reasonable assurance about whether effective internal control over financial reporting was maintained in all material respects. An audit of internal control over financial reporting includes obtaining an understanding of internal control over financial reporting, evaluating management’s assessment, testing and evaluating the design and operating effectiveness of internal control, and performing such other procedures as we consider necessary in the circumstances. We believe that our audit provides a reasonable basis for our opinions.
A company’s internal control over financial reporting is a process designed to provide reasonable assurance regarding the reliability of financial reporting and the preparation of financial statements for external purposes in accordance with generally accepted accounting principles. A company’s internal control over financial reporting includes those policies and procedures that (i) pertain to the maintenance of records that, in reasonable detail, accurately and fairly reflect the transactions and dispositions of the assets of the company; (ii) provide reasonable assurance that transactions are recorded as necessary to permit preparation of financial statements in accordance with generally accepted accounting principles, and that receipts and expenditures of the company are being made only in accordance with authorizations of management and directors of the company; and (iii) provide reasonable assurance regarding prevention or timely detection of unauthorized acquisition, use, or disposition of the company’s assets that could have a material effect on the financial statements.
Because of its inherent limitations, internal control over financial reporting may not prevent or detect misstatements. Also, projections of any evaluation of effectiveness to future periods are subject to the risk that controls may become inadequate because of changes in conditions, or that the degree of compliance with the policies or procedures may deteriorate.
| | | |
| | |  |
| | | |
| Florham Park, New Jersey | | PricewaterhouseCoopers LLP |
| February 22, 2005 | | |
Compensation and Benefits Committee’s Report
The Compensation and Benefits Committee, comprised of independent directors, approves compensation objectives and policies for all employees and sets compensation for the Company’s executive officers. The Committee seeks to ensure that rewards are closely linked to Company, division, team and individual performances. The Committee also seeks to ensure that compensation and benefits are set at levels that enable Merck to attract and retain highly qualified employees. The Committee views stock ownership as a vehicle to align the interests of employees with those of the Company’s stockholders. Consistent with the
long-term focus inherent in the Company’s R&D-based pharmaceutical business, it is the policy of the Committee to make a high proportion of executive officer compensation dependent on long-term performance and on enhancing stockholder value.
| | | |
Lawrence A. Bossidy
Chairperson | | William G. Bowen
Johnnetta B. Cole
William N. Kelley |
Merck & Co., Inc. Annual Report 2004
Selected Financial Data
Merck & Co., Inc. and Subsidiaries
($ in millions except per share amounts)
| | | | | | | | | | | | | | | | | | | | | | | | | |
| | | 2004(1) | | | 2003(2) | | | 2002 | | | 2001 | | | 2000 | | | 1999 | |
| |
| Results for Year: | | | | | | | | | | | | | | | | | | | | | | | | |
| Sales | | $ | 22,938.6 | | | $ | 22,485.9 | | | $ | 21,445.8 | | | $ | 21,199.0 | | | $ | 20,009.5 | | | $ | 17,294.4 | |
| Materials and production costs | | | 4,959.8 | | | | 4,436.9 | | | | 4,004.9 | | | | 3,722.6 | | | | 3,273.0 | | | | 3,032.0 | |
| Marketing and administrative expenses | | | 7,346.3 | | | | 6,394.9 | | | | 5,652.2 | | | | 5,700.6 | | | | 5,725.5 | | | | 4,808.1 | |
| Research and development expenses | | | 4,010.2 | | | | 3,279.9 | | | | 2,677.2 | | | | 2,456.4 | | | | 2,343.8 | | | | 2,068.3 | |
| Equity income from affiliates | | | (1,008.2 | ) | | | (474.2 | ) | | | (644.7 | ) | | | (685.9 | ) | | | (764.9 | ) | | | (762.0 | ) |
| Other (income) expense, net | | | (344.0 | ) | | | (203.2 | ) | | | 104.5 | | | | 57.2 | | | | 69.8 | | | | (222.1 | ) |
| Income from continuing operations before taxes | | | 7,974.5 | | | | 9,051.6 | | | | 9,651.7 | | | | 9,948.1 | | | | 9,362.3 | | | | 8,370.1 | |
| Taxes on income | | | 2,161.1 | | | | 2,462.0 | | | | 2,856.9 | | | | 2,894.9 | | | | 2,766.7 | | | | 2,578.1 | |
| Income from continuing operations | | | 5,813.4 | | | | 6,589.6 | | | | 6,794.8 | | | | 7,053.2 | | | | 6,595.6 | | | | 5,792.0 | |
| Income from discontinued operations, net of taxes | | | — | | | | 241.3 | | | | 354.7 | | | | 228.6 | | | | 226.1 | | | | 98.5 | |
| Net income | | | 5,813.4 | | | | 6,830.9 | | | | 7,149.5 | | | | 7,281.8 | | | | 6,821.7 | | | | 5,890.5 | |
| Basic earnings per common share | | | | | | | | | | | | | | | | | | | | | | | | |
| Continuing operations | | $ | 2.62 | | | $ | 2.95 | | | $ | 3.01 | | | $ | 3.08 | | | $ | 2.86 | | | $ | 2.47 | |
| Discontinued operations | | | — | | | | .11 | | | | .16 | | | | .10 | | | | .10 | | | | .04 | |
| Net income | | $ | 2.62 | | | $ | 3.05 | (3) | | $ | 3.17 | | | $ | 3.18 | | | $ | 2.96 | | | $ | 2.51 | |
| Earnings per common share assuming dilution | | | | | | | | | | | | | | | | | | | | | | | | |
| Continuing operations | | $ | 2.61 | | | $ | 2.92 | | | $ | 2.98 | | | $ | 3.04 | | | $ | 2.80 | | | $ | 2.41 | |
| Discontinued operations | | | — | | | | .11 | | | | .16 | | | | .10 | | | | .10 | | | | .04 | |
| Net income | | $ | 2.61 | | | $ | 3.03 | | | $ | 3.14 | | | $ | 3.14 | | | $ | 2.90 | | | $ | 2.45 | |
| Cash dividends declared | | | 3,329.1 | | | | 3,264.7 | | | | 3,204.2 | | | | 3,156.1 | | | | 2,905.7 | | | | 2,629.3 | |
| Cash dividends paid per common share | | $ | 1.49 | | | $ | 1.45 | | | $ | 1.41 | | | $ | 1.37 | | | $ | 1.21 | | | $ | 1.10 | |
| Capital expenditures | | | 1,726.1 | | | | 1,915.9 | | | | 2,128.1 | | | | 2,401.8 | | | | 2,471.0 | | | | 2,369.1 | |
| Depreciation | | | 1,258.7 | | | | 1,129.6 | | | | 1,067.5 | | | | 949.7 | | | | 803.0 | | | | 682.8 | |
| |
| Year-End Position: | | | | | | | | | | | | | | | | | | | | | | | | |
| Working capital | | $ | 1,731.1 | | | $ | 1,957.6 | | | $ | 2,011.2 | | | $ | 1,417.4 | | | $ | 3,643.8 | | | $ | 2,500.4 | |
| Property, plant and equipment (net) | | | 14,713.7 | | | | 14,169.0 | | | | 14,195.6 | | | | 13,103.4 | | | | 11,482.1 | | | | 9,676.7 | |
| Total assets | | | 42,572.8 | | | | 40,587.5 | (4) | | | 47,561.2 | | | | 44,021.2 | | | | 40,154.9 | | | | 35,933.7 | |
| Long-term debt | | | 4,691.5 | | | | 5,096.0 | | | | 4,879.0 | | | | 4,798.6 | | | | 3,600.7 | | | | 3,143.9 | |
| Stockholders’ equity | | | 17,288.2 | | | | 15,576.4 | (4) | | | 18,200.5 | | | | 16,050.1 | | | | 14,832.4 | | | | 13,241.6 | |
| |
| Financial Ratios: | | | | | | | | | | | | | | | | | | | | | | | | |
| Income from continuing operations as a % of sales | | | 25.3 | % | | | 29.3 | % | | | 31.7 | % | | | 33.3 | % | | | 33.0 | % | | | 33.5 | % |
| Net income as a % of average total assets | | | 14.0 | % | | | 14.9 | % | | | 15.5 | % | | | 17.3 | % | | | 17.9 | % | | | 17.4 | % |
| |
| Year-End Statistics: | | | | | | | | | | | | | | | | | | | | | | | | |
| Average common shares outstanding (millions) | | | 2,219.0 | | | | 2,236.7 | | | | 2,257.5 | | | | 2,288.3 | | | | 2,306.9 | | | | 2,349.0 | |
| Average common shares outstanding assuming dilution (millions) | | | 2,226.4 | | | | 2,253.1 | | | | 2,277.0 | | | | 2,322.3 | | | | 2,353.2 | | | | 2,404.6 | |
| Number of stockholders of record | | | 216,100 | | | | 233,000 | | | | 246,300 | | | | 256,200 | | | | 265,700 | | | | 280,500 | |
| Number of employees | | | 62,600 | | | | 63,200 | (4) | | | 77,300 | | | | 78,100 | | | | 69,300 | | | | 62,300 | |
| |
(1) Amounts for 2004 include the impact of the withdrawal of Vioxx.
(2) Amounts for 2003 include the impact of the implementation of a new distribution program for U.S. wholesalers and restructuring costs related to position eliminations.
(3) Amount does not add as a result of rounding.
(4) Decrease in 2003 primarily reflects the impact of the spin-off of Medco Health.
| | |
| | | |
| Merck & Co., Inc. Annual Report 2004 | | 61 |