
1
General Investor Presentation

2
Safe Harbor
This presentation and management’s public commentary contain certain forward-looking statements
that are subject to risks and uncertainties. These statements are based on management’s current
knowledge and estimates of factors affecting the Company’s operations. Statements in this
presentation that are forward-looking include, but are not limited to, the statements regarding
broadcast pacings, publishing advertising revenues, as well as any guidance related to the Company’s
financial performance.
Actual results may differ materially from those currently anticipated. Factors that could adversely affect
future results include, but are not limited to, downturns in national and/or local economies; a softening
of the domestic advertising market; world, national, or local events that could disrupt broadcast
television; increased consolidation among major advertisers or other events depressing the level of
advertising spending; the unexpected loss or insolvency of one or more major clients; the integration
of acquired businesses; changes in consumer reading, purchasing and/or television viewing patterns;
increases in paper, postage, printing, or syndicated programming costs; changes in television network
affiliation agreements; technological developments affecting products or the methods of distribution;
changes in government regulations affecting the Company’s industries; unexpected changes in
interest rates; and the consequences of any acquisitions and/or dispositions. The Company
undertakes no obligation to update any forward-looking statement, whether as a result of new
information, future events, or otherwise.

3
Agenda
§ Meredith Overview
§ Strategic Initiatives
§ Financial Overview

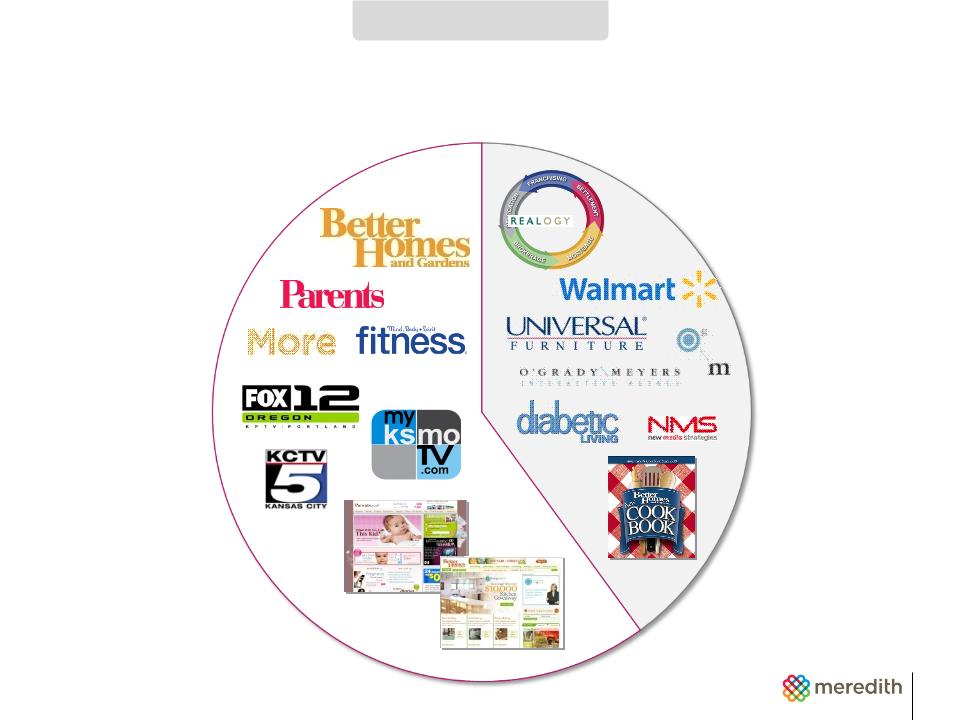
Broad Media and Marketing Footprint
MEREDITH OVERVIEW
NATIONAL BRANDS
Revenues: $900 million
Revenues: $900 million
LOCAL BRANDS
Revenues: $270 million
Revenues: $270 million
§ 25 Subscription titles
§ 150 Newsstand titles
§ 12 television stations
§ 10% of U.S. households
ONLINE & DIVERSIFIED
Revenues: $240 million
Revenues: $240 million
4
5
Balanced Revenue Mix
MEREDITH OVERVIEW
ADVERTISING
REVENUES:
55%
REVENUES:
55%
NON-ADVERTISING
REVENUES:
45%
REVENUES:
45%

6
6
2000
2007
2010
Forecast
Television
30%
34%
35%
Newspapers
29%
24%
18%
Radio
11%
9.4%
8.0%
Yellow Pages
8.8%
7.5%
6.6%
Consumer Magazines
6.8%
6.7%
6.0%
Trade Magazines
5.9%
5.3%
5.7%
Pure-Play Internet
3.6%
8.6%
14%
Out of Home
2.8%
3.7%
4.8%
Other
2.0%
1.0%
2.1%
TOTAL
100%
100%
100%
Source: Veronis Suhler Stevenson -September 2008
Industry Advertising Mix
MEREDITH OVERVIEW

7
Powerful National Consumer Connection
MEREDITH OVERVIEW
Source: Spring 1999 & 2009 MRI Reports
1999
2009
Better Homes and Gardens
34
39
Special Interest Media
18
21
Ladies’ Home Journal
16
12
Other
5
9
Subtotal
73
81
Family Circle
22
20
Parents
12
15
American Baby
5
7
Fitness
6
6
More
NA
2
Subtotal
45
50
TOTAL
118
131
+11%
Readership in Millions

8
Growing Local Consumer Connection
MEREDITH OVERVIEW
CY03
CY08
Market growth
10M HH
11M HH
News hours
240
380
Morning news viewership
330,000
420,000
Late news viewership
900,000
1 Million
Meredith Television Stations
Source: Nielsen

Growing Online and Video Portfolio
MEREDITH OVERVIEW
§ 2 Broadband channels
§ 2.7 million video clips
§ Video on demand
§ Custom production
§ 30+ websites
§ 15 million unique visitors
§ 170 million page views
§ 3.0 million online
subscriptions
subscriptions
§ 25+ websites
§ 5 million unique visitors
§ 33 million page views
§ Mobile platforms
BROADBAND
9

10
Agenda
§ Meredith Overview
§ Strategic Initiatives
– Gain market share across businesses
– Grow new revenue streams
– Exercise disciplined expense management
§ Financial Overview
STRATEGIC OVERVIEW

Powerful Brands Across Life Stages
GAIN MARKET SHARE
PAREN
THOOD/FAMILY
THOOD/FAMILY
HOME/SHELTER
11

12
Ad Category Concentration and Historical Growth
GAIN MARKET SHARE
*Meredith data
** TNS Media Intelligence, Jan.-Dec. 2001 & 2008
Calendar
2001*
Calendar
2008*
7-Year Cumulative
Industry Growth**
Industry Growth**
Food
12%
22%
+7%
Cosmetics
7%
11%
+5%
Pharmaceutical
7%
11%
+26%
Non-DTC
3%
5%
+27%
Retail
4%
5%
+13%
Home
24%
9%
-28%
Direct Response
17%
11%
-21%
Travel
5%
4%
-5%
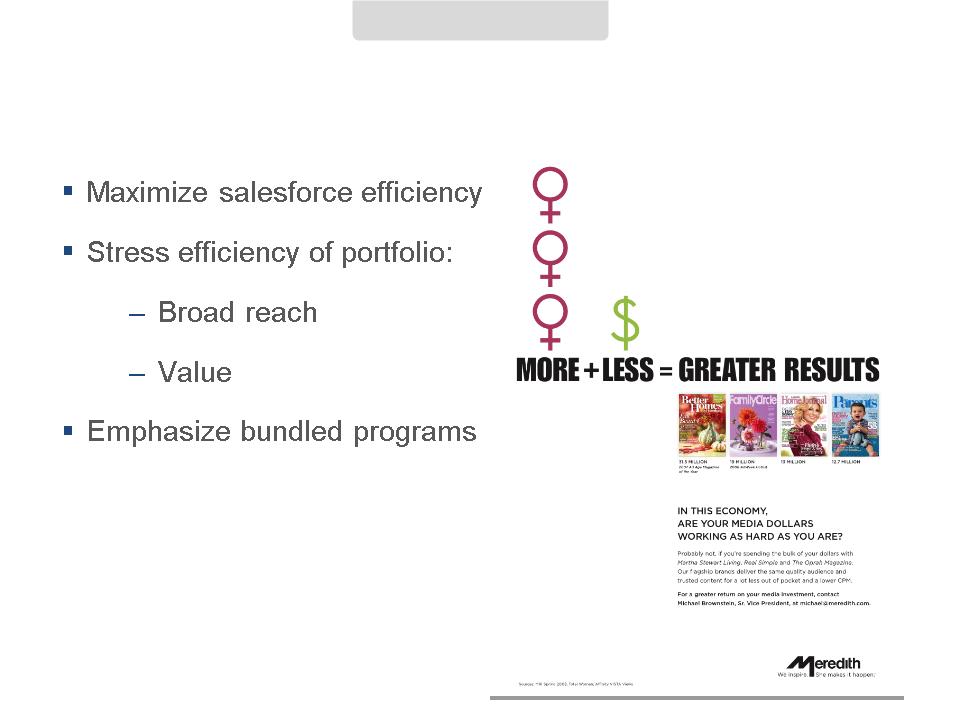
Corporate Sales Strategies
GAIN MARKET SHARE
13

14
Strategic Sales Strategies
§ Access more clients directly
§ Forge deeper senior-level ties
§ Sell solutions, not only ad space
§ Emphasize consumer insights
GAIN MARKET SHARE

15
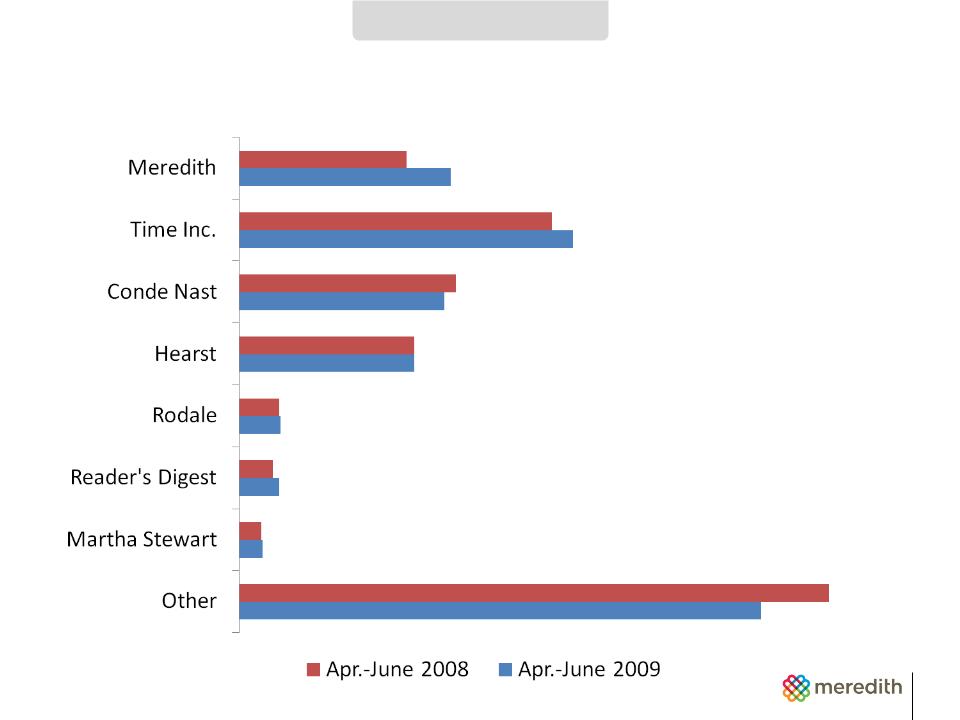
November 2007
November 2008
Time Inc.
74%
Meredith
72%
Conde Nast
67%
Time Inc.
71%
Hearst
61%
Conde Nast
57%
HFM
56%
Hearst
52%
Meredith
55%
HFM
51%
GAIN MARKET SHARE
Meredith is No.1 in Advertiser Perceptions
Source: Advertiser Intelligence Reports, November 2008
16
GAIN MARKET SHARE
Advertising Revenue Share: Meredith vs. Industry
12.8
10.1
20.2
18.9
12.4
13.1
10.6
10.6
2.4
2.5
2.4
2.0
1.4
1.3
31.6
35.7

Diverse Local Portfolio in Fast-Growing Markets
GAIN MARKET SHARE
STAND-ALONE STATIONS
DUOPOLIES/CLUSTERS
CORNE
RSTONES/BRANDED
PROGRAMS
RSTONES/BRANDED
PROGRAMS
17

18
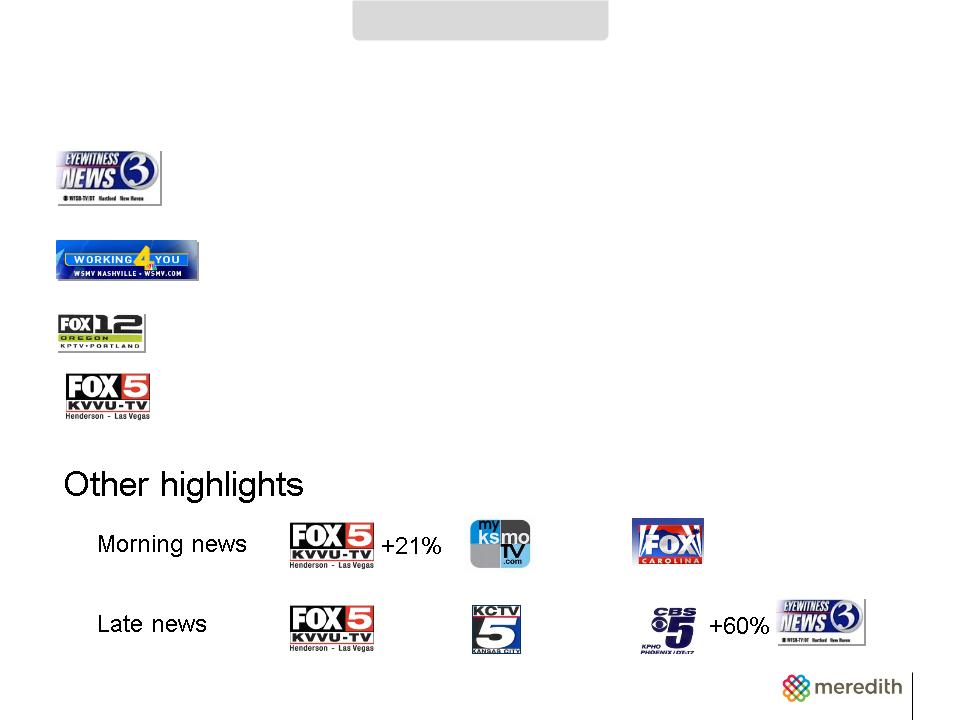
Strategic Initiatives to Grow Local Revenues
GAIN MARKET SHARE
19
Strong Growth in Ratings
#1 across all time periods
#1 in afternoon and evening news
#1 in morning news
#1 in morning news
GAIN MARKET SHARE
Source: Nielsen May 2009 Households shares
+14%
+200%
+57%
+14%
+18%

20
Agenda
§ Meredith Overview
§ Strategic Initiatives
– Gain market share across businesses
– Grow new revenue streams
– Exercise disciplined expense management
§ Financial Overview
STRATEGIC OVERVIEW
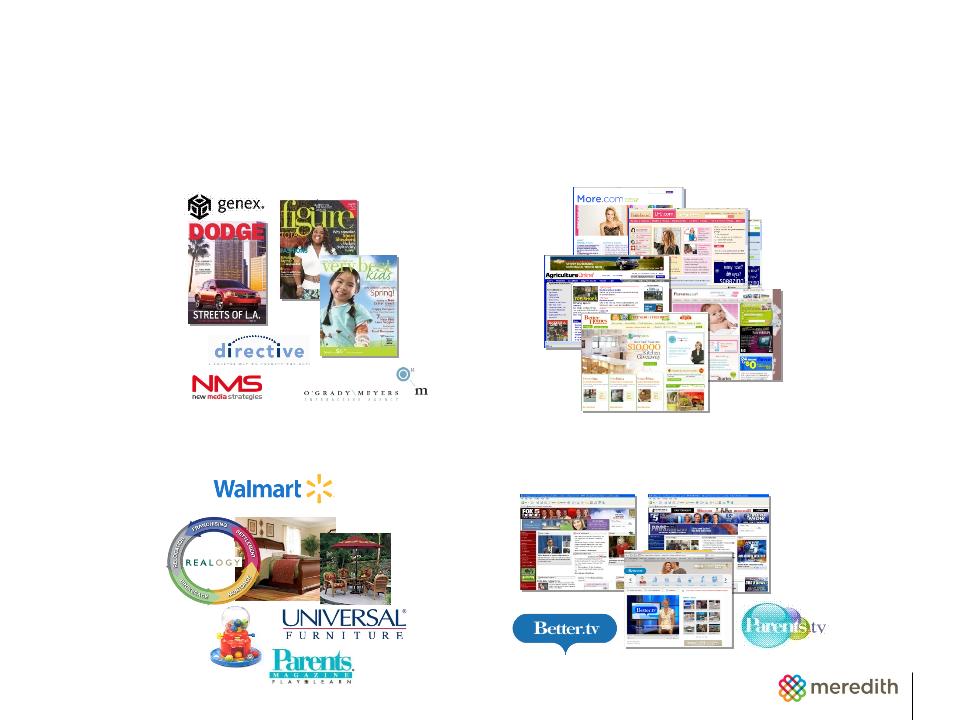
Growing New Revenue Streams
INTEGRATED MARKETING
INTERACTIVE MEDIA
TV, WEB,
BROADBAND/RETRANSMISSION
BROADBAND/RETRANSMISSION
BRAND LICENSING
21
22
Meredith Integrated Marketing
O’Grady Meyers
Genex
New Media Strategies
Directive
Big Communications
Meredith Integrated Marketing
FY05
FY06
FY07
FY08
Custom Publishing
Online CRM Strategy,
Branding & Promotions
Branding & Promotions
Web Site Design
and Marketing
and Marketing
Viral and Word of
Mouth Marketing
Mouth Marketing
Database Marketing
Healthcare
Marketing
Marketing
GROW NEW REVENUE STREAMS
Hyperfactory
FY09
Mobile Marketing

23
Transforming from a vendor to strategic partner
CUSTOM PUBLISHER
RELATIONSHIP MARKETER
• Brand Messaging
• Awareness/intent to purchase
• Responsive/executional
• Ink-on-paper/magazine
• Turn-key/flat-fee solutions
VENDOR
PARTNER
• Brand Marketing
• Calls to action
• Proactive & Strategic
• Robust online & offline capabilities
• Fees based on blended rates
GROW NEW REVENUE STREAMS
Meredith Integrated Marketing

24
The Better Homes and
Gardens Network
Gardens Network
Better Homes and Gardens
Better Recipes
Mixing Bowl
The Real Girls Network
Divine Caroline
Fitness
More
Ladies’ Home Journal
The Parents Network
Parents
American Baby
Family Circle
Boost Online Presence and Grow Revenues
GROW NEW REVENUE STREAMS
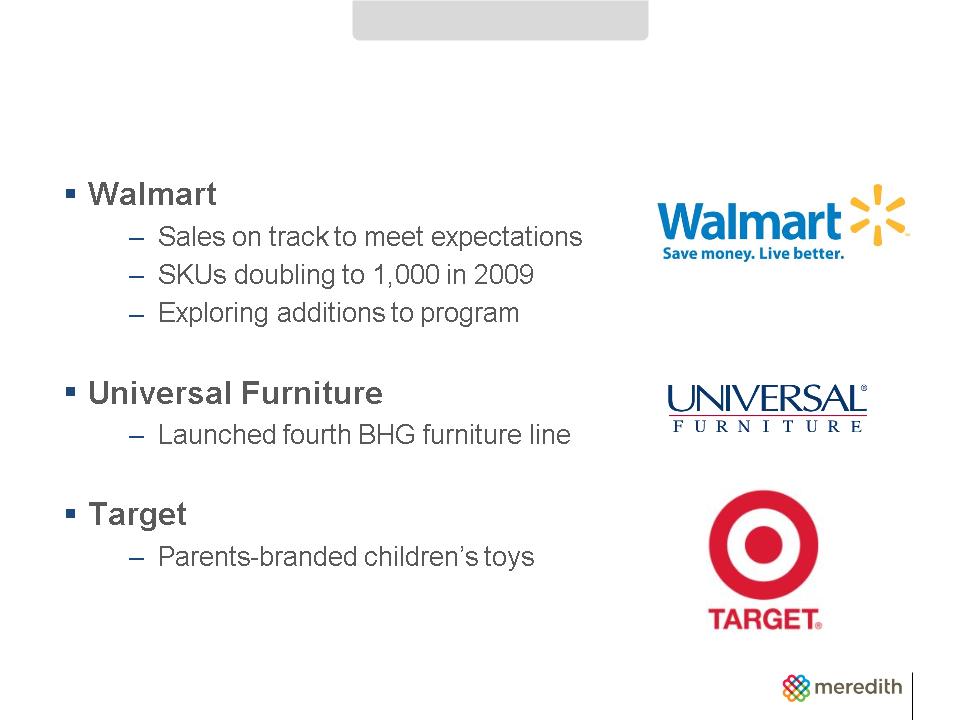
25
Grow Brand Licensing
GROW NEW REVENUE STREAMS
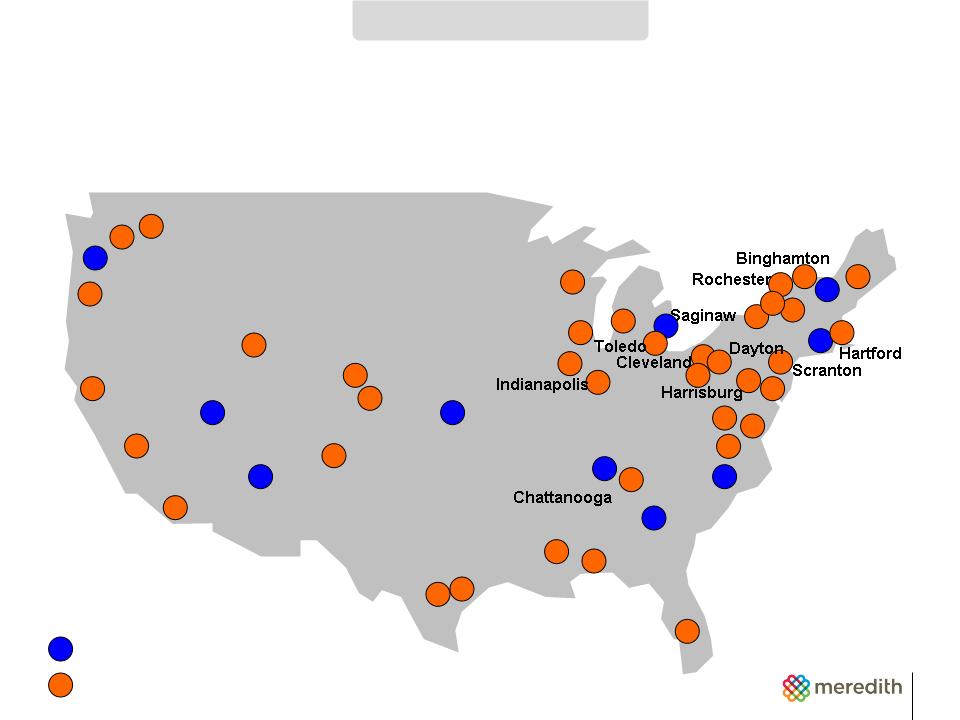
26
Kansas City
Phoenix
Nashville
Las Vegas
Greenville
Portland
Springfield
10 Meredith markets
38 Non-Meredith markets
Bakersfield
San Francisco
Norfolk
Philadelphia
Denver
San Diego
Green Bay
Milwaukee
Ft. Myers
Salt Lake City
Grand
Rapids
Rapids
Albuquerque
Providence
Buffalo
Portland
Spokane
Champaign
Jackson
Tri-Cities
Colorado
Springs
Springs
Yakima
Medford
Elmira
Dothan
Charlottesville
Atlanta
Houston
Austin
Columbus
Albany
Increase Presence for Better Show
GROW NEW REVENUE STREAMS

27
$4
$8
$20
(Actual)
(Actual)
(Estimate)
$ in millions
GROW NEW REVENUE STREAMS
Increase TV Retransmission Revenues

28
Agenda
§ Meredith Overview
§ Strategic Initiatives
– Gain market share across businesses
– Grow new revenue streams
– Exercise disciplined expense management
§ Financial Overview
STRATEGIC OVERVIEW

29
Actions Taken
DISCIPLINED EXPENSE MANAGEMENT
§ Departmental efficiencies
§ Reductions in workforce
§ Strategic vendor sourcing initiative
§ Reduced capital expenditures
§ Aggressive working capital management

30
Agenda
§ Meredith Overview
§ Strategic Initiatives
§ Financial Overview

31
Historical Operating Cash Flow
FINANCIAL OVERVIEW
$ in millions
$163
$171
$194
$211
$256
$181

32
Cash Flow Fiscal 2000 through 2009
FINANCIAL OVERVIEW
200
Stock Option Exercises
$2,000
Utilization of Cash
100
Net Debt
300
Capital Expenditures
600
Acquisitions, Net of Dispositions
$2,000
Available Cash
$1,800
Operating Cash Flow
300
Dividends
$ in millions
$700
Share Repurchases
33
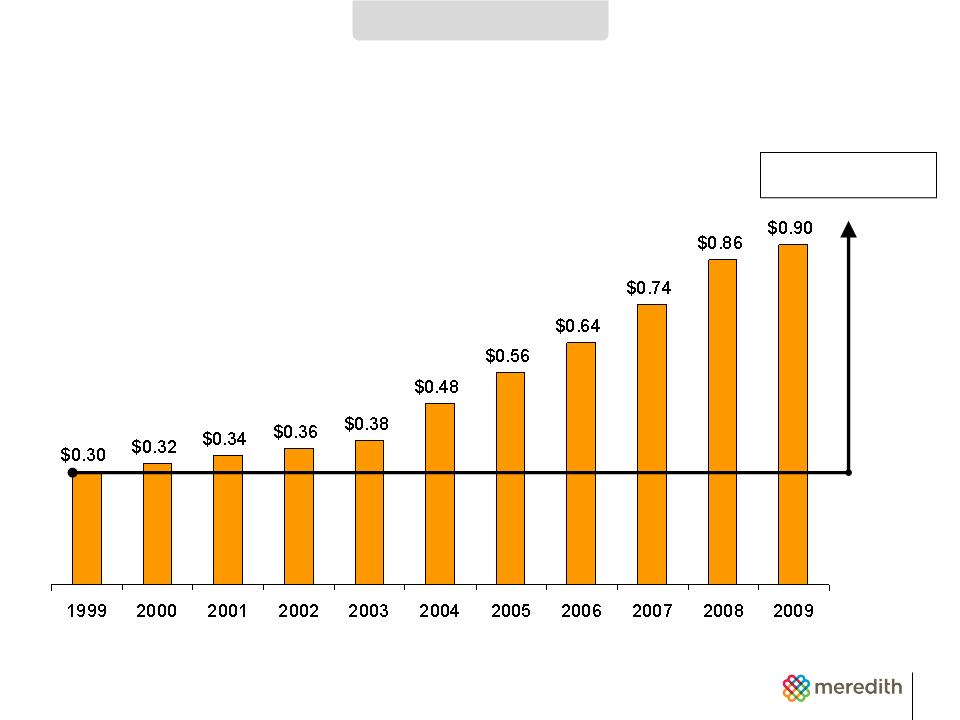
Calendar Year Dividends Per Share
FINANCIAL OVERVIEW
12% CAGR

34
Conservative Capital Structure
§ $380 million total debt
§ 5.4% cost of debt
§ 1.8x debt to EBITDA
FINANCIAL OVERVIEW
As of July 30, 2009

35
Current Valuation Metrics
§ Current dividend yield: 3.1%
§ EPS multiple: 13.9x
§ EBITDA multiple
to market capitalization: 5.9x
to market capitalization: 5.9x
§ EBITDA multiple
to total capitalization: 7.6x
to total capitalization: 7.6x
As of August 10, 2009 using trailing 4 quarters
actual results, excluding special items
actual results, excluding special items
FINANCIAL OVERVIEW

36
Summary
§ Vibrant and profitable media assets and brands
§ Growing online and video presence
§ Comprehensive Integrated Marketing capabilities
§ Growing brand licensing revenues
§ Strong financial foundation

37
General Investor Presentation