
1 UBS 39th Annual Global Media and Communications Conference December 6, 2011

Safe Harbor This presentation and management’s public commentary contain certain forward-looking statements that are subject to risks and uncertainties. These statements are based on management’s current knowledge and estimates of factors affecting the Company’s operations. Statements in this presentation that are forward- looking include, but are not limited to, the statements regarding broadcast and publishing advertising revenues, as well as any guidance related to the Company’s financial performance. Actual results may differ materially from those currently anticipated. Factors that could adversely affect future results include, but are not limited to, downturns in national and/or local economies; a softening of the domestic advertising market; world, national, or local events that could disrupt broadcast television; increased consolidation among major advertisers or other events depressing the level of advertising spending; the unexpected loss or insolvency of one or more major clients; the integration of acquired businesses; changes in consumer reading, purchasing and/or television viewing patterns; increases in paper, postage, printing, or syndicated programming costs; changes in television network affiliation agreements; technological developments affecting products or the methods of distribution; changes in government regulations affecting the Company’s industries; unexpected changes in interest rates; and the consequences of any acquisitions and/or dispositions. The Company undertakes no obligation to update any forward-looking statement, whether as a result of new information, future events, or otherwise. 2

National Media $900 Million Local Media $320 Million WORKING YOU WS M V -TV W SM V-DT NASHV IL L E • 13 TV stations reaching 10% of U.S. households • Top 25 markets of Atlanta, Phoenix, Portland • Daily nationally syndicated show 3 Marketing Services $180 Million • 80 million audience • 25 million web visitors • Growing licensing business • Leading business-to- business marketer • Experts in digital, social, mobile and database • Major clients include Kraft, Nestlè, Chrysler, Lowe’s About Meredith

Broad Capabilities Across Media Platforms Online: Meredith Women’s Network Magazines: Home, Family, Health & Well-being Consumer Events Custom Marketing Database Marketing Video Studios Brand Licensing Local Media

1. Strengthen our core business 2. Enhance our digital activities 3. Expand diversified sources of revenue 4. Execute acquisitions and investments 5. Return more cash to shareholders Key Strategic Initiatives + local media brands + marketing solutions + national media brands 5

Strengthen our Core Business + local media brands + marketing solutions + national media brands 6 • Execute food strategy – Launch of Recipe.com – Acquisition of EatingWell Media Group – Acquisition of Every Day with Rachael Ray • Diversify toward faster-growing advertising categories – Priorities include beauty, retail, entertainment, business and auto • Grow Meredith 360º integrated sales programs • Aggressive roll-out of Meredith Engagement Dividend National Media Group:

Strengthen our Core Business + local media brands + marketing solutions + national media brands 7 Local Media Group: • Increase non-political advertising market share • Maximize political advertising revenues • Expand digital platforms • Manage Peachtree TV

Enhance our Digital Capabilities + local media brands + marketing solutions + national media brands 8 • Grew online traffic – 29 million unique visitors • Increased online subscriptions • Tablets represent promising opportunity: – Strong (though early) consumer metrics: younger; richer; more engaged – Tremendous cost-savings potential – Meredith maximizing multi-channel distribution

Meredith Brand Licensing: • Renewed and expanded Walmart relationship through 2016 • Major product areas include: – Bedroom linens, bath towels – Dishware for kitchens, dining rooms – Home furnishings – Outdoor furniture, garden essentials Meredith Xcelerated Marketing: • Aligned capabilities under common brand • Invested in global firm Iris: – Offices in London, Shanghai. Singapore – Strength at digital, experiential and shopper marketing Expand Diversified Sources of Revenues + local media brands + marketing solutions + national media brands 9

Iris Saks Snowflake Video + local media brands + marketing solutions + national media brands 10 Video presentation

Acquisitions and Investment Priorities + local media brands + marketing solutions + national media brands 11 • Multi-platform National media brands that would provide access to new audiences and advertising categories • Opportunities to enhance the video content and distribution platforms of our current brands • Local media brands in faster growing markets that would add network and geographic diversity • Digital platforms that would significantly increase traffic • Smaller, tuck-in acquisitions that would complement current portfolio of media brands and marketing capabilities
Key Strategic Initiatives + local media brands + marketing solutions + national media brands 12 1. Strengthen our core business 2. Enhance our digital activities 3. Expand diversified sources of revenue 4. Execute acquisitions and investments 5. Return more cash to shareholders
Meredith’s Shareholder Value Proposition • Our view of Total Shareholder Return • Strong and durable ability to generate free cash flow • Great track record of returning cash to shareholders • Significant flexibility remains to: – Continue to invest in the business – Return more cash to shareholders over time • Illustrative view of Meredith’s Total Shareholder Return + local media brands + marketing solutions + national media brands 13

Total Shareholder Return Delivered Three Ways + local media brands + marketing solutions + national media brands Earnings Growth Free Cash Flow Yield Change in Valuation • Revenue growth • Margin improvement • Investments in business • Dividends • Share repurchases 1. 2. 3. • Growth expectations • Performance consistency • Financial policies • Portfolio changes 14
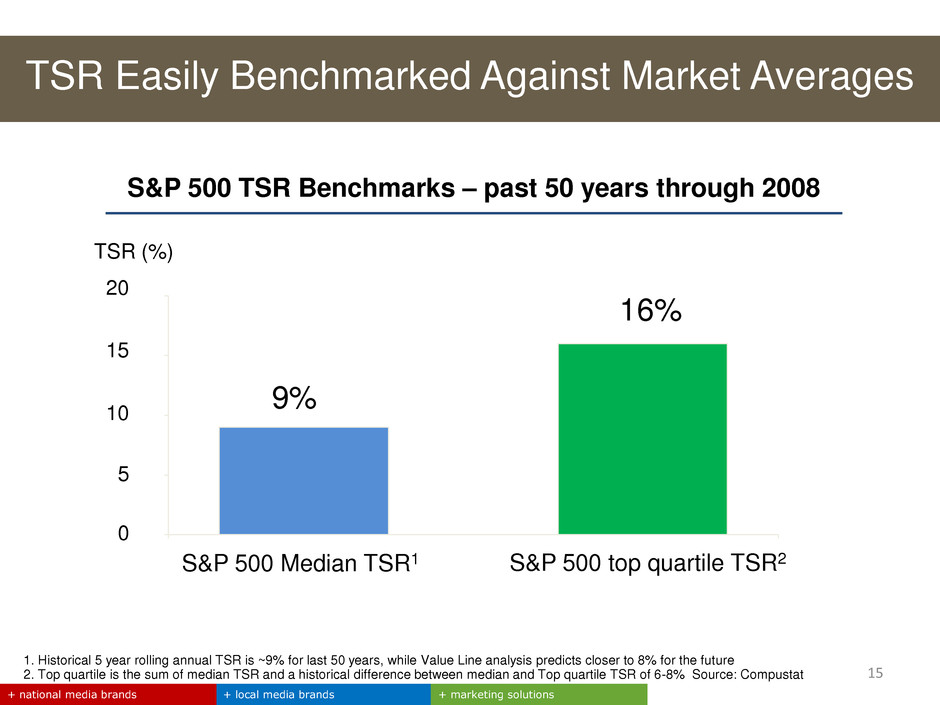
TSR (%) 5 20 15 10 0 16% 9% S&P 500 Median TSR1 S&P 500 top quartile TSR2 1. Historical 5 year rolling annual TSR is ~9% for last 50 years, while Value Line analysis predicts closer to 8% for the future 2. Top quartile is the sum of median TSR and a historical difference between median and Top quartile TSR of 6-8% Source: Compustat S&P 500 TSR Benchmarks – past 50 years through 2008 TSR Easily Benchmarked Against Market Averages + local media brands + marketing solutions + national media brands 15

+ local media brands + marketing solutions + national media brands + local media brands + marketi g solutions + national media brands Strong Free Cash Flow Generation: 2002-2011 $113 $134 $138 $147 $165 $168 $226 $157 $167 $185 FY02 FY03 FY04 FY05 FY06 FY07 FY08 FY09 FY10 FY11 5.6% CAGR $ in millions 16

$0.36 0.56 0.74 0.90 1.02 2003 2005 2007 2009 2011 2012 Historical 14% CAGR 1. Per share amount on an annualized basis beginning December 15, 2011 50% increase to $1.531 Increased Annual Dividend by 50%; Yield >5% + local media brands + marketing solutions + national media brands 17
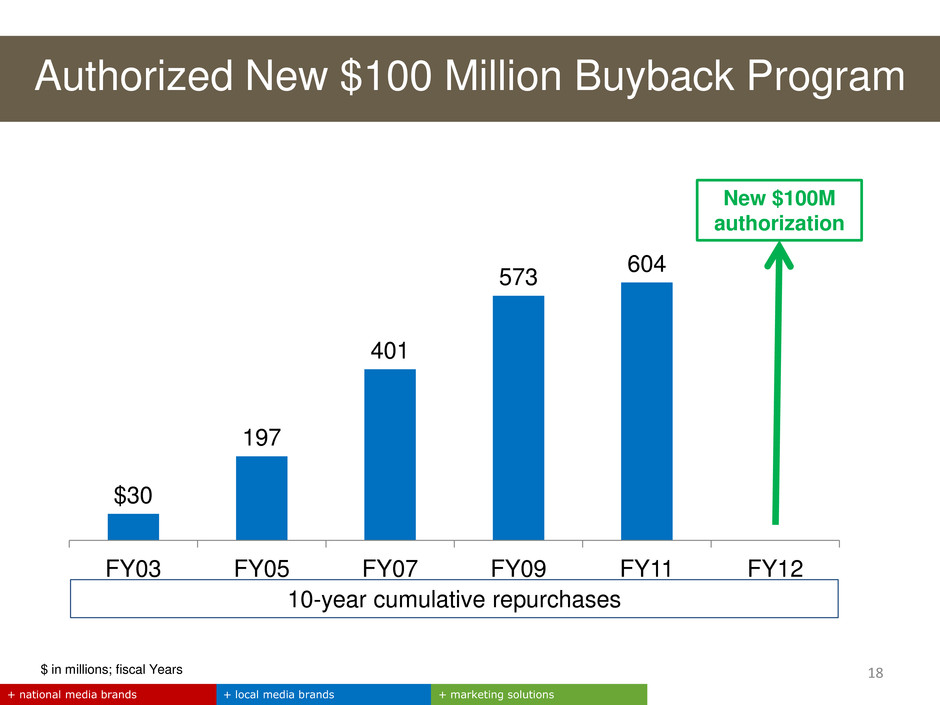
$30 197 401 573 604 FY03 FY05 FY07 FY09 FY11 FY12 $ in millions; fiscal Years Authorized New $100 Million Buyback Program + local media brands + marketing solutions + national media brands New $100M authorization 18 10-year cumulative repurchases

Cash Flow and Strategic Uses + local media brands + marketing solutions + national media brands FY 2009 FY 2010 FY 2011 FY 2011 Operating cash flow $ 181 $ 192 $ 215 $ 215 Capital expenditures (24) (25) (30) (30) Free cash flow $ 157 $ 167 $ 185 $ 185 Dividends 40 41 44 63 Cash available for: $ 117 $ 126 $ 141 $ 122 • Acquisitions • Share repurchases • Debt service Pro Forma for dividend 19
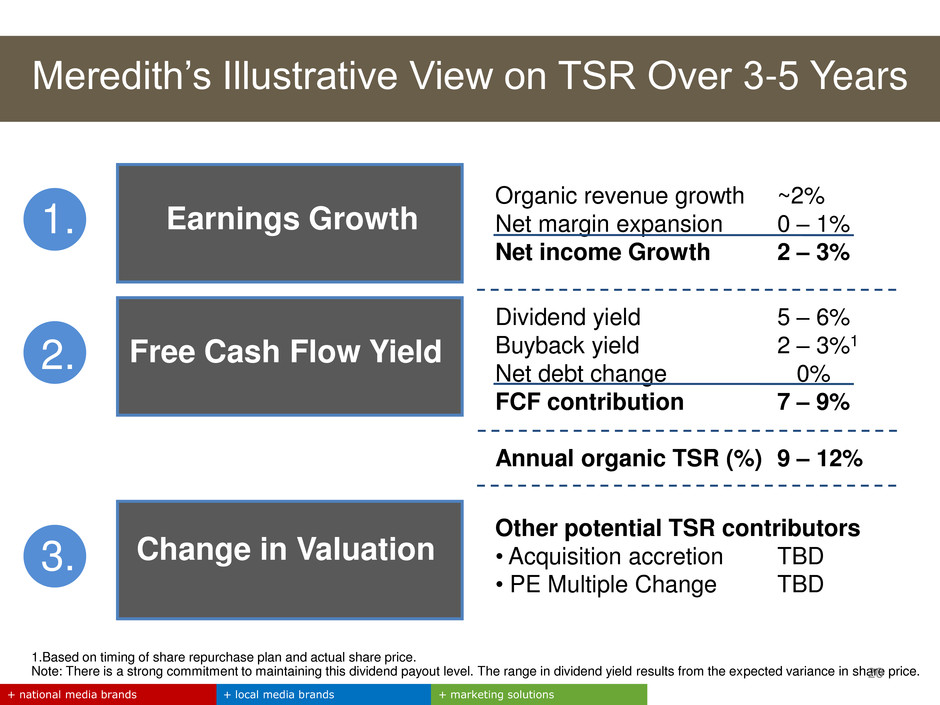
Organic revenue growth ~2% Net margin expansion 0 – 1% Net income Growth 2 – 3% 1.Based on timing of share repurchase plan and actual share price. Note: There is a strong commitment to maintaining this dividend payout level. The range in dividend yield results from the expected variance in share price. Meredith’s Illustrative View on TSR Over 3-5 Years + local media brands + marketing solutions + national media brands 1. 2. 3. Earnings Growth Free Cash Flow Yield Change in Valuation Other potential TSR contributors • Acquisition accretion TBD • PE Multiple Change TBD Dividend yield 5 – 6% Buyback yield 2 – 3%1 Net debt change 0% FCF contribution 7 – 9% Annual organic TSR (%) 9 – 12% 20

21 UBS 39th Annual Global Media and Communications Conference December 6, 2011