
Deutsche Bank 21st Annual Global Media, Internet and Telecom Conference • March 2013
Safe Harbor This presentation and management’s public commentary contain certain forward-looking statements that are subject to risks and uncertainties. These statements are based on management’s current knowledge and estimates of factors affecting the Company and its operations. Statements in this presentation that are forward-looking include, but are not limited to, the statements regarding advertising revenues and investment spending, along with the Company’s revenue and earnings per share outlook. Actual results may differ materially from those currently anticipated. Factors that could adversely affect future results include, but are not limited to, downturns in national and/or local economies; a softening of the domestic advertising market; world, national, or local events that could disrupt broadcast television; increased consolidation among major advertisers or other events depressing the level of advertising spending; the unexpected loss or insolvency of one or more major clients; the integration of acquired businesses; changes in consumer reading, purchasing and/or television viewing patterns; increases in paper, postage, printing, or syndicated programming costs; changes in television network affiliation agreements; technological developments affecting products or the methods of distribution; changes in government regulations affecting the Company’s industries; unexpected changes in interest rates; and the consequences of any acquisitions and/or dispositions. The Company undertakes no obligation to update any forward-looking statement, whether as a result of new information, future events, or otherwise. 2
+ local media brands + marketing solutions + national media brands Agenda Meredith Overview Key Initiatives: National Media Group Key Initiatives: Local Media Group Financial Strategy 3
1. Powerful media and marketing company: A) Trusted national brands and an unrivaled female reach B) Leading full-service global digital marketing agency C) Portfolio of highly-rated television stations in fast-growing markets 2. Experienced management team with a proven record of operational excellence and value creation 3. Strong stewards of capital, committed to Total Shareholder Return strategy 3 Things to Know about Meredith + local media brands + marketing solutions + national media brands 4
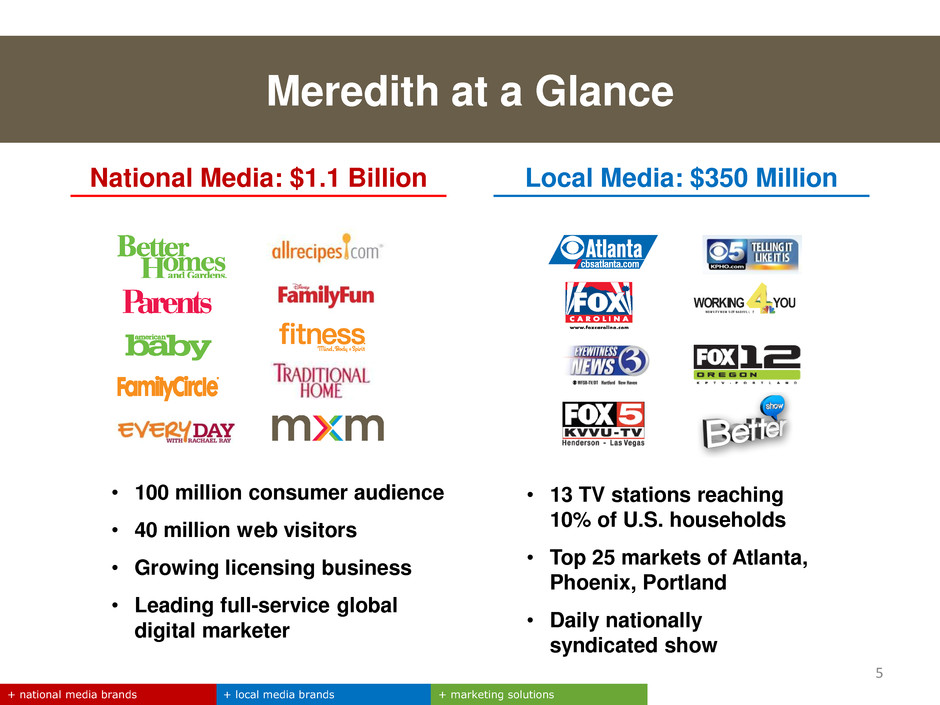
Meredith at a Glance + local media brands + marketing solutions + national media brands 5 National Media: $1.1 Billion Local Media: $350 Million WORKING YOU WS M V -TV W SM V-DT NASHV IL L E • 13 TV stations reaching 10% of U.S. households • Top 25 markets of Atlanta, Phoenix, Portland • Daily nationally syndicated show • 100 million consumer audience • 40 million web visitors • Growing licensing business • Leading full-service global digital marketer
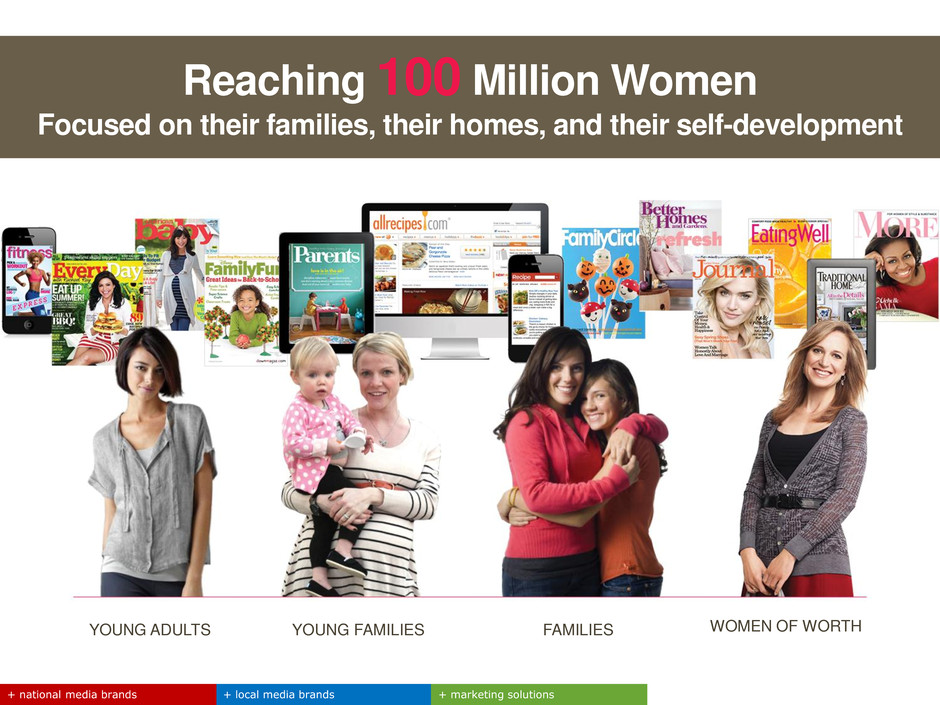
YOUNG ADULTS YOUNG FAMILIES FAMILIES WOMEN OF WORTH Reaching 100 Million Women Focused on their families, their homes, and their self-development + local media brands + marketing solutions + national media brands
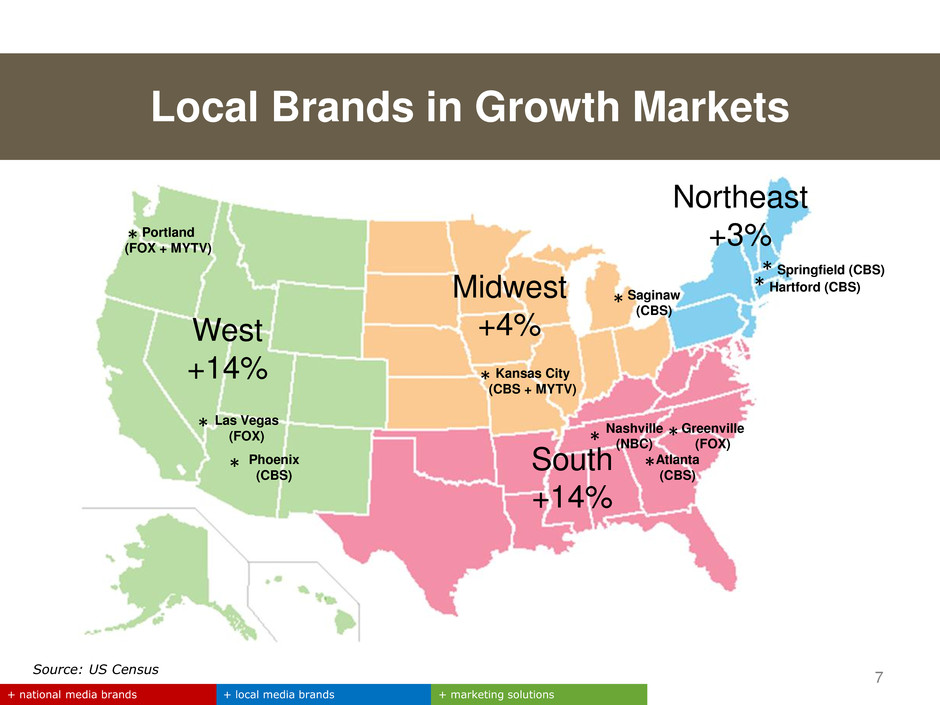
Local Brands in Growth Markets Source: US Census + local media brands + marketing solutions + national media brands West +14% Midwest +4% South +14% Northeast +3% Portland (FOX + MYTV) Las Vegas (FOX) Phoenix (CBS) Kansas City (CBS + MYTV) Saginaw (CBS) Atlanta (CBS) Nashville (NBC) Greenville (FOX) Springfield (CBS) Hartford (CBS) * * * * * * * * * * 7
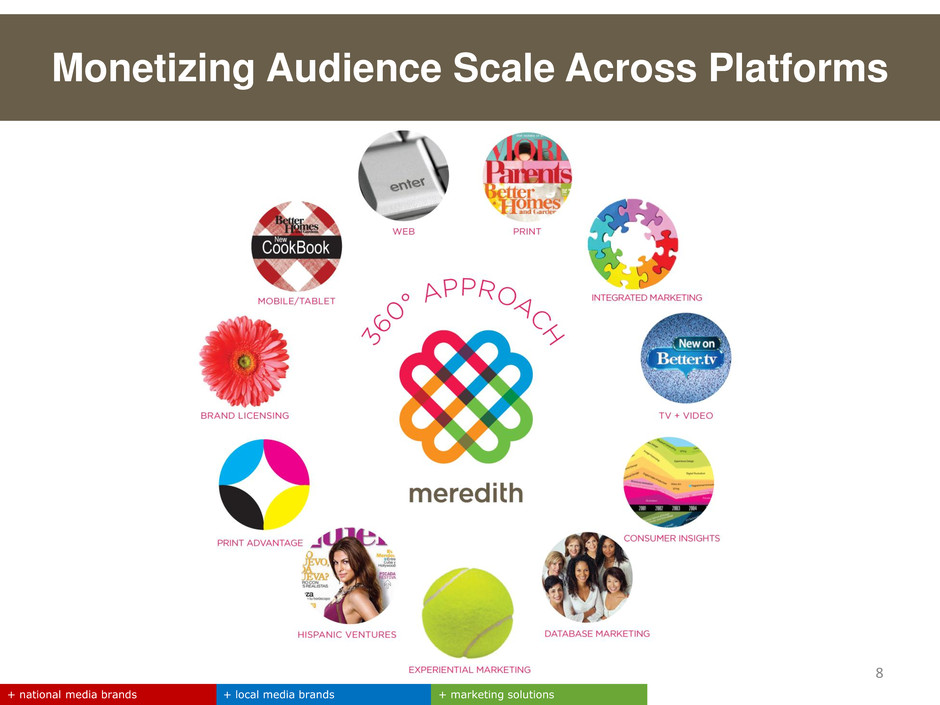
Monetizing Audience Scale Across Platforms + local media brands + marketing solutions + national media brands 8
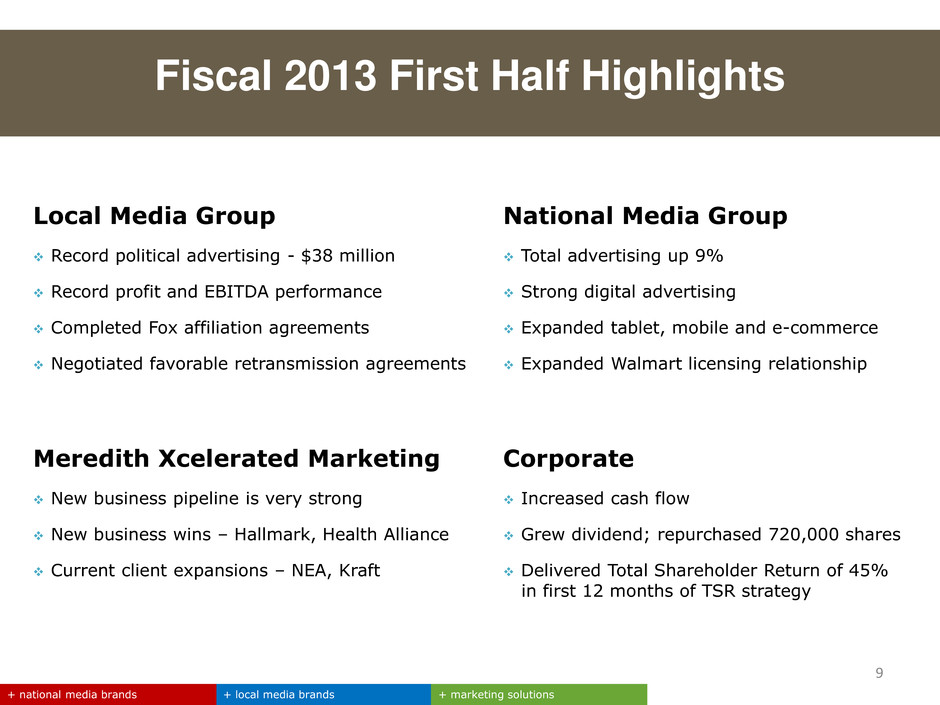
9 Fiscal 2013 First Half Highlights + local media brands + marketing solutions + national media brands National Media Group Total advertising up 9% Strong digital advertising Expanded tablet, mobile and e-commerce Expanded Walmart licensing relationship Meredith Xcelerated Marketing New business pipeline is very strong New business wins – Hallmark, Health Alliance Current client expansions – NEA, Kraft Corporate Increased cash flow Grew dividend; repurchased 720,000 shares Delivered Total Shareholder Return of 45% in first 12 months of TSR strategy Local Media Group Record political advertising - $38 million Record profit and EBITDA performance Completed Fox affiliation agreements Negotiated favorable retransmission agreements
10 + local media brands + marketing solutions + national media brands Agenda Meredith Overview Key Initiatives: National Media Group — Increase our consumer reach across platforms — Gain advertising market share — Grow brand licensing — Execute digital strategy — Maximize Meredith Xcelerated Marketing Key Initiatives: Local Media Group Financial Strategy
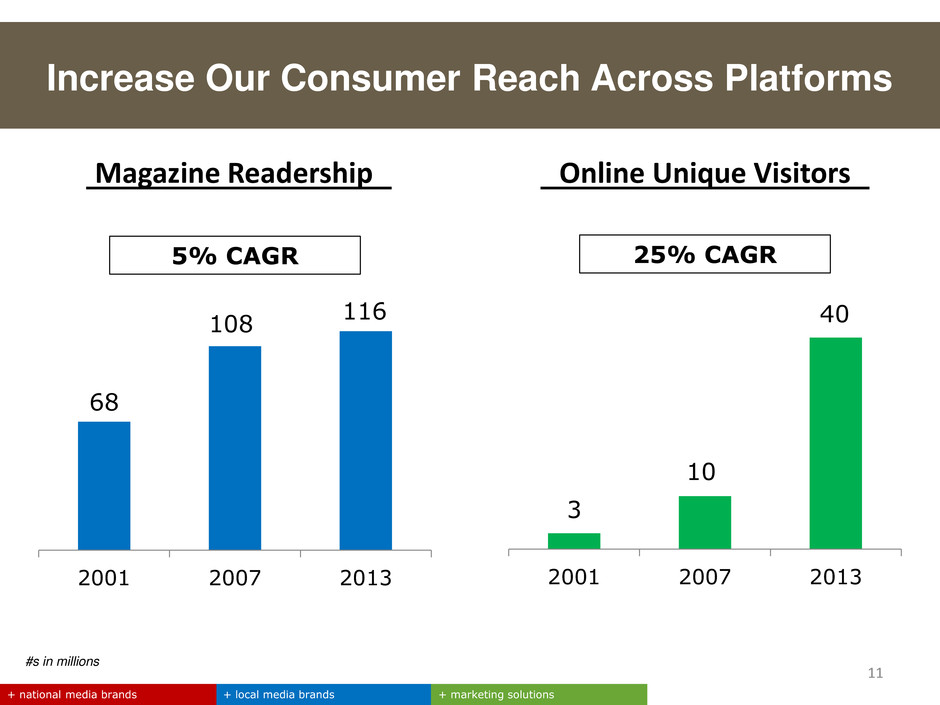
Increase Our Consumer Reach Across Platforms #s in millions + local media brands + marketing solutions + national media brands 11 3 10 40 2001 2007 2013 Magazine Readership Online Unique Visitors 68 108 116 2001 2007 2013 5% CAGR 25% CAGR
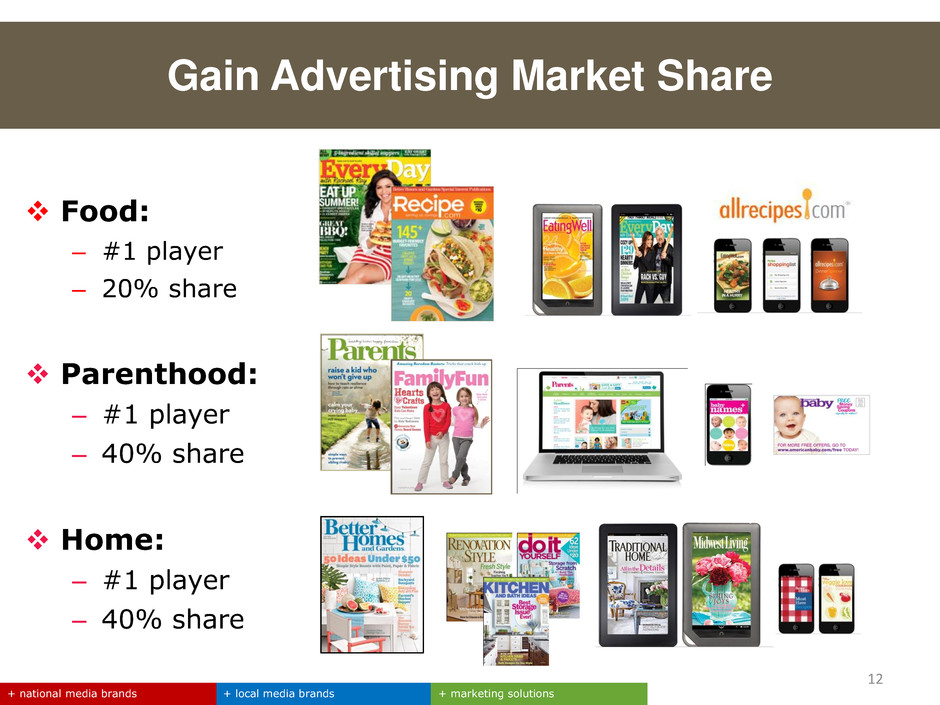
Food: – #1 player – 20% share Parenthood: – #1 player – 40% share Home: – #1 player – 40% share 12 Gain Advertising Market Share + local media brands + marketing solutions + national media brands
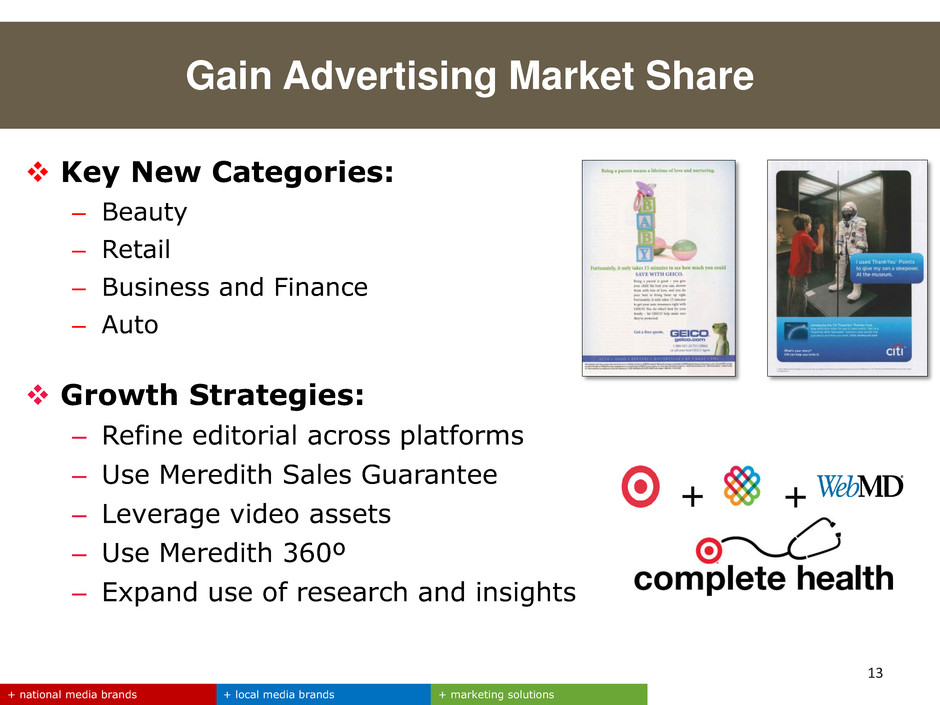
13 Key New Categories: – Beauty – Retail – Business and Finance – Auto Growth Strategies: – Refine editorial across platforms – Use Meredith Sales Guarantee – Leverage video assets – Use Meredith 360º – Expand use of research and insights + local media brands + marketing solutions + national media brands + + Gain Advertising Market Share
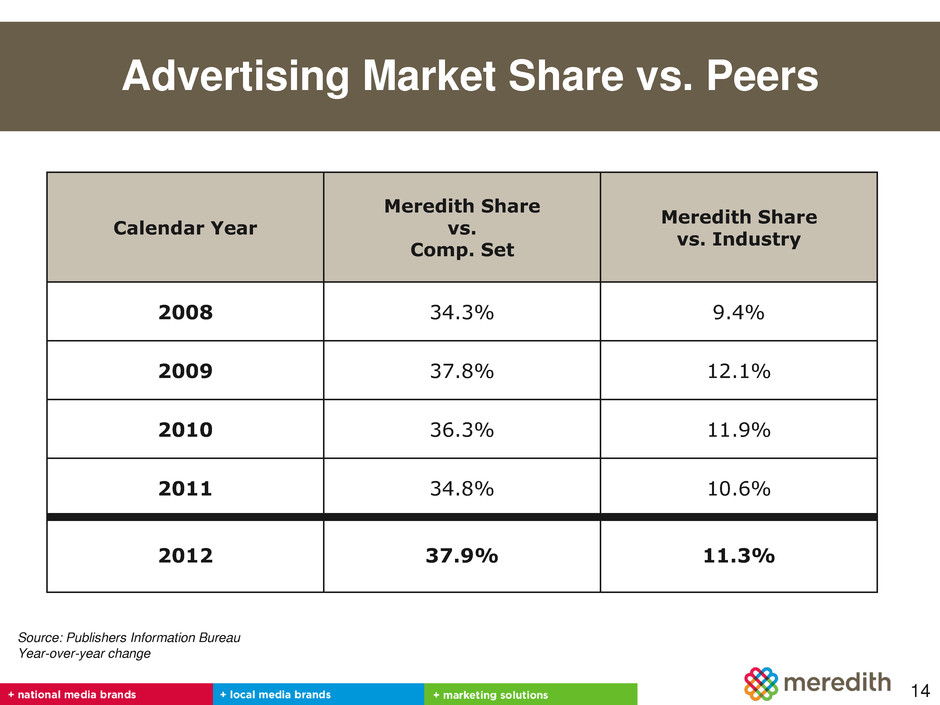
Calendar Year Meredith Share vs. Comp. Set Meredith Share vs. Industry 2008 34.3% 9.4% 2009 37.8% 12.1% 2010 36.3% 11.9% 2011 34.8% 10.6% 2012 37.9% 11.3% 14 Source: Publishers Information Bureau Year-over-year change Advertising Market Share vs. Peers
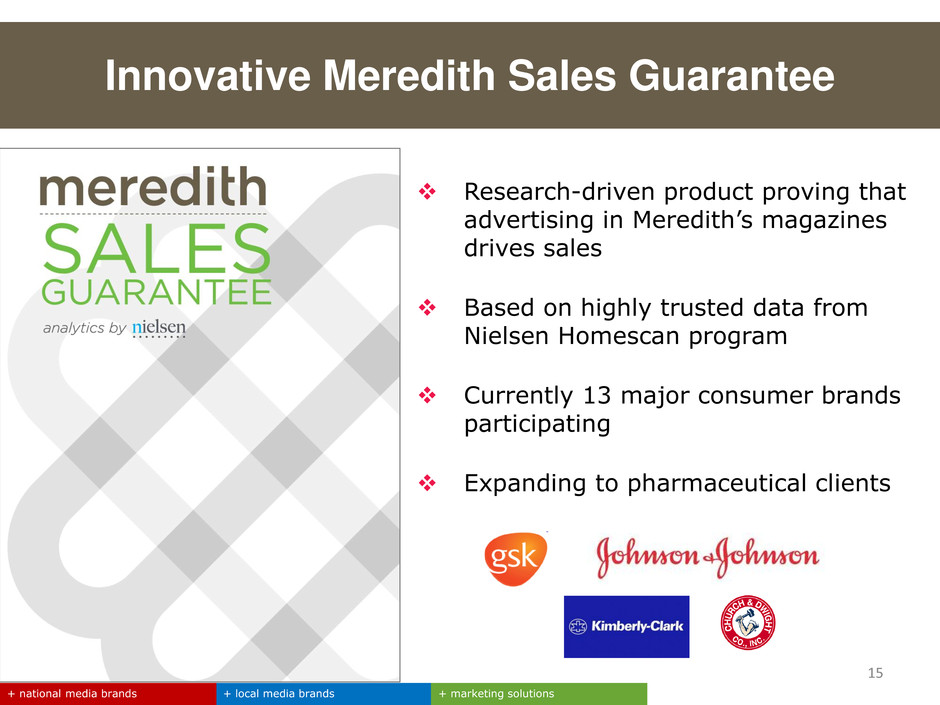
+ local media brands + marketing solutions + national media brands Innovative Meredith Sales Guarantee Research-driven product proving that advertising in Meredith’s magazines drives sales Based on highly trusted data from Nielsen Homescan program Currently 13 major consumer brands participating Expanding to pharmaceutical clients 15
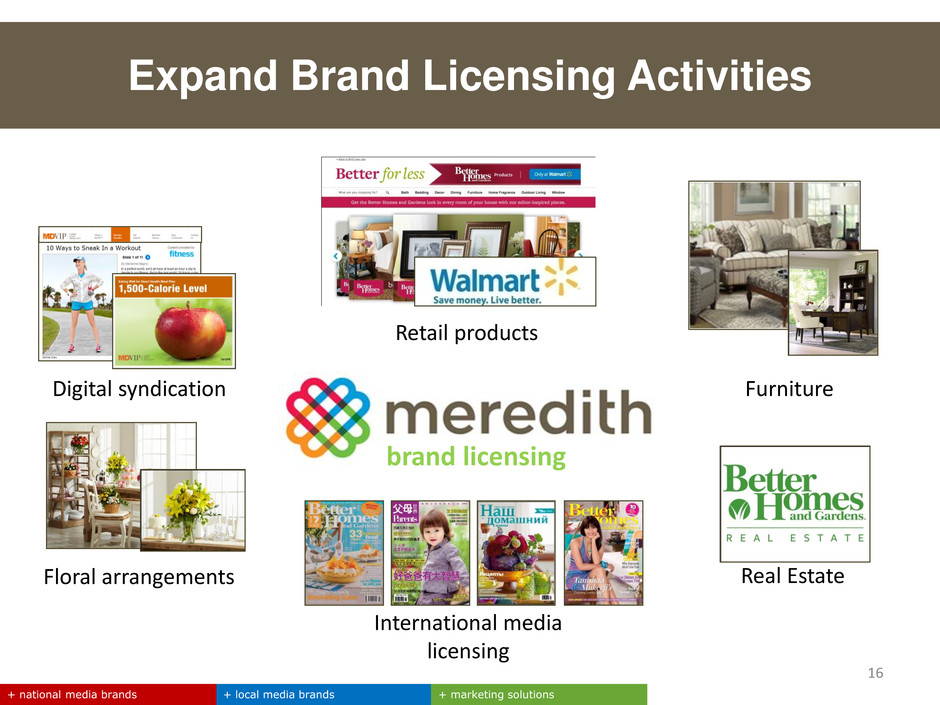
16 + local media brands + marketing solutions + national media brands brand licensing International media licensing Retail products Real Estate Furniture Floral arrangements Digital syndication Expand Brand Licensing Activities
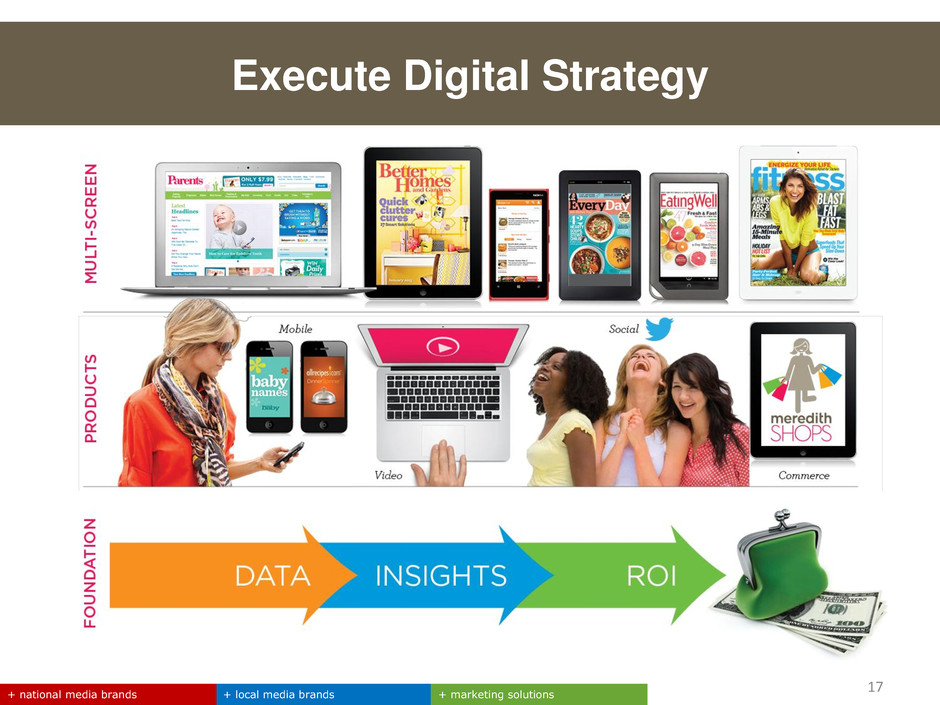
+ local media brands + marketing solutions + national media brands 17 Execute Digital Strategy
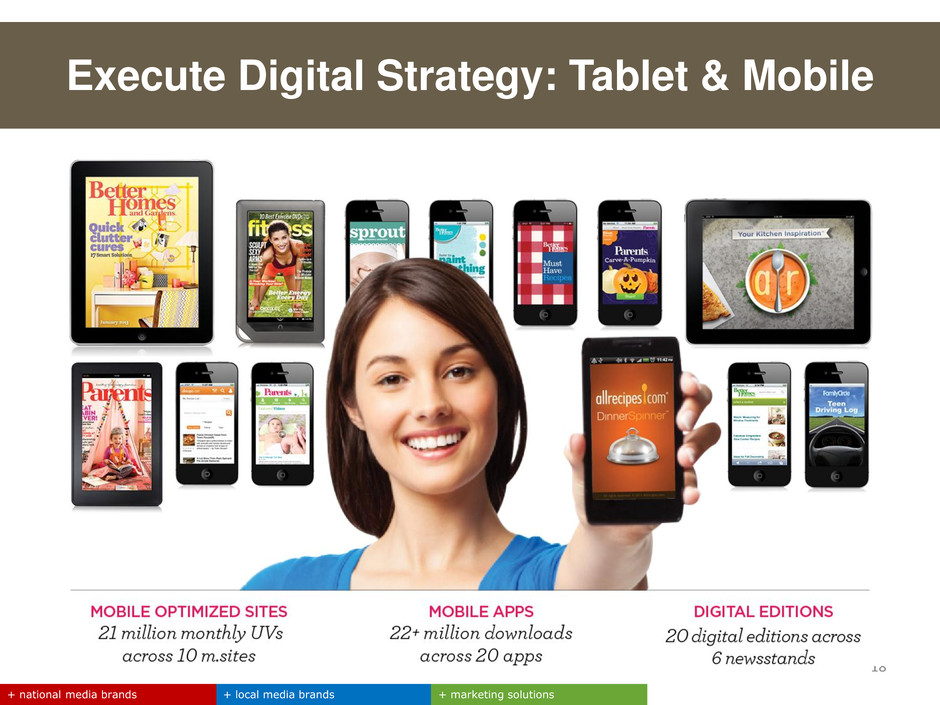
+ local media brands + marketing solutions + national media brands 18 Execute Digital Strategy: Tablet & Mobile
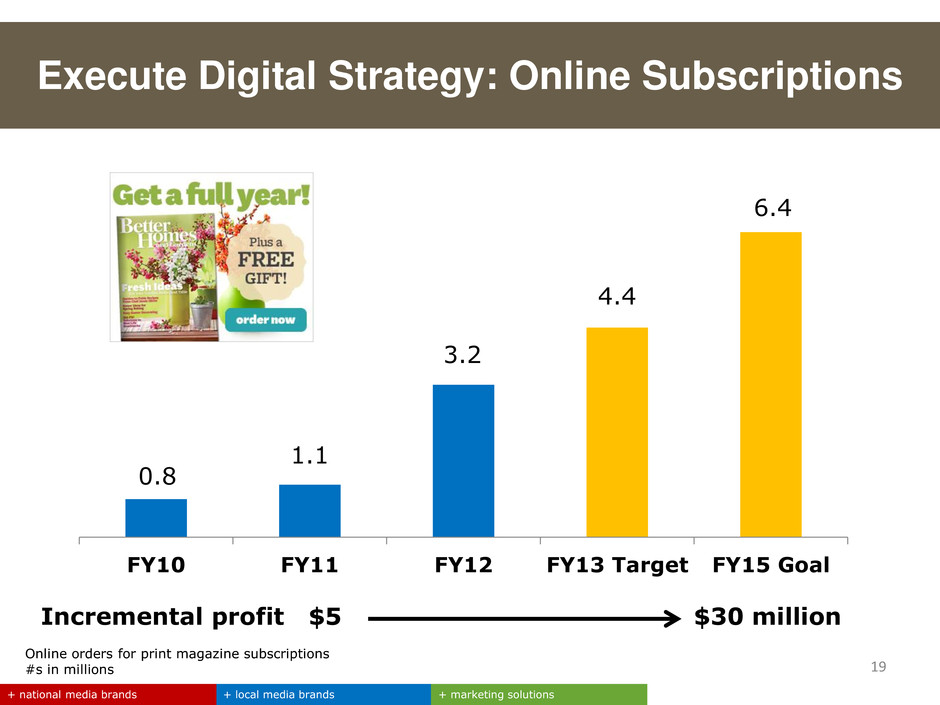
+ local media brands + marketing solutions + national media brands 0.8 1.1 3.2 4.4 FY10 FY11 FY12 FY13 Target FY15 Goal Online orders for print magazine subscriptions #s in millions 19 Incremental profit $5 $30 million Execute Digital Strategy: Online Subscriptions 6.4
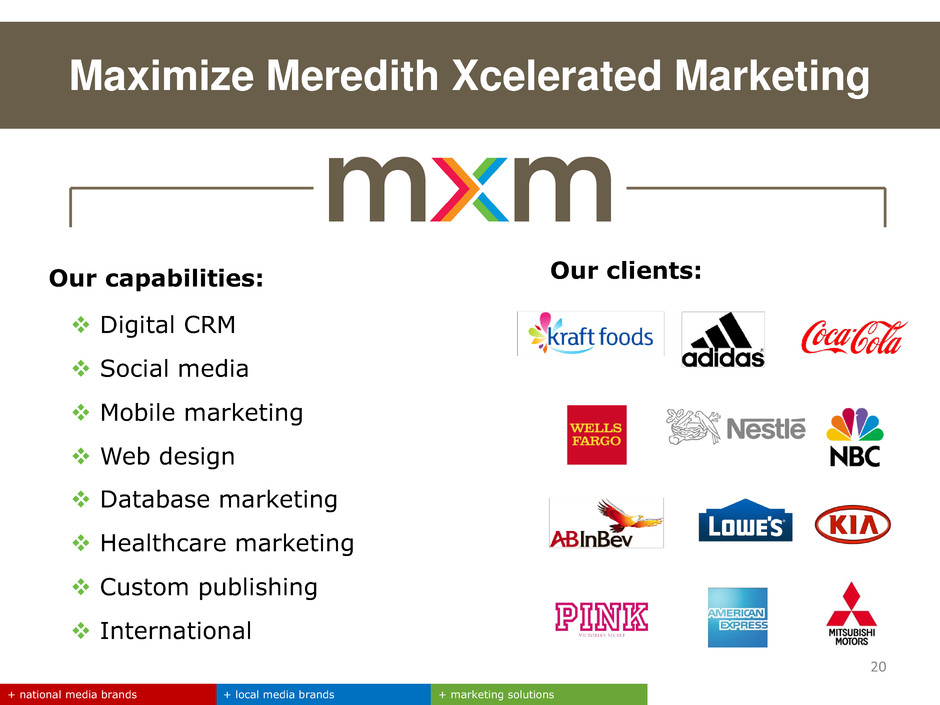
+ local media brands + marketing solutions + national media brands Our capabilities: Digital CRM Social media Mobile marketing Web design Database marketing Healthcare marketing Custom publishing International Our clients: 20 Maximize Meredith Xcelerated Marketing
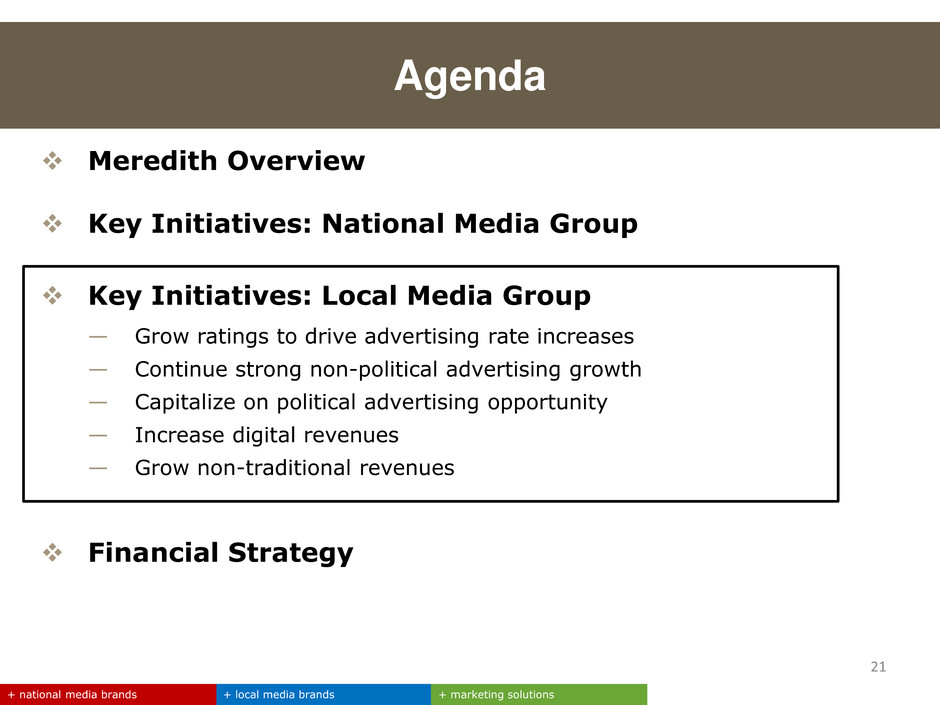
+ local media brands + marketing solutions + national media brands Agenda Meredith Overview Key Initiatives: National Media Group Key Initiatives: Local Media Group — Grow ratings to drive advertising rate increases — Continue strong non-political advertising growth — Capitalize on political advertising opportunity — Increase digital revenues — Grow non-traditional revenues Financial Strategy 21
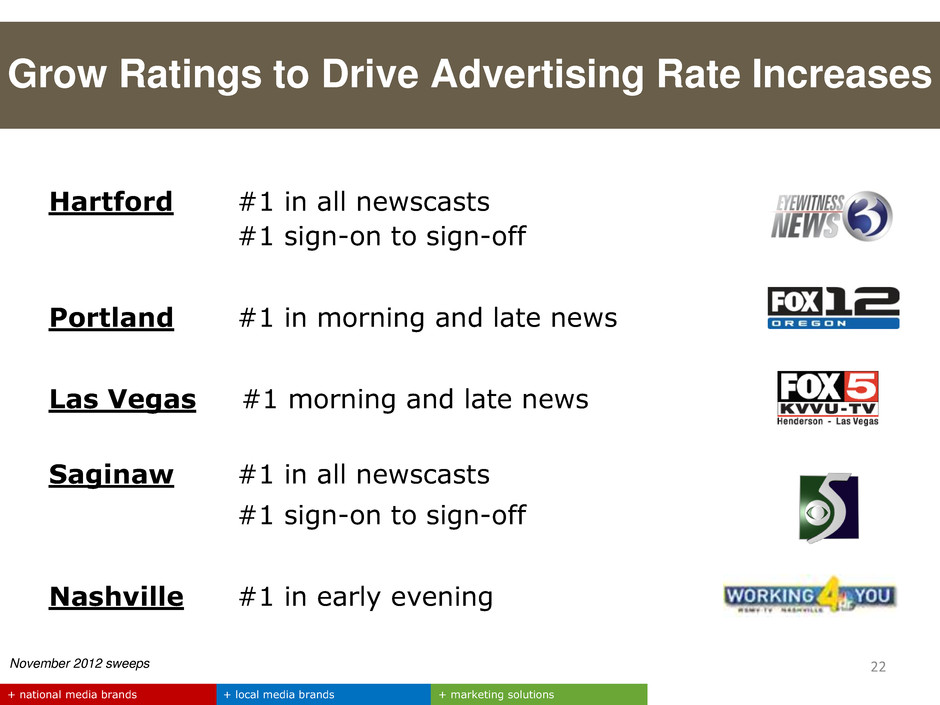
Grow Ratings to Drive Advertising Rate Increases Hartford #1 in all newscasts #1 sign-on to sign-off Portland #1 in morning and late news Las Vegas #1 morning and late news Saginaw #1 in all newscasts #1 sign-on to sign-off Nashville #1 in early evening 22 November 2012 sweeps + local media brands + marketing solutions + national media brands
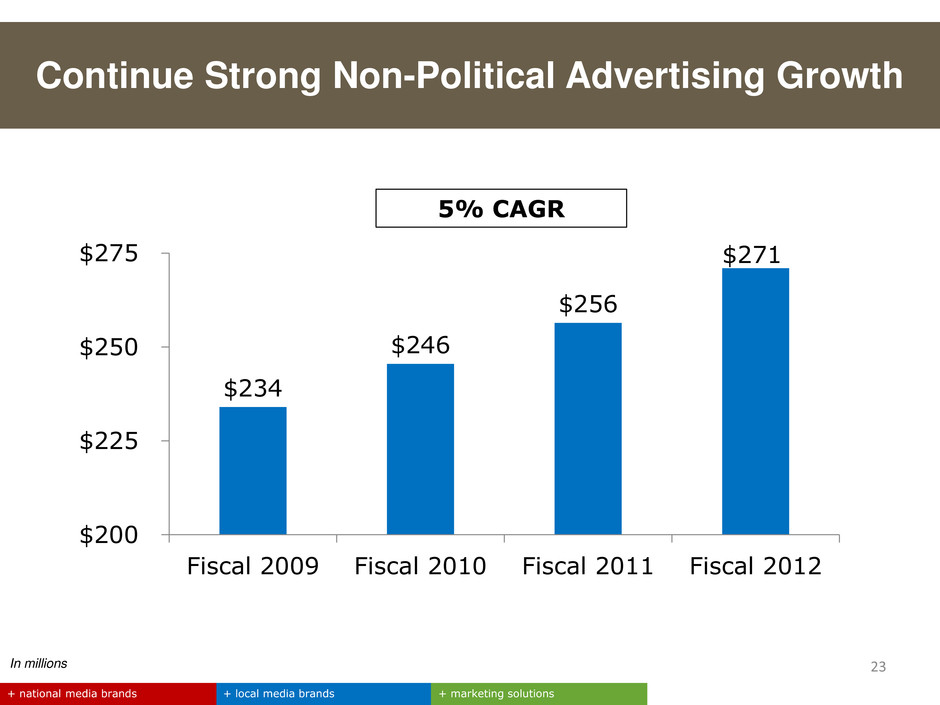
Continue Strong Non-Political Advertising Growth + local media brands + marketing solutions + national media brands In millions 23 $234 $246 $256 $200 $225 $250 $275 Fiscal 2009 Fiscal 2010 Fiscal 2011 Fiscal 2012 $271 5% CAGR
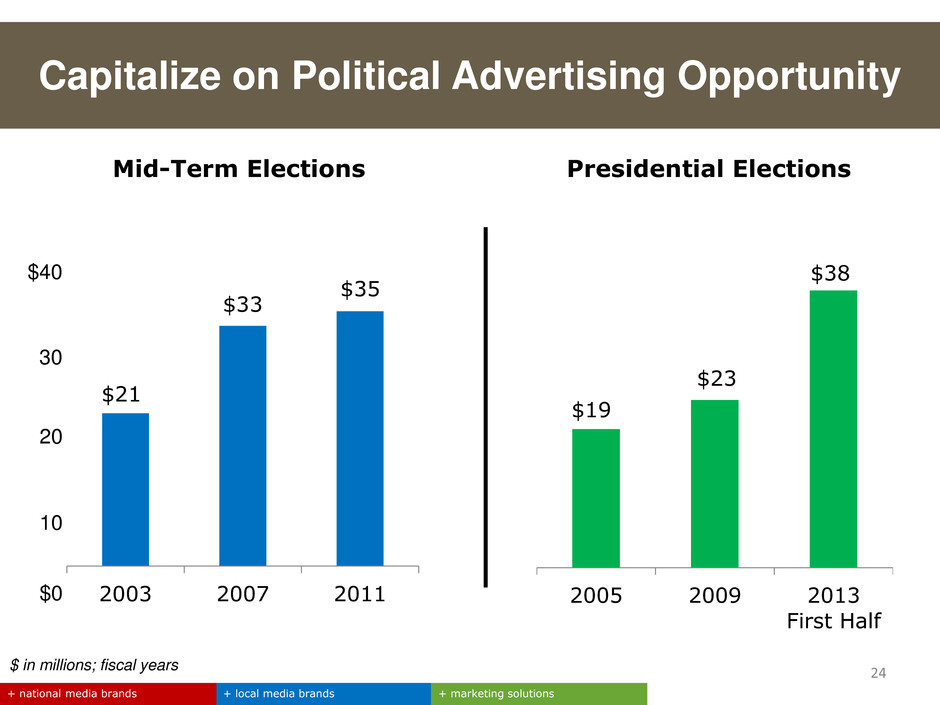
2003 2007 2011 $21 $33 $35 2005 2009 2013 First Half $19 $23 Mid-Term Elections Presidential Elections $ in millions; fiscal years $38 Capitalize on Political Advertising Opportunity 24 + local media brands + marketing solutions + national media brands 20 10 $0 $40 30
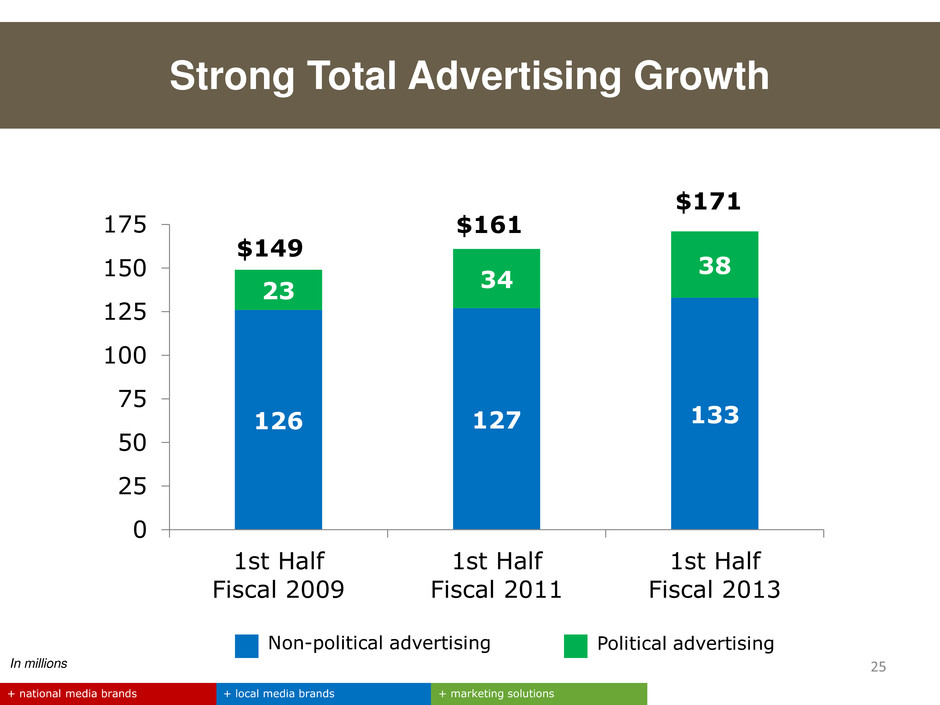
Strong Total Advertising Growth + local media brands + marketing solutions + national media brands In millions 25 126 127 133 23 34 38 0 25 50 75 100 125 150 175 1st Half Fiscal 2009 1st Half Fiscal 2011 1st Half Fiscal 2013 $149 $161 $171 Non-political advertising Political advertising
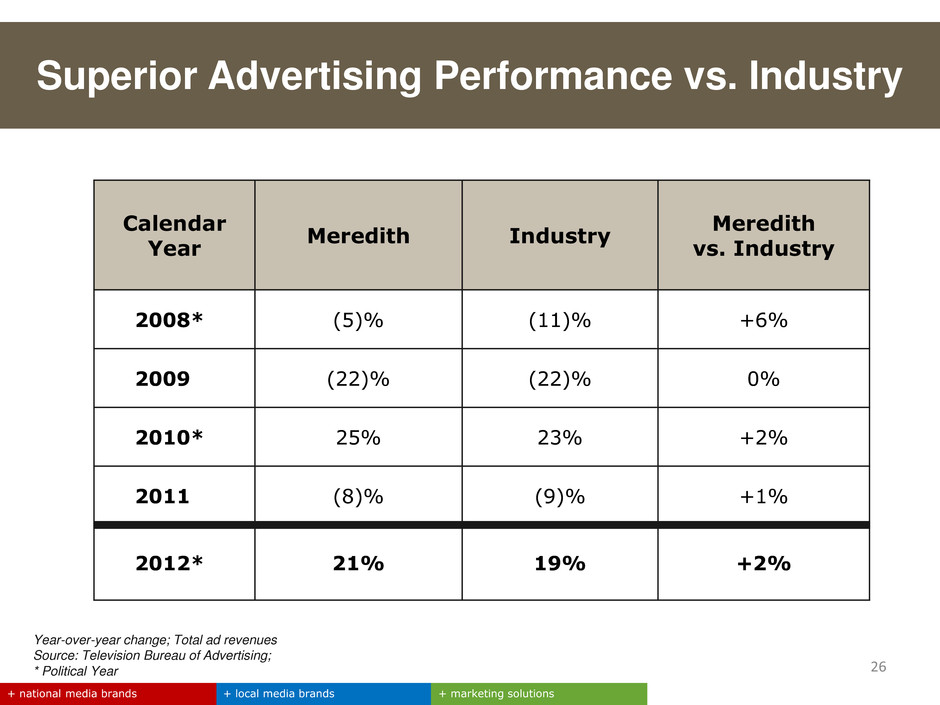
Year-over-year change; Total ad revenues Source: Television Bureau of Advertising; * Political Year Superior Advertising Performance vs. Industry + local media brands + marketing solutions + national media brands Calendar Year Meredith Industry Meredith vs. Industry 2008* (5)% (11)% +6% 2009 (22)% (22)% 0% 2010* 25% 23% +2% 2011 (8)% (9)% +1% 2012* 21% 19% +2% 26
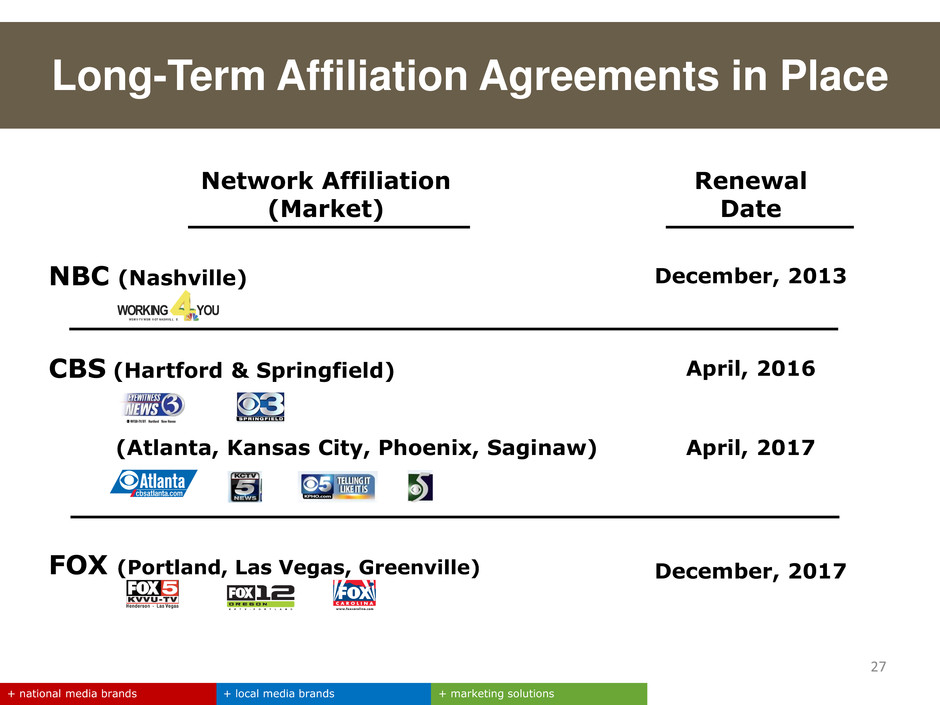
Network Affiliation (Market) Renewal Date NBC (Nashville) December, 2013 CBS (Hartford & Springfield) April, 2016 (Atlanta, Kansas City, Phoenix, Saginaw) April, 2017 FOX (Portland, Las Vegas, Greenville) December, 2017 Long-Term Affiliation Agreements in Place + local media brands + marketing solutions + national media brands 27 WORKING YOU WS M V -TV W SM V-DT NASHV IL L E
+ local media brands + marketing solutions + national media brands Agenda Meredith Overview Key Initiatives: National Media Group Key Initiatives: Local Media Group Financial Strategy 28
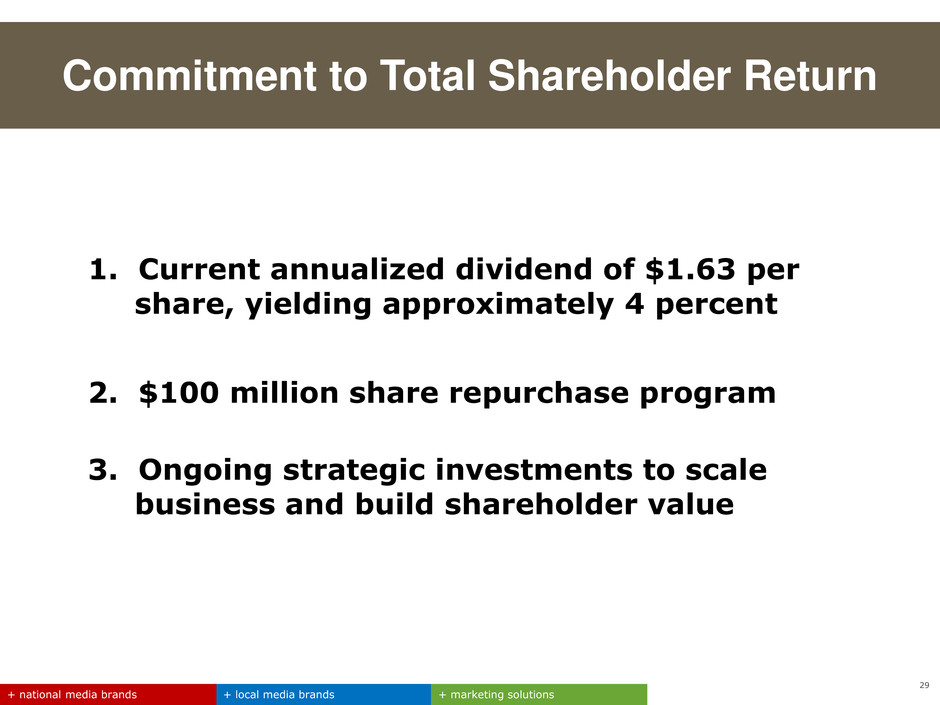
29 + local media brands + marketing solutions + national media brands Commitment to Total Shareholder Return 1. Current annualized dividend of $1.63 per share, yielding approximately 4 percent 2. $100 million share repurchase program 3. Ongoing strategic investments to scale business and build shareholder value
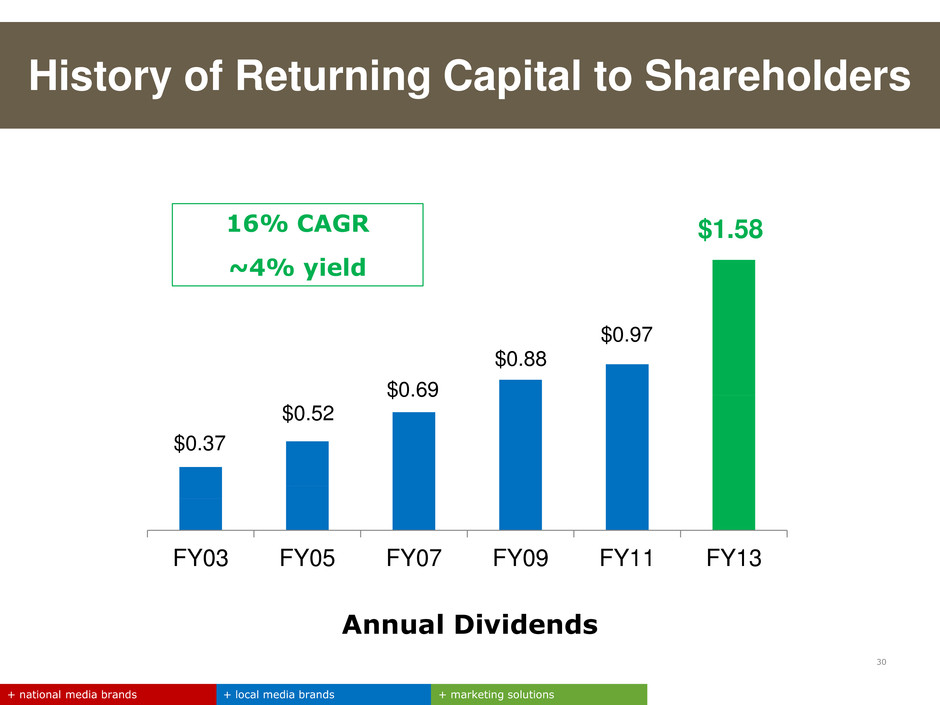
30 History of Returning Capital to Shareholders + local media brands + marketing solutions + national media brands $0.37 $0.52 $0.69 $0.88 $0.97 $1.58 FY03 FY05 FY07 FY09 FY11 FY13 Annual Dividends 16% CAGR ~4% yield
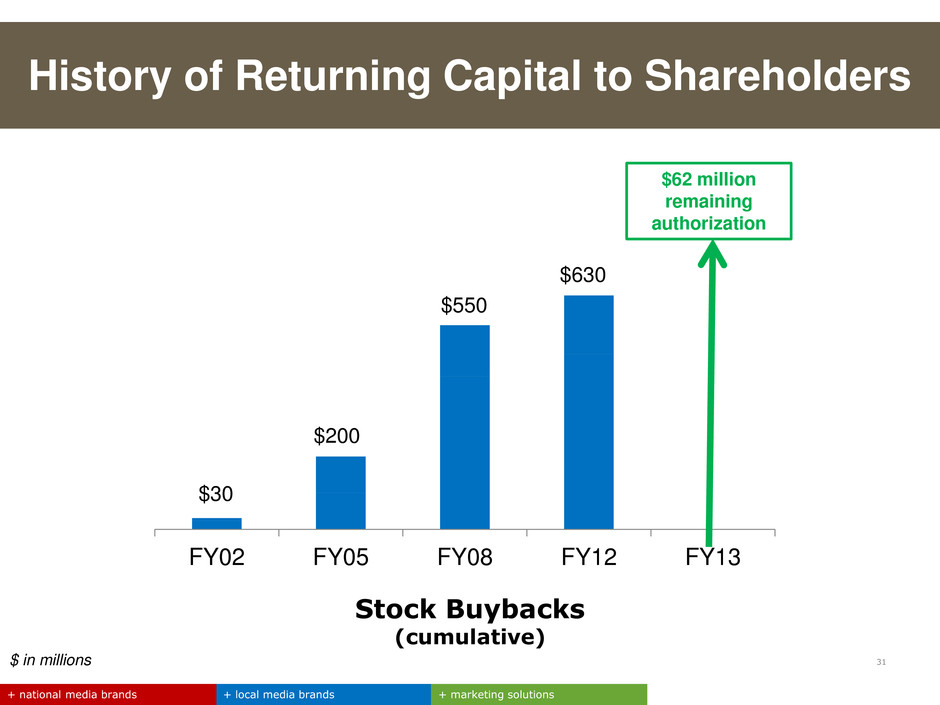
31 History of Returning Capital to Shareholders + local media brands + marketing solutions + national media brands $30 $200 $550 $630 FY02 FY05 FY08 FY12 FY13 $62 million remaining authorization Stock Buybacks (cumulative) $ in millions
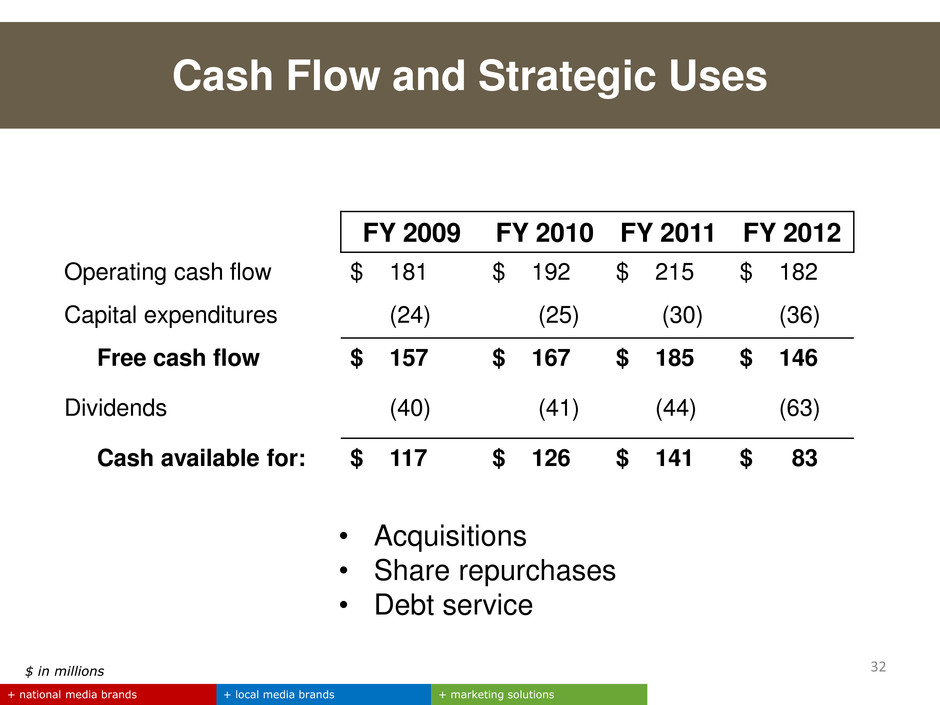
Cash Flow and Strategic Uses + local media brands + marketing solutions + national media brands FY 2009 FY 2010 FY 2011 FY 2012 Operating cash flow $ 181 $ 192 $ 215 $ 182 Capital expenditures (24) (25) (30) (36) Free cash flow $ 157 $ 167 $ 185 $ 146 Dividends (40) (41) (44) (63) Cash available for: $ 117 $ 126 $ 141 $ 83 • Acquisitions • Share repurchases • Debt service 32 $ in millions
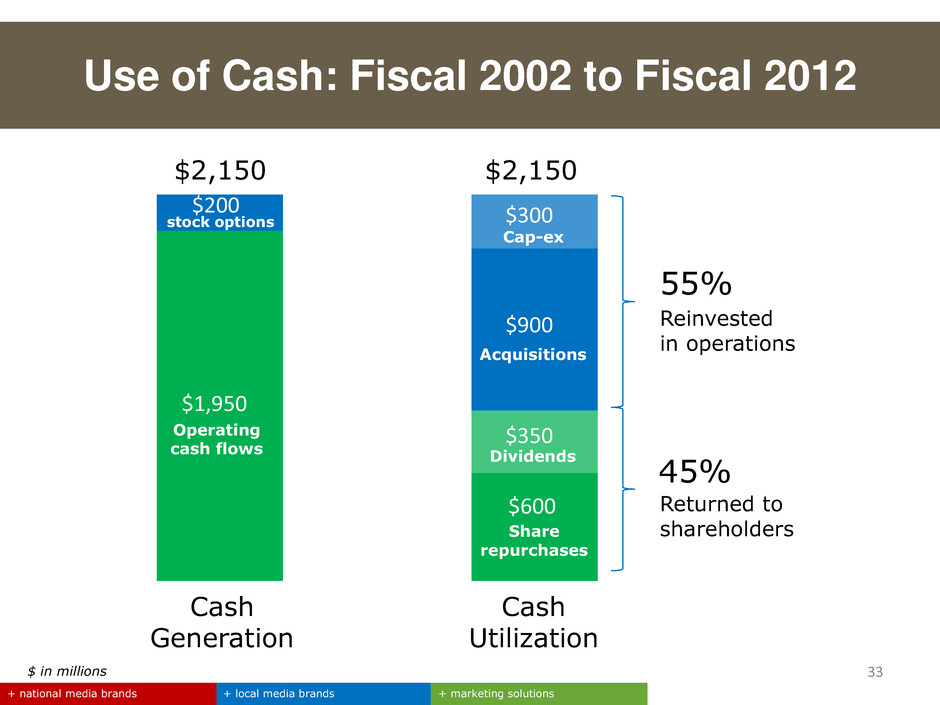
33 + local media brands + marketing solutions + national media brands $ in millions $1,900 $200 $1,950 $200 Cash Generation Cash Utilization $2,150 $2,150 $600 $350 Dividends $300 $900 Share repurchases Acquisitions Cap-ex Operating cash flows stock options 45% 55% Reinvested in operations Returned to shareholders Use of Cash: Fiscal 2002 to Fiscal 2012
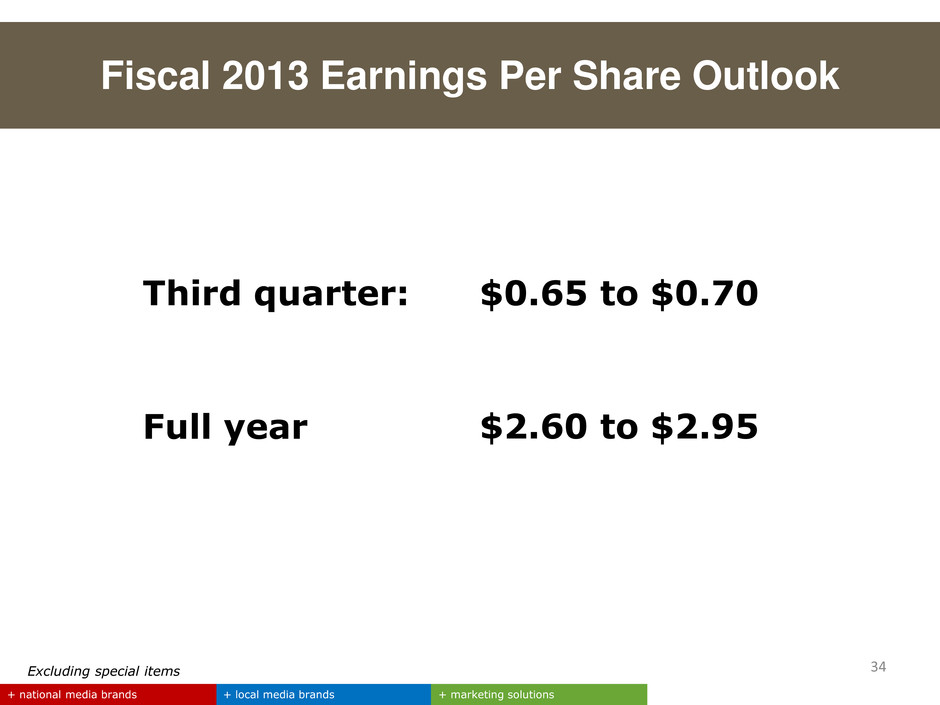
Fiscal 2013 Earnings Per Share Outlook + local media brands + marketing solutions + national media brands 34 Third quarter: Full year $0.65 to $0.70 $2.60 to $2.95 Excluding special items
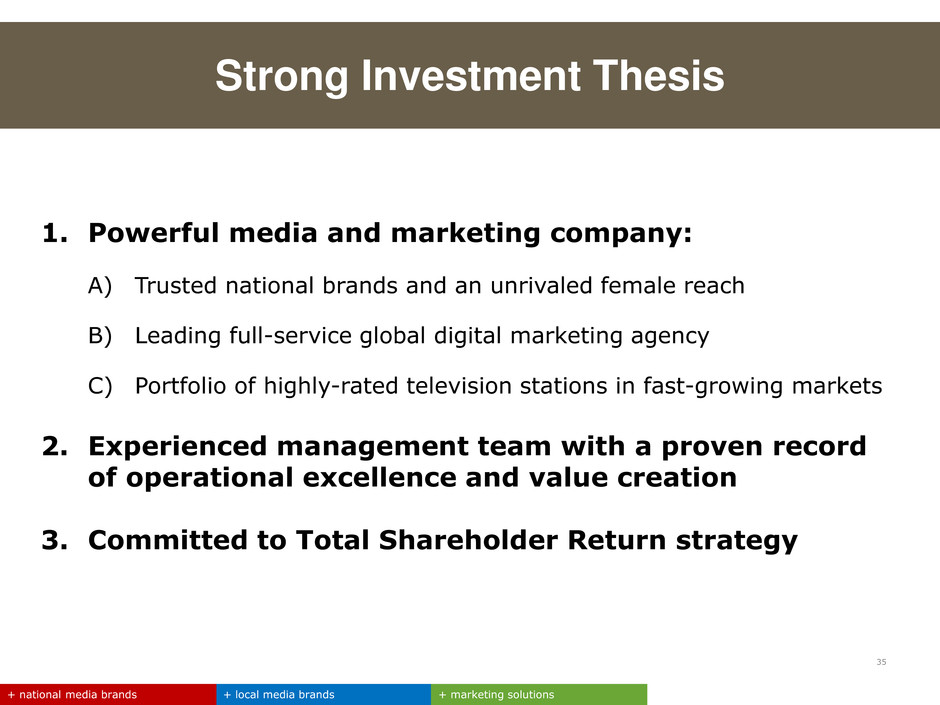
1. Powerful media and marketing company: A) Trusted national brands and an unrivaled female reach B) Leading full-service global digital marketing agency C) Portfolio of highly-rated television stations in fast-growing markets 2. Experienced management team with a proven record of operational excellence and value creation 3. Committed to Total Shareholder Return strategy + local media brands + marketing solutions + national media brands 35 Strong Investment Thesis

Deutsche Bank 21st Annual Global Media, Internet and Telecom Conference • March 2013


