
General Investor Presentation March 2019
FORWARD-LOOKING STATEMENTS This presentation contains certain forward-looking statements that are subject to risks and uncertainties. These statements are based on management’s current knowledge and estimates of factors affecting the Company and its operations. Statements in this presentation that are forward-looking include, but are not limited to, the expected benefits of the acquisition of Time Inc., including the expected synergies from the transaction and the combined company’s prospects for growth and increasing shareholder value. Actual results may differ materially from those currently anticipated. Factors that could adversely affect future results include, but are not limited to, downturns in national and/or local economies; a softening of the domestic advertising market; world, national or local events that could disrupt broadcast television; increased consolidation among major advertisers or other events depressing the level of advertising spending; the unexpected loss or insolvency of one or more major clients or vendors; the integration of acquired businesses; changes in consumer reading, purchasing and/or television viewing patterns; increases in paper, postage, printing, syndicated programming or other costs; changes in television network affiliation agreements; technological developments affecting products or methods of distribution; changes in government regulations affecting the Company’s industries; increases in interest rates; the consequences of acquisitions and/or dispositions; the risks associated with the Company’s recent acquisition of Time Inc., including: (1) the Company’s ability to retain key personnel; (2) unexpected costs, charges or expenses resulting from the acquisition; (3) the Company’s ability to realize the anticipated benefits of the acquisition of Time Inc.; (4) delays, challenges and expenses associated with integrating the businesses; (5) the Company’s ability to comply with the terms of the debt and equity financings entered into in connection with the acquisition; and (6) the risk factors contained in the Company’s most recent Form 10-K filed with the Securities and Exchange Commission, which are available on the SEC’s website at www.sec.gov. The Company undertakes no obligation to update any forward-looking statement, whether as a result of new information, future events or otherwise. 2
TODAY’S AGENDA Meredith Overview National Media Group Growth Strategies Local Media Group Growth Strategies Financial Strategy Q&A 3
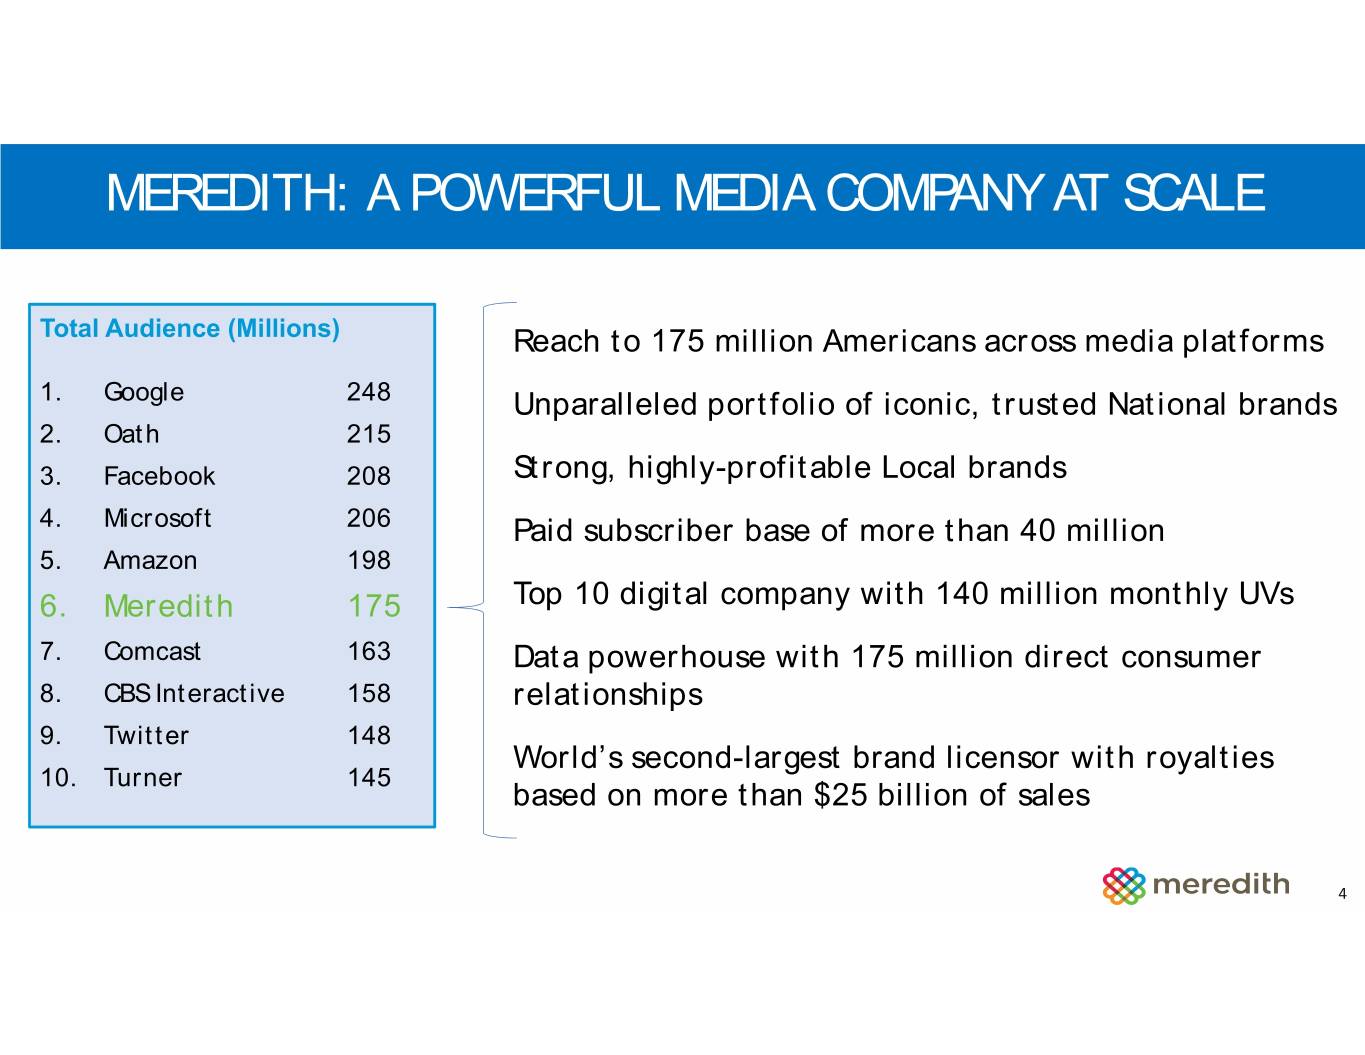
MEREDITH: A POWERFUL MEDIA COMPANY AT SCALE Total Audience (Millions) Reach to 175 million Americans across media platforms 1. Google 248 Unparalleled portfolio of iconic, trusted National brands 2. Oath 215 3. Facebook 208 Strong, highly-profitable Local brands 4. Microsoft 206 Paid subscriber base of more than 40 million 5. Amazon 198 6. Meredith 175 Top 10 digital company with 140 million monthly UVs 7. Comcast 163 Data powerhouse with 175 million direct consumer 8. CBS Interactive 158 relationships 9. Twitter 148 World’s second-largest brand licensor with royalties 10. Turner 145 based on more than $25 billion of sales 4
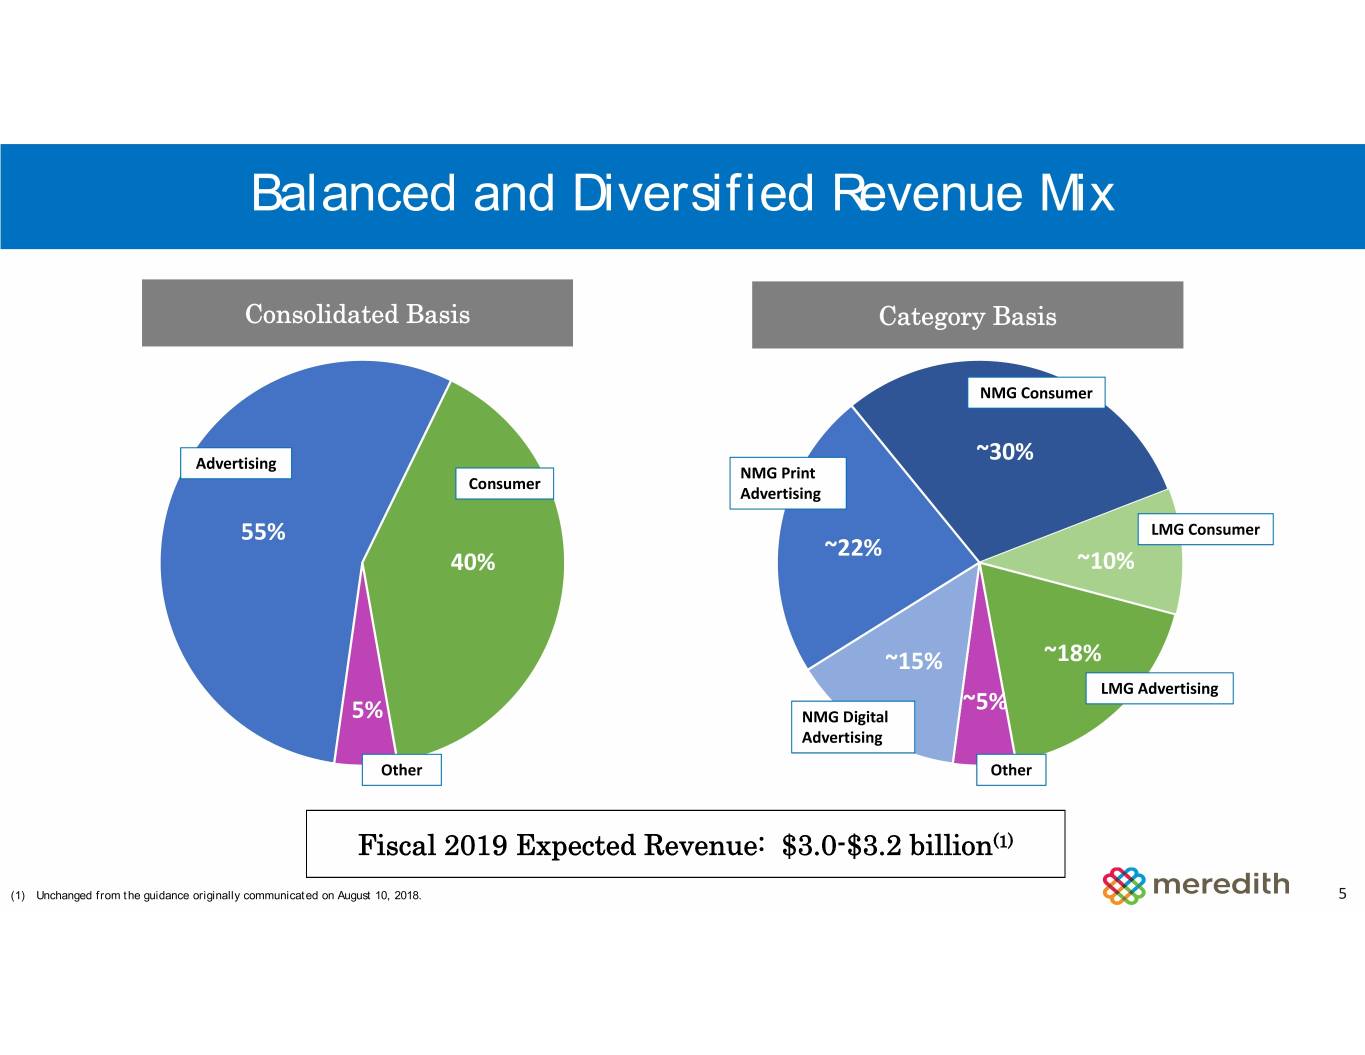
Balanced and Diversified Revenue Mix Consolidated Basis Category Basis NMG Consumer Advertising ~30% NMG Print Consumer Advertising 55% LMG Consumer ~22% 40% ~10% ~15% ~18% LMG Advertising ~5% 5% NMG Digital Advertising Other Other Fiscal 2019 Expected Revenue: $3.0-$3.2 billion(1) (1) Unchanged from the guidance originally communicated on August 10, 2018. 5
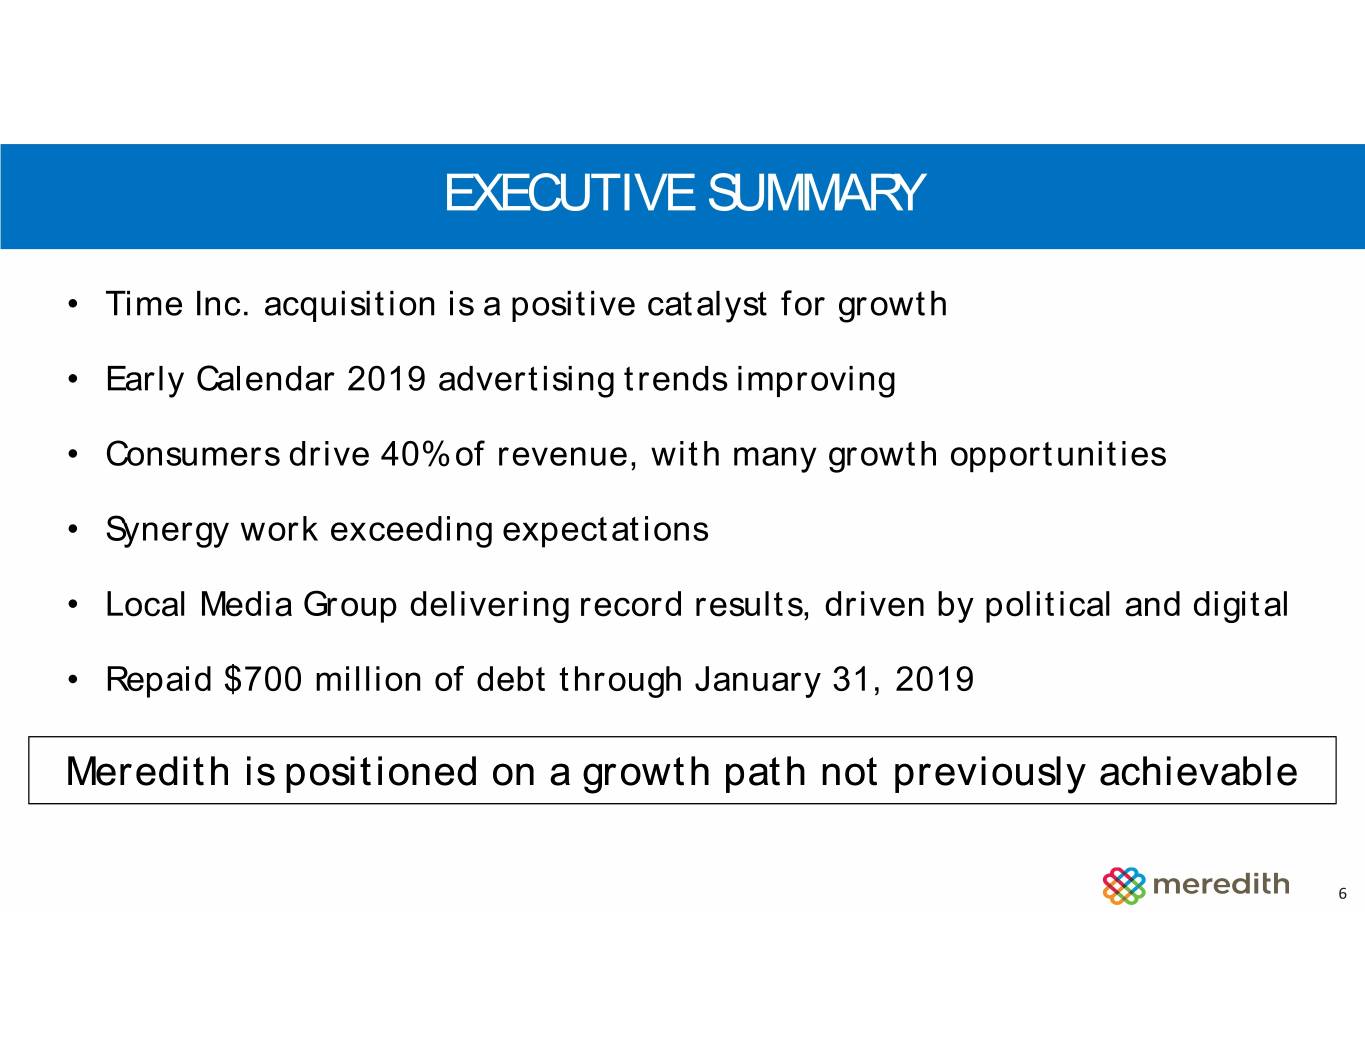
EXECUTIVE SUMMARY • Time Inc. acquisition is a positive catalyst for growth • Early Calendar 2019 advertising trends improving • Consumers drive 40% of revenue, with many growth opportunities • Synergy work exceeding expectations • Local Media Group delivering record results, driven by political and digital • Repaid $700 million of debt through January 31, 2019 Meredith is positioned on a growth path not previously achievable 6
TODAY’S AGENDA Meredith Overview National Media Group Growth Strategies Local Media Group Growth Strategies Financial Strategy Q&A 7
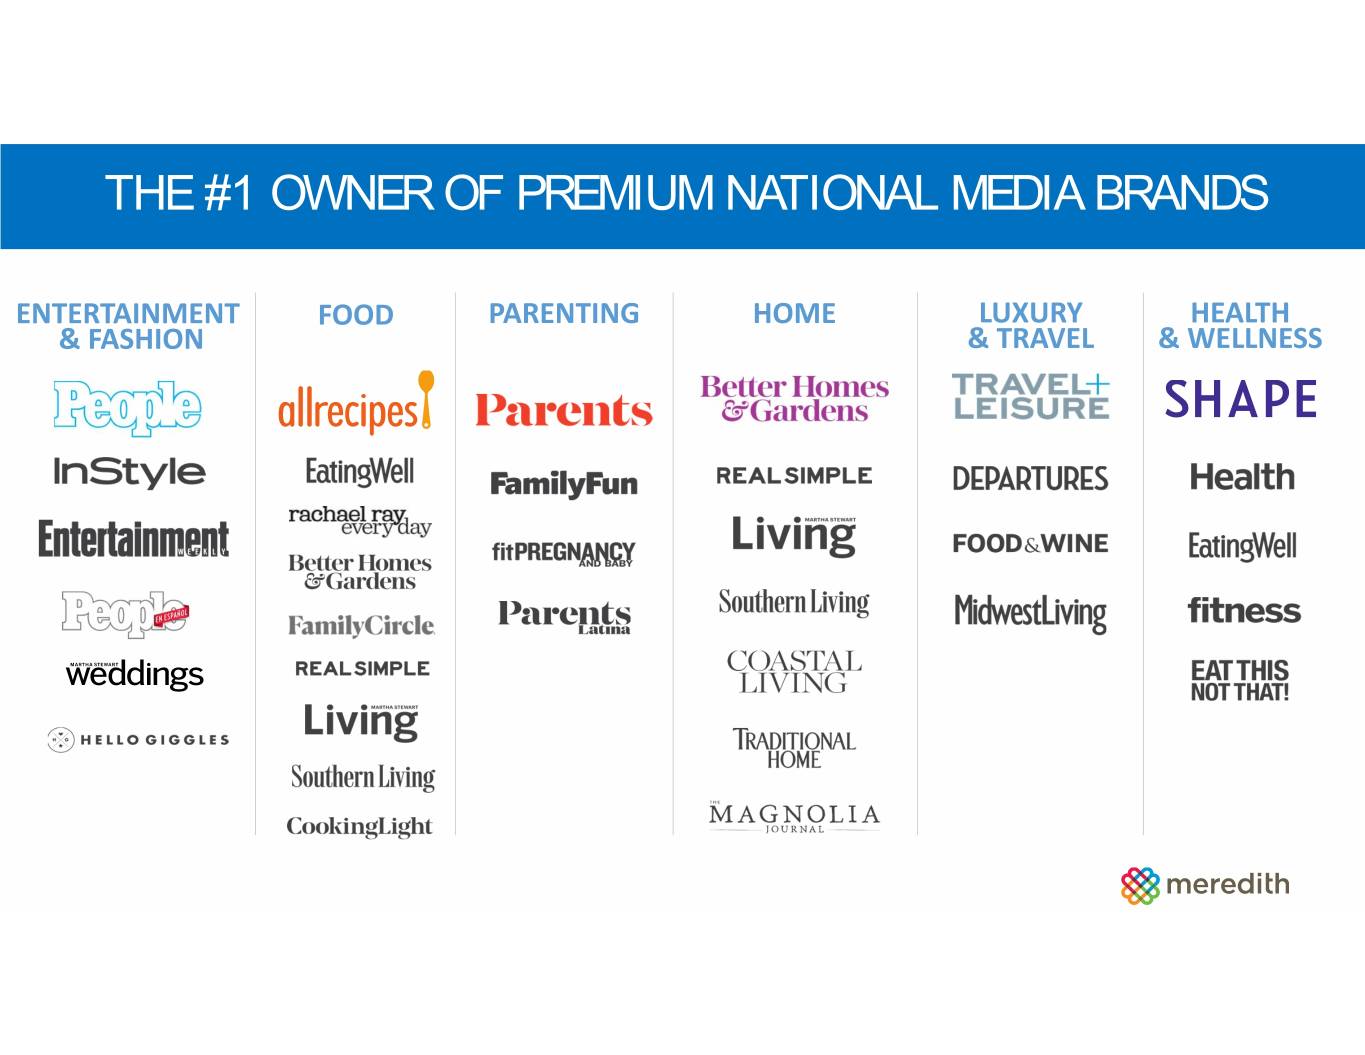
THE #1 OWNER OF PREMIUM NATIONAL MEDIA BRANDS ENTERTAINMENT FOOD PARENTING HOME LUXURY HEALTH & FASHION & TRAVEL & WELLNESS
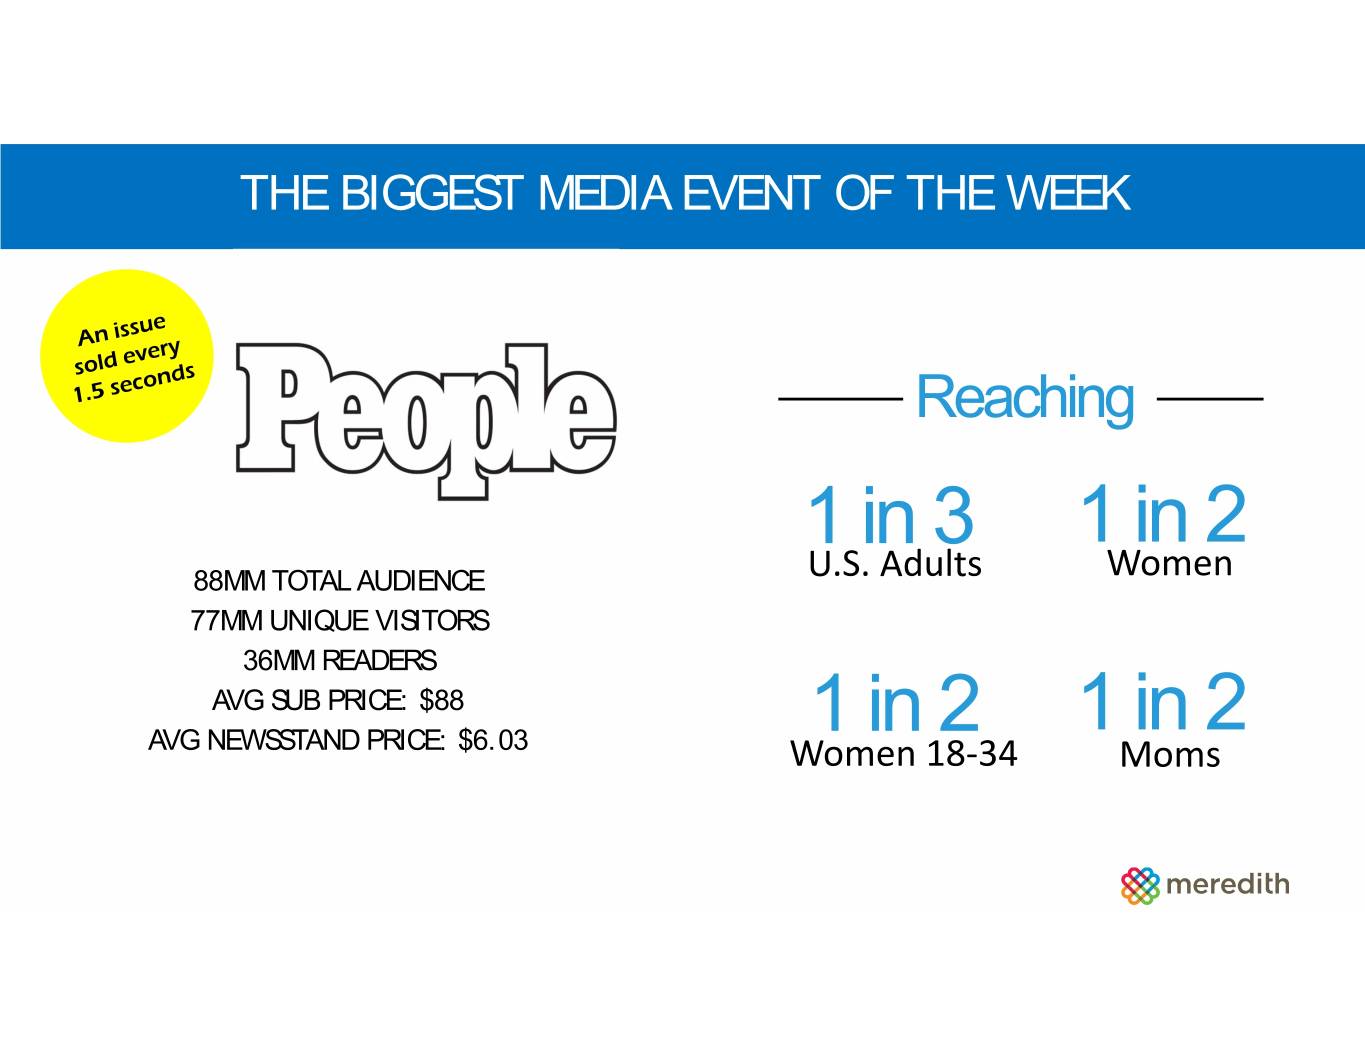
THE BIGGEST MEDIA EVENT OF THE WEEK Reaching 1 in 3 1 in 2 88MM TOTAL AUDIENCE U.S. Adults Women 77MM UNIQUE VISITORS 36MM READERS AVG SUB PRICE: $88 1 in 2 1 in 2 AVG NEWSSTAND PRICE: $6.03 Women 18‐34 Moms
NATIONAL MEDIA GROUP GROWTH STRATEGIES • Improve advertising performance of the acquired Time Inc. titles • Aggressively grow revenue and raise profit margins of digital properties • Accelerate growth of high-margin consumer-related revenue • Complete the divestiture process of media assets not core to our business • Fully realize annual cost synergies of at least $550 million 10
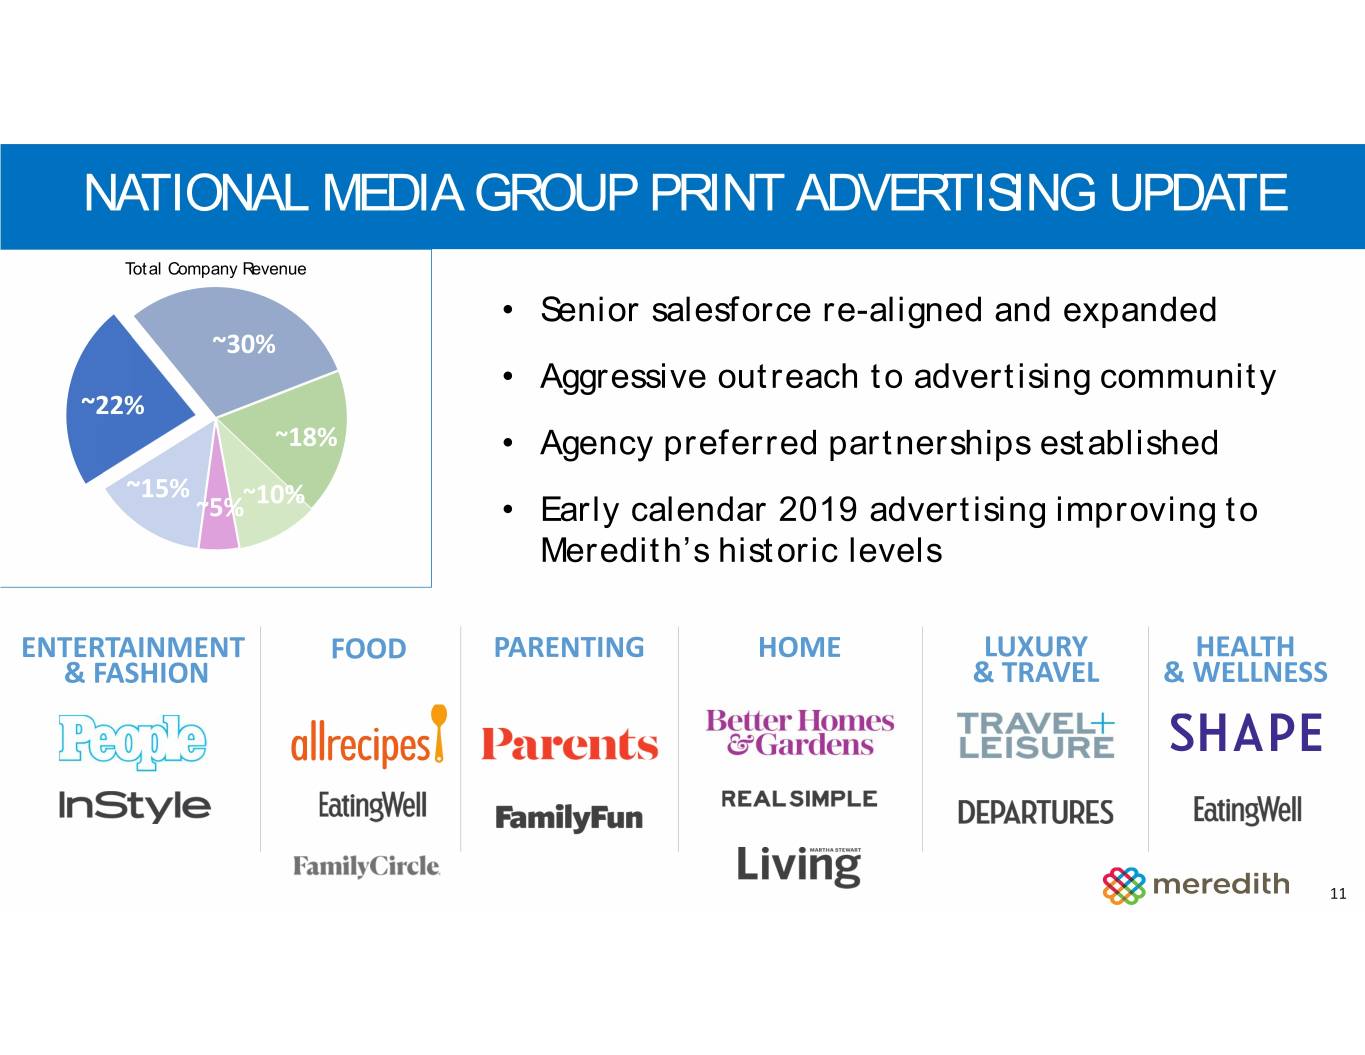
NATIONAL MEDIA GROUP PRINT ADVERTISING UPDATE Total Company Revenue • Senior salesforce re-aligned and expanded ~30% • Aggressive outreach to advertising community ~22% ~18% • Agency preferred partnerships established ~15% ~10% ~5% • Early calendar 2019 advertising improving to Meredith’s historic levels ENTERTAINMENT FOOD PARENTING HOME LUXURY HEALTH & FASHION & TRAVEL & WELLNESS 11
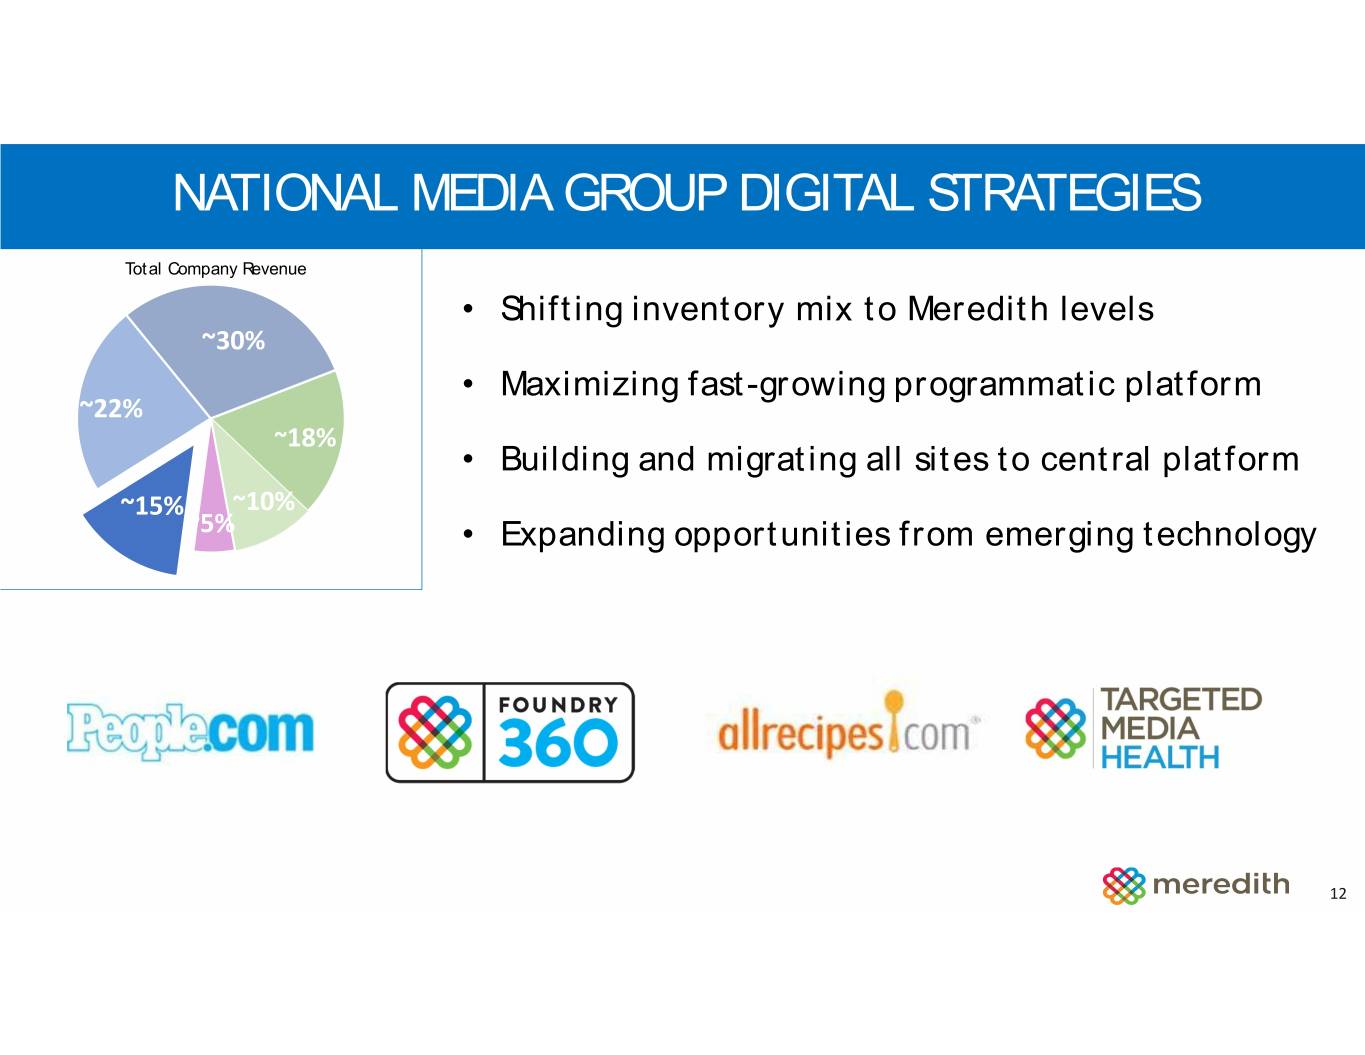
NATIONAL MEDIA GROUP DIGITAL STRATEGIES Total Company Revenue • Shifting inventory mix to Meredith levels ~30% • Maximizing fast-growing programmatic platform ~22% ~18% • Building and migrating all sites to central platform ~15% ~10% ~5% • Expanding opportunities from emerging technology 12

MEREDITH VOICE NETWORK Meredith is the first publisher to unify core voice and audio offerings in a single, buyable Voice Network 1 2 3 SKILLS AUDIO PODCASTS CONTENT TO AUDIO & ACTIONS Episodes of recorded Long-form articles Interactive apps audio content, converted to audio designed to solve consumed daily by 30% content and distributed problems or perform of US pop across voice platforms specific tasks

UNIVERSAL SHOPPING CART Universal cart enables users to add one or more items to a shopping cart that persists across multiple pages and Meredith Digital sites. User can automatically transfer cart contents to preferred retailer for checkout. Meredith receives commission on product sales, and cart contains multiple native advertising opportunities. MEAL CARD ANALYTICS Customize meal Real-time and buy on dashboards Amazon Fresh show retail traffic by store

NATIONAL MEDIA GROUP CONSUMER REVENUE STRATEGIES Total Company Revenue • Grow subscription revenue via cross-promotion ~30% ~22% • Leverage affinity marketer Synapse ~18% ~15% • Engage consumers to drive leads and retail sales ~5%~10% • Expand brand licensing opportunities 42MM 6MM $500MM 1MM Active Subscriptions Direct to Publisher Retail Sales driven by Leads generated by across Credit Card Continuous Shop Platform and Meredith’s Performance Meredith’s 32 titles Service Subscriptions Commerce Content Marketing Platform 15
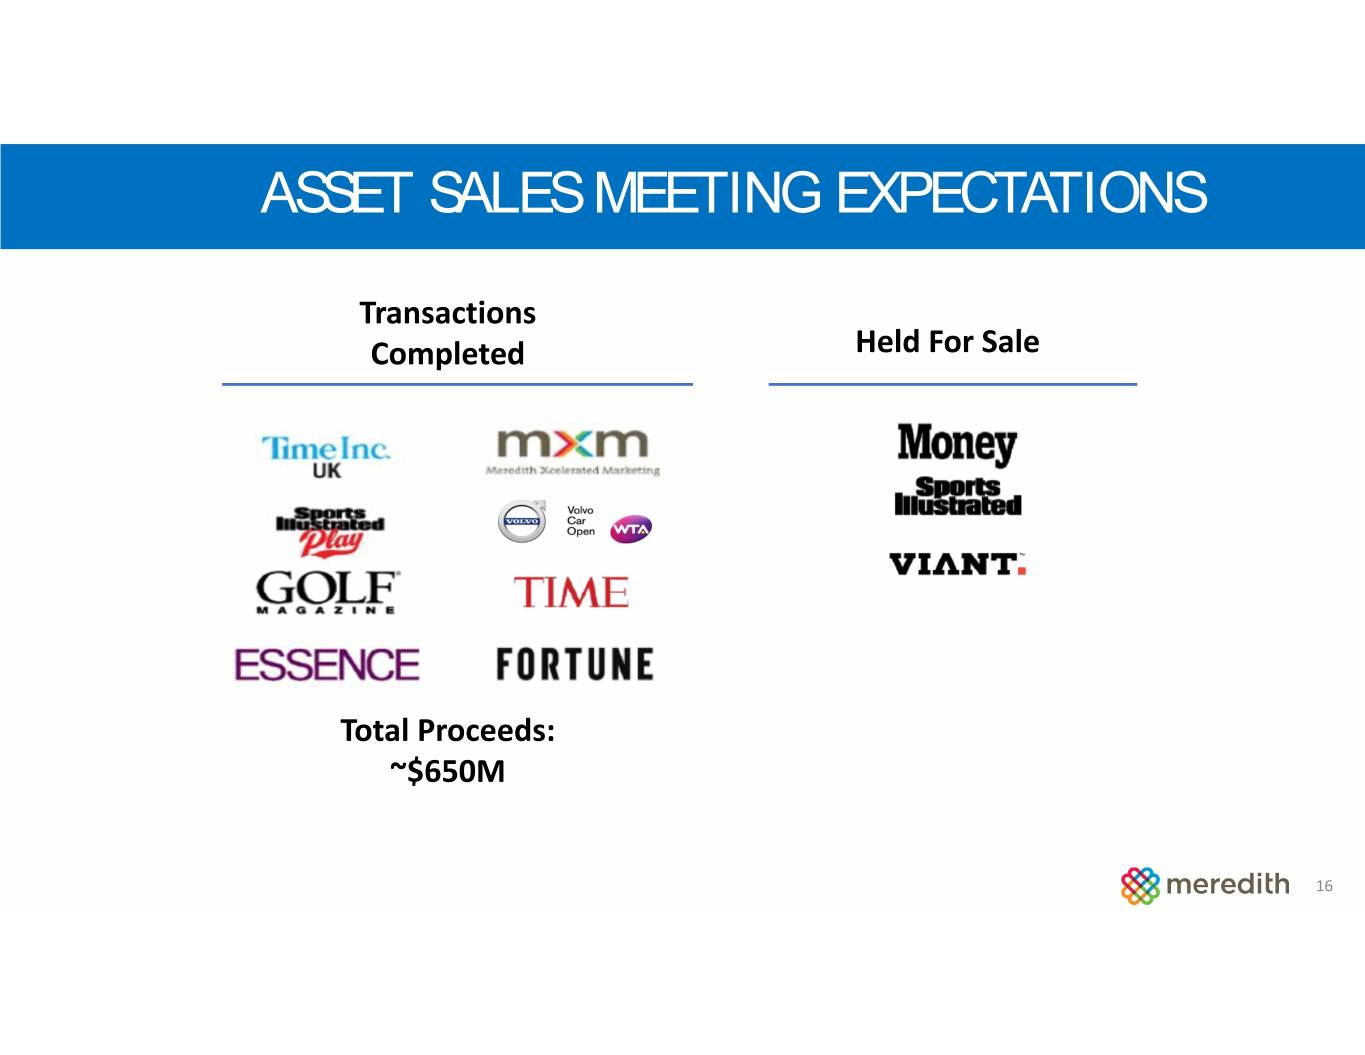
ASSET SALES MEETING EXPECTATIONS Transactions Completed Held For Sale Total Proceeds: ~$650M 16
TODAY’S AGENDA Meredith Overview National Media Group Growth Strategies Local Media Group Growth Strategies Financial Strategy Q&A 17
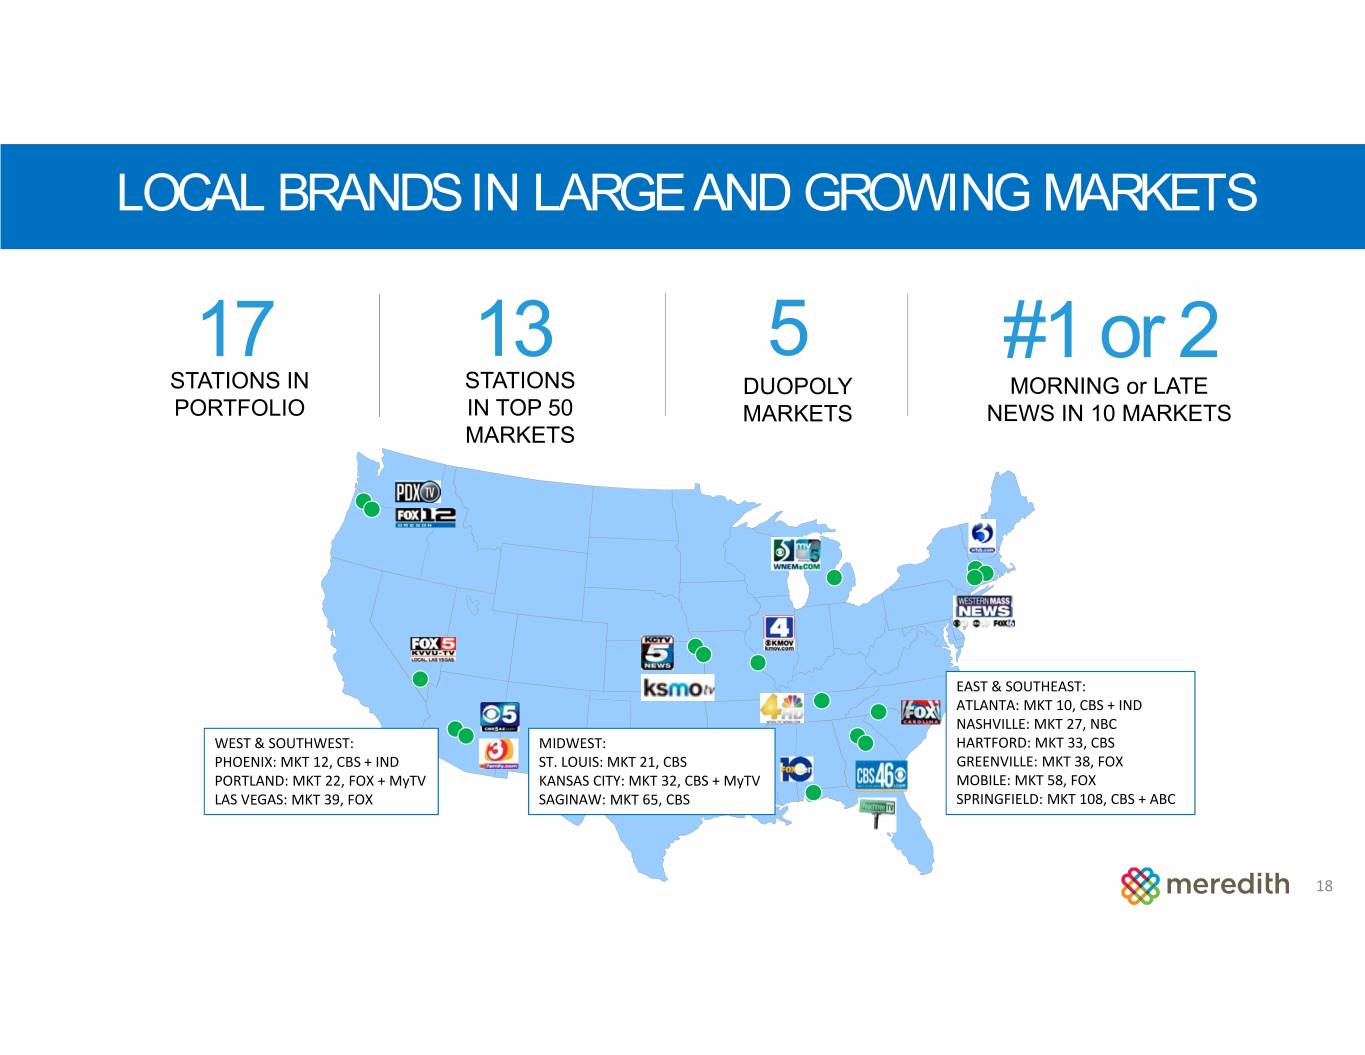
LOCAL BRANDS IN LARGE AND GROWING MARKETS 17 13 5 #1 or 2 STATIONS IN STATIONS DUOPOLY MORNING or LATE PORTFOLIO IN TOP 50 MARKETS NEWS IN 10 MARKETS MARKETS EAST & SOUTHEAST: ATLANTA: MKT 10, CBS + IND NASHVILLE: MKT 27, NBC WEST & SOUTHWEST: MIDWEST: HARTFORD: MKT 33, CBS PHOENIX: MKT 12, CBS + IND ST. LOUIS: MKT 21, CBS GREENVILLE: MKT 38, FOX PORTLAND: MKT 22, FOX + MyTV KANSAS CITY: MKT 32, CBS + MyTV MOBILE: MKT 58, FOX LAS VEGAS: MKT 39, FOX SAGINAW: MKT 65, CBS SPRINGFIELD: MKT 108, CBS + ABC 18

STRONG FINANCIAL PERFORMANCE OVER TIME DRAFT Revenues 15% Operating Profit 14% CAGR CAGR $693 $215 $630 $189 $534 $548 $163 $158 $403 $113 2 FY14 FY15 FY16 FY17 FY18 FY14 FY15 FY16 FY17 FY18 19 $ in millions

LOCAL MEDIA GROUP GROWTH STRATEGIES • Maximize core non-political advertising revenues • Continue to grow political advertising revenues • Expand digital advertising (MNI Targeted Media) • Continue to grow consumer related revenues • Increase collaboration with National Media Group 20

LOCAL MEDIA GROUP ADVERTISING STRATEGIES Total Company Revenue • Maximize pricing and inventory ~30% • Optimize salesforce structure ~22% ~18% • Grow non-traditional advertising streams ~15% ~5%~10% • Execute aggressive digital sales • Continue to grow political-related advertising Total Non‐Political Advertising Performance Political Advertising Performance 7% $444 14% CAGR $102 $357 $352 CAGR $256 $269 $63 $44 $35 $39 FY11 FY13 FY15 FY17 FY19 FY11 FY13 FY15 FY17 FH19 (Consensus) $ in millions 21

EXPAND DIGITAL ADVERTISING: MNI GROWTH OPPORTUNITY A MEDIA PLANNING AND BUYING COMPANY MNI CLIENTS WITH EXPERTISE IN TARGETED MARKETING 50+ YEARS 86 FULL-TIME OF TARGETING SALES PROFESSIONALS over a decade in digital. 40 locations nationwide Serve over DIGITAL AD 1BIMPRESSIONS across multiple platforms, through thousands of premier publishing partners, with trusted media relationships. 22

LOCAL MEDIA GROUP CONSUMER REVENUE UPDATE Total Company Revenue MVPD AFFILIATION ~30% RENEWALS RENEWALS ~22% Fiscal FOX Affiliates: Las Vegas, Portland, ~18% 2019 35% Greenville, Mobile, Springfield ~15% ~5%~10% Fiscal ABC Affiliate: Springfield 60% CBS Affiliates: St. Louis, Hartford, 2020 Springfield Fiscal CBS Affiliates: Atlanta, Phoenix, 2021 5% Kansas City, Saginaw Fiscal NBC Affiliate: Nashville 2022 35% 23
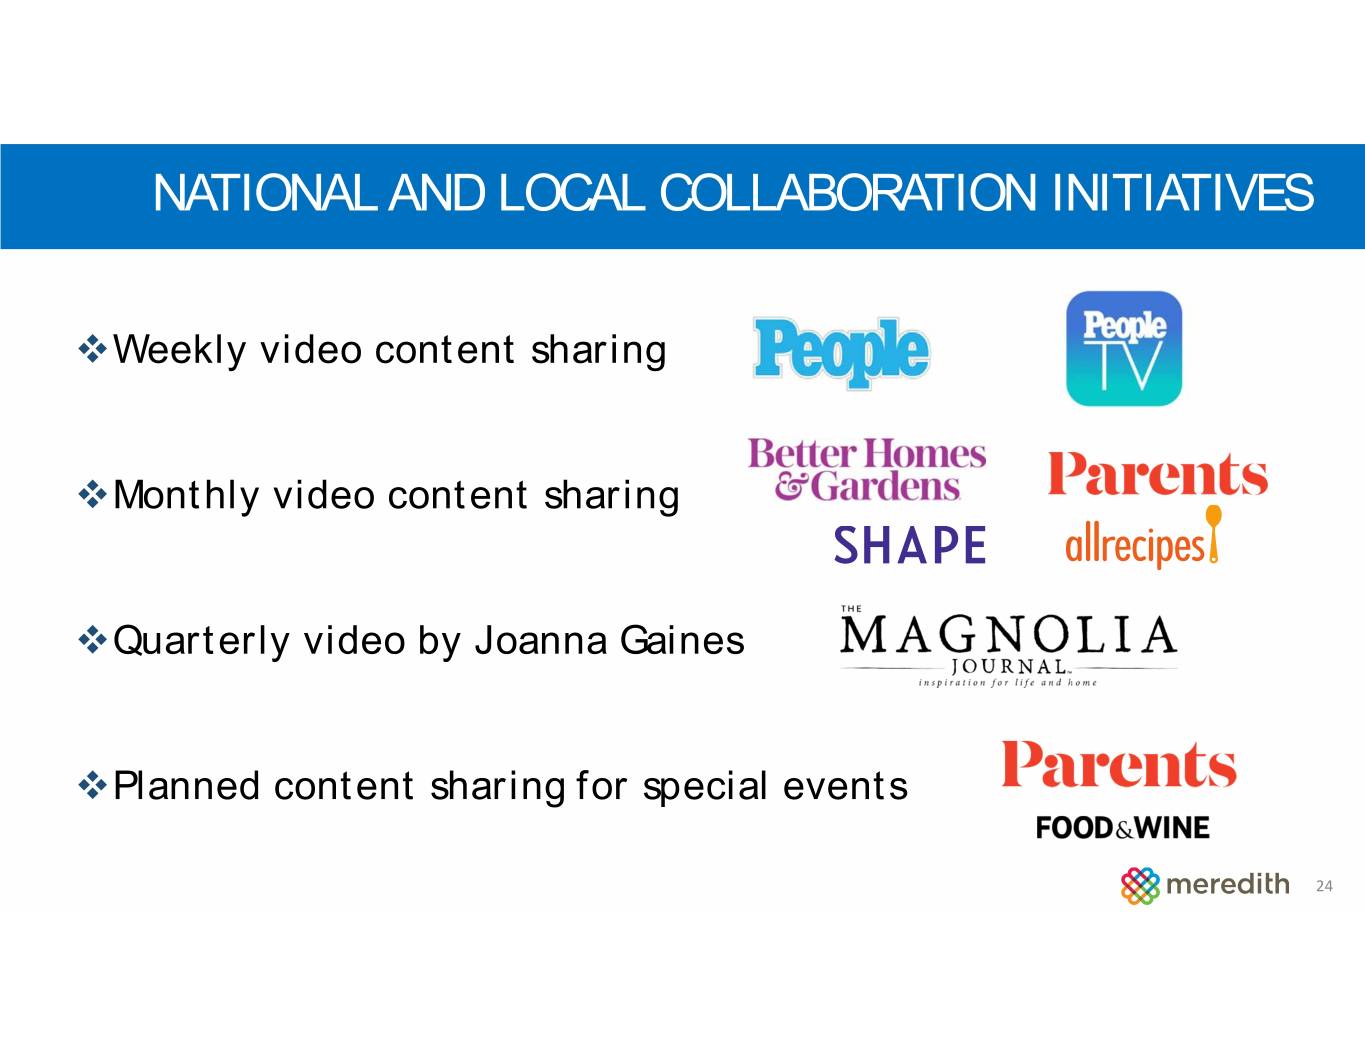
NATIONAL AND LOCAL COLLABORATION INITIATIVES Weekly video content sharing Monthly video content sharing Quarterly video by Joanna Gaines Planned content sharing for special events 24
TODAY’S AGENDA Meredith Overview National Media Group Growth Strategies Local Media Group Growth Strategies Financial Strategy Q&A 25
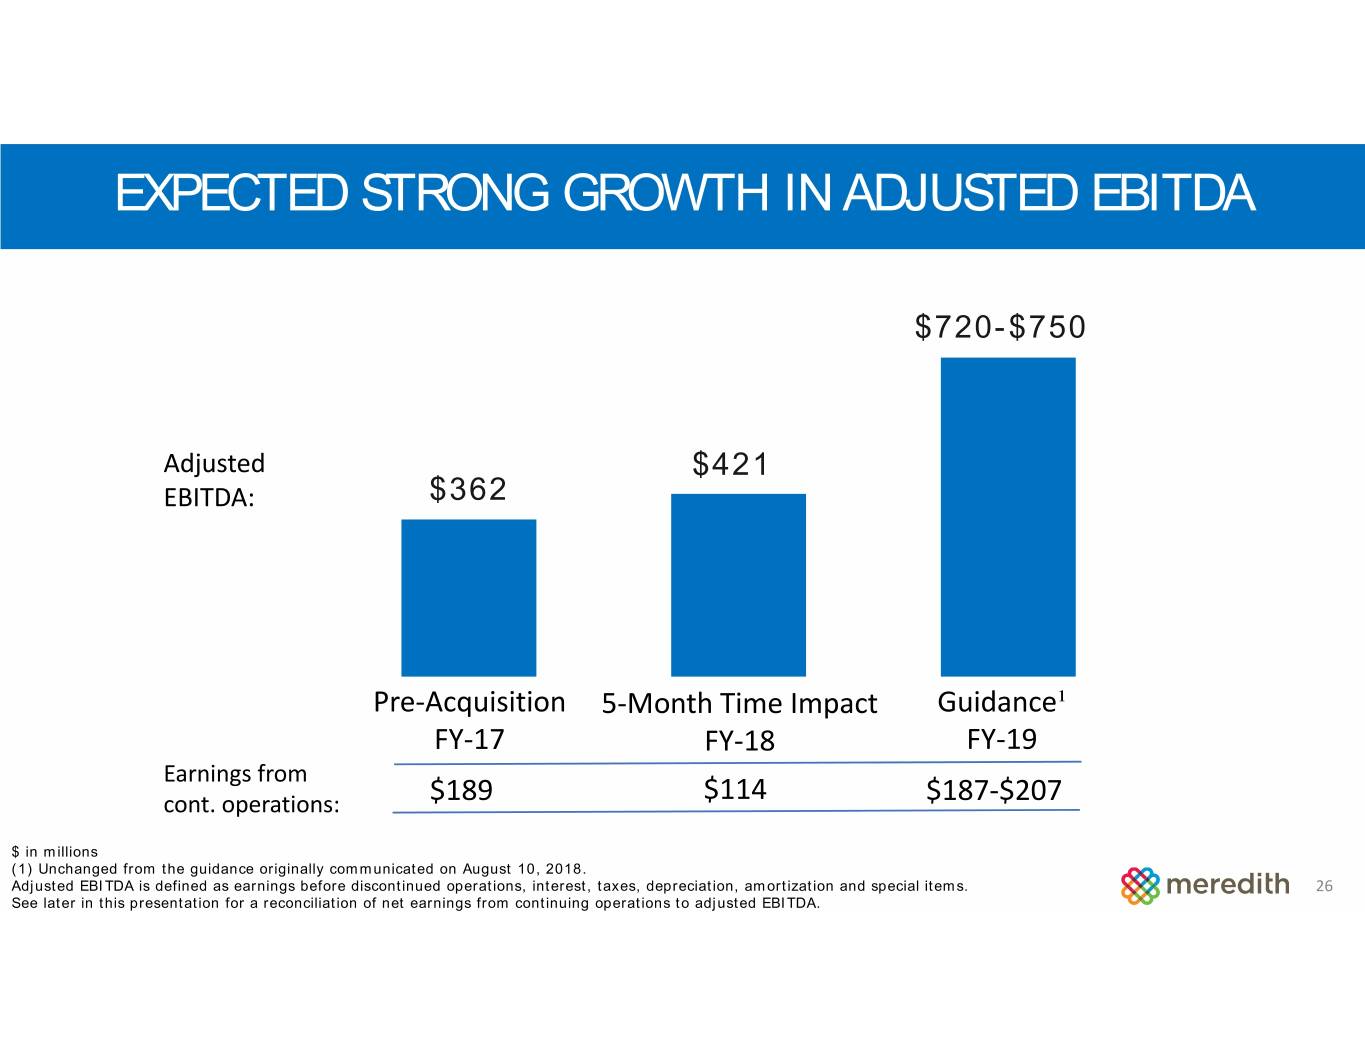
EXPECTED STRONG GROWTH IN ADJUSTED EBITDA $720-$750 Adjusted $421 EBITDA: $362 Pre‐Acquisition 5‐Month Time Impact Guidance¹ FY‐17 FY‐18 FY‐19 Earnings from cont. operations: $189 $114 $187‐$207 $ in millions (1) Unchanged from the guidance originally communicated on August 10, 2018. Adjusted EBITDA is defined as earnings before discontinued operations, interest, taxes, depreciation, amortization and special items. 26 See later in this presentation for a reconciliation of net earnings from continuing operations to adjusted EBITDA.
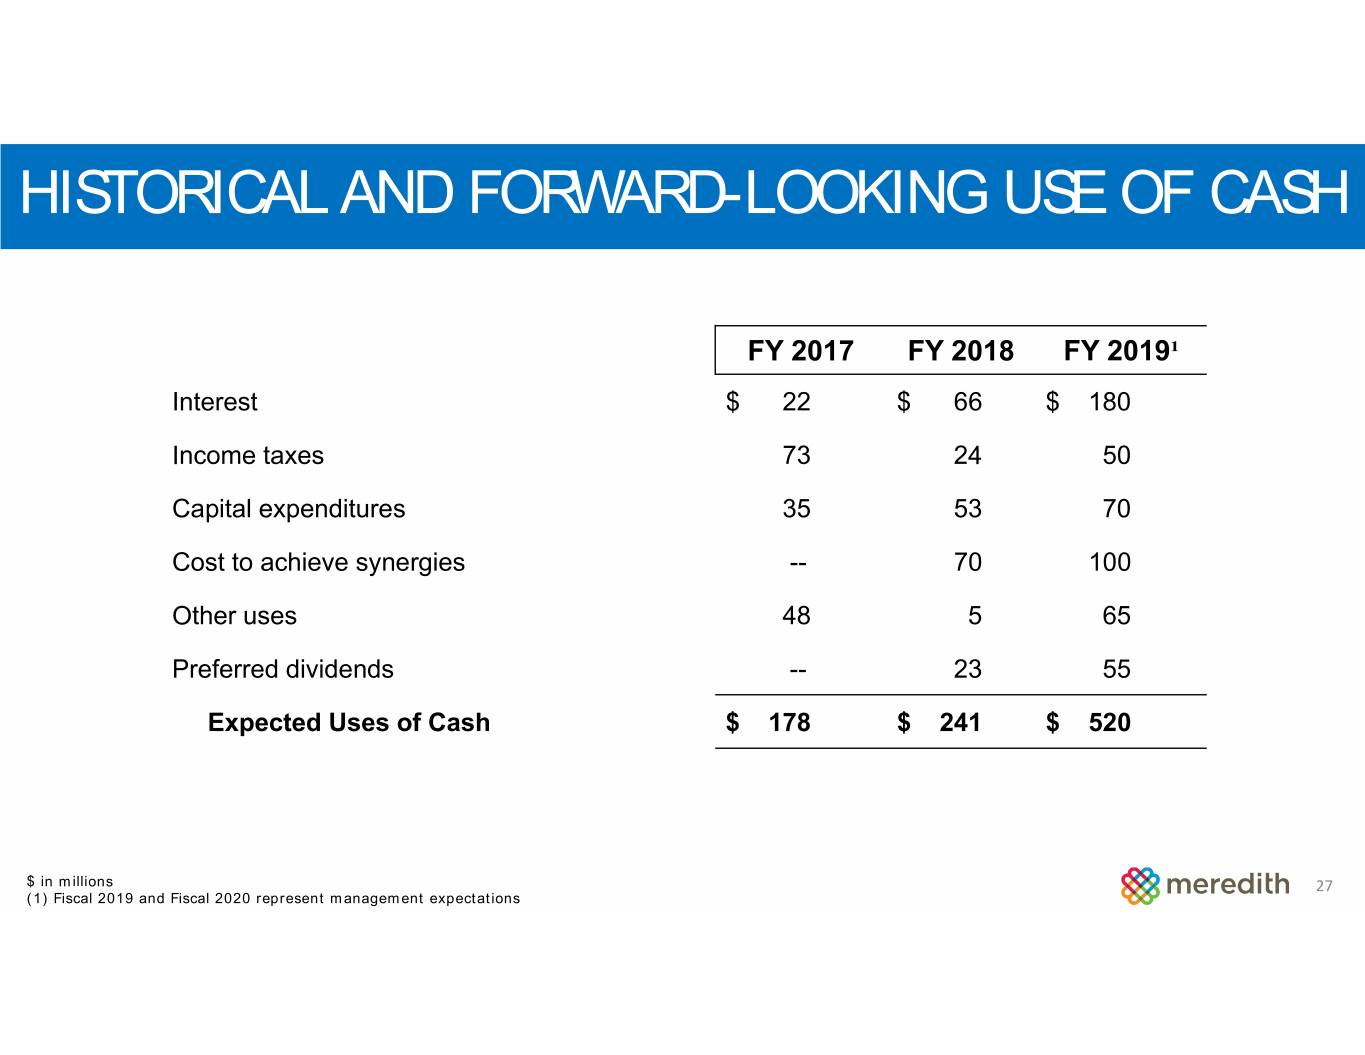
HISTORICAL AND FORWARD-LOOKING USE OF CASH FY 2017 FY 2018 FY 2019¹ Interest $ 22 $ 66 $ 180 Income taxes 73 24 50 Capital expenditures 35 53 70 Cost to achieve synergies -- 70 100 Other uses 48 5 65 Preferred dividends -- 23 55 Expected Uses of Cash $ 178 $ 241 $ 520 $ in millions 27 (1) Fiscal 2019 and Fiscal 2020 represent management expectations
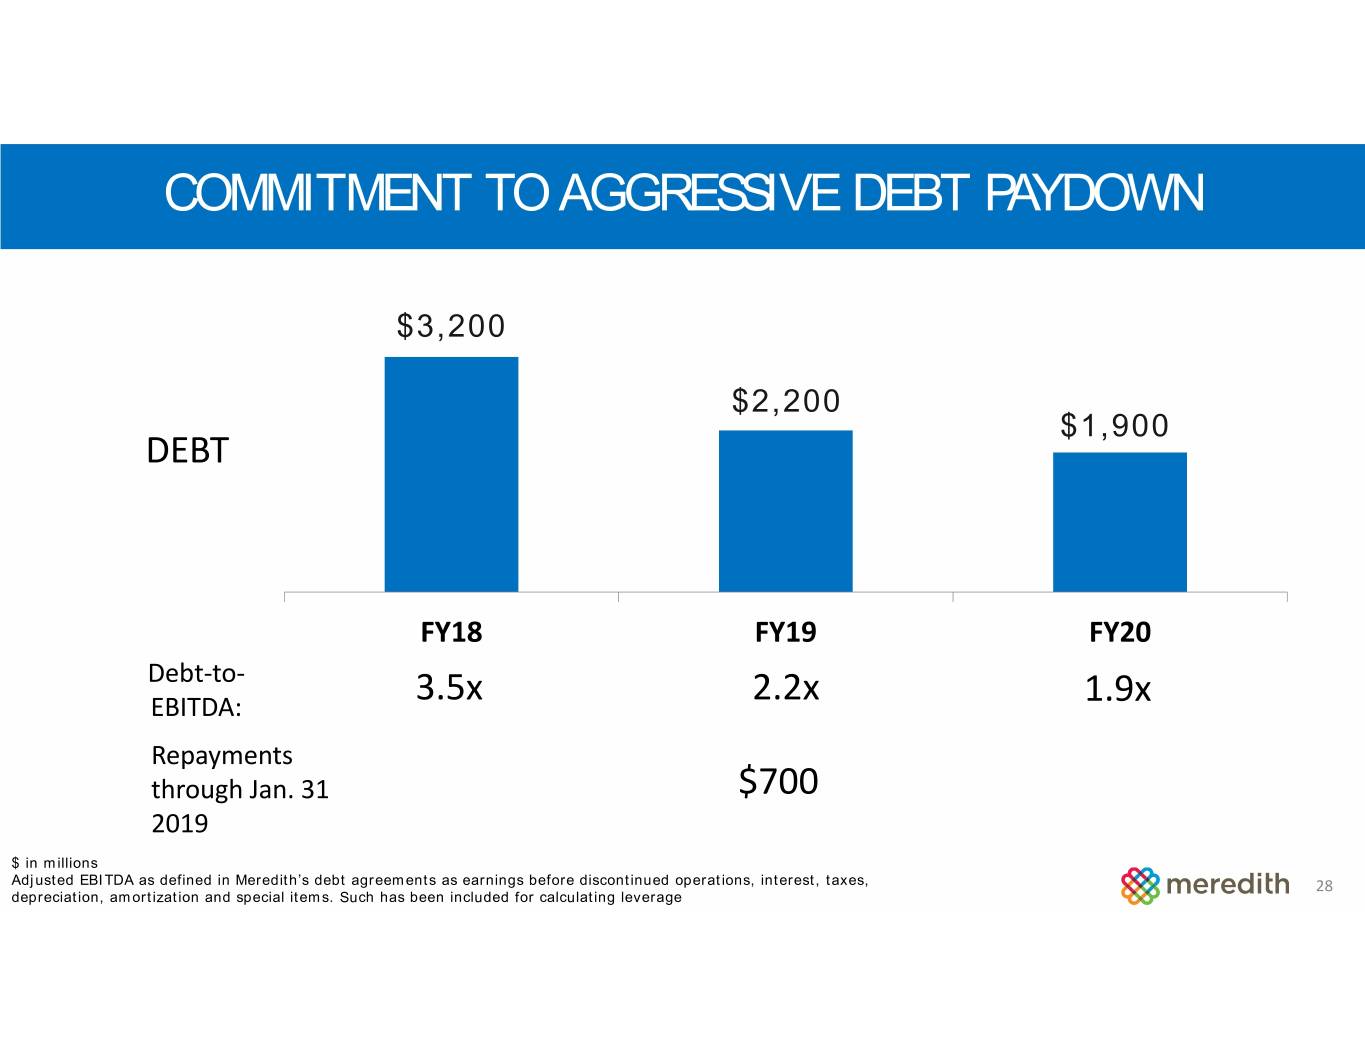
COMMITMENT TO AGGRESSIVE DEBT PAYDOWN $3,200 $2,200 $1,900 DEBT FY18 FY19 FY20 Debt‐to‐ EBITDA: 3.5x 2.2x 1.9x Repayments through Jan. 31 $700 2019 $ in millions Adjusted EBITDA as defined in Meredith’s debt agreements as earnings before discontinued operations, interest, taxes, 28 depreciation, amortization and special items. Such has been included for calculating leverage
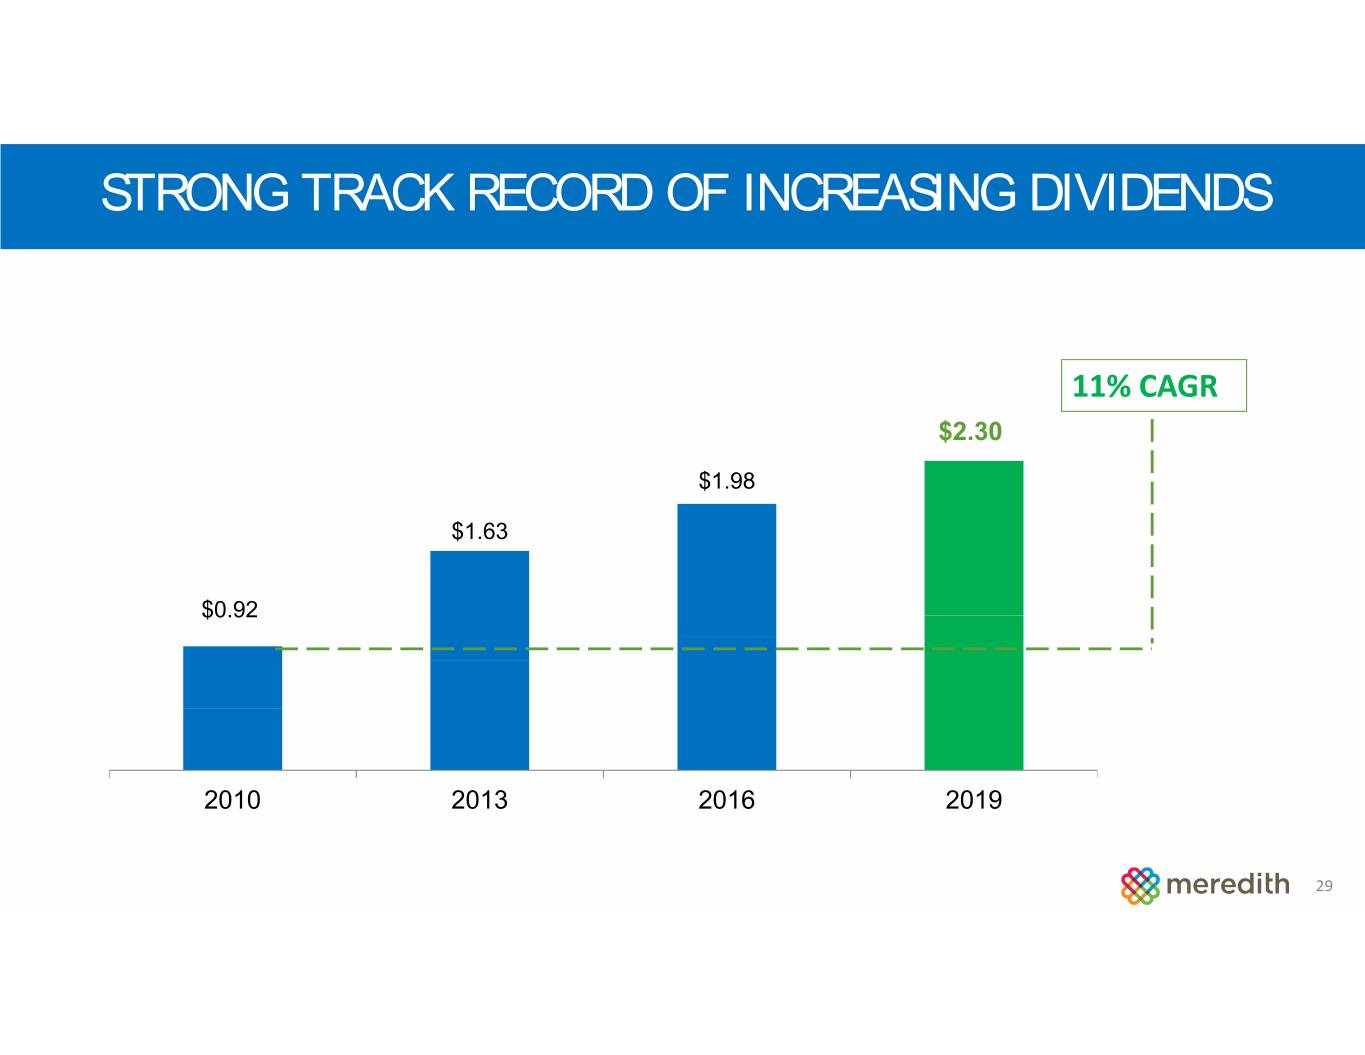
STRONG TRACK RECORD OF INCREASING DIVIDENDS 11% CAGR $2.30 $1.98 $1.63 $0.92 2010 2013 2016 2019 29

Fiscal 2019 Third Quarter Guidance Third Quarter: Earnings from Continuing Operations: $29 million to $36 million Adjusted EBITDA1: $145 million to $155 million Earnings per share: $0.21 to $0.36 Adjusted Earnings per Share1: $1.25 to $1.41 Full Year: Earnings from Continuing Operations: $187 million to $207 million Adjusted EBITDA1,2: $720 million to $750 million Earnings per share: $2.40 to $2.82 Adjusted Earnings per Share1: $6.89 to $7.31 (1) Before special items. Actual results for the third quarter and full fiscal year may include additional special items that have not yet occurred and are difficult to predict with reasonable certainty. (2) Unchanged from August 10, 2018 30
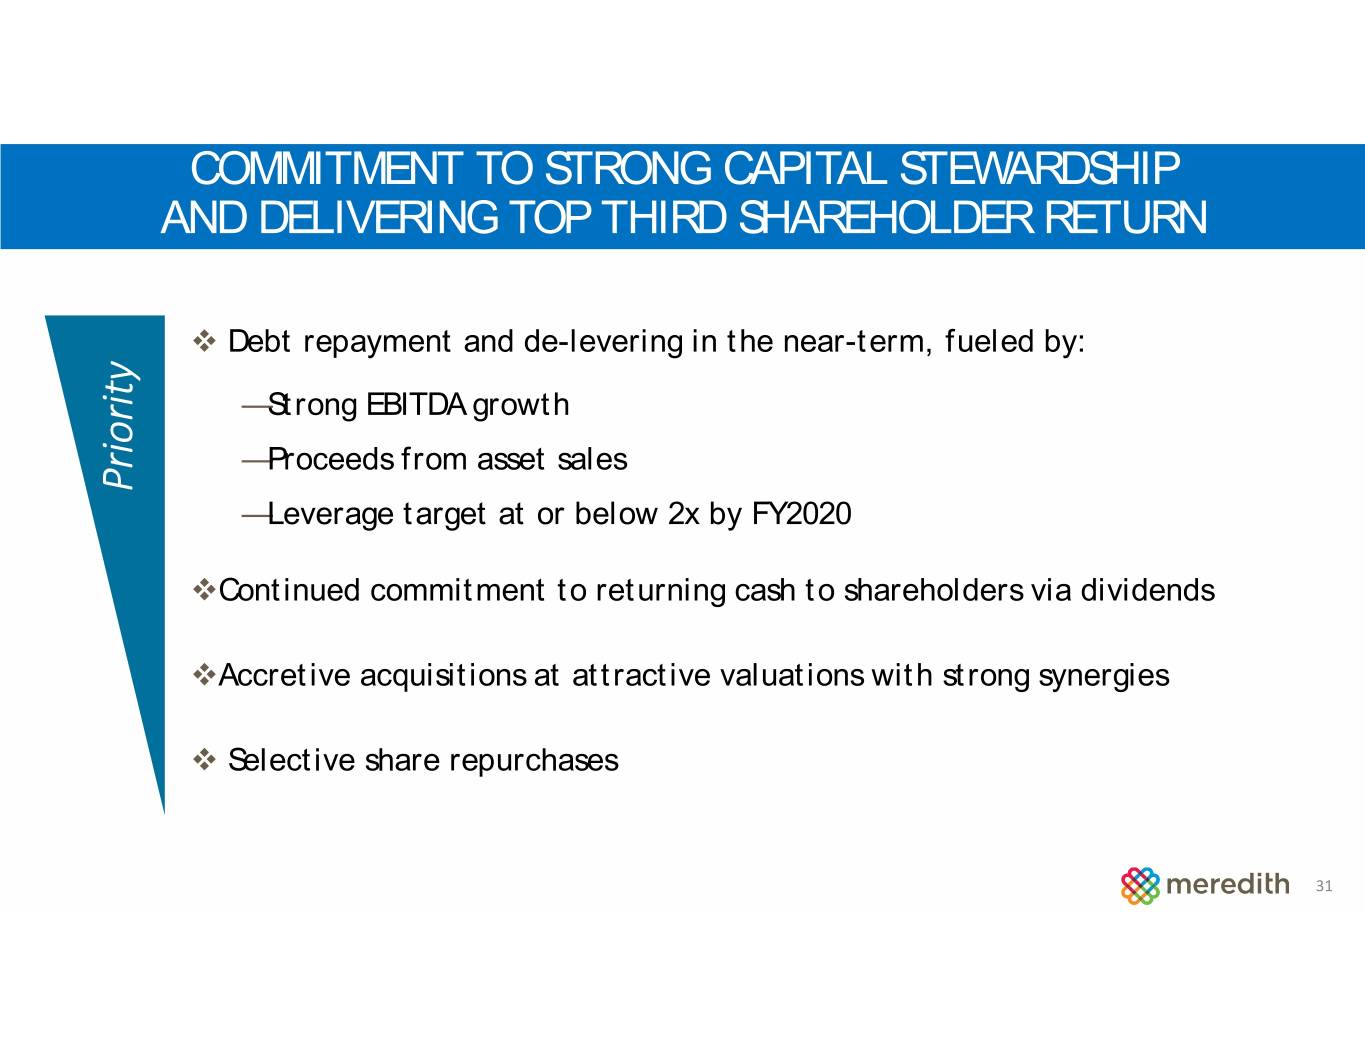
COMMITMENT TO STRONG CAPITAL STEWARDSHIP AND DELIVERING TOP THIRD SHAREHOLDER RETURN Debt repayment and de-levering in the near-term, fueled by: —Strong EBITDA growth —Proceeds from asset sales Priority —Leverage target at or below 2x by FY2020 Continued commitment to returning cash to shareholders via dividends Accretive acquisitions at attractive valuations with strong synergies Selective share repurchases 31

General Investor Presentation March 2019
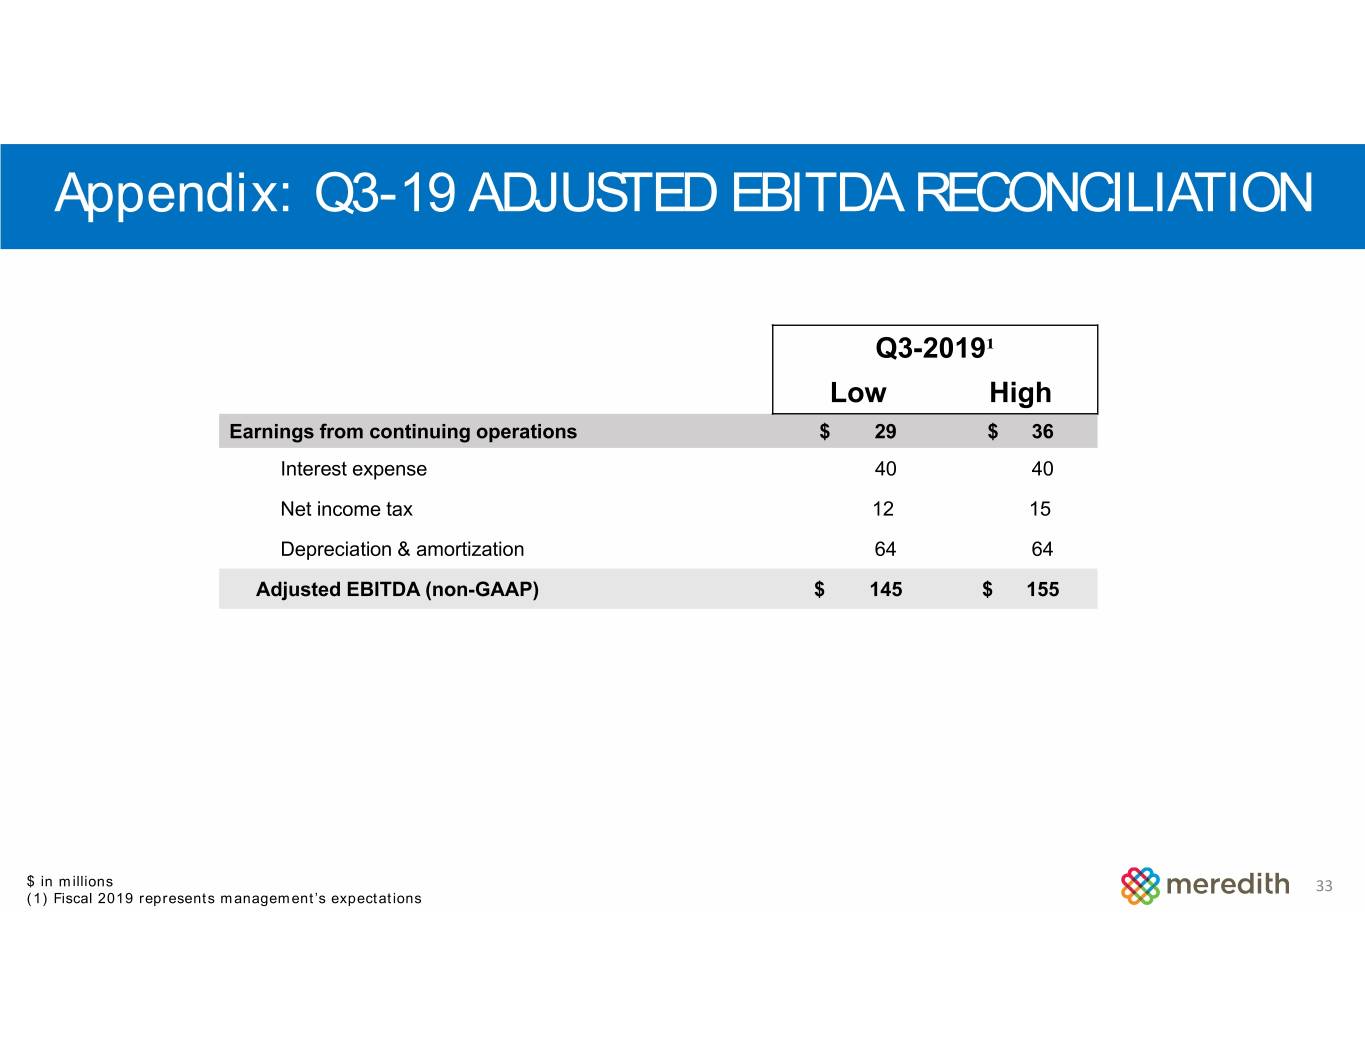
Appendix: Q3-19 ADJUSTED EBITDA RECONCILIATION Q3-2019¹ Low High Earnings from continuing operations $ 29 $ 36 Interest expense 40 40 Net income tax 12 15 Depreciation & amortization 64 64 Adjusted EBITDA (non-GAAP) $ 145 $ 155 $ in millions 33 (1) Fiscal 2019 represents management’s expectations
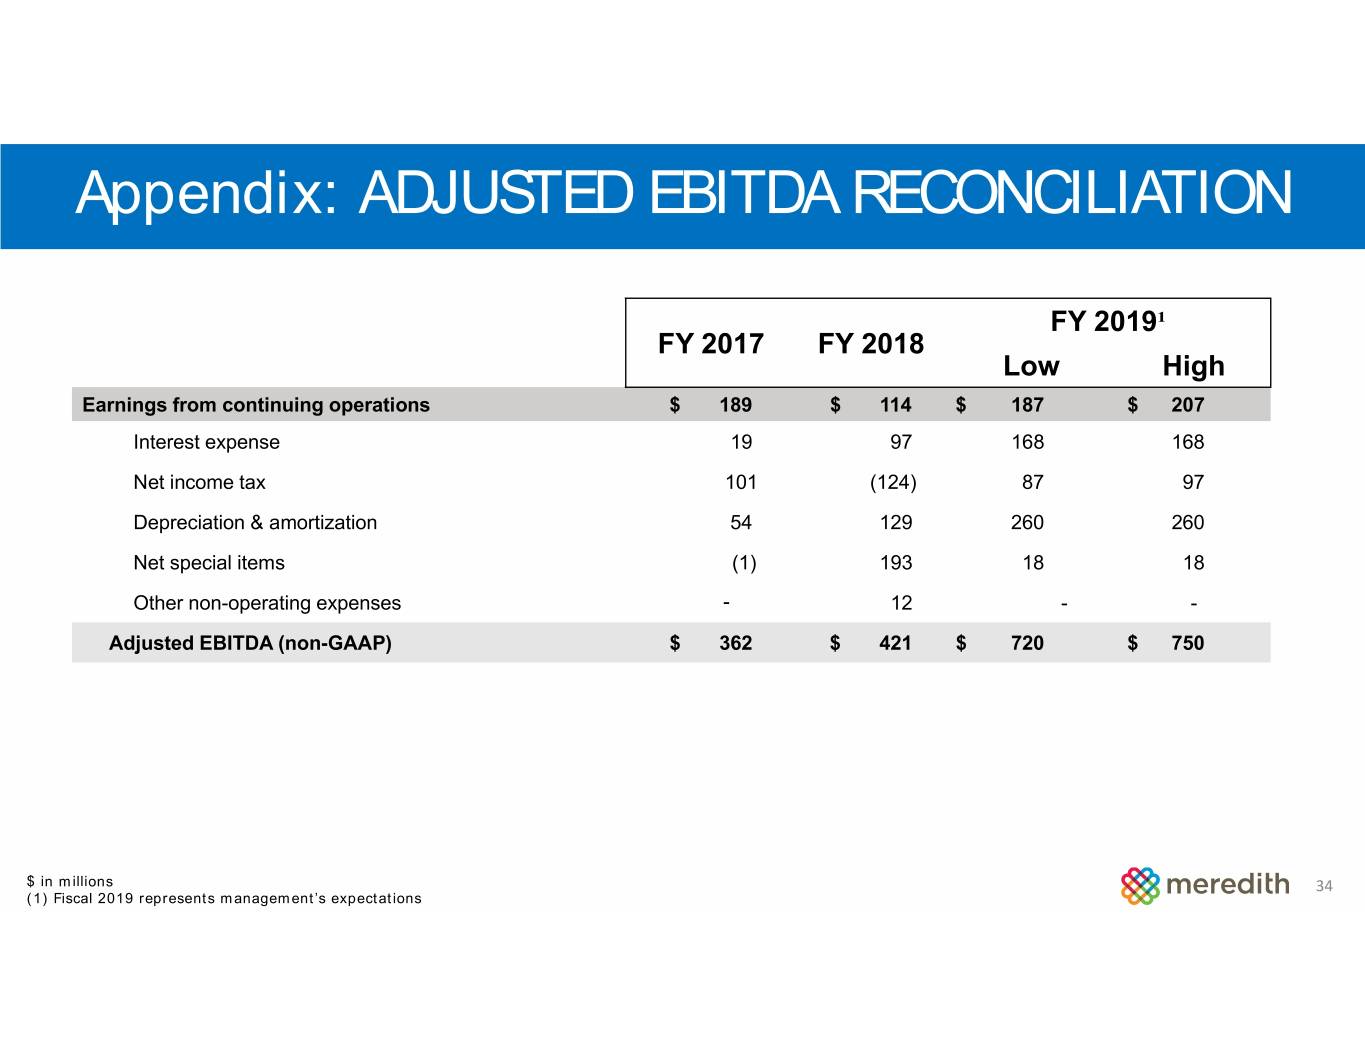
Appendix: ADJUSTED EBITDA RECONCILIATION FY 2019¹ FY 2017 FY 2018 Low High Earnings from continuing operations $ 189 $ 114 $ 187 $ 207 Interest expense 19 97 168 168 Net income tax 101 (124) 87 97 Depreciation & amortization 54 129 260 260 Net special items (1) 193 18 18 Other non-operating expenses - 12 - - Adjusted EBITDA (non-GAAP) $ 362 $ 421 $ 720 $ 750 $ in millions 34 (1) Fiscal 2019 represents management’s expectations
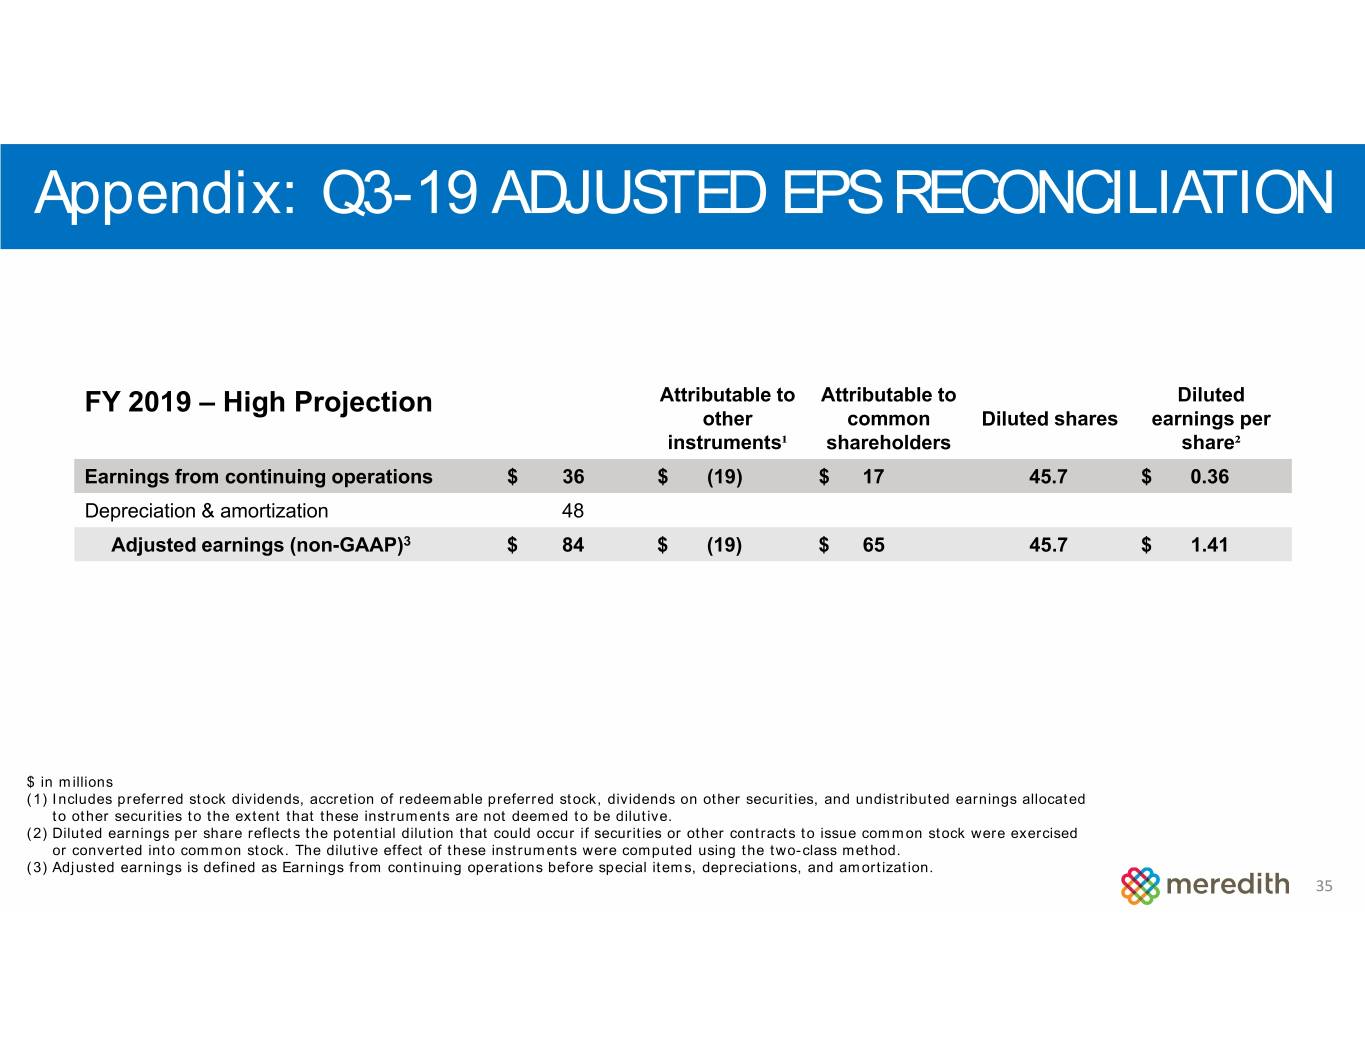
Appendix: Q3-19 ADJUSTED EPS RECONCILIATION FY 2019 – High Projection Attributable to Attributable to Diluted other common Diluted shares earnings per instruments¹ shareholders share² Earnings from continuing operations $ 36 $ (19) $ 17 45.7 $ 0.36 Depreciation & amortization 48 Adjusted earnings (non-GAAP)3 $ 84 $ (19) $ 65 45.7 $ 1.41 $ in millions (1) Includes preferred stock dividends, accretion of redeemable preferred stock, dividends on other securities, and undistributed earnings allocated to other securities to the extent that these instruments are not deemed to be dilutive. (2) Diluted earnings per share reflects the potential dilution that could occur if securities or other contracts to issue common stock were exercised or converted into common stock. The dilutive effect of these instruments were computed using the two-class method. (3) Adjusted earnings is defined as Earnings from continuing operations before special items, depreciations, and amortization. 35
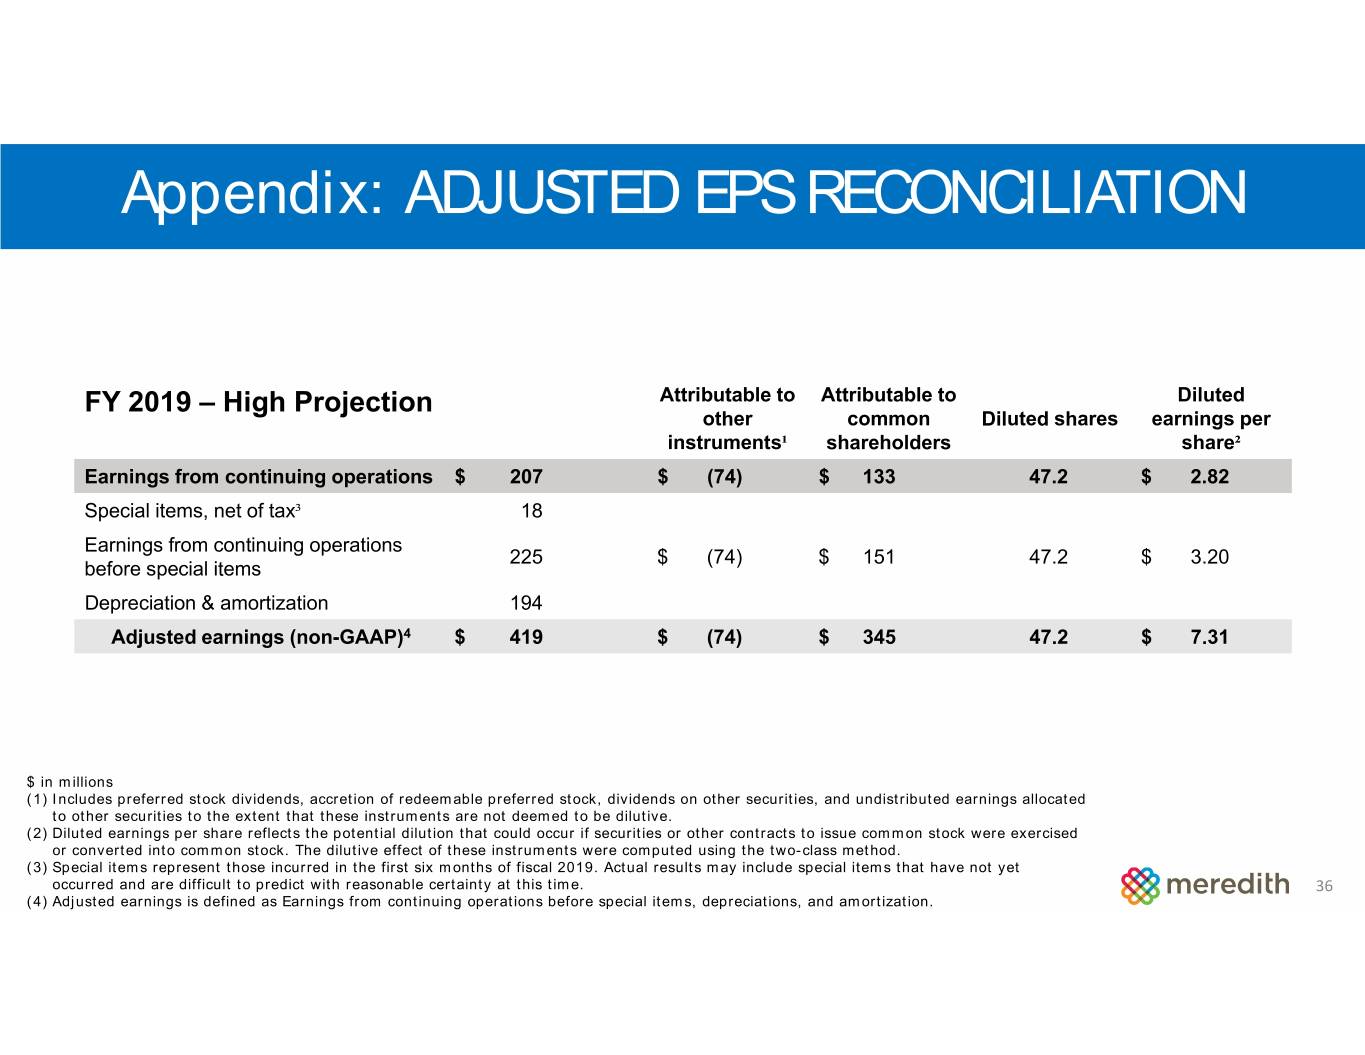
Appendix: ADJUSTED EPS RECONCILIATION FY 2019 – High Projection Attributable to Attributable to Diluted other common Diluted shares earnings per instruments¹ shareholders share² Earnings from continuing operations $ 207 $ (74) $ 133 47.2 $ 2.82 Special items, net of tax³ 18 Earnings from continuing operations 225 $ (74) $ 151 47.2 $ 3.20 before special items Depreciation & amortization 194 Adjusted earnings (non-GAAP)4 $ 419 $ (74) $ 345 47.2 $ 7.31 $ in millions (1) Includes preferred stock dividends, accretion of redeemable preferred stock, dividends on other securities, and undistributed earnings allocated to other securities to the extent that these instruments are not deemed to be dilutive. (2) Diluted earnings per share reflects the potential dilution that could occur if securities or other contracts to issue common stock were exercised or converted into common stock. The dilutive effect of these instruments were computed using the two-class method. (3) Special items represent those incurred in the first six months of fiscal 2019. Actual results may include special items that have not yet occurred and are difficult to predict with reasonable certainty at this time. 36 (4) Adjusted earnings is defined as Earnings from continuing operations before special items, depreciations, and amortization.
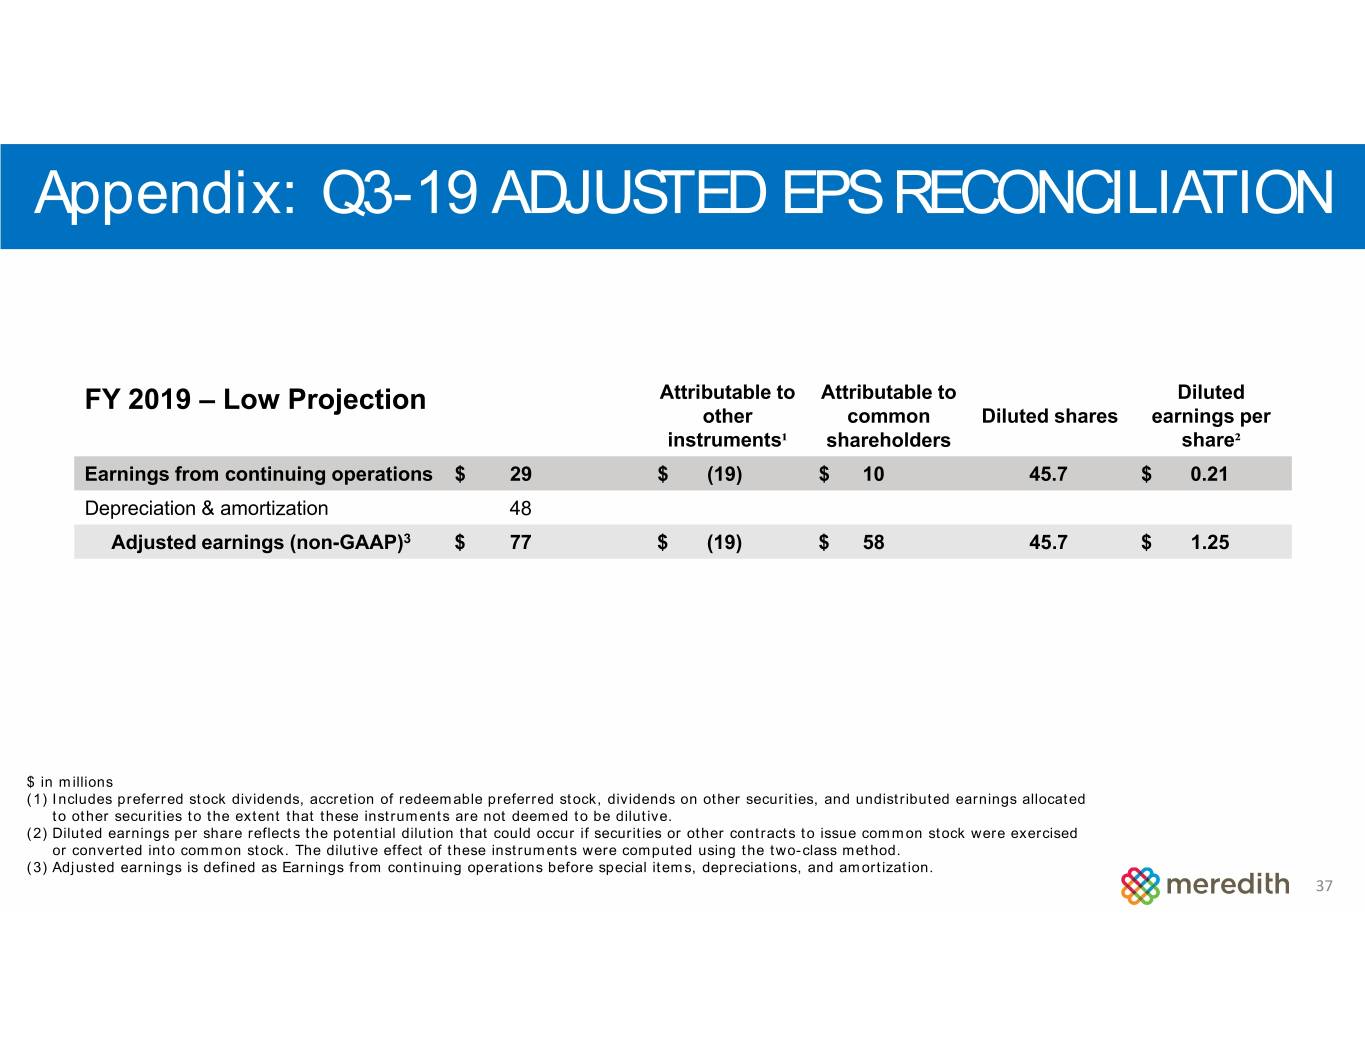
Appendix: Q3-19 ADJUSTED EPS RECONCILIATION FY 2019 – Low Projection Attributable to Attributable to Diluted other common Diluted shares earnings per instruments¹ shareholders share² Earnings from continuing operations $ 29 $ (19) $ 10 45.7 $ 0.21 Depreciation & amortization 48 Adjusted earnings (non-GAAP)3 $ 77 $ (19) $ 58 45.7 $ 1.25 $ in millions (1) Includes preferred stock dividends, accretion of redeemable preferred stock, dividends on other securities, and undistributed earnings allocated to other securities to the extent that these instruments are not deemed to be dilutive. (2) Diluted earnings per share reflects the potential dilution that could occur if securities or other contracts to issue common stock were exercised or converted into common stock. The dilutive effect of these instruments were computed using the two-class method. (3) Adjusted earnings is defined as Earnings from continuing operations before special items, depreciations, and amortization. 37
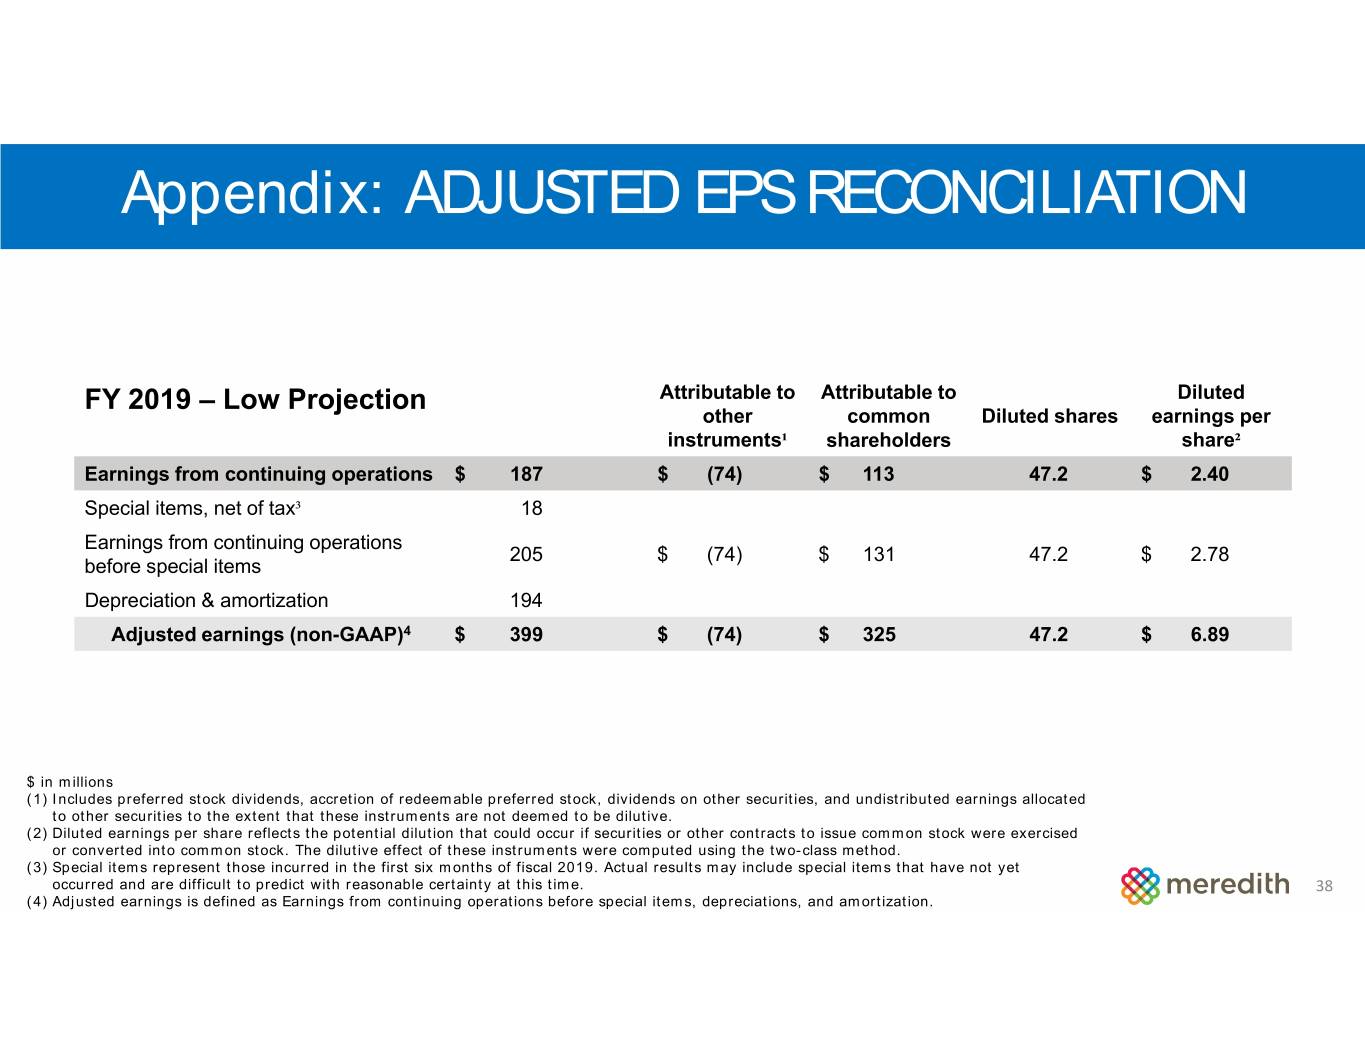
Appendix: ADJUSTED EPS RECONCILIATION FY 2019 – Low Projection Attributable to Attributable to Diluted other common Diluted shares earnings per instruments¹ shareholders share² Earnings from continuing operations $ 187 $ (74) $ 113 47.2 $ 2.40 Special items, net of tax³ 18 Earnings from continuing operations 205 $ (74) $ 131 47.2 $ 2.78 before special items Depreciation & amortization 194 Adjusted earnings (non-GAAP)4 $ 399 $ (74) $ 325 47.2 $ 6.89 $ in millions (1) Includes preferred stock dividends, accretion of redeemable preferred stock, dividends on other securities, and undistributed earnings allocated to other securities to the extent that these instruments are not deemed to be dilutive. (2) Diluted earnings per share reflects the potential dilution that could occur if securities or other contracts to issue common stock were exercised or converted into common stock. The dilutive effect of these instruments were computed using the two-class method. (3) Special items represent those incurred in the first six months of fiscal 2019. Actual results may include special items that have not yet occurred and are difficult to predict with reasonable certainty at this time. 38 (4) Adjusted earnings is defined as Earnings from continuing operations before special items, depreciations, and amortization.


