UNITED STATES SECURITIES AND EXCHANGE COMMISSION
WASHINGTON, D.C. 20549
FORM 10-K/A
Amendment No. 1
[ X ] ANNUAL REPORT PURSUANT TO SECTION 13 OR 15(d) OF THE SECURITIES EXCHANGE ACT OF 1934
For fiscal year ended: January 31, 2012
or
[ ] TRANSITION REPORT PURSUANT TO SECTION 13 OR 15(d) OF THE SECURITIES EXCHANGE ACT OF 1934
Commission file number 001-07763
MET-PRO CORPORATION
(Exact name of registrant as specified in its charter)
| Pennsylvania | 23-1683282 | |
| (State or other jurisdiction of | (I.R.S. Employer | |
| incorporation or organization) | Identification No.) | |
| 160 Cassell Road, P. O. Box 144 | ||
| Harleysville, Pennsylvania | 19438 | |
| (Address of principal executive offices) | (Zip Code) |
| Registrant’s telephone number, including area code: (215) 723-6751 |
| Securities registered pursuant to Section 12(b) of the Act: |
| Name of each exchange on | ||
| Title of each class | which registered | |
| Common Shares, par value $0.10 per share | New York Stock Exchange |
Securities registered pursuant to Section 12(g) of the Act:
None
Indicate by check mark if the registrant is a well-known seasoned issuer, as defined in Rule 405 of the Securities Act. Yes [ ] No [ X ]
Indicate by check mark if the registrant is not required to file reports pursuant to Section 13 or Section 15(d) of the Exchange Act. Yes [ ] No [ X ]
Indicate by check mark whether the Registrant (1) has filed all reports required to be filed by Section 13 or 15(d) of the Securities Exchange Act of 1934 during the preceding 12 months (or for such shorter period that the Registrant was required to file such reports), and (2) has been subject to such filing requirements for the past 90 days. Yes [ X ] No [ ]
Indicate by check mark if disclosure of delinquent filers pursuant to Item 405 of Regulation S-K is not contained herein, and will not be contained, to the best of the Registrant’s knowledge, in definitive proxy or information statements incorporated by reference in Part III of the Form 10-K/A or any amendment to this Form 10-K/A. [ ]
Indicate by check mark whether the registrant has submitted electronically and posted on its corporate website, if any, every Interactive Data File required to be submitted and posted pursuant to Rule 405 of Regulations S-T (§232.405 of this chapter) during the preceding 12 months (or for such shorter period that the registrant was required to submit and post such files). Yes [ X ] No [ ]
Indicate by check mark whether the registrant is a large accelerated filer, an accelerated filer, a non-accelerated filer, or a smaller reporting company. See definition of “large accelerated filer”, “accelerated filer” and “smaller reporting company” in Rule 12b-2 under the Exchange Act.
Large accelerated filer [ ] Accelerated filer [ X ] Non-accelerated filer [ ] Smaller reporting company [ ]
Indicate by check mark whether the Registrant is a shell company (as defined in Rule 12b-2 of the Exchange Act). Yes [ ] No [ X ]
The aggregate market value of the Common Shares, par value $0.10 per share, held by non-affiliates as of (based upon the closing sales price on the New York Stock Exchange on July 31, 2011) the last business day of the Registrant’s most recently completed second fiscal quarter was $154,511,604.
The number of Registrant’s outstanding Common Shares was 14,678,628 as of March 22, 2012.
DOCUMENTS INCORPORATED BY REFERENCE
Form 10-K/A Part Number | |
| Portions of Registrant’s Definitive Proxy Statement filed pursuant to Regulation 14A | |
| in connection with Registrant’s Annual Meeting of Shareholders to be held on June 6, 2012 | III |
Explanatory Note
The purpose of this Amendment No. 1 (this “Amendment”) on Form 10-K/A to the Annual Report on Form 10-K of Met-Pro Corporation (the “Company”) for the fiscal year ended January 31, 2012, as originally filed on March 22, 2012 (“Original Filing”), is solely to correct the reports of the independent registered public accounting firm in the Original Filing to make reference to the fact that their opinion on the consolidated financial statements covers the financial statements and financial statement schedule for each of the years in the three-year period ended January 31, 2012 instead of for the years ended January 31, 2012 and 2011 as reflected in the Original Filing.
The only substantive changes made by this Form 10-K/A as compared with the Original Filing are to the reports of the independent registered public accounting firm, which are changed as described in the preceding paragraph. These reports are contained in Item 8 of Part II of this Form 10-K/A, under the caption “Financial Statements and Supplementary Data”, and this Form 10-K/A contains the corrected reports of the independent registered public accounting firm. This Form 10-K/A continues to speak as of the date of our original Form 10-K. We have not updated the disclosures to read as of a later date or to reflect subsequent results, events or developments, and information in the original Form 10-K not affected by the foregoing is unchanged and reflects the disclosures made at the time of the filing of the original Form 10-K. Accordingly, this Form 10-K/A should be read in conjunction with the Securities and Exchange Commission filings that we make subsequent to the March 22, 2012 filing of the original Form 10-K, including any amendments to those filings.
Pursuant to the applicable rules, Item 15 of Part IV has been updated to contain currently dated certifications from our principal executive officer and principal financial officer, as required by Sections 302 and 906 of the Sarbanes-Oxley Act of 2002. The certifications of our principal executive officer and principal financial officer are attached to this Form 10-K/A as Exhibits 31.1, 31.2, 32.1 and 32.2, respectively.
| Page |
PART I
| Item 1. | 1 | ||
| 7 | |||
| Item 1A. | 8 | ||
| Item 1B. | 11 | ||
| Item 2. | 12 | ||
| Item 3. | 13 | ||
| Item 4. | 13 |
PART II
| Item 5. | |||
| 14 | |||
| Item 6. | 17 | ||
| Item 7. | 18 | ||
| 26 | |||
| Item 7A. | 28 | ||
| Item 8. | 29 | ||
| Item 9. | 67 | ||
| Item 9A. | 67 | ||
| Item 9B. | 67 |
PART III
| Item 10. | 68 | ||
| Item 11. | 68 | ||
| Item 12. | 68 | ||
| Item 13. | 69 | ||
| Item 14. | 69 |
PART IV
FACTORS THAT MAY AFFECT FUTURE RESULTS Met-Pro’s prospects are subject to certain uncertainties and risks. This Annual Report on Form 10-K/A also contains certain forward-looking statements within the meaning of the Federal securities laws. Met-Pro’s future results may differ materially from its current results and actual results could differ materially from those projected in the forward-looking statements, perhaps for reasons described in “Risk Factors”, and perhaps for other unanticipated reasons. Readers should pay particular attention to the considerations described in the section of this report entitled “Management’s Discussion and Analysis of Financial Condition and Results of Operations – Forward-Looking Statements; Factors That May Affect Future Results.” Readers should also carefully review the risk factors identified in this Annual Report and in other documents Met-Pro files from time to time with the Securities and Exchange Commission. |
PART I
General:
Met-Pro Corporation (“Met-Pro” or the “Company”), incorporated in the State of Delaware on March 30, 1966 and reincorporated in the State of Pennsylvania on July 31, 2003, manufactures and sells product recovery and pollution control equipment for purification of air and liquids, fluid handling equipment for corrosive, abrasive and high temperature liquids, and filtration and purification products. The Company markets and sells its products through its own personnel, distributors, representatives and agents. The Company’s products are sold worldwide primarily in industrial markets. The Company was taken public on April 6, 1967 and traded on the American Stock Exchange from July 25, 1978 until June 18, 1998, at which time the Company’s Common Shares began trading on the New York Stock Exchange, where it currently trades under the symbol “MPR”.
The Company’s principal executive offices are located at 160 Cassell Road, Harleysville, Pennsylvania and the telephone number at that location is (215) 723-6751. Our website address is www.met-pro.com.
Our Annual Report on Form 10-K and Form 10-K/A and other reports filed pursuant to Section 13(a) and 15(d) of the Securities Exchange Act of 1934, as amended (the “Exchange Act”), are made available free of charge on or through our website at www.met-pro.com as soon as reasonably practicable after such reports are filed with, or furnished to, the Securities and Exchange Commission (the “SEC”). Copies of our (i) Corporate Governance Guidelines, (ii) charters for the Audit Committee, Compensation and Management Development Committee, and Corporate Governance and Nominating Committee, and (iii) Code of Business Conduct and Ethics are available at www.met-pro.com under the “Investor Relations – Corporate Governance” captions. Copies will also be provided to any shareholder upon written request to the Secretary, Met-Pro Corporation, 160 Cassell Road, P.O. Box 144, Harleysville, Pennsylvania 19438.
Except where otherwise indicated by the context used herein, references to the “Company”, “we”, “our” and “us” refer to Met-Pro Corporation and its wholly-owned subsidiaries.
Products, Services and Markets:
The Company has identified five operating segments and has aggregated those operating segments into three reportable segments and one other segment, as follows, respectively: (i) Product Recovery/Pollution Control Technologies; (ii) Fluid Handling Technologies; (iii) Mefiag Filtration Technologies; with the other segment being Filtration/Purification Technologies. The Filtration/Purification Technologies segment is comprised of two operating segments that do not meet the criteria for aggregation outlined in Financial Accounting Standards Board (“FASB”) Accounting Standards Codification (“ASC”) Topic 280, “Segment Reporting”, but which can be combined due to certain quantitative thresholds listed in ASC Topic 280-10-50-12.
The following is a description of each segment:
Product Recovery/Pollution Control Technologies Reporting Segment:
This reportable segment consists of one operating segment that provides solutions and manufactures products for the purification of air or liquids. Many of these products are custom designed and engineered to solve a customer’s product recovery or pollution control issues. The products are sold worldwide through Company sales personnel and a network of manufacturer’s representatives. This reporting segment is comprised of the Met-Pro Environmental Air Solutions, Strobic Air Corporation, Met-Pro Product Recovery/Pollution Control Technologies Inc. and Met-Pro Chile Limitada business units.
Met-Pro Environmental Air Solutions is a leading niche-oriented global provider of solutions and products for product recovery and pollution control applications. Its diverse and synergistic solutions and products address the world’s growing need to meet the demands of more stringent emission regulations, reduce energy consumption and employ “green technology”. Product lines include: Duall brand chemical and BIO-PROTM biological odor control systems, fume and emergency gas scrubbers, HydroLanceTM wet particulate collectors, carbon adsorption systems, mist eliminators, air strippers and degasifiers for contaminated groundwater treatment, ducting and exhaust fans; Flex-Kleen brand pulse jet fabric filters, product recovery and dry particulate collectors and cyclones; Met-Pro Systems brand custom engineered carbon adsorption systems for the concentration and recovery of volatile solvents, thermal and catalytic oxidation systems, regenerative thermal oxidizers, enclosed flares and the supply of abatement catalysts; Bio-Reaction Industries brand bio-oxidation systems for eliminating volatile organic compounds, hazardous air pollutants and odors; and Met-Pro Industrial Services brand field services including installation, preventative maintenance, trouble shooting, repair, upgrade and performance testing on products related to the Product Recovery/Pollution Control Technologies reporting segment. Met-Pro Environmental Air Solutions’ product lines are sold to a wide variety of markets including, but not limited to, metal finishing and plating, wastewater treatment, composting, food processing, ethanol production, chemical, petrochemical, printed circuit, semiconductor, steel pickling, battery manufacturing, groundwater remediation, automotive, aerospace, furniture, painting, electronics, printing, and pharmaceutical industries. These product lines are sold worldwide by a combination of in-house personnel and manufacturer’s representatives, as well as through the Company’s wholly-owned Canadian subsidiary, Met-Pro Product Recovery/Pollution Control Technologies Inc. and the Company’s wholly-owned Chilean subsidiary, Met-Pro Chile Limitada. Met-Pro Environmental Air Solutions has facilities in Owosso, Michigan; Harleysville, Pennsylvania; Glendale Heights, Illinois; and Tualatin, Oregon.
Strobic Air Corporation, located in Harleysville, Pennsylvania, is a recognized technological leader in the air movement industry and designs and manufactures technologically advanced exhaust systems for laboratory fume hoods in university, public health, government, chemical, pharmaceutical, industrial and other process industries. With three decades of experience in addressing the needs of laboratory researchers and facility owners, Strobic Air has continued to develop and enhance its Tri-Stack™ roof exhaust systems to provide even greater flows, lower energy costs and decreased noise levels. Strobic Air Tri-Stack™ laboratory fume hood exhaust systems meet the requirements of ANSI Z9.5, the American National Standard for Laboratory Ventilation. Heat recovery systems by Strobic Air provide energy conservation on laboratory fume hood exhaust systems. Unique glycol/water heat exchanger coil modules for Tri-Stack™ systems extract exhaust heat for heating or cooling conditioned makeup air. Strobic’s HEPA filtration system allows users to comply fully with ventilation standards for specialized care environments such as airborne infection isolation rooms. These product lines are sold worldwide by a combination of in-house personnel and manufacturer’s representatives.
Met-Pro Product Recovery/Pollution Control Technologies Inc. located in Vaughan, Ontario, Canada, markets, sells and distributes in Canada the Duall, Flex-Kleen, Met-Pro Systems and Bio-Reaction brand product lines.
Met-Pro Chile Limitada located in Santiago, Chile, South America, markets, sells and distributes in South America the Duall, Flex-Kleen, Met-Pro Systems and Bio-Reaction brand product lines.
Fluid Handling Technologies Reporting Segment:
This reportable segment is comprised of one operating segment that manufactures high quality horizontal, vertical, and in-tank centrifugal pumps that handle corrosive, abrasive and high temperature liquids. This combination of pump types and configurations provides products that excel in applications requiring corrosion resistance such as: the pumping of acids, brines, caustics, bleaches, seawater, a wide variety of waste liquids, and high temperature liquids used in many industrial and commercial applications. This reporting segment is comprised of the Met-Pro Global Pump Solutions business unit (consisting of the Dean Pump, Fybroc and Sethco product brands) and has manufacturing facilities located in Indianapolis, Indiana and Telford, Pennsylvania. The Met-Pro Global Pump Solutions products are sold directly through regional sales managers and through a worldwide network of distributors, catalog houses, and original equipment manufacturers.
The Dean Pump brand is comprised of high quality horizontal and vertical centrifugal pumps that handle a broad range of applications. Industrial markets served include the chemical, petrochemical, refinery, pharmaceutical, plastics, pulp and paper, and food processing industries. Commercial users include hospitals, universities, and laboratories. Customers choose the Dean Pump brand for its quality and for its suitability to handle difficult applications, particularly high temperature liquid applications.
The Fybroc brand is comprised primarily of fiberglass reinforced plastic (“FRP”) centrifugal pumps. These pumps provide excellent corrosion resistance for tough applications including the pumping of acids, brines, caustics, bleaches, seawater and a wide variety of waste liquids. Fybroc’s second generation epoxy resin, EY-2, allows us to offer the first corrosion resistant and high temperature FRP thermoset pumps suitable for solvent applications. The EY-2 material also expands Fybroc’s pumping capabilities to include certain acid applications such as high concentration sulfuric acid (75-98%). Fybroc pumps are sold to many markets including the chemical, petrochemical, pharmaceutical, fertilizer, pesticides, steel, pulp and paper, electric utility, aquaculture, aquarium, commercial marine/navy, desalination/water reuse, and industrial and municipal waste treatment industries.
The Sethco brand is comprised of horizontal and vertical corrosion resistant pumps with flow rates of up to approximately 250 gallons per minute. Primarily manufactured from polypropylene or Kynar (PVDF) components, Sethco’s brands are used extensively in the metal finishing, electronics, chemical processing and waste water treatment industries.
Mefiag Filtration Technologies Reporting Segment:
This reportable segment is comprised of one operating segment that manufactures filtration systems utilizing primarily horizontal disc technology. This reporting segment is comprised of the Mefiag B.V., Mefiag (Guangzhou) Filter Systems Ltd., and Mefiag business units.
The Mefiag Filtration Technologies reporting segment designs, manufactures and sells filter systems utilizing horizontal disc technology for superior performance, particularly in high efficiency and high-flow applications. Mefiag® filters are used in tough, corrosive applications in the plating, metal finishing and printing industries. Worldwide sales are accomplished directly through regional sales managers, qualified market-based distributors and original equipment manufacturers located throughout North America, Europe, Asia and other major markets around the world. The Mefiag Filtration Technologies reporting segment has facilities in Owosso, Michigan; Heerenveen, The Netherlands; and Guangzhou, the People’s Republic of China.
Filtration/Purification Technologies Segment:
This other segment consists of two operating segments that supply proprietary chemicals for the treatment of municipal drinking water systems and boiler and cooling tower systems, cartridges and filter housings, and filtration products for difficult industrial air and liquid applications. This other segment is comprised of the Keystone Filter and Pristine Water Solutions operating segments.
Keystone Filter, located in Hatfield, Pennsylvania, is an established custom pleater and filter cartridge manufacturer. Keystone Filter provides custom designed and engineered products which are currently used in a diversity of applications such as the nuclear power industry, components in medical equipment and in indoor air quality equipment. Keystone Filter also provides standard filters for water purification and industrial applications. Sales and customer service functions are provided directly through sales managers and through a non-exclusive distributor network.
Pristine Water Solutions Inc. (“Pristine”), located in Waukegan, Illinois, is a leading manufacturer of safe and reliable water treatment compounds. Products sold by Pristine have been used in the public drinking water industry since 1955. Pristine’s Aquadene™ products are designed to eliminate problems created by high iron and manganese levels in municipal water systems. They also reduce scaling and general corrosion tendencies within water distribution piping systems as well as help municipalities meet soluble lead and copper limits in their drinking water. These food-grade products are NSF/ANSI approved for use in municipal drinking water supplies and are certified to meet or exceed existing state and federal guidelines. Pristine’s product line also includes coagulant and flocculent polymer products for both municipal and industrial applications which are used to improve water clarity and reduce sludge volume. Pristine also markets a chlorine dioxide treatment program for municipal drinking water disinfection which helps customers reduce trihalomethane formation as required by the EPA. In addition, Pristine markets and sells a line of Bio-Purge™ products for drinking well water remediation as well as boiler and cooling tower chemicals and services to industrial and commercial markets. This allows customers to maximize their heat transfer efficiency and save operating costs through energy conservation. Pristine’s products are sold directly through regional sales managers or agents and also through a network of distributors located in the United States and Canada. Pristine offers technical and laboratory customer support from the Waukegan facility.
United States Sales versus Foreign Sales:
The following table sets forth certain data concerning total net sales to customers by geographic area in the past three years:
| Percentage of Net Sales | ||||||
| Fiscal Years Ended January 31, | ||||||
| 2012 | 2011 | 2010 | ||||
| United States | 72.1 | % | 74.8 | % | 75.5 | % |
| Foreign | 27.9 | % | 25.2 | % | 24.5 | % |
| Net Sales | 100.0 | % | 100.0 | % | 100.0 | % |
Customers:
During each of the past three fiscal years, no single customer accounted for 10% or more of the total net sales of the Company in any year. Also, no single customer accounted for 10% or more of the total accounts receivable of the Company as of January 31, 2012, 2011 and 2010. The Company does not believe that it would be materially adversely affected by the loss of any single customer.
Seasonality:
The Company does not consider its business, as a whole, to be seasonal in nature, although a limited number of its product lines are seasonal in nature.
Competition:
The Company experiences competition from a variety of sources with respect to virtually all of its products. The Company knows of no single entity that competes with it across the full range of its products and systems. The lines of business in which the Company is engaged are highly competitive. Competition in the markets served is based on a number of considerations, which may include price, technology, quality, applications experience, know-how, reputation, product warranties, service and distribution.
With respect to the Fluid Handling Technologies reporting segment, several companies, including Ingersoll-Dresser Pumps Co. (a subsidiary of Flowserve Corporation), Goulds Industrial Pumps, Inc. (a subsidiary of ITT Industries), and Durco Pumps, Inc. (a subsidiary of Flowserve Corporation), dominate the industry overall, but several smaller companies, including Met-Pro, compete successfully in select product lines and specialized niche markets.
With respect to the Product Recovery/Pollution Control Technologies reporting segment, the Mefiag Filtration Technologies reporting segment and the Filtration/Purification Technologies segment, we compete with numerous smaller, as well as larger, competitors, but there are no companies that dominate the markets in which we participate.
The Company is unable to state with certainty its relative positions in its various markets, but believes that it is a leading and respected competitor in each of its niche markets.
Research and Development:
Due in part to the diversity of the Company’s products, research and development activities have been typically initiated and conducted on an operating segment basis. Effective February 1, 2007, the Company created the position of Technical Director who is responsible for coordinating the Company’s research and development activities on a corporate-wide basis. Research is directed towards the development of new products related to current product lines, and the improvement and enhancement of existing products.
The principal goals of the Company’s research programs are maintaining the Company’s technological capabilities in the production of product recovery/pollution control equipment, fluid handling equipment, Mefiag filtration equipment and filtration/purification equipment; developing new products; and providing technological support to the manufacturing operations.
Research and development expenses were $2.5 million, $2.2 million and $2.1 million for the years ended January 31, 2012, 2011 and 2010, respectively.
Patents and Trademarks:
The Company has a number of patents and trademarks. The Company considers these rights important to certain of its businesses, although it considers no individual right material to its business as a whole.
Regulatory Matters:
The Company is subject to environmental laws and regulations concerning air emissions, discharges to water processing facilities, and the generation, handling, storage and disposal of waste materials in all operations. All of the Company’s production and manufacturing facilities are controlled under permits issued by federal, state and local regulatory agencies. The Company believes it is presently in compliance in all material respects with these laws and regulations. To date, compliance with federal, state and local provisions relating to protection of the environment has had no material effect upon capital expenditures, earnings or the competitive position of the Company.
Backlog:
Generally, the Company’s customers do not enter into long-term contracts, but rather issue purchase orders which are subject to negotiation and acceptance by the Company, at which point the Company considers the order to be “booked” and to be in backlog. Certain orders that are included in our backlog amounts may be subject to customer approvals, most typically, approval of engineering drawings. The rate of the Company’s bookings of new orders varies from month to month. Orders have varying delivery schedules, and as of any particular date, the Company’s backlog may not be predictive of actual revenues for any succeeding specific period, in part due to potential customer requested delays in delivery of which the extent and duration may vary widely from period to period. Additionally, the Company’s customers typically have the right to cancel a given order, although the Company has historically experienced a very low rate of cancellation.
The dollar amount of the Company’s backlog of orders totaled $28,446,566 and $18,129,842 as of January 31, 2012 and 2011, respectively. The Company expects that substantially all of the backlog that existed as of January 31, 2012 will be shipped during the ensuing fiscal year. We have observed a trend over the last several years where larger projects are more frequently booked and shipped in the same quarter in which we received the customer purchase order due to improved project execution and shorter lead times, resulting in such projects not appearing in publicly disclosed annual or quarterly backlog figures.
Working Capital:
Certain business units require more significant working capital requirements than other business units, such as in the larger project business units included in our Product Recovery/Pollution Control Technologies reporting segment. Additionally, the inventory levels of our Fluid Handling Technologies reporting segment are not insubstantial. However, there have been no material changes in business practices that would result in material changes to our working capital requirements, other than changes in our sales volumes, and we consider our working capital to be adequate based upon current sales levels.
Raw Materials:
The Company procures its raw materials and supplies from various sources. The Company believes it could secure substitutes for the raw materials and supplies should they become unavailable, but there are no assurances that the substitutes would perform as well or be priced as competitively. The Company has not experienced any significant difficulty in securing raw materials and supplies, and does not anticipate any significant difficulty in procurement in the coming year or foreseeable future.
Employees:
As of January 31, 2012, the Company employed 346 people, of whom 134 were involved in manufacturing, and 212 were engaged in administration, sales, engineering, supervision and clerical work. The Company has had no work stoppages during the past five years and considers its employee relations to be good.
Foreign Operations:
Most of the Company’s operations and assets are located in the United States. However, the Company also owns a manufacturing operation in Heerenveen, The Netherlands, through its wholly-owned subsidiary, Mefiag B.V., operates a manufacturing facility in the People’s Republic of China through its wholly-owned subsidiary, Mefiag (Guangzhou) Filter Systems Ltd, operates a sales office and warehouse in Vaughan, Ontario, Canada through its wholly-owned subsidiary, Met-Pro Product Recovery/Pollution Control Technologies Inc., and operates a sales office in Santiago, Chile through its wholly-owned subsidiary, Met-Pro Chile Limitada.
The Company believes that currency fluctuations and political and economic instability do not constitute substantial risks to its business.
For information concerning foreign net sales on a reporting segment basis, reference is made to the consolidated business segment data contained on page 61.
New York Stock Exchange and Securities and Exchange Commission Certifications:
During the fiscal year ended January 31, 2012, the Company submitted to the New York Stock Exchange (the “NYSE”) the certification of the Chief Executive Officer that he was not aware of any violation by Met-Pro Corporation of the NYSE’s corporate governance listing standards as required by Section 303A.12(a) of the New York Stock Exchange Listed Company Manual. In addition, the Company has filed with the SEC, as exhibits to this Form 10-K/A for the fiscal year ended January 31, 2012, the Chief Executive Officer’s and Chief Financial Officer’s certifications regarding the quality of the Company’s public disclosure, disclosure controls and procedures, and internal controls over financial reporting as required by Section 302 of the Sarbanes-Oxley Act of 2002 and related SEC rules.
The following table sets forth certain information regarding the Executive Officers of the Registrant:
Raymond J. De Hont, age 58, is Chairman of the Board, Chief Executive Officer and President of the Company. Mr. De Hont was elected Chairman of the Board in September 2003. He was elected President and Chief Executive Officer in March 2003 and a Director of the Company in February 2003. Mr. De Hont served as the Chief Operating Officer of the Company from June 2000 to March 2003. From June 1995 to December 2000, Mr. De Hont was Vice President and General Manager of the Company’s Fybroc business, during which time, starting in October 1999, he also served as General Manager for the Company’s Dean Pump business. Prior to joining Met-Pro Corporation, Mr. De Hont was employed by Air and Water Technologies, where among other positions he was Vice President and General Manager of Flex-Kleen Corporation, the business of which is now owned by the Company.
Gary J. Morgan, CPA, age 57, is Senior Vice President-Finance, Chief Financial Officer, Secretary, Treasurer and a Director of the Company. He was appointed Vice President-Finance, Chief Financial Officer, Secretary and Treasurer in October 1997, and became a Director of the Company in February 1998. Mr. Morgan joined the Company in 1980.
Neal E. Murphy, age 54, joined the Company as Vice President in February 2012 and is expected to become the Company’s Vice President-Finance, Chief Financial Officer, Chief Accounting Officer, Secretary and Treasurer effective on the departure of Gary J. Morgan, who presently holds these positions, which is anticipated to occur in April 2012. Prior to joining the Company Mr. Murphy served as Vice President and Chief Financial Officer of Northern Tier Energy from November 2010 to August 2011, Vice President and Chief Financial Officer of Sunoco Logistics Partners, L.P. from April 2007 to May 2010 and Vice President and Chief Financial Officer of Quaker Chemical Corporation from July 2004 to April 2007.
Paul A. Tetley, age 53, is Executive Vice President of the Company, a position to which he was appointed in March 2006, with responsibilities for the Product Recovery/Pollution Control Technologies reporting segment which includes Strobic Air Corporation, where he also serves as General Manager. Mr. Tetley joined the Company in 1996 in connection with the Company’s acquisition of the business now conducted by Strobic Air Corporation, where he had worked as the Engineering/Production Manager.
Gennaro A. D’Alterio, age 40, is Vice President of the Company, a position to which he was appointed in February 2009. Mr. D’Alterio continues to serve as General Manager of the Company’s Met-Pro Global Pump Solutions, which includes the Sethco, Fybroc and Dean Pump product brands, a position he has held since July 2007. Since joining the Company in 1994, he has served in a variety of roles including: Sales and Marketing Manager for the Company’s Fybroc and Dean Pump businesses and Regional Sales Manager of the Company’s Fybroc and Dean Pump business.
Gregory C. Kimmer, age 57, was appointed General Manager of the Met-Pro Environmental Air Solutions business unit in February 2010. For more than ten years prior thereto, Mr. Kimmer was General Manager of the Company’s Duall business. Mr. Kimmer is also a Vice President of the Company, having served as such since October 1989.
Lewis E. Osterhoudt, age 61, is Vice President of the Company and General Manager of the Keystone Filter business unit, to which offices he was appointed in June 2004. Mr. Osterhoudt joined the Company in March 2004, initially serving as Assistant to the President. For more than five years prior thereto, Mr. Osterhoudt was employed by Hardy Machine and Design Inc. and I.O. Gold Systems Inc., most recently as Operations Manager and President, respectively.
Vincent J. Verdone, age 64, is Vice President of the Company and General Manager of the Company’s Pristine Water Solutions Inc. subsidiary. Mr. Verdone joined the Company in January 2005. For more than five years prior thereto, Mr. Verdone was employed by Ashland Inc., in which his last position was North American Corporate Sales Manager.
There are no family relationships between any of the Directors or Executive Officers of the Registrant. Each officer serves at the pleasure of the Board of Directors, subject, however, to agreements the Company has with certain officers providing for compensation in the event of termination of employment following a change in control of the Company. See “Security Ownership of Certain Beneficial Owners and Management and Related Shareholder Matters” referenced in Item 12 of this Report.
Any of the events discussed as risk factors below may occur. If they do, our business, financial condition, results of operations and cash flows could be materially adversely affected. Additional risks and uncertainties not identified in this or other SEC filings, or that we currently deem immaterial, may also impair our business operations.
| Our operating results may be adversely affected by unfavorable economic and market conditions and the uncertain geopolitical environment. |
Economic conditions in the markets that we serve appear to be improving, but we do not know the extent or duration of this. Our operating results have been challenged by the worldwide economic slowdown. If the markets that we serve do not improve or if they worsen, this could negatively impact our business, which could result in:
| · | reduced demand for our products, especially for those offered by our Product Recovery/Pollution Control Technologies reporting segment, which include large dollar projects more likely to be affected by economic conditions; |
· | increased price competition for our products; |
| · | increased risk of excess and obsolete inventories; |
| · | increased risk in the collectability of cash from our customers; |
| · | increased risk of the impairment of goodwill of our Flex-Kleen business and Pristine Water Solution business unit; |
| · | increased risk in potential reserves for doubtful accounts and write-offs of accounts receivable; and |
| · | higher operating costs as a percentage of revenues. |
| We sell our products in highly competitive markets, which puts pressure on our profit margins and limits our ability to maintain or increase the market share of our products. |
The markets for our products are fragmented and highly competitive. We compete against a very diverse number of companies across our many markets. Depending upon the market, our competitors include large and well-established national and global companies; regional and local companies; low cost replicators of spare parts; and in-house maintenance departments of our end user customers. We compete based on price, technical expertise, timeliness of delivery, previous installation history and reputation for quality and reliability, with price competition tending to be more significant for sales to original equipment manufacturers. Some of our customers are attempting to reduce the number of vendors from which they purchase in order to reduce the size and diversity of their inventory. To remain competitive, we will need to invest continuously in manufacturing, marketing, customer service and support, and our distribution networks. No assurances can be made that in the short-term our earnings will not be adversely impacted by these investments or that our investments will produce the intended results. If we do not compete successfully, our business, our financial condition, results of operations and cash flows could be adversely affected.
| We are party to asbestos-containing product litigation that could adversely affect our financial condition, results of operations and cash flows. |
Beginning in 2002, the Company began to be named in asbestos-related lawsuits filed against a large number of industrial companies including, in particular, those in the pump and fluid handling industries. In management’s opinion, the complaints typically have been vague, general and speculative, alleging that the Company, along with the numerous other defendants, sold unidentified asbestos-containing products and engaged in other related actions which caused injuries (including death) and loss to the plaintiffs. Counsel has advised that more recent cases often allege more serious claims of mesothelioma. The Company believes that it has meritorious defenses to the cases which have been filed and that none of its products were a cause of any injury or loss to any of the plaintiffs. The Company’s insurers have hired attorneys who, together with the Company, are vigorously defending these cases. The Company has been dismissed from or settled a large number of these cases. The sum total of all payments through March 22, 2012 to settle cases involving asbestos-related claims was $675,000, all of which has been paid by the Company’s insurers including legal expenses, except for corporate counsel expenses, with an average cost per settled claim, excluding legal fees, of approximately $32,000. As of March 22, 2012, there were a total of 130 cases pending against the Company (with Connecticut, New York, Pennsylvania and West Virginia having the largest number of cases), as compared with 93 cases that were pending as of March 17, 2011, the date which our Annual Report on Form 10-K for the fiscal year ended January 31, 2011 was filed with the Securities and Exchange Commission. During the current fiscal year commencing February 1, 2011 through March 22, 2012, 81 new cases were filed against the Company, and the Company was dismissed from 38 cases and settled two cases. Most of the pending cases have not advanced beyond the early stages of discovery, although a number of cases are on schedules leading to, or are scheduled for trial. On April 27, 2011, a liquidation order was entered against Atlantic Mutual Insurance Company, who had been providing defense and indemnity to the Company, and its affiliate, Centennial Insurance Company, who provided umbrella coverage to the Company. It appears that our remaining
insurers have assumed the share of the defense and indemnity obligations that Atlantic Mutual Insurance Company had agreed to assume, and despite the liquidation of Atlantic Mutual Insurance Company and Centennial Insurance Company, the Company believes that its insurance coverage is adequate for the cases currently pending against the Company and for the foreseeable future, assuming a continuation of the current volume, nature of cases and settlement amounts; however, the Company has no control over the number and nature of cases that are filed against it, nor as to the financial health of its insurers or their position as to coverage. The Company also presently believes that none of the pending cases will have a material adverse impact upon the Company’s results of operations, liquidity or financial condition.
| Changes in pension fund investment performance or assumptions relating to pension costs may have a material effect on the valuation of our obligations under our defined benefit pension plans, the funded status of these plans and our pension expense, which can affect our earnings results as well as our cash flows. |
We maintain defined benefit pension plans that we must fund despite the freezing of the accrual of future benefits for our salaried and non-union hourly employees, effective December 31, 2006, and our union hourly employees, effective December 31, 2008. In these plans’ fiscal year ended January 31, 2012, we contributed approximately $3.0 million. As of January 31, 2012, our unfunded pension liability was approximately $9.7 million as compared with $5.9 million at January 31, 2011. The amount of this pension liability is materially affected by the discount rate used to measure our pension obligations and, in the case of the plans such as ours that are required to be funded, the level of plan assets available to fund those obligations and the expected long-term rate of return on plan assets. A change in the discount rate can result in a significant increase or decrease in the valuation of pension obligations, affecting the reported status of our pension plans and our pension expense. The increase in our unfunded pension liability from January 31, 2011 to January 31, 2012, despite the $3.0 million contribution in fiscal year 2012, is attributable in part to a reduction of the discount rate from 5.50% in fiscal year 2011 to 4.25% in fiscal 2012. It is possible that the discount rate used in fiscal year 2013 will be further reduced, with a resulting adverse impact upon the reported status of our unfunded pension liability. Changes in investment performance or a change in the portfolio mix of invested assets also can result in increases and decreases in the valuation of plan assets or in a change of the expected rate of return on plan assets. Changes in the expected return on plan assets assumption can result in significant changes in our pension expense. For our fiscal year ended January 31, 2012, we reported expense from our defined benefit plans totaling $0.1 million as compared to expense for the fiscal year ended January 31, 2011 totaling $0.6 million.
| If our goodwill or indefinite-lived intangible assets become impaired, we may be required to record a significant charge to earnings. Performance by our Flex-Kleen and/or Pristine Water Solutions business units must continue to improve to avoid an impairment charge. |
We carry approximately $20.8 million of goodwill on our consolidated balance sheets, or approximately 18% of our total assets. Approximately $11.1 million and $3.3 million of the $20.8 million of goodwill relates to our Flex-Kleen and Pristine Water Solutions businesses, respectively. Under United States Generally Accepted Accounting Principles, goodwill and indefinite-lived intangible assets are not amortized but are reviewed for impairment on an annual basis or more frequently whenever events or changes in circumstances indicate that their carrying value may not be recoverable.
Flex-Kleen, which initially performed well after being acquired by Met-Pro, thereafter had several years of declining performance which we attributed primarily to a general weakness in its served markets, followed by improved performance in the fiscal years ended January 31, 2007, 2008 and 2009. In the fiscal year ended January 31, 2010, Flex-Kleen’s net sales and operating profit were below the projections in our impairment model. For the fiscal year ended January 31, 2011, Flex-Kleen’s net sales were below the projections in our impairment model but operating profit was slightly above the projections in our impairment model. In the fiscal year ended January 31, 2012, Flex-Kleen’s net sales and operating profit exceeded the projections in our impairment model. We believe the improvement in operating profit for fiscal years 2011 and 2012 as well as the improvement in net sales during fiscal year 2012 is attributable in part to an improvement in global business and economic conditions. In each of the last several fiscal years, including the fiscal year ended January 31, 2012, we performed an impairment analysis of the $11.1 million of goodwill that the Company carries for Flex-Kleen and concluded that no impairment has occurred. The carrying value of Flex-Kleen as of January 31, 2012 and 2011 amounted to $9.3 million and $9.1 million, respectively.The fair value of Flex-Kleen as of January 31, 2012 and 2011 totaled $13.2 million and $12.3 million, respectively. As a result, the fair value of Flex-Kleen exceeded our carrying amount, including goodwill, by $3.9 million and $3.2 million at January 31, 2012 and 2011, respectively. Based on this impairment analysis, the Company concluded Flex-Kleen’s goodwill was not impaired as of January 31, 2012 and 2011. Because of market conditions and/or potential changes in strategy and product portfolio, it is possible that forecasts used to support asset carrying values may change in the future, which could result in a write-down of goodwill that would consist of a non-cash charge that would adversely affect our results of operations and financial condition. Based on current projections, a one percent decrease in revenue growth, a one percent decrease in gross margin or a one percent increase in the weighted average cost of capital would reduce the fair value for Flex-Kleen by $1.9 million, $1.1
million, and $0.9 million, respectively. Additionally, the Company cannot predict the occurrence of unknown events that might adversely affect the reportable value of goodwill related to Flex-Kleen.
During the fiscal year 2012, there was a substantial decline in net sales and operating profit of our Pristine Water Solutions business unit that we attribute to a number of factors including raw material price increases, weaknesses in Pristine Water Solution’s principal market, the municipal market, increased price competition, product mix and inclement weather in certain geographic areas which affected product demand. In each of the last several fiscal years, including the fiscal year ended January 31, 2012, we performed an impairment analysis of the $3.3 million of goodwill that the Company carries for Pristine Water Solutions and concluded that no impairment has occurred. The carrying value of Pristine Water Solutions as of January 31, 2012 and 2011 amounted to $4.6 million at both dates.The fair value of Pristine Water Solutions as of January 31, 2012 and 2011 totaled $5.9 million and $9.8 million, respectively. As a result, the fair value exceeded the carrying amount, including goodwill, by $1.3 million and $5.2 million at January 31, 2012 and 2011, respectively. Based on this impairment analysis, the Company concluded Pristine Water Solution’s goodwill was not impaired as of January 31, 2012 and 2011. Because of market conditions and/or potential changes in strategy and product portfolio, it is possible that forecasts used to support asset carrying values may change in the future, which could result in non-cash charges that would adversely affect our results of operations and financial condition. Based on current projections, a one percent decrease in revenue growth, a one percent decrease in gross margin or a one percent increase in the weighted average cost of capital would reduce the fair value for Pristine Water Solutions by $0.7 million, $0.5 million, and $0.4 million, respectively. Additionally, the Company cannot predict the occurrence of unknown events that might adversely affect the reportable value of goodwill related to Pristine Water Solutions.
Our impairment models provide that Flex-Kleen’s and Pristine Water Solution’s performance needs to continue to improve on an annual basis for a number of fiscal years in order for us not to be potentially required to write-off some or all of their goodwill. If in the future we determine that there has been an impairment of Flex-Kleen’s and/or Pristine Water Solutions’ goodwill, we will be required to record a non-cash charge to earnings, to the extent of the impairment, during the period in which any impairment of our goodwill or indefinite-lived intangible assets is determined, which would have an adverse impact upon our results of operations and financial position. We anticipate that Flex-Kleen’s and Pristine Water Solutions’ performance during the fiscal year beginning February 1, 2012 will be at a level that will not indicate impairment of their goodwill, but this expectation is a forward-looking statement where the actual results may not be as we presently anticipate. Please refer to page 25, “Critical Accounting Policies and Estimates”, for additional information concerning goodwill impairment.
| If we are unable to obtain raw materials at favorable prices, our operating margins and results of operations will be adversely affected. |
We purchase electric power and other raw materials we use in the manufacturing of our products from outside sources. The costs of raw materials and power have been volatile historically and are influenced by factors that are outside our control. We believe we have improved our raw material purchasing practices over recent years with more centralized purchasing, which has decreased raw material costs. However, if we are unable to pass increases in the costs of raw materials to our customers, our operating margins and results of operations will be adversely affected.
| We may incur significant expense as a result of breach of contract, negligence, product liability and warranty claims, which could adversely affect our financial condition, results of operations and cash flows. |
From time to time we are exposed to breach of contract, negligence, product liability, warranty and other claims where our products and/or service cause, or are alleged to cause bodily injury and/or property damage and/or our products actually or allegedly fail to perform as expected, as a result of an actual or alleged design or manufacturing defect or other action or inaction or alleged action or inaction on our part. While we maintain insurance coverage with respect to certain product liability and negligence claims, we do not insure against all risks or possible claims, and/or the insurance that we purchase may not cover all claims or amounts found to be owing. In addition, these claims can be expensive to defend and can divert the attention of management and other personnel for significant periods of time, regardless of the ultimate outcome. An unsuccessful defense of a claim could have an adverse affect on our business, results of operations and financial condition and cash flows. Even if we are successful in defending against a claim relating to our products, claims of this nature could cause our customers to lose confidence in our products and our Company. Warranty claims are not covered by insurance, and we may incur significant warranty costs in the future for which we would not be reimbursed.
| Natural or man-made disasters could negatively affect our business. |
Future disasters caused by earthquakes, hurricanes, floods, terrorist attacks or other events, and any potential response by the U.S. government or military, could have a significant adverse effect on the general economic, market and political conditions, which in turn could have a material adverse effect on our business.
A substantial portion of our business is sold internationally, we also manufacture outside the United States, and we plan to increase our international distribution and manufacturing of our products. These international activities subject us to additional business risks. |
In the fiscal year ended January 31, 2012, 27.9% of our sales were to customers outside the United States, as compared with 25.2% in the prior fiscal year. As part of our business strategy, we intend to increase our international sales, although we cannot assure you that we will be able to do so. Conducting business outside of the United States subjects us to significant additional risks, including:
| · | export and import restrictions, tax consequences and other trade barriers, |
| · | currency fluctuations, |
| · | greater difficulty in accounts receivable collections, |
| · | economic and political instability, |
| · | foreign exchange controls that prohibit payment in U.S. dollars, and |
| · | increased complexity and costs of managing and staffing international operations. |
| Our products could infringe the intellectual property rights of others and we may be exposed to costly litigation. |
The products we sell are continually changing as a result of improved technology. Although we and our suppliers attempt to avoid infringing on known proprietary rights of third parties in our products, we may be subject to legal proceedings and claims for alleged infringement by us, our suppliers or our distributors, of third parties’ patents, trade secrets, trademarks or copyrights.
Any claims relating to the infringement of third-party proprietary rights, even if not meritorious, could result in costly litigation, divert management's attention and resources, or require us to either enter into royalty or license agreements which are not advantageous to us, or pay material amounts of damages. In addition, parties making these claims may be able to obtain an injunction, which could prevent us from selling our products. We may increasingly be subject to infringement claims as we expand our product offerings.
| Our ability to operate our Company effectively could be impaired if we fail to attract and retain key personnel. |
Our ability to operate our businesses and implement our strategies depends, in part, on the efforts of our executive officers and other key employees. In addition, our future success will depend on, among other factors, our ability to attract and retain qualified personnel, particularly research professionals, technical sales professionals and engineers. The loss of the services of any key employee or the failure to attract or retain other qualified personnel could have a material adverse effect on our business or business prospects.
| Changes in accounting may affect our reported earnings. |
For many aspects of our business, United States generally accepted accounting principles are highly complex and require subjective judgments. Additionally, changes in these accounting principles, including their interpretation and application, could significantly change our reported earnings, adding significant volatility to our reported results without a comparable underlying change in our cash flows.
| Additional risks to the Company. |
The Company is subject to various risks occurring in the normal course of business. The Forward-Looking Statements; Factors That May Affect Future Results in the Management’s Discussion and Analysis of Financial Condition and Results of Operations section of this Report sets forth a list of risks, including those identified above, that may adversely affect the Company and is incorporated herein by reference.
None.
The following manufacturing and production facilities were owned or leased by the Company as of the date of filing this report:
| User | Structure | Property/Location | Status | ||||||||
| Product Recovery/Pollution | 73,000 square foot, cement | 17 acres in Harleysville, | Owned | ||||||||
| Control Technologies | building, with finestone facing | Pennsylvania(1) | |||||||||
| 45,500 square foot, brick | 2.3 acres in Glendale Heights, | Owned | |||||||||
| building | Illinois | ||||||||||
| 3,239 square foot, masonry | Vaughan, Ontario, | Leased(2) | |||||||||
| building | Canada | ||||||||||
| 63,000 square foot, metal | 7 acres in Owosso, | Owned | |||||||||
| and masonry building | Michigan(3) | ||||||||||
| 5,758 square foot, masonry | Tualatin, Oregon | Leased(4) | |||||||||
| building | |||||||||||
| Fluid Handling Technologies | 93,500 square foot, cement | 8 acres in Telford, | Owned | ||||||||
| building with brick facing | Pennsylvania | ||||||||||
| 66,000 square foot, metal | 17.1 acres in Indianapolis, | Owned | |||||||||
| building | Indiana | ||||||||||
| Mefiag Filtration | 34,000 square foot, metal | 1.7 acres in Heerenveen, | Owned | ||||||||
| Technologies | and masonry building | The Netherlands | |||||||||
| Vacant land | 3 acres in Heerenveen, | Owned | |||||||||
| The Netherlands | |||||||||||
| 11,000 square foot cement | Guangzhou, People’s Republic | Leased(5) | |||||||||
| building | of China | ||||||||||
| Filtration/Purification | 31,000 square foot, cement | 2.3 acres in Hatfield, | Owned | ||||||||
| Technologies | block building | Pennsylvania | |||||||||
| 22,000 square foot, cement | 2.55 acres in Waukegan, | Owned | |||||||||
| block building | Illinois | ||||||||||
| (1) | Executive offices are housed in the building located in Harleysville, Pennsylvania. |
| (2) | Lease expires on March 31, 2013. |
| (3) | Mefiag Filtration Technologies leases space in the Product Recovery/Pollution Control Technologies facility located in Owosso, Michigan. |
| (4) | Lease expires on September 30, 2012. The Company expects to renew the lease. |
| (5) | Lease expires on July 31, 2014. |
Certain of the statements made in this Item 3 (and elsewhere in this Report) are “forward-looking” statements which are subject to the considerations set forth in “Forward-Looking Statements; Factors That May Affect Future Results” located in the Management’s Discussion and Analysis of Financial Condition and Results of Operations section of this Report, and we refer you to these considerations.
Beginning in 2002, the Company began to be named in asbestos-related lawsuits filed against a large number of industrial companies including, in particular, those in the pump and fluid handling industries. In management’s opinion, the complaints typically have been vague, general and speculative, alleging that the Company, along with the numerous other defendants, sold unidentified asbestos-containing products and engaged in other related actions which caused injuries (including death) and loss to the plaintiffs. Counsel has advised that more recent cases often allege more serious claims of mesothelioma. The Company believes that it has meritorious defenses to the cases which have been filed and that none of its products were a cause of any injury or loss to any of the plaintiffs. The Company’s insurers have hired attorneys who, together with the Company, are vigorously defending these cases. The Company has been dismissed from or settled a large number of these cases. The sum total of all payments through March 22, 2012 to settle cases involving asbestos-related claims was $675,000, all of which has been paid by the Company’s insurers including legal expenses, except for corporate counsel expenses, with an average cost per settled claim, excluding legal fees, of approximately $32,000. As of March 22, 2012, there were a total of 130 cases pending against the Company (with Connecticut, New York, Pennsylvania and West Virginia having the largest number of cases), as compared with 93 cases that were pending as of March 17, 2011, the date which our Annual Report on Form 10-K for the fiscal year ended January 31, 2011 was filed with the Securities and Exchange Commission. During the current fiscal year commencing February 1, 2011 through March 22, 2012, 81 new cases were filed against the Company, and the Company was dismissed from 38 cases and settled two cases. Most of the pending cases have not advanced beyond the early stages of discovery, although a number of cases are on schedules leading to, or are scheduled for trial. On April 27, 2011, a liquidation order was entered against Atlantic Mutual Insurance Company, who had been providing defense and indemnity to the Company, and its affiliate, Centennial Insurance Company, who provided umbrella coverage to the Company. It appears that our remaining insurers have assumed the share of the defense and indemnity obligations that Atlantic Mutual Insurance Company had agreed to assume, and despite the liquidation of Atlantic Mutual Insurance Company and Centennial Insurance Company, the Company believes that its insurance coverage is adequate for the cases currently pending against the Company and for the foreseeable future, assuming a continuation of the current volume, nature of cases and settlement amounts; however, the Company has no control over the number and nature of cases that are filed against it, nor as to the financial health of its insurers or their position as to coverage. The Company also presently believes that none of the pending cases will have a material adverse impact upon the Company’s results of operations, liquidity or financial condition.
At any given time, the Company is typically also party to a small number of other legal proceedings arising in the ordinary course of business. Although the ultimate outcome of any legal matter cannot be predicted with certainty, based upon the present information, including the Company’s assessment of the facts of each particular claim as well as accruals, the Company believes that no pending proceeding will have a material adverse impact upon the Company’s results of operations, liquidity, or financial condition.
No matters were submitted to a vote of security holders during the fourth quarter of the fiscal year ended January 31, 2012.
PART II
(a) Market Information. The Company’s Common Shares are traded on the New York Stock Exchange under the symbol “MPR”. The high and low selling prices of the Common Shares for each quarterly period for the last two fiscal years, as reported on the New York Stock Exchange, are shown below.
| Quarter ended | ||||||||
| Year ended January 31, 2012 | April | July | October | January | ||||
| Price range of common shares: | ||||||||
| High | $12.10 | $11.98 | $10.52 | $10.49 | ||||
| Low | 10.52 | 9.77 | 8.05 | 8.20 | ||||
| Cash dividend paid | .0660 | .0660 | .0660 | .0710 | ||||
| Year ended January 31, 2011 | April | July | October | January | ||||
| Price range of common shares: | ||||||||
| High | $10.59 | $11.07 | $11.42 | $12.50 | ||||
| Low | 9.07 | 9.04 | 8.99 | 10.59 | ||||
| Cash dividend paid | .0600 | .0600 | .0600 | .0660 | ||||
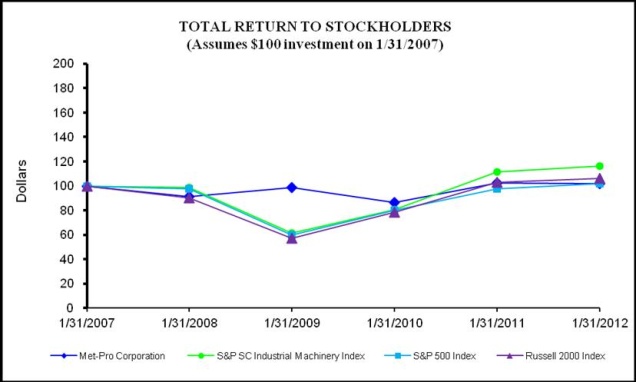
(b) Performance Graph. The following graph sets forth the Company's total cumulative shareholder return as compared to the Standard and Poor’s (the “S&P”) 600 Small Cap Industrial Machinery Index, the S&P 500 Index and the Russell 2000 Index.
The total return on investment assumes $100 invested at the beginning of the period in (i) the Common Shares of the Company, (ii) S&P Small Cap Machinery Index, (iii) S&P 500 Index, and (iv) the Russell 2000 Index. Total return assumes reinvestment of dividends and reflects stock splits. Historical stock price performance is not necessarily indicative of future price performance.
COMPARISON OF FIVE-YEAR CUMULATIVE TOTAL RETURN
Met-Pro Corporation, S&P SC Industrial Machinery Index,
S&P 500 Index and Russell 2000 Index
| January 31, | ||||||||||||
| 2007 | 2008 | 2009 | 2010 | 2011 | 2012 | |||||||
| Met-Pro Corporation | $100.00 | $91.23 | $98.61 | $86.52 | $102.68 | $101.86 | ||||||
| S&P SC Industrial Machinery Index | 100.00 | 98.79 | 61.33 | 80.68 | 111.62 | 116.16 | ||||||
| S&P 500 Index | 100.00 | 97.69 | 59.97 | 79.84 | 97.55 | 101.67 | ||||||
| Russell 2000 Index | 100.00 | 90.23 | 56.98 | 78.54 | 103.16 | 106.09 | ||||||
(c) Holders. There were 525 registered shareholders on January 31, 2012, and the Company estimates that there are approximately 2,000 additional shareholders with shares held in street name.
(d) Dividends. The Board of Directors declared quarterly dividends of $0.066 per share payable on March 17, 2011, June 15, 2011 and September 15, 2011 to shareholders of record at the close of business on March 3, 2011, June 1, 2011 and September 1, 2011, respectively. The Board of Directors declared quarterly dividends of $0.071 per share payable on December 16, 2011 and March 16, 2012 to shareholders of record at the close of business on December 2, 2011 and March 2, 2012, respectively (which amounts to an 8% increase over the $0.066 dividend previously declared).
(e) Securities Authorized For Issuance Under Equity Compensation Plans. Set forth below is information aggregated as of January 31, 2012 with respect to four equity compensation plans previously approved by the Company’s shareholders, being the 1997 Stock Option Plan, the 2001 Equity Incentive Plan, the 2005 Equity Incentive Plan and the 2008 Equity Incentive Plan.
| Number of Securities | ||||||||||
| Number of Securities | Remaining Available | |||||||||
| to be Issued Upon | Weighted-Average | For Future Issuance | ||||||||
| Exercise of | Exercise Price of | Under Equity | ||||||||
| Outstanding Restricted | Outstanding Restricted | Compensation Plans | ||||||||
| Stock Units, Options, | Stock Units, Options | (Excluding Securities | ||||||||
| Plan Category | Warrants and Rights | Warrants and Rights | Reflected in Column (A)) | |||||||
| (A) | (B) | (C) | ||||||||
| Equity compensation plans approved by | ||||||||||
| security holders | 1,231,677 | (1) | $10.23 | 832,075 | (2) | |||||
| Equity compensation plans not approved | ||||||||||
| by security holders | - | - | - | |||||||
| (1) | The number of securities to be issued upon exercise of outstanding options and restricted stock units for the 1997 Stock Option Plan, the 2001 Equity Incentive Plan, the 2005 Equity Incentive Plan and the 2008 Equity Incentive Plan amounted to 25,832; 435,680; 750,322 and 19,843 shares, respectively. |
| (2) | The number of securities remaining available for future issuance under equity compensation plans for the 1997 Stock Option Plan, the 2001 Equity Incentive Plan, the 2005 Equity Incentive Plan and the 2008 Equity Incentive Plan amounted to zero (0); zero (0); 101,918 and 730,157 shares, respectively. |
(f) Stock Repurchases. The Company’s purchases of its Common Shares during the fiscal year ended January 31, 2012, represented in the table below, were made pursuant to the Company’s stock repurchase program first announced on November 5, 2008 (the “2008 Stock Buy Back Program”) covering 300,000 Common Shares. This program has no fixed expiration date.
Issuer Purchases of
Equity Securities
| Total | Maximum | ||||||||
| Number of | Number of | ||||||||
| Shares | Shares | ||||||||
| Purchased | That May | ||||||||
| As Part of | Yet Be | ||||||||
| Total | Publicly | Purchased | |||||||
| Number of | Average | Announced | Under the | ||||||
| Shares | Price Paid | Plans or | Plans or | ||||||
| Period | Purchased | Per Share | Programs | Programs | |||||
| February 1-28, 2011 | - | $ - | - | 187,357 | |||||
| March 1-31, 2011 | 3,717 | 11.515 | 3,717 | 183,640 | |||||
| April 1-30, 2011 | - | - | - | 183,640 | |||||
| May 1-31, 2011 | - | - | - | 183,640 | |||||
| June 1-30, 2011 | - | - | - | 183,640 | |||||
| July 1-31, 2011 | - | - | - | 183,640 | |||||
| August 1-31, 2011 | - | - | - | 183,640 | |||||
| September 1-30, 2011 | - | - | - | 183,640 | |||||
| October 1-31, 2011 | - | - | - | 183,640 | |||||
| November 1-30, 2011 | - | - | - | 183,640 | |||||
| December 1-31, 2011 | - | - | - | 183,640 | |||||
| January 1-31, 2012 | 13,144 | 9.490 | 13,144 | 170,496 | |||||
| Total | 16,861 | $9.936 | 16,861 | 170,496 |
| Years ended January 31, | |||||||||||||||
| 2012 | 2011 | 2010 | 2009 | 2008 | |||||||||||
| Selected Operating Statement Data | |||||||||||||||
| Net sales | $100,161,392 | $88,865,426 | $80,132,493 | $103,391,926 | $106,867,849 | ||||||||||
| Income from operations | 10,591,284 | 8,970,321 | 6,512,555 | 14,057,079 | 17,597,491 | (1) | |||||||||
| Net income | 7,133,701 | 6,139,132 | 4,439,811 | 9,861,065 | 11,906,165 | (2) | |||||||||
| Earnings per share, basic | .49 | .42 | .30 | .66 | .79 | (3) | |||||||||
| Earnings per share, diluted | .48 | .42 | .30 | .65 | .78 | (4) | |||||||||
| Selected Balance Sheet Data | |||||||||||||||
| Current assets | $72,435,534 | $65,346,052 | $63,245,243 | $64,161,732 | $68,095,140 | ||||||||||
| Current liabilities | 16,802,384 | 11,208,173 | 10,198,047 | 12,239,667 | 16,850,801 | ||||||||||
| Working capital | 55,633,150 | 54,137,879 | 53,047,196 | 51,922,065 | 51,244,339 | ||||||||||
| Current ratio | 4.3 | 5.8 | 6.2 | 5.2 | 4.0 | ||||||||||
| Total assets | 115,509,215 | 108,046,328 | 104,608,359 | 104,752,304 | 109,410,903 | ||||||||||
| Long-term obligations | 2,687,971 | 3,011,988 | 3,536,755 | 3,753,228 | 4,075,682 | ||||||||||
| Total shareholders’ equity | 83,821,971 | 84,472,924 | 80,977,584 | 78,777,481 | 83,243,168 | ||||||||||
| Total capitalization | 86,509,942 | 87,484,912 | 84,514,339 | 82,530,709 | 87,318,850 | ||||||||||
| Return on average total assets, % | 6.4 | 5.8 | 4.2 | 9.2 | 11.6 | ||||||||||
| Return on average shareholders’ equity, % | 8.5 | 7.4 | 5.6 | 12.2 | 15.3 | ||||||||||
| Other Financial Data | |||||||||||||||
| Net cash flows from operating activities | $8,959,787 | $8,597,505 | $15,645,713 | $12,142,087 | $9,875,144 | ||||||||||
| Capital expenditures | 2,097,234 | 1,665,949 | 2,133,807 | 1,580,528 | 5,456,418 | ||||||||||
| Dollar value of share repurchases | 167,534 | 935,631 | 251,612 | 7,694,333 | 630,515 | ||||||||||
| Shareholders’ equity per share | 5.71 | 5.76 | 5.54 | 5.40 | 5.56 | ||||||||||
| Cash dividends paid per share | .269 | .246 | .240 | .230 | .207 | ||||||||||
| Average common shares, basic | 14,662,055 | 14,629,215 | 14,602,276 | 14,909,809 | 15,002,012 | ||||||||||
| Average common shares, diluted | 14,774,692 | 14,758,659 | 14,675,735 | 15,219,540 | 15,328,368 | ||||||||||
| Common shares outstanding | 14,678,628 | 14,658,262 | 14,617,015 | 14,600,109 | 15,039,030 | ||||||||||
| (1) | Includes $3,513,940 from the sale of a building owned by the Company in Hauppauge, New York. |
| (2) | Includes $2,213,782 (net of tax) from the sale of a building owned by the Company in Hauppauge, New York. |
| (3) | Includes $0.14 per share from the sale of a building owned by the Company in Hauppauge, New York. |
| (4) | Includes $0.15 per share from the sale of a building owned by the Company in Hauppauge, New York. |
The following discussion should be read in conjunction with the Company’s Consolidated Financial Statements and Notes thereto included elsewhere in this Form 10-K/A, together with “Forward-Looking Statements; Factors That May Affect Future Results” located in the Management’s Discussion and Analysis of Financial Condition and Results of Operations.
Results of Operations:
The following table sets forth for the periods indicated the percentage of total net sales that such items represent in the consolidated statements of income.
| Years ended January 31, | ||||||
| 2012 | 2011 | 2010 | ||||
| Net sales | 100.0 | % | 100.0 | % | 100.0 | % |
| Cost of goods sold | 64.7 | % | 63.7 | % | 65.8 | % |
| Gross profit | 35.3 | % | 36.3 | % | 34.2 | % |
| Selling, general and administrative expense | 24.7 | % | 26.2 | % | 26.1 | % |
| Income from operations | 10.6 | % | 10.1 | % | 8.1 | % |
| Interest expense | (.2 | %) | (.2 | %) | (.3 | %) |
| Other income, net | .4 | % | .4 | % | .4 | % |
| Income before taxes | 10.8 | % | 10.3 | % | 8.2 | % |
| Provision for taxes | 3.7 | % | 3.4 | % | 2.7 | % |
| Net income | 7.1 | % | 6.9 | % | 5.5 | % |
FYE 2012 vs FYE 2011:
Net sales for the fiscal year ended January 31, 2012 were $100.2 million compared with $88.9 million for the fiscal year ended January 31, 2011, an increase of $11.3 million or 12.7%.
Sales in the Product Recovery/Pollution Control Technologies reporting segment were $43.6 million, or $2.2 million higher than the $41.4 million of sales for the fiscal year ended January 31, 2011, an increase of 5.2%. The sales increase was due primarily to higher sales for all product brands within the Met-Pro Environmental Air Solutions business unit, partially offset by lower sales for our Strobic Air systems that we attribute to, among other factors, elongated delivery schedules of booked orders, delays in the timing of customer orders for large projects and reduced construction in the pharmaceutical, university and other industries that purchase Strobic Air's products.
Sales in the Fluid Handling Technologies reporting segment totaled $33.3 million, or $5.8 million higher than the $27.5 million of sales for the fiscal year ended January 31, 2011, an increase of 21.0%. The sales increase was due to higher sales for all product brands within this reporting segment. A large percentage of the $5.8 million increase over the previous year was attributable to the shipment of the $2.4 million balance of a $3.7 million order for Fybroc brand pumps that was announced on October 12, 2010.
Sales in the Mefiag Filtration Technologies reporting segment totaled $12.9 million, or $3.0 million higher than the $9.9 million of sales for the year ended January 31, 2011, an increase of 30.8%. The sales increase in the Mefiag Filtration Technologies reporting segment was due to an increase in sales across all Mefiag product lines which we attribute to an apparent improvement in the industrial markets serviced by this reporting segment which are primarily the automotive and housing industries.
Sales in the Filtration/Purification Technologies segment were $10.4 million, or $0.3 million higher than the $10.1 million of sales for the fiscal year ended January 31, 2011, an increase of 3.3%. This increase in sales was due primarily to increased demand in our Keystone Filter business unit partially offset by decreased demand in our Pristine Water Solutions
business unit as a result of price competition, inclement weather in certain geographic areas and continued weakness in the municipal markets serviced by this business unit.
Foreign sales were $28.0 million for the fiscal year ended January 31, 2012, compared with $22.4 million for the same period last year, an increase of 24.9%. Compared with the prior fiscal year, foreign sales increased 42.1% in the Fluid Handling Technologies reporting segment, 40.8% in the Mefiag Filtration Technologies reporting segment and 29.1% in the Filtration/Purification Technologies segment, offset by a decrease of 5.3% in the Product Recovery/Pollution Control Technologies reporting segment.
Income from operations for the fiscal year ended January 31, 2012 was $10.6 million compared with $9.0 million for the fiscal year ended January 31, 2011, an increase of $1.6 million or 18.1%.
Income from operations in the Product Recovery/Pollution Control Technologies reporting segment was $1.2 million, or $0.8 million lower than the $2.0 million for the fiscal year ended January 31, 2011, a decrease of 41.4%. The decrease in income from operations in this reporting segment was primarily related to the following: (i) lower sales for our Strobic Air systems, (ii) lower gross profit margins experienced amongst all product brands within this reporting segment due primarily to product mix, increases in material cost and competitive pricing pressures and (iii) severance expense of approximately $300,000 recognized in the Company’s second quarter ended July 31, 2011 as a result of the Company offering a voluntary employee early retirement program.
Income from operations in the Fluid Handling Technologies reporting segment totaled $8.2 million, or $2.3 million higher than the $5.9 million for the fiscal year ended January 31, 2011, an increase of 38.7%. The increase in income from operations resulted from a 21.0% increase in sales and higher gross profit margins within this reporting segment.
Income from operations in the Mefiag Filtration Technologies reporting segment totaled $0.8 million, or $0.4 million higher than the $0.4 million for the fiscal year ended January 31, 2011, an increase of 94.3%. The increase in income from operations in the Mefiag Filtration Technologies reporting segment resulted from a 30.8% increase in sales, partially offset by lower gross profit margins.
Income from operations in the Filtration/Purification Technologies segment was $0.4 million, or $0.2 million lower than the $0.6 million for the fiscal year ended January 31, 2011, a decrease of 34.3%. The decrease in income from operations was related to decreased sales and lower gross margins in our Pristine Water Solutions business unit. The lower gross margins experienced in our Pristine Water Solutions business unit was due primarily to increases in material cost and competitive pricing pressures.
Net income for the fiscal year ended January 31, 2012 was $7.1 million compared with $6.1 million for the fiscal year ended January 31, 2011, an increase of $1.0 million or 16.2%.
Gross profit margin for the fiscal year ended January 31, 2012 was 35.3% compared with 36.3% for the prior fiscal year. The gross profit margin in our Product Recovery/Pollution Control Technologies and Mefiag Filtration Technologies reporting segments as well as the Filtration/Purification Technologies segment were lower as compared with the same period last year, partially offset by higher gross profit margins in our Fluid Handling Technologies reporting segment as compared with the same period last year.
Selling expense was $12.0 million for the fiscal year ended January 31, 2012 compared with $11.7 million for the prior fiscal year. The slight increase in selling expense was primarily due to higher payroll expenses, web and print advertising and exhibitions. Selling expense as a percentage of net sales was 12.0% for the fiscal year ended January 31, 2012 compared with 13.1% for the same period last year.
General and administrative expense was $12.8 million for the fiscal year ended January 31, 2012, compared with $11.6 million in the prior fiscal year, an increase of $1.2 million. The increase in general and administrative expense was primarily related to (i) higher payroll expenses, (ii) severance expense of approximately $300,000 recognized in the Company’s second quarter ended July 31, 2011 as a result of the Company offering a voluntary employee early retirement program and (iii) higher personnel acquisition expenses. General and administrative expense as a percentage of net sales was 12.7% for the fiscal year ended January 31, 2012, compared with 13.1% for the prior fiscal year.
Interest expense was approximately $0.2 million for each of the fiscal years ended January 31, 2012 and 2011.
Other income was $0.4 million for each of the fiscal years ended January 31, 2012 and 2011. The increase in other income primarily related to a gain on foreign currency exchange.
The effective tax rates for the fiscal years ended January 31, 2012 and 2011 were 34.1% and 32.7%, respectively. The increase in the effective tax rate of 1.4% from the previous year was due primarily to an increase in stock option tax expense resulting from a reduction in the exercising of non-qualified stock options from the previous year, as well as due to a reevaluation of the Company’s FASB ASC Topic 740 accrual.
FYE 2011 vs FYE 2010:
Net sales for the fiscal year ended January 31, 2011 were $88.9 million compared with $80.1 million for the fiscal year ended January 31, 2010, an increase of $8.8 million or 10.9%.
Sales in the Product Recovery/Pollution Control Technologies reporting segment were $41.4 million, or $5.5 million higher than the $35.9 million of sales for the fiscal year ended January 31, 2010, an increase of 15.4%. The sales increase was due primarily to higher sales in all business units included in this reporting segment.
Sales in the Fluid Handling Technologies reporting segment totaled $27.5 million, or $3.0 million higher than the $24.5 million of sales for the fiscal year ended January 31, 2010, an increase of 12.1%. The sales increase was due primarily to increased demand in our Met-Pro Global Pump Solutions business unit. We attribute the increase in demand to an uptick in the economic environment of the industrial markets serviced by this segment.
Sales in the Mefiag Filtration Technologies reporting segment totaled $9.9 million, or $0.4 million higher than the $9.5 million of sales for the year ended January 31, 2010, an increase of 3.9%. The sales increase was due to an increase in demand attributable to an uptick in the economic environment of the industrial markets served by all business units within this reporting segment.
Sales in the Filtration/Purification Technologies segment were $10.1 million, or $0.1 million lower than the $10.2 million of sales for the fiscal year ended January 31, 2010, a decrease of 1.2%. This decrease in sales was due to decreased demand in our Pristine Water Solutions business unit, as a result of a weakness in the municipal markets served by this business unit, which appear to be recovering more slowly from the economic slowdown.
Foreign sales were $22.4 million for the fiscal year ended January 31, 2011, compared with $19.6 million for the same period last year, an increase of 14.1%. Compared with the prior fiscal year, foreign sales increased 12.8% in the Product Recovery/Pollution Control Technologies reporting segment, 39.4% in the Fluid Handling Technologies reporting segment, and 8.4% in the Filtration/Purification Technologies segment, offset by a slight decrease of 1.8% in the Mefiag Filtration Technologies reporting segment.
Income from operations for the fiscal year ended January 31, 2011 was $9.0 million compared with $6.5 million for the fiscal year ended January 31, 2010, an increase of $2.5 million or 37.8%.
Income from operations in the Product Recovery/Pollution Control Technologies reporting segment was $2.0 million, or $0.1 million higher than the $1.9 million for the fiscal year ended January 31, 2010, an increase of 6.4%. The increase in income from operations was due primarily to higher sales for all business units within this reporting segment as well as higher gross margins for product sold by our Strobic Air business unit.
Income from operations in the Fluid Handling Technologies reporting segment totaled $5.9 million, or $1.6 million higher than the $4.3 million for the fiscal year ended January 31, 2010, an increase of 37.0%. The increase in income from operations was principally related to increased sales and higher gross margins in our Met-Pro Global Pump Solutions business unit.
Income from operations in the Mefiag Filtration Technologies reporting segment totaled $0.4 million, or $0.4 million higher than the loss of $34,886 for the fiscal year ended January 31, 2010. The increase in income from operations was due to increased sales and higher gross margins for all business units within this reporting segment.
Income from operations in the Filtration/Purification Technologies segment was $0.6 million, or $0.3 million higher than the $0.3 million for the fiscal year ended January 31, 2010, an increase of 100.0%. The increase in income from operations in the
Filtration/Purification Technologies segment was related to increased sales and higher gross margins in our Keystone Filter business unit.
Net income for the fiscal year ended January 31, 2011 was $6.1 million compared with $4.4 million for the fiscal year ended January 31, 2010, an increase of $1.7 million or 38.3%.
Gross margin for the fiscal year ended January 31, 2011 was 36.3% compared with 34.2% for the prior fiscal year. Gross margins in our three reporting segments and one other segment were higher than the same period last year.
Selling expense was $11.7 million for the fiscal year ended January 31, 2011 compared with $9.7 million for the prior fiscal year. The increase in selling expense was primarily due to higher payroll and related payroll benefit expenses as well as higher representative and distributor commissions. Selling expense as a percentage of net sales was 13.1% for the fiscal year ended January 31, 2011 compared with 12.2% for the same period last year.
General and administrative expense was $11.6 million for the fiscal year ended January 31, 2011, compared with $11.1 million in the prior fiscal year, an increase of $0.5 million. The increase in general and administrative expense was primarily related to higher management incentives, legal expenses and consulting fees related to the implementation of the Company’s new enterprise resource planning (ERP) system, partially offset by lower payroll and related payroll benefit expenses. General and administrative expense as a percentage of net sales was 13.1% for the fiscal year ended January 31, 2011, compared with 13.9% for the prior fiscal year.
Interest expense was approximately $0.2 million for each of the fiscal years ended January 31, 2011 and 2010.
Other income was $0.4 million for the fiscal year ended January 31, 2011 compared with $0.3 million in the prior year, an increase of $0.1 million. The increase in other income primarily related to (i) higher interest income, which was due to an increase in our cash balance and (ii) a gain on foreign currency exchange.
The effective tax rates for the fiscal years ended January 31, 2011 and 2010 were 32.7% and 32.2%, respectively.
Liquidity:
The Company’s cash and cash equivalents were $34.6 million on January 31, 2012 compared with $32.4 million on January 31, 2011, an increase of $2.2 million. The increase in the Company’s cash and cash equivalents is primarily the net result of positive cash flows provided by operating activities of $9.0 million, proceeds from maturities of investments of $0.5 million and proceeds from new borrowings amounting to $0.5 million, offset by quarterly cash dividend payments aggregating to $3.9 million, investment in property and equipment of $2.1 million, the purchases of investments amounting to $1.0 million and payments on debt totaling $0.7 million. The Company’s cash flows from operating activities are also influenced, in part, by the timing of shipments and negotiated standard payment terms, including retention associated with major projects, as well as other factors including changes in inventories and accounts receivable balances.
Accounts receivable, net were $17.4 million on January 31, 2012, an increase of $2.1 million compared with the prior fiscal year. This increase in accounts receivable is reflective of the higher sales in the fiscal year ended January 31, 2012. In addition to changes in sales volume, the timing and size of shipments and retention on contracts, especially in the Product Recovery/Pollution Control Technologies reporting segment, will, among other factors, influence accounts receivable balances at any given point in time. We endeavor to closely monitor payments and developments which may signal possible customer credit issues. We currently have not identified any potential material impact on our liquidity resulting from customer credit issues.
Inventories totaled $17.8 million on January 31, 2012, an increase of $2.4 million compared with the prior fiscal year. Inventory balances fluctuate depending on sales, market demand and the timing and size of shipments, especially when major systems and contracts are involved. We have been reducing our inventory where possible.
Current liabilities amounted to $16.8 million on January 31, 2012 compared with $11.2 million on January 31, 2011, an increase of $5.6 million. This increase is due primarily to increases in accounts payable, customers’ advances and accrued salaries, wages and benefits.
As of January 31, 2012 and 2011, working capital was $55.6 million and $54.1 million, respectively, and the current ratio was 4.3 and 5.8, respectively.
21
We expect that our major source of funding for normalized operations during fiscal 2013 and the immediate future thereafter will be our operating cash flow and our cash, cash equivalents, and short-term investments. We believe we have sufficient liquidity for the next several years to fund, at anticipated levels of growth, operations, research and development, capital expenditures, scheduled debt repayments, and dividend payments.
The Company and its subsidiaries also have access to $4.4 million uncommitted, unsecured lines of credit through November 2012, subject to the terms thereof. If market conditions are favorable, the Company may seek to enter into negotiations with its bank group prior to the expiration date to renew and extend these credit arrangements.
The existing domestic credit agreements include two financial covenants: a liability/tangible net worth ratio and a fixed charge coverage ratio. At January 31, 2012, we were in compliance with both financial covenants. The required liability/tangible net worth ratio, which measures total liabilities to tangible net worth, is a maximum of 1.20 times. At January 31, 2012 and 2011, our liability/tangible net worth ratio using this measure was 0.52 times and 0.39 times, respectively. The required fixed charge coverage ratio, which is an adjusted earnings measure as defined by our facility, compared with the aggregate of interest expense, debt service, dividends and capital expenditures, is a ratio of at least 1.05 times. At January 31, 2012 and 2011, our fixed charge coverage ratio using this measure was 1.54 times and 1.43 times, respectively.
Our debt instruments contain customary event of default provisions, which allow the lenders the option of accelerating all obligations upon the occurrence of certain events. In addition, the majority of our debt instruments contain a cross default provision, whereby a default on one debt obligation of the Company in excess of a specified amount, also would be considered a default under the terms of another debt instrument. As of January 31, 2012, we were in compliance with all such provisions.
Management is not aware of any known trends or any known demands, commitments, events or uncertainties that will result in or that are reasonably likely to result in a material increase or decrease in our liquidity or an increase in liquidity beyond the historical rate of increase. In addition, other than items discussed, there are no known material trends, favorable or unfavorable, in our capital resources and no expected material changes in the mix and relative cost of such resources.
Capital Resources and Requirements:
Cash flows provided by operating activities during the fiscal year ended January 31, 2012 amounted to $9.0 million compared with $8.6 million in the fiscal year ended January 31, 2011, an increase of $0.4 million. The increase in cash flows from operating activities, as compared with the same period last year, was due principally to the following: (i) an increase in accounts payable and accrued expenses of $3.1 million compared with an increase in accounts payable and accrued expenses of $1.0 million, or a positive impact on cash flow of $2.1 million (ii) an increase in customers’ advances of $2.3 million and (iii) net income increasing $1.0 million from the same period last year as well as adjustments for non-cash charges of deferred income taxes increasing $0.8 million from the same period last year. The previously listed cash inflows were partially offset by the following: (i) a decrease in accrued pension retirement benefits of $2.6 million compared with a decrease in accrued pension retirement benefits of $0.7 million for the same period last year, or a period-to-period cash outflow of $1.9 million, (ii) an increase in inventories of $2.4 million compared with a decrease in inventories of $0.7 million for the same period last year, or a period-to-period cash outflow of $3.1 million and (iii) an increase in accounts receivable of $2.2 million compared with an increase in accounts receivable of $1.5 million for the same period last year, or a negative impact on cash flow of $0.7 million.
Cash flows used in investing activities during the fiscal years ended January 31, 2012 and January 31, 2011 amounted to $2.6 million, in each year. Although the total cash flows used in investing activities did not change from the prior year, the investing activities were different. During the fiscal year ended January 31, 2012 the Company utilized $0.4 million more in acquiring property and equipment, utilized $0.3 more in purchasing investments, received $0.2 million less in proceeds from maturities of investments and had no cash outflow related to an acquisition as compared with the same period last year.
Consistent with past practices, the Company intends to continue to invest in new product development programs and to make capital expenditures required to support the ongoing operations during the coming fiscal year. The Company expects to finance all routine capital expenditure requirements through cash flows generated from operations.
Financing activities during the fiscal year ended January 31, 2012 utilized $4.2 million of available resources, compared with $4.3 million utilized during the fiscal year ended January 31, 2011, a decrease of $0.1 million. The decrease in cash utilized is principally due to the $0.8 million decrease in purchase of treasury shares and the $0.3 million increase in proceeds received from the Company’s Mefiag B.V. subsidiary’s line of credit, partially offset by the $0.6 million decrease in exercises of stock options, and the $0.3 million increase in payments of dividends.
The Company paid $0.7 million of scheduled debt during the current fiscal year. The percentage of long-term debt to equity at January 31, 2012 decreased to 3.2% compared with 3.6% at January 31, 2011.
The Board of Directors declared quarterly dividends of $0.066 per share payable on March 17, 2011, June 15, 2011 and September 15, 2011 to shareholders of record at the close of business on March 3, 2011, June 1, 2011 and September 1, 2011 respectively. The Board of Directors declared and increased the quarterly dividend by 8%, to $0.071 per share, payable on December 16, 2011 and March 16, 2012 to shareholders of record at the close of business on December 2, 2011 and March 2, 2012, respectively.
The Company accounts for its defined benefit plans in accordance with FASB ASC Topic 715, “Compensation – Retirement Benefits”. ASC Topic 715 requires that we recognize the overfunded or underfunded status of our pension plans (the “Plans”) as an asset or liability in the consolidated balance sheets, with changes in the funded status recognized through other comprehensive income in the year in which they occur, effective for our fiscal years beginning after February 1, 2006. ASC Topic 715 also requires us to measure the funded status of the Plans as of the year end consolidated balance sheets date, effective for fiscal years ending after December 15, 2008. The impact of adopting ASC Topic 715 resulted in an increase in pension liabilities and a decrease in accumulated other comprehensive income of approximately $6.7 million, prior to any deferred tax adjustment, in the fiscal year ended January 31, 2012, and a decrease in pension liabilities and an increase in accumulated other comprehensive income of approximately $0.9 million, prior to any deferred tax adjustment, in the fiscal year ended January 31, 2011. We froze the accrual of future benefits for our salaried and non-union hourly employees effective as of December 31, 2006, and for our union hourly employees effective as of December 31, 2008. As of January 31, 2012, our unfunded pension liability was approximately $9.7 million, and we expect to contribute approximately $1.7 million to the pension plans during the fiscal year ending January 31, 2013.
As part of our commitment to the future, the Company expended $2.5 million and $2.2 million on research and development in the fiscal years ended January 31, 2012 and 2011, respectively.
The Company will continue to invest in new product development to maintain and enhance its competitive position in the markets in which we participate. Capital expenditures will be made to support operations and expand our capacity to meet market demands. The Company intends to finance capital expenditures in the coming year through cash flows from operations and will secure third party financing, when deemed appropriate.
Off-Balance Sheet Arrangements:
We have no off-balance sheet arrangements, as defined in Item 303 of Regulation S-K, that have, or are reasonably likely to have, a current or future effect on our financial condition, revenues or expenses, results of operations, liquidity, capital resources or capital expenditures that are material to investors.
Contractual Obligations:
The following table summarizes the Company’s contractual cash obligations as of January 31, 2012 by required payment periods:
| Total | ||||||||||||||
| Contractual | ||||||||||||||
| Payments Due By | Long-Term | Purchase | Operating | Interest | Pension | Cash | ||||||||
| Period | Debt | Obligations | Leases | Expense | Contributions | Obligations | ||||||||
| Less than 1 Year | $657,216 | $8,073,806 | $108,969 | $161,794 | $1,694,583 | $10,696,368 | ||||||||
| 1 – 3 Years | 729,344 | - | 77,545 | 251,999 | 3,383,254 | 4,442,142 | ||||||||
| 3 – 5 Years | 598,504 | - | - | 169,656 | 2,060,964 | 2,829,124 | ||||||||
| More than 5 Years | 993,837 | - | - | 143,275 | 380,065 | 1,517,177 | ||||||||
| Total | $2,978,901 | $8,073,806 | $186,514 | $726,724 | $7,518,866 | $19,484,811 | ||||||||
Future expected obligations under the Company’s pension plans are included in the contractual cash obligations table above. The Company’s pension plan policy allows it to fund an amount, which could be in excess of the pension cost expensed, subject to the limitations imposed by current tax regulations. The Company currently projects that it will contribute $1.7 million to its pension plans during the fiscal year ending January 31, 2013.
Recent Accounting Pronouncements:
In October 2009, the FASB issued Accounting Standards Update (“ASU”) No. 2009-13, “Multiple-Deliverable Revenue Arrangements, a consensus of the FASB Emerging Issues Task Force”, an amendment of ASC Topic 605, “Revenue Recognition”. ASU No. 2009-13 provides amendments to the criteria for separating consideration in multiple-deliverable arrangements. As a result of these amendments, multiple-deliverable revenue arrangements will be separated in more circumstances than under existing U.S. Generally Accepted Accounting Principles (“GAAP”). The ASU does this by establishing a selling price hierarchy for determining the selling price of a deliverable. The selling price used for each deliverable will be based on vendor-specific objective evidence if available, third-party evidence if vendor-specific objective evidence is not available, or estimated selling price if neither vendor-specific objective evidence nor third-party evidence is available. A vendor will be required to determine its best estimate of selling price in a manner that is consistent with that used to determine the price to sell the deliverable on a standalone basis. This ASU also eliminates the residual method of allocation and will require that arrangement consideration be allocated at the inception of the arrangement to all deliverables using the relative selling price method, which allocates any discount in the overall arrangement proportionally to each deliverable based on its relative selling price. Expanded disclosures of qualitative and quantitative information regarding application of the multiple-deliverable revenue arrangement guidance are also required under the ASU. The ASU does not apply to arrangements for which industry specific allocation and measurement guidance exists, such as long-term construction contracts and software transactions. ASU No. 2009-13 was effective for the Company in this fiscal year beginning February 1, 2011. The adoption of this update to ASC Topic 605 did not have a material impact on our financial position, results of operations or cash flows.
In January 2010, the FASB issued ASU No. 2010-06, “Fair Value Measurements and Disclosures (Topic 820): Improving Disclosures about Fair Value Measurements”. This update provides amendments to Subtopic 820-10 that requires new disclosures on 1) the amounts of significant transfers in and out of Level 1 and Level 2 fair value measurements and reasons for the transfers and 2) in the reconciliation for Level 3 fair value measurements, the separate presentation of information about purchases, sales, issuances and settlements. The new disclosures are effective for interim and annual reporting periods beginning after December 15, 2009, except for the disclosures about purchases, sales, issuances and settlements in the roll forward activity in Level 3 fair value measurements. Those disclosures are effective for fiscal years beginning after December 15, 2010 and for interim periods within those fiscal years. The adoption of this update to ASC Topic 820 did not have a material impact on our financial position, results of operations or cash flows.
In May 2011, the FASB issued ASU No. 2011-04, “Fair Value Measurement (Topic 820): Amendments to Achieve Common Fair Value Measurement and Disclosure Requirements in U.S. GAAP and IFRSs”. The amendments in this update are the result of the work of the FASB and the International Accounting Standards Board (“IASB”) to develop common requirements for measuring fair value and for disclosing information about fair value measurements. The amendments change the wording used to describe many of the requirements in U.S. GAAP for measuring fair value and for disclosing information about fair value measurements. The amendments clarify that a reporting entity should disclose quantitative information about the unobservable inputs used in a fair value measurement that is categorized within Level 3 of the fair value hierarchy in order to increase the comparability of disclosures between reporting entities applying U.S. GAAP and those applying IFRSs. Additionally, the amendments expand the disclosures for fair value measurements categorized within Level 3 where a reporting entity will need to include the valuation processes used and the sensitivity of the fair value measurement to changes in unobservable inputs and the interrelationships between those unobservable inputs, if any. For many of the requirements, the FASB does not intend for the amendments to result in a change in the application of the requirements in ASC Topic 820. The amendments in this update are to be applied prospectively and are effective during interim and annual periods beginning after December 15, 2011. The adoption of this update will not have a material impact on our financial position, results of operations or cash flows.
In June 2011, the FASB issued ASU No. 2011-05, “Comprehensive Income (Topic 220): Presentation of Comprehensive Income.” The amendments in this update eliminate the current option to report other comprehensive income and its components in the statements of shareholders’ equity. Instead, an entity will be required to present either a single continuous statement of net income and other comprehensive income or in two separate, but consecutive statements. The amendments in this update are to be applied retrospectively and are effective for interim and annual periods beginning after December 15, 2011. The new guidance will be effective for the Company beginning February 1, 2012 and will have presentation changes only.
In September 2011, the FASB issued ASU No. 2011-08, “Intangibles-Goodwill and Other (Topic 350): Testing Goodwill for Impairment”. The amendments in this update allow an entity the option to first assess qualitative factors to determine whether the existence of events or circumstances leads to a determination that it is more likely than not that the fair value of a reporting unit is less than its carrying amount. If, based on its qualitative assessment, an entity concludes it is more likely than not that the fair value of a reporting unit is less than its carrying amount, quantitative impairment testing is required. However, if an entity concludes otherwise, quantitative impairment testing is not required. ASU No. 2011-08 is
effective for annual and interim reporting periods beginning after December 15, 2011, with early adoption permitted. The adoption of this update is not expected to have a material impact on our financial position, results of operations or cash flows.
Critical Accounting Policies and Estimates:
Management’s Discussion and Analysis of its Financial Position and Results of Operations are based upon the Company’s consolidated financial statements, which have been prepared in accordance with accounting principles generally accepted in the United States. The preparation of these financial statements requires management to make estimates and assumptions that affect the reported amounts of assets, liabilities, revenues and expenses and related disclosure of contingent assets and liabilities. The significant accounting policies which we believe are the most critical to aid in fully understanding and evaluating our reported financial results include the following:
Revenue Recognition:
The Company recognizes revenues from product sales or services provided when the following revenue recognition criteria are met: persuasive evidence of an arrangement exists, delivery has occurred or services have been rendered, the selling price is fixed or determinable and collectability is reasonably assured. FASB ASC Topic 605, “Revenue Recognition”, provides guidance on the application of generally accepted accounting principles to selected revenue recognition issues. The Company has concluded that its revenue recognition policy is appropriate and in accordance with FASB ASC Topic 605.
Depreciation and Amortization:
Property, plant and equipment, finite lived intangible assets and certain other long-lived assets are depreciated or amortized over their useful lives. Useful lives are based on management’s estimates of the period that the assets will generate revenue. Property, plant and equipment, as well as intangible assets, are reviewed for impairment whenever events or changes in circumstances indicate that the carrying amount of an asset may not be recoverable.
Goodwill:
In September 2011, the FASB issued ASU No. 2011-08, “Intangibles-Goodwill and Other (Topic 350): Testing Goodwill for Impairment”. The amendments in this update allow the Company the option to first assess qualitative factors to determine whether the existence of events or circumstances leads to a determination that it is more likely than not that the fair value of a reporting unit is less than its carrying amount. If, based on its qualitative assessment, the Company concludes it is more likely than not that the fair value of a reporting unit is less than its carrying amount, quantitative impairment testing is required. However, if an entity concludes otherwise, quantitative impairment testing is not required. Quantitative impairment testing involves significant judgment in estimating projections of fair value generated through future performance of each of the reporting units, which comprise our operating segments. In calculating the fair value of the reporting units using the present value of estimated future cash flows method, we rely on a number of assumptions including sales and related gross margin projections, operating margins, anticipated working capital requirements and market rate of returns used in discounting projected cash flows. These assumptions are based upon market and industry forecasts, our business plans and historical data. Inherent uncertainties exist in determining and applying such factors. The discount rate used in the projection of fair value represents a weighted average cost of capital available to the Company.
During the fiscal year ended January 31, 2012, we performed a quantitative impairment analysis on each of the Company’s reporting units that carry goodwill on their balance sheets. In each case, the fair value exceeded the carrying amount, including goodwill, by a significant amount, except for Flex-Kleen and Pristine Water Solutions which represents 69.6% of the total Company-wide goodwill.
For Flex-Kleen, the carrying value as of January 31, 2012 and 2011 amounted to $9.3 million and $9.1 million, respectively. The fair value of Flex-Kleen as of January 31, 2012 and 2011 totaled $13.2 million and $12.3 million, respectively. As a result, the fair value exceeded the carrying amount, including goodwill, by $3.9 million and $3.2 million at January 31, 2012 and 2011, respectively. Therefore, as of January 31, 2012, Flex-Kleen’s goodwill was not impaired.
Flex-Kleen, which initially performed well after being acquired in 1998, thereafter had several years of declining performance which we attributed primarily to a general weakness in its served markets, followed by improved performance in the fiscal years ended January 31, 2007, 2008 and 2009. In the fiscal years ended January 31, 2007, 2008 and 2009, actual results exceeded the projected results used in our impairment model. During the fiscal year ended January 31, 2010, Flex-Kleen’s net sales and operating profit were below the projections in our impairment model, which we believe was a reflection of the downturn
in global business and economic conditions during this period of time and was not due to any new development specific to Flex-Kleen. In the fiscal year ended January 31, 2011, Flex-Kleen’s net sales were below the projections but operating profit was slightly above the projections in our impairment model. In the fiscal year ended January 31, 2012, Flex-Kleen’s net sales and operating profit exceeded the projections in our impairment model. Our impairment model requires that Flex-Kleen’s sales and operating profit improve during each of the next several fiscal years in order for us to avoid a potential impairment charge.
Because of market conditions and/or potential changes in strategy and product portfolio, it is possible that forecasts used to support asset carrying values may change in the future, which could result in non-cash charges that would adversely affect our results of operations and financial condition. Based on current projections, a one percent decrease in revenue growth, a one percent decrease in gross margin or a one percent increase in the weighted average cost of capital would reduce the fair value for Flex-Kleen by $1.9 million, $1.1 million, and $0.9 million, respectively. Additionally, the Company cannot predict the occurrence of unknown events that might adversely affect the reportable value of Flex-Kleen’s goodwill.
For Pristine Water Solutions, the carrying value as of January 31, 2012 and 2011 amounted to $4.6 million at both dates. The fair value of Pristine Water Solutions as of January 31, 2012 and 2011 totaled $5.9 million and $9.8 million, respectively. As a result, the fair value exceeded the carrying amount, including goodwill, by $1.3 million and $5.2 million at January 31, 2012 and 2011, respectively. Therefore, as of January 31, 2012, Pristine Water Solutions’ goodwill was not impaired.
During the fiscal year 2012, there was a decline in net sales and operating profit of our Pristine Water Solutions business unit that we attribute to a number of factors including raw material price increases, increased price competition, product mix, continued weaknesses in Pristine Water Solutions’ principal market, the municipal market, and inclement weather in certain geographic areas which affected product demand. Our impairment model requires that Pristine Water Solutions’ sales and operating profit improve during each of the next several fiscal years in order for us to avoid a potential impairment charge.
Because of market conditions and/or potential changes in strategy and product portfolio, it is possible that forecasts used to support asset carrying values may change in the future, which could result in non-cash charges that would adversely affect our results of operations and financial condition. Based on current projections, a one percent decrease in revenue growth, a one percent decrease in gross margin or a one percent increase in the weighted average cost of capital would reduce the fair value for Pristine Water Solutions by $0.7 million, $0.5 million, and $0.4 million, respectively. Additionally, the Company cannot predict the occurrence of unknown events that might adversely affect the reportable value of goodwill related to Pristine Water Solutions.
Pension Obligations:
The determination of our obligation and expense for pension benefits is dependent on our selection of certain assumptions used by actuaries in calculating such amounts. Those assumptions are described in Note 13 to the consolidated financial statements and include, among others, the discount rate and the expected long-term rate of return on plan assets. In accordance with generally accepted accounting principles, actual results that differ from our assumptions are accumulated and amortized over future periods and therefore, generally affect our recognized expense and recorded obligation in such future periods. While we believe that our assumptions are appropriate, significant differences in our actual experience or significant changes in our assumptions may materially affect our pension obligations and our future expense.
Our prospects are subject to certain uncertainties and risk. This Annual Report on Form 10-K/A also contains certain forward-looking statements within the meaning of the Federal Securities Laws. These forward-looking statements may be identified by words describing our belief or expectation, such as where we say that we “believe”, “expect” or “anticipate”, or where we characterize something in a manner in which there is an express or implicit reference to the future, such as “non-recurring” or “unusual,” or where we express that our view is based upon the “current status” of a given matter, or upon facts as we know them as of the date of the statement. The content and/or context of other statements that we make may indicate that the statement is “forward-looking”. We claim the “safe harbor” provided by The Private Securities Reform Act of 1995 for all forward-looking statements.
Results may differ materially from our current results and actual results could differ materially from those suggested in the forward-looking statements as a result of certain risk factors, including but not limited to those set forth below, other one time events, other important factors disclosed previously and from time to time in Met-Pro’s other filings with the Securities and Exchange Commission.
The following important factors, along with those discussed elsewhere in this Annual Report on Form 10-K/A, could affect our future financial condition and results of operations, and could cause our future financial condition and results of operations to differ materially from those expressed in our SEC filings and in our forward-looking statements:
| · | the write-down of goodwill, as a result of the determination that the acquired business is impaired. As of January 31, 2012, the most recent date of the required annual testing for goodwill impairment, Flex-Kleen and Pristine Water Solutions were the only reporting units that carry goodwill where the fair value of the unit did not exceed the carrying value, including goodwill, by a significant amount. Flex-Kleen, which initially performed well after being acquired by Met-Pro, thereafter had several years of declining performance which we attributed primarily to a general weakness in its served markets, followed by improved performance in the fiscal years ended January 31, 2007, 2008 and 2009. During the fiscal year ended January 31, 2010, Flex-Kleen’s sales and operating profit were below the projections in our impairment model, which we believe was a reflection of the downturn in global business and economic conditions during this period of time and was not due to any new development specific to Flex-Kleen. In the fiscal year ended January 31, 2011, Flex-Kleen’s net sales were below that which is required by our impairment model, while the fiscal year 2011 operating profit was slightly higher than the amount which is required by our impairment model. In the fiscal year ended January 31, 2012, Flex-Kleen’s net sales and operating profit exceeded that which is required by our impairment model. During the fiscal year ended January 31, 2012, we performed an impairment analysis of the $11.1 million of goodwill that the Company carries for Flex-Kleen and concluded that no impairment had occurred. During the fiscal year ended January 31, 2012, there has been a decline in sales and profitability of our Pristine Water Solutions business unit that we attribute to a number of factors including raw material price increases, price competition, product mix, weaknesses in Pristine Water Solutions’ principal market, the municipal market, and wet weather conditions. During the fiscal year ended January 31, 2012, we performed an impairment analysis of the $3.3 million of goodwill that the Company carries for Pristine Water Solutions and concluded that no impairment had occurred. Our impairment models require that Flex-Kleen’s and Pristine Water Solutions’ sales and operating profit improve during each of the next several fiscal years in order for us to avoid a potential impairment charge. While we project that Flex-Kleen’s and Pristine Water Solutions’ performance during the fiscal year ending January 31, 2013 will be sufficient to avoid an impairment charge, our projections are forward-looking statements where the actual results may not be as we presently anticipate; | |
· | materially adverse changes in economic conditions (i) in the markets served by us or (ii) in significant customers of ours; | |
· | material changes in available technology; | |
· | adverse developments in the asbestos cases that have been filed against the Company, including without limitation the exhaustion of insurance coverage, the imposition of punitive damages, the insolvency or liquidation of our insurance carriers, or other adverse developments in the availability of insurance coverage. On April 27, 2011, a liquidation order was entered against Atlantic Mutual Insurance Company, who had been providing defense and indemnity to the Company, and its affiliate, Centennial Insurance Company, who provided umbrella coverage to the Company. It appears that our remaining insurers have assumed the share of the defense and indemnity obligations that Atlantic Mutual Insurance Company had agreed to assume, and despite the liquidation of Atlantic Mutual Insurance Company and Centennial Insurance Company, the Company believes that its insurance coverage is adequate for the cases currently pending against the Company and for the foreseeable future, assuming a continuation of the current volume, nature of cases and settlement amounts; however, the Company has no control over the number and nature of cases that are filed against it, nor as to the financial health of its insurers or their position as to coverage; | |
· | changes in accounting rules promulgated by regulatory agencies, including the SEC, which could result in an impact on earnings; | |
· | the cost of compliance with Sarbanes-Oxley and other applicable legal and listing requirements, and the unanticipated possibility that Met-Pro may not meet these requirements; | |
· | weaknesses in our internal control over financial reporting, which either alone or combined with actions by our employees intended to circumvent our internal control over financial reporting, to violate our policies, or to commit fraud or other bad acts, could lead to incorrect reporting of financial results. We believe that our internal control over financial reporting as of January 31, 2012 is effective; however, there are limits to any control system and we cannot give absolute assurance that our internal control is effective or that financial statement misstatements will not occur or that policy violations and/or fraud within the Company will not occur; | |
· | unexpected results in our product development activities; | |
· | loss of key customers; | |
· | changes in product mix, increases in the cost of materials, commoditization, price competition, and other similar changes in our markets, with adverse effect on margins; | |
· | changes in our existing management; | |
· | exchange rate fluctuations; | |
· | changes in federal laws, state laws and regulations; |
27
| · | lower than anticipated return on investments in the Company’s defined benefit plans, which could affect the amount of the Company’s pension liabilities; | |
| · | the assertion of claims that the Company’s products, including products produced by companies acquired by the Company, infringe third party patents or have caused injury, loss or damage; | |
· | the effect of acquisitions and other strategic ventures; | |
· | failure to properly quote and/or execute customer orders, including misspecifications, design, engineering or production errors; | |
· | customer-directed delays in the completion, or shipment, of purchase orders. In particular, sales of larger projects sold by our Product Recovery/Pollution Control Technologies reporting segment may vary materially from period-to-period in part due to customer-directed delays in the completion, or shipment, of an order, even though we may be in a position to complete the order or we may be ready to ship it and we have incurred expense in producing the order; | |
· | unanticipated problems related to international sales; | |
· | challenges in the implementation of a new enterprise resource planning (ERP) system; and/or | |
· | failure in execution of acquisition strategy. |
We are exposed to certain market risks, primarily changes in interest rates. Market risk is the potential loss arising from adverse changes in market rates and prices, such as foreign currency exchange and interest rates. For Met-Pro Corporation, these exposures are primarily related to changes in interest rates. We do not currently hold any derivatives or other financial instruments purely for trading or speculative purposes.
The carrying value of the Company’s total long-term debt and current maturities of long-term debt, at January 31, 2012 was $3.3 million. Market risk was estimated as the potential decrease (increase) in future earnings and cash flows resulting from a hypothetical 10% increase (decrease) in the Company’s estimated weighted average borrowing rate at January 31, 2012. Although most of the interest on the Company’s debt is indexed to either the LIBOR or EURIBOR market rates, there would be no material effect on the future earnings or cash flows related to the Company’s total debt for such a hypothetical change.
The Company has only a limited involvement with derivative financial instruments. The Company has one interest rate swap agreement to hedge against the potential impact on earnings from increases in market interest rates. Effective April 3, 2006, the Company entered into a fifteen-year interest rate swap agreement for a notional amount equal to the balance on the bond payable maturing April 2021. The Company swapped the ninety day LIBOR for a fixed rate of 4.87%. As of January 31, 2012 the effective fixed interest rate was 7.00% as a result of the swap agreement plus the interest rate floor provision of 250 basis points. The interest rate swap agreement is accounted for as a cash flow hedge that qualifies for treatment under the short-cut method of measuring effectiveness in accordance with FASB ASC Topic 815, “Derivatives and Hedging”. There was no hedge ineffectiveness as of January 31, 2012. The fair value of the interest rate swap agreement resulted in a decrease in equity of $230,760 (net of tax) and $172,814 (net of tax) at January 31, 2012 and 2011, respectively. These results are recorded in the accumulated other comprehensive loss section of shareholders’ equity. See Note 7, “Debt,” in the Notes to Consolidated Financial Statements for additional information.
The Company has wholly-owned subsidiaries located in The Netherlands, Canada, the People’s Republic of China and Chile. In the past, we have not hedged our foreign currency exposure, and fluctuations in exchange rates have not materially affected our operating results. Future changes in exchange rates may positively or negatively impact our revenues, operating expenses and earnings. Due to the fact that most of our foreign sales are denominated in the local currency, we do not anticipate that exposure to foreign currency rate fluctuations will be material in the fiscal year ending January 31, 2013.
Index to Consolidated Financial Statements and Supplementary Data:
| Page | |||
| Consolidated Financial Statements: | |||
| 30 | |||
| 31 | |||
| 33 | |||
| 34 | |||
| 35 | |||
| 36 | |||
| 37 | |||
Management of Met-Pro Corporation (the “Company”) is responsible for establishing and maintaining adequate internal control over financial reporting. The Company’s internal control over financial reporting is a process designed under the supervision of the Chief Executive and Chief Financial Officers to provide reasonable assurance regarding the reliability of financial reporting and the preparation of the Company’s financial statements for external reporting purposes in accordance with accounting principles generally accepted in the United States.
As of January 31, 2012, management conducted an assessment of the effectiveness of the Company’s internal control over financial reporting based on the framework established in Internal Control–Integrated Framework issued by the Committee of Sponsoring Organizations of the Treadway Commission (COSO). Management has determined that the Company’s internal control over financial reporting as of January 31, 2012 is effective to provide reasonable assurance regarding the reliability of financial reporting and the preparation of the Company’s financial statements for external reporting purposes in accordance with accounting principles generally accepted in the United States.
Our internal control over financial reporting includes policies and procedures that pertain to the maintenance of records that, in reasonable detail, accurately and fairly reflect transactions and dispositions of assets; provide reasonable assurances that transactions are recorded as necessary to permit preparation of financial statements in accordance with accounting principles generally accepted in the United States, and that receipts and expenditures are being made only in accordance with authorizations of management; and provide reasonable assurance regarding prevention or timely detection of unauthorized acquisition, use or disposition of the Company’s assets that could have a material effect on our financial statements.
The Company’s internal control over financial reporting as of January 31, 2012, has been audited by Marcum LLP, an independent registered public accounting firm. Their report expresses an unqualified opinion on the effectiveness of the Company’s internal control over financial reporting as of January 31, 2012.
The Company’s management, including the Chief Executive Officer and Chief Financial Officer, does not expect that our internal control over financial reporting will prevent or detect all errors and all frauds. A control system, no matter how well designed and operated, can provide only reasonable, not absolute, assurance that the control system’s objectives will be met. The design of a control system must reflect the fact that there are resource constraints, and the benefits of controls must be considered relative to their costs. Further, because of the inherent limitations in all control systems, no evaluation of controls can provide absolute assurance that misstatements due to error or fraud will not occur or that all control issues and instances of fraud, if any, within the Company have been detected. These inherent limitations include the realities that judgments in decision-making can be faulty and that breakdowns can occur because of simple error or mistake, or because of intentional acts designed to circumvent controls. The design of any system of controls is based, in part, on certain assumptions about the likelihood of future events, and there can be no assurance that any design will succeed in achieving its stated goals under all potential future conditions. Projections of any evaluation of controls effectiveness to future periods are subject to risks. Over time, controls may become inadequate because of changes in conditions or deterioration in the degree of compliance with policies or procedures.
| /s/ Raymond J. De Hont | |
| Raymond J. De Hont | |
| President and Chief Executive Officer | |
| /s/ Gary J. Morgan | |
| Gary J. Morgan | |
| Chief Financial Officer |
Harleysville, Pennsylvania
March 22, 2012
To the Audit Committee of the Board of Directors
and Shareholders of Met-Pro Corporation
We have audited the accompanying consolidated balance sheets of Met-Pro Corporation and its wholly-owned subsidiaries (the “Company”) as of January 31, 2012 and 2011, and the related consolidated statements of income, shareholders’ equity and cash flows for each of the years in the three-year period ended January 31, 2012. Our audits also included the financial statement schedule as of and for the years ended January 31, 2012, 2011 and 2010 included on page 70. These consolidated financial statements and financial statement schedule are the responsibility of the Company’s management. Our responsibility is to express an opinion on these consolidated financial statements and financial statement schedule based on our audits.
We conducted our audits in accordance with the standards of the Public Company Accounting Oversight Board (United States). Those standards require that we plan and perform the audit to obtain reasonable assurance about whether the consolidated financial statements are free of material misstatement. An audit includes examining, on a test basis, evidence supporting the amounts and disclosures in the financial statements, assessing the accounting principles used and significant estimates made by management, as well as evaluating the overall financial statement presentation. We believe that our audits provide a reasonable basis for our opinion.
In our opinion, the consolidated financial statements referred to above present fairly, in all material respects, the consolidated financial position of Met-Pro Corporation and its wholly-owned subsidiaries as of January 31, 2012 and 2011, and the consolidated results of their operations and their cash flows for each of the years in the three-year period ended January 31, 2012, in conformity with accounting principles generally accepted in the United States of America. Also, in our opinion, the related financial statement schedule, when considered in relation to the basic consolidated financial statements taken as a whole presents fairly, in all material aspects, the information set forth therein.
We also have audited, in accordance with the standards of the Public Company Accounting Oversight Board (United States), Met-Pro Corporation’s internal control over financial reporting as of January 31, 2012, based on the criteria established in Internal Control–Integrated Framework issued by the Committee of Sponsoring Organizations of the Treadway Commission and our report dated March 22, 2012 expressed an unqualified opinion on the effectiveness of the Company’s internal control over financial reporting.
| /s/ Marcum LLP |
Marcum LLP
Bala Cynwyd, Pennsylvania
March 22, 2012
ON INTERNAL CONTROL OVER FINANCIAL REPORTING
To the Audit Committee of the Board of Directors
and Shareholders of Met-Pro Corporation
We have audited Met-Pro Corporation’s (the “Company”) internal control over financial reporting as of January 31, 2012, based on criteria established in Internal Control–Integrated Framework issued by the Committee of Sponsoring Organizations of the Treadway Commission. The Company’s management is responsible for maintaining effective internal control over financial reporting; and for its assessment of the effectiveness of internal control over financial reporting included in the accompanying “Management’s Annual Report on Internal Control Over Financial Reporting”. Our responsibility is to express an opinion on the Company’s internal control over financial reporting based on our audit.
We conducted our audit in accordance with the standards of the Public Company Accounting Oversight Board (United States). Those standards require that we plan and perform the audit to obtain reasonable assurance about whether effective internal control over financial reporting was maintained in all material respects. Our audit of internal control over financial reporting included obtaining an understanding of internal control over financial reporting, assessing the risk that a material weakness exists, and testing and evaluating the design and operating effectiveness of internal control based on the assessed risk. Our audit also included performing such other procedures as we considered necessary in the circumstances. We believe that our audit provides a reasonable basis for our opinion.
A company’s internal control over financial reporting is a process designed to provide reasonable assurance regarding the reliability of financial reporting and the preparation of financial statements for external purposes in accordance with generally accepted accounting principles. A company’s internal control over financial reporting includes those policies and procedures that (1) pertain to the maintenance of records that, in reasonable detail, accurately and fairly reflect the transactions and dispositions of the assets of the company; (2) provide reasonable assurance that transactions are recorded as necessary to permit preparation of financial statements in accordance with generally accepted accounting principles, and that receipts and expenditures of the company are being made only in accordance with authorizations of management and directors of the company; and (3) provide reasonable assurance regarding prevention or timely detection of unauthorized acquisition, use, or disposition of the company’s assets that could have a material effect on the financial statements.
Because of the inherent limitations, internal control over financial reporting may not prevent or detect misstatements. Also, projections of any evaluation of effectiveness to future periods are subject to the risk that controls may become inadequate because of changes in conditions, or that the degree of compliance with the policies or procedures may deteriorate.
In our opinion, Met-Pro Corporation maintained, in all material respects, effective internal control over financial reporting as of January 31, 2012, based on criteria established in Internal Control–Integrated Framework issued by the Committee of Sponsoring Organizations of the Treadway Commission.
We also have audited, in accordance with the standards of the Public Company Accounting Oversight Board (United States), the consolidated balance sheets as of January 31, 2012 and 2011, and the related consolidated statements of income, shareholders’ equity, and cash flows and the related financial statement schedule for each of the years in the three-year period ended January 31, 2012 of the Company, and our report dated March 22, 2012 expressed an unqualified opinion on those financial statements and the related financial statement schedule.
| /s/ Marcum LLP |
Marcum LLP
Bala Cynwyd, Pennsylvania
March 22, 2012
| Years ended January 31, | |||||||
| 2012 | 2011 | 2010 | |||||
| Net sales | $100,161,392 | $88,865,426 | $80,132,493 | ||||
| Cost of goods sold | 64,792,385 | 56,587,326 | 52,755,941 | ||||
| Gross profit | 35,369,007 | 32,278,100 | 27,376,552 | ||||
| Operating expenses | |||||||
| Selling | 12,017,123 | 11,674,270 | 9,741,528 | ||||
| General and administrative | 12,760,600 | 11,633,509 | 11,122,469 | ||||
| 24,777,723 | 23,307,779 | 20,863,997 | |||||
| Income from operations | 10,591,284 | 8,970,321 | 6,512,555 | ||||
| Interest expense | (191,181 | ) | (212,470 | ) | (224,143 | ) | |
| Other income | 434,207 | 362,046 | 260,177 | ||||
| Income before taxes | 10,834,310 | 9,119,897 | 6,548,589 | ||||
| Provision for taxes | 3,700,609 | 2,980,765 | 2,108,778 | ||||
| Net income | $7,133,701 | $6,139,132 | $4,439,811 | ||||
| Earnings per share | |||||||
| Basic | $.49 | $.42 | $.30 | ||||
| Diluted | $.48 | $.42 | $.30 | ||||
| Average number of common and | |||||||
| common equivalent shares outstanding | |||||||
| Basic | 14,662,055 | 14,629,215 | 14,602,276 | ||||
| Diluted | 14,774,692 | 14,758,659 | 14,675,735 | ||||
The notes to consolidated financial statements are an integral part of the above statements.
| January 31, | ||||
| ASSETS | 2012 | 2011 | ||
| Current assets | ||||
| Cash and cash equivalents | $34,581,394 | $32,400,814 | ||
| Short-term investments | 764,061 | 497,155 | ||
| Accounts receivable, net of allowance for | ||||
| doubtful accounts of approximately | ||||
| $491,000 and $444,000, respectively | 17,373,121 | 15,311,322 | ||
| Inventories | 17,847,143 | 15,474,430 | ||
| Prepaid expenses, deposits and other current assets | 1,683,486 | 1,578,176 | ||
| Deferred income taxes | 186,329 | 84,155 | ||
| Total current assets | 72,435,534 | 65,346,052 | ||
| Property, plant and equipment, net | 19,322,436 | 19,290,808 | ||
| Goodwill | 20,798,913 | 20,798,913 | ||
| Other assets | 2,952,332 | 2,610,555 | ||
| Total assets | $115,509,215 | $108,046,328 | ||
| LIABILITIES AND SHAREHOLDERS’ EQUITY | ||||
| Current liabilities | ||||
| Current portion of debt | $657,216 | $532,540 | ||
| Accounts payable | 7,684,739 | 4,864,724 | ||
| Accrued salaries, wages and benefits | 1,827,603 | 1,650,314 | ||
| Other accrued expenses | 2,357,929 | 2,286,043 | ||
| Dividend payable | 1,042,297 | 967,445 | ||
| Customers’ advances | 3,232,600 | 907,107 | ||
| Total current liabilities | 16,802,384 | 11,208,173 | ||
| Long-term debt | 2,687,971 | 3,011,988 | ||
| Accrued pension retirement benefits | 10,618,047 | 6,553,262 | ||
| Other non-current liabilities | 56,391 | 54,195 | ||
| Deferred income taxes | 1,522,451 | 2,745,786 | ||
| Total liabilities | 31,687,244 | 23,573,404 | ||
| Commitments and contingencies | ||||
| Shareholders’ equity | ||||
| Common shares, $.10 par value; 36,000,000 shares | ||||
| authorized, 15,928,679 shares issued, of which | ||||
| 1,250,051 and 1,270,417 shares were reacquired | ||||
| and held in treasury at the respective dates | 1,592,868 | 1,592,868 | ||
| Additional paid-in capital | 4,058,735 | 3,448,249 | ||
| Retained earnings | 96,228,764 | 93,113,247 | ||
| Accumulated other comprehensive loss | (7,718,883 | ) | (3,201,767 | ) |
| Treasury shares, at cost | (10,339,513 | ) | (10,479,673 | ) |
| Total shareholders’ equity | 83,821,971 | 84,472,924 | ||
| Total liabilities and shareholders’ equity | $115,509,215 | $108,046,328 | ||
The notes to consolidated financial statements are an integral part of the above statements.
| Years ended January 31, | ||||||
| 2012 | 2011 | 2010 | ||||
| Cash flows from operating activities | ||||||
| Net income | $7,133,701 | $6,139,132 | $4,439,811 | |||
| Adjustments to reconcile net income to net | ||||||
| cash provided by operating activities: | ||||||
| Depreciation and amortization | 1,914,418 | 1,824,685 | 1,931,512 | |||
| Deferred income taxes | 1,197,654 | 439,069 | 406,754 | |||
| (Gain) loss on sales of property and equipment, net | 102,386 | 8,231 | (20,585 | ) | ||
| Stock-based compensation | 744,306 | 645,891 | 645,967 | |||
| Allowance for doubtful accounts | 46,986 | 240,133 | 37,189 | |||
| Change in operating assets and liabilities: | ||||||
| Accounts receivable | (2,173,195 | ) | (1,464,863 | ) | 6,409,090 | |
| Inventories | (2,450,559 | ) | 676,071 | 4,280,330 | ||
| Prepaid expenses, deposits and other assets | (350,416 | ) | (243,598 | ) | (9,904 | ) |
| Accounts payable and accrued expenses | 3,116,045 | 977,454 | (2,551,921 | ) | ||
| Customers’ advances | 2,323,603 | 22,004 | 524,678 | |||
| Accrued pension retirement benefits | (2,647,339 | ) | (668,901 | ) | (449,405 | ) |
| Other non-current liabilities | 2,197 | 2,197 | 2,197 | |||
| Net cash provided by operating activities | 8,959,787 | 8,597,505 | 15,645,713 | |||
| Cash flows from investing activities | ||||||
| Proceeds from sales of property and equipment | 33,566 | 36,387 | 40,318 | |||
| Acquisitions of property and equipment | (2,097,233 | ) | (1,665,949 | ) | (2,133,807 | ) |
| Purchase of investments | (1,010,535 | ) | (745,218 | ) | (1,445,004 | ) |
| Proceeds from maturities of investments | 497,155 | 725,004 | 720,000 | |||
| Payment for acquisition of business | - | (955,268 | ) | - | ||
| Net cash used in investing activities | (2,577,047 | ) | (2,605,044 | ) | (2,818,493 | ) |
| Cash flows from financing activities | ||||||
| Proceeds from new borrowings | 477,692 | 189,074 | 485,336 | |||
| Reduction of debt | (727,399 | ) | (717,134 | ) | (926,497 | ) |
| Exercise of stock options | 152,970 | 780,834 | 225,584 | |||
| Payment of dividends | (3,943,332 | ) | (3,597,539 | ) | (3,504,026 | ) |
| Purchase of treasury shares | (167,534 | ) | (935,631 | ) | (251,612 | ) |
| Net cash used in financing activities | (4,207,603 | ) | (4,280,396 | ) | (3,971,215 | ) |
| Effect of exchange rate changes on cash | 5,443 | 26,645 | 56,446 | |||
| Net increase in cash and cash equivalents | 2,180,580 | 1,738,710 | 8,912,451 | |||
| Cash and cash equivalents at beginning of year | 32,400,814 | 30,662,104 | 21,749,653 | |||
| Cash and cash equivalents at end of year | $34,581,394 | $32,400,814 | $30,662,104 | |||
The notes to consolidated financial statements are an integral part of the above statements.
Accumulated | ||||||||||||||
| Additional | Other | |||||||||||||
| Common | Paid-in | Retained | Comprehensive | Treasury | ||||||||||
| Shares | Capital | Earnings | Income/(Loss) | Shares | Total | |||||||||
| Balances, January 31, 2009 | $1,592,868 | $2,465,193 | $89,727,308 | ($4,324,293 | ) | ($10,683,595 | ) | $78,777,481 | ||||||
| Comprehensive income: | ||||||||||||||
| Net income | - | - | 4,439,811 | - | - | |||||||||
| Foreign currency translation adjustment | - | - | - | 439,575 | - | |||||||||
| Interest rate swap, net of tax of ($35,603) | - | - | - | 60,621 | - | |||||||||
| Minimum pension liability adjustment, | ||||||||||||||
| net of tax of ($84,838) | - | - | - | 144,456 | - | |||||||||
| Total comprehensive income | 5,084,463 | |||||||||||||
| Dividends | - | - | (3,504,299 | ) | - | - | (3,504,299 | ) | ||||||
| Stock-based compensation | - | 645,967 | - | - | - | 645,967 | ||||||||
| Stock option transactions | - | (122,210 | ) | - | - | 347,794 | 225,584 | |||||||
| Purchase of 26,237 treasury shares | - | - | - | - | (251,612 | ) | (251,612 | ) | ||||||
| Balances, January 31, 2010 | 1,592,868 | 2,988,950 | 90,662,820 | (3,679,641 | ) | (10,587,413 | ) | 80,977,584 | ||||||
| Comprehensive income: | ||||||||||||||
| Net income | - | - | 6,139,132 | - | - | |||||||||
| Foreign currency translation adjustment | - | - | - | (82,149 | ) | - | ||||||||
| Interest rate swap, net of tax of $6,040 | - | - | - | (10,284 | ) | - | ||||||||
| Minimum pension liability adjustment, | ||||||||||||||
| net of tax of ($334,943) | - | - | - | 570,307 | - | |||||||||
| Total comprehensive income | 6,617,006 | |||||||||||||
| Dividends | - | - | (3,688,705 | ) | - | - | (3,688,705 | ) | ||||||
| Stock-based compensation | - | 645,891 | - | - | - | 645,891 | ||||||||
| Stock option transactions | - | (262,537 | ) | - | - | 1,043,371 | 780,834 | |||||||
| Purchase of 86,406 treasury shares | - | - | - | - | (935,631 | ) | (935,631 | ) | ||||||
| Stock option tax benefit | - | 75,945 | - | - | - | 75,945 | ||||||||
| Balances, January 31, 2011 | 1,592,868 | 3,448,249 | 93,113,247 | (3,201,767 | ) | (10,479,673 | ) | 84,472,924 | ||||||
| Comprehensive income: | ||||||||||||||
| Net income | - | - | 7,133,701 | - | - | |||||||||
| Foreign currency translation adjustment | - | - | - | (230,532 | ) | - | ||||||||
| Interest rate swap, net of tax of $34,032 | - | - | - | (57,946 | ) | - | ||||||||
| Minimum pension liability adjustment, | ||||||||||||||
| net of tax of $2,483,486 | - | - | - | (4,228,638 | ) | - | ||||||||
| Total comprehensive income | 2,616,585 | |||||||||||||
| Dividends | - | - | (4,018,184 | ) | - | - | (4,018,184 | ) | ||||||
| Stock-based compensation | - | 744,306 | - | - | - | 744,306 | ||||||||
| Stock option transactions | - | (53,002 | ) | - | - | 205,972 | 152,970 | |||||||
| Restricted stock unit transactions | - | (101,722 | ) | - | - | 101,722 | - | |||||||
| Purchase of 16,861 treasury shares | - | - | - | - | (167,534 | ) | (167,534 | ) | ||||||
| Stock option tax benefit | - | 20,904 | - | - | - | 20,904 | ||||||||
| Balances, January 31, 2012 | $1,592,868 | $4,058,735 | $96,228,764 | ($7,718,883 | ) | ($10,339,513 | ) | $83,821,971 | ||||||
The notes to consolidated financial statements are an integral part of the above statements.
36
MET-PRO CORPORATION
NOTES TO CONSOLIDATED FINANCIAL STATEMENTS
FOR THE YEARS ENDED JANUARY 31, 2012, 2011 AND 2010
Nature of operations:
The Company manufactures and sells product recovery and pollution control equipment for purification of air and liquids, fluid handling equipment for corrosive, abrasive and high temperature liquids, and filtration and purification products. The Company has three reporting segments: Product Recovery/Pollution Control Technologies, Fluid Handling Technologies and Mefiag Filtration Technologies, and one other segment (Filtration/Purification Technologies).
Basis of presentation:
The consolidated financial statements include the accounts of Met-Pro Corporation (“Met-Pro” or the “Company”) and its direct and indirect wholly-owned subsidiaries: Mefiag B.V., Met-Pro Product Recovery/Pollution Control Technologies Inc., Strobic Air Corporation, MPC Inc., Pristine Water Solutions Inc., Mefiag (Guangzhou) Filter Systems Ltd., Met-Pro (Hong Kong) Company Limited, Met-Pro Industrial Services Inc., Bio-Reaction Industries Inc., Met-Pro Holdings LLC and Met-Pro Chile Limitada. Significant intercompany accounts and transactions have been eliminated.
Certain reclassifications have been made to prior year information to conform with the current year presentation.
Use of estimates:
The preparation of financial statements in conformity with accounting principles generally accepted in the United States of America requires management to make estimates and assumptions that affect the reported amounts of assets and liabilities and disclosure of contingent assets and liabilities at the date of the financial statements and the reported amounts of revenues and expenses during the reporting period. Actual results could differ from those estimates.
Foreign currency translation:
Assets and liabilities of the Company’s foreign subsidiaries are translated at current exchange rates, while income and expenses are translated at average rates for the period. Translation gains and losses are reported as a component of accumulated other comprehensive income in the consolidated statements of shareholders’ equity.
Fair Value of Financial Instruments:
Under the accounting for fair value measurements and disclosures, a fair value hierarchy was established that prioritizes the inputs to valuation techniques used to measure fair value. The hierarchy gives the highest priority to unadjusted quoted prices in active markets for identical assets or liabilities (Level 1 measurements) and the lowest priority to unobservable inputs (Level 3 measurements). A financial instrument’s level within the fair value hierarchy is based on the lowest level of any input that is significant to the fair value measurement.
We use the following valuation techniques to measure fair value for our assets and liabilities:
| Level 1 | Quoted market prices in active markets for identical assets or liabilities; |
| Level 2 | Significant other observable inputs (e.g. quoted prices for similar items in active markets, quoted prices for identical or similar items in markets that are not active, inputs other than quoted prices that are observable such as interest rate and yield curves, and market-corroborated inputs); and |
| Level 3 | Unobservable inputs for the asset or liability, which are valued based on management’s estimates of assumptions that market participants would use in pricing the asset or liability. |
37
MET-PRO CORPORATION
NOTES TO CONSOLIDATED FINANCIAL STATEMENTS (Continued)
FOR THE YEARS ENDED JANUARY 31, 2012, 2011 AND 2010
The amounts reported on the consolidated balance sheets for cash and cash equivalents, short-term investments, accounts receivable, other assets and short-term debt approximate fair value due to the short-term nature of these instruments.
Inventories:
Inventories are stated at the lower of cost (principally first-in, first-out) or market, except for the inventory in the Met-Pro Global Pump Solutions business unit (Dean Pump product brand) which is determined on the last-in, first-out basis (see Note 5).
Property, plant and equipment:
Property, plant and equipment are stated at cost, net of accumulated depreciation. Expenditures for maintenance and repairs are charged to expense as incurred. Renewals and betterments are capitalized (see Note 6). For financial reporting purposes, provisions for depreciation are calculated on a straight-line basis over the following estimated useful lives of the assets:
| Years | |
| Buildings and improvements | 10-39 |
| Machinery and equipment | 5-10 |
| Furniture and fixtures | 5-7 |
| Automotive equipment | 3 |
The carrying amount of all long-lived assets is evaluated periodically to determine if an adjustment to the depreciation period or the non-depreciated balance is warranted. Based upon its most recent analysis, the Company believes that no impairment of property, plant and equipment exists as of January 31, 2012.
Goodwill:
In September 2011, the FASB issued Accounting Standards Update (“ASU”) No. 2011-08, “Intangibles-Goodwill and Other (Topic 350): Testing Goodwill for Impairment”. The amendments in this update allow the Company the option to first assess qualitative factors to determine whether the existence of events or circumstances leads to a determination that it is more likely than not that the fair value of a reporting unit is less than its carrying amount. If, based on its qualitative assessment, the Company concludes it is more likely than not that the fair value of a reporting unit is less than its carrying amount, quantitative impairment testing is required. However, if an entity concludes otherwise, quantitative impairment testing is not required. Quantitative impairment testing involves significant judgment in estimating projections of fair value generated through future performance of each of the reporting units, which comprise our operating segments. In calculating the fair value of the reporting units using the present value of estimated future cash flows method, we rely on a number of assumptions including sales and related gross margin projections, operating margins, anticipated working capital requirements and market rate of returns used in discounting projected cash flows. These assumptions are based upon market and industry forecasts, our business plans and historical data. Inherent uncertainties exist in determining and applying such factors. The discount rate used in the projection of fair value represents a weighted average cost of capital available to the Company. ASU No. 2011-08 is effective for annual and interim reporting periods beginning after December 15, 2011. The Company will adopt ASU No. 2011-08 during the first quarter of fiscal year 2013.
No impairment was present upon performing this test since the fair value of each reporting unit exceeded its carrying value, including goodwill. At January 31, 2012, the goodwill associated with the Company’s three reporting segments and one other segment totaled $20,798,913.
38
MET-PRO CORPORATION
NOTES TO CONSOLIDATED FINANCIAL STATEMENTS (Continued)
FOR THE YEARS ENDED JANUARY 31, 2012, 2011 AND 2010
The changes in the carrying amount of goodwill by the three reporting segments and one other segment for the fiscal year ended January 31, 2012 are as follows:
Product Recovery/ Pollution Control Technologies | Fluid Handling Technologies | Mefiag Filtration Technologies | Filtration/ Purification Technologies | Total | ||||||||||
| Balance as of February 1, 2011 | $15,706,667 | $11,542 | $1,732,482 | $3,348,222 | $20,798,913 | |||||||||
| Goodwill acquired during the period | - | - | - | - | - | |||||||||
| Balance as of January 31, 2012 | $15,706,667 | $11,542 | $1,732,482 | $3,348,222 | $20,798,913 | |||||||||
Other intangible assets:
The Company maintains intangible assets with finite and indefinite lives. The following is a summary of the Company’s components of other intangible assets, which are reported in other assets on the consolidated balance sheets.
| January 31, 2012 | January 31, 2011 | |||||||||
| Gross Carrying | Accumulated | Gross Carrying | Accumulated | |||||||
| Amortized intangible assets | Amount | Amortization | Amount | Amortization | ||||||
| Patents | $761,821 | ($131,665 | ) | $709,132 | ($70,453 | ) | ||||
| Customer lists | 384,000 | (275,667 | ) | 384,000 | (261,264 | ) | ||||
| Intellectual property | 195,886 | (195,886 | ) | 195,886 | (195,886 | ) | ||||
| Other | 181,337 | (110,753 | ) | 181,337 | (78,517 | ) | ||||
| $1,523,044 | ($713,971 | ) | $1,470,355 | ($606,120 | ) | |||||
| Unamortized intangible assets | ||||||||||
| Trademarks | $11,963 | $0 | $10,500 | $0 | ||||||
The following is a summary of the amortization expense related to the Company’s components of other intangible assets:
| Amortization Expense | |||
| For the year ended January 31, 2010 | $37,047 | ||
| For the year ended January 31, 2011 | 52,017 | ||
| For the year ended January 31, 2012 | 107,851 | ||
| Estimated Amortization Expense | |||
| For the year ended January 31, 2013 | $97,315 | ||
| For the year ended January 31, 2014 | 80,648 | ||
| For the year ended January 31, 2015 | 80,201 | ||
| For the year ended January 31, 2016 | 79,256 | ||
| For the year ended January 31, 2017 | 77,589 | ||
| Thereafter | 394,064 | ||
| $809,073 | |||
39
MET-PRO CORPORATION
NOTES TO CONSOLIDATED FINANCIAL STATEMENTS (Continued)
FOR THE YEARS ENDED JANUARY 31, 2012, 2011 AND 2010
For financial reporting purposes, provisions for amortization are calculated on a straight-line basis over the following estimated useful lives for the identified intangible assets:
| Years | |
| Patents | 6-20 |
| Customer Lists | 10 |
| Intellectual Property | 10 |
| Other | 2-20 |
Asset Available for Sale:
The Company maintains a vacant plot of land available for sale in Heerenveen, The Netherlands amounting to $546,771 and $572,223 as of January 31, 2012 and 2011, respectively. This asset available for sale is reported in other assets on the consolidated balance sheets.
Revenue recognition:
The Company recognizes revenues from product sales or services provided when the following revenue recognition criteria are met: persuasive evidence of an arrangement exists, delivery has occurred or services have been rendered, the selling price is fixed or determinable and collectability is reasonably assured. FASB ASC Topic 605, “Revenue Recognition”, provides guidance on the application of generally accepted accounting principles to selected revenue recognition issues. The Company has concluded that its revenue recognition policy is appropriate and in accordance with FASB ASC Topic 605.
Advertising:
Advertising costs are charged to operations in the year incurred and were $1,258,220, $988,217 and $938,046 for the years ended January 31, 2012, 2011, and 2010, respectively.
Research and development:
Research and development costs are charged to operations in the year incurred and were $2,512,923, $2,242,052 and $2,145,716 for the years ended January 31, 2012, 2011, and 2010, respectively.
Stock-based compensation:
The Company accounts for stock-based compensation under the provisions of FASB ASC Topic 718, “Compensation – Stock Compensation”, which requires the recognition of the fair value of stock-based compensation. Under the fair value recognition provisions for FASB ASC Topic 718, stock-based compensation is estimated at the grant date based on the fair value of the awards expected to vest and recognized as expense ratably over the requisite service period of the award. The Company uses the Black-Scholes valuation model to estimate fair value of stock-based awards, which requires various assumptions including estimating stock price volatility, forfeiture rates and expected life.
Income Taxes:
Income taxes are determined using the asset and liability method of accounting for income taxes in accordance with FASB ASC Topic 740, “Income Taxes”. Under ASC Topic 740, tax expense includes U.S. and international income taxes plus the provision for U.S. taxes on undistributed earnings of international subsidiaries not deemed to be permanently invested. Tax credits and other incentives reduce tax expense in the year the credits are claimed. Certain items of income and expense are not reported in tax returns and financial statements in the same
40
MET-PRO CORPORATION
NOTES TO CONSOLIDATED FINANCIAL STATEMENTS (Continued)
FOR THE YEARS ENDED JANUARY 31, 2012, 2011 AND 2010
year. The tax effect of such temporary differences is reported in deferred income taxes. Deferred tax assets are recognized if it is more likely than not that the assets will be realized in future years. The Company establishes a valuation allowance for deferred tax assets for which realization is not more likely than not.
Income tax contingencies are accounted for in accordance with FASB ASC Topic 740-10-20, “Income Taxes”. Significant judgment is required in determining the Company’s worldwide provision for income taxes and recording the related assets and liabilities. In the ordinary course of our business, there are many transactions and calculations where the ultimate tax determination is less than certain. The Company is examined by various Federal, State, and foreign tax authorities. The Company regularly assesses the potential outcomes of these examinations and any future examinations for the current or prior years in determining the adequacy of our provision for income taxes. The Company continually assesses the likelihood and amount of potential adjustments and records any necessary adjustments in the period in which the facts that give rise to a revision become known.
The Company recognizes interest accrued related to unrecognized tax liabilities in interest expense and penalties in general and administrative expenses. No such interest and penalties were recognized during the years ended January 31, 2012, 2011 and 2010.
Earnings per share:
Basic earnings per share are computed based on the weighted average number of common shares outstanding during each year.
Diluted earnings per share are computed based on the weighted average number of shares outstanding plus all potential dilutive common shares outstanding (stock options) and awards of restricted stock units during each year.
Dividends payable:
On December 16, 2011, the Board of Directors declared a $0.071 per share quarterly cash dividend payable on March 16, 2012 to shareholders of record at the close of business on March 2, 2012, amounting to an aggregate of $1,042,297.
Concentrations of credit risk:
Financial instruments which potentially subject the Company to concentrations of credit risk consist of cash and cash equivalents (see Note 3) and trade accounts receivable. The Company believes concentrations of accounts receivable credit risk are limited due to the number of customers and dispersion among the operating segments and geographic areas. It is the policy of management to review the outstanding accounts receivable balance at the end of each reporting period, as well as the bad debt write-offs experienced in the past, and establish an allowance for doubtful accounts for uncollectible amounts.
Supplemental cash flow information:
| 2012 | 2011 | 2010 | |||
| Cash paid during the year for: | |||||
| Interest | $192,971 | $210,497 | $220,919 | ||
| Income taxes | 2,394,238 | 2,096,789 | 1,608,485 |
41
MET-PRO CORPORATION
NOTES TO CONSOLIDATED FINANCIAL STATEMENTS (Continued)
FOR THE YEARS ENDED JANUARY 31, 2012, 2011 AND 2010
Subsequent events:
The Company evaluates events that have occurred after the balance sheet date but before the financial statements are issued. Based upon the evaluation, the Company did not identify any recognized or non-recognized subsequent events that would have required adjustment or disclosure in the consolidated financial statements.
Recent accounting pronouncements:
In October 2009, the FASB issued ASU No. 2009-13, “Multiple-Deliverable Revenue Arrangements, a consensus of the FASB Emerging Issues Task Force”, an amendment of ASC Topic 605, “Revenue Recognition”. ASU No. 2009-13 provides amendments to the criteria for separating consideration in multiple-deliverable arrangements. As a result of these amendments, multiple-deliverable revenue arrangements will be separated in more circumstances than under existing U.S. Generally Accepted Accounting Principles (“GAAP”). The ASU does this by establishing a selling price hierarchy for determining the selling price of a deliverable. The selling price used for each deliverable will be based on vendor-specific objective evidence if available, third-party evidence if vendor-specific objective evidence is not available, or estimated selling price if neither vendor-specific objective evidence nor third-party evidence is available. A vendor will be required to determine its best estimate of selling price in a manner that is consistent with that used to determine the price to sell the deliverable on a standalone basis. This ASU also eliminates the residual method of allocation and will require that arrangement consideration be allocated at the inception of the arrangement to all deliverables using the relative selling price method, which allocates any discount in the overall arrangement proportionally to each deliverable based on its relative selling price. Expanded disclosures of qualitative and quantitative information regarding application of the multiple-deliverable revenue arrangement guidance are also required under the ASU. The ASU does not apply to arrangements for which industry specific allocation and measurement guidance exists, such as long-term construction contracts and software transactions. ASU No. 2009-13 was effective for the Company in this fiscal year beginning February 1, 2011. The adoption of this update to ASC Topic 605 did not have a material impact on our financial position, results of operations or cash flows.
In January 2010, the FASB issued ASU No. 2010-06, “Fair Value Measurements and Disclosures (Topic 820): Improving Disclosures about Fair Value Measurements”. This update provides amendments to Subtopic 820-10 that requires new disclosures on 1) the amounts of significant transfers in and out of Level 1 and Level 2 fair value measurements and reasons for the transfers and 2) in the reconciliation for Level 3 fair value measurements, the separate presentation of information about purchases, sales, issuances and settlements. The new disclosures are effective for interim and annual reporting periods beginning after December 15, 2009, except for the disclosures about purchases, sales, issuances and settlements in the roll forward activity in Level 3 fair value measurements. Those disclosures are effective for fiscal years beginning after December 15, 2010 and for interim periods within those fiscal years. The adoption of this update to ASC Topic 820 did not have a material impact on our financial position, results of operations or cash flows.
In May 2011, the FASB issued ASU No. 2011-04, “Fair Value Measurement (Topic 820): Amendments to Achieve Common Fair Value Measurement and Disclosure Requirements in U.S. GAAP and IFRSs”. The amendments in this update are the result of the work of the FASB and the International Accounting Standards Board (“IASB”) to develop common requirements for measuring fair value and for disclosing information about fair value measurements. The amendments change the wording used to describe many of the requirements in U.S. GAAP for measuring fair value and for disclosing information about fair value measurements. The amendments clarify that a reporting entity should disclose quantitative information about the unobservable inputs used in a fair value measurement that is categorized within Level 3 of the fair value hierarchy in order to increase the comparability of disclosures between reporting entities applying U.S. GAAP and those applying IFRSs. Additionally, the amendments expand the disclosures for fair value measurements categorized within Level 3 where a reporting entity will need to include the valuation processes used and the sensitivity of the fair value measurement to changes in unobservable inputs and the interrelationships between those unobservable inputs, if any. For many of the requirements, the FASB does not intend for the amendments to result in a change in the application of the requirements in ASC Topic 820. The amendments in this update are to be applied prospectively and are effective during interim and annual periods beginning after December 15, 2011. The
42
MET-PRO CORPORATION
NOTES TO CONSOLIDATED FINANCIAL STATEMENTS (Continued)
FOR THE YEARS ENDED JANUARY 31, 2012, 2011 AND 2010
adoption of this update will not have a material impact on our financial position, results of operations or cash flows.
In June 2011, the FASB issued ASU No. 2011-05, “Comprehensive Income (Topic 220): Presentation of Comprehensive Income.” The amendments in this update eliminate the current option to report other comprehensive income and its components in the statements of shareholders’ equity. Instead, an entity will be required to present either a single continuous statement of net income and other comprehensive income or in two separate, but consecutive statements. The amendments in this update are to be applied retrospectively and are effective for interim and annual periods beginning after December 15, 2011. The new guidance will be effective for the Company beginning February 1, 2012 and will have presentation changes only.
In September 2011, the FASB issued ASU No. 2011-08, “Intangibles-Goodwill and Other (Topic 350): Testing Goodwill for Impairment”. The amendments in this update allow an entity the option to first assess qualitative factors to determine whether the existence of events or circumstances leads to a determination that it is more likely than not that the fair value of a reporting unit is less than its carrying amount. If, based on its qualitative assessment, an entity concludes it is more likely than not that the fair value of a reporting unit is less than its carrying amount, quantitative impairment testing is required. However, if an entity concludes otherwise, quantitative impairment testing is not required. ASU No. 2011-08 is effective for annual and interim reporting periods beginning after December 15, 2011, with early adoption permitted. The adoption of this update is not expected to have a material impact on our financial position, results of operations or cash flows.
NOTE 2: BUSINESS COMBINATION
On October 8, 2010, the Company’s newly-formed wholly-owned subsidiary, Bio-Reaction Industries Inc. (“BRI”), completed its acquisition of substantially all of the assets of Bio-Reaction Industries, LLC. As a result of this combination, the Company is now able to offer products that utilize microbes to digest pollutants and odors, which we intend to sell to both commercial and municipal markets. These products extend our Duall brand product line of chemical and biological odor control systems as well as our Systems brand product line of thermal and oxidation equipment. BRI is included in our Product Recovery/Pollution Control Technologies reporting segment.
The Company paid $955,268 in cash for the Bio-Reaction Industries, LLC assets and other rights obtained under the asset purchase agreement. The assets consist of (i) intangible assets such as patents, a customer list, non-compete agreements and trademarks totaling $760,000 and (ii) tangible personal property such as machinery and office equipment totaling $195,268. We did not assume any material liabilities of Bio-Reaction Industries, LLC in connection with this transaction.
Intangible assets amounting to $750,000 with finite lives acquired from BRI are being amortized on a straight-line basis over their estimated useful lives, which range from two to twelve years with a weighted average amortization life of approximately eight years. Trademarks amounting to $10,000 with indefinite lives acquired from BRI are not being amortized.
NOTE 3: FAIR VALUE OF FINANCIAL INSTRUMENTS
Cash and cash equivalents:
Cash and cash equivalents at January 31, 2012 and 2011 amounted to $34,581,394 and $32,400,814, respectively. The cash and cash equivalents balance at January 31, 2012 was comprised of the following: (i) cash amounting to $8,777,483 and (ii) cash equivalents consisting of money market funds amounting to $25,803,911. The Company evaluates the creditworthiness of the financial institutions and financial instruments in which it invests and places its cash deposits and temporary cash investments with financial institutions, that at times, may be uninsured or in
43
MET-PRO CORPORATION
NOTES TO CONSOLIDATED FINANCIAL STATEMENTS (Continued)
FOR THE YEARS ENDED JANUARY 31, 2012, 2011 AND 2010
deposit accounts that exceed the Federal Deposit Insurance Corporation (“FDIC”) insurance limit. At January 31, 2012, the Company’s cash and cash equivalents were held at 20 financial institutions.
Short-term investments:
Short-term investments at January 31, 2012 and 2011 amounted to $764,061 and $497,155, respectively. The short-term investment balance at January 31, 2012 was comprised of two certificates of deposit with nine month maturity dates and one certificate of deposit with a twelve month maturity date. The short-term investment balance at January 31, 2011 was comprised of two certificates of deposit with twelve month maturity dates. The Company evaluates the creditworthiness of the financial institutions and the financial instruments in which it invests.
Long-term investments:
Long-term investments at January 31, 2012 and 2011 amounted to $494,537 and $248,063, respectively, which are reported in other assets on the consolidated balance sheets. The long-term investment balance at January 31, 2012 was comprised of two certificates of deposit with fourteen and fifteen month maturity dates. The long-term investment balance at January 31, 2011 was comprised of a certificate of deposit with a fourteen month maturity date. The Company evaluates the creditworthiness of the financial institutions and the financial instruments in which it invests.
Debt:
The estimated fair value and carrying amount of debt were as follows:
| January 31, | |||
| 2012 | 2011 | ||
| Fair value | $3,747,061 | $3,858,888 | |
| Carrying amount | 3,345,187 | 3,544,528 | |
Valuations for debt are determined based on borrowing rates currently available to the Company for loans with similar terms and maturities.
The Company uses an interest rate swap (see Note 7) to minimize its exposure to fluctuations in interest rates. The interest rate differential to be paid or received under this agreement is recognized over the term of the loan and is included in interest expense.
The Company’s financial instruments are not held for trading purposes.
Fair value measurements:
ASC Topic 820, “Fair Value Measurements and Disclosures”, defines fair value, provides guidance for measuring fair value and requires certain disclosures. This standard discusses valuation techniques, such as the market approach (comparable market prices), the income approach (present value of future income or cash flow), and the cost approach (cost to replace the service capacity of an asset or replacement cost). The standard utilizes a fair value hierarchy that prioritizes the inputs to valuation techniques used to measure fair value into three broad levels.
44
MET-PRO CORPORATION
NOTES TO CONSOLIDATED FINANCIAL STATEMENTS (Continued)
FOR THE YEARS ENDED JANUARY 31, 2012, 2011 AND 2010
The following table summarizes the basis used to measure the Company’s financial assets (liabilities) at fair value on a recurring basis in the consolidated balance sheets at January 31, 2012 and 2011:
| Quoted Prices | ||||||||
| in Active | ||||||||
| Markets for | Significant | Significant | ||||||
| Identical | Observable | Unobservable | ||||||
| Balance at | Assets | Inputs | Inputs | |||||
| January 31, 2012 | (Level 1) | (Level 2) | (Level 3) | |||||
| Cash and cash equivalents | $34,581,394 | $34,581,394 | $- | $- | ||||
| Short-term investments | 764,061 | 764,061 | - | - | ||||
| Long-term investments | 494,537 | 494,537 | - | - | ||||
| Cash surrender value - life insurance policies | 1,089,989 | - | 1,089,989 | - | ||||
| Interest rate swap agreement | (366,286 | ) | - | (366,286 | ) | - | ||
| $36,563,695 | $35,839,992 | $723,703 | $- | |||||
| Quoted Prices | ||||||||
| in Active | ||||||||
| Markets for | Significant | Significant | ||||||
| Identical | Observable | Unobservable | ||||||
| Balance at | Assets | Inputs | Inputs | |||||
| January 31, 2011 | (Level 1) | (Level 2) | (Level 3) | |||||
| Cash and cash equivalents | $32,400,814 | $32,400,814 | $- | $- | ||||
| Short-term investments | 497,155 | 497,155 | - | - | ||||
| Long-term investments | 248,063 | 248,063 | - | - | ||||
| Cash surrender value - life insurance policies | 912,417 | - | 912,417 | - | ||||
| Interest rate swap agreement | (274,308 | ) | - | (274,308 | ) | - | ||
| $33,784,141 | $33,146,032 | $638,109 | $- | |||||
There were no transfers of assets or liabilities between Level 1 and Level 2 in the fiscal years ended January 31, 2012 or 2011.
The predominance of market inputs are actively quoted and can be validated through external sources, including brokers, market transactions and third-party pricing services. The Company’s cash surrender value of life insurance policies (which are reported in other assets on the consolidated balance sheets) and the interest rate swap agreement are valued using Level 2 measurements.
45
MET-PRO CORPORATION
NOTES TO CONSOLIDATED FINANCIAL STATEMENTS (Continued)
FOR THE YEARS ENDED JANUARY 31, 2012, 2011 AND 2010
NOTE 4: EARNINGS PER SHARE COMPUTATIONS
Basic earnings per share is based on the weighted average number of common shares outstanding. Diluted earnings per share is based on the weighted average number of common shares outstanding and potentially dilutive shares. The dilutive effect of employee stock options and awards of restricted stock units are included in the computation of diluted earnings per share. The dilutive effect of stock options is calculated using the treasury stock method and expected proceeds upon exercise of the stock options.
The following table summarizes the shares used in computing basic and diluted net income per common share:
| January 31, | ||||||
| 2012 | 2011 | 2010 | ||||
| Numerator: | ||||||
| Net income | $7,133,701 | $6,139,132 | $4,439,811 | |||
| Denominator: | ||||||
Weighted average common shares outstanding during the period for basic computation | 14,662,055 | 14,629,215 | 14,602,276 | |||
| Dilutive effect of stock-based compensation plans | 112,637 | 129,444 | 73,459 | |||
Weighted average common shares outstanding during the period for diluted computation | 14,774,692 | 14,758,659 | 14,675,735 | |||
| Earnings per share, basic | $.49 | $.42 | $.30 | |||
| Earnings per share, diluted | $.48 | $.42 | $.30 | |||
For the fiscal years ended January 31, 2012, 2011 and 2010, employee stock options to purchase 616,585, 642,585 and 944,096 common shares were excluded from the calculations of diluted earnings per share as the calculated proceeds from the options’ exercises were greater than the market price of the Company’s common shares during these periods.
NOTE 5: INVENTORIES
Inventories consisted of the following:
| January 31, | |||
| 2012 | 2011 | ||
| Raw materials | $12,673,210 | $11,639,410 | |
| Work in process | 2,808,747 | 1,914,412 | |
| Finished goods | 2,365,186 | 1,920,608 | |
| $17,847,143 | $15,474,430 | ||
At January 31, 2012 and 2011, inventories valued at the last-in, first-out method (“LIFO”) were $1,790,705 and $1,863,303, respectively. The LIFO value of inventories was lower than replacement cost by $1,553,153 and $1,536,993 at January 31, 2012 and 2011, respectively.
The book basis of LIFO inventories exceeded the tax basis by approximately $866,900 and $902,000 at January 31, 2012 and January 31, 2011, respectively, as a result of applying the provisions of FASB ASC Topic 805, “Business Combinations”, to an acquisition completed in a prior year.
46
MET-PRO CORPORATION
NOTES TO CONSOLIDATED FINANCIAL STATEMENTS (Continued)
FOR THE YEARS ENDED JANUARY 31, 2012, 2011 AND 2010
NOTE 6: PROPERTY, PLANT AND EQUIPMENT
Property, plant and equipment consisted of the following:
| January 31, | |||
| 2012 | 2011 | ||
| Land | $1,946,228 | $1,950,190 | |
| Buildings and improvements | 20,980,144 | 20,051,371 | |
| Machinery and equipment | 14,201,851 | 13,769,406 | |
| Furniture and fixtures | 5,514,662 | 5,612,378 | |
| Automotive equipment | 1,504,380 | 1,459,614 | |
| Construction in progress | 1,654,176 | 1,546,477 | |
| 45,801,441 | 44,389,436 | ||
| Less accumulated depreciation | 26,479,005 | 25,098,628 | |
| $19,322,436 | $19,290,808 | ||
Depreciation of property, plant and equipment charged to operations amounted to $1,806,567, $1,772,668 and $1,894,465 for the fiscal years ended in 2012, 2011 and 2010, respectively.
47
MET-PRO CORPORATION
NOTES TO CONSOLIDATED FINANCIAL STATEMENTS (Continued)
FOR THE YEARS ENDED JANUARY 31, 2012, 2011 AND 2010
NOTE 7: DEBT
The Company and its subsidiaries have domestic and foreign uncommitted, unsecured lines of credit totaling $4,392,490 which can be used for working capital. Of the total lines of credit available, the foreign unsecured line of credit totals $392,490 (300,000 Euro). As of January 31, 2012 and 2011 the Company had zero outstanding borrowings from its domestic line of credit. The Company’s Mefiag B.V. subsidiary’s line of credit, which is with a bank in The Netherlands, had outstanding borrowings of $265,581, or 202,997 Euro, as of January 31, 2012 and zero as of January 31, 2011.
Short-term and long-term debt consisted of the following:
| January 31, | ||||
| 2012 | 2011 | |||
| Bond payable, bank, payable in quarterly installments of | ||||
| $58,460, plus interest at a rate equal to the greater of | ||||
| (i) 16 basis points below the ninety day LIBOR rate | ||||
| or (ii) 250 basis points (effective interest rate of | ||||
| 2.50% at both January 31, 2012 and 2011), maturing | ||||
| April, 2021, collateralized by the Telford, PA building | $2,163,037 | $2,396,878 | ||
| Note payable, bank, payable in quarterly installments of | ||||
| $32,708 (25,000 Euro), plus interest at a fixed rate of | ||||
| 3.82%, maturing January, 2016, collateralized by | 523,320 | 684,600 | ||
| the Heerenveen, Netherlands building | ||||
| Equipment note, payable in monthly installments of | ||||
| $13,482, no interest, maturing March 2012 | 26,963 | 188,742 | ||
| Line of credit, $265,581, or 202,997 Euro, payable upon | ||||
| demand, plus interest at a rate of 70 basis points over | ||||
| the thirty day EURIBOR rate (effective interest rate of | ||||
| 1.41% at January 31, 2012) | 265,581 | - | ||
| 2,978,901 | 3,270,220 | |||
| Less current portion | 657,216 | 532,540 | ||
| 2,321,685 | 2,737,680 | |||
| Fair market value of interest rate swap liability | 366,286 | 274,308 | ||
| Long-term portion | $2,687,971 | $3,011,988 | ||
One of the notes payable and the bond payable are subject to certain covenants, including maintenance of prescribed amounts of leverage and fixed charge coverage ratios. As of January 31, 2012, the Company is in compliance with all applicable covenants.
The Company has an interest rate swap agreement to hedge against the potential impact on earnings from increases in market interest rates. Effective April 3, 2006, the Company entered into a fifteen-year interest rate swap agreement for a notional amount equal to the balance on the bond payable maturing in April 2021. The Company swapped the ninety-day LIBOR for a fixed rate of 4.87%. As of January 31, 2012, the effective fixed interest rate was 7.00% as a result of the swap agreement plus the interest rate floor provision of 250 basis points. The interest rate swap agreement is accounted for as a cash flow hedge that qualifies for treatment under the short-cut method of measuring effectiveness in accordance with FASB ASC Topic 815, “Derivatives and Hedging”. There was no hedge ineffectiveness as of January 31, 2012. The fair value of the interest rate swap agreement resulted in a decrease in equity of $230,760 (net of tax), $172,814 (net of tax) and $162,530 (net of tax) at January
48
MET-PRO CORPORATION
NOTES TO CONSOLIDATED FINANCIAL STATEMENTS (Continued)
FOR THE YEARS ENDED JANUARY 31, 2012, 2011 AND 2010
31, 2012, 2011 and 2010, respectively. These results are recorded in the accumulated other comprehensive loss section of shareholders’ equity.
The bank has issued and has outstanding standby letters of credit to customers totaling $1,243,850 as of January 31, 2012, which have expiration dates during the fiscal years ending January 31, 2013 and 2014, in the amounts of $1,232,850 and $11,000, respectively.
Maturities of short-term and long-term debt are as follows:
| Year Ending | ||
| January 31, | ||
| 2013 | $657,216 | |
| 2014 | 364,672 | |
| 2015 | 364,672 | |
| 2016 | 364,664 | |
| 2017 | 233,840 | |
| Thereafter | 993,837 | |
| $2,978,901 |
NOTE 8: ACCUMULATED OTHER COMPREHENSIVE LOSS
Accumulated other comprehensive loss as of January 31 was comprised of the following:
| 2012 | 2011 | |||||
| Interest rate swap, net of tax | ($230,760 | ) | ($172,814 | ) | ||
| Foreign currency translation adjustment | 807,591 | 1,038,123 | ||||
| Minimum pension liability adjustment, net of tax | (8,295,714 | ) | (4,067,076 | ) | ||
| ($7,718,883 | ) | ($3,201,767 | ) | |||
NOTE 9: SHAREHOLDERS’ EQUITY
During the fiscal year ended January 31, 2012, the Company repurchased 16,861 shares pursuant to a 300,000 share stock repurchase program authorized by the Company’s Board of Directors on November 5, 2008. The 300,000 share stock repurchase program has no fixed expiration date and, as of January 31, 2012, there were 170,496 shares remaining under the program.
The Company has a Shareholders’ Rights Plan, as amended, under which the Company’s Board of Directors declared a dividend of one Right for each Common Share owned. The Plan provides, under certain conditions involving acquisition of the Company’s Common Shares, that holders of Rights, except for the acquiring entity, would be entitled to purchase Common Shares of the Company, or acquiring company, having a value of twice the Rights’ exercise price. The Rights under the Plan expire in 2020.
49
MET-PRO CORPORATION
NOTES TO CONSOLIDATED FINANCIAL STATEMENTS (Continued)
FOR THE YEARS ENDED JANUARY 31, 2012, 2011 AND 2010
NOTE 10: STOCK-BASED COMPENSATION
The Company grants equity awards to its senior executives and non-employee Directors, typically in December of each year. Historically, this has consisted of stock option awards. In December 2010, the Company’s Board of Directors approved a change in practice to begin awarding non-employee Directors restricted stock units (“RSUs”).
Restricted Stock Units:
On December 16, 2011, the Company awarded an aggregate of 8,385 RSUs to its five non-employee Directors. Each RSU entitles the grantee to receive, from the Company, one Common Share at the June 6, 2012 vesting date in accordance with the terms of the award agreement. The award agreements provide for accelerated vesting in certain instances such as a “change in control” or death, and for pro-rata vesting in the event of a non-cause departure from the Board of Directors prior to the one year anniversary of the award. The weighted average grant fair value per unit for awards granted on December 16, 2011 was $8.945 (which is the average of the high and low price of the Company’s Common Shares as quoted on the NYSE that day). As of January 31, 2012, there was $50,003 of unrecognized compensation expense for these RSUs.
The following table summarizes RSU transactions for the fiscal year ended January 31, 2012:
| Units | ||
| Non-vested at February 1, 2011 | 12,315 | |
| Granted | 8,385 | |
| Vested | (12,315 | ) |
| Forfeited | - | |
| Non-vested at January 31, 2012 | 8,385 | |
Stock options:
On December 17, 2010, and December 11, 2009, the Company issued 125,448 and 236,083 stock options, respectively, with one-third exercisable one year from the grant date and the remaining two-thirds vesting two and three years from grant date, respectively. The December 2010 awards were made to the Company’s senior executives; the awards in the prior two years were made to the Company’s senior executives as well as the Company’s non-employee Directors. In the event of a “change of control”, any unvested options shall become immediately exercisable. Typically, the duration of options is for up to ten years from the date of grant, subject to earlier termination under various conditions. On March 27, 2009, the Company issued 5,000 stock options fully exercisable on the grant date with an expiration date of June 3, 2011. The fair value of options that we grant is amortized into compensation expense on a straight-line basis over their respective vesting period, net of estimated forfeitures. We estimate the fair value of options as of the grant date using the Black-Scholes option valuation model. The per share fair value weighted-averages at the date of grant for stock options granted in the month of December during the fiscal years ended January 31, 2011 and 2010 were $3.95 and $3.26 per option, respectively. The per share fair value weighted-average at the date of grant for stock options granted on March 27, 2009 was $2.01 per option.
50
MET-PRO CORPORATION
NOTES TO CONSOLIDATED FINANCIAL STATEMENTS (Continued)
FOR THE YEARS ENDED JANUARY 31, 2012, 2011 AND 2010
The application of this valuation model relies on the following assumptions that are judgmental and sensitive in the determination of the compensation expense:
| Fiscal Years Ended | |||
| January 31, | |||
| 2012 | 2011 | 2010 | |
| Expected term (years) | - | 5.0 | 3.0 - 5.0 |
| Risk-free interest rate | - | 1.90% - 3.53% | 1.90% - 4.50% |
| Expected volatility | - | 29% - 45% | 29% - 39% |
| Dividend yield | - | 1.88% - 2.48% | 1.86% - 2.80% |
Historical information was the principal basis for the selection of the expected term and dividend yield. The expected volatility is based on a weighted-average combination of historical and implied volatilities over a time period that approximates the expected term of the option. The risk-free interest rate was selected based upon the U.S. Treasury Bill rates in effect at the time of grant for the expected term of the option.
The following table summarizes stock option transactions for the fiscal year ended January 31, 2012:
| Weighted | |||||||||
| Weighted | Average | Aggregate | |||||||
| Average | Remaining | Intrinsic | |||||||
| Shares | Exercise Price | Life (years) | Value | ||||||
| Options: | |||||||||
| Outstanding at February 1, 2011 | 1,274,204 | $10.1942 | 6.29 | ||||||
| Granted | - | - | |||||||
| Forfeited | - | - | |||||||
| Expired | (26,000 | ) | 11.7500 | ||||||
| Exercised | (24,912 | ) | 6.1404 | ||||||
| Outstanding at January 31, 2012 | 1,223,292 | $10.2437 | 5.52 | $930,082 | |||||
| Exercisable at January 31, 2012 | 1,067,951 | $10.1292 | 5.10 | $873,125 | |||||
The aggregate intrinsic value of options exercised during the fiscal years ended January 31, 2012, 2011 and 2010 was $93,570, $617,594 and $187,577, respectively. The intrinsic value of stock options is the amount by which the market price of the stock on a given date, such as at the end of the period or on the day of exercise, exceeded the market price of stock on the date of grant.
51
MET-PRO CORPORATION
NOTES TO CONSOLIDATED FINANCIAL STATEMENTS (Continued)
FOR THE YEARS ENDED JANUARY 31, 2012, 2011 AND 2010
The following table summarizes information about the options outstanding and options exercisable as of January 31, 2012:
| Options Outstanding | Options Exercisable | |||||||||||
| Weighted Average | ||||||||||||
| Remaining | Weighted Average | Weighted Average | ||||||||||
| Shares | Life (years) | Exercise Price | Shares | Exercise Price | ||||||||
| Range of prices: | ||||||||||||
| $5.50 – 6.99 | 19,913 | 0.57 | $5.5328 | 19,913 | $5.5328 | |||||||
| $7.00 – 8.99 | 116,450 | 3.06 | 7.4110 | 116,450 | 7.4110 | |||||||
| $9.00 – 9.99 | 470,344 | 5.26 | 9.4848 | 398,640 | 9.4479 | |||||||
| $10.00 – 10.99 | 155,337 | 4.76 | 10.8975 | 155,337 | 10.8975 | |||||||
| $11.00 – 11.99 | 335,800 | 6.11 | 11.5426 | 335,800 | 11.5426 | |||||||
| $12.00 – 12.99 | 125,448 | 8.88 | 12.1800 | 41,811 | 12.1800 | |||||||
| 1,223,292 | 5.52 | $10.2437 | 1,067,951 | $10.1292 | ||||||||
As of January 31, 2012, there was $502,811 (excludes an unrecognized compensation cost of $50,003 related to RSUs) of total unrecognized compensation cost related to non-vested share-based compensation arrangements granted under the plans. The cost is expected to be recognized over a weighted-average period of 1.4 years.
NOTE 11: INCOME TAXES
The provision (benefit) for income taxes was comprised of the following:
| 2012 | 2011 | 2010 | ||||
| Current | ||||||
| Federal | $2,010,929 | $2,106,753 | $1,464,160 | |||
| State | 290,461 | 299,616 | 199,327 | |||
| Foreign | 201,565 | 135,327 | 38,537 | |||
| 2,502,955 | 2,541,696 | 1,702,024 | ||||
| Deferred | ||||||
| Federal | 1,112,827 | 429,442 | 377,441 | |||
| State | 98,191 | 37,892 | 33,304 | |||
| Foreign | (13,364 | ) | (28,265 | ) | (3,991 | ) |
| $3,700,609 | $2,980,765 | $2,108,778 |
52
MET-PRO CORPORATION
NOTES TO CONSOLIDATED FINANCIAL STATEMENTS (Continued)
FOR THE YEARS ENDED JANUARY 31, 2012, 2011 AND 2010
Deferred income taxes reflect the net tax effect of temporary differences between the carrying amounts of assets and liabilities for financial reporting purposes and the amounts used for income tax purposes. Significant components of the net deferred tax assets (liabilities) were as follows:
| January 31, | ||||
| 2012 | 2011 | |||
| Deferred tax assets | ||||
| Inventory cost capitalization | $110,306 | $131,255 | ||
| Pension cost | 3,964,282 | 2,460,898 | ||
| Management incentive | 262,612 | 178,825 | ||
| Stock options | 458,468 | 363,429 | ||
| Interest rate swap | 135,526 | 101,494 | ||
| Other | 446,576 | 433,005 | ||
| Total deferred tax assets | 5,377,770 | 3,668,906 | ||
| Deferred tax liabilities | ||||
| Property, plant and equipment | 2,348,541 | 2,255,538 | ||
| Inventory – LIFO | 320,759 | 333,764 | ||
| Prepaid expenses | 205,501 | 200,876 | ||
| Goodwill | 3,839,091 | 3,540,359 | ||
| Total deferred tax liabilities | 6,713,892 | 6,330,537 | ||
| Net deferred tax (liabilities) | ($1,336,122 | ) | ($2,661,631 | ) |
A reconciliation of the federal statutory rate and the Company’s effective tax rate is presented as follows:
| 2012 | 2011 | 2010 | ||||||||||
| Computed expected | ||||||||||||
| federal tax expense | $3,683,665 | 34.0 | % | $3,100,765 | 34.0 | % | $2,226,520 | 34.0 | % | |||
| Manufacturing exemption | (205,457 | ) | (1.9 | ) | (207,968 | ) | (2.3 | ) | (129,428 | ) | (2.0 | ) |
| State income taxes, | ||||||||||||
| net of federal | ||||||||||||
| income tax benefit | 191,704 | 1.8 | 197,747 | 2.2 | 131,556 | 2.0 | ||||||
| Research and | ||||||||||||
| development tax credits | (149,728 | ) | (1.4 | ) | (143,361 | ) | (1.5 | ) | (121,917 | ) | (1.9 | ) |
| Stock option tax expense | 78,473 | .7 | 20,076 | .2 | 82,030 | 1.3 | ||||||
| Other | 101,952 | .9 | 13,506 | .1 | (79,983 | ) | (1.2 | ) | ||||
| Effective income taxes | $3,700,609 | 34.1 | % | $2,980,765 | 32.7 | % | $2,108,778 | 32.2 | % | |||
The Company follows the provisions of FASB ASC Topic 740, “Income Taxes”, and recognizes the financial statement benefit of a tax position only after determining that the relevant tax authority would more likely than not sustain the position following an audit. For tax positions meeting the more-likely-than-not threshold, the amount recognized in the financial statements is the largest benefit that has a greater than 50 percent likelihood of being realized upon ultimate settlement with the relevant tax authority. The Company applies ASC Topic 740 to all tax positions for which the statute of limitations remains open.
During the fiscal year ended January 31, 2012, the Company performed an evaluation of its position with regards to state, federal and foreign tax matters. The Company’s conclusion was to increase the unrecognized tax benefits by $49,000 in order to account for state tax matters in the United States as a result of changes in tax positions with relevant tax authorities.
53
MET-PRO CORPORATION
NOTES TO CONSOLIDATED FINANCIAL STATEMENTS (Continued)
FOR THE YEARS ENDED JANUARY 31, 2012, 2011 AND 2010
A reconciliation of the beginning and ending balances of the total amounts of unrecognized tax benefits is as follows:
| 2012 | |
| Balance at February 1, 2011 | $- |
| Increases in tax positions for prior years | - |
| Decreases in tax positions for prior years | - |
| Increases in tax positions for current year | 49,000 |
| Balance at January 31, 2012 | $49,000 |
The Company and its subsidiaries are subject to income taxes in the U.S. federal jurisdiction, various states and foreign jurisdictions. Tax regulations within each jurisdiction are subject to the interpretation of the related tax laws and regulations and require significant judgment to apply. The following table summarizes tax years that remain subject to examination by major jurisdictions:
| Open Tax Year | |||
| Examination in Progress | Examination Not Yet Initiated | ||
| United States | |||
| Federal | n/a | 2010 – 2012 | |
| State | n/a | 2008 – 2012 | |
| Canada | n/a | 2007 – 2012 | |
| The Netherlands | n/a | 2008 – 2012 | |
| People’s Republic of China | n/a | 2011 – 2012 | |
| Chile | n/a | 2012 | |
NOTE 12: LEASES AND OTHER COMMITMENTS
The Company has various real estate operating leases for warehouse space and office space for sales, general and administrative purposes. Future minimum lease payments under these non-cancelable operating leases at January 31, 2012 are as follows:
| 2013 | $108,969 |
| 2014 | 53,765 |
| 2015 | 23,780 |
| $186,514 |
Rental expense for the above operating leases during the fiscal years ended in 2012, 2011, and 2010 was $138,518, $111,878 and $89,602, respectively.
NOTE 13: EMPLOYEE BENEFIT PLANS
Pension Plans:
The Company has several defined benefit pension plans covering eligible employees in the United States. The Company contributes amounts to the pension plans equal to the amounts that are tax deductible.
In the third quarter ended October 31, 2006, the Company amended its defined benefit pension plans to freeze the accrual of future benefits for all its salaried and non-union hourly employees, effective on December 31, 2006. Effective December 31, 2008, the Company amended its defined benefit pension plan to freeze the accrual of future benefits for union hourly employees.
54
MET-PRO CORPORATION
NOTES TO CONSOLIDATED FINANCIAL STATEMENTS (Continued)
FOR THE YEARS ENDED JANUARY 31, 2012, 2011 AND 2010
In the fiscal year ended January 31, 2007, the Company adopted FASB ASC Topic 715, “Compensation – Retirement Benefits”, which requires the recognition of the overfunded or underfunded status of its pension plans as an asset or liability, with changes in the funded status recognized through other comprehensive income in the year they occur. The Company recognized the liability for the funded status in its consolidated balance sheets. During the fiscal year ended January 31, 2009, the Company changed the annual measurement date and the plan year end date to January 31.
On January 31, 2012, the Company’s annual measurement date, the accumulated benefit obligation related to the Company’s pension plans exceeded the fair value of the pension plan assets (such excess is referred to as an unfunded accumulated benefit obligation). This difference is principally due to the decline in the discount rate and market value of investments during the fiscal year ended January 31, 2012.
A pension liability adjustment was recorded in the fourth quarter of the fiscal year ended January 31, 2012 as an increase to the pension liability with a corresponding decrease to shareholders’ equity. During the fiscal year ended January 31, 2012, the Company recorded an after-tax decrease to shareholders’ equity of $4,228,638.
The following table provides the components of net periodic pension (income) cost:
| 2012 | 2011 | 2010 | ||||
| Service cost | $205,725 | $211,500 | $69,225 | |||
| Interest cost | 1,121,492 | 1,118,007 | 1,134,779 | |||
| Expected return on plan assets | (1,401,943 | ) | (1,011,021 | ) | (785,901 | ) |
| Recognized net actuarial loss | 209,830 | 243,640 | 240,890 | |||
| Net periodic benefit cost | $135,104 | $562,126 | $658,993 | |||
55
MET-PRO CORPORATION
NOTES TO CONSOLIDATED FINANCIAL STATEMENTS (Continued)
FOR THE YEARS ENDED JANUARY 31, 2012, 2011 AND 2010
The following table sets forth the plans’ change in benefit obligations, change in plan assets and amounts recognized on the Company’s consolidated balance sheets at January 31, 2012 and 2011:
| 2012 | 2011 | |||
| Change in benefit obligation: | ||||
| Benefit obligation at beginning of year | $20,675,319 | $19,711,075 | ||
| Service cost | 205,725 | 211,500 | ||
| Interest cost | 1,121,492 | 1,118,007 | ||
| Actuarial loss | 5,371,311 | 841,333 | ||
| Administrative expenses | (259,229 | ) | (204,011 | ) |
| Benefits paid | (1,054,855 | ) | (1,002,585 | ) |
| Benefit obligation at end of year | $26,059,763 | $20,675,319 | ||
| Change in plan assets: | ||||
| Fair value of plan assets at beginning of year | $14,807,545 | $11,930,933 | ||
| Actual gain (loss) on plan assets | (148,700 | ) | 2,513,964 | |
| Employer contribution | 2,998,411 | 1,569,244 | ||
| Administrative expenses | (259,229 | ) | (204,011 | ) |
| Benefits paid | (1,054,855 | ) | (1,002,585 | ) |
| Fair value of plan assets at end of year | $16,343,172 | $14,807,545 | ||
| Funded status: | ($9,716,591 | ) | ($5,867,774 | ) |
| Unrecognized actuarial loss | 13,167,800 | 6,455,676 | ||
| Net amount recognized | $3,451,209 | $587,902 | ||
| Amounts recognized in the consolidated balance sheets consist of: | ||||
| Accrued benefit liability – short term | ($94,583 | ) | ($97,815 | ) |
| Accrued benefit liability – long term | (9,622,008 | ) | (5,769,959 | ) |
| Accumulated other comprehensive loss | 13,167,800 | 6,455,676 | ||
| Net amount recognized | $3,451,209 | $587,902 |
The accumulated benefit obligation, projected benefit obligation, and fair value of plan assets for plans with accumulated benefit obligations in excess of assets were $26,059,763, $26,059,763 and $16,343,172, respectively, as of January 31, 2012, and $20,675,319, $20,675,319 and $14,807,545, respectively, as of January 31, 2011.
The Company contributed $2,998,411 to the pension plans during the plan year ended January 31, 2012 and expects an additional contribution of $1,694,583 during the Company’s fiscal year ending January 31, 2013.
The following benefit payments are expected to be paid:
| Year Ending | ||
| January 31, | ||
| 2013 | $1,202,606 | |
| 2014 | 1,251,257 | |
| 2015 | 1,315,922 | |
| 2016 | 1,370,919 | |
| 2017 | 1,404,089 | |
| 2018 – 2022 | 7,517,424 | |
| $14,062,217 |
56
MET-PRO CORPORATION
NOTES TO CONSOLIDATED FINANCIAL STATEMENTS (Continued)
FOR THE YEARS ENDED JANUARY 31, 2012, 2011 AND 2010
Weighted average assumptions used in accounting for benefit obligations for the fiscal year ended January 31:
| 2012 | 2011 | 2010 | |
| Discount rate | 4.25% | 5.50% | 5.75% |
| Expected long-term rate of | |||
| return on assets | 7.50% | 8.50% | 8.50% |
| Rate of increase in | |||
| compensation levels | |||
| (where applicable) | 4.50% | 4.50% | 4.50% |
Weighted average assumptions used in accounting for net projected pension cost for the fiscal year ended January 31:
| 2012 | 2011 | 2010 | |
| Discount rate | 5.50% | 5.75% | 6.50% |
| Expected long-term rate of | |||
| return on assets | 8.50% | 8.50% | 8.50% |
| Rate of increase in | |||
| compensation levels | |||
| (where applicable) | 4.50% | 4.50% | 4.50% |
In selecting the expected long-term rate of return on asset assumption, the Company considered the average rate of earnings on the funds invested or to be invested to provide for the benefits of these plans. This included considering the trust’s asset allocation and the expected returns likely to be earned over the lives of the plans.
The table below sets forth the target allocations and asset allocations for the plan as follows:
| January 31, | January 31, | ||
| 2012 | 2011 | ||
| Target allocation: | |||
| Equity securities | 40-80% | 40-80% | |
| Debt securities | 20-60% | 20-60% | |
| Asset allocation: | |||
| Equity securities | 61-77% | 80% | |
| Debt securities | 23-39% | 20% | |
| Total | 100% | 100% |
The assets of the funds will be invested in a manner consistent with the safeguards and diversity to which a prudent investor would adhere and undertake on behalf of the plans’ participants. The main objective is to obtain the highest possible return commensurate with the level of assumed risk and with an investment horizon sufficient to permit market cycles to be reasonably reflected.
57
MET-PRO CORPORATION
NOTES TO CONSOLIDATED FINANCIAL STATEMENTS (Continued)
FOR THE YEARS ENDED JANUARY 31, 2012, 2011 AND 2010
The fair value of the Company’s pension plans’ assets at January 31, 2012 by asset class are as follows:
| Quoted Prices | ||||||||
| in Active | ||||||||
| Markets for | Significant | Significant | ||||||
| Identical | Observable | Unobservable | ||||||
| Assets | Inputs | Inputs | ||||||
| Total | (Level 1) | (Level 2) | (Level 3) | |||||
| Asset Class: | ||||||||
| Equity securities | ||||||||
| Domestic equities (a) | $7,162,837 | $- | $7,162,837 | $- | ||||
| Foreign equities (a) | 2,839,026 | - | 2,839,026 | - | ||||
| Fixed income securities | ||||||||
| Intermediate duration corporate and | ||||||||
| government bonds (b) | 5,468,502 | - | 5,468,502 | - | ||||
| Cash and cash equivalents (c) | 872,807 | - | 872,807 | - | ||||
| Total pension assets | $16,343,172 | $- | $16,343,172 | $- | ||||
The fair value of the Company’s pension plans’ assets at January 31, 2011 by asset class are as follows:
| Quoted Prices | ||||||||
| in Active | ||||||||
| Markets for | Significant | Significant | ||||||
| Identical | Observable | Unobservable | ||||||
| Assets | Inputs | Inputs | ||||||
| Total | (Level 1) | (Level 2) | (Level 3) | |||||
| Asset Class: | ||||||||
| Equity securities | ||||||||
| Domestic equities (a) | $11,770,186 | $- | $11,770,186 | $- | ||||
| Foreign equities (a) | - | - | - | - | ||||
| Fixed income securities | ||||||||
| Intermediate duration corporate and | ||||||||
| government bonds (b) | 2,923,014 | - | 2,923,014 | - | ||||
| Cash and cash equivalents (c) | 114,345 | - | 114,345 | - | ||||
| Total pension assets | $14,807,545 | $- | $14,807,545 | $- | ||||
| (a) | These categories consist of various managed funds that invest primarily in common stocks, as well as other equity securities and a combination of other funds. | |
| (b) | Investments in this category consist of a fixed income fund that invests primarily in intermediate duration bonds, as well as a combination of other funds. | |
| (c) | Cash is comprised of money market funds, which are valued utilizing the net asset value per unit based on the fair value of the underlying assets as determined by the fund’s investment managers. |
58
MET-PRO CORPORATION
NOTES TO CONSOLIDATED FINANCIAL STATEMENTS (Continued)
FOR THE YEARS ENDED JANUARY 31, 2012, 2011 AND 2010
Directors’ Benefit Plan:
The Company provides a non-qualified pension plan for Directors which is presently unfunded. The Plan is designed to provide pension benefits based on the category of the Director and length of service. The aggregate benefit obligation payable in the future under the terms of the Plan was $561,061 and $584,870 at January 31, 2012 and 2011, respectively. The current portion of the benefit obligation amounted to $79,000 and $82,333, respectively, and is presented under the accrued salaries, wages and benefits category on the consolidated balance sheets. The non-current portion of the benefit obligation amounted to $482,061 and $502,537, respectively, and is presented under the accrued pension retirement benefits category on the consolidated balance sheets. The amounts applicable are included in the tables above. This plan was discontinued in December 1999 with respect to non-vested Directors.
Defined Contribution Plan:
The Company has a 401(k) profit sharing plan in which all employees of the Company in the United States are eligible to participate, following the completion of one year of service and after attaining age 21. Pursuant to this plan, employees can contribute up to 25% of their compensation to the Plan. The Company will match, in the form of Met-Pro Common Shares, up to 50% of the employee’s contribution up to 4% of compensation. Effective January 1, 2007, the Company added a discretionary contribution to the Plan for non-bargaining unit employees in the United States in lieu of the Defined Benefit Plan, which was frozen on December 31, 2006 and accelerated the eligibility to participate in the 401(k) profit sharing plan from the completion of one year of service to six-months of service. Effective February 1, 2008, the non-bargaining unit employees in the United States were eligible for the discretionary contributions under the Plan. The discretionary contribution is (i) 2% for employees under 45 years old or with less than five years of service, (ii) 3% for employees 45 years or older and between five to nine years of service, or (iii) 4% for employees 45 years or older and with ten or more years of service. The levels of discretionary contribution will not change with the employee’s age or years of service going forward and all future eligible new hires after April 15, 2006 will receive a discretionary contribution at the 2% level. The Company provided cash contributions to the 401(k) profit sharing plan of $780,673, $709,470 and $673,135 for the fiscal years ended January 31, 2012, 2011 and 2010, respectively.
Employees’ Stock Ownership Trust:
The Company sponsors an employee stock ownership plan under which it may make discretionary contributions to the trust either in cash or in shares of the Company for salaried employees in the United States eligible to participate in the Plan. There were no contributions to the Employees’ Stock Ownership Trust for the fiscal years ended January 31, 2012, 2011 and 2010. All shares are considered to be allocated to participants or to be released for allocation to participants, and are included in the earnings per share computations.
Equity Incentive Plans:
In 1997, the Board of Directors of the Company approved a stock option plan covering 350,000 shares (increased to 829,629 shares after giving effect to stock splits effective October 15, 2003, November 15, 2005 and November 14, 2007) that was approved by the Company’s shareholders at the 1997 meeting of shareholders (the “1997 Plan”). In 2001, the Board of Directors of the Company approved an equity incentive plan covering 350,000 shares (increased to 829,629 shares after giving effect to stock splits effective October 15, 2003, November 15, 2005 and November 14, 2007) that was approved by the Company’s shareholders at the 2001 meeting of shareholders (the “2001 Plan”). In 2005, the Board of Directors of the Company approved an equity incentive plan covering 500,000 shares (increased to 888,888 shares after giving effect to stock splits effective November 15, 2005 and November 14, 2007) that was approved by the Company’s shareholders at the 2005 meeting of shareholders (the “2005 Plan”). In 2008, the Board of Directors of the Company approved an equity incentive plan covering 750,000 shares that was approved by the Company’s shareholders at the 2008 meeting of shareholders (the “2008 Plan”). These plans contain anti-dilution provisions that apply to stock splits and stock dividends declared by the Company.
59
MET-PRO CORPORATION
NOTES TO CONSOLIDATED FINANCIAL STATEMENTS (Continued)
FOR THE YEARS ENDED JANUARY 31, 2012, 2011 AND 2010
The status of the plans was as follows (adjusted for stock splits):
| 1997 Plan | 2012 | 2011 | 2010 | ||||||
| Options outstanding, beginning | 35,788 | 69,924 | 113,067 | ||||||
| Grants | - | - | - | ||||||
| Exercises | (9,956 | ) | (34,136 | ) | (43,143 | ) | |||
| Cancellations | - | - | - | ||||||
| Options outstanding, ending | 25,832 | 35,788 | 69,924 | ||||||
| Options price range at January 31 | $5.5476 | $5.5476 | $5.1047 | ||||||
| to | to | to | |||||||
| $9.6440 | $9.6440 | $9.6440 | |||||||
| Options exercisable at January 31 | 25,832 | 35,788 | 69,924 | ||||||
| Options available for grant at January 31 | 0 | 0 | 0 | ||||||
| 2001 Plan | 2012 | 2011 | 2010 | ||||||
| Options outstanding, beginning | 445,636 | 488,037 | 500,483 | ||||||
| Grants | - | 51,116 | - | ||||||
| Exercises | (9,956 | ) | (93,517 | ) | - | ||||
| Cancellations | - | - | (12,446 | ) | |||||
| Options outstanding, ending | 435,680 | 445,636 | 488,037 | ||||||
| Options price range at January 31 | $5.5181 | $5.5181 | $5.5181 | ||||||
| to | to | to | |||||||
| $12.1800 | $12.1800 | $11.7500 | |||||||
| Options exercisable at January 31 | 401,599 | 394,520 | 485,370 | ||||||
| Options available for grant at January 31 | 0 | 0 | 51,116 | ||||||
| 2005 Plan | 2012 | 2011 | 2010 | ||||||
| Awards outstanding, beginning | 785,252 | 815,066 | 579,983 | ||||||
| Grants (a) | 8,385 | 66,804 | 241,083 | ||||||
| Exercises (b) | (17,315 | ) | - | - | |||||
| Cancellations | (26,000 | ) | (96,618 | ) | (6,000 | ) | |||
| Awards outstanding, ending (a) | 750,322 | 785,252 | 815,066 | ||||||
| Exercise price at January 31 | $9.6900 | $8.5600 | $8.5600 | ||||||
| to | to | to | |||||||
| $12.1800 | $12.1800 | $11.7500 | |||||||
| Awards exercisable at January 31 | 635,156 | 522,050 | 383,778 | ||||||
| Awards available for grant at January 31 | 101,918 | 84,303 | 54,489 | ||||||
| 2008 Plan | 2012 | 2011 | 2010 | ||||||
| Awards outstanding, beginning | 19,843 | - | - | ||||||
| Grants | - | 19,843 | - | ||||||
| Exercises | - | - | - | ||||||
| Cancellations | - | - | - | ||||||
| Awards outstanding, ending | 19,843 | 19,843 | - | ||||||
| Exercise price at January 31 | $12.1800 | $12.1800 | - | ||||||
| Awards exercisable at January 31 | 5,364 | - | - | ||||||
| Awards available for grant at January 31 | 730,157 | 730,157 | 750,000 |
| (a) | Grants under the 2005 Plan for the fiscal year ending January 31, 2012 were comprised of 8,385 RSUs. |
| (b) | Exercises under the 2005 Plan for the fiscal year ending January 31, 2012 include 12,315 RSUs which vested as of December 17, 2011. |
60
MET-PRO CORPORATION
NOTES TO CONSOLIDATED FINANCIAL STATEMENTS (Continued)
FOR THE YEARS ENDED JANUARY 31, 2012, 2011 AND 2010
The weighted average exercise prices (adjusted for stock split) of the Company’s stock options for the fiscal year ended January 31 were as follows:
| 2012 | 2011 | 2010 | ||||||
| Options outstanding, beginning | $10.1942 | $9.6866 | $9.5374 | |||||
| Grants | - | $12.1800 | $9.6666 | |||||
| Exercises | $6.1404 | $6.1168 | $5.2287 | |||||
| Cancellations | $11.7500 | $10.9450 | $10.1973 | |||||
| Options outstanding, ending | $10.2437 | $10.1942 | $9.6866 |
NOTE 14: OTHER INCOME
Other income was comprised of the following for the fiscal year ended January 31:
| 2012 | 2011 | 2010 | ||||||
| Interest income | $179,602 | $221,972 | $218,165 | |||||
| Other miscellaneous income | 254,605 | 140,074 | 42,012 | |||||
| $434,207 | $362,046 | $260,177 |
NOTE 15: BUSINESS SEGMENTS AND OTHER INFORMATION
The segment discussion outlined below represents the adjusted segment structure as determined by management in accordance with FASB ASC Topic 280, “Segment Reporting”.
The Company has five operating segments which are aggregated into three reportable segments: Product Recovery/Pollution Control Technologies, Fluid Handling Technologies and Mefiag Filtration Technologies, and one other segment (Filtration/Purification Technologies). The Filtration/Purification Technologies segment is comprised of two operating segments that do not meet the criteria for aggregation outlined in FASB ASC Topic 280-10-50-12. The Company’s analysis is that FASB ASC Topic 280-10-50-12 permits the aggregation of operating segments if, individually, each operating segment does not meet any of the following quantitative thresholds: (i) reported revenue is 10% or more of combined revenue of all reported operating segments, (ii) the absolute amount of reported profit or loss is 10% or more of the greater, in absolute amounts, of either the combined reported profit of all operating segments that did not report a loss or the combined reported loss of all operating segments that did report a loss, and (iii) its assets are 10% or more of the combined assets of all operating segments. As of the fiscal years ended January 31, 2012, 2011 and 2010, none of the operating segments included in the Filtration/Purification Technologies segment met these criteria, and at least 75% of total consolidated revenue was included in the Product Recovery/Pollution Control Technologies, Fluid Handling Technologies and Mefiag Filtration Technologies reporting segments; therefore the Company determined the aggregation of these operating segments into this other segment was appropriate under FASB ASC Topic 280-10-50-12.
The Company expects, based upon the current financial performance of its business units, the segmentation reporting will continue to be presented in future periods using the three reportable segments and the one other segment.
61
MET-PRO CORPORATION
NOTES TO CONSOLIDATED FINANCIAL STATEMENTS (Continued)
FOR THE YEARS ENDED JANUARY 31, 2012, 2011 AND 2010
The following is a description of each segment:
Product Recovery/Pollution Control Technologies: This reportable segment consists of one operating segment that manufactures products for the purification of air or liquids. Many of these products are custom designed and engineered to solve a customer’s product recovery or pollution control issues. The products are sold worldwide through Company sales personnel and a network of manufacturer’s representatives. This reporting segment is comprised of the Met-Pro Environmental Air Solutions (the combination of the Duall, Systems, Flex-Kleen, Bio-Reaction Industries and Met-Pro Industrial Services product brands), Met-Pro Product Recovery/Pollution Control Technologies Inc., and Strobic Air Corporation business units.
Fluid Handling Technologies: This reportable segment consists of one operating segment that manufactures high-quality centrifugal pumps that are suitable for difficult applications, including the pumping of acids, brines, caustics, bleaches, seawater, high-temperature liquids and a wide variety of waste liquids. A variety of pump configurations make these products adaptable to almost any pumping application. These products are sold worldwide through an extensive network of distributors. This reporting segment is comprised of Met-Pro Global Pump Solutions business unit (consisting of the Dean Pump, Fybroc and Sethco product brands).
Mefiag Filtration Technologies: This reportable segment consists of one operating segment that produces filter systems using horizontal disc technology for tough, corrosive applications in the plating, metal finishing and printing industries. These products are sold worldwide through Company sales personnel and a network of distributors. This reporting segment is comprised of the Mefiag, Mefiag B.V. and Mefiag (Guangzhou) Filter Systems Ltd. business units.
Filtration/Purification Technologies: This other segment consists of two operating segments that produce the following products: proprietary chemicals for the treatment of municipal drinking water systems and boiler and cooling tower systems; cartridges and filter housings; and filtration products for difficult industrial air and liquid applications. This other segment is comprised of the Keystone Filter and Pristine Water Solutions operating segments.
The accounting policies of the reporting segments are the same as those described in the summary of significant accounting policies. The Company evaluates the performance of these segments based on many factors including sales, sales trends, margins and operating performance.
No significant intercompany revenue is realized in these reporting segments. Interest income and expense are not included in the measure of segment profit reviewed by management. Income taxes are also not included in the measure of segment operating profit reviewed by management.
62
MET-PRO CORPORATION
NOTES TO CONSOLIDATED FINANCIAL STATEMENTS (Continued)
FOR THE YEARS ENDED JANUARY 31, 2012, 2011 AND 2010
Financial information for the three reporting segments and one other segment is as follows:
| Years ended January 31, | ||||||
| 2012 | 2011 | 2010 | ||||
| Net sales to unaffiliated customers | ||||||
| Product Recovery/Pollution Control Technologies | $43,568,042 | $41,426,858 | $35,899,630 | |||
| Fluid Handling Technologies | 33,264,149 | 27,488,559 | 24,527,998 | |||
| Mefiag Filtration Technologies | 12,945,610 | 9,897,038 | 9,526,908 | |||
| Filtration/Purification Technologies | 10,383,591 | 10,052,971 | 10,177,957 | |||
| $100,161,392 | $88,865,426 | $80,132,493 | ||||
| Income (loss) from operations | ||||||
| Product Recovery/Pollution Control Technologies | $1,198,674 | $2,046,716 | $1,924,005 | |||
| Fluid Handling Technologies | 8,220,768 | 5,926,592 | 4,325,853 | |||
| Mefiag Filtration Technologies | 780,586 | 401,695 | (34,886 | ) | ||
| Filtration/Purification Technologies | 391,256 | 595,318 | 297,583 | |||
| $10,591,284 | $8,970,321 | $6,512,555 | ||||
| Depreciation and amortization expense | ||||||
| Product Recovery/Pollution Control Technologies | $708,507 | $657,724 | $620,734 | |||
| Fluid Handling Technologies | 720,841 | 672,072 | 703,644 | |||
| Mefiag Filtration Technologies | 265,192 | 265,261 | 331,065 | |||
| Filtration/Purification Technologies | 219,878 | 229,628 | 276,069 | |||
| $1,914,418 | $1,824,685 | $1,931,512 | ||||
| Capital expenditures | ||||||
| Product Recovery/Pollution Control Technologies | $692,383 | $305,803 | $312,221 | |||
| Fluid Handling Technologies | 580,354 | 476,104 | 291,452 | |||
| Mefiag Filtration Technologies | 420,187 | 138,384 | 29,740 | |||
| Filtration/Purification Technologies | 110,886 | 57,679 | 59,278 | |||
| 1,803,810 | 977,970 | 692,691 | ||||
| Corporate | 293,424 | 687,979 | 1,441,116 | |||
| $2,097,234 | $1,665,949 | $2,133,807 | ||||
| Identifiable assets at January 31 | ||||||
| Product Recovery/Pollution Control Technologies | $36,444,763 | $34,003,251 | $34,466,168 | |||
| Fluid Handling Technologies | 19,290,035 | 18,114,257 | 18,068,428 | |||
| Mefiag Filtration Technologies | 14,017,572 | 12,814,143 | 12,257,281 | |||
| Filtration/Purification Technologies | 8,368,652 | 8,369,385 | 8,257,837 | |||
| 78,121,022 | 73,301,036 | 73,049,714 | ||||
| Corporate | 37,388,193 | 34,745,292 | 31,558,645 | |||
| $115,509,215 | $108,046,328 | $104,608,359 | ||||
The Company follows the practice of allocating general corporate expenses, including depreciation and amortization expense, among the reporting segments.
63
MET-PRO CORPORATION
NOTES TO CONSOLIDATED FINANCIAL STATEMENTS (Continued)
FOR THE YEARS ENDED JANUARY 31, 2012, 2011 AND 2010
Geographic Information:
Transfers between geographic areas are accounted for at cost and consistent with rules and regulations of governing tax authorities. Such transfers are eliminated in the consolidated financial statements. Income from operations by geographic segment includes an allocation of general corporate expenses. Identifiable assets are those that can be directly associated with the geographic area. Geographic information for the three years ended January 31 is presented in the following table:
| 2012 | 2011 | 2010 | |||
| Net sales: | |||||
| United States | $72,180,541 | $66,459,905 | $60,499,608 | ||
| Foreign | 27,980,851 | 22,405,521 | 19,632,885 | ||
| $100,161,392 | $88,865,426 | $80,132,493 | |||
| Foreign Sales by Segment: | |||||
| Product Recovery/Pollution Control Technologies | $7,492,321 | $7,912,462 | $7,017,041 | ||
| Fluid Handling Technologies | 10,072,782 | 7,086,069 | 5,081,925 | ||
| Mefiag Filtration Technologies | 10,290,964 | 7,310,354 | 7,444,774 | ||
| Filtration/Purification Technologies | 124,784 | 96,636 | 89,145 | ||
| $27,980,851 | $22,405,521 | $19,632,885 | |||
| Income from operations: | |||||
| United States | $6,264,686 | $5,721,656 | $4,991,481 | ||
| Foreign | 4,326,598 | 3,248,665 | 1,521,074 | ||
| $10,591,284 | $8,970,321 | $6,512,555 | |||
| Total assets: | |||||
| United States | $104,812,114 | $97,875,243 | $94,035,051 | ||
| Foreign | 10,697,101 | 10,171,085 | 10,573,308 | ||
| $115,509,215 | $108,046,328 | $104,608,359 |
64
MET-PRO CORPORATION
NOTES TO CONSOLIDATED FINANCIAL STATEMENTS (Continued)
FOR THE YEARS ENDED JANUARY 31, 2012, 2011 AND 2010
NOTE 16: CONTINGENCIES AND COMMITTMENTS
Beginning in 2002, the Company began to be named in asbestos-related lawsuits filed against a large number of industrial companies including, in particular, those in the pump and fluid handling industries. In management’s opinion, the complaints typically have been vague, general and speculative, alleging that the Company, along with the numerous other defendants, sold unidentified asbestos-containing products and engaged in other related actions which caused injuries (including death) and loss to the plaintiffs. Counsel has advised that more recent cases often allege more serious claims of mesothelioma. The Company believes that it has meritorious defenses to the cases which have been filed and that none of its products were a cause of any injury or loss to any of the plaintiffs. The Company’s insurers have hired attorneys who, together with the Company, are vigorously defending these cases. The Company has been dismissed from or settled a large number of these cases. The sum total of all payments through March 22, 2012 to settle cases involving asbestos-related claims was $675,000, all of which has been paid by the Company’s insurers including legal expenses, except for corporate counsel expenses, with an average cost per settled claim, excluding legal fees, of approximately $32,000. As of March 22, 2012, there were a total of 130 cases pending against the Company (with Connecticut, New York, Pennsylvania and West Virginia having the largest number of cases), as compared with 93 cases that were pending as of March 17, 2011, the date which our Annual Report on Form 10-K for the fiscal year ended January 31, 2011 was filed with the Securities and Exchange Commission. During the current fiscal year commencing February 1, 2011 through March 22, 2012, 81 new cases were filed against the Company, and the Company was dismissed from 38 cases and settled two cases. Most of the pending cases have not advanced beyond the early stages of discovery, although a number of cases are on schedules leading to, or are scheduled for trial. On April 27, 2011, a liquidation order was entered against Atlantic Mutual Insurance Company, who had been providing defense and indemnity to the Company, and its affiliate, Centennial Insurance Company, who provided umbrella coverage to the Company. It appears that our remaining insurers have assumed the share of the defense and indemnity obligations that Atlantic Mutual Insurance Company had agreed to assume, and despite the liquidation of Atlantic Mutual Insurance Company and Centennial Insurance Company, the Company believes that its insurance coverage is adequate for the cases currently pending against the Company and for the foreseeable future, assuming a continuation of the current volume, nature of cases and settlement amounts; however, the Company has no control over the number and nature of cases that are filed against it, nor as to the financial health of its insurers or their position as to coverage. The Company also presently believes that none of the pending cases will have a material adverse impact upon the Company’s results of operations, liquidity or financial condition.
At any given time, the Company is typically also party to a small number of other legal proceedings arising in the ordinary course of business. Although the ultimate outcome of any legal matter cannot be predicted with certainty, based upon the present information, including the Company’s assessment of the facts of each particular claim as well as accruals, the Company believes that no pending proceeding will have a material adverse impact upon the Company’s results of operations, liquidity, or financial condition.
On November 22, 2011, the Company entered into a Separation Agreement and General Release with Gary J. Morgan, the Company’s Senior Vice President-Finance, Chief Financial Officer, Secretary and Treasurer. The agreement stipulates that provided Mr. Morgan agrees to remain employed through April 30, 2012 and absent a termination of his employment by the Company for certain reasons the Company will provide him with certain specified benefits including severance pay totaling $236,640 payable over a twelve month period. Additionally, if Mr. Morgan is not re-employed under specified conditions at a minimum salary of $160,000 as of April 30, 2013, Mr. Morgan shall be paid $20,000 per month for three months, subject to three months additional payments if Mr. Morgan is not so re-employed as of July 31, 2013. Additionally, under certain circumstances the Company shall pay the COBRA premium for certain healthcare benefits during the time Mr. Morgan receives severance pay. The Company also agreed to accelerate the vesting of certain stock options and to extend the exercise date of Mr. Morgan’s stock options. The agreement also grants Mr. Morgan certain other specified rights and benefits.
65
MET-PRO CORPORATION
NOTES TO CONSOLIDATED FINANCIAL STATEMENTS (Continued)
FOR THE YEARS ENDED JANUARY 31, 2012, 2011 AND 2010
NOTE 17: SELECTED QUARTERLY FINANCIAL INFORMATION (Unaudited)
The following tables set forth a summary of the Company’s quarterly financial information for each of the four quarters ended January 31, 2012 and 2011:
| Earnings | Earnings | |||||||||||
| Gross | Per Share, | Per Share, | ||||||||||
| 2012 | Net Sales | Profit | Net Income | Basic | Diluted | |||||||
| First Quarter | $23,429,903 | $8,058,205 | $1,412,507 | $.10 | $.10 | |||||||
| Second Quarter | 23,089,343 | 8,136,981 | 1,490,234 | .10 | .10 | |||||||
| Third Quarter | 25,245,131 | 9,334,848 | 2,081,886 | .14 | .14 | |||||||
| Fourth Quarter | 28,397,015 | 9,838,973 | 2,149,074 | .15 | .15 | |||||||
| Earnings | Earnings | |||||||||||
| Gross | Per Share, | Per Share, | ||||||||||
| 2011 | Net Sales | Profit | Net Income | Basic | Diluted | |||||||
| First Quarter | $22,277,077 | $7,981,539 | $1,411,078 | $.10 | $.10 | |||||||
| Second Quarter | 21,436,886 | 7,843,152 | 1,552,730 | .11 | .11 | |||||||
| Third Quarter | 21,384,674 | 7,795,036 | 1,419,199 | .10 | .10 | |||||||
| Fourth Quarter | 23,766,789 | 8,658,373 | 1,756,125 | .12 | .12 | |||||||
Basic and diluted earnings per share are computed independently for each of the quarters presented. Therefore, the sum of quarterly basic and diluted per share information may not equal annual basic and diluted earnings per share.
None.
(a) Disclosure Controls and Procedures
Disclosure controls and procedures (as defined in Rule 13a-15(e) under the Securities Exchange Act of 1934, as amended (the “Exchange Act”)) are controls and other procedures that are designed to ensure that the information that we are required to disclose in the reports that we file or submit under the Exchange Act is recorded, processed, summarized, and reported within the time periods specified in the SEC’s rules and forms, and that such information is accumulated and made known to our management, including our Chief Executive Officer and Chief Financial Officer, as appropriate, to allow timely decisions regarding required disclosure.
In connection with the preparation of this Annual Report on Form 10-K/A, our management, under the supervision and with the participation of our Chief Executive Officer and Chief Financial Officer, carried out an evaluation of the effectiveness of the design and operation of our disclosure controls and procedures as of January 31, 2012. Based upon this evaluation, our Chief Executive Officer and Chief Financial Officer concluded that our controls and procedures were effective as of January 31, 2012.
(b) Management’s Report on Internal Control over Financial Reporting
We assessed the effectiveness of our internal control over financial reporting as of January 31, 2012. Management’s report on the Company’s internal control over financial reporting (as defined in Exchange Act Rules 13a-15(f) and 15d-15(f)) and the related report of our independent registered public accounting firm are included in Item 8 – Financial Statements and Supplementary Data.
(c) Changes in Internal Control Over Financial Reporting
There were no changes to our internal control over financial reporting (as defined in Rules 13a-15(f) and 15d-15(f) under the Exchange Act) that occurred during the period covered by this report that have materially affected, or are reasonably likely to materially affect, our internal control over financial reporting.
None.
Pursuant to Paragraph G (3) of the General Instructions to Form 10-K/A, portions of the information required in Part III of Form 10-K/A are incorporated by reference from Met-Pro’s proxy statement to be filed with the SEC in connection with our 2012 Annual Meeting of Shareholders.
We have codes of ethics that apply to all Directors, officers and employees, including our Chief Executive Officer and our Chief Financial Officer (who is also our principal accounting officer). You can find our codes of ethics on our website by going to the following address: www.met-pro.com, and clicking on the link for our codes of ethics under the “Investor Relations – Corporate Governance” captions. We will post on our website any amendments to the codes of ethics, as well as any waivers that are required to be disclosed by the rules of either the Securities and Exchange Commission or the New York Stock Exchange.
Our Board of Directors has adopted charters for the three standing committees of the Board, those being the Audit, Compensation and Management Development, and Corporate Governance and Nominating Committees. You can find these documents on our website by going to the following address: www.met-pro.com, under the “Investor Relations – Corporate Governance” captions.
You may obtain a printed copy of any of the foregoing materials by writing to: Corporate Secretary, Met-Pro Corporation, 160 Cassell Road, Harleysville, PA 19438.
The information required by this Item (except for the information set forth on page 7 of this Report with respect to Executive Officers of Registrant) is hereby incorporated by reference to the applicable information set forth in our proxy statement for our 2012 Annual Meeting of Shareholders, including the information set forth under the captions “Election of Directors”, “The Board of Directors and its Committees”, “Share Ownership of Executive Officers and Directors”, “Section 16(a) Beneficial Ownership Reporting Compliance”, “Independence of Directors/Corporate Governance Guidelines” and “Codes of Ethics”.
Section 16(a) Beneficial Ownership Reporting Compliance
Neal E. Murphy joined the Company as a Vice President on February 7, 2012, and the Form 3 required to be filed in connection therewith was not filed until March 2, 2012. There were no transactions or beneficial ownership to report on the Form 3. The Company granted Mr. Murphy two sets of stock options on February 27, 2012 and the Form 4 to report these grants was not filed until March 2, 2012.
The Company granted Vincent J. Verdone certain stock options on February 27, 2012 and the Form 4 to report this grant was not filed until March 7, 2012.
The information required by this Item is hereby incorporated by reference to the applicable information set forth in our proxy statement for our 2012 Annual Meeting of Shareholders, including the information set forth under the captions “Compensation Discussion and Analysis”, “Compensation and Management Development Committee Report on Executive Compensation”, “Summary Compensation Table”, “Grants of Plan-Based Awards”, “Outstanding Equity Awards at Fiscal Year End”, “Options Exercises and Year End Holdings”, “Pension Benefits”, “Compensation Termination of Employment and Change of Control Arrangements”, “Director Compensation” and “Director Summary Compensation Table”.
The information required by this Item is hereby incorporated by reference to the applicable information set forth in our proxy statement for our 2012 Annual Meeting of Shareholders, including the information set forth under the captions “Share Ownership of Executive Officers and Directors” and “Beneficial Ownership of Principal Shareholders”.
The information required by this Item is hereby incorporated by reference to the applicable information set forth in our proxy statement for our 2012 Annual Meeting of Shareholders, including the information set forth under the captions “Election of Directors”, “Independence of Directors/Corporate Governance Guidelines” and “Certain Business Relationships”.
The information required by this Item is hereby incorporated by reference to the applicable information set forth in our proxy statement for our 2012 Annual Meeting of Shareholders, including the information set forth under the caption “Our Relationship with Our Independent Registered Public Accountants”.
| (a) | Exhibits and Financial Statements/Schedules: | |
| (1) | Financial Statements: | |
| (2) | Financial Statement Schedule – See “Schedule II – Valuation and Qualifying Accounts” below. | |
SCHEDULE II—VALUATION AND QUALIFYING ACCOUNTS
Accounts Receivable Allowance for Doubtful Accounts
Valuation and qualifying account information related to operations is as follows:
| Fiscal Year End | Balance at Beginning of Year | Additions Charged to Costs and Expenses | Deductions(1) | Balance at End of Year | ||||||||
| January 31, 2010 | $166,830 | $157,653 | ($120,464 | ) | $204,019 | |||||||
| January 31, 2011 | 204,019 | 368,983 | (128,850 | ) | 444,152 | |||||||
| January 31, 2012 | 444,152 | 56,654 | (9,668 | ) | 491,138 | |||||||
(1) Includes amounts written-off as uncollectible, net of recoveries.
| (3) | Exhibits, including those incorporated by reference: |
| Exhibit No. | Description | |
| (2)(c) | Agreement and Plan of Merger dated July 31, 2003 by and between Met-Pro Corporation, a Delaware corporation, and Met-Pro Pennsylvania, Inc., a Pennsylvania corporation, incorporated by reference to the Company’s Current Report on Form 8-K filed on August 6, 2003. | |
| (3)(f) | Articles of Incorporation of Met-Pro Corporation, a Pennsylvania corporation formerly known as Met-Pro Pennsylvania, Inc., incorporated by reference to the Company’s Current Report of Form 8-K filed on August 6, 2003. | |
| (3)(g) | By-Laws of Met-Pro Corporation, a Pennsylvania corporation formerly known as Met-Pro Pennsylvania, Inc., incorporated by reference to the Company’s Current Report on Form 8-K filed on August 6, 2003. | |
| (4) | Shareholders’ Rights Plan, incorporated by reference to the Company’s Current Report on Form 8-K filed on January 6, 2000. | |
| (4)(a) | Amendment No. 1 to Shareholders’ Rights Plan, incorporated by reference to the Company’s Current Report on Form 8-K filed on December 17, 2009. | |
| (10)(b) | The 1997 Stock Option Plan, incorporated by reference to the Company’s Registration Statement on Form S-8 filed January 16, 1998.* | |
| (10)(d) | Amendment No. 1 to the 1997 Stock Option Plan, incorporated by reference to the Company’s Annual Report on Form 10-K filed on May 4, 2001.* | |
| (10)(f) | Key Employee Severance Agreement between Met-Pro Corporation and Gary J. Morgan, incorporated by reference to the Company’s Annual Report on Form 10-K filed on May 4, 2001.* | |
| Exhibit No. | Description | |
| (10)(g) | Key Employee Severance Agreement between Met-Pro Corporation and Raymond J. De Hont, incorporated by reference to the Company’s Annual Report on Form 10-K filed on May 4, 2001.* | |
| (10)(i) | Amendment to Key Employee Severance Agreement between Met-Pro Corporation and Gary J. Morgan, incorporated by reference to the Company’s Annual Report on Form 10-K filed on May 4, 2001.* | |
| (10)(j) | The Company’s Director’s Retirement Plan, incorporated by reference to the Company’s Annual Report on Form 10-K filed on May 4, 2001.* | |
| (10)(k) | Amendment No. 1 to the Company’s Director’s Retirement Plan, incorporated by reference to the Company’s Annual Report on Form 10-K filed on May 4, 2001.* | |
| (10)(l) | Amendment No. 2 to the Company’s Director’s Retirement Plan, incorporated by reference to the Company’s Annual Report on Form 10-K filed on May 4, 2001.* | |
| (10)(m) | Restoration Plan, effective February 1, 2000, incorporated by reference to the Company’s Annual Report on Form 10-K filed on May 4, 2001.* | |
| (10)(n) | Amendment No. 1 to the Company’s Restoration Plan, incorporated by reference to the Company’s Annual Report on Form 10-K filed on May 4, 2001.* | |
| (10)(o) | Additional 1% Supplemental Executive Retirement Plan, effective February 1, 2000, incorporated by reference to the Company’s Annual Report on Form 10-K filed on May 4, 2001.* | |
| (10)(p) | The 2001 Equity Incentive Plan, incorporated by reference to the Company’s Registration Statement on Form S-8 filed August 22, 2001.* | |
| (10)(q) | Year 2000 Employee Stock Purchase Plan, incorporated by reference to the Company’s Registration Statement on Form S-8 filed on June 13, 2000.* | |
| (10)(r) | Salaried Pension Plan Amended and Restated effective September 1, 2000, incorporated by reference to the Company’s Annual Report on Form 10-K filed on April 28, 2003.* | |
| (10)(s) | First Amendment to the Company’s Salaried Pension Plan dated August 15, 2002, incorporated by reference to the Company’s Annual Report on Form 10-K filed on April 28, 2003.* | |
| (10)(t) | Second Amendment to the Company’s Salaried Pension Plan dated October 23, 2002, incorporated by reference to the Company’s Annual Report on Form 10-K filed on April 28, 2003.* | |
| (10)(u) | Amendment No. 3 to the Company’s Directors’ Retirement Plan dated as of February 24, 2003, incorporated by reference to the Company’s Annual Report on Form 10-K filed on April 28, 2003.* | |
| (10)(v) | Amendment No. 1 to the Company’s Additional 1% Supplemental Executive Plan dated as of March 21, 2003, incorporated by reference to the Company’s Annual Report on Form 10-K filed on April 28, 2003.* | |
| (10)(w) | Directors Retirement Plan Trust dated as of February 11, 2000, incorporated by reference to the Company’s Annual Report on Form 10-K filed on April 28, 2003.* | |
| (10)(x) | Amendment No. 1 to the Company’s Directors’ Retirement Plan Trust dated as of February 24, 2003, incorporated by reference to the Company’s Annual Report on Form 10-K filed on April 28, 2003.* | |
| (10)(y) | Amendment No. 2 to the Company’s Directors’ Retirement Plan Trust dated as of February 24, 2003, incorporated by reference to the Company’s Annual Report on Form 10-K filed on April 28, 2003.* | |
| (10)(z) | Restoration and Supplemental Executive Retirement Plan Trust Agreement dated as of February 11, 2000, incorporated by reference to the Company’s Annual Report on Form 10-K filed on April 28, 2003.* | |
| Exhibit No. | Description | |
| (10)(aa) | Amendment No. 1 to the Company’s Restoration and Supplemental Executive Retirement Plan Trust Agreement dated as of February 24, 2003, incorporated by reference to the Company’s Annual Report on Form 10-K filed on April 28, 2003.* | |
| (10)(ab) | The 2005 Equity Incentive Plan, incorporated by reference to the Company’s Registration Statement on Form S-8 filed June 9, 2005.* | |
| (10)(ac) | Third Amendment to the Company’s Salaried Pension Plan dated as of August 31, 2005, incorporated by reference to the Company’s Annual Report on Form 10-K filed on April 13, 2007. * | |
| (10)(ad) | Fourth Amendment to the Company’s Salaried Pension Plan dated as of April 5, 2006, incorporated by reference to the Company’s Annual Report on Form 10-K filed on April 13, 2007. * | |
| (10)(ae) | Fifth Amendment to the Company’s Salaried Pension Plan dated as of October 18, 2006, incorporated by reference to the Company’s Annual Report on Form 10-K filed on April 13, 2007. * | |
| (10)(af) | Standard form for the Company’s Non-Employee Director Stock Option Agreement dated as of December 10, 2007. * | |
| (10)(ag) | Standard form for the Company’s Incentive Stock Option Agreement dated as of December 10, 2007. * | |
| (10)(ah) | Non-Qualified Defined Contribution Supplemental Executive Retirement Plan Agreement dated as of May 1, 2008. * | |
| (10)(ai) | Amended and Restated Key Severance Agreement for the Chief Executive Officer dated as of April 3, 2008. * | |
| (10)(aj) | Amended and Restated Key Severance Agreement for the Chief Financial Officer dated as of April 3, 2008. * | |
| (10)(ak) | The 2008 Equity Incentive Plan, incorporated by reference to the Company’s Registration Statement on Form S-8 filed on December 8, 2008.* | |
| (10)(al) | Second Amended and Restated Key Employee Severance Pay Agreement for the Chief Executive Officer dated as of December 3, 2008, incorporated by reference to the Company’s Current Report on 8-K filed on December 5, 2008. * | |
| (10)(am) | Second Amended and Restated Key Employee Severance Pay Agreement for the Chief Financial Officer dated as of December 3, 2008, incorporated by reference to the Company’s Current Report on 8-K filed on December 5, 2008. * | |
(10)(an) | Standard Form for the Non-Employee Stock Option Agreement dated December 3, 2008, incorporated by reference to the Company’s Current Report on Form 8-K filed on January 11, 2010. * | |
(10)(ao) | Standard Form for the Incentive Stock Option Agreement dated December 3, 2008, incorporated by reference to the Company’s Current Report on Form 8-K filed on January 11, 2010. * | |
| (10)(ap) | Standard Form for the Employee Non-Qualified Stock Option Agreement dated December 3, 2008, incorporated by reference to the Company’s Current Report filed on Form 8-K filed on January 11, 2010. * | |
| (10)(aq) | Standard Form for the Non-Employee Stock Option Agreement dated December 11, 2009, incorporated by reference to the Company’s Current Report filed on Form 8-K filed on January 11, 2010. * | |
| (10)(ar) | Standard Form for the Incentive Stock Option Agreement dated December 11, 2009, incorporated by reference to the Company’s Current Report filed on Form 8-K filed on January 11, 2010. * | |
| (10)(as) | Standard Form for the Employee Non-Qualified Stock Option Agreement dated December 11, 2009, incorporated by reference to the Company’s Current Report filed on Form 8-K filed on January 11, 2010. * | |
| Exhibit No. | Description | |
| (10)(at) | FYE 2010 Incentive Plan for Chief Executive Officer and Chief Financial Officer, incorporated by reference to the Company’s Current Report filed on Form 8-K filed on January 12, 2010. * | |
| (10)(au) | FYE 2010 Incentive Plan for Executive Vice President, incorporated by reference to the Company’s Current Report filed on Form 8-K filed on January 12, 2010. * | |
| (10)(av) | FYE 2010 Incentive Plan for Vice Presidents/General Managers, incorporated by reference to the Company’s Current Report filed on Form 8-K filed on January 12, 2010. * | |
| (10)(aw) | Salaried Pension Plan Amended and Restated effective September 1, 2007, incorporated by reference to the Company’s Current Report filed on Form 8-K filed on January 15, 2010. * | |
| (10)(ax) | First (Corrective) Amendment to the Met-Pro Corporation Salaried Pension Plan, incorporated by reference to the Company’s Current Report filed on Form 8-K filed on January 15, 2010. * | |
| (10)(ay) | Second (Qualification) Amendment to the Met-Pro Corporation Salaried Pension Plan, incorporated by reference to the Company’s Current Report filed on Form 8-K filed on January 15, 2010. * | |
| (10)(az) | Met-Pro Corporation Retirement Savings Plan effective January 1, 2007, incorporated by reference to the Company’s Current Report filed on Form 8-K filed on January 19, 2010. * | |
| (10)(ba) | First (Qualification) Amendment to the Met-Pro Corporation Retirement Savings Plan, incorporated by reference to the Company’s Current Report filed on Form 8-K filed on January 19, 2010. * | |
| (10)(bb) | Second Amendment to the Met-Pro Corporation Retirement Savings Plan, incorporated by reference to the Company’s Current Report filed on Form 8-K filed on January 19, 2010. * | |
| (10)(bc) | Third (Good Faith) Amendment to the Met-Pro Corporation Retirement Savings Plan, incorporated by reference to the Company’s Current Report filed on Form 8-K filed on January 19, 2010. * | |
| (10)(bd) | Promissory Line of Credit Note dated February 23, 1996, incorporated by reference to the Company’s Current Report filed on Form 8-K filed on February 1, 2010. * | |
| (10)(be) | Reaffirmation of Line of Credit dated January 19, 2010, incorporated by reference to the Company’s Current Report filed on Form 8-K filed on February 1, 2010. * | |
| (10)(bf) | Third (Good Faith) Amendment to the Met-Pro Corporation Salaried Pension Plan effective January 29, 2010, incorporated by reference to the Company’s Current Report filed on Form 8-K filed on February 1, 2010. * | |
| (10)(bg) | Financing Agreement dated December 30, 2005, incorporated by reference to the Company’s Current Report filed on Form 8-K filed on March 12, 2010. * | |
| (10)(bh) | Trade Confirmation, incorporated by reference to the Company’s Current Report filed on Form 8-K filed on March 12, 2010. * | |
| (10)(bi) | ISDA Master Agreement, incorporated by reference to the Company’s Current Report filed on Form 8-K filed on March 12, 2010. * | |
| (10)(bj) | ISDA Schedule to the Master Agreement, incorporated by reference to the Company’s Current Report filed on Form 8-K filed on March 12, 2010. * | |
| (10)(bk) | Fortis Bank General Credit Offer dated October 19, 2005, incorporated by reference to the Company’s Current Report filed on Form 8-K filed on March 12, 2010. * | |
| (10)(bl) | Positive/Negative Mortgage Statement dated October 19, 2005, incorporated by reference to the Company’s Current Report filed on Form 8-K filed on March 12, 2010. * | |
| Exhibit No. | Description | |
| (10)(bm) | Fortis Bank General Conditions, incorporated by reference to the Company’s Current Report filed on Form 8-K filed on March 12, 2010. * | |
| (10)(bn) | General Credit Conditions of Fortis Bank (Nederland) N.V., incorporated by reference to the Company’s Current Report filed on Form 8-K filed on March 12, 2010. * | |
| (10)(bo) | Interest Assessment dated November 2, 2005, incorporated by reference to the Company’s Current Report filed on Form 8-K filed on March 12, 2010. * | |
| (10)(bp) | Supplement to the General Credit Offer dated October 19, 2005, incorporated by reference to the Company’s Current Report filed on Form 8-K filed on March 12, 2010. * | |
| (10)(bq) | Microsoft Financing Master Agreement dated March 18, 2009, incorporated by reference to the Company’s Current Report filed on Form 8-K filed on March 12, 2010. * | |
| (10)(br) | FYE 2011 Incentive Plan for Chief Executive Officer and Chief Financial Officer, incorporated by reference to the Company’s Current Report filed on Form 8-K filed on April 5, 2010. * | |
| (10)(bs) | FYE 2011 Incentive Plan for Executive Vice President, incorporated by reference to the Company’s Current Report filed on Form 8-K filed on April 5, 2010. * | |
| (10)(bt) | FYE 2011 Incentive Plan for Vice Presidents/General Managers, incorporated by reference to the Company’s Current Report filed on Form 8-K filed on April 5, 2010. * | |
| (10)(bu) | Fourth Amendment to the Met-Pro Corporation Retirement Savings Plan dated October 20, 2010, incorporated by reference to the Company's Current Report filed on Form 10-Q filed on December 2, 2010.* | |
| (10)(bv) | Reaffirmation of Discretionary Demand Line of Credit dated November 29, 2010, incorporated by reference to the Company's Current Report filed on Form 10-Q filed on December 2, 2010.* | |
| (10)(bw) | Form of a Letter Agreement Regarding Amendment of Stock Option Agreements for Non-Employee Directors dated November 29, 2010, incorporated by reference to the Company's Current Report filed on Form 10-Q filed on December 2, 2010.* | |
| (10)(bx) | Met-Pro Corporation Pension Restoration Plan (Amended and Restated Effective January 1, 2010), incorporated by reference to the Company's Current Report filed on Form 8-K filed on January 4, 2011.* | |
| (10)(by) | First Amendment to the Met-Pro Corporation Salaried Employee Stock Ownership Plan, incorporated by reference to the Company's Current Report filed on Form 8-K filed on January 4, 2011.* | |
| (10)(bz) | Fourth Amendment to the Met-Pro Corporation Salaried Pension Plan, incorporated by reference to the Company's Current Report filed on Form 8-K filed on January 4, 2011.* | |
| (10)(ca) | Fifth Amendment to the Met-Pro Corporation Retirement Savings Plan, incorporated by reference to the Company's Current Report filed on Form 8-K filed on January 4, 2011.* | |
| (10)(cb) | FYE 2012 Incentive Plan for Chief Executive Officer and Chief Financial Officer, incorporated by reference to the Company’s Current Report filed on Form 8-K filed on February 1, 2011. * | |
| (10)(cc) | FYE 2012 Incentive Plan for Executive Vice President, incorporated by reference to the Company’s Current Report filed on Form 8-K filed on February 1, 2011. * | |
| (10)(cd) | FYE 2012 Incentive Plan for Vice Presidents/General Managers, incorporated by reference to the Company’s Current Report filed on Form 8-K filed on February 1, 2011. * | |
| (10)(ce) | Standard Form for the Non-Employee Restricted Stock Unit Agreement dated December 17, 2010, incorporated by reference to the Company’s Current Report filed on Form 8-K filed on March 8, 2011.* | |
| Exhibit No. | Description | |
| (10)(cf) | Standard Form for the Incentive Stock Option Agreement dated December 17, 2010, incorporated by reference to the Company’s Current Report filed on Form 8-K filed on March 8, 2011.* | |
| (10)(cg) | Standard Form for the Employee Non-Qualified Option Agreement dated December 17, 2010, incorporated by reference to the Company’s Current Report filed on Form 8-K filed on March 8, 2011.* | |
| (10)(ch) | Amendment No. 1 to the Met-Pro Corporation 2008 Equity Incentive Plan in Respect of Performance-Based Compensation Under Code Section 162(m), incorporated by reference to the Company's definitive proxy statement for the 2011 Annual Meeting of Shareholders filed on April 11, 2011.* | |
| (10)(ci) | Separation Agreement and General Release effective as of November 29, 2011 between Met-Pro Corporation and Gary J. Morgan, incorporated by reference to the Company's Current Report filed on Form 8-K filed on December 5, 2011.* | |
| (10)(cj) | Form of Indemnification Agreement incorporated by reference to the Company's Current Report filed on Form 10-Q filed on December 8, 2011.* | |
| (10)(ck) | Third (Qualification) Amendment to the Met-Pro Corporation Salaried Employee Stock Ownership Plan incorporated by reference to the Company's Current Report filed on Form 10-Q filed on December 8, 2011.* | |
| (10)(cl) | Met-Pro Corporation Pension Restoration and Supplemental Executive Retirement Plan Trust Agreement incorporated by reference to the Company's Quarterly Report on Form 10-Q filed on December 8, 2011.* | |
| (10)(cm) | Met-Pro Corporation Non-Qualified Defined Contribution Supplemental Executive Retirement Plan Trust Agreement incorporated by reference to the Company's Quarterly Report on Form 10-Q filed on December 8, 2011.* | |
| (10)(cn) | Met-Pro Corporation Directors Retirement Plan Trust Agreement incorporated by reference to the Company's Quarterly Report on Form 10-Q filed on December 8, 2011.* | |
| (10)(co) | Reaffirmation of Discretionary Demand Line of Credit dated February 28, 2012, incorporated by reference to the Company's Current Report filed on Form 8-K filed on February 29, 2012.* | |
| (11) | Statement Re-computation of Per Share Earnings. See page 33 of Item 8. | |
| (21) | List of Subsidiaries of Registrant as of January 31, 2012: | |
| Corporate | Jurisdiction of | Name under which Business | |||
| Name | Incorporation | is Conducted | |||
| Mefiag B.V. | The Netherlands | Mefiag B.V., a wholly owned | |||
| subsidiary of Met-Pro Corporation | |||||
| Met-Pro Product | Ontario, Canada | Met-Pro Product Recovery/Pollution | |||
| Recovery/Pollution Control | Control Technologies Inc., | ||||
| Technologies Inc. | a wholly-owned subsidiary of | ||||
| Met-Pro Corporation | |||||
| Strobic Air Corporation | Delaware | Strobic Air Corporation, | |||
| a wholly-owned subsidiary of | |||||
| Met-Pro Corporation | |||||
| MPC Inc. | Delaware | MPC Inc., | |||
| a wholly-owned subsidiary of | |||||
| Met-Pro Corporation |
| Exhibit No. | Description | |
| Corporate | Jurisdiction of | Name under which Business | |||
| Name | Incorporation | is Conducted | |||
| Pristine Water Solutions | Delaware | Pristine Water Solutions Inc., | |||
| Inc. | a wholly-owned subsidiary of | ||||
| Met-Pro Corporation | |||||
| Met-Pro Industrial Services | Pennsylvania | Met-Pro Industrial Services Inc., | |||
| Inc. | a wholly-owned subsidiary of | ||||
| Met-Pro Corporation | |||||
| Bio-Reaction Industries | Delaware | Bio-Reaction Industries Inc., | |||
| Inc. | a wholly-owned subsidiary of | ||||
| Met-Pro Corporation | |||||
| Mefiag (Guangzhou) Filter | People’s Republic of | Mefiag (Guangzhou) Filter Systems Ltd., | |||
| Systems Ltd. | China | a wholly-owned subsidiary of Met-Pro | |||
| (Hong Kong) Company Limited | |||||
| Met-Pro (Hong Kong) | Hong Kong | Met-Pro (Hong Kong) Company | |||
| Company Limited | Limited, a wholly-owned subsidiary of | ||||
| Met-Pro Corporation | |||||
| Met-Pro Holdings LLC | Delaware | Met-Pro Holdings LLC, a wholly-owned | |||
| a wholly- owned subsidiary of | |||||
| Met-Pro Corporation | |||||
| Met-Pro Chile Limitada | Chile | Met-Pro Chile Limitada, | |||
| a wholly-owned subsidiary of | |||||
| Met-Pro Corporation |
| (23) | ||
| (31.1) | ||
| (31.2) | ||
| (32.1) | ||
| (32.2) | ||
| (101.INS) | XBRL Instance* | |
| (101.SCH) | XBRL Taxonomy Extension Schema* | |
| (101.CAL) | XBRL Taxonomy Extension Calculation* | |
| (101.LAB) | XBRL Taxonomy Extension Labels* | |
| (101.PRE) | XBRL Taxonomy Extension Presentation* | |
| (101.DEF) | XBRL Taxonomy Extension Definition* |
| Exhibit No. | Description | |
| The following exhibits required under Item 601 of Regulation S-K promulgated by the Securities & Exchange Commission have been omitted because they are either posted on our website, inapplicable or non-existent: | ||
| (9) | Voting trust agreements. | |
| (12) | Statements re computation of ratios. | |
| (13) | Annual report to security holders. | |
| (14) | Code of ethics. | |
| (16) | Letter re change in certifying accountant. | |
| (18) | Letter re change in accounting principles. | |
| (22) | Published report regarding matters submitted to vote of security holders. | |
| (24) | Power of attorney. | |
| * Indicates management contract or compensatory plan or arrangement. | ||
| **Filed herewith. | ||
Pursuant to the requirements of Section 13 or 15(d) of the Securities Exchange Act of 1934, the Registrant has duly caused this report to be signed on its behalf by the undersigned, thereunto duly authorized.
| MET-PRO CORPORATION | ||||
| March 26, 2012 | By: | /s/ Raymond J. De Hont | ||
| Date | Raymond J. De Hont | |||
| Chairman, Chief Executive | ||||
| Officer and President | ||||
Pursuant to the requirement of the Securities Exchange Act of 1934, this report has been signed below by the following persons on behalf of the Registrant and in the capacities and on the dates indicated.
| Signature | Title | Date | |||||||
| /s/ Raymond J. De Hont | Chairman, | March 26, 2012 | |||||||
| Raymond J. De Hont | Chief Executive Officer | ||||||||
| and President | |||||||||
| /s/ Gary J. Morgan | Senior Vice President-Finance, | March 26, 2012 | |||||||
| Gary J. Morgan | Secretary, Treasurer, | ||||||||
| Chief Financial Officer, | |||||||||
| Chief Accounting Officer | |||||||||
| and Director | |||||||||
| /s/ George H. Glatfelter II | Director | March 26, 2012 | |||||||
| George H. Glatfelter II | |||||||||
| /s/ Michael J. Morris | Director | March 26, 2012 | |||||||
| Michael J. Morris | |||||||||
| /s/ Judith A. Spires | Director | March 26, 2012 | |||||||
| Judith A. Spires | |||||||||
| /s/ Stanley W. Silverman | Director | March 26, 2012 | |||||||
| Stanley W. Silverman | |||||||||
| /s/ Robin L. Wiessmann | Director | March 26, 2012 | |||||||
| Robin L. Wiessmann | |||||||||
78