Exhibit 99.1
Link to searchable text of slide shown above
Link to searchable text of slide shown above
Searchable text section of graphics shown below
| |
| |
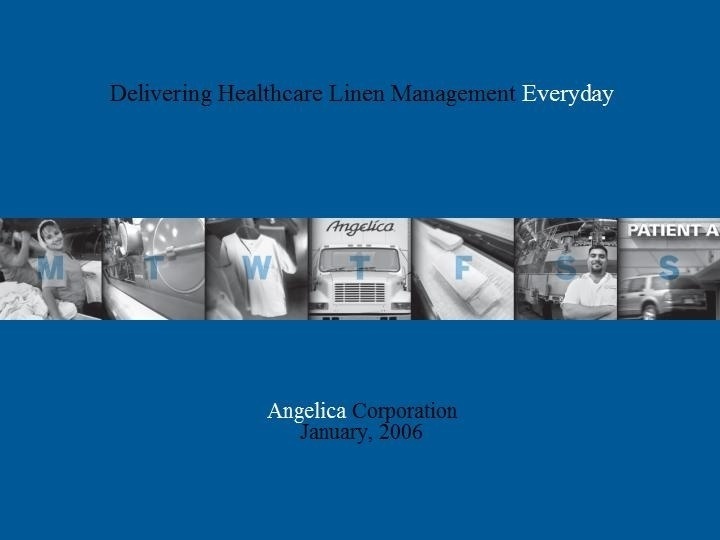
| [picture] | |
Angelica Corporation January, 2006 | |
| | |
|
| |
| This presentation contains forward-looking statements, which reflect Angelica Corporation’s current views with respect to future events and financial performance and are made pursuant to the Private Securities Litigation Reform Act of 1995. These forward-looking statements involve risks and uncertainties that may cause our actual results to be materially different from those expressed or implied by these statements. A more detailed description of certain factors that could affect actual results include, but are not limited to, those discussed in Angelica Corporation’s filings with the Securities and Exchange Commission. |
| [Angelica Logo] |
| |
| | |
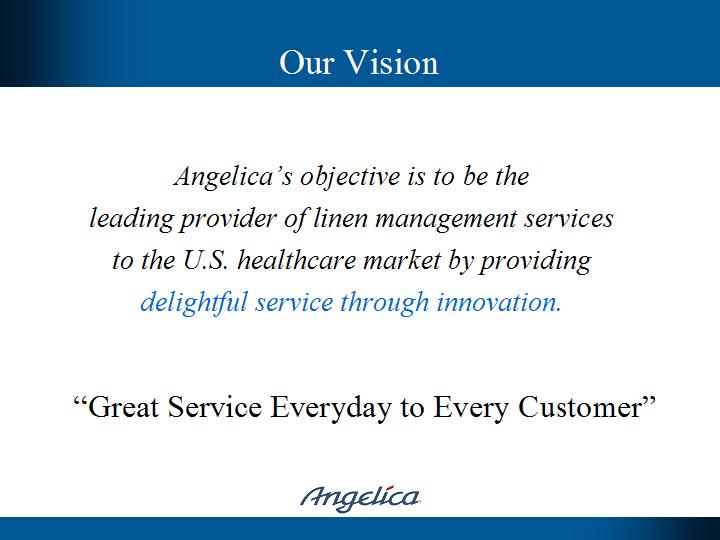
| Angelica’s objective is to be the leading provider of linen management services to the U.S. healthcare market by providing delightful service through innovation. | |
| | |
“Great Service Everyday to Every Customer” | |
[Angelica Logo] | |
| |
| | | |
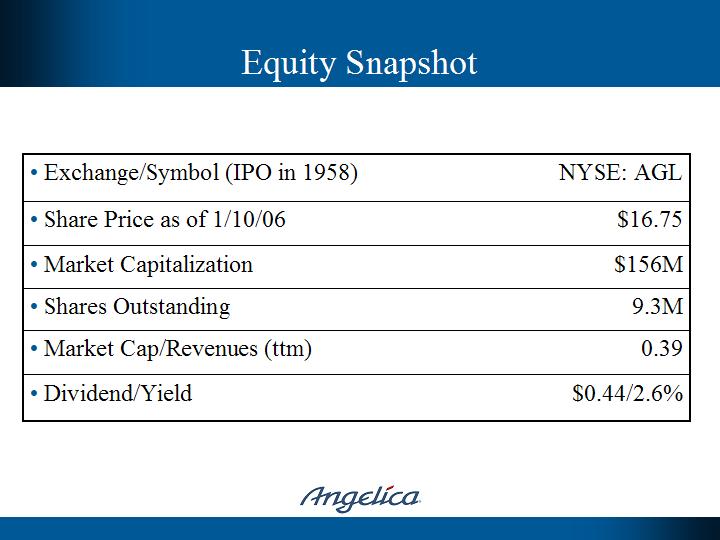
| • Exchange/Symbol (IPO in 1958) | NYSE: AGL | |
| | | |
| • Share Price as of 1/10/06 | $16.75 | |
| | | |
| • Market Capitalization | $156M | |
| | | |
| • Shares Outstanding | 9.3M | |
| | | |
| • Market Cap/Revenues (ttm) | 0.39 | |
| | | |
| • Dividend/Yield | $0.44/2.6% | |
| [Angelica Logo] | |
| | | |
| | | |
| • | Founded in 1878 as uniform manufacturing company and grew to three divisions in 1960’s: Manufacturing, Textile Services and Retail | |
| • | Sold Manufacturing division in 2002 | |
| • | Sold Retail division in 2004 | |
| • | Reduced corporate overhead from 50 people to 15 people in 2004 | |
| • | Focused textile rental services business on healthcare linen services | |
| • | However, lingering cultural focus on local plant operations has slowed organic growth and hindered achievement of vision | |
[Angelica Logo] | |
| |
| | |
| | | | |
| • | Completed reorganization from inward looking, plant-centric operations company to outward looking customer-focused, high quality service provider | |
| | – | Effective November 1, 2005, moved to customer versus plant focused organizational structure of nine markets | |
| | – | Created the position of Market Vice President, supported by Directors of Service, Operations and Sales. Streamlined plant operations and eliminated approximately 50 management positions keeping reorganization cost neutral | |
| | – | Rolling out program to achieve on-time delivery, 100% fill rates, and product quality | |
| • | Benchmarking all best practices and implementing across all 31 plants to deliver Angelica Service everywhere with optimized cost structure | |
| • | Building an IT knowledge base and metrics | |
| | | | |
[Angelica Logo] | |
| |
| | | |
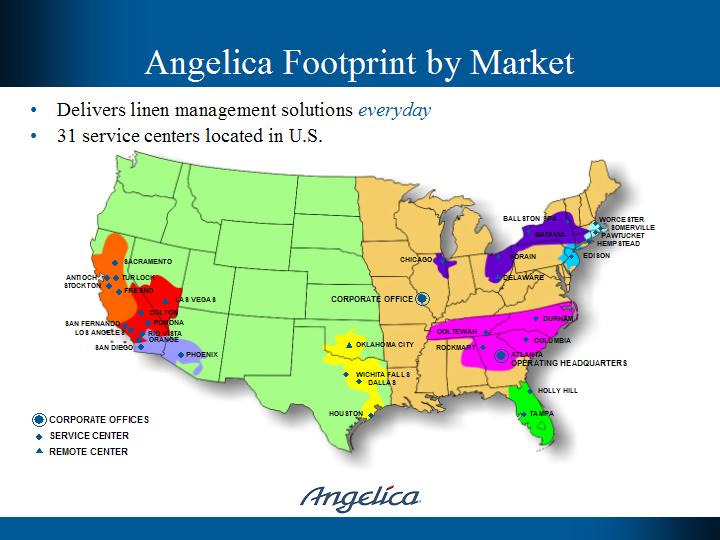
| • | Delivers linen management solutions everyday | |
| | | |
| • | 31 service centers located in U.S. | |
| | | |
| [picture] | |
[Angelica Logo] | |
| | | |
| | | |
| “Great Service Everyday to Every Customer” yields: | |
| | | |
| • | The unsurpassed healthcare service provider of linen management services leading to organic growth rate of 7-10% | |
| | | |
| • | A more efficient operating model, leveraging our scale benefits and best practices, allowing gross margins to grow to 20% | |
| | | |
| • | Adding additional growth through acquisitions by consolidating a fragmented market and by adding complementary healthcare services that fit our distribution model | |
| | | |
| | [Angelica Logo] | |
| | | |
| |
| | |
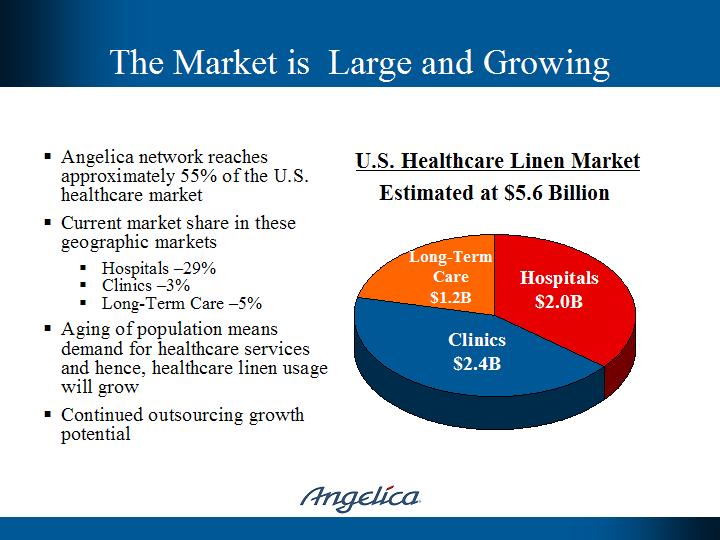
| § | Angelica network reaches approximately 55% of the U.S. healthcare market | U.S. Healthcare Linen Market Estimated at $5.6 Billion | |
| § | Current market share in these geographic markets | [pie chart] | |
| | § | Hospitals -29% | Long-Term Care $1.2B | |
| | § | Clinics -3% | Hospitals $2.0B | |
| | § | Long-Term Care -5% | Clinics $2.4B | |
| § | Aging of population means demand for healthcare services and hence, healthcare linen usage will grow | | |
| § | Continued outsourcing growth potential | | |
[Angelica Logo] | |
| |
| | | |
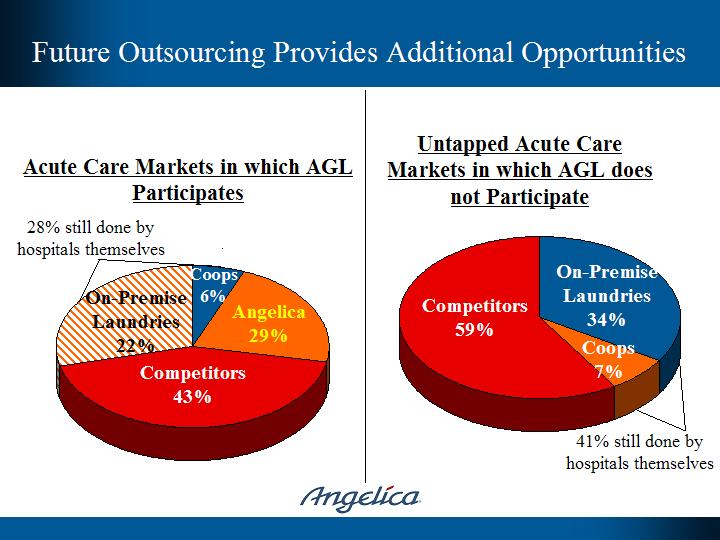
Acute Care Markets in which AGL Participates | Untapped Acute Care Markets in which AGL does not Participate | |
| | | |
28% still done by hospitals themselves | | |
| | | |
| [pie chart] | [pie chart] | |
| | | |
Competitors 43% | Competitors 59% | |
On-Premise Laundries 22% | On-Premise Laundries 34% | |
Angelica 29% | Coops 7% | |
| Coops 6% | | |
| | 41% still done by hospitals themselves | |
| [Angelica Logo] | |
| |
| | | |
| • | With less than 10% share of the total healthcare market, Angelica leads a fragmented $5.6 billion market | |
| • | Only two national competitors (Crothall Services, a Compass division, and Sodexho Laundry Services) | |
| • | Approximately 11 mid-size regional providers (between $20 million and $100 million) | |
| • | Over 1,500 hospitals still managing own laundry (OPL) or coop | |
| [Angelica Logo] | |
| |
| | | |
| • | Organic Revenue Growth | |
| | – | Delightful service through innovation | |
| | | • | 100% fill rate; on-time delivery | |
| | | • | Improved product offerings | |
| | – | All products available and offered to all customers | |
| | – | Clinic and long-term care growth | |
| • | Acquired Revenue Growth | |
| | – | On premise laundry (OPL) conversion | |
| | – | Accretive competitor acquisition | |
| • | Improved Operational Efficiency | |
| | – | Market structure | |
| | – | Best practices | |
| [Angelica Logo] | |
| |
| | | |
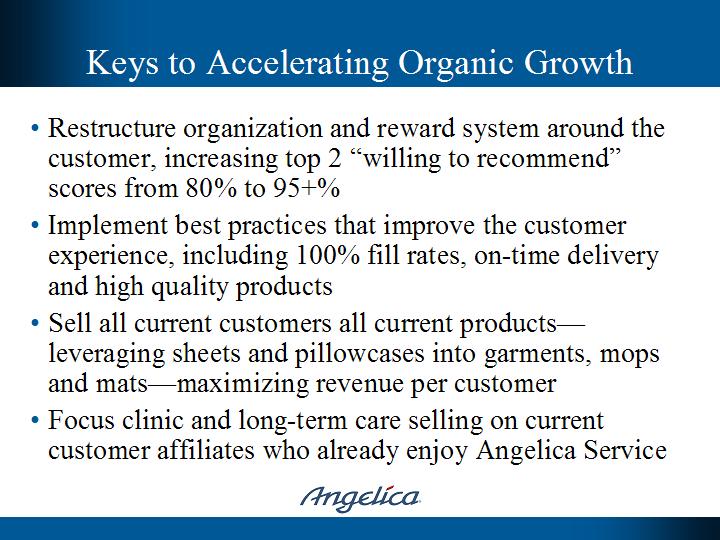
| • | Restructure organization and reward system around the customer, increasing top 2 “willing to recommend” scores from 80% to 95+% | |
| • | Implement best practices that improve the customer experience, including 100% fill rates, on-time delivery and high quality products | |
| • | Sell all current customers all current products—leveraging sheets and pillowcases into garments, mops and mats—maximizing revenue per customer | |
| • | Focus clinic and long-term care selling on current customer affiliates who already enjoy Angelica Service | |
| [Angelica Logo] | |
| |
| | | |
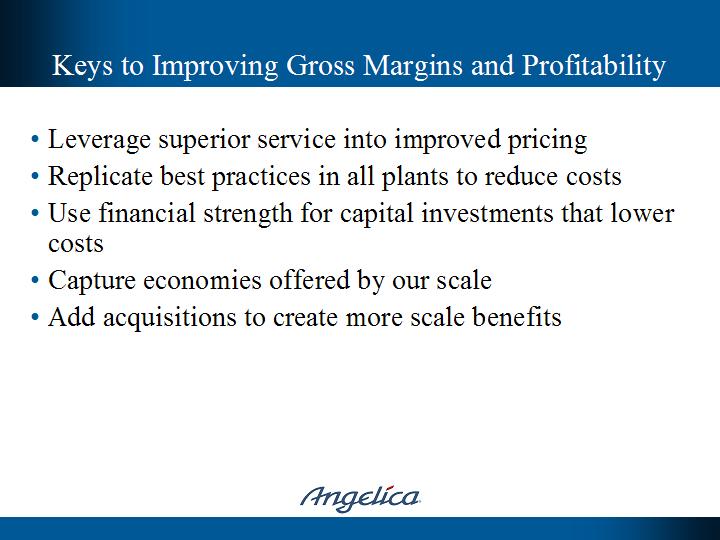
| • | Leverage superior service into improved pricing | |
| • | Replicate best practices in all plants to reduce costs | |
| • | Use financial strength for capital investments that lower costs | |
| • | Capture economies offered by our scale | |
| • | Add acquisitions to create more scale benefits | |
| [Angelica Logo] | |
| |
| | | | |
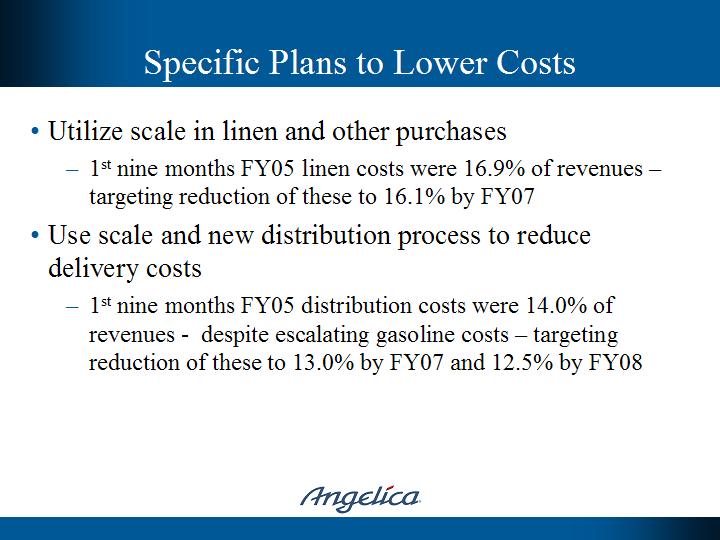
| • | Utilize scale in linen and other purchases | |
| | – | 1st nine months FY05 linen costs were 16.9% of revenues - targeting reduction of these to 16.1% by FY07 | |
| • | Use scale and new distribution process to reduce delivery costs | |
| | – | 1st nine months FY05 distribution costs were 14.0% of revenues - despite escalating gasoline costs - targeting reduction of these to 13.0% by FY07 and 12.5% by FY08 | |
[Angelica Logo] | |
| |
| | | | |
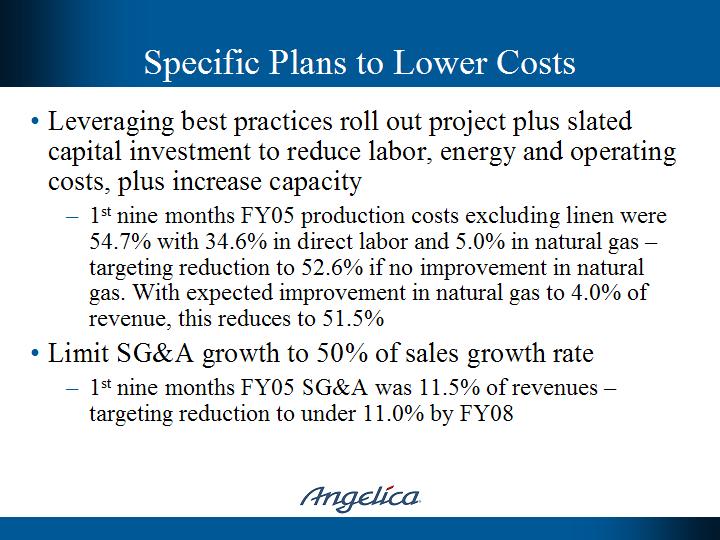
| • | Leveraging best practices roll out project plus slated capital investment to reduce labor, energy and operating costs, plus increase capacity | |
| | – | 1st nine months FY05 production costs excluding linen were 54.7% with 34.6% in direct labor and 5.0% in natural gas - targeting reduction to 52.6% if no improvement in natural gas. With expected improvement in natural gas to 4.0% of revenue, this reduces to 51.5% | |
| • | Limit SG&A growth to 50% of sales growth rate | |
| | – | 1st nine months FY05 SG&A was 11.5% of revenues - targeting reduction to under 11.0% by FY08 | |
[Angelica Logo] | |
| |
| | | |
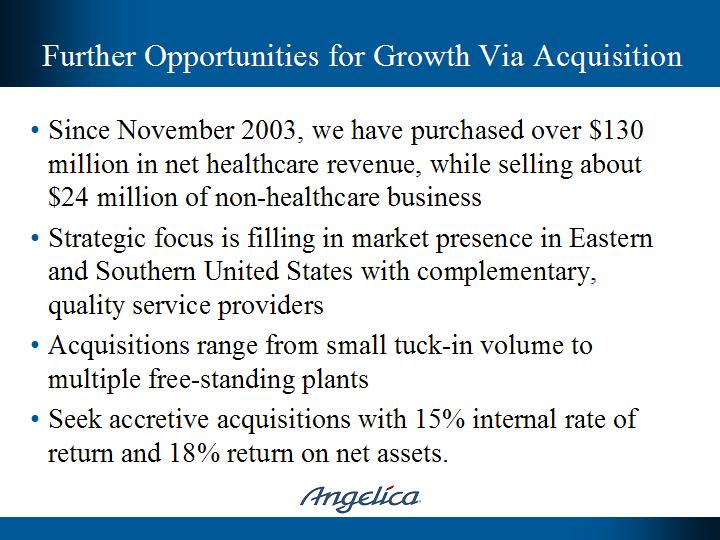
| • | Since November 2003, we have purchased over $130 million in net healthcare revenue, while selling about $24 million of non-healthcare business | |
| • | Strategic focus is filling in market presence in Eastern and Southern United States with complementary, quality service providers | |
| • | Acquisitions range from small tuck-in volume to multiple free-standing plants | |
| • | Seek accretive acquisitions with 15% internal rate of return and 18% return on net assets. | |
| [Angelica Logo] | |
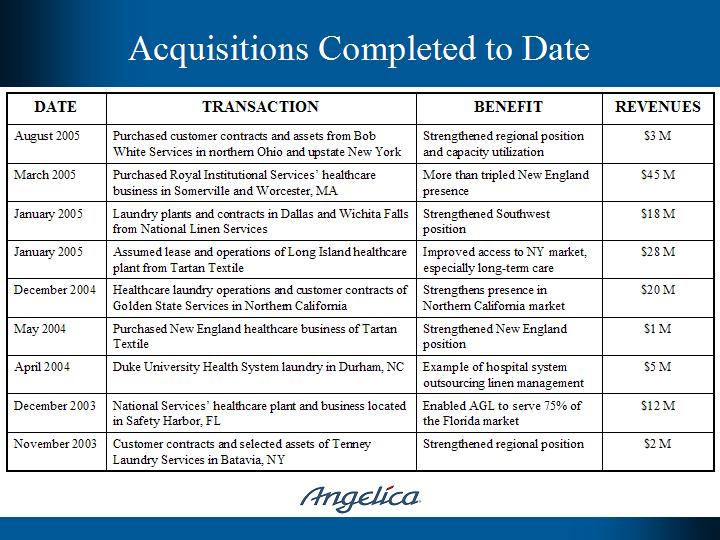
DATE | TRANSACTION | BENEFIT | REVENUES |
| August 2005 | Purchased customer contracts and assets from Bob White Services in northern Ohio and upstate New York | Strengthened regional position and capacity utilization | $3 M |
| March 2005 | Purchased Royal Institutional Services’ healthcare business in Somerville and Worcester, MA | More than tripled New England presence | $45 M |
| January 2005 | Laundry plants and contracts in Dallas and Wichita Falls from National Linen Services | Strengthened Southwest position | $18 M |
| January 2005 | Assumed lease and operations of Long Island healthcare plant from Tartan Textile | Improved access to NY market, especially long-term care | $28 M |
| December 2004 | Healthcare laundry operations and customer contracts of Golden State Services in Northern California | Strengthens presence in Northern California market | $20 M |
| May 2004 | Purchased New England healthcare business of Tartan Textile | Strengthened New England position | $1 M |
| April 2004 | Duke University Health System laundry in Durham, NC | Example of hospital system outsourcing linen management | $5 M |
| December 2003 | National Services’ healthcare plant and business located in Safety Harbor, FL | Enabled AGL to serve 75% of the Florida market | $12 M |
| November 2003 | Customer contracts and selected assets of Tenney Laundry Services in Batavia, NY | Strengthened regional position | $2 M |
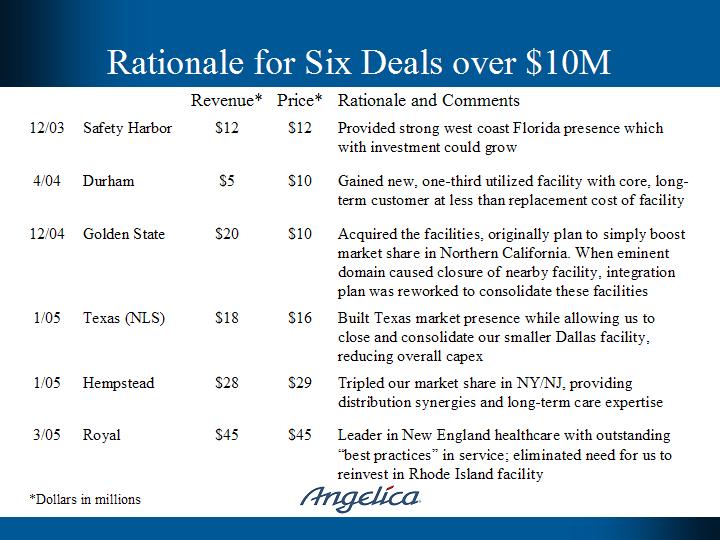
| | | Revenue* | Price* | Rationale and Comments |
| 12/03 | Safety Harbor | $12 | $12 | Provided strong west coast Florida presence which with investment could grow |
| 4/04 | Durham | $5 | $10 | Gained new, one-third utilized facility with core, long-term customer at less than replacement cost of facility |
| 12/04 | Golden State | $20 | $10 | Acquired the facilities, originally plan to simply boost market share in Northern California. When eminent domain caused closure of nearby facility, integration plan was reworked to consolidate these facilities |
| 1/05 | Texas (NLS) | $18 | $16 | Built Texas market presence while allowing us to close and consolidate our smaller Dallas facility, reducing overall capex |
| 1/05 | Hempstead | $28 | $29 | Tripled our market share in NY/NJ, providing distribution synergies and long-term care expertise |
| 3/05 | Royal | $45 | $45 | Leader in New England healthcare with outstanding “best practices” in service; eliminated need for us to reinvest in Rhode Island facility |
*Dollars in millions
[Angelica Logo]
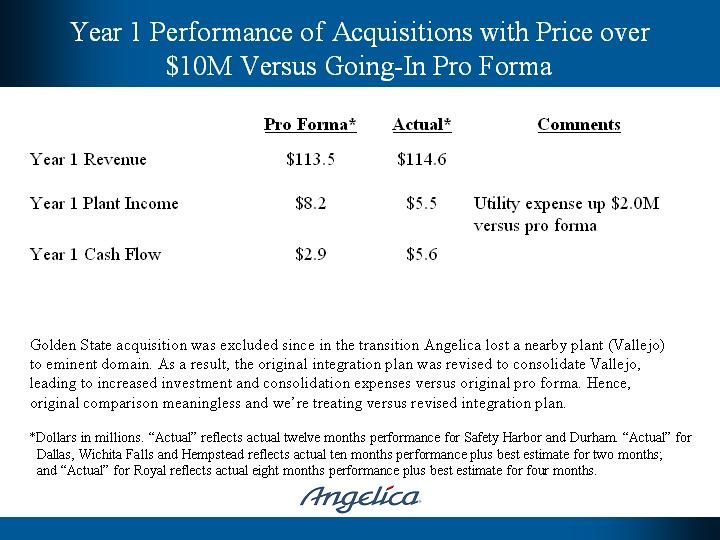
| | Pro Forma* | Actual* | Comments |
| Year 1 Revenue | $113.5 | $114.6 | |
| Year 1 Plant Income | $8.2 | $5.5 | Utility expense up $2.0M versus pro forma |
| Year 1 Cash Flow | $2.9 | $5.6 | |
Golden State acquisition was excluded since in the transition Angelica lost a nearby plant (Vallejo) to eminent domain. As a result, the original integration plan was revised to consolidate Vallejo, leading to increased investment and consolidation expenses versus original pro forma. Hence, original comparison meaningless and we’re treating versus revised integration plan.
*Dollars in millions. “Actual” reflects actual twelve months performance for Safety Harbor and Durham. “Actual” for Dallas, Wichita Falls and Hempstead reflects actual ten months performance plus best estimate for two months; and “Actual” for Royal reflects actual eight months performance plus best estimate for four months.
[Angelica Logo]
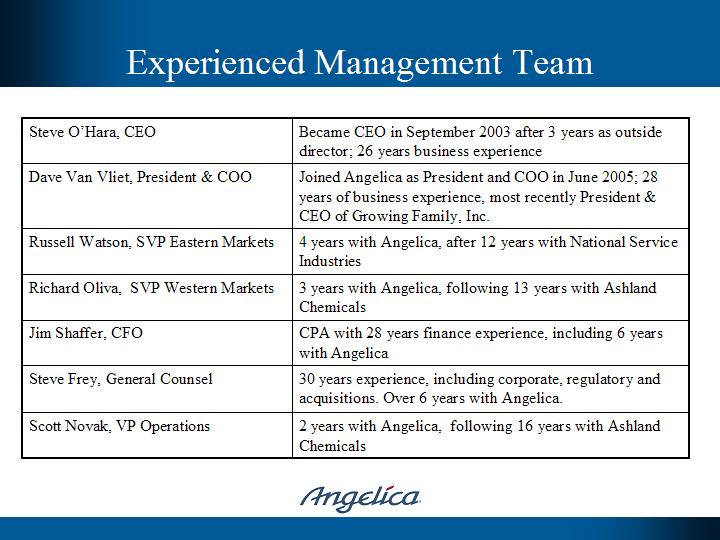
| Steve O’Hara, CEO | Became CEO in September 2003 after 3 years as outside director; 26 years business experience |
| Dave Van Vliet, President & COO | Joined Angelica as President and COO in June 2005; 28 years of business experience, most recently President & CEO of Growing Family, Inc. |
| Russell Watson, SVP Eastern Markets | 4 years with Angelica, after 12 years with National Service Industries |
| Richard Oliva, SVP Western Markets | 3 years with Angelica, following 13 years with Ashland Chemicals |
| Jim Shaffer, CFO | CPA with 28 years finance experience, including 6 years with Angelica |
| Steve Frey, General Counsel | 30 years experience, including corporate, regulatory and acquisitions. Over 6 years with Angelica. |
| Scott Novak, VP Operations | 2 years with Angelica, following 16 years with Ashland Chemicals |
[Angelica Logo]
[Angelica Logo]
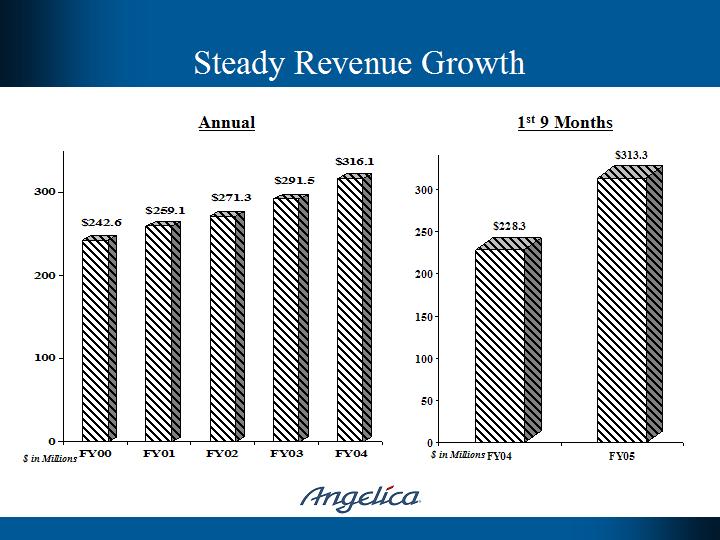
Annual | 1st 9 Months |
| | |
| [Graph] | [Graph] |
| | |
FY00 $242.6 FY01 $259.1 FY02 $271.3 FY03 $291.5 FY04 $316.1 | FY04 $228.3 FY05 $313.3 |
[Angelica Logo]
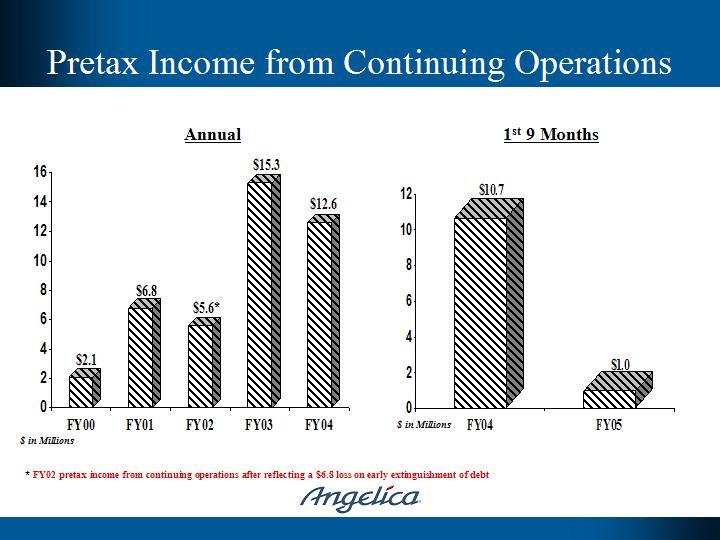
Annual | 1st 9 Months |
| | |
| [Graph] | [Graph] |
| | |
FY00 $ 2.1 FY01 $ 6.8 FY02 $ 5.6* FY03 $15.3 FY04 $12.6 | FY04 $10.7 FY05 $ 1.0 |
* FY02 pretax income from continuing operations after reflecting a $6.8 loss on early extinguishment of debt
[Angelica Logo]
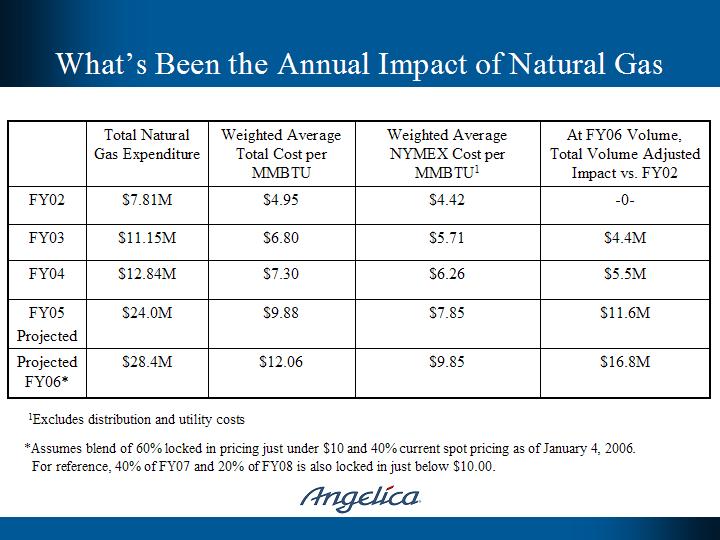
| | Total Natural Gas Expenditure | Weighted Average Total Cost per MMBTU | Weighted Average NYMEX Cost per MMBTU1 | At FY06 Volume, Total Volume Adjusted Impact vs. FY02 |
| FY02 | $7.81M | $4.95 | $4.42 | -0- |
| FY03 | $11.15M | $6.80 | $5.71 | $4.4M |
| FY04 | $12.84M | $7.30 | $6.26 | $5.5M |
FY05 Projected | $24.0M | $9.88 | $7.85 | $11.6M |
Projected FY06* | $28.4M | $12.06 | $9.85 | $16.8M |
1Excludes distribution and utility costs
*Assumes blend of 60% locked in pricing just under $10 and 40% current spot pricing as of January 4, 2006.
For reference, 40% of FY07 and 20% of FY08 is also locked in just below $10.00.
[Angelica Logo]
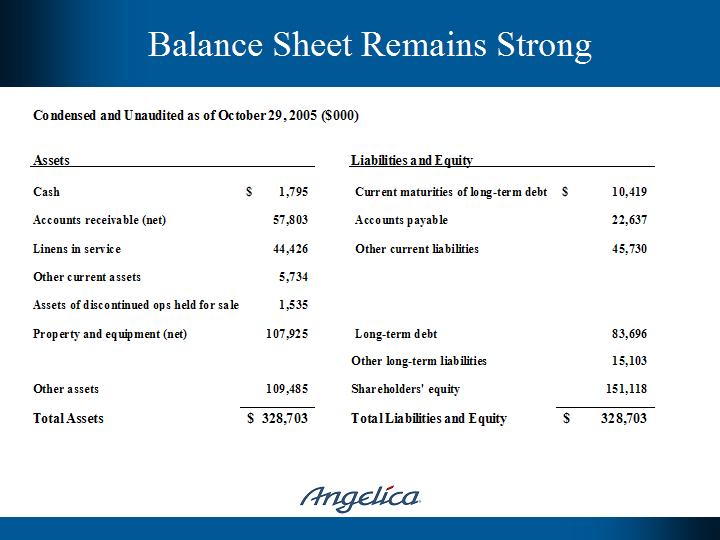
Condensed and Unaudited as of October 29, 2005 ($000) | | | |
| | | | | | | | |
| | | | | | | | |
| | | | | | | | |
Assets | | | | Liabilities and Equity | | | |
| | | | | | | | |
| | | | | | | | |
Cash | | $ | 1,795 | | | Current maturities of long-term debt | | $ | 10,419 | |
| | | | | | | | | | | |
Accounts receivable (net) | | | 57,803 | | | Accounts payable | | | 22,637 | |
| | | | | | | | | | | |
Linens in service | | | 44,426 | | | Other current liabilities | | | 45,730 | |
| | | | | | | | | | | |
Other current assets | | | 5,734 | | | | | | | |
| | | | | | | | | | | |
Assets of discontinued ops held for sale | | | 1,535 | | | | | | | |
| | | | | | | | | | | |
Property and equipment (net) | | | 107,925 | | | Long-term debt | | | 83,696 | |
| | | | | | | | | | | |
| | | | | | | Other long-term liabilities | | | 15,103 | |
| | | | | | | | | | | |
Other assets | | | 109,485 | | | Shareholders' equity | | | 151,118 | |
| | | | | | | | | | | |
Total Assets | | $ | 328,703 | | | Total Liabilities and Equity | | $ | 328,703 | |
[Angelica Logo]
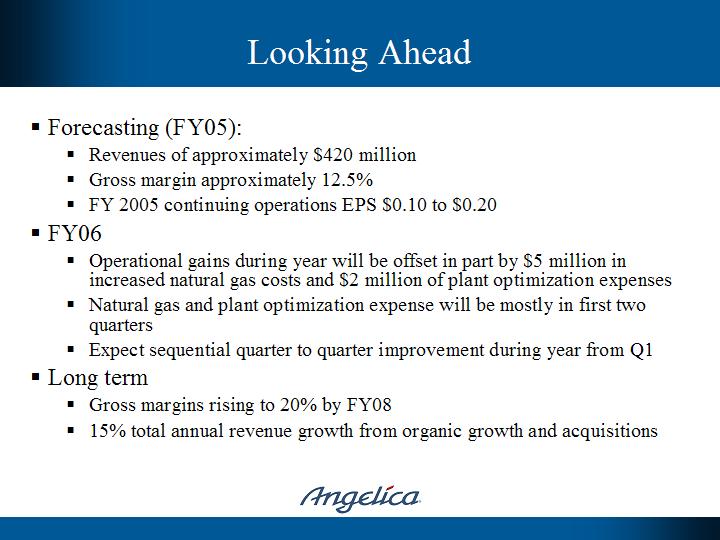
§Forecasting (FY05):
§Revenues of approximately $420 million
§Gross margin approximately 12.5%
§FY 2005 continuing operations EPS $0.10 to $0.20
§FY06
§Operational gains during year will be offset in part by $5 million in increased natural gas costs and $2 million of plant optimization expenses
§Natural gas and plant optimization expense will be mostly in first two quarters
§Expect sequential quarter to quarter improvement during year from Q1
§Long term
§Gross margins rising to 20% by FY08
§15% total annual revenue growth from organic growth and acquisitions
[Angelica Logo]
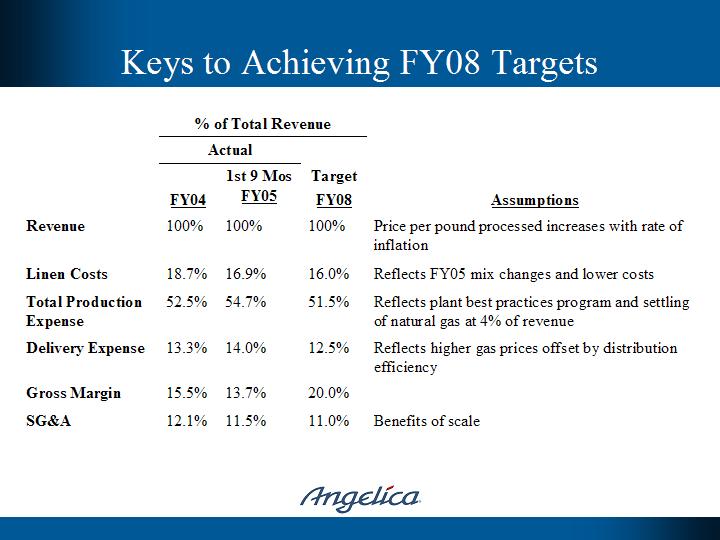
| | % of Total Revenue | |
| | Actual | | |
| | FY04 | 1st 9 Mos FY05 | Target FY08 | Assumptions |
Revenue | 100% | 100% | 100% | Price per pound processed increases with rate of inflation |
Linen Costs | 18.7% | 16.9% | 16.0% | Reflects FY05 mix changes and lower costs |
Total Production Expense | 52.5% | 54.7% | 51.5% | Reflects plant best practices program and settling of natural gas at 4% of revenue |
Delivery Expense | 13.3% | 14.0% | 12.5% | Reflects higher gas prices offset by distribution efficiency |
| 15.5% | 13.7% | 20.0% | |
SG&A | 12.1% | 11.5% | 11.0% | Benefits of scale |
[Angelica Logo]
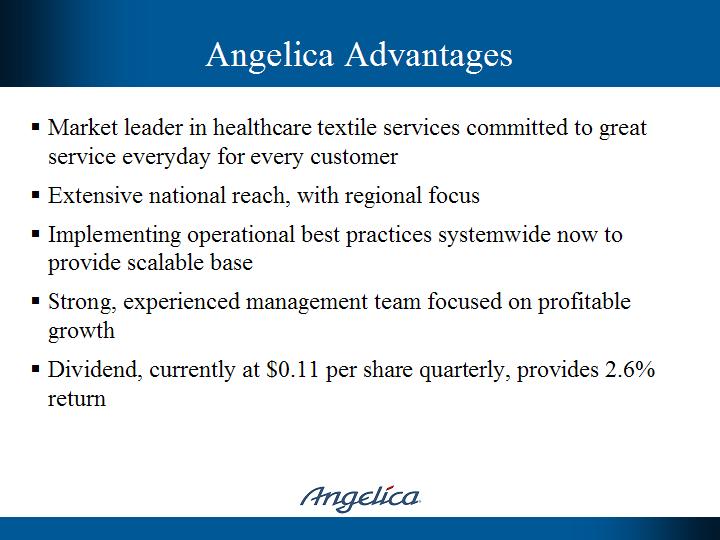
§Market leader in healthcare textile services committed to great service everyday for every customer
§Extensive national reach, with regional focus
§Implementing operational best practices systemwide now to provide scalable base
§Strong, experienced management team focused on profitable growth
§Dividend, currently at $0.11 per share quarterly, provides 2.6% return
[Angelica Logo]
By pursuing its stated initiatives, Angelica will be the leading provider of linen management services
to the U.S. healthcare market with healthcare providers desiring our services due to our quality standards,
passion and creativity, allowing us to reach our goal of delivering
industry-leading growth and exceptional stakeholder value.
[Angelica Logo]
[pictures]
Angelica Corporation
January, 2006