Searchable text section of graphics shown below
To Every Customer Every Day
[picture]
Angelica Corporation
This presentation contains forward-looking statements, which reflect Angelica Corporation’s current views with respect to future events and financial performance and are made pursuant to the Private Securities Litigation Reform Act of 1995. These forward-looking statements involve risks and uncertainties that may cause our actual results to be materially different from those expressed or implied by these statements. A more detailed description of certain factors that could affect actual results include, but are not limited to, those discussed in Angelica Corporation’s filings with the Securities and Exchange Commission.
[Angelica logo]
Vision |
| | |
| • | Delightful Service through Innovation |
| | |
Mission |
| | |
| • | Every healthcare provider desires our superior services based on our high quality standards, passion and creativity. This will deliver industry-leading growth and exceptional stakeholder value. |
| |
Strategies |
| | |
| • | |
| | |
| • | People, Family, Talent, Teams |
| | |
| • | |
| | |
| • | Business Expansion |
| | |
Values |
| | |
| • | Excellence - Establish high standards and routinely surpass them |
| | |
| • | Respect - Care and concern for customers and employees |
| | |
| • | Ethics - Integrity and trust in all we do |
| | |
| • | Teamwork - Work together, celebrate and reward successes |
| | |
| • | Communications - Open, Honest, Always |
[Angelica logo]
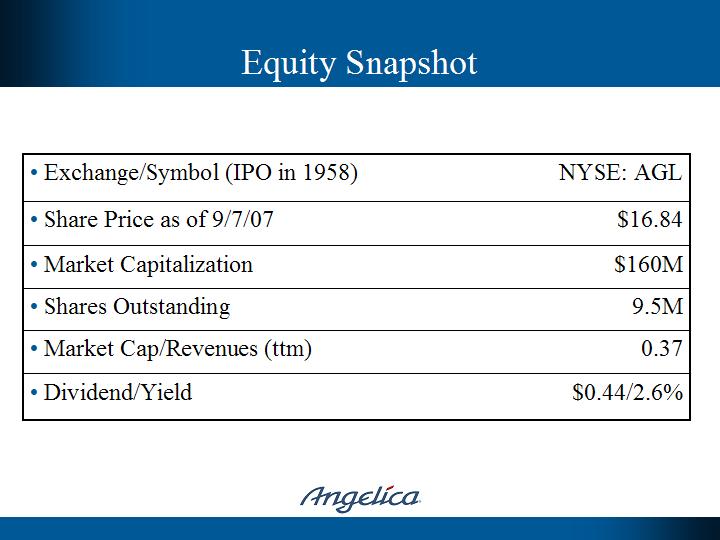
| • Exchange/Symbol (IPO in 1958) | NYSE: AGL |
| • Share Price as of 9/7/07 | $16.84 |
| • Market Capitalization | $160M |
| • Shares Outstanding | 9.5M |
| • Market Cap/Revenues (ttm) | 0.37 |
| • Dividend/Yield | $0.44/2.6% |
[Angelica logo]
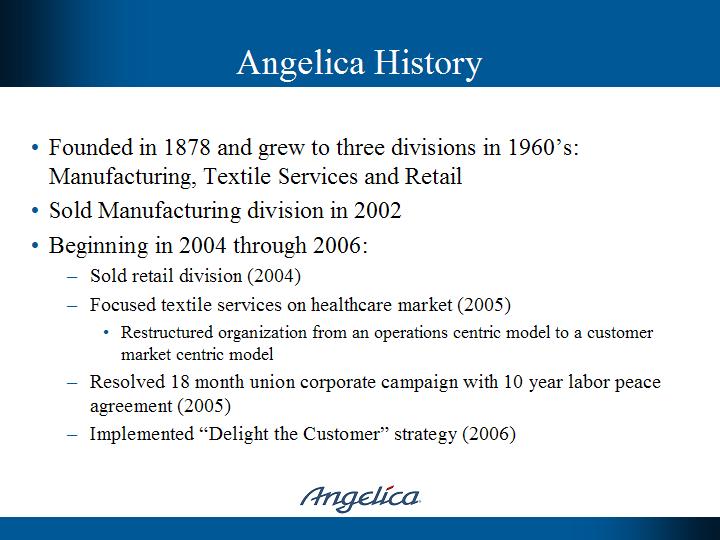
| • | Founded in 1878 and grew to three divisions in 1960’s: Manufacturing, Textile Services and Retail |
| | | |
| • | Sold Manufacturing division in 2002 |
| | | |
| • | Beginning in 2004 through 2006: |
| | | |
| | - | Sold retail division (2004) |
| | | |
| | - | Focused textile services on healthcare market (2005) |
| | | |
| | | • Restructured organization from an operations centric model to a customer market centric model |
| | | |
| | - | Resolved 18 month union corporate campaign with 10 year labor peace agreement (2005) |
| | | |
| | - | Implemented “Delight the Customer” strategy (2006) |
| • | In August, 2007 Board voted to sell or close Edison facility by end of FY07 |
| | | |
| | - | Edison lost $4mm in first half FY07 |
| | | |
| • | Reorganized from 9 to 8 regional markets |
| | | |
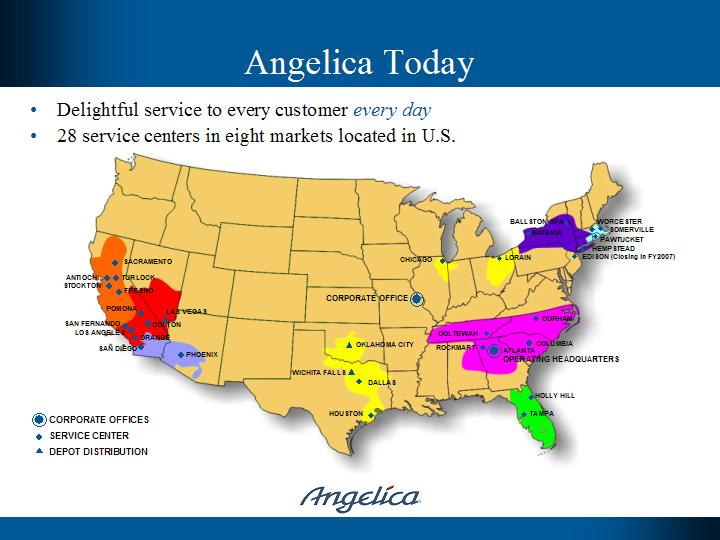
• Delightful service to every customer every day
• 28 service centers in eight markets located in U.S.
[map]
[Angelica logo]
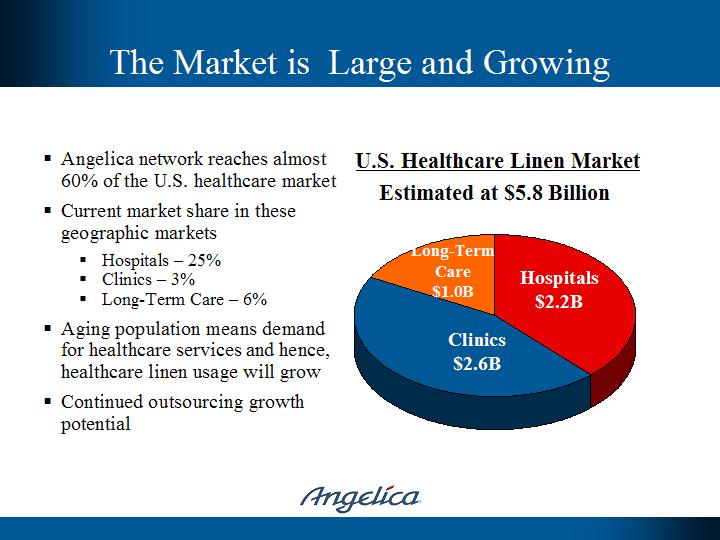
| • | Angelica network reaches almost 60% of the U.S. healthcare market | U.S. Healthcare Linen Market |
| | | |
| • | Current market share in these geographic markets | Estimated at $5.8 Billion |
| | | |
| | • Hospitals - 25% | [pie chart] |
| | • Clinics - 3% | |
| | • Long-Term Care - 6% | Long-Term Care $1.0B |
| | | |
| • | Aging population means demand for healthcare services and hence, healthcare linen usage will grow | Hospitals $2.2B Clinics $2.6B |
| • | Continued outsourcing growth potential | |
[Angelica logo]
Acute Care Markets in which AGL Participates | Untapped Acute Care |
| | Markets in which AGL does not Participate |
| | |
[pie chart] | [pie chart] |
| 31% still done by | Coops 7% |
| |
| | On-Premise Laundries 34% |
| Coops 9% | |
| | Competitors 59% |
| On-Premise Laundries 22% | |
| | 41% still done by |
| Angelica 25% | |
| | |
| Competitors 44% | |
| | |
[Angelica logo]
| • | With less than 10% share of the total healthcare market, Angelica leads a fragmented $5.8 billion market |
| | |
| • | Only two national hospital competitors (Crothall Services, a Compass division, and Sodexho Laundry Services) |
| | |
| • | Approximately 10 mid-size regional hospital providers |
| | |
| • | In clinics, small and regional players dominate, but some national competition (Aramark and Alsco) |
| | |
| • | In long-term care, Health Care Services Group is an indirect national competitor as most do own laundry |
[Angelica logo]
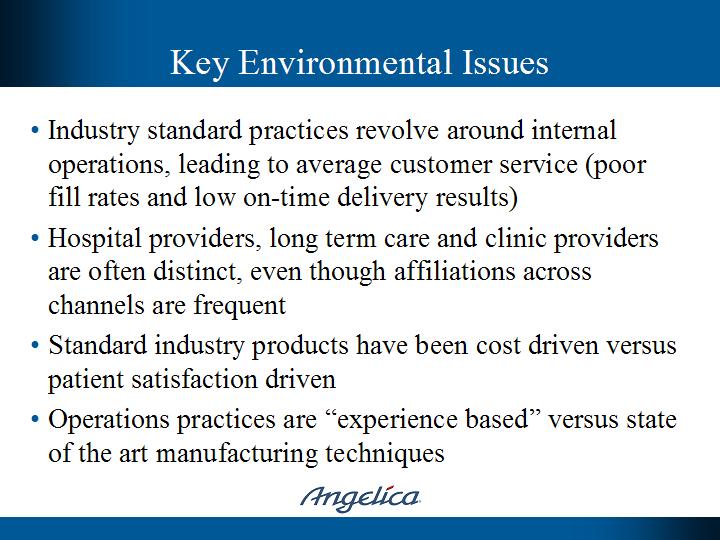
| • | Industry standard practices revolve around internal operations, leading to average customer service (poor fill rates and low on-time delivery results) |
| | |
| • | Hospital providers, long term care and clinic providers are often distinct, even though affiliations across channels are frequent |
| | |
| • | Standard industry products have been cost driven versus patient satisfaction driven |
| | |
| • | Operations practices are “experience based” versus state of the art manufacturing techniques |
[Angelica logo]
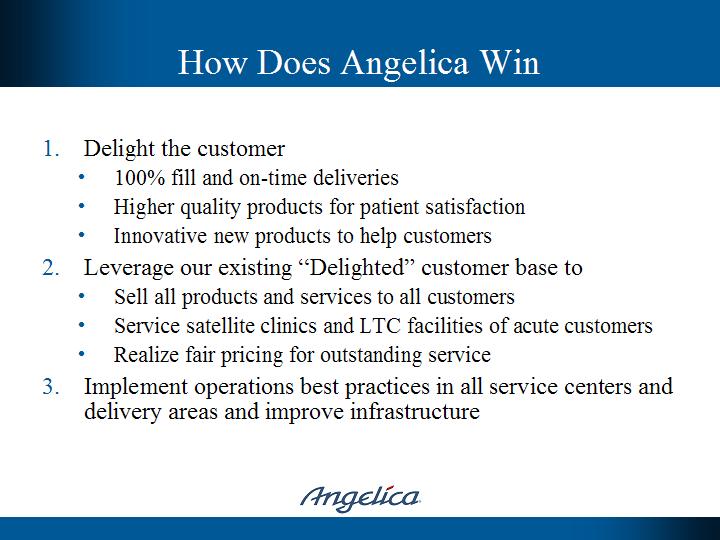
| 1. | Delight the customer |
| | | |
| | • | 100% fill and on-time deliveries |
| | | |
| | • | Higher quality products for patient satisfaction |
| | | |
| | • | Innovative new products to help customers |
| | | |
| 2. | Leverage our existing “Delighted” customer base to |
| | | |
| | • | Sell all products and services to all customers |
| | | |
| | • | Service satellite clinics and LTC facilities of acute customers |
| | | |
| | • | Realize fair pricing for outstanding service |
| | | |
| 3. | Implement operations best practices in all service centers and delivery areas and improve infrastructure |
| | | |
| | | |
[Angelica logo]
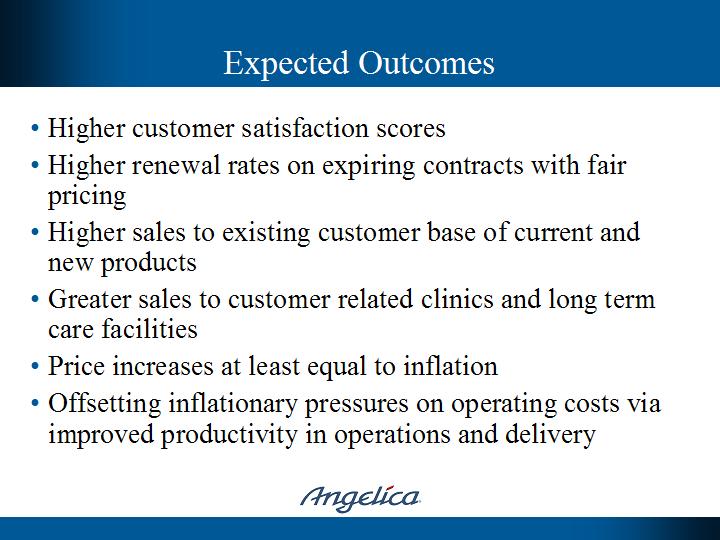
| • | Higher customer satisfaction scores |
| | |
| • | Higher renewal rates on expiring contracts with fair pricing |
| | |
| • | Higher sales to existing customer base of current and new products |
| | |
| • | Greater sales to customer related clinics and long term care facilities |
| | |
| • | Price increases at least equal to inflation |
| | |
| • | Offsetting inflationary pressures on operating costs via improved productivity in operations and delivery |
[Angelica logo]
| • | Organic growth rate increasing to 7% to 10% |
| | |
| • | Gross margin growing to 20% of revenues |
| | |
[Angelica logo]
| | HISTORICAL RESULTS* | 1st HALF FY07 | |
| | FY03 | FY04 | FY05 | FY06 | Total | w/o Edison | Goal | COMMENTS |
| | | | | | | | | | |
| Revenues | 100% | 100% | 100% | 100% | 100% | 100% | 100 | % | Assumes 3% annual price gains |
| | | | | | | | | | |
| All Merchandise Costs | 19.4% | 19.3% | 17.7% | 17.0% | 18.6% | 18.4% | 17.0 | % | Direct sourcing savings |
| | | | | | | | | | |
| Utilities | 7.3% | 8.4% | 9.8% | 9.8% | 9.9% | 9.7% | 8.4 | % | Adjusting to current energy costs |
| | | | | | | | | | |
| A/O Production Expense | 41.0% | 43.0% | 45.5% | 44.9% | 43.4% | 41.9% | 40.4 | % | Gains from FY06 Best Practices Project offset wage inflation |
| | | | | | | | | | |
| Delivery Expense | 13.3% | 13.4% | 14.1% | 13.7% | 15.1% | 14.8% | 14.2 | % | Impact of GPS and Distribution Software |
| | | | | | | | | | |
| Gross Margin | 19.0% | 15.8% | 12.9% | 14.5% | 13.1% | 15.2% | 20.0 | % | |
| | | | | | | | | | |
| SG&A | 13.9% | 12.2% | 12.0% | 12.1% | 12.6% | 12.8% | 11.0 | % | Projected needs at volume levels |
* Discontinued operations removed from historical results. In FY07 some in-hospital line management expense, representing approximately 1.0% of revenue, have been reclassed from A/O Production Expense to Delivery Expense.
[Angelica logo]
| 1. | Get Edison sale or closure behind us |
| | |
| 2. | Improved sourcing offsets higher quality linen costs and stabilizes inventory levels at 100% fill requirements |
| | |
| Natural gas remains relatively stable at today's levels |
| | |
| 4. | Continued productivity gains from capital investments and process improvement initiative |
| | |
| 5. | Realize promised delivery benefit from GPS of route optimization software |
| | |
[Angelica logo]
(See 10-K for complete list of risks)
| | Risks | | | Opportunities |
| | | | | |
| • | Can’t realize inflationary price increases despite delightful service | | • | Delightful service permits sale of higher priced, higher margin products and higher customer retention rates |
| | | | | |
| • | Natural gas remains above 5% of revenues vs. historic high of 4% | | • | Higher quality products increase useful life of linen |
| | | | | |
| • | Industry-wide wage pressures aren’t adequately offset via productivity gains | | • | Potential for additional savings via more direct sourcing |
| | | | | |
| • | Escalating fuel and driver wages lessen savings from GPS and distribution software | | • | Greater productivity gains allow A/O production expense to return to FY03 levels |
| | | | | |
| | | | • | Efficiency and scale help drive SG&A below 11% of revenue |
[Angelica logo]
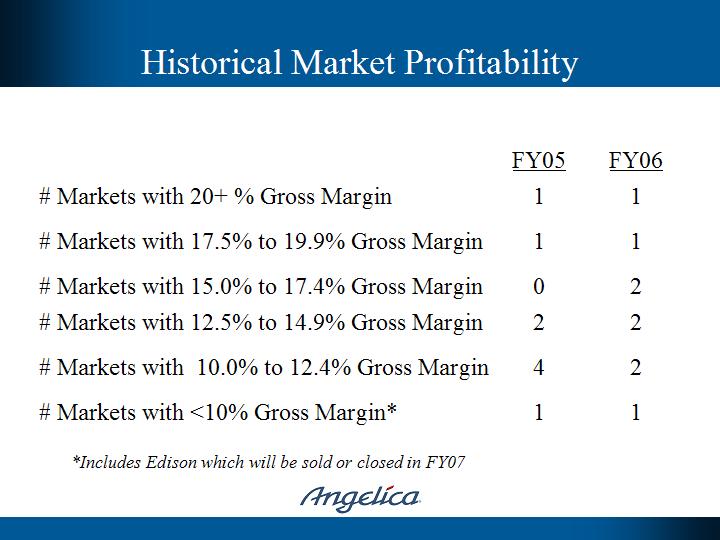
| | FY05 | |
| # Markets with 20+ % Gross Margin | 1 | 1 |
| | | |
| # Markets with 17.5% to 19.9% Gross Margin | 1 | 1 |
| | | |
| # Markets with 15.0% to 17.4% Gross Margin | 0 | 2 |
| | | |
| # Markets with 12.5% to 14.9% Gross Margin | 2 | 2 |
| | | |
| # Markets with 10.0% to 12.4% Gross Margin | 4 | 2 |
| | | |
| # Markets with <10% Gross Margin* | 1 | 1 |
*Includes Edison which will be sold or closed in FY07
[Angelica logo]
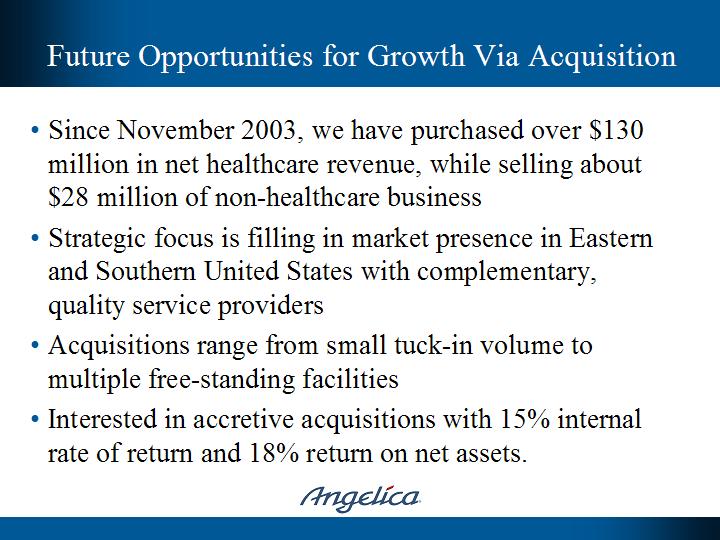
| • | Since November 2003, we have purchased over $130 million in net healthcare revenue, while selling about $28 million of non-healthcare business |
| | |
| • | Strategic focus is filling in market presence in Eastern and Southern United States with complementary, quality service providers |
| | |
| • | Acquisitions range from small tuck-in volume to multiple free-standing facilities |
| | |
| • | Interested in accretive acquisitions with 15% internal rate of return and 18% return on net assets. |
[Angelica logo]
| Steve O’Hara, Chairman, President & CEO | Became President & CEO in September 2003 after 3 years as outside director; added Chairman role in February 2006; 26 years business experience |
Jack Olbrych, SVP and Chief Administrative Officer | Joined Angelica in December 2006, previously CEO of Carrus Publishing and held various senior management positions in the aviation industry. |
Russell Watson, SVP Strategy, Marketing and Sales Administration | 6 years with Angelica, after 12 years with National Service Industries |
| Richard Oliva, SVP Sales and Services | 5 years with Angelica, following 13 years with Ashland Chemicals |
| Mel Davis, Vice President Operations | Joined Angelica in November 2005. 18 years experience in supply chain management and operations. |
| Steve Frey, General Counsel | 30 years experience, including corporate, regulatory and acquisitions. Over 8 years with Angelica. |
| Jim Shaffer, Chief Financial Officer | CPA with 30 years finance experience, including 8 years with Angelica. |
[Angelica logo]
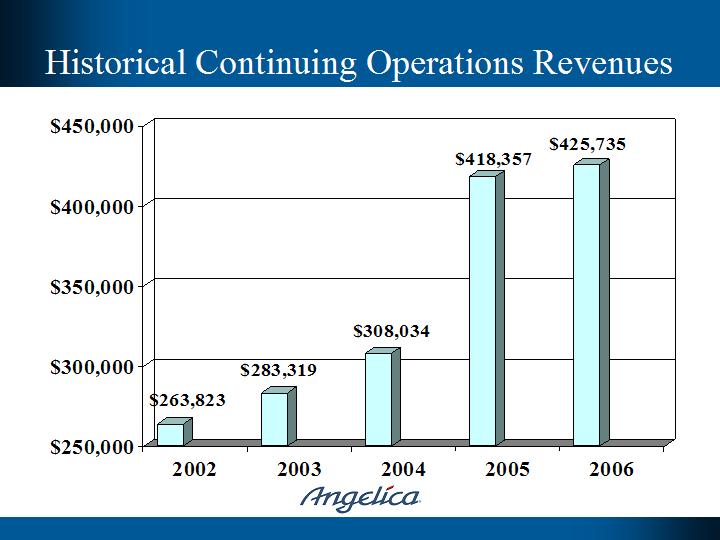
[bar graph]
2002 | 2003 | 2004 | 2005 | 2006 |
$263,823 | $283,319 | $308,034 | $418,357 | $425,735 |
[Angelica logo]
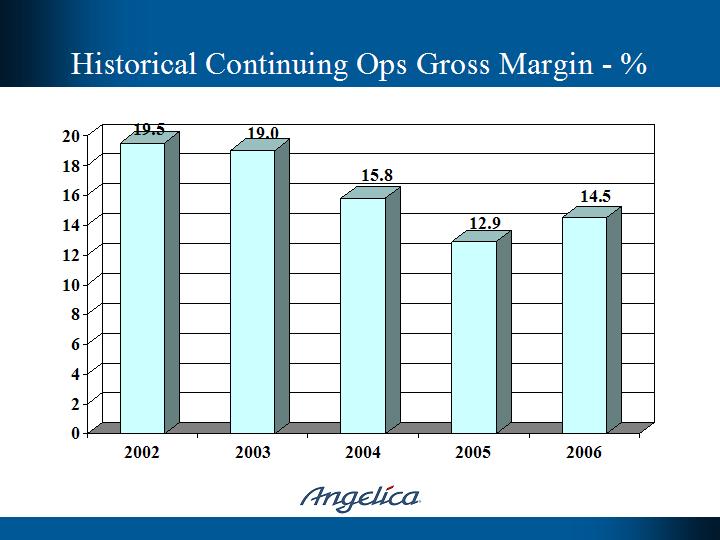
[bar graph]
2002 | 2003 | 2004 | 2005 | 2006 |
19.5 | 19.0 | 15.8 | 12.9 | 14.5 |
[Angelica logo]
Total | Total Minus Edison |
Revenues | Gross Margin % | Revenues | Gross Margin % |
FY06 | FY07 | FY06 | FY07 | FY06 | FY07 | FY06 | FY07 |
212.3 | 215.4 | 14.1% | 13.1% | 205.6 | 208.1 | 14.9% | 15.2% |
$MM | % | $MM | % |
[Angelica logo]
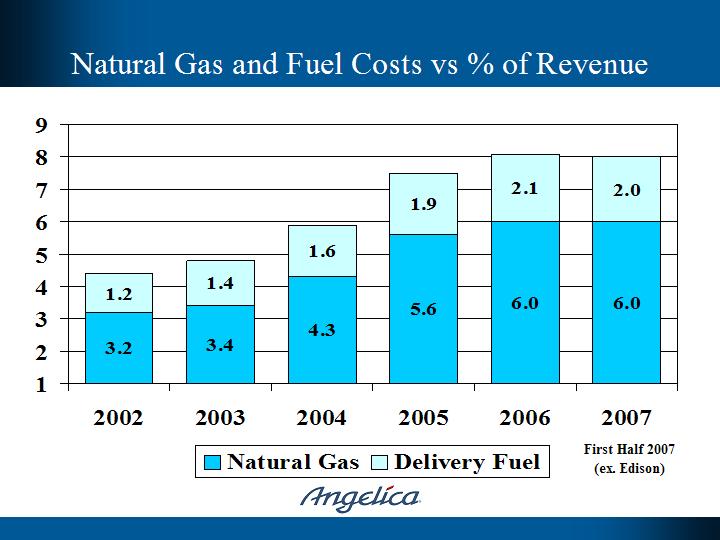
[bar graph]
| | 2002 | 2003 | 2004 | 2005 | 2006 | 2007 |
Natural Gas | 3.2 | 3.4 | 4.3 | 5.6 | 6.0 | 6.0 |
| Delivery Fuel | 1.2 | 1.4 | 1.6 | 1.9 | 2.1 | 2.0 |
| | | | | | | First Half 2007 (ex. Edison) |
[Angelica logo]
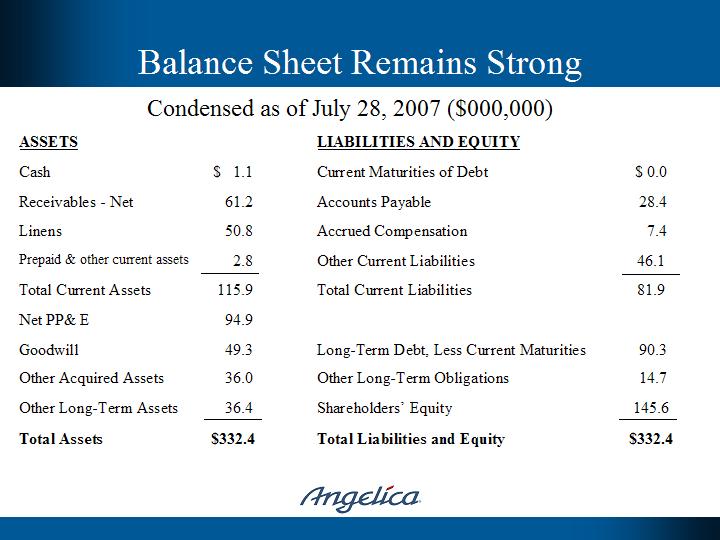
Condensed as of July 28, 2007 ($000,000)
ASSETS | | | LIABILITIES AND EQUITY | |
| | | | | |
| Cash | $ 1.1 | | Current Maturities of Debt | $ 0.0 |
| | | | | |
| Receivables - Net | 61.2 | | Accounts Payable | 28.4 |
| | | | | |
| Linens | 50.8 | | Accrued Compensation | 7.4 |
| | | | | |
| Prepaid & other current assets | 2.8 | | Other Current Liabilities | 46.1 |
| | | | | |
| Total Current Assets | 115.9 | | Total Current Liabilities | 81.9 |
| | | | | |
| Net PP& E | 94.9 | | | |
| | | | | |
| Goodwill | 49.3 | | Long-Term Debt, Less Current Maturities | 90.3 |
| | | | | |
| Other Acquired Assets | 36.0 | | Other Long-Term Obligations | 14.7 |
| | | | | |
| Other Long-Term Assets | 36.4 | | Shareholders’ Equity | 145.6 |
| | | | | |
Total Assets | $332.4 | | Total Liabilities and Equity | $332.4 |
[Angelica logo]
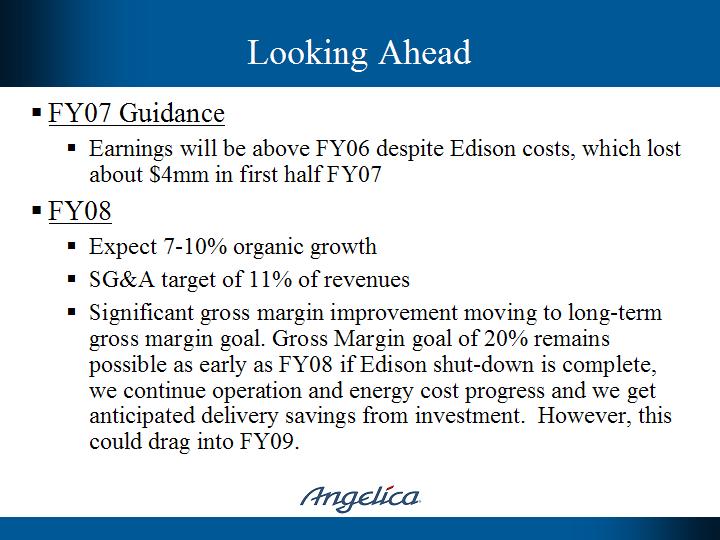
• FY07 Guidance |
| | |
| • | Earnings will be above FY06 despite Edison costs, which lost about $4mm in first half FY07 |
| | |
| • FY08 |
| | |
| • | Expect 7-10% organic growth |
| | |
| • | SG&A target of 11% of revenues |
| | |
| • | Significant gross margin improvement moving to long-term gross margin goal. Gross Margin goal of 20% remains possible as early as FY08 if Edison shut-down is complete, we continue operation and energy cost progress and we get anticipated delivery savings from investment. However, this could drag into FY09. |
[Angelica logo]
| • | Market leader in healthcare textile services committed to great service every day for every customer |
| | |
| • | Extensive national reach, with regional focus |
| | |
| • | Implementing operational best practices systemwide to provide scalable base |
| | |
| • | Strong, experienced management team focused on profitable growth |
| | |
| • | Dividend, currently at $0.11 per share quarterly, provides 2.6% return |
[Angelica logo]
By pursuing its stated initiatives, Angelica will
be the leading provider of linen management
services to the U.S. healthcare market with
healthcare providers desiring our services due
to our quality standards, passion and
creativity, allowing us to reach our goal of
delivering industry-leading growth and
exceptional stakeholder value.
[Angelica logo]
To Every Customer Every Day
[picture]
Angelica Corporation