


Appendices: Reg G Reconciliatons
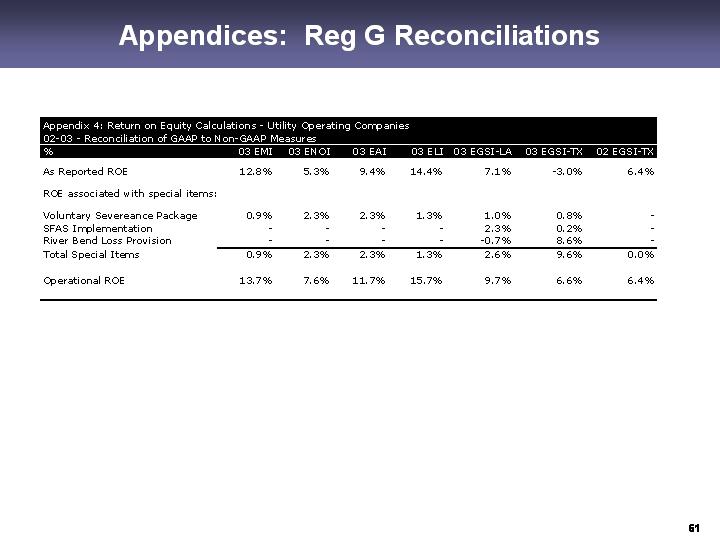
Appendix 1: Earnings | ||||||||
1999-2004 Guidance - Reconciliation of GAAP vs. Non-GAAP Measures | Guidance | |||||||
($/share) | 1999 | 2000 | 2001 | 2002 | 2003 | TTM 3Q04 | 2004 | |
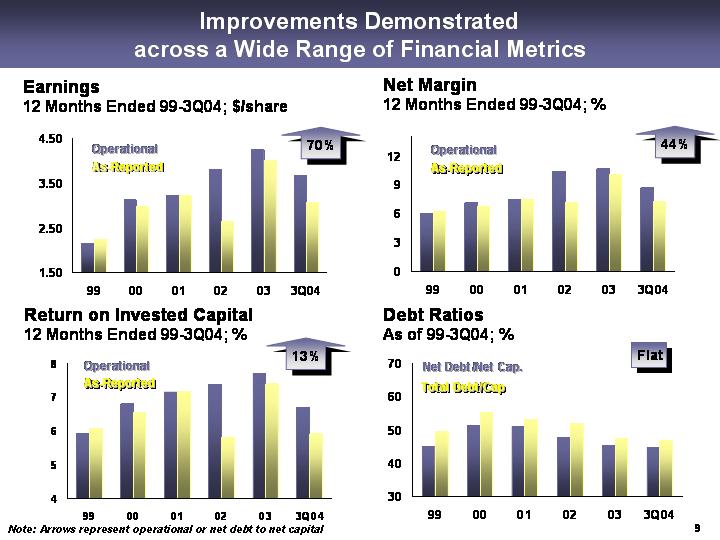
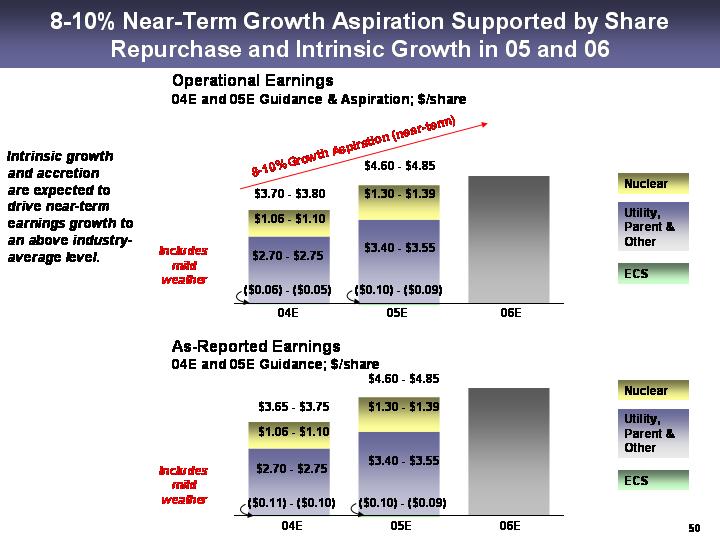
AS-REPORTED EARNINGS - CONSOLIDATED | (A) | 2.25 | 2.97 | 3.23 | 2.64 | 4.01 | 3.07 | 3.65 - 3.75 |
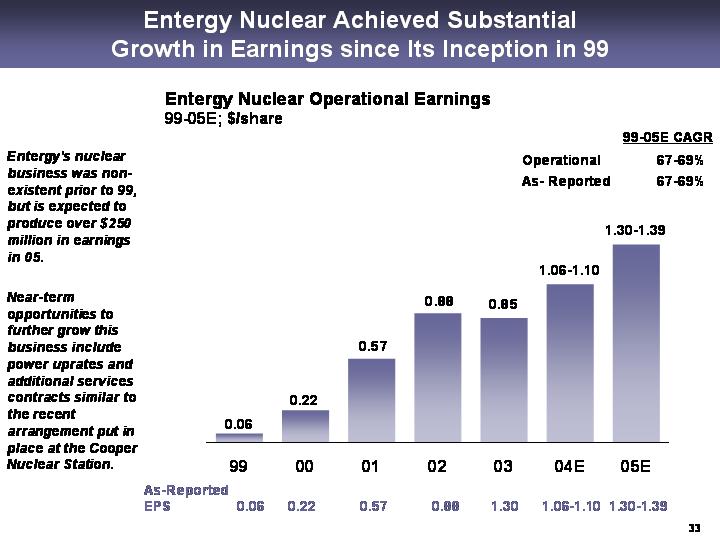
AS-REPORTED EARNINGS - NUCLEAR | (B) | 0.06 | 0.22 | 0.57 | 0.88 | 1.30 | 0.83 | 1.06 - 1.10 |
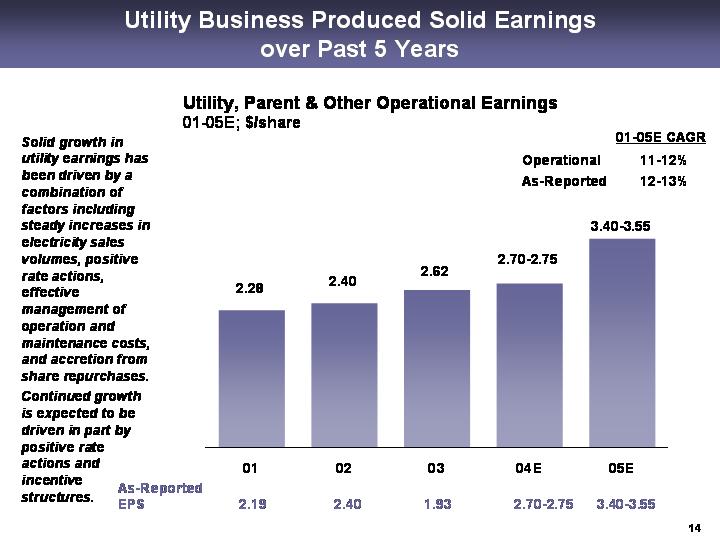
AS-REPORTED EARNINGS - UTILITY, PARENT & OTHER | (C) | 1.89 | 2.51 | 2.19 | 2.40 | 1.93 | 2.31 | 2.70 - 2.75 |
UTILITY SPECIAL ITEMS | ||||||||
River Bend loss provision | - | - | - | - | (0.29) | - | - | |
SFAS 143 implementation | - | - | - | - | (0.09) | - | - | |
Voluntary severance plan | - | - | - | - | (0.30) | (0.30) | - | |
Merger expenses | - | - | (0.01) | - | - | - | - | |
Regulatory and reserve adjustments | (0.27) | (0.09) | - | - | - | - | - | |
Change in unbilled revenue estimate | 0.13 | - | - | - | - | - | - | |
Depreciation adjustment | 0.04 | - | - | - | - | - | - | |
SERI refund adjustments | (0.08) | - | - | - | - | - | - | |
Total Utility Special Items | (D) | (0.18) | (0.09) | (0.01) | - | (0.68) | (0.30) | - |
PARENT & OTHER SPECIAL ITEMS | ||||||||
Voluntary severance plan | - | - | - | - | (0.01) | - | - | |
Merger expenses | - | - | (0.05) | - | - | - | - | |
Write-down of MyHomeKey investment | - | - | (0.03) | - | - | - | - | |
Write-down of Latin American assets | - | (0.12) | - | - | - | - | - | |
Total Parent & Other Special Items | (E) | - | (0.12) | (0.08) | - | (0.01) | - | - |
COMPETITIVE BUSINESS SPECIAL ITEMS | ||||||||
Entergy Nuclear | ||||||||
SFAS 143 implementation | - | - | - | - | 0.67 | (0.03) | - | |
Voluntary severance plan | - | - | - | - | (0.22) | (0.22) | - | |
Total Nuclear Special Items | (F) | - | - | - | - | 0.45 | (0.25) | - |
Energy Commodity Services | - | - | - | - | - | - | - | |
Gain (loss) on disposition of assets | 0.27 | 0.06 | 0.01 | 0.23 | - | - | - | |
Asset and contract impairments | - | - | - | (0.62) | - | - | - | |
Turbine commitment | - | - | - | (0.52) | - | - | - | |
Development costs | - | - | - | (0.09) | - | - | - | |
Restructuring costs | - | - | (0.02) | (0.17) | - | - | - | |
Damhead Creek mark to market gas contract | - | - | 0.10 | - | - | - | - | |
Write-off of start-up costs per new acct standard | (0.01) | - | - | - | - | - | - | |
Earnings from Entergy-Koch Trading | - | - | - | - | - | (0.14) | (0.14) | |
Earnings from Gulf South Pipeline | 0.07 | 0.07 | ||||||
Non-nuclear wholesale assets - adjustment to sales reserves | 0.02 | 0.02 | ||||||
Total Competitive Business Special Items | 0.26 | 0.06 | 0.09 | (1.17) | 0.45 | (0.05) | (0.05) | |
TOTAL SPECIAL ITEMS | (G) | 0.08 | (0.15) | - | (1.17) | (0.24) | (0.60) | (0.05) |
OPERATIONAL EARNINGS - CONSOLIDATED | (A-G) | 2.17 | 3.12 | 3.23 | 3.81 | 4.25 | 3.67 | 3.70 - 3.80 |
OPERATIONAL EARNINGS - NUCLEAR | (B-F) | 0.06 | 0.22 | 0.57 | 0.88 | 0.85 | 1.08 | 1.06 - 1.10 |
OPERATIONAL EARNINGS - UTILITY, PARENT & OTHER | (C-D-E) | 2.07 | 2.72 | 2.28 | 2.40 | 2.62 | 2.61 | 2.70 - 2.75 |
Appendices: Reg G Reconciliatons
Appendix 2: Earnings | ||||||
1999-2004 - Reconciliation of GAAP vs. Non-GAAP Measures | ||||||
($ millions) | 1999 | 2000 | 2001 | 2002 | 2003 | TTM 3Q04 |
AS-REPORTED EARNINGS (A) | 552 | 679 | 726 | 599 | 927 | 715 |
Preferred Dividends | 43 | 32 | 24 | 24 | 24 | 23 |
Tax Effected Interest Expense | 338 | 332 | 440 | 353 | 332 | 292 |
AS-REPORTED EARNINGS (including preferred dividends & tax effected | 933 | 1042 | 1191 | 976 | 1262 | 1031 |
UTILITY SPECIAL ITEMS | ||||||
River Bend loss provision | - | - | - | - | -66 | |
SFAS 143 implementation | - | - | - | - | -21 | |
Voluntary severance plan | - | - | - | - | -70 | -70 |
Merger expenses | - | - | -2 | - | - | |
Regulatory and reserve adjustments | -65 | -22 | - | - | - | |
Change in unbilled revenue estimate | 32 | - | - | - | - | |
Depreciation adjustment | 11 | - | - | - | - | |
SERI refund adjustments | -20 | - | - | - | - | |
Total Utility Special Items (C) | -42 | -22 | -2 | - | -157 | -70 |
PARENT & OTHER SPECIAL ITEMS | ||||||
Voluntary severance plan | - | - | - | - | -1 | - |
Merger expenses | - | - | -12 | - | - | - |
Write-down of MyHomeKey investment | - | - | -7 | - | - | - |
Write-down of Latin American assets | - | -28 | - | - | - | - |
Total Parent & Other Special Items | - | -28 | -19 | - | -1 | - |
COMPETITIVE BUSINESS SPECIAL ITEMS | ||||||
Entergy Nuclear | ||||||
SFAS 143 implementation | - | - | - | - | 154 | -6 |
Voluntary severance plan | - | - | - | - | -52 | -52 |
Energy Commodity Services | - | - | - | - | - | - |
Gain (loss) on disposition of assets | 68 | 13 | 1 | 52 | 1 | - |
Asset and contract impairments | - | - | - | -142 | - | - |
Turbine commitment | - | - | - | -117 | - | - |
Development costs | - | - | - | -21 | - | - |
Restructuring costs | - | - | -4 | -39 | - | - |
Damhead Creek mark to market gas contract | - | - | 24 | - | - | - |
Write-off of start-up costs per new acct standard | -3 | - | - | - | - | - |
Earnings from Entergy-Koch Trading | -32 | |||||
Earnings from Gulf South Pipeline | 15 | |||||
Non-nuclear wholesale assets - adjustment to sales reserves | 6 | |||||
Total Competitive Business Special Items | 65 | 13 | 21 | -267 | 103 | -69 |
TOTAL SPECIAL ITEMS (D) | 23 | -36 | 1 | -267 | -55 | -139 |
OPERATIONAL EARNINGS (A-D) | 530 | 715 | 726 | 866 | 982 | 854 |
Appendices: Reg G Reconciliatons
Appendix 3: Return Metrics and Net Margin (refer to Appendix 2 for A-D statistics) | ||||||
1999-2004 - Reconciliation of GAAP vs. Non-GAAP Measures | ||||||
($ millions) | 1999 | 2000 | 2001 | 2002 | 2003 | TTM 3Q04 |
OPERATIONAL EARNINGS (including preferred dividends & tax effected interest | 910 | 1,078 | 1,190 | 1,243 | 1,317 | 1,170 |
AVERAGE INVESTED CAPITAL (E) | 15,364 | 15,883 | 16,640 | 16,862 | 17,114 | 17,462 |
AS-REPORTED ROIC (B)/E | 6.1% | 6.6% | 7.2% | 5.8% | 7.4% | 5.9% |
OPERATIONAL ROIC (B-D)/E | 5.9% | 6.8% | 7.2% | 7.4% | 7.7% | 6.7% |
OPERATING REVENUES (F) | 8,766 | 10,022 | 9,621 | 8,305 | 9,195 | 9,803 |
AS-REPORTED NET MARGIN (A/F) | 6.3% | 6.8% | 7.5% | 7.2% | 10.1% | 7.3% |
OPERATIONAL NET MARGIN (A-D/F) | 6.0% | 7.1% | 7.5% | 10.4% | 10.7% | 8.7% |
UTILITY AS-REPORTED EARNINGS (G) | 511 | 587 | 550 | 583 | 469 | |
UTILITY OPERATIONAL EARNINGS (G-C) | 553 | 609 | 552 | 583 | 626 | |
UTILITY - AVERAGE SHAREHOLDER'S EQUITY (excluding preferred stock without | 5,168 | 5,299 | 5,490 | 5,470 | 5,422 | |
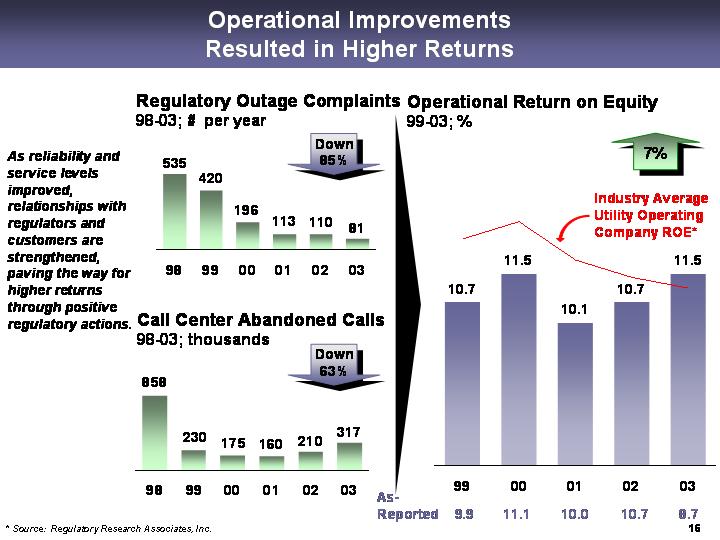
UTILITY AS-REPORTED ROE (G)/H | 9.9% | 11.1% | 10.0% | 10.7% | 8.7% | |
UTILITY OPERATIONAL ROE (G-C)/H | 10.7% | 11.5% | 10.1% | 10.7% | 11.5% | |