EXHIBIT 99.2
Millipore Conference Call, January 27, 2005
Fourth Quarter and Year-End Results
Forward-looking statements/risk factors
In order to take advantage of the safe harbor provisions of the private securities litigation reform act of 1995, you should understand that we will be making forward-looking statements in this conference. These statements involve a number of risks and uncertainties, all of which are set forth in detail in our annual report on form 10-K, subsequent quarterly reports on form 10-Q, and our other SEC filings. We assume no obligation to update any forward-looking statement based on new information, future events or any other reason.
2
Regulation G: Use of non-GAAP financial measures
In addition to analyzing U.S. GAAP financial results, management also analyzes “non-GAAP” and “pro forma” financial measures as we believe these measures may allow for a better understanding of the underlying business trends.
“Constant currency” is a non-GAAP measure whereby foreign currency balances are translated, in all periods presented, at Millipore’s predetermined budgeted exchange rates for 2004, thus excluding the impact of fluctuations in the actual foreign currency rates.
Pro forma basis financial results reflect U.S. GAAP results, translated at actual rates of exchange and adjusted for unusual or non-operating items.
3
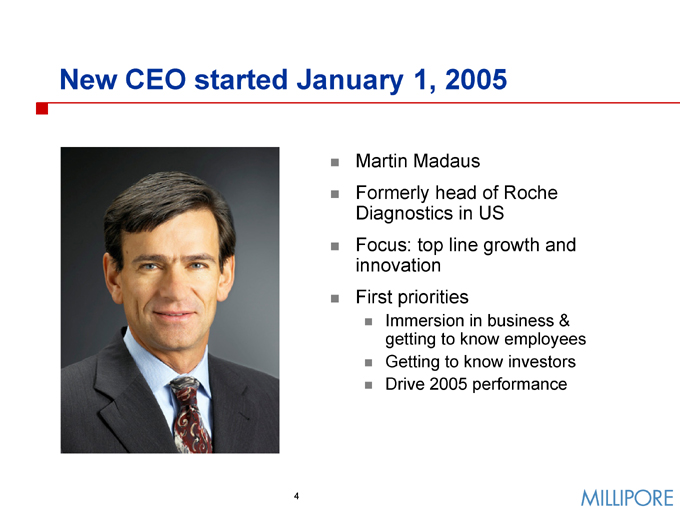
New CEO started January 1, 2005
Martin Madaus
Formerly head of Roche Diagnostics in US Focus: top line growth and innovation First priorities
Immersion in business & getting to know employees Getting to know investors Drive 2005 performance
4
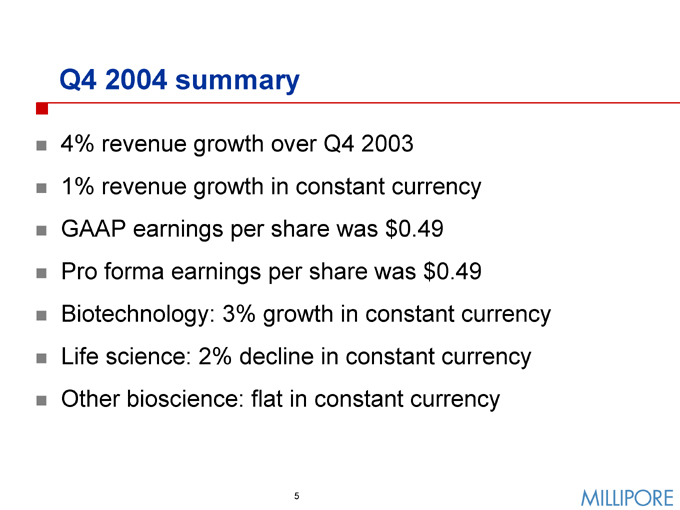
Q4 2004 summary
4% revenue growth over Q4 2003 1% revenue growth in constant currency GAAP earnings per share was $0.49 Pro forma earnings per share was $0.49 Biotechnology: 3% growth in constant currency Life science: 2% decline in constant currency Other bioscience: flat in constant currency
5
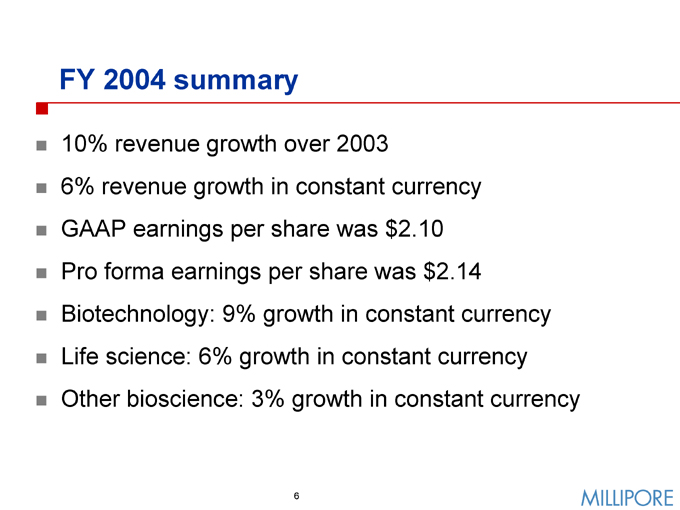
FY 2004 summary
10% revenue growth over 2003
6% revenue growth in constant currency GAAP earnings per share was $2.10 Pro forma earnings per share was $2.14 Biotechnology: 9% growth in constant currency Life science: 6% growth in constant currency Other bioscience: 3% growth in constant currency
6
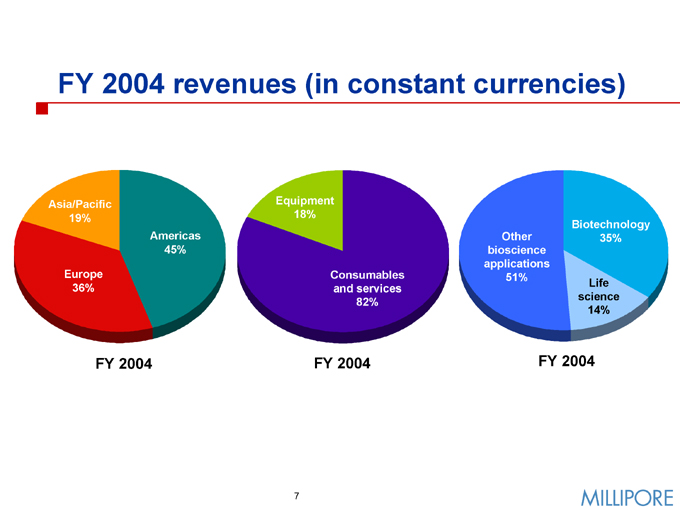
FY 2004 revenues (in constant currencies)
Asia/Pacific 19%
Europe 36%
Americas 45%
FY 2004
Equipment 18%
Consumables and services 82%
FY 2004
Other bioscience applications 51%
Biotechnology 35%
Life science 14%
FY 2004
7
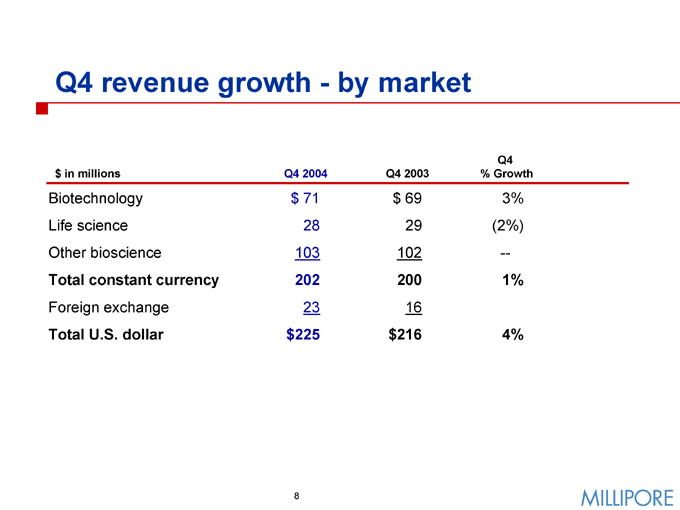
Q4 revenue growth - by market $ in millions
Q4 2004
Q4 2003
Q4 % Growth
Biotechnology $ 71 $ 69 3% Life science 28 29 (2%) Other bioscience 103 102 —%
Total constant currency 202 200 1%
Foreign exchange 23 16
Total U.S. dollar $225 $216 4%
8
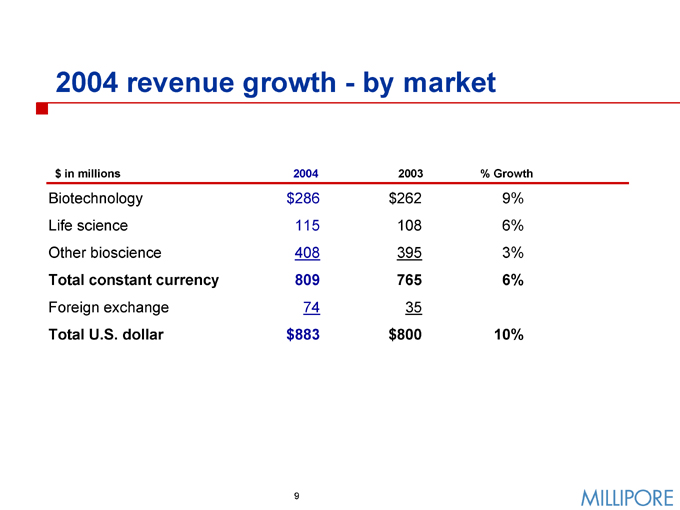
2004 revenue growth—by market $ in millions 2004 2003 % Growth
Biotechnology $286 $262 9% Life science 115 108 6% Other bioscience 408 395 3%
Total constant currency 809 765 6%
Foreign exchange 74 35
Total U.S. dollar $883 $800 10%
9
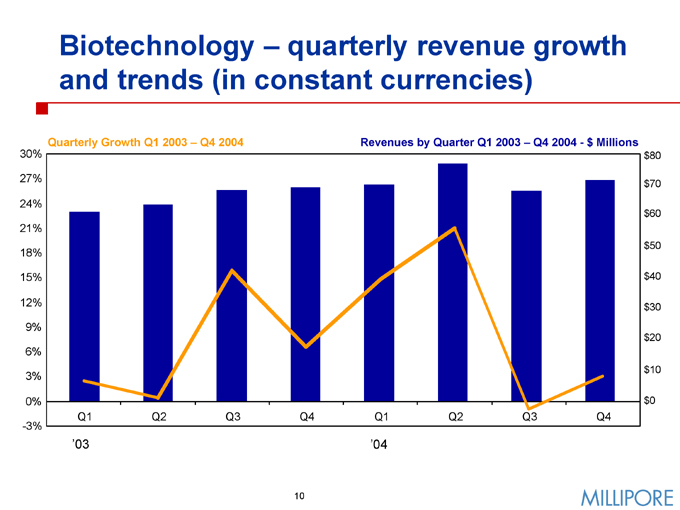
Biotechnology – quarterly revenue growth and trends (in constant currencies)
Quarterly Growth Q1 2003 – Q4 2004
Revenues by Quarter Q1 2003 – Q4 2004—$ Millions
30% 27% 24% 21% 18% 15% 12% 9% 6% 3% 0% -3% $80 $70 $60 $50 $40 $30 $20 $10 $0
Q1 Q2 Q3 Q4 Q1 Q2 Q3 Q4
‘03
‘04
10
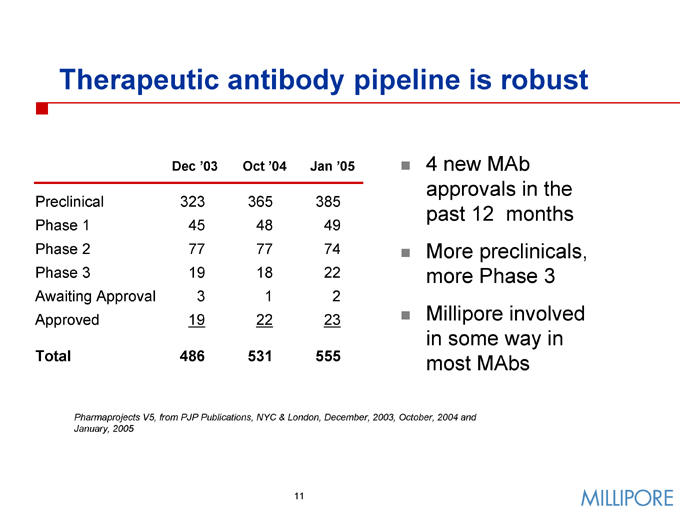
Therapeutic antibody pipeline is robust
Dec ‘03 Oct ‘04 Jan ‘05
Preclinical 323 365 385 Phase 1 45 48 49 Phase 2 77 77 74 Phase 3 19 18 22 Awaiting Approval 3 1 2 Approved 19 22 23
Total 486 531 555
4 new MAb approvals in the past 12 months More preclinicals, more Phase 3 Millipore involved in some way in most MAbs
Pharmaprojects V5, from PJP Publications, NYC & London, December, 2003, October, 2004 and January, 2005
11
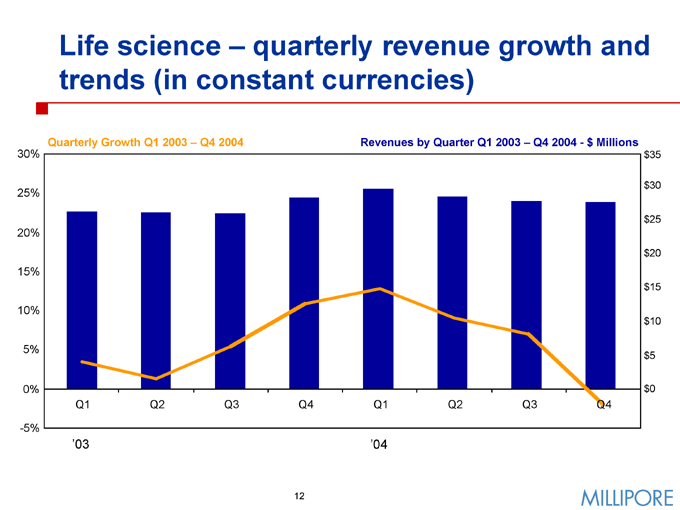
Life science – quarterly revenue growth and trends (in constant currencies)
Quarterly Growth Q1 2003 – Q4 2004
Revenues by Quarter Q1 2003 – Q4 2004—$ Millions
30% 25% 20% 15% 10% 5% 0% -5% $35 $30 $25 $20 $15 $10 $5 $0
Q1 Q2 Q3 Q4 Q1 Q2 Q3 Q4
‘03 ‘04
12
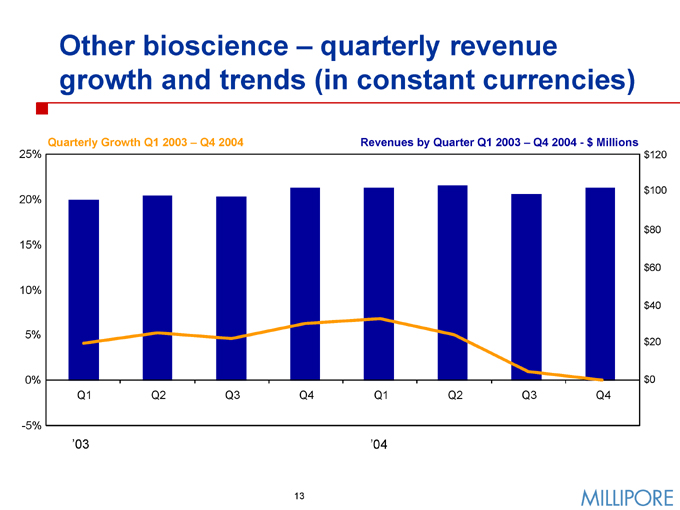
Other bioscience – quarterly revenue growth and trends (in constant currencies)
Quarterly Growth Q1 2003 – Q4 2004 Revenues by Quarter Q1 2003 – Q4 2004—$ Millions
25% 20% 15% 10% 5% 0% -5% $120 $100 $80 $60 $40 $20 $0
Q1 Q2 Q3 Q4 Q1 Q2 Q3 Q4
‘03 ‘04
13
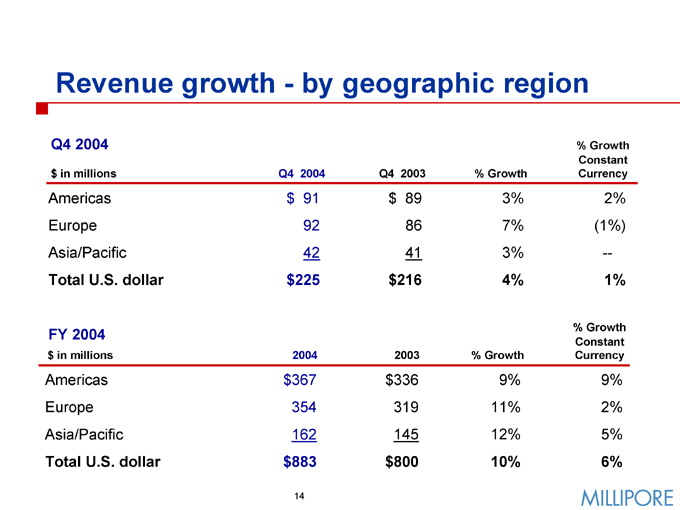
Revenue growth—by geographic region
Q4 2004 $ in millions Q4 2004 Q4 2003 % Growth
% Growth Constant Currency
Americas $ 91 $ 89 3% 2% Europe 92 86 7% (1%) Asia/Pacific 42 41 3% —%
Total U.S. dollar $225 $216 4% 1%
FY 2004
$ in millions
2004 2003 % Growth
% Growth Constant Currency
Americas $367 $336 9% 9% Europe 354 319 11% 2% Asia/Pacific 162 145 12% 5%
Total U.S. dollar $883 $800 10% 6%
14
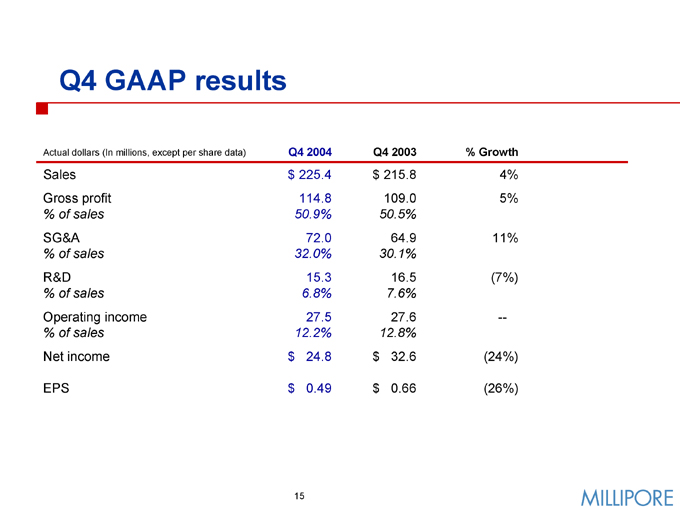
Q4 GAAP results
Actual dollars (In millions, except per share data) Q4 2004 Q4 2003 % Growth
Sales $ 225.4 $ 215.8 4% Gross profit 114.8 109.0 5%
% of sales 50.9% 50.5%
SG&A 72.0 64.9 11%
% of sales 32.0% 30.1%
R&D 15.3 16.5 (7%)
% of sales 6.8% 7.6%
Operating income 27.5 27.6 —%
% of sales 12.2% 12.8%
Net income $ 24.8 $ 32.6 (24%)
EPS $ 0.49 $ 0.66 (26%)
15
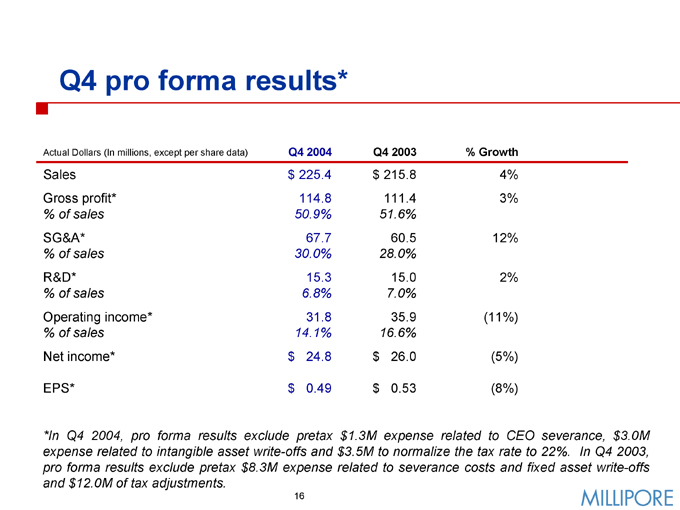
Q4 pro forma results*
Actual Dollars (In millions, except per share data) Q4 2004 Q4 2003 % Growth
Sales $ 225.4 $ 215.8 4% Gross profit* 114.8 111.4 3%
% of sales 50.9% 51.6%
SG&A* 67.7 60.5 12%
% of sales 30.0% 28.0%
R&D* 15.3 15.0 2%
% of sales 6.8% 7.0%
Operating income* 31.8 35.9 (11%)
% of sales 14.1% 16.6%
Net income* $ 24.8 $ 26.0 (5%)
EPS* $ 0.49 $ 0.53 (8%)
*In Q4 2004, pro forma results exclude pretax $1.3M expense related to CEO severance, $3.0M expense related to intangible asset write-offs and $3.5M to normalize the tax rate to 22%. In Q4 2003, pro forma results exclude pretax $8.3M expense related to severance costs and fixed asset write-offs and $12.0M of tax adjustments.
16
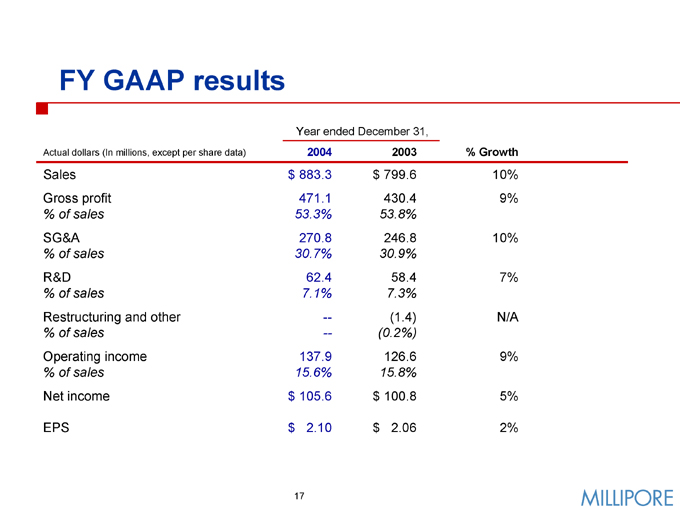
FY GAAP results
Year ended December 31,
Actual dollars (In millions, except per share data) 2004 2003 % Growth
Sales $ 883.3 $ 799.6 10% Gross profit 471.1 430.4 9%
% of sales 53.3% 53.8%
SG&A 270.8 246.8 10%
% of sales 30.7% 30.9%
R&D 62.4 58.4 7%
% of sales 7.1% 7.3%
Restructuring and other — (1.4) N/A
% of sales — (0.2%)
Operating income 137.9 126.6 9%
% of sales 15.6% 15.8%
Net income $ 105.6 $ 100.8 5%
EPS $ 2.10 $ 2.06 2%
17
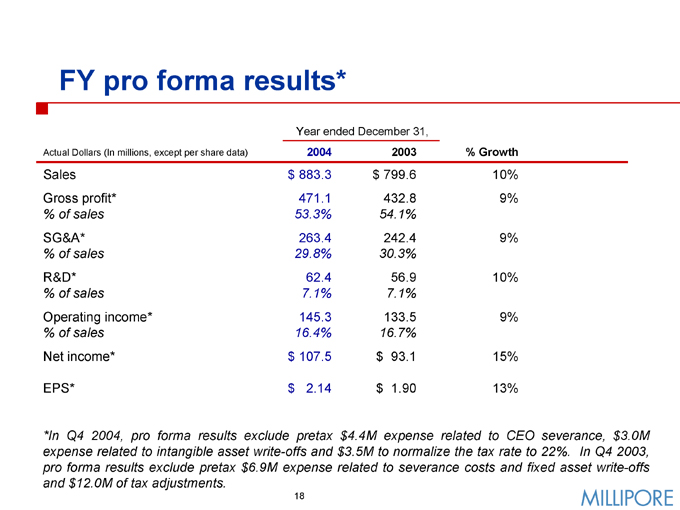
FY pro forma results*
Year ended December 31,
Actual Dollars (In millions, except per share data) 2004 2003 % Growth
Sales $ 883.3 $ 799.6 10% Gross profit* 471.1 432.8 9%
% of sales 53.3% 54.1%
SG&A* 263.4 242.4 9%
% of sales 29.8% 30.3%
R&D* 62.4 56.9 10%
% of sales 7.1% 7.1%
Operating income* 145.3 133.5 9%
% of sales 16.4% 16.7%
Net income* $ 107.5 $ 93.1 15%
EPS* $ 2.14 $ 1.90 13%
*In Q4 2004, pro forma results exclude pretax $4.4M expense related to CEO severance, $3.0M expense related to intangible asset write-offs and $3.5M to normalize the tax rate to 22%. In Q4 2003, pro forma results exclude pretax $6.9M expense related to severance costs and fixed asset write-offs and $12.0M of tax adjustments.
18
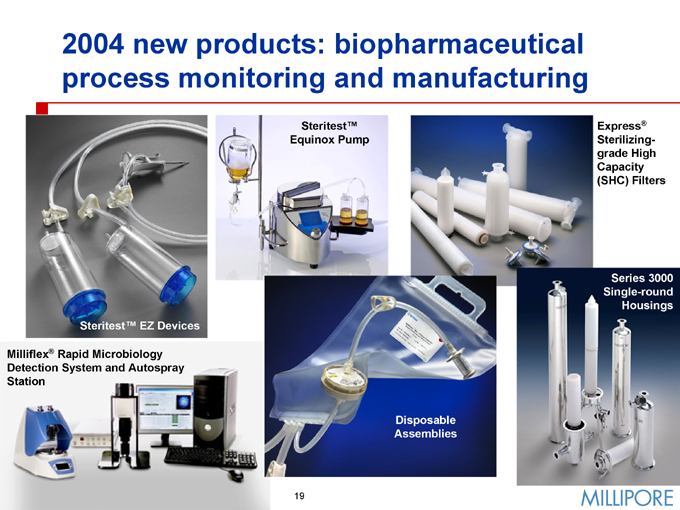
2004 new products: biopharmaceutical process monitoring and manufacturing
Steritest™ Equinox Pump
Express® Sterilizing-grade High Capacity (SHC) Filters
Steritest™ EZ Devices
Milliflex® Rapid Microbiology Detection System and Autospray Station
Disposable Assemblies
Series 3000 Single-round Housings
19
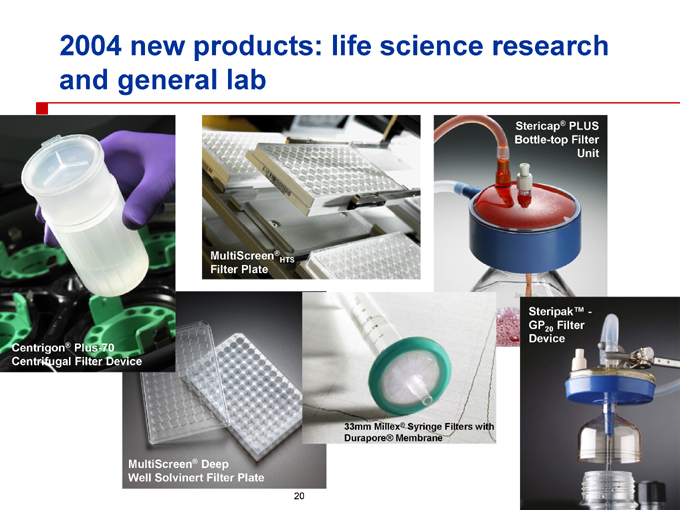
2004 new products: life science research and general lab
Centrigon® Plus-70 Centrifugal Filter Device
MultiScreen®HTS Filter Plate
Stericap® PLUS Bottle-top Filter Unit
MultiScreen® Deep Well Solvinert Filter Plate
33mm Millex® Syringe Filters with Durapore® Membrane
Steripak™ -
GP20 Filter
Device
20
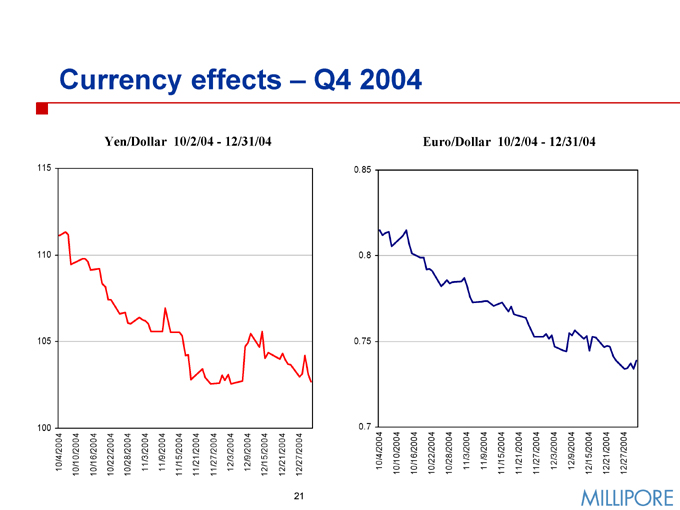
Currency effects – Q4 2004
Yen/Dollar 10/2/04—12/31/04
115 110 105 100
10/4/2004 10/10/2004
10/16/2004 10/22/2004 10/28/2004
11/3/2004 11/9/2004 11/15/2004 11/21/2004
11/27/2004 12/3/2004 12/9/2004 12/15/2004
12/21/2004 12/27/2004
Euro/Dollar 10/2/04—12/31/04
0.85 0.8 0.75 0.7
10/4/2004 10/10/2004 10/16/2004 10/22/2004 10/28/2004 11/3/2004 11/9/2004 11/15/2004 11/21/2004 11/27/2004 12/3/2004 12/9/2004 12/15/2004 12/21/2004 12/27/2004
21
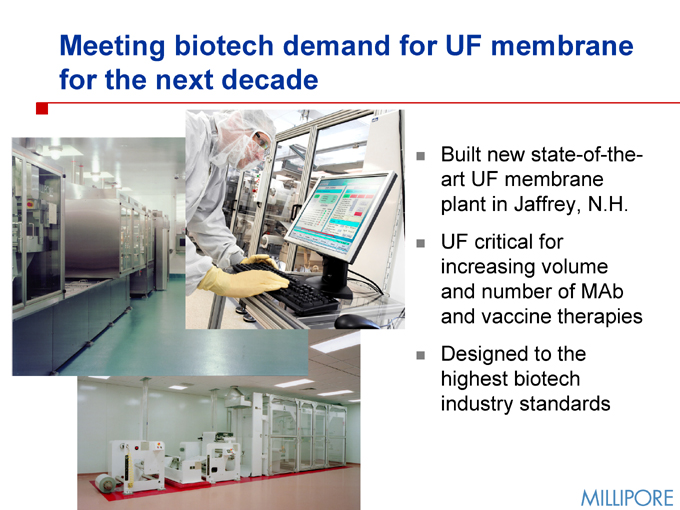
Meeting biotech demand for UF membrane for the next decade
Built new state-of-the-art UF membrane plant in Jaffrey, N.H. UF critical for increasing volume and number of MAb and vaccine therapies Designed to the highest biotech industry standards
22
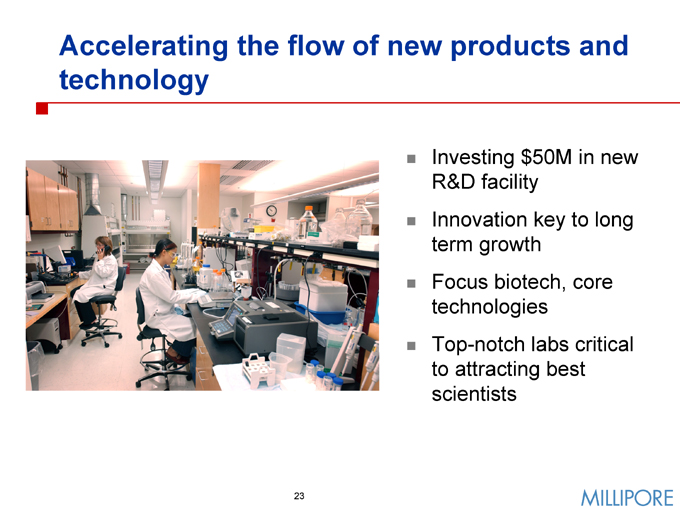
Accelerating the flow of new products and technology
Investing $50M in new R&D facility Innovation key to long term growth Focus biotech, core technologies Top-notch labs critical to attracting best scientists
23
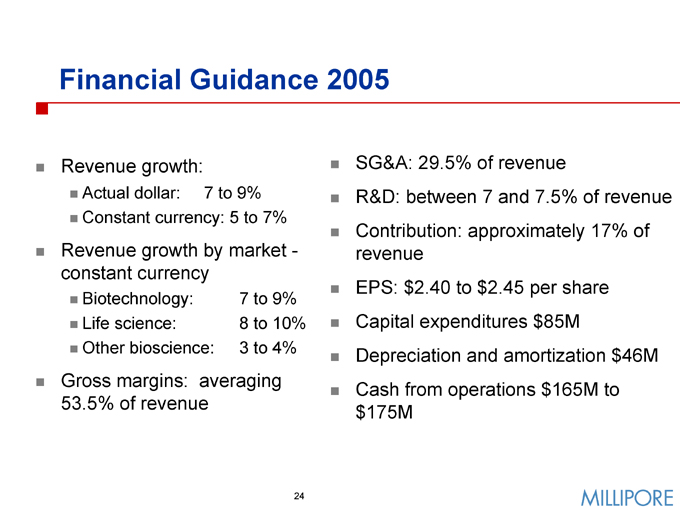
Financial Guidance 2005
Revenue growth:
Actual dollar: 7 to 9% Constant currency: 5 to 7%
Revenue growth by market -constant currency
Biotechnology: 7 to 9% Life science: 8 to 10% Other bioscience: 3 to 4%
Gross margins: averaging 53.5% of revenue
SG&A: 29.5% of revenue
R&D: between 7 and 7.5% of revenue Contribution: approximately 17% of revenue EPS: $2.40 to $2.45 per share Capital expenditures $85M
Depreciation and amortization $46M Cash from operations $165M to $175M
24
Appendix
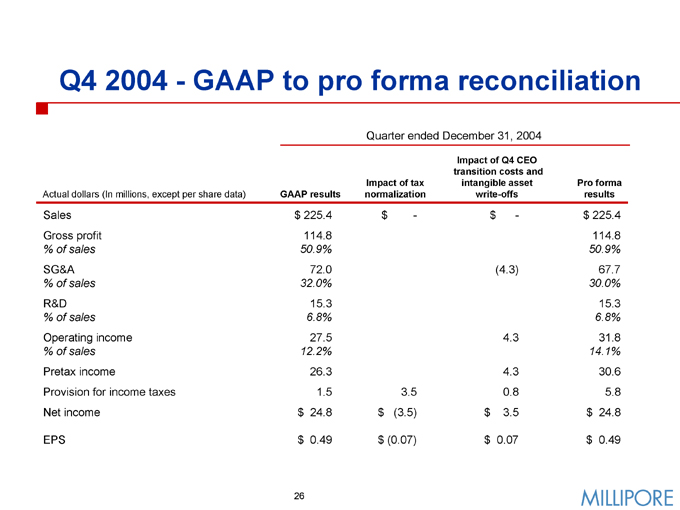
Q4 2004—GAAP to pro forma reconciliation
Quarter ended December 31, 2004
Actual dollars (In millions, except per share data) GAAP results
Impact of tax normalization
Impact of Q4 CEO transition costs and intangible asset write-offs
Pro forma results
Sales $ 225.4 $ - $ - $ 225.4 Gross profit 114.8 114.8
% of sales 50.9% 50.9%
SG&A 72.0 (4.3) 67.7
% of sales 32.0% 30.0%
R&D 15.3 15.3
% of sales 6.8% 6.8%
Operating income 27.5 4.3 31.8
% of sales 12.2% 14.1%
Pretax income 26.3 4.3 30.6 Provision for income taxes 1.5 3.5 0.8 5.8 Net income $ 24.8 $ (3.5) $ 3.5 $ 24.8
EPS $ 0.49 $ (0.07) $ 0.07 $ 0.49
26
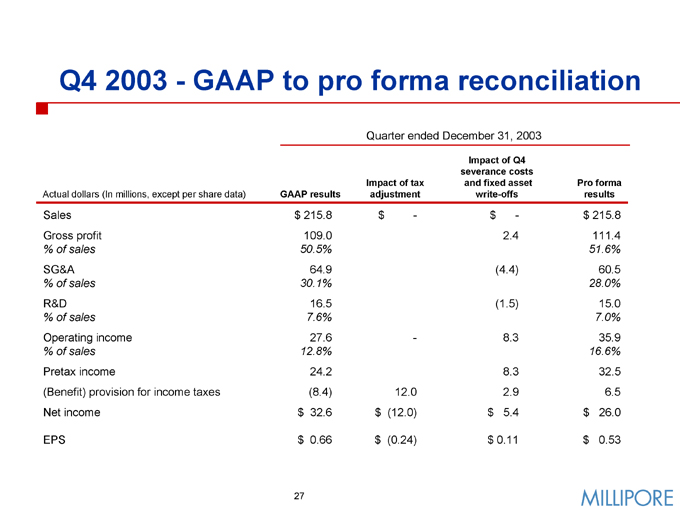
Q4 2003—GAAP to pro forma reconciliation
Quarter ended December 31, 2003
Actual dollars (In millions, except per share data) GAAP results
Impact of tax adjustment
Impact of Q4 severance costs and fixed asset write-offs
Pro forma results
Sales $ 215.8 $ - $ - $ 215.8 Gross profit 109.0 2.4 111.4
% of sales 50.5% 51.6%
SG&A 64.9 (4.4) 60.5
% of sales 30.1% 28.0%
R&D 16.5 (1.5) 15.0
% of sales 7.6% 7.0%
Operating income 27.6 - 8.3 35.9
% of sales 12.8% 16.6%
Pretax income 24.2 8.3 32.5 (Benefit) provision for income taxes (8.4) 12.0 2.9 6.5 Net income $ 32.6 $ (12.0) $ 5.4 $ 26.0
EPS $ 0.66 $ (0.24) $ 0.11 $ 0.53
27
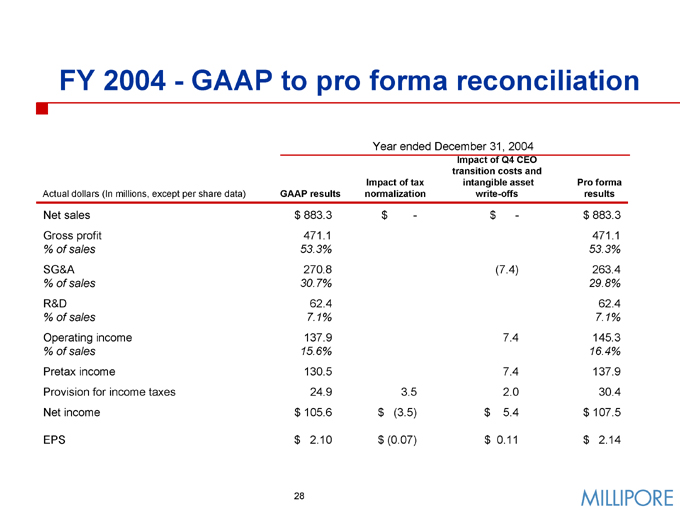
FY 2004—GAAP to pro forma reconciliation
Year ended December 31, 2004
Actual dollars (In millions, except per share data)
GAAP results
Impact of tax normalization
Impact of Q4 CEO transition costs and intangible asset write-offs
Pro forma results
Net sales $ 883.3 $ - $ - $ 883.3 Gross profit 471.1 471.1
% of sales 53.3% 53.3%
SG&A 270.8 (7.4) 263.4
% of sales 30.7% 29.8%
R&D 62.4 62.4
% of sales 7.1% 7.1%
Operating income 137.9 7.4 145.3
% of sales 15.6% 16.4%
Pretax income 130.5 7.4 137.9 Provision for income taxes 24.9 3.5 2.0 30.4 Net income $ 105.6 $ (3.5) $ 5.4 $ 107.5
EPS $ 2.10 $ (0.07) $ 0.11 $ 2.14
28
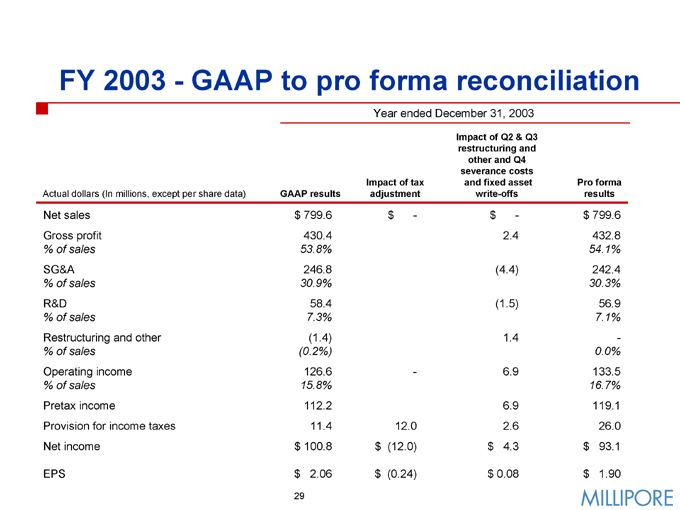
FY 2003—GAAP to pro forma reconciliation
Year ended December 31, 2003
Actual dollars (In millions, except per share data) GAAP results
Impact of tax adjustment
Impact of Q2 & Q3 restructuring and other and Q4 severance costs and fixed asset write-offs
Pro forma results
Net sales $ 799.6 $ - $ - $ 799.6 Gross profit 430.4 2.4 432.8
% of sales 53.8% 54.1%
SG&A 246.8 (4.4) 242.4
% of sales 30.9% 30.3%
R&D 58.4 (1.5) 56.9
% of sales 7.3% 7.1%
Restructuring and other (1.4) 1.4 -
% of sales (0.2%) 0.0%
Operating income 126.6 - 6.9 133.5
% of sales 15.8% 16.7%
Pretax income 112.2 6.9 119.1 Provision for income taxes 11.4 12.0 2.6 26.0 Net income $ 100.8 $ (12.0) $ 4.3 $ 93.1
EPS $ 2.06 $ (0.24) $ 0.08 $ 1.90
29