April 15, 2009
Mark A. Cowan
Securities and Exchange Commission
100 F Street, N.E.
Mail Stop 5-5
Washington, DC 20549-0506
| Re: | MML Series Investment Fund (the “Trust”) | |
| 1933 Act File No. 2-39334 | ||
| 1940 Act File No. 811-2224 | ||
| Comments received for PEA #70 filed on February 23, 2009 |
Dear Mr. Cowan:
Below is a summary of the comments I received from you on April 7, 2009 regarding the above-mentioned Trust, together with our responses. I appreciate the time you took to carefully review these documents and have tried to address your comments. I would greatly appreciate your contacting me at 413-744-6602 as soon as possible if you have any further questions or comments. Thank you.
| 1. | Performance and Financial Highlights |
Comment: Please provide updated performance and financial highlights information.
Response: Updated performance and financial highlights information is attached hereto and will be included in the upcoming 485(b) filing for the Registrant.
| 2. | Expense Information |
Comment:Fee Tables. For all portfolios, please explain footnote 3 — that Other Expenses are based on estimated amounts for the first fiscal year.
Response: We have updated these footnotes to state “Other expenses are based on estimated amounts for the firstfull fiscal year.” These amounts are estimated because the Service Class or Service Class I for each Fund, as applicable, was less than six months old at the end of its initial fiscal year.
| 3. | SAI Appendix C – Additional Portfolio Manager Information (p. B-88 +) |
Comment (a):Conflicts of Interest. In most cases, the portfolio manager disclosure provides a description of the kinds of conflicts that a portfolio manager could have, however, it does not describe any actual conflicts of interests that apply to specific portfolio managers due to their particular accounts. Please revise the conflicts of interest discussion to address concrete conflicts of interest affecting the named portfolio managers of each fund. Disclose the actual accounts for which the manager has such a conflict, the nature of the conflict (describing specific conflicts in the allocation of investment opportunities among specifically named portfolios for which s/he is responsible), and how that conflict has been addressed.See Item 15(a)(4) of Form N-1A and Adopting Release IC-26533.
Response: The conflict of interest discussion is provided to MassMutual by each sub-adviser as part of the sub-adviser’s satisfaction of the requirements under Form N-1A. We are not aware of any additional conflicts of interest that are unique to our Funds.
Comment (b):Portfolio Manager Compensation.
(i) With respect to the year-end bonus given to the portfolio managers at Essex Investment Management Company, LLC, please indicate whether the bonus is based on pre-tax or after-tax performance (if applicable).
Response: The disclosure will be modified to reflect that the bonus is based on pre-tax performance.
(ii) With respect to the annual bonus available to Mr. Molendyk and Mr. Swanson at Insight Capital Research & Management, Inc., please define the “Peer Group” to which the portfolio’s performance will be compared.
Response: The disclosure will be modified to reflect that the “Peer Group” used is the Mercer U.S. Equity Small Cap Growth universe.
(iii) With respect to the compensation of the portfolio managers of Northern Trust Investments, N.A., the disclosure states that the annual incentive award is based, in part, on a qualitative evaluation of each portfolio managers performance, but that the award is not based on performance of the funds or the amount of assets held in the funds. Please clarify what this performance evaluation will be based upon.
Response: The disclosure will be modified to reflect that the qualitative evaluation of the portfolio managers includes, but is not limited to, the following criteria: analytical abilities, ability to react to market events, oral and written communication skills, organizational skills, team work and substantive knowledge of their respective markets.
As requested, we acknowledge the following: (i) the Registrant is responsible for the adequacy and accuracy of the disclosure in the filings; (ii) SEC staff comments or changes to disclosure in response to SEC staff comments in the filings reviewed by the SEC staff do not foreclose the SEC from taking any action with respect to the filings; and (iii) the Registrant may not assert SEC staff comments as a defense in any proceeding initiated by the SEC or any person under the federal securities laws of the United States. As indicated in the SEC’s June 24, 2004 release regarding the public release of comment letters and responses, you are requesting such acknowledgements from all companies whose filings are being reviewed and this request and these acknowledgements should not be construed as suggesting that there is an inquiry or investigation or other matter involving the Registrant.
| Very truly yours, |
/s/ Jill Nareau Robert |
| Jill Nareau Robert |
| Assistant Secretary, MML Series Investment Fund |
| Counsel, Massachusetts Mutual Life Insurance Company |
Investment Objective
This Fund seeks both capital growth and income.
Principal Investment Strategies and Risks
The Fund seeks to achieve its investment objective by selecting businesses that possess characteristics that the Fund’s Sub-Adviser,Davis Selected Advisers, L.P.(“Davis”), believes foster the creation of long-term value, such as proven management, a durable franchise and business model, and sustainable competitive advantages. Davis will normally invest at least 80% of the Fund’s net assets in common stock of companies with market capitalizations of at least $5 billion. The Fund’s investment strategy is to select these companies for the long-term. In the current market environment, Davis expects that current income will be low.
Using intensive research into company fundamentals, Davis looks for factors, both quantitative and qualitative, that it believes foster sustainable long-term business growth. While few companies will exhibit all of these qualities, Davis believes that nearly every company in which it invests has a majority and appropriate mix of these traits:
| · | First-Class Management:Proven track record; significant alignment of interest in business; smart appliers of technology to improve business and lower costs; |
| · | Strong Financial Condition and Satisfactory Profitability:Strong balance sheets; low cost structure/low debt; high returns on capital; |
| · | Strategic Positioning for the Long-Term:Non-obsolescent products/industries; dominant position in a growing market; global presence and brand names. |
The Fund may also invest up to 20% of its total assets in foreign securities and may, but generally does not, use derivatives as a hedge against currency risks.
A security may be sold when Davis believes that the market price is greater that its estimate of intrinsic value. Davis may also sell if the risk of owning the security makes it no longer attractive.
The Principal Risks of investing in the Fund are Market Risk, Credit Risk, Management Risk, Foreign Investment Risk, Currency Risk, Value Company Risk and Leveraging Risk.
These Risks are described beginning on page 16.
Annual Performance
The bar chart shows the risks of investing in the Fund by showing changes in the Fund’s performance from year to year. The returns shown are net of Fund expenses, but do not reflect the fees and expenses deducted under the variable life insurance or variable annuity contract through which you invest in the Fund. The returns would be lower if those fees and expenses were included.
Initial Class Shares
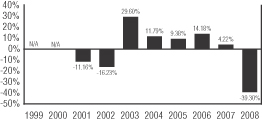
During the periods shown above, the highest quarterly return was 17.08% for the quarter ended June 30, 2003 and the lowest was
-24.93% for the quarter ended December 31, 2008.
– 4 –
Average Annual Total Returns
(for the periods ended December 31, 2008)
The table shows the risks of investing in the Fund by comparing the Fund’s returns with a broad measure of market performance over different time periods. The returns shown are net of Fund expenses, but do not reflect the fees and expenses deducted under the variable life insurance or variable annuity contract through which you invest in the Fund. The returns would be lower if those fees and expenses were included.
One Year | Five | Since Inception (05/01/00) | |||||||
MML Large Cap Value Fund Initial Class | - | 39.30% | - | 2.45% | - | 1.95% | |||
MML Large Cap Value Fund Service Class(1) | - | 39.45% | - | 2.69% | - | 2.20% | |||
S&P 500® Index(2) | - | 37.00% | - | 2.19% | - | 3.65% | |||
Russell 1000® Value Index(3) | - | 36.85% | - | 0.79% | 0.83% | ||||
(1) Performance for Service Class shares of the Fund for periods prior to its inception date (08/15/08) is based on the performance of Initial Class shares, adjusted to reflect Service Class expenses.
(2) The S&P 500® Index is a widely recognized, unmanaged index representative of common stocks of the larger capitalized U.S. companies. The Index does not incur expenses or reflect any deduction for taxes and cannot be purchased directly by investors.
(3) The Russell 1000® Value Index is an unmanaged index consisting of those Russell 1000 securities (representing the 1,000 largest U.S. companies based on market capitalization) with greater-than-average value orientation that tend to exhibit lower price-to-book ratios and forecasted growth values than securities in the growth universe. The Index does not incur expenses or reflect any deduction for taxes and cannot be purchased directly by investors.
Expense Information
This table describes the fees and expenses that you may pay if you buy and hold shares of the Fund. The expenses in the table do not reflect deductions at the separate account level or contract level for any charges that may be incurred under a variable life insurance or variable annuity contract.
| Initial Class(1) | Service Class | ||||
| Annual Fund Operating Expenses (expenses that are deducted from Fund assets) (% of average net assets) | |||||
Management Fees | .77% | .77% | |||
Distribution and Service (Rule 12b-1) Fees(2) | N/A | .25% | |||
Other Expenses | .07% | .07% | (3) | ||
| Total Annual Fund Operating Expenses | .84% | 1.09% |
Examples
These examples are intended to help you compare the cost of investing in the Fund with the cost of investing in other mutual funds. The examples assume that you invest $10,000 in each share class of the Fund for the time periods indicated, that your investment earns a 5% return each year and that the Fund’s operating expenses are exactly as described in the preceding table. If separate account or variable life insurance or variable annuity contract expenses were included, overall expenses would be higher. Although your actual costs may be higher or lower, based on these assumptions your costs would be:
| 1 Year | 3 Years | 5 Years | 10 Years | |||||||||
Initial Class | $ | 86 | $ | 268 | $ | 466 | $ | 1,037 | ||||
Service Class | $ | 111 | $ | 347 | $ | 601 | $ | 1,329 | ||||
The Fund does not impose any Shareholder Fees. Therefore, the figures shown would be the same whether you sold your shares at the end of a period or kept them, although this does not include any surrender charges that may be imposed if you withdraw the proceeds from your variable life insurance or variable annuity contract.
| (1) | The expenses in the above table are based on expenses for the fiscal year ended December 31, 2008. |
| (2) | Rule 12b-1 Fees reflect current fees in effect that the Fund’s Board of Trustees has determined not to raise through at least May 2, 2010. |
| (3) | Other expenses are based on estimated amounts for the first full fiscal year. |
– 5 –
Investment Objective
The Fund’s investment objective is to provide investment results that correspond to the price and yield performance of publicly traded common stocks in the aggregate as represented by the S&P 500® Index.
Principal Investment Strategies and Risks
This Fund seeks to achieve its objective by investing at least 80% of its net assets in the securities of companies that make up the S&P 500 Index. The S&P 500 Index is a widely recognized, unmanaged index representative of common stocks of larger capitalized U.S. companies. As of February 28, 2009, the market capitalization range of the S&P 500 Index was $224.35 million to $337.87 billion.
The Fund generally purchases and sells securities in order to allocate the Fund’s investments among stocks in proportions that approximately match their index weights. This is the primary strategy used by the Fund to achieve a capitalization-weighted total rate of return. Each company’s shares contribute to the Fund’s overall return in the same proportion as the value of the Company’s shares that contribute to the return of the S&P 500 Index. However, the Fund’s Sub-Adviser, Northern Trust Investments, N.A. (“NTI”), uses a process known as “optimization,” which is a statistical sampling technique. Using this technique, NTI may invest in a statistically selected sample of the securities found in the Index instead of buying every possible stock. In doing so, NTI attempts to maximize the Fund’s liquidity and returns while minimizing its costs. (See discussion of “Optimization” on page 40). Therefore, the Fund may not hold every stock in the Index. NTI believes that this approach allows the Fund to run an efficient and effective strategy to maximize the Fund’s liquidity while minimizing transaction costs. The Fund may also invest in other instruments, the performance of which is expected to correspond to the Index. The Fund may also usederivatives, such as index futures and options, as described in “Additional Investment Policies and Risk Considerations.” NTI believes that the use of these investments helps the Fund’s returns approach the returns of a fully invested portfolio, while enabling the Fund to keep cash on hand for liquidity purposes.NTI seeks a correlation between the performance of the Fund, before expenses, and the S&P 500 Index of 98% or better.
The Fund is non-diversified, which means that it may hold larger positions in a smaller number of stocks than a diversified fund. As a result, an increase or decrease in the value of a single stock could have a greater impact on the Fund’s net asset value and its total return. See “Non-Diversification Risk” on page 18.
The Principal Risks of investing in the Fund are Market Risk, Credit Risk, Tracking Error Risk, Liquidity Risk, Derivative Risk, Non-Diversification Risk and Leveraging Risk.
These Risks are described beginning on page 16.
Annual Performance
The bar chart shows the risks of investing in the Fund by showing changes in the Fund’s performance from year to year. The returns shown are net of Fund expenses, but do not reflect the fees and expenses deducted under the variable life insurance or variable annuity contract through which you invest in the Fund. The returns would be lower if those fees and expenses were included.
Class I Shares
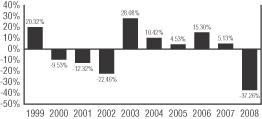
During the periods shown above, the highest quarterly return was 15.27% for the quarter ended June 30, 2003 and the lowest was –22.02% for the quarter ended December 31, 2008.
– 6 –
Average Annual Total Returns
(for the periods ended December 31, 2008)
The table shows the risks of investing in the Fund by comparing the Fund’s returns with a broad measure of market performance over different time periods. The returns shown are net of Fund expenses, but do not reflect the fees and expenses deducted under the variable life insurance or variable annuity contract through which you invest in the Fund. The returns would be lower if those fees and expenses were included.
One Year | Five Years | Ten Years | ||||
MML Equity Index Fund Class I | -37.26% | -2.57% | -1.82% | |||
MML Equity Index Fund Class II(1) | -37.14% | -2.42% | -1.66% | |||
MML Equity Index Fund Class III(1) | -37.09% | -2.29% | -1.56% | |||
MML Equity Index Fund Service Class I(2) | -37.43% | -2.82% | -2.07% | |||
S&P 500 Index(3) | -37.00% | -2.19% | -1.38% |
(1) Performance for Class II and Class III shares of the Fund for periods prior to their inception date (05/01/00) is based on the performance of Class I shares, adjusted to reflect Class II and Class III expenses.
(2) Performance for Service Class I shares of the Fund for periods prior to its inception date (08/15/08) is based on the performance of Class I shares, adjusted to reflect Service Class I expenses.
(3) The S&P 500 Index is a widely recognized, unmanaged index representative of common stocks of the larger capitalized U.S. companies. The Index does not incur expenses or reflect any deduction for taxes and cannot be purchased directly by investors.
Expense Information
This table describes the fees and expenses that you may pay if you buy and hold shares of the Fund. The expenses in the table do not reflect deductions at the separate account level or contract level for any charges that may be incurred under a variable life insurance or variable annuity contract.
| Class I(1) | Class II(1) | Class III(1) | Service Class I | ||||||||
| Annual Fund Operating Expenses (expenses that are deducted from Fund assets) (% of average net assets) | |||||||||||
Management Fees | .10% | .10% | .10% | .10% | |||||||
Distribution and Service (Rule 12b-1) Fees(2) | N/A | N/A | N/A | .25% | |||||||
Other Expenses(3) | .36% | .25% | .11% | .36% | (4) | ||||||
| Total Annual Fund Operating Expenses(5) | .46% | .35% | .21% | .71% | |||||||
Less Expense Reimbursement | — | (.05% | ) | (.05% | ) | — | |||||
Net Fund Expenses(6) | .46% | .30% | .16% | .71% |
Examples
These examples are intended to help you compare the cost of investing in the Fund with the cost of investing in other mutual funds. The examples assume that you invest $10,000 in each share class of the Fund for the time periods indicated, that your investment earns a 5% return each year and that the Fund’s operating expenses are exactly as described in the preceding table. If separate account or variable life insurance or variable annuity contract expenses were included, overall expenses would be higher. Although your actual costs may be higher or lower, based on these assumptions your costs would be:
| 1 Year | 3 Years | 5 Years | 10 Years | |||||||||
Class I | $ | 47 | $ | 148 | $ | 258 | $ | 579 | ||||
Class II | $ | 31 | $ | 107 | $ | 191 | $ | 438 | ||||
Class III | $ | 16 | $ | 63 | $ | 113 | $ | 263 | ||||
Service Class I | $ | 73 | $ | 227 | $ | 395 | $ | 883 | ||||
The Fund does not impose any Shareholder Fees. Therefore, the figures shown would be the same whether you sold your shares at the end of a period or kept them, although this does not include any surrender charges that may be imposed if you withdraw the proceeds from your variable life insurance or variable annuity contract.
| (1) | For Classes I, II and III, the expenses in the above table are based on expenses for the fiscal year ended December 31, 2008. |
| (2) | Rule 12b-1 Fees reflect current fees in effect that the Fund’s Board of Trustees has determined not to raise through at least May 2, 2010. |
| (3) | Other Expenses include Acquired Fund fees and expenses, which represent approximate expenses borne indirectly by the Fund in its most recent fiscal year through investments in other pooled investment vehicles. The amount of Acquired Fund fees and expenses may change in the coming year due to a number of factors including, among others, a change in allocation of the Fund’s investments among other pooled investment vehicles. |
| (4) | Other expenses are based on estimated amounts for the first full fiscal year. |
| (5) | Because Total Annual Fund Operating Expenses include Acquired Fund fees and expenses, they may not correspond to the ratios of expenses to average daily net assets shown in the “Financial Highlights” tables in this Prospectus, which reflect the operating expenses of the Fund and do not include Acquired Fund fees and expenses. |
| (6) | The expenses in the above table reflect written agreements by MassMutual to bear the expenses (other than the management and administrative fees, interest, taxes, brokerage commissions, extraordinary litigation and legal expenses, or other non-recurring or unusual expenses), excluding Acquired Fund fees and expenses, in excess of .05% of the average daily net asset values through May 2, 2010 for Class I, Class II, Class III and Service Class I shares. The agreements cannot be terminated unilaterally by MassMutual. In addition, MassMutual has agreed to waive certain administrative and shareholder service fees payable by the Fund on account of Class II and Class III shares. |
– 7 –
Investment Objective
This Fund seeks to approximate as closely as practicable (before fees and expenses) the total return of the NASDAQ-100 Index®.
Principal Investment Strategies and Risks
This Fund seeks to achieve its objective by investing at least 80% of its net assets in the securities of companies included in the NASDAQ-100 Index. The NASDAQ-100 Index is a modified capitalization-weighted index composed of the 100 largest non-financial companies listed on the National Association of Securities Dealers Automated Quotations System (“NASDAQ”). As of February 28, 2009, the market capitalization range of the NASDAQ-100 Index was $1.53 billion to $143.56 billion.
The Fund generally purchases and sells securities in order to allocate the Fund’s investments among stocks in proportions that approximately match their index weights. This is the primary strategy used by the Fund to achieve a capitalization-weighted total rate of return. Each company’s shares contribute to the Fund’s overall return in the same proportion as the value of the Company’s shares that contribute to the return of the NASDAQ-100 Index. However, the Fund’s Sub-Adviser,Northern Trust Investments, N.A. (“NTI”), uses a process known as “optimization,” which is a statistical sampling technique. Using this technique, NTI may invest in a statistically selected sample of the securities found in the Index instead of buying every possible stock. In doing so, NTI attempts to maximize the Fund’s liquidity and returns while minimizing its costs. (See discussion of “Optimization” on page 40). Therefore, the Fund may not hold every stock in the Index. NTI believes that this approach allows the Fund to run an efficient and effective strategy to maximize the Fund’s liquidity while minimizing transaction costs. The Fund may also invest in other instruments, the performance of which is expected to correspond to the Index. The Fund may also usederivatives, such as index futures and options, as described in “Additional Investment Policies and Risk Considerations.” NTI believes that the use of these investments helps the Fund’s returns approach the returns of a fully invested portfolio, while enabling the Fund to keep cash on hand for liquidity purposes.
The Fund is non-diversified, which means that it may hold larger positions in a smaller number of stocks than a diversified fund. As a result, an increase or decrease in value of a single stock could have a greater impact on the Fund’s net asset value and its total return. See “Non-Diversification Risk” on page 18.
The Principal Risks of investing in the Fund are Market Risk, Credit Risk, Tracking Error Risk, Liquidity Risk, Derivative Risk, Non-Diversification Risk, Smaller and Mid-Cap Company Risk, Growth Company Risk, Over-the-Counter Risk and Leveraging Risk.
These Risks are described beginning on page 16.
Annual Performance
The bar chart shows the risks of investing in the Fund by showing changes in the Fund’s performance from year to year. The returns shown are net of Fund expenses, but do not reflect the fees and expenses deducted under the variable life insurance or variable annuity contract through which you invest in the Fund. The returns would be lower if those fees and expenses were included.
Initial Class Shares
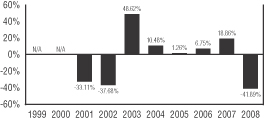
During the periods shown above, the highest quarterly return was 34.88% for the quarter ended December 31, 2001 and the lowest was -36.36% for the quarter ended September 30, 2001.
– 8 –
Average Annual Total Returns
(for the periods ended December 31, 2008)
The table shows the risks of investing in the Fund by comparing the Fund’s returns with a broad measure of market performance over different time periods. The returns shown are net of Fund expenses, but do not reflect the fees and expenses deducted under the variable life insurance or variable annuity contract through which you invest in the Fund. The returns would be lower if those fees and expenses were included.
| One Year | Five Years | Since (05/01/00) | ||||||
MML NASDAQ-100 Fund | ||||||||
Initial Class | - | 41.89% | - | 3.78% | -12.56% | |||
MML NASDAQ-100 Fund | ||||||||
Service Class(1) | - | 42.05% | - | 4.03% | -12.79% | |||
NASDAQ-100 Index(2) | - | 41.89% | - | 3.76% | -12.28% | |||
(1) Performance for Service Class shares of the Fund for periods prior to its inception date (08/15/08) is based on the performance of Initial Class shares, adjusted to reflect Service Class expenses.
(2) NASDAQ-100 Index is a registered service mark of The NASDAQ Stock Market, Inc. (“NASDAQ”). The NASDAQ-100 Index is composed and calculated by NASDAQ without regard to the Fund. NASDAQ makes no warranty, express or implied, regarding, and bears no liability with respect to, the NASDAQ-100 Index or its use or any data included therein. The Index does not incur expenses or reflect any deduction for taxes and cannot be purchased directly by investors.
Expense Information
This table describes the fees and expenses that you may pay if you buy and hold shares of the Fund. The expenses in the table do not reflect deductions at the separate account level or contract level for any charges that may be incurred under a variable life insurance or variable annuity contract.
| Initial Class(1) | Service Class | |||||
| Annual Fund Operating Expenses (expenses that are deducted from Fund assets) (% of average net assets) | ||||||
Management Fees | .45% | .45% | ||||
Distribution and Service (Rule 12b-1) Fees(2) | N/A | .25% | ||||
Other Expenses | .78% | .78% | (3) | |||
| Total Annual Fund Operating Expenses | 1.23% | 1.48% | ||||
Less Expense Reimbursement | (.67% | ) | (.67% | ) | ||
Net Fund Expenses(4) | .56% | .81% |
Examples
These examples are intended to help you compare the cost of investing in the Fund with the cost of investing in other mutual funds. The examples assume that you invest $10,000 in each share class of the Fund for the time periods indicated, that your investment earns a 5% return each year and that the Fund’s operating expenses are exactly as described in the preceding table. If separate account or variable life insurance or variable annuity contract expenses were included, overall expenses would be higher. Although your actual costs may be higher or lower, based on these assumptions your costs would be:
| 1 Year | 3 Years | 5 Years | 10 Years | |||||||||
Initial Class | $ | 57 | $ | 324 | $ | 611 | $ | 1,429 | ||||
Service Class | $ | 83 | $ | 402 | $ | 744 | $ | 1,711 | ||||
The Fund does not impose any Shareholder Fees. Therefore, the figures shown would be the same whether you sold your shares at the end of a period or kept them, although this does not include any surrender charges that may be imposed if you withdraw the proceeds from your variable life insurance or variable annuity contract.
| (1) | The expenses in the above table are based on expenses for the fiscal year ended December 31, 2008. |
| (2) | Rule 12b-1 Fees reflect current fees in effect that the Fund’s Board of Trustees has determined not to raise through at least May 2, 2010. |
| (3) | Other expenses are based on estimated amounts for the first full fiscal year. |
| (4) | The expenses in the above table reflect written agreements by MassMutual to bear the expenses (other than the management fees, interest, taxes, brokerage commissions, extraordinary litigation and legal expenses, or other non-recurring or unusual expenses) in excess of .11% of the average daily net asset values through May 2, 2010 for Initial Class and Service Class shares. The agreements cannot be terminated unilaterally by MassMutual. |
– 9 –
MML Small Cap Growth Equity Fund
Investment Objective
This Fund seeks long-term capital appreciation.
Principal Investment Strategies and Risks
The Fund seeks to achieve its objective by investing primarily in common stocks and equity securities of smaller companies which the managers believe offer potential for long-term growth. The Fund may maintain cash reserves for liquidity and defensive purposes. Normally, the Fund invests at least 80% of its net assets in the securities of companies whose market capitalizations, at the time of purchase, fall within the range of companies in the Russell 2000® Index or the S&P SmallCap 600 Index – (as of February 28, 2009, the market capitalization ranges of the indices were $3.22 million to $3.69 billion and $15.09 million to $2.09 billion, respectively). The range of capitalizations of companies included in each index will fluctuate as market prices increase or decrease. Two Sub-Advisers manage the Fund, each being responsible for a portion of the portfolio, but not necessarily equal weighted. Each Sub-Adviser will not automatically sell the stock of a company it already owns just because the company’s market capitalization no longer falls within the range of companies in either index. The Fund may invest up to 20% of its total assets in foreign securities. Foreign securities may include securities of issuers in both developed and emerging countries, and may consist of securities denominated in U.S. dollars or in foreign currencies. In pursuing its investment strategy, the Fund may (but it is not obligated to) use a wide variety of exchange-traded and over-the-counter derivative instruments, including options, futures and swap contracts.
Wellington Management Company, LLP(“Wellington Management”) employs two investment approaches: one used by Kenneth Abrams and one used by Steven Angeli.
Wellington Management’s investment approach used by Mr. Abrams emphasizes its own proprietary fundamental research and bottom-up stock selection to identify what it believes to be the best small-capitalization companies. It is anticipated that these companies will generally share several common characteristics: financial strength; top market share; significant insider ownership; a high level of focus on core businesses; favorable industry dynamics; andsignificant potential appreciation over a three-year time horizon.
Wellington Management’s investment approach used by Mr. Angeli employs its own proprietary fundamental research and bottom-up stock selection to identify small-capitalization growth companies believed to have significant appreciation potential. This approach looks at both the life-cycle of a company and its fundamental characteristics. Companies whose stocks are purchased for the Fund generally will share several common characteristics: sustainable revenue growth; superior market position; positive financial trends; and high quality management.
Both of the investment approaches employed by Wellington Management will generally sell companies from the Fund when: target prices are reached; detailed evaluation suggests that future upside potential is limited; company fundamentals are no longer attractive; superior purchase candidates are identified; or market capitalization ceilings are exceeded.
Waddell & Reed Investment Management Company(“Waddell & Reed”) uses a bottom-up process of stock selection, generally emphasizing long-term growth potential and superior financial characteristics, such as: annual revenue and earnings growth rate of 15-20%+, pre-tax margins of 20%+, and low-debt capital structure. Generally, companies also are considered which are strong niche players with a defensible market position, have active involvement of the founder-entrepreneur, and demonstrate commitment to their employees, customers, suppliers and shareholders.
Waddell & Reed typically buys companies with an anticipated 3-5 year holding period, and therefore expects its portion of the Fund’s portfolio typically to have lower than 50% annual turnover. Waddell & Reed may sell a company if its fundamentals decline, the original investment thesis is no longer valid or if, in Waddell & Reed’s view, the company’s valuation is deemed too high.
The Principal Risks of investing in the Fund are Market Risk, Credit Risk, Management Risk, Liquidity Risk, Derivative Risk, Foreign Investment Risk, Emerging Markets Risk, Currency Risk, Smaller and Mid-Cap Company Risk, Growth Company Risk, Over-the-Counter Risk and Leveraging Risk.
These Risks are described beginning on page 16.
– 10 –
Annual Performance
The bar chart shows the risks of investing in the Fund by showing changes in the Fund’s performance from year to year. The returns shown are net of Fund expenses, but do not reflect the fees and expenses deducted under the variable life insurance or variable annuity contract through which you invest in the Fund. The returns would be lower if those fees and expenses were included.
Initial Class Shares
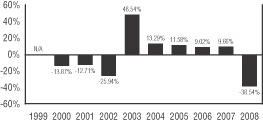
During the periods shown above, the highest quarterly return was 26.95% for the quarter ended December 31, 2001 and the lowest was -28.17% for the quarter ended September 30, 2001.
Average Annual Total Returns
(for the periods ended December 31, 2008)
The table shows the risks of investing in the Fund by comparing the Fund’s returns with a broad measure of market performance over different time periods. The returns shown are net of Fund expenses, but do not reflect the fees and expenses deducted under the variable life insurance or variable annuity contract through which you invest in the Fund. The returns would be lower if those fees and expenses were included.
| One Year | Five Years | Since Inception (05/03/99) | |||||||
MML Small Cap Growth Equity Fund Initial Class | - | 38.54% | - | 1.47% | 2.53% | ||||
MML Small Cap Growth Equity Fund Service Class(1) | - | 38.71% | - | 1.72% | 2.26% | ||||
Russell 2000 Growth Index(2) | - | 38.54% | - | 2.35% | - | 1.48% | |||
Russell 2000 Index(3) | - | 33.79% | - | 0.93% | 2.81% | ||||
| (1) | Performance for Service Class shares of the Fund for periods prior to its inception date (08/15/08) is based on the performance of Initial Class shares, adjusted to reflect Service Class expenses. |
(2) | The Russell 2000 Growth Index is a widely recognized, unmanaged index that measures the performance of those Russell 2000 Index companies (representing small-capitalization U.S. common stocks) with higher price-to-book ratios and forecasted growth rates. The Index does not incur expenses or reflect any deduction for taxes and cannot be purchased directly by investors. |
| (3) | The Russell 2000 Index is a widely recognized, unmanaged index representative of common stocks of smaller capitalized, U.S. companies. The Index does not incur expenses or reflect any deduction for taxes and cannot be purchased directly by investors. |
Expense Information
This table describes the fees and expenses that you may pay if you buy and hold shares of the Fund. The expenses in the table do not reflect deductions at the separate account level or contract level for any charges that may be incurred under a variable life insurance or variable annuity contract.
| Initial Class(1) | Service | ||||
| Annual Fund Operating Expenses (expenses that are deducted from Fund assets) (% of average net assets) | |||||
Management Fees | 1.07% | 1.07% | |||
Distribution and Service (Rule | N/A | .25% | |||
Other Expenses(3) | .09% | .09% | (4) | ||
| Total Annual Fund Operating Expenses(5) | 1.16% | 1.41% |
Examples
These examples are intended to help you compare the cost of investing in the Fund with the cost of investing in other mutual funds. The examples assume that you invest $10,000 in each share class of the Fund for the time periods indicated, that your investment earns a 5% return each year and that the Fund’s operating expenses are exactly as described in the preceding table. If separate account or variable life insurance or variable annuity contract expenses were included, overall expenses would be higher. Although your actual costs may be higher or lower, based on these assumptions your costs would be:
| 1 Year | 3 Years | 5 Years | 10 Years | |||||||||
Initial Class | $ | 118 | $ | 368 | $ | 638 | $ | 1,409 | ||||
Service Class | $ | 144 | $ | 446 | $ | 771 | $ | 1,691 | ||||
– 11 –
Investment Objective
This Fund seeks capital appreciation.
Principal Investment Strategies and Risks
The Fund seeks to achieve its objective by investing primarily in smaller, rapidly growing emerging growth companies, which may include companies growing earnings per share and/or revenues at above average rates. For this Fund, emerging growth companies are those whose market capitalizations, at the time of purchase, are less than or equal to the capitalization of the company with the largest capitalization in the Russell 2000® Index or the S&P SmallCap 600 Index – as of February 28, 2009, $3.69 billion. The identity or capitalization of the company with the largest capitalization in either index will fluctuate as market prices increase or decrease. The Fund is not required to sell the stock of a company it already owns just because the company’s market capitalization grows outside the range of companies in either index. Under normal circumstances, the Fund will invest at least 80% of its net assets in equity securities (primarily common stocks) of these emerging growth companies. The Fund will generally invest in industry segments experiencing rapid growth and will likely have a portion of its assets in technology and technology-related stocks. The Fund may invest in both domestic and foreign securities. The Fund may invest up to 20% of its total assets in foreign securities. Foreign securities may include securities of issuers in both developed and emerging countries, and may consist of securities denominated in U.S. dollars or in foreign currencies. The Fund may also use derivative instruments, including futures and options, in pursuing its investment strategy. The Fund is managed by two Sub-Advisers, each being responsible for a portion of the portfolio, but not necessarily equal weighted.
Essex Investment Management Company, LLC(“Essex”) has an investment philosophy that is based on the belief that the market is inefficient in analyzing smaller cap companies and that improving fundamentals, particularly future growth prospects that are not fully discounted in the price of a stock, will drive returns. Essex screens for companies showing evidence that business fundamentals are improving, as measured by accelerating earnings and revenue growth. Those companies that are early in the process of improvement, with the best relative acceleration, are placed on the “follow list.” From this pre-screening, Essex conducts fundamental analysis in order to identify growth factors, determine if they are sustainable, and evaluate whether current and future growth catalysts are factored into the current stock price. The catalysts giving rise to improving situations include corporate restructuring, industry consolidation, improving industry outlook, market share gains and new products.
Essex then identifies companies in the early stages of positive business and earnings change. This analysis allows Essex to understand, adeptly interpret and exploit the conservative nature of market analysts when they prepare earnings estimates. From this research process, Essex generates a rating and target price for each stock. Finally, Essex believes that balancing the upside in a stock with the risk is an important component for any portfolio candidate.
The buy criteria for Essex include the following:
| · | Accelerating earnings and revenues; |
| · | Sustainability of revenue and earnings growth; |
| · | Highly-developed/scaleable business model; and |
| · | Attractive fair value, risk/reward and target price. |
The sell criteria for Essex include the following:
| · | Breakdown in company fundamentals and investment thesis; |
| · | Anticipated earnings disappointment/deceleration; |
| · | Over valued relative to Essex’s growth projections; and |
| · | Better relative investment opportunity. |
Insight Capital Research & Management, Inc.(“Insight Capital”) uses a disciplined, three-step process to evaluate the investable domestic universe of actively traded public companies. The process includes quantitative analysis, fundamental analysis, and a stock price performance analysis. Insight Capital’s approach to portfolio construction is based on a “bottom-up” approach. Insight Capital typically invests in a portfolio containing 40-60 stocks.
Insight Capital considers companies that it believes demonstrate:
| · | rapid growth in sales and earnings; |
| · | attractive relative risk/return characteristics; |
| · | highly defensible competitive advantages; |
| · | strong management teams; and |
| · | stocks with good relative performance. |
Insight Capital may sell a security when in its view the security’s performance deteriorates relative to the market. A security may also be sold if the company’s fundamental attractiveness weakens – this may include slowing earnings growth, or a prospective slowing of earnings growth.
The Principal Risks of investing in the Fund are Market Risk, Credit Risk, Management Risk, Liquidity Risk, Derivative Risk, Foreign Investment Risk, Emerging Markets Risk, Currency Risk, Smaller and Mid-Cap Company Risk, Growth Company Risk, Leveraging Risk and Portfolio Turnover Risk.
These Risks are described beginning on page 16.
– 14 –
Annual Performance
The bar chart shows the risks of investing in the Fund by showing changes in the Fund’s performance from year to year. The returns shown are net of Fund expenses, but do not reflect the fees and expenses deducted under the variable life insurance or variable annuity contract through which you invest in the Fund. The returns would be lower if those fees and expenses were included.
Initial Class Shares
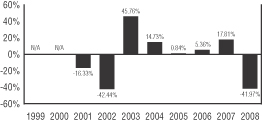
During the periods shown above, the highest quarterly return was 30.02% for the quarter ended December 31, 2001 and the lowest was -30.65% for the quarter ended September 30, 2001.
Average Annual Total Returns
(for the periods ended December 31, 2008)
The table shows the risks of investing in the Fund by comparing the Fund’s returns with a broad measure of market performance over different time periods. The returns shown are net of Fund expenses, but do not reflect the fees and expenses deducted under the variable life insurance or variable annuity contract through which you invest in the Fund. The returns would be lower if those fees and expenses were included.
One Year | Five Years | Since Inception (05/01/00) | ||||
MML Emerging Growth Fund Initial Class | -41.97% | -3.58% | -9.28% | |||
MML Emerging Growth Fund Service Class(1) | -42.12% | -3.82% | -9.51% | |||
Russell 2000 Growth Index(2) | -38.54% | -2.35% | -4.70% |
(1) Performance for Service Class shares of the Fund for periods prior to its inception date (08/15/08) is based on the performance of Initial Class shares, adjusted to reflect Service Class expenses.
(2) The Russell 2000 Growth Index is a widely recognized, unmanaged index that measures the performance of those Russell 2000 Index companies (representing small-capitalization U.S. common stocks) with higher price-to-book ratios and forecasted growth rates. The Index does not incur expenses or reflect any deduction for taxes and cannot be purchased directly by investors.
Expense Information
This table describes the fees and expenses that you may pay if you buy and hold shares of the Fund. The expenses in the table do not reflect deductions at the separate account level or contract level for any charges that may be incurred under a variable life insurance or variable annuity contract.
| Initial Class(1) | Service Class | |||||
| Annual Fund Operating Expenses (expenses that are deducted from Fund assets) (% of average net assets) | ||||||
Management Fees | 1.05% | 1.05% | ||||
Distribution and Service (Rule 12b-1) Fees(2) | N/A | .25% | ||||
Other Expenses | .53% | .53% | (3) | |||
Total Annual Fund Operating Expenses | 1.58% | 1.83% | ||||
Less Expense Reimbursement | (.33% | ) | (.33% | ) | ||
Net Fund Expenses(4) | 1.25% | 1.50% |
Examples
These examples are intended to help you compare the cost of investing in the Fund with the cost of investing in other mutual funds. The examples assume that you invest $10,000 in each share class of the Fund for the time periods indicated, that your investment earns a 5% return each year and that the Fund’s operating expenses are exactly as described in the preceding table. If separate account or variable life insurance or variable annuity contract expenses were included, overall expenses would be higher. Although your actual costs may be higher or lower, based on these assumptions your costs would be:
| 1 Year | 3 Years | 5 Years | 10 Years | |||||||||
Initial Class | $ | 127 | $ | 467 | $ | 829 | $ | 1,850 | ||||
Service Class | $ | 153 | $ | 544 | $ | 960 | $ | 2,121 | ||||
The Fund does not impose any Shareholder Fees. Therefore, the figures shown would be the same whether you sold your shares at the end of a period or kept them, although this does not include any surrender charges that may be imposed if you withdraw the proceeds from your variable life insurance or variable annuity contract.
| (1) | The expenses in the above table are based on expenses for the fiscal year ended December 31, 2008. |
| (2) | Rule 12b-1 Fees reflect current fees in effect that the Fund’s Board of Trustees has determined not to raise through at least May 2, 2010. |
| (3) | Other expenses are based on estimated amounts for the first full fiscal year. |
| (4) | The expenses in the above table reflect written agreements by MassMutual to bear the expense (other than the management fees, interest, taxes, brokerage commissions, extraordinary litigation and legal expenses, or other non-recurring or unusual expenses) in excess of .20% of the average daily net asset values through May 2, 2010 for Initial Class and Service Class shares. The agreements cannot be terminated unilaterally by MassMutual. |
– 15 –
The financial highlights tables are intended to help you understand the Funds’ financial performance for the past 5 years (or shorter periods for newer Funds). Certain information reflects financial results for a single Fund share. The total returns in the tables represent the rate that an investor would have earned on an investment in the Fund (assuming reinvestment of all dividends and distributions) but do not include charges and expenses attributable to any insurance product. Any such charges and expenses would reduce the total return figures for the periods shown. This information has been audited by Deloitte & Touche LLP, whose report, along with the Funds’ financial statements, is included in the Funds’ Annual Report, which is available on request.
MML LARGE CAP VALUE FUND
Initial Class | ||||||||||||||||||||
| Year Ended 12/31/08 | Year Ended 12/31/07 | Year Ended 12/31/06 | Year Ended 12/31/05††† | Year Ended 12/31/04 | ||||||||||||||||
Net asset value, beginning of year | $ | 13.21 | $ | 12.80 | $ | 11.27 | $ | 10.38 | $ | 9.35 | ||||||||||
Income (loss) from investment operations: | ||||||||||||||||||||
Net investment income (loss) | 0.10 | *** | 0.15 | *** | 0.09 | *** | 0.09 | *** | 0.06 | |||||||||||
Net realized and unrealized gain (loss) on investments | (5.29 | ) | 0.39 | 1.52 | 0.87 | 1.04 | ||||||||||||||
Total income (loss) from investment operations | (5.19 | ) | 0.54 | 1.61 | 0.96 | 1.10 | ||||||||||||||
Less distributions to shareholders: | ||||||||||||||||||||
From net investment income | - | (0.13 | ) | (0.08) | (0.07 | ) | (0.07 | ) | ||||||||||||
From net realized gains | (0.01 | ) | - | - | - | - | ||||||||||||||
Tax return of capital | - | - | - | (0.00 | )† | - | ||||||||||||||
Total distributions | (0.01 | ) | (0.13 | ) | (0.08 | ) | (0.07 | ) | (0.07 | ) | ||||||||||
Net asset value, end of year | $ | 8.01 | $ | 13.21 | $ | 12.80 | $ | 11.27 | $ | 10.38 | ||||||||||
Total Return^^ | (39.30%) | 4.22% | 14.18% | 9.38% | 11.79% | |||||||||||||||
Ratios / Supplemental Data: | ||||||||||||||||||||
Net assets, end of year (000’s) | $ | 175,313 | $ | 290,938 | $ | 216,821 | $ | 133,756 | $ | 82,898 | ||||||||||
Ratio of expenses to average daily net assets: | ||||||||||||||||||||
Before expense waiver | 0.84% | 0.82% | 0.85% | 0.89% | 0.87% | |||||||||||||||
After expense waiver | N/A | N/A | N/A | N/A | 0.87% | #^^^ | ||||||||||||||
Net investment income (loss) to average daily net assets | 0.92% | 1.10% | 0.80% | 0.81% | 0.78% | |||||||||||||||
Portfolio turnover rate | 20% | 7% | 10% | 3% | 3% | |||||||||||||||
Service Class | ||||||||||||||||||||
| Period Ended 12/31/08+++ | ||||||||||||||||||||
Net asset value, beginning of period | $ | 11.57 | ||||||||||||||||||
Income (loss) from investment operations: | ||||||||||||||||||||
Net investment income (loss) | 0.01 | *** | ||||||||||||||||||
Net realized and unrealized gain (loss) on investments | (3.56) | |||||||||||||||||||
Total income (loss) from investment operations | (3.55) | |||||||||||||||||||
Less distributions to shareholders: | ||||||||||||||||||||
From net realized gains | (0.01) | |||||||||||||||||||
Total distributions | (0.01) | |||||||||||||||||||
Net asset value, end of period | $ | 8.01 | ||||||||||||||||||
Total Return^^ | (30.69%) | ** | ||||||||||||||||||
Ratios / Supplemental Data: | ||||||||||||||||||||
Net assets, end of period (000’s) | $ | 4,823 | ||||||||||||||||||
Net expenses to average daily net assets | 1.12% | * | ||||||||||||||||||
Net investment income (loss) to average daily net assets | 0.48% | * | ||||||||||||||||||
Portfolio turnover rate | 20% | |||||||||||||||||||
| * | Annualized. |
| ** | Percentage represents the results for the period and is not annualized. |
| *** | Per share amount calculated on the average shares method. |
| † | Amount is less than $0.005 per share. |
| ††† | Effective January 1, 2005, rebated brokerage commissions are included with realized gain or loss on investment transactions. Prior to January 1, 2005, these amounts were presented as a reduction of expenses. Prior year amounts have not been restated to reflect this change due to immateriality. |
| +++ | For the period August 15, 2008 (commencement of operations) through December 31, 2008. |
| # | Computed after giving effect to an agreement by MassMutual to waive certain fees and expenses of the Fund. |
| ^^ | Total return does not reflect expenses that apply at the separate account level or to related insurance products. Inclusion of these charges would reduce the total return figures for all periods shown. |
| ^^^ | The Fund has entered into agreements with certain brokers to rebate a portion of brokerage commissions. The rebated commissions were used to reduce operating expenses of the Fund. |
– 30 –
MML EQUITY INDEX FUND
Class I | ||||||||||||||||||||
| Year Ended 12/31/08 | Year Ended 12/31/07 | Year Ended 12/31/06 | Year Ended 12/31/05 | Year Ended 12/31/04 | ||||||||||||||||
Net asset value, beginning of year | $ | 18.06 | $ | 17.45 | $ | 15.36 | $ | 14.90 | $ | 13.71 | ||||||||||
Income (loss) from investment operations: | ||||||||||||||||||||
Net investment income (loss) | 0.29 | *** | 0.28 | *** | 0.25 | *** | 0.21 | *** | 0.22 | *** | ||||||||||
Net realized and unrealized gain (loss) on investments | (7.02 | ) | 0.61 | 2.10 | 0.47 | 1.21 | ||||||||||||||
Total income (loss) from investment operations | (6.73 | ) | 0.89 | 2.35 | 0.68 | 1.43 | ||||||||||||||
Less distributions to shareholders: | ||||||||||||||||||||
From net investment income | - | (0.28 | ) | (0.26 | ) | (0.22 | ) | (0.24 | ) | |||||||||||
Tax return of capital | - | - | - | (0.00 | )† | - | ||||||||||||||
Total distributions | - | (0.28 | ) | (0.26 | ) | (0.22 | ) | (0.24 | ) | |||||||||||
Net asset value, end of year | $ | 11.33 | $ | 18.06 | $ | 17.45 | $ | 15.36 | $ | 14.90 | ||||||||||
Total Return^^ | (37.26)% | 5.13% | 15.30% | 4.53% | 10.42% | |||||||||||||||
Ratios / Supplemental Data: | ||||||||||||||||||||
Net assets, end of year (000’s) | $ | 48,279 | $ | 88,058 | $ | 85,288 | $ | 76,012 | $ | 85,138 | ||||||||||
Ratio of expenses to average daily net assets: | ||||||||||||||||||||
Before expense waiver | 0.45% | 0.45% | 0.46% | 0.48% | 0.44% | |||||||||||||||
After expense waiver | N/A | ## | N/A | 0.45% | # | 0.45% | # | N/A | ||||||||||||
Net investment income (loss) to average daily net assets | 1.88% | 1.53% | 1.54% | 1.42% | 1.60% | |||||||||||||||
Portfolio turnover rate | 5% | 6% | 4% | 4% | 4% | |||||||||||||||
Class II | ||||||||||||||||||||
Year Ended | Year Ended | Year Ended | Year Ended | Year Ended | ||||||||||||||||
Net asset value, beginning of year | $ | 18.04 | $ | 17.44 | $ | 15.34 | $ | 14.89 | $ | 13.70 | ||||||||||
Income (loss) from investment operations: | ||||||||||||||||||||
Net investment income (loss) | 0.31 | *** | 0.31 | *** | 0.28 | *** | 0.24 | *** | 0.25 | *** | ||||||||||
Net realized and unrealized gain (loss) on investments | (7.01 | ) | 0.60 | 2.10 | 0.45 | 1.20 | ||||||||||||||
Total income (loss) from investment operations | (6.70 | ) | 0.91 | 2.38 | 0.69 | 1.45 | ||||||||||||||
Less distributions to shareholders: | ||||||||||||||||||||
From net investment income | - | (0.31 | ) | (0.28 | ) | (0.24 | ) | (0.26 | ) | |||||||||||
Tax return of capital | - | - | - | (0.00 | )† | - | ||||||||||||||
Total distributions | - | (0.31 | ) | (0.28 | ) | (0.24 | ) | (0.26 | ) | |||||||||||
Net asset value, end of year | $ | 11.34 | $ | 18.04 | $ | 17.44 | $ | 15.34 | $ | 14.89 | ||||||||||
Total Return^^ | (37.14)% | 5.24% | 15.54% | 4.65% | 10.60% | |||||||||||||||
Ratios / Supplemental Data: | ||||||||||||||||||||
Net assets, end of year (000’s) | $ | 117,274 | $ | 197,826 | $ | 189,688 | $ | 182,390 | $ | 184,271 | ||||||||||
Ratio of expenses to average daily net assets: | ||||||||||||||||||||
Before expense waiver | 0.34% | 0.34% | 0.35% | 0.37% | 0.33% | |||||||||||||||
After expense waiver | 0.29% | # | 0.29% | # | 0.29% | # | 0.29% | # | 0.27% | # | ||||||||||
Net investment income (loss) to average daily net assets | 2.01% | 1.69% | 1.70% | 1.59% | 1.75% | |||||||||||||||
Portfolio turnover rate | 5% | 6% | 4% | 4% | 4% | |||||||||||||||
| *** | Per share amount calculated on the average shares method. |
| † | Amount is less than $0.005 per share. |
| # | Computed after giving effect to an agreement by MassMutual to waive certain fees and expenses of the Fund. |
| ## | Amount waived had no impact on the ratio of expenses to average daily net assets. |
| ^^ | Total return does not reflect expenses that apply at the separate account level or to related insurance products. Inclusion of these charges would reduce the total return figures for all periods shown. |
– 31 –
MML EQUITY INDEX FUND
Class III | ||||||||||||||||||||
| Year Ended 12/31/08 | Year Ended 12/31/07 | Year Ended 12/31/06 | Year Ended 12/31/05 | Year Ended 12/31/04 | ||||||||||||||||
Net asset value, beginning of year | $ | 18.01 | $ | 17.41 | $ | 15.31 | $ | 14.86 | $ | 13.67 | ||||||||||
Income (loss) from investment operations: | ||||||||||||||||||||
Net investment income (loss) | 0.34 | *** | 0.33 | *** | 0.30 | *** | 0.26 | *** | 0.26 | *** | ||||||||||
Net realized and unrealized gain (loss) on investments | (7.02 | ) | 0.61 | 2.11 | 0.46 | 1.21 | ||||||||||||||
Total income (loss) from investment operations | (6.68 | ) | 0.94 | 2.41 | 0.72 | 1.47 | ||||||||||||||
Less distributions to shareholders: | ||||||||||||||||||||
From net investment income | - | (0.34 | ) | (0.31 | ) | (0.27 | ) | (0.28 | ) | |||||||||||
Tax return of capital | - | - | - | (0.00 | )† | - | ||||||||||||||
Total distributions | - | (0.34 | ) | (0.31 | ) | (0.27 | ) | (0.28 | ) | |||||||||||
Net asset value, end of year | $ | 11.33 | $ | 18.01 | $ | 17.41 | $ | 15.31 | $ | 14.86 | ||||||||||
Total Return^^ | (37.09)% | 5.40% | 15.72% | 4.80% | 10.77% | |||||||||||||||
Ratios / Supplemental Data: | ||||||||||||||||||||
Net assets, end of year (000’s) | $ | 76,287 | $ | 122,979 | $ | 127,549 | $ | 137,295 | $ | 136,927 | ||||||||||
Ratio of expenses to average daily net assets: | ||||||||||||||||||||
Before expense waiver | 0.20% | 0.20% | 0.21% | 0.23% | 0.19% | |||||||||||||||
After expense waiver | 0.15% | # | 0.15% | # | 0.15% | # | 0.15% | # | 0.14% | # | ||||||||||
Net investment income (loss) to average daily net assets | 2.23% | 1.83% | 1.83% | 1.72% | 1.88% | |||||||||||||||
Portfolio turnover rate | 5% | 6% | 4% | 4% | 4% | |||||||||||||||
Service Class I | ||||||||||||||||||||
| Period Ended 12/31/08+++ | ||||||||||||||||||||
Net asset value, beginning of period | $ | 16.07 | ||||||||||||||||||
Income (loss) from investment operations: | ||||||||||||||||||||
Net investment income (loss) | 0.10 | *** | ||||||||||||||||||
Net realized and unrealized gain (loss) on investments | (4.85 | ) | ||||||||||||||||||
Total income (loss) from investment operations | (4.75 | ) | ||||||||||||||||||
Net asset value, end of period | $ | 11.32 | ||||||||||||||||||
Total Return^^ | (29.56)% | ** | ||||||||||||||||||
Ratios / Supplemental Data: | ||||||||||||||||||||
Net assets, end of period (000’s) | $ | 478 | ||||||||||||||||||
Ratio of expenses to average daily net assets: | ||||||||||||||||||||
Before expense waiver | 0.72% | * | ||||||||||||||||||
After expense waiver | 0.70% | *# | ||||||||||||||||||
Net investment income (loss) to average daily net assets | 2.33% | * | ||||||||||||||||||
Portfolio turnover rate | 5% | |||||||||||||||||||
| * | Annualized. |
| ** | Percentage represents the results for the period and is not annualized. |
| *** | Per share amount calculated on the average shares method. |
| † | Amount is less than $0.005 per share. |
| +++ | For the period August 15, 2008 (commencement of operations) through December 31, 2008. |
| # | Computed after giving effect to an agreement by MassMutual to waive certain fees and expenses of the Fund. |
| ^^ | Total return does not reflect expenses that apply at the separate account level or to related insurance products. Inclusion of these charges would reduce the total return figures for all periods shown. |
– 32 –
MML NASDAQ-100 FUND
Initial Class | ||||||||||||||||||||
| Year Ended 12/31/08 | Year Ended 12/31/07 | Year Ended 12/31/06 | Year Ended 12/31/05 | Year Ended 12/31/04 | ||||||||||||||||
Net asset value, beginning of year | $ | 5.30 | $ | 4.46 | $ | 4.18 | $ | 4.13 | $ | 3.76 | ||||||||||
Income (loss) from investment operations: | ||||||||||||||||||||
Net investment income (loss) | 0.00 | ***† | 0.00 | ***† | 0.01 | *** | 0.00 | ***† | 0.02 | |||||||||||
Net realized and unrealized gain (loss) on investments | (2.22 | ) | 0.84 | 0.27 | 0.05 | 0.37 | ||||||||||||||
Total income (loss) from investment operations | (2.22 | ) | 0.84 | 0.28 | 0.05 | 0.39 | ||||||||||||||
Less distributions to shareholders: | ||||||||||||||||||||
From net investment income | (0.00 | )† | (0.00 | )† | (0.00 | )† | (0.00 | )† | (0.02 | ) | ||||||||||
Total distributions | (0.00 | )† | (0.00 | )† | (0.00 | )† | (0.00 | )† | (0.02 | ) | ||||||||||
Net asset value, end of year | $ | 3.08 | $ | 5.30 | $ | 4.46 | $ | 4.18 | $ | 4.13 | ||||||||||
Total Return^^ | (41.89)% | 18.86% | 6.75% | 1.26% | 10.48% | |||||||||||||||
Ratios / Supplemental Data: | ||||||||||||||||||||
Net assets, end of year (000’s) | $ | 5,322 | $ | 10,369 | $ | 8,474 | $ | 9,496 | $ | 12,223 | ||||||||||
Ratio of expenses to average daily net assets: | ||||||||||||||||||||
Before expense waiver | 1.23% | 0.99% | 1.08% | 0.86% | 0.77% | |||||||||||||||
After expense waiver | 0.56% | # | 0.56% | # | 0.56% | # | 0.56% | # | 0.56% | # | ||||||||||
Net investment income (loss) to average daily net assets | 0.01% | 0.02% | 0.13% | 0.03% | 0.63% | |||||||||||||||
Portfolio turnover rate | 18% | 17% | 9% | 23% | 35% | |||||||||||||||
Service Class | ||||||||||||||||||||
| Period Ended 12/31/08+++ | ||||||||||||||||||||
Net asset value, beginning of period | $ | 4.99 | ||||||||||||||||||
Income (loss) from investment operations: | ||||||||||||||||||||
Net investment income (loss) | (0.00 | )***† | ||||||||||||||||||
Net realized and unrealized gain (loss) on investments | (1.91 | ) | ||||||||||||||||||
Total income (loss) from investment operations | (1.91 | ) | ||||||||||||||||||
Less distributions to shareholders: | ||||||||||||||||||||
From net investment income | (0.00 | )† | ||||||||||||||||||
Total distributions | (0.00 | )† | ||||||||||||||||||
Net asset value, end of period | $ | 3.08 | ||||||||||||||||||
Total Return^^ | (38.28)% | ** | ||||||||||||||||||
Ratios / Supplemental Data: | ||||||||||||||||||||
Net assets, end of period (000’s) | $ | 251 | ||||||||||||||||||
Ratio of expenses to average daily net assets: | ||||||||||||||||||||
Before expense waiver | 2.05% | * | ||||||||||||||||||
After expense waiver | 0.81% | *# | ||||||||||||||||||
Net investment income (loss) to average daily net assets | (0.16)% | * | ||||||||||||||||||
Portfolio turnover rate | 18% | |||||||||||||||||||
| * | Annualized. |
| ** | Percentage represents the results for the period and is not annualized. |
| *** | Per share amount calculated on the average shares method. |
| † | Amount is less than $0.005 per share. |
| +++ | For the period August 15, 2008 (commencement of operations) through December 31, 2008. |
| # | Computed after giving effect to an agreement by MassMutual to waive certain fees and expenses of the Fund. |
| ^^ | Total return does not reflect expenses that apply at the separate account level or to related insurance products. Inclusion of these charges would reduce the total return figures for all periods shown. |
– 33 –
MML SMALL CAP GROWTH EQUITY FUND
Initial Class | ||||||||||||||||||||
| Year Ended 12/31/08 | Year Ended 12/31/07 | Year Ended 12/31/06 | Year Ended 12/31/05††† | Year Ended 12/31/04 | ||||||||||||||||
Net asset value, beginning of year | $ | 17.02 | $ | 16.07 | $ | 14.73 | $ | 13.21 | $ | 11.66 | ||||||||||
Income (loss) from investment operations: | ||||||||||||||||||||
Net investment income (loss) | (0.01 | )*** | (0.07 | )*** | (0.06 | )*** | (0.05 | ) | (0.07 | ) | ||||||||||
Net realized and unrealized gain (loss) on investments | (6.55 | ) | 1.63 | 1.40 | 1.57 | 1.62 | ||||||||||||||
Total income (loss) from investment operations | (6.56 | ) | 1.56 | 1.34 | 1.52 | 1.55 | ||||||||||||||
Less distributions to shareholders: | ||||||||||||||||||||
From net investment income | - | (0.02 | ) | - | - | - | ||||||||||||||
From net realized gains | - | (0.59 | ) | - | - | - | ||||||||||||||
Total distributions | - | (0.61 | ) | - | - | - | ||||||||||||||
Net asset value, end of year | $ | 10.46 | $ | 17.02 | $ | 16.07 | $ | 14.73 | $ | 13.21 | ||||||||||
Total Return^^ | (38.54)% | 9.66% | 9.10% | 11.58% | 13.29% | |||||||||||||||
Ratios / Supplemental Data: | ||||||||||||||||||||
Net assets, end of year (000’s) | $ | 171,302 | $ | 238,185 | $ | 169,941 | $ | 105,008 | $ | 62,009 | ||||||||||
Ratio of expenses to average daily net assets: | ||||||||||||||||||||
Before expense waiver | 1.15% | 1.14% | 1.18% | 1.22% | 1.21% | |||||||||||||||
After expense waiver | N/A | N/A | N/A | 1.18% | # | 1.14% | #^^^ | |||||||||||||
Net investment income (loss) to average daily net assets | (0.06)% | (0.39)% | (0.41)% | (0.48)% | (0.63)% | |||||||||||||||
Portfolio turnover rate | 86% | 70% | 79% | 61% | 62% | |||||||||||||||
Service Class | ||||||||||||||||||||
| Period Ended 12/31/08+++ | ||||||||||||||||||||
Net asset value, beginning of period | $ | 15.79 | ||||||||||||||||||
Income (loss) from investment operations: | ||||||||||||||||||||
Net investment income (loss) | 0.01 | *** | ||||||||||||||||||
Net realized and unrealized gain (loss) on investments | (5.35 | ) | ||||||||||||||||||
Total income (loss) from investment operations | (5.34 | ) | ||||||||||||||||||
Net asset value, end of period | $ | 10.45 | ||||||||||||||||||
Total Return^^ | (33.82)% | ** | ||||||||||||||||||
Ratios / Supplemental Data: | ||||||||||||||||||||
Net assets, end of period (000’s) | $ | 831 | ||||||||||||||||||
Net expenses to average daily net assets | 1.43% | * | ||||||||||||||||||
Net investment income (loss) to average daily net assets | 0.21% | * | ||||||||||||||||||
Portfolio turnover rate | 86% | |||||||||||||||||||
| * | Annualized. |
| ** | Percentage represents the results for the period and is not annualized. |
| *** | Per share amount calculated on the average shares method. |
| ††† | Effective January 1, 2005, rebated brokerage commissions are included with realized gain or loss on investment transactions. Prior to January 1, 2005, these amounts were presented as a reduction of expenses. Prior year amounts have not been restated to reflect this change due to immateriality. |
| +++ | For the period August 15, 2008 (commencement of operations) through December 31, 2008. |
| # | Computed after giving effects to an agreement by MassMutual to waive certain fees and expenses of the Fund. |
| ^^ | Total return does not reflect expenses that apply at the separate account level or to related insurance products. Inclusion of these charges would reduce the total return figures for all periods shown. |
| ^^^ | The Fund has entered into agreements with certain brokers to rebate a portion of brokerage commissions. The rebated commissions were used to reduce operating expenses of the Fund. |
– 34 –
MML EMERGING GROWTH FUND
Initial Class | ||||||||||||||||||||
| Year Ended 12/31/08 | Year Ended 12/31/07 | Year Ended 12/31/06 | Year Ended 12/31/05 | Year Ended 12/31/04 | ||||||||||||||||
Net asset value, beginning of year | $ | 7.41 | $ | 6.29 | $ | 5.97 | $ | 5.92 | $ | 5.16 | ||||||||||
Income (loss) from investment operations: | ||||||||||||||||||||
Net investment income (loss) | (0.05 | )*** | (0.05 | )*** | (0.05 | )*** | (0.05 | ) | (0.05 | ) | ||||||||||
Net realized and unrealized gain (loss) on investments | (3.06 | ) | 1.17 | 0.37 | 0.10 | 0.81 | ||||||||||||||
Total income (loss) from investment operations | (3.11 | ) | 1.12 | 0.32 | 0.05 | 0.76 | ||||||||||||||
Net asset value, end of year | $ | 4.30 | $ | 7.41 | $ | 6.29 | $ | 5.97 | $ | 5.92 | ||||||||||
Total Return^^ | (41.97)% | 17.81% | 5.36% | 0.84% | 14.73% | |||||||||||||||
Ratios / Supplemental Data: | ||||||||||||||||||||
Net assets, end of year (000’s) | $ | 9,873 | $ | 18,911 | $ | 14,703 | $ | 13,807 | $ | 14,136 | ||||||||||
Ratio of expenses to average daily net assets: | ||||||||||||||||||||
Before expense waiver | 1.58% | 1.44% | 1.55% | 1.51% | 1.62% | |||||||||||||||
After expense waiver | 1.22% | # | 1.16% | # | 1.16% | # | 1.16% | # | 1.16% | # | ||||||||||
Net investment income (loss) to average daily net assets | (0.89)% | (0.72)% | (0.83)% | (0.91)% | (0.97)% | |||||||||||||||
Portfolio turnover rate | 280% | 195% | 291% | 127% | 184% | |||||||||||||||
Service Class | ||||||||||||||||||||
| Period Ended 12/31/08+++ | ||||||||||||||||||||
Net asset value, beginning of period | $ | 6.72 | ||||||||||||||||||
Income (loss) from investment operations: | ||||||||||||||||||||
Net investment income (loss) | (0.02 | )*** | ||||||||||||||||||
Net realized and unrealized gain (loss) on investments | (2.40 | ) | ||||||||||||||||||
Total income (loss) from investment operations | (2.42 | ) | ||||||||||||||||||
Net asset value, end of period | $ | 4.30 | ||||||||||||||||||
Total Return^^ | (36.01)% | ** | ||||||||||||||||||
Ratios / Supplemental Data: | ||||||||||||||||||||
Net assets, end of period (000’s) | $ | 181 | ||||||||||||||||||
Ratio of expenses to average daily net assets: | ||||||||||||||||||||
Before expense waiver | 2.27% | * | ||||||||||||||||||
After expense waiver | 1.50% | *# | ||||||||||||||||||
Net investment income (loss) to average daily net assets | (1.10)% | * | ||||||||||||||||||
Portfolio turnover rate | 280% | |||||||||||||||||||
| * | Annualized. |
| ** | Percentage represents the results for the period and is not annualized. |
| *** | Per share amount calculated on the average shares method. |
| +++ | For the period August 15, 2008 (commencement of operations) through December 31, 2008. |
| # | Computed after giving effect to an agreement by MassMutual to waive certain fees and expenses of the Fund. |
| ^^ | Total return does not reflect expenses that apply at the separate account level or to related insurance products. Inclusion of these charges would reduce the total return figures for all periods shown. |
– 35 –