UNITED STATES
SECURITIES AND EXCHANGE COMMISSION
Washington, D.C. 20549
FORM N-CSR
CERTIFIED SHAREHOLDER REPORT OF REGISTERED
MANAGEMENT INVESTMENT COMPANIES
| Investment Company Act file number | 811-02224 |
| |
| MML Series Investment Fund |
| (Exact name of registrant as specified in charter) |
| | |
| 100 Bright Meadow Blvd., Enfield, CT 06082 | |
| (Address of principal executive offices) | (Zip code) |
| | |
| Paul LaPiana |
| 100 Bright Meadow Blvd., Enfield, CT 06082 | |
| (Name and address of agent for service) |
| | | |
| Registrant's telephone number, including area code: | (860) 562-1000 | |
| | | |
| Date of fiscal year end: | 12/31/2020 | |
| | | |
| Date of reporting period: | 12/31/2020 | |
| |
| | | | | | | | | |
Item 1. Reports to Stockholders.

This material must be preceded or accompanied by a current prospectus (or summary prospectus, if available) for the MML Series Investment Fund. Investors should consider a Fund’s investment objective, risks, and charges and expenses carefully before investing. This and other information about the investment company is available in the prospectus (or summary prospectus, if available). Read it carefully before investing.
[THIS PAGE INTENTIONALLY LEFT BLANK]
MML Series Investment Fund – President’s Letter to Shareholders (Unaudited) |
To Our Shareholders

Paul LaPiana
“We encourage you to maintain perspective when it comes to retirement investing, despite short-term changes in the markets or day-to-day events that may seem unsettling. MassMutual’s view is that changing market conditions have the potential to reward patient investors.”
December 31, 2020
Markets advanced despite pandemic challenges
I am pleased to present you with the MML Series Investment Fund Annual Report, covering the year ended December 31, 2020 (the “fiscal year”). U.S. stocks were up over 18% for the reporting period, despite the global economic recession brought on by the COVID-19 pandemic, as investors looked past rising coronavirus case levels and responded positively to the global rollout of vaccinations, additional global fiscal stimulus, and a post-Brexit trade agreement between the U.K. and European Union. (“Brexit” – an abbreviation for “British exit” – refers to the United Kingdom’s withdrawal from the European Union.) A swift response to the pandemic by the Federal Reserve Board and Congress delivered unprecedented monetary and fiscal stimulus to support the U.S. economy and financial markets. The global response was similar in speed and magnitude. U.S. bond investors enjoyed positive returns in a falling yield environment, fueled by lower economic growth expectations, interest rate decreases, and supportive central bank policy.
Despite the ongoing challenges that investors face, it’s important to keep in mind that market conditions are cyclical and subject to change anytime. In MassMutual’s view, the market environment that ensued from the pandemic (with stocks largely selling off and then, for the most part, recovering) underscores the importance of maintaining a long-term perspective and avoiding reacting to current events. That’s why we continue to believe that retirement investors should create and maintain a plan that focuses on their goals, how long they have to invest, and how comfortable they are with market volatility.
Suggestions for retirement investors under any market conditions
● | You are likely in it for the long run. Investing for retirement doesn’t happen overnight. Most people save and invest for retirement throughout their working years. Although the financial markets will go up and down over time, taking a long-term approach to investing gives you more time to ride out the downturns as you work toward your retirement income goals. |
● | Keep contributing. While it’s impossible to control how your investments perform, you can control how often and how much you save. Saving as much as possible and increasing your contributions regularly is one way smart retirement investors can help boost their retirement savings, regardless of the investment environment.* |
● | Invest continually. Financial professionals often advise their clients to stay in the market, regardless of short-term results. Here’s why: Individuals who can invest in all market conditions have the potential to be rewarded even during market downturns, when more favorable prices may enable them to accumulate larger positions. This has the potential to put them at an advantage when the markets turn around. |
● | Monitor your asset allocation and diversify. Stocks, bonds, and short-term/money market investments are asset classes that tend to behave differently, depending upon the economic and market environment. Those broad asset classes contain an even greater array of asset sub-categories (such as small-cap stocks, international stocks, and high-yield bonds). Most financial professionals agree that investors can take advantage of different opportunities in the market and reduce the risk of over-exposure to one or two poorly performing asset types by selecting a number of investments that represent a mix of asset classes and sub-categories.* |
*Systematic investing and asset allocation do not ensure a profit or protect against loss in a declining market. Systematic investing involves continuous investment in securities regardless of fluctuating price levels. Investors should consider their ability to continue investing through periods of low price levels.
(Continued)
1
MML Series Investment Fund – President’s Letter to Shareholders (Unaudited) (Continued) |
If you work with a financial professional, you may wish to consider checking in with him or her to help you determine if:
● | you are saving enough for retirement; |
● | your retirement account is invested properly for all market conditions, based on your goals and objectives, as well as your investment time horizon; and |
● | you are taking the right steps to help reduce your longevity risk, which is the chance that you could “run out” of retirement savings during your lifetime. |
We live mutual, every day
MassMutual believes that humanity brings out the best in one another. That’s why, for nearly 170 years, through ups and downs and good times and bad, we have continually believed that we are stronger when we rely on one another. That’s also why we encourage you to maintain perspective when it comes to retirement investing, despite short-term changes in the markets or day-to-day events that may seem unsettling. MassMutual’s view is that changing market conditions have the potential to reward patient investors. Thank you for your continued confidence and trust in MassMutual.
Sincerely,

Paul LaPiana, CFP®
President
© 2021 Massachusetts Mutual Life Insurance Company (MassMutual®), Springfield, MA 01111-0001. All rights reserved. www.MassMutual.com Underwriter: MML Distributors, LLC (MMLD) Member FINRA and SIPC (www.FINRA.org and www.SIPC.org), 1295 State Street, Springfield, MA 01111. MMLD is a wholly owned subsidiary of MassMutual. Investment advisory services provided to the Funds by MML Investment Advisers, LLC (MML Advisers), a wholly owned subsidiary of MassMutual. The information provided is the opinion of MML Advisers as of 1/1/21 and is subject to change without notice. It is not to be construed as tax, legal, or investment advice. Of course, past performance does not guarantee future results.
2
MML Series Investment Fund – Economic and Market Overview (Unaudited) |
December 31, 2020
Market Highlights
● | For the reporting period from January 1, 2020 through December 31, 2020, U.S. stocks were up over 18%, despite the global economic recession brought on by the COVID-19 pandemic. |
● | The first quarter of 2020 was one of the most difficult quarters on record for the markets. COVID-19 fears turned to reality as “social distancing,” shuttered businesses, and the associated lost economic activity became the new norm. |
● | A swift response to the pandemic by the Federal Reserve Board and Congress delivered unprecedented monetary and fiscal stimulus to support the U.S. economy and financial markets. The global response was similar in speed and magnitude. |
● | Investors ended the period looking past rising COVID-19 cases and responding positively to the global rollout of COVID-19 vaccinations, additional global fiscal stimulus, and a post-Brexit trade agreement between the U.K. and European Union. |
● | Foreign stocks in developed markets and emerging markets also experienced gains in the fiscal year, aided by increasing economic activity in the second half of the year and the weakening of the U.S. dollar. |
● | U.S. bond investors enjoyed positive returns in a falling yield environment, fueled by lower economic growth expectations, interest rate declines, and supportive global central bank policy. |
Market Environment
Global stock investors experienced significant levels of volatility for the fiscal year beginning January 1, 2020. U.S. stocks rose steadily until mid-February, when the severity of the COVID-19 crisis was becoming apparent with rising case counts, hospitalizations, and deaths. Investor sentiment quickly turned negative, with March marking the end of the 11-year bull market. The S&P 500® Index* fell 34% from its February high to its March low, as the reality that the COVID-19 crisis had stalled the global economy and the imminence of a recession became evident.
Investors started the second quarter of 2020 facing increasing COVID-19 deaths, record unemployment levels, and expectations for an unprecedented decline in economic activity. Despite this, global markets ultimately recorded a strong second quarter, with investors responding positively to the massive amounts of monetary and fiscal stimulus. In addition, progress in combating COVID-19 and increasing economic activity, helped to fuel the market turnaround. Central banks supported bond market liquidity and kept interest rates low through government and corporate bond purchases.
Better-than-expected second-quarter corporate earnings, a strong rebound in housing demand, and progress on COVID-19 therapeutics and vaccine research helped to tamp down investor concerns and drove many stocks, especially in the information technology sector, to new highs in the third quarter of 2020. Positive economic and market momentum continued into the fourth quarter of the year, as investors looked past rising COVID-19 cases, responded positively to the global rollout of COVID-19 vaccinations and the signing of a $900 billion COVID-19 relief bill in the U.S. in late December, and cheered the post-Brexit trade agreement between the U.K. and European Union. (“Brexit” – an abbreviation for “British exit” – refers to the United Kingdom’s withdrawal from the European Union.) Improved expectations for economic activity in 2021 helped propel interest rates higher and the yield curve steeper.
The broad market S&P 500 Index delivered a strong 18.40% return for the fiscal year. The Dow Jones Industrial AverageSM was also up a healthy 9.72%. The technology-heavy NASDAQ Composite Index was one of the biggest winners, up 44.92% for the fiscal year. Small- and mid-cap stock indexes generally outperformed their larger peers, while growth stocks outperformed their value counterparts by over 35% during the period.
Eight of 11 sectors delivered positive returns for the fiscal year, led by information technology, consumer discretionary, communication services, and materials, which all enjoyed double-digit growth and beat the S&P 500 Index. The energy sector was the worst performer for the fiscal year, down nearly 34%. The financial and real estate sectors also ended in negative territory.
* Indexes referenced, other than the MSCI Indexes, are unmanaged, do not incur fees, expenses, or taxes, and cannot be purchased directly for investment. The MSCI Indexes are unmanaged, do not incur fees or expenses, and cannot be purchased directly for investment.
3
MML Series Investment Fund – Economic and Market Overview (Unaudited) (Continued) |
Developed international markets, as measured by the MSCI EAFE® Index, had a respectable year, ending the fiscal year up 7.82%. Emerging-market stocks, as measured by the MSCI Emerging Markets Index, fared significantly better, ending up 18.31% for the period. Both developed international and emerging-market stocks benefited from increasing economic activity in the second half of the fiscal year, as well as the weakening U.S. dollar.
Bond yields fell sharply during the fiscal year, with the 10-year U.S. Treasury bond yield falling from a high of 1.88% in January 2020 to end the fiscal year at 0.93%. Falling yields generally produce rising bond prices; consequently, bond index returns benefited. The Bloomberg Barclays U.S. Aggregate Bond Index ended the period up 7.51%. Investment-grade corporate bonds also advanced. The Bloomberg Barclays U.S. Corporate Bond Index, which tracks investment-grade corporate bonds, ended the period with a 9.89% gain. The Bloomberg Barclays U.S. Corporate High Yield Bond Index also ended in positive territory, advancing 7.11%, despite a rising level of corporate bankruptcies.
As we enter 2021, we view the stock markets as extended and valuations high relative to market history. While the prospect of lower financing, labor, and energy costs support a bull case, there is substantial uncertainty regarding the impacts of the U.S. presidential election, the timeline for large-scale COVID-19 vaccine deployment, and the health of the global economy. Against this backdrop, we feel that diversification across global assets could be a smart approach for what we believe may well be a bumpy ride in 2021.
At MassMutual, we remain convinced that a broadly diversified portfolio aligned with a long-term strategy is the wisest course for those investors seeking retirement income. We remind you that it is important to maintain perspective and have realistic expectations about the future performance of your investment portfolio. As described in this report, financial markets can reverse suddenly, stumble along sideways, and reverse again. As always, we recommend that you work with a personal financial professional, who can help you define an investment strategy that aligns with your comfort level with respect to markets like these, with how long you have to save and invest, and with your specific financial goals and risk tolerance. Thank you for your confidence in MassMutual.
The information provided is the opinion of MML Investment Advisers, LLC as of 1/1/2021 and is subject to change without notice. It is not to be construed as tax, legal, or investment advice. Of course, past performance does not guarantee future results.
4
MML Allocation Series – Portfolio Manager Report (Unaudited) |
What are the investment approaches of the Funds that constitute the MML Allocation Series (the “Series”), and who is the Series’ investment adviser?
The MML Allocation Series comprises five Funds – each of which has a “fund of funds” structure. The five Funds in the Series are MML Conservative Allocation Fund, MML Balanced Allocation Fund, MML Moderate Allocation Fund, MML Growth Allocation Fund, and MML Aggressive Allocation Fund.
Each Fund seeks to achieve as high a total return over time as is considered consistent with prudent investment risk, preservation of capital, and recognition of the Fund’s stated asset allocation. Each Fund invests in a combination of U.S. domestic and international mutual funds (“MML Underlying Funds”) using an asset allocation strategy. MML Underlying Funds will include a combination of series of the MML Series Investment Fund and MML Series Investment Fund II (advised by MML Investment Advisers, LLC (MML Advisers), a wholly-owned subsidiary of Massachusetts Mutual Life Insurance Company (MassMutual)), and may also include other, non-affiliated mutual funds. The MML Underlying Funds may invest in various asset classes, including equity securities, fixed income securities, and money market instruments. The Series’ investment adviser is MML Advisers.
Each Fund will normally invest most of its assets in MML Underlying Funds advised by MML Advisers; each Fund will normally invest no more than 10% of its assets in mutual funds not advised by MML Advisers (referred to here as “non-affiliated” funds).
Each Fund’s assets are allocated to its MML Underlying Funds according to an asset allocation strategy stated below.
● | MML Conservative Allocation Fund: Approximately 35% to 45% in equity funds and 55% to 65% in fixed income funds, including money market funds. |
● | MML Balanced Allocation Fund: Approximately 45% to 55% in equity funds and 45% to 55% in fixed income funds, including money market funds. |
● | MML Moderate Allocation Fund: Approximately 55% to 65% in equity funds and 35% to 45% in fixed income funds, including money market funds. |
● | MML Growth Allocation Fund: Approximately 70% to 80% in equity funds and 20% to 30% in fixed income funds, including money market funds. |
● | MML Aggressive Allocation Fund: Approximately 85% to 95% in equity funds and 5% to 15% in fixed income funds, including money market funds. |
How did each Fund perform during the 12 months ended December 31, 2020?
| | Fund’s Initial
Class Return | Custom
Index Return | Russell 3000®
Index Return | MSCI ACWI
ex USA Return | Bloomberg
Barclays U.S.
Aggregate Bond
Index Return |
MML Conservative | | | | | |
Allocation Fund | 9.93% | 13.35% | 20.89% | 10.65% | 7.51%* |
| | | | | | |
MML Balanced | | | | | |
Allocation Fund | 10.93% | 14.53% | 20.89%* | 10.65% | 7.51% |
| | | | | | |
MML Moderate | | | | | |
Allocation Fund | 10.54% | 15.57% | 20.89%* | 10.65% | 7.51% |
| | | | | | |
MML Growth | | | | | |
Allocation Fund | 12.76% | 16.87% | 20.89%* | 10.65% | 7.51% |
| | | | | | |
MML Aggressive | | | | | |
Allocation Fund | 13.35% | 17.84% | 20.89%* | 10.65% | 7.51% |
* Benchmark return
5
MML Allocation Series – Portfolio Manager Report (Unaudited) (Continued) |
All of the MML Allocation Series Funds underperformed their respective Custom Index as well as the Russell 3000 Index, which measures the performance of the 3000 largest U.S. companies representing approximately 98% of the investable U.S. equity market. All of the Funds except the MML Conservative Allocation Fund and the MML Moderate Allocation Fund outperformed the MSCI ACWI ex USA, which measures the performance of the large- and mid-cap segments of the particular regions, excluding U.S. equity securities, including developed and emerging markets, and all five funds in the Series outperformed the Bloomberg Barclays U.S. Aggregate Bond Index, which measures the performance of investment grade, U.S. dollar-denominated, fixed-rate taxable bond market securities, including Treasuries, government-related and corporate securities, mortgage-backed securities (MBS) (agency fixed-rate and hybrid ARM pass-throughs), asset-backed securities (ABS), and commercial mortgage-backed securities (CMBS), for the full year.
MML Allocation Fund Series Custom Indexes
● | The Custom MML Conservative Allocation Index comprises the Bloomberg Barclays U.S. Aggregate Bond, Russell 3000, and MSCI ACWI ex USA Indexes. The weightings of each index are 60%, 30%, and 10%, respectively. |
● | The Custom MML Balanced Allocation Index comprises the Bloomberg Barclays U.S. Aggregate Bond, Russell 3000, and MSCI ACWI ex USA Indexes. The weightings of each index are 50%, 37.5%, and 12.5%, respectively. |
● | The Custom MML Moderate Allocation Index comprises the Bloomberg Barclays U.S. Aggregate Bond, Russell 3000, and MSCI ACWI ex USA Indexes. The weightings of each index are 40%, 45%, and 15%, respectively. |
● | The Custom MML Growth Allocation Index comprises the Bloomberg Barclays U.S. Aggregate Bond, Russell 3000, and MSCI ACWI ex USA Indexes. The weightings of each index are 25%, 56.25%, and 18.75%, respectively. |
● | The Custom MML Aggressive Allocation Index comprises the Bloomberg Barclays U.S. Aggregate Bond, Russell 3000, and MSCI ACWI ex USA Indexes. The weightings of each index are 10%, 67.5%, and 22.5%, respectively. |
For a discussion on the economic and market environment during the 12-month period ended December 31, 2020, please see the Economic and Market Review, beginning on page 3.
Investment adviser discussion of factors that contributed to the Funds’ performance
For the year ended December 31, 2020, the Series Funds delivered positive returns, as stocks outperformed fixed-income investments. Consequently, those Series Funds with higher equity allocations outperformed their Series counterparts with higher fixed-income allocations.
Stock markets across the globe were up significantly for the year despite the COVID-19 panemic, as were the more credit- and interest rate-sensitive fixed-income markets. Allocations across various asset classes intended to diversify risk in the MML Underlying Funds delivered mixed results. The allocation to international and emerging-market stocks hurt performance, as non-U.S. stocks underperformed domestic equities in the face of a weak global economy. Allocations to corporate bonds generally helped performance, as U.S. corporate bonds outperformed U.S. government bonds in a year of unprecedented monetary and fiscal stimulus.
Manager selection of underlying Funds detracted from the Funds’ overall performance in 2020. Weak performance by MML International Equity Fund, MML Dynamic Bond Fund, and MML Short-Duration Bond Fund were significant drivers of the Funds’ underperformance. Strong results from MML Total Return Bond Fund and MML Inflation-Protected and Income Fund helped overall returns.
6
MML Allocation Series – Portfolio Manager Report (Unaudited) (Continued) |
Investment adviser outlook
As we enter 2021, Fund management views the stock markets as extended and valuations high relative to market history. While the prospect of lower financing, labor, and energy costs support a bull case, more clarity on the impacts of the U.S. presidential election results, timeline for large-scale COVID-19 vaccine deployment, and the health of the global economy is needed for the allocation to stocks to increase. Against this backdrop, Fund management believes that diversification across global assets could be a smart approach for what they believe to be a potentially bumpy ride in 2021.
7
MML Allocation Series – Portfolio Manager Report (Unaudited) (Continued) |
MML Conservative Allocation Fund
Asset Allocation
(% of Net Assets) on 12/31/20 |
Fixed Income Funds | 56.7% |
Equity Funds | 43.4% |
Total Long-Term Investments | 100.1% |
Other Assets & Liabilities | (0.1)% |
Net Assets | 100.0% |
| | |
MML Moderate Allocation Fund
Asset Allocation
(% of Net Assets) on 12/31/20 |
Equity Funds | 62.4% |
Fixed Income Funds | 37.7% |
Total Long-Term Investments | 100.1% |
Other Assets & Liabilities | (0.1)% |
Net Assets | 100.0% |
| | |
MML Balanced Allocation Fund
Asset Allocation
(% of Net Assets) on 12/31/20 |
Equity Funds | 51.0% |
Fixed Income Funds | 49.1% |
Total Long-Term Investments | 100.1% |
Other Assets & Liabilities | (0.1)% |
Net Assets | 100.0% |
| | |
MML Growth Allocation Fund
Asset Allocation
(% of Net Assets) on 12/31/20 |
Equity Funds | 75.5% |
Fixed Income Funds | 24.6% |
Total Long-Term Investments | 100.1% |
Other Assets & Liabilities | (0.1)% |
Net Assets | 100.0% |
| | |
MML Aggressive Allocation Fund
Asset Allocation
(% of Net Assets) on 12/31/20 |
Equity Funds | 90.5% |
Fixed Income Funds | 9.6% |
Total Long-Term Investments | 100.1% |
Other Assets & Liabilities | (0.1)% |
Net Assets | 100.0% |
| | |
8
MML Conservative Allocation Fund – Portfolio Manager Report (Unaudited) (Continued) |
GROWTH OF $10,000 INVESTMENT - INITIAL CLASS
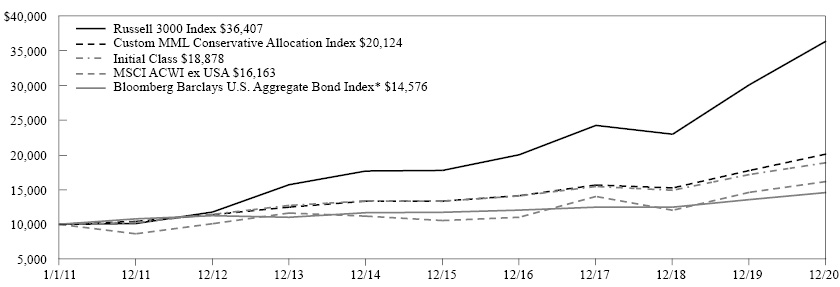
The graph above illustrates a representative class of the Fund’s historical performance for the past 10 fiscal years or since inception (for Funds lacking 10-year records) in comparison to its benchmark index, as well as one or more additional indexes, if applicable. The performance of other share classes will be greater than or less than the class depicted above.
Average Annual Total Returns (for the periods ended 12/31/2020) | | |
| Inception Date
of Class | 1 Year | 5 Years | 10 Years |
Initial Class | 08/31/2007 | 9.93% | 7.22% | 6.56% |
Service Class | 08/15/2008 | 9.67% | 6.96% | 6.29% |
Bloomberg Barclays U.S. Aggregate Bond Index* | | 7.51% | 4.44% | 3.84% |
Russell 3000 Index | | 20.89% | 15.43% | 13.79% |
MSCI ACWI ex USA | | 10.65% | 8.93% | 4.92% |
Custom MML Conservative Allocation Index | | 13.35% | 8.56% | 7.24% |
* Benchmark
Generally accepted accounting principles require adjustments to be made to the net assets of the Fund at period end for financial reporting purposes only, and as such, the total return based on the unadjusted net asset value per share may differ from the total return reported in the financial highlights.
Performance results in the graph and table reflect the percentage change in net asset value, including reinvestment of dividends and capital gains distributions. Investors should note that the Fund is a professionally managed mutual fund, while the index or indexes shown above are unmanaged, cannot be purchased directly, and, with the exception of any peer group index, do not incur expenses.
Performance data quoted in the graph and table represents past performance; past performance is not predictive of future results. The investment return and principal value of shares of the Fund fluctuate, so your shares, when sold, may be worth more or less than their original cost. Current performance of the Fund may be lower or higher than the performance quoted. The performance shown does not reflect the deduction of taxes, if any, that a shareholder would pay on Fund distributions or the redemption of Fund shares. Performance data current to the most recent month end may be obtained by calling 1-888-309-3539.
Investors should read the Fund’s prospectus with regard to the Fund’s investment objectives, risks, and charges and expenses in conjunction with these financial statements. The Fund’s return reflects changes in the net asset value per share without the deduction of any product charges (e.g., cost of insurance, mortality and expense risk charges, administrative fees, and CDSL). The inclusion of these charges would have reduced the performance shown here.
9
MML Balanced Allocation Fund – Portfolio Manager Report (Unaudited) (Continued) |
GROWTH OF $10,000 INVESTMENT - INITIAL CLASS
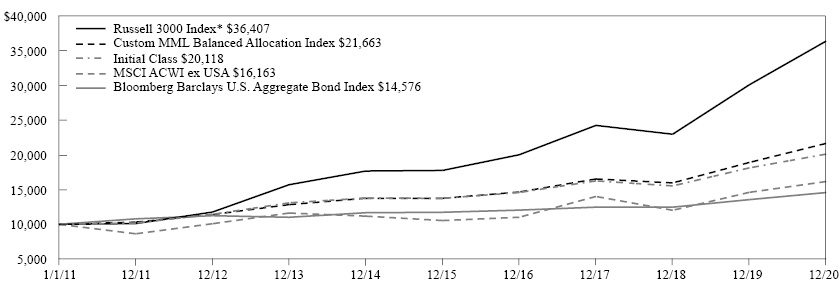
The graph above illustrates a representative class of the Fund’s historical performance for the past 10 fiscal years or since inception (for Funds lacking 10-year records) in comparison to its benchmark index, as well as one or more additional indexes, if applicable. The performance of other share classes will be greater than or less than the class depicted above.
Average Annual Total Returns (for the periods ended 12/31/2020) | | |
| Inception Date
of Class | 1 Year | 5 Years | 10 Years |
Initial Class | 08/31/2007 | 10.93% | 7.92% | 7.24% |
Service Class | 08/15/2008 | 10.65% | 7.65% | 6.98% |
Russell 3000 Index* | | 20.89% | 15.43% | 13.79% |
Bloomberg Barclays U.S. Aggregate Bond Index | | 7.51% | 4.44% | 3.84% |
MSCI ACWI ex USA | | 10.65% | 8.93% | 4.92% |
Custom MML Balanced Allocation Index | | 14.53% | 9.53% | 8.04% |
* Benchmark
Generally accepted accounting principles require adjustments to be made to the net assets of the Fund at period end for financial reporting purposes only, and as such, the total return based on the unadjusted net asset value per share may differ from the total return reported in the financial highlights.
Performance results in the graph and table reflect the percentage change in net asset value, including reinvestment of dividends and capital gains distributions. Investors should note that the Fund is a professionally managed mutual fund, while the index or indexes shown above are unmanaged, cannot be purchased directly, and, with the exception of any peer group index, do not incur expenses.
Performance data quoted in the graph and table represents past performance; past performance is not predictive of future results. The investment return and principal value of shares of the Fund fluctuate, so your shares, when sold, may be worth more or less than their original cost. Current performance of the Fund may be lower or higher than the performance quoted. The performance shown does not reflect the deduction of taxes, if any, that a shareholder would pay on Fund distributions or the redemption of Fund shares. Performance data current to the most recent month end may be obtained by calling 1-888-309-3539.
Investors should read the Fund’s prospectus with regard to the Fund’s investment objectives, risks, and charges and expenses in conjunction with these financial statements. The Fund’s return reflects changes in the net asset value per share without the deduction of any product charges (e.g., cost of insurance, mortality and expense risk charges, administrative fees, and CDSL). The inclusion of these charges would have reduced the performance shown here.
10
MML Moderate Allocation Fund – Portfolio Manager Report (Unaudited) (Continued) |
GROWTH OF $10,000 INVESTMENT - INITIAL CLASS

The graph above illustrates a representative class of the Fund’s historical performance for the past 10 fiscal years or since inception (for Funds lacking 10-year records) in comparison to its benchmark index, as well as one or more additional indexes, if applicable. The performance of other share classes will be greater than or less than the class depicted above.
Average Annual Total Returns (for the periods ended 12/31/2020) | | |
| Inception Date
of Class | 1 Year | 5 Years | 10 Years |
Initial Class | 08/31/2007 | 10.54% | 8.46% | 7.79% |
Service Class | 08/15/2008 | 10.16% | 8.17% | 7.51% |
Russell 3000 Index* | | 20.89% | 15.43% | 13.79% |
Bloomberg Barclays U.S. Aggregate Bond Index | | 7.51% | 4.44% | 3.84% |
MSCI ACWI ex USA | | 10.65% | 8.93% | 4.92% |
Custom MML Moderate Allocation Index | | 15.57% | 10.46% | 8.80% |
* Benchmark
Generally accepted accounting principles require adjustments to be made to the net assets of the Fund at period end for financial reporting purposes only, and as such, the total return based on the unadjusted net asset value per share may differ from the total return reported in the financial highlights.
Performance results in the graph and table reflect the percentage change in net asset value, including reinvestment of dividends and capital gains distributions. Investors should note that the Fund is a professionally managed mutual fund, while the index or indexes shown above are unmanaged, cannot be purchased directly, and, with the exception of any peer group index, do not incur expenses.
Performance data quoted in the graph and table represents past performance; past performance is not predictive of future results. The investment return and principal value of shares of the Fund fluctuate, so your shares, when sold, may be worth more or less than their original cost. Current performance of the Fund may be lower or higher than the performance quoted. The performance shown does not reflect the deduction of taxes, if any, that a shareholder would pay on Fund distributions or the redemption of Fund shares. Performance data current to the most recent month end may be obtained by calling 1-888-309-3539.
Investors should read the Fund’s prospectus with regard to the Fund’s investment objectives, risks, and charges and expenses in conjunction with these financial statements. The Fund’s return reflects changes in the net asset value per share without the deduction of any product charges (e.g., cost of insurance, mortality and expense risk charges, administrative fees, and CDSL). The inclusion of these charges would have reduced the performance shown here.
11
MML Growth Allocation Fund – Portfolio Manager Report (Unaudited) (Continued) |
GROWTH OF $10,000 INVESTMENT - INITIAL CLASS

The graph above illustrates a representative class of the Fund’s historical performance for the past 10 fiscal years or since inception (for Funds lacking 10-year records) in comparison to its benchmark index, as well as one or more additional indexes, if applicable. The performance of other share classes will be greater than or less than the class depicted above.
Average Annual Total Returns (for the periods ended 12/31/2020) | | |
| Inception Date
of Class | 1 Year | 5 Years | 10 Years |
Initial Class | 08/31/2007 | 12.76% | 9.70% | 8.84% |
Service Class | 08/15/2008 | 12.47% | 9.43% | 8.58% |
Russell 3000 Index* | | 20.89% | 15.43% | 13.79% |
Bloomberg Barclays U.S. Aggregate Bond Index | | 7.51% | 4.44% | 3.84% |
MSCI ACWI ex USA | | 10.65% | 8.93% | 4.92% |
Custom MML Growth Allocation Index | | 16.87% | 11.79% | 9.90% |
* Benchmark
Generally accepted accounting principles require adjustments to be made to the net assets of the Fund at period end for financial reporting purposes only, and as such, the total return based on the unadjusted net asset value per share may differ from the total return reported in the financial highlights.
Performance results in the graph and table reflect the percentage change in net asset value, including reinvestment of dividends and capital gains distributions. Investors should note that the Fund is a professionally managed mutual fund, while the index or indexes shown above are unmanaged, cannot be purchased directly, and, with the exception of any peer group index, do not incur expenses.
Performance data quoted in the graph and table represents past performance; past performance is not predictive of future results. The investment return and principal value of shares of the Fund fluctuate, so your shares, when sold, may be worth more or less than their original cost. Current performance of the Fund may be lower or higher than the performance quoted. The performance shown does not reflect the deduction of taxes, if any, that a shareholder would pay on Fund distributions or the redemption of Fund shares. Performance data current to the most recent month end may be obtained by calling 1-888-309-3539.
Investors should read the Fund’s prospectus with regard to the Fund’s investment objectives, risks, and charges and expenses in conjunction with these financial statements. The Fund’s return reflects changes in the net asset value per share without the deduction of any product charges (e.g., cost of insurance, mortality and expense risk charges, administrative fees, and CDSL). The inclusion of these charges would have reduced the performance shown here.
12
MML Aggressive Allocation Fund – Portfolio Manager Report (Unaudited) (Continued) |
GROWTH OF $10,000 INVESTMENT - INITIAL CLASS

The graph above illustrates a representative class of the Fund’s historical performance for the past 10 fiscal years or since inception (for Funds lacking 10-year records) in comparison to its benchmark index, as well as one or more additional indexes, if applicable. The performance of other share classes will be greater than or less than the class depicted above.
Average Annual Total Returns (for the periods ended 12/31/2020) | | |
| Inception Date
of Class | 1 Year | 5 Years | 10 Years |
Initial Class | 08/31/2007 | 13.35% | 10.72% | 9.71% |
Service Class | 08/15/2008 | 13.08% | 10.42% | 9.44% |
Russell 3000 Index* | | 20.89% | 15.43% | 13.79% |
Bloomberg Barclays U.S. Aggregate Bond Index | | 7.51% | 4.44% | 3.84% |
MSCI ACWI ex USA | | 10.65% | 8.93% | 4.92% |
Custom MML Aggressive Allocation Index | | 17.84% | 13.03% | 10.93% |
* Benchmark
Generally accepted accounting principles require adjustments to be made to the net assets of the Fund at period end for financial reporting purposes only, and as such, the total return based on the unadjusted net asset value per share may differ from the total return reported in the financial highlights.
Performance results in the graph and table reflect the percentage change in net asset value, including reinvestment of dividends and capital gains distributions. Investors should note that the Fund is a professionally managed mutual fund, while the index or indexes shown above are unmanaged, cannot be purchased directly, and, with the exception of any peer group index, do not incur expenses.
Performance data quoted in the graph and table represents past performance; past performance is not predictive of future results. The investment return and principal value of shares of the Fund fluctuate, so your shares, when sold, may be worth more or less than their original cost. Current performance of the Fund may be lower or higher than the performance quoted. The performance shown does not reflect the deduction of taxes, if any, that a shareholder would pay on Fund distributions or the redemption of Fund shares. Performance data current to the most recent month end may be obtained by calling 1-888-309-3539.
Investors should read the Fund’s prospectus with regard to the Fund’s investment objectives, risks, and charges and expenses in conjunction with these financial statements. The Fund’s return reflects changes in the net asset value per share without the deduction of any product charges (e.g., cost of insurance, mortality and expense risk charges, administrative fees, and CDSL). The inclusion of these charges would have reduced the performance shown here.
13
MML American Funds Growth Fund – Portfolio Manager Report (Unaudited) |
What is the investment approach of MML American Funds Growth Fund, and who is the Fund’s investment adviser?
The Fund seeks to provide investors with growth of capital through a “master feeder” relationship. (See page 236 of this report for information about the “master feeder” relationship.) The Fund invests all of its assets in Class 1 shares of the American Funds Insurance Series – Growth Fund (the “Master Growth Fund”), a series of the American Funds Insurance Series, a registered open-end investment company, managed by Capital Research and Management Company (Capital Research) with substantially the same investment objective. The Master Growth Fund invests primarily in common stocks and seeks to invest in companies that appear to offer superior opportunities for growth of capital. The Master Growth Fund may invest up to 25% of its assets in common stocks and other securities of issuers domiciled outside the United States. The Master Growth Fund may hold a portion of its assets in cash or cash equivalents. The Fund’s investment adviser is MML Investment Advisers, LLC (MML Advisers).
How did the Fund perform during the 12 months ended December 31, 2020?
The Fund returned 51.41%, outperforming, by a wide margin, the 18.40% return of the S&P 500® Index (the “benchmark”), which measures the performance of 500 widely held stocks in the U.S. equity market. The Fund also significantly outperformed the 38.49% return of the Russell 1000® Growth Index, which measures the performance of the large-cap growth segment of U.S. equity securities. It includes the Russell 1000 Index companies with higher price-to-book ratios and higher forecasted growth values.
For a discussion on the economic and market environment during the 12-month period ended December 31, 2020, please see the Economic and Market Review, beginning on page 3.
Capital Research’s discussion of factors that contributed to the Fund’s performance
U.S. equities ended 2020 at record highs, showing resilience during a volatile year that included a pandemic-induced recession, a sharp bear market, civil unrest, and a contentious presidential election. Information technology, consumer discretionary, and communication services stocks, including Amazon and Netflix, led markets, as these names benefited from widespread stay-at-home restrictions.
Overall, the information technology sector rose 44%, while consumer discretionary and communication services gained 33% and 24%, respectively. Energy lagged all other sectors, declining 34%. The significant reduction in travel reduced the demand for oil, which was briefly priced below $0 for the first time in history amid fears of dwindling storage capacity. The real estate and financial sectors were also negative for the year, each declining 2%.
Fund holdings in the consumer discretionary and communication services sectors were top contributors to the Fund’s relative performance for the year ended December 31, 2020. In particular, Tesla and Netflix were standouts within the Fund’s portfolio. Tesla’s shares soared as founder Elon Musk’s efforts to bring electric vehicles into the mainstream gained traction, transforming the company’s underlying financial performance.
On the downside, the Fund’s investments in Suncor Energy (a Canadian integrated energy company) and MTU Aero Engines (a German aircraft engine manufacturer) detracted from relative returns. In terms of allocations, the Fund’s significantly lower-than-benchmark position in technology giant Apple, which proved to be a high-performing stock, also detracted from its relative returns for the year.
Capital Research’s outlook
Although U.S. economic growth remains solid, Fund management is keeping a close watch on the impact of COVID-19 recovery and stimulus measures on economic indicators. They continue to favor well-positioned companies with capital appreciation potential that Fund management believes are capable of generating outstanding returns in myriad near-term economic environments.
14
MML American Funds Growth Fund – Portfolio Manager Report (Unaudited) (Continued) |
MML American Funds Growth Fund
Asset Allocation
(% of Net Assets) on 12/31/20 |
Equity Funds | 100.1% |
Total Long-Term Investments | 100.1% |
Other Assets & Liabilities | (0.1)% |
Net Assets | 100.0% |
| | |
15
MML American Funds Growth Fund – Portfolio Manager Report (Unaudited) (Continued) |
GROWTH OF $10,000 INVESTMENT - SERVICE CLASS I

The graph above illustrates the Fund’s historical performance for the past 10 fiscal years or since inception (for Funds lacking 10-year records) in comparison to its benchmark index, as well as one or more additional indexes, if applicable.
Average Annual Total Returns (for the periods ended 12/31/2020) | | |
| Inception Date
of Class | 1 Year | 5 Years | 10 Years |
Service Class I | 08/15/2008 | 51.41% | 22.23% | 16.34% |
S&P 500 Index* | | 18.40% | 15.22% | 13.88% |
Russell 1000 Growth Index | | 38.49% | 21.00% | 17.21% |
* Benchmark
Generally accepted accounting principles require adjustments to be made to the net assets of the Fund at period end for financial reporting purposes only, and as such, the total return based on the unadjusted net asset value per share may differ from the total return reported in the financial highlights.
Performance results in the graph and table reflect the percentage change in net asset value, including reinvestment of dividends and capital gains distributions. Investors should note that the Fund is a professionally managed mutual fund, while the index or indexes shown above are unmanaged, cannot be purchased directly, and, with the exception of any peer group index, do not incur expenses.
Performance data quoted in the graph and table represents past performance; past performance is not predictive of future results. The investment return and principal value of shares of the Fund fluctuate, so your shares, when sold, may be worth more or less than their original cost. Current performance of the Fund may be lower or higher than the performance quoted. The performance shown does not reflect the deduction of taxes, if any, that a shareholder would pay on Fund distributions or the redemption of Fund shares. Performance data current to the most recent month end may be obtained by calling 1-888-309-3539.
Investors should read the Fund’s prospectus with regard to the Fund’s investment objectives, risks, and charges and expenses in conjunction with these financial statements. The Fund’s return reflects changes in the net asset value per share without the deduction of any product charges (e.g., cost of insurance, mortality and expense risk charges, administrative fees, and CDSL). The inclusion of these charges would have reduced the performance shown here.
16
MML American Funds International Fund – Portfolio Manager Report (Unaudited) |
What is the investment approach of MML American Funds International Fund, and who is the Fund’s investment adviser?
The Fund seeks long-term capital growth of assets through a “master-feeder” relationship. (See page 236 of this report for information about the “master feeder” relationship.) The Fund invests all of its assets in Class 1 shares of the American Funds Insurance Series – International Fund (the “Master International Fund”), a series of the American Funds Insurance Series, a registered open-end investment company managed by Capital Research and Management Company (Capital Research) with substantially the same investment objective. The Master International Fund invests primarily in common stocks of companies domiciled outside the United States, including companies domiciled in emerging markets, that Capital Research believes have the potential for growth. The Master International Fund may hold a portion of its assets in cash or cash equivalents. The Fund’s investment adviser is MML Investment Advisers, LLC (MML Advisers).
How did the Fund perform during the 12 months ended December 31, 2020?
The Fund returned 13.44%, outperforming the 10.65% return of MSCI All Country World Index (ACWI) ex USA (the “benchmark”), which measures the performance of the large- and mid-cap segments of the particular regions, excluding U.S. equity securities, including developed and emerging markets. The Fund substantially outperformed the 7.82% return of the MSCI EAFE Index, which measures the performance of the large- and mid-cap segments of developed markets, excluding the U.S. and Canada equity securities.
For a discussion on the economic and market environment during the 12-month period ended December 31, 2020, please see the Economic and Market Review, beginning on page 3.
Capital Research’s discussion of factors that contributed to the Fund’s performance
During the year ended December 31, 2020, global stocks rose in the face of a deadly pandemic, boosted by massive government stimulus measures and the rapid development of coronavirus vaccines. In a year marked by unprecedented volatility, stocks declined sharply from February to March, followed by a remarkable nine-month rally that lifted a few key market indexes to all-time highs. U.S. equities also ended 2020 at record highs, showing resilience during a volatile year that included a pandemic-induced recession, a sharp bear market, civil unrest, and a contentious presidential election. European stocks declined in local currency terms as the eurozone economy suffered the effects of government-imposed lockdowns and a severe recession. Emerging markets posted solid gains for a second consecutive year, led by China’s economic rebound and the technology export-driven economies of Taiwan and South Korea.
The Fund’s investments in the consumer discretionary and health care sectors boosted relative returns. Mercado Libre, the leading e-commerce site for Latin America, was among the top contributors, as shares surged to fresh highs as the COVID-19 pandemic drove the adoption of online shopping in Latin America. On the downside, some of the Fund’s investments in the industrial sector hindered relative returns. In particular, Airbus (a European multinational aerospace corporation) was a top relative detractor in an environment where the travel industry was hit hard by pandemic-related travel restrictions.
Capital Research’s outlook
Fund management continues to monitor the volatility and potential headwinds brought about by ongoing political and trade uncertainty. Given how late it may be in the current bull market, Fund management seeks opportunities especially in regions, countries, and sectors they expect to be less affected by these global headlines. Their focus on a company’s fundamental growth drivers and intrinsic worth is critical to helping them identify investments that they believe represent the best value over the long term.
17
MML American Funds International Fund – Portfolio Manager Report (Unaudited) (Continued) |
MML American Funds International Fund
Asset Allocation
(% of Net Assets) on 12/31/20 |
Mutual Funds | 100.1% |
Total Long-Term Investments | 100.1% |
Other Assets and Liabilities | (0.1)% |
Net Assets | 100.0% |
| | |
18
MML American Funds International Fund – Portfolio Manager Report (Unaudited) (Continued) |
GROWTH OF $10,000 INVESTMENT - SERVICE CLASS I

The graph above illustrates the Fund’s historical performance for the past 10 fiscal years or since inception (for Funds lacking 10-year records) in comparison to its benchmark index, as well as one or more additional indexes, if applicable.
Average Annual Total Returns (for the periods ended 12/31/2020) | | |
| Inception Date
of Class | 1 Year | 5 Years | 10 Years |
Service Class I | 08/15/2008 | 13.44% | 10.22% | 6.20% |
MSCI ACWI ex USA* | | 10.65% | 8.93% | 4.92% |
MSCI EAFE Index | | 7.82% | 7.45% | 5.51% |
* Benchmark
Generally accepted accounting principles require adjustments to be made to the net assets of the Fund at period end for financial reporting purposes only, and as such, the total return based on the unadjusted net asset value per share may differ from the total return reported in the financial highlights.
Performance results in the graph and table reflect the percentage change in net asset value, including reinvestment of dividends and capital gains distributions. Investors should note that the Fund is a professionally managed mutual fund, while the index or indexes shown above are unmanaged, cannot be purchased directly, and, with the exception of any peer group index, do not incur expenses.
Performance data quoted in the graph and table represents past performance; past performance is not predictive of future results. The investment return and principal value of shares of the Fund fluctuate, so your shares, when sold, may be worth more or less than their original cost. Current performance of the Fund may be lower or higher than the performance quoted. The performance shown does not reflect the deduction of taxes, if any, that a shareholder would pay on Fund distributions or the redemption of Fund shares. Performance data current to the most recent month end may be obtained by calling 1-888-309-3539.
Investors should read the Fund’s prospectus with regard to the Fund’s investment objectives, risks, and charges and expenses in conjunction with these financial statements. The Fund’s return reflects changes in the net asset value per share without the deduction of any product charges (e.g., cost of insurance, mortality and expense risk charges, administrative fees, and CDSL). The inclusion of these charges would have reduced the performance shown here.
19
MML American Funds Core Allocation Fund – Portfolio Manager Report (Unaudited) |
What is the investment approach of MML American Funds Core Allocation Fund, and who is the Fund’s investment adviser?
The Fund seeks to achieve as high a total return over time as is considered consistent with prudent investment risk, preservation of capital, and recognition of the Fund’s stated asset allocation. The Fund is a “fund of funds” and seeks to achieve its investment objective by principally investing in a combination of series of the American Funds Insurance Series (the “American Underlying Funds”), managed by Capital Research and Management Company (Capital Research), using a flexible asset allocation approach. The Fund’s investment adviser invests the Fund’s assets in a combination of U.S. domestic and international American Underlying Funds. As of the date of this report, it is expected that the American Underlying Funds will include Class 1 shares of the American Funds Insurance Series – Bond Fund, the American Funds Insurance Series – Blue Chip Income and Growth Fund, the American Funds Insurance Series – Growth-Income Fund, and the American Funds Insurance Series – International Fund. The Fund’s investment adviser allocates the Fund’s assets among a variety of different asset classes through investing in American Underlying Funds in response to changing market, economic, and investment conditions. The Fund’s investment adviser is MML Investment Advisers, LLC (MML Advisers).
How did the Fund perform during the 12 months ended December 31, 2020?
The Fund returned 11.39%, underperforming, by a wide margin, the 18.40% return of the S&P 500® Index (the “benchmark”), which measures the performance of 500 widely held stocks in the U.S. equity market. The Fund outperformed the 10.65% return of the MSCI All Country World Index (ACWI) ex USA, which measures the performance of the large- and mid-cap segments of the particular regions, excluding U.S. equity securities, including developed and emerging markets. The Fund outperformed the 7.51% return of the Bloomberg Barclays U.S. Aggregate Bond Index, which measures the performance of investment grade, U.S. dollar-denominated, fixed-rate taxable bond market securities, including Treasuries, government-related and corporate securities, mortgage-backed securities (MBS) (agency fixed-rate and hybrid ARM pass-throughs), asset-backed securities (ABS), and commercial mortgage-backed securities (CMBS). Finally, the Fund’s 11.39% return underperformed the 15.14% return of the Custom MML Core Allocation Index, which comprises the benchmark (55%), the Bloomberg Barclays U.S. Aggregate Bond Index (35%), and the MSCI ACWI ex USA (10%).
For a discussion on the economic and market environment during the 12-month period ended December 31, 2020, please see the Economic and Market Review, beginning on page 3.
Capital Research’s discussion of factors that contributed to the Fund’s performance
The following paragraphs discuss the results of each of the Fund’s underlying portfolio components. Because the Fund invests in both stock- and bond-based portfolios, its overall performance may vary considerably from the broad market indexes listed above, which each measures the performance of a specific group of securities. These component-specific discussions focus on results and positioning versus each component’s main comparative index, not how the Fund as a whole performed or was positioned versus those indexes.
The American Funds Insurance Series – Bond Fund (the “Bond Fund”) outperformed the Bloomberg Barclays U.S. Aggregate Bond Index (the “Index”) for the year, as bond markets rebounded sharply, supported by extraordinary measures from the Federal Reserve. The Bond Fund’s relative performance benefited from overweight allocations, relative to the Index, to investment-grade corporates and agency mortgage-backed securities, as well as out-of-Index investments in Treasury Inflation Protected Securities (TIPS) and high-yield bonds. With respect to specific Bond Fund holdings, bonds issued by Teva Pharmaceutical were notable contributors. On the other hand, municipal issuers, such as the State of Illinois and Chicago Board of Education, detracted from the Bond Fund’s performance.
The American Funds Insurance Series – Blue Chip Income and Growth Fund (the “Income and Growth Fund”) underperformed the benchmark in 2020, despite U.S. equities ending the year at record highs, in a volatile environment that included a pandemic-induced recession, a sharp bear market, civil unrest, and a contentious presidential election. The Income and Growth Fund’s investments in the energy sector were a drag on results. Specifically, investments in Exxon Mobil and Diamondback Energy (an American energy company focused on hydrocarbon exploration) hurt results. Among the Income and Growth Fund’s top
20
MML American Funds Core Allocation Fund – Portfolio Manager Report (Unaudited) (Continued) |
contributors to relative returns was Broadcom, a semiconductor and wireless company that was boosted by strong financial results. Another top contributor was Carrier Global, where sales growth was largely driven by record demand for residential heating, ventilating and air conditioning (HVAC) products in North America.
The American Funds Insurance Series – Growth-Income Fund (the “Growth-Income Fund”) underperformed the benchmark for the year, as the Growth-Income Fund’s lower-than-benchmark position in information technology stocks, a sector that performed strongly over the period, weighed on relative returns. In particular, the Growth-Income Fund’s underweight investment in technology giant Apple hindered results the most, as Apple shares outperformed the broader market over the period. On the positive side, the Growth-Income Fund’s investments in the communications services sector contributed the most to relative returns. Among these stocks, Netflix was a standout, as its share price soared in an environment where stay-at-home quarantine orders spurred demand for internet-streaming media.
The American Funds Insurance Series – International Fund (the “International Fund”) outperformed the MSCI ACWI ex USA (the “Index”) for the year, as global stocks rose in the face of a deadly pandemic, boosted by massive government stimulus measures and the rapid development of coronavirus vaccines. Stocks declined sharply from February to March, followed by a remarkable nine-month rally that lifted a few key market indexes to all-time highs. The International Fund’s holdings in the consumer discretionary and health care sectors boosted relative returns. Mercado Libre, the leading e-commerce site for Latin America, was among the top contributors, as shares of this International Fund holding surged to fresh highs as the COVID-19 pandemic drove online shopping adoption in Latin America. On the downside, one International Fund holding that detracted from relative performance was Airbus (a European multinational aerospace corporation), whose shares lost value in an environment where the travel industry was hit hard by pandemic-related travel restrictions.
Capital Research’s outlook
With respect to fixed income, Fund management believes that stimulative fiscal and monetary policy could help to keep U.S. economic growth positive. Although the Bond Fund is positioned toward an economic recovery, Fund Management anticipates a high level of uncertainty and a fragile state of the economy.
With respect to U.S. equities, Fund management continues to favor well-managed, high-quality companies that are capable of paying dividends in myriad economic environments. They believe that this focus, supported by their global research, could help them identify favorable long-term investment opportunities. On the international front, Fund management continues to monitor the volatility and potential headwinds brought about by ongoing political and trade uncertainty. Given how late stage they estimate the current bull market may be, they seek opportunities, especially in regions, countries, and sectors less affected by these global headlines. They believe that their focus on a company’s fundamental growth drivers and intrinsic worth is critical to helping them identify investments they believe represent the best value over the long term.
21
MML American Funds Core Allocation Fund – Portfolio Manager Report (Unaudited) (Continued) |
MML American Funds Core Allocation Fund
Asset Allocation
(% of Net Assets) on 12/31/20 |
Equity Funds | 67.4% |
Fixed Income Funds | 32.7% |
Total Long-Term Investments | 100.1% |
Other Assets & Liabilities | (0.1)% |
Net Assets | 100.0% |
| | |
22
MML American Funds Core Allocation Fund – Portfolio Manager Report (Unaudited) (Continued) |
GROWTH OF $10,000 INVESTMENT - SERVICE CLASS I

The graph above illustrates the Fund’s historical performance for the past 10 fiscal years or since inception (for Funds lacking 10-year records) in comparison to its benchmark index, as well as one or more additional indexes, if applicable.
Average Annual Total Returns (for the periods ended 12/31/2020) | | |
| Inception Date
of Class | 1 Year | 5 Years | 10 Years |
Service Class I | 08/15/2008 | 11.39% | 9.41% | 8.25% |
S&P 500 Index* | | 18.40% | 15.22% | 13.88% |
Bloomberg Barclays U.S. Aggregate Bond Index | | 7.51% | 4.44% | 3.84% |
MSCI ACWI ex USA | | 10.65% | 8.93% | 4.92% |
Custom MML Core Allocation Index | | 15.14% | 11.15% | 9.74% |
* Benchmark
Generally accepted accounting principles require adjustments to be made to the net assets of the Fund at period end for financial reporting purposes only, and as such, the total return based on the unadjusted net asset value per share may differ from the total return reported in the financial highlights.
Performance results in the graph and table reflect the percentage change in net asset value, including reinvestment of dividends and capital gains distributions. Investors should note that the Fund is a professionally managed mutual fund, while the index or indexes shown above are unmanaged, cannot be purchased directly, and, with the exception of any peer group index, do not incur expenses.
Performance data quoted in the graph and table represents past performance; past performance is not predictive of future results. The investment return and principal value of shares of the Fund fluctuate, so your shares, when sold, may be worth more or less than their original cost. Current performance of the Fund may be lower or higher than the performance quoted. The performance shown does not reflect the deduction of taxes, if any, that a shareholder would pay on Fund distributions or the redemption of Fund shares. Performance data current to the most recent month end may be obtained by calling 1-888-309-3539.
Investors should read the Fund’s prospectus with regard to the Fund’s investment objectives, risks, and charges and expenses in conjunction with these financial statements. The Fund’s return reflects changes in the net asset value per share without the deduction of any product charges (e.g., cost of insurance, mortality and expense risk charges, administrative fees, and CDSL). The inclusion of these charges would have reduced the performance shown here.
23
MML Blue Chip Growth Fund – Portfolio Manager Report (Unaudited) |
What is the investment approach of MML Blue Chip Growth Fund, and who is the Fund’s subadviser?
The Fund seeks long-term capital growth. Income is a secondary objective. Under normal circumstances, the Fund invests at least 80% of net assets (plus the amount of any borrowings for investment purposes) in the common stocks of large- and medium-sized blue chip growth companies. The Fund’s subadviser currently defines blue chip growth companies to mean firms that, in its view, are well-established in their industries and have the potential for above-average earnings growth. The Fund’s subadviser is T. Rowe Price Associates, Inc. (T. Rowe Price).
How did the Fund perform during the 12 months ended December 31, 2020?
The Fund’s Initial Class shares returned 34.40%, underperforming the 38.49% return of the Russell 1000® Growth Index (the “benchmark”), which measures the performance of the large-cap growth segment of U.S. equity securities. It includes the Russell 1000 Index companies with higher price-to-book ratios and higher forecasted growth values. In addition, the Fund substantially outperformed the 18.40% return of the S&P 500® Index, which measures the performance of 500 widely held stocks in the U.S. equity market.
For a discussion on the economic and market environment during the 12-month period ended December 31, 2020, please see the Economic and Market Overview, beginning on page 3.
Subadviser discussion of factors that contributed to the Fund’s performance
For the year ended December 31, 2020, stock selection was the primary driver of the Fund’s relative underperformance. During the reporting period, the consumer discretionary, information technology, and financial sectors were the largest detractors from the Fund’s performance, while the consumer staples and communication services sectors were the largest contributors.
Although the Fund had strong absolute performance for the year, consumer discretionary was the largest relative hindrance compared to the benchmark. Despite impressive growth and market share gains for its core e-commerce business, shares of Fund holding Alibaba came under pressure following the announcement of an antitrust investigation and the cancellation of the IPO of Ant, a company in which Alibaba owns a 33% stake. Alibaba continues its dominance in China’s fast-growing e-commerce industry and, despite near-term uncertainty around regulatory hurdles, Fund management believes its fundamentals are strengthening.
The information technology sector also detracted on a relative basis. The Fund’s underweight position in Apple, relative to the benchmark, detracted from relative performance for the year, as Apple shares outperformed during the period, driven by strength from Mac and iPad (which benefited from work and learn-at-home dynamics) and better-than-feared iPhone results. Finally, an overweight position to the financial sector hampered the Fund’s relative results.
In contrast, an underweight allocation to the consumer staples sector contributed to relative performance. Additionally, the communication services sector bolstered the Fund’s relative returns, driven by strong stock picks such as Sea. Shares of Fund holding Sea traded higher over the past 12 months, as both its gaming and e-commerce businesses experienced accelerating growth, aided by coronavirus-related tailwinds that reinforced a shift toward digitalization.
Subadviser outlook
Fund management believes that rapid progress with a first wave of new vaccines based on messenger RNA (mRNA) technology is the most positive sign for the year ahead. As the pandemic hopefully recedes and economies reopen, their view is that a broader economic recovery could benefit many of the sectors that were most damaged by the virus, such as travel and leisure. While a rapid economic recovery could also bring an accelerated earnings recovery, Fund management’s opinion is that this might not translate into strong equity returns, with much of the recovery already priced into the markets. Their view is that investors seeking value opportunities should be careful about stock selection – and continue to seek companies that appear well positioned to emerge from the pandemic with lasting competitive advantages, while avoiding firms that face longer-term secular challenges.
24
MML Blue Chip Growth Fund – Portfolio Manager Report (Unaudited) (Continued) |
MML Blue Chip Growth Fund
Largest Holdings
(% of Net Assets) on 12/31/20 |
Amazon.com, Inc. | 11.4% |
Facebook, Inc. Class A | 6.4% |
Alphabet, Inc. Class C | 5.3% |
Microsoft Corp. | 5.2% |
Apple, Inc. | 5.0% |
Visa, Inc. Class A | 3.1% |
Alibaba Group Holding Ltd. Sponsored ADR | 3.0% |
PayPal Holdings, Inc. | 2.8% |
Tencent Holdings Ltd. | 2.6% |
ServiceNow, Inc. | 2.5% |
| | 47.3% |
| | |
MML Blue Chip Growth Fund
Sector Table
(% of Net Assets) on 12/31/20 |
Communications | 37.3% |
Technology | 28.4% |
Consumer, Non-cyclical | 18.6% |
Financial | 8.1% |
Consumer, Cyclical | 5.3% |
Industrial | 1.7% |
Basic Materials | 0.5% |
Mutual Funds | 0.0% |
Total Long-Term Investments | 99.9% |
Short-Term Investments and Other Assets and Liabilities | 0.1% |
Net Assets | 100.0% |
| | |
25
MML Blue Chip Growth Fund – Portfolio Manager Report (Unaudited) (Continued) |
GROWTH OF $10,000 INVESTMENT - INITIAL CLASS

The graph above illustrates a representative class of the Fund’s historical performance for the past 10 fiscal years or since inception (for Funds lacking 10-year records) in comparison to its benchmark index, as well as one or more additional indexes, if applicable. The performance of other share classes will be greater than or less than the class depicted above.
Average Annual Total Returns (for the periods ended 12/31/2020) | | |
| Inception Date
of Class | 1 Year | 5 Years | 10 Years |
Initial Class | 05/01/2006 | 34.40% | 19.57% | 17.51% |
Service Class | 08/15/2008 | 34.00% | 19.28% | 17.21% |
Russell 1000 Growth Index* | | 38.49% | 21.00% | 17.21% |
S&P 500 Index | | 18.40% | 15.22% | 13.88% |
* Benchmark
Generally accepted accounting principles require adjustments to be made to the net assets of the Fund at period end for financial reporting purposes only, and as such, the total return based on the unadjusted net asset value per share may differ from the total return reported in the financial highlights.
Performance results in the graph and table reflect the percentage change in net asset value, including reinvestment of dividends and capital gains distributions. Investors should note that the Fund is a professionally managed mutual fund, while the index or indexes shown above are unmanaged, cannot be purchased directly, and, with the exception of any peer group index, do not incur expenses.
Performance data quoted in the graph and table represents past performance; past performance is not predictive of future results. The investment return and principal value of shares of the Fund fluctuate, so your shares, when sold, may be worth more or less than their original cost. Current performance of the Fund may be lower or higher than the performance quoted. The performance shown does not reflect the deduction of taxes, if any, that a shareholder would pay on Fund distributions or the redemption of Fund shares. Performance data current to the most recent month end may be obtained by calling 1-888-309-3539.
Investors should read the Fund’s prospectus with regard to the Fund’s investment objectives, risks, and charges and expenses in conjunction with these financial statements. The Fund’s return reflects changes in the net asset value per share without the deduction of any product charges (e.g., cost of insurance, mortality and expense risk charges, administrative fees, and CDSL). The inclusion of these charges would have reduced the performance shown here.
26
MML Equity Income Fund – Portfolio Manager Report (Unaudited) |
What is the investment approach of MML Equity Income Fund, and who is the Fund’s subadviser?
The Fund seeks dividend income and long-term capital growth by investing primarily in common stocks, with an emphasis on large-capitalization companies that have a strong track record of paying dividends or that the Fund’s subadviser believes to be undervalued. Under normal circumstances, the Fund invests at least 80% of its net assets (plus the amount of any borrowings for investment purposes) in common stocks. The Fund’s subadviser is T. Rowe Price Associates, Inc. (T. Rowe Price).
How did the Fund perform during the 12 months ended December 31, 2020?
The Fund’s Initial Class shares returned 1.34%, underperforming the 2.80% return of the Russell 1000® Value Index (the “benchmark”), which measures the performance of the large-cap value segment of U.S. equity securities. It includes the Russell 1000 Index companies with lower price-to-book ratios and lower expected growth values.
For a discussion on the economic and market environment during the 12-month period ended December 31, 2020, please see the Economic and Market Review, beginning on page 3.
Subadviser discussion of factors that contributed to the Fund’s performance
For the year ended December 31, 2020, the primary detractor from the Fund’s relative returns was unfavorable sector allocation, although strong security selection partially offset the relative underperformance. The health care, consumer staples, and industrial and business services sectors were the largest relative detractors. The information technology and energy sectors were the largest relative contributors.
Fund holdings in the health care sector were the primary relative detractor from the Fund’s performance for the period, due to detrimental stock selection. Shares of Fund holding CVS Health traded lower throughout the year amid investors’ short-term concerns over a potential decline in demand due to coronavirus lockdowns. Fund holdings such as Tyson Foods in the consumer staples sector also hampered relative performance. During the first half of the year, shares of Tyson Foods lagged the broader market, as Tyson Foods grappled with uncertainty stemming from the coronavirus outbreak and a shift from commercial to residential consumption. Additionally, Tyson Foods’ shares were pressured due to reports of coronavirus outbreaks at numerous manufacturing plants. In the fourth quarter, the company came under fire after reports surfaced of management’s inappropriate actions related to the coronavirus and the impact of the virus on its workers.
The industrial and business services sector also weighed on relative returns due to weak stock picks, such as Boeing, and an unfavorable overweight allocation, relative to the benchmark. Despite finishing negative for the one-year period, shares of Fund holding Boeing significantly rebounded from their March lows. The company’s shares began trending upward late in the first half of the year, as airlines began rescheduling more flights. Additionally, late in the fourth quarter, shares trended upward following the recertification of the 737 MAX.
Turning to the positive, stock selection in the information technology sector contributed to the Fund’s relative performance. Shares of Qualcomm regained from the first quarter sell-off and were up considerably for the one-year period, stemming from this Fund holding’s favorable earnings reports (which exceeded market expectations) and the unveiling of the company’s new Snapdragon 888 5G mobile platform. Fund holdings in the energy sector also aided relative performance, although a detrimental overweight allocation to this poorly performing sector partially offset the positive contribution.
Derivatives are securities that derive their value from the performance of one or more other investments and take the form of a contract between two or more parties. Derivatives can be used for hedging, speculation, or both. The Fund’s use of futures and warrants during the reporting period was slightly additive to performance. The Fund also held index futures and rights during the period.
27
MML Equity Income Fund – Portfolio Manager Report (Unaudited) (Continued) |
Subadviser outlook
Given market performance in 2020, Fund management believes we are beginning to see signs of exuberance, with narrow leadership, high index concentration, and increased special-purpose acquisition company and initial public offering activity. Considering this, they believe 2021 could prove to be a stock pickers’ market, where more tempered returns may remind investors of the importance of dividends. Additionally, in the event of an economic recovery, Fund management believes that 2021 may offer an environment where inflation could reappear, as consumers and businesses have capital to deploy, while household net worth is at an all-time high. Ultimately, in Fund management’s view, there could be a recoupling between the market and the economy, which has the potential to benefit areas of the market that were left behind in 2020.
28
MML Equity Income Fund – Portfolio Manager Report (Unaudited) (Continued) |
MML Equity Income Fund
Largest Holdings
(% of Net Assets) on 12/31/20 |
QUALCOMM, Inc. | 3.1% |
Wells Fargo & Co. | 2.9% |
The Southern Co. | 2.8% |
General Electric Co. | 2.7% |
DuPont de Nemours, Inc. | 2.5% |
Chubb Ltd. | 2.3% |
United Parcel Service, Inc. Class B | 2.3% |
Morgan Stanley | 2.1% |
MetLife, Inc. | 2.0% |
American International Group, Inc. | 1.9% |
| | 24.6% |
| | |
MML Equity Income Fund
Sector Table
(% of Net Assets) on 12/31/20 |
Financial | 25.7% |
Consumer, Non-cyclical | 21.1% |
Industrial | 10.8% |
Utilities | 9.1% |
Technology | 7.6% |
Communications | 7.1% |
Energy | 6.6% |
Basic Materials | 6.3% |
Consumer, Cyclical | 5.6% |
Mutual Funds | 0.6% |
Total Long-Term Investments | 100.5% |
Short-Term Investments and Other Assets and Liabilities | (0.5)% |
Net Assets | 100.0% |
| | |
29
MML Equity Income Fund – Portfolio Manager Report (Unaudited) (Continued) |
GROWTH OF $10,000 INVESTMENT - INITIAL CLASS

The graph above illustrates a representative class of the Fund’s historical performance for the past 10 fiscal years or since inception (for Funds lacking 10-year records) in comparison to its benchmark index, as well as one or more additional indexes, if applicable. The performance of other share classes will be greater than or less than the class depicted above.
Average Annual Total Returns (for the periods ended 12/31/2020) | | |
| Inception Date
of Class | 1 Year | 5 Years | 10 Years |
Initial Class | 05/01/2006 | 1.34% | 9.91% | 9.28% |
Service Class | 08/15/2008 | 1.17% | 9.65% | 9.01% |
Russell 1000 Value Index | | 2.80% | 9.74% | 10.50% |
Generally accepted accounting principles require adjustments to be made to the net assets of the Fund at period end for financial reporting purposes only, and as such, the total return based on the unadjusted net asset value per share may differ from the total return reported in the financial highlights.
Performance results in the graph and table reflect the percentage change in net asset value, including reinvestment of dividends and capital gains distributions. Investors should note that the Fund is a professionally managed mutual fund, while the index or indexes shown above are unmanaged, cannot be purchased directly, and, with the exception of any peer group index, do not incur expenses.
Performance data quoted in the graph and table represents past performance; past performance is not predictive of future results. The investment return and principal value of shares of the Fund fluctuate, so your shares, when sold, may be worth more or less than their original cost. Current performance of the Fund may be lower or higher than the performance quoted. The performance shown does not reflect the deduction of taxes, if any, that a shareholder would pay on Fund distributions or the redemption of Fund shares. Performance data current to the most recent month end may be obtained by calling 1-888-309-3539.
Investors should read the Fund’s prospectus with regard to the Fund’s investment objectives, risks, and charges and expenses in conjunction with these financial statements. The Fund’s return reflects changes in the net asset value per share without the deduction of any product charges (e.g., cost of insurance, mortality and expense risk charges, administrative fees, and CDSL). The inclusion of these charges would have reduced the performance shown here.
30
MML Equity Index Fund – Portfolio Manager Report (Unaudited) |
What is the investment approach of MML Equity Index Fund, and who is the Fund’s subadviser?
The Fund’s investment objective is to provide investment results that correspond to the price and yield performance of publicly traded common stocks in the aggregate as represented by the S&P 500® Index* (the “Index”). Under normal circumstances, the Fund invests at least 80% (and, typically, substantially all) of its net assets (plus the amount of any borrowings for investment purposes) in the equity securities of companies included within the Index. The Fund’s subadviser is Northern Trust Investments, Inc. (NTI).
How did the Fund perform during the 12 months ended December 31, 2020?
The Fund’s Class I shares returned 18.06%, underperforming the 18.40% return of the Index, which measures the performance of 500 widely held stocks in the U.S. equity market.
For a discussion on the economic and market environment during the 12-month period ended December 31, 2020, please see the Economic and Market Overview, beginning on page 3.
Subadviser discussion of factors that contributed to the Fund’s performance
Generally, the Fund’s underperformance versus the Index was mainly attributable to the impact of fees and expenses necessary for the management and operation of the Fund. The Index is not subject to fees or expenses and it is not possible to invest directly in the Index.
For the year ended December 31, 2020, information technology and consumer discretionary were the strongest-performing sectors within the Index, returning 43.88% and 33.30%, respectively. The energy and real estate sectors exhibited the worst performance, returning -33.69% and -2.27%, respectively.
During 2020, U.S. equities encountered significant volatility, but ended the year well above their December 2019 levels. Equities hit all-time highs in the early months of the year, with increasing consumer confidence and three interest rate cuts by the U.S. Federal Reserve driving the rally. That quickly changed, however, as a worldwide pandemic shook global markets, and U.S. equities saw a drawdown of more than 30% in less than a month. Following the initial shock, markets rebounded in the second quarter of 2020, mostly erasing the losses from the early March slide. This rally was supported by record-level global fiscal stimulus and central banks that opted for extremely accommodative monetary policy in an effort to stimulate a swift economic recovery.
Despite an economy that looked to be adjusting slowly to living alongside the COVID-19 virus, markets continued to rally in the third quarter, setting new all-time highs, with the technology sector leading the way. Aside from brief volatility in the days leading up to the U.S. presidential election in early November, we experienced a historic equity rally in November and December of 2020. Two COVID-19 vaccines were approved for use during this time, and Congress passed a second round of fiscal stimulus, as investor optimism for the future prevailed over the concerns of the current state of the pandemic. Also in the fourth quarter of 2020, electric-car manufacturer Tesla was added to the Index, making it one of the largest firms in terms of market capitalization in the benchmark.
U.S. equities closed out 2020 at all-time highs, monetary policy remained accommodative, and interest rates remained low, as many Americans looked to the new year with hopes of moving past the pandemic.
* The “S&P 500 Index” is a product of S&P Dow Jones Indices LLC or its affiliates(“SPDJI”), and has been licensed for use by MassMutual. Standard & Poor’s®, S&P® and S&P 500® are registered trademarks of Standard & Poor’s Financial Services LLC (“S&P”); and Dow Jones® is a registered trademark of Dow Jones Trademark Holdings LLC (“Dow Jones”). The Fund is not sponsored, endorsed, sold or promoted by SPDJI, Dow Jones, S&P, or their respective affiliates, and none of such parties make any representation regarding the advisability of investing in such product(s) nor do they have any liability for any errors, omissions, or interruptions of the S&P 500 Index.
31
MML Equity Index Fund – Portfolio Manager Report (Unaudited) (Continued) |
Subadviser outlook
Looking ahead, in Fund management’s view, the U.S. economy has the potential to continue its recovery, as vaccine distribution picks up and additional fiscal stimulus is possible in the near term, due to the incoming Biden Administration. Equity valuations remain elevated compared to their historical averages, but Fund management believes that accommodative monetary and fiscal policy, combined with increased consumer activity, could provide the tailwinds necessary to spur further equity gains.
32
MML Equity Index Fund – Portfolio Manager Report (Unaudited) (Continued) |
MML Equity Index Fund
Largest Holdings
(% of Net Assets) on 12/31/20 |
Apple, Inc. | 6.7% |
Microsoft Corp. | 5.3% |
Amazon.com, Inc. | 4.4% |
Facebook, Inc. Class A | 2.1% |
Tesla, Inc. | 1.7% |
Alphabet, Inc. Class A | 1.7% |
Alphabet, Inc. Class C | 1.6% |
Berkshire Hathaway, Inc. Class B | 1.4% |
Johnson & Johnson | 1.3% |
JP Morgan Chase & Co. | 1.2% |
| | 27.4% |
| | |
MML Equity Index Fund
Sector Table
(% of Net Assets) on 12/31/20 |
Technology | 23.1% |
Consumer, Non-cyclical | 20.8% |
Communications | 16.2% |
Financial | 14.4% |
Consumer, Cyclical | 9.7% |
Industrial | 8.2% |
Utilities | 2.7% |
Energy | 2.3% |
Basic Materials | 2.1% |
Mutual Funds | 0.1% |
Total Long-Term Investments | 99.6% |
Short-Term Investments and Other Assets and Liabilities | 0.4% |
Net Assets | 100.0% |
| | |
33
MML Equity Index Fund – Portfolio Manager Report (Unaudited) (Continued) |
GROWTH OF $10,000 INVESTMENT - CLASS I

The graph above illustrates a representative class of the Fund’s historical performance for the past 10 fiscal years or since inception (for Funds lacking 10-year records) in comparison to its benchmark index, as well as one or more additional indexes, if applicable. The performance of other share classes will be greater than or less than the class depicted above.
Average Annual Total Returns (for the periods ended 12/31/2020) | | |
| Inception Date
of Class | 1 Year | 5 Years | 10 Years |
Class I | 05/01/1997 | 18.06% | 14.75% | 13.41% |
Class II | 05/01/2000 | 18.21% | 14.91% | 13.58% |
Class III | 05/01/2000 | 18.41% | 15.07% | 13.74% |
Service Class I | 08/15/2008 | 17.74% | 14.46% | 13.13% |
S&P 500 Index | | 18.40% | 15.22% | 13.88% |
Generally accepted accounting principles require adjustments to be made to the net assets of the Fund at period end for financial reporting purposes only, and as such, the total return based on the unadjusted net asset value per share may differ from the total return reported in the financial highlights.
Performance results in the graph and table reflect the percentage change in net asset value, including reinvestment of dividends and capital gains distributions. Investors should note that the Fund is a professionally managed mutual fund, while the index or indexes shown above are unmanaged, cannot be purchased directly, and, with the exception of any peer group index, do not incur expenses.
Performance data quoted in the graph and table represents past performance; past performance is not predictive of future results. The investment return and principal value of shares of the Fund fluctuate, so your shares, when sold, may be worth more or less than their original cost. Current performance of the Fund may be lower or higher than the performance quoted. The performance shown does not reflect the deduction of taxes, if any, that a shareholder would pay on Fund distributions or the redemption of Fund shares. Performance data current to the most recent month end may be obtained by calling 1-888-309-3539.
Investors should read the Fund’s prospectus with regard to the Fund’s investment objectives, risks, and charges and expenses in conjunction with these financial statements. The Fund’s return reflects changes in the net asset value per share without the deduction of any product charges (e.g., cost of insurance, mortality and expense risk charges, administrative fees, and CDSL). The inclusion of these charges would have reduced the performance shown here.
34
MML Focused Equity Fund – Portfolio Manager Report (Unaudited) |
What is the investment approach of MML Focused Equity Fund, and who is the Fund’s subadviser?
The Fund seeks growth of capital over the long-term by investing primarily in equity securities of U.S. companies that the Fund’s subadviser believes are financially sound, valued conservatively by the market, and have improving prospects. Under normal circumstances, the Fund invests at least 80% of its net assets (plus the amount of any borrowings for investment purposes) in equity securities. The Fund’s subadviser is Wellington Management Company LLP (Wellington Management).
How did the Fund perform during the 12 months ended December 31, 2020?
The Fund’s Class II shares returned 12.76%, underperforming, by a wide margin, the 20.96% return of the Russell 1000® Index (the “benchmark”), which measures the performance of the large-cap segment of U.S. equity securities. It is a subset of the Russell 3000® Index and includes approximately 1000 of the largest securities based on a combination of their market cap and current index membership.
For a discussion on the economic and market environment during the 12-month period ended December 31, 2020, please see the Economic and Market Overview, beginning on page 3.
Subadviser discussion of factors that contributed to the Fund’s performance
For the year ended December 31, 2020, security selection drove the Fund’s relative underperformance, due mainly to the results of weak Fund holdings in the consumer discretionary, information technology, and industrial sectors. Those results were partially offset by stronger-performing Fund holdings in the real estate and financial sectors. The Fund’s sector allocation also detracted from full-year returns, due to the Fund’s underweight, relative to the benchmark, in information technology and an overweight in consumer staples. The Fund’s lack of exposure to the energy sector and its overweight stake in consumer discretionary benefited relative returns.
With respect to specific Fund holdings, top relative detractors for the period included Northrop Grumman (industrial) and Diageo (consumer staples). Shares of aerospace defense company Northrop Grumman slid after first-quarter results missed consensus estimates. Margin compression in aeronautics and defense systems weighed on performance. The company began to recover in the second half of the year, as revenue growth returned and operating margins improved. Shares of U.K.-based alcoholic beverage company Diageo fell early in the year, as restrictions implemented to fight the spread of COVID-19 led to a reduction in social activities, such as business conferences, tourism, and ticketed events. For the fiscal year ended June 2020, revenues of Diageo fell 8.7% on weak volumes. Diageo’s local brands suffered greater volume declines than the global and reserve brands, with the Windsor whisky brand in South Korea down 44%. The Fund’s lack of exposure to benchmark constituents Apple (information technology), Tesla (consumer discretionary), and Amazon (consumer discretionary), all of which were stellar performers during the reporting period, also detracted from relative returns.
Fund holdings that were among the top relative contributors for the period were Nike (consumer discretionary) and Deere (industrial). Shares of athletic apparel company Nike posted a gain over the year, as the company beat earnings estimates and raised guidance in both the first and second quarters of fiscal 2021. Performance was helped by digital business, strong product innovations, and robust membership engagement. Shares of agricultural machinery company Deere rose after the company announced strong third-quarter results, exceeding expectations. The company increased its sales outlook for the year, as demand remained resilient despite the uncertainty related to COVID-19. Fund management eliminated Deere from the Fund’s portfolio during the period.
Subadviser outlook
In the current environment, following such a volatile year, Fund management believes that the data seems to support further market strength in 2021. Despite this, they warn that there is dysfunction in D.C., massive global debt, rising geopolitical risk, and a pandemic that has the potential to damage capacity for years to come. As such, at year end, the Fund’s biggest positions were those where Fund management feels comfortable managing downside risk. For example, if things work out for fast food provider McDonald’s and markets keep going up, it will prove to be a valuable Fund holding. The same could be true if markets go down. Fund management thinks that “upside” is a long-term concept and, therefore, more challenging to anticipate, whereas “downside” is a short-term concept and, thus, more predictable. Fund management tends to “think down” more than “up,” because over the long term, economies grow, markets go up, and good companies become more valuable.
At the end of the period, the Fund held its largest overweight positions in the consumer staples and health care sectors, and was most underweight in the information technology and communication services sectors.
35
MML Focused Equity Fund – Portfolio Manager Report (Unaudited) (Continued) |
MML Focused Equity Fund
Largest Holdings
(% of Net Assets) on 12/31/20 |
The TJX Cos., Inc. | 5.6% |
Johnson & Johnson | 5.6% |
Medtronic PLC | 5.3% |
The Coca-Cola Co. | 5.0% |
McDonald’s Corp. | 4.8% |
American Express Co. | 4.7% |
UnitedHealth Group, Inc. | 4.7% |
Diageo PLC | 4.6% |
Colgate-Palmolive Co. | 4.6% |
PepsiCo, Inc. | 4.6% |
| | 49.5% |
| | |
MML Focused Equity Fund
Sector Table
(% of Net Assets) on 12/31/20 |
Consumer, Non-cyclical | 40.4% |
Financial | 18.5% |
Consumer, Cyclical | 14.9% |
Industrial | 12.4% |
Basic Materials | 6.6% |
Technology | 5.7% |
Total Long-Term Investments | 98.5% |
Short-Term Investments and Other Assets and Liabilities | 1.5% |
Net Assets | 100.0% |
| | |
36
MML Focused Equity Fund – Portfolio Manager Report (Unaudited) (Continued) |
GROWTH OF $10,000 INVESTMENT - CLASS II

The graph above illustrates a representative class of the Fund’s historical performance for the past 10 fiscal years or since inception (for Funds lacking 10-year records) in comparison to its benchmark index, as well as one or more additional indexes, if applicable. The performance of other share classes will be greater than or less than the class depicted above.
Average Annual Total Returns (for the periods ended 12/31/2020) | | | |
| Inception Date
of Class | 1 Year | 5 Years | Since Inception
12/08/2011 | Since Inception
05/01/2012 |
Class II | 12/08/2011 | 12.76% | 16.40% | 15.36% | |
Service Class I | 05/01/2012 | 12.54% | 16.12% | | 13.91% |
Russell 1000 Index | | 20.96% | 15.60% | 15.62% | 14.59% |
Generally accepted accounting principles require adjustments to be made to the net assets of the Fund at period end for financial reporting purposes only, and as such, the total return based on the unadjusted net asset value per share may differ from the total return reported in the financial highlights.
Performance results in the graph and table reflect the percentage change in net asset value, including reinvestment of dividends and capital gains distributions. Investors should note that the Fund is a professionally managed mutual fund, while the index or indexes shown above are unmanaged, cannot be purchased directly, and, with the exception of any peer group index, do not incur expenses.
Performance data quoted in the graph and table represents past performance; past performance is not predictive of future results. The investment return and principal value of shares of the Fund fluctuate, so your shares, when sold, may be worth more or less than their original cost. Current performance of the Fund may be lower or higher than the performance quoted. The performance shown does not reflect the deduction of taxes, if any, that a shareholder would pay on Fund distributions or the redemption of Fund shares. Performance data current to the most recent month end may be obtained by calling 1-888-309-3539.
Investors should read the Fund’s prospectus with regard to the Fund’s investment objectives, risks, and charges and expenses in conjunction with these financial statements. The Fund’s return reflects changes in the net asset value per share without the deduction of any product charges (e.g., cost of insurance, mortality and expense risk charges, administrative fees, and CDSL). The inclusion of these charges would have reduced the performance shown here.
37
MML Foreign Fund – Portfolio Manager Report (Unaudited) |
What is the investment approach of MML Foreign Fund, and who is the Fund’s subadviser?
The Fund seeks long-term total return by investing primarily in common stocks of companies listed on foreign securities exchanges. Under normal circumstances, the Fund invests at least 80% of its net assets (plus the amount of any borrowings for investment purposes) in investments of issuers located outside of the U.S., including those in emerging markets. Under normal market conditions, the Fund invests in equity securities of foreign companies representing at least three countries other than the United States. Although the Fund may invest in companies of any size as measured by assets, sales, or market capitalization, the Fund will tend to focus on larger, more seasoned or established companies. The Fund’s subadviser is Thompson, Siegel & Walmsley LLC (TSW), which replaced Templeton Investment Counsel, LLC (Templeton) effective January 7, 2020.
How did the Fund perform during the 12 months ended December 31, 2020?
The Fund’s Initial Class shares returned 5.93%, underperforming the 7.82% return of the MSCI EAFE Index (the “benchmark”), which measures the performance of the large- and mid-cap segments of developed markets, excluding the U.S. and Canada equity securities. The MSCI EAFE Index became the Fund’s benchmark on January 7, 2020, because the MSCI EAFE Index more closely represents the Fund’s investment strategy than does the Fund’s former benchmark, the MSCI All Country World Index (ACWI) ex USA. The MSCI ACWI ex USA measures the performance of the large- and mid-cap segments of the particular regions, excluding U.S. equity securities, including developed and emerging markets.
For a discussion on the economic and market environment during the 12-month period ended December 31, 2020, please see the Economic and Market Overview, beginning on page 3.
Subadviser discussion of factors that contributed to the Fund’s performance
For the portion of the year that Templeton served as subadviser of the Fund (January 1, 2020– January 6, 2020), stock selection in Canada and China hurt the Fund’s relative performance. In contrast, stock selection in Europe helped drive the Fund’s relative performance. Within Europe, the U.K. was the biggest contributor. Fund holdings in the consumer staples, materials, and consumer discretionary sectors detracted from relative performance. In consumer staples, Japanese convenience store operator Seven & I Holdings and Japanese beverage manufacturer Kirin Holdings were significant detractors. In materials, Canadian precious metals mining company Wheaton Precious Metal detracted from performance. In consumer discretionary, Japanese commercial vehicle and diesel engine manufacturer Isuzu Motors also hurt performance.
For the part of the year that TSW served as subadviser of the Fund (January 7, 2020–December 31, 2020), on a regional basis, Asia Ex-Japan was the largest detractor from Fund performance. Fund holding Australian airline Qantas Airways Limited underperformed, as COVID-19 disrupted both international and domestic air travel. Fund management eliminated the airline from the Fund’s portfolio during the second quarter. The U.K. led the Fund’s relative performance, with Fund holdings Ashtead Group plc and Entain PLC among the top performers. Ashtead Group rebounded from COVID-19 lows as global economies reopened and there was an anticipated pickup in construction activity. The equipment rental company has a cash-generative business model that Fund management thinks is well positioned to survive near-term headwinds. Sports betting and gambling company Entain, formerly GVC Holdings, reported strong revenue growth driven by its online offerings.
With respect to sectors, health care detracted from the Fund’s relative returns due to stock selection. The international health care services company Fresenius SE & Co. underperformed despite reporting satisfactory results. A large portion of this Fund holding’s business revolves around elective procedures, which were routinely postponed during 2020 due to COVID-19. The energy and financial sectors were the top contributors to the Fund’s relative returns. The Fund’s underweight allocation to the energy sector proved positive, as did Fund holdings within the sector whose fortunes were modestly less sensitive to commodity prices that declined most of the year. Stock selection was also favorable in the financial sector, with UBS Group AG among the top performers. Global wealth manager UBS Group performed well throughout the year after releasing a series of strong earnings results. The Fund holding consistently grew assets under management and benefited from increased transaction activity during the year’s periods of market volatility.
Subadviser outlook
2020 offered both opportunities and pitfalls for nearly all investors. While growth commanded a sizable premium in the first half of the year, markets rediscovered value later in the year. Currency also played a major role in returns as the U.S. dollar weakened. Fund management believes that the global economy will recover fitfully in the year ahead and the sorting among corporate winners and losers will continue. Compared to 2020, their view is that political risks appear diminished, but regulatory factors could shackle high-flying capital markets. In their opinion, the largest companies, which were performance laggards for the year, have the potential to offer attractive risk/reward tradeoffs in 2021.
38
MML Foreign Fund – Portfolio Manager Report (Unaudited) (Continued) |
MML Foreign Fund
Largest Holdings
(% of Net Assets) on 12/31/20 |
Sony Corp. | 3.1% |
Samsung Electronics Co. Ltd. | 2.5% |
Siemens AG Registered | 2.0% |
Toyota Industries Corp. | 1.9% |
Koninklijke Philips NV | 1.9% |
Nestle SA Registered | 1.8% |
Unilever PLC | 1.8% |
Engie SA | 1.8% |
Seven & i Holdings Co. Ltd. | 1.8% |
Novartis AG Registered | 1.7% |
| | 20.3% |
| | |
MML Foreign Fund
Sector Table
(% of Net Assets) on 12/31/20 |
Consumer, Non-cyclical | 25.7% |
Financial | 18.8% |
Consumer, Cyclical | 14.2% |
Industrial | 13.8% |
Technology | 11.1% |
Basic Materials | 6.4% |
Energy | 3.7% |
Utilities | 3.2% |
Communications | 2.5% |
Diversified | 1.2% |
Mutual Funds | 0.5% |
Total Long-Term Investments | 101.1% |
Short-Term Investments and Other Assets and Liabilities | (1.1)% |
Net Assets | 100.0% |
| | |
39
MML Foreign Fund – Portfolio Manager Report (Unaudited) (Continued) |
GROWTH OF $10,000 INVESTMENT - INITIAL CLASS

The graph above illustrates a representative class of the Fund’s historical performance for the past 10 fiscal years or since inception (for Funds lacking 10-year records) in comparison to its benchmark index, as well as one or more additional indexes, if applicable. The performance of other share classes will be greater than or less than the class depicted above.
Average Annual Total Returns (for the periods ended 12/31/2020) | | |
| Inception Date
of Class | 1 Year | 5 Years | 10 Years |
Initial Class | 05/01/2006 | 5.93% | 4.48% | 3.70% |
Service Class | 08/15/2008 | 5.57% | 4.20% | 3.43% |
MSCI EAFE Index* | | 7.82% | 7.45% | 5.51% |
MSCI ACWI ex USA | | 10.65% | 8.93% | 4.92% |
* Benchmark
Generally accepted accounting principles require adjustments to be made to the net assets of the Fund at period end for financial reporting purposes only, and as such, the total return based on the unadjusted net asset value per share may differ from the total return reported in the financial highlights.
Performance results in the graph and table reflect the percentage change in net asset value, including reinvestment of dividends and capital gains distributions. Investors should note that the Fund is a professionally managed mutual fund, while the index or indexes shown above are unmanaged, cannot be purchased directly, and, with the exception of any peer group index, do not incur expenses.
Performance data quoted in the graph and table represents past performance; past performance is not predictive of future results. The investment return and principal value of shares of the Fund fluctuate, so your shares, when sold, may be worth more or less than their original cost. Current performance of the Fund may be lower or higher than the performance quoted. The performance shown does not reflect the deduction of taxes, if any, that a shareholder would pay on Fund distributions or the redemption of Fund shares. Performance data current to the most recent month end may be obtained by calling 1-888-309-3539.
Investors should read the Fund’s prospectus with regard to the Fund’s investment objectives, risks, and charges and expenses in conjunction with these financial statements. The Fund’s return reflects changes in the net asset value per share without the deduction of any product charges (e.g., cost of insurance, mortality and expense risk charges, administrative fees, and CDSL). The inclusion of these charges would have reduced the performance shown here.
40
MML Fundamental Equity Fund – Portfolio Manager Report (Unaudited) |
What is the investment approach of MML Fundamental Equity Fund, formerly known as MML Fundamental Growth Fund, and who is the Fund’s subadviser?
The Fund seeks a high total return by investing primarily in common stocks of U.S. companies of different capitalization ranges. The Fund’s subadviser currently focuses on “large capitalization” issuers, which are considered to be companies with market capitalizations at the time of purchase within the market capitalization range of companies included within the Russell 1000® Index, although it may purchase stocks of companies with any market capitalization. Under normal circumstances, the Fund invests at least 80% of its net assets (plus the amount of any borrowings for investment purposes) in equity securities. The Fund’s subadviser is Invesco Advisers, Inc. (Invesco), which replaced Wellington Management Company LLP (Wellington Management) effective March 2, 2020.
How did the Fund perform during the 12 months ended December 31, 2020?
The Fund’s Class II shares returned 20.02%, outperforming the 18.40% return of the S&P 500® Index (the “benchmark”), which measures the performance of 500 widely held stocks in the U.S. equity market. The S&P 500 Index became the Fund’s benchmark on March 2, 2020, because the S&P 500 Index more closely represents the Fund’s investment strategy than does the Fund’s former benchmark, the Russell 1000® Growth Index. The Russell 1000 Growth Index measures the performance of the large-cap growth segment of U.S. equity securities. It includes the Russell 1000 Index companies with higher price-to-book ratios and higher forecasted growth values.
For a discussion on the economic and market environment during the 12-month period ended December 31, 2020, please see the Economic and Market Overview, beginning on page 3.
Subadviser discussion of factors that contributed to the Fund’s performance
For the portion of the year that Wellington Management served as subadviser of the Fund (January 1, 2020–March 1, 2020), security selection within the industrial and health care sectors helped to drive the Fund’s performance, whereas weaker selection within the communication services and consumer discretionary sectors partially offset results. With respect to specific Fund holdings, the top contributors to benchmark-relative returns were Regeneron Pharmaceuticals (health care) and Brown & Brown (financial). Shares of Regeneron, a biotechnology company, advanced during the period, as competitive pressure on the company eased. Brown & Brown, an insurance provider, started the year off strongly on the heels of positive fourth-quarter earnings results. Conversely, the top detractor from relative performance was the Fund’s lack of exposure to benchmark constituents Tesla (consumer discretionary) and Netflix (communication services). Tesla, an electric vehicle and clean energy company, benefited from strong demand for its products. The online video platform Netflix profited from increased demand for its streaming service as people around the world began spending more time at home due to COVID-19.
For the part of the year that Invesco served as subadviser of the Fund (March 2, 2020–December 31, 2020), strong stock selection in the real estate, communications services, and consumer discretionary sectors drove the Fund’s performance, while stock choices within the information technology, health care, and energy sectors detracted. Fund holdings that were top contributors to relative performance included Qualcomm, Amazon, and Microsoft. Qualcomm benefited from the ramp-up in 5G technology, particularly Apple’s launch of its 5G iPhone, which experienced strong initial demand. Amazon and Microsoft have been key beneficiaries of the stay-at-home trends driven by the pandemic. Both companies saw particularly strong demand for their cloud offerings, driven by the acceleration of the digital transformation that took place across companies and sectors. Amazon also continued to experience market share gains in its e-commerce business.
Fund holdings that were top detractors from relative performance included Suncor, Lockheed Martin, and Motorola Solutions. Suncor, an integrated oil company, was negatively impacted by oil prices and refining utilization at multi-year lows. Despite slashing operating and capital expenses along with the dividend, the company remained challenged and Fund management exited the position. Lockheed Martin underperformed after 2021 financial guidance provided in late October was underwhelming and modestly below consensus expectations. Motorola Solutions was negatively impacted by COVID-19, which had a major impact on its commercial customers in the transportation, entertainment, and hospitality verticals.
41
MML Fundamental Equity Fund – Portfolio Manager Report (Unaudited) (Continued) |
Subadviser outlook
Fund management believes these are the late innings of the pandemic-induced recession. In their view, life could start to normalize in the second quarter of 2021, and potentially return to normal sometime in the third quarter. However, they do not think a simple resumption of the previous economic trend is possible since, even with government assistance programs, many businesses and jobs are being permanently lost, and the reallocation of people and resources in the economy will likely take time. Fund management continues to seek companies with competitive advantages and skilled management teams that are out-executing their peers.
42
MML Fundamental Equity Fund – Portfolio Manager Report (Unaudited) (Continued) |
MML Fundamental Equity Fund
Largest Holdings
(% of Net Assets) on 12/31/20 |
Microsoft Corp. | 7.9% |
Amazon.com, Inc. | 6.3% |
QUALCOMM, Inc. | 3.8% |
UnitedHealth Group, Inc. | 3.4% |
Facebook, Inc. Class A | 3.4% |
JP Morgan Chase & Co. | 3.3% |
Applied Materials, Inc. | 2.8% |
The Procter & Gamble Co. | 2.5% |
Prologis, Inc. | 2.4% |
HCA Healthcare, Inc. | 2.3% |
| | 38.1% |
| | |
MML Fundamental Equity Fund
Sector Table
(% of Net Assets) on 12/31/20 |
Technology | 24.4% |
Consumer, Non-cyclical | 22.0% |
Communications | 16.7% |
Financial | 16.1% |
Industrial | 10.3% |
Consumer, Cyclical | 6.6% |
Energy | 2.3% |
Utilities | 1.2% |
Basic Materials | 0.5% |
Mutual Funds | 0.2% |
Total Long-Term Investments | 100.3% |
Short-Term Investments and Other Assets and Liabilities | (0.3)% |
Net Assets | 100.0% |
| | |
43
MML Fundamental Equity Fund – Portfolio Manager Report (Unaudited) (Continued) |
GROWTH OF $10,000 INVESTMENT - CLASS II

The graph above illustrates a representative class of the Fund’s historical performance for the past 10 fiscal years or since inception (for Funds lacking 10-year records) in comparison to its benchmark index, as well as one or more additional indexes, if applicable. The performance of other share classes will be greater than or less than the class depicted above.
Average Annual Total Returns (for the periods ended 12/31/2020) | | | |
| Inception Date
of Class | 1 Year | 5 Years | Since Inception
12/08/2011 | Since Inception
05/01/2012 |
Class II | 12/08/2011 | 20.02% | 16.47% | 15.75% | |
Service Class I | 05/01/2012 | 19.59% | 16.17% | | 14.36% |
S&P 500 Index* | | 18.40% | 15.22% | 15.41% | 14.41% |
Russell 1000 Growth Index | | 38.49% | 21.00% | 18.93% | 17.88% |
* Benchmark
Generally accepted accounting principles require adjustments to be made to the net assets of the Fund at period end for financial reporting purposes only, and as such, the total return based on the unadjusted net asset value per share may differ from the total return reported in the financial highlights.
Performance results in the graph and table reflect the percentage change in net asset value, including reinvestment of dividends and capital gains distributions. Investors should note that the Fund is a professionally managed mutual fund, while the index or indexes shown above are unmanaged, cannot be purchased directly, and, with the exception of any peer group index, do not incur expenses.
Performance data quoted in the graph and table represents past performance; past performance is not predictive of future results. The investment return and principal value of shares of the Fund fluctuate, so your shares, when sold, may be worth more or less than their original cost. Current performance of the Fund may be lower or higher than the performance quoted. The performance shown does not reflect the deduction of taxes, if any, that a shareholder would pay on Fund distributions or the redemption of Fund shares. Performance data current to the most recent month end may be obtained by calling 1-888-309-3539.
Investors should read the Fund’s prospectus with regard to the Fund’s investment objectives, risks, and charges and expenses in conjunction with these financial statements. The Fund’s return reflects changes in the net asset value per share without the deduction of any product charges (e.g., cost of insurance, mortality and expense risk charges, administrative fees, and CDSL). The inclusion of these charges would have reduced the performance shown here.
44
MML Fundamental Value Fund – Portfolio Manager Report (Unaudited) |
What is the investment approach of MML Fundamental Value Fund, and who is the Fund’s subadviser?
The Fund seeks long-term total return by investing primarily in equity securities of issuers that the Fund’s subadviser believes are undervalued. Under normal circumstances, the Fund invests at least 80% of its net assets (plus the amount of any borrowings for investment purposes) in equity securities, with a focus on companies with large market capitalizations (which the subadviser believes are generally above $1 billion). The Fund’s subadviser is Boston Partners Global Investors, Inc. (Boston Partners).
How did the Fund perform during the 12 months ended December 31, 2020?
The Fund’s Class II shares returned 2.67%, underperforming the 2.80% return of the Russell 1000® Value Index (the “benchmark”), which measures the performance of the large-cap value segment of U.S. equity securities. It includes the Russell 1000 Index companies with lower price-to-book ratios and lower expected growth values.
For a discussion on the economic and market environment during the 12-month period ended December 31, 2020, please see the Economic and Market Overview, beginning on page 3.
Subadviser discussion of factors that contributed to the Fund’s performance
For the year ended December 31, 2020, the Fund’s overweight allocation, relative to the benchmark, to the financial sector and an underweight stake in consumer staples hampered the Fund’s relative performance. On the other hand, the Fund’s underweight allocation to real estate and overweight allocation to the materials and health care sectors aided relative performance.
During the year, stock selection within health care and financial sectors detracted from relative performance. In health care, the Fund’s lack of exposure to expensive companies in the life sciences, medical devices, and biotechnology industries – including Danaher, Thermo Fisher, Abbott, and Regeneron – hurt relative performance. In the financial sector, the Fund’s overweight position in the property and casualty insurance industry weighed on returns, as claims increased due to COVID-19 and weather-related issues. The industry, however, rebounded in the fourth quarter.
Fund holdings within the information technology, communication services, and industrial sectors helped drive the Fund’s full-year performance. Within information technology, semiconductor capital equipment companies Lam Research and KLA, and applied materials and semiconductor manufacturers Qorvo, NXP, and ON Semiconductor performed well, as demand for semiconductors was stronger than expected during the COVID-19 crisis. In communication services, bellwethers Alphabet (the parent company of Google) and Facebook outperformed, as online ad trends remained strong. Within industrial, inexpensive, economically sensitive companies outperformed, as tangible evidence of an economic rebound emerged. Machinery companies Deere and Cummins, electrical equipment company Eaton, and building products supplier Owens Corning all outperformed due to order backlogs increasing and guidance being raised.
During the reporting period, Fund management increased the Fund’s exposure to the industrial and energy sectors and reduced its stake in consumer staples. Within industrial, the Fund initiated a position in Boeing, which had its Max 737 recertified by the FAA in November, an important milestone to turn around the cash flow at the company. The Fund added to its energy holdings by initiating positions in Canadian Natural Resources and PetroBras during the fourth quarter, and reduced its exposure to consumer staples by selling its Kimberly Clark position.
Subadviser outlook
Fund management will continue to focus on finding investments that have not only attractive valuation characteristics and solid business fundamentals, but also improving business momentum and catalysts that Fund management believes will help drive stock prices higher. In their view, the global economy could experience a steady cyclical recovery over the next few years. Historically, these have often been good windows for value investing, as more economically sensitive companies tend to outperform growth favorites under such conditions.
45
MML Fundamental Value Fund – Portfolio Manager Report (Unaudited) (Continued) |
MML Fundamental Value Fund
Largest Holdings
(% of Net Assets) on 12/31/20 |
Berkshire Hathaway, Inc. Class B | 3.4% |
Johnson & Johnson | 3.4% |
JP Morgan Chase & Co. | 3.4% |
Bank of America Corp. | 2.5% |
Cigna Corp. | 2.5% |
Cisco Systems, Inc. | 2.4% |
Chubb Ltd. | 2.1% |
Anthem, Inc. | 2.0% |
AutoZone, Inc. | 1.9% |
Alphabet, Inc. Class A | 1.8% |
| | 25.4% |
| | |
MML Fundamental Value Fund
Sector Table
(% of Net Assets) on 12/31/20 |
Financial | 24.0% |
Consumer, Non-cyclical | 22.9% |
Industrial | 12.1% |
Consumer, Cyclical | 11.7% |
Technology | 10.1% |
Communications | 5.7% |
Energy | 5.3% |
Basic Materials | 4.9% |
Utilities | 2.6% |
Total Long-Term Investments | 99.3% |
Short-Term Investments and Other Assets and Liabilities | 0.7% |
Net Assets | 100.0% |
| | |
46
MML Fundamental Value Fund – Portfolio Manager Report (Unaudited) (Continued) |
GROWTH OF $10,000 INVESTMENT - CLASS II

The graph above illustrates a representative class of the Fund’s historical performance for the past 10 fiscal years or since inception (for Funds lacking 10-year records) in comparison to its benchmark index, as well as one or more additional indexes, if applicable. The performance of other share classes will be greater than or less than the class depicted above.
Average Annual Total Returns (for the periods ended 12/31/2020) | | | |
| Inception Date
of Class | 1 Year | 5 Years | 10 Years | Since Inception
05/01/2012 |
Class II | 08/10/2010 | 2.67% | 8.06% | 9.07% | |
Service Class I | 05/01/2012 | 2.37% | 7.79% | | 9.06% |
Russell 1000 Value Index | | 2.80% | 9.74% | 10.50% | 10.93% |
Generally accepted accounting principles require adjustments to be made to the net assets of the Fund at period end for financial reporting purposes only, and as such, the total return based on the unadjusted net asset value per share may differ from the total return reported in the financial highlights.
Performance results in the graph and table reflect the percentage change in net asset value, including reinvestment of dividends and capital gains distributions. Investors should note that the Fund is a professionally managed mutual fund, while the index or indexes shown above are unmanaged, cannot be purchased directly, and, with the exception of any peer group index, do not incur expenses.
Performance data quoted in the graph and table represents past performance; past performance is not predictive of future results. The investment return and principal value of shares of the Fund fluctuate, so your shares, when sold, may be worth more or less than their original cost. Current performance of the Fund may be lower or higher than the performance quoted. The performance shown does not reflect the deduction of taxes, if any, that a shareholder would pay on Fund distributions or the redemption of Fund shares. Performance data current to the most recent month end may be obtained by calling 1-888-309-3539.
Investors should read the Fund’s prospectus with regard to the Fund’s investment objectives, risks, and charges and expenses in conjunction with these financial statements. The Fund’s return reflects changes in the net asset value per share without the deduction of any product charges (e.g., cost of insurance, mortality and expense risk charges, administrative fees, and CDSL). The inclusion of these charges would have reduced the performance shown here.
47
MML Global Fund – Portfolio Manager Report (Unaudited) |
What is the investment approach of MML Global Fund, and who is the Fund’s subadviser?
The Fund seeks long-term capital appreciation by investing primarily in the equity securities of U.S. and foreign companies, including companies in developed and emerging markets. The Fund may invest a significant percentage of its assets in issuers in a single industry, sector, country, or region. The Fund’s subadviser is Massachusetts Financial Services Company (MFS).
How did the Fund perform during the 12 months ended December 31, 2020?
The Fund’s Class I shares returned 14.02%, modestly underperforming the 15.90% return of the MSCI World Index (the “benchmark”), which measures the performance of the large- and mid-cap segments of world equity securities.
For a discussion on the economic and market environment during the 12-month period ended December 31, 2020, please see the Economic and Market Overview, beginning on page 3.
Subadviser discussion of factors that contributed to the Fund’s performance
For the year ended December 31, 2020, security selection and an underweight position, relative to the benchmark, in the information technology sector were the primary detractors from the Fund’s relative performance. Within the sector, not owning shares of both computer and personal electronics maker Apple and software giant Microsoft also weighed on the Fund’s relative results. Stock selection in the consumer discretionary sector also detracted from the Fund’s relative performance. Within consumer discretionary, not owning shares of both internet retail giant Amazon and electric vehicle manufacturer Tesla hindered returns.
Security selection and an overweight allocation to the consumer staples sector further dampened relative returns, led by overweight positions in food processing company Danone (France) and premium drinks distributer Diageo (United Kingdom). Stocks in other sectors that negatively impacted the Fund’s relative performance included overweight positions in life sciences company Bayer (Germany), diversified industrial manufacturer Rolls-Royce (United Kingdom), advertising and marketing firm WPP Group (United Kingdom), and financial services provider Bank of New York Mellon.
On the other side of the ledger, an underweight position in the energy sector contributed to the Fund’s relative performance for the year. Within energy, not owning shares of both American integrated oil and gas company ExxonMobil and U.K.-based global energy and petrochemicals company Royal Dutch Shell boosted relative results. An underweight allocation and stock selection in the financial sector also supported relative performance. Stock selection in the industrial sector also helped relative returns, led by overweight positions in electrical distribution equipment manufacturer Schneider Electric (France), railroad company Kansas City Southern, machinery and industrial products manufacturer Kubota (Japan), and ground delivery service company United Parcel Service.
Elsewhere, the Fund’s overweight positions in life sciences supply company Thermo Fisher Scientific, luxury goods company LVMH (France), and digital payment technology developer PayPal, as well as holdings of microchip and electronics manufacturer Samsung Electronics (South Korea; not a benchmark constituent), positively impacted the Fund’s relative performance.
During the reporting period, the Fund’s relative currency exposure, resulting primarily from differences between the Fund’s and the benchmark’s exposures to holdings of securities denominated in foreign currencies, was another contributor to relative performance. All of the Fund’s investment decisions are driven by the fundamentals of each individual opportunity and as such, it is common for the Fund to have different currency exposure than the benchmark.
Subadviser outlook
Looking back on 2020, Fund management is reminded of the advice they always give investors seeking to navigate extreme volatility: Stick with a tried-and-true disciplined investment process focused on the long term. Fund management’s approach seeks out companies with above-average sustainable growth at the right valuation, companies operating in an attractive industry structure, and companies with a competitive advantage and the pricing power to protect and grow profits. Looking ahead, Fund management is optimistic about a potential recovery and the return to some semblance of normalcy in markets, with fewer big swings in share prices and a return to fundamentals, but they remain acutely aware of some stretched valuations and signs of excess in some areas of the market.
48
MML Global Fund – Portfolio Manager Report (Unaudited) (Continued) |
MML Global Fund
Largest Holdings
(% of Net Assets) on 12/31/20 |
Comcast Corp. Class A | 3.5% |
Thermo Fisher Scientific, Inc. | 3.2% |
Visa, Inc. Class A | 3.1% |
Medtronic PLC | 3.0% |
Schneider Electric SE | 3.0% |
LVMH Moet Hennessy Louis Vuitton SE | 2.6% |
Accenture PLC Class A | 2.6% |
Nestle SA Registered | 2.5% |
Honeywell International, Inc. | 2.4% |
The Walt Disney Co. | 2.2% |
| | 28.1% |
| | |
MML Global Fund
Sector Table
(% of Net Assets) on 12/31/20 |
Consumer, Non-cyclical | 35.8% |
Industrial | 20.3% |
Financial | 12.8% |
Technology | 9.1% |
Communications | 8.6% |
Consumer, Cyclical | 7.0% |
Basic Materials | 6.1% |
Mutual Funds | 1.2% |
Total Long-Term Investments | 100.9% |
Short-Term Investments and Other Assets and Liabilities | (0.9)% |
Net Assets | 100.0% |
| | |
49
MML Global Fund – Portfolio Manager Report (Unaudited) (Continued) |
GROWTH OF $10,000 INVESTMENT - CLASS I

The graph above illustrates a representative class of the Fund’s historical performance for the past 10 fiscal years or since inception (for Funds lacking 10-year records) in comparison to its benchmark index, as well as one or more additional indexes, if applicable. The performance of other share classes will be greater than or less than the class depicted above.
Average Annual Total Returns (for the periods ended 12/31/2020) | | |
| Inception Date
of Class | 1 Year | 5 Years | 10 Years |
Class I | 05/01/2006 | 14.02% | 12.46% | 10.84% |
Class II | 05/01/2006 | 13.96% | 12.46% | 10.88% |
Service Class I | 08/15/2008 | 13.70% | 12.18% | 10.55% |
MSCI World Index | | 15.90% | 12.19% | 9.87% |
Generally accepted accounting principles require adjustments to be made to the net assets of the Fund at period end for financial reporting purposes only, and as such, the total return based on the unadjusted net asset value per share may differ from the total return reported in the financial highlights.
Performance results in the graph and table reflect the percentage change in net asset value, including reinvestment of dividends and capital gains distributions. Investors should note that the Fund is a professionally managed mutual fund, while the index or indexes shown above are unmanaged, cannot be purchased directly, and, with the exception of any peer group index, do not incur expenses.
Performance data quoted in the graph and table represents past performance; past performance is not predictive of future results. The investment return and principal value of shares of the Fund fluctuate, so your shares, when sold, may be worth more or less than their original cost. Current performance of the Fund may be lower or higher than the performance quoted. The performance shown does not reflect the deduction of taxes, if any, that a shareholder would pay on Fund distributions or the redemption of Fund shares. Performance data current to the most recent month end may be obtained by calling 1-888-309-3539.
Investors should read the Fund’s prospectus with regard to the Fund’s investment objectives, risks, and charges and expenses in conjunction with these financial statements. The Fund’s return reflects changes in the net asset value per share without the deduction of any product charges (e.g., cost of insurance, mortality and expense risk charges, administrative fees, and CDSL). The inclusion of these charges would have reduced the performance shown here.
50
MML Growth & Income Fund – Portfolio Manager Report (Unaudited) |
What is the investment approach of MML Growth & Income Fund, and who is the Fund’s subadviser?
The Fund seeks capital appreciation and income by investing, under normal circumstances, at least 80% of its net assets (plus the amount of any borrowings for investment purposes) in equity securities and equity-related securities, including convertible securities, preferred stocks, options, and warrants, of U.S. companies with market capitalizations at the time of purchase greater than $1 billion. The Fund’s subadviser is Massachusetts Financial Services Company (MFS).
How did the Fund perform during the 12 months ended December 31, 2020?
The Fund’s Initial Class shares returned 14.51%, underperforming the 18.40% return of the S&P 500® Index (the “benchmark”), which measures the performance of 500 widely held stocks in the U.S. equity market.
For a discussion on the economic and market environment during the 12-month period ended December 31, 2020, please see the Economic and Market Overview, beginning on page 3.
Subadviser discussion of factors that contributed to the Fund’s performance
For the year ended December 31, 2020, security selection in the information technology sector hampered the Fund’s relative performance. Within the sector, the Fund’s underweight position, relative to the benchmark, in computer and personal electronics maker Apple, and not holding shares of both computer graphics processor maker NVIDIA and digital payment technology developer PayPal detracted from the Fund’s relative performance.
Also weakening the Fund’s relative performance were stock selection and, to a lesser extent, an underweight position in the consumer discretionary sector. Stock selection and an overweight position in the consumer staples sector were also detractors. Within the consumer discretionary sector, not holding shares of strong-performing internet retail giant Amazon held back relative returns. Within the consumer staples sector, holding shares of food processing company Danone (France; not a benchmark constituent) detracted from relative results, as the stock declined over the reporting period. Elsewhere, holding shares of natural gas and petrochemical products manufacturer and pipeline company Enterprise Products Partners (not a benchmark constituent), and the timing of the Fund’s overweight positions in both oil field services company Schlumberger and energy exploration and production company EOG Resources detracted. The Fund eliminated Schlumberger and EOG Resources from its portfolio. Also, the Fund’s overweight positions in medical technology company Becton, Dickson & Co. as well as financial services firm Bank of America hindered relative performance.
On the upside, stock selection in both the financial and communication services sectors proved positive for the Fund’s performance over the reporting period. Within the financial sector, not holding shares of diversified financial services firm Wells Fargo benefited relative results, as that company’s stock price fell during the year. Within the communication services sector, not holding shares of telecommunication services provider AT&T supported relative returns. An underweight allocation to the utilities sector also helped the Fund’s relative performance.
Additional contributors to relative performance in other sectors included not owning shares of integrated oil and gas company ExxonMobil, energy company Chevron, and aerospace company Boeing. Overweighting shares of specialty rural lifestyle retailer Tractor Supply Company, life sciences supply company Thermo Fisher Scientific, health care equipment manufacturer Danaher, retail giant Target, and software company Adobe Systems also aided the Fund’s relative performance.
During the reporting period, the Fund’s relative currency exposure, resulting primarily from differences between the Fund’s and the benchmark’s exposures to holdings of securities denominated in foreign currencies, was another contributor to relative performance. All of the Fund’s investment decisions are driven by the fundamentals of each individual opportunity and as such, it is common for the Fund to have different currency exposures than the benchmark.
51
MML Growth & Income Fund – Portfolio Manager Report (Unaudited) (Continued) |
Subadviser outlook
In Fund management’s view, the market’s resounding nine-month rally following the March 2020 lows looks very similar to the 2009 rally following the financial crisis. The nine months after the 2009 rally were fraught with volatility, as investors tried to decipher the next phase of the market. Time will tell if 2021 follows a similar path, but Fund management is prepared for the potential for volatility, as investors try to make sense of where the market could be headed. Fund management believes that there may be froth in this market, as evidenced by large retail investor flows, initial public offerings (IPOs), and the record levels of money raised by special-purpose acquisition companies. And, as MFS’s Chief Investment Strategist Rob Almeida and Chief Economist Erik Weisman like to emphasize, “There is no such thing as a free lunch.” They believe the monetary and fiscal response to what the world went through in 2020 comes with a cost; it was not free. In Fund management’s view, the combination of market distortion from central bankers and growing demand for corporate behavior changes could be setting the stage for a new era of profit and asset price dispersion, which they feel could lead to opportunities for active managers.
52
MML Growth & Income Fund – Portfolio Manager Report (Unaudited) (Continued) |
MML Growth & Income Fund
Largest Holdings
(% of Net Assets) on 12/31/20 |
Microsoft Corp. | 5.0% |
Alphabet, Inc. Class A | 4.0% |
Apple, Inc. | 2.5% |
JP Morgan Chase & Co. | 2.5% |
Johnson & Johnson | 2.4% |
Visa, Inc. Class A | 2.4% |
Medtronic PLC | 2.3% |
Mastercard, Inc. Class A | 2.2% |
Honeywell International, Inc. | 2.2% |
Comcast Corp. Class A | 2.1% |
| | 27.6% |
| | |
MML Growth & Income Fund
Sector Table
(% of Net Assets) on 12/31/20 |
Consumer, Non-cyclical | 25.1% |
Technology | 20.5% |
Financial | 18.8% |
Consumer, Cyclical | 10.3% |
Communications | 10.0% |
Industrial | 9.2% |
Basic Materials | 3.1% |
Energy | 1.6% |
Utilities | 0.6% |
Total Long-Term Investments | 99.2% |
Short-Term Investments and Other Assets and Liabilities | 0.8% |
Net Assets | 100.0% |
| | |
53
MML Growth & Income Fund – Portfolio Manager Report (Unaudited) (Continued) |
GROWTH OF $10,000 INVESTMENT - INITIAL CLASS

The graph above illustrates a representative class of the Fund’s historical performance for the past 10 fiscal years or since inception (for Funds lacking 10-year records) in comparison to its benchmark index, as well as one or more additional indexes, if applicable. The performance of other share classes will be greater than or less than the class depicted above.
Average Annual Total Returns (for the periods ended 12/31/2020) | | |
| Inception Date
of Class | 1 Year | 5 Years | 10 Years |
Initial Class | 05/01/2006 | 14.51% | 14.05% | 12.86% |
Service Class | 08/15/2008 | 14.24% | 13.77% | 12.58% |
S&P 500 Index | | 18.40% | 15.22% | 13.88% |
Generally accepted accounting principles require adjustments to be made to the net assets of the Fund at period end for financial reporting purposes only, and as such, the total return based on the unadjusted net asset value per share may differ from the total return reported in the financial highlights.
Performance results in the graph and table reflect the percentage change in net asset value, including reinvestment of dividends and capital gains distributions. Investors should note that the Fund is a professionally managed mutual fund, while the index or indexes shown above are unmanaged, cannot be purchased directly, and, with the exception of any peer group index, do not incur expenses.
Performance data quoted in the graph and table represents past performance; past performance is not predictive of future results. The investment return and principal value of shares of the Fund fluctuate, so your shares, when sold, may be worth more or less than their original cost. Current performance of the Fund may be lower or higher than the performance quoted. The performance shown does not reflect the deduction of taxes, if any, that a shareholder would pay on Fund distributions or the redemption of Fund shares. Performance data current to the most recent month end may be obtained by calling 1-888-309-3539.
Investors should read the Fund’s prospectus with regard to the Fund’s investment objectives, risks, and charges and expenses in conjunction with these financial statements. The Fund’s return reflects changes in the net asset value per share without the deduction of any product charges (e.g., cost of insurance, mortality and expense risk charges, administrative fees, and CDSL). The inclusion of these charges would have reduced the performance shown here.
54
MML Income & Growth Fund – Portfolio Manager Report (Unaudited) |
MassMutual Select Funds – Portfolio Summaries (Unaudited) (Continued) |
What is the investment approach of MML Income & Growth Fund, and who is the Fund’s subadviser?
The Fund seeks long-term total return and current income by investing primarily in equity securities of issuers that the Fund’s subadviser believes are undervalued. Although the Fund may invest in companies of any size, the Fund will tend to focus on companies with large market capitalizations (which the Fund’s subadviser believes are generally above $2 billion). The Fund’s subadviser is Barrow, Hanley, Mewhinney & Strauss, LLC (Barrow Hanley).
How did the Fund perform during the 12 months ended December 31, 2020?
The Fund’s Initial Class shares returned 3.03%, outperforming the 2.80% return of the Russell 1000® Value Index (the “benchmark”), which measures the performance of the large-cap value segment of U.S. equity securities. It includes the Russell 1000 Index companies with lower price-to-book ratios and lower expected growth values.
For a discussion on the economic and market environment during the 12-month period ended December 31, 2020, please see the Economic and Market Review, beginning on page 3.
Subadviser discussion of factors that contributed to the Fund’s performance
2020 will be recorded as another year of growth’s dominance, as the Russell 1000® Growth benchmark outperformed its value counterpart by the largest margin on record – over 40% annually at one point during the year. It will also be notable for having the most rapidly declining bear market in history, followed by a historically rapid recovery. The bear market was atypical to say the least, as cheaper stocks (with higher dividend yields and lower price/earnings ratios) were shunned in favor of growth stocks (specifically, pricey technology stocks).
Something unexpected happened on the way to growth’s coronation party for the year: Value stocks began outperforming and clawing back some of growth’s advantage with a strong fourth-quarter performance. The Fund’s outperformance during the fourth quarter propelled its returns high enough for the Fund to end the year slightly ahead of the benchmark.
The Fund’s stock selection within the technology sector added meaningfully to relative performance. Fund holdings within the technology sector gained 46.3% during the year, while the technology sector of the benchmark rose only 10.4%. Among the largest contributors were integrated circuit supplier Marvell Technology Group (which advanced 55%), cloud software and database provider Oracle Corp. (+24%), digital telecommunications chipset maker Qualcomm (+77%), and software maker Microsoft (+18%). Within materials, the Fund’s overweight position, relative to the benchmark, and stock selection within the sector, added to relative performance. Fund holdings that contributed here included the specialty agriculture company Corteva (+34%) and the specialty chemical company that supplies many technology and industrial companies, Element Solutions (+53%). These Fund holdings significantly outperformed the benchmark’s materials sector, which gained only 18% during the year.
Areas that detracted from performance included the industrial sector and the energy sector. Within industrial, shares of General Electric, a large industrial conglomerate that has faced many headwinds in several of its portfolio business lines, fell toward the end of the year, and this Fund holding was eliminated from the Fund’s portfolio. Another Fund holding, Spirit AeroSystems, a large supplier of fuselage systems and aerospace systems to commercial airlines and defense contractors, detracted from the Fund’s full-year returns, as demand for air travel decreased dramatically. The Fund also eliminated this stock from its portfolio. A slight overweight to, and stock selection within, the energy sector detracted from performance. Nearly every Fund holding within the sector hampered returns, as the price of oil fell dramatically during the year. The Fund holdings that detracted the most included EOG Resources, an exploration and production company; Valero Energy, a large refinery; and Phillips 66, a transportation, storage, and marketer of gas and other fuels.
Subadviser outlook
Fund management notes that growth’s rise relative to value went parabolic during 2020, breaking every previous record for a one-year return difference. The length and magnitude of this growth cycle has left many investors wondering whether an allocation to value will ever outperform their growth investments. Yet, in Fund management’s view, the greater the consensus grows that “value is dead,” the closer we could be to a sustainable inflection point in favor of value. They also note that, while value stocks began outperforming growth starting in September 2020, clawing back some of growth’s advantage with strong fourth-quarter returns, whether or not a sustainable turn in favor of value has actually begun remains to be seen. However, they do believe that conditions appear to be tilted in favor of value to a degree that we have not seen in more than a decade.
55
MML Income & Growth Fund – Portfolio Manager Report (Unaudited) (Continued) |
MML Income & Growth Fund
Largest Holdings
(% of Net Assets) on 12/31/20 |
DuPont de Nemours, Inc. | 2.6% |
JP Morgan Chase & Co. | 2.5% |
US Bancorp | 2.4% |
Corteva, Inc. | 2.3% |
Comcast Corp. Class A | 2.3% |
Phillips 66 | 2.2% |
Coca-Cola European Partners PLC | 2.2% |
American Express Co. | 2.2% |
Raytheon Technologies Corp. | 2.2% |
Wells Fargo & Co. | 2.2% |
| | 23.1% |
| | |
MML Income & Growth Fund
Sector Table
(% of Net Assets) on 12/31/20 |
Financial | 29.6% |
Consumer, Non-cyclical | 18.1% |
Industrial | 14.5% |
Consumer, Cyclical | 9.8% |
Technology | 6.7% |
Utilities | 5.7% |
Energy | 5.3% |
Basic Materials | 5.2% |
Communications | 4.6% |
Mutual Funds | 0.4% |
Total Long-Term Investments | 99.9% |
Short-Term Investments and Other Assets and Liabilities | 0.1% |
Net Assets | 100.0% |
| | |
56
MML Income & Growth Fund – Portfolio Manager Report (Unaudited) (Continued) |
GROWTH OF $10,000 INVESTMENT - INITIAL CLASS

The graph above illustrates a representative class of the Fund’s historical performance for the past 10 fiscal years or since inception (for Funds lacking 10-year records) in comparison to its benchmark index, as well as one or more additional indexes, if applicable. The performance of other share classes will be greater than or less than the class depicted above.
Average Annual Total Returns (for the periods ended 12/31/2020) | | |
| Inception Date
of Class | 1 Year | 5 Years | 10 Years |
Initial Class | 05/01/2006 | 3.03% | 9.13% | 9.54% |
Service Class | 08/15/2008 | 2.79% | 8.86% | 9.28% |
Russell 1000 Value Index | | 2.80% | 9.74% | 10.50% |
Generally accepted accounting principles require adjustments to be made to the net assets of the Fund at period end for financial reporting purposes only, and as such, the total return based on the unadjusted net asset value per share may differ from the total return reported in the financial highlights.
Performance results in the graph and table reflect the percentage change in net asset value, including reinvestment of dividends and capital gains distributions. Investors should note that the Fund is a professionally managed mutual fund, while the index or indexes shown above are unmanaged, cannot be purchased directly, and, with the exception of any peer group index, do not incur expenses.
Performance data quoted in the graph and table represents past performance; past performance is not predictive of future results. The investment return and principal value of shares of the Fund fluctuate, so your shares, when sold, may be worth more or less than their original cost. Current performance of the Fund may be lower or higher than the performance quoted. The performance shown does not reflect the deduction of taxes, if any, that a shareholder would pay on Fund distributions or the redemption of Fund shares. Performance data current to the most recent month end may be obtained by calling 1-888-309-3539.
Investors should read the Fund’s prospectus with regard to the Fund’s investment objectives, risks, and charges and expenses in conjunction with these financial statements. The Fund’s return reflects changes in the net asset value per share without the deduction of any product charges (e.g., cost of insurance, mortality and expense risk charges, administrative fees, and CDSL). The inclusion of these charges would have reduced the performance shown here.
57
MML International Equity Fund – Portfolio Manager Report (Unaudited) |
MassMutual Select Funds – Portfolio Summaries (Unaudited) (Continued) |
What is the investment approach of MML International Equity Fund, and who is the Fund’s subadviser?
The Fund seeks long-term capital growth by investing, under normal circumstances, at least 80% of its net assets (plus the amount of any borrowings for investment purposes) in equity securities of non-U.S. companies located in non-U.S. markets throughout the world, including emerging markets. The Fund may invest a substantial portion of its assets in just one region or country and may, but does not currently intend to, invest in U.S. companies. Ordinarily, the Fund’s portfolio typically holds thirty to sixty stocks and the Fund invests in the securities of at least five countries outside the U.S. The Fund’s subadviser is Harris Associates L.P. (Harris).
How did the Fund perform during the 12 months ended December 31, 2020?
The Fund’s Class II shares returned 5.37%, underperforming the 7.59% return of the MSCI World Index ex USA (the “benchmark”), which measures the performance of the large- and mid-cap segments of world, excluding U.S. equity securities.
For a discussion on the economic and market environment during the 12-month period ended December 31, 2020, please see the Economic and Market Overview, beginning on page 3.
Subadviser discussion of factors that contributed to the Fund’s performance
As the Fund uses a bottom-up approach in selecting stocks, country and sector allocations are a result of the Fund’s stock selection process. With respect to country performance relative to the benchmark, both stock selection and country weightings detracted from the Fund’s results. Relative sector performance was negatively impacted by stock selection, while sector weightings contributed to overall results.
From a geographic perspective, Japan detracted most from relative performance, mainly due to a less-than-benchmark weighting – although ironically, this geography contributed to the Fund’s absolute return, as all four underlying Fund holdings generated double-digit positive returns. The Netherlands was the next-largest relative detractor, stemming from less-than-favorable stock selection, along with a lower-than-benchmark weighting. The Netherlands was also a negative absolute contributor, as one of three Fund holdings, internet and direct marketing retail company Prosus, lost value for the period.
South Korea and Sweden produced the Fund’s best relative performance for the year, due to a combination of strong stock selection and weightings discrepancies relative to the benchmark. South Korea and Sweden were also the second- and third-largest contributors to the Fund’s absolute return, as all underlying Fund holdings in these geographies gained value. Interactive media and services firm NAVER (up 67%) generated the largest absolute return in South Korea, while construction machinery and heavy trucks company Volvo (+41%) posted the top absolute return in Sweden.
From a sector perspective, Fund holdings in the materials sector detracted the most from relative results. Two of the five underlying Fund holdings within the sector lost value in the double digits: Germany-based steel company thyssenkrupp (down 26%) and Australia-headquartered chemical firm Orica (-23%). The financial sector was next-largest detractor for the period. In contrast, the consumer discretionary sector generated the best relative performance for 2020 from both stock selection and a greater-than-benchmark weighting. Of the sector’s 18 underlying Fund holdings, 15 generated positive absolute returns, led by Richemont (+47%), a luxury goods company. Energy produced the next best relative return for the year.
Derivatives are securities that derive their value from the performance of one or more other investments and take the form of a contract between two or more parties. Derivatives can be used for hedging, speculation, or both. As of year end, approximately 14% of the Fund’s exposure to the Swiss franc was hedged. Currency hedges detracted slightly from the Fund’s performance for the year.
Subadviser outlook
Similar to the year 2016, 2020 was a year of extremes, driven by exogenous factors ranging from the COVID-19 pandemic to Brexit negotiations, with elections in between. (“Brexit” – an abbreviation for “British exit” – refers to the United Kingdom’s withdrawal from the European Union.) Markets reacted favorably to events in the fourth quarter of 2020, particularly as a result of the approval and emergency use authorization of multiple vaccines aimed at preventing the spread of COVID-19. Fund
58
MML International Equity Fund – Portfolio Manager Report (Unaudited) (Continued) |
management acknowledges that the past 12 months have been volatile for many investors. Though volatility is traumatic and difficult to tolerate, Fund management believes that market instability can unearth investment opportunities for those who are patient and willing to weather the storm. In times when others chase performance or lose conviction based on news headlines and irrational reactions, Fund management watches for opportunities to build positions in quality companies that are trading at large discounts to Fund management’s perception of their intrinsic value.
59
MML International Equity Fund – Portfolio Manager Report (Unaudited) (Continued) |
MML International Equity Fund
Largest Holdings
(% of Net Assets) on 12/31/20 |
Glencore PLC | 5.0% |
Lloyds Banking Group PLC | 4.4% |
Intesa Sanpaolo SpA | 4.1% |
Credit Suisse Group AG Registered | 4.1% |
Daimler AG Registered | 3.8% |
BNP Paribas SA | 3.8% |
Bayer AG Registered | 3.6% |
CNH Industrial NV | 3.6% |
Bayerische Motoren Werke AG | 3.2% |
Allianz SE Registered | 3.0% |
| | 38.6% |
| | |
MML International Equity Fund
Sector Table
(% of Net Assets) on 12/31/20 |
Financial | 30.1% |
Consumer, Cyclical | 22.1% |
Consumer, Non-cyclical | 13.6% |
Communications | 10.7% |
Industrial | 10.1% |
Basic Materials | 7.6% |
Energy | 1.7% |
Technology | 1.5% |
Total Long-Term Investments | 97.4% |
Short-Term Investments and Other Assets and Liabilities | 2.6% |
Net Assets | 100.0% |
| | |
60
MML International Equity Fund – Portfolio Manager Report (Unaudited) (Continued) |
GROWTH OF $10,000 INVESTMENT - CLASS II

The graph above illustrates a representative class of the Fund’s historical performance for the past 10 fiscal years or since inception (for Funds lacking 10-year records) in comparison to its benchmark index, as well as one or more additional indexes, if applicable. The performance of other share classes will be greater than or less than the class depicted above.
Average Annual Total Returns (for the periods ended 12/31/2020) | | | |
| Inception Date
of Class | 1 Year | 5 Years | Since Inception
01/07/2014 | Since Inception
05/01/2014 |
Class II | 01/07/2014 | 5.37% | 7.15% | 3.62% | |
Service Class I | 05/01/2014 | 5.07% | 6.88% | | 3.09% |
MSCI World Index ex USA | | 7.59% | 7.64% | 4.46% | 4.13% |
Generally accepted accounting principles require adjustments to be made to the net assets of the Fund at period end for financial reporting purposes only, and as such, the total return based on the unadjusted net asset value per share may differ from the total return reported in the financial highlights.
Performance results in the graph and table reflect the percentage change in net asset value, including reinvestment of dividends and capital gains distributions. Investors should note that the Fund is a professionally managed mutual fund, while the index or indexes shown above are unmanaged, cannot be purchased directly, and, with the exception of any peer group index, do not incur expenses.
Performance data quoted in the graph and table represents past performance; past performance is not predictive of future results. The investment return and principal value of shares of the Fund fluctuate, so your shares, when sold, may be worth more or less than their original cost. Current performance of the Fund may be lower or higher than the performance quoted. The performance shown does not reflect the deduction of taxes, if any, that a shareholder would pay on Fund distributions or the redemption of Fund shares. Performance data current to the most recent month end may be obtained by calling 1-888-309-3539.
Investors should read the Fund’s prospectus with regard to the Fund’s investment objectives, risks, and charges and expenses in conjunction with these financial statements. The Fund’s return reflects changes in the net asset value per share without the deduction of any product charges (e.g., cost of insurance, mortality and expense risk charges, administrative fees, and CDSL). The inclusion of these charges would have reduced the performance shown here.
61
MML Large Cap Growth Fund – Portfolio Manager Report (Unaudited) |
What is the investment approach of MML Large Cap Growth Fund, and who is the Fund’s subadviser?
The Fund seeks long-term capital appreciation by investing primarily in large-capitalization companies that the Fund’s subadviser believes offer the potential for long-term growth. Under normal circumstances, the Fund invests at least 80% of its net assets (plus the amount of any borrowings for investment purposes) in the common stocks of companies whose market capitalizations at the time of purchase are within the market capitalization range of companies included in the Russell 1000® Growth Index. The Fund’s subadviser is Loomis, Sayles & Company, L.P. (Loomis Sayles).
How did the Fund perform during the 12 months ended December 31, 2020?
The Fund’s Initial Class shares returned 31.78%, significantly underperforming the 38.49% return of the Russell 1000 Growth Index (the “benchmark”), which measures the performance of the large-cap growth segment of U.S. equity securities. It includes the Russell 1000 Index companies with higher price-to-book ratios and higher forecasted growth values.
For a discussion on the economic and market environment during the 12-month period ended December 31, 2020, please see the Economic and Market Review, beginning on page 3.
Subadviser discussion of factors that contributed to the Fund’s performance
For the year ended December 31, 2020, stock selection in the information technology, consumer discretionary, energy, and financial sectors, as well as the Fund’s allocations to the information technology, energy, financial, consumer staples, health care, and communication services sectors detracted from relative performance. Stock selection in the industrial, consumer staples, health care, and communication services sectors, as well as the Fund’s allocations to the industrial and consumer discretionary sectors, contributed positively to relative returns.
With respect to specific Fund holdings, Coca-Cola and Schlumberger were the biggest detractors from the Fund’s performance, whereas Amazon and Nvidia were the top contributors.
The Coca-Cola Company is the world’s leading owner and marketer of non-alcoholic beverage brands. In late January 2020, the company reported strong financial results that surpassed company management’s full-year guidance, which had already been raised during the year, and the company recorded its 10th consecutive quarter of mid-single-digit organic revenue growth. While Coca-Cola management expected its strong organic growth to continue, the then-current level of growth exceeded Fund management’s long-term forecasts for the company and the Fund eliminated its position in March to reallocate capital to more attractive reward-to-risk opportunities. Due to the timing of the sale in the March downturn, Coca-Cola was among the biggest detractors for the period. Schlumberger is the world’s leading supplier of technology, equipment, project management, and information solutions to the oil and gas exploration and production industry. The company reported financial results that deteriorated substantially due to the oil price environment. Following record oil price declines in the first quarter due to COVID-19-related demand weakness in China and a price war between OPEC and Russia, demand and prices fell further in the second quarter due to the global lockdown, continued travel restrictions, and a resurgence of COVID-19 cases – all of which continued to delay a recovery in demand. On Fund management’s belief that Schlumberger’s products remain a necessary part of the solution for profitably extracting energy resources, even in times of substantial commodity price compression, the Fund expanded its position in Schlumberger during the period.
Online retailer Amazon offers millions of products to consumers and its enterprise IT business, Amazon Web Services (AWS), offers a suite of secure, on-demand cloud-computing services. During the period, Fund management estimates Amazon’s gross merchandise volume grew faster than either global retail sales or U.S. e-commerce, indicating the company expanded its market share. AWS also posted strong revenue growth during the period that exceeded consensus expectations and accelerated following the outbreak of COVID-19. Nvidia is the world leader in graphic processing units, which enable computers to produce and utilize highly realistic 3D graphic imagery and models. Nvidia reported better-than-expected results, driven by recovery in its gaming business and rising demand in its data center business.
62
MML Large Cap Growth Fund – Portfolio Manager Report (Unaudited) (Continued) |
Subadviser outlook
The Fund’s investment process is characterized by bottom-up, fundamental research and a long-term investment time horizon. This process is designed to lead to a lower-turnover portfolio, where sector positioning is the result of stock selection. At year end, the Fund was overweight in the industrial, communication services, health care, energy, financial, and consumer staples sectors – and underweight in the information technology and consumer discretionary sectors. The Fund held no positions in the real estate, materials, or utilities sectors. Fund management remains committed to its long-term investment approach to invest in those few high-quality businesses with sustainable competitive advantages and profitable growth when they trade at a significant discount to intrinsic value.
63
MML Large Cap Growth Fund – Portfolio Manager Report (Unaudited) (Continued) |
MML Large Cap Growth Fund
Largest Holdings
(% of Net Assets) on 12/31/20 |
Amazon.com, Inc. | 7.1% |
Visa, Inc. Class A | 5.8% |
Facebook, Inc. Class A | 5.7% |
Autodesk, Inc. | 5.3% |
Alibaba Group Holding Ltd. Sponsored ADR | 4.7% |
NVIDIA Corp. | 4.5% |
The Boeing Co. | 4.5% |
Microsoft Corp. | 4.0% |
Deere & Co. | 3.8% |
The Walt Disney Co. | 3.8% |
| | 49.2% |
| | |
MML Large Cap Growth Fund
Sector Table
(% of Net Assets) on 12/31/20 |
Communications | 29.8% |
Technology | 26.9% |
Consumer, Non-cyclical | 18.9% |
Industrial | 10.5% |
Financial | 7.2% |
Consumer, Cyclical | 4.9% |
Energy | 1.3% |
Total Long-Term Investments | 99.5% |
Short-Term Investments and Other Assets and Liabilities | 0.5% |
Net Assets | 100.0% |
| | |
64
MML Large Cap Growth Fund – Portfolio Manager Report (Unaudited) (Continued) |
GROWTH OF $10,000 INVESTMENT - INITIAL CLASS
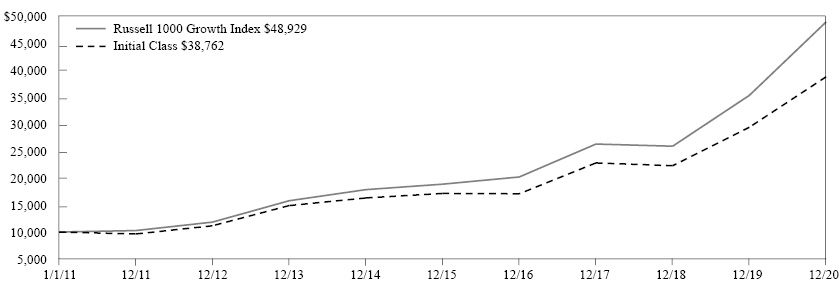
The graph above illustrates a representative class of the Fund’s historical performance for the past 10 fiscal years or since inception (for Funds lacking 10-year records) in comparison to its benchmark index, as well as one or more additional indexes, if applicable. The performance of other share classes will be greater than or less than the class depicted above.
Average Annual Total Returns (for the periods ended 12/31/2020) | | |
| Inception Date
of Class | 1 Year | 5 Years | 10 Years |
Initial Class | 05/01/2006 | 31.78% | 17.72% | 14.51% |
Service Class | 08/15/2008 | 31.53% | 17.45% | 14.23% |
Russell 1000 Growth Index | | 38.49% | 21.00% | 17.21% |
Generally accepted accounting principles require adjustments to be made to the net assets of the Fund at period end for financial reporting purposes only, and as such, the total return based on the unadjusted net asset value per share may differ from the total return reported in the financial highlights.
Performance results in the graph and table reflect the percentage change in net asset value, including reinvestment of dividends and capital gains distributions. Investors should note that the Fund is a professionally managed mutual fund, while the index or indexes shown above are unmanaged, cannot be purchased directly, and, with the exception of any peer group index, do not incur expenses.
Performance data quoted in the graph and table represents past performance; past performance is not predictive of future results. The investment return and principal value of shares of the Fund fluctuate, so your shares, when sold, may be worth more or less than their original cost. Current performance of the Fund may be lower or higher than the performance quoted. The performance shown does not reflect the deduction of taxes, if any, that a shareholder would pay on Fund distributions or the redemption of Fund shares. Performance data current to the most recent month end may be obtained by calling 1-888-309-3539.
Investors should read the Fund’s prospectus with regard to the Fund’s investment objectives, risks, and charges and expenses in conjunction with these financial statements. The Fund’s return reflects changes in the net asset value per share without the deduction of any product charges (e.g., cost of insurance, mortality and expense risk charges, administrative fees, and CDSL). The inclusion of these charges would have reduced the performance shown here.
65
MML Managed Volatility Fund – Portfolio Manager Report (Unaudited) |
What is the investment approach of MML Managed Volatility Fund and who is the Fund’s subadviser?
The Fund seeks to capture the majority of the returns associated with equity market investments, while exposing investors to less risk than other equity investments. Under normal circumstances, the Fund invests in a broadly diversified portfolio of common stocks, while also selling index call options and purchasing index put options. The Fund’s stock portfolio will have approximately 500 stocks, and seeks to duplicate the investment composition and return of the S&P 500® Index* (the “Index”) by holding each stock included in the Index in approximately the same proportion as each stock’s relative weighting in the Index. The Fund’s subadviser is Gateway Investment Advisers, LLC (Gateway).
*The “S&P 500 Index” is a product of S&P Dow Jones Indices LLC or its affiliates (“SPDJI”),and has been licensed for use by MassMutual. Standard & Poor’s®, S&P® and S&P 500® are registered trademarks of Standard & Poor’s Financial Services LLC (“S&P”); and Dow Jones® is a registered trademark of Dow Jones Trademark Holdings LLC (“Dow Jones”). The Fund is not sponsored, endorsed, sold or promoted by SPDJI, Dow Jones, S&P, or their respective affiliates, and none of such parties make any representation regarding the advisability of investing in such product(s) nor do they have any liability for any errors, omissions, or interruptions of the S&P 500 Index.
How did the Fund perform during the 12 months ended December 31, 2020?
The Fund’s Initial Class shares returned 6.68%, underperforming, by a wide margin, the 18.40% return of the Index, which measures the performance of 500 widely held stocks in the U.S. equity market. The Index is the Fund’s benchmark. The Fund underperformed the 7.51% return of the Bloomberg Barclays U.S. Aggregate Bond Index, which measures the performance of investment grade, U.S. dollar-denominated, fixed-rate taxable bond market securities, including Treasuries, government-related and corporate securities, mortgage-backed securities (MBS) (agency fixed-rate and hybrid ARM pass-throughs), asset-backed securities (ABS), and commercial mortgage-backed securities (CMBS).
For a discussion on the economic and market environment during the 12-month period ended December 31, 2020, please see the Economic and Market Overview, beginning on page 3.
Subadviser discussion of factors that contributed to the Fund’s performance
The Fund underperformed the Index for the year, while achieving the risk component of its objective by exhibiting significantly less volatility than the equity market. Throughout 2020, the Fund’s two-part option strategy delivered equity market participation during the periods in which the equity market advanced and significant downside protection during market declines. When the equity market has a strong advance, combined with below-average implied volatility levels, underperformance of the Fund is expected, as its risk-reducing option strategy generates losses that detract from the return of the Fund’s Index-tracking equity portfolio. During the pandemic-driven bear market from February 19 to March 23, the Fund’s decline was less than half the loss of the Index, as gains from its option strategy provided 18.56% of downside protection relative to the Index’s decline of 33.79%.
The Fund returned 18.94% during the market recovery from March 23 to the temporary recovery peak on September 2. The Index returned 61.39% over this period. The Fund’s return differential was primarily due to losses from its option strategy, though above-average implied volatility levels resulted in smaller losses than would have otherwise been incurred.
Derivatives are securities that derive their value from the performance of one or more other investments and take the form of a contract between two or more parties. Derivatives can be used for hedging, speculation, or both. As noted above, throughout the reporting period, the Fund’s performance was both positively and negatively impacted by its options strategy. (A call option is an agreement that gives the owner the ability to buy a specified amount of an underlying security at a specified price within a specified period of time. A put option is an agreement that gives the owner the ability to sell a specified amount of an underlying security at a specified price within a specified period of time.)
Subadviser outlook
Fund management’s investment philosophy is informed by its long history and maintains that the equity market is the most reliable source of attractive long-term returns, despite its high volatility relative to other asset classes and tendency to periodically deliver significant short-term losses. Their investment philosophy also holds that consistency is key to long-term success and
66
MML Managed Volatility Fund – Portfolio Manager Report (Unaudited) (Continued) |
that generating cash flow with index options, rather than seeking to forecast the market, can be a lower-risk means to participate in equity markets. By staying true to this philosophy and continuing to manage strategies consistent with the firm’s historical approach, Fund management seeks to manage risk while pursuing long-term returns in an uncertain environment. As always, they will avoid incorporating forecasts into their investment approach and will not attempt to anticipate how events will unfold.
67
MML Managed Volatility Fund – Portfolio Manager Report (Unaudited) (Continued) |
MML Managed Volatility Fund
Largest Holdings
(% of Net Assets) on 12/31/20 |
Apple, Inc. | 6.3% |
Microsoft Corp. | 5.0% |
Amazon.com, Inc. | 4.1% |
Facebook, Inc. Class A | 2.0% |
Tesla, Inc. | 1.6% |
Alphabet, Inc. Class A | 1.6% |
Alphabet, Inc. Class C | 1.5% |
Berkshire Hathaway, Inc. Class B | 1.3% |
Johnson & Johnson | 1.2% |
JP Morgan Chase & Co. | 1.2% |
| | 25.8% |
| | |
MML Managed Volatility Fund
Sector Table
(% of Net Assets) on 12/31/20 |
Technology | 21.9% |
Consumer, Non-cyclical | 19.8% |
Communications | 15.4% |
Financial | 14.3% |
Consumer, Cyclical | 9.2% |
Industrial | 7.8% |
Utilities | 2.6% |
Energy | 2.1% |
Basic Materials | 2.0% |
Mutual Funds | 0.0% |
Total Long-Term Investments | 95.1% |
Short-Term Investments and Other Assets and Liabilities | 4.9% |
Net Assets | 100.0% |
| | |
68
MML Managed Volatility Fund – Portfolio Manager Report (Unaudited) (Continued) |
GROWTH OF $10,000 INVESTMENT - INITIAL CLASS
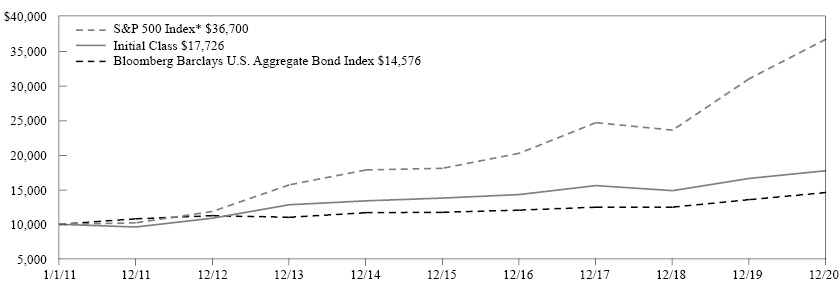
The graph above illustrates a representative class of the Fund’s historical performance for the past 10 fiscal years or since inception (for Funds lacking 10-year records) in comparison to its benchmark index, as well as one or more additional indexes, if applicable. The performance of other share classes will be greater than or less than the class depicted above.
Average Annual Total Returns (for the periods ended 12/31/2020) | | |
| Inception Date
of Class | 1 Year | 5 Years | 10 Years |
Initial Class | 05/01/2000 | 6.68% | 5.16% | 5.89% |
Service Class | 08/15/2008 | 6.42% | 4.90% | 5.63% |
S&P 500 Index* | | 18.40% | 15.22% | 13.88% |
Bloomberg Barclays U.S. Aggregate Bond Index | | 7.51% | 4.44% | 3.84% |
* Benchmark
Generally accepted accounting principles require adjustments to be made to the net assets of the Fund at period end for financial reporting purposes only, and as such, the total return based on the unadjusted net asset value per share may differ from the total return reported in the financial highlights.
Performance results in the graph and table reflect the percentage change in net asset value, including reinvestment of dividends and capital gains distributions. Investors should note that the Fund is a professionally managed mutual fund, while the index or indexes shown above are unmanaged, cannot be purchased directly, and, with the exception of any peer group index, do not incur expenses.
Performance data quoted in the graph and table represents past performance; past performance is not predictive of future results. The investment return and principal value of shares of the Fund fluctuate, so your shares, when sold, may be worth more or less than their original cost. Current performance of the Fund may be lower or higher than the performance quoted. The performance shown does not reflect the deduction of taxes, if any, that a shareholder would pay on Fund distributions or the redemption of Fund shares. Performance data current to the most recent month end may be obtained by calling 1-888-309-3539.
Investors should read the Fund’s prospectus with regard to the Fund’s investment objectives, risks, and charges and expenses in conjunction with these financial statements. The Fund’s return reflects changes in the net asset value per share without the deduction of any product charges (e.g., cost of insurance, mortality and expense risk charges, administrative fees, and CDSL). The inclusion of these charges would have reduced the performance shown here.
69
MML Mid Cap Growth Fund – Portfolio Manager Report (Unaudited) |
MassMutual Select Funds – Portfolio Summaries (Unaudited) (Continued) |
What is the investment approach of MML Mid Cap Growth Fund, and who are the Fund’s subadvisers?
The Fund seeks long-term capital appreciation by investing primarily in equity securities of mid-capitalization companies that the Fund’s subadvisers believe offer the potential for above-average earnings growth. Under normal circumstances, the Fund invests at least 80% of its net assets (plus the amount of any borrowings for investment purposes) in a broadly diversified portfolio of common stocks of mid-cap companies whose earnings the Fund’s subadvisers expect to grow at a faster rate than the average company. The Fund’s two subadvisers are T. Rowe Price Associates, Inc. (T. Rowe Price), which managed approximately 74% of the Fund’s portfolio; and Wellington Management Company LLP (Wellington Management), which managed approximately 26% of the Fund’s portfolio, as of December 31, 2020. Wellington Management was added as a subadviser of the Fund effective January 7, 2020.
How did the Fund perform during the 12 months ended December 31, 2020?
The Fund’s Initial Class shares returned 25.57%, significantly underperforming the 35.59% return of the Russell Midcap® Growth Index (the “benchmark”), which measures the performance of the mid-cap growth segment of the U.S. equity universe. It includes Russell Midcap Index companies with higher price-to-book ratios and higher forecasted growth values. The Fund’s 25.57% return outperformed, by a wide margin, the 13.66% return of the S&P MidCap 400® Index, which measures the performance of mid-sized U.S. companies, reflecting the distinctive risk and return characteristics of this market segment. It comprises stocks in the middle capitalization range, covering approximately 7% of the of U.S. equity market.
For a discussion on the economic and market environment during the 12-month period ended December 31, 2020, please see the Economic and Market Overview, beginning on page 3.
Subadviser discussion of factors that contributed to the Fund’s performance
For the year ended December 31, 2020, within the T. Rowe Price component of the Fund, broadly speaking, stock selection and sector allocation detracted from performance. At the sector level, information technology, health care, and consumer discretionary detracted from relative returns, while consumer staples partially contributed to relative performance. The information technology sector was the largest detractor from the Fund component’s relative performance, due to an underweight position, relative to the benchmark, and weak stock selection. In health care, security selection weighed on relative results, driven by Fund component holding Teleflex, which came under meaningful pressure during the March sell-off as widespread coronavirus-driven delays and cancellations of scheduled and voluntary medical procedures depressed demand for the company’s surgical devices. Fund component holdings within the consumer discretionary sector also hampered relative returns due to unfortunate stock choices such as Norwegian Cruise Line Holdings, whose share price suffered greatly as the entire industry was sidelined for the long term due to the coronavirus pandemic. In contrast, an underweight allocation to the consumer staples sector contributed to the Fund component’s relative performance. However, adverse stock selection within the sector offset almost all of the positive impact. No other sector contributed during the period. Derivatives are securities that derive their value from the performance of one or more other investments and take the form of a contract between two or more parties. Derivatives can be used for hedging, speculation, or both. The estimated return impact from employing warrants was negligible during the reporting period.
For the part of the year that Wellington Management served as co-subadviser of the Fund (January 7, 2020–December 31, 2020), weak stock selection in the industrial and consumer discretionary sectors was the primary driver of the Fund component’s relative returns. These results were slightly offset by stronger selection within the information technology sector. Sector allocation, a residual of the Fund component’s bottom-up stock selection process, also weighed on relative returns. An overweight to the consumer discretionary sector and an underweight to information technology detracted, while a lack of exposure to the energy sector contributed to relative performance. Fund component holdings that detracted most from relative returns during the period included Hexcel (industrial) and Aramark (consumer discretionary). Weakness in airlines related to the coronavirus weighed on Hexcel, the world’s largest supplier of aerospace grade carbon fiber, which makes planes lighter and more fuel efficient. Shares of Aramark, a provider of uniform and food services to a broad base of customers, fell as a portion of the business went offline during the pandemic. Fund component holdings that were top individual contributors to relative performance during the period included DocuSign (information technology) and Etsy (consumer discretionary). DocuSign is an electronic signature solutions company leading the increasing digitization of agreement workflows. Wellington Management eliminated its position during the
70
MML Mid Cap Growth Fund – Portfolio Manager Report (Unaudited) (Continued) |
period as the stock moved above their market cap range. Etsy, the dominant online marketplace for vintage items, handmade goods, art, and crafts, also contributed to relative returns for the year. Wellington Management did not use derivatives during the period.
Subadviser outlook
T. Rowe Price believes that the battle to “return to normal” played out in the fourth quarter of 2020, as news of coronavirus vaccine rollouts alternated with a soaring number of infections. Against this backdrop, extreme growth and richly valued stocks extended their outperformance, despite a highly uncertain economic outlook and an increasingly bloated Federal Reserve (the “Fed”) balance sheet. As in recent periods, the fourth quarter showed that any bias toward valuation discipline was a performance headwind in an environment favoring “growth at any price,” in which investors mostly shrugged off concerns about massive deficits, U.S. dollar weakness, prolonged zero interest rates, and inflation. T. Rowe Price believes that these potential long-term negative economic impacts are not reflected in the lofty growth expectations baked into the valuations of many high-flying stocks. Moreover, T. Rowe Price continues to believe there could be a reckoning in the market when these expectations are not met or when the adverse economic consequences from massive stimulus packages start to materialize.
While Wellington Management is bottom-up in its investment approach, they harbor a generally optimistic view of the macro landscape heading into 2021. They believe that the combination of fiscal stimulus, an accommodative Fed, pent-up consumer savings, an improving employment and manufacturing picture, the gradual rollout of the coronavirus vaccine, and a strong U.S. housing landscape has the potential to make for a positive backdrop in 2021.
71
MML Mid Cap Growth Fund – Portfolio Manager Report (Unaudited) (Continued) |
MML Mid Cap Growth Fund
Largest Holdings
(% of Net Assets) on 12/31/20 |
Burlington Stores, Inc. | 2.2% |
TransUnion | 2.0% |
Hologic, Inc. | 1.9% |
J.B. Hunt Transport Services, Inc. | 1.8% |
Ball Corp. | 1.7% |
Teleflex, Inc. | 1.7% |
Catalent, Inc. | 1.6% |
KLA Corp. | 1.6% |
Microchip Technology, Inc. | 1.5% |
BWX Technologies, Inc. | 1.5% |
| | 17.5% |
| | |
MML Mid Cap Growth Fund
Sector Table
(% of Net Assets) on 12/31/20 |
Consumer, Non-cyclical | 32.5% |
Technology | 21.2% |
Industrial | 16.9% |
Consumer, Cyclical | 13.5% |
Communications | 6.2% |
Financial | 5.5% |
Utilities | 1.0% |
Basic Materials | 0.7% |
Mutual Funds | 0.7% |
Energy | 0.6% |
Diversified | 0.2% |
Total Long-Term Investments | 99.0% |
Short-Term Investments and Other Assets and Liabilities | 1.0% |
Net Assets | 100.0% |
| | |
72
MML Mid Cap Growth Fund – Portfolio Manager Report (Unaudited) (Continued) |
GROWTH OF $10,000 INVESTMENT - INITIAL CLASS

The graph above illustrates a representative class of the Fund’s historical performance for the past 10 fiscal years or since inception (for Funds lacking 10-year records) in comparison to its benchmark index, as well as one or more additional indexes, if applicable. The performance of other share classes will be greater than or less than the class depicted above.
Average Annual Total Returns (for the periods ended 12/31/2020) | | |
| Inception Date
of Class | 1 Year | 5 Years | 10 Years |
Initial Class | 05/01/2006 | 25.57% | 16.43% | 14.80% |
Service Class | 08/15/2008 | 25.25% | 16.13% | 14.50% |
Russell Midcap Growth Index* | | 35.59% | 18.66% | 15.04% |
S&P MidCap 400 Index | | 13.66% | 12.35% | 11.51% |
* Benchmark
Generally accepted accounting principles require adjustments to be made to the net assets of the Fund at period end for financial reporting purposes only, and as such, the total return based on the unadjusted net asset value per share may differ from the total return reported in the financial highlights.
Performance results in the graph and table reflect the percentage change in net asset value, including reinvestment of dividends and capital gains distributions. Investors should note that the Fund is a professionally managed mutual fund, while the index or indexes shown above are unmanaged, cannot be purchased directly, and, with the exception of any peer group index, do not incur expenses.
Performance data quoted in the graph and table represents past performance; past performance is not predictive of future results. The investment return and principal value of shares of the Fund fluctuate, so your shares, when sold, may be worth more or less than their original cost. Current performance of the Fund may be lower or higher than the performance quoted. The performance shown does not reflect the deduction of taxes, if any, that a shareholder would pay on Fund distributions or the redemption of Fund shares. Performance data current to the most recent month end may be obtained by calling 1-888-309-3539.
Investors should read the Fund’s prospectus with regard to the Fund’s investment objectives, risks, and charges and expenses in conjunction with these financial statements. The Fund’s return reflects changes in the net asset value per share without the deduction of any product charges (e.g., cost of insurance, mortality and expense risk charges, administrative fees, and CDSL). The inclusion of these charges would have reduced the performance shown here.
73
MML Mid Cap Value Fund – Portfolio Manager Report (Unaudited) |
What is the investment approach of MML Mid Cap Value Fund, and who is the Fund’s subadviser?
The Fund seeks long-term capital growth. Income is a secondary objective. The Fund invests primarily in equity securities of mid-capitalization companies that the Fund’s subadviser believes offer prospects for long-term capital growth. Under normal circumstances, the Fund invests at least 80% of its net assets (plus the amount of any borrowings for investment purposes) in equity securities of medium-size companies. The Fund’s subadviser is American Century Investment Management, Inc. (American Century).
How did the Fund perform during the 12 months ended December 31, 2020?
The Fund’s Initial Class shares returned 1.71%, underperforming the 4.96% return of Russell Midcap® Value Index (the “benchmark”), which measures the performance of the mid-cap value segment of the U.S. equity universe. It includes Russell Midcap Index companies with lower price-to-book ratios and lower forecasted growth values.
For a discussion on the economic and market environment during the 12-month period ended December 31, 2020, please see the Economic and Market Overview, beginning on page 3.
Subadviser discussion of factors that contributed to the Fund’s performance
For the year ended December 31, 2020, large-cap stocks outperformed mid- and small-cap issues. Growth stocks outperformed their value counterparts.
Stock selection and an underweight in the materials sector, relative to the benchmark, detracted from the Fund’s relative performance. In particular, a lack of exposure to metals and mining companies, including Newmont, weighed on results. Not owning a number of outperforming interactive media and services companies also dampened the Fund’s relative performance in the communication services sector. On a positive note, the Fund’s underweight in the real estate sector benefited performance. Several information technology stocks were also notable contributors.
With respect to specific Fund holdings, key detractors during the year included Comerica and Sodexo. Fund management reduced the Fund’s weight in regional banks, which included eliminating the Fund’s position in Comerica. Like other banks, Comerica faces increased credit risk from worsening economic conditions. Additionally, low short-term interest rates negatively impacted Comerica’s earnings by a greater degree, relative to many of its peers. Food service and facilities maintenance operator Sodexo weighed on the Fund’s returns, as COVID-19 caused business interruptions for many of its corporate, leisure, and higher education customers. Fund management added to the Fund’s position in this holding, due to Sodexo’s attractive valuation, flexible cost structure, and financial strength.
Fund holdings that were key contributors to the Fund’s performance during the year included Applied Materials and Hologic. Semiconductor equipment company Applied Materials was a top contributor, as it benefited from strong trends in key end markets and demand for connectivity during the pandemic. Fund management trimmed the Fund’s position in Hologic as the stock had appreciated. Hologic, a medical devices company, outperformed due to significant sales for its new COVID-19 test. The economics of the test are very favorable, as Hologic is able to capture three times the revenue of its core diagnostics test with better gross margins. The Fund trimmed its position following the stock’s outperformance.
Subadviser outlook
In Fund management’s view, disruption themes continue into 2021. The pandemic accelerated paradigm-shifting structural trends. For example, dedensification reshaped the real estate market as millennials migrated from urban cores, boosted by low mortgage interest rates and the acceptance of work-from-home practices. Declining technology costs and growing environmental concerns have created opportunities for utilities to transition power generation from coal and natural gas to renewable sources, such as solar and wind. In addition, Fund management believes government entities will support renewables by enacting policies intended to combat global warming. These and other significant themes, in their view, could create investment opportunities, while increasing the importance of fundamental analysis and security selection.
74
MML Mid Cap Value Fund – Portfolio Manager Report (Unaudited) (Continued) |
MML Mid Cap Value Fund
Largest Holdings
(% of Net Assets) on 12/31/20 |
Zimmer Biomet Holdings, Inc. | 2.9% |
Northern Trust Corp. | 2.4% |
Emerson Electric Co. | 2.4% |
iShares Russell Mid-Cap Value ETF | 2.4% |
Chubb Ltd. | 2.3% |
nVent Electric PLC | 1.8% |
Universal Health Services, Inc. Class B | 1.8% |
The Bank of New York Mellon Corp. | 1.7% |
Southwest Airlines Co. | 1.7% |
Koninklijke Ahold Delhaize NV | 1.7% |
| | 21.1% |
| | |
MML Mid Cap Value Fund
Sector Table
(% of Net Assets) on 12/31/20 |
Financial | 22.9% |
Consumer, Non-cyclical | 21.4% |
Industrial | 20.3% |
Consumer, Cyclical | 12.3% |
Utilities | 7.9% |
Technology | 5.0% |
Communications | 3.8% |
Mutual Funds | 2.4% |
Energy | 2.2% |
Basic Materials | 1.3% |
Total Long-Term Investments | 99.5% |
Short-Term Investments and Other Assets and Liabilities | 0.5% |
Net Assets | 100.0% |
| | |
75
MML Mid Cap Value Fund – Portfolio Manager Report (Unaudited) (Continued) |
GROWTH OF $10,000 INVESTMENT - INITIAL CLASS

The graph above illustrates a representative class of the Fund’s historical performance for the past 10 fiscal years or since inception (for Funds lacking 10-year records) in comparison to its benchmark index, as well as one or more additional indexes, if applicable. The performance of other share classes will be greater than or less than the class depicted above.
Average Annual Total Returns (for the periods ended 12/31/2020) | | |
| Inception Date
of Class | 1 Year | 5 Years | 10 Years |
Initial Class | 05/01/2006 | 1.71% | 9.48% | 10.59% |
Service Class | 08/15/2008 | 1.48% | 9.20% | 10.32% |
Russell Midcap Value Index | | 4.96% | 9.73% | 10.49% |
Generally accepted accounting principles require adjustments to be made to the net assets of the Fund at period end for financial reporting purposes only, and as such, the total return based on the unadjusted net asset value per share may differ from the total return reported in the financial highlights.
Performance results in the graph and table reflect the percentage change in net asset value, including reinvestment of dividends and capital gains distributions. Investors should note that the Fund is a professionally managed mutual fund, while the index or indexes shown above are unmanaged, cannot be purchased directly, and, with the exception of any peer group index, do not incur expenses.
Performance data quoted in the graph and table represents past performance; past performance is not predictive of future results. The investment return and principal value of shares of the Fund fluctuate, so your shares, when sold, may be worth more or less than their original cost. Current performance of the Fund may be lower or higher than the performance quoted. The performance shown does not reflect the deduction of taxes, if any, that a shareholder would pay on Fund distributions or the redemption of Fund shares. Performance data current to the most recent month end may be obtained by calling 1-888-309-3539.
Investors should read the Fund’s prospectus with regard to the Fund’s investment objectives, risks, and charges and expenses in conjunction with these financial statements. The Fund’s return reflects changes in the net asset value per share without the deduction of any product charges (e.g., cost of insurance, mortality and expense risk charges, administrative fees, and CDSL). The inclusion of these charges would have reduced the performance shown here.
76
MML Small Cap Growth Equity Fund – Portfolio Manager Report (Unaudited) |
What is the investment approach of MML Small Cap Growth Equity Fund, and who is the Fund’s subadviser?
The Fund seeks long-term capital appreciation by investing primarily in equity securities of smaller companies that the Fund’s subadviser believes offer potential for long-term growth. Under normal circumstances, the Fund invests at least 80% of its net assets (plus the amount of any borrowings for investment purposes) in the equity securities of companies whose market capitalizations at the time of purchase are within the market capitalization range of companies included in the Russell 2000® Index or the S&P SmallCap 600 Index. The Fund’s subadviser is Wellington Management Company LLP (Wellington Management).
How did the Fund perform during the 12 months ended December 31, 2020?
The Fund’s Initial Class shares returned 35.62%, outperforming the 34.63% return of the Russell 2000 Growth Index (the “benchmark”), which measures the performance of the small- to mid-cap growth segment of the U.S. equity universe. It includes Russell 2000 Index companies with higher price-to-book ratios and higher forecasted growth values. The Fund’s 35.62% return outperformed, by a wide margin, the 19.96% return of the Russell 2000 Index, which measures the performance of the small-cap segment of the U.S. equity universe. It is a subset of the Russell 3000® Index and includes approximately 2000 of the smallest securities based on a combination of their market cap and current index membership.
For a discussion on the economic and market environment during the 12-month period ended December 31, 2020, please see the Economic and Market Overview, beginning on page 3.
Subadviser discussion of factors that contributed to the Fund’s performance
For the year ended December 31, 2020, stock selection within health care, information technology, and communication services was a primary driver of the Fund’s outperformance of the benchmark. An underweight allocation, relative to the benchmark, to the poorly performing energy sector and an overweight to the industrial sector also contributed to the Fund’s full-year returns. On the other hand, weak stock selection within the materials, industrial, and consumer discretionary sectors hampered the Fund’s performance for the year.
With respect to specific Fund holdings, top individual contributors to relative performance during the period included Livongo Health (health care), Chegg (consumer discretionary), and SunPower (information technology). Shares of Livongo Health rose after management announced a merger agreement with Teledoc Health, which will position the firm as a leader in comprehensive virtual care during a time of unprecedented demand. The Fund sold its position, as the combined entity’s market cap no longer occupied the small-cap market segment. Shares of Chegg rose over the period after reporting strong results that surpassed expectations. The online textbook rental and learning services company saw a sharp increase in subscriptions over the year as institutions moved to online learning in response to COVID-19. SunPower’s shares rose after the solar panel manufacturer reported third-quarter revenue that beat consensus estimates, with sales up 70% year over year. Management raised its guidance for the 2020 fiscal year, and the company secured funding for its residential solar leasing program through 2021.
Stocks that detracted most from relative returns during the period included Curtiss-Wright (industrial), MFA Financial (financial), and Kirby (industrial). Shares of Curtiss-Wright fell as COVID-19 created uncertainty in the company’s guidance, despite the company releasing a solid set of results. The market’s de-rating of the company on commercial aerospace and defense budget concerns remained a headwind through the period. The Fund increased its position in Curtiss-Wright on what Fund management viewed as attractive valuations and remained overweight to end the period. Shares of MFA Financial fell after the company failed to meet its margin calls due to COVID-19-driven volatility in the credit markets. Fund management eliminated the mortgage real estate investment trust (REIT) from the Fund’s portfolio after the company was required to sell assets to help satisfy margin calls, leading Fund management to question the health of the business model. Shares of Kirby, a Texas-based barge operator, declined, as the COVID-19 pandemic led to decreased levels of business activity, causing workforce reductions. Shares also came under pressure after Kirby announced a restatement of first-quarter earnings, failing to properly record a goodwill impairment charge.
Subadviser outlook
U.S. small-cap equities enjoyed a strong rally in the fourth quarter to close out 2020 with the largest positive quarterly return for the Russell 2000 Index since its launch. With the distribution of COVID-19 vaccinations and additional fiscal stimulus, Fund management has become optimistic about the prospects for equity markets in 2021. At the end of the period, the Fund held its largest overweight allocations to the financial and information technology sectors – and its greatest underweight stakes in the health care, consumer staples, and real estate sectors.
77
MML Small Cap Growth Equity Fund – Portfolio Manager Report (Unaudited) (Continued) |
MML Small Cap Growth Equity Fund
Largest Holdings
(% of Net Assets) on 12/31/20 |
Rapid7, Inc. | 1.6% |
Tower Semiconductor Ltd. | 1.4% |
Western Alliance Bancorp | 1.3% |
Globus Medical, Inc. Class A | 1.2% |
BMC Stock Holdings, Inc. | 1.2% |
LHC Group, Inc. | 1.2% |
Cardlytics, Inc. | 1.2% |
Rexnord Corp. | 1.2% |
Kennametal, Inc. | 1.2% |
Hannon Armstrong Sustainable Infrastructure Capital, Inc. | 1.1% |
| | 12.6% |
| | |
MML Small Cap Growth Equity Fund
Sector Table
(% of Net Assets) on 12/31/20 |
Consumer, Non-cyclical | 31.2% |
Financial | 16.7% |
Consumer, Cyclical | 16.1% |
Technology | 15.6% |
Industrial | 15.3% |
Communications | 4.1% |
Energy | 3.0% |
Mutual Funds | 1.9% |
Basic Materials | 1.0% |
Utilities | 0.4% |
Total Long-Term Investments | 105.3% |
Short-Term Investments and Other Assets and Liabilities | (5.3)% |
Net Assets | 100.0% |
| | |
78
MML Small Cap Growth Equity Fund – Portfolio Manager Report (Unaudited) (Continued) |
GROWTH OF $10,000 INVESTMENT - INITIAL CLASS
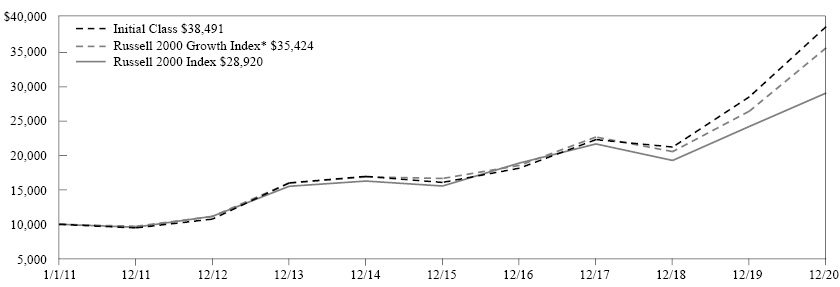
The graph above illustrates a representative class of the Fund’s historical performance for the past 10 fiscal years or since inception (for Funds lacking 10-year records) in comparison to its benchmark index, as well as one or more additional indexes, if applicable. The performance of other share classes will be greater than or less than the class depicted above.
Average Annual Total Returns (for the periods ended 12/31/2020) | | |
| Inception Date
of Class | 1 Year | 5 Years | 10 Years |
Initial Class | 05/03/1999 | 35.62% | 19.13% | 14.43% |
Service Class | 08/15/2008 | 35.29% | 18.83% | 14.14% |
Russell 2000 Growth Index* | | 34.63% | 16.36% | 13.48% |
Russell 2000 Index | | 19.96% | 13.26% | 11.20% |
* Benchmark
Generally accepted accounting principles require adjustments to be made to the net assets of the Fund at period end for financial reporting purposes only, and as such, the total return based on the unadjusted net asset value per share may differ from the total return reported in the financial highlights.
Performance results in the graph and table reflect the percentage change in net asset value, including reinvestment of dividends and capital gains distributions. Investors should note that the Fund is a professionally managed mutual fund, while the index or indexes shown above are unmanaged, cannot be purchased directly, and, with the exception of any peer group index, do not incur expenses.
Performance data quoted in the graph and table represents past performance; past performance is not predictive of future results. The investment return and principal value of shares of the Fund fluctuate, so your shares, when sold, may be worth more or less than their original cost. Current performance of the Fund may be lower or higher than the performance quoted. The performance shown does not reflect the deduction of taxes, if any, that a shareholder would pay on Fund distributions or the redemption of Fund shares. Performance data current to the most recent month end may be obtained by calling 1-888-309-3539.
Investors should read the Fund’s prospectus with regard to the Fund’s investment objectives, risks, and charges and expenses in conjunction with these financial statements. The Fund’s return reflects changes in the net asset value per share without the deduction of any product charges (e.g., cost of insurance, mortality and expense risk charges, administrative fees, and CDSL). The inclusion of these charges would have reduced the performance shown here.
79
MML Small Company Value Fund – Portfolio Manager Report (Unaudited) |
What is the investment approach of MML Small Company Value Fund, and who is the Fund’s subadviser?
The Fund seeks long-term capital appreciation by investing primarily in equity securities that the Fund’s subadviser believes are undervalued. Under normal circumstances, the Fund invests at least 80% of its net assets (plus the amount of any borrowings for investment purposes) in the securities of companies whose market capitalizations at the time of purchase are within the market capitalization range of companies included in the Russell 2000® Index. The Fund’s subadviser is T. Rowe Price Associates, Inc. (T. Rowe Price).
How did the Fund perform during the 12 months ended December 31, 2020?
The Fund’s Class II shares returned 9.16%, outperforming the 4.63% return of the Russell 2000 Value Index (the “benchmark”), which measures the performance of the small-cap value segment of the U.S. equity universe. It includes those Russell 2000 Index companies with lower price-to-book ratios and lower forecasted growth values. The Fund significantly underperformed the 19.96% return of the Russell 2000 Index, which measures the performance of the small-cap segment of the U.S. equity universe. It is a subset of the Russell 3000® Index and includes approximately 2000 of the smallest securities based on a combination of their market cap and current index membership.
For a discussion on the economic and market environment during the 12-month period ended December 31, 2020, please see the Economic and Market Overview, beginning on page 3.
Subadviser discussion of factors that contributed to the Fund’s performance
Stock selection and sector allocation, overall, aided the Fund’s relative outperformance for the year ended December 31, 2020. The financial sector was the leading contributor, primarily due to stock selection, led by Fund holding PennyMac Financial Services. The mortgage provider and servicer continued to post strong quarterly results, despite significant market disruptions.
The health care sector also contributed to relative returns, due to favorable stock selection coupled with an overweight position, relative to the benchmark. Within the sector, Fund holdings Quidel (an American manufacturer of diagnostic health care products sold worldwide) and Momenta Pharmaceuticals drove performance. Shares of the latter were boosted by positive sentiment toward its M281 anti-FcRn antibody, which has the potential to provide a safer, more convenient, and more effective alternative to intravenous immunoglobulin (IVIG) for patients with autoimmune diseases. In the third quarter, shares soared on news the company would be acquired by Johnson & Johnson. Real estate also aided the Fund’s performance during the period due to both a beneficial underweight allocation and favorable stock choices, such as The St. Joe Company (a Northwest Florida based real estate developer and asset manager).
On the other side of the ledger, stock selection in the consumer discretionary sector weighed on relative performance, driven by Fund holding Strategic Education. Shares of the for-profit educator plunged in July on quarterly results highlighting a deceleration in enrollment growth. Negative investor reaction to the announcement of the company’s acquisition of Laureate Education’s Australian portfolio also weighed on the stock. Additionally, Fund holdings in the industrial and business services sectors detracted from relative results for the period, due to poor stock choices, such as Triumph Group, a supplier of aerospace services, structures, systems, and support.
Derivatives are securities that derive their value from the performance of one or more other investments and take the form of a contract between two or more parties. Derivatives can be used for hedging, speculation, or both. For the year ended December 31, 2020, the estimated return impact on the Fund’s performance from employing warrants was negligible.
Subadviser outlook
Fund management is optimistic about a continued economic recovery as the global fight against the coronavirus continues and multiple vaccines are rolled out in 2021. Additionally, although Fund management expects some noise in Washington over the coming weeks, Fund management believes there could be less political volatility now that the 2020 election is behind us. That said, they are mindful of the many challenges that remain before we are back to a more normal environment – and of the fact that market valuations were above long-term averages as we entered 2021. Fund management’s focus, as always, remains on long-term performance, and they believe their contrarian approach has the potential to serve the interests of their shareholders.
80
MML Small Company Value Fund – Portfolio Manager Report (Unaudited) (Continued) |
MML Small Company Value Fund
Largest Holdings
(% of Net Assets) on 12/31/20 |
Littelfuse, Inc. | 1.6% |
Cable One, Inc. | 1.5% |
Home BancShares, Inc. | 1.4% |
PennyMac Financial Services, Inc. | 1.3% |
Ceridian HCM Holding, Inc. | 1.3% |
Western Alliance Bancorp | 1.3% |
WSFS Financial Corp. | 1.3% |
Chesapeake Utilities Corp. | 1.2% |
Pinnacle Financial Partners, Inc. | 1.2% |
BankUnited, Inc. | 1.2% |
| | 13.3% |
| | |
MML Small Company Value Fund
Sector Table
(% of Net Assets) on 12/31/20 |
Financial | 35.1% |
Industrial | 15.8% |
Consumer, Non-cyclical | 13.0% |
Consumer, Cyclical | 11.7% |
Technology | 6.5% |
Basic Materials | 5.7% |
Utilities | 4.2% |
Energy | 4.2% |
Communications | 3.1% |
Mutual Funds | 0.3% |
Total Long-Term Investments | 99.6% |
Short-Term Investments and Other Assets and Liabilities | 0.4% |
Net Assets | 100.0% |
| | |
81
MML Small Company Value Fund – Portfolio Manager Report (Unaudited) (Continued) |
GROWTH OF $10,000 INVESTMENT - CLASS II
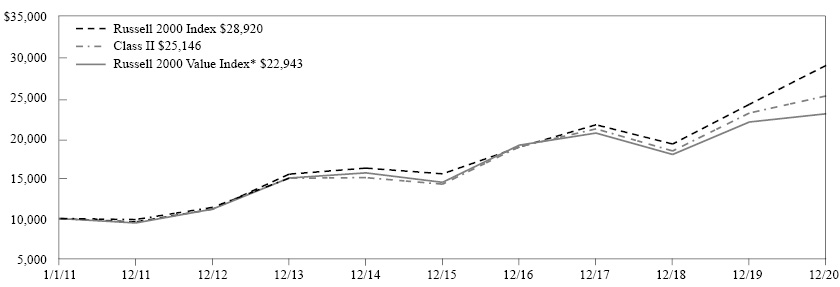
The graph above illustrates a representative class of the Fund’s historical performance for the past 10 fiscal years or since inception (for Funds lacking 10-year records) in comparison to its benchmark index, as well as one or more additional indexes, if applicable. The performance of other share classes will be greater than or less than the class depicted above.
Average Annual Total Returns (for the periods ended 12/31/2020) | | |
| Inception Date
of Class | 1 Year | 5 Years | 10 Years |
Class II | 02/27/2009 | 9.16% | 12.04% | 9.66% |
Service Class I | 02/27/2009 | 8.92% | 11.77% | 9.38% |
Russell 2000 Value Index* | | 4.63% | 9.65% | 8.66% |
Russell 2000 Index | | 19.96% | 13.26% | 11.20% |
* Benchmark
Generally accepted accounting principles require adjustments to be made to the net assets of the Fund at period end for financial reporting purposes only, and as such, the total return based on the unadjusted net asset value per share may differ from the total return reported in the financial highlights.
Performance results in the graph and table reflect the percentage change in net asset value, including reinvestment of dividends and capital gains distributions. Investors should note that the Fund is a professionally managed mutual fund, while the index or indexes shown above are unmanaged, cannot be purchased directly, and, with the exception of any peer group index, do not incur expenses.
Performance data quoted in the graph and table represents past performance; past performance is not predictive of future results. The investment return and principal value of shares of the Fund fluctuate, so your shares, when sold, may be worth more or less than their original cost. Current performance of the Fund may be lower or higher than the performance quoted. The performance shown does not reflect the deduction of taxes, if any, that a shareholder would pay on Fund distributions or the redemption of Fund shares. Performance data current to the most recent month end may be obtained by calling 1-888-309-3539.
Investors should read the Fund’s prospectus with regard to the Fund’s investment objectives, risks, and charges and expenses in conjunction with these financial statements. The Fund’s return reflects changes in the net asset value per share without the deduction of any product charges (e.g., cost of insurance, mortality and expense risk charges, administrative fees, and CDSL). The inclusion of these charges would have reduced the performance shown here.
82
MML Small/Mid Cap Value Fund – Portfolio Manager Report (Unaudited) |
What is the investment approach of MML Small/Mid Cap Value Fund, and who is the Fund’s subadviser?
The Fund seeks long-term total return by investing primarily in securities that the Fund’s subadviser believes to be undervalued. Under normal circumstances, the Fund invests at least 80% of its net assets (plus the amount of any borrowings for investment purposes) in securities of small- and mid-cap companies. The Fund’s subadviser is AllianceBernstein L.P. (AllianceBernstein).
How did the Fund perform during the 12 months ended December 31, 2020?
The Fund’s Initial Class Shares returned 4.65%, underperforming the 4.88% return of the Russell 2500TM Value Index (the “benchmark), which measures the performance of the small- to mid-cap value segment of the U.S. equity universe. It includes Russell 2500 Index companies with lower price-to-book and lower forecasted growth values.
For a discussion on the economic and market environment during the 12-month period ended December 31, 2020, please see the Economic and Market Overview, beginning on page 3.
Subadviser discussion of factors that contributed to the Fund’s performance
For the year ended December 31, 2020, stock selection detracted from the Fund’s performance, while sector allocations generally contributed. An underweight to the health care sector, relative to the benchmark, hampered the Fund’s full-year results, while an overweight stake in technology contributed. Less-than-favorable security selection in the energy and materials sectors more than offset positive security selection in real estate and health care.
With respect to specific Fund holdings, HollyFrontier detracted from Fund performance, as the petroleum refiner continued to deal with weak COVID-19-related end demand for fuel products and the resulting low asset utilization. Reinsurance Group of America held back returns after the life reinsurer raised equity capital that was dilutive to its book value. Its management indicated that the capital would be an additional buffer against higher mortality claims and credit losses that could potentially come from the current volatile climate. Carpenter Technology, a specialty alloy manufacturer, also hampered the Fund’s full-year results. Carpenter underperformed amid soft earnings due to weakness in its key aerospace end market.
On the positive side, Fund holdings that contributed to the Fund’s returns included Quanta Services, a utility contractor that reported a series of better-than-expected quarterly earnings and cash flow results. Papa John’s International also contributed, as the pizza restaurant company continued to show strong comparable-store sales growth. Papa John’s, and the pizza market in general, has been experiencing robust demand from consumers who face fewer dine-out options due to restaurant closures and state- and local-mandated occupancy limits and closures. Packaged-foods company Hain Celestial beat expectations throughout the year, as its shares rebounded off March lows.
Subadviser outlook
After a strong fourth quarter, investors have begun to wonder if the outperformance of smaller-cap value stocks signals the beginning of a new trend. Over the recent past, value stocks have faced multiple headwinds. A fragile economy followed by a recession led to investors paying ever higher multiples for growth stocks – and increasing investor skepticism that value company profits could survive the twin shocks of a slower economy and technological disruption, along with heightened risk and historically low interest rates. As a result, the discount of value stocks relative to their growth counterparts is at historic levels.
Fund management believes that the tide is showing signs of turning. They believe the economy is recovering, and value stock profit concerns appear misplaced, with stronger-than-expected second- and third-quarter 2020 results. Fund management believes that risks, while still elevated, are declining. Fund management continues to look for companies that combine the business model strength to navigate the current volatile climate, in tandem with cash flows and valuations that they believe have the potential to drive performance as the economic climate improves.
83
MML Small/Mid Cap Value Fund – Portfolio Manager Report (Unaudited) (Continued) |
MML Small/Mid Cap Value Fund
Largest Holdings
(% of Net Assets) on 12/31/20 |
Regal Beloit Corp. | 1.8% |
XPO Logistics, Inc. | 1.7% |
First Citizens BancShares, Inc. Class A | 1.6% |
Oshkosh Corp. | 1.6% |
Change Healthcare, Inc. | 1.6% |
AECOM | 1.5% |
Knight-Swift Transportation Holdings, Inc. | 1.5% |
Reliance Steel & Aluminum Co. | 1.5% |
Ralph Lauren Corp. | 1.4% |
Synovus Financial Corp. | 1.4% |
| | 15.6% |
| | |
MML Small/Mid Cap Value Fund
Sector Table
(% of Net Assets) on 12/31/20 |
Financial | 32.5% |
Industrial | 22.0% |
Consumer, Cyclical | 21.0% |
Technology | 8.0% |
Consumer, Non-cyclical | 7.8% |
Basic Materials | 5.4% |
Energy | 3.5% |
Utilities | 2.1% |
Communications | 1.0% |
Total Long-Term Investments | 103.3% |
Short-Term Investments and Other Assets and Liabilities | (3.3)% |
Net Assets | 100.0% |
| | |
84
MML Small/Mid Cap Value Fund – Portfolio Manager Report (Unaudited) (Continued) |
GROWTH OF $10,000 INVESTMENT - INITIAL CLASS
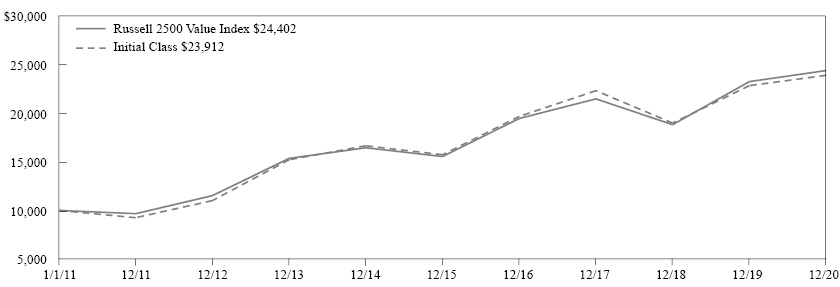
The graph above illustrates a representative class of the Fund’s historical performance for the past 10 fiscal years or since inception (for Funds lacking 10-year records) in comparison to its benchmark index, as well as one or more additional indexes, if applicable. The performance of other share classes will be greater than or less than the class depicted above.
Average Annual Total Returns (for the periods ended 12/31/2020) | | |
| Inception Date
of Class | 1 Year | 5 Years | 10 Years |
Initial Class | 05/01/2006 | 4.65% | 8.73% | 9.11% |
Service Class | 08/15/2008 | 4.32% | 8.44% | 8.83% |
Russell 2500 Value Index | | 4.88% | 9.43% | 9.33% |
Generally accepted accounting principles require adjustments to be made to the net assets of the Fund at period end for financial reporting purposes only, and as such, the total return based on the unadjusted net asset value per share may differ from the total return reported in the financial highlights.
Performance results in the graph and table reflect the percentage change in net asset value, including reinvestment of dividends and capital gains distributions. Investors should note that the Fund is a professionally managed mutual fund, while the index or indexes shown above are unmanaged, cannot be purchased directly, and, with the exception of any peer group index, do not incur expenses.
Performance data quoted in the graph and table represents past performance; past performance is not predictive of future results. The investment return and principal value of shares of the Fund fluctuate, so your shares, when sold, may be worth more or less than their original cost. Current performance of the Fund may be lower or higher than the performance quoted. The performance shown does not reflect the deduction of taxes, if any, that a shareholder would pay on Fund distributions or the redemption of Fund shares. Performance data current to the most recent month end may be obtained by calling 1-888-309-3539.
Investors should read the Fund’s prospectus with regard to the Fund’s investment objectives, risks, and charges and expenses in conjunction with these financial statements. The Fund’s return reflects changes in the net asset value per share without the deduction of any product charges (e.g., cost of insurance, mortality and expense risk charges, administrative fees, and CDSL). The inclusion of these charges would have reduced the performance shown here.
85
MML Total Return Bond Fund – Portfolio Manager Report (Unaudited) |
What is the investment approach of MML Total Return Bond Fund, and who is the Fund’s subadviser?
The Fund seeks maximum total return, consistent with preservation of capital and prudent investment management, by investing, under normal circumstances, at least 80% of its net assets (plus the amount of any borrowings for investment purposes) in a diversified portfolio of investment grade fixed income securities (rated Baa3 or higher by Moody’s, BBB- or higher by Standard & Poor’s, BBB- or higher by Fitch, or A-2 by S&P, P-2 by Moody’s, or F-2 by Fitch for short-term debt obligations, or, if unrated, determined by the Fund’s subadviser to be of comparable quality). The Fund’s subadviser is Metropolitan West Asset Management, LLC (MetWest).
How did the Fund perform during the 12 months ended December 31, 2020?
The Fund’s Class II shares returned 8.79%, outperforming the 7.51% return of the Bloomberg Barclays U.S. Aggregate Bond Index (the “benchmark”), which measures the performance of investment grade, U.S. dollar-denominated, fixed-rate taxable bond market securities, including Treasuries, government-related and corporate securities, mortgage-backed securities (MBS) (agency fixed-rate and hybrid ARM pass-throughs), asset-backed securities (ABS), and commercial mortgage-backed securities (CMBS).
For a discussion on the economic and market environment during the 12-month period ended December 31, 2020, please see the Economic and Market Overview, beginning on page 3.
Subadviser discussion of factors that contributed to the Fund’s performance
The year 2020 is notable for the ending of the longest U.S. bull market, laid low by the transmission of the novel coronavirus and the economic curbs initiated in the spring to slow its spread. The consequent market volatility sent risk premiums soaring across the bond markets and Treasury yields collapsed. No sector was spared of the repricing, particularly as levered investor (forced) sales and more routine redemptions tested liquidity. A slew of jobs were lost in the process, with knock-on effects on consumption and confidence. In response to the pandemic, government accommodations ($2.2 trillion on the fiscal side), unprecedented in size and scope, were promptly instituted, including the Federal Reserve’s (the “Fed”) unlimited buying of agency mortgage-backed securities (MBS). (“Agency” refers to debt issued by U.S. federal government agencies or government-sponsored entities for financing purposes.) As a result, a recovery began around April/May, with Treasury yields stabilizing. Toward the end of the year, with a couple of efficacious vaccines approved for distribution and additional fiscal stimulus ($900 billion) passed, U.S. equities topped record peaks, even while COVID-19 cases continued to surge.
Against this backdrop, credits drove the Fund’s outperformance of the benchmark, including where a higher average yield in industrial holdings such as non-cyclicals, communications, and energy, as well as emerging market debt, boosted relative returns. Opportunistic credit additions made during the March market volatility and subsequent trimming also proved beneficial to returns.
In securitized, contributions came from the Fund’s emphasis on current (low) coupon agency MBS TBAs, which continued to benefit from the Fed’s limitless sponsorship. (In a TBA trade, the seller of MBS agrees on a sale price, but does not specify which securities will be delivered to the buyer on settlement day.) Non-agency MBS also contributed to returns, as the sector recovered in the months following the March selloff amid strong housing fundamentals (i.e., increasing home prices amid robust demand).
Overall, commercial mortgage-backed securities (CMBS) and asset-backed securities (ABS) had little impact on the Fund’s performance and were trimmed to fund corporate bond purchases and improve liquidity. Elsewhere, Treasury futures used to manage duration were a drag on the Fund’s performance, as financing rates exceeded yields, but Treasury inflation-protected securities (TIPS) were beneficial, given higher inflation expectations. (Duration is a measure of a bond fund’s sensitivity to interest rates. The longer the duration, the greater the price impact on the bond or portfolio when interest rates rise or fall.)
Finally, the duration of the Fund started the year long versus the Index, benefiting returns as Treasury yields hit historic lows in March. Over the remainder of the year, the position was shortened and maintained in a range of 0.5 to 0.6 year short, and though rates didn’t recover to pre-COVID-19 levels, they did edge higher, further rewarding returns.
86
MML Total Return Bond Fund – Portfolio Manager Report (Unaudited) (Continued) |
Derivatives are securities that derive their value from the performance of one or more other investments and take the form of a contract between two or more parties. Derivatives can be used for hedging, speculation, or both. As noted above, the Fund’s use of futures to manage duration hindered its full-year performance.
Subadviser outlook
Fund management believes that markets are pricing in a degree of optimism that does not appear to reflect the underlying challenges. They believe that, although the economy has shown more resilience than expected due to extraordinary policy response, a return to sustained growth remains a ways off, as uncertainties around the pandemic remain. They view that persistent stimulus could foster momentum, with a recognition that the pace will be far better for some industries than others. Despite optimism on vaccines, Fund management believes a measure of caution may be warranted as there are uncertainties to the rollout. They estimate that current valuations portend a challenging environment for prospective returns, which requires careful evaluation. Not lost on the forward-looking perspective is a more Democratic controlled government, which Fund management views could be beneficial growth-wise from stimulus and pent-up demand, though with the potential to lose some momentum, with new taxes and some regulatory tightening.
87
MML Total Return Bond Fund – Portfolio Manager Report (Unaudited) (Continued) |
MML Total Return Bond Fund
Portfolio Characteristics
(% of Net Assets) on 12/31/20 |
U.S. Treasury Obligations | 40.5% |
U.S. Government Agency Obligations and Instrumentalities | 31.9% |
Corporate Debt | 22.1% |
Non-U.S. Government Agency Obligations | 12.9% |
Municipal Obligations | 1.9% |
Sovereign Debt Obligations | 0.9% |
Bank Loans | 0.7% |
Total Long-Term Investments | 110.9% |
Short-Term Investments and Other Assets and Liabilities | (10.9)% |
Net Assets | 100.0% |
| | |
88
MML Total Return Bond Fund – Portfolio Manager Report (Unaudited) (Continued) |
GROWTH OF $10,000 INVESTMENT - CLASS II
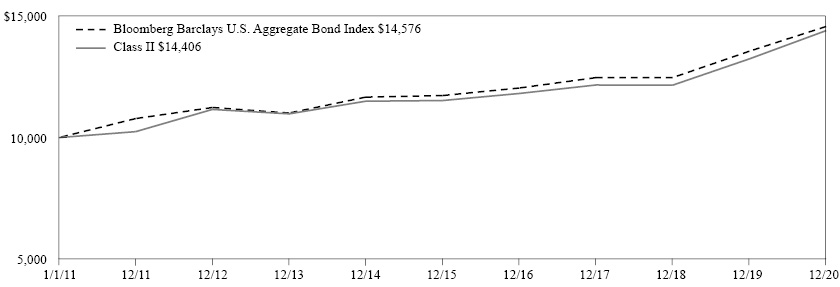
The graph above illustrates a representative class of the Fund’s historical performance for the past 10 fiscal years or since inception (for Funds lacking 10-year records) in comparison to its benchmark index, as well as one or more additional indexes, if applicable. The performance of other share classes will be greater than or less than the class depicted above.
Average Annual Total Returns (for the periods ended 12/31/2020) | | | |
| Inception Date
of Class | 1 Year | 5 Years | 10 Years | Since Inception
05/01/2012 |
Class II | 08/10/2010 | 8.79% | 4.56% | 3.72% | |
Service Class I | 05/01/2012 | 8.60% | 4.32% | | 3.33% |
Bloomberg Barclays U.S. Aggregate Bond Index | | 7.51% | 4.44% | 3.84% | 3.37% |
Generally accepted accounting principles require adjustments to be made to the net assets of the Fund at period end for financial reporting purposes only, and as such, the total return based on the unadjusted net asset value per share may differ from the total return reported in the financial highlights.
Performance results in the graph and table reflect the percentage change in net asset value, including reinvestment of dividends and capital gains distributions. Investors should note that the Fund is a professionally managed mutual fund, while the index or indexes shown above are unmanaged, cannot be purchased directly, and, with the exception of any peer group index, do not incur expenses.
Performance data quoted in the graph and table represents past performance; past performance is not predictive of future results. The investment return and principal value of shares of the Fund fluctuate, so your shares, when sold, may be worth more or less than their original cost. Current performance of the Fund may be lower or higher than the performance quoted. The performance shown does not reflect the deduction of taxes, if any, that a shareholder would pay on Fund distributions or the redemption of Fund shares. Performance data current to the most recent month end may be obtained by calling 1-888-309-3539.
Investors should read the Fund’s prospectus with regard to the Fund’s investment objectives, risks, and charges and expenses in conjunction with these financial statements. The Fund’s return reflects changes in the net asset value per share without the deduction of any product charges (e.g., cost of insurance, mortality and expense risk charges, administrative fees, and CDSL). The inclusion of these charges would have reduced the performance shown here.
89
MML Conservative Allocation Fund – Portfolio of Investments |
December 31, 2020 |
| | | Number of
Shares | | | Value | |
MUTUAL FUNDS — 100.1% |
Equity Funds — 43.4% |
Invesco Oppenheimer V.I. Discovery Mid Cap Growth Fund, Series I | | | 9,377 | | | $ | 1,002,683 | |
Invesco Oppenheimer V.I. Global Fund, Series I | | | 82,877 | | | | 4,319,566 | |
Invesco Oppenheimer V.I. International Growth Fund, Series I | | | 253,054 | | | | 736,389 | |
Invesco Oppenheimer V.I. Main Street Fund, Series I | | | 31,013 | | | | 927,584 | |
MML Blue Chip Growth Fund, Initial Class (a) | | | 708,103 | | | | 14,523,195 | |
MML Equity Income Fund, Initial Class (a) | | | 1,544,087 | | | | 15,873,210 | |
MML Equity Index Fund, Class III (a) | | | 39,446 | | | | 1,143,136 | |
MML Focused Equity Fund, Class II (a) | | | 2,861,486 | | | | 20,745,777 | |
MML Foreign Fund, Initial Class (a) | | | 904,986 | | | | 9,067,960 | |
MML Fundamental Equity Fund, Class II (a) | | | 1,177,942 | | | | 12,639,315 | |
MML Fundamental Value Fund, Class II (a) | | | 1,253,609 | | | | 14,566,940 | |
MML Global Fund, Class I (a) | | | 1,731,245 | | | | 24,168,175 | |
MML Income & Growth Fund, Initial Class (a) | | | 1,426,663 | | | | 14,266,629 | |
MML International Equity Fund, Class II (a) | | | 900,997 | | | | 8,991,953 | |
MML Large Cap Growth Fund, Initial Class (a) | | | 378,065 | | | | 5,285,349 | |
MML Mid Cap Growth Fund, Initial Class (a) | | | 891,448 | | | | 16,135,206 | |
MML Mid Cap Value Fund, Initial Class (a) | | | 1,202,623 | | | | 12,735,775 | |
MML Small Cap Growth Equity Fund, Initial Class (a) | | | 129,179 | | | | 2,178,261 | |
MML Small Company Value Fund, Class II (a) | | | 284,617 | | | | 4,340,411 | |
MML Small/Mid Cap Value Fund, Initial Class (a) | | | 296,532 | | | | 3,244,058 | |
MML Strategic Emerging Markets Fund, Class II (a) | | | 117,363 | | | | 1,693,550 | |
| | | | | | | | 188,585,122 | |
Fixed Income Funds — 56.7% |
Invesco Oppenheimer V.I. Global Strategic Income Fund, Series I | | | 2,365,082 | | | | 11,446,997 | |
MML Dynamic Bond Fund, Class II (a) | | | 4,927,025 | | | | 51,438,140 | |
MML High Yield Fund, Class II (a) | | | 1,098,581 | | | | 11,095,663 | |
MML Inflation-Protected and Income Fund, Initial Class (a) | | | 1,350,765 | | | | 15,412,231 | |
MML Managed Bond Fund, Initial Class (a) | | | 6,454,684 | | | | 87,736,037 | |
| | | Number of
Shares | | | Value | |
MML Short-Duration Bond Fund, Class II (a) | | | 2,298,562 | | | $ | 22,617,852 | |
MML Total Return Bond Fund, Class II (a) | | | 4,150,778 | | | | 46,820,774 | |
| | | | | | | | 246,567,694 | |
| | | | | | | | | |
TOTAL MUTUAL FUNDS (Cost $399,864,247) | | | | | | | 435,152,816 | |
| | | | | | | | | |
TOTAL LONG-TERM INVESTMENTS (Cost $399,864,247) | | | | | | | 435,152,816 | |
| | | | | | | | | |
TOTAL INVESTMENTS — 100.1% (Cost $399,864,247) (b) | | | | | | | 435,152,816 | |
| | | | | | | | | |
Other Assets/(Liabilities) — (0.1)% | | | | | | | (322,242 | ) |
| | | | | | | | | |
NET ASSETS — 100.0% | | | | | | $ | 434,830,574 | |
Notes to Portfolio of Investments
Percentages are stated as a percent of net assets.
(a) | Affiliated issuer. See Note 7 for a summary of transactions in the investments of affiliated issuers. |
(b) | See Note 6 for aggregate cost for federal tax purposes. |
The accompanying notes are an integral part of the financial statements.
90
MML Balanced Allocation Fund – Portfolio of Investments |
December 31, 2020 |
| | | Number of
Shares | | | Value | |
MUTUAL FUNDS — 100.1% |
Equity Funds — 51.0% |
Invesco Oppenheimer V.I. Discovery Mid Cap Growth Fund, Series I | | | 8,592 | | | $ | 918,750 | |
Invesco Oppenheimer V.I. Global Fund, Series I | | | 128,283 | | | | 6,686,124 | |
Invesco Oppenheimer V.I. International Growth Fund, Series I | | | 510,872 | | | | 1,486,639 | |
Invesco Oppenheimer V.I. Main Street Fund, Series I | | | 15,693 | | | | 469,383 | |
MML Blue Chip Growth Fund, Initial Class (a) | | | 980,163 | | | | 20,103,133 | |
MML Equity Income Fund, Initial Class (a) | | | 1,919,498 | | | | 19,732,438 | |
MML Equity Index Fund, Class III (a) | | | 46,104 | | | | 1,336,100 | |
MML Focused Equity Fund, Class II (a) | | | 3,275,587 | | | | 23,748,002 | |
MML Foreign Fund, Initial Class (a) | | | 1,310,526 | | | | 13,131,475 | |
MML Fundamental Equity Fund, Class II (a) | | | 2,030,968 | | | | 21,792,289 | |
MML Fundamental Value Fund, Class II (a) | | | 1,370,006 | | | | 15,919,466 | |
MML Global Fund, Class I (a) | | | 1,770,114 | | | | 24,710,785 | |
MML Income & Growth Fund, Initial Class (a) | | | 1,864,531 | | | | 18,645,312 | |
MML International Equity Fund, Class II (a) | | | 1,487,698 | | | | 14,847,222 | |
MML Large Cap Growth Fund, Initial Class (a) | | | 689,479 | | | | 9,638,916 | |
MML Mid Cap Growth Fund, Initial Class (a) | | | 1,139,247 | | | | 20,620,370 | |
MML Mid Cap Value Fund, Initial Class (a) | | | 1,455,947 | | | | 15,418,476 | |
MML Small Cap Growth Equity Fund, Initial Class (a) | | | 163,829 | | | | 2,762,553 | |
MML Small Company Value Fund, Class II (a) | | | 338,789 | | | | 5,166,538 | |
MML Small/Mid Cap Value Fund, Initial Class (a) | | | 429,057 | | | | 4,693,880 | |
MML Strategic Emerging Markets Fund, Class II (a) | | | 317,986 | | | | 4,588,539 | |
| | | | | | | | 246,416,390 | |
Fixed Income Funds — 49.1% |
Invesco Oppenheimer V.I. Global Strategic Income Fund, Series I | | | 2,246,492 | | | | 10,873,021 | |
MML Dynamic Bond Fund, Class II (a) | | | 4,908,329 | | | | 51,242,951 | |
MML High Yield Fund, Class II (a) | | | 1,066,200 | | | | 10,768,622 | |
MML Inflation-Protected and Income Fund, Initial Class (a) | | | 1,648,805 | | | | 18,812,862 | |
MML Managed Bond Fund, Initial Class (a) | | | 6,037,188 | | | | 82,061,179 | |
| | | Number of
Shares | | | Value | |
MML Short-Duration Bond Fund, Class II (a) | | | 2,284,416 | | | $ | 22,478,652 | |
MML Total Return Bond Fund, Class II (a) | | | 3,614,112 | | | | 40,767,188 | |
| | | | | | | | 237,004,475 | |
| | | | | | | | | |
TOTAL MUTUAL FUNDS (Cost $443,117,721) | | | | | | | 483,420,865 | |
| | | | | | | | | |
TOTAL LONG-TERM INVESTMENTS (Cost $443,117,721) | | | | | | | 483,420,865 | |
| | | | | | | | | |
TOTAL INVESTMENTS — 100.1% (Cost $443,117,721) (b) | | | | | | | 483,420,865 | |
| | | | | | | | | |
Other Assets/(Liabilities) — (0.1)% | | | | | | | (352,605 | ) |
| | | | | | | | | |
NET ASSETS — 100.0% | | | | | | $ | 483,068,260 | |
Notes to Portfolio of Investments
Percentages are stated as a percent of net assets.
(a) | Affiliated issuer. See Note 7 for a summary of transactions in the investments of affiliated issuers. |
(b) | See Note 6 for aggregate cost for federal tax purposes. |
The accompanying notes are an integral part of the financial statements.
91
MML Moderate Allocation Fund – Portfolio of Investments |
December 31, 2020 |
| | | Number of
Shares | | | Value | |
MUTUAL FUNDS — 100.1% |
Equity Funds — 62.4% |
Invesco Oppenheimer V.I. Discovery Mid Cap Growth Fund, Series I | | | 9,228 | | | $ | 986,796 | |
Invesco Oppenheimer V.I. Global Fund, Series I | | | 41,828 | | | | 2,180,052 | |
Invesco Oppenheimer V.I. International Growth Fund, Series I | | | 423,141 | | | | 1,231,341 | |
MML Blue Chip Growth Fund, Initial Class (a) | | | 4,602,052 | | | | 94,388,094 | |
MML Equity Income Fund, Initial Class (a) | | | 9,004,190 | | | | 92,563,076 | |
MML Equity Index Fund, Class III (a) | | | 207,628 | | | | 6,017,045 | |
MML Focused Equity Fund, Class II (a) | | | 18,148,140 | | | | 131,574,012 | |
MML Foreign Fund, Initial Class (a) | | | 6,066,641 | | | | 60,787,748 | |
MML Fundamental Equity Fund, Class II (a) | | | 6,283,984 | | | | 67,427,147 | |
MML Fundamental Value Fund, Class II (a) | | | 6,841,775 | | | | 79,501,429 | |
MML Global Fund, Class I (a) | | | 11,691,029 | | | | 163,206,767 | |
MML Income & Growth Fund, Initial Class (a) | | | 8,672,058 | | | | 86,720,575 | |
MML International Equity Fund, Class II (a) | | | 6,880,597 | | | | 68,668,354 | |
MML Large Cap Growth Fund, Initial Class (a) | | | 2,643,123 | | | | 36,950,861 | |
MML Mid Cap Growth Fund, Initial Class (a) | | | 5,491,482 | | | | 99,395,822 | |
MML Mid Cap Value Fund, Initial Class (a) | | | 6,927,044 | | | | 73,357,395 | |
MML Small Cap Growth Equity Fund, Initial Class (a) | | | 936,047 | | | | 15,783,975 | |
MML Small Company Value Fund, Class II (a) | | | 1,852,116 | | | | 28,244,770 | |
MML Small/Mid Cap Value Fund, Initial Class (a) | | | 2,238,301 | | | | 24,487,015 | |
MML Strategic Emerging Markets Fund, Class II (a) | | | 2,614,671 | | | | 37,729,701 | |
| | | | | | | | 1,171,201,975 | |
Fixed Income Funds — 37.7% |
Invesco Oppenheimer V.I. Global Strategic Income Fund, Series I | | | 4,399,148 | | | | 21,291,879 | |
MML Dynamic Bond Fund, Class II (a) | | | 15,436,791 | | | | 161,160,094 | |
MML High Yield Fund, Class II (a) | | | 1,126,836 | | | | 11,381,039 | |
MML Inflation-Protected and Income Fund, Initial Class (a) | | | 5,036,555 | | | | 57,467,089 | |
MML Managed Bond Fund, Initial Class (a) | | | 18,253,650 | | | | 248,114,832 | |
MML Short-Duration Bond Fund, Class II (a) | | | 6,500,768 | | | | 63,967,558 | |
| | | Number of
Shares | | | Value | |
MML Total Return Bond Fund, Class II (a) | | | 12,908,693 | | | $ | 145,610,062 | |
| | | | | | | | 708,992,553 | |
| | | | | | | | | |
TOTAL MUTUAL FUNDS (Cost $1,740,769,039) | | | | | | | 1,880,194,528 | |
| | | | | | | | | |
TOTAL LONG-TERM INVESTMENTS (Cost $1,740,769,039) | | | | | | | 1,880,194,528 | |
| | | | | | | | | |
TOTAL INVESTMENTS — 100.1% (Cost $1,740,769,039) (b) | | | | | | | 1,880,194,528 | |
| | | | | | | | | |
Other Assets/(Liabilities) — (0.1)% | | | | | | | (1,352,932 | ) |
| | | | | | | | | |
NET ASSETS — 100.0% | | | | | | $ | 1,878,841,596 | |
Notes to Portfolio of Investments
Percentages are stated as a percent of net assets.
(a) | Affiliated issuer. See Note 7 for a summary of transactions in the investments of affiliated issuers. |
(b) | See Note 6 for aggregate cost for federal tax purposes. |
The accompanying notes are an integral part of the financial statements.
92
MML Growth Allocation Fund – Portfolio of Investments |
December 31, 2020 |
| | | Number of
Shares | | | Value | |
MUTUAL FUNDS — 100.1% |
Equity Funds — 75.5% |
Invesco Oppenheimer V.I. Discovery Mid Cap Growth Fund, Series I | | | 43,843 | | | $ | 4,688,162 | |
Invesco Oppenheimer V.I. Global Fund, Series I | | | 376,801 | | | | 19,638,869 | |
Invesco Oppenheimer V.I. International Growth Fund, Series I | | | 823,516 | | | | 2,396,433 | |
MML Blue Chip Growth Fund, Initial Class (a) | | | 3,812,305 | | | | 78,190,367 | |
MML Equity Income Fund, Initial Class (a) | | | 6,396,474 | | | | 65,755,752 | |
MML Equity Index Fund, Class III (a) | | | 159,873 | | | | 4,633,126 | |
MML Focused Equity Fund, Class II (a) | | | 12,047,203 | | | | 87,342,224 | |
MML Foreign Fund, Initial Class (a) | | | 4,878,222 | | | | 48,879,787 | |
MML Fundamental Equity Fund, Class II (a) | | | 4,755,091 | | | | 51,022,131 | |
MML Fundamental Value Fund, Class II (a) | | | 5,169,853 | | | | 60,073,693 | |
MML Global Fund, Class I (a) | | | 9,017,570 | | | | 125,885,274 | |
MML Income & Growth Fund, Initial Class (a) | | | 6,428,317 | | | | 64,283,172 | |
MML International Equity Fund, Class II (a) | | | 5,831,123 | | | | 58,194,605 | |
MML Large Cap Growth Fund, Initial Class (a) | | | 2,026,625 | | | | 28,332,218 | |
MML Mid Cap Growth Fund, Initial Class (a) | | | 4,340,326 | | | | 78,559,893 | |
MML Mid Cap Value Fund, Initial Class (a) | | | 5,726,547 | | | | 60,644,129 | |
MML Small Cap Growth Equity Fund, Initial Class (a) | | | 902,498 | | | | 15,218,246 | |
MML Small Company Value Fund, Class II (a) | | | 1,597,434 | | | | 24,360,872 | |
MML Small/Mid Cap Value Fund, Initial Class (a) | | | 1,701,391 | | | | 18,613,216 | |
MML Strategic Emerging Markets Fund, Class II (a) | | | 3,002,367 | | | | 43,324,154 | |
| | | | | | | | 940,036,323 | |
Fixed Income Funds — 24.6% |
Invesco Oppenheimer V.I. Global Strategic Income Fund, Series I | | | 3,026,916 | | | | 14,650,271 | |
MML Dynamic Bond Fund, Class II (a) | | | 4,795,434 | | | | 50,064,332 | |
MML High Yield Fund, Class II (a) | | | 1,565,230 | | | | 15,808,819 | |
MML Inflation-Protected and Income Fund, Initial Class (a) | | | 3,933,439 | | | | 44,880,535 | |
MML Managed Bond Fund, Initial Class (a) | | | 7,120,389 | | | | 96,784,702 | |
MML Short-Duration Bond Fund, Class II (a) | | | 3,131,087 | | | | 30,809,899 | |
| | | Number of
Shares | | | Value | |
MML Total Return Bond Fund, Class II (a) | | | 4,717,510 | | | $ | 53,213,516 | |
| | | | | | | | 306,212,074 | |
| | | | | | | | | |
TOTAL MUTUAL FUNDS (Cost $1,128,341,605) | | | | | | | 1,246,248,397 | |
| | | | | | | | | |
TOTAL LONG-TERM INVESTMENTS (Cost $1,128,341,605) | | | | | | | 1,246,248,397 | |
| | | | | | | | | |
TOTAL INVESTMENTS — 100.1% (Cost $1,128,341,605) (b) | | | | | | | 1,246,248,397 | |
| | | | | | | | | |
Other Assets/(Liabilities) — (0.1)% | | | | | | | (803,969 | ) |
| | | | | | | | | |
NET ASSETS — 100.0% | | | | | | $ | 1,245,444,428 | |
Notes to Portfolio of Investments
Percentages are stated as a percent of net assets.
(a) | Affiliated issuer. See Note 7 for a summary of transactions in the investments of affiliated issuers. |
(b) | See Note 6 for aggregate cost for federal tax purposes. |
The accompanying notes are an integral part of the financial statements.
93
MML Aggressive Allocation Fund – Portfolio of Investments |
December 31, 2020 |
| | | Number of
Shares | | | Value | |
MUTUAL FUNDS — 100.1% |
Equity Funds — 90.5% |
Invesco Oppenheimer V.I. Discovery Mid Cap Growth Fund, Series I | | | 18,006 | | | $ | 1,925,342 | |
Invesco Oppenheimer V.I. Global Fund, Series I | | | 92,792 | | | | 4,836,325 | |
Invesco Oppenheimer V.I. International Growth Fund, Series I | | | 388,852 | | | | 1,131,558 | |
Invesco Oppenheimer V.I. Main Street Fund, Series I | | | 7,772 | | | | 232,469 | |
MML Blue Chip Growth Fund, Initial Class (a) | | | 519,720 | | | | 10,659,456 | |
MML Equity Income Fund, Initial Class (a) | | | 894,223 | | | | 9,192,613 | |
MML Equity Index Fund, Class III (a) | | | 24,418 | | | | 707,628 | |
MML Focused Equity Fund, Class II (a) | | | 1,857,582 | | | | 13,467,469 | |
MML Foreign Fund, Initial Class (a) | | | 737,688 | | | | 7,391,632 | |
MML Fundamental Equity Fund, Class II (a) | | | 723,986 | | | | 7,768,366 | |
MML Fundamental Value Fund, Class II (a) | | | 763,158 | | | | 8,867,900 | |
MML Global Fund, Class I (a) | | | 1,332,636 | | | | 18,603,602 | |
MML Income & Growth Fund, Initial Class (a) | | | 966,746 | | | | 9,667,461 | |
MML International Equity Fund, Class II (a) | | | 899,689 | | | | 8,978,900 | |
MML Large Cap Growth Fund, Initial Class (a) | | | 263,699 | | | | 3,686,508 | |
MML Mid Cap Growth Fund, Initial Class (a) | | | 665,340 | | | | 12,042,658 | |
MML Mid Cap Value Fund, Initial Class (a) | | | 750,661 | | | | 7,949,498 | |
MML Small Cap Growth Equity Fund, Initial Class (a) | | | 139,148 | | | | 2,346,361 | |
MML Small Company Value Fund, Class II (a) | | | 244,296 | | | | 3,725,508 | |
MML Small/Mid Cap Value Fund, Initial Class (a) | | | 220,651 | | | | 2,413,919 | |
MML Strategic Emerging Markets Fund, Class II (a) | | | 650,144 | | | | 9,381,571 | |
| | | | | | | | 144,976,744 | |
Fixed Income Funds — 9.6% |
Invesco Oppenheimer V.I. Global Strategic Income Fund, Series I | | | 273,029 | | | | 1,321,460 | |
MML Dynamic Bond Fund, Class II (a) | | | 158,440 | | | | 1,654,114 | |
MML High Yield Fund, Class II (a) | | | 162,292 | | | | 1,639,153 | |
MML Inflation-Protected and Income Fund, Initial Class (a) | | | 261,855 | | | | 2,987,771 | |
MML Managed Bond Fund, Initial Class (a) | | | 273,794 | | | | 3,721,575 | |
| | | Number of
Shares | | | Value | |
MML Short-Duration Bond Fund, Class II (a) | | | 269,078 | | | $ | 2,647,731 | |
MML Total Return Bond Fund, Class II (a) | | | 127,005 | | | | 1,432,622 | |
| | | | | | | | 15,404,426 | |
| | | | | | | | | |
TOTAL MUTUAL FUNDS (Cost $145,025,176) | | | | | | | 160,381,170 | |
| | | | | | | | | |
TOTAL LONG-TERM INVESTMENTS (Cost $145,025,176) | | | | | | | 160,381,170 | |
| | | | | | | | | |
TOTAL INVESTMENTS — 100.1% (Cost $145,025,176) (b) | | | | | | | 160,381,170 | |
| | | | | | | | | |
Other Assets/(Liabilities) — (0.1)% | | | | | | | (105,793 | ) |
| | | | | | | | | |
NET ASSETS — 100.0% | | | | | | $ | 160,275,377 | |
Notes to Portfolio of Investments
Percentages are stated as a percent of net assets.
(a) | Affiliated issuer. See Note 7 for a summary of transactions in the investments of affiliated issuers. |
(b) | See Note 6 for aggregate cost for federal tax purposes. |
The accompanying notes are an integral part of the financial statements.
94
MML American Funds Growth Fund – Portfolio of Investments |
December 31, 2020 |
| | | Number of
Shares | | | Value | |
MUTUAL FUNDS — 100.1% |
Equity Funds — 100.1% |
American Funds Growth Fund, Class 1 | | | 2,144,096 | | | $ | 257,741,838 | |
| | | | | | | | | |
TOTAL MUTUAL FUNDS (Cost $156,446,097) | | | | | | | 257,741,838 | |
| | | | | | | | | |
TOTAL INVESTMENTS — 100.1% (Cost $156,446,097) (a) | | | | | | | 257,741,838 | |
| | | | | | | | | |
Other Assets/(Liabilities) — (0.1)% | | | | | | | (277,663 | ) |
| | | | | | | | | |
NET ASSETS — 100.0% | | | | | | $ | 257,464,175 | |
Notes to Portfolio of Investments
Percentages are stated as a percent of net assets.
(a) | See Note 6 for aggregate cost for federal tax purposes. |
The accompanying notes are an integral part of the financial statements.
95
MML American Funds International Fund – Portfolio of Investments |
December 31, 2020 |
| | | Number of
Shares | | | Value | |
MUTUAL FUNDS — 100.1% |
Equity Funds — 100.1% |
American Funds International Fund, Class 1 | | | 2,585,402 | | | $ | 61,118,911 | |
| | | | | | | | | |
TOTAL MUTUAL FUNDS (Cost $49,313,484) | | | | | | | 61,118,911 | |
| | | | | | | | | |
TOTAL INVESTMENTS — 100.1% (Cost $49,313,484) (a) | | | | | | | 61,118,911 | |
| | | | | | | | | |
Other Assets/(Liabilities) — (0.1)% | | | | | | | (88,346 | ) |
| | | | | | | | | |
NET ASSETS — 100.0% | | | | | | $ | 61,030,565 | |
Notes to Portfolio of Investments
Percentages are stated as a percent of net assets.
(a) | See Note 6 for aggregate cost for federal tax purposes. |
The accompanying notes are an integral part of the financial statements.
96
MML American Funds Core Allocation Fund – Portfolio of Investments |
December 31, 2020 |
| | | Number of
Shares | | | Value | |
MUTUAL FUNDS — 100.1% |
Equity Funds — 67.4% |
American Funds Blue Chip Income and Growth Fund, Class 1 | | | 18,405,582 | | | $ | 264,120,107 | |
American Funds Growth-Income Fund, Class 1 | | | 4,548,362 | | | | 251,888,296 | |
American Funds International Fund, Class 1 | | | 5,078,481 | | | | 120,055,290 | |
| | | | | | | | 636,063,693 | |
Fixed Income Funds — 32.7% |
American Funds Bond Fund, Class 1 | | | 25,962,748 | | | | 308,697,076 | |
| | | | | | | | | |
TOTAL MUTUAL FUNDS (Cost $829,260,902) | | | | | | | 944,760,769 | |
| | | | | | | | | |
TOTAL LONG-TERM INVESTMENTS (Cost $829,260,902) | | | | | | | 944,760,769 | |
| | | | | | | | | |
TOTAL INVESTMENTS — 100.1% (Cost $829,260,902) (a) | | | | | | | 944,760,769 | |
| | | | | | | | | |
Other Assets/(Liabilities) — (0.1)% | | | | | | | (1,033,241 | ) |
| | | | | | | | | |
NET ASSETS — 100.0% | | | | | | $ | 943,727,528 | |
Notes to Portfolio of Investments
Percentages are stated as a percent of net assets.
(a) | See Note 6 for aggregate cost for federal tax purposes. |
The accompanying notes are an integral part of the financial statements.
97
MML Blue Chip Growth Fund – Portfolio of Investments |
December 31, 2020 |
| | | Number of
Shares | | | Value | |
EQUITIES — 99.9% |
COMMON STOCK — 99.9% |
Basic Materials — 0.5% |
Chemicals — 0.5% |
Linde PLC | | | 6,801 | | | $ | 1,792,132 | |
PPG Industries, Inc. | | | 2,450 | | | | 353,339 | |
The Sherwin-Williams Co. | | | 665 | | | | 488,715 | |
| | | | | | | | 2,634,186 | |
Communications — 37.3% |
Internet — 37.1% |
Airbnb, Inc.Class A (a) | | | 2,416 | | | | 354,669 | |
Alibaba Group Holding Ltd. Sponsored ADR (a) | | | 69,411 | | | | 16,154,022 | |
Alphabet, Inc. Class A (a) | | | 3,689 | | | | 6,465,489 | |
Alphabet, Inc. Class C (a) | | | 16,216 | | | | 28,408,486 | |
Amazon.com, Inc. (a) | | | 18,663 | | | | 60,784,085 | |
Booking Holdings, Inc. (a) | | | 1,985 | | | | 4,421,131 | |
DoorDash, Inc. Class A (a) | | | 1,965 | | | | 280,504 | |
Etsy, Inc. (a) | | | 6,500 | | | | 1,156,415 | |
Facebook, Inc. Class A (a) | | | 124,347 | | | | 33,966,626 | |
JD.com, Inc. ADR (a) | | | 5,164 | | | | 453,916 | |
Match Group, Inc. (a) | | | 36,371 | | | | 5,498,931 | |
Netflix, Inc. (a) | | | 22,916 | | | | 12,391,369 | |
Pinduoduo, Inc. ADR (a) | | | 6,960 | | | | 1,236,583 | |
Roku, Inc. (a) | | | 400 | | | | 132,808 | |
Shopify, Inc. Class A (a) | | | 1,771 | | | | 2,004,683 | |
Snap, Inc. Class A (a) | | | 94,673 | | | | 4,740,277 | |
Spotify Technology SA (a) | | | 10,183 | | | | 3,204,183 | |
Tencent Holdings Ltd. | | | 189,200 | | | | 13,824,319 | |
Wix.com Ltd. (a) | | | 8,931 | | | | 2,232,393 | |
| | | | | | | | 197,710,889 | |
Media — 0.2% |
Charter Communications, Inc. Class A (a) | | | 100 | | | | 66,155 | |
The Walt Disney Co. (a) | | | 4,243 | | | | 768,747 | |
| | | | | | | | 834,902 | |
Telecommunications — 0.0% |
T-Mobile US, Inc. (a) | | | 1,800 | | | | 242,730 | |
| | | | | | | | 198,788,521 | |
Consumer, Cyclical — 5.3% |
Airlines — 0.0% |
United Airlines Holdings, Inc. (a) | | | 239 | | | | 10,337 | |
Apparel — 1.0% |
NIKE, Inc. Class B | | | 35,008 | | | | 4,952,582 | |
VF Corp. | | | 5,900 | | | | 503,919 | |
| | | | | | | | 5,456,501 | |
| | | Number of
Shares | | | Value | |
Auto Parts & Equipment — 0.1% |
Aptiv PLC | | | 2,828 | | | $ | 368,460 | |
Lodging — 0.1% |
Hilton Worldwide Holdings, Inc. | | | 1,200 | | | | 133,512 | |
Marriott International, Inc. Class A | | | 2,837 | | | | 374,257 | |
| | | | | | | | 507,769 | |
Retail — 4.1% |
Carvana Co. (a) | | | 6,239 | | | | 1,494,490 | |
Chipotle Mexican Grill, Inc. (a) | | | 2,440 | | | | 3,383,572 | |
Dollar General Corp. | | | 29,041 | | | | 6,107,322 | |
Dollar Tree, Inc. (a) | | | 461 | | | | 49,806 | |
Domino’s Pizza, Inc. | | | 1,045 | | | | 400,716 | |
Lululemon Athletica, Inc. (a) | | | 10,551 | | | | 3,672,064 | |
McDonald’s Corp. | | | 308 | | | | 66,091 | |
Ross Stores, Inc. | | | 31,885 | | | | 3,915,797 | |
Starbucks Corp. | | | 4,209 | | | | 450,279 | |
The TJX Cos., Inc. | | | 12,071 | | | | 824,329 | |
Yum! Brands, Inc. | | | 15,121 | | | | 1,641,536 | |
| | | | | | | | 22,006,002 | |
| | | | | | | | 28,349,069 | |
Consumer, Non-cyclical — 18.6% |
Biotechnology — 1.4% |
Exact Sciences Corp. (a) (b) | | | 917 | | | | 121,493 | |
Incyte Corp. (a) | | | 21,547 | | | | 1,874,158 | |
Seagen, Inc. (a) | | | 433 | | | | 75,836 | |
Vertex Pharmaceuticals, Inc. (a) | | | 23,647 | | | | 5,588,732 | |
| | | | | | | | 7,660,219 | |
Commercial Services — 6.9% |
Ant International Co. Ltd., Class C (Acquired 6/07/18, Cost $775,038) (a) (c) (d) (e) | | | 138,153 | | | | 1,201,931 | |
Cintas Corp. | | | 5,460 | | | | 1,929,892 | |
CoStar Group, Inc. (a) | | | 3,600 | | | | 3,327,408 | |
Equifax, Inc. | | | 2,248 | | | | 433,504 | |
Global Payments, Inc. | | | 53,729 | | | | 11,574,301 | |
PayPal Holdings, Inc. (a) | | | 63,313 | | | | 14,827,904 | |
S&P Global, Inc. | | | 9,649 | | | | 3,171,916 | |
Square, Inc. Class A (a) | | | 2,056 | | | | 447,468 | |
| | | | | | | | 36,914,324 | |
Health Care – Products — 5.0% |
Align Technology, Inc. (a) | | | 776 | | | | 414,679 | |
Danaher Corp. | | | 25,731 | | | | 5,715,884 | |
Intuitive Surgical, Inc. (a) | | | 9,953 | | | | 8,142,549 | |
Stryker Corp. | | | 29,785 | | | | 7,298,517 | |
Thermo Fisher Scientific, Inc. | | | 10,730 | | | | 4,997,819 | |
| | | | | | | | 26,569,448 | |
The accompanying notes are an integral part of the financial statements.
98
MML Blue Chip Growth Fund – Portfolio of Investments (Continued) |
| | | Number of
Shares | | | Value | |
Health Care – Services — 3.7% |
Anthem, Inc. | | | 8,460 | | | $ | 2,716,422 | |
Centene Corp. (a) | | | 34,772 | | | | 2,087,363 | |
HCA Healthcare, Inc. | | | 15,168 | | | | 2,494,529 | |
Humana, Inc. | | | 3,012 | | | | 1,235,733 | |
PPD, Inc. (a) | | | 10,586 | | | | 362,253 | |
UnitedHealth Group, Inc. | | | 29,985 | | | | 10,515,140 | |
| | | | | | | | 19,411,440 | |
Pharmaceuticals — 1.6% |
AbbVie, Inc. | | | 476 | | | | 51,003 | |
Becton Dickinson and Co. | | | 221 | | | | 55,299 | |
Cigna Corp. | | | 30,685 | | | | 6,388,003 | |
Zoetis, Inc. | | | 11,959 | | | | 1,979,215 | |
| | | | | | | | 8,473,520 | |
| | | | | | | | 99,028,951 | |
Financial — 8.1% |
Banks — 1.3% |
The Goldman Sachs Group, Inc. | | | 18,109 | | | | 4,775,524 | |
Morgan Stanley | | | 26,358 | | | | 1,806,314 | |
State Street Corp. | | | 875 | | | | 63,683 | |
| | | | | | | | 6,645,521 | |
Diversified Financial Services — 6.3% |
The Charles Schwab Corp. | | | 47,903 | | | | 2,540,775 | |
Intercontinental Exchange, Inc. | | | 18,311 | | | | 2,111,075 | |
Mastercard, Inc. Class A | | | 35,155 | | | | 12,548,226 | |
Visa, Inc. Class A | | | 75,749 | | | | 16,568,579 | |
| | | | | | | | 33,768,655 | |
Insurance — 0.5% |
Chubb Ltd. | | | 7,066 | | | | 1,087,598 | |
Marsh & McLennan Cos., Inc. | | | 4,627 | | | | 541,359 | |
Willis Towers Watson PLC | | | 4,182 | | | | 881,064 | |
| | | | | | | | 2,510,021 | |
| | | | | | | | 42,924,197 | |
Industrial — 1.7% |
Electronics — 1.0% |
Agilent Technologies, Inc. | | | 288 | | | | 34,125 | |
Fortive Corp. | | | 17,480 | | | | 1,237,934 | |
Honeywell International, Inc. | | | 2,049 | | | | 435,822 | |
Roper Technologies, Inc. | | | 6,412 | | | | 2,764,149 | |
TE Connectivity Ltd. | | | 8,700 | | | | 1,053,309 | |
| | | | | | | | 5,525,339 | |
Miscellaneous – Manufacturing — 0.2% |
General Electric Co. | | | 72,893 | | | | 787,244 | |
Parker-Hannifin Corp. | | | 1,500 | | | | 408,615 | |
| | | | | | | | 1,195,859 | |
| | | Number of
Shares | | | Value | |
Transportation — 0.5% |
Canadian Pacific Railway Ltd. | | | 196 | | | $ | 67,951 | |
Kansas City Southern | | | 239 | | | | 48,787 | |
Norfolk Southern Corp. | | | 5,085 | | | | 1,208,247 | |
Union Pacific Corp. | | | 5,908 | | | | 1,230,164 | |
| | | | | | | | 2,555,149 | |
| | | | | | | | 9,276,347 | |
Technology — 28.4% |
Computers — 5.1% |
Apple, Inc. | | | 202,157 | | | | 26,824,212 | |
Crowdstrike Holdings, Inc. Class A (a) | | | 2,100 | | | | 444,822 | |
| | | | | | | | 27,269,034 | |
Semiconductors — 4.7% |
Advanced Micro Devices, Inc. (a) | | | 58,778 | | | | 5,390,530 | |
Applied Materials, Inc. | | | 12,181 | | | | 1,051,220 | |
KLA Corp. | | | 280 | | | | 72,495 | |
Lam Research Corp. | | | 213 | | | | 100,594 | |
Marvell Technology Group Ltd. | | | 89,628 | | | | 4,260,915 | |
Maxim Integrated Products, Inc. | | | 19,171 | | | | 1,699,509 | |
Monolithic Power Systems, Inc. | | | 2,937 | | | | 1,075,618 | |
NVIDIA Corp. | | | 14,701 | | | | 7,676,862 | |
QUALCOMM, Inc. | | | 15,984 | | | | 2,435,003 | |
Texas Instruments, Inc. | | | 8,402 | | | | 1,379,020 | |
| | | | | | | | 25,141,766 | |
Software — 18.6% |
Adobe, Inc. (a) | | | 100 | | | | 50,012 | |
Atlassian Corp. PLC Class A (a) | | | 4,890 | | | | 1,143,624 | |
Clarivate PLC (a) | | | 5,500 | | | | 163,405 | |
Coupa Software, Inc. (a) | | | 864 | | | | 292,818 | |
DocuSign, Inc. (a) | | | 7,332 | | | | 1,629,904 | |
Fidelity National Information Services, Inc. | | | 38,501 | | | | 5,446,351 | |
Fiserv, Inc. (a) | | | 51,432 | | | | 5,856,047 | |
Intuit, Inc. | | | 29,761 | | | | 11,304,716 | |
Microsoft Corp. | | | 124,716 | | | | 27,739,333 | |
MongoDB, Inc. (a) | | | 1,120 | | | | 402,125 | |
MSCI, Inc. | | | 104 | | | | 46,439 | |
Paycom Software, Inc. (a) | | | 3,395 | | | | 1,535,389 | |
RingCentral, Inc. Class A (a) | | | 700 | | | | 265,279 | |
salesforce.com, Inc. (a) | | | 47,646 | | | | 10,602,664 | |
Sea Ltd. ADR (a) | | | 35,965 | | | | 7,158,833 | |
ServiceNow, Inc. (a) | | | 24,240 | | | | 13,342,423 | |
Snowflake, Inc. Class A (a) (b) | | | 717 | | | | 201,764 | |
Splunk, Inc. (a) | | | 17,768 | | | | 3,018,606 | |
Synopsys, Inc. (a) | | | 16,137 | | | | 4,183,356 | |
Twilio, Inc. Class A (a) | | | 1,666 | | | | 563,941 | |
Veeva Systems, Inc. Class A (a) | | | 5,284 | | | | 1,438,569 | |
Workday, Inc. Class A (a) | | | 8,596 | | | | 2,059,688 | |
The accompanying notes are an integral part of the financial statements.
99
MML Blue Chip Growth Fund – Portfolio of Investments (Continued) |
| | | Number of
Shares | | | Value | |
Zoom Video Communications, Inc. Class A (a) | | | 2,245 | | | $ | 757,283 | |
| | | | | | | | 99,202,569 | |
| | | | | | | | 151,613,369 | |
| | | | | | | | | |
TOTAL COMMON STOCK (Cost $261,639,286) | | | | | | | 532,614,640 | |
| | | | | | | | | |
TOTAL EQUITIES (Cost $261,639,286) | | | | | | | 532,614,640 | |
| | | | | | | | | |
MUTUAL FUNDS — 0.0% |
Diversified Financial Services — 0.0% |
State Street Navigator Securities Lending Prime Portfolio (f) | | | 75,834 | | | | 75,834 | |
| | | | | | | | | |
TOTAL MUTUAL FUNDS (Cost $75,834) | | | | | | | 75,834 | |
| | | | | | | | | |
TOTAL LONG-TERM INVESTMENTS (Cost $261,715,120) | | | | | | | 532,690,474 | |
| | | | | | | | | |
SHORT-TERM INVESTMENTS — 0.2% |
Mutual Fund — 0.0% |
T. Rowe Price Government Reserve Investment Fund | | | 100 | | | | 100 | |
| | | Principal
Amount | | | | | |
Repurchase Agreement — 0.2% |
Fixed Income Clearing Corp., Repurchase Agreement, dated 12/31/20, 0.000%, due 1/04/21 (g) | | $ | 997,767 | | | | 997,767 | |
| | | | | | | | | |
TOTAL SHORT-TERM INVESTMENTS (Cost $997,867) | | | | | | | 997,867 | |
| | | | | | | | | |
TOTAL INVESTMENTS — 100.1% (Cost $262,712,987) (h) | | | | | | | 533,688,341 | |
| | | | | | | | | |
Other Assets/(Liabilities) — (0.1)% | | | | | | | (457,067 | ) |
| | | | | | | | | |
NET ASSETS — 100.0% | | | | | | $ | 533,231,274 | |
Abbreviation Legend
ADR | American Depositary Receipt |
Notes to Portfolio of Investments
Percentages are stated as a percent of net assets.
(a) | Non-income producing security. |
(b) | Denotes all or a portion of security on loan. The total value of securities on loan as of December 31, 2020, was $127,286 or 0.02% of net assets. Total securities on loan may be less than the amounts identified in the Portfolio of Investments. The Fund received $55,287 of non-cash collateral (U.S. Treasury and/or Agency obligations) related to securities lending activity. This amount is not reflected on either the Portfolio of Investments or the Statement of Assets and Liabilities. (Note 2). |
(c) | Investment was valued using significant unobservable inputs. |
(d) | This security is fair valued in good faith in accordance with procedures approved by the Board of Trustees. At December 31, 2020, these securities amounted to a value of $1,201,931 or 0.23% of net assets. |
(e) | Restricted security. Certain securities are restricted as to resale. At December 31, 2020, these securities amounted to a value of $1,201,931 or 0.23% of net assets. The Fund generally bears the costs, if any, associated with the disposition of restricted securities. |
(f) | Represents investment of security lending cash collateral. (Note 2). |
(g) | Maturity value of $997,767. Collateralized by U.S. Government Agency obligations with a rate of 0.000%, maturity date of 12/30/21, and an aggregate market value, including accrued interest, of $1,017,815. |
(h) | See Note 6 for aggregate cost for federal tax purposes. |
Country weightings, as a percentage of net assets, is as follows:
United States | | | 89.2 | % |
Cayman Islands | | | 7.3 | % |
Bermuda | | | 0.8 | % |
Luxembourg | | | 0.6 | % |
Ireland | | | 0.5 | % |
Israel | | | 0.4 | % |
Switzerland | | | 0.4 | % |
Canada | | | 0.4 | % |
United Kingdom | | | 0.3 | % |
Total Long-Term Investments | | | 99.9 | % |
Short-Term Investments and Other Assets and Liabilities | | | 0.1 | % |
Net Assets | | | 100.0 | % |
The accompanying notes are an integral part of the financial statements.
100
MML Equity Income Fund – Portfolio of Investments |
December 31, 2020 |
| | | Number of
Shares | | | Value | |
EQUITIES — 99.6% |
COMMON STOCK — 97.6% |
Basic Materials — 6.3% |
Chemicals — 4.6% |
Akzo Nobel NV | | | 9,040 | | | $ | 971,071 | |
CF Industries Holdings, Inc. | | | 188,239 | | | | 7,286,732 | |
DuPont de Nemours, Inc. | | | 159,144 | | | | 11,316,729 | |
PPG Industries, Inc. | | | 7,369 | | | | 1,062,757 | |
| | | | | | | | 20,637,289 | |
Forest Products & Paper — 1.7% |
International Paper Co. | | | 155,509 | | | | 7,731,907 | |
| | | | | | | | 28,369,196 | |
Communications — 7.1% |
Media — 4.8% |
Comcast Corp. Class A | | | 155,567 | | | | 8,151,711 | |
Fox Corp. Class B (a) | | | 108,011 | | | | 3,119,357 | |
News Corp. Class A | | | 312,759 | | | | 5,620,279 | |
The Walt Disney Co. (a) | | | 26,043 | | | | 4,718,471 | |
| | | | | | | | 21,609,818 | |
Telecommunications — 2.3% |
AT&T, Inc. | | | 47,248 | | | | 1,358,852 | |
Cisco Systems, Inc. | | | 161,314 | | | | 7,218,802 | |
Verizon Communications, Inc. | | | 26,893 | | | | 1,579,964 | |
| | | | | | | | 10,157,618 | |
| | | | | | | | 31,767,436 | |
Consumer, Cyclical — 5.6% |
Airlines — 0.4% |
Alaska Air Group, Inc. | | | 29,757 | | | | 1,547,364 | |
Auto Manufacturers — 1.6% |
Cummins, Inc. | | | 2,600 | | | | 590,460 | |
General Motors Co. | | | 21,254 | | | | 885,017 | |
PACCAR, Inc. | | | 21,600 | | | | 1,863,648 | |
Volkswagen AG | | | 198,093 | | | | 3,688,472 | |
| | | | | | | | 7,027,597 | |
Auto Parts & Equipment — 0.1% |
Magna International, Inc. | | | 7,000 | | | | 495,600 | |
Lodging — 1.0% |
Las Vegas Sands Corp. | | | 78,130 | | | | 4,656,548 | |
Retail — 1.8% |
Kohl’s Corp. | | | 86,300 | | | | 3,511,547 | |
McDonald’s Corp. | | | 2,900 | | | | 622,282 | |
The TJX Cos., Inc. | | | 22,000 | | | | 1,502,380 | |
Walmart, Inc. | | | 15,162 | | | | 2,185,602 | |
| | | | | | | | 7,821,811 | |
| | | Number of
Shares | | | Value | |
Toys, Games & Hobbies — 0.7% |
Mattel, Inc. (a) | | | 188,700 | | | $ | 3,292,815 | |
| | | | | | | | 24,841,735 | |
Consumer, Non-cyclical — 20.6% |
Agriculture — 2.2% |
Altria Group, Inc. | | | 16,900 | | | | 692,900 | |
Bunge Ltd. | | | 19,400 | | | | 1,272,252 | |
Philip Morris International, Inc. | | | 96,151 | | | | 7,960,341 | |
| | | | | | | | 9,925,493 | |
Beverages — 0.6% |
The Coca-Cola Co. | | | 51,100 | | | | 2,802,324 | |
Biotechnology — 0.6% |
Biogen, Inc. (a) | | | 4,100 | | | | 1,003,926 | |
Gilead Sciences, Inc. | | | 32,617 | | | | 1,900,266 | |
| | | | | | | | 2,904,192 | |
Commercial Services — 0.8% |
Nielsen Holdings PLC | | | 162,344 | | | | 3,388,119 | |
Foods — 3.1% |
Conagra Brands, Inc. | | | 166,710 | | | | 6,044,905 | |
Mondelez International, Inc. Class A | | | 3,900 | | | | 228,033 | |
Tyson Foods, Inc. Class A | | | 117,694 | | | | 7,584,201 | |
| | | | | | | | 13,857,139 | |
Health Care – Products — 2.2% |
Medtronic PLC | | | 64,084 | | | | 7,506,800 | |
Zimmer Biomet Holdings, Inc. | | | 14,223 | | | | 2,191,622 | |
| | | | | | | | 9,698,422 | |
Health Care – Services — 1.7% |
Anthem, Inc. | | | 23,872 | | | | 7,665,061 | |
Household Products & Wares — 1.0% |
Kimberly-Clark Corp. | | | 32,553 | | | | 4,389,121 | |
Pharmaceuticals — 8.4% |
AbbVie, Inc. | | | 76,104 | | | | 8,154,544 | |
Becton Dickinson and Co. | | | 24,489 | | | | 6,127,638 | |
CVS Health Corp. | | | 84,625 | | | | 5,779,887 | |
GlaxoSmithKline PLC Sponsored ADR | | | 24,808 | | | | 912,934 | |
GlaxoSmithKline PLC | | | 82,813 | | | | 1,517,388 | |
Johnson & Johnson | | | 40,161 | | | | 6,320,538 | |
Merck & Co., Inc. | | | 22,500 | | | | 1,840,500 | |
Pfizer, Inc. | | | 144,780 | | | | 5,329,352 | |
Sanofi | | | 15,963 | | | | 1,542,354 | |
| | | | | | | | 37,525,135 | |
| | | | | | | | 92,155,006 | |
Energy — 6.6% |
Oil & Gas — 4.1% |
Chevron Corp. | | | 10,786 | | | | 910,878 | |
ConocoPhillips | | | 12,700 | | | | 507,873 | |
The accompanying notes are an integral part of the financial statements.
101
MML Equity Income Fund – Portfolio of Investments (Continued) |
| | | Number of
Shares | | | Value | |
EOG Resources, Inc. | | | 70,500 | | | $ | 3,515,835 | |
Exxon Mobil Corp. | | | 80,953 | | | | 3,336,882 | |
Hess Corp. | | | 15,500 | | | | 818,245 | |
Occidental Petroleum Corp. | | | 34,929 | | | | 604,621 | |
TOTAL SE | | | 195,284 | | | | 8,424,179 | |
TOTAL SE Sponsored ADR | | | 7,200 | | | | 301,752 | |
| | | | | | | | 18,420,265 | |
Oil & Gas Services — 0.7% |
Halliburton Co. | | | 157,472 | | | | 2,976,221 | |
Pipelines — 1.8% |
Enbridge, Inc. | | | 68,993 | | | | 2,207,086 | |
Targa Resources Corp. | | | 92,753 | | | | 2,446,824 | |
TC Energy Corp. | | | 84,388 | | | | 3,436,280 | |
| | | | | | | | 8,090,190 | |
| | | | | | | | 29,486,676 | |
Financial — 25.4% |
Banks — 10.7% |
Bank of America Corp. | | | 48,477 | | | | 1,469,338 | |
Fifth Third Bancorp | | | 245,485 | | | | 6,768,021 | |
The Goldman Sachs Group, Inc. | | | 9,000 | | | | 2,373,390 | |
JP Morgan Chase & Co. | | | 34,056 | | | | 4,327,496 | |
Morgan Stanley | | | 137,282 | | | | 9,407,936 | |
The PNC Financial Services Group, Inc. | | | 32,789 | | | | 4,885,561 | |
State Street Corp. | | | 80,906 | | | | 5,888,339 | |
Wells Fargo & Co. | | | 425,191 | | | | 12,832,264 | |
| | | | | | | | 47,952,345 | |
Diversified Financial Services — 1.3% |
The Charles Schwab Corp. | | | 32,200 | | | | 1,707,888 | |
Franklin Resources, Inc. | | | 56,049 | | | | 1,400,665 | |
Raymond James Financial, Inc. | | | 28,753 | | | | 2,750,799 | |
| | | | | | | | 5,859,352 | |
Insurance — 8.9% |
American International Group, Inc. | | | 228,137 | | | | 8,637,267 | |
Chubb Ltd. | | | 67,351 | | | | 10,366,666 | |
Equitable Holdings, Inc. | | | 138,617 | | | | 3,547,209 | |
Loews Corp. | | | 140,014 | | | | 6,303,430 | |
Marsh & McLennan Cos., Inc. | | | 10,400 | | | | 1,216,800 | |
MetLife, Inc. | | | 193,259 | | | | 9,073,510 | |
Willis Towers Watson PLC | | | 4,411 | | | | 929,309 | |
| | | | | | | | 40,074,191 | |
Real Estate Investment Trusts (REITS) — 4.5% |
Equity Residential | | | 85,559 | | | | 5,071,938 | |
Rayonier, Inc. | | | 127,248 | | | | 3,738,546 | |
SL Green Realty Corp. (b) | | | 31,541 | | | | 1,879,213 | |
Welltower, Inc. | | | 13,300 | | | | 859,446 | |
| | | Number of
Shares | | | Value | |
Weyerhaeuser Co. | | | 254,785 | | | $ | 8,542,941 | |
| | | | | | | | 20,092,084 | |
| | | | | | | | 113,977,972 | |
Industrial — 10.8% |
Aerospace & Defense — 2.7% |
The Boeing Co. | | | 26,589 | | | | 5,691,641 | |
L3 Harris Technologies, Inc. | | | 35,167 | | | | 6,647,267 | |
| | | | | | | | 12,338,908 | |
Building Materials — 0.4% |
Johnson Controls International PLC | | | 41,023 | | | | 1,911,261 | |
Electrical Components & Equipment — 0.3% |
Emerson Electric Co. | | | 17,000 | | | | 1,366,290 | |
Electronics — 0.3% |
TE Connectivity Ltd. | | | 10,700 | | | | 1,295,449 | |
Environmental Controls — 0.8% |
Stericycle, Inc. (a) | | | 49,599 | | | | 3,438,699 | |
Hand & Machine Tools — 0.6% |
Snap-on, Inc. | | | 16,100 | | | | 2,755,354 | |
Machinery – Construction & Mining — 0.6% |
Caterpillar, Inc. | | | 14,300 | | | | 2,602,886 | |
Machinery – Diversified — 0.1% |
Flowserve Corp. | | | 8,973 | | | | 330,655 | |
Miscellaneous – Manufacturing — 2.7% |
General Electric Co. | | | 1,109,008 | | | | 11,977,286 | |
Transportation — 2.3% |
United Parcel Service, Inc. Class B | | | 61,428 | | | | 10,344,475 | |
| | | | | | | | 48,361,263 | |
Technology — 7.6% |
Semiconductors — 5.9% |
Applied Materials, Inc. | | | 69,814 | | | | 6,024,948 | |
NXP Semiconductor NV | | | 10,700 | | | | 1,701,407 | |
QUALCOMM, Inc. | | | 91,526 | | | | 13,943,071 | |
Texas Instruments, Inc. | | | 29,342 | | | | 4,815,903 | |
| | | | | | | | 26,485,329 | |
Software — 1.7% |
Citrix Systems, Inc. | | | 11,000 | | | | 1,431,100 | |
Microsoft Corp. | | | 27,798 | | | | 6,182,831 | |
| | | | | | | | 7,613,931 | |
| | | | | | | | 34,099,260 | |
Utilities — 7.6% |
Electric — 5.9% |
Ameren Corp. | | | 33,400 | | | | 2,607,204 | |
Duke Energy Corp. | | | 7,100 | | | | 650,076 | |
Edison International | | | 68,433 | | | | 4,298,961 | |
NextEra Energy, Inc. | | | 41,072 | | | | 3,168,705 | |
Sempra Energy | | | 28,349 | | | | 3,611,946 | |
The accompanying notes are an integral part of the financial statements.
102
MML Equity Income Fund – Portfolio of Investments (Continued) |
| | | Number of
Shares | | | Value | |
The Southern Co. | | | 200,893 | | | $ | 12,340,857 | |
| | | | | | | | 26,677,749 | |
Gas — 1.7% |
NiSource, Inc. | | | 323,509 | | | | 7,421,296 | |
| | | | | | | | 34,099,045 | |
| | | | | | | | | |
TOTAL COMMON STOCK (Cost $354,403,541) | | | | | | | 437,157,589 | |
| | | | | | | | | |
PREFERRED STOCK — 2.0% |
Consumer, Non-cyclical — 0.5% |
Pharmaceuticals — 0.5% |
Becton Dickinson and Co. Convertible 6.000% (b) | | | 37,343 | | | | 2,058,719 | |
Utilities — 1.5% |
Electric — 1.5% |
NextEra Energy, Inc. Convertible 5.279% | | | 29,376 | | | | 1,493,476 | |
Sempra Energy Convertible 6.000% | | | 23,490 | | | | 2,343,362 | |
Sempra Energy Convertible 6.750% (b) | | | 7,448 | | | | 772,581 | |
The Southern Co. Convertible 6.750% | | | 41,015 | | | | 2,128,679 | |
| | | | | | | | 6,738,098 | |
| | | | | | | | | |
TOTAL PREFERRED STOCK (Cost $8,444,467) | | | | | | | 8,796,817 | |
| | | | | | | | | |
TOTAL EQUITIES (Cost $362,848,008) | | | | | | | 445,954,406 | |
| | | | | | | | | |
WARRANTS — 0.0% |
Energy — 0.0% |
Oil & Gas — 0.0% |
Occidental Petroleum Corp., Expires 8/03/27 (a) | | | 10,803 | | | | 73,569 | |
| | | | | | | | | |
TOTAL WARRANTS (Cost $53,475) | | | | | | | 73,569 | |
| | | Principal
Amount | | | Value | |
BONDS & NOTES — 0.3% |
CORPORATE DEBT — 0.3% |
Insurance — 0.3% |
AXA SA Convertible 7.250% 5/15/21 (c) | | $ | 1,170,000 | | | $ | 1,333,069 | |
| | | | | | | | | |
TOTAL CORPORATE DEBT (Cost $1,172,094) | | | | | | | 1,333,069 | |
| | | | | | | | | |
TOTAL BONDS & NOTES (Cost $1,172,094) | | | | | | | 1,333,069 | |
| | | Number of
Shares | | | | | |
MUTUAL FUNDS — 0.6% |
Diversified Financial Services — 0.6% |
State Street Navigator Securities Lending Prime Portfolio (d) | | | 2,861,044 | | | | 2,861,044 | |
| | | | | | | | | |
TOTAL MUTUAL FUNDS (Cost $2,861,044) | | | | | | | 2,861,044 | |
| | | | | | | | | |
TOTAL LONG-TERM INVESTMENTS (Cost $366,934,621) | | | | | | | 450,222,088 | |
SHORT-TERM INVESTMENTS — 0.5% |
Mutual Fund — 0.0% |
T. Rowe Price Government Reserve Investment Fund | | | 1,075 | | | | 1,075 | |
| | | Principal
Amount | | | | | |
Repurchase Agreement — 0.5% |
Fixed Income Clearing Corp., Repurchase Agreement, dated 12/31/20, 0.000%, due 1/04/21 (e) | | $ | 2,144,321 | | | | 2,144,321 | |
| | | | | | | | | |
TOTAL SHORT-TERM INVESTMENTS (Cost $2,145,396) | | | | | | | 2,145,396 | |
| | | | | | | | | |
TOTAL INVESTMENTS — 101.0% (Cost $369,080,017) (f) | | | | | | | 452,367,484 | |
| | | | | | | | | |
Other Assets/(Liabilities) — (1.0)% | | | | | | | (4,315,013 | ) |
| | | | | | | | | |
NET ASSETS — 100.0% | | | | | | $ | 448,052,471 | |
Abbreviation Legend
ADR | American Depositary Receipt |
The accompanying notes are an integral part of the financial statements.
103
MML Equity Income Fund – Portfolio of Investments (Continued) |
Notes to Portfolio of Investments
Percentages are stated as a percent of net assets.
(a) | Non-income producing security. |
(b) | Denotes all or a portion of security on loan. The total value of securities on loan as of December 31, 2020, was $4,667,160 or 1.04% of net assets. Total securities on loan may be less than the amounts identified in the Portfolio of Investments. The Fund received $1,853,854 of non-cash collateral (U.S. Treasury and/or Agency obligations) related to securities lending activity. This amount is not reflected on either the Portfolio of Investments or the Statement of Assets and Liabilities. (Note 2). |
(c) | Security is exempt from registration under Regulation S or Rule 144A of the Securities Act of 1933. These securities are considered restricted and may be resold in transactions exempt from registration. At December 31, 2020, the aggregate market value of these securities amounted to $1,333,069 or 0.30% of net assets. |
(d) | Represents investment of security lending cash collateral. (Note 2). |
(e) | Maturity value of $2,144,321. Collateralized by U.S. Government Agency obligations with a rate of 0.000%, maturity date of 12/30/21, and an aggregate market value, including accrued interest, of $2,187,253. |
(f) | See Note 6 for aggregate cost for federal tax purposes. |
The accompanying notes are an integral part of the financial statements.
104
MML Equity Index Fund – Portfolio of Investments |
December 31, 2020 |
| | | Number of
Shares | | | Value | |
EQUITIES — 99.5% |
COMMON STOCK — 99.5% |
Basic Materials — 2.1% |
Chemicals — 1.7% |
Air Products & Chemicals, Inc. | | | 4,536 | | | $ | 1,239,326 | |
Albemarle Corp. | | | 2,177 | | | | 321,151 | |
Celanese Corp. | | | 2,391 | | | | 310,687 | |
CF Industries Holdings, Inc. | | | 4,444 | | | | 172,027 | |
Dow, Inc. | | | 15,197 | | | | 843,434 | |
DuPont de Nemours, Inc. | | | 15,051 | | | | 1,070,277 | |
Eastman Chemical Co. | | | 2,766 | | | | 277,374 | |
Ecolab, Inc. | | | 5,098 | | | | 1,103,003 | |
FMC Corp. | | | 2,652 | | | | 304,794 | |
International Flavors & Fragrances, Inc. (a) | | | 2,180 | | | | 237,271 | |
Linde PLC | | | 10,771 | | | | 2,838,266 | |
LyondellBasell Industries NV Class A | | | 5,268 | | | | 482,865 | |
The Mosaic Co. | | | 7,173 | | | | 165,051 | |
PPG Industries, Inc. | | | 4,842 | | | | 698,313 | |
The Sherwin-Williams Co. | | | 1,678 | | | | 1,233,179 | |
| | | | | | | | 11,297,018 | |
Forest Products & Paper — 0.1% |
International Paper Co. | | | 8,054 | | | | 400,445 | |
Iron & Steel — 0.1% |
Nucor Corp. | | | 6,186 | | | | 329,033 | |
Mining — 0.2% |
Freeport-McMoRan, Inc. | | | 29,798 | | | | 775,344 | |
Newmont Corp. | | | 16,483 | | | | 987,167 | |
| | | | | | | | 1,762,511 | |
| | | | | | | | 13,789,007 | |
Communications — 16.2% |
Advertising — 0.1% |
The Interpublic Group of Cos., Inc. | | | 8,077 | | | | 189,971 | |
Omnicom Group, Inc. | | | 4,380 | | | | 273,181 | |
| | | | | | | | 463,152 | |
Internet — 11.3% |
Alphabet, Inc. Class A (b) | | | 6,167 | | | | 10,808,531 | |
Alphabet, Inc. Class C (b) | | | 5,957 | | | | 10,435,949 | |
Amazon.com, Inc. (b) | | | 8,750 | | | | 28,498,137 | |
Booking Holdings, Inc. (b) | | | 840 | | | | 1,870,907 | |
CDW Corp. | | | 2,930 | | | | 386,145 | |
eBay, Inc. | | | 13,434 | | | | 675,058 | |
Etsy, Inc. (b) | | | 2,587 | | | | 460,253 | |
Expedia Group, Inc. | | | 2,784 | | | | 368,602 | |
F5 Networks, Inc. (b) | | | 1,273 | | | | 223,972 | |
Facebook, Inc. Class A (b) | | | 49,321 | | | | 13,472,524 | |
Netflix, Inc. (b) | | | 9,064 | | | | 4,901,177 | |
| | | Number of
Shares | | | Value | |
NortonLifeLock, Inc. | | | 12,053 | | | $ | 250,461 | |
Twitter, Inc. (b) | | | 16,317 | | | | 883,566 | |
VeriSign, Inc. (b) | | | 2,061 | | | | 446,000 | |
| | | | | | | | 73,681,282 | |
Media — 2.3% |
Charter Communications, Inc. Class A (b) | | | 2,993 | | | | 1,980,019 | |
Comcast Corp. Class A | | | 93,650 | | | | 4,907,260 | |
Discovery, Inc. Class A (a) (b) | | | 3,350 | | | | 100,802 | |
Discovery, Inc. Class C (b) | | | 5,974 | | | | 156,459 | |
DISH Network Corp. Class A (b) | | | 5,124 | | | | 165,710 | |
Fox Corp. Class A | | | 6,856 | | | | 199,647 | |
Fox Corp. Class B (b) | | | 3,218 | | | | 92,936 | |
News Corp. Class A | | | 8,119 | | | | 145,898 | |
News Corp. Class B | | | 2,495 | | | | 44,336 | |
ViacomCBS, Inc. Class B | | | 11,567 | | | | 430,986 | |
The Walt Disney Co. (b) | | | 37,143 | | | | 6,729,569 | |
| | | | | | | | 14,953,622 | |
Telecommunications — 2.5% |
Arista Networks, Inc. (b) | | | 1,117 | | | | 324,567 | |
AT&T, Inc. | | | 146,188 | | | | 4,204,367 | |
CenturyLink, Inc. | | | 20,173 | | | | 196,687 | |
Cisco Systems, Inc. | | | 86,695 | | | | 3,879,601 | |
Corning, Inc. | | | 15,659 | | | | 563,724 | |
Juniper Networks, Inc. | | | 6,884 | | | | 154,959 | |
Motorola Solutions, Inc. | | | 3,475 | | | | 590,958 | |
T-Mobile US, Inc. (b) | | | 11,969 | | | | 1,614,019 | |
Verizon Communications, Inc. | | | 84,905 | | | | 4,988,169 | |
| | | | | | | | 16,517,051 | |
| | | | | | | | 105,615,107 | |
Consumer, Cyclical — 9.7% |
Airlines — 0.3% |
Alaska Air Group, Inc. | | | 2,591 | | | | 134,732 | |
American Airlines Group, Inc. (a) | | | 12,510 | | | | 197,283 | |
Delta Air Lines, Inc. | | | 13,036 | | | | 524,177 | |
Southwest Airlines Co. | | | 12,075 | | | | 562,816 | |
United Airlines Holdings, Inc. (b) | | | 6,035 | | | | 261,014 | |
| | | | | | | | 1,680,022 | |
Apparel — 0.8% |
Hanesbrands, Inc. | | | 7,306 | | | | 106,522 | |
NIKE, Inc. Class B | | | 25,734 | | | | 3,640,589 | |
PVH Corp. | | | 1,487 | | | | 139,614 | |
Ralph Lauren Corp. | | | 996 | | | | 103,325 | |
Tapestry, Inc. | | | 5,790 | | | | 179,953 | |
Under Armour, Inc. Class A (b) | | | 3,793 | | | | 65,126 | |
Under Armour, Inc. Class C (b) | | | 4,186 | | | | 62,288 | |
The accompanying notes are an integral part of the financial statements.
105
MML Equity Index Fund – Portfolio of Investments (Continued) |
| | | Number of
Shares | | | Value | |
VF Corp. | | | 6,544 | | | $ | 558,923 | |
| | | | | | | | 4,856,340 | |
Auto Manufacturers — 2.2% |
Cummins, Inc. | | | 3,037 | | | | 689,703 | |
Ford Motor Co. | | | 80,084 | | | | 703,938 | |
General Motors Co. | | | 25,819 | | | | 1,075,103 | |
PACCAR, Inc. | | | 7,109 | | | | 613,365 | |
Tesla, Inc. (b) | | | 15,558 | | | | 10,978,814 | |
| | | | | | | | 14,060,923 | |
Auto Parts & Equipment — 0.1% |
Aptiv PLC | | | 5,533 | | | | 720,895 | |
BorgWarner, Inc. | | | 5,085 | | | | 196,484 | |
| | | | | | | | 917,379 | |
Distribution & Wholesale — 0.3% |
Copart, Inc. (b) | | | 4,259 | | | | 541,958 | |
Fastenal Co. | | | 11,784 | | | | 575,413 | |
LKQ Corp. (b) | | | 5,819 | | | | 205,061 | |
Pool Corp. | | | 820 | | | | 305,450 | |
W.W. Grainger, Inc. | | | 925 | | | | 377,714 | |
| | | | | | | | 2,005,596 | |
Entertainment — 0.0% |
Live Nation Entertainment, Inc. (b) | | | 2,954 | | | | 217,060 | |
Home Builders — 0.2% |
D.R. Horton, Inc. | | | 6,804 | | | | 468,932 | |
Lennar Corp. Class A | | | 5,641 | | | | 430,013 | |
NVR, Inc. (b) | | | 72 | | | | 293,750 | |
PulteGroup, Inc. | | | 5,457 | | | | 235,306 | |
| | | | | | | | 1,428,001 | |
Home Furnishing — 0.1% |
Leggett & Platt, Inc. | | | 2,775 | | | | 122,932 | |
Whirlpool Corp. | | | 1,294 | | | | 233,554 | |
| | | | | | | | 356,486 | |
Housewares — 0.0% |
Newell Brands, Inc. | | | 7,847 | | | | 166,592 | |
Leisure Time — 0.1% |
Carnival Corp. | | | 15,217 | | | | 329,600 | |
Norwegian Cruise Line Holdings Ltd. (b) | | | 6,570 | | | | 167,075 | |
Royal Caribbean Cruises Ltd. | | | 3,808 | | | | 284,420 | |
| | | | | | | | 781,095 | |
Lodging — 0.4% |
Hilton Worldwide Holdings, Inc. | | | 5,685 | | | | 632,513 | |
Las Vegas Sands Corp. | | | 6,734 | | | | 401,347 | |
Marriott International, Inc. Class A | | | 5,450 | | | | 718,964 | |
MGM Resorts International | | | 8,388 | | | | 264,306 | |
Wynn Resorts Ltd. | | | 1,986 | | | | 224,080 | |
| | | | | | | | 2,241,210 | |
| | | Number of
Shares | | | Value | |
Retail — 5.2% |
Advance Auto Parts, Inc. | | | 1,388 | | | $ | 218,624 | |
AutoZone, Inc. (b) | | | 475 | | | | 563,084 | |
Best Buy Co., Inc. | | | 4,722 | | | | 471,208 | |
CarMax, Inc. (b) | | | 3,392 | | | | 320,408 | |
Chipotle Mexican Grill, Inc. (b) | | | 574 | | | | 795,972 | |
Costco Wholesale Corp. | | | 9,056 | | | | 3,412,120 | |
Darden Restaurants, Inc. | | | 2,663 | | | | 317,217 | |
Dollar General Corp. | | | 5,027 | | | | 1,057,178 | |
Dollar Tree, Inc. (b) | | | 4,825 | | | | 521,293 | |
Domino’s Pizza, Inc. | | | 806 | | | | 309,069 | |
The Gap, Inc. | | | 4,354 | | | | 87,907 | |
Genuine Parts Co. | | | 2,945 | | | | 295,766 | |
The Home Depot, Inc. | | | 22,087 | | | | 5,866,749 | |
L Brands, Inc. | | | 4,856 | | | | 180,595 | |
Lowe’s Cos., Inc. | | | 15,029 | | | | 2,412,305 | |
McDonald’s Corp. | | | 15,293 | | | | 3,281,572 | |
O’Reilly Automotive, Inc. (b) | | | 1,484 | | | | 671,614 | |
Ross Stores, Inc. | | | 7,299 | | | | 896,390 | |
Starbucks Corp. | | | 24,092 | | | | 2,577,362 | |
Target Corp. | | | 10,274 | | | | 1,813,669 | |
Tiffany & Co. | | | 2,210 | | | | 290,505 | |
The TJX Cos., Inc. | | | 24,631 | | | | 1,682,051 | |
Tractor Supply Co. | | | 2,383 | | | | 335,002 | |
Ulta Beauty, Inc. (b) | | | 1,153 | | | | 331,095 | |
Walgreens Boots Alliance, Inc. | | | 14,732 | | | | 587,512 | |
Walmart, Inc. | | | 28,455 | | | | 4,101,788 | |
Yum! Brands, Inc. | | | 6,191 | | | | 672,095 | |
| | | | | | | | 34,070,150 | |
Textiles — 0.0% |
Mohawk Industries, Inc. (b) | | | 1,217 | | | | 171,536 | |
Toys, Games & Hobbies — 0.0% |
Hasbro, Inc. | | | 2,597 | | | | 242,923 | |
| | | | | | | | 63,195,313 | |
Consumer, Non-cyclical — 20.8% |
Agriculture — 0.7% |
Altria Group, Inc. | | | 38,116 | | | | 1,562,756 | |
Archer-Daniels-Midland Co. | | | 11,402 | | | | 574,775 | |
Philip Morris International, Inc. | | | 31,951 | | | | 2,645,223 | |
| | | | | | | | 4,782,754 | |
Beverages — 1.6% |
Brown-Forman Corp. Class B | | | 3,734 | | | | 296,592 | |
The Coca-Cola Co. | | | 79,348 | | | | 4,351,444 | |
Constellation Brands, Inc. Class A | | | 3,474 | | | | 760,980 | |
Molson Coors Beverage Co. Class B | | | 3,905 | | | | 176,467 | |
Monster Beverage Corp. (b) | | | 7,582 | | | | 701,183 | |
PepsiCo, Inc. | | | 28,362 | | | | 4,206,085 | |
| | | | | | | | 10,492,751 | |
The accompanying notes are an integral part of the financial statements.
106
MML Equity Index Fund – Portfolio of Investments (Continued) |
| | | Number of
Shares | | | Value | |
Biotechnology — 1.6% |
Alexion Pharmaceuticals, Inc. (b) | | | 4,491 | | | $ | 701,674 | |
Amgen, Inc. | | | 11,947 | | | | 2,746,854 | |
Bio-Rad Laboratories, Inc. Class A (b) | | | 445 | | | | 259,408 | |
Biogen, Inc. (b) | | | 3,157 | | | | 773,023 | |
Corteva, Inc. | | | 15,276 | | | | 591,487 | |
Gilead Sciences, Inc. | | | 25,724 | | | | 1,498,680 | |
Illumina, Inc. (b) | | | 2,996 | | | | 1,108,520 | |
Incyte Corp. (b) | | | 3,811 | | | | 331,481 | |
Regeneron Pharmaceuticals, Inc. (b) | | | 2,151 | | | | 1,039,170 | |
Vertex Pharmaceuticals, Inc. (b) | | | 5,336 | | | | 1,261,110 | |
| | | | | | | | 10,311,407 | |
Commercial Services — 2.4% |
Automatic Data Processing, Inc. | | | 8,798 | | | | 1,550,208 | |
Cintas Corp. | | | 1,810 | | | | 639,763 | |
Equifax, Inc. | | | 2,498 | | | | 481,714 | |
FleetCor Technologies, Inc. (b) | | | 1,709 | | | | 466,266 | |
Gartner, Inc. (b) | | | 1,824 | | | | 292,187 | |
Global Payments, Inc. | | | 6,139 | | | | 1,322,463 | |
IHS Markit Ltd. | | | 7,641 | | | | 686,391 | |
MarketAxess Holdings, Inc. | | | 779 | | | | 444,466 | |
Moody’s Corp. | | | 3,316 | | | | 962,436 | |
Nielsen Holdings PLC | | | 7,469 | | | | 155,878 | |
PayPal Holdings, Inc. (b) | | | 24,042 | | | | 5,630,636 | |
Quanta Services, Inc. | | | 2,827 | | | | 203,601 | |
Robert Half International, Inc. | | | 2,384 | | | | 148,952 | |
Rollins, Inc. | | | 4,603 | | | | 179,839 | |
S&P Global, Inc. | | | 4,937 | | | | 1,622,940 | |
United Rentals, Inc. (b) | | | 1,476 | | | | 342,299 | |
Verisk Analytics, Inc. | | | 3,333 | | | | 691,898 | |
| | | | | | | | 15,821,937 | |
Cosmetics & Personal Care — 1.5% |
Colgate-Palmolive Co. | | | 17,592 | | | | 1,504,292 | |
The Estee Lauder Cos., Inc. Class A | | | 4,648 | | | | 1,237,251 | |
The Procter & Gamble Co. | | | 50,888 | | | | 7,080,556 | |
| | | | | | | | 9,822,099 | |
Foods — 1.1% |
Campbell Soup Co. | | | 4,213 | | | | 203,699 | |
Conagra Brands, Inc. | | | 10,017 | | | | 363,216 | |
General Mills, Inc. | | | 12,545 | | | | 737,646 | |
The Hershey Co. | | | 3,025 | | | | 460,798 | |
Hormel Foods Corp. | | | 5,738 | | | | 267,448 | |
The J.M. Smucker Co. | | | 2,330 | | | | 269,348 | |
Kellogg Co. | | | 5,201 | | | | 323,658 | |
The Kraft Heinz Co. | | | 13,287 | | | | 460,527 | |
The Kroger Co. | | | 15,889 | | | | 504,635 | |
Lamb Weston Holdings, Inc. | | | 3,023 | | | | 238,031 | |
McCormick & Co., Inc. | | | 5,100 | | | | 487,560 | |
| | | Number of
Shares | | | Value | |
Mondelez International, Inc. Class A | | | 29,351 | | | $ | 1,716,153 | |
Sysco Corp. | | | 10,444 | | | | 775,572 | |
Tyson Foods, Inc. Class A | | | 6,017 | | | | 387,736 | |
| | | | | | | | 7,196,027 | |
Health Care – Products — 4.0% |
Abbott Laboratories | | | 36,374 | | | | 3,982,589 | |
ABIOMED, Inc. (b) | | | 937 | | | | 303,775 | |
Align Technology, Inc. (b) | | | 1,472 | | | | 786,607 | |
Baxter International, Inc. | | | 10,473 | | | | 840,354 | |
Boston Scientific Corp. (b) | | | 29,358 | | | | 1,055,420 | |
The Cooper Cos., Inc. | | | 1,006 | | | | 365,500 | |
Danaher Corp. | | | 12,976 | | | | 2,882,489 | |
Dentsply Sirona, Inc. | | | 4,447 | | | | 232,845 | |
Edwards Lifesciences Corp. (b) | | | 12,788 | | | | 1,166,649 | |
Hologic, Inc. (b) | | | 5,272 | | | | 383,960 | |
IDEXX Laboratories, Inc. (b) | | | 1,751 | | | | 875,272 | |
Intuitive Surgical, Inc. (b) | | | 2,412 | | | | 1,973,257 | |
Medtronic PLC | | | 27,621 | | | | 3,235,524 | |
ResMed, Inc. | | | 2,974 | | | | 632,154 | |
Steris PLC | | | 1,742 | | | | 330,179 | |
Stryker Corp. | | | 6,708 | | | | 1,643,728 | |
Teleflex, Inc. | | | 955 | | | | 393,049 | |
Thermo Fisher Scientific, Inc. | | | 8,133 | | | | 3,788,189 | |
Varian Medical Systems, Inc. (b) | | | 1,868 | | | | 326,919 | |
West Pharmaceutical Services, Inc. | | | 1,517 | | | | 429,781 | |
Zimmer Biomet Holdings, Inc. | | | 4,248 | | | | 654,574 | |
| | | | | | | | 26,282,814 | |
Health Care – Services — 2.1% |
Anthem, Inc. | | | 5,103 | | | | 1,638,522 | |
Catalent, Inc. (b) | | | 3,364 | | | | 350,091 | |
Centene Corp. (b) | | | 11,893 | | | | 713,937 | |
DaVita, Inc. (b) | | | 1,517 | | | | 178,096 | |
HCA Healthcare, Inc. | | | 5,414 | | | | 890,386 | |
Humana, Inc. | | | 2,714 | | | | 1,113,473 | |
IQVIA Holdings, Inc. (b) | | | 3,933 | | | | 704,676 | |
Laboratory Corp. of America Holdings (b) | | | 1,998 | | | | 406,693 | |
Quest Diagnostics, Inc. | | | 2,752 | | | | 327,956 | |
UnitedHealth Group, Inc. | | | 19,473 | | | | 6,828,792 | |
Universal Health Services, Inc. Class B | | | 1,590 | | | | 218,625 | |
| | | | | | | | 13,371,247 | |
Household Products & Wares — 0.3% |
Avery Dennison Corp. | | | 1,704 | | | | 264,307 | |
Church & Dwight Co., Inc. | | | 5,090 | | | | 444,001 | |
The Clorox Co. | | | 2,587 | | | | 522,367 | |
Kimberly-Clark Corp. | | | 6,981 | | | | 941,248 | |
| | | | | | | | 2,171,923 | |
The accompanying notes are an integral part of the financial statements.
107
MML Equity Index Fund – Portfolio of Investments (Continued) |
| | | Number of
Shares | | | Value | |
Pharmaceuticals — 5.5% |
AbbVie, Inc. | | | 36,222 | | | $ | 3,881,187 | |
AmerisourceBergen Corp. | | | 3,008 | | | | 294,062 | |
Becton Dickinson and Co. | | | 5,952 | | | | 1,489,310 | |
Bristol-Myers Squibb Co. | | | 46,356 | | | | 2,875,463 | |
Cardinal Health, Inc. | | | 5,991 | | | | 320,878 | |
Cigna Corp. | | | 7,410 | | | | 1,542,614 | |
CVS Health Corp. | | | 26,857 | | | | 1,834,333 | |
DexCom, Inc. (b) | | | 1,970 | | | | 728,348 | |
Eli Lilly and Co. | | | 16,293 | | | | 2,750,910 | |
Henry Schein, Inc. (b) | | | 2,926 | | | | 195,632 | |
Johnson & Johnson | | | 54,023 | | | | 8,502,140 | |
McKesson Corp. | | | 3,291 | | | | 572,371 | |
Merck & Co., Inc. | | | 51,914 | | | | 4,246,565 | |
Perrigo Co. PLC | | | 2,834 | | | | 126,737 | |
Pfizer, Inc. | | | 114,047 | | | | 4,198,070 | |
Viatris, Inc. (b) | | | 24,727 | | | | 463,384 | |
Zoetis, Inc. | | | 9,750 | | | | 1,613,625 | |
| | | | | | | | 35,635,629 | |
| | | | | | | | 135,888,588 | |
Energy — 2.3% |
Oil & Gas — 1.9% |
Apache Corp. | | | 7,929 | | | | 112,512 | |
Cabot Oil & Gas Corp. | | | 8,296 | | | | 135,059 | |
Chevron Corp. | | | 39,492 | | | | 3,335,099 | |
Concho Resources, Inc. | | | 3,997 | | | | 233,225 | |
ConocoPhillips | | | 21,875 | | | | 874,781 | |
Devon Energy Corp. | | | 8,013 | | | | 126,685 | |
Diamondback Energy, Inc. | | | 3,207 | | | | 155,219 | |
EOG Resources, Inc. | | | 11,932 | | | | 595,049 | |
Exxon Mobil Corp. | | | 86,746 | | | | 3,575,670 | |
Hess Corp. | | | 5,591 | | | | 295,149 | |
HollyFrontier Corp. | | | 3,082 | | | | 79,670 | |
Marathon Oil Corp. | | | 16,480 | | | | 109,922 | |
Marathon Petroleum Corp. | | | 13,333 | | | | 551,453 | |
Occidental Petroleum Corp. | | | 17,149 | | | | 296,849 | |
Phillips 66 | | | 8,955 | | | | 626,313 | |
Pioneer Natural Resources Co. | | | 3,363 | | | | 383,012 | |
Valero Energy Corp. | | | 8,357 | | | | 472,755 | |
| | | | | | | | 11,958,422 | |
Oil & Gas Services — 0.2% |
Baker Hughes Co. | | | 14,016 | | | | 292,234 | |
Halliburton Co. | | | 18,270 | | | | 345,303 | |
Nov, Inc. | | | 8,121 | | | | 111,501 | |
Schlumberger NV | | | 28,473 | | | | 621,566 | |
TechnipFMC PLC | | | 8,761 | | | | 82,353 | |
| | | | | | | | 1,452,957 | |
| | | Number of
Shares | | | Value | |
Pipelines — 0.2% |
Kinder Morgan, Inc. | | | 39,888 | | | $ | 545,269 | |
ONEOK, Inc. | | | 9,109 | | | | 349,603 | |
The Williams Cos., Inc. | | | 24,890 | | | | 499,045 | |
| | | | | | | | 1,393,917 | |
| | | | | | | | 14,805,296 | |
Financial — 14.4% |
Banks — 4.7% |
Bank of America Corp. | | | 156,196 | | | | 4,734,301 | |
The Bank of New York Mellon Corp. | | | 16,719 | | | | 709,554 | |
Citigroup, Inc. | | | 42,712 | | | | 2,633,622 | |
Citizens Financial Group, Inc. | | | 8,720 | | | | 311,827 | |
Comerica, Inc. | | | 2,824 | | | | 157,749 | |
Fifth Third Bancorp | | | 14,577 | | | | 401,888 | |
First Republic Bank | | | 3,583 | | | | 526,450 | |
The Goldman Sachs Group, Inc. | | | 7,062 | | | | 1,862,320 | |
Huntington Bancshares, Inc. | | | 20,721 | | | | 261,706 | |
JP Morgan Chase & Co. | | | 62,552 | | | | 7,948,483 | |
KeyCorp | | | 19,909 | | | | 326,707 | |
M&T Bank Corp. | | | 2,622 | | | | 333,781 | |
Morgan Stanley | | | 29,335 | | | | 2,010,328 | |
Northern Trust Corp. | | | 4,268 | | | | 397,522 | |
The PNC Financial Services Group, Inc. | | | 8,696 | | | | 1,295,704 | |
Regions Financial Corp. | | | 19,620 | | | | 316,274 | |
State Street Corp. | | | 7,234 | | | | 526,490 | |
SVB Financial Group (b) | | | 1,062 | | | | 411,875 | |
Truist Financial Corp. | | | 27,641 | | | | 1,324,833 | |
US Bancorp | | | 28,107 | | | | 1,309,505 | |
Wells Fargo & Co. | | | 84,814 | | | | 2,559,686 | |
Zions Bancorp NA | | | 3,422 | | | | 148,652 | |
| | | | | | | | 30,509,257 | |
Diversified Financial Services — 4.0% |
American Express Co. | | | 13,380 | | | | 1,617,776 | |
Ameriprise Financial, Inc. | | | 2,421 | | | | 470,473 | |
BlackRock, Inc. | | | 2,912 | | | | 2,101,124 | |
Capital One Financial Corp. | | | 9,379 | | | | 927,114 | |
Cboe Global Markets, Inc. | | | 2,208 | | | | 205,609 | |
The Charles Schwab Corp. | | | 30,611 | | | | 1,623,607 | |
CME Group, Inc. | | | 7,367 | | | | 1,341,162 | |
Discover Financial Services | | | 6,284 | | | | 568,891 | |
Franklin Resources, Inc. | | | 5,562 | | | | 138,994 | |
Intercontinental Exchange, Inc. | | | 11,527 | | | | 1,328,948 | |
Invesco Ltd. | | | 7,622 | | | | 132,851 | |
Mastercard, Inc. Class A | | | 18,050 | | | | 6,442,767 | |
Nasdaq, Inc. | | | 2,355 | | | | 312,603 | |
Raymond James Financial, Inc. | | | 2,486 | | | | 237,836 | |
Synchrony Financial | | | 11,124 | | | | 386,114 | |
The accompanying notes are an integral part of the financial statements.
108
MML Equity Index Fund – Portfolio of Investments (Continued) |
| | | Number of
Shares | | | Value | |
T. Rowe Price Group, Inc. | | | 4,650 | | | $ | 703,964 | |
Visa, Inc. Class A | | | 34,793 | | | | 7,610,273 | |
The Western Union Co. | | | 8,419 | | | | 184,713 | |
| | | | | | | | 26,334,819 | |
Insurance — 3.3% |
Aflac, Inc. | | | 13,383 | | | | 595,142 | |
The Allstate Corp. | | | 6,242 | | | | 686,183 | |
American International Group, Inc. | | | 17,652 | | | | 668,305 | |
Aon PLC Class A | | | 4,692 | | | | 991,279 | |
Arthur J Gallagher & Co. | | | 3,946 | | | | 488,160 | |
Assurant, Inc. | | | 1,215 | | | | 165,507 | |
Berkshire Hathaway, Inc. Class B (b) | | | 39,935 | | | | 9,259,728 | |
Chubb Ltd. | | | 9,261 | | | | 1,425,453 | |
Cincinnati Financial Corp. | | | 3,052 | | | | 266,653 | |
Everest Re Group Ltd. | | | 830 | | | | 194,295 | |
Globe Life, Inc. | | | 1,972 | | | | 187,261 | |
The Hartford Financial Services Group, Inc. | | | 7,336 | | | | 359,317 | |
Lincoln National Corp. | | | 3,774 | | | | 189,870 | |
Loews Corp. | | | 4,781 | | | | 215,241 | |
Marsh & McLennan Cos., Inc. | | | 10,414 | | | | 1,218,438 | |
MetLife, Inc. | | | 15,688 | | | | 736,552 | |
Principal Financial Group, Inc. | | | 5,201 | | | | 258,022 | |
The Progressive Corp. | | | 12,024 | | | | 1,188,933 | |
Prudential Financial, Inc. | | | 8,106 | | | | 632,835 | |
The Travelers Cos., Inc. | | | 5,196 | | | | 729,362 | |
Unum Group | | | 4,256 | | | | 97,633 | |
W.R. Berkley Corp. | | | 2,876 | | | | 191,024 | |
Willis Towers Watson PLC | | | 2,646 | | | | 557,459 | |
| | | | | | | | 21,302,652 | |
Real Estate — 0.1% |
CBRE Group, Inc. Class A (b) | | | 6,877 | | | | 431,326 | |
Real Estate Investment Trusts (REITS) — 2.3% |
Alexandria Real Estate Equities, Inc. | | | 2,542 | | | | 453,035 | |
American Tower Corp. | | | 9,114 | | | | 2,045,728 | |
AvalonBay Communities, Inc. | | | 2,857 | | | | 458,349 | |
Boston Properties, Inc. | | | 2,892 | | | | 273,381 | |
Crown Castle International Corp. | | | 8,849 | | | | 1,408,672 | |
Digital Realty Trust, Inc. | | | 5,748 | | | | 801,904 | |
Duke Realty Corp. | | | 7,584 | | | | 303,132 | |
Equinix, Inc. | | | 1,828 | | | | 1,305,521 | |
Equity Residential | | | 7,010 | | | | 415,553 | |
Essex Property Trust, Inc. | | | 1,334 | | | | 316,718 | |
Extra Space Storage, Inc. | | | 2,640 | | | | 305,870 | |
Federal Realty Investment Trust | | | 1,429 | | | | 121,636 | |
Healthpeak Properties, Inc. | | | 10,980 | | | | 331,925 | |
Host Hotels & Resorts, Inc. | | | 14,430 | | | | 211,111 | |
Iron Mountain, Inc. (a) | | | 5,885 | | | | 173,490 | |
| | | Number of
Shares | | | Value | |
Kimco Realty Corp. | | | 8,983 | | | $ | 134,835 | |
Mid-America Apartment Communities, Inc. | | | 2,333 | | | | 295,568 | |
Prologis, Inc. | | | 15,165 | | | | 1,511,344 | |
Public Storage | | | 3,121 | | | | 720,733 | |
Realty Income Corp. | | | 7,174 | | | | 446,008 | |
Regency Centers Corp. | | | 3,276 | | | | 149,353 | |
SBA Communications Corp. | | | 2,279 | | | | 642,974 | |
Simon Property Group, Inc. | | | 6,713 | | | | 572,485 | |
SL Green Realty Corp. (a) | | | 1,469 | | | | 87,523 | |
UDR, Inc. | | | 6,008 | | | | 230,887 | |
Ventas, Inc. | | | 7,662 | | | | 375,744 | |
Vornado Realty Trust | | | 3,243 | | | | 121,094 | |
Welltower, Inc. | | | 8,545 | | | | 552,178 | |
Weyerhaeuser Co. | | | 15,308 | | | | 513,277 | |
| | | | | | | | 15,280,028 | |
Savings & Loans — 0.0% |
People’s United Financial, Inc. | | | 8,919 | | | | 115,323 | |
| | | | | | | | 93,973,405 | |
Industrial — 8.2% |
Aerospace & Defense — 1.6% |
The Boeing Co. | | | 10,885 | | | | 2,330,043 | |
General Dynamics Corp. | | | 4,769 | | | | 709,722 | |
Howmet Aerospace, Inc. | | | 7,977 | | | | 227,664 | |
L3 Harris Technologies, Inc. | | | 4,311 | | | | 814,865 | |
Lockheed Martin Corp. | | | 5,052 | | | | 1,793,359 | |
Northrop Grumman Corp. | | | 3,182 | | | | 969,619 | |
Raytheon Technologies Corp. | | | 31,150 | | | | 2,227,536 | |
Teledyne Technologies, Inc. (b) | | | 754 | | | | 295,553 | |
TransDigm Group, Inc. (b) | | | 1,116 | | | | 690,637 | |
| | | | | | | | 10,058,998 | |
Building Materials — 0.4% |
Carrier Global Corp. | | | 16,716 | | | | 630,528 | |
Fortune Brands Home & Security, Inc. | | | 2,874 | | | | 246,359 | |
Johnson Controls International PLC | | | 14,853 | | | | 692,001 | |
Martin Marietta Materials, Inc. | | | 1,276 | | | | 362,346 | |
Masco Corp. | | | 5,351 | | | | 293,930 | |
Vulcan Materials Co. | | | 2,715 | | | | 402,662 | |
| | | | | | | | 2,627,826 | |
Electrical Components & Equipment — 0.2% |
AMETEK, Inc. | | | 4,711 | | | | 569,748 | |
Emerson Electric Co. | | | 12,258 | | | | 985,176 | |
| | | | | | | | 1,554,924 | |
Electronics — 1.4% |
Agilent Technologies, Inc. | | | 6,283 | | | | 744,473 | |
Allegion PLC | | | 1,872 | | | | 217,863 | |
Amphenol Corp. Class A | | | 6,133 | | | | 802,012 | |
FLIR Systems, Inc. | | | 2,754 | | | | 120,708 | |
The accompanying notes are an integral part of the financial statements.
109
MML Equity Index Fund – Portfolio of Investments (Continued) |
| | | Number of
Shares | | | Value | |
Fortive Corp. | | | 6,911 | | | $ | 489,437 | |
Garmin Ltd. | | | 3,050 | | | | 364,963 | |
Honeywell International, Inc. | | | 14,398 | | | | 3,062,454 | |
Keysight Technologies, Inc. (b) | | | 3,801 | | | | 502,074 | |
Mettler-Toledo International, Inc. (b) | | | 488 | | | | 556,164 | |
PerkinElmer, Inc. | | | 2,291 | | | | 328,758 | |
Roper Technologies, Inc. | | | 2,152 | | | | 927,706 | |
TE Connectivity Ltd. | | | 6,780 | | | | 820,855 | |
Vontier Corp. (b) | | | 2,717 | | | | 90,748 | |
Waters Corp. (b) | | | 1,267 | | | | 313,481 | |
| | | | | | | | 9,341,696 | |
Engineering & Construction — 0.1% |
Jacobs Engineering Group, Inc. | | | 2,660 | | | | 289,834 | |
Environmental Controls — 0.2% |
Pentair PLC | | | 3,450 | | | | 183,160 | |
Republic Services, Inc. | | | 4,312 | | | | 415,246 | |
Waste Management, Inc. | | | 7,975 | | | | 940,492 | |
| | | | | | | | 1,538,898 | |
Hand & Machine Tools — 0.1% |
Snap-on, Inc. | | | 1,103 | | | | 188,767 | |
Stanley Black & Decker, Inc. | | | 3,283 | | | | 586,213 | |
| | | | | | | | 774,980 | |
Machinery – Construction & Mining — 0.3% |
Caterpillar, Inc. | | | 11,147 | | | | 2,028,977 | |
Machinery – Diversified — 0.7% |
Deere & Co. | | | 6,431 | | | | 1,730,261 | |
Dover Corp. | | | 2,950 | | | | 372,438 | |
Flowserve Corp. | | | 2,723 | | | | 100,343 | |
IDEX Corp. | | | 1,546 | | | | 307,963 | |
Ingersoll Rand, Inc. (b) | | | 7,609 | | | | 346,666 | |
Otis Worldwide Corp. | | | 8,350 | | | | 564,042 | |
Rockwell Automation, Inc. | | | 2,382 | | | | 597,429 | |
Westinghouse Air Brake Technologies Corp. | | | 3,649 | | | | 267,107 | |
Xylem, Inc. | | | 3,694 | | | | 376,012 | |
| | | | | | | | 4,662,261 | |
Miscellaneous – Manufacturing — 1.2% |
3M Co. | | | 11,837 | | | | 2,068,989 | |
A.O. Smith Corp. | | | 2,817 | | | | 154,428 | |
Eaton Corp. PLC | | | 8,173 | | | | 981,904 | |
General Electric Co. | | | 179,712 | | | | 1,940,890 | |
Illinois Tool Works, Inc. | | | 5,913 | | | | 1,205,543 | |
Parker-Hannifin Corp. | | | 2,641 | | | | 719,435 | |
Textron, Inc. | | | 4,677 | | | | 226,039 | |
Trane Technologies PLC | | | 4,925 | | | | 714,913 | |
| | | | | | | | 8,012,141 | |
| | | Number of
Shares | | | Value | |
Packaging & Containers — 0.3% |
Amcor PLC | | | 32,153 | | | $ | 378,441 | |
Ball Corp. | | | 6,713 | | | | 625,517 | |
Packaging Corp. of America | | | 1,937 | | | | 267,132 | |
Sealed Air Corp. | | | 3,237 | | | | 148,222 | |
WestRock Co. | | | 5,399 | | | | 235,018 | |
| | | | | | | | 1,654,330 | |
Shipbuilding — 0.0% |
Huntington Ingalls Industries, Inc. | | | 841 | | | | 143,374 | |
Transportation — 1.7% |
C.H. Robinson Worldwide, Inc. | | | 2,806 | | | | 263,399 | |
CSX Corp. | | | 15,680 | | | | 1,422,960 | |
Expeditors International of Washington, Inc. | | | 3,490 | | | | 331,934 | |
FedEx Corp. | | | 4,955 | | | | 1,286,417 | |
J.B. Hunt Transport Services, Inc. | | | 1,734 | | | | 236,951 | |
Kansas City Southern | | | 1,917 | | | | 391,317 | |
Norfolk Southern Corp. | | | 5,206 | | | | 1,236,998 | |
Old Dominion Freight Line, Inc. | | | 1,970 | | | | 384,505 | |
Union Pacific Corp. | | | 13,821 | | | | 2,877,809 | |
United Parcel Service, Inc. Class B | | | 14,674 | | | | 2,471,101 | |
| | | | | | | | 10,903,391 | |
| | | | | | | | 53,591,630 | |
Technology — 23.1% |
Computers — 8.1% |
Accenture PLC Class A | | | 13,001 | | | | 3,395,991 | |
Apple, Inc. | | | 327,897 | | | | 43,508,653 | |
Cognizant Technology Solutions Corp. Class A | | | 10,967 | | | | 898,746 | |
DXC Technology Co. | | | 5,337 | | | | 137,428 | |
Fortinet, Inc. (b) | | | 2,757 | | | | 409,497 | |
Hewlett Packard Enterprise Co. | | | 26,285 | | | | 311,477 | |
HP, Inc. | | | 28,164 | | | | 692,553 | |
International Business Machines Corp. | | | 18,280 | | | | 2,301,086 | |
Leidos Holdings, Inc. | | | 2,732 | | | | 287,188 | |
NetApp, Inc. | | | 4,615 | | | | 305,697 | |
Seagate Technology PLC | | | 4,567 | | | | 283,885 | |
Western Digital Corp. | | | 6,292 | | | | 348,514 | |
| | | | | | | | 52,880,715 | |
Office & Business Equipment — 0.1% |
Xerox Holdings Corp. | | | 3,382 | | | | 78,428 | |
Zebra Technologies Corp. Class A (b) | | | 1,093 | | | | 420,073 | |
| | | | | | | | 498,501 | |
Semiconductors — 5.1% |
Advanced Micro Devices, Inc. (b) | | | 24,676 | | | | 2,263,036 | |
Analog Devices, Inc. | | | 7,580 | | | | 1,119,794 | |
Applied Materials, Inc. | | | 18,741 | | | | 1,617,348 | |
Broadcom, Inc. | | | 8,299 | | | | 3,633,717 | |
The accompanying notes are an integral part of the financial statements.
110
MML Equity Index Fund – Portfolio of Investments (Continued) |
| | | Number of
Shares | | | Value | |
Intel Corp. | | | 84,078 | | | $ | 4,188,766 | |
IPG Photonics Corp. (b) | | | 727 | | | | 162,695 | |
KLA Corp. | | | 3,169 | | | | 820,486 | |
Lam Research Corp. | | | 2,955 | | | | 1,395,558 | |
Maxim Integrated Products, Inc. | | | 5,482 | | | | 485,979 | |
Microchip Technology, Inc. | | | 5,338 | | | | 737,231 | |
Micron Technology, Inc. (b) | | | 22,840 | | | | 1,717,111 | |
NVIDIA Corp. | | | 12,700 | | | | 6,631,940 | |
Qorvo, Inc. (b) | | | 2,338 | | | | 388,739 | |
QUALCOMM, Inc. | | | 23,205 | | | | 3,535,050 | |
Skyworks Solutions, Inc. | | | 3,404 | | | | 520,404 | |
Teradyne, Inc. | | | 3,407 | | | | 408,465 | |
Texas Instruments, Inc. | | | 18,837 | | | | 3,091,717 | |
Xilinx, Inc. | | | 5,031 | | | | 713,245 | |
| | | | | | | | 33,431,281 | |
Software — 9.8% |
Activision Blizzard, Inc. | | | 15,860 | | | | 1,472,601 | |
Adobe, Inc. (b) | | | 9,845 | | | | 4,923,682 | |
Akamai Technologies, Inc. (b) | | | 3,338 | | | | 350,457 | |
ANSYS, Inc. (b) | | | 1,762 | | | | 641,016 | |
Autodesk, Inc. (b) | | | 4,512 | | | | 1,377,694 | |
Broadridge Financial Solutions, Inc. | | | 2,362 | | | | 361,858 | |
Cadence Design Systems, Inc. (b) | | | 5,724 | | | | 780,925 | |
Cerner Corp. | | | 6,287 | | | | 493,404 | |
Citrix Systems, Inc. | | | 2,526 | | | | 328,633 | |
Electronic Arts, Inc. | | | 5,953 | | | | 854,851 | |
Fidelity National Information Services, Inc. | | | 12,729 | | | | 1,800,644 | |
Fiserv, Inc. (b) | | | 11,796 | | | | 1,343,093 | |
Intuit, Inc. | | | 5,392 | | | | 2,048,151 | |
Jack Henry & Associates, Inc. | | | 1,564 | | | | 253,352 | |
Microsoft Corp. | | | 155,126 | | | | 34,503,125 | |
MSCI, Inc. | | | 1,702 | | | | 759,994 | |
Oracle Corp. | | | 38,925 | | | | 2,518,058 | |
Paychex, Inc. | | | 6,562 | | | | 611,447 | |
Paycom Software, Inc. (b) | | | 1,005 | | | | 454,511 | |
salesforce.com, Inc. (b) | | | 18,772 | | | | 4,177,333 | |
ServiceNow, Inc. (b) | | | 4,003 | | | | 2,203,371 | |
Synopsys, Inc. (b) | | | 3,134 | | | | 812,458 | |
Take-Two Interactive Software, Inc. (b) | | | 2,354 | | | | 489,138 | |
Tyler Technologies, Inc. (b) | | | 826 | | | | 360,566 | |
| | | | | | | | 63,920,362 | |
| | | | | | | | 150,730,859 | |
Utilities — 2.7% |
Electric — 2.5% |
AES Corp. | | | 13,608 | | | | 319,788 | |
Alliant Energy Corp. | | | 5,097 | | | | 262,648 | |
| | | Number of
Shares | | | Value | |
Ameren Corp. | | | 5,079 | | | $ | 396,467 | |
American Electric Power Co., Inc. | | | 10,190 | | | | 848,521 | |
CenterPoint Energy, Inc. | | | 11,101 | | | | 240,226 | |
CMS Energy Corp. | | | 5,875 | | | | 358,434 | |
Consolidated Edison, Inc. | | | 7,033 | | | | 508,275 | |
Dominion Energy, Inc. | | | 16,740 | | | | 1,258,848 | |
DTE Energy Co. | | | 3,963 | | | | 481,148 | |
Duke Energy Corp. | | | 15,107 | | | | 1,383,197 | |
Edison International | | | 7,756 | | | | 487,232 | |
Entergy Corp. | | | 4,101 | | | | 409,444 | |
Evergy, Inc. | | | 4,626 | | | | 256,789 | |
Eversource Energy | | | 7,038 | | | | 608,857 | |
Exelon Corp. | | | 20,013 | | | | 844,949 | |
FirstEnergy Corp. | | | 11,121 | | | | 340,414 | |
NextEra Energy, Inc. | | | 40,210 | | | | 3,102,202 | |
NRG Energy, Inc. | | | 5,073 | | | | 190,491 | |
Pinnacle West Capital Corp. | | | 2,340 | | | | 187,083 | |
PPL Corp. | | | 15,752 | | | | 444,206 | |
Public Service Enterprise Group, Inc. | | | 10,381 | | | | 605,212 | |
Sempra Energy | | | 5,913 | | | | 753,375 | |
The Southern Co. | | | 21,696 | | | | 1,332,785 | |
WEC Energy Group, Inc. | | | 6,475 | | | | 595,894 | |
Xcel Energy, Inc. | | | 10,789 | | | | 719,303 | |
| | | | | | | | 16,935,788 | |
Gas — 0.1% |
Atmos Energy Corp. | | | 2,567 | | | | 244,969 | |
NiSource, Inc. | | | 7,813 | | | | 179,230 | |
| | | | | | | | 424,199 | |
Water — 0.1% |
American Water Works Co., Inc. | | | 3,723 | | | | 571,369 | |
| | | | | | | | 17,931,356 | |
| | | | | | | | | |
TOTAL COMMON STOCK (Cost $357,808,118) | | | | | | | 649,520,561 | |
| | | | | | | | | |
TOTAL EQUITIES (Cost $357,808,118) | | | | | | | 649,520,561 | |
| |
MUTUAL FUNDS — 0.1% |
Diversified Financial Services — 0.1% |
State Street Navigator Securities Lending Prime Portfolio (c) | | | 257,366 | | | | 257,366 | |
| | | | | | | | | |
TOTAL MUTUAL FUNDS (Cost $257,366) | | | | | | | 257,366 | |
| | | | | | | | | |
TOTAL LONG-TERM INVESTMENTS (Cost $358,065,484) | | | | | | | 649,777,927 | |
The accompanying notes are an integral part of the financial statements.
111
MML Equity Index Fund – Portfolio of Investments (Continued) |
| | | Principal
Amount | | | Value | |
| SHORT-TERM INVESTMENTS — 0.5% |
| Repurchase Agreement — 0.4% |
| Fixed Income Clearing Corp., Repurchase Agreement, dated 12/31/20, 0.000%, due 1/04/21 (d) | | $ | 2,861,066 | | | $ | 2,861,066 | |
| U.S. Treasury Bill — 0.1% |
| U.S. Treasury Bill | | | | | | | | |
| 0.000%1/28/21(e) | | | 860,000 | | | | 859,968 | |
| | | | | | | | | |
| TOTAL SHORT-TERM INVESTMENTS (Cost $3,720,996) | | | | | | | 3,721,034 | |
| TOTAL INVESTMENTS — 100.1% (Cost $361,786,480) (f) | | | | | | | 653,498,961 | |
| Other Assets/(Liabilities) — (0.1)% | | | | | | | (657,181 | ) |
| NET ASSETS — 100.0% | | | | | | $ | 652,841,780 | |
Notes to Portfolio of Investments
Percentages are stated as a percent of net assets.
(a) | Denotes all or a portion of security on loan. The total value of securities on loan as of December 31, 2020, was $689,696 or 0.11% of net assets. Total securities on loan may be less than the amounts identified in the Portfolio of Investments. The Fund received $448,614 of non-cash collateral (U.S. Treasury and/or Agency obligations) related to securities lending activity. This amount is not reflected on either the Portfolio of Investments or the Statement of Assets and Liabilities. (Note 2). |
(b) | Non-income producing security. |
(c) | Represents investment of security lending cash collateral. (Note 2). |
(d) | Maturity value of $2,861,066. Collateralized by U.S. Government Agency obligations with a rate of 0.000%, maturity date of 12/30/21, and an aggregate market value, including accrued interest, of $2,918,302. |
(e) | A portion of this security is pledged/held as collateral for open derivatives. (Note 2). |
(f) | See Note 6 for aggregate cost for federal tax purposes. |
Futures contracts
| | Expiration
Date | | | Number of
Contracts | | | Notional
Amount | | | Value/ Net
Unrealized
Appreciation/
(Depreciation) | |
Long | | | | | | | | | | | | | | | | |
S&P 500 E Mini Index | | | 3/19/21 | | | | 22 | | | $ | 4,018,864 | | | $ | 104,816 | |
The accompanying notes are an integral part of the financial statements.
112
MML Focused Equity Fund – Portfolio of Investments |
December 31, 2020 |
| | | Number of
Shares | | | Value | |
EQUITIES — 98.5% |
COMMON STOCK — 98.5% |
Basic Materials — 6.6% |
Chemicals — 6.6% |
Ecolab, Inc. | | | 42,778 | | | $ | 9,255,448 | |
Linde PLC | | | 39,112 | | | | 10,306,403 | |
| | | | | | | | 19,561,851 | |
Consumer, Cyclical — 14.9% |
Apparel — 4.4% |
NIKE, Inc. Class B | | | 92,477 | | | | 13,082,721 | |
Retail — 10.5% |
McDonald’s Corp. | | | 66,723 | | | | 14,317,421 | |
The TJX Cos., Inc. | | | 244,546 | | | | 16,700,047 | |
| | | | | | | | 31,017,468 | |
| | | | | | | | 44,100,189 | |
Consumer, Non-cyclical — 40.4% |
Beverages — 14.2% |
The Coca-Cola Co. | | | 273,455 | | | | 14,996,272 | |
Diageo PLC | | | 346,089 | | | | 13,677,819 | |
PepsiCo, Inc. | | | 91,365 | | | | 13,549,430 | |
| | | | | | | | 42,223,521 | |
Cosmetics & Personal Care — 6.4% |
Colgate-Palmolive Co. | | | 159,355 | | | | 13,626,446 | |
The Procter & Gamble Co. | | | 39,426 | | | | 5,485,734 | |
| | | | | | | | 19,112,180 | |
Health Care – Products — 9.5% |
Baxter International, Inc. | | | 91,630 | | | | 7,352,391 | |
Danaher Corp. | | | 23,305 | | | | 5,176,973 | |
Medtronic PLC | | | 134,795 | | | | 15,789,886 | |
| | | | | | | | 28,319,250 | |
Health Care – Services — 4.7% |
UnitedHealth Group, Inc. | | | 39,408 | | | | 13,819,597 | |
Pharmaceuticals — 5.6% |
Johnson & Johnson | | | 104,897 | | | | 16,508,690 | |
| | | | | | | | 119,983,238 | |
Financial — 18.5% |
Diversified Financial Services — 6.8% |
American Express Co. | | | 116,455 | | | | 14,080,574 | |
Visa, Inc. Class A | | | 28,244 | | | | 6,177,810 | |
| | | | | | | | 20,258,384 | |
Insurance — 8.7% |
Chubb Ltd. | | | 82,145 | | | | 12,643,759 | |
Marsh & McLennan Cos., Inc. | | | 112,573 | | | | 13,171,041 | |
| | | | | | | | 25,814,800 | |
| | | Number of
Shares | | | Value | |
Real Estate Investment Trusts (REITS) — 3.0% |
American Tower Corp. | | | 14,755 | | | $ | 3,311,907 | |
Public Storage | | | 24,464 | | | | 5,649,472 | |
| | | | | | | | 8,961,379 | |
| | | | | | | | 55,034,563 | |
Industrial — 12.4% |
Aerospace & Defense — 6.3% |
Lockheed Martin Corp. | | | 22,546 | | | | 8,003,379 | |
Northrop Grumman Corp. | | | 35,784 | | | | 10,904,100 | |
| | | | | | | | 18,907,479 | |
Transportation — 6.1% |
Canadian National Railway Co. | | | 67,398 | | | | 7,409,597 | |
Union Pacific Corp. | | | 50,975 | | | | 10,614,015 | |
| | | | | | | | 18,023,612 | |
| | | | | | | | 36,931,091 | |
Technology — 5.7% |
Computers — 2.6% |
Accenture PLC Class A | | | 29,884 | | | | 7,805,999 | |
Software — 3.1% |
Microsoft Corp. | | | 41,023 | | | | 9,124,336 | |
| | | | | | | | 16,930,335 | |
| | | | | | | | | |
TOTAL COMMON STOCK (Cost $245,447,713) | | | | | | | 292,541,267 | |
| | | | | | | | | |
TOTAL EQUITIES (Cost $245,447,713) | | | | | | | 292,541,267 | |
| | | | | | | | | |
TOTAL LONG-TERM INVESTMENTS (Cost $245,447,713) | | | | | | | 292,541,267 | |
| | | Principal
Amount | | | | | |
SHORT-TERM INVESTMENTS — 0.7% |
Repurchase Agreement — 0.7% |
Fixed Income Clearing Corp., Repurchase Agreement, dated 12/31/20, 0.000%, due 1/04/21 (a) | | $ | 2,221,301 | | | | 2,221,301 | |
| | | | | | | | | |
TOTAL SHORT-TERM INVESTMENTS (Cost $2,221,301) | | | | | | | 2,221,301 | |
| | | | | | | | | |
TOTAL INVESTMENTS — 99.2% (Cost $247,669,014) (b) | | | | | | | 294,762,568 | |
| | | | | | | | | |
Other Assets/(Liabilities) — 0.8% | | | | | | | 2,293,264 | |
| | | | | | | | | |
NET ASSETS — 100.0% | | | | | | $ | 297,055,832 | |
The accompanying notes are an integral part of the financial statements.
113
MML Focused Equity Fund – Portfolio of Investments (Continued) |
Notes to Portfolio of Investments
Percentages are stated as a percent of net assets.
(a) | Maturity value of $2,221,301. Collateralized by U.S. Government Agency obligations with a rate of 0.000%, maturity date of 12/30/21, and an aggregate market value, including accrued interest, of $2,265,762. |
(b) | See Note 6 for aggregate cost for federal tax purposes. |
Country weightings, as a percentage of net assets, is as follows:
United States | | | 75.7 | % |
Ireland | | | 11.4 | % |
United Kingdom | | | 4.6 | % |
Switzerland | | | 4.3 | % |
Canada | | | 2.5 | % |
Total Long-Term Investments | | | 98.5 | % |
Short-Term Investments and Other Assets and Liabilities | | | 1.5 | % |
Net Assets | | | 100.0 | % |
The accompanying notes are an integral part of the financial statements.
114
MML Foreign Fund – Portfolio of Investments |
December 31, 2020 |
| | | Number of
Shares | | | Value | |
EQUITIES — 100.6% |
COMMON STOCK — 100.6% |
Australia — 3.2% |
Challenger Ltd. | | | 387,900 | | | $ | 1,928,079 | |
Lendlease Corp Ltd. | | | 190,600 | | | | 1,926,919 | |
Macquarie Group Ltd. | | | 30,200 | | | | 3,226,950 | |
Santos Ltd. | | | 355,700 | | | | 1,720,235 | |
| | | | | | | | 8,802,183 | |
Belgium — 2.1% |
Groupe Bruxelles Lambert SA | | | 25,700 | | | | 2,593,319 | |
KBC Group NV (a) | | | 46,000 | | | | 3,224,016 | |
| | | | | | | | 5,817,335 | |
Cayman Islands — 2.0% |
CK Asset Holdings Ltd. | | | 392,000 | | | | 2,016,287 | |
CK Hutchison Holdings Ltd. | | | 479,500 | | | | 3,348,454 | |
| | | | | | | | 5,364,741 | |
Denmark — 0.9% |
AP Moller - Maersk A/S Class B | | | 1,100 | | | | 2,452,927 | |
France — 9.6% |
Arkema SA | | | 21,000 | | | | 2,400,363 | |
Capgemini SE | | | 14,800 | | | | 2,295,053 | |
Dassault Aviation SA (a) | | | 900 | | | | 987,303 | |
Engie SA (a) | | | 328,200 | | | | 5,025,149 | |
Rexel SA (a) | | | 44,200 | | | | 696,974 | |
Sanofi | | | 46,800 | | | | 4,521,841 | |
TOTAL SE | | | 60,700 | | | | 2,618,482 | |
Ubisoft Entertainment SA (a) | | | 23,300 | | | | 2,245,124 | |
Veolia Environnement SA | | | 157,700 | | | | 3,858,207 | |
Vivendi SA | | | 52,200 | | | | 1,683,377 | |
| | | | | | | | 26,331,873 | |
Germany — 12.2% |
Allianz SE Registered | | | 13,600 | | | | 3,327,539 | |
Bayer AG Registered | | | 12,300 | | | | 722,966 | |
Deutsche Boerse AG | | | 19,100 | | | | 3,242,613 | |
Deutsche Post AG Registered | | | 54,600 | | | | 2,702,029 | |
Fresenius SE & Co. KGaA | | | 93,600 | | | | 4,325,074 | |
HeidelbergCement AG | | | 57,000 | | | | 4,263,760 | |
Infineon Technologies AG | | | 86,100 | | | | 3,304,231 | |
SAP SE | | | 26,300 | | | | 3,456,044 | |
Siemens AG Registered | | | 38,100 | | | | 5,453,122 | |
Siemens Energy AG (a) | | | 48,400 | | | | 1,776,323 | |
Talanx AG (a) | | | 27,300 | | | | 1,057,442 | |
| | | | | | | | 33,631,143 | |
Ireland — 4.2% |
AIB Group PLC (a) (b) | | | 642,200 | | | | 1,321,099 | |
DCC PLC | | | 38,600 | | | | 2,743,695 | |
Linde PLC | | | 7,900 | | | | 2,081,729 | |
| | | Number of
Shares | | | Value | |
Ryanair Holdings PLC Sponsored ADR (a) | | | 10,600 | | | $ | 1,165,788 | |
Smurfit Kappa Group PLC | | | 91,000 | | | | 4,232,368 | |
| | | | | | | | 11,544,679 | |
Israel — 0.7% |
Check Point Software Technologies Ltd. (a) | | | 14,400 | | | | 1,913,904 | |
Italy — 1.4% |
Mediobanca Banca di Credito Finanziario SpA | | | 239,100 | | | | 2,185,260 | |
Prysmian SpA | | | 42,800 | | | | 1,525,813 | |
| | | | | | | | 3,711,073 | |
Japan — 26.2% |
Astellas Pharma, Inc. | | | 247,700 | | | | 3,829,312 | |
Denka Co. Ltd. | | | 63,300 | | | | 2,474,924 | |
FANUC Corp. | | | 15,700 | | | | 3,865,612 | |
Fujitsu Ltd. | | | 16,700 | | | | 2,417,546 | |
Hitachi Ltd. | | | 113,000 | | | | 4,458,914 | |
Japan Airlines Co. Ltd. (a) | | | 97,000 | | | | 1,879,272 | |
Kirin Holdings Co. Ltd. (b) | | | 96,000 | | | | 2,266,605 | |
Kyocera Corp. | | | 44,300 | | | | 2,718,990 | |
Matsumotokiyoshi Holdings Co. Ltd. | | | 30,400 | | | | 1,297,540 | |
Nintendo Co. Ltd. | | | 7,100 | | | | 4,531,143 | |
Olympus Corp. | | | 178,100 | | | | 3,898,630 | |
ORIX Corp. | | | 299,600 | | | | 4,649,502 | |
Rakuten, Inc. (a) (b) | | | 370,800 | | | | 3,561,260 | |
Sega Sammy Holdings, Inc. | | | 163,500 | | | | 2,580,172 | |
Seven & i Holdings Co. Ltd. | | | 138,700 | | | | 4,925,458 | |
Sony Corp. | | | 83,700 | | | | 8,415,506 | |
Square Enix Holdings Co. Ltd. | | | 35,200 | | | | 2,136,016 | |
Sumitomo Mitsui Financial Group, Inc. | | | 120,400 | | | | 3,725,549 | |
Toshiba Corp. | | | 118,200 | | | | 3,310,048 | |
Toyota Industries Corp. | | | 64,500 | | | | 5,126,767 | |
| | | | | | | | 72,068,766 | |
Luxembourg — 1.5% |
ArcelorMittal SA (a) | | | 184,300 | | | | 4,229,418 | |
Netherlands — 6.2% |
Airbus SE (a) | | | 5,800 | | | | 637,127 | |
ASML Holding NV | | | 7,200 | | | | 3,479,486 | |
EXOR NV | | | 15,800 | | | | 1,268,225 | |
Heineken Holding NV | | | 45,000 | | | | 4,238,757 | |
Koninklijke Philips NV (a) | | | 95,479 | | | | 5,109,688 | |
NXP Semiconductor NV | | | 15,000 | | | | 2,385,150 | |
| | | | | | | | 17,118,433 | |
Norway — 1.1% |
Mowi ASA | | | 134,600 | | | | 2,997,867 | |
The accompanying notes are an integral part of the financial statements.
115
MML Foreign Fund – Portfolio of Investments (Continued) |
| | | Number of
Shares | | | Value | |
Republic of Korea — 2.5% |
Samsung Electronics Co. Ltd. | | | 92,900 | | | $ | 6,943,107 | |
Singapore — 1.2% |
DBS Group Holdings, Ltd. | | | 175,700 | | | | 3,323,345 | |
Spain — 0.5% |
Siemens Gamesa Renewable Energy SA | | | 35,600 | | | | 1,445,220 | |
Sweden — 1.9% |
Investor AB Class B | | | 39,200 | | | | 2,865,020 | |
Volvo AB Class B (a) | | | 97,498 | | | | 2,294,354 | |
| | | | | | | | 5,159,374 | |
Switzerland — 8.7% |
ABB Ltd. Registered | | | 126,100 | | | | 3,527,186 | |
Alcon, Inc. (a) | | | 45,800 | | | | 3,057,591 | |
Nestle SA Registered | | | 43,000 | | | | 5,062,342 | |
Novartis AG Registered | | | 50,900 | | | | 4,807,546 | |
Roche Holding AG | | | 8,600 | | | | 3,000,608 | |
UBS Group AG Registered | | | 315,100 | | | | 4,407,124 | |
| | | | | | | | 23,862,397 | |
United Kingdom — 14.5% |
Ashtead Group PLC | | | 60,000 | | | | 2,823,524 | |
Aviva PLC | | | 844,100 | | | | 3,785,940 | |
Barratt Developments PLC (a) | | | 98,600 | | | | 904,567 | |
BHP Group PLC ADR | | | 19,300 | | | | 1,023,479 | |
The British Land Co. PLC | | | 438,500 | | | | 2,934,486 | |
Bunzl PLC | | | 51,000 | | | | 1,704,758 | |
Entain PLC (a) | | | 198,400 | | | | 3,079,681 | |
Glencore PLC (a) | | | 344,400 | | | | 1,098,601 | |
IG Group Holdings PLC | | | 48,500 | | | | 571,964 | |
Imperial Brands PLC | | | 112,300 | | | | 2,359,577 | |
Inchcape PLC (a) | | | 305,600 | | | | 2,692,055 | |
Informa PLC (a) | | | 169,200 | | | | 1,271,456 | |
Liberty Global PLC Class C (a) | | | 9,800 | | | | 231,770 | |
Persimmon PLC | | | 71,100 | | | | 2,693,157 | |
Savills PLC (a) | | | 50,400 | | | | 654,436 | |
Smith & Nephew PLC | | | 102,700 | | | | 2,144,581 | |
Tesco PLC | | | 1,502,900 | | | | 4,744,890 | |
Unilever PLC | | | 83,900 | | | | 5,050,561 | |
| | | | | | | | 39,769,483 | |
| | | | | | | | | |
TOTAL COMMON STOCK (Cost $253,482,203) | | | | | | | 276,487,268 | |
| | | | | | | | | |
TOTAL EQUITIES (Cost $253,482,203) | | | | | | | 276,487,268 | |
| | | Number of
Shares | | | Value | |
MUTUAL FUNDS — 0.5% |
United States — 0.5% |
State Street Navigator Securities Lending Prime Portfolio (c) | | | 1,384,583 | | | $ | 1,384,583 | |
| | | | | | | | | |
TOTAL MUTUAL FUNDS (Cost $1,384,583) | | | | | | | 1,384,583 | |
| | | | | | | | | |
TOTAL LONG-TERM INVESTMENTS (Cost $254,866,786) | | | | | | | 277,871,851 | |
| | | | | | | | | |
TOTAL INVESTMENTS — 101.1% (Cost $254,866,786) (d) | | | | | | | 277,871,851 | |
| | | | | | | | | |
Other Assets/(Liabilities) — (1.1)% | | | | | | | (3,043,120 | ) |
| | | | | | | | | |
NET ASSETS — 100.0% | | | | | | $ | 274,828,731 | |
Abbreviation Legend
ADR | American Depositary Receipt |
Notes to Portfolio of Investments
Percentages are stated as a percent of net assets.
(a) | Non-income producing security. |
(b) | Denotes all or a portion of security on loan. The total value of securities on loan as of December 31, 2020, was $7,004,774 or 2.55% of net assets. Total securities on loan may be less than the amounts identified in the Portfolio of Investments. The Fund received $6,031,935 of non-cash collateral (U.S. Treasury and/or Agency obligations) related to securities lending activity. This amount is not reflected on either the Portfolio of Investments or the Statement of Assets and Liabilities. (Note 2). |
(c) | Represents investment of security lending cash collateral. (Note 2). |
(d) | See Note 6 for aggregate cost for federal tax purposes. |
Sector weightings, as a percentage of net assets, is as follows:
Consumer, Non-cyclical | | | 25.7 | % |
Financial | | | 18.8 | % |
Consumer, Cyclical | | | 14.2 | % |
Industrial | | | 13.8 | % |
Technology | | | 11.1 | % |
Basic Materials | | | 6.4 | % |
Energy | | | 3.7 | % |
Utilities | | | 3.2 | % |
Communications | | | 2.5 | % |
Diversified | | | 1.2 | % |
Mutual Funds | | | 0.5 | % |
Total Long-Term Investments | | | 101.1 | % |
Short-Term Investments and Other Assets and Liabilities | | | (1.1 | )% |
Net Assets | | | 100.0 | % |
The accompanying notes are an integral part of the financial statements.
116
MML Fundamental Equity Fund – Portfolio of Investments |
December 31, 2020 |
| | | Number of
Shares | | | Value | |
EQUITIES — 100.1% |
COMMON STOCK — 100.1% |
Basic Materials — 0.5% |
Chemicals — 0.5% |
Valvoline, Inc. | | | 37,130 | | | $ | 859,188 | |
Communications — 16.7% |
Internet — 12.3% |
Airbnb, Inc.Class A (a) | | | 3,211 | | | | 471,375 | |
Amazon.com, Inc. (a) | | | 3,519 | | | | 11,461,137 | |
Booking Holdings, Inc. (a) | | | 1,316 | | | | 2,931,087 | |
Facebook, Inc. Class A (a) | | | 22,647 | | | | 6,186,255 | |
Snap, Inc. Class A (a) | | | 25,078 | | | | 1,255,655 | |
| | | | | | | | 22,305,509 | |
Media — 1.0% |
Comcast Corp. Class A | | | 34,968 | | | | 1,832,323 | |
Telecommunications — 3.4% |
Motorola Solutions, Inc. | | | 13,624 | | | | 2,316,897 | |
Verizon Communications, Inc. | | | 64,854 | | | | 3,810,173 | |
| | | | | | | | 6,127,070 | |
| | | | | | | | 30,264,902 | |
Consumer, Cyclical — 6.6% |
Auto Manufacturers — 0.8% |
General Motors Co. | | | 33,360 | | | | 1,389,110 | |
Entertainment — 0.5% |
Live Nation Entertainment, Inc. (a) | | | 6,598 | | | | 484,821 | |
Warner Music Group Corp. Class A | | | 13,323 | | | | 506,141 | |
| | | | | | | | 990,962 | |
Home Builders — 0.7% |
D.R. Horton, Inc. | | | 19,668 | | | | 1,355,519 | |
Retail — 4.6% |
CarMax, Inc. (a) | | | 12,616 | | | | 1,191,707 | |
The Home Depot, Inc. | | | 13,123 | | | | 3,485,731 | |
O’Reilly Automotive, Inc. (a) | | | 2,980 | | | | 1,348,659 | |
Target Corp. | | | 13,108 | | | | 2,313,955 | |
| | | | | | | | 8,340,052 | |
| | | | | | | | 12,075,643 | |
Consumer, Non-cyclical — 22.0% |
Beverages — 1.3% |
Constellation Brands, Inc. Class A | | | 10,570 | | | | 2,315,358 | |
Cosmetics & Personal Care — 2.6% |
The Procter & Gamble Co. | | | 33,178 | | | | 4,616,387 | |
Foods — 2.3% |
a2 Milk Co. Ltd. (a) (b) | | | 22,705 | | | | 200,574 | |
Mondelez International, Inc. Class A | | | 35,971 | | | | 2,103,225 | |
Sysco Corp. | | | 26,158 | | | | 1,942,493 | |
| | | | | | | | 4,246,292 | |
| | | Number of
Shares | | | Value | |
Health Care – Products — 2.7% |
Alcon, Inc. (a) (b) | | | 13,747 | | | $ | 907,027 | |
Avantor, Inc. (a) | | | 28,479 | | | | 801,684 | |
Thermo Fisher Scientific, Inc. | | | 6,784 | | | | 3,159,851 | |
| | | | | | | | 4,868,562 | |
Health Care – Services — 5.8% |
HCA Healthcare, Inc. | | | 25,806 | | | | 4,244,055 | |
UnitedHealth Group, Inc. | | | 17,803 | | | | 6,243,156 | |
| | | | | | | | 10,487,211 | |
Household Products & Wares — 0.4% |
Reckitt Benckiser Group PLC | | | 8,845 | | | | 791,059 | |
Pharmaceuticals — 6.9% |
AstraZeneca PLC Sponsored ADR (b) | | | 70,454 | | | | 3,521,996 | |
CVS Health Corp. | | | 34,337 | | | | 2,345,217 | |
Eli Lilly and Co. | | | 15,782 | | | | 2,664,633 | |
Merck & Co., Inc. | | | 41,678 | | | | 3,409,260 | |
Neurocrine Biosciences, Inc. (a) | | | 6,834 | | | | 655,039 | |
| | | | | | | | 12,596,145 | |
| | | | | | | | 39,921,014 | |
Energy — 2.3% |
Oil & Gas — 1.1% |
Cabot Oil & Gas Corp. | | | 48,395 | | | | 787,871 | |
Valero Energy Corp. | | | 21,262 | | | | 1,202,791 | |
| | | | | | | | 1,990,662 | |
Pipelines — 1.2% |
Magellan Midstream Partners LP (c) | | | 53,331 | | | | 2,263,368 | |
| | | | | | | | 4,254,030 | |
Financial — 16.1% |
Banks — 3.3% |
JP Morgan Chase & Co. | | | 46,708 | | | | 5,935,185 | |
Diversified Financial Services — 6.7% |
Capital One Financial Corp. | | | 34,119 | | | | 3,372,663 | |
Intercontinental Exchange, Inc. | | | 31,895 | | | | 3,677,175 | |
Mastercard, Inc. Class A | | | 8,914 | | | | 3,181,763 | |
Rocket Cos., Inc. (a) (b) | | | 93,591 | | | | 1,892,410 | |
| | | | | | | | 12,124,011 | |
Insurance — 3.7% |
Equitable Holdings, Inc. | | | 134,473 | | | | 3,441,164 | |
The Progressive Corp. | | | 32,859 | | | | 3,249,098 | |
| | | | | | | | 6,690,262 | |
Real Estate Investment Trusts (REITS) — 2.4% |
Prologis, Inc. | | | 44,816 | | | | 4,466,363 | |
| | | | | | | | 29,215,821 | |
Industrial — 10.3% |
Aerospace & Defense — 1.6% |
Lockheed Martin Corp. | | | 7,927 | | | | 2,813,927 | |
The accompanying notes are an integral part of the financial statements.
117
MML Fundamental Equity Fund – Portfolio of Investments (Continued) |
| | | Number of
Shares | | | Value | |
Building Materials — 0.8% |
Vulcan Materials Co. | | | 10,184 | | | $ | 1,510,389 | |
Electronics — 1.4% |
Honeywell International, Inc. | | | 9,949 | | | | 2,116,152 | |
Hubbell, Inc. | | | 3,065 | | | | 480,562 | |
| | | | | | | | 2,596,714 | |
Environmental Controls — 0.9% |
Waste Connections, Inc. | | | 16,004 | | | | 1,641,530 | |
Machinery – Construction & Mining — 0.9% |
Caterpillar, Inc. | | | 9,066 | | | | 1,650,193 | |
Machinery – Diversified — 1.2% |
Otis Worldwide Corp. | | | 16,842 | | | | 1,137,677 | |
Rockwell Automation, Inc. | | | 4,459 | | | | 1,118,362 | |
| | | | | | | | 2,256,039 | |
Transportation — 3.5% |
C.H. Robinson Worldwide, Inc. | | | 8,032 | | | | 753,964 | |
Union Pacific Corp. | | | 13,972 | | | | 2,909,250 | |
United Parcel Service, Inc. Class B | | | 15,381 | | | | 2,590,160 | |
| | | | | | | | 6,253,374 | |
| | | | | | | | 18,722,166 | |
Technology — 24.4% |
Computers — 4.1% |
Accenture PLC Class A | | | 11,093 | | | | 2,897,602 | |
Amdocs Ltd. | | | 17,002 | | | | 1,205,952 | |
Apple, Inc. | | | 25,455 | | | | 3,377,624 | |
| | | | | | | | 7,481,178 | |
Semiconductors — 8.5% |
Applied Materials, Inc. | | | 59,550 | | | | 5,139,165 | |
QUALCOMM, Inc. | | | 45,237 | | | | 6,891,404 | |
Texas Instruments, Inc. | | | 20,237 | | | | 3,321,499 | |
| | | | | | | | 15,352,068 | |
Software — 11.8% |
Adobe, Inc. (a) | | | 2,035 | | | | 1,017,744 | |
Fiserv, Inc. (a) | | | 23,943 | | | | 2,726,150 | |
Microsoft Corp. | | | 64,756 | | | | 14,403,030 | |
Snowflake, Inc. Class A (a) (b) | | | 1,016 | | | | 285,902 | |
Workday, Inc. Class A (a) | | | 5,902 | | | | 1,414,178 | |
Zynga, Inc. Class A (a) | | | 159,719 | | | | 1,576,427 | |
| | | | | | | | 21,423,431 | |
| | | | | | | | 44,256,677 | |
| | | Number of
Shares | | | Value | |
Utilities — 1.2% |
Electric — 1.2% |
Duke Energy Corp. | | | 10,577 | | | $ | 968,430 | |
FirstEnergy Corp. | | | 37,931 | | | | 1,161,068 | |
| | | | | | | | 2,129,498 | |
| | | | | | | | | |
TOTAL COMMON STOCK (Cost $147,352,182) | | | | | | | 181,698,939 | |
| | | | | | | | | |
TOTAL EQUITIES (Cost $147,352,182) | | | | | | | 181,698,939 | |
| | | | | | | | | |
MUTUAL FUNDS — 0.2% |
Diversified Financial Services — 0.2% |
State Street Navigator Securities Lending Prime Portfolio (d) | | | 293,570 | | | | 293,570 | |
| | | | | | | | | |
TOTAL MUTUAL FUNDS (Cost $293,570) | | | | | | | 293,570 | |
| | | | | | | | | |
TOTAL LONG-TERM INVESTMENTS (Cost $147,645,752) | | | | | | | 181,992,509 | |
| | | | | | | | | |
TOTAL INVESTMENTS — 100.3% (Cost $147,645,752) (e) | | | | | | | 181,992,509 | |
| | | | | | | | | |
Other Assets/(Liabilities) — (0.3)% | | | | | | | (565,632 | ) |
| | | | | | | | | |
NET ASSETS — 100.0% | | | | | | $ | 181,426,877 | |
Abbreviation Legend
ADR | American Depositary Receipt |
Notes to Portfolio of Investments
Percentages are stated as a percent of net assets.
(a) | Non-income producing security. |
(b) | Denotes all or a portion of security on loan. The total value of securities on loan as of December 31, 2020, was $6,799,022 or 3.75% of net assets. Total securities on loan may be less than the amounts identified in the Portfolio of Investments. The Fund received $6,779,255 of non-cash collateral (U.S. Treasury and/or Agency obligations) related to securities lending activity. This amount is not reflected on either the Portfolio of Investments or the Statement of Assets and Liabilities. (Note 2). |
(c) | Security is a Master Limited Partnership. |
(d) | Represents investment of security lending cash collateral. (Note 2). |
(e) | See Note 6 for aggregate cost for federal tax purposes. |
The accompanying notes are an integral part of the financial statements.
118
MML Fundamental Value Fund – Portfolio of Investments |
December 31, 2020 |
| | | Number of
Shares | | | Value | |
EQUITIES — 99.3% |
COMMON STOCK — 99.3% |
Basic Materials — 4.9% |
Chemicals — 2.8% |
DuPont de Nemours, Inc. | | | 47,318 | | | $ | 3,364,783 | |
FMC Corp. | | | 10,262 | | | | 1,179,412 | |
PPG Industries, Inc. | | | 6,432 | | | | 927,623 | |
| | | | | | | | 5,471,818 | |
Iron & Steel — 0.7% |
Steel Dynamics, Inc. | | | 36,556 | | | | 1,347,820 | |
Mining — 1.4% |
Kinross Gold Corp. | | | 86,131 | | | | 632,201 | |
Newmont Corp. | | | 17,997 | | | | 1,077,840 | |
Yamana Gold, Inc. | | | 192,287 | | | | 1,097,959 | |
| | | | | | | | 2,808,000 | |
| | | | | | | | 9,627,638 | |
Communications — 5.7% |
Internet — 1.9% |
Alphabet, Inc. Class A (a) | | | 2,057 | | | | 3,605,180 | |
Telecommunications — 3.8% |
Cisco Systems, Inc. | | | 102,635 | | | | 4,592,916 | |
T-Mobile US, Inc. (a) | | | 21,258 | | | | 2,866,642 | |
| | | | | | | | 7,459,558 | |
| | | | | | | | 11,064,738 | |
Consumer, Cyclical — 11.7% |
Apparel — 1.0% |
Tapestry, Inc. | | | 61,735 | | | | 1,918,724 | |
Auto Manufacturers — 0.7% |
Cummins, Inc. | | | 5,966 | | | | 1,354,879 | |
Auto Parts & Equipment — 0.8% |
Allison Transmission Holdings, Inc. | | | 16,752 | | | | 722,514 | |
Lear Corp. | | | 4,841 | | | | 769,864 | |
| | | | | | | | 1,492,378 | |
Distribution & Wholesale — 0.7% |
LKQ Corp. (a) | | | 38,779 | | | | 1,366,572 | |
Home Builders — 0.8% |
Lennar Corp. Class A | | | 19,809 | | | | 1,510,040 | |
Leisure Time — 0.9% |
Harley-Davidson, Inc. | | | 47,701 | | | | 1,750,627 | |
Lodging — 1.3% |
Las Vegas Sands Corp. | | | 25,705 | | | | 1,532,018 | |
Wyndham Hotels & Resorts, Inc. | | | 16,412 | | | | 975,529 | |
| | | | | | | | 2,507,547 | |
Retail — 4.5% |
AutoZone, Inc. (a) | | | 3,057 | | | | 3,623,890 | |
Best Buy Co., Inc. | | | 18,028 | | | | 1,799,014 | |
| | | Number of
Shares | | | Value | |
Lowe’s Cos., Inc. | | | 7,324 | | | $ | 1,175,575 | |
The TJX Cos., Inc. | | | 20,954 | | | | 1,430,949 | |
Williams-Sonoma, Inc. | | | 7,760 | | | | 790,278 | |
| | | | | | | | 8,819,706 | |
Textiles — 1.0% |
Mohawk Industries, Inc. (a) | | | 14,567 | | | | 2,053,219 | |
| | | | | | | | 22,773,692 | |
Consumer, Non-cyclical — 22.9% |
Beverages — 1.0% |
Coca-Cola European Partners PLC | | | 39,717 | | | | 1,979,098 | |
Biotechnology — 0.5% |
Amgen, Inc. | | | 4,198 | | | | 965,204 | |
Commercial Services — 1.1% |
Robert Half International, Inc. | | | 10,484 | | | | 655,040 | |
United Rentals, Inc. (a) | | | 6,700 | | | | 1,553,797 | |
| | | | | | | | 2,208,837 | |
Foods — 1.0% |
The Kroger Co. | | | 58,970 | | | | 1,872,887 | |
Health Care – Products — 2.4% |
Avantor, Inc. (a) | | | 59,091 | | | | 1,663,412 | |
Medtronic PLC | | | 25,220 | | | | 2,954,271 | |
| | | | | | | | 4,617,683 | |
Health Care – Services — 3.3% |
Anthem, Inc. | | | 11,947 | | | | 3,836,062 | |
UnitedHealth Group, Inc. | | | 7,469 | | | | 2,619,229 | |
| | | | | | | | 6,455,291 | |
Pharmaceuticals — 13.6% |
AbbVie, Inc. | | | 14,138 | | | | 1,514,887 | |
AmerisourceBergen Corp. | | | 18,851 | | | | 1,842,874 | |
Cigna Corp. | | | 23,078 | | | | 4,804,378 | |
CVS Health Corp. | | | 20,321 | | | | 1,387,924 | |
GlaxoSmithKline PLC Sponsored ADR | | | 35,649 | | | | 1,311,883 | |
Johnson & Johnson | | | 41,893 | | | | 6,593,120 | |
McKesson Corp. | | | 12,952 | | | | 2,252,612 | |
Novartis AG Sponsored ADR | | | 34,632 | | | | 3,270,300 | |
Pfizer, Inc. | | | 74,359 | | | | 2,737,155 | |
Viatris, Inc. (a) | | | 42,487 | | | | 796,206 | |
| | | | | | | | 26,511,339 | |
| | | | | | | | 44,610,339 | |
Energy — 5.3% |
Oil & Gas — 4.8% |
Canadian Natural Resources Ltd. | | | 43,678 | | | | 1,050,456 | |
ConocoPhillips | | | 81,254 | | | | 3,249,347 | |
Marathon Petroleum Corp. | | | 57,801 | | | | 2,390,649 | |
Parsley Energy, Inc. Class A | | | 103,979 | | | | 1,476,502 | |
The accompanying notes are an integral part of the financial statements.
119
MML Fundamental Value Fund – Portfolio of Investments (Continued) |
| | | Number of
Shares | | | Value | |
Petroleo Brasileiro SA Sponsored ADR | | | 104,320 | | | $ | 1,171,514 | |
| | | | | | | | 9,338,468 | |
Oil & Gas Services — 0.5% |
Schlumberger NV | | | 45,839 | | | | 1,000,665 | |
| | | | | | | | 10,339,133 | |
Financial — 24.0% |
Banks — 11.8% |
Bank of America Corp. | | | 159,676 | | | | 4,839,779 | |
Citigroup, Inc. | | | 49,267 | | | | 3,037,803 | |
Fifth Third Bancorp | | | 44,216 | | | | 1,219,035 | |
The Goldman Sachs Group, Inc. | | | 7,152 | | | | 1,886,054 | |
Huntington Bancshares, Inc. | | | 147,039 | | | | 1,857,103 | |
JP Morgan Chase & Co. | | | 51,539 | | | | 6,549,061 | |
Truist Financial Corp. | | | 75,045 | | | | 3,596,907 | |
| | | | | | | | 22,985,742 | |
Diversified Financial Services — 1.4% |
AerCap Holdings NV (a) | | | 12,250 | | | | 558,355 | |
The Charles Schwab Corp. | | | 39,077 | | | | 2,072,644 | |
| | | | | | | | 2,630,999 | |
Insurance — 10.8% |
Aflac, Inc. | | | 31,740 | | | | 1,411,478 | |
American International Group, Inc. | | | 66,380 | | | | 2,513,147 | |
Berkshire Hathaway, Inc. Class B (a) | | | 28,695 | | | | 6,653,510 | |
Chubb Ltd. | | | 26,032 | | | | 4,006,845 | |
Everest Re Group Ltd. | | | 8,445 | | | | 1,976,890 | |
Marsh & McLennan Cos., Inc. | | | 7,313 | | | | 855,621 | |
The Progressive Corp. | | | 29,495 | | | | 2,916,466 | |
RenaissanceRe Holdings Ltd. | | | 4,599 | | | | 762,606 | |
| | | | | | | | 21,096,563 | |
| | | | | | | | 46,713,304 | |
Industrial — 12.1% |
Aerospace & Defense — 3.1% |
The Boeing Co. | | | 10,598 | | | | 2,268,608 | |
General Dynamics Corp. | | | 6,564 | | | | 976,854 | |
Howmet Aerospace, Inc. | | | 64,184 | | | | 1,831,811 | |
Northrop Grumman Corp. | | | 2,941 | | | | 896,182 | |
| | | | | | | | 5,973,455 | |
Building Materials — 1.7% |
CRH PLC Sponsored ADR | | | 26,888 | | | | 1,144,891 | |
Owens Corning | | | 27,441 | | | | 2,078,930 | |
| | | | | | | | 3,223,821 | |
Machinery – Construction & Mining — 1.4% |
Caterpillar, Inc. | | | 14,653 | | | | 2,667,139 | |
| | | Number of
Shares | | | Value | |
Machinery – Diversified — 3.0% |
Deere & Co. | | | 13,094 | | | $ | 3,522,941 | |
Dover Corp. | | | 10,845 | | | | 1,369,181 | |
Otis Worldwide Corp. | | | 14,304 | | | | 966,235 | |
| | | | | | | | 5,858,357 | |
Miscellaneous – Manufacturing — 1.4% |
Eaton Corp. PLC | | | 23,586 | | | | 2,833,622 | |
Packaging & Containers — 0.4% |
WestRock Co. | | | 19,976 | | | | 869,556 | |
Shipbuilding — 0.3% |
Huntington Ingalls Industries, Inc. | | | 3,664 | | | | 624,639 | |
Transportation — 0.8% |
Union Pacific Corp. | | | 7,237 | | | | 1,506,888 | |
| | | | | | | | 23,557,477 | |
Technology — 10.1% |
Semiconductors — 8.1% |
Applied Materials, Inc. | | | 33,755 | | | | 2,913,056 | |
KLA Corp. | | | 7,001 | | | | 1,812,629 | |
Lam Research Corp. | | | 7,628 | | | | 3,602,476 | |
Micron Technology, Inc. (a) | | | 39,077 | | | | 2,937,809 | |
NXP Semiconductor NV | | | 16,028 | | | | 2,548,612 | |
ON Semiconductor Corp. (a) | | | 11,712 | | | | 383,334 | |
Qorvo, Inc. (a) | | | 9,010 | | | | 1,498,093 | |
| | | | | | | | 15,696,009 | |
Software — 2.0% |
Oracle Corp. | | | 34,076 | | | | 2,204,376 | |
SS&C Technologies Holdings, Inc | | | 23,325 | | | | 1,696,894 | |
| | | | | | | | 3,901,270 | |
| | | | | | | | 19,597,279 | |
Utilities — 2.6% |
Electric — 2.6% |
CenterPoint Energy, Inc. | | | 65,220 | | | | 1,411,361 | |
Edison International | | | 32,463 | | | | 2,039,326 | |
Vistra Corp. | | | 86,369 | | | | 1,698,014 | |
| | | | | | | | 5,148,701 | |
| | | | | | | | | |
TOTAL COMMON STOCK (Cost $160,777,851) | | | | | | | 193,432,301 | |
| | | | | | | | | |
TOTAL EQUITIES (Cost $160,777,851) | | | | | | | 193,432,301 | |
| | | | | | | | | |
TOTAL LONG-TERM INVESTMENTS (Cost $160,777,851) | | | | | | | 193,432,301 | |
The accompanying notes are an integral part of the financial statements.
120
MML Fundamental Value Fund – Portfolio of Investments (Continued) |
| | | Principal
Amount | | | Value | |
SHORT-TERM INVESTMENTS — 0.9% |
Repurchase Agreement — 0.9% |
Fixed Income Clearing Corp., Repurchase Agreement, dated 12/31/20, 0.000%, due 1/04/21 (b) | | $ | 1,776,367 | | | $ | 1,776,367 | |
| | | | | | | | | |
TOTAL SHORT-TERM INVESTMENTS (Cost $1,776,367) | | | | | | | 1,776,367 | |
| | | | | | | | | |
TOTAL INVESTMENTS — 100.2% (Cost $162,554,218) (c) | | | | | | | 195,208,668 | |
| | | | | | | | | |
Other Assets/(Liabilities) — (0.2)% | | | | | | | (299,797 | ) |
| | | | | | | | | |
NET ASSETS — 100.0% | | | | | | $ | 194,908,871 | |
Abbreviation Legend
ADR | American Depositary Receipt |
Notes to Portfolio of Investments
Percentages are stated as a percent of net assets.
(a) | Non-income producing security. |
(b) | Maturity value of $1,776,367. Collateralized by U.S. Government Agency obligations with a rate of 0.000%, maturity date of 12/30/21, and an aggregate market value, including accrued interest, of $1,811,990. |
(c) | See Note 6 for aggregate cost for federal tax purposes. |
The accompanying notes are an integral part of the financial statements.
121
MML Global Fund – Portfolio of Investments |
December 31, 2020 |
| | | Number of
Shares | | | Value | |
EQUITIES — 99.7% |
COMMON STOCK — 99.7% |
Austria — 0.3% |
Erste Group Bank AG (a) | | | 34,018 | | | $ | 1,027,011 | |
Canada — 1.9% |
Canadian National Railway Co. | | | 70,227 | | | | 7,714,436 | |
Denmark — 0.6% |
Carlsberg A/S Class B | | | 13,924 | | | | 2,232,270 | |
France — 11.7% |
Air Liquide SA | | | 23,445 | | | | 3,847,997 | |
Danone SA | | | 113,365 | | | | 7,451,023 | |
EssilorLuxottica SA | | | 9,549 | | | | 1,489,225 | |
Hermes International | | | 1,091 | | | | 1,173,213 | |
Legrand SA | | | 49,651 | | | | 4,431,507 | |
LVMH Moet Hennessy Louis Vuitton SE | | | 16,721 | | | | 10,447,794 | |
Pernod Ricard SA | | | 30,961 | | | | 5,934,860 | |
Schneider Electric SE | | | 81,756 | | | | 11,825,637 | |
| | | | | | | | 46,601,256 | |
Germany — 4.4% |
Bayer AG Registered | | | 80,475 | | | | 4,730,138 | |
Brenntag AG | | | 25,431 | | | | 1,968,077 | |
Deutsche Boerse AG | | | 12,432 | | | | 2,110,584 | |
Deutsche Wohnen SE | | | 28,191 | | | | 1,504,918 | |
Merck KGaA | | | 30,207 | | | | 5,177,888 | |
MTU Aero Engines AG | | | 8,614 | | | | 2,244,382 | |
| | | | | | | | 17,735,987 | |
Ireland — 9.4% |
Accenture PLC Class A | | | 39,597 | | | | 10,343,132 | |
Aon PLC Class A | | | 20,465 | | | | 4,323,641 | |
Linde PLC (a) | | | 27,135 | | | | 7,047,062 | |
Linde PLC | | | 7,160 | | | | 1,886,732 | |
Medtronic PLC | | | 103,311 | | | | 12,101,851 | |
Willis Towers Watson PLC | | | 8,258 | | | | 1,739,795 | |
| | | | | | | | 37,442,213 | |
Israel — 1.2% |
Check Point Software Technologies Ltd. (a) | | | 36,267 | | | | 4,820,247 | |
Japan — 2.8% |
Hoya Corp. | | | 18,100 | | | | 2,501,946 | |
Kubota Corp. (b) | | | 268,100 | | | | 5,857,124 | |
Olympus Corp. | | | 123,200 | | | | 2,696,862 | |
| | | | | | | | 11,055,932 | |
Mexico — 0.2% |
Grupo Financiero Banorte SAB de CV Class O (a) | | | 153,697 | | | | 846,899 | |
| | | Number of
Shares | | | Value | |
Netherlands — 3.0% |
Akzo Nobel NV | | | 47,717 | | | $ | 5,125,726 | |
Heineken NV (b) | | | 61,894 | | | | 6,902,408 | |
| | | | | | | | 12,028,134 | |
Republic of Korea — 1.2% |
Samsung Electronics Co. Ltd. | | | 62,887 | | | | 4,700,013 | |
Spain — 1.0% |
Aena SME SA (a) (c) | | | 23,166 | | | | 4,045,180 | |
Sweden — 1.9% |
Essity AB Class B | | | 230,830 | | | | 7,418,286 | |
Switzerland — 7.7% |
Adecco Group AG Registered | | | 27,520 | | | | 1,845,282 | |
Cie Financiere Richemont SA Registered | | | 49,319 | | | | 4,456,579 | |
Julius Baer Group Ltd. | | | 29,258 | | | | 1,694,753 | |
Nestle SA Registered | | | 85,707 | | | | 10,090,190 | |
Roche Holding AG | | | 24,154 | | | | 8,427,521 | |
Sonova Holding AG Registered (a) | | | 4,024 | | | | 1,035,950 | |
UBS Group AG Registered | | | 230,382 | | | | 3,222,222 | |
| | | | | | | | 30,772,497 | |
Thailand — 0.1% |
Kasikornbank PCL | | | 102,000 | | | | 389,363 | |
United Kingdom — 7.3% |
Aptiv PLC | | | 16,882 | | | | 2,199,556 | |
Burberry Group PLC (a) | | | 93,930 | | | | 2,300,769 | |
Compass Group PLC | | | 141,906 | | | | 2,648,025 | |
Diageo PLC | | | 219,198 | | | | 8,662,947 | |
Reckitt Benckiser Group PLC | | | 70,299 | | | | 6,287,239 | |
Rolls-Royce Holdings PLC (a) | | | 1,605,134 | | | | 2,443,808 | |
Whitbread PLC (a) | | | 47,827 | | | | 2,029,253 | |
WPP PLC | | | 248,941 | | | | 2,704,752 | |
| | | | | | | | 29,276,349 | |
United States — 45.0% |
3M Co. | | | 31,675 | | | | 5,536,473 | |
Abbott Laboratories | | | 52,582 | | | | 5,757,203 | |
American Express Co. | | | 34,988 | | | | 4,230,399 | |
Amphenol Corp. Class A | | | 18,218 | | | | 2,382,368 | |
The Bank of New York Mellon Corp. | | | 93,624 | | | | 3,973,403 | |
Carrier Global Corp. | | | 24,922 | | | | 940,058 | |
The Charles Schwab Corp. | | | 89,523 | | | | 4,748,300 | |
Cisco Systems, Inc. | | | 42,345 | | | | 1,894,939 | |
Cognizant Technology Solutions Corp. Class A | | | 51,892 | | | | 4,252,549 | |
Colgate-Palmolive Co. | | | 47,638 | | | | 4,073,525 | |
Comcast Corp. Class A | | | 262,307 | | | | 13,744,887 | |
The Cooper Cos., Inc. | | | 10,803 | | | | 3,924,946 | |
eBay, Inc. | | | 72,161 | | | | 3,626,090 | |
Equifax, Inc. | | | 22,166 | | | | 4,274,492 | |
The accompanying notes are an integral part of the financial statements.
122
MML Global Fund – Portfolio of Investments (Continued) |
| | | Number of
Shares | | | Value | |
Fidelity National Information Services, Inc. | | | 30,355 | | | $ | 4,294,018 | |
The Goldman Sachs Group, Inc. | | | 23,295 | | | | 6,143,125 | |
Honeywell International, Inc. | | | 44,779 | | | | 9,524,493 | |
Kansas City Southern | | | 37,643 | �� | | | 7,684,066 | |
Liberty Broadband Corp. Class C (a) | | | 14,761 | | | | 2,337,700 | |
Marriott International, Inc. Class A | | | 18,841 | | | | 2,485,505 | |
Microchip Technology, Inc. | | | 14,892 | | | | 2,056,734 | |
Omnicom Group, Inc. | | | 19,549 | | | | 1,219,271 | |
Oracle Corp. | | | 88,618 | | | | 5,732,698 | |
Otis Worldwide Corp. | | | 28,853 | | | | 1,949,020 | |
PayPal Holdings, Inc. (a) | | | 21,311 | | | | 4,991,036 | |
PPG Industries, Inc. | | | 31,991 | | | | 4,613,742 | |
State Street Corp. | | | 39,426 | | | | 2,869,424 | |
Stryker Corp. | | | 30,687 | | | | 7,519,543 | |
Thermo Fisher Scientific, Inc. | | | 27,471 | | | | 12,795,442 | |
Union Pacific Corp. | | | 17,309 | | | | 3,604,080 | |
United Parcel Service, Inc. Class B | | | 24,816 | | | | 4,179,014 | |
Visa, Inc. Class A | | | 56,196 | | | | 12,291,751 | |
The Walt Disney Co. (a) | | | 48,531 | | | | 8,792,847 | |
Waters Corp. (a) | | | 16,328 | | | | 4,039,874 | |
Zimmer Biomet Holdings, Inc. | | | 42,900 | | | | 6,610,461 | |
| | | | | | | | 179,093,476 | |
| | | | | | | | | |
TOTAL COMMON STOCK (Cost $305,638,246) | | | | | | | 397,199,549 | |
| | | | | | | | | |
TOTAL EQUITIES (Cost $305,638,246) | | | | | | | 397,199,549 | |
| | | | | | | | | |
MUTUAL FUNDS — 1.2% |
United States — 1.2% |
State Street Navigator Securities Lending Prime Portfolio (d) | | | 4,798,170 | | | | 4,798,170 | |
| | | | | | | | | |
TOTAL MUTUAL FUNDS (Cost $4,798,170) | | | | | | | 4,798,170 | |
| | | | | | | | | |
WARRANTS — 0.0% |
Switzerland — 0.0% |
Cie Financiere Richemont SA, Expires 11/22/23, Strike 67.00 (a) | | | 105,484 | | | | 27,405 | |
| | | | | | | | | |
TOTAL WARRANTS (Cost $0) | | | | | | | 27,405 | |
| | | | | | | | | |
TOTAL LONG-TERM INVESTMENTS (Cost $310,436,416) | | | | | | | 402,025,124 | |
| | | Principal
Amount | | | Value | |
SHORT-TERM INVESTMENTS — 0.3% |
Repurchase Agreement — 0.3% |
Fixed Income Clearing Corp., Repurchase Agreement, dated 12/31/20, 0.000%, due 1/04/21 (e) | | $ | 1,159,807 | | | $ | 1,159,807 | |
| | | | | | | | | |
TOTAL SHORT-TERM INVESTMENTS (Cost $1,159,807) | | | | | | | 1,159,807 | |
| | | | | | | | | |
TOTAL INVESTMENTS — 101.2% (Cost $311,596,223) (f) | | | | | | | 403,184,931 | |
| | | | | | | | | |
Other Assets/(Liabilities) — (1.2)% | | | | | | | (4,977,589 | ) |
| | | | | | | | | |
NET ASSETS — 100.0% | | | | | | $ | 398,207,342 | |
Notes to Portfolio of Investments
Percentages are stated as a percent of net assets.
(a) | Non-income producing security. |
(b) | Denotes all or a portion of security on loan. The total value of securities on loan as of December 31, 2020, was $10,278,531 or 2.58% of net assets. Total securities on loan may be less than the amounts identified in the Portfolio of Investments. The Fund received $6,031,067 of non-cash collateral (U.S. Treasury and/or Agency obligations) related to securities lending activity. This amount is not reflected on either the Portfolio of Investments or the Statement of Assets and Liabilities. (Note 2). |
(c) | Security is exempt from registration under Regulation S or Rule 144A of the Securities Act of 1933. These securities are considered restricted and may be resold in transactions exempt from registration. At December 31, 2020, the aggregate market value of these securities amounted to $4,045,180 or 1.02% of net assets. |
(d) | Represents investment of security lending cash collateral. (Note 2). |
(e) | Maturity value of $1,159,807. Collateralized by U.S. Government Agency obligations with a rate of 0.000%, maturity date of 12/30/21, and an aggregate market value, including accrued interest, of $1,183,023. |
(f) | See Note 6 for aggregate cost for federal tax purposes. |
The accompanying notes are an integral part of the financial statements.
123
MML Global Fund – Portfolio of Investments (Continued) |
Notes to Portfolio of Investments (Continued)
Sector weightings, as a percentage of net assets, is as follows:
Consumer, Non-cyclical | | | 35.8 | % |
Industrial | | | 20.3 | % |
Financial | | | 12.8 | % |
Technology | | | 9.1 | % |
Communications | | | 8.6 | % |
Consumer, Cyclical | | | 7.0 | % |
Basic Materials | | | 6.1 | % |
Mutual Funds | | | 1.2 | % |
Total Long-Term Investments | | | 100.9 | % |
Short-Term Investments and Other Assets and Liabilities | | | (0.9 | )% |
Net Assets | | | 100.0 | % |
The accompanying notes are an integral part of the financial statements.
124
MML Growth & Income Fund – Portfolio of Investments |
December 31, 2020 |
| | | Number of
Shares | | | Value | |
EQUITIES — 99.2% |
COMMON STOCK — 99.2% |
Basic Materials — 3.1% |
Chemicals — 3.1% |
DuPont de Nemours, Inc. | | | 20,302 | | | $ | 1,443,675 | |
PPG Industries, Inc. | | | 9,104 | | | | 1,312,979 | |
The Sherwin-Williams Co. | | | 2,779 | | | | 2,042,315 | |
| | | | | | | | 4,798,969 | |
Communications — 10.0% |
Internet — 7.5% |
Alphabet, Inc. Class A (a) | | | 3,584 | | | | 6,281,462 | |
Alphabet, Inc. Class C (a) | | | 1,331 | | | | 2,331,752 | |
Facebook, Inc. Class A (a) | | | 11,234 | | | | 3,068,679 | |
| | | | | | | | 11,681,893 | |
Media — 2.5% |
Cable One, Inc. | | | 225 | | | | 501,237 | |
Comcast Corp. Class A | | | 62,904 | | | | 3,296,170 | |
| | | | | | | | 3,797,407 | |
| | | | | | | | 15,479,300 | |
Consumer, Cyclical — 10.3% |
Apparel — 2.5% |
LVMH Moet Hennessy Louis Vuitton SE | | | 3,734 | | | | 2,333,118 | |
NIKE, Inc. Class B | | | 11,146 | | | | 1,576,824 | |
| | | | | | | | 3,909,942 | |
Retail — 7.8% |
Costco Wholesale Corp. | | | 4,804 | | | | 1,810,051 | |
Dollar General Corp. | | | 9,172 | | | | 1,928,872 | |
The Home Depot, Inc. | | | 9,086 | | | | 2,413,423 | |
Starbucks Corp. | | | 12,481 | | | | 1,335,218 | |
Target Corp. | | | 13,791 | | | | 2,434,525 | |
Tractor Supply Co. | | | 15,273 | | | | 2,147,078 | |
| | | | | | | | 12,069,167 | |
| | | | | | | | 15,979,109 | |
Consumer, Non-cyclical — 25.1% |
Beverages — 2.4% |
Diageo PLC | | | 50,643 | | | | 2,001,467 | |
Pernod Ricard SA | | | 9,371 | | | | 1,796,311 | |
| | | | | | | | 3,797,778 | |
Biotechnology — 1.3% |
Illumina, Inc. (a) | | | 3,485 | | | | 1,289,450 | |
Vertex Pharmaceuticals, Inc. (a) | | | 3,341 | | | | 789,612 | |
| | | | | | | | 2,079,062 | |
Cosmetics & Personal Care — 1.8% |
Colgate-Palmolive Co. | | | 21,346 | | | | 1,825,296 | |
| | | Number of
Shares | | | Value | |
The Estee Lauder Cos., Inc. Class A | | | 3,366 | | | $ | 895,996 | |
| | | | | | | | 2,721,292 | |
Foods — 2.0% |
Danone SA | | | 27,441 | | | | 1,803,586 | |
Mondelez International, Inc. Class A | | | 23,362 | | | | 1,365,976 | |
| | | | | | | | 3,169,562 | |
Health Care – Products — 5.6% |
Danaher Corp. | | | 10,017 | | | | 2,225,176 | |
Medtronic PLC | | | 30,439 | | | | 3,565,625 | |
Thermo Fisher Scientific, Inc. | | | 6,224 | | | | 2,899,015 | |
| | | | | | | | 8,689,816 | |
Health Care – Services — 0.6% |
ICON PLC (a) | | | 4,727 | | | | 921,670 | |
Household Products & Wares — 0.9% |
Kimberly-Clark Corp. | | | 9,892 | | | | 1,333,738 | |
Pharmaceuticals — 10.5% |
Becton Dickinson and Co. | | | 11,714 | | | | 2,931,077 | |
Cigna Corp. | | | 7,414 | | | | 1,543,447 | |
Eli Lilly and Co. | | | 14,210 | | | | 2,399,216 | |
Johnson & Johnson | | | 23,962 | | | | 3,771,140 | |
Merck & Co., Inc. | | | 27,893 | | | | 2,281,647 | |
PRA Health Sciences, Inc. (a) | | | 15,386 | | | | 1,930,020 | |
Zoetis, Inc. | | | 9,127 | | | | 1,510,518 | |
| | | | | | | | 16,367,065 | |
| | | | | | | | 39,079,983 | |
Energy — 1.6% |
Oil & Gas — 0.5% |
ConocoPhillips | | | 21,156 | | | | 846,029 | |
Pipelines — 1.1% |
Enterprise Products Partners LP (b) | | | 85,880 | | | | 1,682,389 | |
| | | | | | | | 2,528,418 | |
Financial — 18.8% |
Banks — 7.3% |
Bank of America Corp. | | | 104,682 | | | | 3,172,911 | |
The Goldman Sachs Group, Inc. | | | 9,701 | | | | 2,558,251 | |
JP Morgan Chase & Co. | | | 30,267 | | | | 3,846,028 | |
Truist Financial Corp. | | | 35,676 | | | | 1,709,950 | |
| | | | | | | | 11,287,140 | |
Diversified Financial Services — 6.8% |
The Charles Schwab Corp. | | | 19,101 | | | | 1,013,117 | |
Mastercard, Inc. Class A | | | 9,638 | | | | 3,440,188 | |
Nasdaq, Inc. | | | 17,799 | | | | 2,362,639 | |
Visa, Inc. Class A | | | 16,924 | | | | 3,701,787 | |
| | | | | | | | 10,517,731 | |
Insurance — 1.0% |
Chubb Ltd. | | | 10,114 | | | | 1,556,747 | |
The accompanying notes are an integral part of the financial statements.
125
MML Growth & Income Fund – Portfolio of Investments (Continued) |
| | | Number of
Shares | | | Value | |
Private Equity — 0.7% |
The Blackstone Group, Inc. Class A | | | 17,746 | | | $ | 1,150,118 | |
Real Estate Investment Trusts (REITS) — 3.0% |
American Tower Corp. | | | 12,645 | | | | 2,838,297 | |
Equinix, Inc. | | | 2,683 | | | | 1,916,145 | |
| | | | | | | | 4,754,442 | |
| | | | | | | | 29,266,178 | |
Industrial — 9.2% |
Aerospace & Defense — 0.7% |
Raytheon Technologies Corp. | | | 14,269 | | | | 1,020,376 | |
Electrical Components & Equipment — 1.3% |
AMETEK, Inc. | | | 16,083 | | | | 1,945,078 | |
Electronics — 4.2% |
Fortive Corp. | | | 23,406 | | | | 1,657,613 | |
Honeywell International, Inc. | | | 15,813 | | | | 3,363,425 | |
TE Connectivity Ltd. | | | 13,015 | | | | 1,575,726 | |
| | | | | | | | 6,596,764 | |
Packaging & Containers — 1.3% |
Crown Holdings, Inc. (a) | | | 20,903 | | | | 2,094,481 | |
Transportation — 1.7% |
Canadian National Railway Co. | | | 21,134 | | | | 2,321,570 | |
Old Dominion Freight Line, Inc. | | | 1,344 | | | | 262,322 | |
| | | | | | | | 2,583,892 | |
| | | | | | | | 14,240,591 | |
Technology — 20.5% |
Computers — 5.1% |
Accenture PLC Class A | | | 8,275 | | | | 2,161,513 | |
Amdocs Ltd. | | | 25,561 | | | | 1,813,042 | |
Apple, Inc. | | | 29,763 | | | | 3,949,252 | |
| | | | | | | | 7,923,807 | |
Semiconductors — 3.6% |
Analog Devices, Inc. | | | 11,331 | | | | 1,673,929 | |
Applied Materials, Inc. | | | 13,411 | | | | 1,157,369 | |
Texas Instruments, Inc. | | | 16,755 | | | | 2,749,998 | |
| | | | | | | | 5,581,296 | |
Software — 11.8% |
Adobe, Inc. (a) | | | 5,592 | | | | 2,796,671 | |
Electronic Arts, Inc. | | | 18,590 | | | | 2,669,524 | |
Fidelity National Information Services, Inc. | | | 21,344 | | | | 3,019,322 | |
Microsoft Corp. | | | 35,099 | | | | 7,806,720 | |
salesforce.com, Inc. (a) | | | 8,909 | | | | 1,982,520 | |
| | | | | | | | 18,274,757 | |
| | | | | | | | 31,779,860 | |
| | | Number of
Shares | | | Value | |
Utilities — 0.6% |
Electric — 0.6% |
American Electric Power Co., Inc. | | | 11,570 | | | $ | 963,434 | |
| | | | | | | | | |
TOTAL COMMON STOCK (Cost $85,862,095) | | | | | | | 154,115,842 | |
| | | | | | | | | |
TOTAL EQUITIES (Cost $85,862,095) | | | | | | | 154,115,842 | |
| | | | | | | | | |
TOTAL LONG-TERM INVESTMENTS (Cost $85,862,095) | | | | | | | 154,115,842 | |
| | | Principal
Amount | | | | | |
SHORT-TERM INVESTMENTS — 0.1% |
Repurchase Agreement — 0.1% |
Fixed Income Clearing Corp., Repurchase Agreement, dated 12/31/20, 0.000%, due 1/04/21 (c) | | $ | 224,561 | | | | 224,561 | |
| | | | | | | | | |
TOTAL SHORT-TERM INVESTMENTS (Cost $224,561) | | | | | | | 224,561 | |
| | | | | | | | | |
TOTAL INVESTMENTS — 99.3% (Cost $86,086,656) (d) | | | | | | | 154,340,403 | |
| | | | | | | | | |
Other Assets/(Liabilities) — 0.7% | | | | | | | 1,018,578 | |
| | | | | | | | | |
NET ASSETS — 100.0% | | | | | | $ | 155,358,981 | |
Notes to Portfolio of Investments
Percentages are stated as a percent of net assets.
(a) | Non-income producing security. |
(b) | Security is a Master Limited Partnership. |
(c) | Maturity value of $224,561. Collateralized by U.S. Government Agency obligations with a rate of 0.000%, maturity date of 12/30/21, and an aggregate market value, including accrued interest, of $229,133. |
(d) | See Note 6 for aggregate cost for federal tax purposes. |
The accompanying notes are an integral part of the financial statements.
126
MML Income & Growth Fund – Portfolio of Investments |
December 31, 2020 |
| | | Number of
Shares | | | Value | |
EQUITIES — 99.5% |
COMMON STOCK — 99.5% |
Basic Materials — 5.2% |
Chemicals — 5.2% |
DuPont de Nemours, Inc. | | | 98,191 | | | $ | 6,982,362 | |
Element Solutions, Inc. | | | 189,149 | | | | 3,353,612 | |
International Flavors & Fragrances, Inc. (a) | | | 11,112 | | | | 1,209,430 | |
Linde PLC | | | 9,190 | | | | 2,421,657 | |
| | | | | | | | 13,967,061 | |
Communications — 4.6% |
Media — 3.3% |
Altice USA, Inc. Class A (b) | | | 72,155 | | | | 2,732,510 | |
Comcast Corp. Class A | | | 116,261 | | | | 6,092,076 | |
| | | | | | | | 8,824,586 | |
Telecommunications — 1.3% |
Verizon Communications, Inc. | | | 59,157 | | | | 3,475,474 | |
| | | | | | | | 12,300,060 | |
Consumer, Cyclical — 9.8% |
Apparel — 0.7% |
Ralph Lauren Corp. | | | 17,482 | | | | 1,813,583 | |
Entertainment — 1.8% |
Marriott Vacations Worldwide Corp. | | | 15,958 | | | | 2,189,757 | |
SeaWorld Entertainment, Inc. (b) | | | 84,599 | | | | 2,672,482 | |
| | | | | | | | 4,862,239 | |
Food Services — 1.0% |
Aramark | | | 71,991 | | | | 2,770,214 | |
Home Builders — 1.3% |
Lennar Corp. Class A | | | 46,269 | | | | 3,527,086 | |
Lodging — 2.6% |
Las Vegas Sands Corp. | | | 38,142 | | | | 2,273,263 | |
Marriott International, Inc. Class A | | | 15,456 | | | | 2,038,955 | |
MGM Resorts International | | | 84,841 | | | | 2,673,340 | |
| | | | | | | | 6,985,558 | |
Retail — 2.4% |
Advance Auto Parts, Inc. | | | 10,973 | | | | 1,728,357 | |
Lowe’s Cos., Inc. | | | 29,096 | | | | 4,670,199 | |
| | | | | | | | 6,398,556 | |
| | | | | | | | 26,357,236 | |
Consumer, Non-cyclical — 18.1% |
Beverages — 3.0% |
Coca-Cola European Partners PLC | | | 119,538 | | | | 5,956,579 | |
Molson Coors Beverage Co. Class B | | | 46,201 | | | | 2,087,823 | |
| | | | | | | | 8,044,402 | |
Biotechnology — 2.3% |
Corteva, Inc. | | | 160,721 | | | | 6,223,117 | |
| | | Number of
Shares | | | Value | |
Commercial Services — 0.8% |
Quanta Services, Inc. | | | 30,686 | | | $ | 2,210,006 | |
Health Care – Products — 3.8% |
Envista Holdings Corp. (b) | | | 47,937 | | | | 1,616,915 | |
Hologic, Inc. (b) | | | 13,285 | | | | 967,546 | |
LivaNova PLC (b) | | | 26,985 | | | | 1,786,677 | |
Medtronic PLC | | | 49,164 | | | | 5,759,071 | |
| | | | | | | | 10,130,209 | |
Health Care – Services — 3.5% |
Anthem, Inc. | | | 6,623 | | | | 2,126,579 | |
Humana, Inc. | | | 3,686 | | | | 1,512,255 | |
UnitedHealth Group, Inc. | | | 16,180 | | | | 5,674,003 | |
| | | | | | | | 9,312,837 | |
Pharmaceuticals — 4.7% |
Cigna Corp. | | | 15,997 | | | | 3,330,255 | |
CVS Health Corp. | | | 82,158 | | | | 5,611,391 | |
Johnson & Johnson | | | 23,075 | | | | 3,631,544 | |
| | | | | | | | 12,573,190 | |
| | | | | | | | 48,493,761 | |
Energy — 5.3% |
Oil & Gas — 5.3% |
Chevron Corp. | | | 19,173 | | | | 1,619,160 | |
Hess Corp. | | | 97,931 | | | | 5,169,778 | |
Phillips 66 | | | 85,678 | | | | 5,992,319 | |
Valero Energy Corp. | | | 24,733 | | | | 1,399,146 | |
| | | | | | | | 14,180,403 | |
Financial — 29.6% |
Banks — 10.3% |
Citigroup, Inc. | | | 43,158 | | | | 2,661,122 | |
The Goldman Sachs Group, Inc. | | | 8,915 | | | | 2,350,975 | |
JP Morgan Chase & Co. | | | 52,080 | | | | 6,617,806 | |
Northern Trust Corp. | | | 41,657 | | | | 3,879,933 | |
US Bancorp | | | 136,508 | | | | 6,359,908 | |
Wells Fargo & Co. | | | 193,374 | | | | 5,836,027 | |
| | | | | | | | 27,705,771 | |
Diversified Financial Services — 5.1% |
AerCap Holdings NV (b) | | | 32,288 | | | | 1,471,687 | |
American Express Co. | | | 49,236 | | | | 5,953,125 | |
Discover Financial Services | | | 22,913 | | | | 2,074,314 | |
Navient Corp. | | | 73,771 | | | | 724,431 | |
PROG Holdings, Inc. | | | 30,848 | | | | 1,661,782 | |
SLM Corp. | | | 153,830 | | | | 1,905,953 | |
| | | | | | | | 13,791,292 | |
Insurance — 7.0% |
American International Group, Inc. | | | 60,268 | | | | 2,281,746 | |
Aon PLC Class A | | | 16,903 | | | | 3,571,097 | |
Assurant, Inc. | | | 13,891 | | | | 1,892,232 | |
The accompanying notes are an integral part of the financial statements.
127
MML Income & Growth Fund – Portfolio of Investments (Continued) |
| | | Number of
Shares | | | Value | |
Axis Capital Holdings Ltd. | | | 28,139 | | | $ | 1,417,924 | |
Chubb Ltd. | | | 33,743 | | | | 5,193,723 | |
Fidelity National Financial, Inc. | | | 57,712 | | | | 2,255,962 | |
Willis Towers Watson PLC | | | 10,043 | | | | 2,115,859 | |
| | | | | | | | 18,728,543 | |
Real Estate — 0.7% |
The Howard Hughes Corp. (b) | | | 23,792 | | | | 1,877,903 | |
Real Estate Investment Trusts (REITS) — 5.6% |
American Campus Communities, Inc. | | | 56,360 | | | | 2,410,517 | |
Corporate Office Properties Trust | | | 136,677 | | | | 3,564,536 | |
Healthpeak Properties, Inc. | | | 95,817 | | | | 2,896,548 | |
MGM Growth Properties LLC Class A | | | 130,911 | | | | 4,097,515 | |
VICI Properties, Inc. | | | 79,240 | | | | 2,020,620 | |
| | | | | | | | 14,989,736 | |
Savings & Loans — 0.9% |
New York Community Bancorp, Inc. | | | 227,279 | | | | 2,397,793 | |
| | | | | | | | 79,491,038 | |
Industrial — 14.5% |
Aerospace & Defense — 4.3% |
General Dynamics Corp. | | | 37,510 | | | | 5,582,238 | |
Raytheon Technologies Corp. | | | 83,248 | | | | 5,953,065 | |
| | | | | | | | 11,535,303 | |
Building Materials — 0.9% |
Owens Corning | | | 30,851 | | | | 2,337,272 | |
Electrical Components & Equipment — 0.7% |
Emerson Electric Co. | | | 24,651 | | | | 1,981,201 | |
Engineering & Construction — 1.4% |
AECOM (b) | | | 44,036 | | | | 2,192,112 | |
Jacobs Engineering Group, Inc. | | | 13,441 | | | | 1,464,531 | |
| | | | | | | | 3,656,643 | |
Hand & Machine Tools — 1.9% |
Stanley Black & Decker, Inc. | | | 28,730 | | | | 5,130,029 | |
Machinery – Construction & Mining — 0.6% |
BWX Technologies, Inc. | | | 27,773 | | | | 1,674,156 | |
Machinery – Diversified — 3.9% |
Deere & Co. | | | 19,452 | | | | 5,233,561 | |
Westinghouse Air Brake Technologies Corp. | | | 72,300 | | | | 5,292,360 | |
| | | | | | | | 10,525,921 | |
| | | Number of
Shares | | | Value | |
Transportation — 0.8% |
J.B. Hunt Transport Services, Inc. | | | 15,427 | | | $ | 2,108,099 | |
| | | | | | | | 38,948,624 | |
Technology — 6.7% |
Computers — 1.7% |
Cognizant Technology Solutions Corp. Class A | | | 55,450 | | | | 4,544,128 | |
Semiconductors — 3.1% |
Broadcom, Inc. | | | 6,342 | | | | 2,776,845 | |
Microchip Technology, Inc. | | | 16,565 | | | | 2,287,792 | |
QUALCOMM, Inc. | | | 13,504 | | | | 2,057,199 | |
Texas Instruments, Inc. | | | 8,131 | | | | 1,334,541 | |
| | | | | | | | 8,456,377 | |
Software — 1.9% |
Oracle Corp. | | | 76,813 | | | | 4,969,033 | |
| | | | | | | | 17,969,538 | |
Utilities — 5.7% |
Electric — 5.7% |
CenterPoint Energy, Inc. | | | 215,377 | | | | 4,660,758 | |
Edison International | | | 33,623 | | | | 2,112,197 | |
Entergy Corp. | | | 31,324 | | | | 3,127,388 | |
Exelon Corp. | | | 131,391 | | | | 5,547,328 | |
| | | | | | | | 15,447,671 | |
| | | | | | | | | |
TOTAL COMMON STOCK (Cost $225,090,144) | | | | | | | 267,155,392 | |
| | | | | | | | | |
TOTAL EQUITIES (Cost $225,090,144) | | | | | | | 267,155,392 | |
| | | | | | | | | |
MUTUAL FUNDS — 0.4% |
Diversified Financial Services — 0.4% |
State Street Navigator Securities Lending Prime Portfolio (c) | | | 1,223,750 | | | | 1,223,750 | |
| | | | | | | | | |
TOTAL MUTUAL FUNDS (Cost $1,223,750) | | | | | | | 1,223,750 | |
| | | | | | | | | |
TOTAL LONG-TERM INVESTMENTS (Cost $226,313,894) | | | | | | | 268,379,142 | |
The accompanying notes are an integral part of the financial statements.
128
MML Income & Growth Fund – Portfolio of Investments (Continued) |
| | | Principal
Amount | | | Value | |
SHORT-TERM INVESTMENTS — 0.4% |
Repurchase Agreement — 0.4% |
Fixed Income Clearing Corp., Repurchase Agreement, dated 12/31/20, 0.000%, due 1/04/21 (d) | | $ | 966,808 | | | $ | 966,808 | |
| | | | | | | | | |
TOTAL SHORT-TERM INVESTMENTS (Cost $966,808) | | | | | | | 966,808 | |
| | | | | | | | | |
TOTAL INVESTMENTS — 100.3% (Cost $227,280,702) (e) | | | | | | | 269,345,950 | |
| | | | | | | | | |
Other Assets/(Liabilities) — (0.3)% | | | | | | | (906,717 | ) |
| | | | | | | | | |
NET ASSETS — 100.0% | | | | | | $ | 268,439,233 | |
Notes to Portfolio of Investments
Percentages are stated as a percent of net assets.
(a) | Denotes all or a portion of security on loan. The total value of securities on loan as of December 31, 2020, was $1,197,240 or 0.45% of net assets. Total securities on loan may be less than the amounts identified in the Portfolio of Investments. (Note 2). |
(b) | Non-income producing security. |
(c) | Represents investment of security lending cash collateral. (Note 2). |
(d) | Maturity value of $966,808. Collateralized by U.S. Government Agency obligations with a rate of 0.000%, maturity date of 12/30/21, and an aggregate market value, including accrued interest, of $986,152. |
(e) | See Note 6 for aggregate cost for federal tax purposes. |
Country weightings, as a percentage of net assets, is as follows:
United States | | | 88.9 | % |
Ireland | | | 5.2 | % |
United Kingdom | | | 2.9 | % |
Switzerland | | | 1.9 | % |
Netherlands | | | 0.5 | % |
Bermuda | | | 0.5 | % |
Total Long-Term Investments | | | 99.9 | % |
Short-Term Investments and Other Assets and Liabilities | | | 0.1 | % |
Net Assets | | | 100.0 | % |
The accompanying notes are an integral part of the financial statements.
129
MML International Equity Fund – Portfolio of Investments |
December 31, 2020 |
| | | Number of
Shares | | | Value | |
EQUITIES — 97.4% |
COMMON STOCK — 97.1% |
Australia — 3.3% |
AMP Ltd. | | | 1,505,394 | | | $ | 1,811,833 | |
Brambles Ltd. | | | 165,200 | | | | 1,353,446 | |
Orica Ltd. | | | 203,167 | | | | 2,376,011 | |
| | | | | | | | 5,541,290 | |
Belgium — 1.0% |
Anheuser-Busch InBev SA | | | 24,200 | | | | 1,691,157 | |
Canada — 3.1% |
Cenovus Energy, Inc. | | | 455,615 | | | | 2,773,994 | |
Open Text Corp. | | | 38,800 | | | | 1,763,054 | |
Restaurant Brands International, Inc. | | | 10,000 | | | | 611,100 | |
| | | | | | | | 5,148,148 | |
Cayman Islands — 1.2% |
Alibaba Group Holding Ltd. Sponsored ADR (a) | | | 3,390 | | | | 788,955 | |
Alibaba Group Holding Ltd. (a) | | | 21,860 | | | | 638,697 | |
Trip.com Group Ltd. ADR (a) | | | 16,900 | | | | 570,037 | |
| | | | | | | | 1,997,689 | |
Finland — 1.0% |
UPM-Kymmene OYJ | | | 45,900 | | | | 1,707,697 | |
France — 9.7% |
Accor SA (a) | | | 100,800 | | | | 3,672,263 | |
BNP Paribas SA (a) | | | 119,950 | | | | 6,326,669 | |
Bureau Veritas SA (a) | | | 20,598 | | | | 547,887 | |
EssilorLuxottica SA | | | 7,305 | | | | 1,139,259 | |
Publicis Groupe SA | | | 59,505 | | | | 2,965,333 | |
Valeo SA | | | 38,010 | | | | 1,501,162 | |
| | | | | | | | 16,152,573 | |
Germany — 20.2% |
Allianz SE Registered | | | 20,640 | | | | 5,050,030 | |
Bayer AG Registered | | | 500 | | | | 29,695 | |
Bayer AG Registered | | | 102,894 | | | | 6,047,876 | |
Bayerische Motoren Werke AG | | | 61,350 | | | | 5,415,124 | |
Continental AG | | | 33,955 | | | | 5,031,418 | |
Daimler AG Registered | | | 89,803 | | | | 6,341,157 | |
Fresenius Medical Care AG & Co. KGaA | | | 29,500 | | | | 2,460,564 | |
Henkel AG & Co. KGaA | | | 6,900 | | | | 664,210 | |
thyssenkrupp AG (a) | | | 500 | | | | 4,890 | |
thyssenkrupp AG (a) | | | 271,674 | | | | 2,697,144 | |
| | | | | | | | 33,742,108 | |
India — 1.6% |
Axis Bank Ltd. (a) | | | 313,742 | | | | 2,664,574 | |
Indonesia — 0.5% |
Bank Mandiri Persero Tbk PT | | | 1,858,700 | | | | 838,776 | |
| | | Number of
Shares | | | Value | |
Ireland — 1.2% |
Ryanair Holdings PLC (a) | | | 8,000 | | | $ | 159,354 | |
Ryanair Holdings PLC Sponsored ADR (a) | | | 17,410 | | | | 1,914,752 | |
| | | | | | | | 2,074,106 | |
Italy — 4.1% |
Intesa Sanpaolo SpA (a) | | | 2,934,200 | | | | 6,845,596 | |
Japan — 2.2% |
Komatsu Ltd. | | | 63,600 | | | | 1,742,808 | |
Toyota Motor Corp. | | | 25,900 | | | | 1,985,985 | |
| | | | | | | | 3,728,793 | |
Mexico — 0.9% |
Grupo Televisa SAB Sponsored ADR (a) | | | 174,600 | | | | 1,438,704 | |
Netherlands — 5.8% |
CNH Industrial NV (a) | | | 476,953 | | | | 6,043,912 | |
EXOR NV | | | 45,400 | | | | 3,644,140 | |
| | | | | | | | 9,688,052 | |
Republic of Korea — 1.6% |
NAVER Corp. | | | 6,860 | | | | 1,852,347 | |
Samsung Electronics Co. Ltd. | | | 10,550 | | | | 788,480 | |
| | | | | | | | 2,640,827 | |
South Africa — 2.5% |
Naspers Ltd. | | | 20,215 | | | | 4,137,438 | |
Spain — 1.1% |
Amadeus IT Group SA | | | 26,000 | | | | 1,882,341 | |
Sweden — 4.1% |
Hennes & Mauritz AB Class B (a) | | | 128,318 | | | | 2,680,352 | |
SKF AB Class B | | | 79,000 | | | | 2,046,848 | |
Volvo AB Class B (a) | | | 85,770 | | | | 2,018,367 | |
| | | | | | | | 6,745,567 | |
Switzerland — 9.3% |
Cie Financiere Richemont SA Registered | | | 19,540 | | | | 1,765,680 | |
Credit Suisse Group AG Registered | | | 529,009 | | | | 6,805,497 | |
LafargeHolcim Ltd. Registered | | | 34,659 | | | | 1,901,990 | |
Novartis AG Registered | | | 22,100 | | | | 2,087,363 | |
Roche Holding AG | | | 3,670 | | | | 1,280,492 | |
The Swatch Group AG | | | 5,830 | | | | 1,588,964 | |
| | | | | | | | 15,429,986 | |
United Kingdom — 22.7% |
Ashtead Group PLC | | | 36,774 | | | | 1,730,538 | |
Bunzl PLC | | | 14,000 | | | | 467,973 | |
Compass Group PLC | | | 86,400 | | | | 1,612,260 | |
G4S PLC (a) | | | 392,100 | | | | 1,360,907 | |
Glencore PLC (a) | | | 2,613,644 | | | | 8,337,261 | |
Liberty Global PLC Class C (a) | | | 11,800 | | | | 279,070 | |
The accompanying notes are an integral part of the financial statements.
130
MML International Equity Fund – Portfolio of Investments (Continued) |
| | | Number of
Shares | | | Value | |
Liberty Global PLC Series A (a) | | | 118,900 | | | $ | 2,879,758 | |
Lloyds Banking Group PLC (a) | | | 14,511,000 | | | | 7,314,744 | |
Natwest Group PLC (a) | | | 1,210,800 | | | | 2,800,314 | |
Prudential PLC | | | 187,300 | | | | 3,457,227 | |
Rolls-Royce Holdings PLC (a) | | | 1,153,648 | | | | 1,756,423 | |
Schroders PLC | | | 54,200 | | | | 2,475,626 | |
Smiths Group PLC | | | 46,700 | | | | 966,544 | |
WPP PLC | | | 214,092 | | | | 2,326,117 | |
| | | | | | | | 37,764,762 | |
| | | | | | | | | |
TOTAL COMMON STOCK (Cost $140,729,977) | | | | | | | 161,860,184 | |
| | | | | | | | | |
PREFERRED STOCK — 0.3% |
Germany — 0.3% |
Henkel AG & Co. KGaA 1.980% | | | 4,100 | | | | 462,005 | |
| | | | | | | | | |
TOTAL PREFERRED STOCK (Cost $410,515) | | | | | | | 462,005 | |
| | | | | | | | | |
TOTAL EQUITIES (Cost $141,140,492) | | | | | | | 162,322,189 | |
| | | | | | | | | |
WARRANTS — 0.0% |
Switzerland — 0.0% |
Cie Financiere Richemont SA, Expires 11/22/23, Strike 67.00 (a) | | | 44,280 | | | | 11,504 | |
| | | | | | | | | |
TOTAL WARRANTS (Cost $0) | | | | | | | 11,504 | |
| | | | | | | | | |
TOTAL LONG-TERM INVESTMENTS (Cost $141,140,492) | | | | | | | 162,333,693 | |
| | | Principal
Amount | | | Value | |
SHORT-TERM INVESTMENTS — 2.4% |
Repurchase Agreement — 2.4% |
Fixed Income Clearing Corp., Repurchase Agreement, dated 12/31/20, 0.000%, due 1/04/21 (b) | | $ | 4,051,484 | | | $ | 4,051,484 | |
| | | | | | | | | |
TOTAL SHORT-TERM INVESTMENTS (Cost $4,051,484) | | | | | | | 4,051,484 | |
| | | | | | | | | |
TOTAL INVESTMENTS — 99.8% (Cost $145,191,976) (c) | | | | | | | 166,385,177 | |
| | | | | | | | | |
Other Assets/(Liabilities) — 0.2% | | | | | | | 330,540 | |
| | | | | | | | | |
NET ASSETS — 100.0% | | | | | | $ | 166,715,717 | |
Abbreviation Legend
ADR | American Depositary Receipt |
Notes to Portfolio of Investments
Percentages are stated as a percent of net assets.
(a) | Non-income producing security. |
(b) | Maturity value of $4,051,484. Collateralized by U.S. Government Agency obligations with a rate of 0.000%, maturity date of 12/30/21, and an aggregate market value, including accrued interest, of $4,132,588. |
(c) | See Note 6 for aggregate cost for federal tax purposes. |
Sector weightings, as a percentage of net assets, is as follows:
Financial | | | 30.1 | % |
Consumer, Cyclical | | | 22.1 | % |
Consumer, Non-cyclical | | | 13.6 | % |
Communications | | | 10.7 | % |
Industrial | | | 10.1 | % |
Basic Materials | | | 7.6 | % |
Energy | | | 1.7 | % |
Technology | | | 1.5 | % |
Total Long-Term Investments | | | 97.4 | % |
Short-Term Investments and Other Assets and Liabilities | | | 2.6 | % |
Net Assets | | | 100.0 | % |
Forward contracts
Counterparty | | Settlement
Date | | | Currency Purchased | | | Currency Sold | | | Unrealized
Appreciation
(Depreciation) | |
State Street Bank and Trust Co* | | | 6/16/21 | | | | USD | | | | 2,137,566 | | | | CHF | | | | 1,886,000 | | | $ | (2,916 | ) |
* Contracts are subject to a Master Netting Agreement.
Currency Legend
The accompanying notes are an integral part of the financial statements.
131
MML Large Cap Growth Fund – Portfolio of Investments |
December 31, 2020 |
| | | Number of
Shares | | | Value | |
EQUITIES — 99.5% |
COMMON STOCK — 99.5% |
Communications — 29.8% |
Internet — 23.0% |
Alibaba Group Holding Ltd. Sponsored ADR (a) | | | 28,599 | | | $ | 6,655,845 | |
Alphabet, Inc. Class A (a) | | | 2,246 | | | | 3,936,430 | |
Alphabet, Inc. Class C (a) | | | 2,252 | | | | 3,945,234 | |
Amazon.com, Inc. (a) | | | 3,125 | | | | 10,177,906 | |
Facebook, Inc. Class A (a) | | | 29,702 | | | | 8,113,398 | |
| | | | | | | | 32,828,813 | |
Media — 5.2% |
FactSet Research Systems, Inc. | | | 6,060 | | | | 2,014,950 | |
The Walt Disney Co. (a) | | | 30,130 | | | | 5,458,953 | |
| | | | | | | | 7,473,903 | |
Telecommunications — 1.6% |
Cisco Systems, Inc. | | | 51,229 | | | | 2,292,498 | |
| | | | | | | | 42,595,214 | |
Consumer, Cyclical — 4.9% |
Retail — 4.9% |
Starbucks Corp. | | | 36,437 | | | | 3,898,030 | |
Yum China Holdings, Inc. | | | 23,968 | | | | 1,368,333 | |
Yum! Brands, Inc. | | | 16,182 | | | | 1,756,718 | |
| | | | | | | | 7,023,081 | |
Consumer, Non-cyclical — 18.9% |
Beverages — 3.5% |
Monster Beverage Corp. (a) | | | 53,993 | | | | 4,993,273 | |
Biotechnology — 4.8% |
Illumina, Inc. (a) | | | 9,070 | | | | 3,355,900 | |
Regeneron Pharmaceuticals, Inc. (a) | | | 7,330 | | | | 3,541,196 | |
| | | | | | | | 6,897,096 | |
Commercial Services — 0.7% |
Automatic Data Processing, Inc. | | | 5,515 | | | | 971,743 | |
Cosmetics & Personal Care — 1.6% |
Colgate-Palmolive Co. | | | 25,822 | | | | 2,208,039 | |
Health Care – Products — 1.3% |
Intuitive Surgical, Inc. (a) | | | 2,275 | | | | 1,861,178 | |
Pharmaceuticals — 7.0% |
Novartis AG Sponsored ADR | | | 52,819 | | | | 4,987,698 | |
Novo Nordisk A/S Sponsored ADR | | | 18,183 | | | | 1,270,083 | |
Roche Holding AG Sponsored ADR | | | 85,229 | | | | 3,736,439 | |
| | | | | | | | 9,994,220 | |
| | | | | | | | 26,925,549 | |
| | | Number of
Shares | | | Value | |
Energy — 1.3% |
Oil & Gas Services — 1.3% |
Schlumberger NV | | | 81,902 | | | $ | 1,787,921 | |
Financial — 7.2% |
Diversified Financial Services — 7.2% |
SEI Investments Co. | | | 34,749 | | | | 1,997,025 | |
Visa, Inc. Class A | | | 37,545 | | | | 8,212,218 | |
| | | | | | | | 10,209,243 | |
Industrial — 10.5% |
Aerospace & Defense — 4.5% |
The Boeing Co. | | | 29,875 | | | | 6,395,042 | |
Machinery – Diversified — 3.8% |
Deere & Co. | | | 20,317 | | | | 5,466,289 | |
Transportation — 2.2% |
Expeditors International of Washington, Inc. | | | 33,306 | | | | 3,167,734 | |
| | | | | | | | 15,029,065 | |
Technology — 26.9% |
Semiconductors — 7.2% |
NVIDIA Corp. | | | 12,287 | | | | 6,416,271 | |
QUALCOMM, Inc. | | | 24,870 | | | | 3,788,696 | |
| | | | | | | | 10,204,967 | |
Software — 19.7% |
Autodesk, Inc. (a) | | | 24,691 | | | | 7,539,150 | |
Cerner Corp. | | | 29,639 | | | | 2,326,069 | |
Microsoft Corp. | | | 25,440 | | | | 5,658,365 | |
Oracle Corp. | | | 80,985 | | | | 5,238,920 | |
salesforce.com, Inc. (a) | | | 24,071 | | | | 5,356,519 | |
Workday, Inc. Class A (a) | | | 8,589 | | | | 2,058,010 | |
| | | | | | | | 28,177,033 | |
| | | | | | | | 38,382,000 | |
| | | | | | | | | |
TOTAL COMMON STOCK (Cost $80,843,905) | | | | | | | 141,952,073 | |
| | | | | | | | | |
TOTAL EQUITIES (Cost $80,843,905) | | | | | | | 141,952,073 | |
| | | | | | | | | |
TOTAL LONG-TERM INVESTMENTS (Cost $80,843,905) | | | | | | | 141,952,073 | |
The accompanying notes are an integral part of the financial statements.
132
MML Large Cap Growth Fund – Portfolio of Investments (Continued) |
| | | Principal
Amount | | | Value | |
SHORT-TERM INVESTMENTS — 0.6% |
Repurchase Agreement — 0.6% |
Fixed Income Clearing Corp., Repurchase Agreement, dated 12/31/20, 0.000%, due 1/04/21 (b) | | $ | 939,592 | | | $ | 939,592 | |
| | | | | | | | | |
TOTAL SHORT-TERM INVESTMENTS (Cost $939,592) | | | | | | | 939,592 | |
| | | | | | | | | |
TOTAL INVESTMENTS — 100.1% (Cost $81,783,497) (c) | | | | | | | 142,891,665 | |
| | | | | | | | | |
Other Assets/(Liabilities) — (0.1)% | | | | | | | (202,083 | ) |
| | | | | | | | | |
NET ASSETS — 100.0% | | | | | | $ | 142,689,582 | |
Abbreviation Legend
ADR | American Depositary Receipt |
Notes to Portfolio of Investments
Percentages are stated as a percent of net assets.
(a) | Non-income producing security. |
(b) | Maturity value of $939,592. Collateralized by U.S. Government Agency obligations with a rate of 0.000%, maturity date of 12/30/21, and an aggregate market value, including accrued interest, of $958,484. |
(c) | See Note 6 for aggregate cost for federal tax purposes. |
Country weightings, as a percentage of net assets, is as follows:
United States | | | 86.5 | % |
Switzerland | | | 6.1 | % |
Cayman Islands | | | 4.7 | % |
Netherlands | | | 1.3 | % |
Denmark | | | 0.9 | % |
Total Long-Term Investments | | | 99.5 | % |
Short-Term Investments and Other Assets and Liabilities | | | 0.5 | % |
Net Assets | | | 100.0 | % |
The accompanying notes are an integral part of the financial statements.
133
MML Managed Volatility Fund – Portfolio of Investments |
December 31, 2020 |
| | | Number of
Shares | | | Value | |
EQUITIES — 94.5% |
COMMON STOCK — 94.5% |
Basic Materials — 2.0% |
Chemicals — 1.6% |
Air Products & Chemicals, Inc. (a) | | | 939 | | | $ | 256,553 | |
Albemarle Corp. (a) | | | 446 | | | | 65,794 | |
Celanese Corp. (a) | | | 519 | | | | 67,439 | |
CF Industries Holdings, Inc. (a) | | | 918 | | | | 35,536 | |
Dow, Inc. (a) | | | 3,130 | | | | 173,715 | |
DuPont de Nemours, Inc. (a) | | | 3,099 | | | | 220,370 | |
Eastman Chemical Co. (a) | | | 580 | | | | 58,162 | |
Ecolab, Inc. (a) | | | 1,052 | | | | 227,611 | |
FMC Corp. (a) | | | 574 | | | | 65,970 | |
International Flavors & Fragrances, Inc. (a) | | | 463 | | | | 50,393 | |
Linde PLC (a) | | | 2,239 | | | | 589,999 | |
LyondellBasell Industries NV Class A (a) | | | 1,119 | | | | 102,567 | |
The Mosaic Co. (a) | | | 1,487 | | | | 34,216 | |
PPG Industries, Inc. (a) | | | 1,029 | | | | 148,402 | |
The Sherwin-Williams Co. (a) | | | 357 | | | | 262,363 | |
| | | | | | | | 2,359,090 | |
Forest Products & Paper — 0.1% |
International Paper Co. (a) | | | 1,711 | | | | 85,071 | |
Iron & Steel — 0.0% |
Nucor Corp. (a) | | | 1,230 | | | | 65,424 | |
Mining — 0.3% |
Freeport-McMoRan, Inc. (a) | | | 6,314 | | | | 164,290 | |
Newmont Corp. (a) | | | 3,426 | | | | 205,183 | |
| | | | | | | | 369,473 | |
| | | | | | | | 2,879,058 | |
Communications — 15.4% |
Advertising — 0.1% |
The Interpublic Group of Cos., Inc. (a) | | | 1,664 | | | | 39,137 | |
Omnicom Group, Inc. (a) | | | 939 | | | | 58,566 | |
| | | | | | | | 97,703 | |
Internet — 10.7% |
Alphabet, Inc. Class A (a) (b) | | | 1,291 | | | | 2,262,658 | |
Alphabet, Inc. Class C (a) (b) | | | 1,243 | | | | 2,177,587 | |
Amazon.com, Inc. (a) (b) | | | 1,829 | | | | 5,956,925 | |
Booking Holdings, Inc. (a) (b) | | | 175 | | | | 389,772 | |
CDW Corp. (a) | | | 603 | | | | 79,470 | |
eBay, Inc. (a) | | | 2,861 | | | | 143,765 | |
Etsy, Inc. (a) (b) | | | 535 | | | | 95,182 | |
Expedia Group, Inc. (a) | | | 593 | | | | 78,513 | |
F5 Networks, Inc. (a) (b) | | | 279 | | | | 49,087 | |
Facebook, Inc. Class A (a) (b) | | | 10,307 | | | | 2,815,460 | |
| | | Number of
Shares | | | Value | |
Netflix, Inc. (a) (b) | | | 1,893 | | | $ | 1,023,602 | |
NortonLifeLock, Inc. (a) | | | 2,650 | | | | 55,067 | |
Twitter, Inc. (a) (b) | | | 3,385 | | | | 183,298 | |
VeriSign, Inc. (a) (b) | | | 439 | | | | 95,000 | |
| | | | | | | | 15,405,386 | |
Media — 2.2% |
Charter Communications, Inc. Class A (a) (b) | | | 623 | | | | 412,146 | |
Comcast Corp. Class A (a) | | | 19,553 | | | | 1,024,577 | |
Discovery, Inc. Class A (b) (c) | | | 885 | | | | 26,630 | |
Discovery, Inc. Class C (a) (b) | | | 1,091 | | | | 28,573 | |
DISH Network Corp. Class A (a) (b) | | | 1,002 | | | | 32,405 | |
Fox Corp. Class A (a) | | | 1,094 | | | | 31,857 | |
Fox Corp. Class B (a) (b) | | | 1,077 | | | | 31,104 | |
News Corp. Class A (a) | | | 1,161 | | | | 20,863 | |
News Corp. Class B | | | 1,016 | | | | 18,054 | |
ViacomCBS, Inc. Class B (a) | | | 2,475 | | | | 92,218 | |
The Walt Disney Co. (a) (b) | | | 7,756 | | | | 1,405,232 | |
| | | | | | | | 3,123,659 | |
Telecommunications — 2.4% |
Arista Networks, Inc. (a) (b) | | | 235 | | | | 68,284 | |
AT&T, Inc. (a) | | | 30,484 | | | | 876,720 | |
CenturyLink, Inc. (a) | | | 4,170 | | | | 40,657 | |
Cisco Systems, Inc. (a) | | | 18,067 | | | | 808,498 | |
Corning, Inc. (a) | | | 3,318 | | | | 119,448 | |
Juniper Networks, Inc. (a) | | | 1,537 | | | | 34,598 | |
Motorola Solutions, Inc. (a) | | | 712 | | | | 121,083 | |
T-Mobile US, Inc. (a) (b) | | | 2,554 | | | | 344,407 | |
Verizon Communications, Inc. (a) | | | 17,739 | | | | 1,042,166 | |
| | | | | | | | 3,455,861 | |
| | | | | | | | 22,082,609 | |
Consumer, Cyclical — 9.2% |
Airlines — 0.3% |
Alaska Air Group, Inc. (a) | | | 549 | | | | 28,548 | |
American Airlines Group, Inc. (a) (c) | | | 2,517 | | | | 39,693 | |
Delta Air Lines, Inc. (a) | | | 2,635 | | | | 105,953 | |
Southwest Airlines Co. (a) | | | 2,604 | | | | 121,373 | |
United Airlines Holdings, Inc. (a) (b) | | | 1,308 | | | | 56,571 | |
| | | | | | | | 352,138 | |
Apparel — 0.7% |
Hanesbrands, Inc. | | | 1,559 | | | | 22,730 | |
NIKE, Inc. Class B (a) | | | 5,371 | | | | 759,835 | |
PVH Corp. (a) | | | 322 | | | | 30,233 | |
Ralph Lauren Corp. | | | 221 | | | | 22,926 | |
Tapestry, Inc. (a) | | | 1,175 | | | | 36,519 | |
Under Armour, Inc. Class A (a) (b) | | | 604 | | | | 10,371 | |
Under Armour, Inc. Class C (b) | | | 912 | | | | 13,571 | |
The accompanying notes are an integral part of the financial statements.
134
MML Managed Volatility Fund – Portfolio of Investments (Continued) |
| | | Number of
Shares | | | Value | |
VF Corp. (a) | | | 1,375 | | | $ | 117,439 | |
| | | | | | | | 1,013,624 | |
Auto Manufacturers — 2.1% |
Cummins, Inc. (a) | | | 640 | | | | 145,344 | |
Ford Motor Co. (a) | | | 16,960 | | | | 149,078 | |
General Motors Co. (a) | | | 5,332 | | | | 222,025 | |
PACCAR, Inc. (a) | | | 1,441 | | | | 124,329 | |
Tesla, Inc. (a) (b) | | | 3,251 | | | | 2,294,133 | |
| | | | | | | | 2,934,909 | |
Auto Parts & Equipment — 0.1% |
Aptiv PLC (a) | | | 1,179 | | | | 153,612 | |
BorgWarner, Inc. (a) | | | 1,040 | | | | 40,185 | |
| | | | | | | | 193,797 | |
Distribution & Wholesale — 0.3% |
Copart, Inc. (a) (b) | | | 865 | | | | 110,071 | |
Fastenal Co. (a) | | | 2,396 | | | | 116,997 | |
LKQ Corp. (a) (b) | | | 1,202 | | | | 42,359 | |
Pool Corp. (a) | | | 170 | | | | 63,325 | |
W.W. Grainger, Inc. (a) | | | 183 | | | | 74,726 | |
| | | | | | | | 407,478 | |
Entertainment — 0.0% |
Live Nation Entertainment, Inc. (a) (b) | | | 620 | | | | 45,558 | |
Home Builders — 0.2% |
D.R. Horton, Inc. (a) | | | 1,365 | | | | 94,076 | |
Lennar Corp. Class A (a) | | | 1,181 | | | | 90,028 | |
NVR, Inc. (a) (b) | | | 15 | | | | 61,198 | |
PulteGroup, Inc. (a) | | | 1,153 | | | | 49,717 | |
| | | | | | | | 295,019 | |
Home Furnishing — 0.1% |
Leggett & Platt, Inc. (a) | | | 541 | | | | 23,966 | |
Whirlpool Corp. (a) | | | 258 | | | | 46,567 | |
| | | | | | | | 70,533 | |
Housewares — 0.0% |
Newell Brands, Inc. (a) | | | 1,635 | | | | 34,711 | |
Leisure Time — 0.1% |
Carnival Corp. (a) | | | 3,230 | | | | 69,962 | |
Norwegian Cruise Line Holdings Ltd. (a) (b) | | | 1,367 | | | | 34,763 | |
Royal Caribbean Cruises Ltd. (a) | | | 817 | | | | 61,021 | |
| | | | | | | | 165,746 | |
Lodging — 0.3% |
Hilton Worldwide Holdings, Inc. (a) | | | 1,209 | | | | 134,513 | |
Las Vegas Sands Corp. (a) | | | 1,384 | | | | 82,486 | |
Marriott International, Inc. Class A (a) | | | 1,122 | | | | 148,014 | |
MGM Resorts International (a) | | | 1,833 | | | | 57,758 | |
Wynn Resorts Ltd. (a) | | | 437 | | | | 49,307 | |
| | | | | | | | 472,078 | |
| | | Number of
Shares | | | Value | |
Retail — 5.0% |
Advance Auto Parts, Inc. (a) | | | 302 | | | $ | 47,568 | |
AutoZone, Inc. (a) (b) | | | 101 | | | | 119,729 | |
Best Buy Co., Inc. (a) | | | 997 | | | | 99,491 | |
CarMax, Inc. (a) (b) | | | 672 | | | | 63,477 | |
Chipotle Mexican Grill, Inc. (a) (b) | | | 118 | | | | 163,632 | |
Costco Wholesale Corp. (a) | | | 1,885 | | | | 710,230 | |
Darden Restaurants, Inc. (a) | | | 560 | | | | 66,707 | |
Dollar General Corp. (a) | | | 1,038 | | | | 218,291 | |
Dollar Tree, Inc. (a) (b) | | | 1,019 | | | | 110,093 | |
Domino’s Pizza, Inc. (a) | | | 171 | | | | 65,572 | |
The Gap, Inc. | | | 999 | | | | 20,170 | |
Genuine Parts Co. (a) | | | 611 | | | | 61,363 | |
The Home Depot, Inc. (a) | | | 4,609 | | | | 1,224,243 | |
L Brands, Inc. (a) | | | 1,040 | | | | 38,678 | |
Lowe’s Cos., Inc. (a) | | | 3,126 | | | | 501,754 | |
McDonald’s Corp. (a) | | | 3,190 | | | | 684,510 | |
O’Reilly Automotive, Inc. (a) (b) | | | 314 | | | | 142,107 | |
Ross Stores, Inc. (a) | | | 1,550 | | | | 190,356 | |
Starbucks Corp. (a) | | | 5,019 | | | | 536,933 | |
Target Corp. (a) | | | 2,136 | | | | 377,068 | |
Tiffany & Co. (a) | | | 453 | | | | 59,547 | |
The TJX Cos., Inc. (a) | | | 5,111 | | | | 349,030 | |
Tractor Supply Co. (a) | | | 504 | | | | 70,852 | |
Ulta Beauty, Inc. (a) (b) | | | 251 | | | | 72,077 | |
Walgreens Boots Alliance, Inc. (a) | | | 3,039 | | | | 121,195 | |
Walmart, Inc. (a) | | | 5,941 | | | | 856,395 | |
Yum! Brands, Inc. (a) | | | 1,270 | | | | 137,871 | |
| | | | | | | | 7,108,939 | |
Textiles — 0.0% |
Mohawk Industries, Inc. (a) (b) | | | 259 | | | | 36,506 | |
Toys, Games & Hobbies — 0.0% |
Hasbro, Inc. (a) | | | 563 | | | | 52,663 | |
| | | | | | | | 13,183,699 | |
Consumer, Non-cyclical — 19.8% |
Agriculture — 0.7% |
Altria Group, Inc. (a) | | | 7,867 | | | | 322,547 | |
Archer-Daniels-Midland Co. (a) | | | 2,461 | | | | 124,059 | |
Philip Morris International, Inc. (a) | | | 6,646 | | | | 550,222 | |
| | | | | | | | 996,828 | |
Beverages — 1.5% |
Brown-Forman Corp. Class B (a) | | | 790 | | | | 62,750 | |
The Coca-Cola Co. (a) | | | 16,541 | | | | 907,108 | |
Constellation Brands, Inc. Class A (a) | | | 733 | | | | 160,564 | |
Molson Coors Beverage Co. Class B (a) | | | 811 | | | | 36,649 | |
Monster Beverage Corp. (a) (b) | | | 1,639 | | | | 151,575 | |
The accompanying notes are an integral part of the financial statements.
135
MML Managed Volatility Fund – Portfolio of Investments (Continued) |
| | | Number of
Shares | | | Value | |
PepsiCo, Inc. (a) | | | 5,913 | | | $ | 876,898 | |
| | | | | | | | 2,195,544 | |
Biotechnology — 1.5% |
Alexion Pharmaceuticals, Inc. (a) (b) | | | 957 | | | | 149,522 | |
Amgen, Inc. (a) | | | 2,493 | | | | 573,191 | |
Bio-Rad Laboratories, Inc. Class A (a) (b) | | | 93 | | | | 54,213 | |
Biogen, Inc. (a) (b) | | | 672 | | | | 164,546 | |
Corteva, Inc. (a) | | | 3,253 | | | | 125,956 | |
Gilead Sciences, Inc. (a) | | | 5,366 | | | | 312,623 | |
Illumina, Inc. (a) (b) | | | 622 | | | | 230,140 | |
Incyte Corp. (a) (b) | | | 790 | | | | 68,714 | |
Regeneron Pharmaceuticals, Inc. (a) (b) | | | 448 | | | | 216,433 | |
Vertex Pharmaceuticals, Inc. (a) (b) | | | 1,105 | | | | 261,156 | |
| | | | | | | | 2,156,494 | |
Commercial Services — 2.3% |
Automatic Data Processing, Inc. (a) | | | 1,828 | | | | 322,094 | |
Cintas Corp. (a) | | | 368 | | | | 130,073 | |
Equifax, Inc. (a) | | | 511 | | | | 98,541 | |
FleetCor Technologies, Inc. (a) (b) | | | 369 | | | | 100,674 | |
Gartner, Inc. (a) (b) | | | 398 | | | | 63,756 | |
Global Payments, Inc. (a) | | | 1,272 | | | | 274,014 | |
IHS Markit Ltd. (a) | | | 1,639 | | | | 147,231 | |
MarketAxess Holdings, Inc. (a) | | | 165 | | | | 94,142 | |
Moody’s Corp. (a) | | | 703 | | | | 204,039 | |
Nielsen Holdings PLC (a) | | | 1,534 | | | | 32,015 | |
PayPal Holdings, Inc. (a) (b) | | | 5,021 | | | | 1,175,918 | |
Quanta Services, Inc. (a) | | | 556 | | | | 40,043 | |
Robert Half International, Inc. | | | 489 | | | | 30,553 | |
Rollins, Inc. (a) | | | 946 | | | | 36,960 | |
S&P Global, Inc. (a) | | | 1,027 | | | | 337,606 | |
United Rentals, Inc. (a) (b) | | | 319 | | | | 73,979 | |
Verisk Analytics, Inc. (a) | | | 720 | | | | 149,465 | |
| | | | | | | | 3,311,103 | |
Cosmetics & Personal Care — 1.4% |
Colgate-Palmolive Co. (a) | | | 3,743 | | | | 320,064 | |
The Estee Lauder Cos., Inc. Class A (a) | | | 964 | | | | 256,607 | |
The Procter & Gamble Co. (a) | | | 10,627 | | | | 1,478,641 | |
| | | | | | | | 2,055,312 | |
Foods — 1.1% |
Campbell Soup Co. (a) | | | 877 | | | | 42,403 | |
Conagra Brands, Inc. (a) | | | 2,155 | | | | 78,140 | |
General Mills, Inc. (a) | | | 2,630 | | | | 154,644 | |
The Hershey Co. (a) | | | 632 | | | | 96,273 | |
Hormel Foods Corp. (a) | | | 1,112 | | | | 51,830 | |
The J.M. Smucker Co. (a) | | | 459 | | | | 53,060 | |
| | | Number of
Shares | | | Value | |
Kellogg Co. (a) | | | 1,041 | | | $ | 64,782 | |
The Kraft Heinz Co. (a) | | �� | 2,914 | | | | 100,999 | |
The Kroger Co. (a) | | | 3,274 | | | | 103,982 | |
Lamb Weston Holdings, Inc. (a) | | | 655 | | | | 51,575 | |
McCormick & Co., Inc. (a) | | | 1,106 | | | | 105,734 | |
Mondelez International, Inc. Class A (a) | | | 6,210 | | | | 363,099 | |
Sysco Corp. (a) | | | 2,224 | | | | 165,154 | |
Tyson Foods, Inc. Class A (a) | | | 1,227 | | | | 79,068 | |
| | | | | | | | 1,510,743 | |
Health Care – Products — 3.7% |
Abbott Laboratories (a) | | | 7,590 | | | | 831,029 | |
ABIOMED, Inc. (a) (b) | | | 195 | | | | 63,219 | |
Baxter International, Inc. (a) | | | 2,229 | | | | 178,855 | |
Boston Scientific Corp. (a) (b) | | | 6,067 | | | | 218,109 | |
The Cooper Cos., Inc. (a) | | | 217 | | | | 78,840 | |
Danaher Corp. (a) | | | 2,705 | | | | 600,889 | |
Edwards Lifesciences Corp. (a) (b) | | | 2,649 | | | | 241,668 | |
Hologic, Inc. (a) (b) | | | 1,134 | | | | 82,589 | |
IDEXX Laboratories, Inc. (a) (b) | | | 372 | | | | 185,952 | |
Intuitive Surgical, Inc. (a) (b) | | | 501 | | | | 409,868 | |
Medtronic PLC (a) | | | 5,757 | | | | 674,375 | |
ResMed, Inc. (a) | | | 632 | | | | 134,338 | |
Steris PLC (a) | | | 350 | | | | 66,339 | |
Stryker Corp. (a) | | | 1,393 | | | | 341,341 | |
Teleflex, Inc. (a) | | | 205 | | | | 84,372 | |
Thermo Fisher Scientific, Inc. (a) | | | 1,695 | | | | 789,497 | |
Varian Medical Systems, Inc. (a) (b) | | | 404 | | | | 70,704 | |
West Pharmaceutical Services, Inc. (a) | | | 309 | | | | 87,543 | |
Zimmer Biomet Holdings, Inc. (a) | | | 900 | | | | 138,681 | |
| | | | | | | | 5,278,208 | |
Health Care – Services — 2.0% |
Anthem, Inc. (a) | | | 1,062 | | | | 340,997 | |
Catalent, Inc. (a) (b) | | | 716 | | | | 74,514 | |
Centene Corp. (a) (b) | | | 2,462 | | | | 147,794 | |
DaVita, Inc. (a) (b) | | | 317 | | | | 37,216 | |
HCA Healthcare, Inc. (a) | | | 1,123 | | | | 184,689 | |
Humana, Inc. (a) | | | 563 | | | | 230,982 | |
IQVIA Holdings, Inc. (a) (b) | | | 839 | | | | 150,324 | |
Laboratory Corp. of America Holdings (a) (b) | | | 423 | | | | 86,102 | |
Quest Diagnostics, Inc. (a) | | | 585 | | | | 69,714 | |
UnitedHealth Group, Inc. (a) | | | 4,068 | | | | 1,426,566 | |
Universal Health Services, Inc. Class B (a) | | | 333 | | | | 45,787 | |
| | | | | | | | 2,794,685 | |
Household Products & Wares — 0.3% |
Avery Dennison Corp. (a) | | | 363 | | | | 56,305 | |
The accompanying notes are an integral part of the financial statements.
136
MML Managed Volatility Fund – Portfolio of Investments (Continued) |
| | | Number of
Shares | | | Value | |
Church & Dwight Co., Inc. (a) | | | 1,088 | | | $ | 94,906 | |
The Clorox Co. (a) | | | 522 | | | | 105,402 | |
Kimberly-Clark Corp. (a) | | | 1,482 | | | | 199,818 | |
| | | | | | | | 456,431 | |
Pharmaceuticals — 5.3% |
AbbVie, Inc. (a) | | | 7,566 | | | | 810,697 | |
Align Technology, Inc. (a) (b) | | | 305 | | | | 162,986 | |
AmerisourceBergen Corp. (a) | | | 619 | | | | 60,513 | |
Becton Dickinson and Co. (a) | | | 1,239 | | | | 310,023 | |
Bristol-Myers Squibb Co. (a) | | | 9,666 | | | | 599,582 | |
Cardinal Health, Inc. (a) | | | 1,319 | | | | 70,646 | |
Cigna Corp. (a) | | | 1,541 | | | | 320,805 | |
CVS Health Corp. (a) | | | 5,598 | | | | 382,343 | |
Dentsply Sirona, Inc. (a) | | | 956 | | | | 50,056 | |
DexCom, Inc. (a) (b) | | | 409 | | | | 151,215 | |
Eli Lilly and Co. (a) | | | 3,400 | | | | 574,056 | |
Henry Schein, Inc. (a) (b) | | | 660 | | | | 44,128 | |
Johnson & Johnson (a) | | | 11,291 | | | | 1,776,978 | |
McKesson Corp. (a) | | | 678 | | | | 117,918 | |
Merck & Co., Inc. (a) | | | 10,843 | | | | 886,957 | |
Perrigo Co. PLC (a) | | | 645 | | | | 28,844 | |
Pfizer, Inc. (a) | | | 23,820 | | | | 876,814 | |
Viatris, Inc. (a) (b) | | | 5,086 | | | | 95,312 | |
Zoetis, Inc. (a) | | | 2,025 | | | | 335,138 | |
| | | | | | | | 7,655,011 | |
| | | | | | | | 28,410,359 | |
Energy — 2.1% |
Oil & Gas — 1.7% |
Apache Corp. (a) | | | 1,625 | | | | 23,059 | |
Cabot Oil & Gas Corp. (a) | | | 1,649 | | | | 26,846 | |
Chevron Corp. (a) | | | 8,229 | | | | 694,939 | |
Concho Resources, Inc. (a) | | | 876 | | | | 51,115 | |
ConocoPhillips (a) | | | 4,643 | | | | 185,673 | |
Devon Energy Corp. (a) | | | 1,623 | | | | 25,660 | |
Diamondback Energy, Inc. (a) | | | 723 | | | | 34,993 | |
EOG Resources, Inc. (a) | | | 2,532 | | | | 126,271 | |
Exxon Mobil Corp. (a) | | | 18,080 | | | | 745,257 | |
Hess Corp. (a) | | | 1,130 | | | | 59,653 | |
HollyFrontier Corp. (a) | | | 570 | | | | 14,734 | |
Marathon Oil Corp. | | | 3,114 | | | | 20,770 | |
Marathon Petroleum Corp. (a) | | | 2,752 | | | | 113,823 | |
Occidental Petroleum Corp. (a) | | | 3,622 | | | | 62,697 | |
Phillips 66 (a) | | | 1,894 | | | | 132,466 | |
Pioneer Natural Resources Co. (a) | | | 685 | | | | 78,015 | |
Valero Energy Corp. (a) | | | 1,775 | | | | 100,412 | |
| | | | | | | | 2,496,383 | |
| | | Number of
Shares | | | Value | |
Oil & Gas Services — 0.2% |
Baker Hughes Co. (a) | | | 2,922 | | | $ | 60,924 | |
Halliburton Co. (a) | | | 3,865 | | | | 73,049 | |
Nov, Inc. (a) | | | 1,740 | | | | 23,890 | |
Schlumberger NV (a) | | | 5,978 | | | | 130,500 | |
TechnipFMC PLC (a) | | | 2,016 | | | | 18,950 | |
| | | | | | | | 307,313 | |
Pipelines — 0.2% |
Kinder Morgan, Inc. (a) | | | 8,186 | | | | 111,903 | |
ONEOK, Inc. (a) | | | 1,870 | | | | 71,770 | |
The Williams Cos., Inc. (a) | | | 5,285 | | | | 105,964 | |
| | | | | | | | 289,637 | |
| | | | | | | | 3,093,333 | |
Financial — 13.7% |
Banks — 4.5% |
Bank of America Corp. (a) | | | 32,535 | | | | 986,136 | |
The Bank of New York Mellon Corp. (a) | | | 3,539 | | | | 150,195 | |
Citigroup, Inc. (a) | | | 8,897 | | | | 548,589 | |
Citizens Financial Group, Inc. (a) | | | 1,866 | | | | 66,728 | |
Comerica, Inc. (a) | | | 544 | | | | 30,388 | |
Fifth Third Bancorp (a) | | | 3,055 | | | | 84,226 | |
First Republic Bank (a) | | | 756 | | | | 111,079 | |
The Goldman Sachs Group, Inc. (a) | | | 1,468 | | | | 387,126 | |
Huntington Bancshares, Inc. (a) | | | 4,334 | | | | 54,738 | |
JP Morgan Chase & Co. (a) | | | 13,059 | | | | 1,659,407 | |
KeyCorp (a) | | | 4,230 | | | | 69,414 | |
M&T Bank Corp. (a) | | | 512 | | | | 65,178 | |
Morgan Stanley (a) | | | 6,108 | | | | 418,581 | |
Northern Trust Corp. (a) | | | 922 | | | | 85,875 | |
The PNC Financial Services Group, Inc. (a) | | | 1,852 | | | | 275,948 | |
Regions Financial Corp. (a) | | | 4,120 | | | | 66,414 | |
State Street Corp. (a) | | | 1,540 | | | | 112,081 | |
SVB Financial Group (a) (b) | | | 225 | | | | 87,262 | |
Truist Financial Corp. (a) | | | 5,705 | | | | 273,441 | |
US Bancorp (a) | | | 5,984 | | | | 278,795 | |
Wells Fargo & Co. (a) | | | 17,670 | | | | 533,281 | |
Zions Bancorp NA (a) | | | 742 | | | | 32,233 | |
| | | | | | | | 6,377,115 | |
Diversified Financial Services — 3.8% |
American Express Co. (a) | | | 2,774 | | | | 335,404 | |
Ameriprise Financial, Inc. (a) | | | 510 | | | | 99,108 | |
BlackRock, Inc. (a) | | | 606 | | | | 437,253 | |
Capital One Financial Corp. (a) | | | 2,001 | | | | 197,799 | |
Cboe Global Markets, Inc. (a) | | | 465 | | | | 43,301 | |
The Charles Schwab Corp. (a) | | | 6,383 | | | | 338,554 | |
CME Group, Inc. (a) | | | 1,535 | | | | 279,447 | |
The accompanying notes are an integral part of the financial statements.
137
MML Managed Volatility Fund – Portfolio of Investments (Continued) |
| | | Number of
Shares | | | Value | |
Discover Financial Services (a) | | | 1,339 | | | $ | 121,220 | |
Franklin Resources, Inc. (a) | | | 1,127 | | | | 28,164 | |
Intercontinental Exchange, Inc. (a) | | | 2,396 | | | | 276,235 | |
Invesco Ltd. (a) | | | 1,776 | | | | 30,956 | |
Mastercard, Inc. Class A (a) | | | 3,769 | | | | 1,345,307 | |
Nasdaq, Inc. (a) | | | 492 | | | | 65,308 | |
Raymond James Financial, Inc. (a) | | | 534 | | | | 51,088 | |
Synchrony Financial (a) | | | 2,291 | | | | 79,520 | |
T. Rowe Price Group, Inc. (a) | | | 958 | | | | 145,032 | |
Visa, Inc. Class A (a) | | | 7,269 | | | | 1,589,948 | |
The Western Union Co. (a) | | | 1,764 | | | | 38,702 | |
| | | | | | | | 5,502,346 | |
Insurance — 3.1% |
Aflac, Inc. (a) | | | 2,889 | | | | 128,474 | |
The Allstate Corp. (a) | | | 1,319 | | | | 144,998 | |
American International Group, Inc. (a) | | | 3,621 | | | | 137,091 | |
Aon PLC Class A (a) | | | 997 | | | | 210,636 | |
Arthur J Gallagher & Co. (a) | | | 792 | | | | 97,978 | |
Assurant, Inc. (a) | | | 240 | | | | 32,693 | |
Berkshire Hathaway, Inc. Class B (a) (b) | | | 8,351 | | | | 1,936,347 | |
Chubb Ltd. (a) | | | 1,971 | | | | 303,376 | |
Cincinnati Financial Corp. (a) | | | 644 | | | | 56,266 | |
Everest Re Group Ltd. (a) | | | 169 | | | | 39,561 | |
Globe Life, Inc. (a) | | | 441 | | | | 41,877 | |
The Hartford Financial Services Group, Inc. (a) | | | 1,546 | | | | 75,723 | |
Lincoln National Corp. (a) | | | 720 | | | | 36,223 | |
Loews Corp. (a) | | | 993 | | | | 44,705 | |
Marsh & McLennan Cos., Inc. (a) | | | 2,154 | | | | 252,018 | |
MetLife, Inc. (a) | | | 3,180 | | | | 149,301 | |
Principal Financial Group, Inc. (a) | | | 1,011 | | | | 50,156 | |
The Progressive Corp. (a) | | | 2,498 | | | | 247,002 | |
Prudential Financial, Inc. (a) | | | 1,725 | | | | 134,671 | |
The Travelers Cos., Inc. (a) | | | 1,100 | | | | 154,407 | |
Unum Group | | | 818 | | | | 18,765 | |
W.R. Berkley Corp. (a) | | | 571 | | | | 37,926 | |
Willis Towers Watson PLC (a) | | | 564 | | | | 118,824 | |
| | | | | | | | 4,449,018 | |
Real Estate — 0.1% |
CBRE Group, Inc. Class A (a) (b) | | | 1,391 | | | | 87,244 | |
Real Estate Investment Trusts (REITS) — 2.2% |
Alexandria Real Estate Equities, Inc. (a) | | | 503 | | | | 89,645 | |
American Tower Corp. (a) | | | 1,897 | | | | 425,801 | |
AvalonBay Communities, Inc. (a) | | | 604 | | | | 96,900 | |
Boston Properties, Inc. (a) | | | 593 | | | | 56,056 | |
Crown Castle International Corp. (a) | | | 1,838 | | | | 292,591 | |
| | | Number of
Shares | | | Value | |
Digital Realty Trust, Inc. (a) | | | 1,224 | | | $ | 170,760 | |
Duke Realty Corp. (a) | | | 1,584 | | | | 63,312 | |
Equinix, Inc. (a) | | | 389 | | | | 277,816 | |
Equity Residential (a) | | | 1,415 | | | | 83,881 | |
Essex Property Trust, Inc. (a) | | | 290 | | | | 68,852 | |
Extra Space Storage, Inc. (a) | | | 558 | | | | 64,650 | |
Federal Realty Investment Trust (a) | | | 313 | | | | 26,643 | |
Healthpeak Properties, Inc. (a) | | | 2,180 | | | | 65,901 | |
Host Hotels & Resorts, Inc. (a) | | | 3,039 | | | | 44,461 | |
Iron Mountain, Inc. (c) | | | 1,189 | | | | 35,052 | |
Kimco Realty Corp. (a) | | | 1,680 | | | | 25,217 | |
Mid-America Apartment Communities, Inc. (a) | | | 487 | | | | 61,698 | |
Prologis, Inc. (a) | | | 3,147 | | | | 313,630 | |
Public Storage (a) | | | 641 | | | | 148,026 | |
Realty Income Corp. (a) | | | 1,519 | | | | 94,436 | |
Regency Centers Corp. (a) | | | 732 | | | | 33,372 | |
SBA Communications Corp. (a) | | | 489 | | | | 137,962 | |
Simon Property Group, Inc. (a) | | | 1,389 | | | | 118,454 | |
SL Green Realty Corp. (a) | | | 335 | | | | 19,959 | |
UDR, Inc. (a) | | | 1,165 | | | | 44,771 | |
Ventas, Inc. (a) | | | 1,627 | | | | 79,788 | |
Vornado Realty Trust (a) | | | 718 | | | | 26,810 | |
Welltower, Inc. (a) | | | 1,820 | | | | 117,608 | |
Weyerhaeuser Co. (a) | | | 3,246 | | | | 108,838 | |
| | | | | | | | 3,192,890 | |
Savings & Loans — 0.0% |
People’s United Financial, Inc. (a) | | | 1,553 | | | | 20,080 | |
| | | | | | | | 19,628,693 | |
Industrial — 7.8% |
Aerospace & Defense — 1.5% |
The Boeing Co. (a) | | | 2,271 | | | | 486,130 | |
General Dynamics Corp. (a) | | | 1,013 | | | | 150,755 | |
Howmet Aerospace, Inc. (a) | | | 1,688 | | | | 48,176 | |
L3 Harris Technologies, Inc. (a) | | | 917 | | | | 173,331 | |
Lockheed Martin Corp. (a) | | | 1,050 | | | | 372,729 | |
Northrop Grumman Corp. (a) | | | 658 | | | | 200,506 | |
Raytheon Technologies Corp. (a) | | | 6,473 | | | | 462,884 | |
Teledyne Technologies, Inc. (a) (b) | | | 159 | | | | 62,325 | |
TransDigm Group, Inc. (a) (b) | | | 239 | | | | 147,905 | |
| | | | | | | | 2,104,741 | |
Building Materials — 0.4% |
Carrier Global Corp. (a) | | | 3,572 | | | | 134,736 | |
Fortune Brands Home & Security, Inc. | | | 596 | | | | 51,089 | |
Johnson Controls International PLC (a) | | | 3,175 | | | | 147,923 | |
Martin Marietta Materials, Inc. (a) | | | 268 | | | | 76,104 | |
Masco Corp. (a) | | | 1,136 | | | | 62,401 | |
The accompanying notes are an integral part of the financial statements.
138
MML Managed Volatility Fund – Portfolio of Investments (Continued) |
| | | Number of
Shares | | | Value | |
Vulcan Materials Co. (a) | | | 591 | | | $ | 87,651 | |
| | | | | | | | 559,904 | |
Electrical Components & Equipment — 0.2% |
AMETEK, Inc. (a) | | | 934 | | | | 112,958 | |
Emerson Electric Co. (a) | | | 2,609 | | | | 209,685 | |
| | | | | | | | 322,643 | |
Electronics — 1.4% |
Agilent Technologies, Inc. (a) | | | 1,342 | | | | 159,014 | |
Allegion PLC (a) | | | 387 | | | | 45,039 | |
Amphenol Corp. Class A (a) | | | 1,318 | | | | 172,355 | |
FLIR Systems, Inc. (a) | | | 538 | | | | 23,581 | |
Fortive Corp. (a) | | | 1,453 | | | | 102,901 | |
Garmin Ltd. (a) | | | 652 | | | | 78,018 | |
Honeywell International, Inc. (a) | | | 2,979 | | | | 633,633 | |
Keysight Technologies, Inc. (a) (b) | | | 773 | | | | 102,106 | |
Mettler-Toledo International, Inc. (a) (b) | | | 104 | | | | 118,527 | |
PerkinElmer, Inc. (a) | | | 468 | | | | 67,158 | |
Roper Technologies, Inc. (a) | | | 458 | | | | 197,439 | |
TE Connectivity Ltd. (a) | | | 1,379 | | | | 166,955 | |
Vontier Corp. (b) | | | 573 | | | | 19,138 | |
Waters Corp. (a) (b) | | | 271 | | | | 67,051 | |
| | | | | | | | 1,952,915 | |
Engineering & Construction — 0.0% |
Jacobs Engineering Group, Inc. (a) | | | 584 | | | | 63,633 | |
Environmental Controls — 0.2% |
Pentair PLC (a) | | | 699 | | | | 37,110 | |
Republic Services, Inc. (a) | | | 872 | | | | 83,974 | |
Waste Management, Inc. (a) | | | 1,697 | | | | 200,127 | |
| | | | | | | | 321,211 | |
Hand & Machine Tools — 0.1% |
Snap-on, Inc. (a) | | | 227 | | | | 38,849 | |
Stanley Black & Decker, Inc. (a) | | | 674 | | | | 120,349 | |
| | | | | | | | 159,198 | |
Machinery – Construction & Mining — 0.3% |
Caterpillar, Inc. (a) | | | 2,320 | | | | 422,286 | |
Machinery – Diversified — 0.7% |
Deere & Co. (a) | | | 1,335 | | | | 359,182 | |
Dover Corp. (a) | | | 640 | | | | 80,800 | |
Flowserve Corp. (a) | | | 534 | | | | 19,678 | |
IDEX Corp. (a) | | | 330 | | | | 65,736 | |
Ingersoll Rand, Inc. (a) (b) | | | 1,604 | | | | 73,078 | |
Otis Worldwide Corp. (a) | | | 1,713 | | | | 115,713 | |
Rockwell Automation, Inc. (a) | | | 504 | | | | 126,408 | |
Westinghouse Air Brake Technologies Corp. (a) | | | 764 | | | | 55,925 | |
| | | Number of
Shares | | | Value | |
Xylem, Inc. (a) | | | 783 | | | $ | 79,702 | |
| | | | | | | | 976,222 | |
Miscellaneous – Manufacturing — 1.2% |
3M Co. (a) | | | 2,455 | | | | 429,110 | |
A.O. Smith Corp. (a) | | | 560 | | | | 30,699 | |
Eaton Corp. PLC (a) | | | 1,737 | | | | 208,683 | |
General Electric Co. (a) | | | 37,354 | | | | 403,423 | |
Illinois Tool Works, Inc. (a) | | | 1,264 | | | | 257,705 | |
Parker-Hannifin Corp. (a) | | | 559 | | | | 152,277 | |
Textron, Inc. (a) | | | 990 | | | | 47,847 | |
Trane Technologies PLC (a) | | | 1,052 | | | | 152,708 | |
| | | | | | | | 1,682,452 | |
Packaging & Containers — 0.2% |
Amcor PLC (a) | | | 6,862 | | | | 80,766 | |
Ball Corp. (a) | | | 1,428 | | | | 133,061 | |
Packaging Corp. of America (a) | | | 412 | | | | 56,819 | |
Sealed Air Corp. (a) | | | 671 | | | | 30,725 | |
WestRock Co. (a) | | | 1,141 | | | | 49,667 | |
| | | | | | | | 351,038 | |
Shipbuilding — 0.0% |
Huntington Ingalls Industries, Inc. (a) | | | 173 | | | | 29,493 | |
Transportation — 1.6% |
C.H. Robinson Worldwide, Inc. (a) | | | 598 | | | | 56,134 | |
CSX Corp. (a) | | | 3,239 | | | | 293,939 | |
Expeditors International of Washington, Inc. (a) | | | 741 | | | | 70,477 | |
FedEx Corp. (a) | | | 1,028 | | | | 266,889 | |
J.B. Hunt Transport Services, Inc. (a) | | | 372 | | | | 50,834 | |
Kansas City Southern (a) | | | 399 | | | | 81,448 | |
Norfolk Southern Corp. (a) | | | 1,074 | | | | 255,193 | |
Old Dominion Freight Line, Inc. (a) | | | 436 | | | | 85,098 | |
Union Pacific Corp. (a) | | | 2,882 | | | | 600,090 | |
United Parcel Service, Inc. Class B (a) | | | 3,059 | | | | 515,136 | |
| | | | | | | | 2,275,238 | |
| | | | | | | | 11,220,974 | |
Technology — 21.9% |
Computers — 7.7% |
Accenture PLC Class A (a) | | | 2,712 | | | | 708,401 | |
Apple, Inc. (a) | | | 68,532 | | | | 9,093,511 | |
Cognizant Technology Solutions Corp. Class A (a) | | | 2,329 | | | | 190,861 | |
DXC Technology Co. (a) | | | 1,085 | | | | 27,939 | |
Fortinet, Inc. (a) (b) | | | 596 | | | | 88,524 | |
Hewlett Packard Enterprise Co. (a) | | | 5,769 | | | | 68,363 | |
HP, Inc. (a) | | | 5,971 | | | | 146,827 | |
International Business Machines Corp. (a) | | | 3,809 | | | | 479,477 | |
Leidos Holdings, Inc. (a) | | | 588 | | | | 61,810 | |
The accompanying notes are an integral part of the financial statements.
139
MML Managed Volatility Fund – Portfolio of Investments (Continued) |
| | | Number of
Shares | | | Value | |
NetApp, Inc. (a) | | | 961 | | | $ | 63,657 | |
Seagate Technology PLC (a) | | | 970 | | | | 60,295 | |
Western Digital Corp. (a) | | | 1,266 | | | | 70,124 | |
| | | | | | | | 11,059,789 | |
Office & Business Equipment — 0.1% |
Xerox Holdings Corp. (a) | | | 681 | | | | 15,793 | |
Zebra Technologies Corp. Class A (a) (b) | | | 231 | | | | 88,780 | |
| | | | | | | | 104,573 | |
Semiconductors — 4.8% |
Advanced Micro Devices, Inc. (a) (b) | | | 5,150 | | | | 472,307 | |
Analog Devices, Inc. (a) | | | 1,607 | | | | 237,402 | |
Applied Materials, Inc. (a) | | | 3,896 | | | | 336,225 | |
Broadcom, Inc. (a) | | | 1,734 | | | | 759,232 | |
Intel Corp. (a) | | | 17,570 | | | | 875,337 | |
IPG Photonics Corp. (a) (b) | | | 153 | | | | 34,240 | |
KLA Corp. (a) | | | 656 | | | | 169,845 | |
Lam Research Corp. (a) | | | 615 | | | | 290,446 | |
Maxim Integrated Products, Inc. (a) | | | 1,188 | | | | 105,316 | |
Microchip Technology, Inc. (a) | | | 1,109 | | | | 153,164 | |
Micron Technology, Inc. (b) | | | 4,756 | | | | 357,556 | |
NVIDIA Corp. (a) | | | 2,654 | | | | 1,385,919 | |
Qorvo, Inc. (a) (b) | | | 476 | | | | 79,145 | |
QUALCOMM, Inc. (a) | | | 4,847 | | | | 738,392 | |
Skyworks Solutions, Inc. (a) | | | 718 | | | | 109,768 | |
Teradyne, Inc. (a) | | | 689 | | | | 82,604 | |
Texas Instruments, Inc. (a) | | | 3,933 | | | | 645,523 | |
Xilinx, Inc. (a) | | | 1,068 | | | | 151,410 | |
| | | | | | | | 6,983,831 | |
Software — 9.3% |
Activision Blizzard, Inc. (a) | | | 3,297 | | | | 306,126 | |
Adobe, Inc. (a) (b) | | | 2,054 | | | | 1,027,246 | |
Akamai Technologies, Inc. (a) (b) | | | 725 | | | | 76,118 | |
ANSYS, Inc. (a) (b) | | | 373 | | | | 135,697 | |
Autodesk, Inc. (a) (b) | | | 936 | | | | 285,798 | |
Broadridge Financial Solutions, Inc. (a) | | | 478 | | | | 73,230 | |
Cadence Design Systems, Inc. (a) (b) | | | 1,169 | | | | 159,487 | |
Cerner Corp. (a) | | | 1,327 | | | | 104,143 | |
Citrix Systems, Inc. (a) | | | 516 | | | | 67,132 | |
Electronic Arts, Inc. (a) | | | 1,268 | | | | 182,085 | |
Fidelity National Information Services, Inc. (a) | | | 2,647 | | | | 374,445 | |
Fiserv, Inc. (a) (b) | | | 2,461 | | | | 280,209 | |
Intuit, Inc. (a) | | | 1,120 | | | | 425,432 | |
Jack Henry & Associates, Inc. (a) | | | 337 | | | | 54,591 | |
| | | Number of
Shares | | | Value | |
Microsoft Corp. (a) | | | 32,425 | | | $ | 7,211,968 | |
MSCI, Inc. (a) | | | 353 | | | | 157,625 | |
Oracle Corp. (a) | | | 8,123 | | | | 525,477 | |
Paychex, Inc. (a) | | | 1,422 | | | | 132,502 | |
Paycom Software, Inc. (a) (b) | | | 215 | | | | 97,234 | |
salesforce.com, Inc. (a) (b) | | | 3,919 | | | | 872,095 | |
ServiceNow, Inc. (a) (b) | | | 834 | | | | 459,059 | |
Synopsys, Inc. (a) (b) | | | 662 | | | | 171,617 | |
Take-Two Interactive Software, Inc. (a) (b) | | | 485 | | | | 100,778 | |
Tyler Technologies, Inc. (a) (b) | | | 170 | | | | 74,208 | |
| | | | | | | | 13,354,302 | |
| | | | | | | | 31,502,495 | |
Utilities — 2.6% |
Electric — 2.4% |
AES Corp. (a) | | | 2,771 | | | | 65,119 | |
Alliant Energy Corp. (a) | | | 936 | | | | 48,232 | |
Ameren Corp. (a) | | | 1,083 | | | | 84,539 | |
American Electric Power Co., Inc. (a) | | | 2,161 | | | | 179,946 | |
CenterPoint Energy, Inc. | | | 2,318 | | | | 50,162 | |
CMS Energy Corp. (a) | | | 1,103 | | | | 67,294 | |
Consolidated Edison, Inc. (a) | | | 1,468 | | | | 106,092 | |
Dominion Energy, Inc. (a) | | | 3,565 | | | | 268,088 | |
DTE Energy Co. (a) | | | 839 | | | | 101,863 | |
Duke Energy Corp. (a) | | | 3,217 | | | | 294,549 | |
Edison International (a) | | | 1,644 | | | | 103,276 | |
Entergy Corp. (a) | | | 835 | | | | 83,366 | |
Evergy, Inc. | | | 1,020 | | | | 56,620 | |
Eversource Energy (a) | | | 1,516 | | | | 131,149 | |
Exelon Corp. (a) | | | 4,256 | | | | 179,688 | |
FirstEnergy Corp. (a) | | | 2,258 | | | | 69,117 | |
NextEra Energy, Inc. (a) | | | 8,361 | | | | 645,051 | |
NRG Energy, Inc. (a) | | | 1,052 | | | | 39,503 | |
Pinnacle West Capital Corp. (a) | | | 482 | | | | 38,536 | |
PPL Corp. (a) | | | 3,363 | | | | 94,837 | |
Public Service Enterprise Group, Inc. (a) | | | 2,198 | | | | 128,143 | |
Sempra Energy (a) | | | 1,258 | | | | 160,282 | |
The Southern Co. (a) | | | 4,432 | | | | 272,258 | |
WEC Energy Group, Inc. (a) | | | 1,361 | | | | 125,253 | |
Xcel Energy, Inc. (a) | | | 2,158 | | | | 143,874 | |
| | | | | | | | 3,536,837 | |
Gas — 0.1% |
Atmos Energy Corp. (a) | | | 570 | | | | 54,395 | |
NiSource, Inc. (a) | | | 1,756 | | | | 40,283 | |
| | | | | | | | 94,678 | |
The accompanying notes are an integral part of the financial statements.
140
MML Managed Volatility Fund – Portfolio of Investments (Continued) |
| | | Number of
Shares | | | Value | |
Water — 0.1% |
American Water Works Co., Inc. (a) | | | 788 | | | $ | 120,934 | |
| | | | | | | | 3,752,449 | |
| | | | | | | | | |
TOTAL COMMON STOCK (Cost $80,872,088) | | | | | | | 135,753,669 | |
| | | | | | | | | |
TOTAL EQUITIES (Cost $80,872,088) | | | | | | | 135,753,669 | |
| | | Principal
Amount | | | | | |
BONDS & NOTES — 0.0% |
CORPORATE DEBT — 0.0% |
Forest Products & Paper — 0.0% |
Sino Forest Corp. 5.000% 8/01/49 (d) (e) | | $ | 359,000 | | | | — | |
| | | | | | | | | |
TOTAL CORPORATE DEBT (Cost $0) | | | | | | | — | |
| | | | | | | | | |
TOTAL BONDS & NOTES (Cost $0) | | | | | | | — | |
| | | Number of
Shares | | | | | |
MUTUAL FUNDS — 0.0% |
Diversified Financial Services — 0.0% |
State Street Navigator Securities Lending Prime Portfolio (f) | | | 33,892 | | | | 33,892 | |
| | | | | | | | | |
TOTAL MUTUAL FUNDS (Cost $33,892) | | | | | | | 33,892 | |
| | | | | | | | | |
TOTAL PURCHASED OPTIONS (#) — 0.6% (Cost $1,520,634) | | | | | | | 838,968 | |
| | | | | | | | | |
TOTAL LONG-TERM INVESTMENTS (Cost $82,426,614) | | | | | | | 136,626,529 | |
| | | Principal
Amount | | | Value | |
SHORT-TERM INVESTMENTS — 1.9% |
Repurchase Agreement — 1.9% |
Fixed Income Clearing Corp., Repurchase Agreement, dated 12/31/20, 0.000%, due 1/04/21 (g) | | $ | 2,709,183 | | | $ | 2,709,183 | |
| | | | | | | | | |
TOTAL SHORT-TERM INVESTMENTS (Cost $2,709,183) | | | | | | | 2,709,183 | |
| | | | | | | | | |
TOTAL INVESTMENTS — 97.0% (Cost $85,135,797) (h) | | | | | | | 139,335,712 | |
| | | | | | | | | |
Other Assets/(Liabilities) — 3.0% | | | | | | | 4,259,624 | |
| | | | | | | | | |
NET ASSETS — 100.0% | | | | | | $ | 143,595,336 | |
Notes to Portfolio of Investments
Percentages are stated as a percent of net assets.
(a) | A portion of this security is pledged/held as collateral for open derivatives. (Note 2). |
(b) | Non-income producing security. |
(c) | Denotes all or a portion of security on loan. The total value of securities on loan as of December 31, 2020, was $46,787 or 0.03% of net assets. Total securities on loan may be less than the amounts identified in the Portfolio of Investments. The Fund received $13,874 of non-cash collateral (U.S. Treasury and/or Agency obligations) related to securities lending activity. This amount is not reflected on either the Portfolio of Investments or the Statement of Assets and Liabilities. (Note 2). |
(d) | Investment was valued using significant unobservable inputs. |
(e) | This security is fair valued in good faith in accordance with procedures approved by the Board of Trustees. At December 31, 2020, these securities amounted to a value of $0 or 0.00% of net assets. |
(f) | Represents investment of security lending cash collateral. (Note 2). |
(g) | Maturity value of $2,709,183. Collateralized by U.S. Government Agency obligations with a rate of 0.000%, maturity date of 12/30/21, and an aggregate market value, including accrued interest, of $2,763,382. |
(h) | See Note 6 for aggregate cost for federal tax purposes. |
The accompanying notes are an integral part of the financial statements.
141
MML Managed Volatility Fund – Portfolio of Investments (Continued) |
(#) Exchange-Traded Options Purchased
Description | | Expiration
Date | | | Exercise
Price | | | No. of
Contracts | | | Notional
Amount | | | Value | | | Premiums
Paid
(Received) | | | Unrealized
Appreciation/
(Depreciation) | |
Put | | | | | | | | | | | | | | | | | | | | | | | | | | | | | | | | |
S&P 500 Index | | | 2/19/21 | | | | 3,175.00 | | | | 56 | | | | USD | | | | 17,780,000 | | | $ | 77,280 | | | $ | 323,372 | | | $ | (246,092 | ) |
S&P 500 Index | | | 2/19/21 | | | | 3,200.00 | | | | 36 | | | | USD | | | | 11,520,000 | | | | 60,732 | | | | 233,903 | | | | (173,171 | ) |
S&P 500 Index | | | 2/19/21 | | | | 3,250.00 | | | | 36 | | | | USD | | | | 11,700,000 | | | | 65,880 | | | | 145,170 | | | | (79,290 | ) |
S&P 500 Index | | | 2/19/21 | | | | 3,350.00 | | | | 36 | | | | USD | | | | 12,060,000 | | | | 89,280 | | | | 135,414 | | | | (46,134 | ) |
S&P 500 Index | | | 3/19/21 | | | | 3,250.00 | | | | 36 | | | | USD | | | | 11,700,000 | | | | 132,876 | | | | 199,098 | | | | (66,222 | ) |
S&P 500 Index | | | 3/19/21 | | | | 3,300.00 | | | | 56 | | | | USD | | | | 18,480,000 | | | | 248,640 | | | | 317,380 | | | | (68,740 | ) |
S&P 500 Index | | | 3/19/21 | | | | 3,325.00 | | | | 37 | | | | USD | | | | 12,302,500 | | | | 164,280 | | | | 166,297 | | | | (2,017 | ) |
| | | | | | | | | | | | | | | | | | | | | | | $ | 838,968 | | | $ | 1,520,634 | | | $ | (681,666 | ) |
Exchange-Traded Options Written
Description | | Expiration
Date | | | Exercise
Price | | | No. of
Contracts | | | Notional
Amount | | | Value | | | Premiums
Paid
(Received) | | | Unrealized
Appreciation/
(Depreciation) | |
Call | | | | | | | | | | | | | | | | | | | | | | | | | | | | | | | | |
S&P 500 Index | | | 1/15/21 | | | | 3,600.00 | | | | 40 | | | | USD | | | | 14,400,000 | | | $ | (665,480 | ) | | $ | (401,820 | ) | | $ | (263,660 | ) |
S&P 500 Index | | | 1/15/21 | | | | 3,650.00 | | | | 40 | | | | USD | | | | 14,600,000 | | | | (528,000 | ) | | | (466,780 | ) | | | (61,220 | ) |
S&P 500 Index | | | 1/15/21 | | | | 3,700.00 | | | | 40 | | | | USD | | | | 14,800,000 | | | | (355,560 | ) | | | (250,300 | ) | | | (105,260 | ) |
S&P 500 Index | | | 1/15/21 | | | | 3,750.00 | | | | 40 | | | | USD | | | | 15,000,000 | | | | (210,400 | ) | | | (208,700 | ) | | | (1,700 | ) |
S&P 500 Index | | | 1/29/21 | | | | 3,750.00 | | | | 40 | | | | USD | | | | 15,000,000 | | | | (302,600 | ) | | | (245,100 | ) | | | (57,500 | ) |
S&P 500 Index | | | 2/19/21 | | | | 3,600.00 | | | | 40 | | | | USD | | | | 14,400,000 | | | | (763,080 | ) | | | (525,660 | ) | | | (237,420 | ) |
S&P 500 Index | | | 2/19/21 | | | | 3,625.00 | | | | 40 | | | | USD | | | | 14,500,000 | | | | (733,840 | ) | | | (634,460 | ) | | | (99,380 | ) |
S&P 500 Index | | | 2/19/21 | | | | 3,725.00 | | | | 40 | | | | USD | | | | 14,900,000 | | | | (460,240 | ) | | | (439,940 | ) | | | (20,300 | ) |
S&P 500 Index | | | 3/19/21 | | | | 3,800.00 | | | | 40 | | | | USD | | | | 15,200,000 | | | | (404,000 | ) | | | (373,700 | ) | | | (30,300 | ) |
| | | | | | | | | | | | | | | | | | | | | | | $ | (4,423,200 | ) | | $ | (3,546,460 | ) | | $ | (876,740 | ) |
Currency Legend
The accompanying notes are an integral part of the financial statements.
142
MML Mid Cap Growth Fund — Portfolio of Investments |
December 31, 2020 |
| | | Number of
Shares | | | Value | |
EQUITIES — 98.3% |
COMMON STOCK — 97.7% |
Basic Materials — 0.7% |
Chemicals — 0.3% |
RPM International, Inc. | | | 22,000 | | | $ | 1,997,160 | |
Mining — 0.4% |
Kirkland Lake Gold Ltd. (a) | | | 49,000 | | | | 2,022,230 | |
| | | | | | | | 4,019,390 | |
Communications — 5.9% |
Internet — 5.3% |
Airbnb, Inc.Class A (b) | | | 1,828 | | | | 268,350 | |
CDW Corp. | | | 52,842 | | | | 6,964,047 | |
DoorDash, Inc. Class A (b) | | | 1,487 | | | | 212,269 | |
DoorDash, Inc., Lockup Shares (Acquired 6/17/20, Cost $142,309) (b) (c) (d) | | | 3,100 | | | | 420,399 | |
Etsy, Inc. (b) | | | 32,650 | | | | 5,808,762 | |
Farfetch Ltd. Class A (b) | | | 22,000 | | | | 1,403,820 | |
IAC/InterActiveCorp (b) | | | 14,282 | | | | 2,704,297 | |
Match Group, Inc. (b) | | | 53,000 | | | | 8,013,070 | |
Spotify Technology SA (b) | | | 11,000 | | | | 3,461,260 | |
| | | | | | | | 29,256,274 | |
Telecommunications — 0.6% |
Corning, Inc. | | | 85,000 | | | | 3,060,000 | |
| | | | | | | | 32,316,274 | |
Consumer, Cyclical — 13.2% |
Airlines — 0.3% |
Alaska Air Group, Inc. | | | 32,000 | | | | 1,664,000 | |
Apparel — 0.3% |
VF Corp. | | | 22,000 | | | | 1,879,020 | |
Auto Parts & Equipment — 0.9% |
Aptiv PLC | | | 37,000 | | | | 4,820,730 | |
Entertainment — 1.3% |
DraftKings, Inc. Class A (a) (b) | | | 23,000 | | | | 1,070,880 | |
Vail Resorts, Inc. | | | 20,856 | | | | 5,817,990 | |
| | | | | | | | 6,888,870 | |
Food Services — 0.6% |
Aramark | | | 90,734 | | | | 3,491,444 | |
Lodging — 1.8% |
Hilton Worldwide Holdings, Inc. | | | 42,000 | | | | 4,672,920 | |
Marriott International, Inc. Class A | | | 16,000 | | | | 2,110,720 | |
MGM Resorts International | | | 108,000 | | | | 3,403,080 | |
| | | | | | | | 10,186,720 | |
Retail — 8.0% |
Burlington Stores, Inc. (b) | | | 46,573 | | | | 12,181,168 | |
Casey’s General Stores, Inc. | | | 25,000 | | | | 4,465,500 | |
Chipotle Mexican Grill, Inc. (b) | | | 2,400 | | | | 3,328,104 | |
| | | Number of
Shares | | | Value | |
Dollar General Corp. | | | 24,000 | | | $ | 5,047,200 | |
Dollar Tree, Inc. (b) | | | 35,000 | | | | 3,781,400 | |
Domino’s Pizza, Inc. | | | 15,380 | | | | 5,897,615 | |
Five Below, Inc. (b) | | | 7,000 | | | | 1,224,860 | |
Freshpet, Inc. (b) | | | 11,178 | | | | 1,587,164 | |
JAND, Inc., Class A (Acquired 11/19/20, Cost $21,141) (b) (c) (d) (e) | | | 860 | | | | 21,096 | |
Lululemon Athletica, Inc. (b) | | | 2,000 | | | | 696,060 | |
O’Reilly Automotive, Inc. (b) | | | 8,000 | | | | 3,620,560 | |
Ross Stores, Inc. | | | 19,000 | | | | 2,333,390 | |
| | | | | | | | 44,184,117 | |
| | | | | | | | 73,114,901 | |
Consumer, Non-cyclical — 32.5% |
Beverages — 0.1% |
The Boston Beer Co., Inc. Class A (b) | | | 600 | | | | 596,574 | |
Biotechnology — 4.8% |
Abcam PLC (a) (b) | | | 35,810 | | | | 771,705 | |
ACADIA Pharmaceuticals, Inc. (b) | | | 4,000 | | | | 213,840 | |
Alnylam Pharmaceuticals, Inc. (b) | | | 14,000 | | | | 1,819,580 | |
Argenx SE ADR (b) | | | 8,000 | | | | 2,352,720 | |
Ascendis Pharma A/S ADR (b) | | | 5,000 | | | | 833,900 | |
Exact Sciences Corp. (a) (b) | | | 17,522 | | | | 2,321,490 | |
Exelixis, Inc. (b) | | | 12,990 | | | | 260,709 | |
Incyte Corp. (b) | | | 92,848 | | | | 8,075,919 | |
Ionis Pharmaceuticals, Inc. (b) | | | 41,000 | | | | 2,318,140 | |
Seagen, Inc. (b) | | | 38,484 | | | | 6,740,088 | |
Ultragenyx Pharmaceutical, Inc. (b) | | | 8,000 | | | | 1,107,440 | |
| | | | | | | | 26,815,531 | |
Commercial Services — 9.6% |
Avalara, Inc. (b) | | | 17,723 | | | | 2,922,345 | |
Bright Horizons Family Solutions, Inc. (b) | | | 19,821 | | | | 3,428,835 | |
CoStar Group, Inc. (b) | | | 5,000 | | | | 4,621,400 | |
Dun & Bradstreet Holdings, Inc. (b) | | | 43,000 | | | | 1,070,700 | |
Equifax, Inc. | | | 21,000 | | | | 4,049,640 | |
FleetCor Technologies, Inc. (b) | | | 16,000 | | | | 4,365,280 | |
Global Payments, Inc. | | | 7,000 | | | | 1,507,940 | |
IHS Markit Ltd. | | | 27,000 | | | | 2,425,410 | |
MarketAxess Holdings, Inc. | | | 10,466 | | | | 5,971,481 | |
Multiplan Corp. (a) (b) | | | 171,000 | | | | 1,366,290 | |
Terminix Global Holdings, Inc. (b) | | | 80,000 | | | | 4,080,800 | |
TransUnion | | | 110,683 | | | | 10,981,967 | |
Verisk Analytics, Inc. | | | 23,000 | | | | 4,774,570 | |
Wework Companies, Inc., Class A (Acquired 5/26/15, Cost $108,169) (b) (c) (d) (e) | | | 4,132 | | | | — | |
WEX, Inc. (b) | | | 8,000 | | | | 1,628,240 | |
| | | | | | | | 53,194,898 | |
The accompanying notes are an integral part of the financial statements.
143
MML Mid Cap Growth Fund – Portfolio of Investments (Continued) |
| | | Number of
Shares | | | Value | |
Foods — 0.4% |
Sprouts Farmers Market, Inc. (b) | | | 19,000 | | | $ | 381,900 | |
TreeHouse Foods, Inc. (b) | | | 41,000 | | | | 1,742,090 | |
| | | | | | | | 2,123,990 | |
Health Care – Products — 11.1% |
ABIOMED, Inc. (b) | | | 12,500 | | | | 4,052,500 | |
Alcon, Inc. (b) | | | 35,000 | | | | 2,309,300 | |
Align Technology, Inc. (b) | | | 3,500 | | | | 1,870,330 | |
Avantor, Inc. (b) | | | 158,000 | | | | 4,447,700 | |
Bruker Corp. | | | 105,000 | | | | 5,683,650 | |
The Cooper Cos., Inc. | | | 17,000 | | | | 6,176,440 | |
Dentsply Sirona, Inc. | | | 20,000 | | | | 1,047,200 | |
Hologic, Inc. (b) | | | 146,000 | | | | 10,633,180 | |
ICU Medical, Inc. (b) | | | 9,000 | | | | 1,930,410 | |
IDEXX Laboratories, Inc. (b) | | | 13,172 | | | | 6,584,288 | |
Penumbra, Inc. (b) | | | 18,640 | | | | 3,262,000 | |
Quidel Corp. (b) | | | 8,000 | | | | 1,437,200 | |
Teleflex, Inc. | | | 23,000 | | | | 9,466,110 | |
West Pharmaceutical Services, Inc. | | | 8,000 | | | | 2,266,480 | |
| | | | | | | | 61,166,788 | |
Health Care – Services — 3.4% |
Acadia Healthcare Co., Inc. (a) (b) | | | 52,000 | | | | 2,613,520 | |
Catalent, Inc. (b) | | | 85,000 | | | | 8,845,950 | |
ICON PLC (b) | | | 25,123 | | | | 4,898,483 | |
Molina Healthcare, Inc. (b) | | | 6,000 | | | | 1,276,080 | |
PPD, Inc. (b) | | | 31,000 | | | | 1,060,820 | |
| | | | | | | | 18,694,853 | |
Household Products & Wares — 0.8% |
Avery Dennison Corp. | | | 22,000 | | | | 3,412,420 | |
Reynolds Consumer Products, Inc. | | | 44,000 | | | | 1,321,760 | |
| | | | | | | | 4,734,180 | |
Pharmaceuticals — 2.3% |
Alkermes PLC (b) | | | 82,000 | | | | 1,635,900 | |
Elanco Animal Health, Inc. (b) | | | 93,000 | | | | 2,852,310 | |
Neurocrine Biosciences, Inc. (b) | | | 16,000 | | | | 1,533,600 | |
Perrigo Co. PLC | | | 55,000 | | | | 2,459,600 | |
PRA Health Sciences, Inc. (b) | | | 32,000 | | | | 4,014,080 | |
| | | | | | | | 12,495,490 | |
| | | | | | | | 179,822,304 | |
Diversified — 0.2% |
Holding Company – Diversified — 0.2% |
Pershing Square Tontine Holdings Ltd. Class A (b) | | | 42,000 | | | | 1,164,240 | |
Energy — 0.6% |
Energy – Alternate Sources — 0.4% |
Array Technologies, Inc. (b) | | | 50,000 | | | | 2,157,000 | |
| | | Number of
Shares | | | Value | |
Oil & Gas — 0.2% |
Venture Global LNG, Inc., Series B (Acquired 3/08/18, Cost $63,420) (b) (c) (d) (e) | | | 21 | | | $ | 116,871 | |
Venture Global LNG, Inc., Series C (Acquired 10/16/17-3/08/18, Cost $530,257) (b) (c) (d) (e) | | | 144 | | | | 801,402 | |
| | | | | | | | 918,273 | |
| | | | | | | | 3,075,273 | |
Financial — 5.5% |
Banks — 0.3% |
Webster Financial Corp. | | | 43,000 | | | | 1,812,450 | |
Diversified Financial Services — 3.4% |
Cboe Global Markets, Inc. | | | 38,360 | | | | 3,572,083 | |
Hamilton Lane, Inc. Class A | | | 73,969 | | | | 5,773,281 | |
Raymond James Financial, Inc. | | | 14,000 | | | | 1,339,380 | |
Social Finance, Inc. (Acquired 12/30/20, Cost $813,666) (b) (c) (d) (e) | | | 44,149 | | | | 813,666 | |
Tradeweb Markets, Inc. Class A | | | 116,811 | | | | 7,294,847 | |
| | | | | | | | 18,793,257 | |
Insurance — 1.2% |
Assurant, Inc. | | | 22,000 | | | | 2,996,840 | |
Axis Capital Holdings Ltd. | | | 39,000 | | | | 1,965,210 | |
GoHealth, Inc. Class A (b) | | | 32,000 | | | | 437,120 | |
Kemper Corp. | | | 13,000 | | | | 998,790 | |
Selectquote, Inc. (a) (b) | | | 20,000 | | | | 415,000 | |
| | | | | | | | 6,812,960 | |
Private Equity — 0.6% |
KKR & Co., Inc. | | | 74,000 | | | | 2,996,260 | |
| | | | | | | | 30,414,927 | |
Industrial — 16.9% |
Aerospace & Defense — 0.5% |
Hexcel Corp. | | | 62,667 | | | | 3,038,723 | |
Building Materials — 1.0% |
Fortune Brands Home & Security, Inc. | | | 48,069 | | | | 4,120,475 | |
Martin Marietta Materials, Inc. | | | 4,000 | | | | 1,135,880 | |
| | | | | | | | 5,256,355 | |
Electronics — 5.3% |
Agilent Technologies, Inc. | | | 65,000 | | | | 7,701,850 | |
Amphenol Corp. Class A | | | 14,000 | | | | 1,830,780 | |
Fortive Corp. | | | 50,000 | | | | 3,541,000 | |
Keysight Technologies, Inc. (b) | | | 43,000 | | | | 5,679,870 | |
Mettler-Toledo International, Inc. (b) | | | 3,812 | | | | 4,344,460 | |
National Instruments Corp. | | | 67,000 | | | | 2,943,980 | |
Roper Technologies, Inc. | | | 8,000 | | | | 3,448,720 | |
| | | | | | | | 29,490,660 | |
The accompanying notes are an integral part of the financial statements.
144
MML Mid Cap Growth Fund – Portfolio of Investments (Continued) |
| | | Number of
Shares | | | Value | |
Environmental Controls — 0.3% |
Waste Connections, Inc. | | | 16,000 | | | $ | 1,641,120 | |
Hand & Machine Tools — 0.6% |
Colfax Corp. (b) | | | 87,000 | | | | 3,326,880 | |
Machinery – Construction & Mining — 1.5% |
BWX Technologies, Inc. | | | 134,573 | | | | 8,112,060 | |
Machinery – Diversified — 2.4% |
Cognex Corp. | | | 13,000 | | | | 1,043,705 | |
IDEX Corp. | | | 27,000 | | | | 5,378,400 | |
Ingersoll Rand, Inc. (b) | | | 150,000 | | | | 6,834,000 | |
| | | | | | | | 13,256,105 | |
Miscellaneous – Manufacturing — 1.1% |
Textron, Inc. | | | 130,000 | | | | 6,282,900 | |
Packaging & Containers — 2.4% |
Ball Corp. | | | 102,000 | | | | 9,504,360 | |
Packaging Corp. of America | | | 10,000 | | | | 1,379,100 | |
Sealed Air Corp. | | | 57,000 | | | | 2,610,030 | |
| | | | | | | | 13,493,490 | |
Transportation — 1.8% |
J.B. Hunt Transport Services, Inc. | | | 70,828 | | | | 9,678,646 | |
| | | | | | | | 93,576,939 | |
Technology — 21.2% |
Computers — 0.6% |
Crowdstrike Holdings, Inc. Class A (b) | | | 10,000 | | | | 2,118,200 | |
Leidos Holdings, Inc. | | | 11,000 | | | | 1,156,320 | |
| | | | | | | | 3,274,520 | |
Semiconductors — 8.2% |
Entegris, Inc. | | | 33,000 | | | | 3,171,300 | |
Inphi Corp. (b) | | | 11,000 | | | | 1,765,170 | |
KLA Corp. | | | 33,822 | | | | 8,756,854 | |
Marvell Technology Group Ltd. | | | 144,000 | | | | 6,845,760 | |
Maxim Integrated Products, Inc. | | | 47,000 | | | | 4,166,550 | |
Microchip Technology, Inc. | | | 60,000 | | | | 8,286,600 | |
Monolithic Power Systems, Inc. | | | 8,131 | | | | 2,977,816 | |
Skyworks Solutions, Inc. | | | 22,000 | | | | 3,363,360 | |
Teradyne, Inc. | | | 31,575 | | | | 3,785,527 | |
Xilinx, Inc. | | | 16,000 | | | | 2,268,320 | |
| | | | | | | | 45,387,257 | |
Software — 12.4% |
Atlassian Corp. PLC Class A (b) | | | 14,000 | | | | 3,274,180 | |
Bentley Systems, Inc. Class A | | | 7,000 | | | | 283,570 | |
Bill.com Holdings, Inc. (b) | | | 7,000 | | | | 955,500 | |
Black Knight, Inc. (b) | | | 40,000 | | | | 3,534,000 | |
Broadridge Financial Solutions, Inc. | | | 11,000 | | | | 1,685,200 | |
Ceridian HCM Holding, Inc. (b) | | | 42,000 | | | | 4,475,520 | |
Citrix Systems, Inc. | | | 17,000 | | | | 2,211,700 | |
Clarivate PLC (a) (b) | | | 166,000 | | | | 4,931,860 | |
| | | Number of
Shares | | | Value | |
DocuSign, Inc. (b) | | | 24,000 | | | $ | 5,335,200 | |
Five9, Inc. (b) | | | 5,000 | | | | 872,000 | |
Guidewire Software, Inc. (b) | | | 41,416 | | | | 5,331,482 | |
Medallia, Inc. (a) (b) | | | 128,875 | | | | 4,281,228 | |
nCino, Inc. (b) | | | 5,000 | | | | 362,050 | |
Procore Technologies, Inc. (Acquired 7/15/20-12/09/20, Cost $145,684) (b) (c) (d) (e) | | | 2,599 | | | | 163,737 | |
PTC, Inc. (b) | | | 6,000 | | | | 717,660 | |
Splunk, Inc. (b) | | | 19,000 | | | | 3,227,910 | |
SS&C Technologies Holdings, Inc | | | 103,515 | | | | 7,530,716 | |
Take-Two Interactive Software, Inc. (b) | | | 28,652 | | | | 5,953,599 | |
Tyler Technologies, Inc. (b) | | | 7,391 | | | | 3,226,319 | |
Veeva Systems, Inc. Class A (b) | | | 16,000 | | | | 4,356,000 | |
ZoomInfo Technologies, Inc. Class A (a) (b) | | | 67,518 | | | | 3,256,393 | |
Zynga, Inc. Class A (b) | | | 251,000 | | | | 2,477,370 | |
| | | | | | | | 68,443,194 | |
| | | | | | | | 117,104,971 | |
Utilities — 1.0% |
Electric — 1.0% |
Ameren Corp. | | | 16,000 | | | | 1,248,960 | |
Eversource Energy | | | 11,000 | | | | 951,610 | |
Sempra Energy | | | 24,000 | | | | 3,057,840 | |
| | | | | | | | 5,258,410 | |
| | | | | | | | | |
TOTAL COMMON STOCK (Cost $359,532,687) | | | | | | | 539,867,629 | |
| | | | | | | | | |
PREFERRED STOCK — 0.6% |
Communications — 0.3% |
Internet — 0.3% |
Roofoods, Ltd., Series F (Acquired 9/12/17, Cost $677,088) (b) (c) (d) (e) | | | 1,915 | | | | 1,231,900 | |
Roofoods, Ltd., Series G (Acquired 9/12/17, Cost $677,088) (b) (c) (d) (e) | | | 50 | | | | 32,165 | |
| | | | | | | | 1,264,065 | |
Consumer, Cyclical — 0.3% |
Auto Manufacturers — 0.3% |
Rivian Automotive, Inc., Series D (Acquired 12/23/19, Cost $900,713) (b) (c) (d) (e) | | | 83,834 | | | | 1,331,284 | |
Rivian Automotive, Inc., Series E (Acquired 7/10/20, Cost $379,954) (b) (c) (d) (e) | | | 24,529 | | | | 389,521 | |
| | | | | | | | 1,720,805 | |
The accompanying notes are an integral part of the financial statements.
145
MML Mid Cap Growth Fund – Portfolio of Investments (Continued) |
| | | Number of
Shares | | | Value | |
Retail — 0.0% |
JAND, Inc., Series AA (Acquired 11/19/20, Cost $43,758) (b) (c) (d) (e) | | | 1,781 | | | $ | 43,689 | |
JAND, Inc., Series B (Acquired 11/19/20, Cost $49) (b) (c) (d) (e) | | | 2 | | | | 49 | |
| | | | | | | | 43,738 | |
Consumer, Non-cyclical — 0.0% |
Commercial Services — 0.0% |
Wework Companies, Inc., Series D-1 (Acquired 12/09/14, Cost $369,606) (b) (c) (d) (e) | | | 22,197 | | | | — | |
Wework Companies, Inc., Series D-2 (Acquired 12/09/14, Cost $290,396) (b) (c) (d) (e) | | | 17,440 | | | | — | |
| | | | | | | | — | |
Technology — 0.0% |
Software — 0.0% |
Procore Technologies, Inc., Series B (Acquired 7/15/20, Cost $30,150) (b) (c) (d) (e) | | | 670 | | | | 42,210 | |
| | | | | | | | | |
TOTAL PREFERRED STOCK (Cost $2,712,659) | | | | | | | 3,070,818 | |
| | | | | | | | | |
TOTAL EQUITIES (Cost $362,245,346) | | | | | | | 542,938,447 | |
| | | | | | | | | |
WARRANTS — 0.0% |
Diversified — 0.0% |
Holding Company – Diversified — 0.0% |
Pershing Square Tontine Holdings Ltd., Expires 7/24/25 (b) | | | 4,983 | | | | 47,837 | |
| | | | | | | | | |
TOTAL WARRANTS (Cost $28,347) | | | | | | | 47,837 | |
| | | | | | | | | |
MUTUAL FUNDS — 0.7% |
Diversified Financial Services — 0.7% |
State Street Navigator Securities Lending Prime Portfolio (f) | | | 3,925,556 | | | | 3,925,556 | |
| | | | | | | | | |
TOTAL MUTUAL FUNDS (Cost $3,925,556) | | | | | | | 3,925,556 | |
| | | | | | | | | |
TOTAL LONG-TERM INVESTMENTS (Cost $366,199,249) | | | | | | | 546,911,840 | |
| | | Number of
Shares | | | Value | |
SHORT-TERM INVESTMENTS — 1.9% |
Mutual Fund — 0.0% |
T. Rowe Price Treasury Reserve Fund, 1.000%, due 9/19/34 | | | 372 | | | $ | 372 | |
| | | Principal
Amount | | | | | |
Repurchase Agreement — 1.9% |
Fixed Income Clearing Corp., Repurchase Agreement, dated 12/31/20, 0.000%, due 1/04/21 (g) | | $ | 10,695,884 | | | | 10,695,884 | |
| | | | | | | | | |
TOTAL SHORT-TERM INVESTMENTS (Cost $10,696,256) | | | | | | | 10,696,256 | |
| | | | | | | | | |
TOTAL INVESTMENTS — 100.9% (Cost $376,895,505) (h) | | | | | | | 557,608,096 | |
| | | | | | | | | |
Other Assets/(Liabilities) — (0.9)% | | | | | | | (4,970,589 | ) |
| | | | | | | | | |
NET ASSETS — 100.0% | | | | | | $ | 552,637,507 | |
Abbreviation Legend
ADR | American Depositary Receipt |
Notes to Portfolio of Investments
Percentages are stated as a percent of net assets.
(a) | Denotes all or a portion of security on loan. The total value of securities on loan as of December 31, 2020, was $15,904,553 or 2.88% of net assets. Total securities on loan may be less than the amounts identified in the Portfolio of Investments. The Fund received $12,331,837 of non-cash collateral (U.S. Treasury and/or Agency obligations) related to securities lending activity. This amount is not reflected on either the Portfolio of Investments or the Statement of Assets and Liabilities. (Note 2). |
(b) | Non-income producing security. |
(c) | Restricted security. Certain securities are restricted as to resale. At December 31, 2020, these securities amounted to a value of $5,407,989 or 0.98% of net assets. The Fund generally bears the costs, if any, associated with the disposition of restricted securities. |
(d) | This security is fair valued in good faith in accordance with procedures approved by the Board of Trustees. At December 31, 2020, these securities amounted to a value of $5,407,989 or 0.98% of net assets. |
(e) | Investment was valued using significant unobservable inputs. |
(f) | Represents investment of security lending cash collateral. (Note 2). |
(g) | Maturity value of $10,695,884. Collateralized by U.S. Government Agency obligations with a rate of 0.000%, maturity date of 12/30/21, and an aggregate market value, including accrued interest, of $10,909,897. |
(h) | See Note 6 for aggregate cost for federal tax purposes. |
The accompanying notes are an integral part of the financial statements.
146
MML Mid Cap Value Fund — Portfolio of Investments |
December 31, 2020 |
| | | Number of
Shares | | | Value | |
EQUITIES — 97.1% |
COMMON STOCK — 97.1% |
Basic Materials — 1.3% |
Forest Products & Paper — 1.3% |
Mondi PLC | | | 225,918 | | | $ | 5,332,080 | |
Communications — 3.8% |
Internet — 1.6% |
F5 Networks, Inc. (a) | | | 36,355 | | | | 6,396,299 | |
Media — 1.2% |
Fox Corp. Class B (a) | | | 158,636 | | | | 4,581,408 | |
Telecommunications — 1.0% |
Rogers Communications, Inc. Class B | | | 87,654 | | | | 4,080,741 | |
| | | | | | | | 15,058,448 | |
Consumer, Cyclical — 12.3% |
Airlines — 1.7% |
Southwest Airlines Co. | | | 144,692 | | | | 6,744,094 | |
Auto Manufacturers — 2.6% |
Cummins, Inc. | | | 10,911 | | | | 2,477,888 | |
Honda Motor Co. Ltd. Sponsored ADR | | | 140,973 | | | | 3,982,487 | |
PACCAR, Inc. | | | 47,256 | | | | 4,077,248 | |
| | | | | | | | 10,537,623 | |
Auto Parts & Equipment — 1.4% |
Aptiv PLC | | | 20,149 | | | | 2,625,213 | |
BorgWarner, Inc. | | | 80,008 | | | | 3,091,509 | |
| | | | | | | | 5,716,722 | |
Food Services — 1.1% |
Sodexo SA | | | 51,525 | | | | 4,361,451 | |
Leisure Time — 0.7% |
Polaris, Inc. | | | 27,073 | | | | 2,579,516 | |
Retail — 4.6% |
Advance Auto Parts, Inc. | | | 38,216 | | | | 6,019,402 | |
Dollar Tree, Inc. (a) | | | 35,917 | | | | 3,880,473 | |
Genuine Parts Co. | | | 39,561 | | | | 3,973,111 | |
MSC Industrial Direct Co., Inc. Class A | | | 54,808 | | | | 4,625,247 | |
| | | | | | | | 18,498,233 | |
Textiles — 0.2% |
Mohawk Industries, Inc. (a) | | | 5,918 | | | | 834,142 | |
| | | | | | | | 49,271,781 | |
Consumer, Non-cyclical — 21.4% |
Foods — 7.8% |
Conagra Brands, Inc. | | | 173,044 | | | | 6,274,575 | |
The J.M. Smucker Co. | | | 48,597 | | | | 5,617,813 | |
Kellogg Co. | | | 60,984 | | | | 3,795,034 | |
Koninklijke Ahold Delhaize NV | | | 238,376 | | | | 6,731,782 | |
Mondelez International, Inc. Class A | | | 31,727 | | | | 1,855,078 | |
| | | Number of
Shares | | | Value | |
Orkla ASA | | | 337,111 | | | $ | 3,420,219 | |
Sysco Corp. | | | 47,827 | | | | 3,551,633 | |
| | | | | | | | 31,246,134 | |
Health Care – Products — 5.0% |
Envista Holdings Corp. (a) | | | 139,011 | | | | 4,688,841 | |
Hill-Rom Holdings, Inc. | | | 22,641 | | | | 2,218,139 | |
Hologic, Inc. (a) | | | 21,230 | | | | 1,546,181 | |
Zimmer Biomet Holdings, Inc. | | | 75,474 | | | | 11,629,788 | |
| | | | | | | | 20,082,949 | |
Health Care – Services — 3.3% |
Quest Diagnostics, Inc. | | | 50,392 | | | | 6,005,215 | |
Universal Health Services, Inc. Class B | | | 52,020 | | | | 7,152,750 | |
| | | | | | | | 13,157,965 | |
Household Products & Wares — 0.8% |
Kimberly-Clark Corp. | | | 22,546 | | | | 3,039,877 | |
Pharmaceuticals — 4.5% |
Becton Dickinson and Co. | | | 17,495 | | | | 4,377,599 | |
Cardinal Health, Inc. | | | 94,926 | | | | 5,084,237 | |
Henry Schein, Inc. (a) | | | 63,306 | | | | 4,232,639 | |
McKesson Corp. | | | 25,644 | | | | 4,460,004 | |
| | | | | | | | 18,154,479 | |
| | | | | | | | 85,681,404 | |
Energy — 2.2% |
Oil & Gas — 1.9% |
Cimarex Energy Co. | | | 61,852 | | | | 2,320,068 | |
ConocoPhillips | | | 135,517 | | | | 5,419,325 | |
| | | | | | | | 7,739,393 | |
Oil & Gas Services — 0.3% |
Baker Hughes Co. | | | 53,968 | | | | 1,125,233 | |
| | | | | | | | 8,864,626 | |
Financial — 22.9% |
Banks — 9.8% |
The Bank of New York Mellon Corp. | | | 162,555 | | | | 6,898,834 | |
Commerce Bancshares, Inc. | | | 72,282 | | | | 4,748,928 | |
Eastern Bankshares, Inc. (a) | | | 61,857 | | | | 1,008,888 | |
M&T Bank Corp. | | | 25,244 | | | | 3,213,561 | |
Northern Trust Corp. | | | 104,858 | | | | 9,766,474 | |
The PNC Financial Services Group, Inc. | | | 18,736 | | | | 2,791,664 | |
State Street Corp. | | | 35,349 | | | | 2,572,700 | |
Truist Financial Corp. | | | 111,243 | | | | 5,331,877 | |
Westamerica Bancorp. | | | 53,879 | | | | 2,978,970 | |
| | | | | | | | 39,311,896 | |
Diversified Financial Services — 2.5% |
Ameriprise Financial, Inc. | | | 28,947 | | | | 5,625,270 | |
T. Rowe Price Group, Inc. | | | 28,743 | | | | 4,351,403 | |
| | | | | | | | 9,976,673 | |
The accompanying notes are an integral part of the financial statements.
147
MML Mid Cap Value Fund – Portfolio of Investments (Continued) |
| | | Number of
Shares | | | Value | |
Insurance — 6.0% |
Aflac, Inc. | | | 118,898 | | | $ | 5,287,394 | |
Arthur J Gallagher & Co. | | | 23,912 | | | | 2,958,153 | |
Brown & Brown, Inc. | | | 16,120 | | | | 764,249 | |
Chubb Ltd. | | | 60,712 | | | | 9,344,791 | |
Reinsurance Group of America, Inc. | | | 47,183 | | | | 5,468,510 | |
| | | | | | | | 23,823,097 | |
Real Estate Investment Trusts (REITS) — 4.0% |
Healthcare Trust of America, Inc. Class A | | | 83,982 | | | | 2,312,864 | |
Healthpeak Properties, Inc. | | | 122,995 | | | | 3,718,139 | |
MGM Growth Properties LLC Class A | | | 130,345 | | | | 4,079,799 | |
Welltower, Inc. | | | 34,169 | | | | 2,208,001 | |
Weyerhaeuser Co. | | | 108,074 | | | | 3,623,721 | |
| | | | | | | | 15,942,524 | |
Savings & Loans — 0.6% |
Capitol Federal Financial, Inc. | | | 182,860 | | | | 2,285,750 | |
| | | | | | | | 91,339,940 | |
Industrial — 20.3% |
Aerospace & Defense — 2.1% |
BAE Systems PLC | | | 563,971 | | | | 3,771,973 | |
General Dynamics Corp. | | | 29,559 | | | | 4,398,971 | |
| | | | | | | | 8,170,944 | |
Building Materials — 1.4% |
Johnson Controls International PLC | | | 117,716 | | | | 5,484,388 | |
Electrical Components & Equipment — 2.4% |
Emerson Electric Co. | | | 118,045 | | | | 9,487,276 | |
Electronics — 4.3% |
Hubbell, Inc. | | | 41,385 | | | | 6,488,754 | |
nVent Electric PLC | | | 314,159 | | | | 7,316,763 | |
TE Connectivity Ltd. | | | 29,335 | | | | 3,551,589 | |
| | | | | | | | 17,357,106 | |
Engineering & Construction — 1.1% |
IMI PLC | | | 283,607 | | | | 4,541,354 | |
Environmental Controls — 1.6% |
Republic Services, Inc. | | | 67,316 | | | | 6,482,531 | |
Machinery – Construction & Mining — 1.1% |
Oshkosh Corp. | | | 52,555 | | | | 4,523,409 | |
Machinery – Diversified — 0.6% |
Crane Co. | | | 29,584 | | | | 2,297,493 | |
Miscellaneous – Manufacturing — 0.9% |
Textron, Inc. | | | 74,582 | | | | 3,604,548 | |
Packaging & Containers — 3.4% |
Graphic Packaging Holding Co. | | | 207,275 | | | | 3,511,239 | |
Packaging Corp. of America | | | 24,642 | | | | 3,398,378 | |
Sonoco Products Co. | | | 110,493 | | | | 6,546,710 | |
| | | | | | | | 13,456,327 | |
| | | Number of
Shares | | | Value | |
Transportation — 1.4% |
Heartland Express, Inc. | | | 169,715 | | | $ | 3,071,841 | |
Norfolk Southern Corp. | | | 11,178 | | | | 2,656,005 | |
| | | | | | | | 5,727,846 | |
| | | | | | | | 81,133,222 | |
Technology — 5.0% |
Computers — 1.3% |
HP, Inc. | | | 215,603 | | | | 5,301,678 | |
Semiconductors — 1.7% |
Applied Materials, Inc. | | | 54,840 | | | | 4,732,692 | |
Maxim Integrated Products, Inc. | | | 21,573 | | | | 1,912,446 | |
Microchip Technology, Inc. | | | 1,771 | | | | 244,593 | |
| | | | | | | | 6,889,731 | |
Software — 2.0% |
Cerner Corp. | | | 73,153 | | | | 5,741,047 | |
Open Text Corp. | | | 48,432 | | | | 2,201,719 | |
| | | | | | | | 7,942,766 | |
| | | | | | | | 20,134,175 | |
Utilities — 7.9% |
Electric — 6.3% |
Ameren Corp. | | | 20,572 | | | | 1,605,850 | |
Edison International | | | 95,484 | | | | 5,998,305 | |
Evergy, Inc. | | | 41,983 | | | | 2,330,476 | |
Eversource Energy | | | 6,121 | | | | 529,528 | |
NorthWestern Corp. | | | 95,516 | | | | 5,569,538 | |
Pinnacle West Capital Corp. | | | 82,576 | | | | 6,601,951 | |
Xcel Energy, Inc. | | | 36,738 | | | | 2,449,323 | |
| | | | | | | | 25,084,971 | |
Gas — 1.6% |
Atmos Energy Corp. | | | 35,020 | | | | 3,341,959 | |
Spire, Inc. | | | 50,031 | | | | 3,203,985 | |
| | | | | | | | 6,545,944 | |
| | | | | | | | 31,630,915 | |
| | | | | | | | | |
TOTAL COMMON STOCK (Cost $331,285,934) | | | | | | | 388,446,591 | |
| | | | | | | | | |
TOTAL EQUITIES (Cost $331,285,934) | | | | | | | 388,446,591 | |
| | | | | | | | | |
MUTUAL FUNDS — 2.4% |
Diversified Financial Services — 2.4% |
iShares Russell Mid-Cap Value ETF | | | 97,487 | | | | 9,452,340 | |
| | | | | | | | | |
TOTAL MUTUAL FUNDS (Cost $8,307,173) | | | | | | | 9,452,340 | |
| | | | | | | | | |
TOTAL LONG-TERM INVESTMENTS (Cost $339,593,107) | | | | | | | 397,898,931 | |
The accompanying notes are an integral part of the financial statements.
148
MML Mid Cap Value Fund – Portfolio of Investments (Continued) |
| | | Principal
Amount | | | Value | |
SHORT-TERM INVESTMENTS — 0.6% |
Repurchase Agreement — 0.6% |
Fixed Income Clearing Corp., Repurchase Agreement, dated 12/31/20, 0.000%, due 1/04/21 (b) | | $ | 2,326,692 | | | $ | 2,326,692 | |
| | | | | | | | | |
TOTAL SHORT-TERM INVESTMENTS (Cost $2,326,692) | | | | | | | 2,326,692 | |
| | | | | | | | | |
TOTAL INVESTMENTS — 100.1% (Cost $341,919,799) (c) | | | | | | | 400,225,623 | |
| | | | | | | | | |
Other Assets/(Liabilities) — (0.1)% | | | | | | | (343,033 | ) |
| | | | | | | | | |
NET ASSETS — 100.0% | | | | | | $ | 399,882,590 | |
Abbreviation Legend
ADR | American Depositary Receipt |
Notes to Portfolio of Investments
Percentages are stated as a percent of net assets.
(a) | Non-income producing security. |
(b) | Maturity value of $2,326,692. Collateralized by U.S. Government Agency obligations with a rate of 0.000%, maturity date of 12/30/21, and an aggregate market value, including accrued interest, of $2,373,237. |
(c) | See Note 6 for aggregate cost for federal tax purposes. |
Forward contracts
Counterparty | | Settlement
Date | | | Currency Purchased | | | Currency Sold | | | Unrealized
Appreciation
(Depreciation) | |
Bank of America N.A.* | | | 3/31/21 | | | | JPY | | | | 8,730,681 | | | | USD | | | | 84,338 | | | $ | 302 | |
Bank of America N.A.* | | | 3/31/21 | | | | USD | | | | 2,506,096 | | | | JPY | | | | 259,907,219 | | | | (13,595 | ) |
Credit Suisse International* | | | 3/31/21 | | | | EUR | | | | 267,620 | | | | USD | | | | 326,473 | | | | 1,098 | |
Credit Suisse International* | | | 3/31/21 | | | | USD | | | | 9,967,843 | | | | EUR | | | | 8,117,808 | | | | 31,509 | |
Goldman Sachs & Co.* | | | 3/31/21 | | | | USD | | | | 2,871,291 | | | | NOK | | | | 24,946,551 | | | | (37,254 | ) |
JP Morgan Chase Bank N.A.* | | | 3/31/21 | | | | GBP | | | | 280,262 | | | | USD | | | | 374,503 | | | | 8,959 | |
JP Morgan Chase Bank N.A.* | | | 3/31/21 | | | | USD | | | | 12,107,669 | | | | GBP | | | | 8,988,743 | | | | (190,945 | ) |
Morgan Stanley & Co. LLC* | | | 3/31/21 | | | | USD | | | | 3,498,935 | | | | CAD | | | | 4,456,943 | | | | (3,288 | ) |
| | | | | | | | | | | | | | | | | | | | | | | $ | (203,214 | ) |
* Contracts are subject to a Master Netting Agreement.
Currency Legend
The accompanying notes are an integral part of the financial statements.
149
MML Small Cap Growth Equity Fund — Portfolio of Investments |
December 31, 2020 |
| | | Number of
Shares | | | Value | |
EQUITIES — 103.4% |
COMMON STOCK — 103.3% |
Basic Materials — 1.0% |
Chemicals — 1.0% |
Ingevity Corp. (a) | | | 13,918 | | | $ | 1,054,010 | |
Methanex Corp. | | | 25,094 | | | | 1,156,332 | |
| | | | | | | | 2,210,342 | |
Communications — 4.0% |
Internet — 3.0% |
Mimecast Ltd. (a) | | | 37,946 | | | | 2,156,851 | |
Perficient, Inc. (a) | | | 40,267 | | | | 1,918,723 | |
Q2 Holdings, Inc. (a) | | | 9,409 | | | | 1,190,521 | |
Shutterstock, Inc. | | | 16,315 | | | | 1,169,785 | |
Veracode, Inc. (Escrow Shares) (Acquired 8/26/17, Cost $20,131) (a) (b) (c) (d) | | | 10,688 | | | | 262 | |
| | | | | | | | 6,436,142 | |
Media — 0.5% |
The New York Times Co. Class A | | | 20,461 | | | | 1,059,266 | |
Telecommunications — 0.5% |
Ciena Corp. (a) | | | 18,931 | | | | 1,000,503 | |
| | | | | | | | 8,495,911 | |
Consumer, Cyclical — 16.1% |
Apparel — 2.5% |
Carter’s, Inc. | | | 11,331 | | | | 1,065,907 | |
Deckers Outdoor Corp. (a) | | | 2,817 | | | | 807,859 | |
Skechers U.S.A., Inc. Class A (a) | | | 29,606 | | | | 1,064,040 | |
Wolverine World Wide, Inc. | | | 76,384 | | | | 2,387,000 | |
| | | | | | | | 5,324,806 | |
Auto Parts & Equipment — 0.5% |
Fox Factory Holding Corp. (a) | | | 9,458 | | | | 999,805 | |
Entertainment — 1.4% |
Cinemark Holdings, Inc. (e) | | | 62,784 | | | | 1,093,069 | |
GAN Ltd. (a) (e) | | | 18,736 | | | | 379,966 | |
Penn National Gaming, Inc. (a) (e) | | | 17,857 | | | | 1,542,309 | |
| | | | | | | | 3,015,344 | |
Home Builders — 2.2% |
Cavco Industries, Inc. (a) | | | 5,269 | | | | 924,446 | |
Century Communities, Inc. (a) | | | 16,029 | | | | 701,750 | |
Skyline Champion Corp. (a) | | | 67,912 | | | | 2,101,197 | |
Thor Industries, Inc. (e) | | | 10,609 | | | | 986,531 | |
| | | | | | | | 4,713,924 | |
Leisure Time — 1.9% |
Acushnet Holdings Corp. | | | 27,814 | | | | 1,127,580 | |
Planet Fitness, Inc. Class A (a) | | | 14,975 | | | | 1,162,509 | |
Polaris, Inc. | | | 8,615 | | | | 820,837 | |
| | | Number of
Shares | | | Value | |
YETI Holdings, Inc. (a) | | | 11,849 | | | $ | 811,301 | |
| | | | | | | | 3,922,227 | |
Retail — 7.1% |
BMC Stock Holdings, Inc. (a) | | | 48,493 | | | | 2,603,104 | |
Denny’s Corp. (a) | | | 80,279 | | | | 1,178,496 | |
FirstCash, Inc. | | | 14,435 | | | | 1,011,027 | |
Five Below, Inc. (a) | | | 8,975 | | | | 1,570,446 | |
Floor & Decor Holdings, Inc. Class A (a) | | | 17,825 | | | | 1,655,051 | |
La-Z-Boy, Inc. | | | 31,299 | | | | 1,246,952 | |
Nu Skin Enterprises, Inc. Class A | | | 23,536 | | | | 1,285,772 | |
Ollie’s Bargain Outlet Holdings, Inc. (a) (e) | | | 26,504 | | | | 2,167,232 | |
Rush Enterprises, Inc. Class A | | | 55,400 | | | | 2,294,668 | |
| | | | | | | | 15,012,748 | |
Textiles — 0.5% |
Albany International Corp. Class A | | | 13,816 | | | | 1,014,371 | |
| | | | | | | | 34,003,225 | |
Consumer, Non-cyclical — 31.2% |
Beverages — 0.4% |
The Boston Beer Co., Inc. Class A (a) | | | 893 | | | | 887,901 | |
Biotechnology — 13.2% |
Acceleron Pharma, Inc. (a) | | | 4,771 | | | | 610,402 | |
Akero Therapeutics, Inc. (a) | | | 13,530 | | | | 349,074 | |
Allakos, Inc. (a) (e) | | | 6,945 | | | | 972,300 | |
ALX Oncology Holdings, Inc. (a) | | | 15,629 | | | | 1,347,220 | |
Amicus Therapeutics, Inc. (a) | | | 80,186 | | | | 1,851,495 | |
Apellis Pharmaceuticals, Inc. (a) | | | 22,939 | | | | 1,312,111 | |
Arena Pharmaceuticals, Inc. (a) | | | 15,354 | | | | 1,179,648 | |
Ascendis Pharma A/S ADR (a) | | | 4,951 | | | | 825,728 | |
Biohaven Pharmaceutical Holding Co. Ltd. (a) | | | 3,834 | | | | 328,612 | |
Blueprint Medicines Corp. (a) | | | 5,933 | | | | 665,386 | |
ChemoCentryx, Inc. (a) | | | 8,643 | | | | 535,174 | |
Constellation Pharmaceuticals, Inc. (a) | | | 28,955 | | | | 833,904 | |
Dicerna Pharmaceuticals, Inc. (a) | | | 25,470 | | | | 561,104 | |
Five Prime Therapeutics, Inc. (a) | | | 22,020 | | | | 374,560 | |
Freeline Therapeutics Holdings PLC (a) | | | 20,731 | | | | 378,548 | |
Global Blood Therapeutics, Inc. (a) | | | 9,226 | | | | 399,578 | |
ImmunoGen, Inc. (a) | | | 81,510 | | | | 525,739 | |
Iovance Biotherapeutics, Inc. (a) | | | 15,237 | | | | 706,997 | |
Kodiak Sciences, Inc. (a) (e) | | | 14,741 | | | | 2,165,600 | |
Mersana Therapeutics, Inc. (a) | | | 42,989 | | | | 1,143,937 | |
Mirati Therapeutics, Inc. (a) | | | 6,033 | | | | 1,325,088 | |
NeoGenomics, Inc. (a) | | | 17,700 | | | | 952,968 | |
PTC Therapeutics, Inc. (a) | | | 14,559 | | | | 888,536 | |
RAPT Therapeutics, Inc. (a) (e) | | | 9,893 | | | | 195,387 | |
Rocket Pharmaceuticals, Inc. (a) | | | 9,216 | | | | 505,405 | |
The accompanying notes are an integral part of the financial statements.
150
MML Small Cap Growth Equity Fund – Portfolio of Investments (Continued) |
| | | Number of
Shares | | | Value | |
Sage Therapeutics, Inc. (a) | | | 7,611 | | | $ | 658,428 | |
TCR2 Therapeutics, Inc. (a) | | | 11,400 | | | | 352,602 | |
TG Therapeutics, Inc. (a) | | | 37,107 | | | | 1,930,306 | |
Theravance Biopharma, Inc. (a) (e) | | | 24,173 | | | | 429,554 | |
Turning Point Therapeutics, Inc. (a) | | | 13,760 | | | | 1,676,656 | |
Veracyte, Inc. (a) | | | 11,120 | | | | 544,213 | |
Y-mAbs Therapeutics, Inc. (a) | | | 25,519 | | | | 1,263,446 | |
| | | | | | | | 27,789,706 | |
Commercial Services — 6.4% |
2U, Inc. (a) (e) | | | 26,874 | | | | 1,075,229 | |
Cardtronics PLC Class A (a) | | | 36,704 | | | | 1,295,651 | |
Chegg, Inc. (a) | | | 22,875 | | | | 2,066,299 | |
Green Dot Corp. Class A (a) | | | 15,674 | | | | 874,609 | |
Herc Holdings, Inc. (a) | | | 18,706 | | | | 1,242,266 | |
HMS Holdings Corp. (a) | | | 30,023 | | | | 1,103,345 | |
Liveramp Holdings, Inc. (a) | | | 19,918 | | | | 1,457,798 | |
Multiplan Corp. (a) (e) | | | 128,726 | | | | 1,028,521 | |
Paylocity Holding Corp. (a) | | | 5,440 | | | | 1,120,150 | |
TriNet Group, Inc. (a) | | | 26,516 | | | | 2,137,190 | |
| | | | | | | | 13,401,058 | |
Foods — 1.5% |
BellRing Brands, Inc. Class A (a) | | | 46,965 | | | | 1,141,719 | |
Performance Food Group Co. (a) | | | 23,332 | | | | 1,110,836 | |
Sanderson Farms, Inc. | | | 7,018 | | | | 927,780 | |
| | | | | | | | 3,180,335 | |
Health Care – Products — 5.7% |
Avanos Medical, Inc. (a) | | | 23,554 | | | | 1,080,658 | |
Glaukos Corp. (a) (e) | | | 9,952 | | | | 748,988 | |
Globus Medical, Inc. Class A (a) | | | 40,364 | | | | 2,632,540 | |
Haemonetics Corp. (a) | | | 9,886 | | | | 1,173,962 | |
Hill-Rom Holdings, Inc. | | | 10,347 | | | | 1,013,696 | |
Insulet Corp. (a) | | | 3,911 | | | | 999,769 | |
Integra LifeSciences Holdings Corp. (a) | | | 9,000 | | | | 584,280 | |
NanoString Technologies, Inc. (a) | | | 12,339 | | | | 825,232 | |
Omnicell, Inc. (a) | | | 17,111 | | | | 2,053,662 | |
Tandem Diabetes Care, Inc. (a) | | | 10,484 | | | | 1,003,109 | |
| | | | | | | | 12,115,896 | |
Health Care – Services — 2.9% |
Acadia Healthcare Co., Inc. (a) | | | 23,304 | | | | 1,171,259 | |
Addus HomeCare Corp. (a) | | | 6,960 | | | | 814,947 | |
Amedisys, Inc. (a) | | | 3,128 | | | | 917,536 | |
LHC Group, Inc. (a) | | | 12,061 | | | | 2,572,853 | |
Medpace Holdings, Inc. (a) | | | 5,267 | | | | 733,166 | |
| | | | | | | | 6,209,761 | |
Pharmaceuticals — 1.1% |
Heron Therapeutics, Inc. (a) (e) | | | 42,791 | | | | 905,671 | |
Kura Oncology, Inc. (a) | | | 10,495 | | | | 342,767 | |
| | | Number of
Shares | | | Value | |
Reata Pharmaceuticals, Inc. Class A (a) (e) | | | 2,608 | | | $ | 322,401 | |
Revance Therapeutics, Inc. (a) | | | 11,035 | | | | 312,732 | |
UroGen Pharma Ltd. (a) (e) | | | 25,675 | | | | 462,663 | |
| | | | | | | | 2,346,234 | |
| | | | | | | | 65,930,891 | |
Energy — 3.0% |
Energy – Alternate Sources — 2.6% |
Atlantica Sustainable Infrastructure PLC | | | 30,772 | | | | 1,168,721 | |
First Solar, Inc. (a) | | | 21,857 | | | | 2,162,094 | |
Maxeon Solar Technologies Ltd. (a) (e) | | | 9,613 | | | | 272,721 | |
Plug Power, Inc. (a) | | | 14,517 | | | | 492,272 | |
SunPower Corp. (a) (e) | | | 55,021 | | | | 1,410,738 | |
| | | | | | | | 5,506,546 | |
Oil & Gas — 0.4% |
Delek US Holdings, Inc. | | | 30,212 | | | | 485,507 | |
Viper Energy Partners LP (f) | | | 26,835 | | | | 311,822 | |
| | | | | | | | 797,329 | |
| | | | | | | | 6,303,875 | |
Financial — 16.7% |
Banks — 4.4% |
Ameris Bancorp | | | 38,285 | | | | 1,457,510 | |
Atlantic Union Bankshares Corp. | | | 38,759 | | | | 1,276,721 | |
First Interstate BancSystem, Inc. Class A | | | 28,160 | | | | 1,148,083 | |
National Bank Holdings Corp. Class A | | | 37,629 | | | | 1,232,726 | |
Seacoast Banking Corp. of Florida (a) | | | 46,717 | | | | 1,375,816 | |
Western Alliance Bancorp | | | 47,165 | | | | 2,827,542 | |
| | | | | | | | 9,318,398 | |
Diversified Financial Services — 3.2% |
Air Lease Corp. | | | 24,432 | | | | 1,085,270 | |
Ares Management Corp. Class A | | | 17,904 | | | | 842,383 | |
Hamilton Lane, Inc. Class A | | | 5,162 | | | | 402,894 | |
Hannon Armstrong Sustainable Infrastructure Capital, Inc. (e) | | | 37,873 | | | | 2,402,284 | |
PRA Group, Inc. (a) | | | 52,807 | | | | 2,094,326 | |
| | | | | | | | 6,827,157 | |
Insurance — 3.2% |
Assured Guaranty Ltd. | | | 30,561 | | | | 962,366 | |
James River Group Holdings Ltd. | | | 35,083 | | | | 1,724,329 | |
Kemper Corp. | | | 12,419 | | | | 954,152 | |
MGIC Investment Corp. | | | 92,034 | | | | 1,155,027 | |
Selective Insurance Group, Inc. | | | 16,025 | | | | 1,073,354 | |
Third Point Reinsurance Ltd. (a) | | | 97,856 | | | | 931,589 | |
| | | | | | | | 6,800,817 | |
The accompanying notes are an integral part of the financial statements.
151
MML Small Cap Growth Equity Fund – Portfolio of Investments (Continued) |
| | | Number of
Shares | | | Value | |
Real Estate — 0.7% |
McGrath RentCorp | | | 16,908 | | | $ | 1,134,527 | |
Redfin Corp. (a) | | | 3,477 | | | | 238,626 | |
| | | | | | | | 1,373,153 | |
Real Estate Investment Trusts (REITS) — 3.8% |
Essential Properties Realty Trust, Inc. | | | 101,864 | | | | 2,159,517 | |
JBG SMITH Properties | | | 28,253 | | | | 883,471 | |
Life Storage, Inc. | | | 9,139 | | | | 1,091,105 | |
PotlatchDeltic Corp. | | | 20,497 | | | | 1,025,260 | |
PS Business Parks, Inc. | | | 7,862 | | | | 1,044,624 | |
Xenia Hotels & Resorts, Inc. | | | 118,183 | | | | 1,796,382 | |
| | | | | | | | 8,000,359 | |
Savings & Loans — 1.4% |
OceanFirst Financial Corp. | | | 30,614 | | | | 570,339 | |
Sterling Bancorp | | | 129,617 | | | | 2,330,514 | |
| | | | | | | | 2,900,853 | |
| | | | | | | | 35,220,737 | |
Industrial — 15.3% |
Aerospace & Defense — 0.7% |
Aerojet Rocketdyne Holdings, Inc. (a) | | | 27,504 | | | | 1,453,586 | |
Building Materials — 1.0% |
Gibraltar Industries, Inc. (a) | | | 14,727 | | | | 1,059,460 | |
Louisiana-Pacific Corp. | | | 27,935 | | | | 1,038,344 | |
| | | | | | | | 2,097,804 | |
Electrical Components & Equipment — 1.1% |
EnerSys | | | 14,599 | | | | 1,212,593 | |
Novanta, Inc. (a) | | | 10,108 | | | | 1,194,968 | |
| | | | | | | | 2,407,561 | |
Electronics — 1.0% |
II-VI, Inc. (a) (e) | | | 28,412 | | | | 2,158,176 | |
Engineering & Construction — 0.3% |
Comfort Systems USA, Inc. | | | 12,574 | | | | 662,147 | |
Environmental Controls — 0.9% |
Clean Harbors, Inc. (a) | | | 14,545 | | | | 1,106,874 | |
Tetra Tech, Inc. | | | 6,382 | | | | 738,908 | |
| | | | | | | | 1,845,782 | |
Hand & Machine Tools — 1.2% |
Kennametal, Inc. | | | 68,483 | | | | 2,481,824 | |
Machinery – Construction & Mining — 0.7% |
Argan, Inc. | | | 34,557 | | | | 1,537,441 | |
Machinery – Diversified — 3.0% |
Applied Industrial Technologies, Inc. | | | 7,600 | | | | 592,724 | |
Chart Industries, Inc. (a) | | | 10,683 | | | | 1,258,351 | |
Curtiss-Wright Corp. | | | 14,480 | | | | 1,684,748 | |
Kornit Digital Ltd. (a) | | | 13,453 | | | | 1,199,066 | |
| | | Number of
Shares | | | Value | |
SPX FLOW, Inc. (a) | | | 27,747 | | | $ | 1,608,216 | |
| | | | | | | | 6,343,105 | |
Metal Fabricate & Hardware — 1.7% |
Advanced Drainage Systems, Inc. | | | 11,954 | | | | 999,116 | |
Rexnord Corp. | | | 62,933 | | | | 2,485,224 | |
| | | | | | | | 3,484,340 | |
Miscellaneous – Manufacturing — 1.9% |
Axon Enterprise, Inc. (a) | | | 6,364 | | | | 779,781 | |
Enerpac Tool Group Corp. | | | 49,919 | | | | 1,128,669 | |
ITT, Inc. | | | 15,709 | | | | 1,209,907 | |
John Bean Technologies Corp. | | | 8,668 | | | | 987,025 | |
| | | | | | | | 4,105,382 | |
Packaging & Containers — 0.6% |
Graphic Packaging Holding Co. | | | 74,592 | | | | 1,263,588 | |
Transportation — 0.8% |
Kirby Corp. (a) | | | 12,820 | | | | 664,460 | |
Saia, Inc. (a) | | | 5,056 | | | | 914,125 | |
| | | | | | | | 1,578,585 | |
Trucking & Leasing — 0.4% |
GATX Corp. | | | 10,289 | | | | 855,839 | |
| | | | | | | | 32,275,160 | |
Technology — 15.6% |
Computers — 2.3% |
Lumentum Holdings, Inc. (a) | | | 8,277 | | | | 784,660 | |
PAR Technology Corp. (a) (e) | | | 10,811 | | | | 678,823 | |
Rapid7, Inc. (a) | | | 37,146 | | | | 3,349,083 | |
| | | | | | | | 4,812,566 | |
Semiconductors — 4.4% |
ACM Research, Inc. Class A (a) | | | 8,568 | | | | 696,150 | |
Entegris, Inc. | | | 7,761 | | | | 745,832 | |
FormFactor, Inc. (a) | | | 25,287 | | | | 1,087,847 | |
Lattice Semiconductor Corp. (a) | | | 21,812 | | | | 999,426 | |
MKS Instruments, Inc. | | | 15,540 | | | | 2,337,993 | |
Power Integrations, Inc. | | | 6,600 | | | | 540,276 | |
Tower Semiconductor Ltd. (a) | | | 113,205 | | | | 2,922,953 | |
| | | | | | | | 9,330,477 | |
Software — 8.9% |
1Life Healthcare, Inc. (a) (e) | | | 19,256 | | | | 840,524 | |
Bandwidth, Inc. Class A (a) (e) | | | 8,802 | | | | 1,352,603 | |
Cardlytics, Inc. (a) (e) | | | 17,569 | | | | 2,508,326 | |
Cloudera, Inc. (a) (e) | | | 83,825 | | | | 1,166,006 | |
Digital Turbine, Inc. (a) | | | 28,923 | | | | 1,635,885 | |
Five9, Inc. (a) | | | 9,708 | | | | 1,693,075 | |
Health Catalyst, Inc. (a) | | | 23,309 | | | | 1,014,641 | |
HubSpot, Inc. (a) | | | 1,970 | | | | 780,987 | |
j2 Global, Inc. (a) | | | 11,711 | | | | 1,144,047 | |
Manhattan Associates, Inc. (a) | | | 10,015 | | | | 1,053,378 | |
The accompanying notes are an integral part of the financial statements.
152
MML Small Cap Growth Equity Fund – Portfolio of Investments (Continued) |
| | | Number of
Shares | | | Value | |
MarkLogic Corp. (Escrow Shares) (Acquired 11/11/20, Cost $7,680) (a) (b) (c) (d) | | | 22,966 | | | $ | 6,155 | |
New Relic, Inc. (a) | | | 500 | | | | 32,700 | |
PagerDuty, Inc. (a) (e) | | | 20,848 | | | | 869,362 | |
Porch Group, Inc. (Acquired 12/23/20, Cost $694,540) (a) (c) (d) | | | 69,454 | | | | 943,588 | |
Skillz, Inc. (a) | | | 47,260 | | | | 945,200 | |
Sprout Social, Inc. Class A (a) | | | 17,165 | | | | 779,463 | |
SVMK, Inc. (a) | | | 44,437 | | | | 1,135,365 | |
Verra Mobility Corp. (a) | | | 60,110 | | | | 806,676 | |
| | | | | | | | 18,707,981 | |
| | | | | | | | 32,851,024 | |
Utilities — 0.4% |
Electric — 0.4% |
Portland General Electric Co. | | | 20,794 | | | | 889,359 | |
| | | | | | | | | |
TOTAL COMMON STOCK (Cost $155,174,611) | | | | | | | 218,180,524 | |
| | | | | | | | | |
PREFERRED STOCK — 0.1% |
Communications — 0.1% |
Internet — 0.1% |
The Honest Company, Inc., Series D (Acquired 8/03/15, Cost $184,255) (a) (b) (c) (d) | | | 4,027 | | | | 166,798 | |
| | | | | | | | | |
TOTAL PREFERRED STOCK (Cost $184,255) | | | | | | | 166,798 | |
| | | | | | | | | |
TOTAL EQUITIES (Cost $155,358,866) | | | | | | | 218,347,322 | |
| | | | | | | | | |
MUTUAL FUNDS — 1.9% |
Diversified Financial Services — 1.9% |
iShares Russell 2000 ETF (e) | | | 4,673 | | | | 916,189 | |
State Street Navigator Securities Lending Prime Portfolio (g) | | | 3,122,111 | | | | 3,122,111 | |
| | | | | | | | 4,038,300 | |
| | | | | | | | | |
TOTAL MUTUAL FUNDS (Cost $3,884,957) | | | | | | | 4,038,300 | |
| | | | | | | | | |
TOTAL LONG-TERM INVESTMENTS (Cost $159,243,823) | | | | | | | 222,385,622 | |
| | | Principal
Amount | | | Value | |
| SHORT-TERM INVESTMENTS — 0.7% |
| Repurchase Agreement — 0.7% |
| Fixed Income Clearing Corp., Repurchase Agreement, dated 12/31/20, 0.000%, due 1/04/21 (h) | | $ | 1,482,608 | | | $ | 1,482,608 | |
| | | | | | | | | |
| TOTAL SHORT-TERM INVESTMENTS (Cost $1,482,608) | | | | | | | 1,482,608 | |
| TOTAL INVESTMENTS — 106.0% (Cost $160,726,431) (i) | | | | | | | 223,868,230 | |
| Other Assets/(Liabilities) — (6.0)% | | | | | | | (12,656,309 | ) |
| NET ASSETS — 100.0% | | | | | | $ | 211,211,921 | |
Abbreviation Legend
ADR | American Depositary Receipt |
Notes to Portfolio of Investments
Percentages are stated as a percent of net assets.
(a) | Non-income producing security. |
(b) | Investment was valued using significant unobservable inputs. |
(c) | Restricted security. Certain securities are restricted as to resale. At December 31, 2020, these securities amounted to a value of $1,116,803 or 0.53% of net assets. The Fund generally bears the costs, if any, associated with the disposition of restricted securities. |
(d) | This security is fair valued in good faith in accordance with procedures approved by the Board of Trustees. At December 31, 2020, these securities amounted to a value of $1,116,803 or 0.53% of net assets. |
(e) | Denotes all or a portion of security on loan. The total value of securities on loan as of December 31, 2020, was $25,628,995 or 11.99% of net assets. Total securities on loan may be less than the amounts identified in the Portfolio of Investments. The Fund received $23,196,229 of non-cash collateral (U.S. Treasury and/or Agency obligations) related to securities lending activity. This amount is not reflected on either the Portfolio of Investments or the Statement of Assets and Liabilities. (Note 2). |
(f) | Security is a Master Limited Partnership. |
(g) | Represents investment of security lending cash collateral. (Note 2). |
(h) | Maturity value of $1,482,608. Collateralized by U.S. Government Agency obligations with a rate of 0.000%, maturity date of 12/30/21, and an aggregate market value, including accrued interest, of $1,512,339. |
(i) | See Note 6 for aggregate cost for federal tax purposes. |
The accompanying notes are an integral part of the financial statements.
153
MML Small Company Value Fund — Portfolio of Investments |
December 31, 2020 |
| | | Number of
Shares | | | Value | |
EQUITIES — 99.3% |
COMMON STOCK — 99.3% |
Basic Materials — 5.7% |
Chemicals — 2.4% |
American Vanguard Corp. | | | 15,497 | | | $ | 240,513 | |
Element Solutions, Inc. | | | 14,975 | | | | 265,507 | |
Minerals Technologies, Inc. | | | 9,438 | | | | 586,289 | |
Orion Engineered Carbons SA | | | 27,322 | | | | 468,299 | |
Quaker Chemical Corp. (a) | | | 2,661 | | | | 674,271 | |
| | | | | | | | 2,234,879 | |
Forest Products & Paper — 0.7% |
Clearwater Paper Corp. (b) | | | 17,530 | | | | 661,758 | |
Iron & Steel — 1.1% |
Carpenter Technology Corp. | | | 17,924 | | | | 521,947 | |
Reliance Steel & Aluminum Co. | | | 3,983 | | | | 476,964 | |
| | | | | | | | 998,911 | |
Mining — 1.5% |
Alcoa Corp. (b) | | | 27,039 | | | | 623,249 | |
Constellium SE (b) | | | 56,773 | | | | 794,254 | |
| | | | | | | | 1,417,503 | |
| | | | | | | | 5,313,051 | |
Communications — 3.1% |
Advertising — 0.4% |
Boston Omaha Corp. Class A (a) (b) | | | 14,582 | | | | 403,192 | |
Internet — 0.2% |
Opendoor Technologies, Inc. (a) (b) | | | 6,474 | | | | 147,154 | |
Media — 1.7% |
Cable One, Inc. | | | 606 | | | | 1,349,998 | |
Scholastic Corp. | | | 8,431 | | | | 210,775 | |
| | | | | | | | 1,560,773 | |
Telecommunications — 0.8% |
Harmonic, Inc. (a) (b) | | | 106,740 | | | | 788,809 | |
| | | | | | | | 2,899,928 | |
Consumer, Cyclical — 11.7% |
Apparel — 1.3% |
Hanesbrands, Inc. | | | 34,398 | | | | 501,523 | |
Steven Madden Ltd. | | | 20,832 | | | | 735,786 | |
| | | | | | | | 1,237,309 | |
Auto Manufacturers — 0.4% |
Blue Bird Corp. (b) | | | 17,943 | | | | 327,639 | |
Auto Parts & Equipment — 1.2% |
Dorman Products, Inc. (b) | | | 5,757 | | | | 499,823 | |
Visteon Corp. (b) | | | 4,958 | | | | 622,328 | |
| | | | | | | | 1,122,151 | |
| | | Number of
Shares | | | Value | |
Distribution & Wholesale — 1.4% |
Pool Corp. | | | 1,664 | | | $ | 619,840 | |
Resideo Technologies, Inc. (b) | | | 13,443 | | | | 285,798 | |
Univar Solutions, Inc. (b) | | | 17,684 | | | | 336,173 | |
| | | | | | | | 1,241,811 | |
Entertainment — 0.7% |
Marriott Vacations Worldwide Corp. | | | 4,378 | | | | 600,749 | |
Home Builders — 1.8% |
Cavco Industries, Inc. (b) | | | 3,851 | | | | 675,658 | |
LCI Industries | | | 4,918 | | | | 637,766 | |
Meritage Home Corp. (b) | | | 4,445 | | | | 368,135 | |
| | | | | | | | 1,681,559 | |
Leisure Time — 0.4% |
Planet Fitness, Inc. Class A (b) | | | 5,213 | | | | 404,686 | |
Retail — 4.3% |
Beacon Roofing Supply, Inc. (b) | | | 18,235 | | | | 732,865 | |
BJ’s Restaurants, Inc. | | | 11,293 | | | | 434,667 | |
Hibbett Sports, Inc. (b) | | | 6,387 | | | | 294,952 | |
Lumber Liquidators Holdings, Inc. (b) | | | 23,173 | | | | 712,338 | |
Papa John’s International, Inc. | | | 5,673 | | | | 481,354 | |
Red Robin Gourmet Burgers, Inc. (b) | | | 13,087 | | | | 251,663 | |
Rush Enterprises, Inc. Class A | | | 7,235 | | | | 299,674 | |
Sportsman’s Warehouse Holdings, Inc. (b) | | | 33,186 | | | | 582,414 | |
Texas Roadhouse, Inc. | | | 2,400 | | | | 187,584 | |
| | | | | | | | 3,977,511 | |
Textiles — 0.2% |
UniFirst Corp. | | | 877 | | | | 185,652 | |
| | | | | | | | 10,779,067 | |
Consumer, Non-cyclical — 13.0% |
Beverages — 0.5% |
Coca-Cola Consolidated, Inc. | | | 1,785 | | | | 475,292 | |
Biotechnology — 1.9% |
Acceleron Pharma, Inc. (b) | | | 2,053 | | | | 262,661 | |
Blueprint Medicines Corp. (b) | | | 1,807 | | | | 202,655 | |
Certara, Inc. (b) | | | 1,425 | | | | 48,051 | |
Insmed, Inc. (b) | | | 3,702 | | | | 123,240 | |
Kodiak Sciences, Inc. (a) (b) | | | 1,868 | | | | 274,428 | |
Replimune Group, Inc. (b) | | | 4,859 | | | | 185,371 | |
Seer, Inc. (b) | | | 997 | | | | 55,972 | |
Ultragenyx Pharmaceutical, Inc. (b) | | | 2,666 | | | | 369,054 | |
Xencor, Inc. (a) (b) | | | 5,475 | | | | 238,874 | |
| | | | | | | | 1,760,306 | |
Commercial Services — 2.9% |
The Aaron’s Co., Inc. (b) | | | 4,511 | | | | 85,528 | |
Advantage Solutions, Inc. (b) | | | 17,239 | | | | 227,038 | |
FTI Consulting, Inc. (b) | | | 1,314 | | | | 146,800 | |
The accompanying notes are an integral part of the financial statements.
154
MML Small Company Value Fund – Portfolio of Investments (Continued) |
| | | Number of
Shares | | | Value | |
Green Dot Corp. Class A (b) | | | 11,497 | | | $ | 641,533 | |
Korn Ferry | | | 9,183 | | | | 399,460 | |
Monro, Inc. | | | 8,169 | | | | 435,408 | |
Strategic Education, Inc. | | | 7,273 | | | | 693,335 | |
| | | | | | | | 2,629,102 | |
Foods — 2.6% |
Grocery Outlet Holding Corp. (b) | | | 9,734 | | | | 382,059 | |
Nomad Foods Ltd. (b) | | | 39,291 | | | | 998,777 | |
Post Holdings, Inc. (b) | | | 5,679 | | | | 573,636 | |
The Simply Good Foods Co. (a) (b) | | | 14,691 | | | | 460,710 | |
| | | | | | | | 2,415,182 | |
Health Care – Products — 2.1% |
Atrion Corp. | | | 889 | | | | 570,951 | |
Avanos Medical, Inc. (b) | | | 8,148 | | | | 373,830 | |
Envista Holdings Corp. (b) | | | 16,108 | | | | 543,323 | |
Quidel Corp. (b) | | | 2,606 | | | | 468,168 | |
| | | | | | | | 1,956,272 | |
Health Care – Services — 2.5% |
The Ensign Group, Inc. | | | 8,937 | | | | 651,686 | |
Molina Healthcare, Inc. (b) | | | 929 | | | | 197,580 | |
The Pennant Group, Inc. (b) | | | 9,963 | | | | 578,452 | |
Select Medical Holdings Corp. (b) | | | 31,363 | | | | 867,500 | |
| | | | | | | | 2,295,218 | |
Pharmaceuticals — 0.5% |
Arvinas, Inc. (b) | | | 1,144 | | | | 97,160 | |
Option Care Health, Inc. (b) | | | 21,773 | | | | 340,530 | |
| | | | | | | | 437,690 | |
| | | | | | | | 11,969,062 | |
Energy — 4.2% |
Energy – Alternate Sources — 0.8% |
Array Technologies, Inc. (b) | | | 5,836 | | | | 251,765 | |
REX American Resources Corp. (b) | | | 6,049 | | | | 444,420 | |
| | | | | | | | 696,185 | |
Oil & Gas — 1.7% |
Kimbell Royalty Partners LP | | | 20,104 | | | | 159,023 | |
Magnolia Oil & Gas Corp. Class A (a) (b) | | | 49,334 | | | | 348,298 | |
Matador Resources Co. (b) | | | 33,615 | | | | 405,397 | |
WPX Energy, Inc. (b) | | | 79,780 | | | | 650,207 | |
| | | | | | | | 1,562,925 | |
Oil & Gas Services — 1.7% |
ChampionX Corp. (b) | | | 47,599 | | | | 728,265 | |
Liberty Oilfield Services, Inc. Class A (a) | | | 54,003 | | | | 556,771 | |
Thermon Group Holdings, Inc. (b) | | | 20,985 | | | | 327,995 | |
| | | | | | | | 1,613,031 | |
| | | | | | | | 3,872,141 | |
| | | Number of
Shares | | | Value | |
Financial — 35.1% |
Banks — 16.2% |
Atlantic Capital Bancshares, Inc. (b) | | | 7,874 | | | $ | 125,354 | |
BankUnited, Inc. | | | 31,665 | | | | 1,101,309 | |
Columbia Banking System, Inc. | | | 21,181 | | | | 760,398 | |
CrossFirst Bankshares, Inc. (b) | | | 28,142 | | | | 302,526 | |
East West Bancorp, Inc. | | | 10,635 | | | | 539,301 | |
Eastern Bankshares, Inc. (b) | | | 16,031 | | | | 261,466 | |
FB Financial Corp. | | | 20,274 | | | | 704,116 | |
Glacier Bancorp, Inc. | | | 15,617 | | | | 718,538 | |
HarborOne Bancorp, Inc. (b) | | | 45,158 | | | | 490,416 | |
Heritage Financial Corp. | | | 11,234 | | | | 262,763 | |
Home BancShares, Inc. | | | 66,218 | | | | 1,289,927 | |
Howard Bancorp, Inc. (b) | | | 34,114 | | | | 402,886 | |
Independent Bank Corp. | | | 5,613 | | | | 409,974 | |
Live Oak Bancshares, Inc. | | | 18,280 | | | | 867,569 | |
National Bank Holdings Corp. Class A | | | 18,931 | | | | 620,180 | |
Origin Bancorp, Inc. | | | 15,565 | | | | 432,240 | |
PCSB Financial Corp. | | | 11,909 | | | | 189,829 | |
Pinnacle Financial Partners, Inc. | | | 17,169 | | | | 1,105,684 | |
Popular, Inc. | | | 11,153 | | | | 628,137 | |
Prosperity Bancshares, Inc. | | | 2,004 | | | | 138,997 | |
South State Corp. | | | 10,319 | | | | 746,064 | |
Towne Bank | | | 29,814 | | | | 700,033 | |
Walker & Dunlop, Inc. | | | 3,720 | | | | 342,314 | |
Webster Financial Corp. | | | 15,455 | | | | 651,428 | |
Western Alliance Bancorp | | | 19,674 | | | | 1,179,456 | |
| | | | | | | | 14,970,905 | |
Diversified Financial Services — 5.0% |
Air Lease Corp. | | | 5,800 | | | | 257,636 | |
Houlihan Lokey, Inc. | | | 10,362 | | | | 696,637 | |
I3 Verticals, Inc. Class A (a) (b) | | | 13,584 | | | | 450,989 | |
PennyMac Financial Services, Inc. | | | 18,830 | | | | 1,235,625 | |
PRA Group, Inc. (b) | | | 5,334 | | | | 211,546 | |
PROG Holdings, Inc. | | | 18,444 | | | | 993,578 | |
Virtus Investment Partners, Inc. | | | 3,596 | | | | 780,332 | |
| | | | | | | | 4,626,343 | |
Insurance — 2.9% |
BRP Group, Inc. Class A (b) | | | 17,126 | | | | 513,266 | |
James River Group Holdings Ltd. | | | 5,344 | | | | 262,658 | |
Palomar Holdings, Inc. (b) | | | 5,128 | | | | 455,571 | |
ProAssurance Corp. | | | 17,249 | | | | 306,860 | |
Radian Group, Inc. | | | 34,999 | | | | 708,730 | |
Safety Insurance Group, Inc. | | | 1,778 | | | | 138,506 | |
State Auto Financial Corp. | | | 16,071 | | | | 285,099 | |
| | | | | | | | 2,670,690 | |
The accompanying notes are an integral part of the financial statements.
155
MML Small Company Value Fund – Portfolio of Investments (Continued) |
| | | Number of
Shares | | | Value | |
Investment Companies — 0.5% |
Cannae Holdings, Inc. (b) | | | 4,738 | | | $ | 209,751 | |
StepStone Group, Inc. Class A (a) (b) | | | 5,188 | | | | 206,483 | |
| | | | | | | | 416,234 | |
Real Estate — 1.8% |
McGrath RentCorp | | | 8,566 | | | | 574,778 | |
The St. Joe Co. (a) | | | 25,802 | | | | 1,095,295 | |
| | | | | | | | 1,670,073 | |
Real Estate Investment Trusts (REITS) — 7.0% |
American Campus Communities, Inc. | | | 9,030 | | | | 386,213 | |
Apartment Investment and Management Co. Class A | | | 38,600 | | | | 203,808 | |
EastGroup Properties, Inc. | | | 5,481 | | | | 756,707 | |
Essential Properties Realty Trust, Inc. | | | 9,259 | | | | 196,291 | |
Healthcare Realty Trust, Inc. | | | 17,577 | | | | 520,279 | |
JBG SMITH Properties | | | 20,235 | | | | 632,748 | |
PotlatchDeltic Corp. | | | 16,462 | | | | 823,429 | |
PS Business Parks, Inc. | | | 3,927 | | | | 521,781 | |
Safehold, Inc. (a) | | | 3,359 | | | | 243,494 | |
Saul Centers, Inc. | | | 14,553 | | | | 461,039 | |
Sunstone Hotel Investors, Inc. | | | 63,275 | | | | 716,906 | |
Terreno Realty Corp. | | | 17,374 | | | | 1,016,553 | |
| | | | | | | | 6,479,248 | |
Savings & Loans — 1.7% |
Meridian Bancorp, Inc. | | | 27,711 | | | | 413,171 | |
WSFS Financial Corp. | | | 25,975 | | | | 1,165,758 | |
| | | | | | | | 1,578,929 | |
| | | | | | | | 32,412,422 | |
Industrial — 15.8% |
Aerospace & Defense — 0.6% |
Triumph Group, Inc. | | | 45,447 | | | | 570,814 | |
Building Materials — 1.9% |
JELD-WEN Holding, Inc. (b) | | | 9,499 | | | | 240,895 | |
SPX Corp. (b) | | | 9,167 | | | | 499,968 | |
UFP Industries, Inc. | | | 18,766 | | | | 1,042,451 | |
| | | | | | | | 1,783,314 | |
Electrical Components & Equipment — 2.7% |
Belden, Inc. | | | 25,644 | | | | 1,074,484 | |
Littelfuse, Inc. | | | 5,656 | | | | 1,440,357 | |
| | | | | | | | 2,514,841 | |
Electronics — 1.4% |
Brady Corp. Class A | | | 9,862 | | | | 520,911 | |
Knowles Corp. (b) | | | 23,194 | | | | 427,466 | |
Mesa Laboratories, Inc. | | | 1,102 | | | | 315,877 | |
| | | | | | | | 1,264,254 | |
| | | Number of
Shares | | | Value | |
Engineering & Construction — 0.9% |
Aegion Corp. (b) | | | 45,285 | | | $ | 859,962 | |
Environmental Controls — 0.8% |
Stericycle, Inc. (b) | | | 10,098 | | | | 700,094 | |
Hand & Machine Tools — 0.6% |
MSA Safety, Inc. | | | 3,454 | | | | 515,993 | |
Machinery – Diversified — 1.8% |
Alamo Group, Inc. | | | 2,008 | | | | 277,003 | |
Cactus, Inc. Class A | | | 22,342 | | | | 582,456 | |
Chart Industries, Inc. (b) | | | 2,606 | | | | 306,961 | |
CIRCOR International, Inc. (b) | | | 12,425 | | | | 477,617 | |
Hydrofarm Holdings Group, Inc. (b) | | | 617 | | | | 32,442 | |
| | | | | | | | 1,676,479 | |
Metal Fabricate & Hardware — 1.1% |
Helios Technologies, Inc. | | | 12,303 | | | | 655,627 | |
The Timken Co. | | | 4,649 | | | | 359,647 | |
| | | | | | | | 1,015,274 | |
Miscellaneous – Manufacturing — 2.0% |
Enerpac Tool Group Corp. | | | 21,192 | | | | 479,151 | |
ESCO Technologies, Inc. | | | 8,354 | | | | 862,300 | |
Myers Industries, Inc. | | | 23,277 | | | | 483,696 | |
| | | | | | | | 1,825,147 | |
Transportation — 2.0% |
International Seaways, Inc. | | | 16,982 | | | | 277,316 | |
Landstar System, Inc. | | | 4,487 | | | | 604,219 | |
Matson, Inc. | | | 7,695 | | | | 438,384 | |
Ryder System, Inc. | | | 9,184 | | | | 567,204 | |
| | | | | | | | 1,887,123 | |
| | | | | | | | 14,613,295 | |
Technology — 6.5% |
Computers — 1.1% |
Cubic Corp. | | | 10,676 | | | | 662,339 | |
Parsons Corp. (b) | | | 9,819 | | | | 357,510 | |
| | | | | | | | 1,019,849 | |
Semiconductors — 2.3% |
Entegris, Inc. | | | 7,993 | | | | 768,127 | |
MaxLinear, Inc. (b) | | | 16,850 | | | | 643,502 | |
Onto Innovation, Inc. (b) | | | 5,466 | | | | 259,908 | |
Semtech Corp. (b) | | | 5,698 | | | | 410,769 | |
| | | | | | | | 2,082,306 | |
Software — 3.1% |
Ceridian HCM Holding, Inc. (b) | | | 11,135 | | | | 1,186,546 | |
Clarivate PLC (b) | | | 20,572 | | | | 611,194 | |
nCino, Inc. (b) | | | 3,788 | | | | 274,289 | |
Outset Medical, Inc. (b) | | | 730 | | | | 41,493 | |
Phreesia, Inc. (b) | | | 7,383 | | | | 400,601 | |
The accompanying notes are an integral part of the financial statements.
156
MML Small Company Value Fund – Portfolio of Investments (Continued) |
| | | Number of
Shares | | | Value | |
Workiva, Inc. (b) | | | 3,911 | | | $ | 358,326 | |
| | | | | | | | 2,872,449 | |
| | | | | | | | 5,974,604 | |
Utilities — 4.2% |
Electric — 1.4% |
Ameresco, Inc. Class A (b) | | | 4,126 | | | | 215,542 | |
IDACORP, Inc. | | | 3,255 | | | | 312,578 | |
MGE Energy, Inc. | | | 7,470 | | | | 523,124 | |
PNM Resources, Inc. | | | 4,850 | | | | 235,371 | |
| | | | | | | | 1,286,615 | |
Gas — 2.2% |
Chesapeake Utilities Corp. (a) | | | 10,361 | | | | 1,121,164 | |
ONE Gas, Inc. | | | 9,545 | | | | 732,769 | |
RGC Resources, Inc. | | | 6,196 | | | | 147,341 | |
| | | | | | | | 2,001,274 | |
Water — 0.6% |
California Water Service Group | | | 11,365 | | | | 614,051 | |
| | | | | | | | 3,901,940 | |
| | | | | | | | | |
TOTAL COMMON STOCK (Cost $66,369,691) | | | | | | | 91,735,510 | |
| | | | | | | | | |
TOTAL EQUITIES (Cost $66,369,691) | | | | | | | 91,735,510 | |
| | | | | | | | | |
WARRANTS — 0.0% |
Consumer, Non-cyclical — 0.0% |
Commercial Services — 0.0% |
Advantage Solutions, Inc., Expires 10/28/25 (b) | | | 3,471 | | | | 9,892 | |
| | | | | | | | | |
TOTAL WARRANTS (Cost $4,568) | | | | | | | 9,892 | |
| | | | | | | | | |
MUTUAL FUNDS — 0.3% |
Diversified Financial Services — 0.3% |
State Street Navigator Securities Lending Prime Portfolio (c) | | | 243,686 | | | | 243,686 | |
| | | | | | | | | |
TOTAL MUTUAL FUNDS (Cost $243,686) | | | | | | | 243,686 | |
| | | | | | | | | |
TOTAL LONG-TERM INVESTMENTS (Cost $66,617,945) | | | | | | | 91,989,088 | |
| | | Number of
Shares | | | Value | |
| SHORT-TERM INVESTMENTS — 0.3% |
| Mutual Fund — 0.0% |
| T. Rowe Price Government Reserve Investment Fund | | | 100 | | | $ | 100 | |
| | | | | | | | | |
| | | | Principal
Amount | | | | | |
| Repurchase Agreement — 0.3% |
| Fixed Income Clearing Corp., Repurchase Agreement, dated 12/31/20, 0.000%, due 1/04/21 (d) | | $ | 320,755 | | | | 320,755 | |
| | | | | | | | | |
| TOTAL SHORT-TERM INVESTMENTS (Cost $320,855) | | | | | | | 320,855 | |
| TOTAL INVESTMENTS — 99.9% (Cost $66,938,800) (e) | | | | | | | 92,309,943 | |
| Other Assets/(Liabilities) — 0.1% | | | | | | | 112,678 | |
| NET ASSETS — 100.0% | | | | | | $ | 92,422,621 | |
Notes to Portfolio of Investments
Percentages are stated as a percent of net assets.
(a) | Denotes all or a portion of security on loan. The total value of securities on loan as of December 31, 2020, was $3,698,970 or 4.00% of net assets. Total securities on loan may be less than the amounts identified in the Portfolio of Investments. The Fund received $3,575,313 of non-cash collateral (U.S. Treasury and/or Agency obligations) related to securities lending activity. This amount is not reflected on either the Portfolio of Investments or the Statement of Assets and Liabilities. (Note 2). |
(b) | Non-income producing security. |
(c) | Represents investment of security lending cash collateral. (Note 2). |
(d) | Maturity value of $320,755. Collateralized by U.S. Government Agency obligations with a rate of 0.000%, maturity date of 12/30/21, and an aggregate market value, including accrued interest, of $327,219. |
(e) | See Note 6 for aggregate cost for federal tax purposes. |
The accompanying notes are an integral part of the financial statements.
157
MML Small/Mid Cap Value Fund – Portfolio of Investments |
December 31, 2020 |
| | | Number of
Shares | | | Value | |
EQUITIES — 103.3% |
COMMON STOCK — 103.3% |
Basic Materials — 5.4% |
Chemicals — 3.1% |
GCP Applied Technologies, Inc. (a) | | | 47,668 | | | $ | 1,127,348 | |
Innospec, Inc. | | | 11,130 | | | | 1,009,825 | |
Orion Engineered Carbons SA | | | 112,200 | | | | 1,923,108 | |
Westlake Chemical Corp. | | | 21,673 | | | | 1,768,517 | |
| | | | | | | | 5,828,798 | |
Iron & Steel — 2.3% |
Carpenter Technology Corp. | | | 50,055 | | | | 1,457,601 | |
Reliance Steel & Aluminum Co. | | | 22,805 | | | | 2,730,899 | |
| | | | | | | | 4,188,500 | |
| | | | | | | | 10,017,298 | |
Communications — 1.0% |
Internet — 0.8% |
Criteo SA Sponsored ADR (a) | | | 71,151 | | | | 1,459,307 | |
Media — 0.2% |
Houghton Mifflin Harcourt Co. (a) | | | 141,140 | | | | 469,996 | |
| | | | | | | | 1,929,303 | |
Consumer, Cyclical — 21.0% |
Airlines — 2.1% |
Alaska Air Group, Inc. | | | 36,222 | | | | 1,883,544 | |
SkyWest, Inc. | | | 51,777 | | | | 2,087,131 | |
| | | | | | | | 3,970,675 | |
Apparel — 5.3% |
Kontoor Brands, Inc. (b) | | | 49,130 | | | | 1,992,713 | |
Ralph Lauren Corp. | | | 25,470 | | | | 2,642,258 | |
Skechers U.S.A., Inc. Class A (a) | | | 39,367 | | | | 1,414,850 | |
Steven Madden Ltd. | | | 59,750 | | | | 2,110,370 | |
Tapestry, Inc. | | | 55,930 | | | | 1,738,304 | |
| | | | | | | | 9,898,495 | |
Auto Parts & Equipment — 3.5% |
Cooper Tire & Rubber Co. | | | 40,903 | | | | 1,656,572 | |
Dana, Inc. | | | 127,896 | | | | 2,496,530 | |
Lear Corp. | | | 15,250 | | | | 2,425,207 | |
| | | | | | | | 6,578,309 | |
Home Builders — 3.0% |
KB Home | | | 52,520 | | | | 1,760,470 | |
PulteGroup, Inc. | | | 55,710 | | | | 2,402,215 | |
Taylor Morrison Home Corp. (a) | | | 53,664 | | | | 1,376,482 | |
| | | | | | | | 5,539,167 | |
Home Furnishing — 1.1% |
Herman Miller, Inc. | | | 60,640 | | | | 2,049,632 | |
Leisure Time — 1.1% |
Brunswick Corp. | | | 27,461 | | | | 2,093,627 | |
| | | Number of
Shares | | | Value | |
Lodging — 1.1% |
Hilton Grand Vacations, Inc. (a) | | | 65,020 | | | $ | 2,038,377 | |
Retail — 3.8% |
Foot Locker, Inc. | | | 60,873 | | | | 2,461,704 | |
The Gap, Inc. | | | 89,420 | | | | 1,805,389 | |
Papa John’s International, Inc. | | | 15,241 | | | | 1,293,199 | |
Williams-Sonoma, Inc. | | | 14,901 | | | | 1,517,518 | |
| | | | | | | | 7,077,810 | |
| | | | | | | | 39,246,092 | |
Consumer, Non-cyclical — 7.8% |
Beverages — 0.7% |
Primo Water Corp. | | | 79,031 | | | | 1,239,206 | |
Commercial Services — 2.4% |
Robert Half International, Inc. | | | 39,008 | | | | 2,437,220 | |
United Rentals, Inc. (a) | | | 8,881 | | | | 2,059,593 | |
| | | | | | | | 4,496,813 | |
Foods — 3.1% |
The Hain Celestial Group, Inc. (a) (b) | | | 63,055 | | | | 2,531,658 | |
Nomad Foods Ltd. (a) | | | 64,977 | | | | 1,651,716 | |
US Foods Holding Corp. (a) | | | 47,372 | | | | 1,577,961 | |
| | | | | | | | 5,761,335 | |
Health Care – Services — 1.6% |
MEDNAX, Inc. (a) | | | 83,930 | | | | 2,059,642 | |
Molina Healthcare, Inc. (a) | | | 4,385 | | | | 932,602 | |
| | | | | | | | 2,992,244 | |
| | | | | | | | 14,489,598 | |
Energy — 3.5% |
Oil & Gas — 2.0% |
Cimarex Energy Co. | | | 38,074 | | | | 1,428,156 | |
HollyFrontier Corp. | | | 91,905 | | | | 2,375,744 | |
| | | | | | | | 3,803,900 | |
Oil & Gas Services — 1.5% |
Dril-Quip, Inc. (a) | | | 50,262 | | | | 1,488,760 | |
MRC Global, Inc. (a) | | | 197,285 | | | | 1,308,000 | |
| | | | | | | | 2,796,760 | |
| | | | | | | | 6,600,660 | |
Financial — 32.5% |
Banks — 11.8% |
Associated Banc-Corp. | | | 76,161 | | | | 1,298,545 | |
BankUnited, Inc. | | | 74,669 | | | | 2,596,988 | |
Comerica, Inc. | | | 42,120 | | | | 2,352,823 | |
First Citizens BancShares, Inc. Class A | | | 5,239 | | | | 3,008,601 | |
Synovus Financial Corp. | | | 80,974 | | | | 2,621,128 | |
Texas Capital Bancshares, Inc. (a) | | | 39,808 | | | | 2,368,576 | |
Umpqua Holdings Corp. | | | 110,248 | | | | 1,669,155 | |
Webster Financial Corp. | | | 58,879 | | | | 2,481,750 | |
Wintrust Financial Corp. | | | 27,220 | | | | 1,662,870 | |
The accompanying notes are an integral part of the financial statements.
158
MML Small/Mid Cap Value Fund – Portfolio of Investments (Continued) |
| | | Number of
Shares | | | Value | |
Zions Bancorp NA | | | 45,178 | | | $ | 1,962,532 | |
| | | | | | | | 22,022,968 | |
Diversified Financial Services — 3.5% |
Moelis & Co. Class A | | | 55,611 | | | | 2,600,370 | |
OneMain Holdings, Inc. | | | 36,154 | | | | 1,741,177 | |
Stifel Financial Corp. | | | 44,940 | | | | 2,267,672 | |
| | | | | | | | 6,609,219 | |
Insurance — 7.2% |
American Financial Group, Inc. | | | 21,868 | | | | 1,916,074 | |
Essent Group Ltd. | | | 31,593 | | | | 1,364,818 | |
Everest Re Group Ltd. | | | 10,381 | | | | 2,430,088 | |
The Hanover Insurance Group, Inc. | | | 17,228 | | | | 2,014,298 | |
Reinsurance Group of America, Inc. | | | 16,922 | | | | 1,961,260 | |
Selective Insurance Group, Inc. | | | 22,507 | | | | 1,507,519 | |
Voya Financial, Inc. | | | 36,578 | | | | 2,151,152 | |
| | | | | | | | 13,345,209 | |
Real Estate Investment Trusts (REITS) — 8.6% |
American Campus Communities, Inc. | | | 46,062 | | | | 1,970,072 | |
Camden Property Trust | | | 22,618 | | | | 2,259,991 | |
Cousins Properties, Inc. | | | 51,720 | | | | 1,732,620 | |
CubeSmart | | | 64,704 | | | | 2,174,702 | |
MGM Growth Properties LLC Class A | | | 73,319 | | | | 2,294,885 | |
Physicians Realty Trust | | | 112,503 | | | | 2,002,553 | |
RLJ Lodging Trust | | | 110,936 | | | | 1,569,744 | |
STAG Industrial, Inc. | | | 65,242 | | | | 2,043,379 | |
| | | | | | | | 16,047,946 | |
Savings & Loans — 1.4% |
Sterling Bancorp | | | 141,032 | | | | 2,535,755 | |
| | | | | | | | 60,561,097 | |
Industrial — 22.0% |
Aerospace & Defense — 1.0% |
AAR Corp. | | | 53,238 | | | | 1,928,280 | |
Building Materials — 0.9% |
Masonite International Corp. (a) | | | 16,351 | | | | 1,607,957 | |
Electrical Components & Equipment — 1.5% |
Belden, Inc. | | | 44,514 | | | | 1,865,137 | |
EnerSys | | | 11,530 | | | | 957,682 | |
| | | | | | | | 2,822,819 | |
Electronics — 1.9% |
Arrow Electronics, Inc. (a) | | | 18,600 | | | | 1,809,780 | |
Vishay Intertechnology, Inc. | | | 84,829 | | | | 1,756,809 | |
| | | | | | | | 3,566,589 | |
Engineering & Construction — 1.5% |
AECOM (a) | | | 55,650 | | | | 2,770,257 | |
Hand & Machine Tools — 3.2% |
Kennametal, Inc. | | | 69,608 | | | | 2,522,594 | |
| | | Number of
Shares | | | Value | |
Regal Beloit Corp. | | | 27,572 | | | $ | 3,386,117 | |
| | | | | | | | 5,908,711 | |
Machinery – Construction & Mining — 1.6% |
Oshkosh Corp. | | | 34,601 | | | | 2,978,108 | |
Machinery – Diversified — 1.2% |
Crane Co. | | | 10,432 | | | | 810,149 | |
The Middleby Corp. (a) | | | 7,140 | | | | 920,489 | |
Welbilt, Inc. (a) | | | 38,380 | | | | 506,616 | |
| | | | | | | | 2,237,254 | |
Miscellaneous – Manufacturing — 2.4% |
Hillenbrand, Inc. | | | 49,990 | | | | 1,989,602 | |
Trinseo SA | | | 46,153 | | | | 2,363,495 | |
| | | | | | | | 4,353,097 | |
Packaging & Containers — 2.4% |
Graphic Packaging Holding Co. | | | 136,229 | | | | 2,307,719 | |
Sealed Air Corp. | | | 48,450 | | | | 2,218,526 | |
| | | | | | | | 4,526,245 | |
Transportation — 3.1% |
Knight-Swift Transportation Holdings, Inc. | | | 65,943 | | | | 2,757,736 | |
XPO Logistics, Inc. (a) | | | 25,869 | | | | 3,083,585 | |
| | | | | | | | 5,841,321 | |
Trucking & Leasing — 1.3% |
GATX Corp. | | | 28,900 | | | | 2,403,902 | |
| | | | | | | | 40,944,540 | |
Technology — 8.0% |
Computers — 3.5% |
Amdocs Ltd. | | | 22,384 | | | | 1,587,697 | |
Genpact Ltd. | | | 36,140 | | | | 1,494,750 | |
NCR Corp. (a) | | | 64,205 | | | | 2,412,182 | |
NetScout Systems, Inc. (a) | | | 37,606 | | | | 1,031,157 | |
| | | | | | | | 6,525,786 | |
Semiconductors — 1.7% |
Kulicke & Soffa Industries, Inc. | | | 57,902 | | | | 1,841,863 | |
MaxLinear, Inc. (a) | | | 36,319 | | | | 1,387,022 | |
| | | | | | | | 3,228,885 | |
Software — 2.8% |
Change Healthcare, Inc. (a) | | | 155,630 | | | | 2,902,499 | |
CommVault Systems, Inc. (a) | | | 40,496 | | | | 2,242,264 | |
| | | | | | | | 5,144,763 | |
| | | | | | | | 14,899,434 | |
Utilities — 2.1% |
Electric — 1.3% |
IDACORP, Inc. | | | 20,561 | | | | 1,974,473 | |
PNM Resources, Inc. | | | 8,951 | | | | 434,392 | |
| | | | | | | | 2,408,865 | |
The accompanying notes are an integral part of the financial statements.
159
MML Small/Mid Cap Value Fund – Portfolio of Investments (Continued) |
| | | Number of
Shares | | | Value | |
Gas — 0.8% |
Southwest Gas Holdings, Inc. | | | 26,310 | | | $ | 1,598,332 | |
| | | | | | | | 4,007,197 | |
| | | | | | | | | |
TOTAL COMMON STOCK (Cost $161,431,878) | | | | | | | 192,695,219 | |
| | | | | | | | | |
TOTAL EQUITIES (Cost $161,431,878) | | | | | | | 192,695,219 | |
| | | | | | | | | |
TOTAL LONG-TERM INVESTMENTS (Cost $161,431,878) | | | | | | | 192,695,219 | |
| | | Principal
Amount | | | | | |
SHORT-TERM INVESTMENTS — 1.1% |
Repurchase Agreement — 1.1% |
Fixed Income Clearing Corp., Repurchase Agreement, dated 12/31/20, 0.000%, due 1/04/21 (c) | | $ | 1,974,455 | | | | 1,974,455 | |
| | | | | | | | | |
TOTAL SHORT-TERM INVESTMENTS (Cost $1,974,455) | | | | | | | 1,974,455 | |
| | | | | | | | | |
TOTAL INVESTMENTS — 104.4% (Cost $163,406,333) (d) | | | | | | | 194,669,674 | |
| | | | | | | | | |
Other Assets/(Liabilities) — (4.4)% | | | | | | | (8,222,529 | ) |
| | | | | | | | | |
NET ASSETS — 100.0% | | | | | | $ | 186,447,145 | |
Abbreviation Legend
ADR | American Depositary Receipt |
Notes to Portfolio of Investments
Percentages are stated as a percent of net assets.
(a) | Non-income producing security. |
(b) | Denotes all or a portion of security on loan. The total value of securities on loan as of December 31, 2020, was $3,953,829 or 2.12% of net assets. Total securities on loan may be less than the amounts identified in the Portfolio of Investments. The Fund received $4,038,919 of non-cash collateral (U.S. Treasury and/or Agency obligations) related to securities lending activity. This amount is not reflected on either the Portfolio of Investments or the Statement of Assets and Liabilities. (Note 2). |
(c) | Maturity value of $1,974,455. Collateralized by U.S. Government Agency obligations with a rate of 0.000%, maturity date of 12/30/21, and an aggregate market value, including accrued interest, of $2,013,955. |
(d) | See Note 6 for aggregate cost for federal tax purposes. |
The accompanying notes are an integral part of the financial statements.
160
MML Total Return Bond Fund – Portfolio of Investments |
December 31, 2020 |
| | | Principal
Amount | | | Value | |
BONDS & NOTES — 110.9% |
BANK LOANS — 0.7% |
Aerospace & Defense — 0.0% |
TransDigm, Inc., 2020 Term Loan E, 1 mo. LIBOR + 2.250% | | | | | | | | |
2.397% VRN 5/30/25 | | $ | 49,500 | | | $ | 48,448 | |
Airlines — 0.0% |
American Airlines, Inc., 2017 1st Lien Term Loan, 1 mo. LIBOR + 1.750% | | | | | | | | |
1.898% VRN 1/29/27 | | | 50,000 | | | | 42,750 | |
Auto Parts & Equipment — 0.0% |
Clarios Global LP, USD Term Loan B, 1 mo. LIBOR + 3.500% | | | | | | | | |
3.647% VRN 4/30/26 | | | 48,604 | | | | 48,350 | |
Diversified Financial Services — 0.2% |
Delos Finance S.A.R.L., 2018 Term Loan B, 3 mo. LIBOR + 1.750% | | | | | | | | |
2.004% VRN 10/06/23 | | | 796,200 | | | | 794,870 | |
Environmental Controls — 0.0% |
GFL Environmental, Inc., 2018 USD Term Loan B, 3 mo. LIBOR + 3.000% | | | | | | | | |
3.500% VRN 5/30/25 | | | 89,263 | | | | 89,278 | |
Foods — 0.1% |
Hostess Brands LLC, 2019 Term Loan, 1 mo. LIBOR + 2.250%, 3 mo. LIBOR + 2.250% | | | | | | | | |
3.000% VRN 8/03/25 | | | 128,697 | | | | 127,892 | |
Health Care – Products — 0.1% |
Avantor Funding, Inc., 2020 Incremental Term Loan B4, 1 mo. LIBOR + 2.500% | | | | | | | | |
3.500% VRN 11/08/27 | | | 250,000 | | | | 250,157 | |
Packaging & Containers — 0.0% |
Berry Global, Inc., Term Loan Y, 1 mo. LIBOR + 2.000% | | | | | | | | |
2.149% VRN 7/01/26 | | | 98,995 | | | | 98,414 | |
Pharmaceuticals — 0.2% |
Change Healthcare Holdings LLC, 2017 Term Loan B, 1 mo. LIBOR + 2.500%, 3 mo. LIBOR + 2.500% | | | | | | | | |
3.500% VRN 3/01/24 | | | 46,521 | | | | 46,265 | |
Elanco Animal Health, Inc., Term Loan B, 3 mo. LIBOR + 1.750% | | | | | | | | |
1.905% VRN 8/01/27 | | | 413,996 | | | | 409,943 | |
| | | Principal
Amount | | | Value | |
Grifols Worldwide Operations USA, Inc., USD 2019 Term Loan B, 1 Week LIBOR + 2.000% | | | | | | | | |
2.102% VRN 11/15/27 | | $ | 49,500 | | | $ | 49,036 | |
| | | | | | | | 505,244 | |
Real Estate Investment Trusts (REITS) — 0.0% |
VICI Properties 1 LLC, Replacement Term Loan B, 1 mo. LIBOR + 1.750% | | | | | | | | |
1.894% VRN 12/20/24 | | | 50,000 | | | | 49,113 | |
Semiconductors — 0.0% |
Broadcom, Inc., 2019 1st Lien Term Loan A3, 1 mo. LIBOR + 1.125% | | | | | | | | |
1.272% VRN 11/04/22 | | | 52,802 | | | | 52,704 | |
Telecommunications — 0.1% |
Level 3 Financing, Inc., 2019 Term Loan B, 1 mo. LIBOR + 1.750% | | | | | | | | |
1.897% VRN 3/01/27 | | | 125,000 | | | | 122,786 | |
Zayo Group Holdings, Inc., USD Term Loan, 1 mo. LIBOR + 3.000% | | | | | | | | |
3.147% VRN 3/09/27 | | | 200,428 | | | | 198,925 | |
| | | | | | | | 321,711 | |
| | | | | | | | | |
TOTAL BANK LOANS (Cost $2,337,738) | | | | | | | 2,428,931 | |
| | | | | | | | | |
CORPORATE DEBT — 22.1% |
Agriculture — 0.5% |
BAT Capital Corp. | | | | | | | | |
4.390% 8/15/37 | | | 400,000 | | | | 449,325 | |
4.540% 8/15/47 | | | 800,000 | | | | 888,361 | |
Reynolds American, Inc. | | | | | | | | |
5.850% 8/15/45 | | | 315,000 | | | | 402,806 | |
| | | | | | | | 1,740,492 | |
Airlines — 0.1% |
Northwest Airlines Pass-Through Trust | | | | | | | | |
7.041% 10/01/23 | | | 292,947 | | | | 287,694 | |
Auto Manufacturers — 1.1% |
Ford Motor Credit Co. LLC | | | | | | | | |
3 mo. USD LIBOR + .810% 1.048% FRN 4/05/21 | | | 260,000 | | | | 258,886 | |
3 mo. USD LIBOR + .880% 1.104% FRN 10/12/21 | | | 405,000 | | | | 400,163 | |
3 mo. USD LIBOR + 1.270% 1.521% FRN 3/28/22 | | | 90,000 | | | | 88,466 | |
3.219% 1/09/22 | | | 100,000 | | | | 100,928 | |
3.336% 3/18/21 | | | 65,000 | | | | 65,163 | |
3.813% 10/12/21 | | | 185,000 | | | | 187,081 | |
5.085% 1/07/21 | | | 640,000 | | | | 640,000 | |
The accompanying notes are an integral part of the financial statements.
161
MML Total Return Bond Fund – Portfolio of Investments (Continued) |
| | | Principal
Amount | | | Value | |
5.750% 2/01/21 | | $ | 80,000 | | | $ | 80,200 | |
General Motors Financial Co., Inc. | | | | | | | | |
3.150% 6/30/22 | | | 550,000 | | | | 569,430 | |
3.200% 7/06/21 | | | 610,000 | | | | 616,561 | |
3.450% 4/10/22 | | | 105,000 | | | | 107,974 | |
4.200% 11/06/21 | | | 675,000 | | | | 695,734 | |
4.375% 9/25/21 | | | 85,000 | | | | 87,295 | |
| | | | | | | | 3,897,881 | |
Banks — 2.3% |
Bank of America Corp. | | | | | | | | |
SOFR + 1.150% 1.319% VRN 6/19/26 | | | 330,000 | | | | 337,039 | |
3 mo. USD LIBOR + 1.190% 2.884% VRN 10/22/30 | | | 250,000 | | | | 274,527 | |
3 mo. USD LIBOR + 3.150% 4.083% VRN 3/20/51 | | | 390,000 | | | | 492,519 | |
Citigroup, Inc. SOFR + 2.107% | | | | | | | | |
2.572% VRN 6/03/31 | | | 435,000 | | | | 463,649 | |
HSBC Holdings PLC SOFR + 1.732% | | | | | | | | |
2.013% VRN 9/22/28 | | | 870,000 | | | | 890,642 | |
JP Morgan Chase & Co. | | | | | | | | |
2.950% 10/01/26 | | | 895,000 | | | | 992,952 | |
Lloyds Banking Group PLC | | | | | | | | |
3.900% 3/12/24 | | | 400,000 | | | | 439,678 | |
4.050% 8/16/23 | | | 220,000 | | | | 240,411 | |
Santander UK Group Holdings PLC 3 mo. USD LIBOR + 1.080% | | | | | | | | |
3.373% VRN 1/05/24 | | | 645,000 | | | | 678,838 | |
Santander UK PLC | | | | | | | | |
5.000% 11/07/23 (a) | | | 435,000 | | | | 480,177 | |
Wells Fargo & Co. | | | | | | | | |
SOFR + 2.100% 2.393% VRN 6/02/28 | | | 400,000 | | | | 425,849 | |
3 mo. USD LIBOR + 1.170% 2.879% VRN 10/30/30 | | | 305,000 | | | | 332,752 | |
SOFR + 2.530% 3.068% VRN 4/30/41 | | | 500,000 | | | | 543,900 | |
3 mo. USD LIBOR + 4.240% 5.013% VRN 4/04/51 | | | 980,000 | | | | 1,392,793 | |
| | | | | | | | 7,985,726 | |
Beverages — 0.4% |
Anheuser-Busch Cos. LLC/Anheuser-Busch InBev Worldwide, Inc. | | | | | | | | |
4.900% 2/01/46 | | | 880,000 | | | | 1,144,203 | |
Bacardi Ltd. | | | | | | | | |
4.700% 5/15/28 (a) | | | 160,000 | | | | 189,808 | |
5.300% 5/15/48 (a) | | | 130,000 | | | | 180,330 | |
| | | | | | | | 1,514,341 | |
| | | Principal
Amount | | | Value | |
Chemicals — 0.2% |
International Flavors & Fragrances, Inc. | | | | | | | | |
5.000% 9/26/48 | | $ | 515,000 | | | $ | 693,262 | |
Nutrition & Biosciences, Inc. | | | | | | | | |
3.468% 12/01/50 (a) | | | 115,000 | | | | 124,922 | |
| | | | | | | | 818,184 | |
Commercial Services — 0.3% |
IHS Markit Ltd. | | | | | | | | |
4.000% 3/01/26 (a) | | | 253,000 | | | | 289,837 | |
4.750% 2/15/25 (a) | | | 120,000 | | | | 137,712 | |
4.750% 8/01/28 | | | 385,000 | | | | 474,139 | |
| | | | | | | | 901,688 | |
Computers — 0.4% |
Apple, Inc. | | | | | | | | |
4.650% 2/23/46 | | | 850,000 | | | | 1,208,238 | |
Diversified Financial Services — 1.3% |
Air Lease Corp. | | | | | | | | |
3.500% 1/15/22 | | | 575,000 | | | | 591,738 | |
Avolon Holdings Funding Ltd. | | | | | | | | |
2.875% 2/15/25 (a) | | | 335,000 | | | | 341,588 | |
3.950% 7/01/24 (a) | | | 130,000 | | | | 137,301 | |
5.125% 10/01/23 (a) | | | 40,000 | | | | 42,791 | |
5.250% 5/15/24 (a) | | | 35,000 | | | | 38,067 | |
GE Capital Funding LLC | | | | | | | | |
4.400% 5/15/30 (a) | | | 330,000 | | | | 389,013 | |
GE Capital International Funding Co. Unlimited Co. | | | | | | | | |
4.418% 11/15/35 | | | 1,360,000 | | | | 1,623,223 | |
Park Aerospace Holdings Ltd. | | | | | | | | |
4.500% 3/15/23 (a) | | | 320,000 | | | | 335,336 | |
5.250% 8/15/22 (a) | | | 95,000 | | | | 99,704 | |
5.500% 2/15/24 (a) | | | 290,000 | | | | 316,284 | |
Raymond James Financial, Inc. | | | | | | | | |
4.950% 7/15/46 | | | 265,000 | | | | 363,169 | |
| | | | | | | | 4,278,214 | |
Electric — 1.7% |
Duke Energy Carolinas LLC | | | | | | | | |
4.000% 9/30/42 | | | 1,000,000 | | | | 1,235,386 | |
Jersey Central Power & Light Co. | | | | | | | | |
4.700% 4/01/24 (a) | | | 800,000 | | | | 874,876 | |
6.400% 5/15/36 | | | 425,000 | | | | 544,623 | |
LG&E & KU Energy LLC | | | | | | | | |
4.375% 10/01/21 | | | 1,200,000 | | | | 1,222,159 | |
MidAmerican Energy Co. | | | | | | | | |
4.800% 9/15/43 | | | 1,400,000 | | | | 1,915,286 | |
| | | | | | | | 5,792,330 | |
The accompanying notes are an integral part of the financial statements.
162
MML Total Return Bond Fund – Portfolio of Investments (Continued) |
| | | Principal
Amount | | | Value | |
Engineering & Construction — 0.1% |
PowerTeam Services LLC | | | | | | | | |
9.033% 12/04/25 (a) | | $ | 190,000 | | | $ | 211,396 | |
Entertainment — 0.1% |
Caesars Entertainment, Inc. | | | | | | | | |
6.250% 7/01/25 (a) | | | 104,000 | | | | 110,760 | |
Churchill Downs, Inc. | | | | | | | | |
4.750% 1/15/28 (a) | | | 80,000 | | | | 84,200 | |
Live Nation Entertainment, Inc. | | | | | | | | |
4.750% 10/15/27 (a) | | | 109,000 | | | | 111,716 | |
| | | | | | | | 306,676 | |
Environmental Controls — 0.1% |
GFL Environmental, Inc. | | | | | | | | |
5.125% 12/15/26 (a) | | | 164,000 | | | | 174,455 | |
Waste Pro USA, Inc. | | | | | | | | |
5.500% 2/15/26 (a) | | | 136,000 | | | | 139,060 | |
| | | | | | | | 313,515 | |
Foods — 0.5% |
Kraft Heinz Foods Co. | | | | | | | | |
4.875% 10/01/49 (a) | | | 560,000 | | | | 653,309 | |
5.000% 6/04/42 | | | 350,000 | | | | 410,646 | |
6.875% 1/26/39 | | | 250,000 | | | | 346,414 | |
Pilgrim’s Pride Corp. | | | | | | | | |
5.875% 9/30/27 (a) | | | 30,000 | | | | 32,538 | |
Post Holdings, Inc. | | | | | | | | |
5.750% 3/01/27 (a) | | | 150,000 | | | | 158,813 | |
| | | | | | | | 1,601,720 | |
Gas — 0.2% |
CenterPoint Energy Resources Corp. | | | | | | | | |
6.250% 2/01/37 | | | 595,000 | | | | 795,934 | |
Health Care – Products — 0.1% |
Hologic, Inc. | | | | | | | | |
4.625% 2/01/28 (a) | | | 160,000 | | | | 169,800 | |
Health Care – Services — 1.3% |
Aetna, Inc. | | | | | | | | |
2.800% 6/15/23 | | | 485,000 | | | | 510,295 | |
Centene Corp. | | | | | | | | |
3.000% 10/15/30 | | | 855,000 | | | | 906,214 | |
3.375% 2/15/30 | | | 185,000 | | | | 194,636 | |
4.250% 12/15/27 | | | 165,000 | | | | 174,900 | |
5.375% 8/15/26 (a) | | | 155,000 | | | | 163,719 | |
CommonSpirit Health | | | | | | | | |
2.782% 10/01/30 | | | 165,000 | | | | 174,691 | |
HCA, Inc. | | | | | | | | |
5.000% 3/15/24 | | | 647,000 | | | | 727,858 | |
5.125% 6/15/39 | | | 230,000 | | | | 294,305 | |
5.250% 6/15/49 | | | 525,000 | | | | 693,418 | |
| | | Principal
Amount | | | Value | |
Molina Healthcare, Inc. | | | | | | | | |
3.875% 11/15/30 (a) | | $ | 90,000 | | | $ | 96,525 | |
5.375% STEP 11/15/22 | | | 225,000 | | | | 238,219 | |
Tenet Healthcare Corp. | | | | | | | | |
4.625% 7/15/24 | | | 184,000 | | | | 188,604 | |
| | | | | | | | 4,363,384 | |
Household Products & Wares — 0.1% |
Central Garden & Pet Co. | | | | | | | | |
5.125% 2/01/28 | | | 123,000 | | | | 130,803 | |
Spectrum Brands, Inc. | | | | | | | | |
5.750% 7/15/25 | | | 245,000 | | | | 252,987 | |
| | | | | | | | 383,790 | |
Insurance — 0.5% |
Farmers Exchange Capital III 3 mo. USD LIBOR + 3.454% | | | | | | | | |
5.454% VRN 10/15/54 (a) | | | 970,000 | | | | 1,192,517 | |
Teachers Insurance & Annuity Association of America | | | | | | | | |
3.300% 5/15/50 (a) | | | 500,000 | | | | 544,862 | |
| | | | | | | | 1,737,379 | |
Media — 0.8% |
CCO Holdings LLC/CCO Holdings Capital Corp. | | | | | | | | |
4.500% 8/15/30 (a) | | | 250,000 | | | | 265,313 | |
4.500% 5/01/32 (a) | | | 195,000 | | | | 208,205 | |
Charter Communications Operating LLC/Charter Communications Operating Capital | | | | | | | | |
3.750% 2/15/28 | | | 92,000 | | | | 103,153 | |
4.800% 3/01/50 | | | 230,000 | | | | 274,712 | |
4.908% 7/23/25 | | | 205,000 | | | | 238,097 | |
5.750% 4/01/48 | | | 200,000 | | | | 261,689 | |
CSC Holdings LLC | | | | | | | | |
5.375% 2/01/28 (a) | | | 30,000 | | | | 32,025 | |
5.500% 5/15/26 (a) | | | 200,000 | | | | 208,000 | |
Virgin Media Secured Finance PLC | | | | | | | | |
5.500% 5/15/29 (a) | | | 255,000 | | | | 276,356 | |
The Walt Disney Co. | | | | | | | | |
2.650% 1/13/31 | | | 330,000 | | | | 361,783 | |
3.600% 1/13/51 | | | 475,000 | | | | 574,987 | |
| | | | | | | | 2,804,320 | |
Mining — 0.1% |
Indonesia Asahan Aluminium Persero PT | | | | | | | | |
6.530% 11/15/28 (a) | | | 200,000 | | | | 250,659 | |
Miscellaneous – Manufacturing — 0.2% |
General Electric Co. | | | | | | | | |
5.875% 1/14/38 | | | 244,000 | | | | 330,703 | |
The accompanying notes are an integral part of the financial statements.
163
MML Total Return Bond Fund – Portfolio of Investments (Continued) |
| | | Principal
Amount | | | Value | |
6.750% 3/15/32 | | $ | 300,000 | | | $ | 420,619 | |
| | | | | | | | 751,322 | |
Oil & Gas — 1.6% |
Antero Resources Corp. | | | | | | | | |
5.000% 3/01/25 | | | 364,000 | | | | 345,800 | |
5.125% 12/01/22 | | | 93,000 | | | | 92,768 | |
8.375% 7/15/26 (a) (b) | | | 50,000 | | | | 51,035 | |
BP Capital Markets America, Inc. | | | | | | | | |
3.000% 2/24/50 | | | 80,000 | | | | 82,138 | |
3.633% 4/06/30 | | | 190,000 | | | | 221,343 | |
Canadian Natural Resources Ltd. | | | | | | | | |
3.850% 6/01/27 | | | 171,000 | | | | 191,870 | |
Equinor ASA | | | | | | | | |
3.700% 4/06/50 | | | 155,000 | | | | 186,797 | |
Exxon Mobil Corp. | | | | | | | | |
3.482% 3/19/30 | | | 155,000 | | | | 180,263 | |
4.327% 3/19/50 | | | 735,000 | | | | 962,303 | |
Noble Energy, Inc. | | | | | | | | |
5.250% 11/15/43 | | | 140,000 | | | | 201,103 | |
Pertamina Persero PT | | | | | | | | |
3.100% 8/27/30 (a) | | | 400,000 | | | | 426,990 | |
Petrobras Global Finance BV | | | | | | | | |
5.093% 1/15/30 | | | 201,000 | | | | 224,617 | |
Petroleos del Peru SA | | | | | | | | |
4.750% 6/19/32 (a) | | | 200,000 | | | | 230,600 | |
Petroleos Mexicanos | | | | | | | | |
5.950% 1/28/31 | | | 395,000 | | | | 394,012 | |
6.625% 6/15/35 | | | 900,000 | | | | 891,000 | |
7.690% 1/23/50 | | | 115,000 | | | | 115,949 | |
Saudi Arabian Oil Co. | | | | | | | | |
4.250% 4/16/39 (a) | | | 200,000 | | | | 234,517 | |
Transocean Guardian Ltd. | | | | | | | | |
5.875% 1/15/24 (a) | | | 118,560 | | | | 99,590 | |
Transocean Pontus Ltd. | | | | | | | | |
6.125% 8/01/25 (a) | | | 134,940 | | | | 128,192 | |
Transocean Poseidon Ltd. | | | | | | | | |
6.875% 2/01/27 (a) | | | 98,000 | | | | 89,180 | |
| | | | | | | | 5,350,067 | |
Oil & Gas Services — 0.1% |
Transocean Proteus Ltd. | | | | | | | | |
6.250% 12/01/24 (a) | | | 49,800 | | | | 46,750 | |
USA Compression Partners LP / USA Compression Finance Corp. | | | | | | | | |
6.875% 4/01/26 | | | 30,000 | | | | 31,350 | |
6.875% 9/01/27 | | | 96,000 | | | | 102,487 | |
| | | | | | | | 180,587 | |
| | | Principal
Amount | | | Value | |
Packaging & Containers — 0.4% |
Amcor Finance USA, Inc. | | | | | | | | |
3.625% 4/28/26 | | $ | 650,000 | | | $ | 732,542 | |
Graphic Packaging International LLC | | | | | | | | |
4.125% 8/15/24 | | | 200,000 | | | | 213,500 | |
Mauser Packaging Solutions Holding Co. | | | | | | | | |
5.500% 4/15/24 (a) | | | 30,000 | | | | 30,592 | |
Sealed Air Corp. | | | | | | | | |
4.000% 12/01/27 (a) | | | 30,000 | | | | 32,025 | |
5.500% 9/15/25 (a) | | | 190,000 | | | | 212,562 | |
| | | | | | | | 1,221,221 | |
Pharmaceuticals — 2.0% |
AbbVie, Inc. | | | | | | | | |
3.800% 3/15/25 | | | 250,000 | | | | 278,795 | |
4.250% 11/21/49 | | | 535,000 | | | | 670,794 | |
4.500% 5/14/35 | | | 165,000 | | | | 207,252 | |
4.875% 11/14/48 | | | 400,000 | | | | 540,989 | |
Bausch Health Cos., Inc. | | | | | | | | |
5.500% 11/01/25 (a) | | | 124,000 | | | | 128,500 | |
Bayer US Finance II LLC | | | | | | | | |
4.250% 12/15/25 (a) | | | 180,000 | | | | 205,755 | |
4.375% 12/15/28 (a) | | | 850,000 | | | | 999,784 | |
4.625% 6/25/38 (a) | | | 635,000 | | | | 771,783 | |
4.875% 6/25/48 (a) | | | 505,000 | | | | 650,400 | |
Cigna Corp. | | | | | | | | |
4.125% 11/15/25 | | | 800,000 | | | | 921,618 | |
CVS Health Corp. | | | | | | | | |
5.050% 3/25/48 | | | 1,150,000 | | | | 1,558,570 | |
| | | | | | | | 6,934,240 | |
Pipelines — 1.1% |
Cheniere Energy Partners LP | | | | | | | | |
5.250% 10/01/25 | | | 30,000 | | | | 30,788 | |
Energy Transfer Operating LP | | | | | | | | |
4.950% 6/15/28 | | | 300,000 | | | | 345,784 | |
5.000% 5/15/50 | | | 130,000 | | | | 140,776 | |
5.150% 3/15/45 | | | 400,000 | | | | 433,477 | |
5.500% 6/01/27 | | | 254,000 | | | | 298,958 | |
Plains All American Pipeline LP/PAA Finance Corp. | | | | | | | | |
3.800% 9/15/30 | | | 300,000 | | | | 322,515 | |
4.650% 10/15/25 | | | 300,000 | | | | 335,394 | |
Rockies Express Pipeline LLC | | | | | | | | |
4.800% 5/15/30 (a) | | | 250,000 | | | | 254,541 | |
4.950% 7/15/29 (a) | | | 200,000 | | | | 208,024 | |
Ruby Pipeline LLC | | | | | | | | |
7.750% STEP 4/01/22 (a) | | | 471,591 | | | | 466,835 | |
The accompanying notes are an integral part of the financial statements.
164
MML Total Return Bond Fund – Portfolio of Investments (Continued) |
| | | Principal
Amount | | | Value | |
Sabine Pass Liquefaction LLC | | | | | | | | |
5.750% 5/15/24 | | $ | 290,000 | | | $ | 331,555 | |
Sunoco Logistics Partners Operations LP | | | | | | | | |
5.350% 5/15/45 | | | 50,000 | | | | 55,081 | |
5.400% 10/01/47 | | | 394,000 | | | | 440,230 | |
Targa Resources Partners LP/Targa Resources Partners Finance Corp. | | | | | | | | |
6.875% 1/15/29 | | | 72,000 | | | | 81,090 | |
TransMontaigne Partners LP/TLP Finance Corp. | | | | | | | | |
6.125% 2/15/26 | | | 81,000 | | | | 81,405 | |
| | | | | | | | 3,826,453 | |
Real Estate Investment Trusts (REITS) — 1.4% |
American Campus Communities Operating Partnership LP | | | | | | | | |
3.750% 4/15/23 | | | 650,000 | | | | 686,940 | |
CyrusOne LP / CyrusOne Finance Corp. | | | | | | | | |
2.150% 11/01/30 | | | 345,000 | | | | 336,268 | |
GLP Capital LP/GLP Financing II, Inc. | | | | | | | | |
4.000% 1/15/30 | | | 35,000 | | | | 38,019 | |
5.250% 6/01/25 | | | 230,000 | | | | 258,768 | |
5.300% 1/15/29 | | | 310,000 | | | | 358,654 | |
5.375% 4/15/26 | | | 695,000 | | | | 797,631 | |
Healthpeak Properties, Inc. | | | | | | | | |
4.250% 11/15/23 | | | 12,000 | | | | 13,135 | |
MGM Growth Properties Operating Partnership LP/MGP Finance Co-Issuer, Inc. | | | | | | | | |
5.625% 5/01/24 | | | 100,000 | | | | 108,615 | |
SBA Communications Corp. | | | | | | | | |
4.875% 9/01/24 | | | 98,000 | | | | 100,522 | |
SL Green Operating Partnership LP | | | | | | | | |
3.250% 10/15/22 | | | 500,000 | | | | 516,283 | |
Ventas Realty LP | | | | | | | | |
3.500% 2/01/25 | | | 1,500,000 | | | | 1,651,948 | |
| | | | | | | | 4,866,783 | |
Retail — 0.1% |
Walgreens Boots Alliance, Inc. | | | | | | | | |
3.800% 11/18/24 | | | 25,000 | | | | 27,631 | |
4.800% 11/18/44 | | | 275,000 | | | | 312,361 | |
| | | | | | | | 339,992 | |
Savings & Loans — 0.2% |
Nationwide Building Society | | | | | | | | |
3 mo. USD LIBOR + 1.181% 3.622% VRN 4/26/23 (a) | | | 270,000 | | | | 280,454 | |
| | | Principal
Amount | | | Value | |
3 mo. USD LIBOR + 1.064% 3.766% VRN 3/08/24 (a) | | $ | 375,000 | | | $ | 398,953 | |
| | | | | | | | 679,407 | |
Semiconductors — 0.2% |
Intel Corp. | | | | | | | | |
4.750% 3/25/50 | | | 500,000 | | | | 697,781 | |
Software — 0.1% |
Change Healthcare Holdings LLC/Change Healthcare Finance, Inc. | | | | | | | | |
5.750% 3/01/25 (a) | | | 144,000 | | | | 146,880 | |
SS&C Technologies, Inc. | | | | | | | | |
5.500% 9/30/27 (a) | | | 138,000 | | | | 147,387 | |
| | | | | | | | 294,267 | |
Telecommunications — 2.5% |
AT&T, Inc. | | | | | | | | |
3.300% 2/01/52 | | | 55,000 | | | | 54,531 | |
3.500% 9/15/53 (a) | | | 184,000 | | | | 184,270 | |
3.800% 12/01/57 (a) | | | 1,641,000 | | | | 1,714,741 | |
4.300% 2/15/30 | | | 500,000 | | | | 597,269 | |
4.750% 5/15/46 | | | 310,000 | | | | 382,388 | |
5.250% 3/01/37 | | | 270,000 | | | | 351,394 | |
CenturyLink, Inc. | | | | | | | | |
4.000% 2/15/27 (a) | | | 76,000 | | | | 78,470 | |
Intelsat Jackson Holdings SA | | | | | | | | |
8.500% 10/15/24 (a) (c) | | | 171,000 | | | | 122,265 | |
9.750% 7/15/25 (a) (c) | | | 585,000 | | | | 421,200 | |
Level 3 Financing, Inc. | | | | | | | | |
5.375% 5/01/25 | | | 149,000 | | | | 153,239 | |
Sprint Corp. | | | | | | | | |
7.875% 9/15/23 | | | 33,000 | | | | 38,207 | |
Sprint Spectrum Co. LLC/Sprint Spectrum Co. II LLC/Sprint Spectrum Co. III LLC | | | | | | | | |
3.360% STEP 3/20/23 (a) | | | 216,563 | | | | 218,598 | |
4.738% 9/20/29 (a) | | | 1,250,000 | | | | 1,353,862 | |
T-Mobile USA, Inc. | | | | | | | | |
2.550% 2/15/31 (a) | | | 155,000 | | | | 162,761 | |
3.875% 4/15/30 (a) | | | 290,000 | | | | 335,878 | |
4.375% 4/15/40 (a) | | | 290,000 | | | | 353,907 | |
4.500% 2/01/26 | | | 104,000 | | | | 106,323 | |
4.750% 2/01/28 | | | 119,000 | | | | 127,912 | |
6.000% 3/01/23 | | | 206,000 | | | | 206,258 | |
6.000% 4/15/24 | | | 122,000 | | | | 123,496 | |
Vodafone Group PLC | | | | | | | | |
4.875% 6/19/49 | | | 1,052,000 | | | | 1,405,895 | |
| | | | | | | | 8,492,864 | |
| | | | | | | | | |
TOTAL CORPORATE DEBT (Cost $67,198,692) | | | | | | | 74,998,345 | |
The accompanying notes are an integral part of the financial statements.
165
MML Total Return Bond Fund – Portfolio of Investments (Continued) |
| | | Principal
Amount | | | Value | |
MUNICIPAL OBLIGATIONS — 1.9% |
City of New York NY, General Obligation | | | | | | | | |
5.206% 10/01/31 | | $ | 750,000 | | | $ | 945,802 | |
Commonwealth of Massachusetts, General Obligation | | | | | | | | |
3.000% 3/01/49 | | | 550,000 | | | | 601,122 | |
Greater Orlando Aviation Authority, Revenue Bond | | | | | | | | |
4.000% 10/01/44 | | | 150,000 | | | | 172,262 | |
Jersey City Municipal Utilities Authority, Revenue Bond | | | | | | | | |
5.470% 5/15/27 | | | 850,000 | | | | 962,854 | |
Los Angeles Unified School District, General Obligation | | | | | | | | |
5.755% 7/01/29 | | | 1,000,000 | | | | 1,289,470 | |
New York City Water & Sewer System, Revenue Bond | | | | | | | | |
4.000% 6/15/50 | | | 150,000 | | | | 178,196 | |
New York State Dormitory Authority | | | | | | | | |
Revenue Bond, 4.000% 3/15/44 | | | 370,000 | | | | 438,609 | |
Revenue Bond, 5.289% 3/15/33 | | | 750,000 | | | | 940,320 | |
New York State Urban Development Corp., Revenue Bond | | | | | | | | |
4.000% 3/15/43 | | | 185,000 | | | | 218,413 | |
Regents of the University of California Medical Center Pooled, Revenue Bond | | | | | | | | |
3.256% 5/15/60 | | | 730,000 | | | | 821,075 | |
| | | | | | | | 6,568,123 | |
| | | | | | | | | |
TOTAL MUNICIPAL OBLIGATIONS (Cost $6,205,397) | | | | | | | 6,568,123 | |
| | | | | | | | | |
NON-U.S. GOVERNMENT AGENCY OBLIGATIONS — 12.9% |
Commercial Mortgage-Backed Securities — 1.6% |
BAMLL Commercial Mortgage Securities Trust, Series 2018-PARK, Class A, | | | | | | | | |
4.091% VRN 8/10/38 (a) (d) | | | 620,000 | | | | 723,144 | |
BX Trust, Series 2019-OC11, Class A | | | | | | | | |
3.202% 12/09/41 (a) | | | 180,000 | | | | 197,602 | |
CALI Mortgage Trust, Series 2019-101C, Class A | | | | | | | | |
3.957% 3/10/39 (a) | | | 415,000 | | | | 485,094 | |
CPT Mortgage Trust, Series 2019-CPT, Class A | | | | | | | | |
2.865% 11/13/39 (a) | | | 355,000 | | | | 386,311 | |
| | | Principal
Amount | | | Value | |
DC Office Trust, Series 2019-MTC, Class A | | | | | | | | |
2.965% 9/15/45 (a) | | $ | 375,000 | | | $ | 411,025 | |
Hudson Yards Mortgage Trust | | | | | | | | |
Series 2019-55HY, Class A, 2.943% VRN 12/10/41 (a) (d) | | | 375,000 | | | | 418,540 | |
Series 2019-30HY, Class A, 3.228% 7/10/39 (a) | | | 385,000 | | | | 436,355 | |
JP Morgan Chase Commercial Mortgage Securities Trust, Series 2019-OSB, Class A | | | | | | | | |
3.397% 6/05/39 (a) | | | 385,000 | | | | 439,470 | |
MKT Mortgage Trust, Series 2020-525M, Class A | | | | | | | | |
2.694% 2/12/40 (a) | | | 465,000 | | | | 499,564 | |
Natixis Commercial Mortgage Securities Trust, Series 2020-2PAC, Class A | | | | | | | | |
2.966% 12/15/38 (a) | | | 375,000 | | | | 391,670 | |
One Bryant Park Trust, Series 2019-OBP, Class A | | | | | | | | |
2.516% 9/15/54 (a) | | | 490,000 | | | | 523,991 | |
RBS Commercial Funding, Inc. Trust, Series 2013-GSP, Class A, | | | | | | | | |
3.834% VRN 1/15/32 (a) (d) | | | 160,000 | | | | 168,607 | |
SFAVE Commercial Mortgage Securities Trust, Series 2015-5AVE, Class A1, | | | | | | | | |
3.872% VRN 1/05/43 (a) (d) | | | 185,000 | | | | 194,425 | |
| | | | | | | | 5,275,798 | |
Home Equity Asset-Backed Securities — 0.9% |
Citigroup Mortgage Loan Trust, Inc., Series 2006-HE2, Class M1, 1 mo. USD LIBOR + .290% | | | | | | | | |
0.438% FRN 8/25/36 | | | 2,199,000 | | | | 2,167,856 | |
Wells Fargo Home Equity Trust, Series 2004-2, Class M3, 1 mo. USD LIBOR + 1.050% | | | | | | | | |
1.198% FRN 10/25/34 | | | 825,670 | | | | 809,875 | |
| | | | | | | | 2,977,731 | |
Other Asset-Backed Securities — 2.7% |
Aimco CLO Ltd., Series 2020-11A, Class A1, 3 mo. USD LIBOR + 1.380% | | | | | | | | |
1.605% FRN 10/15/31 (a) | | | 750,000 | | | | 750,881 | |
Allegro CLO XII Ltd., Series 2020-1A, Class A1, 3 mo. USD LIBOR + 1.250% | | | | | | | | |
0.000% FRN 1/21/32 (a) (b) | | | 850,000 | | | | 850,000 | |
The accompanying notes are an integral part of the financial statements.
166
MML Total Return Bond Fund – Portfolio of Investments (Continued) |
| | | Principal
Amount | | | Value | |
Countrywide Asset-Backed Certificates, Series 2006-15, Class A3, | | | | | | | | |
4.517% VRN 10/25/46 (d) | | $ | 306,843 | | | $ | 293,899 | |
Dryden Senior Loan Fund, Series 2013-26A, Class AR, 3 mo. USD LIBOR + .900% | | | | | | | | |
1.137% FRN 4/15/29 (a) | | | 975,000 | | | | 970,534 | |
LCM LP, Series 21A, Class AR, 3 mo. USD LIBOR + .880% | | | | | | | | |
1.098% FRN 4/20/28 (a) | | | 740,000 | | | | 737,127 | |
Magnetite Ltd. | | | | | | | | |
Series 2012-7A, Class A1R2, 3 mo. USD LIBOR + .800% 1.037% FRN 1/15/28 (a) | | | 1,000,000 | | | | 993,712 | |
Series 2019-21A, Class A, 3 mo. USD LIBOR + 1.280% 1.498% FRN 4/20/30 (a) | | | 200,000 | | | | 200,528 | |
Morgan Stanley Capital, Inc. Trust, Series 2006-HE1, Class A4, 1 mo. USD LIBOR + .580% | | | | | | | | |
0.728% FRN 1/25/36 | | | 1,548,234 | | | | 1,505,759 | |
Saxon Asset Securities Trust | | | | | | | | |
Series 2007-2, Class A2C, 1 mo. USD LIBOR + .240% 0.388% FRN 5/25/47 | | | 1,995,815 | | | | 1,657,901 | |
Series 2005-1, Class M1, 1 mo. USD LIBOR + .690% 0.838% FRN 5/25/35 | | | 204,808 | | | | 204,178 | |
TCI-Flatiron CLO Ltd. | | | | | | | | |
Series 2016-1A, Class AR2, 3 mo. USD LIBOR + 1.150% 0.000% FRN 1/17/32 (a) (b) | | | 500,000 | | | | 500,000 | |
Series 2016-1A, Class AR, 3 mo. USD LIBOR + 1.220% 1.438% FRN 7/17/28 (a) | | | 225,000 | | | | 225,001 | |
Voya CLO Ltd., Series 2014-3A, Class A1R, 3 mo. USD LIBOR + .720% | | | | | | | | |
0.935% FRN 7/25/26 (a) | | | 166,934 | | | | 166,646 | |
| | | | | | | | 9,056,166 | |
Student Loans Asset-Backed Securities — 3.6% |
Access Group, Inc., Series 2015-1, Class A, 1 mo. USD LIBOR + .700% | | | | | | | | |
0.848% FRN 7/25/56 (a) | | | 512,344 | | | | 505,147 | |
Collegiate Funding Services Education Loan Trust, Series 2005-A, Class A4, 3 mo. USD LIBOR + .200% | | | | | | | | |
0.451% FRN 3/28/35 | | | 1,500,000 | | | | 1,446,146 | |
| | | Principal
Amount | | | Value | |
Navient Student Loan Trust, Series 2018-3A, Class A3, 1 mo. USD LIBOR + .800% | | | | | | | | |
0.948% FRN 3/25/67 (a) | | $ | 630,000 | | | $ | 629,412 | |
Nelnet Student Loan Trust, Series 2015-1A, Class A, 1 mo. USD LIBOR + .590% | | | | | | | | |
0.738% FRN 4/25/46 (a) | | | 936,552 | | | | 920,671 | |
Pennsylvania Higher Education Assistance Agency, Series 2013-3A, Class A, 1 mo. USD LIBOR + .750% | | | | | | | | |
0.898% FRN 11/25/42 (a) | | | 837,357 | | | | 832,055 | |
SLM Student Loan Trust | | | | | | | | |
Series 2007-7, Class A4, 3 mo. USD LIBOR + .330% 0.545% FRN 1/25/22 | | | 753,278 | | | | 718,505 | |
Series 2012-7, Class A3, 1 mo. USD LIBOR + .650% 0.798% FRN 5/26/26 | | | 764,064 | | | | 753,050 | |
Series 2012-2, Class A, 1 mo. USD LIBOR + .700% 0.848% FRN 1/25/29 | | | 891,124 | | | | 886,394 | |
Series 2008-1, Class A4, 3 mo. USD LIBOR + .650% 0.865% FRN 1/25/22 | | | 724,054 | | | | 711,960 | |
Series 2012-1, Class A3, 1 mo. USD LIBOR + .950% 1.098% FRN 9/25/28 | | | 751,675 | | | | 747,476 | |
Series 2008-6, Class A4, 3 mo. USD LIBOR + 1.100% 1.315% FRN 7/25/23 | | | 1,111,253 | | | | 1,078,209 | |
Series 2008-9, Class A, 3 mo. USD LIBOR + 1.500% 1.715% FRN 4/25/23 | | | 837,160 | | | | 841,555 | |
Series 2008-5, Class B, 3 mo. USD LIBOR + 1.850% 2.065% FRN 7/25/73 | | | 700,000 | | | | 679,180 | |
Series 2008-9, Class B, 3 mo. USD LIBOR + 2.250% 2.465% FRN 10/25/83 | | | 1,430,000 | | | | 1,413,563 | |
| | | | | | | | 12,163,323 | |
Whole Loan Collateral Collateralized Mortgage Obligations — 4.1% |
American Home Mortgage Investment Trust, Series 2005-1, Class 6A, 6 mo. USD LIBOR + 2.000% | | | | | | | | |
2.254% FRN 6/25/45 | | | 780,818 | | | | 769,090 | |
Banc of America Funding Trust, Series 2016-R1, Class A1, | | | | | | | | |
2.500% VRN 3/25/40 (a) (d) | | | 384,648 | | | | 384,475 | |
The accompanying notes are an integral part of the financial statements.
167
MML Total Return Bond Fund – Portfolio of Investments (Continued) |
| | | Principal
Amount | | | Value | |
Chase Mortgage Finance Trust, Series 2007-A1, Class 11A4, | | | | | | | | |
3.647% VRN 3/25/37 (d) | | $ | 330,699 | | | $ | 319,840 | |
Citigroup Mortgage Loan Trust, Series 2005-11, Class A2A, 1 year CMT + 2.400% | | | | | | | | |
2.530% FRN 10/25/35 | | | 251,056 | | | | 252,293 | |
Countrywide Alternative Loan Trust | | | | | | | | |
Series 2006-OA6, Class 1A2, 1 mo. USD LIBOR + .420% 0.568% FRN 7/25/46 | | | 1,199,436 | | | | 1,109,162 | |
Series 2005-31, Class 2A1, 1 mo. USD LIBOR + .600% 0.748% FRN 8/25/35 | | | 1,177,101 | | | | 1,037,415 | |
Credit Suisse Mortgage Trust, Series 2018-RPL9, Class A, | | | | | | | | |
3.850% VRN 9/25/57 (a) (d) | | | 1,368,572 | | | | 1,509,094 | |
First Horizon Mortgage Pass-Through Trust, Series 2005-AR5, Class 2A1, | | | | | | | | |
2.684% VRN 11/25/35 (d) | | | 336,490 | | | | 293,108 | |
GS Mortgage-Backed Securities Trust, Series 2018-RPL1, Class A1A | | | | | | | | |
3.750% 10/25/57 (a) | | | 1,315,999 | | | | 1,366,426 | |
HarborView Mortgage Loan Trust, Series 2006-10, Class 1A1A, 1 mo. USD LIBOR + .200% | | | | | | | | |
0.352% FRN 11/19/36 | | | 1,612,979 | | | | 1,356,639 | |
Impac CMB Trust, Series 2005-1, Class 1A1, 1 mo. USD LIBOR + .520% | | | | | | | | |
0.668% FRN 4/25/35 | | | 856,973 | | | | 820,013 | |
IndyMac Index Mortgage Loan Trust | | | | | | | | |
Series 2006-AR27, Class 1A3, 1 mo. USD LIBOR + .270% 0.418% FRN 10/25/36 | | | 1,592,734 | | | | 972,936 | |
Series 2005-AR19, Class A1, 3.011% VRN 10/25/35 (d) | | | 827,136 | | | | 726,423 | |
Morgan Stanley Resecuritization Trust, Series 2014-R9, Class 3A, 12 mo. MTA + .840% | | | | | | | | |
1.582% FRN 11/26/46 (a) | | | 298,133 | | | | 289,926 | |
Nomura Asset Acceptance Corp. Alternative Loan Trust, Series 2005-AR1, Class M1, 1 mo. LIBOR + 1.070% | | | | | | | | |
1.218% FRN 2/25/35 | | | 1,098,034 | | | | 1,080,922 | |
Washington Mutual Mortgage Pass-Through Certificates | | | | | | | | |
Series 2005-AR13, Class A1A1, 1 mo. USD LIBOR + .580% 0.728% FRN 10/25/45 | | | 583,875 | | | | 572,349 | |
| | | Principal
Amount | | | Value | |
Series 2005-AR2, Class 2A21, 1 mo. USD LIBOR + .660% 0.808% FRN 1/25/45 | | $ | 569,897 | | | $ | 554,549 | |
Series 2006-1 Class 3A2, 5.750% 2/25/36 | | | 688,227 | | | | 672,351 | |
| | | | | | | | 14,087,011 | |
| | | | | | | | | |
TOTAL NON-U.S. GOVERNMENT AGENCY OBLIGATIONS (Cost $42,993,636) | | | | | | | 43,560,029 | |
| | | | | | | | | |
SOVEREIGN DEBT OBLIGATIONS — 0.9% |
Abu Dhabi Government International Bond | | | | | | | | |
2.500% 9/30/29 (a) | | | 200,000 | | | | 215,816 | |
Colombia Government International Bond | | | | | | | | |
3.000% 1/30/30 | | | 200,000 | | | | 209,602 | |
Dominican Republic International Bond | | | | | | | | |
4.500% 1/30/30 (a) | | | 200,000 | | | | 216,752 | |
Mexico Government International Bond | | | | | | | | |
2.659% 5/24/31 | | | 638,000 | | | | 653,312 | |
Panama Government International Bond | | | | | | | | |
2.252% 9/29/32 | | | 200,000 | | | | 206,000 | |
3.160% 1/23/30 | | | 200,000 | | | | 221,502 | |
3.875% 3/17/28 | | | 200,000 | | | | 229,502 | |
Qatar Government International Bond | | | | | | | | |
4.500% 4/23/28 (a) | | | 200,000 | | | | 242,250 | |
Republic of South Africa Government International Bond | | | | | | | | |
4.850% 9/30/29 | | | 250,000 | | | | 265,356 | |
Russian Foreign Bond | | | | | | | | |
4.750% 5/27/26 (a) | | | 200,000 | | | | 230,936 | |
Saudi Government International Bond | | | | | | | | |
3.750% 1/21/55 (a) | | | 200,000 | | | | 218,290 | |
Uruguay Government International Bond | | | | | | | | |
4.375% 10/27/27 | | | 89,423 | | | | 105,744 | |
| | | | | | | | 3,015,062 | |
| | | | | | | | | |
TOTAL SOVEREIGN DEBT OBLIGATIONS (Cost $2,874,059) | | | | | | | 3,015,062 | |
The accompanying notes are an integral part of the financial statements.
168
MML Total Return Bond Fund – Portfolio of Investments (Continued) |
| | | Principal
Amount | | | Value | |
U.S. GOVERNMENT AGENCY OBLIGATIONS AND INSTRUMENTALITIES — 31.9% |
Collateralized Mortgage Obligations — 2.2% |
Federal Home Loan Mortgage Corp. Multifamily Structured Pass-Through Certificates Series S8FX, Class A2 3.291% 3/25/27 | | $ | 1,775,000 | | | $ | 1,994,944 | |
Federal Home Loan Mortgage Corp. REMICS | | | | | | | | |
Series 4818, Class CA, 3.000% 4/15/48 | | | 404,408 | | | | 429,123 | |
Series 4639, Class HZ, 3.250% STEP 4/15/53 | | | 1,512,158 | | | | 1,647,954 | |
Series 4846, Class PA, 4.000% 6/15/47 | | | 450,332 | | | | 478,312 | |
Federal National Mortgage Association ACES (d) Series 2020-M10, Class X1 1.796% 12/25/30 | | | 909,216 | | | | 126,548 | |
Federal National Mortgage Association. REMICS | | | | | | | | |
Series 2018-43, Class CT, 3.000% 6/25/48 | | | 733,082 | | | | 777,585 | |
Series 2018-57, Class QA, 3.500% 5/25/46 | | | 596,586 | | | | 610,593 | |
Series 2018-55, Class PA, 3.500% 1/25/47 | | | 349,410 | | | | 362,965 | |
Government National Mortgage Association | | | | | | | | |
Series 2018-124, Class NW, 3.500% 9/20/48 | | | 544,438 | | | | 584,383 | |
Series 2019-15, Class GT, 3.500% 2/20/49 | | | 499,150 | | | | 532,538 | |
| | | | | | | | 7,544,945 | |
Pass-Through Securities — 29.7% |
Federal Home Loan Mortgage Corp. | | | | | | | | |
Pool #G18592 3.000% 3/01/31 | | | 337,079 | | | | 356,334 | |
Pool #G18627 3.000% 1/01/32 | | | 980,180 | | | | 1,035,557 | |
Pool #G08710 3.000% 6/01/46 | | | 212,794 | | | | 224,627 | |
Pool #ZM1779 3.000% 9/01/46 | | | 1,042,255 | | | | 1,099,971 | |
Pool #G08726 3.000% 10/01/46 | | | 1,564,340 | | | | 1,651,334 | |
Pool #G08732 3.000% 11/01/46 | | | 564,374 | | | | 595,231 | |
Pool #G08741 3.000% 1/01/47 | | | 1,488,820 | | | | 1,568,358 | |
Pool #G07848 3.500% 4/01/44 | | | 1,818,675 | | | | 2,022,984 | |
Pool #G60023 3.500% 4/01/45 | | | 1,839,010 | | | | 2,035,833 | |
Pool #G08711 3.500% 6/01/46 | | | 754,073 | | | | 807,857 | |
Pool #G08716 3.500% 8/01/46 | | | 1,071,350 | | | | 1,147,762 | |
Pool #G67700 3.500% 8/01/46 | | | 935,770 | | | | 1,025,687 | |
Pool #G08722 3.500% 9/01/46 | | | 182,915 | | | | 195,961 | |
Pool #G08742 3.500% 1/01/47 | | | 808,822 | | | | 865,752 | |
Pool #G67703 3.500% 4/01/47 | | | 1,365,190 | | | | 1,494,664 | |
| | | Principal
Amount | | | Value | |
Pool #G08757 3.500% 4/01/47 | | $ | 231,634 | | | $ | 247,431 | |
Pool #G67706 3.500% 12/01/47 | | | 1,289,956 | | | | 1,411,085 | |
Pool #ZA5103 3.500% 12/01/47 | | | 10,990 | | | | 11,668 | |
Pool #G67707 3.500% 1/01/48 | | | 3,210,441 | | | | 3,529,965 | |
Pool #G08800 3.500% 2/01/48 | | | 86,648 | | | | 91,853 | |
Pool #G67708 3.500% 3/01/48 | | | 332,255 | | | | 361,053 | |
Pool #G67710 3.500% 3/01/48 | | | 1,819,948 | | | | 1,957,218 | |
Pool #G08816 3.500% 6/01/48 | | | 755,360 | | | | 800,266 | |
Pool #G61556 3.500% 8/01/48 | | | 977,631 | | | | 1,062,062 | |
Pool #G60344 4.000% 12/01/45 | | | 1,052,368 | | | | 1,165,963 | |
Pool #G67711 4.000% 3/01/48 | | | 1,219,669 | | | | 1,340,651 | |
Pool #G67713 4.000% 6/01/48 | | | 5,655 | | | | 6,186 | |
Pool #G08843 4.500% 10/01/48 | | | 361,541 | | | | 391,766 | |
Pool #G08833 5.000% 7/01/48 | | | 264,965 | | | | 293,761 | |
Pool #G08844 5.000% 10/01/48 | | | 231,211 | | | | 256,041 | |
Federal National Mortgage Association | | | | | | | | |
Pool #MA4152 2.000% 10/01/40 | | | 1,124,177 | | | | 1,169,418 | |
Pool #MA4176 2.000% 11/01/40 | | | 2,152,457 | | | | 2,239,080 | |
Pool #BL6060 2.455% 4/01/40 | | | 570,000 | | | | 604,597 | |
Pool #AM2808 2.700% 3/01/23 | | | 375,000 | | | | 389,986 | |
Pool #MA1607 3.000% 10/01/33 | | | 480,606 | | | | 514,429 | |
Pool #MA3811 3.000% 10/01/49 | | | 790,350 | | | | 811,640 | |
Pool #FN0039 3.182% VRN 9/01/27 (d) | | | 639,636 | | | | 720,321 | |
Pool #AB4262 3.500% 1/01/32 | | | 418,329 | | | | 451,328 | |
Pool #MA1512 3.500% 7/01/33 | | | 219,460 | | | | 236,429 | |
Pool #MA1148 3.500% 8/01/42 | | | 1,432,560 | | | | 1,563,471 | |
Pool #CA0996 3.500% 1/01/48 | | | 245,458 | | | | 266,585 | |
Pool #MA3305 3.500% 3/01/48 | | | 63,922 | | | | 67,745 | |
Pool #BL1132 3.730% 1/01/29 | | | 920,000 | | | | 1,089,891 | |
Pool #MA1146 4.000% 8/01/42 | | | 598,172 | | | | 658,098 | |
Pool #AS9830 4.000% 6/01/47 | | | 393,670 | | | | 423,882 | |
Pool #MA3027 4.000% 6/01/47 | | | 483,736 | | | | 520,860 | |
Pool #AS9972 4.000% 7/01/47 | | | 386,032 | | | | 414,693 | |
Pool #931504 4.500% 7/01/39 | | | 64,912 | | | | 72,863 | |
Pool #CA1711 4.500% 5/01/48 | | | 373,933 | | | | 406,491 | |
Pool #CA1710 4.500% 5/01/48 | | | 1,098,764 | | | | 1,190,931 | |
Pool #CA2208 4.500% 8/01/48 | | | 700,494 | | | | 759,515 | |
Pool #AD6374 5.000% 5/01/40 | | | 16,804 | | | | 19,376 | |
Pool #AI2733 5.000% 5/01/41 | | | 115,944 | | | | 133,509 | |
Pool #977014 5.500% 5/01/38 | | | 24,003 | | | | 28,203 | |
Pool #985524 5.500% 6/01/38 | | | 17,575 | | | | 20,644 | |
Pool #988578 5.500% 8/01/38 | | | 128,461 | | | | 150,885 | |
Pool #995482 5.500% 1/01/39 | | | 94,820 | | | | 111,282 | |
Government National Mortgage Association II | | | | | | | | |
Pool #MA4126 3.000% 12/20/46 | | | 1,309,869 | | | | 1,378,328 | |
Pool #MA4718 3.000% 9/20/47 | | | 148,987 | | | | 156,727 | |
Pool #MA4836 3.000% 11/20/47 | | | 550,772 | | | | 579,385 | |
The accompanying notes are an integral part of the financial statements.
169
MML Total Return Bond Fund – Portfolio of Investments (Continued) |
| | | Principal
Amount | | | Value | |
Pool #MA6209 3.000% 10/20/49 | | $ | 898,110 | | | $ | 920,070 | |
Pool #MA3521 3.500% 3/20/46 | | | 519,545 | | | | 560,754 | |
Pool #MA3597 3.500% 4/20/46 | | | 162,420 | | | | 175,302 | |
Pool #MA3663 3.500% 5/20/46 | | | 241,980 | | | | 261,173 | |
Pool #MA3937 3.500% 9/20/46 | | | 197,509 | | | | 212,990 | |
Pool #MA4127 3.500% 12/20/46 | | | 682,256 | | | | 735,091 | |
Pool #MA4262 3.500% 2/20/47 | | | 745,069 | | | | 802,070 | |
Pool #MA4382 3.500% 4/20/47 | | | 201,467 | | | | 216,566 | |
Pool #MA4719 3.500% 9/20/47 | | | 265,167 | | | | 284,045 | |
Pool #MA4837 3.500% 11/20/47 | | | 542,131 | | | | 580,726 | |
Pool #MA4900 3.500% 12/20/47 | | | 1,968,414 | | | | 2,104,858 | |
Pool #MA4653 4.000% 8/20/47 | | | 102,152 | | | | 110,030 | |
Pool #MA4838 4.000% 11/20/47 | | | 447,159 | | | | 481,364 | |
Pool #MA4901 4.000% 12/20/47 | | | 194,920 | | | | 209,830 | |
Pool #MA5078 4.000% 3/20/48 | | | 741,189 | | | | 797,422 | |
Pool #MA5466 4.000% 9/20/48 | | | 790,855 | | | | 849,373 | |
Pool #MA5399 4.500% 8/20/48 | | | 1,533,288 | | | | 1,656,906 | |
Pool #MA3666 5.000% 5/20/46 | | | 151,938 | | | | 173,829 | |
Pool #MA4199 5.000% 1/20/47 | | | 173,552 | | | | 198,721 | |
Pool #MA4454 5.000% 5/20/47 | | | 297,182 | | | | 331,271 | |
Pool #MA4722 5.000% 9/20/47 | | | 371,841 | | | | 413,331 | |
Government National Mortgage Association II TBA | | | | | | | | |
2.000% 1/21/51 (b) | | | 6,625,000 | | | | 6,927,266 | |
2.500% 1/21/51 (b) | | | 3,800,000 | | | | 4,022,062 | |
Uniform Mortgage Backed Securities TBA | | | | | | | | |
1.500% 1/16/36 (b) | | | 1,675,000 | | | | 1,723,941 | |
2.000% 1/16/36 (b) | | | 300,000 | | | | 313,734 | |
2.000% 1/14/51 (b) | | | 13,700,000 | | | | 14,235,156 | |
2.000% 2/12/51 (b) | | | 10,650,000 | | | | 11,048,959 | |
2.500% 1/14/51 (b) | | | 1,600,000 | | | | 1,686,750 | |
2.500% 2/12/51 (b) | | | 2,150,000 | | | | 2,262,623 | |
| | | | | | | | 100,501,686 | |
| | | | | | | | | |
TOTAL U.S. GOVERNMENT AGENCY OBLIGATIONS AND INSTRUMENTALITIES (Cost $104,538,333) | | | | | | | 108,046,631 | |
| | | | | | | | | |
U.S. TREASURY OBLIGATIONS — 40.5% |
U.S. Treasury Bonds & Notes — 40.5% |
U.S. Treasury Bond | | | | | | | | |
1.625% 11/15/50 | | | 17,565,000 | | | | 17,498,453 | |
U.S. Treasury Note | | | | | | | | |
0.125% 10/31/22 | | | 16,415,000 | | | | 16,416,666 | |
0.125% 11/30/22 | | | 43,595,000 | | | | 43,598,479 | |
0.125% 12/31/22 | | | 13,390,000 | | | | 13,391,034 | |
0.250% 12/31/25 | | | 26,335,000 | | | | 26,355,320 | |
| | | Principal
Amount | | | Value | |
0.375% 11/30/25 | | $ | 14,920,000 | | | $ | 14,941,058 | |
0.875% 11/15/30 | | | 5,149,000 | | | | 5,131,620 | |
| | | | | | | | 137,332,630 | |
| | | | | | | | | |
TOTAL U.S. TREASURY OBLIGATIONS (Cost $137,236,580) | | | | | | | 137,332,630 | |
| | | | | | | | | |
TOTAL BONDS & NOTES (Cost $363,384,435) | | | | | | | 375,949,751 | |
| | | | | | | | | |
TOTAL LONG-TERM INVESTMENTS (Cost $363,384,435) | | | | | | | 375,949,751 | |
| | | | | | | | | |
SHORT-TERM INVESTMENTS — 1.2% |
Commercial Paper — 0.2% |
Ford Motor Credit Co. | | | | | | | | |
2.920% 1/08/21 (a) | | | 750,000 | | | | 749,845 | |
| | | | | | | | | |
Sovereign Debt Obligation — 1.0% |
Japan Treasury Discount Bill 0.000% 3/15/21 JPY (e) | | | 360,000,000 | | | | 3,487,216 | |
| | | | | | | | | |
TOTAL SHORT-TERM INVESTMENTS (Cost $4,204,922) | | | | | | | 4,237,061 | |
| | | | | | | | | |
TOTAL INVESTMENTS — 112.1% (Cost $367,589,357) (f) | | | | | | | 380,186,812 | |
| | | | | | | | | |
Other Assets/(Liabilities) — (12.1)% | | | | | | | (40,929,708 | ) |
| | | | | | | | | |
NET ASSETS — 100.0% | | | | | | $ | 339,257,104 | |
Abbreviation Legend
CLO | Collateralized Loan Obligation |
REMICS | Real Estate Mortgage Investment Conduits |
Notes to Portfolio of Investments
Percentages are stated as a percent of net assets.
(a) | Security is exempt from registration under Regulation S or Rule 144A of the Securities Act of 1933. These securities are considered restricted and may be resold in transactions exempt from registration. At December 31, 2020, the aggregate market value of these securities amounted to $39,230,577 or 11.56% of net assets. |
(b) | A portion of this security is purchased on a when-issued, delayed-delivery or forward commitment basis. (Note 2). |
The accompanying notes are an integral part of the financial statements.
170
MML Total Return Bond Fund – Portfolio of Investments (Continued) |
Notes to Portfolio of Investments (Continued)
(c) | Security is currently in default due to bankruptcy or failure to make payment of principal or interest of the issuer. Income is not being accrued. At December 31, 2020, these securities amounted to a value of $543,465 or 0.16% of net assets. |
(d) | Certain variable rate securities are not based on a published reference rate and spread but are determined by the issuer or agent and are based on current market conditions. These securities do not indicate a reference rate and spread in their description above. The rates shown are the current interest rates at December 31, 2020. |
(e) | The principal amount of the security is in foreign currency. The market value is in U.S. dollars. |
(f) | See Note 6 for aggregate cost for federal tax purposes. |
Forward contracts
Counterparty | | Settlement
Date | | | Currency Purchased | | | Currency Sold | | | Unrealized
Appreciation
(Depreciation) | |
Goldman Sachs International* | | | 3/15/21 | | | | USD | | | | 3,459,227 | | | | JPY | | | | 360,000,000 | | | $ | (30,073 | ) |
Futures contracts
| | Expiration
Date | | | Number of
Contracts | | | Notional
Amount | | | Value/ Net
Unrealized
Appreciation/
(Depreciation) | |
Long | | | | | | | | | | | | | | | | |
U.S. Treasury Ultra Bond | | | 3/22/21 | | | | 1 | | | $ | 216,534 | | | $ | (2,971 | ) |
| | | | | | | | | | | | | | | | | |
Short | | | | | | | | | | | | | | | | |
U.S. Treasury Ultra 10 Year | | | 3/22/21 | | | | 6 | | | $ | (941,518 | ) | | $ | 3,362 | |
* Contracts are subject to a Master Netting Agreement.
Currency Legend
The accompanying notes are an integral part of the financial statements.
171
MML Series Investment Fund – Financial Statements | |
Statements of Assets and Liabilities
December 31, 2020 | |
| | | MML
Conservative
Allocation
Fund | | | MML
Balanced
Allocation
Fund | |
Assets: | | | | | | | | |
Investments, at value - unaffiliated issuers (Note 2) (a) | | $ | 18,433,219 | | | $ | 20,433,917 | |
Investments, at value - affiliated issuers (Notes 2 & 7) (b) | | | 416,719,597 | | | | 462,986,948 | |
Repurchase agreements, at value (Note 2) (c) | | | — | | | | — | |
Other short-term investments, at value (Note 2) (d) | | | — | | | | — | |
Total investments (e) | | | 435,152,816 | | | | 483,420,865 | |
Receivables from: | | | | | | | | |
Investments sold | | | | | | | | |
Regular delivery | | | 995,965 | | | | 658,976 | |
Fund shares sold | | | 3,169 | | | | 76,072 | |
Interest and dividends | | | — | | | | — | |
Total assets | | | 436,151,950 | | | | 484,155,913 | |
Liabilities: | | | | | | | | |
Payables for: | | | | | | | | |
Investments purchased | | | | | | | | |
Regular delivery | | | — | | | | — | |
Fund shares repurchased | | | 996,437 | | | | 732,107 | |
Collateral held for securities on loan (Note 2) (f) | | | — | | | | — | |
Trustees’ fees and expenses (Note 3) | | | 41,796 | | | | 50,918 | |
Affiliates (Note 3): | | | | | | | | |
Administration fees | | | — | | | | — | |
Investment advisory fees | | | 38,031 | | | | 41,258 | |
Service fees | | | 219,895 | | | | 237,693 | |
Accrued expense and other liabilities | | | 25,217 | | | | 25,677 | |
Total liabilities | | | 1,321,376 | | | | 1,087,653 | |
Net assets | | $ | 434,830,574 | | | $ | 483,068,260 | |
Net assets consist of: | | | | | | | | |
Paid-in capital | | $ | 396,869,583 | | | $ | 435,979,497 | |
Accumulated Gain (Loss) | | | 37,960,991 | | | | 47,088,763 | |
Net assets | | $ | 434,830,574 | | | $ | 483,068,260 | |
(a) | Cost of investments - unaffiliated issuers: | | $ | 17,328,414 | | | $ | 18,490,746 | |
(b) | Cost of investments - affiliated issuers: | | $ | 382,535,833 | | | $ | 424,626,975 | |
(c) | Cost of repurchase agreements: | | $ | — | | | $ | — | |
(d) | Cost of other short-term investments: | | $ | — | | | $ | — | |
(e) | Securities on loan with market value of: | | $ | — | | | $ | — | |
(f) | Non-cash collateral is not included. | | | | | | | | |
The accompanying notes are an integral part of the financial statements.
172
| | MML
Moderate
Allocation
Fund | | | MML
Growth
Allocation
Fund | | | MML
Aggressive
Allocation
Fund | | | MML
American
Funds Growth
Fund | | | MML
American
Funds
International
Fund | | | MML
American
Funds Core
Allocation
Fund | | | MML
Blue Chip
Growth Fund | |
| | | | | | | | | | | | | | | | | | | | | | | | | | | | |
| | $ | 25,690,068 | | | $ | 41,373,735 | | | $ | 9,447,154 | | | $ | 257,741,838 | | | $ | 61,118,911 | | | $ | 944,760,769 | | | $ | 532,690,474 | |
| | | 1,854,504,460 | | | | 1,204,874,662 | | | | 150,934,016 | | | | — | | | | — | | | | — | | | | — | |
| | | — | | | | — | | | | — | | | | — | | | | — | | | | — | | | | 997,767 | |
| | | — | | | | — | | | | — | | | | — | | | | — | | | | — | | | | 100 | |
| | | 1,880,194,528 | | | | 1,246,248,397 | | | | 160,381,170 | | | | 257,741,838 | | | | 61,118,911 | | | | 944,760,769 | | | | 533,688,341 | |
| | | | | | | | | | | | | | | | | | | | | | | | | | | | |
| | | | | | | | | | | | | | | | | | | | | | | | | | | | |
| | | 2,218,653 | | | | 1,892,069 | | | | 5,891 | | | | 10,177,455 | | | | 1,099,436 | | | | 321,707 | | | | 2,850,387 | |
| | | 4,454 | | | | 13,460 | | | | 1,944 | | | | 327 | | | | 681 | | | | 2,669 | | | | 12,358 | |
| | | — | | | | — | | | | — | | | | — | | | | — | | | | — | | | | 50,363 | |
| | | 1,882,417,635 | | | | 1,248,153,926 | | | | 160,389,005 | | | | 267,919,620 | | | | 62,219,028 | | | | 945,085,145 | | | | 536,601,449 | |
| | | | | | | | | | | | | | | | | | | | | | | | | | | | |
| | | | | | | | | | | | | | | | | | | | | | | | | | | | |
| | | | | | | | | | | | | | | | | | | | | | | | | | | | |
| | | — | | | | — | | | | — | | | | — | | | | — | | | | — | | | | 1,972,187 | |
| | | 2,211,810 | | | | 1,897,538 | | | | 6,918 | | | | 10,176,357 | | | | 1,099,770 | | | | 318,829 | | | | 770,998 | |
| | | — | | | | — | | | | — | | | | — | | | | — | | | | — | | | | 75,834 | |
| | | 188,776 | | | | 153,827 | | | | 11,123 | | | | 10,903 | | | | 5,283 | | | | 73,513 | | | | 39,041 | |
| | | | | | | | | | | | | | | | | | | | | | | | | | | | |
| | | — | | | | — | | | | — | | | | 55,458 | | | | 12,894 | | | | 199,755 | | | | — | |
| | | 159,963 | | | | 108,289 | | | | 13,441 | | | | 33,275 | | | | 7,736 | | | | 155,710 | | | | 333,834 | |
| | | 989,317 | | | | 523,930 | | | | 56,699 | | | | 155,301 | | | | 37,014 | | | | 586,040 | | | | 111,177 | |
| | | 26,173 | | | | 25,914 | | | | 25,447 | | | | 24,151 | | | | 25,766 | | | | 23,770 | | | | 67,104 | |
| | | 3,576,039 | | | | 2,709,498 | | | | 113,628 | | | | 10,455,445 | | | | 1,188,463 | | | | 1,357,617 | | | | 3,370,175 | |
| | $ | 1,878,841,596 | | | $ | 1,245,444,428 | | | $ | 160,275,377 | | | $ | 257,464,175 | | | $ | 61,030,565 | | | $ | 943,727,528 | | | $ | 533,231,274 | |
| | | | | | | | | | | | | | | | | | | | | | | | | | | | |
| | $ | 1,701,095,251 | | | $ | 1,082,050,099 | | | $ | 142,007,001 | | | $ | 141,085,402 | | | $ | 48,350,495 | | | $ | 804,494,417 | | | $ | 203,382,119 | |
| | | 177,746,345 | | | | 163,394,329 | | | | 18,268,376 | | | | 116,378,773 | | | | 12,680,070 | | | | 139,233,111 | | | | 329,849,155 | |
| | $ | 1,878,841,596 | | | $ | 1,245,444,428 | | | $ | 160,275,377 | | | $ | 257,464,175 | | | $ | 61,030,565 | | | $ | 943,727,528 | | | $ | 533,231,274 | |
| | $ | 24,830,089 | | | $ | 34,697,759 | | | $ | 7,387,050 | | | $ | 156,446,097 | | | $ | 49,313,484 | | | $ | 829,260,902 | | | $ | 261,715,120 | |
| | $ | 1,715,938,950 | | | $ | 1,093,643,846 | | | $ | 137,638,126 | | | $ | — | | | $ | — | | | $ | — | | | $ | — | |
| | $ | — | | | $ | — | | | $ | — | | | $ | — | | | $ | — | | | $ | — | | | $ | 997,767 | |
| | $ | — | | | $ | — | | | $ | — | | | $ | — | | | $ | — | | | $ | — | | | $ | 100 | |
| | $ | — | | | $ | — | | | $ | — | | | $ | — | | | $ | — | | | $ | — | | | $ | 127,286 | |
| | | | | | | | | | | | | | | | | | | | | | | | | | | | |
The accompanying notes are an integral part of the financial statements.
173
MML Series Investment Fund – Financial Statements (Continued) |
Statements of Assets and Liabilities
December 31, 2020 |
| | | MML
Conservative
Allocation
Fund | | | MML
Balanced
Allocation
Fund | |
Initial Class shares: | | | | | | | | |
Net assets | | $ | 96,649,296 | | | $ | 109,924,125 | |
Shares outstanding (a) | | | 9,347,306 | | | | 10,647,278 | |
Net asset value, offering price and redemption price per share | | $ | 10.34 | | | $ | 10.32 | |
Service Class shares: | | | | | | | | |
Net assets | | $ | 338,181,278 | | | $ | 373,144,135 | |
Shares outstanding (a) | | | 33,086,015 | | | | 36,513,997 | |
Net asset value, offering price and redemption price per share | | $ | 10.22 | | | $ | 10.22 | |
Service Class I shares: | | | | | | | | |
Net assets | | $ | — | | | $ | — | |
Shares outstanding (a) | | | — | | | | — | |
Net asset value, offering price and redemption price per share | | $ | — | | | $ | — | |
(a) | Authorized unlimited number of shares with no par value. |
The accompanying notes are an integral part of the financial statements.
174
| | MML
Moderate
Allocation
Fund | | | MML
Growth
Allocation
Fund | | | MML
Aggressive
Allocation
Fund | | | MML
American
Funds Growth
Fund | | | MML
American
Funds
International
Fund | | | MML
American
Funds Core
Allocation
Fund | | | MML
Blue Chip
Growth Fund | |
| | | | | | | | | | | | | | | | | | | | | | | | | | | | |
| | $ | 303,037,054 | | | $ | 456,817,209 | | | $ | 66,654,830 | | | $ | — | | | $ | — | | | $ | — | | | $ | 351,503,573 | |
| | | 27,958,768 | | | | 48,682,870 | | | | 6,300,840 | | | | — | | | | — | | | | — | | | | 17,136,250 | |
| | $ | 10.84 | | | $ | 9.38 | | | $ | 10.58 | | | $ | — | | | $ | — | | | $ | — | | | $ | 20.51 | |
| | | | | | | | | | | | | | | | | | | | | | | | | | | | |
| | $ | 1,575,804,542 | | | $ | 788,627,219 | | | $ | 93,620,547 | | | $ | — | | | $ | — | | | $ | — | | | $ | 181,727,701 | |
| | | 147,236,440 | | | | 84,892,152 | | | | 9,008,695 | | | | — | | | | — | | | | — | | | | 9,365,223 | |
| | $ | 10.70 | | | $ | 9.29 | | | $ | 10.39 | | | $ | — | | | $ | — | | | $ | — | | | $ | 19.40 | |
| | | | | | | | | | | | | | | | | | | | | | | | | | | | |
| | $ | — | | | $ | — | | | $ | — | | | $ | 257,464,175 | | | $ | 61,030,565 | | | $ | 943,727,528 | | | $ | — | |
| | | — | | | | — | | | | — | | | | 13,166,048 | | | | 5,640,523 | | | | 77,581,716 | | | | — | |
| | $ | — | | | $ | — | | | $ | — | | | $ | 19.56 | | | $ | 10.82 | | | $ | 12.16 | | | $ | — | |
The accompanying notes are an integral part of the financial statements.
175
MML Series Investment Fund – Financial Statements (Continued) |
Statements of Assets and Liabilities
December 31, 2020 |
| | | MML
Equity
Income Fund | | | MML
Equity
Index Fund | |
Assets: | | | | | | | | |
Investments, at value (Note 2) (a) | | $ | 450,222,088 | | | $ | 649,777,927 | |
Repurchase agreements, at value (Note 2) (b) | | | 2,144,321 | | | | 2,861,066 | |
Other short-term investments, at value (Note 2) (c) | | | 1,075 | | | | 859,968 | |
Total investments (d) | | | 452,367,484 | | | | 653,498,961 | |
Foreign currency, at value (e) | | | — | | | | — | |
Receivables from: | | | | | | | | |
Investments sold | | | | | | | | |
Regular delivery | | | 3,018,058 | | | | — | |
Fund shares sold | | | 228,903 | | | | 69,939 | |
Variation margin on open derivative instruments (Note 2) | | | — | | | | 27,089 | |
Interest and dividends | | | 793,037 | | | | 481,308 | |
Foreign taxes withheld | | | 9,733 | | | | — | |
Total assets | | | 456,417,215 | | | | 654,077,297 | |
Liabilities: | | | | | | | | |
Payables for: | | | | | | | | |
Investments purchased | | | | | | | | |
Regular delivery | | | 488,611 | | | | — | |
Fund shares repurchased | | | 4,569,445 | | | | 699,290 | |
Collateral held for securities on loan (Note 2) (f) | | | 2,861,044 | | | | 257,366 | |
Trustees’ fees and expenses (Note 3) | | | 59,547 | | | | 77,461 | |
Affiliates (Note 3): | | | | | | | | |
Administration fees | | | — | | | | 56,618 | |
Investment advisory fees | | | 287,801 | | | | 52,053 | |
Service fees | | | 48,996 | | | | 27,277 | |
Due to custodian | | | — | | | | — | |
Commitment and Contingent Liabilities (Note 10) | | | — | | | | — | |
Accrued expense and other liabilities | | | 49,300 | | | | 65,452 | |
Total liabilities | | | 8,364,744 | | | | 1,235,517 | |
Net assets | | $ | 448,052,471 | | | $ | 652,841,780 | |
Net assets consist of: | | | | | | | | |
Paid-in capital | | $ | 347,849,482 | | | $ | 325,538,119 | |
Accumulated Gain (Loss) | | | 100,202,989 | | | | 327,303,661 | |
Net assets | | $ | 448,052,471 | | | $ | 652,841,780 | |
(a) | Cost of investments: | | $ | 366,934,621 | | | $ | 358,065,484 | |
(b) | Cost of repurchase agreements: | | $ | 2,144,321 | | | $ | 2,861,066 | |
(c) | Cost of other short-term investments: | | $ | 1,075 | | | $ | 859,930 | |
(d) | Securities on loan with market value of: | | $ | 4,667,160 | | | $ | 689,696 | |
(e) | Cost of foreign currency: | | $ | — | | | $ | — | |
(f) | Non-cash collateral is not included. | | | | | | | | |
The accompanying notes are an integral part of the financial statements.
176
| | MML
Focused
Equity Fund | | | MML
Foreign
Fund | | | MML
Fundamental
Equity Fund | | | MML
Fundamental
Value Fund | | | MML
Global Fund | | | MML
Growth &
Income Fund | | | MML
Income &
Growth Fund | |
| | | | | | | | | | | | | | | | | | | | | | | | | | | | |
| | $ | 292,541,267 | | | $ | 277,871,851 | | | $ | 181,992,509 | | | $ | 193,432,301 | | | $ | 402,025,124 | | | $ | 154,115,842 | | | $ | 268,379,142 | |
| | | 2,221,301 | | | | — | | | | — | | | | 1,776,367 | | | | 1,159,807 | | | | 224,561 | | | | 966,808 | |
| | | — | | | | — | | | | — | | | | — | | | | — | | | | — | | | | — | |
| | | 294,762,568 | | | | 277,871,851 | | | | 181,992,509 | | | | 195,208,668 | | | | 403,184,931 | | | | 154,340,403 | | | | 269,345,950 | |
| | | — | | | | 73,714 | | | | 156 | | | | 62,924 | | | | 2 | | | | — | | | | — | |
| | | | | | | | | | | | | | | | | | | | | | | | | | | | |
| | | | | | | | | | | | | | | | | | | | | | | | | | | | |
| | | 2,662,161 | | | | 1,099,520 | | | | 2,342,933 | | | | — | | | | — | | | | 1,160,359 | | | | 491,507 | |
| | | 1,356 | | | | 13,560 | | | | 1,233 | | | | 45,676 | | | | 45,427 | | | | 5,371 | | | | 85,944 | |
| | | — | | | | — | | | | — | | | | — | | | | — | | | | — | | | | — | |
| | | 307,880 | | | | 139,110 | | | | 86,756 | | | | 189,533 | | | | 206,610 | | | | 89,365 | | | | 345,130 | |
| | | — | | | | 694,653 | | | | — | | | | 2,275 | | | | 522,897 | | | | — | | | | — | |
| | | 297,733,965 | | | | 279,892,408 | | | | 184,423,587 | | | | 195,509,076 | | | | 403,959,867 | | | | 155,595,498 | | | | 270,268,531 | |
| | | | | | | | | | | | | | | | | | | | | | | | | | | | |
| | | | | | | | | | | | | | | | | | | | | | | | | | | | |
| | | | | | | | | | | | | | | | | | | | | | | | | | | | |
| | | 123 | | | | — | | | | 1,664,216 | | | | 154,421 | | | | — | | | | — | | | | — | |
| | | 394,726 | | | | 2,167,159 | | | | 275,094 | | | | 251,726 | | | | 598,335 | | | | 88,544 | | | | 332,639 | |
| | | — | | | | 1,384,583 | | | | 293,570 | | | | — | | | | 4,798,170 | | | | — | | | | 1,223,750 | |
| | | 9,579 | | | | 43,199 | | | | 14,673 | | | | 20,181 | | | | 19,322 | | | | 19,924 | | | | 26,700 | |
| | | | | | | | | | | | | | | | | | | | | | | | | | | | |
| | | 37,925 | | | | — | | | | 23,434 | | | | 25,023 | | | | 50,670 | | | | — | | | | — | |
| | | 172,875 | | | | 200,980 | | | | 93,735 | | | | 100,095 | | | | 202,680 | | | | 65,161 | | | | 148,236 | |
| | | 12,271 | | | | 5,161 | | | | 11,942 | | | | 9,534 | | | | 10,826 | | | | 30,095 | | | | 16,192 | |
| | | — | | | | 1,222,182 | | | | 587,537 | | | | — | | | | — | | | | — | | | | 34,658 | |
| | | — | | | | — | | | | — | | | | — | | | | — | | | | — | | | | — | |
| | | 50,634 | | | | 40,413 | | | | 32,509 | | | | 39,225 | | | | 72,522 | | | | 32,793 | | | | 47,123 | |
| | | 678,133 | | | | 5,063,677 | | | | 2,996,710 | | | | 600,205 | | | | 5,752,525 | | | | 236,517 | | | | 1,829,298 | |
| | $ | 297,055,832 | | | $ | 274,828,731 | | | $ | 181,426,877 | | | $ | 194,908,871 | | | $ | 398,207,342 | | | $ | 155,358,981 | | | $ | 268,439,233 | |
| | | | | | | | | | | | | | | | | | | | | | | | | | | | |
| | $ | 230,032,674 | | | $ | 253,946,515 | | | $ | 128,328,396 | | | $ | 163,035,962 | | | $ | 270,461,633 | | | $ | 76,346,763 | | | $ | 233,700,499 | |
| | | 67,023,158 | | | | 20,882,216 | | | | 53,098,481 | | | | 31,872,909 | | | | 127,745,709 | | | | 79,012,218 | | | | 34,738,734 | |
| | $ | 297,055,832 | | | $ | 274,828,731 | | | $ | 181,426,877 | | | $ | 194,908,871 | | | $ | 398,207,342 | | | $ | 155,358,981 | | | $ | 268,439,233 | |
| | $ | 245,447,713 | | | $ | 254,866,786 | | | $ | 147,645,752 | | | $ | 160,777,851 | | | $ | 310,436,416 | | | $ | 85,862,095 | | | $ | 226,313,894 | |
| | $ | 2,221,301 | | | $ | — | | | $ | — | | | $ | 1,776,367 | | | $ | 1,159,807 | | | $ | 224,561 | | | $ | 966,808 | |
| | $ | — | | | $ | — | | | $ | — | | | $ | — | | | $ | — | | | $ | — | | | $ | — | |
| | $ | — | | | $ | 7,004,774 | | | $ | 6,799,022 | | | $ | — | | | $ | 10,278,531 | | | $ | — | | | $ | 1,197,240 | |
| | $ | — | | | $ | 73,388 | | | $ | 154 | | | $ | 59,604 | | | $ | 2 | | | $ | — | | | $ | — | |
| | | | | | | | | | | | | | | | | | | | | | | | | | | | |
The accompanying notes are an integral part of the financial statements.
177
MML Series Investment Fund – Financial Statements (Continued) |
Statements of Assets and Liabilities
December 31, 2020 |
| | | MML
Equity
Income Fund | | | MML
Equity
Index Fund | |
Initial Class shares: | | | | | | | | |
Net assets | | $ | 365,381,608 | | | $ | — | |
Shares outstanding (a) | | | 35,533,113 | | | | — | |
Net asset value, offering price and redemption price per share | | $ | 10.28 | | | $ | — | |
Class I shares: | | | | | | | | |
Net assets | | $ | — | | | $ | 61,002,433 | |
Shares outstanding (a) | | | — | | | | 2,098,510 | |
Net asset value, offering price and redemption price per share | | $ | — | | | $ | 29.07 | |
Class II shares: | | | | | | | | |
Net assets | | $ | — | | | $ | 239,889,660 | |
Shares outstanding (a) | | | — | | | | 8,260,123 | |
Net asset value, offering price and redemption price per share | | $ | — | | | $ | 29.04 | |
Class III shares: | | | | | | | | |
Net assets | | $ | — | | | $ | 307,588,838 | |
Shares outstanding | | | — | | | | 10,615,107 | |
Net asset value, offering price and redemption price per share | | $ | — | | | $ | 28.98 | |
Service Class shares: | | | | | | | | |
Net assets | | $ | 82,670,863 | | | $ | — | |
Shares outstanding (a) | | | 8,155,848 | | | | — | |
Net asset value, offering price and redemption price per share | | $ | 10.14 | | | $ | — | |
Service Class I shares: | | | | | | | | |
Net assets | | $ | — | | | $ | 44,360,849 | |
Shares outstanding (a) | | | — | | | | 1,597,989 | |
Net asset value, offering price and redemption price per share | | $ | — | | | $ | 27.76 | |
(a) | Authorized unlimited number of shares with no par value. |
The accompanying notes are an integral part of the financial statements.
178
| | MML
Focused
Equity Fund | | | MML
Foreign
Fund | | | MML
Fundamental
Equity Fund | | | MML
Fundamental
Value Fund | | | MML
Global Fund | | | MML
Growth &
Income Fund | | | MML
Income &
Growth Fund | |
| | | | | | | | | | | | | | | | | | | | | | | | | | | | |
| | $ | — | | | $ | 266,505,508 | | | $ | — | | | $ | — | | | $ | — | | | $ | 105,572,691 | | | $ | 241,441,380 | |
| | | — | | | | 26,609,691 | | | | — | | | | — | | | | — | | | | 5,142,680 | | | | 24,149,166 | |
| | $ | — | | | $ | 10.02 | | | $ | — | | | $ | — | | | $ | — | | | $ | 20.53 | | | $ | 10.00 | |
| | | | | | | | | | | | | | | | | | | | | | | | | | | | |
| | $ | — | | | $ | — | | | $ | — | | | $ | — | | | $ | 361,660,127 | | | $ | — | | | $ | — | |
| | | — | | | | — | | | | — | | | | — | | | | 25,915,981 | | | | — | | | | — | |
| | $ | — | | | $ | — | | | $ | — | | | $ | — | | | $ | 13.96 | | | $ | — | | | $ | — | |
| | | | | | | | | | | | | | | | | | | | | | | | | | | | |
| | $ | 277,370,006 | | | $ | — | | | $ | 161,496,346 | | | $ | 178,953,055 | | | $ | 18,460,923 | | | $ | — | | | $ | — | |
| | | 38,237,276 | | | | — | | | | 15,057,866 | | | | 15,406,490 | | | | 1,290,233 | | | | — | | | | — | |
| | $ | 7.25 | | | $ | — | | | $ | 10.73 | | | $ | 11.62 | | | $ | 14.31 | | | $ | — | | | $ | — | |
| | | | | | | | | | | | | | | | | | | | | | | | | | | | |
| | $ | — | | | $ | — | | | $ | — | | | $ | — | | | $ | — | | | $ | — | | | $ | — | |
| | | — | | | | — | | | | — | | | | — | | | | — | | | | — | | | | — | |
| | $ | — | | | $ | — | | | $ | — | | | $ | — | | | $ | — | | | $ | — | | | $ | — | |
| | | | | | | | | | | | | | | | | | | | | | | | | | | | |
| | $ | — | | | $ | 8,323,223 | | | $ | — | | | $ | — | | | $ | — | | | $ | 49,786,290 | | | $ | 26,997,853 | |
| | | — | | | | 836,100 | | | | — | | | | — | | | | — | | | | 2,449,344 | | | | 2,744,896 | |
| | $ | — | | | $ | 9.95 | | | $ | — | | | $ | — | | | $ | — | | | $ | 20.33 | | | $ | 9.84 | |
| | | | | | | | | | | | | | | | | | | | | | | | | | | | |
| | $ | 19,685,826 | | | $ | — | | | $ | 19,930,531 | | | $ | 15,955,816 | | | $ | 18,086,292 | | | $ | — | | | $ | — | |
| | | 2,819,919 | | | | — | | | | 1,932,969 | | | | 1,405,953 | | | | 1,314,265 | | | | — | | | | — | |
| | $ | 6.98 | | | $ | — | | | $ | 10.31 | | | $ | 11.35 | | | $ | 13.76 | | | $ | — | | | $ | — | |
The accompanying notes are an integral part of the financial statements.
179
MML Series Investment Fund – Financial Statements (Continued) |
Statements of Assets and Liabilities
December 31, 2020 |
| | | MML
International
Equity Fund | | | MML
Large Cap
Growth Fund | |
Assets: | | | | | | | | |
Investments, at value (Note 2) (a) | | $ | 162,333,693 | | | $ | 141,952,073 | |
Repurchase agreements, at value (Note 2) (b) | | | 4,051,484 | | | | 939,592 | |
Other short-term investments, at value (Note 2) (c) | | | — | | | | — | |
Total investments (d) | | | 166,385,177 | | | | 142,891,665 | |
Cash | | | — | | | | — | |
Foreign currency, at value (e) | | | 739 | | | | — | |
Receivables from: | | | | | | | | |
Investments sold | | | | | | | | |
Regular delivery | | | 268,322 | | | | — | |
Delayed delivery | | | — | | | | — | |
Open forward contracts (Note 2) | | | — | | | | — | |
Fund shares sold | | | 18 | | | | 18,112 | |
Collateral pledged for open futures contracts (Note 2) | | | — | | | | — | |
Investment adviser (Note 3) | | | 12,864 | | | | — | |
Interest and dividends | | | 34,118 | | | | 50,194 | |
Interest tax reclaim | | | — | | | | — | |
Foreign taxes withheld | | | 620,244 | | | | 51,561 | |
Total assets | | | 167,321,482 | | | | 143,011,532 | |
Liabilities: | | | | | | | | |
Payables for: | | | | | | | | |
Investments purchased | | | | | | | | |
Regular delivery | | | 90,892 | | | | — | |
Delayed delivery | | | — | | | | — | |
Written options outstanding, at value (Note 2) (f) | | | — | | | | — | |
Open forward contracts (Note 2) | | | 2,916 | | | | — | |
Fund shares repurchased | | | 168,307 | | | | 176,017 | |
Payable for premium on purchased options | | | — | | | | — | |
Collateral held for securities on loan (Note 2) (g) | | | — | | | | — | |
Trustees’ fees and expenses (Note 3) | | | 12,043 | | | | 17,190 | |
Variation margin on open derivative instruments (Note 2) | | | — | | | | — | |
Affiliates (Note 3): | | | | | | | | |
Administration fees | | | 21,284 | | | | — | |
Investment advisory fees | | | 113,516 | | | | 78,349 | |
Service fees | | | 3,989 | | | | 13,224 | |
Due to custodian | | | — | | | | — | |
Accrued expense and other liabilities | | | 192,818 | | | | 37,170 | |
Total liabilities | | | 605,765 | | | | 321,950 | |
Net assets | | $ | 166,715,717 | | | $ | 142,689,582 | |
Net assets consist of: | | | | | | | | |
Paid-in capital | | $ | 162,683,704 | | | $ | 64,287,952 | |
Accumulated Gain (Loss) | | | 4,032,013 | | | | 78,401,630 | |
Net assets | | $ | 166,715,717 | | | $ | 142,689,582 | |
(a) | Cost of investments: | | $ | 141,140,492 | | | $ | 80,843,905 | |
(b) | Cost of repurchase agreements: | | $ | 4,051,484 | | | $ | 939,592 | |
(c) | Cost of other short-term investments: | | $ | — | | | $ | — | |
(d) | Securities on loan with market value of: | | $ | — | | | $ | — | |
(e) | Cost of foreign currency: | | $ | 730 | | | $ | — | |
(f) | Premiums on written options: | | $ | — | | | $ | — | |
(g) | Non-cash collateral is not included. | | | | | | | | |
The accompanying notes are an integral part of the financial statements.
180
| | MML
Managed
Volatility Fund | | | MML
Mid Cap
Growth Fund | | | MML
Mid Cap
Value Fund | | | MML Small
Cap Growth
Equity Fund | | | MML Small
Company
Value Fund | | | MML
Small/Mid
Cap Value
Fund | | | MML
Total Return
Bond Fund | |
| | | | | | | | | | | | | | | | | | | | | | | | | | | | |
| | $ | 136,626,529 | | | $ | 546,911,840 | | | $ | 397,898,931 | | | $ | 222,385,622 | | | $ | 91,989,088 | | | $ | 192,695,219 | | | $ | 375,949,751 | |
| | | 2,709,183 | | | | 10,695,884 | | | | 2,326,692 | | | | 1,482,608 | | | | 320,755 | | | | 1,974,455 | | | | — | |
| | | — | | | | 372 | | | | — | | | | — | | | | 100 | | | | — | | | | 4,237,061 | |
| | | 139,335,712 | | | | 557,608,096 | | | | 400,225,623 | | | | 223,868,230 | | | | 92,309,943 | | | | 194,669,674 | | | | 380,186,812 | |
| | | — | | | | — | | | | 104,030 | | | | — | | | | — | | | | — | | | | 53,610 | |
| | | 29,882 | | | | — | | | | — | | | | 12 | | | | — | | | | — | | | | 2 | |
| | | | | | | | | | | | | | | | | | | | | | | | | | | | |
| | | | | | | | | | | | | | | | | | | | | | | | | | | | |
| | | 3,392,734 | | | | 2,045,346 | | | | 1,129,393 | | | | 1,936,596 | | | | 624,285 | | | | 540,390 | | | | 1,909,901 | |
| | | — | | | | — | | | | — | | | | — | | | | — | | | | — | | | | 11,220,729 | |
| | | — | | | | — | | | | 41,868 | | | | — | | | | — | | | | — | | | | — | |
| | | 6,412,974 | | | | 33,378 | | | | 310,299 | | | | 2,351 | | | | 599 | | | | 1,009 | | | | 2,982 | |
| | | — | | | | — | | | | — | | | | — | | | | — | | | | — | | | | 531,000 | |
| | | — | | | | — | | | | — | | | | — | | | | — | | | | — | | | | — | |
| | | 102,781 | | | | 115,864 | | | | 694,054 | | | | 89,260 | | | | 49,569 | | | | 212,780 | | | | 1,099,165 | |
| | | — | | | | — | | | | — | | | | — | | | | — | | | | — | | | | 967 | |
| | | — | | | | — | | | | 8,392 | | | | — | | | | — | | | | — | | | | — | |
| | | 149,274,083 | | | | 559,802,684 | | | | 402,513,659 | | | | 225,896,449 | | | | 92,984,396 | | | | 195,423,853 | | | | 395,005,168 | |
| | | | | | | | | | | | | | | | | | | | | | | | | | | | |
| | | | | | | | | | | | | | | | | | | | | | | | | | | | |
| | | | | | | | | | | | | | | | | | | | | | | | | | | | |
| | | — | | | | 498,957 | | | | 330,140 | | | | 202,838 | | | | 3,635 | | | | 294,119 | | | | 373,856 | |
| | | — | | | | — | | | | — | | | | — | | | | — | | | | — | | | | 54,594,352 | |
| | | 4,423,200 | | | | — | | | | — | | | | — | | | | — | | | | — | | | | — | |
| | | — | | | | — | | | | 245,082 | | | | — | | | | — | | | | — | | | | 30,073 | |
| | | 3,031 | | | | 2,197,057 | | | | 1,619,825 | | | | 10,574,606 | | | | 180,990 | | | | 8,476,277 | | | | 447,079 | |
| | | 993,277 | | | | — | | | | — | | | | — | | | | — | | | | — | | | | — | |
| | | 33,892 | | | | 3,925,556 | | | | — | | | | 3,122,111 | | | | 243,686 | | | | — | | | | — | |
| | | 33,278 | | | | 46,343 | | | | 54,535 | | | | 33,137 | | | | 10,660 | | | | 26,334 | | | | 35,372 | |
| | | — | | | | — | | | | — | | | | — | | | | — | | | | — | | | | 551 | |
| | | | | | | | | | | | | | | | | | | | | | | | | | | | |
| | | — | | | | — | | | | — | | | | — | | | | 11,740 | | | | — | | | | 43,249 | |
| | | 87,427 | | | | 360,350 | | | | 287,832 | | | | 191,526 | | | | 62,615 | | | | 124,292 | | | | 115,331 | |
| | | 16,859 | | | | 71,429 | | | | 30,836 | | | | 18,047 | | | | 15,612 | | | | 13,529 | | | | 30,792 | |
| | | — | | | | — | | | | — | | | | 504,767 | | | | — | | | | — | | | | — | |
| | | 87,783 | | | | 65,485 | | | | 62,819 | | | | 37,496 | | | | 32,837 | | | | 42,157 | | | | 77,409 | |
| | | 5,678,747 | | | | 7,165,177 | | | | 2,631,069 | | | | 14,684,528 | | | | 561,775 | | | | 8,976,708 | | | | 55,748,064 | |
| | $ | 143,595,336 | | | $ | 552,637,507 | | | $ | 399,882,590 | | | $ | 211,211,921 | | | $ | 92,422,621 | | | $ | 186,447,145 | | | $ | 339,257,104 | |
| | | | | | | | | | | | | | | | | | | | | | | | | | | | |
| | $ | 92,533,545 | | | $ | 277,300,315 | | | $ | 335,564,501 | | | $ | 117,200,344 | | | $ | 61,534,514 | | | $ | 159,699,792 | | | $ | 302,938,378 | |
| | | 51,061,791 | | | | 275,337,192 | | | | 64,318,089 | | | | 94,011,577 | | | | 30,888,107 | | | | 26,747,353 | | | | 36,318,726 | |
| | $ | 143,595,336 | | | $ | 552,637,507 | | | $ | 399,882,590 | | | $ | 211,211,921 | | | $ | 92,422,621 | | | $ | 186,447,145 | | | $ | 339,257,104 | |
| | $ | 82,426,614 | | | $ | 366,199,249 | | | $ | 339,593,107 | | | $ | 159,243,823 | | | $ | 66,617,945 | | | $ | 161,431,878 | | | $ | 363,384,435 | |
| | $ | 2,709,183 | | | $ | 10,695,884 | | | $ | 2,326,692 | | | $ | 1,482,608 | | | $ | 320,755 | | | $ | 1,974,455 | | | $ | — | |
| | $ | — | | | $ | 372 | | | $ | — | | | $ | — | | | $ | 100 | | | $ | — | | | $ | 4,204,922 | |
| | $ | 46,787 | | | $ | 15,904,553 | | | $ | — | | | $ | 25,628,995 | | | $ | 3,698,970 | | | $ | 3,953,829 | | | $ | — | |
| | $ | 28,943 | | | $ | — | | | $ | — | | | $ | 11 | | | $ | — | | | $ | — | | | $ | 1 | |
| | $ | 3,546,460 | | | $ | — | | | $ | — | | | $ | — | | | $ | — | | | $ | — | | | $ | — | |
| | | | | | | | | | | | | | | | | | | | | | | | | | | | |
The accompanying notes are an integral part of the financial statements.
181
MML Series Investment Fund – Financial Statements (Continued) |
Statements of Assets and Liabilities
December 31, 2020 |
| | | MML
International
Equity Fund | | | MML
Large Cap
Growth Fund | |
Initial Class shares: | | | | | | | | |
Net assets | | $ | — | | | $ | 120,463,912 | |
Shares outstanding (a) | | | — | | | | 8,615,202 | |
Net asset value, offering price and redemption price per share | | $ | — | | | $ | 13.98 | |
Class II shares: | | | | | | | | |
Net assets | | $ | 159,694,310 | | | $ | — | |
Shares outstanding (a) | | | 16,003,376 | | | | — | |
Net asset value, offering price and redemption price per share | | $ | 9.98 | | | $ | — | |
Service Class shares: | | | | | | | | |
Net assets | | $ | — | | | $ | 22,225,670 | |
Shares outstanding (a) | | | — | | | | 1,657,612 | |
Net asset value, offering price and redemption price per share | | $ | — | | | $ | 13.41 | |
Service Class I shares: | | | | | | | | |
Net assets | | $ | 7,021,407 | | | $ | — | |
Shares outstanding (a) | | | 710,459 | | | | — | |
Net asset value, offering price and redemption price per share | | $ | 9.88 | | | $ | — | |
(a) | Authorized unlimited number of shares with no par value. |
The accompanying notes are an integral part of the financial statements.
182
| | MML
Managed
Volatility Fund | | | MML
Mid Cap
Growth Fund | | | MML
Mid Cap
Value Fund | | | MML Small
Cap Growth
Equity Fund | | | MML Small
Company
Value Fund | | | MML
Small/Mid
Cap Value
Fund | | | MML
Total Return
Bond Fund | |
| | | | | | | | | | | | | | | | | | | | | | | | | | | | |
| | $ | 116,694,301 | | | $ | 434,829,655 | | | $ | 348,613,600 | | | $ | 180,047,254 | | | $ | — | | | $ | 164,144,677 | | | $ | — | |
| | | 8,467,007 | | | | 24,023,856 | | | | 32,907,325 | | | | 10,677,485 | | | | — | | | | 15,009,081 | | | | — | |
| | $ | 13.78 | | | $ | 18.10 | | | $ | 10.59 | | | $ | 16.86 | | | $ | — | | | $ | 10.94 | | | $ | — | |
| | | | | | | | | | | | | | | | | | | | | | | | | | | | |
| | $ | — | | | $ | — | | | $ | — | | | $ | — | | | $ | 65,955,405 | | | $ | — | | | $ | 288,004,668 | |
| | | — | | | | — | | | | — | | | | — | | | | 4,325,832 | | | | — | | | | 25,521,663 | |
| | $ | — | | | $ | — | | | $ | — | | | $ | — | | | $ | 15.25 | | | $ | — | | | $ | 11.28 | |
| | | | | | | | | | | | | | | | | | | | | | | | | | | | |
| | $ | 26,901,035 | | | $ | 117,807,852 | | | $ | 51,268,990 | | | $ | 31,164,667 | | | $ | — | | | $ | 22,302,468 | | | $ | — | |
| | | 1,968,115 | | | | 6,892,094 | | | | 4,939,303 | | | | 2,013,469 | | | | — | | | | 2,066,029 | | | | — | |
| | $ | 13.67 | | | $ | 17.09 | | | $ | 10.38 | | | $ | 15.48 | | | $ | — | | | $ | 10.79 | | | $ | — | |
| | | | | | | | | | | | | | | | | | | | | | | | | | | | |
| | $ | — | | | $ | — | | | $ | — | | | $ | — | | | $ | 26,467,216 | | | $ | — | | | $ | 51,252,436 | |
| | | — | | | | — | | | | — | | | | — | | | | 1,805,756 | | | | — | | | | 4,601,984 | |
| | $ | — | | | $ | — | | | $ | — | | | $ | — | | | $ | 14.66 | | | $ | — | | | $ | 11.14 | |
The accompanying notes are an integral part of the financial statements.
183
MML Series Investment Fund – Financial Statements (Continued) | |
Statements of Operations
For the Year Ended December 31, 2020 | |
| | | MML
Conservative
Allocation
Fund | | | MML
Balanced
Allocation
Fund | |
Investment income (Note 2): | | | | | | | | |
Dividends - unaffiliated issuers (a) | | $ | 798,944 | | | $ | 877,301 | |
Dividends - affiliated issuers (Note 7) | | | 3,696,504 | | | | 4,571,670 | |
Interest | | | — | | | | — | |
Securities lending net income | | | — | | | | — | |
Total investment income | | | 4,495,448 | | | | 5,448,971 | |
Expenses (Note 3): | | | | | | | | |
Investment advisory fees | | | 413,186 | | | | 497,326 | |
Custody fees | | | 20,705 | | | | 20,776 | |
Audit fees | | | 33,741 | | | | 33,996 | |
Legal fees | | | 7,528 | | | | 11,868 | |
Proxy fees | | | 1,113 | | | | 1,114 | |
Shareholder reporting fees | | | 16,559 | | | | 18,789 | |
Trustees’ fees | | | 19,071 | | | | 23,699 | |
| | | | 511,903 | | | | 607,568 | |
Administration fees: | | | | | | | | |
Service Class I | | | — | | | | — | |
Distribution and Service fees: | | | | | | | | |
Service Class | | | 795,959 | | | | 949,710 | |
Service Class I | | | — | | | | — | |
Total expenses: | | | 1,307,862 | | | | 1,557,278 | |
Net investment income (loss) | | | 3,187,586 | | | | 3,891,693 | |
Realized and unrealized gain (loss): | | | | | | | | |
Net realized gain (loss) on: | | | | | | | | |
Investment transactions - unaffiliated issuers | | | 206,471 | | | | 355,051 | |
Investment transactions - affiliated issuers (Note 7) | | | (550,908 | ) | | | (2,375,384 | ) |
Foreign currency transactions | | | — | | | | — | |
Realized gain distributions - unaffiliated issuers | | | 218,049 | | | | 286,657 | |
Realized gain distributions - affiliated issuers (Note 7) | | | 9,825,722 | | | | 14,235,270 | |
Net realized gain (loss) | | | 9,699,334 | | | | 12,501,594 | |
Net change in unrealized appreciation (depreciation) on: | | | | | | | | |
Investment transactions - unaffiliated issuers | | | 408,837 | | | | 650,731 | |
Investment transactions - affiliated issuers (Note 7) | | | 27,786,373 | | | | 31,363,751 | |
Translation of assets and liabilities in foreign currencies | | | — | | | | — | |
Net change in unrealized appreciation (depreciation) | | | 28,195,210 | | | | 32,014,482 | |
Net realized gain (loss) and change in unrealized appreciation (depreciation) | | | 37,894,544 | | | | 44,516,076 | |
Net increase (decrease) in net assets resulting from operations | | $ | 41,082,130 | | | $ | 48,407,769 | |
(a) | Net of foreign withholding tax of: | | $ | — | | | $ | — | |
The accompanying notes are an integral part of the financial statements.
184
| | MML
Moderate
Allocation
Fund | | | MML
Growth
Allocation
Fund | | | MML
Aggressive
Allocation
Fund | | | MML
American
Funds Growth
Fund | | | MML
American
Funds
International
Fund | | | MML
American
Funds Core
Allocation
Fund | | | MML
Blue Chip
Growth Fund | |
| | | | | | | | | | | | | | | | | | | | | | | | | | | | |
| | $ | 2,434,441 | | | $ | 1,969,855 | | | $ | 237,552 | | | $ | 1,203,917 | | | $ | 496,413 | | | $ | 16,679,165 | | | $ | 2,053,522 | |
| | | 19,235,856 | | | | 14,439,828 | | | | 1,570,980 | | | | — | | | | — | | | | — | | | | — | |
| | | — | | | | — | | | | — | | | | — | | | | — | | | | — | | | | 2,951 | |
| | | — | | | | — | | | | — | | | | — | | | | — | | | | — | | | | 6,428 | |
| | | 21,670,297 | | | | 16,409,683 | | | | 1,808,532 | | | | 1,203,917 | | | | 496,413 | | | | 16,679,165 | | | | 2,062,901 | |
| | | | | | | | | | | | | | | | | | | | | | | | | | | | |
| | | 1,918,121 | | | | 1,384,291 | | | | 148,694 | | | | 323,718 | | | | 85,267 | | | | 1,817,242 | | | | 3,588,939 | |
| | | 21,008 | | | | 20,881 | | | | 20,498 | | | | — | | | | — | | | | 6,411 | | | | 52,211 | |
| | | 37,547 | | | | 36,222 | | | | 33,138 | | | | 33,234 | | | | 32,920 | | | | 35,011 | | | | 39,672 | |
| | | 45,411 | | | | 33,137 | | | | 3,570 | | | | 4,404 | | | | 1,159 | | | | 18,714 | | | | 10,500 | |
| | | 1,114 | | | | 1,114 | | | | 1,114 | | | | 1,114 | | | | 1,114 | | | | 1,114 | | | | 1,114 | |
| | | 47,956 | | | | 37,184 | | | | 11,651 | | | | 13,456 | | | | 10,006 | | | | 28,414 | | | | 56,848 | |
| | | 90,303 | | | | 65,601 | | | | 6,968 | | | | 9,753 | | | | 2,703 | | | | 43,606 | | | | 22,024 | |
| | | 2,161,460 | | | | 1,578,430 | | | | 225,633 | | | | 385,679 | | | | 133,169 | | | | 1,950,512 | | | | 3,771,308 | |
| | | | | | | | | | | | | | | | | | | | | | | | | | | | |
| | | — | | | | — | | | | — | | | | 539,530 | | | | 142,111 | | | | 2,328,203 | | | | — | |
| | | | | | | | | | | | | | | | | | | | | | | | | | | | |
| | | 3,951,907 | | | | 2,176,103 | | | | 214,509 | | | | — | | | | — | | | | — | | | | 387,287 | |
| | | — | | | | — | | | | — | | | | 539,530 | | | | 142,111 | | | | 2,328,203 | | | | — | |
| | | 6,113,367 | | | | 3,754,533 | | | | 440,142 | | | | 1,464,739 | | | | 417,391 | | | | 6,606,918 | | | | 4,158,595 | |
| | | 15,556,930 | | | | 12,655,150 | | | | 1,368,390 | | | | (260,822 | ) | | | 79,022 | | | | 10,072,247 | | | | (2,095,694 | ) |
| | | | | | | | | | | | | | | | | | | | | | | | | | | | |
| | | | | | | | | | | | | | | | | | | | | | | | | | | | |
| | | 8,744,526 | | | | 4,835,576 | | | | (229,467 | ) | | | 9,972,400 | | | | 874,130 | | | | 6,192,668 | | | | 60,385,153 | |
| | | (16,152,946 | ) | | | (10,673,906 | ) | | | (1,342,522 | ) | | | — | | | | — | | | | — | | | | — | |
| | | — | | | | — | | | | — | | | | — | | | | — | | | | — | | | | 343 | |
| | | 1,033,547 | | | | 1,028,554 | | | | 182,267 | | | | 5,119,609 | | | | — | | | | 12,841,245 | | | | — | |
| | | 65,160,874 | | | | 58,143,018 | | | | 7,171,752 | | | | — | | | | — | | | | — | | | | — | |
| | | 58,786,001 | | | | 53,333,242 | | | | 5,782,030 | | | | 15,092,009 | | | | 874,130 | | | | 19,033,913 | | | | 60,385,496 | |
| | | | | | | | | | | | | | | | | | | | | | | | | | | | |
| | | (6,390,596 | ) | | | 411,680 | | | | 1,355,454 | | | | 79,479,443 | | | | 6,485,352 | | | | 69,309,779 | | | | 91,947,481 | |
| | | 106,644,620 | | | | 84,243,906 | | | | 9,955,458 | | | | — | | | | — | | | | — | | | | — | |
| | | — | | | | — | | | | — | | | | — | | | | — | | | | — | | | | (24 | ) |
| | | 100,254,024 | | | | 84,655,586 | | | | 11,310,912 | | | | 79,479,443 | | | | 6,485,352 | | | | 69,309,779 | | | | 91,947,457 | |
| | | 159,040,025 | | | | 137,988,828 | | | | 17,092,942 | | | | 94,571,452 | | | | 7,359,482 | | | | 88,343,692 | | | | 152,332,953 | |
| | $ | 174,596,955 | | | $ | 150,643,978 | | | $ | 18,461,332 | | | $ | 94,310,630 | | | $ | 7,438,504 | | | $ | 98,415,939 | | | $ | 150,237,259 | |
The accompanying notes are an integral part of the financial statements.
185
MML Series Investment Fund – Financial Statements (Continued) |
Statements of Operations
For the Year Ended December 31, 2020 |
| | | MML
Equity
Income Fund | | | MML
Equity
Index Fund | |
Investment income (Note 2): | | | | | | | | |
Dividends (a) | | $ | 13,016,094 | | | $ | 10,615,858 | |
Interest | | | 81,822 | | | | 11,041 | |
Securities lending net income | | | 26,125 | | | | 8,106 | |
Non cash income | | | — | | | | 25,830 | |
Total investment income | | | 13,124,041 | | | | 10,660,835 | |
Expenses (Note 3): | | | | | | | | |
Investment advisory fees | | | 3,201,140 | | | | 558,957 | |
Custody fees | | | 36,465 | | | | 46,699 | |
Audit fees | | | 38,563 | | | | 39,886 | |
Legal fees | | | 12,735 | | | | 14,274 | |
Proxy fees | | | 1,114 | | | | 1,114 | |
Shareholder reporting fees | | | 51,527 | | | | 67,999 | |
Trustees’ fees | | | 20,406 | | | | 26,891 | |
| | | | 3,361,950 | | | | 755,820 | |
Administration fees: | | | | | | | | |
Class I | | | — | | | | 164,268 | |
Class II | | | — | | | | 313,856 | |
Service Class I | | | — | | | | 126,446 | |
Distribution and Service fees: | | | | | | | | |
Service Class | | | 187,306 | | | | — | |
Service Class I | | | — | | | | 105,372 | |
Total expenses | | | 3,549,256 | | | | 1,465,762 | |
Expenses waived (Note 3): | | | | | | | | |
Initial Class advisory fees waived | | | (105,570 | ) | | | — | |
Class II advisory fees waived | | | — | | | | — | |
Service Class advisory fees waived | | | (22,476 | ) | | | — | |
Service Class I advisory fees waived | | | — | | | | — | |
Net expenses: | | | 3,421,210 | | | | 1,465,762 | |
Net investment income (loss) | | | 9,702,831 | | | | 9,195,073 | |
Realized and unrealized gain (loss): | | | | | | | | |
Net realized gain (loss) on: | | | | | | | | |
Investment transactions | | | 7,501,902 | | | | 31,016,027 | |
Futures contracts | | | 184,306 | | | | 567,137 | |
Foreign currency transactions | | | 798 | | | | — | |
Net realized gain (loss) | | | 7,687,006 | | | | 31,583,164 | |
Net change in unrealized appreciation (depreciation) on: | | | | | | | | |
Investment transactions | | | (10,565,523 | ) | | | 62,952,812 | |
Futures contracts | | | — | | | | 16,001 | |
Translation of assets and liabilities in foreign currencies | | | (1,080 | ) | | | — | |
Net change in unrealized appreciation (depreciation) | | | (10,566,603 | ) | | | 62,968,813 | |
Net realized gain (loss) and change in unrealized appreciation (depreciation) | | | (2,879,597 | ) | | | 94,551,977 | |
Net increase (decrease) in net assets resulting from operations | | $ | 6,823,234 | | | $ | 103,747,050 | |
(a) | Net of foreign withholding tax of: | | $ | 199,199 | | | $ | — | |
The accompanying notes are an integral part of the financial statements.
186
| | MML
Focused
Equity Fund | | | MML
Foreign
Fund | | | MML
Fundamental
Equity Fund | | | MML
Fundamental
Value Fund | | | MML
Global Fund | | | MML
Growth &
Income Fund | | | MML
Income &
Growth Fund | |
| | | | | | | | | | | | | | | | | | | | | | | | | | | | |
| | $ | 5,957,506 | | | $ | 6,752,177 | | | $ | 2,373,096 | | | $ | 4,857,658 | | | $ | 6,760,837 | | | $ | 2,273,753 | | | $ | 6,400,586 | |
| | | 8,844 | | | | 4,305 | | | | 2,282 | | | | 7,940 | | | | 4,971 | | | | 5,619 | | | | 16,817 | |
| | | 5,750 | | | | 16,614 | | | | 28,093 | | | | 1,522 | | | | 15,925 | | | | 673 | | | | 2,261 | |
| | | — | | | | — | | | | — | | | | — | | | | — | | | | — | | | | — | |
| | | 5,972,100 | | | | 6,773,096 | | | | 2,403,471 | | | | 4,867,120 | | | | 6,781,733 | | | | 2,280,045 | | | | 6,419,664 | |
| | | | | | | | | | | | | | | | | | | | | | | | | | | | |
| | | 2,069,939 | | | | 2,374,170 | | | | 946,257 | | | | 1,169,353 | | | | 2,427,427 | | | | 712,132 | | | | 1,703,963 | |
| | | 23,422 | | | | 16,442 | | | | 25,927 | | | | 27,191 | | | | 88,498 | | | | 21,744 | | | | 25,868 | |
| | | 38,433 | | | | 41,709 | | | | 38,135 | | | | 38,311 | | | | 42,113 | | | | 38,173 | | | | 39,170 | |
| | | 6,926 | | | | 5,916 | | | | 3,313 | | | | 4,284 | | | | 9,056 | | | | 3,106 | | | | 7,854 | |
| | | 1,114 | | | | 1,114 | | | | 1,114 | | | | 1,114 | | | | 1,114 | | | | 1,114 | | | | 1,114 | |
| | | 37,080 | | | | 38,536 | | | | 28,232 | | | | 26,014 | | | | 47,061 | | | | 23,827 | | | | 34,502 | |
| | | 13,952 | | | | 13,228 | | | | 6,963 | | | | 9,169 | | | | 18,835 | | | | 6,617 | | | | 12,590 | |
| | | 2,190,866 | | | | 2,491,115 | | | | 1,049,941 | | | | 1,275,436 | | | | 2,634,104 | | | | 806,713 | | | | 1,825,061 | |
| | | | | | | | | | | | | | | | | | | | | | | | | | | | |
| | | — | | | | — | | | | — | | | | — | | | | 558,059 | | | | — | | | | — | |
| | | 427,662 | | | | — | | | | 207,769 | | | | 271,060 | | | | 24,525 | | | | — | | | | — | |
| | | 27,374 | | | | — | | | | 25,677 | | | | 21,278 | | | | 24,273 | | | | — | | | | — | |
| | | | | | | | | | | | | | | | | | | | | | | | | | | | |
| | | — | | | | 20,847 | | | | — | | | | — | | | | — | | | | 111,023 | | | | 61,953 | |
| | | 45,623 | | | | — | | | | 42,795 | | | | 35,464 | | | | 40,456 | | | | — | | | | — | |
| | | 2,691,525 | | | | 2,511,962 | | | | 1,326,182 | | | | 1,603,238 | | | | 3,281,417 | | | | 917,736 | | | | 1,887,014 | |
| | | | | | | | | | | | | | | | | | | | | | | | | | | | |
| | | — | | | | (91,639 | ) | | | — | | | | — | | | | — | | | | — | | | | — | |
| | | — | | | | — | | | | (7,406 | ) | | | (36,141 | ) | | | — | | | | — | | | | — | |
| | | — | | | | (2,908 | ) | | | — | | | | — | | | | — | | | | — | | | | — | |
| | | — | | | | — | | | | (1,008 | ) | | | (2,837 | ) | | | — | | | | — | | | | — | |
| | | 2,691,525 | | | | 2,417,415 | | | | 1,317,768 | | | | 1,564,260 | | | | 3,281,417 | | | | 917,736 | | | | 1,887,014 | |
| | | 3,280,575 | | | | 4,355,681 | | | | 1,085,703 | | | | 3,302,860 | | | | 3,500,316 | | | | 1,362,309 | | | | 4,532,650 | |
| | | | | | | | | | | | | | | | | | | | | | | | | | | | |
| | | | | | | | | | | | | | | | | | | | | | | | | | | | |
| | | 16,894,896 | | | | (6,244,680 | ) | | | 17,949,074 | | | | (3,923,838 | ) | | | 33,396,516 | | | | 9,115,123 | | | | (11,849,121 | ) |
| | | — | | | | — | | | | — | | | | — | | | | — | | | | — | | | | — | |
| | | (3,109 | ) | | | (166,259 | ) | | | (8,658 | ) | | | 2,406 | | | | (16,962 | ) | | | (2,235 | ) | | | — | |
| | | 16,891,787 | | | | (6,410,939 | ) | | | 17,940,416 | | | | (3,921,432 | ) | | | 33,379,554 | | | | 9,112,888 | | | | (11,849,121 | ) |
| | | | | | | | | | | | | | | | | | | | | | | | | | | | |
| | | 16,223,936 | | | | 15,287,232 | | | | 15,353,807 | | | | 5,431,589 | | | | 13,686,859 | | | | 9,054,175 | | | | 11,417,007 | |
| | | — | | | | — | | | | — | | | | — | | | | — | | | | — | | | | — | |
| | | (123 | ) | | | 52,162 | | | | 2 | | | | 3,053 | | | | 42,593 | | | | (41 | ) | | | — | |
| | | 16,223,813 | | | | 15,339,394 | | | | 15,353,809 | | | | 5,434,642 | | | | 13,729,452 | | | | 9,054,134 | | | | 11,417,007 | |
| | | 33,115,600 | | | | 8,928,455 | | | | 33,294,225 | | | | 1,513,210 | | | | 47,109,006 | | | | 18,167,022 | | | | (432,114 | ) |
| | $ | 36,396,175 | | | $ | 13,284,136 | | | $ | 34,379,928 | | | $ | 4,816,070 | | | $ | 50,609,322 | | | $ | 19,529,331 | | | $ | 4,100,536 | |
| | $ | 23,721 | | | $ | 615,076 | | | $ | 10,553 | | | $ | 31,243 | | | $ | 463,288 | | | $ | 21,881 | | | $ | — | |
The accompanying notes are an integral part of the financial statements.
187
MML Series Investment Fund – Financial Statements (Continued) |
Statements of Operations
For the Year Ended December 31, 2020 |
| | | MML
International
Equity Fund | | | MML
Large Cap
Growth Fund | |
Investment income (Note 2): | | | | | | | | |
Dividends (a) | | $ | 2,025,753 | | | $ | 1,071,219 | |
Interest | | | 5,915 | | | | 2,316 | |
Securities lending net income | | | 8,335 | | | | 123 | |
Non cash income | | | 121,258 | | | | — | |
Total investment income | | | 2,161,261 | | | | 1,073,658 | |
Expenses (Note 3): | | | | | | | | |
Investment advisory fees | | | 1,242,930 | | | | 845,744 | |
Custody fees | | | 92,277 | | | | 21,997 | |
Audit fees | | | 52,997 | | | | 38,099 | |
Legal fees | | | 3,363 | | | | 2,810 | |
Proxy fees | | | 1,114 | | | | 1,114 | |
Shareholder reporting fees | | | 26,874 | | | | 22,504 | |
Trustees’ fees | | | 7,481 | | | | 5,900 | |
| | | | 1,427,036 | | | | 938,168 | |
Administration fees: | | | | | | | | |
Class II | | | 224,371 | | | | — | |
Service Class I | | | 8,678 | | | | — | |
Distribution and Service fees: | | | | | | | | |
Service Class | | | — | | | | 46,393 | |
Service Class I | | | 14,464 | | | | — | |
Total expenses | | | 1,674,549 | | | | 984,561 | |
Expenses waived (Note 3): | | | | | | | | |
Class II fees reimbursed by adviser | | | (102,466 | ) | | | — | |
Service Class I fees reimbursed by adviser | | | (3,957 | ) | | | — | |
Initial Class advisory fees waived | | | — | | | | — | |
Class II advisory fees waived | | | — | | | | — | |
Service Class advisory fees waived | | | — | | | | — | |
Service Class I advisory fees waived | | | — | | | | — | |
Net expenses: | | | 1,568,126 | | | | 984,561 | |
Net investment income (loss) | | | 593,135 | | | | 89,097 | |
Realized and unrealized gain (loss): | | | | | | | | |
Net realized gain (loss) on: | | | | | | | | |
Investment transactions | | | (14,973,562 | ) | | | 17,606,300 | |
Futures contracts | | | — | | | | — | |
Written options | | | — | | | | — | |
Swap agreements | | | — | | | | — | |
Foreign currency transactions | | | (10,244 | ) | | | — | |
Forward contracts | | | (111,452 | ) | | | — | |
Net realized gain (loss) | | | (15,095,258 | ) | | | 17,606,300 | |
Net change in unrealized appreciation (depreciation) on: | | | | | | | | |
Investment transactions | | | 22,502,405 | * | | | 20,787,845 | |
Futures contracts | | | — | | | | — | |
Written options | | | — | | | | — | |
Swap agreements | | | — | | | | — | |
Translation of assets and liabilities in foreign currencies | | | 50,792 | | | | — | |
Forward contracts | | | 19,395 | | | | — | |
Net change in unrealized appreciation (depreciation) | | | 22,572,592 | | | | 20,787,845 | |
Net realized gain (loss) and change in unrealized appreciation (depreciation) | | | 7,477,334 | | | | 38,394,145 | |
Net increase (decrease) in net assets resulting from operations | | $ | 8,070,469 | | | $ | 38,483,242 | |
(a) | Net of foreign withholding tax of: | | $ | 237,974 | | | $ | 38,920 | |
* | Net of net increase (decrease) in accrued foreign capital gains tax of: | | $ | (109,368 | ) | | $ | — | |
The accompanying notes are an integral part of the financial statements.
188
| | MML
Managed
Volatility Fund | | | MML
Mid Cap
Growth Fund | | | MML
Mid Cap
Value Fund | | | MML Small
Cap Growth
Equity Fund | | | MML Small
Company
Value Fund | | | MML
Small/Mid
Cap Value
Fund | | | MML
Total Return
Bond Fund | |
| | | | | | | | | | | | | | | | | | | | | | | | | | | | |
| | $ | 2,577,090 | | | $ | 3,087,334 | | | $ | 9,794,575 | | | $ | 1,433,177 | | | $ | 1,092,244 | | | $ | 3,118,186 | | | $ | — | |
| | | 5,972 | | | | 49,526 | | | | 9,314 | | | | 4,438 | | | | 2,735 | | | | 4,753 | | | | 8,247,883 | |
| | | 651 | | | | 35,982 | | | | 20,340 | | | | 69,064 | | | | 45,677 | | | | 4,646 | | | | 7,482 | |
| | | — | | | | — | | | | — | | | | — | | | | — | | | | — | | | | — | |
| | | 2,583,713 | | | | 3,172,842 | | | | 9,824,229 | | | | 1,506,679 | | | | 1,140,656 | | | | 3,127,585 | | | | 8,255,365 | |
| | | | | | | | | | | | | | | | | | | | | | | | | | | | |
| | | 1,052,174 | | | | 3,916,355 | | | | 3,295,001 | | | | 1,918,242 | | | | 684,846 | | | | 1,308,435 | | | | 1,387,943 | |
| | | 363,597 | | | | 59,382 | | | | 64,819 | | | | 40,553 | | | | 28,981 | | | | 32,864 | | | | 101,821 | |
| | | 38,190 | | | | 39,684 | | | | 39,489 | | | | 40,633 | | | | 38,748 | | | | 38,285 | | | | 57,761 | |
| | | 4,178 | | | | 11,054 | | | | 11,791 | | | | 3,971 | | | | 1,863 | | | | 3,767 | | | | 16,411 | |
| | | 1,114 | | | | 1,114 | | | | 1,114 | | | | 1,114 | | | | 1,114 | | | | 1,114 | | | | 1,114 | |
| | | 27,110 | | | | 64,919 | | | | 47,965 | | | | 26,978 | | | | 18,016 | | | | 25,635 | | | | 50,861 | |
| | | 6,770 | | | | 23,547 | | | | 18,810 | | | | 8,719 | | | | 4,192 | | | | 8,497 | | | | 16,679 | |
| | | 1,493,133 | | | | 4,116,055 | | | | 3,478,989 | | | | 2,040,210 | | | | 777,760 | | | | 1,418,597 | | | | 1,632,590 | |
| | | | | | | | | | | | | | | | | | | | | | | | | | | | |
| | | — | | | | — | | | | — | | | | — | | | | 94,231 | | | | — | | | | 457,226 | |
| | | — | | | | — | | | | — | | | | — | | | | 34,178 | | | | — | | | | 63,253 | |
| | | | | | | | | | | | | | | | | | | | | | | | | | | | |
| | | 69,277 | | | | 262,155 | | | | 116,682 | | | | 62,626 | | | | — | | | | 49,562 | | | | — | |
| | | — | | | | — | | | | — | | | | — | | | | 56,963 | | | | — | | | | 105,421 | |
| | | 1,562,410 | | | | 4,378,210 | | | | 3,595,671 | | | | 2,102,836 | | | | 963,132 | | | | 1,468,159 | | | | 2,258,490 | |
| | | | | | | | | | | | | | | | | | | | | | | | | | | | |
| | | — | | | | — | | | | — | | | | — | | | | — | | | | — | | | | (27,620 | ) |
| | | — | | | | — | | | | — | | | | — | | | | — | | | | — | | | | (3,203 | ) |
| | | — | | | | — | | | | — | | | | (36,295 | ) | | | — | | | | — | | | | — | |
| | | — | | | | — | | | | — | | | | — | | | | (31,405 | ) | | | — | | | | — | |
| | | — | | | | — | | | | — | | | | (5,735 | ) | | | — | | | | — | | | | — | |
| | | — | | | | — | | | | — | | | | — | | | | (11,398 | ) | | | — | | | | — | |
| | | 1,562,410 | | | | 4,378,210 | | | | 3,595,671 | | | | 2,060,806 | | | | 920,329 | | | | 1,468,159 | | | | 2,227,667 | |
| | | 1,021,303 | | | | (1,205,368 | ) | | | 6,228,558 | | | | (554,127 | ) | | | 220,327 | | | | 1,659,426 | | | | 6,027,698 | |
| | | | | | | | | | | | | | | | | | | | | | | | | | | | |
| | | | | | | | | | | | | | | | | | | | | | | | | | | | |
| | | 25,426,334 | | | | 96,918,378 | | | | 6,278,148 | | | | 32,030,508 | | | | 5,638,218 | | | | (5,515,350 | ) | | | 15,432,085 | |
| | | — | | | | — | | | | — | | | | — | | | | — | | | | — | | | | 2,614,368 | |
| | | (14,687,208 | ) | | | — | | | | — | | | | — | | | | — | | | | — | | | | 80,096 | |
| | | — | | | | — | | | | — | | | | — | | | | — | | | | — | | | | 18,450 | |
| | | — | | | | 4 | | | | (11,414 | ) | | | (716 | ) | | | — | | | | — | | | | 286,694 | |
| | | — | | | | — | | | | (1,392,959 | ) | | | — | | | | — | | | | — | | | | 144,777 | |
| | | 10,739,126 | | | | 96,918,382 | | | | 4,873,775 | | | | 32,029,792 | | | | 5,638,218 | | | | (5,515,350 | ) | | | 18,576,470 | |
| | | | | | | | | | | | | | | | | | | | | | | | | | | | |
| | | (4,239,405 | ) | | | 31,264,718 | | | | (2,003,420 | ) | | | 30,418,630 | | | | 774,734 | | | | 15,147,890 | | | | 5,134,626 | |
| | | — | | | | — | | | | — | | | | — | | | | — | | | | — | | | | 79,794 | |
| | | 341,641 | | | | — | | | | — | | | | — | | | | — | | | | — | | | | — | |
| | | — | | | | — | | | | — | | | | — | | | | — | | | | — | | | | (395 | ) |
| | | 590 | | | | — | | | | 195 | | | | (29 | ) | | | — | | | | — | | | | (148 | ) |
| | | — | | | | — | | | | 119,269 | | | | — | | | | — | | | | — | | | | (107,168 | ) |
| | | (3,897,174 | ) | | | 31,264,718 | | | | (1,883,956 | ) | | | 30,418,601 | | | | 774,734 | | | | 15,147,890 | | | | 5,106,709 | |
| | | 6,841,952 | | | | 128,183,100 | | | | 2,989,819 | | | | 62,448,393 | | | | 6,412,952 | | | | 9,632,540 | | | | 23,683,179 | |
| | $ | 7,863,255 | | | $ | 126,977,732 | | | $ | 9,218,377 | | | $ | 61,894,266 | | | $ | 6,633,279 | | | $ | 11,291,966 | | | $ | 29,710,877 | |
| | $ | — | | | $ | 6,449 | | | $ | 114,230 | | | $ | 3,431 | | | $ | 2,064 | | | $ | 16,056 | | | $ | — | |
| | $ | — | | | $ | — | | | $ | — | | | $ | — | | | $ | — | | | $ | — | | | $ | — | |
The accompanying notes are an integral part of the financial statements.
189
MML Series Investment Fund – Financial Statements (Continued) | |
Statements of Changes in Net Assets | |
| | | MML
Conservative
Allocation Fund | |
| | | Year
Ended
December 31, 2020 | | | Year
Ended
December 31, 2019 | |
Increase (Decrease) in Net Assets: | | | | | | | | |
Operations: | | | | | | | | |
Net investment income (loss) | | $ | 3,187,586 | | | $ | 9,728,483 | |
Net realized gain (loss) | | | 9,699,334 | | | | 10,627,600 | |
Net change in unrealized appreciation (depreciation) | | | 28,195,210 | | | | 36,659,219 | |
Net increase (decrease) in net assets resulting from operations | | | 41,082,130 | | | | 57,015,302 | |
Distributions to shareholders (Note 2): | | | | | | | | |
Initial Class | | | (5,143,809 | ) | | | (5,987,929 | ) |
Service Class | | | (17,167,168 | ) | | | (19,874,970 | ) |
Total distributions | | | (22,310,977 | ) | | | (25,862,899 | ) |
Net fund share transactions (Note 5): | | | | | | | | |
Initial Class | | | (3,006,178 | ) | | | (2,731,337 | ) |
Service Class | | | 11,117,616 | | | | (17,500,386 | ) |
Increase (decrease) in net assets from fund share transactions | | | 8,111,438 | | | | (20,231,723 | ) |
Total increase (decrease) in net assets | | | 26,882,591 | | | | 10,920,680 | |
Net assets | | | | | | | | |
Beginning of year | | | 407,947,983 | | | | 397,027,303 | |
End of year | | $ | 434,830,574 | | | $ | 407,947,983 | |
The accompanying notes are an integral part of the financial statements.
190
| | MML
Balanced
Allocation Fund | | | MML
Moderate
Allocation Fund | |
| | Year
Ended
December 31, 2020 | | | Year
Ended
December 31, 2019 | | | Year
Ended
December 31, 2020 | | | Year
Ended
December 31, 2019 | |
| | | | | | | | | | | | | | | | |
| | | | | | | | | | | | | | | | |
| | $ | 3,891,693 | | | $ | 11,251,106 | | | $ | 15,556,930 | | | $ | 38,604,248 | |
| | | 12,501,594 | | | | 16,442,426 | | | | 58,786,001 | | | | 81,319,671 | |
| | | 32,014,482 | | | | 53,288,160 | | | | 100,254,024 | | | | 235,039,836 | |
| | | 48,407,769 | | | | 80,981,692 | | | | 174,596,955 | | | | 354,963,755 | |
| | | | | | | | | | | | | | | | |
| | | (7,252,946 | ) | | | (8,806,961 | ) | | | (24,418,984 | ) | | | (31,558,407 | ) |
| | | (22,625,157 | ) | | | (28,322,059 | ) | | | (108,694,392 | ) | | | (144,073,299 | ) |
| | | (29,878,103 | ) | | | (37,129,020 | ) | | | (133,113,376 | ) | | | (175,631,706 | ) |
| | | | | | | | | | | | | | | | |
| | | (19,721,783 | ) | | | (837,627 | ) | | | (80,376,454 | ) | | | (2,709,458 | ) |
| | | (50,072,660 | ) | | | (16,089,521 | ) | | | (211,957,239 | ) | | | (86,865,404 | ) |
| | | (69,794,443 | ) | | | (16,927,148 | ) | | | (292,333,693 | ) | | | (89,574,862 | ) |
| | | (51,264,777 | ) | | | 26,925,524 | | | | (250,850,114 | ) | | | 89,757,187 | |
| | | | | | | | | | | | | | | | |
| | | 534,333,037 | | | | 507,407,513 | | | | 2,129,691,710 | | | | 2,039,934,523 | |
| | $ | 483,068,260 | | | $ | 534,333,037 | | | $ | 1,878,841,596 | | | $ | 2,129,691,710 | |
The accompanying notes are an integral part of the financial statements.
191
MML Series Investment Fund – Financial Statements (Continued) |
Statements of Changes in Net Assets |
| | | MML
Growth Allocation
Fund | |
| | | Year
Ended
December 31, 2020 | | | Year
Ended
December 31, 2019 | |
Increase (Decrease) in Net Assets: | | | | | | | | |
Operations: | | | | | | | | |
Net investment income (loss) | | $ | 12,655,150 | | | $ | 22,650,964 | |
Net realized gain (loss) | | | 53,333,242 | | | | 86,057,251 | |
Net change in unrealized appreciation (depreciation) | | | 84,655,586 | | | | 180,346,855 | |
Net increase (decrease) in net assets resulting from operations | | | 150,643,978 | | | | 289,055,070 | |
Distributions to shareholders (Note 2): | | | | | | | | |
Initial Class | | | (43,790,723 | ) | | | (58,967,879 | ) |
Service Class | | | (72,284,951 | ) | | | (99,752,639 | ) |
Service Class I | | | — | | | | — | |
Total distributions | | | (116,075,674 | ) | | | (158,720,518 | ) |
Net fund share transactions (Note 5): | | | | | | | | |
Initial Class | | | (128,925,894 | ) | | | (12,292,505 | ) |
Service Class | | | (211,691,232 | ) | | | (18,633,415 | ) |
Service Class I | | | — | | | | — | |
Increase (decrease) in net assets from fund share transactions | | | (340,617,126 | ) | | | (30,925,920 | ) |
Total increase (decrease) in net assets | | | (306,048,822 | ) | | | 99,408,632 | |
Net assets | | | | | | | | |
Beginning of year | | | 1,551,493,250 | | | | 1,452,084,618 | |
End of year | | $ | 1,245,444,428 | | | $ | 1,551,493,250 | |
The accompanying notes are an integral part of the financial statements.
192
| | MML
Aggressive
Allocation Fund | | | MML
American Funds
Growth Fund | |
| | Year
Ended
December 31, 2020 | | | Year
Ended
December 31, 2019 | | | Year
Ended
December 31, 2020 | | | Year
Ended
December 31, 2019 | |
| | | | | | | | | | | | | | | | |
| | | | | | | | | | | | | | | | |
| | $ | 1,368,390 | | | $ | 1,642,529 | | | $ | (260,822 | ) | | $ | 570,854 | |
| | | 5,782,030 | | | | 8,932,582 | | | | 15,092,009 | | | | 23,576,540 | |
| | | 11,310,912 | | | | 21,689,527 | | | | 79,479,443 | | | | 23,915,036 | |
| | | 18,461,332 | | | | 32,264,638 | | | | 94,310,630 | | | | 48,062,430 | |
| | | | | | | | | | | | | | | | |
| | | (5,424,704 | ) | | | (6,937,589 | ) | | | — | | | | — | |
| | | (7,141,143 | ) | | | (9,487,948 | ) | | | — | | | | — | |
| | | — | | | | — | | | | (24,143,106 | ) | | | (24,103,348 | ) |
| | | (12,565,847 | ) | | | (16,425,537 | ) | | | (24,143,106 | ) | | | (24,103,348 | ) |
| | | | | | | | | | | | | | | | |
| | | (3,763,403 | ) | | | 5,117,999 | | | | — | | | | — | |
| | | (5,252,856 | ) | | | 3,031,713 | | | | — | | | | — | |
| | | — | | | | — | | | | (9,739,042 | ) | | | 10,716,727 | |
| | | (9,016,259 | ) | | | 8,149,712 | | | | (9,739,042 | ) | | | 10,716,727 | |
| | | (3,120,774 | ) | | | 23,988,813 | | | | 60,428,482 | | | | 34,675,809 | |
| | | | | | | | | | | | | | | | |
| | | 163,396,151 | | | | 139,407,338 | | | | 197,035,693 | | | | 162,359,884 | |
| | $ | 160,275,377 | | | $ | 163,396,151 | | | $ | 257,464,175 | | | $ | 197,035,693 | |
The accompanying notes are an integral part of the financial statements.
193
MML Series Investment Fund – Financial Statements (Continued) |
Statements of Changes in Net Assets |
| | | MML
American Funds
International Fund | |
| | | Year
Ended
December 31, 2020 | | | Year
Ended
December 31, 2019 | |
Increase (Decrease) in Net Assets: | | | | | | | | |
Operations: | | | | | | | | |
Net investment income (loss) | | $ | 79,022 | | | $ | 587,822 | |
Net realized gain (loss) | | | 874,130 | | | | 3,242,397 | |
Net change in unrealized appreciation (depreciation) | | | 6,485,352 | | | | 8,463,025 | |
Net increase (decrease) in net assets resulting from operations | | | 7,438,504 | | | | 12,293,244 | |
Distributions to shareholders (Note 2): | | | | | | | | |
Initial Class | | | — | | | | — | |
Service Class | | | — | | | | — | |
Service Class I | | | (3,830,988 | ) | | | (4,781,345 | ) |
Total distributions | | | (3,830,988 | ) | | | (4,781,345 | ) |
Net fund share transactions (Note 5): | | | | | | | | |
Initial Class | | | — | | | | — | |
Service Class | | | — | | | | — | |
Service Class I | | | (6,520,093 | ) | | | (281,004 | ) |
Increase (decrease) in net assets from fund share transactions | | | (6,520,093 | ) | | | (281,004 | ) |
Total increase (decrease) in net assets | | | (2,912,577 | ) | | | 7,230,895 | |
Net assets | | | | | | | | |
Beginning of year | | | 63,943,142 | | | | 56,712,247 | |
End of year | | $ | 61,030,565 | | | $ | 63,943,142 | |
The accompanying notes are an integral part of the financial statements.
194
| | MML
American Funds
Core Allocation
Fund | | | MML
Blue Chip Growth
Fund | |
| | Year
Ended
December 31, 2020 | | | Year
Ended
December 31, 2019 | | | Year
Ended
December 31, 2020 | | | Year
Ended
December 31, 2019 | |
| | | | | | | | | | | | | | | | |
| | | | | | | | | | | | | | | | |
| | $ | 10,072,247 | | | $ | 15,031,237 | | | $ | (2,095,694 | ) | | $ | (687,556 | ) |
| | | 19,033,913 | | | | 47,561,727 | | | | 60,385,496 | | | | 42,327,464 | |
| | | 69,309,779 | | | | 101,458,840 | | | | 91,947,457 | | | | 61,935,453 | |
| | | 98,415,939 | | | | 164,051,804 | | | | 150,237,259 | | | | 103,575,361 | |
| | | | | | | | | | | | | | | | |
| | | — | | | | — | | | | (28,187,061 | ) | | | (35,871,142 | ) |
| | | — | | | | — | | | | (14,108,057 | ) | | | (16,692,604 | ) |
| | | (66,435,525 | ) | | | (93,729,834 | ) | | | — | | | | — | |
| | | (66,435,525 | ) | | | (93,729,834 | ) | | | (42,295,118 | ) | | | (52,563,746 | ) |
| | | | | | | | | | | | | | | | |
| | | — | | | | — | | | | (28,085,143 | ) | | | 12,687,751 | |
| | | — | | | | — | | | | 11,700,654 | | | | 24,456,475 | |
| | | (89,664,279 | ) | | | (24,961,620 | ) | | | — | | | | — | |
| | | (89,664,279 | ) | | | (24,961,620 | ) | | | (16,384,489 | ) | | | 37,144,226 | |
| | | (57,683,865 | ) | | | 45,360,350 | | | | 91,557,652 | | | | 88,155,841 | |
| | | | | | | | | | | | | | | | |
| | | 1,001,411,393 | | | | 956,051,043 | | | | 441,673,622 | | | | 353,517,781 | |
| | $ | 943,727,528 | | | $ | 1,001,411,393 | | | $ | 533,231,274 | | | $ | 441,673,622 | |
The accompanying notes are an integral part of the financial statements.
195
MML Series Investment Fund – Financial Statements (Continued) |
Statements of Changes in Net Assets |
| | | MML
Equity Income
Fund | |
| | | Year
Ended
December 31, 2020 | | | Year
Ended
December 31, 2019 | |
Increase (Decrease) in Net Assets: | | | | | | | | |
Operations: | | | | | | | | |
Net investment income (loss) | | $ | 9,702,831 | | | $ | 10,031,026 | |
Net realized gain (loss) | | | 7,687,006 | | | | 30,331,581 | |
Net change in unrealized appreciation (depreciation) | | | (10,566,603 | ) | | | 67,301,960 | |
Net increase (decrease) in net assets resulting from operations | | | 6,823,234 | | | | 107,664,567 | |
Distributions to shareholders (Note 2): | | | | | | | | |
Initial Class | | | (33,362,820 | ) | | | (42,720,131 | ) |
Class I | | | — | | | | — | |
Class II | | | — | | | | — | |
Class III | | | — | | | | — | |
Service Class | | | (6,937,635 | ) | | | (9,473,801 | ) |
Service Class I | | | — | | | | — | |
Total distributions | | | (40,300,455 | ) | | | (52,193,932 | ) |
Net fund share transactions (Note 5): | | | | | | | | |
Initial Class | | | (3,989,422 | ) | | | (7,947,021 | ) |
Class I | | | — | | | | — | |
Class II | | | — | | | | — | |
Class III | | | — | | | | — | |
Service Class | | | 1,860,902 | | | | 1,853,062 | |
Service Class I | | | — | | | | — | |
Increase (decrease) in net assets from fund share transactions | | | (2,128,520 | ) | | | (6,093,959 | ) |
Total increase (decrease) in net assets | | | (35,605,741 | ) | | | 49,376,676 | |
Net assets | | | | | | | | |
Beginning of year | | | 483,658,212 | | | | 434,281,536 | |
End of year | | $ | 448,052,471 | | | $ | 483,658,212 | |
The accompanying notes are an integral part of the financial statements.
196
| | MML
Equity Index Fund | | | MML
Focused Equity
Fund | |
| | Year
Ended
December 31, 2020 | | | Year
Ended
December 31, 2019 | | | Year
Ended
December 31, 2020 | | | Year
Ended
December 31, 2019 | |
| | | | | | | | | | | | | | | | |
| | | | | | | | | | | | | | | | |
| | $ | 9,195,073 | | | $ | 9,942,919 | | | $ | 3,280,575 | | | $ | 2,441,289 | |
| | | 31,583,164 | | | | 144,142,248 | | | | 16,891,787 | | | | 13,584,276 | |
| | | 62,968,813 | | | | 15,562,877 | | | | 16,223,813 | | | | 29,678,837 | |
| | | 103,747,050 | | | | 169,648,044 | | | | 36,396,175 | | | | 45,704,402 | |
| | | | | | | | | | | | | | | | |
| | | — | | | | — | | | | — | | | | — | |
| | | (14,127,801 | ) | | | (6,401,570 | ) | | | — | | | | — | |
| | | (55,432,137 | ) | | | (22,586,203 | ) | | | (15,078,907 | ) | | | (6,676,411 | ) |
| | | (72,635,801 | ) | | | (28,794,121 | ) | | | — | | | | — | |
| | | — | | | | — | | | | — | | | | — | |
| | | (11,098,783 | ) | | | (5,197,860 | ) | | | (965,147 | ) | | | (359,769 | ) |
| | | (153,294,522 | ) | | | (62,979,754 | ) | | | (16,044,054 | ) | | | (7,036,180 | ) |
| | | | | | | | | | | | | | | | |
| | | — | | | | — | | | | — | | | | — | |
| | | 7,721,363 | | | | (2,739,783 | ) | | | — | | | | — | |
| | | 47,903,400 | | | | 23,140,448 | | | | (38,935,605 | ) | | | 213,720,336 | |
| | | 62,143,583 | | | | (187,859,189 | ) | | | — | | | | — | |
| | | — | | | | — | | | | — | | | | — | |
| | | 2,542,609 | | | | (1,480,399 | ) | | | (146,693 | ) | | | 4,141,530 | |
| | | 120,310,955 | | | | (168,938,923 | ) | | | (39,082,298 | ) | | | 217,861,866 | |
| | | 70,763,483 | | | | (62,270,633 | ) | | | (18,730,177 | ) | | | 256,530,088 | |
| | | | | | | | | | | | | | | | |
| | | 582,078,297 | | | | 644,348,930 | | | | 315,786,009 | | | | 59,255,921 | |
| | $ | 652,841,780 | | | $ | 582,078,297 | | | $ | 297,055,832 | | | $ | 315,786,009 | |
The accompanying notes are an integral part of the financial statements.
197
MML Series Investment Fund – Financial Statements (Continued) |
Statements of Changes in Net Assets |
| | | MML
Foreign Fund | |
| | | Year
Ended
December 31, 2020 | | | Year
Ended
December 31, 2019 | |
Increase (Decrease) in Net Assets: | | | | | | | | |
Operations: | | | | | | | | |
Net investment income (loss) | | $ | 4,355,681 | | | $ | 8,348,387 | |
Net realized gain (loss) | | | (6,410,939 | ) | | | 9,956,326 | |
Net change in unrealized appreciation (depreciation) | | | 15,339,394 | | | | 20,356,755 | |
Net increase (decrease) in net assets resulting from operations | | | 13,284,136 | | | | 38,661,468 | |
Distributions to shareholders (Note 2): | | | | | | | | |
Initial Class | | | (17,462,978 | ) | | | (9,912,550 | ) |
Class II | | | — | | | | — | |
Service Class | | | (543,157 | ) | | | (286,467 | ) |
Service Class I | | | — | | | | — | |
Total distributions | | | (18,006,135 | ) | | | (10,199,017 | ) |
Net fund share transactions (Note 5): | | | | | | | | |
Initial Class | | | (36,310,172 | ) | �� | | (14,265,626 | ) |
Class II | | | — | | | | — | |
Service Class | | | (1,326,175 | ) | | | (370,549 | ) |
Service Class I | | | — | | | | — | |
Increase (decrease) in net assets from fund share transactions | | | (37,636,347 | ) | | | (14,636,175 | ) |
Total increase (decrease) in net assets | | | (42,358,346 | ) | | | 13,826,276 | |
Net assets | | | | | | | | |
Beginning of year | | | 317,187,077 | | | | 303,360,801 | |
End of year | | $ | 274,828,731 | | | $ | 317,187,077 | |
The accompanying notes are an integral part of the financial statements.
198
| | MML
Fundamental
Equity Fund | | | MML
Fundamental Value
Fund | |
| | Year
Ended
December 31, 2020 | | | Year
Ended
December 31, 2019 | | | Year
Ended
December 31, 2020 | | | Year
Ended
December 31, 2019 | |
| | | | | | | | | | | | | | | | |
| | | | | | | | | | | | | | | | |
| | $ | 1,085,703 | | | $ | 68,369 | | | $ | 3,302,860 | | | $ | 2,563,533 | |
| | | 17,940,416 | | | | 21,078,335 | | | | (3,921,432 | ) | | | 24,764,253 | |
| | | 15,353,809 | | | | 10,219,628 | | | | 5,434,642 | | | | 12,445,472 | |
| | | 34,379,928 | | | | 31,366,332 | | | | 4,816,070 | | | | 39,773,258 | |
| | | | | | | | | | | | | | | | |
| | | — | | | | — | | | | — | | | | — | |
| | | (19,054,687 | ) | | | (19,254,998 | ) | | | (25,483,413 | ) | | | (23,310,264 | ) |
| | | — | | | | — | | | | — | | | | — | |
| | | (2,117,974 | ) | | | (2,735,384 | ) | | | (1,948,736 | ) | | | (1,954,060 | ) |
| | | (21,172,661 | ) | | | (21,990,382 | ) | | | (27,432,149 | ) | | | (25,264,324 | ) |
| | | | | | | | | | | | | | | | |
| | | — | | | | — | | | | — | | | | — | |
| | | 47,483,118 | | | | 3,267,738 | | | | 5,991,538 | | | | 11,979,316 | |
| | | — | | | | — | | | | — | | | | — | |
| | | 3,342,612 | | | | 4,203,610 | | | | 1,366,155 | | | | 1,875,998 | |
| | | 50,825,730 | | | | 7,471,348 | | | | 7,357,693 | | | | 13,855,314 | |
| | | 64,032,997 | | | | 16,847,298 | | | | (15,258,386 | ) | | | 28,364,248 | |
| | | | | | | | | | | | | | | | |
| | | 117,393,880 | | | | 100,546,582 | | | | 210,167,257 | | | | 181,803,009 | |
| | $ | 181,426,877 | | | $ | 117,393,880 | | | $ | 194,908,871 | | | $ | 210,167,257 | |
The accompanying notes are an integral part of the financial statements.
199
MML Series Investment Fund – Financial Statements (Continued) |
Statements of Changes in Net Assets |
| | | MML
Global Fund | |
| | | Year
Ended
December 31, 2020 | | | Year
Ended
December 31, 2019 | |
Increase (Decrease) in Net Assets: | | | | | | | | |
Operations: | | | | | | | | |
Net investment income (loss) | | $ | 3,500,316 | | | $ | 4,484,567 | |
Net realized gain (loss) | | | 33,379,554 | | | | 15,833,070 | |
Net change in unrealized appreciation (depreciation) | | | 13,729,452 | | | | 61,687,460 | |
Net increase (decrease) in net assets resulting from operations | | | 50,609,322 | | | | 82,005,097 | |
Distributions to shareholders (Note 2): | | | | | | | | |
Initial Class | | | — | | | | — | |
Class I | | | (18,839,748 | ) | | | (15,070,765 | ) |
Class II | | | (790,380 | ) | | | (629,501 | ) |
Service Class | | | — | | | | — | |
Service Class I | | | (805,077 | ) | | | (555,133 | ) |
Total distributions | | | (20,435,205 | ) | | | (16,255,399 | ) |
Net fund share transactions (Note 5): | | | | | | | | |
Initial Class | | | — | | | | — | |
Class I | | | (76,941,427 | ) | | | 172,732,658 | |
Class II | | | (819,659 | ) | | | (822,522 | ) |
Service Class | | | — | | | | — | |
Service Class I | | | (383,206 | ) | | | (394,382 | ) |
Increase (decrease) in net assets from fund share transactions | | | (78,144,292 | ) | | | 171,515,754 | |
Total increase (decrease) in net assets | | | (47,970,175 | ) | | | 237,265,452 | |
Net assets | | | | | | | | |
Beginning of year | | | 446,177,517 | | | | 208,912,065 | |
End of year | | $ | 398,207,342 | | | $ | 446,177,517 | |
The accompanying notes are an integral part of the financial statements.
200
| | MML
Growth & Income
Fund | | | MML
Income & Growth
Fund | |
| | Year
Ended
December 31, 2020 | | | Year
Ended
December 31, 2019 | | | Year
Ended
December 31, 2020 | | | Year
Ended
December 31, 2019 | |
| | | | | | | | | | | | | | | | |
| | | | | | | | | | | | | | | | |
| | $ | 1,362,309 | | | $ | 1,358,018 | | | $ | 4,532,650 | | | $ | 5,603,860 | |
| | | 9,112,888 | | | | 10,419,392 | | | | (11,849,121 | ) | | | 837,054 | |
| | | 9,054,134 | | | | 27,355,920 | | | | 11,417,007 | | | | 55,148,141 | |
| | | 19,529,331 | | | | 39,133,330 | | | | 4,100,536 | | | | 61,589,055 | |
| | | | | | | | | | | | | | | | |
| | | (7,969,735 | ) | | | (10,219,127 | ) | | | (5,619,340 | ) | | | (14,273,421 | ) |
| | | — | | | | — | | | | — | | | | — | |
| | | — | | | | — | | | | — | | | | — | |
| | | (3,654,039 | ) | | | (4,037,009 | ) | | | (526,027 | ) | | | (1,555,938 | ) |
| | | — | | | | — | | | | — | | | | — | |
| | | (11,623,774 | ) | | | (14,256,136 | ) | | | (6,145,367 | ) | | | (15,829,359 | ) |
| | | | | | | | | | | | | | | | |
| | | (6,641,960 | ) | | | (3,966,803 | ) | | | (30,951,611 | ) | | | (7,635,976 | ) |
| | | — | | | | — | | | | — | | | | — | |
| | | — | | | | — | | | | — | | | | — | |
| | | 1,144,590 | | | | 5,326,441 | | | | (2,290,359 | ) | | | 706,203 | |
| | | — | | | | — | | | | — | | | | — | |
| | | (5,497,370 | ) | | | 1,359,638 | | | | (33,241,970 | ) | | | (6,929,773 | ) |
| | | 2,408,187 | | | | 26,236,832 | | | | (35,286,801 | ) | | | 38,829,923 | |
| | | | | | | | | | | | | | | | |
| | | 152,950,794 | | | | 126,713,962 | | | | 303,726,034 | | | | 264,896,111 | |
| | $ | 155,358,981 | | | $ | 152,950,794 | | | $ | 268,439,233 | | | $ | 303,726,034 | |
The accompanying notes are an integral part of the financial statements.
201
MML Series Investment Fund – Financial Statements (Continued) |
Statements of Changes in Net Assets |
| | | MML
International
Equity Fund | |
| | | Year
Ended
December 31, 2020 | | | Year
Ended
December 31, 2019 | |
Increase (Decrease) in Net Assets: | | | | | | | | |
Operations: | | | | | | | | |
Net investment income (loss) | | $ | 593,135 | | | $ | 5,381,324 | |
Net realized gain (loss) | | | (15,095,258 | ) | | | 4,767,503 | |
Net change in unrealized appreciation (depreciation) | | | 22,572,592 | | | | 28,879,787 | |
Net increase (decrease) in net assets resulting from operations | | | 8,070,469 | | | | 39,028,614 | |
Distributions to shareholders (Note 2): | | | | | | | | |
Initial Class | | | — | | | | — | |
Class II | | | (9,804,482 | ) | | | (14,661,848 | ) |
Service Class | | | — | | | | — | |
Service Class I | | | (359,225 | ) | | | (485,036 | ) |
Total distributions | | | (10,163,707 | ) | | | (15,146,884 | ) |
Net fund share transactions (Note 5): | | | | | | | | |
Initial Class | | | — | | | | — | |
Class II | | | (16,570,534 | ) | | | 746,447 | |
Service Class | | | — | | | | — | |
Service Class I | | | 160,875 | | | | 1,283,718 | |
Increase (decrease) in net assets from fund share transactions | | | (16,409,659 | ) | | | 2,030,165 | |
Total increase (decrease) in net assets | | | (18,502,897 | ) | | | 25,911,895 | |
Net assets | | | | | | | | |
Beginning of year | | | 185,218,614 | | | | 159,306,719 | |
End of year | | $ | 166,715,717 | | | $ | 185,218,614 | |
The accompanying notes are an integral part of the financial statements.
202
| | MML
Large Cap Growth
Fund | | | MML
Managed Volatility
Fund | |
| | Year
Ended
December 31, 2020 | | | Year
Ended
December 31, 2019 | | | Year
Ended
December 31, 2020 | | | Year
Ended
December 31, 2019 | |
| | | | | | | | | | | | | | | | |
| | | | | | | | | | | | | | | | |
| | $ | 89,097 | | | $ | 422,714 | | | $ | 1,021,303 | | | $ | 1,549,347 | |
| | | 17,606,300 | | | | 5,929,936 | | | | 10,739,126 | | | | (7,510,563 | ) |
| | | 20,787,845 | | | | 21,742,607 | | | | (3,897,174 | ) | | | 23,038,840 | |
| | | 38,483,242 | | | | 28,095,257 | | | | 7,863,255 | | | | 17,077,624 | |
| | | | | | | | | | | | | | | | |
| | | (5,597,296 | ) | | | (11,308,969 | ) | | | (1,569,290 | ) | | | (2,006,227 | ) |
| | | — | | | | — | | | | — | | | | — | |
| | | (908,084 | ) | | | (1,872,436 | ) | | | (317,733 | ) | | | (406,901 | ) |
| | | — | | | | — | | | | — | | | | — | |
| | | (6,505,380 | ) | | | (13,181,405 | ) | | | (1,887,023 | ) | | | (2,413,128 | ) |
| | | | | | | | | | | | | | | | |
| | | (2,445,427 | ) | | | (1,197,387 | ) | | | (12,572,220 | ) | | | (8,893,357 | ) |
| | | — | | | | — | | | | — | | | | — | |
| | | 1,491,809 | | | | 4,147,375 | | | | (4,945,193 | ) | | | (1,232,645 | ) |
| | | — | | | | — | | | | — | | | | — | |
| | | (953,618 | ) | | | 2,949,988 | | | | (17,517,413 | ) | | | (10,126,002 | ) |
| | | 31,024,244 | | | | 17,863,840 | | | | (11,541,181 | ) | | | 4,538,494 | |
| | | | | | | | | | | | | | | | |
| | | 111,665,338 | | | | 93,801,498 | | | | 155,136,517 | | | | 150,598,023 | |
| | $ | 142,689,582 | | | $ | 111,665,338 | | | $ | 143,595,336 | | | $ | 155,136,517 | |
The accompanying notes are an integral part of the financial statements.
203
MML Series Investment Fund – Financial Statements (Continued) |
Statements of Changes in Net Assets |
| | | MML
Mid Cap Growth
Fund | |
| | | Year
Ended
December 31, 2020 | | | Year
Ended
December 31, 2019 | |
Increase (Decrease) in Net Assets: | | | | | | | | |
Operations: | | | | | | | | |
Net investment income (loss) | | $ | (1,205,368 | ) | | $ | 343,584 | |
Net realized gain (loss) | | | 96,918,382 | | | | 49,632,163 | |
Net change in unrealized appreciation (depreciation) | | | 31,264,718 | | | | 77,318,464 | |
Net increase (decrease) in net assets resulting from operations | | | 126,977,732 | | | | 127,294,211 | |
Distributions to shareholders (Note 2): | | | | | | | | |
Initial Class | | | (39,651,202 | ) | | | (51,794,275 | ) |
Service Class | | | (10,615,548 | ) | | | (14,171,452 | ) |
Total distributions | | | (50,266,750 | ) | | | (65,965,727 | ) |
Net fund share transactions (Note 5): | | | | | | | | |
Initial Class | | | (34,986,822 | ) | | | 30,146,826 | |
Service Class | | | (5,231,458 | ) | | | 7,002,228 | |
Increase (decrease) in net assets from fund share transactions | | | (40,218,280 | ) | | | 37,149,054 | |
Total increase (decrease) in net assets | | | 36,492,702 | | | | 98,477,538 | |
Net assets | | | | | | | | |
Beginning of year | | | 516,144,805 | | | | 417,667,267 | |
End of year | | $ | 552,637,507 | | | $ | 516,144,805 | |
The accompanying notes are an integral part of the financial statements.
204
| | MML
Mid Cap Value
Fund | | | MML
Small Cap Growth
Equity Fund | |
| | Year
Ended
December 31, 2020 | | | Year
Ended
December 31, 2019 | | | Year
Ended
December 31, 2020 | | | Year
Ended
December 31, 2019 | |
| | | | | | | | | | | | | | | | |
| | | | | | | | | | | | | | | | |
| | $ | 6,228,558 | | | $ | 6,851,877 | | | $ | (554,127 | ) | | $ | (172,814 | ) |
| | | 4,873,775 | | | | 771,372 | | | | 32,029,792 | | | | 23,812,506 | |
| | | (1,883,956 | ) | | | 99,841,377 | | | | 30,418,601 | | | | 32,140,744 | |
| | | 9,218,377 | | | | 107,464,626 | | | | 61,894,266 | | | | 55,780,436 | |
| | | | | | | | | | | | | | | | |
| | | (6,322,018 | ) | | | (43,755,980 | ) | | | (19,885,569 | ) | | | (29,446,089 | ) |
| | | (737,517 | ) | | | (5,898,516 | ) | | | (3,402,966 | ) | | | (4,374,302 | ) |
| | | (7,059,535 | ) | | | (49,654,496 | ) | | | (23,288,535 | ) | | | (33,820,391 | ) |
| | | | | | | | | | | | | | | | |
| | | (42,695,740 | ) | | | (5,655,588 | ) | | | (24,000,920 | ) | | | (1,213,463 | ) |
| | | (1,944,447 | ) | | | 3,501,883 | | | | 154,503 | | | | 4,571,433 | |
| | | (44,640,187 | ) | | | (2,153,705 | ) | | | (23,846,417 | ) | | | 3,357,970 | |
| | | (42,481,345 | ) | | | 55,656,425 | | | | 14,759,314 | | | | 25,318,015 | |
| | | | | | | | | | | | | | | | |
| | | 442,363,935 | | | | 386,707,510 | | | | 196,452,607 | | | | 171,134,592 | |
| | $ | 399,882,590 | | | $ | 442,363,935 | | | $ | 211,211,921 | | | $ | 196,452,607 | |
The accompanying notes are an integral part of the financial statements.
205
MML Series Investment Fund – Financial Statements (Continued) |
Statements of Changes in Net Assets |
| | | MML
Small Company
Value Fund | |
| | | Year
Ended
December 31, 2020 | | | Year
Ended
December 31, 2019 | |
Increase (Decrease) in Net Assets: | | | | | | | | |
Operations: | | | | | | | | |
Net investment income (loss) | | $ | 220,327 | | | $ | 187,423 | |
Net realized gain (loss) | | | 5,638,218 | | | | 4,385,906 | |
Net change in unrealized appreciation (depreciation) | | | 774,734 | | | | 16,789,543 | |
Net increase (decrease) in net assets resulting from operations | | | 6,633,279 | | | | 21,362,872 | |
Distributions to shareholders (Note 2): | | | | | | | | |
Initial Class | | | — | | | | — | |
Class II | | | (3,344,244 | ) | | | (10,637,023 | ) |
Service Class | | | — | | | | — | |
Service Class I | | | (1,232,924 | ) | | | (3,412,926 | ) |
Total distributions | | | (4,577,168 | ) | | | (14,049,949 | ) |
Net fund share transactions (Note 5): | | | | | | | | |
Initial Class | | | — | | | | — | |
Class II | | | (9,870,059 | ) | | | 2,181,798 | |
Service Class | | | — | | | | — | |
Service Class I | | | (254,063 | ) | | | 4,158,602 | |
Increase (decrease) in net assets from fund share transactions | | | (10,124,122 | ) | | | 6,340,400 | |
Total increase (decrease) in net assets | | | (8,068,011 | ) | | | 13,653,323 | |
Net assets | | | | | | | | |
Beginning of year | | | 100,490,632 | | | | 86,837,309 | |
End of year | | $ | 92,422,621 | | | $ | 100,490,632 | |
The accompanying notes are an integral part of the financial statements.
206
| | MML
Small/Mid Cap
Value Fund | | | MML
Total Return Bond
Fund | |
| | Year
Ended
December 31, 2020 | | | Year
Ended
December 31, 2019 | | | Year
Ended
December 31, 2020 | | | Year
Ended
December 31, 2019 | |
| | | | | | | | | | | | | | | | |
| | | | | | | | | | | | | | | | |
| | $ | 1,659,426 | | | $ | 2,015,024 | | | $ | 6,027,698 | | | $ | 9,364,596 | |
| | | (5,515,350 | ) | | | 7,561,569 | | | | 18,576,470 | | | | 13,369,874 | |
| | | 15,147,890 | | | | 26,811,318 | | | | 5,106,709 | | | | 10,120,500 | |
| | | 11,291,966 | | | | 36,387,911 | | | | 29,710,877 | | | | 32,854,970 | |
| | | | | | | | | | | | | | | | |
| | | (8,658,051 | ) | | | (22,035,759 | ) | | | — | | | | — | |
| | | — | | | | — | | | | (10,430,481 | ) | | | (10,406,581 | ) |
| | | (1,079,794 | ) | | | (2,792,250 | ) | | | — | | | | — | |
| | | — | | | | — | | | | (1,499,979 | ) | | | (895,462 | ) |
| | | (9,737,845 | ) | | | (24,828,009 | ) | | | (11,930,460 | ) | | | (11,302,043 | ) |
| | | | | | | | | | | | | | | | |
| | | (16,891,084 | ) | | | 5,435,238 | | | | — | | | | — | |
| | | — | | | | — | | | | (69,935,507 | ) | | | (31,647,275 | ) |
| | | (1,013,863 | ) | | | 3,006,628 | | | | — | | | | — | |
| | | — | | | | — | | | | 15,399,108 | | | | 7,003,083 | |
| | | (17,904,947 | ) | | | 8,441,866 | | | | (54,536,399 | ) | | | (24,644,192 | ) |
| | | (16,350,826 | ) | | | 20,001,768 | | | | (36,755,982 | ) | | | (3,091,265 | ) |
| | | | | | | | | | | | | | | | |
| | | 202,797,971 | | | | 182,796,203 | | | | 376,013,086 | | | | 379,104,351 | |
| | $ | 186,447,145 | | | $ | 202,797,971 | | | $ | 339,257,104 | | | $ | 376,013,086 | |
The accompanying notes are an integral part of the financial statements.
207
MML Series Investment Fund – Financial Statements (Continued) |
Financial Highlights (For a share outstanding throughout each period) |
MML Conservative Allocation Fund
| | | Income (loss) from investment
operations | Less distributions to shareholders | | | Ratios / Supplemental Data |
| | Net
asset
value,
beginning
of period | Net
investment
income
(loss)c | Net
realized
and
unrealized
gain (loss)
on
investments | Total
income
(loss) from
investment
operations | From net
investment
income | From net
realized
gains | Total
distributions | Net
asset
value,
end of
the
period | Total
returnm | Net
assets,
end of
the
period
(000’s) | Ratio of
expenses
to average
daily net
assetsw | Net
investment
income
(loss) to
average
daily net
assets |
Initial Class | | | | | | | | | | | |
12/31/20 | $ 9.95 | $ 0.09 | $ 0.86 | $ 0.95 | $ (0.27) | $ (0.29) | $ (0.56) | $ 10.34 | 9.93% | $ 96,649 | 0.12% | 0.95% |
12/31/19 | 9.23 | 0.25 | 1.13 | 1.38 | (0.28) | (0.38) | (0.66) | 9.95 | 15.20% | 95,290 | 0.13% | 2.55% |
12/31/18 | 10.01 | 0.22 | (0.55) | (0.33) | (0.25) | (0.20) | (0.45) | 9.23 | (3.50%) | 90,797 | 0.12% | 2.22% |
12/31/17 | 9.63 | 0.22 | 0.70 | 0.92 | (0.23) | (0.31) | (0.54) | 10.01 | 9.62% | 107,294 | 0.12% | 2.23% |
12/31/16 | 9.83 | 0.20 | 0.37 | 0.57 | (0.24) | (0.53) | (0.77) | 9.63 | 5.78% | 112,989 | 0.12% | 2.01% |
Service Class | | | | | | | | | | | |
12/31/20 | $ 9.84 | $ 0.07 | $ 0.85 | $ 0.92 | $ (0.25) | $ (0.29) | $ (0.54) | $ 10.22 | 9.67% | $ 338,181 | 0.37% | 0.72% |
12/31/19 | 9.13 | 0.22 | 1.12 | 1.34 | (0.25) | (0.38) | (0.63) | 9.84 | 14.93% | 312,658 | 0.38% | 2.31% |
12/31/18 | 9.90 | 0.19 | (0.53) | (0.34) | (0.23) | (0.20) | (0.43) | 9.13 | (3.70%) | 306,230 | 0.37% | 1.94% |
12/31/17 | 9.53 | 0.20 | 0.68 | 0.88 | (0.20) | (0.31) | (0.51) | 9.90 | 9.33% | 368,843 | 0.37% | 2.00% |
12/31/16 | 9.74 | 0.18 | 0.35 | 0.53 | (0.21) | (0.53) | (0.74) | 9.53 | 5.48% | 364,364 | 0.37% | 1.80% |
| | Year ended December 31 |
| | 2020 | 2019 | 2018 | 2017 | 2016 |
Portfolio turnover ratex | 43% | 29% | 18% | 14% | 24% |
c | Per share amount calculated on the average shares method. |
m | Total return does not reflect expenses that apply at the separate account level or to related insurance products. Inclusion of these charges would reduce the total return figures for all periods shown. |
w | Expenses of the underlying funds are not included in the Fund’s expense ratio. The Fund indirectly bears its proportionate share of the expenses of any underlying fund. |
x | Amount does not include the portfolio activity of any underlying fund. |
The accompanying notes are an integral part of the financial statements.
208
MML Series Investment Fund – Financial Statements (Continued) |
Financial Highlights (For a share outstanding throughout each period) |
MML Balanced Allocation Fund
| | | Income (loss) from investment
operations | Less distributions to shareholders | | | Ratios / Supplemental Data |
| | Net
asset
value,
beginning
of period | Net
investment
income
(loss)c | Net
realized
and
unrealized
gain (loss)
on
investments | Total
income
(loss) from
investment
operations | From net
investment
income | From net
realized
gains | Total
distributions | Net
asset
value,
end of
the
period | Total
returnm | Net
assets,
end of
the
period
(000’s) | Ratio of
expenses
to average
daily net
assetsw | Net
investment
income
(loss) to
average
daily net
assets |
Initial Class | | | | | | | | | | | |
12/31/20 | $ 9.89 | $ 0.09 | $ 0.94 | $ 1.03 | $ (0.26) | $ (0.34) | $ (0.60) | $ 10.32 | 10.93% | $ 109,924 | 0.12% | 0.97% |
12/31/19 | 9.12 | 0.23 | 1.27 | 1.50 | (0.26) | (0.47) | (0.73) | 9.89 | 16.75% | 125,465 | 0.12% | 2.32% |
12/31/18 | 10.16 | 0.20 | (0.61) | (0.41) | (0.24) | (0.39) | (0.63) | 9.12 | (4.47%) | 116,177 | 0.12% | 2.00% |
12/31/17 | 9.70 | 0.21 | 0.88 | 1.09 | (0.20) | (0.43) | (0.63) | 10.16 | 11.48% | 139,773 | 0.12% | 2.06% |
12/31/16 | 10.05 | 0.18 | 0.43 | 0.61 | (0.24) | (0.72) | (0.96) | 9.70 | 6.15% | 134,716 | 0.12% | 1.84% |
Service Class | | | | | | | | | | | |
12/31/20 | $ 9.80 | $ 0.07 | $ 0.92 | $ 0.99 | $ (0.23) | $ (0.34) | $ (0.57) | $ 10.22 | 10.65% | $ 373,144 | 0.37% | 0.72% |
12/31/19 | 9.03 | 0.20 | 1.27 | 1.47 | (0.23) | (0.47) | (0.70) | 9.80 | 16.61% | 408,868 | 0.37% | 2.07% |
12/31/18 | 10.07 | 0.17 | (0.61) | (0.44) | (0.21) | (0.39) | (0.60) | 9.03 | (4.76%) | 391,230 | 0.37% | 1.76% |
12/31/17 | 9.62 | 0.18 | 0.88 | 1.06 | (0.18) | (0.43) | (0.61) | 10.07 | 11.21% | 459,581 | 0.37% | 1.82% |
12/31/16 | 9.98 | 0.16 | 0.42 | 0.58 | (0.22) | (0.72) | (0.94) | 9.62 | 5.82% | 438,996 | 0.37% | 1.62% |
| | Year ended December 31 |
| | 2020 | 2019 | 2018 | 2017 | 2016 |
Portfolio turnover ratex | 22% | 28% | 17% | 15% | 18% |
c | Per share amount calculated on the average shares method. |
m | Total return does not reflect expenses that apply at the separate account level or to related insurance products. Inclusion of these charges would reduce the total return figures for all periods shown. |
w | Expenses of the underlying funds are not included in the Fund’s expense ratio. The Fund indirectly bears its proportionate share of the expenses of any underlying fund. |
x | Amount does not include the portfolio activity of any underlying fund. |
The accompanying notes are an integral part of the financial statements.
209
MML Series Investment Fund – Financial Statements (Continued) |
Financial Highlights (For a share outstanding throughout each period) |
MML Moderate Allocation Fund
| | | Income (loss) from investment
operations | Less distributions to shareholders | | | Ratios / Supplemental Data |
| | Net
asset
value,
beginning
of period | Net
investment
income
(loss)c | Net
realized
and
unrealized
gain (loss)
on
investments | Total
income
(loss) from
investment
operations | From net
investment
income | From net
realized
gains | Total
distributions | Net
asset
value,
end of
the
period | Total
returnm | Net
assets,
end of
the
period
(000’s) | Ratio of
expenses
to average
daily net
assetsw | Net
investment
income
(loss) to
average
daily net
assets |
Initial Class | | | | | | | | | | | |
12/31/20 | $ 10.53 | $ 0.10 | $ 0.95 | $ 1.05 | $ (0.26) | $ (0.48) | $ (0.74) | $ 10.84 | 10.54% | $ 303,037 | 0.11% | 1.04% |
12/31/19 | 9.71 | 0.21 | 1.54 | 1.75 | (0.28) | (0.65) | (0.93) | 10.53 | 18.58% | 378,044 | 0.12% | 2.05% |
12/31/18 | 11.00 | 0.19 | (0.73) | (0.54) | (0.24) | (0.51) | (0.75) | 9.71 | (5.48%) | 349,719 | 0.11% | 1.79% |
12/31/17 | 10.38 | 0.20 | 1.15 | 1.35 | (0.20) | (0.53) | (0.73) | 11.00 | 13.33% | 417,670 | 0.11% | 1.84% |
12/31/16 | 10.66 | 0.18 | 0.54 | 0.72 | (0.23) | (0.77) | (1.00) | 10.38 | 6.89% | 411,730 | 0.11% | 1.69% |
Service Class | | | | | | | | | | | |
12/31/20 | $ 10.41 | $ 0.08 | $ 0.92 | $ 1.00 | $ (0.23) | $ (0.48) | $ (0.71) | $ 10.70 | 10.16% | $1,575,805 | 0.36% | 0.76% |
12/31/19 | 9.60 | 0.18 | 1.53 | 1.71 | (0.25) | (0.65) | (0.90) | 10.41 | 18.36% | 1,751,648 | 0.37% | 1.78% |
12/31/18 | 10.88 | 0.16 | (0.72) | (0.56) | (0.21) | (0.51) | (0.72) | 9.60 | (5.70%) | 1,690,215 | 0.36% | 1.54% |
12/31/17 | 10.28 | 0.17 | 1.14 | 1.31 | (0.18) | (0.53) | (0.71) | 10.88 | 12.99% | 2,047,202 | 0.36% | 1.60% |
12/31/16 | 10.57 | 0.15 | 0.53 | 0.68 | (0.20) | (0.77) | (0.97) | 10.28 | 6.59% | 1,968,981 | 0.36% | 1.45% |
| | Year ended December 31 |
| | 2020 | 2019 | 2018 | 2017 | 2016 |
Portfolio turnover ratex | 19% | 28% | 15% | 13% | 14% |
c | Per share amount calculated on the average shares method. |
m | Total return does not reflect expenses that apply at the separate account level or to related insurance products. Inclusion of these charges would reduce the total return figures for all periods shown. |
w | Expenses of the underlying funds are not included in the Fund’s expense ratio. The Fund indirectly bears its proportionate share of the expenses of any underlying fund. |
x | Amount does not include the portfolio activity of any underlying fund. |
The accompanying notes are an integral part of the financial statements.
210
MML Series Investment Fund – Financial Statements (Continued) |
Financial Highlights (For a share outstanding throughout each period) |
MML Growth Allocation Fund
| | | Income (loss) from investment
operations | Less distributions to shareholders | | | Ratios / Supplemental Data |
| | Net
asset
value,
beginning
of period | Net
investment
income
(loss)c | Net
realized
and
unrealized
gain (loss)
on
investments | Total
income
(loss) from
investment
operations | From net
investment
income | From net
realized
gains | Total
distributions | Net
asset
value,
end of
the
period | Total
returnm | Net
assets,
end of
the
period
(000’s) | Ratio of
expenses
to average
daily net
assetsw | Net
investment
income
(loss) to
average
daily net
assets |
Initial Class | | | | | | | | | | | |
12/31/20 | $ 9.04 | $ 0.09 | $ 0.98 | $ 1.07 | $ (0.18) | $ (0.55) | $ (0.73) | $ 9.38 | 12.76% | $ 456,817 | 0.11% | 1.07% |
12/31/19 | 8.35 | 0.15 | 1.55 | 1.70 | (0.22) | (0.79) | (1.01) | 9.04 | 21.21% | 573,104 | 0.12% | 1.64% |
12/31/18 | 9.75 | 0.14 | (0.73) | (0.59) | (0.18) | (0.63) | (0.81) | 8.35 | (6.90%) | 536,767 | 0.11% | 1.47% |
12/31/17 | 9.16 | 0.15 | 1.28 | 1.43 | (0.15) | (0.69) | (0.84) | 9.75 | 16.07% | 647,613 | 0.11% | 1.53% |
12/31/16 | 9.69 | 0.13 | 0.58 | 0.71 | (0.19) | (1.05) | (1.24) | 9.16 | 7.57% | 607,088 | 0.11% | 1.38% |
Service Class | | | | | | | | | | | |
12/31/20 | $ 8.96 | $ 0.07 | $ 0.97 | $ 1.04 | $ (0.16) | $ (0.55) | $ (0.71) | $ 9.29 | 12.47% | $ 788,627 | 0.36% | 0.82% |
12/31/19 | 8.28 | 0.12 | 1.54 | 1.66 | (0.19) | (0.79) | (0.98) | 8.96 | 20.93% | 978,390 | 0.37% | 1.40% |
12/31/18 | 9.67 | 0.12 | (0.73) | (0.61) | (0.15) | (0.63) | (0.78) | 8.28 | (7.10%) | 915,318 | 0.36% | 1.22% |
12/31/17 | 9.09 | 0.12 | 1.28 | 1.40 | (0.13) | (0.69) | (0.82) | 9.67 | 15.81% | 1,080,728 | 0.36% | 1.27% |
12/31/16 | 9.63 | 0.11 | 0.56 | 0.67 | (0.16) | (1.05) | (1.21) | 9.09 | 7.23% | 1,001,718 | 0.36% | 1.13% |
| | Year ended December 31 |
| | 2020 | 2019 | 2018 | 2017 | 2016 |
Portfolio turnover ratex | 18% | 29% | 17% | 16% | 17% |
c | Per share amount calculated on the average shares method. |
m | Total return does not reflect expenses that apply at the separate account level or to related insurance products. Inclusion of these charges would reduce the total return figures for all periods shown. |
w | Expenses of the underlying funds are not included in the Fund’s expense ratio. The Fund indirectly bears its proportionate share of the expenses of any underlying fund. |
x | Amount does not include the portfolio activity of any underlying fund. |
The accompanying notes are an integral part of the financial statements.
211
MML Series Investment Fund – Financial Statements (Continued) |
Financial Highlights (For a share outstanding throughout each period) |
MML Aggressive Allocation Fund
| | | Income (loss) from investment
operations | Less distributions to shareholders | | | Ratios / Supplemental Data |
| | Net
asset
value,
beginning
of period | Net
investment
income
(loss)c | Net
realized
and
unrealized
gain (loss)
on
investments | Total
income
(loss) from
investment
operations | From net
investment
income | From net
realized
gains | Total
distributions | Net
asset
value,
end of
the
period | Total
returnm | Net
assets,
end of
the
period
(000’s) | Ratio of
expenses
to average
daily net
assetsw | Net
investment
income
(loss) to
average
daily net
assets |
Initial Class | | | | | | | | | | | |
12/31/20 | $ 10.16 | $ 0.10 | $ 1.15 | $ 1.25 | $ (0.16) | $ (0.67) | $ (0.83) | $ 10.58 | 13.35% | $ 66,655 | 0.15% | 1.08% |
12/31/19 | 9.20 | 0.12 | 1.99 | 2.11 | (0.21) | (0.94) | (1.15) | 10.16 | 23.93% | 67,730 | 0.15% | 1.24% |
12/31/18 | 10.68 | 0.12 | (0.90) | (0.78) | (0.15) | (0.55) | (0.70) | 9.20 | (8.12%) | 56,195 | 0.15% | 1.10% |
12/31/17 | 9.67 | 0.12 | 1.65 | 1.77 | (0.12) | (0.64) | (0.76) | 10.68 | 18.77% | 66,517 | 0.15% | 1.17% |
12/31/16 | 10.10 | 0.11 | 0.72 | 0.83 | (0.16) | (1.10) | (1.26) | 9.67 | 8.54% | 58,438 | 0.15% | 1.09% |
Service Class | | | | | | | | | | | |
12/31/20 | $ 9.99 | $ 0.07 | $ 1.13 | $ 1.20 | $ (0.13) | $ (0.67) | $ (0.80) | $ 10.39 | 13.08% | $ 93,621 | 0.40% | 0.80% |
12/31/19 | 9.06 | 0.09 | 1.96 | 2.05 | (0.18) | (0.94) | (1.12) | 9.99 | 23.65% | 95,667 | 0.40% | 0.95% |
12/31/18 | 10.54 | 0.09 | (0.90) | (0.81) | (0.12) | (0.55) | (0.67) | 9.06 | (8.44%) | 83,212 | 0.40% | 0.87% |
12/31/17 | 9.56 | 0.10 | 1.62 | 1.72 | (0.10) | (0.64) | (0.74) | 10.54 | 18.44% | 90,246 | 0.40% | 0.95% |
12/31/16 | 10.00 | 0.08 | 0.72 | 0.80 | (0.14) | (1.10) | (1.24) | 9.56 | 8.28% | 73,617 | 0.40% | 0.84% |
| | Year ended December 31 |
| | 2020 | 2019 | 2018 | 2017 | 2016 |
Portfolio turnover ratex | 17% | 32% | 19% | 20% | 19% |
c | Per share amount calculated on the average shares method. |
m | Total return does not reflect expenses that apply at the separate account level or to related insurance products. Inclusion of these charges would reduce the total return figures for all periods shown. |
w | Expenses of the underlying funds are not included in the Fund’s expense ratio. The Fund indirectly bears its proportionate share of the expenses of any underlying fund. |
x | Amount does not include the portfolio activity of any underlying fund. |
The accompanying notes are an integral part of the financial statements.
212
MML Series Investment Fund – Financial Statements (Continued) |
Financial Highlights (For a share outstanding throughout each period) |
MML American Funds Growth Fund
| | | Income (loss) from investment
operations | Less distributions to shareholders | | | Ratios / Supplemental Data |
| | Net
asset
value,
beginning
of period | Net
investment
income
(loss)c,j | Net
realized
and
unrealized
gain (loss)
on
investments | Total
income
(loss) from
investment
operations | From net
investment
income | From net
realized
gains | Total
distributions | Net
asset
value,
end of
the
period | Total
returnm | Net
assets,
end of
the
period
(000’s) | Ratio of
expenses
to average
daily net
assets
before
expense
waiversu | Ratio of
expenses
to average
daily net
assets
after
expense
waiversu,j | Net
investment
income
(loss) to
average
daily net
assets |
Service Class I | | | | | | | | | | | | |
12/31/20 | $ 14.33 | $ (0.02) | $ 7.11 | $ 7.09 | $ (0.12) | $ (1.74) | $ (1.86) | $ 19.56 | 51.49% | $ 257,464 | 0.68% | N/A | (0.12%) |
12/31/19 | 12.70 | 0.04 | 3.53 | 3.57 | (0.05) | (1.89) | (1.94) | 14.33 | 30.33% | 197,036 | 0.69% | 0.69%l | 0.31% |
12/31/18 | 14.37 | 0.00d | 0.15 | 0.15 | (0.04) | (1.78) | (1.82) | 12.70 | (0.73%) | 162,360 | 0.69% | 0.69%l | 0.01% |
12/31/17 | 12.37 | 0.01 | 3.31 | 3.32 | (0.04) | (1.28) | (1.32) | 14.37 | 27.78% | 171,896 | 0.68% | 0.68%l | 0.07% |
12/31/16 | 14.53 | 0.05 | 1.16 | 1.21 | (0.03) | (3.34) | (3.37) | 12.37 | 9.00% | 139,841 | 0.69% | 0.69%l | 0.37% |
| | Year ended December 31 |
| | 2020 | 2019 | 2018 | 2017 | 2016 |
Portfolio turnover ratex | 8% | 12% | 12% | 11% | 8% |
c | Per share amount calculated on the average shares method. |
d | Amount is less than $0.005 per share. |
j | Computed after giving effect to an agreement by MML Advisers to waive certain fees and expenses of the Fund. |
l | Expenses incurred during the period fell under the expense cap. |
m | Total return does not reflect expenses that apply at the separate account level or to related insurance products. Inclusion of these charges would reduce the total return figures for all periods shown. |
u | Expenses of the Master Fund are not included in the Fund’s expense ratio. The Fund indirectly bears its proportionate share of the expenses of the Master Fund. |
x | Amount does not include the portfolio activity of the Master Fund. |
The accompanying notes are an integral part of the financial statements.
213
MML Series Investment Fund – Financial Statements (Continued) |
Financial Highlights (For a share outstanding throughout each period) |
MML American Funds International Fund
| | | Income (loss) from investment
operations | Less distributions to shareholders | | | Ratios / Supplemental Data |
| | Net
asset
value,
beginning
of period | Net
investment
income
(loss)c,j | Net
realized
and
unrealized
gain (loss)
on
investments | Total
income
(loss) from
investment
operations | From net
investment
income | From net
realized
gains | Total
distributions | Net
asset
value,
end of
the
period | Total
returnm | Net
assets,
end of
the
period
(000’s) | Ratio of
expenses
to average
daily net
assets
before
expense
waiversu | Ratio of
expenses
to average
daily net
assets
after
expense
waiversu,j | Net
investment
income
(loss) to
average
daily net
assets |
Service Class I | | | | | | | | | | | | |
12/31/20 | $ 10.19 | $ 0.01 | $ 1.25 | $ 1.26 | $ (0.10) | $ (0.53) | $ (0.63) | $ 10.82 | 13.44% | $ 61,031 | 0.73% | N/A | 0.14% |
12/31/19 | 9.07 | 0.09 | 1.83 | 1.92 | (0.28) | (0.52) | (0.80) | 10.19 | 22.31% | 63,943 | 0.74% | 0.73% | 0.96% |
12/31/18 | 10.93 | 0.13 | (1.55) | (1.42) | (0.09) | (0.35) | (0.44) | 9.07 | (13.52%) | 56,712 | 0.73% | 0.70% | 1.24% |
12/31/17 | 9.12 | 0.08 | 2.73 | 2.81 | (0.09) | (0.91) | (1.00) | 10.93 | 31.65% | 66,931 | 0.72% | 0.70% | 0.80% |
12/31/16 | 9.63 | 0.09 | 0.21 | 0.30 | (0.11) | (0.70) | (0.81) | 9.12 | 2.97% | 53,972 | 0.72% | 0.70% | 0.94% |
| | Year ended December 31 |
| | 2020 | 2019 | 2018 | 2017 | 2016 |
Portfolio turnover ratex | 5% | 8% | 11% | 9% | 12% |
c | Per share amount calculated on the average shares method. |
j | Computed after giving effect to an agreement by MML Advisers to waive certain fees and expenses of the Fund. |
m | Total return does not reflect expenses that apply at the separate account level or to related insurance products. Inclusion of these charges would reduce the total return figures for all periods shown. |
u | Expenses of the Master Fund are not included in the Fund’s expense ratio. The Fund indirectly bears its proportionate share of the expenses of the Master Fund. |
x | Amount does not include the portfolio activity of the Master Fund. |
The accompanying notes are an integral part of the financial statements.
214
MML Series Investment Fund – Financial Statements (Continued) |
Financial Highlights (For a share outstanding throughout each period) |
MML American Funds Core Allocation Fund
| | | Income (loss) from investment
operations | Less distributions to shareholders | | | Ratios / Supplemental Data |
| | Net
asset
value,
beginning
of period | Net
investment
income
(loss)c | Net
realized
and
unrealized
gain (loss)
on
investments | Total
income
(loss) from
investment
operations | From net
investment
income | From net
realized
gains | Total
distributions | Net
asset
value,
end of
the
period | Total
returnm | Net
assets,
end of
the
period
(000’s) | Ratio of
expenses
to average
daily net
assetsw | Net
investment
income
(loss) to
average
daily net
assets |
Service Class I | | | | | | | | | | | |
12/31/20 | $ 11.72 | $ 0.12 | $ 1.15 | $ 1.27 | $ (0.20) | $ (0.63) | $ (0.83) | $ 12.16 | 11.39% | $ 943,728 | 0.71% | 1.08% |
12/31/19 | 10.98 | 0.18 | 1.72 | 1.90 | (0.29) | (0.87) | (1.16) | 11.72 | 18.12% | 1,001,411 | 0.71% | 1.52% |
12/31/18 | 12.60 | 0.17 | (0.69) | (0.52) | (0.22) | (0.88) | (1.10) | 10.98 | (4.84%) | 956,051 | 0.71% | 1.41% |
12/31/17 | 11.94 | 0.16 | 1.56 | 1.72 | (0.18) | (0.88) | (1.06) | 12.60 | 14.94% | 1,094,274 | 0.71% | 1.25% |
12/31/16 | 12.08 | 0.16 | 0.92 | 1.08 | (0.24) | (0.98) | (1.22) | 11.94 | 8.97% | 941,450 | 0.71% | 1.29% |
| | Year ended December 31 |
| | 2020 | 2019 | 2018 | 2017 | 2016 |
Portfolio turnover ratex | 14% | 16% | 15% | 16% | 7% |
c | Per share amount calculated on the average shares method. |
m | Total return does not reflect expenses that apply at the separate account level or to related insurance products. Inclusion of these charges would reduce the total return figures for all periods shown. |
w | Expenses of the underlying funds are not included in the Fund’s expense ratio. The Fund indirectly bears its proportionate share of the expenses of any underlying fund. |
x | Amount does not include the portfolio activity of any underlying fund. |
The accompanying notes are an integral part of the financial statements.
215
MML Series Investment Fund – Financial Statements (Continued) |
Financial Highlights (For a share outstanding throughout each period) |
MML Blue Chip Growth Fund
| | | Income (loss) from investment
operations | Less distributions to shareholders | | | Ratios / Supplemental Data |
| | Net
asset
value,
beginning
of the
period | Net
investment
income
(loss)c | Net
realized
and
unrealized
gain (loss)
on
investments | Total
income
(loss) from
investment
operations | From net
investment
income | From net
realized
gains | Total
distributions | Net
asset
value,
end of
the
period | Total
returnm | Net
assets,
end of
the
period
(000’s) | Ratio of
expenses
to average
daily net
assets | Net
investment
income
(loss) to
average
daily net
assets |
Initial Class | | | | | | | | | | | |
12/31/20 | $ 16.49 | $ (0.06) | $ 5.68 | $ 5.62 | $ — | $ (1.60) | $ (1.60) | $ 20.51 | 34.40% | $ 351,504 | 0.78% | (0.35%) |
12/31/19 | 14.60 | (0.02) | 4.16 | 4.14 | — | (2.25) | (2.25) | 16.49 | 29.84% | 304,381 | 0.79% | (0.09%) |
12/31/18 | 17.41 | (0.00)d | 0.86 | 0.86 | — | (3.67) | (3.67) | 14.60 | 1.88% | 254,050 | 0.79% | (0.02%) |
12/31/17 | 13.98 | 0.00d | 4.93 | 4.93 | (0.00)d | (1.50) | (1.50) | 17.41 | 36.22% | 301,054 | 0.80% | 0.00%e |
12/31/16 | 15.79 | 0.00d | 0.13 | 0.13 | — | (1.94) | (1.94) | 13.98 | 0.91% | 332,688 | 0.79% | 0.03% |
Service Class | | | | | | | | | | | |
12/31/20 | $ 15.71 | $ (0.10) | $ 5.39 | $ 5.29 | $ — | $ (1.60) | $ (1.60) | $ 19.40 | 34.00% | $ 181,728 | 1.03% | (0.60%) |
12/31/19 | 14.03 | (0.05) | 3.98 | 3.93 | — | (2.25) | (2.25) | 15.71 | 29.56% | 137,293 | 1.04% | (0.35%) |
12/31/18 | 16.88 | (0.05) | 0.87 | 0.82 | — | (3.67) | (3.67) | 14.03 | 1.68% | 99,468 | 1.04% | (0.26%) |
12/31/17 | 13.62 | (0.04) | 4.80 | 4.76 | — | (1.50) | (1.50) | 16.88 | 35.89% | 77,091 | 1.05% | (0.25%) |
12/31/16 | 15.47 | (0.03) | 0.12 | 0.09 | — | (1.94) | (1.94) | 13.62 | 0.65% | 47,411 | 1.04% | (0.22%) |
| | Year ended December 31 |
| | 2020 | 2019 | 2018 | 2017 | 2016 |
Portfolio turnover rate | 26% | 33% | 28% | 25% | 29% |
c | Per share amount calculated on the average shares method. |
d | Amount is less than $0.005 per share. |
e | Amount is less than 0.005%. |
m | Total return does not reflect expenses that apply at the separate account level or to related insurance products. Inclusion of these charges would reduce the total return figures for all periods shown. |
The accompanying notes are an integral part of the financial statements.
216
MML Series Investment Fund – Financial Statements (Continued) |
Financial Highlights (For a share outstanding throughout each period) |
MML Equity Income Fund
| | | Income (loss) from investment
operations | Less distributions to shareholders | | | Ratios / Supplemental Data |
| | Net
asset
value,
beginning
of the
period | Net
investment
income
(loss)c,j | Net
realized
and
unrealized
gain (loss)
on
investments | Total
income
(loss) from
investment
operations | From net
investment
income | From net
realized
gains | Total
distributions | Net
asset
value,
end of
the
period | Total
returnm | Net
assets,
end of
the
period
(000’s) | Ratio of
expenses
to average
daily net
assets
before
expense
waiver | Ratio of
expenses
to average
daily net
assets
after
expense
waiversj | Net
investment
income
(loss) to
average
daily net
assets |
Initial Class | | | | | | | | | | | | |
12/31/20 | $ 11.18 | $ 0.22 | $ (0.22) | $ 0.00d | $ (0.23) | $ (0.67) | $ (0.90) | $ 10.28 | 1.34% | $ 365,382 | 0.79% | 0.76% | 2.32% |
12/31/19 | 10.04 | 0.24 | 2.25 | 2.49 | (0.27) | (1.08) | (1.35) | 11.18 | 26.45% | 396,909 | 0.78% | 0.75% | 2.22% |
12/31/18 | 12.50 | 0.26 | (1.23) | (0.97) | (0.24) | (1.25) | (1.49) | 10.04 | (9.36%) | 358,947 | 0.79% | 0.76% | 2.17% |
12/31/17 | 11.78 | 0.23 | 1.58 | 1.81 | (0.27) | (0.82) | (1.09) | 12.50 | 16.33% | 440,607 | 0.79% | 0.76% | 1.93% |
12/31/16 | 11.29 | 0.27 | 1.73 | 2.00 | (0.25) | (1.26) | (1.51) | 11.78 | 18.68% | 413,304 | 0.79% | 0.77% | 2.33% |
Service Class | | | | | | | | | | | | |
12/31/20 | $ 11.03 | $ 0.19 | $ (0.20) | $ (0.01) | $ (0.21) | $ (0.67) | $ (0.88) | $ 10.14 | 1.17% | $ 82,671 | 1.04% | 1.01% | 2.06% |
12/31/19 | 9.92 | 0.21 | 2.22 | 2.43 | (0.24) | (1.08) | (1.32) | 11.03 | 26.12% | 86,749 | 1.03% | 1.00% | 1.98% |
12/31/18 | 12.37 | 0.23 | (1.22) | (0.99) | (0.21) | (1.25) | (1.46) | 9.92 | (9.60%) | 75,335 | 1.04% | 1.01% | 1.92% |
12/31/17 | 11.68 | 0.20 | 1.56 | 1.76 | (0.25) | (0.82) | (1.07) | 12.37 | 15.97% | 86,193 | 1.04% | 1.01% | 1.68% |
12/31/16 | 11.20 | 0.24 | 1.72 | 1.96 | (0.22) | (1.26) | (1.48) | 11.68 | 18.46% | 77,647 | 1.04% | 1.02% | 2.10% |
| | Year ended December 31 |
| | 2020 | 2019 | 2018 | 2017 | 2016 |
Portfolio turnover rate | 32% | 18% | 19% | 25% | 22% |
c | Per share amount calculated on the average shares method. |
d | Amount is less than $0.005 per share. |
j | Computed after giving effect to an agreement by MML Advisers to waive certain fees and expenses of the Fund. |
m | Total return does not reflect expenses that apply at the separate account level or to related insurance products. Inclusion of these charges would reduce the total return figures for all periods shown. |
The accompanying notes are an integral part of the financial statements.
217
MML Series Investment Fund – Financial Statements (Continued) |
Financial Highlights (For a share outstanding throughout each period) |
MML Equity Index Fund
| | | Income (loss) from investment
operations | Less distributions to shareholders | | | Ratios / Supplemental Data |
| | Net
asset
value,
beginning
of the
period | Net
investment
income
(loss)c | Net
realized
and
unrealized
gain (loss)
on
investments | Total
income
(loss) from
investment
operations | From net
investment
income | From net
realized
gains | Total
distributions | Net
asset
value,
end of
the
period | Total
returnm | Net
assets,
end of
the
period
(000’s) | Ratio of
expenses
to average
daily net
assets | Net
investment
income
(loss) to
average
daily net
assets |
Class I | | | | | | | | | | | | |
12/31/20 | $ 32.46 | $ 0.42 | $ 4.71 | $ 5.13 | $ (0.55) | $ (7.97) | $ (8.52) | $ 29.07 | 18.06% | $ 61,002 | 0.43% | 1.43% |
12/31/19 | 28.09 | 0.48 | 7.71 | 8.19 | (0.90) | (2.92) | (3.82) | 32.46 | 30.86% | 57,944 | 0.44% | 1.51% |
12/31/18 | 31.01 | 0.49 | (1.76) | (1.27) | (0.50) | (1.15) | (1.65) | 28.09 | (4.80%) | 51,998 | 0.43% | 1.57% |
12/31/17 | 26.53 | 0.45 | 5.11 | 5.56 | (0.29) | (0.79) | (1.08) | 31.01 | 21.34% | 66,374 | 0.43% | 1.57% |
12/31/16 | 24.76 | 0.44 | 2.37 | 2.81 | (0.43) | (0.61) | (1.04) | 26.53 | 11.48% | 66,343 | 0.43% | 1.76% |
Class II | | | | | | | | | | | | |
12/31/20 | $ 32.45 | $ 0.46 | $ 4.71 | $ 5.17 | $ (0.61) | $ (7.97) | $ (8.58) | $ 29.04 | 18.21% | $ 239,890 | 0.28% | 1.58% |
12/31/19 | 28.10 | 0.52 | 7.72 | 8.24 | (0.97) | (2.92) | (3.89) | 32.45 | 31.06% | 209,951 | 0.29% | 1.66% |
12/31/18 | 31.01 | 0.54 | (1.75) | (1.21) | (0.55) | (1.15) | (1.70) | 28.10 | (4.63%) | 159,638 | 0.28% | 1.72% |
12/31/17 | 26.55 | 0.50 | 5.10 | 5.60 | (0.35) | (0.79) | (1.14) | 31.01 | 21.50% | 186,674 | 0.28% | 1.72% |
12/31/16 | 24.80 | 0.48 | 2.36 | 2.84 | (0.48) | (0.61) | (1.09) | 26.55 | 11.62% | 175,525 | 0.28% | 1.91% |
Class III | | | | | | | | | | | | |
12/31/20 | $ 32.39 | $ 0.50 | $ 4.71 | $ 5.21 | $ (0.65) | $ (7.97) | $ (8.62) | $ 28.98 | 18.41% | $ 307,589 | 0.13% | 1.72% |
12/31/19 | 28.05 | 0.57 | 7.70 | 8.27 | (1.01) | (2.92) | (3.93) | 32.39 | 31.27% | 268,217 | 0.14% | 1.82% |
12/31/18 | 30.97 | 0.59 | (1.75) | (1.16) | (0.60) | (1.16) | (1.76) | 28.05 | (4.52%) | 391,891 | 0.13% | 1.87% |
12/31/17 | 26.51 | 0.54 | 5.10 | 5.64 | (0.39) | (0.79) | (1.18) | 30.97 | 21.69% | 440,242 | 0.13% | 1.87% |
12/31/16 | 24.78 | 0.52 | 2.34 | 2.86 | (0.52) | (0.61) | (1.13) | 26.51 | 11.69% | 279,941 | 0.13% | 2.05% |
Service Class I | | | | | | | | | | | |
12/31/20 | $ 31.35 | $ 0.33 | $ 4.52 | $ 4.85 | $ (0.47) | $ (7.97) | $ (8.44) | $ 27.76 | 17.74% | $ 44,361 | 0.68% | 1.18% |
12/31/19 | 27.24 | 0.38 | 7.48 | 7.86 | (0.83) | (2.92) | (3.75) | 31.35 | 30.56% | 45,967 | 0.69% | 1.26% |
12/31/18 | 30.13 | 0.40 | (1.70) | (1.30) | (0.43) | (1.16) | (1.59) | 27.24 | (5.04%) | 40,822 | 0.68% | 1.32% |
12/31/17 | 25.84 | 0.37 | 4.96 | 5.33 | (0.25) | (0.79) | (1.04) | 30.13 | 21.01% | 48,712 | 0.68% | 1.32% |
12/31/16 | 24.16 | 0.37 | 2.31 | 2.68 | (0.39) | (0.61) | (1.00) | 25.84 | 11.24% | 42,165 | 0.68% | 1.51% |
| | Year ended December 31 |
| | 2020 | 2019 | 2018 | 2017 | 2016 |
Portfolio turnover rate | 5% | 5% | 3% | 7% | 8% |
c | Per share amount calculated on the average shares method. |
m | Total return does not reflect expenses that apply at the separate account level or to related insurance products. Inclusion of these charges would reduce the total return figures for all periods shown. |
The accompanying notes are an integral part of the financial statements.
218
MML Series Investment Fund – Financial Statements (Continued) |
Financial Highlights (For a share outstanding throughout each period) |
MML Focused Equity Fund
| | | Income (loss) from investment
operations | Less distributions to shareholders | | | Ratios / Supplemental Data |
| | Net
asset
value,
beginning
of the
period | Net
investment
income
(loss)c,j | Net
realized
and
unrealized
gain (loss)
on
investments | Total
income
(loss) from
investment
operations | From net
investment
income | From net
realized
gain | Total
distributions | Net
asset
value,
end of
the
period | Total
returnm | Net
assets,
end of
the
period
(000’s) | Ratio of
expenses
to average
daily net
assets
before
expense
waivers | Ratio of
expenses
to average
daily net
assets
after
expense
waiversj | Net
investment
income
(loss) to
average
daily net
assets |
Class II | | | | | | | | | | | | |
12/31/20 | $ 6.77 | $ 0.07 | $ 0.76 | $ 0.83 | $ (0.05) | $ (0.30) | $ (0.35) | $ 7.25 | 12.76% | $ 277,370 | 0.87% | N/A | 1.10% |
12/31/19 | 5.33 | 0.07 | 1.53 | 1.60 | (0.02) | (0.14) | (0.16) | 6.77 | 30.15% | 297,347 | 0.89% | 0.88% | 1.11% |
12/31/18 | 12.69 | 0.11 | 0.66 | 0.77 | (0.37) | (7.76) | (8.13) | 5.33 | 1.18% | 48,276 | 0.95% | 0.87% | 1.25% |
12/31/17 | 13.20 | 0.27 | 2.35 | 2.62 | (0.36) | (2.77) | (3.13) | 12.69 | 21.99% | 57,382 | 0.94% | N/A | 2.00% |
12/31/16 | 12.15 | 0.13 | 1.96 | 2.09 | (0.20) | (0.84) | (1.04) | 13.20 | 17.96% | 128,990 | 0.90% | N/A | 1.11% |
Service Class I | | | | | | | | | | | | |
12/31/20 | $ 6.53 | $ 0.05 | $ 0.74 | $ 0.79 | $ (0.04) | $ (0.30) | $ (0.34) | $ 6.98 | 12.54% | $ 19,686 | 1.12% | N/A | 0.85% |
12/31/19 | 5.15 | 0.05 | 1.47 | 1.52 | (0.00)d | (0.14) | (0.14) | 6.53 | 29.73% | 18,439 | 1.15% | 1.13% | 0.90% |
12/31/18 | 12.52 | 0.09 | 0.66 | 0.75 | (0.36) | (7.76) | (8.12) | 5.15 | 0.99% | 10,980 | 1.20% | 1.12% | 1.01% |
12/31/17 | 13.11 | 0.18 | 2.37 | 2.55 | (0.37) | (2.77) | (3.14) | 12.52 | 21.61% | 9,981 | 1.19% | N/A | 1.39% |
12/31/16 | 12.06 | 0.10 | 1.95 | 2.05 | (0.16) | (0.84) | (1.00) | 13.11 | 17.74% | 6,829 | 1.15% | N/A | 0.87% |
| | Year ended December 31 |
| | 2020 | 2019 | 2018 | 2017 | 2016 |
Portfolio turnover rate | 36% | 36% | 64% | 108% | 37% |
c | Per share amount calculated on the average shares method. |
d | Amount is less than $0.005 per share. |
j | Computed after giving effect to an agreement by MML Advisers to waive certain fees and expenses of the Fund. |
m | Total return does not reflect expenses that apply at the separate account level or to related insurance products. Inclusion of these charges would reduce the total return figures for all periods shown. |
The accompanying notes are an integral part of the financial statements.
219
MML Series Investment Fund – Financial Statements (Continued) |
Financial Highlights (For a share outstanding throughout each period) |
MML Foreign Fund
| | | Income (loss) from investment
operations | Less distributions to shareholders | | | Ratios / Supplemental Data |
| | Net
asset
value,
beginning
of the
period | Net
investment
income
(loss)c,j | Net
realized
and
unrealized
gain (loss)
on
investments | Total
income
(loss) from
investment
operations | From net
investment
income | From net
realized
gains | Total
distributions | Net
asset
value,
end of
the
period | Total
returnm | Net
assets,
end of
the
period
(000’s) | Ratio of
expenses
to average
daily net
assets
before
expense
waivers | Ratio of
expenses
to average
daily net
assets
after
expense
waiversj | Net
investment
income
(loss) to
average
daily net
assets |
Initial Class | | | | | | | | | | | | |
12/31/20 | $ 10.10 | $ 0.14 | $ 0.37 | $ 0.51 | $ (0.27) | $ (0.32) | $ (0.59) | $ 10.02 | 5.93% | $ 266,506 | 0.92% | 0.88% | 1.61% |
12/31/19 | 9.25 | 0.26 | 0.92 | 1.18 | (0.18) | (0.15) | (0.33) | 10.10 | 13.17% | 307,367 | 0.94% | 0.89% | 2.69% |
12/31/18 | 11.25 | 0.20 | (1.95) | (1.75) | (0.25) | — | (0.25) | 9.25 | (15.90%) | 294,037 | 0.98% | 0.97% | 1.81% |
12/31/17 | 9.44 | 0.19 | 1.85 | 2.04 | (0.23) | — | (0.23) | 11.25 | 21.73% | 382,813 | 0.97% | N/A | 1.79% |
12/31/16 | 9.49 | 0.20 | (0.07) | 0.13 | (0.18) | — | (0.18) | 9.44 | 1.44% | 348,836 | 0.97% | N/A | 2.22% |
Service Class | | | | | | | | | | | | |
12/31/20 | $ 10.04 | $ 0.12 | $ 0.36 | $ 0.48 | $ (0.25) | $ (0.32) | $ (0.57) | $ 9.95 | 5.57% | $ 8,323 | 1.17% | 1.13% | 1.36% |
12/31/19 | 9.20 | 0.24 | 0.90 | 1.14 | (0.15) | (0.15) | (0.30) | 10.04 | 12.78% | 9,820 | 1.19% | 1.14% | 2.44% |
12/31/18 | 11.18 | 0.17 | (1.93) | (1.76) | (0.22) | — | (0.22) | 9.20 | (16.03%) | 9,324 | 1.23% | 1.22% | 1.57% |
12/31/17 | 9.38 | 0.16 | 1.84 | 2.00 | (0.20) | — | (0.20) | 11.18 | 21.45% | 11,488 | 1.22% | N/A | 1.53% |
12/31/16 | 9.43 | 0.18 | (0.07) | 0.11 | (0.16) | — | (0.16) | 9.38 | 1.18% | 10,231 | 1.22% | N/A | 2.02% |
| | Year ended December 31 |
| | 2020 | 2019 | 2018 | 2017 | 2016 |
Portfolio turnover rate | 106% | 43% | 18% | 15% | 19% |
c | Per share amount calculated on the average shares method. |
j | Computed after giving effect to an agreement by MML Advisers to waive certain fees and expenses of the Fund. |
m | Total return does not reflect expenses that apply at the separate account level or to related insurance products. Inclusion of these charges would reduce the total return figures for all periods shown. |
The accompanying notes are an integral part of the financial statements.
220
MML Series Investment Fund – Financial Statements (Continued) |
Financial Highlights (For a share outstanding throughout each period) |
MML Fundamental Equity Fund
| | | Income (loss) from investment
operations | Less distributions to shareholders | | | Ratios / Supplemental Data |
| | Net
asset
value,
beginning
of the
period | Net
investment
income
(loss)c,j | Net
realized
and
unrealized
gain (loss)
on
investments | Total
income
(loss) from
investment
operations | From net
investment
income | From net
realized
gains | Total
distributions | Net
asset
value,
end of
the
period | Total
returnm | Net
assets,
end of
the
period
(000’s) | Ratio of
expenses
to average
daily net
assets
before
expense
waivers | Ratio of
expenses
to average
daily net
assets
after
expense
waiversj | Net
investment
income
(loss) to
average
daily net
assets |
Class II | | | | | | | | | | | | |
12/31/20 | $ 10.02 | $ 0.07 | $ 1.85 | $ 1.92 | $ (0.00)d | $ (1.21) | $ (1.21) | $ 10.73 | 20.02% | $ 161,496 | 0.82% | 0.82%k | 0.73% |
12/31/19 | 9.37 | 0.01 | 2.92 | 2.93 | (0.06) | (2.22) | (2.28) | 10.02 | 33.74% | 101,937 | 0.87% | 0.87%l | 0.09% |
12/31/18 | 12.94 | 0.06 | 0.66 | 0.72 | (0.15) | (4.14) | (4.29) | 9.37 | 0.80% | 90,145 | 0.83% | 0.83%l | 0.50% |
12/31/17 | 11.42 | 0.11 | 2.92 | 3.03 | (0.13) | (1.38) | (1.51) | 12.94 | 27.67% | 120,666 | 0.84% | 0.84%l | 0.84% |
12/31/16 | 12.53 | 0.09 | 0.36 | 0.45 | (0.08) | (1.48) | (1.56) | 11.42 | 3.73% | 165,183 | 0.83% | 0.83%l | 0.79% |
Service Class I | | | | | | | | | | | | |
12/31/20 | $ 9.70 | $ 0.05 | $ 1.77 | $ 1.82 | $ — | $ (1.21) | $ (1.21) | $ 10.31 | 19.59% | $ 19,931 | 1.08% | 1.07% | 0.48% |
12/31/19 | 9.15 | (0.02) | 2.84 | 2.82 | (0.05) | (2.22) | (2.27) | 9.70 | 33.33% | 15,457 | 1.12% | 1.12%l | (0.16%) |
12/31/18 | 12.74 | 0.03 | 0.67 | 0.70 | (0.15) | (4.14) | (4.29) | 9.15 | 0.66% | 10,401 | 1.08% | 1.08%l | 0.27% |
12/31/17 | 11.29 | 0.07 | 2.89 | 2.96 | (0.13) | (1.38) | (1.51) | 12.74 | 27.32% | 6,875 | 1.09% | 1.09%l | 0.57% |
12/31/16 | 12.41 | 0.06 | 0.37 | 0.43 | (0.07) | (1.48) | (1.55) | 11.29 | 3.54% | 4,263 | 1.08% | 1.08%l | 0.54% |
| | Year ended December 31 |
| | 2020 | 2019 | 2018 | 2017 | 2016 |
Portfolio turnover rate | 113% | 129% | 61% | 40% | 49% |
c | Per share amount calculated on the average shares method. |
d | Amount is less than $0.005 per share. |
j | Computed after giving effect to an agreement by MML Advisers to waive certain fees and expenses of the Fund. |
k | Amount waived had no impact on the ratio of expenses to average daily net assets. |
l | Expenses incurred during the period fell under the expense cap. |
m | Total return does not reflect expenses that apply at the separate account level or to related insurance products. Inclusion of these charges would reduce the total return figures for all periods shown. |
The accompanying notes are an integral part of the financial statements.
221
MML Series Investment Fund – Financial Statements (Continued) |
Financial Highlights (For a share outstanding throughout each period) |
MML Fundamental Value Fund
| | | Income (loss) from investment
operations | Less distributions to shareholders | | | Ratios / Supplemental Data |
| | Net
asset
value,
beginning
of the
period | Net
investment
income
(loss)c,j | Net
realized
and
unrealized
gain (loss)
on
investments | Total
income
(loss) from
investment
operations | From net
investment
income | From net
realized
gains | Total
distributions | Net
asset
value,
end of
the
period | Total
returnm | Net
assets,
end of
the
period
(000’s) | Ratio of
expenses
to average
daily net
assets
before expense waivers | Ratio of
expenses
to average
daily net
assets
after
expense
waiversj | Net
investment
income
(loss) to
average
daily net
assets |
Class II | | | | | | | | | | | | |
12/31/20 | $ 13.09 | $ 0.19 | $ (0.08)aa | $ 0.11 | $ (0.15) | $ (1.43) | $ (1.58) | $ 11.62 | 2.67% | $ 178,953 | 0.80% | 0.78% | 1.71% |
12/31/19 | 12.38 | 0.18 | 2.40 | 2.58 | (0.27) | (1.60) | (1.87) | 13.09 | 22.79% | 193,994 | 0.81% | 0.79% | 1.35% |
12/31/18 | 15.42 | 0.26 | (1.63) | (1.37) | (0.25) | (1.42) | (1.67) | 12.38 | (10.34%) | 168,520 | 0.80% | 0.78% | 1.76% |
12/31/17 | 14.74 | 0.25 | 1.83 | 2.08 | (0.29) | (1.11) | (1.40) | 15.42 | 15.10% | 225,883 | 0.80% | 0.79% | 1.65% |
12/31/16 | 14.20 | 0.26 | 1.56 | 1.82 | (0.21) | (1.07) | (1.28) | 14.74 | 13.25% | 223,801 | 0.79% | N/A | 1.81% |
Service Class I | | | | | | | | | | | | |
12/31/20 | $ 12.83 | $ 0.16 | $ (0.09)aa | $ 0.07 | $ (0.12) | $ (1.43) | $ (1.55) | $ 11.35 | 2.37% | $ 15,956 | 1.05% | 1.03% | 1.47% |
12/31/19 | 12.17 | 0.14 | 2.36 | 2.50 | (0.24) | (1.60) | (1.84) | 12.83 | 22.49% | 16,173 | 1.06% | 1.04% | 1.10% |
12/31/18 | 15.20 | 0.22 | (1.60) | (1.38) | (0.23) | (1.42) | (1.65) | 12.17 | (10.56%) | 13,283 | 1.05% | 1.03% | 1.53% |
12/31/17 | 14.57 | 0.21 | 1.80 | 2.01 | (0.27) | (1.11) | (1.38) | 15.20 | 14.78% | 13,212 | 1.05% | 1.04% | 1.39% |
12/31/16 | 14.05 | 0.22 | 1.55 | 1.77 | (0.18) | (1.07) | (1.25) | 14.57 | 13.05% | 9,319 | 1.04% | N/A | 1.55% |
| | Year ended December 31 |
| | 2020 | 2019 | 2018 | 2017 | 2016 |
Portfolio turnover rate | 86% | 131% | 28% | 18% | 20% |
c | Per share amount calculated on the average shares method. |
j | Computed after giving effect to an agreement by MML Advisers to waive certain fees and expenses of the Fund. |
m | Total return does not reflect expenses that apply at the separate account level or to related insurance products. Inclusion of these charges would reduce the total return figures for all periods shown. |
aa | The amount shown for a share outstanding does not correspond with the aggregate net realized and unrealized gain (loss) for the period due to the timing of purchases and redemptions of Fund shares in relation to the fluctuating market values of the Fund. |
The accompanying notes are an integral part of the financial statements.
222
MML Series Investment Fund – Financial Statements (Continued) |
Financial Highlights (For a share outstanding throughout each period) |
MML Global Fund
| | | Income (loss) from investment
operations | Less distributions to shareholders | | | Ratios / Supplemental Data |
| | Net
asset
value,
beginning
of the
period | Net
investment
income
(loss)c | Net
realized
and
unrealized
gain (loss)
on
investments | Total
income
(loss) from
investment
operations | From net
investment
income | From net
realized
gains | Total
distributions | Net
asset
value,
end of
the
period | Total
returnm | Net
assets,
end of
the
period
(000’s) | Ratio of
expenses
to average
daily net
assets | Net
investment
income
(loss) to
average
daily net
assets |
Class I | | | | | | | | | | | |
12/31/20 | $ 12.86 | $ 0.11 | $ 1.61 | $ 1.72 | $ (0.14) | $ (0.48) | $ (0.62) | $ 13.96 | 14.02% | $ 361,660 | 0.80% | 0.88% |
12/31/19 | 10.25 | 0.15 | 2.94 | 3.09 | (0.08) | (0.40) | (0.48) | 12.86 | 30.59% | 411,174 | 0.79% | 1.23% |
12/31/18 | 13.04 | 0.15 | (1.16) | (1.01) | (0.15) | (1.63) | (1.78) | 10.25 | (9.53%) | 179,973 | 0.83% | 1.21% |
12/31/17 | 11.54 | 0.14 | 2.56 | 2.70 | (0.16) | (1.04) | (1.20) | 13.04 | 24.16% | 206,795 | 0.83% | 1.10% |
12/31/16 | 11.74 | 0.14 | 0.76 | 0.90 | (0.14) | (0.96) | (1.10) | 11.54 | 7.55% | 218,698 | 0.82% | 1.18% |
Class II | | | | | | | | | | | |
12/31/20 | $ 13.17 | $ 0.11 | $ 1.64 | $ 1.75 | $ (0.13) | $ (0.48) | $ (0.61) | $ 14.31 | 13.96% | $ 18,461 | 0.80% | 0.86% |
12/31/19 | 10.48 | 0.16 | 3.00 | 3.16 | (0.07) | (0.40) | (0.47) | 13.17 | 30.58% | 17,896 | 0.79% | 1.31% |
12/31/18 | 13.30 | 0.15 | (1.19) | (1.04) | (0.15) | (1.63) | (1.78) | 10.48 | (9.57%) | 14,950 | 0.83% | 1.21% |
12/31/17 | 11.74 | 0.14 | 2.62 | 2.76 | (0.16) | (1.04) | (1.20) | 13.30 | 24.30% | 18,082 | 0.83% | 1.09% |
12/31/16 | 11.93 | 0.14 | 0.77 | 0.91 | (0.14) | (0.96) | (1.10) | 11.74 | 7.54% | 15,757 | 0.82% | 1.17% |
Service Class I | | | | | | | | | | | |
12/31/20 | $ 12.69 | $ 0.07 | $ 1.59 | $ 1.66 | $ (0.11) | $ (0.48) | $ (0.59) | $ 13.76 | 13.70% | $ 18,086 | 1.05% | 0.60% |
12/31/19 | 10.11 | 0.13 | 2.89 | 3.02 | (0.04) | (0.40) | (0.44) | 12.69 | 30.28% | 17,108 | 1.04% | 1.06% |
12/31/18 | 12.90 | 0.12 | (1.16) | (1.04) | (0.12) | (1.63) | (1.75) | 10.11 | (9.84%) | 13,989 | 1.08% | 0.97% |
12/31/17 | 11.43 | 0.11 | 2.54 | 2.65 | (0.14) | (1.04) | (1.18) | 12.90 | 23.95% | 15,989 | 1.08% | 0.84% |
12/31/16 | 11.65 | 0.10 | 0.76 | 0.86 | (0.12) | (0.96) | (1.08) | 11.43 | 7.25% | 12,129 | 1.07% | 0.89% |
| | Year ended December 31 |
| | 2020 | 2019 | 2018 | 2017 | 2016 |
Portfolio turnover rate | 13% | 16% | 15% | 10% | 15% |
c | Per share amount calculated on the average shares method. |
m | Total return does not reflect expenses that apply at the separate account level or to related insurance products. Inclusion of these charges would reduce the total return figures for all periods shown. |
The accompanying notes are an integral part of the financial statements.
223
MML Series Investment Fund – Financial Statements (Continued) |
Financial Highlights (For a share outstanding throughout each period) |
MML Growth & Income Fund
| | | Income (loss) from investment
operations | Less distributions to shareholders | | | Ratios / Supplemental Data |
| | Net
asset
value,
beginning
of the
period | Net
investment
income
(loss)c | Net
realized
and
unrealized
gain (loss)
on
investments | Total
income
(loss) from
investment
operations | From net
investment
income | From net
realized
gains | Total
distributions | Net
asset
value,
end of
the
period | Total
returnm | Net
assets,
end of
the
period
(000’s) | Ratio of
expenses
to average
daily net
assets | Net
investment
income
(loss) to
average
daily net
assets |
Initial Class | | | | | | | | | | | |
12/31/20 | $ 19.43 | $ 0.19 | $ 2.50 | $ 2.69 | $ (0.18) | $ (1.41) | $ (1.59) | $ 20.53 | 14.51% | $105,573 | 0.57% | 1.03% |
12/31/19 | 16.35 | 0.19 | 4.86 | 5.05 | (0.19) | (1.78) | (1.97) | 19.43 | 32.10% | 106,949 | 0.57% | 1.02% |
12/31/18 | 17.39 | 0.19 | (1.07) | (0.88) | (0.16) | — | (0.16) | 16.35 | (5.20%) | 92,893 | 0.56% | 1.07% |
12/31/17 | 14.19 | 0.16 | 3.19 | 3.35 | (0.15) | — | (0.15) | 17.39 | 23.70% | 111,830 | 0.56% | 1.02% |
12/31/16 | 13.18 | 0.15 | 1.00 | 1.15 | (0.14) | — | (0.14) | 14.19 | 8.77% | 102,858 | 0.56% | 1.10% |
Service Class | | | | | | | | | | | |
12/31/20 | $ 19.26 | $ 0.14 | $ 2.47 | $ 2.61 | $ (0.13) | $ (1.41) | $ (1.54) | $ 20.33 | 14.24% | $ 49,786 | 0.82% | 0.78% |
12/31/19 | 16.22 | 0.14 | 4.83 | 4.97 | (0.15) | (1.78) | (1.93) | 19.26 | 31.82% | 46,002 | 0.82% | 0.77% |
12/31/18 | 17.27 | 0.15 | (1.08) | (0.93) | (0.12) | — | (0.12) | 16.22 | (5.46%) | 33,821 | 0.81% | 0.83% |
12/31/17 | 14.10 | 0.12 | 3.17 | 3.29 | (0.12) | — | (0.12) | 17.27 | 23.41% | 30,610 | 0.81% | 0.77% |
12/31/16 | 13.10 | 0.11 | 1.00 | 1.11 | (0.11) | — | (0.11) | 14.10 | 8.50% | 23,197 | 0.81% | 0.85% |
| | Year ended December 31 |
| | 2020 | 2019 | 2018 | 2017 | 2016 |
Portfolio turnover rate | 17% | 16% | 15% | 12% | 17% |
c | Per share amount calculated on the average shares method. |
m | Total return does not reflect expenses that apply at the separate account level or to related insurance products. Inclusion of these charges would reduce the total return figures for all periods shown. |
The accompanying notes are an integral part of the financial statements.
224
MML Series Investment Fund – Financial Statements (Continued) |
Financial Highlights (For a share outstanding throughout each period) |
MML Income & Growth Fund
| | | Income (loss) from investment
operations | Less distributions to shareholders | | | Ratios / Supplemental Data |
| | Net
asset
value,
beginning
of the
period | Net
investment
income
(loss)c | Net
realized
and
unrealized
gain (loss)
on
investments | Total
income
(loss) from
investment
operations | From net
investment
income | From net
realized
gains | Total
distributions | Net
asset
value,
end of
the
period | Total
returnm | Net
assets,
end of
the
period
(000’s) | Ratio of
expenses
to average
daily net
assets | Net
investment
income
(loss) to
average
daily net
assets |
Initial Class | | | | | | | | | | | |
12/31/20 | $ 9.94 | $ 0.15 | $ 0.12aa | $ 0.27 | $ (0.18) | $ (0.03) | $ (0.21) | $ 10.00 | 3.03% | $241,441 | 0.70% | 1.75% |
12/31/19 | 8.49 | 0.19 | 1.82 | 2.01 | (0.19) | (0.37) | (0.56) | 9.94 | 24.43% | 274,290 | 0.69% | 2.00% |
12/31/18 | 12.72 | 0.21 | (1.25) | (1.04) | (0.22) | (2.97) | (3.19) | 8.49 | (11.68%) | 240,456 | 0.70% | 1.86% |
12/31/17 | 11.86 | 0.22 | 1.74 | 1.96 | (0.21) | (0.89) | (1.10) | 12.72 | 17.43% | 289,310 | 0.70% | 1.80% |
12/31/16 | 11.35 | 0.22 | 1.55 | 1.77 | (0.21) | (1.05) | (1.26) | 11.86 | 16.40% | 257,874 | 0.69% | 1.97% |
Service Class | | | | | | | | | | | |
12/31/20 | $ 9.78 | $ 0.13 | $ 0.11aa | $ 0.24 | $ (0.15) | $ (0.03) | $ (0.18) | $ 9.84 | 2.79% | $ 26,998 | 0.95% | 1.50% |
12/31/19 | 8.36 | 0.16 | 1.80 | 1.96 | (0.17) | (0.37) | (0.54) | 9.78 | 24.14% | 29,436 | 0.94% | 1.75% |
12/31/18 | 12.58 | 0.18 | (1.23) | (1.05) | (0.20) | (2.97) | (3.17) | 8.36 | (11.94%) | 24,440 | 0.95% | 1.62% |
12/31/17 | 11.74 | 0.19 | 1.73 | 1.92 | (0.19) | (0.89) | (1.08) | 12.58 | 17.21% | 27,683 | 0.95% | 1.55% |
12/31/16 | 11.25 | 0.19 | 1.54 | 1.73 | (0.19) | (1.05) | (1.24) | 11.74 | 16.10% | 20,626 | 0.94% | 1.71% |
| | Year ended December 31 |
| | 2020 | 2019 | 2018 | 2017 | 2016 |
Portfolio turnover rate | 49% | 43% | 30% | 110% | 30% |
c | Per share amount calculated on the average shares method. |
m | Total return does not reflect expenses that apply at the separate account level or to related insurance products. Inclusion of these charges would reduce the total return figures for all periods shown. |
aa | The amount shown for a share outstanding does not correspond with the aggregate net realized and unrealized gain (loss) for the period due to the timing of purchases and redemptions of Fund shares in relation to the fluctuating market values of the Fund. |
The accompanying notes are an integral part of the financial statements.
225
MML Series Investment Fund – Financial Statements (Continued) |
Financial Highlights (For a share outstanding throughout each period) |
MML International Equity Fund
| | | Income (loss) from investment
operations | Less distributions to shareholders | | | Ratios / Supplemental Data |
| | Net
asset
value,
beginning
of the
period | Net
investment
income
(loss)c,j | Net
realized
and
unrealized
gain (loss)
on
investments | Total
income
(loss) from
investment
operations | From net
investment
income | From net
realized
gains | Total
distributions | Net
asset
value,
end of
the
period | Total
returnm | Net
assets,
end of
the
period
(000’s) | Ratio of
expenses
to average
daily net
assets
before
expense
waivers | Ratio of
expenses
to average
daily net
assets
after
expense
waiversj | Net
investment
income
(loss) to
average
daily net
assets |
Class II | | | | | | | | | | | | |
12/31/20 | $ 10.10 | $ 0.03 | $ 0.38 | $ 0.41 | $ (0.28) | $ (0.25) | $ (0.53) | $ 9.98 | 5.37% | $159,694 | 1.07% | 1.00% | 0.39% |
12/31/19 | 8.91 | 0.29 | 1.74 | 2.03 | (0.19) | (0.65) | (0.84) | 10.10 | 24.63% | 178,397 | 1.05% | 1.00% | 3.02% |
12/31/18 | 11.97 | 0.21 | (3.02) | (2.81) | (0.17) | (0.08) | (0.25) | 8.91 | (23.79%) | 154,540 | 1.12% | 1.00% | 1.91% |
12/31/17 | 9.33 | 0.18 | 2.64 | 2.82 | (0.18) | — | (0.18) | 11.97 | 30.35% | 187,213 | 1.09% | 1.00% | 1.62% |
12/31/16 | 8.81 | 0.15 | 0.56 | 0.71 | (0.17) | (0.02) | (0.19) | 9.33 | 8.27% | 150,753 | 1.07% | 1.00% | 1.70% |
Service Class I | | | | | | | | | | | | |
12/31/20 | $ 10.01 | $ 0.01 | $ 0.37 | $ 0.38 | $ (0.26) | $ (0.25) | $ (0.51) | $ 9.88 | 5.07% | $ 7,021 | 1.32% | 1.25% | 0.10% |
12/31/19 | 8.84 | 0.26 | 1.73 | 1.99 | (0.17) | (0.65) | (0.82) | 10.01 | 24.35% | 6,821 | 1.30% | 1.25% | 2.70% |
12/31/18 | 11.90 | 0.18 | (2.99) | (2.81) | (0.17) | (0.08) | (0.25) | 8.84 | (23.98%) | 4,767 | 1.37% | 1.25% | 1.64% |
12/31/17 | 9.29 | 0.11 | 2.67 | 2.78 | (0.17) | — | (0.17) | 11.90 | 30.05% | 4,000 | 1.34% | 1.25% | 0.95% |
12/31/16 | 8.78 | 0.13 | 0.56 | 0.69 | (0.16) | (0.02) | (0.18) | 9.29 | 7.97% | 1,063 | 1.32% | 1.25% | 1.50% |
| | Year ended December 31 |
| | 2020 | 2019 | 2018 | 2017 | 2016 |
Portfolio turnover rate | 49% | 37% | 43% | 45% | 50% |
c | Per share amount calculated on the average shares method. |
j | Computed after giving effect to an agreement by MML Advisers to waive certain fees and expenses of the Fund. |
m | Total return does not reflect expenses that apply at the separate account level or to related insurance products. Inclusion of these charges would reduce the total return figures for all periods shown. |
The accompanying notes are an integral part of the financial statements.
226
MML Series Investment Fund – Financial Statements (Continued) |
Financial Highlights (For a share outstanding throughout each period) |
MML Large Cap Growth Fund
| | | Income (loss) from investment
operations | Less distributions to shareholders | | | Ratios / Supplemental Data |
| | Net
asset
value,
beginning
of the
period | Net
investment
income
(loss)c | Net
realized
and
unrealized
gain (loss)
on
investments | Total
income
(loss) from
investment
operations | From net
investment
income | From net
realized
gains | Total
distributions | Net
asset
value,
end of
the
period | Total
returnm | Net
assets,
end of
the
period
(000’s) | Ratio of
expenses
to average
daily net
assets | Net
investment
income
(loss) to
average
daily net
assets |
Initial Class | | | | | | | | | | | |
12/31/20 | $ 11.09 | $ 0.01 | $ 3.49 | $ 3.50 | $ (0.04) | $ (0.57) | $ (0.61) | $ 13.98 | 31.78% | $120,464 | 0.72% | 0.10% |
12/31/19 | 9.68 | 0.05 | 2.89 | 2.94 | (0.07) | (1.46) | (1.53) | 11.09 | 31.99% | 95,272 | 0.74% | 0.45% |
12/31/18 | 10.69 | 0.06 | (0.19) | (0.13) | (0.07) | (0.81) | (0.88) | 9.68 | (2.26%) | 83,211 | 0.72% | 0.56% |
12/31/17 | 10.63 | 0.07 | 3.23 | 3.30 | (0.05) | (3.19) | (3.24) | 10.69 | 33.51% | 106,989 | 0.73% | 0.58% |
12/31/16 | 11.70 | 0.03 | (0.06) | (0.03) | (0.01) | (1.03) | (1.04) | 10.63 | (0.38%) | 103,315 | 0.70% | 0.24% |
Service Class | | | | | | | | | | | |
12/31/20 | $ 10.66 | $ (0.02)bb | $ 3.36 | $ 3.34 | $ (0.02) | $ (0.57) | $ (0.59) | $ 13.41 | 31.53% | $ 22,226 | 0.97% | (0.15%) |
12/31/19 | 9.36 | 0.02 | 2.79 | 2.81 | (0.05) | (1.46) | (1.51) | 10.66 | 31.66% | 16,394 | 0.99% | 0.19% |
12/31/18 | 10.37 | 0.03 | (0.17) | (0.14) | (0.06) | (0.81) | (0.87) | 9.36 | (2.46%) | 10,591 | 0.97% | 0.30% |
12/31/17 | 10.41 | 0.03 | 3.15 | 3.18 | (0.03) | (3.19) | (3.22) | 10.37 | 33.00% | 7,510 | 0.98% | 0.29% |
12/31/16 | 11.48 | (0.00)d | (0.04) | (0.04) | — | (1.03) | (1.03) | 10.41 | (0.52%) | 3,604 | 0.95% | (0.02%) |
| | Year ended December 31 |
| | 2020 | 2019 | 2018 | 2017 | 2016 |
Portfolio turnover rate | 32% | 11% | 16% | 3% | 134% |
c | Per share amount calculated on the average shares method. |
d | Amount is less than $0.005 per share. |
m | Total return does not reflect expenses that apply at the separate account level or to related insurance products. Inclusion of these charges would reduce the total return figures for all periods shown. |
bb | Net investment income per share is not in line with the total net investment income shown on the Statement of Operations due to differing class-specific expense arrangements. |
The accompanying notes are an integral part of the financial statements.
227
MML Series Investment Fund – Financial Statements (Continued) |
Financial Highlights (For a share outstanding throughout each period) |
MML Managed Volatility Fund
| | | Income (loss) from investment
operations | Less distributions to shareholders | | | Ratios / Supplemental Data |
| | Net
asset
value,
beginning
of the
period | Net
investment
income
(loss)c | Net
realized
and
unrealized
gain (loss)
on
investments | Total
income
(loss) from
investment
operations | From net
investment
income | From net
realized
gains | Total
distributions | Net
asset
value,
end of
the
period | Total
returnm | Net
assets,
end of
the
period
(000’s) | Ratio of
expenses
to average
daily net
assets | Net
investment
income
(loss) to
average
daily net
assets |
Initial Class | | | | | | | | | | | |
12/31/20 | $ 13.10 | $ 0.10 | $ 0.76 | $ 0.86 | $ (0.18) | $ — | $ (0.18) | $ 13.78 | 6.68% | $116,694 | 1.06% | 0.78% |
12/31/19 | 11.90 | 0.13 | 1.28 | 1.41 | (0.21) | — | (0.21) | 13.10 | 11.90% | 124,549 | 0.97% | 1.05% |
12/31/18 | 12.63 | 0.12 | (0.69) | (0.57) | (0.16) | — | (0.16) | 11.90 | (4.69%) | 121,635 | 0.96% | 0.99% |
12/31/17 | 11.74 | 0.14 | 0.91 | 1.05 | (0.16) | — | (0.16) | 12.63 | 9.03% | 150,737 | 0.90% | 1.13% |
12/31/16 | 14.27 | 0.17 | 0.31 | 0.48 | (0.26) | (2.75) | (3.01) | 11.74 | 3.69% | 151,537 | 0.91% | 1.29% |
Service Class | | | | | | | | | | | |
12/31/20 | $ 12.99 | $ 0.07 | $ 0.76 | $ 0.83 | $ (0.15) | $ — | $ (0.15) | $ 13.67 | 6.42% | $ 26,901 | 1.31% | 0.53% |
12/31/19 | 11.80 | 0.10 | 1.26 | 1.36 | (0.17) | — | (0.17) | 12.99 | 11.62% | 30,588 | 1.22% | 0.81% |
12/31/18 | 12.53 | 0.09 | (0.70) | (0.61) | (0.12) | — | (0.12) | 11.80 | (4.93%) | 28,963 | 1.21% | 0.74% |
12/31/17 | 11.64 | 0.11 | 0.91 | 1.02 | (0.13) | — | (0.13) | 12.53 | 8.76% | 33,698 | 1.15% | 0.88% |
12/31/16 | 14.18 | 0.14 | 0.29 | 0.43 | (0.22) | (2.75) | (2.97) | 11.64 | 3.42% | 32,569 | 1.16% | 1.04% |
| | Year ended December 31 |
| | 2020 | 2019 | 2018 | 2017 | 2016 |
Portfolio turnover rate | 20% | 2% | 5% | 2% | 4% |
c | Per share amount calculated on the average shares method. |
m | Total return does not reflect expenses that apply at the separate account level or to related insurance products. Inclusion of these charges would reduce the total return figures for all periods shown. |
The accompanying notes are an integral part of the financial statements.
228
MML Series Investment Fund – Financial Statements (Continued) |
Financial Highlights (For a share outstanding throughout each period) |
MML Mid Cap Growth Fund
| | | Income (loss) from investment
operations | Less distributions to shareholders | | | Ratios / Supplemental Data |
| | Net
asset
value,
beginning
of the
period | Net
investment
income
(loss)c | Net
realized
and
unrealized
gain (loss)
on
investments | Total
income
(loss) from
investment
operations | From net
investment
income | From net
realized
gains | Total
distributions | Net
asset
value,
end of
the
period | Total
returnm | Net
assets,
end of
the
period
(000’s) | Ratio of
expenses
to average
daily net
assets | Net
investment
income
(loss) to
average
daily net
assets |
Initial Class | | | | | | | | | | | |
12/31/20 | $ 15.88 | $ (0.03) | $ 3.83 | $ 3.80 | $ (0.01) | $ (1.57) | $ (1.58) | $ 18.10 | 25.57% | $ 434,830 | 0.81% | (0.19%) |
12/31/19 | 13.94 | 0.02 | 4.17 | 4.19 | (0.00)d | (2.25) | (2.25) | 15.88 | 31.30% | 407,351 | 0.81% | 0.12% |
12/31/18 | 16.19 | 0.01 | (0.07) | (0.06) | — | (2.19) | (2.19) | 13.94 | (2.17%) | 328,715 | 0.81% | 0.07% |
12/31/17 | 14.35 | (0.01) | 3.45 | 3.44 | (0.01) | (1.59) | (1.60) | 16.19 | 24.81% | 382,666 | 0.81% | (0.08%) |
12/31/16 | 15.50 | (0.00)d | 0.97 | 0.97 | — | (2.12) | (2.12) | 14.35 | 6.29% | 352,754 | 0.81% | (0.02%) |
Service Class | | | | | | | | | | | |
12/31/20 | $ 15.10 | $ (0.06) | $ 3.62 | $ 3.56 | $ — | $ (1.57) | $ (1.57) | $ 17.09 | 25.25% | $ 117,808 | 1.06% | (0.44%) |
12/31/19 | 13.37 | (0.02) | 4.00 | 3.98 | — | (2.25) | (2.25) | 15.10 | 31.01% | 108,793 | 1.06% | (0.13%) |
12/31/18 | 15.65 | (0.03) | (0.06) | (0.09) | — | (2.19) | (2.19) | 13.37 | (2.45%) | 88,952 | 1.06% | (0.18%) |
12/31/17 | 13.95 | (0.05) | 3.34 | 3.29 | — | (1.59) | (1.59) | 15.65 | 24.47% | 91,145 | 1.06% | (0.33%) |
12/31/16 | 15.16 | (0.04) | 0.95 | 0.91 | — | (2.12) | (2.12) | 13.95 | 6.02% | 71,227 | 1.06% | (0.27%) |
| | Year ended December 31 |
| | 2020 | 2019 | 2018 | 2017 | 2016 |
Portfolio turnover rate | 66% | 28% | 26% | 28% | 29% |
c | Per share amount calculated on the average shares method. |
d | Amount is less than $0.005 per share. |
m | Total return does not reflect expenses that apply at the separate account level or to related insurance products. Inclusion of these charges would reduce the total return figures for all periods shown. |
The accompanying notes are an integral part of the financial statements.
229
MML Series Investment Fund – Financial Statements (Continued) |
Financial Highlights (For a share outstanding throughout each period) |
MML Mid Cap Value Fund
| | | Income (loss) from investment
operations | Less distributions to shareholders | | | Ratios / Supplemental Data |
| | Net
asset
value,
beginning
of the
period | Net
investment
income
(loss)c | Net
realized
and
unrealized
gain (loss)
on
investments | Total
income
(loss) from
investment
operations | From net
investment
income | From net
realized
gains | Total
distributions | Net
asset
value,
end of
the
period | Total
returnm | Net
assets,
end of
the
period
(000’s) | Ratio of
expenses
to average
daily net
assets | Net
investment
income
(loss) to
average
daily net
assets |
Initial Class | | | | | | | | | | | |
12/31/20 | $ 10.60 | $ 0.15 | $ 0.01 | $ 0.16 | $ (0.17) | $ — | $ (0.17) | $ 10.59 | 1.71% | $ 348,614 | 0.89% | 1.62% |
12/31/19 | 9.35 | 0.17 | 2.37 | 2.54 | (0.18) | (1.11) | (1.29) | 10.60 | 29.13% | 389,141 | 0.88% | 1.65% |
12/31/18 | 12.14 | 0.15 | (1.48) | (1.33) | (0.19) | (1.27) | (1.46) | 9.35 | (12.99%) | 343,432 | 0.88% | 1.30% |
12/31/17 | 11.79 | 0.20 | 1.09 | 1.29 | (0.19) | (0.75) | (0.94) | 12.14 | 11.70% | 438,601 | 0.88% | 1.69% |
12/31/16 | 10.74 | 0.17 | 2.22 | 2.39 | (0.19) | (1.15) | (1.34) | 11.79 | 23.23% | 433,046 | 0.88% | 1.55% |
Service Class | | | | | | | | | | | |
12/31/20 | $ 10.39 | $ 0.13 | $ 0.00d | $ 0.13 | $ (0.14) | $ — | $ (0.14) | $ 10.38 | 1.48% | $ 51,269 | 1.14% | 1.37% |
12/31/19 | 9.18 | 0.14 | 2.33 | 2.47 | (0.15) | (1.11) | (1.26) | 10.39 | 28.90% | 53,223 | 1.13% | 1.40% |
12/31/18 | 11.96 | 0.12 | (1.47) | (1.35) | (0.16) | (1.27) | (1.43) | 9.18 | (13.31%) | 43,275 | 1.13% | 1.06% |
12/31/17 | 11.63 | 0.17 | 1.08 | 1.25 | (0.17) | (0.75) | (0.92) | 11.96 | 11.46% | 49,723 | 1.13% | 1.46% |
12/31/16 | 10.62 | 0.15 | 2.18 | 2.33 | (0.17) | (1.15) | (1.32) | 11.63 | 22.86% | 44,148 | 1.13% | 1.35% |
| | Year ended December 31 |
| | 2020 | 2019 | 2018 | 2017 | 2016 |
Portfolio turnover rate | 74% | 39% | 59% | 42% | 52% |
c | Per share amount calculated on the average shares method. |
d | Amount is less than $0.005 per share. |
m | Total return does not reflect expenses that apply at the separate account level or to related insurance products. Inclusion of these charges would reduce the total return figures for all periods shown. |
The accompanying notes are an integral part of the financial statements.
230
MML Series Investment Fund – Financial Statements (Continued) |
Financial Highlights (For a share outstanding throughout each period) |
MML Small Cap Growth Equity Fund
| | | Income (loss) from investment
operations | Less distributions
to shareholders | | | Ratios / Supplemental Data |
| | Net
asset
value,
beginning
of the
period | Net
investment
income
(loss)c,j | Net
realized
and
unrealized
gain (loss)
on
investments | Total
income
(loss) from
investment
operations | From net
realized
gains | Total
distributions | Net
asset
value,
end of
the
period | Total
returnm | Net
assets,
end of
the
period
(000’s) | Ratio of
expenses
to average
daily net
assets
before
expense
waivers | Ratio of
expenses
to average
daily net
assets
after
expense
waiversj | Net
investment
income
(loss) to
average
daily net
assets |
Initial Class | | | | | | | | | | | |
12/31/20 | $ 14.13 | $ (0.04) | $ 4.55 | $ 4.51 | $ (1.78) | $ (1.78) | $ 16.86 | 35.62% | $180,047 | 1.11% | 1.08% | (0.27%) |
12/31/19 | 12.82 | (0.01) | 4.11 | 4.10 | (2.79) | (2.79) | 14.13 | 34.32% | 170,426 | 1.11% | 1.09% | (0.06%) |
12/31/18 | 14.98 | (0.03) | (0.32) | (0.35) | (1.81) | (1.81) | 12.82 | (4.87%) | 151,854 | 1.09% | 1.07% | (0.17%) |
12/31/17 | 12.69 | (0.03) | 2.87 | 2.84 | (0.55) | (0.55) | 14.98 | 22.81% | 198,404 | 1.09% | 1.09%k | (0.21%) |
12/31/16 | 13.51 | 0.00d | 1.59 | 1.59 | (2.41) | (2.41) | 12.69 | 12.74% | 191,245 | 1.10% | N/A | 0.01% |
Service Class | | | | | | | | | | | |
12/31/20 | $ 13.14 | $ (0.06) | $ 4.18 | $ 4.12 | $ (1.78) | $ (1.78) | $ 15.48 | 35.29% | $ 31,165 | 1.36% | 1.33% | (0.52%) |
12/31/19 | 12.11 | (0.04) | 3.86 | 3.82 | (2.79) | (2.79) | 13.14 | 33.99% | 26,026 | 1.36% | 1.34% | (0.30%) |
12/31/18 | 14.27 | (0.06) | (0.29) | (0.35) | (1.81) | (1.81) | 12.11 | (5.11%) | 19,281 | 1.34% | 1.32% | (0.39%) |
12/31/17 | 12.14 | (0.06) | 2.74 | 2.68 | (0.55) | (0.55) | 14.27 | 22.51% | 16,124 | 1.35% | 1.34% | (0.45%) |
12/31/16 | 13.05 | (0.03) | 1.53 | 1.50 | (2.41) | (2.41) | 12.14 | 12.46% | 12,969 | 1.35% | N/A | (0.23%) |
| | Year ended December 31 |
| | 2020 | 2019 | 2018 | 2017 | 2016 |
Portfolio turnover rate | 79% | 63% | 76% | 74% | 105% |
c | Per share amount calculated on the average shares method. |
d | Amount is less than $0.005 per share. |
j | Computed after giving effect to an agreement by MML Advisers to waive certain fees and expenses of the Fund. |
k | Amount waived had no impact on the ratio of expenses to average daily net assets. |
m | Total return does not reflect expenses that apply at the separate account level or to related insurance products. Inclusion of these charges would reduce the total return figures for all periods shown. |
The accompanying notes are an integral part of the financial statements.
231
MML Series Investment Fund – Financial Statements (Continued) |
Financial Highlights (For a share outstanding throughout each period) |
MML Small Company Value Fund
| | | Income (loss) from investment
operations | Less distributions to shareholders | | | Ratios / Supplemental Data |
| | Net
asset
value,
beginning
of the
period | Net
investment
income
(loss)c,j | Net
realized
and
unrealized
gain (loss)
on
investments | Total
income
(loss) from
investment
operations | From net
investment
income | From net
realized
gains | Total
distributions | Net
asset
value,
end of
the
period | Total
returnm | Net
assets,
end of
the
period
(000’s) | Ratio of
expenses
to average
daily net
assets
before
expense
waivers | Ratio of
expenses
to average
daily net
assets
after
expense
waiversj | Net
investment
income
(loss) to
average
daily net
assets |
Class II | | | | | | | | | | | | |
12/31/20 | $ 14.75 | $ 0.04 | $ 1.15 | $ 1.19 | $ (0.03) | $ (0.66) | $ (0.69) | $ 15.25 | 9.16% | $ 65,955 | 1.06% | 1.01% | 0.33% |
12/31/19 | 13.86 | 0.04 | 3.20 | 3.24 | (0.04) | (2.31) | (2.35) | 14.75 | 25.54% | 74,855 | 1.06% | 1.01% | 0.25% |
12/31/18 | 16.90 | 0.05 | (2.01) | (1.96) | (0.06) | (1.02) | (1.08) | 13.86 | (12.94%) | 66,976 | 1.02% | 0.97% | 0.30% |
12/31/17 | 17.23 | 0.05 | 1.73 | 1.78 | (0.10) | (2.01) | (2.11) | 16.90 | 11.69% | 89,256 | 1.02% | 0.97% | 0.30% |
12/31/16 | 14.88 | 0.10 | 4.44 | 4.54 | (0.10) | (2.09) | (2.19) | 17.23 | 32.46% | 88,729 | 1.02% | 0.97% | 0.66% |
Service Class I | | | | | | | | | | | | |
12/31/20 | $ 14.21 | $ 0.01 | $ 1.11 | $ 1.12 | $ (0.01) | $ (0.66) | $ (0.67) | $ 14.66 | 8.92% | $ 26,467 | 1.31% | 1.26% | 0.07% |
12/31/19 | 13.43 | 0.00d | 3.10 | 3.10 | (0.01) | (2.31) | (2.32) | 14.21 | 25.26% | 25,636 | 1.31% | 1.26% | 0.01% |
12/31/18 | 16.43 | 0.01 | (1.96) | (1.95) | (0.03) | (1.02) | (1.05) | 13.43 | (13.19%) | 19,861 | 1.27% | 1.22% | 0.06% |
12/31/17 | 16.83 | 0.01 | 1.68 | 1.69 | (0.08) | (2.01) | (2.09) | 16.43 | 11.42% | 20,671 | 1.27% | 1.22% | 0.06% |
12/31/16 | 14.58 | 0.07 | 4.34 | 4.41 | (0.07) | (2.09) | (2.16) | 16.83 | 32.16% | 15,465 | 1.27% | 1.22% | 0.44% |
| | Year ended December 31 |
| | 2020 | 2019 | 2018 | 2017 | 2016 |
Portfolio turnover rate | 29% | 24% | 22% | 14% | 23% |
c | Per share amount calculated on the average shares method. |
d | Amount is less than $0.005 per share. |
j | Computed after giving effect to an agreement by MML Advisers to waive certain fees and expenses of the Fund. |
m | Total return does not reflect expenses that apply at the separate account level or to related insurance products. Inclusion of these charges would reduce the total return figures for all periods shown. |
The accompanying notes are an integral part of the financial statements.
232
MML Series Investment Fund – Financial Statements (Continued) |
Financial Highlights (For a share outstanding throughout each period) |
MML Small/Mid Cap Value Fund
| | | Income (loss) from investment
operations | Less distributions to shareholders | | | Ratios / Supplemental Data |
| | Net
asset
value,
beginning
of the
period | Net
investment
income
(loss)c | Net
realized
and
unrealized
gain (loss)
on
investments | Total
income
(loss) from
investment
operations | From net
investment
income | From net
realized
gains | Total
distributions | Net
asset
value,
end of
the
period | Total
returnm | Net
assets,
end of
the
period
(000’s) | Ratio of
expenses
to average
daily net
assets | Net
investment
income
(loss) to
average
daily net
assets |
Initial Class | | | | | | | | | | | |
12/31/20 | $ 11.06 | $ 0.09 | $ 0.30 | $ 0.39 | $ (0.10) | $ (0.41) | $ (0.51) | $ 10.94 | 4.65% | $164,145 | 0.81% | 0.98% |
12/31/19 | 10.61 | 0.12 | 1.83 | 1.95 | (0.07) | (1.43) | (1.50) | 11.06 | 20.39% | 179,503 | 0.81% | 1.04% |
12/31/18 | 13.99 | 0.09 | (1.87) | (1.78) | (0.07) | (1.53) | (1.60) | 10.61 | (15.00%) | 163,607 | 0.80% | 0.63% |
12/31/17 | 13.23 | 0.06 | 1.60 | 1.66 | (0.07) | (0.83) | (0.90) | 13.99 | 13.44% | 210,030 | 0.80% | 0.47% |
12/31/16 | 11.34 | 0.06 | 2.70 | 2.76 | (0.07) | (0.80) | (0.87) | 13.23 | 25.10% | 211,849 | 0.79% | 0.51% |
Service Class | | | | | | | | | | | |
12/31/20 | $ 10.92 | $ 0.07 | $ 0.28 | $ 0.35 | $ (0.07) | $ (0.41) | $ (0.48) | $ 10.79 | 4.32% | $ 22,302 | 1.06% | 0.73% |
12/31/19 | 10.50 | 0.09 | 1.80 | 1.89 | (0.04) | (1.43) | (1.47) | 10.92 | 19.98% | 23,295 | 1.06% | 0.80% |
12/31/18 | 13.85 | 0.05 | (1.83) | (1.78) | (0.04) | (1.53) | (1.57) | 10.50 | (15.12%) | 19,189 | 1.05% | 0.39% |
12/31/17 | 13.12 | 0.03 | 1.57 | 1.60 | (0.04) | (0.83) | (0.87) | 13.85 | 13.08% | 22,386 | 1.05% | 0.23% |
12/31/16 | 11.25 | 0.03 | 2.68 | 2.71 | (0.04) | (0.80) | (0.84) | 13.12 | 24.83% | 19,563 | 1.04% | 0.26% |
| | Year ended December 31 |
| | 2020 | 2019 | 2018 | 2017 | 2016 |
Portfolio turnover rate | 60% | 35% | 38% | 34% | 58% |
c | Per share amount calculated on the average shares method. |
m | Total return does not reflect expenses that apply at the separate account level or to related insurance products. Inclusion of these charges would reduce the total return figures for all periods shown. |
The accompanying notes are an integral part of the financial statements.
233
MML Series Investment Fund – Financial Statements (Continued) |
Financial Highlights (For a share outstanding throughout each period) |
MML Total Return Bond Fund
| | | Income (loss) from investment
operations | Less distributions to shareholders | | | Ratios / Supplemental Data |
| | Net
asset
value,
beginning
of the
period | Net
investment
income
(loss)c,j | Net
realized
and
unrealized
gain (loss)
on
investments | Total
income
(loss) from
investment
operations | From net
investment
income | From net
realized
gains | Total
distributions | Net
asset
value,
end of
the
period | Total
returnm | Net
assets,
end of
the
period
(000’s) | Ratio of
expenses
to average
daily net
assets
before
expense
waivers | Ratio of
expenses
to average
daily net
assets
after
expense
waiversj | Net
investment
income
(loss) to
average
daily net
assets
(including
interest
expense) |
Class II | | | | | | | | | | | | |
12/31/20 | $ 10.74 | $ 0.20 | $ 0.74 | $ 0.94 | $ (0.35) | $ (0.05) | $ (0.40) | $ 11.28 | 8.79% | $ 288,005 | 0.62% | 0.61% | 1.77% |
12/31/19 | 10.16 | 0.26 | 0.65 | 0.91 | (0.33) | — | (0.33) | 10.74 | 8.91% | 342,002 | 0.61% | 0.60% | 2.48% |
12/31/18 | 10.36 | 0.25 | (0.26) | (0.01) | (0.19) | — | (0.19) | 10.16 | (0.07%) | 353,571 | 0.60% | 0.60%l | 2.51% |
12/31/17 | 10.27 | 0.19 | 0.11 | 0.30 | (0.21) | — | (0.21) | 10.36 | 2.96% | 408,199 | 0.62% | 0.60% | 1.85% |
12/31/16 | 10.19 | 0.17 | 0.09 | 0.26 | (0.18) | — | (0.18) | 10.27 | 2.52% | 393,276 | 0.62% | 0.60% | 1.67% |
Service Class I | | | | | | | | | | | | |
12/31/20 | $ 10.62 | $ 0.16 | $ 0.75 | $ 0.91 | $ (0.34) | $ (0.05) | $ (0.39) | $ 11.14 | 8.60% | $ 51,252 | 0.87% | 0.86% | 1.47% |
12/31/19 | 10.06 | 0.23 | 0.64 | 0.87 | (0.31) | — | (0.31) | 10.62 | 8.65% | 34,011 | 0.86% | 0.85% | 2.21% |
12/31/18 | 10.27 | 0.23 | (0.27) | (0.04) | (0.17) | — | (0.17) | 10.06 | (0.35%) | 25,533 | 0.85% | 0.85%l | 2.28% |
12/31/17 | 10.18 | 0.16 | 0.12 | 0.28 | (0.19) | — | (0.19) | 10.27 | 2.73% | 21,858 | 0.87% | 0.85% | 1.60% |
12/31/16 | 10.11 | 0.15 | 0.09 | 0.24 | (0.17) | — | (0.17) | 10.18 | 2.30% | 19,079 | 0.87% | 0.85% | 1.43% |
| | Year ended December 31 |
| | 2020 | 2019 | 2018 | 2017 | 2016 |
Portfolio turnover rate | 328% | 219% | 250% | 313% | 278% |
c | Per share amount calculated on the average shares method. |
j | Computed after giving effect to an agreement by MML Advisers to waive certain fees and expenses of the Fund. |
l | Expenses incurred during the period fell under the expense cap. |
m | Total return does not reflect expenses that apply at the separate account level or to related insurance products. Inclusion of these charges would reduce the total return figures for all periods shown. |
The accompanying notes are an integral part of the financial statements.
234
Notes to Financial Statements |
1. The Funds
MML Series Investment Fund (the “Trust”) is registered under the Investment Company Act of 1940, as amended (the “1940 Act”), as an open-end management investment company. The Trust is organized under the laws of the Commonwealth of Massachusetts as a Massachusetts business trust pursuant to an Agreement and Declaration of Trust dated December 19, 1984, as restated May 14, 1993, and further amended and restated as of December 15, 2011, as it may be further amended from time to time. The Trust consists of the following series (each individually referred to as a “Fund” or collectively as the “Funds”):
MML Conservative Allocation Fund (“Conservative Allocation Fund”)
MML Balanced Allocation Fund (“Balanced Allocation Fund”)
MML Moderate Allocation Fund (“Moderate Allocation Fund”)
MML Growth Allocation Fund (“Growth Allocation Fund”)
MML Aggressive Allocation Fund (“Aggressive Allocation Fund”)
MML American Funds Growth Fund (“MML American Funds Growth Fund”)
MML American Funds International Fund (“MML American Funds International Fund”)
MML American Funds Core Allocation Fund (“MML American Funds Core Allocation Fund”)
MML Blue Chip Growth Fund (“Blue Chip Growth Fund”)
MML Equity Income Fund (“Equity Income Fund”)
MML Equity Index Fund (“Equity Index Fund”)
MML Focused Equity Fund (“Focused Equity Fund”)
MML Foreign Fund (“Foreign Fund”)
MML Fundamental Equity Fund (formerly known as MML Fundamental Growth Fund) (“Fundamental Equity Fund”)
MML Fundamental Value Fund (“Fundamental Value Fund”)
MML Global Fund (“Global Fund”)
MML Growth & Income Fund (“Growth & Income Fund”)
MML Income & Growth Fund (“Income & Growth Fund”)
MML International Equity Fund (“International Equity Fund”)
MML Large Cap Growth Fund (“Large Cap Growth Fund”)
MML Managed Volatility Fund (“Managed Volatility Fund”)
MML Mid Cap Growth Fund (“Mid Cap Growth Fund”)
MML Mid Cap Value Fund (“Mid Cap Value Fund”)
MML Small Cap Growth Equity Fund (“Small Cap Growth Equity Fund”)
MML Small Company Value Fund (“Small Company Value Fund”)
MML Small/Mid Cap Value Fund (“Small/Mid Cap Value Fund”)
MML Total Return Bond Fund (“Total Return Bond Fund”)
The Trust makes shares of the Funds available for the investment of assets of various separate investment accounts established by Massachusetts Mutual Life Insurance Company (“MassMutual”) and by life insurance companies which are subsidiaries of MassMutual. Shares of the Trust are not offered to the general public. MassMutual, MML Bay State Life Insurance Company, C.M. Life Insurance Company, and the Allocation Funds (as defined below), which are “funds of funds” series of the Trust, are the record owners of all of the outstanding shares of the Funds.
Each share class of a Fund represents an interest in the same portfolio of assets. The principal difference among the classes is the level of service and administration fees, and shareholder and distribution service expenses borne by the classes. Because each class will have different fees and expenses, performance and share prices will vary between the classes. The classes of shares are offered to different types of investors, as outlined in the Funds’ Prospectus.
The Conservative Allocation Fund, Balanced Allocation Fund, Moderate Allocation Fund, Growth Allocation Fund, and Aggressive Allocation Fund (the “Allocation Funds”) invest their investable assets in shares of series of the Trust and MML Series Investment Fund II (advised by MML Investment Advisers, LLC (“MML Advisers”), a wholly-owned subsidiary of MassMutual) and non-affiliated mutual funds (together, the “MML Underlying Funds”). The financial statements included
235
Notes to Financial Statements (Continued) |
herein are those of the Funds. The financial statements of the applicable MML Underlying Funds that are not Funds of the Trust are presented separately and can be obtained from the Securities and Exchange Commission’s (“SEC”) EDGAR database on its website at http://www.sec.gov or by calling MML Advisers at 1-888-309-3539.
MML American Funds Growth Fund and MML American Funds International Fund (each a “Feeder Fund,” collectively the “Feeder Funds”) invest all of their assets in Class 1 shares of the Growth and International Funds, respectively, each a series of the American Funds Insurance Series (each a “Master Fund,” collectively the “Master Funds”). Each Master Fund is an open-end investment company and organized as a Massachusetts business trust. Each Feeder Fund has an investment objective that is consistent with its corresponding Master Fund. Each Master Fund intends to comply with the requirements under Subchapter M of the Internal Revenue Code of 1986, as amended (the “Code”), applicable to mutual funds and intends to distribute substantially all of its taxable income and capital gains to shareholders, which includes the applicable Feeder Fund, to qualify as a regulated investment company. The performance of the Feeder Funds is directly affected by the performance of the Master Funds. The financial statements of the Master Funds, including the Summary Investment Portfolios, are provided separately and should be read in conjunction with the Feeder Funds’ financial statements. As of December 31, 2020, the MML American Funds Growth Fund and MML American Funds International Fund owned 0.69% and 0.58% of the Growth and International Master Funds, respectively. The MML American Funds Core Allocation Fund invests all of its investable assets in shares of various series of American Funds Insurance Series, which are managed by Capital Research and Management Company (together, the “American Underlying Funds” and collectively with the MML Underlying Funds, the “Underlying Funds”).
The SEC file number for the American Funds Insurance Series is 811-03857. Additional information related to the Master Funds’ and American Underlying Funds’ financial reports can be located on the SEC’s EDGAR database on its website at http://www.sec.gov.
2. | Significant Accounting Policies |
The following is a summary of significant accounting policies followed consistently by each Fund in the preparation of the financial statements in conformity with accounting principles generally accepted in the United States of America (“generally accepted accounting principles”). The preparation of the financial statements in accordance with generally accepted accounting principles requires management to make estimates and assumptions that affect the reported amounts and disclosures in the financial statements. Actual results could differ from those estimates.
Each Fund is an investment company and accordingly follows the investment company accounting and reporting guidance of the Financial Accounting Standards Board (“FASB”) Accounting Standards Codification Topic 946, Financial Services – Investment Companies.
Investment Valuation
The net asset value of each Fund’s shares is determined once daily as of the close of regular trading on the New York Stock Exchange (“NYSE”), on each day the NYSE is open for trading (a “business day”). The NYSE normally closes at 4:00 p.m. Eastern Time, but may close earlier on some days. If the NYSE is scheduled to close early, the business day will be considered to end as of the time of the NYSE’s scheduled close. A Fund will not treat an intraday disruption in NYSE trading or other event that causes an unscheduled closing of the NYSE as a close of business of the NYSE for these purposes and will instead fair value securities in accordance with procedures approved annually by the Board of Trustees (“Trustees”), and under the general oversight of the Trustees. On holidays and other days when the NYSE is closed, each Fund’s net asset value generally is not calculated and the Funds do not anticipate accepting buy or sell orders. However, the value of each Fund’s assets may still be affected on such days to the extent that a Fund or an Underlying Fund or Master Fund holds foreign securities that trade on days that foreign securities markets are open.
The net asset value of each of the Allocation Funds, Feeder Funds, and MML American Funds Core Allocation Fund is based upon the net asset value(s) of its corresponding Master Fund or Underlying Funds. Shares of the Master Fund and Underlying Funds are valued at their closing net asset values as reported on each business day.
236
Notes to Financial Statements (Continued) |
The Prospectuses and Statements of Additional Information (“SAIs”) for the Underlying Funds and Master Funds, as applicable, explain the valuation methods for the Underlying Funds and Master Funds, including the circumstances under which the Underlying Funds or Master Funds, may use fair value pricing and the effects of doing so. Such Prospectuses and SAIs are available on the Securities and Exchange Commission’s (“SEC”) EDGAR database on its website at http://www.sec.gov.
Equity securities and derivative contracts that are actively traded on a national securities exchange or contract market are valued on the basis of information furnished by a pricing service, which provides the last reported sale price, or, in the case of futures contracts, the settlement price, for securities or derivatives listed on the exchange or contract market or the official closing price on the NASDAQ National Market System (“NASDAQ System”), or in the case of over-the-counter (“OTC”) securities for which an official closing price is unavailable or not reported on the NASDAQ System, the last reported bid price. Portfolio securities traded on more than one national securities exchange are valued at the last price at the close of the exchange representing the principal market for such securities. Debt securities are valued on the basis of valuations furnished by a pricing service, which generally determines valuations taking into account factors such as institutional-size trading in similar securities, yield, quality, coupon rate, maturity, type of issue, trading characteristics, and other market data. Shares of other open-end mutual funds are valued at their closing net asset values as reported on each business day.
Investments for which market quotations are readily available are marked to market daily based on those quotations. Market quotations may be provided by third-party vendors or market makers, and may be determined on the basis of a variety of factors, such as broker quotations, financial modeling, and other market data, such as market indexes and yield curves, counterparty information, and foreign exchange rates. U.S. Government and agency securities may be valued on the basis of market quotations or using a model that may incorporate market observable data such as reported sales of similar securities, broker quotes, yields, bids, offers, quoted market prices, and reference data. The fair values of OTC derivative contracts, including forward, swap, and option contracts related to interest rates, foreign currencies, credit standing of reference entities, equity prices, or commodity prices, may be based on market quotations or may be modeled using a series of techniques, including simulation models, depending on the contract and the terms of the transaction. The fair values of asset-backed securities and mortgage-backed securities are estimated based on models that consider the estimated cash flows of each debt tranche of the issuer, established benchmark yield, and estimated tranche-specific spread to the benchmark yield based on the unique attributes of the tranche, including, but not limited to, prepayment speed assumptions and attributes of the collateral. Restricted securities are generally valued at a discount to similar publicly traded securities.
Investments for which market quotations are not available or for which a pricing service or vendor does not provide a value, or for which such market quotations or values are considered by the investment adviser or subadviser to be unreliable (including, for example, certain foreign securities, thinly-traded securities, certain restricted securities, certain initial public offerings, or securities whose values may have been affected by a significant event) are stated at fair valuations determined in good faith by the Funds’ Valuation Committee1 in accordance with procedures approved annually by the Trustees, and under the general oversight of the Trustees. The Funds’ Valuation Committee employs various methods to determine fair valuations including a regular review of significant inputs and assumptions and review of any related market activity. The Funds’ Valuation Committee reports to the Trustees at its regularly scheduled meetings. It is possible that fair value prices will be used by the Funds to a significant extent. The value determined for an investment using the Funds’ fair value procedures may differ from recent market prices for the investment and may be significantly different from the value realized upon the sale of such investment.
The Funds and certain Underlying Funds or Master Funds may invest in securities that are traded principally in foreign markets and that trade on weekends and other days when the Funds do not price their shares. As a result, the values of the Funds’ portfolio securities may change on days when the prices of the Funds’ shares are not calculated. The prices of the Funds’ shares will reflect any such changes when the prices of the Funds’ shares are next calculated, which is the next business day. The Funds may use fair value pricing more frequently for securities primarily traded in foreign markets because, among other things, most foreign markets close well before the Funds value their securities. The earlier close of these foreign markets gives rise to the possibility that significant events, including broad market moves, may have occurred in the interim. The Funds’ investments may be priced
1 | The voting members of the Valuation Committee consist of the President, Treasurer, Assistant Treasurers, Vice Presidents (except for the CCO, Secretary, and Assistant Secretaries) of the Trust, as well as such other members as the Trustees may from time to time designate. The non-voting members of the Valuation Committee consist of the CCO, Secretary, and Assistant Secretaries. The Valuation Committee reviews and determines the fair valuation of portfolio securities and the Funds’ pricing procedures in general. |
237
Notes to Financial Statements (Continued) |
based on fair values provided by a third-party vendor, based on certain factors and methodologies applied by such vendor, in the event that there is movement in the U.S. market, between the close of the foreign market and the time the Funds calculate their net asset values. All assets and liabilities expressed in foreign currencies are converted into U.S. dollars at the mean between the buying and selling rates of such currencies against the U.S. dollar at the end of each business day.
For investments in equity or debt issued by privately held companies or funds (“Private Company” or collectively, the “Private Companies”) and any other investments fair valued using significant unobservable inputs, as described below, the fair valuation approaches used by third party service providers and/or the Funds’ subadvisers utilize one or a combination of, but not limited to, the following inputs:
| Market approach: (i) recent market transactions, including subsequent rounds of financing, in the underlying investment or comparable issuers; (ii) recapitalizations and other transactions across the capital structure; and (iii) market multiples of comparable issuers. |
| Income approach: (i) future cash flows discounted to present value and adjusted as appropriate for liquidity, credit, and/or market risks; (ii) quoted prices for similar investments or assets in active markets; and (iii) other risk factors, such as interest rates, yield curves, volatilities, prepayment speeds, loss severities, credit risks, recovery rates, liquidation amounts, and/or default rates. |
| Cost approach: (i) audited or unaudited financial statements, investor communications, and financial or operational metrics issued by the Private Company; (ii) changes in the valuation of relevant indices or publicly traded companies comparable to the Private Company; (iii) relevant news and other public sources; and (iv) known secondary market transactions in the Private Company’s interests and merger or acquisition activity in companies comparable to the Private Company. |
Investments in series of preferred stock issued by Private Companies are typically valued utilizing Market approach in determining the enterprise value of the company. Such investments often contain rights and preferences that differ from other series of preferred and common stock of the same issuer. Valuation techniques such as the current value method (“CVM”), an option pricing model (“OPM”), a probability weighted expected return model (“PWERM”), or a hybrid of those techniques are used in allocating enterprise value of the company, as deemed appropriate under the circumstances. The CVM allocates value among the various parts of a company’s capital structure assuming that the value of convertible preferred stock is represented by the most favorable claim the preferred stockholders have on the enterprise value as of the valuation date. The use of OPM and PWERM techniques involve a determination of the exit scenarios of the investment in order to appropriately allocate the enterprise value of the company among the various parts of its capital structure.
The Private Companies are not subject to the public company disclosure, timing, and reporting standards as other investments held by a Fund. Typically, the most recently available information for a Private Company is as of a date that is earlier than the date a Fund is calculating its net asset value. This factor may result in a difference between the value of the investment and the price a Fund could receive upon the sale of the investment.
Fair value is defined as the price that would be received to sell an asset or paid to transfer a liability in an orderly transaction between market participants at the measurement date. A three-tier hierarchy is utilized to maximize the use of observable market data inputs and minimize the use of unobservable inputs and to establish classification of fair value measurements for disclosure purposes. Inputs refer broadly to the assumptions that market participants would use in pricing the asset or liability, including assumptions about risk, for example, the risk inherent in a particular valuation technique used to measure fair value (such as a pricing model) and/or the risk inherent in the inputs to the valuation technique. Inputs may be observable or unobservable. Observable inputs are inputs that reflect the assumptions market participants would use in pricing the asset or liability and are developed based on market data obtained from sources independent of the reporting entity. Unobservable inputs are inputs that reflect the reporting entity’s own assumptions about the assumptions market participants would use in pricing the asset or liability and are developed based on the best information available in the circumstances. The three-tier hierarchy of inputs is summarized in the three broad Levels listed below. The inputs or methodology used for valuing investments are not necessarily an indication of the risk associated with investing in those investments and the determination of the significance of a particular input to the fair value measurement in its entirety requires judgment and consideration of factors specific to each security.
238
Notes to Financial Statements (Continued) |
Level 1 – quoted prices (unadjusted) in active markets for identical investments that the Funds can access at the measurement date
Level 2 – other significant observable inputs (including quoted prices for similar investments, interest rates, prepayment speeds, credit risk, etc.)
Level 3 – significant unobservable inputs, to the extent observable inputs are not available (including the Funds’ own assumptions in determining the fair value of investments)
The availability of observable inputs can vary from security to security and is affected by a wide variety of factors, including, for example, the type of security, whether the security is new and not yet established in the marketplace, the liquidity of markets, and other characteristics particular to the security. To the extent that valuation is based on models or inputs that are less observable or unobservable in the market, the determination of fair value requires more judgment. Accordingly, the degree of judgment exercised in determining fair value is greatest for instruments categorized in Level 3.
Changes in valuation techniques may result in transfers in or out of an investment’s assigned Level within the hierarchy. In addition, in periods of market dislocation, the observability of prices and inputs may be reduced for many instruments. This condition, as well as changes related to liquidity of investments, could cause a security to be reclassified between Levels.
In certain cases, the inputs used to measure fair value may fall into different Levels of the fair value hierarchy. In such cases, for disclosure purposes, the Level in the fair value hierarchy within which the fair value measurement falls is determined based on the lowest Level input that is significant to the overall fair value measurement.
The Allocation Funds, Feeder Funds, and MML American Funds Core Allocation Fund characterized all investments at Level 1, as of December 31, 2020. The Fundamental Value Fund, Income & Growth Fund, Large Cap Growth Fund, and Small/Mid Cap Value Fund characterized all long-term investments at Level 1, and all short-term investments at Level 2, as of December 31, 2020. For each Fund noted in the preceding sentences, the level classification by major category of investments is the same as the category presentation in the Portfolio of Investments.
The following is the aggregate value by input level, as of December 31, 2020, for the remaining Funds’ investments:
| | | Level 1 | | | Level 2 | | | Level 3 | | | Total | |
| Blue Chip Growth Fund | | | | | | | | | | | | | | | | |
| Asset Investments | | | | | | | | | | | | | | | | |
| Common Stock | | $ | 517,588,390 | | | $ | 13,824,319 | * | | $ | 1,201,931 | ** | | $ | 532,614,640 | |
| Mutual Funds | | | 75,834 | | | | — | | | | — | | | | 75,834 | |
| Short-Term Investments | | | 100 | | | | 997,767 | | | | — | | | | 997,867 | |
| Total Investments | | $ | 517,664,324 | | | $ | 14,822,086 | | | $ | 1,201,931 | | | $ | 533,688,341 | |
| | | | | | | | | | | | | | | | | |
| Equity Income Fund | | | | | | | | | | | | | | | | |
| Asset Investments | | | | | | | | | | | | | | | | |
| Common Stock | | $ | 424,702,597 | | | $ | 12,454,992 | * | | $ | — | | | $ | 437,157,589 | |
| Preferred Stock | | | 8,796,817 | | | | — | | | | — | | | | 8,796,817 | |
| Warrants | | | 73,569 | | | | — | | | | — | | | | 73,569 | |
| Corporate Debt | | | — | | | | 1,333,069 | | | | — | | | | 1,333,069 | |
| Mutual Funds | | | 2,861,044 | | | | — | | | | — | | | | 2,861,044 | |
| Short-Term Investments | | | 1,075 | | | | 2,144,321 | | | | — | | | | 2,145,396 | |
| Total Investments | | $ | 436,435,102 | | | $ | 15,932,382 | | | $ | — | | | $ | 452,367,484 | |
239
Notes to Financial Statements (Continued) |
| | | Level 1 | | | Level 2 | | | Level 3 | | | Total | |
| Equity Index Fund | | | | | | | | | | | | | | | | |
| Asset Investments | | | | | | | | | | | | | | | | |
| Common Stock | | $ | 649,520,561 | | | $ | — | | | $ | — | | | $ | 649,520,561 | |
| Mutual Funds | | | 257,366 | | | | — | | | | — | | | | 257,366 | |
| Short-Term Investments | | | — | | | | 3,721,034 | | | | — | | | | 3,721,034 | |
| Total Investments | | $ | 649,777,927 | | | $ | 3,721,034 | | | $ | — | | | $ | 653,498,961 | |
| Asset Derivatives | | | | | | | | | | | | | | | | |
| Futures Contracts | | $ | 104,816 | | | $ | — | | | $ | — | | | $ | 104,816 | |
| | | | | | | | | | | | | | | | | |
| Focused Equity Fund | | | | | | | | | | | | | | | | |
| Asset Investments | | | | | | | | | | | | | | | | |
| Common Stock | | $ | 278,863,448 | | | $ | 13,677,819 | * | | $ | — | | | $ | 292,541,267 | |
| Short-Term Investments | | | — | | | | 2,221,301 | | | | — | | | | 2,221,301 | |
| Total Investments | | $ | 278,863,448 | | | $ | 15,899,120 | | | $ | — | | | $ | 294,762,568 | |
| | | | | | | | | | | | | | | | | |
| Foreign Fund | | | | | | | | | | | | | | | | |
| Asset Investments | | | | | | | | | | | | | | | | |
| Common Stock* | | | | | | | | | | | | | | | | |
| Australia | | $ | — | | | $ | 8,802,183 | | | $ | — | | | $ | 8,802,183 | |
| Belgium | | | — | | | | 5,817,335 | | | | — | | | | 5,817,335 | |
| Cayman Islands | | | — | | | | 5,364,741 | | | | — | | | | 5,364,741 | |
| Denmark | | | — | | | | 2,452,927 | | | | — | | | | 2,452,927 | |
| France | | | — | | | | 26,331,873 | | | | — | | | | 26,331,873 | |
| Germany | | | — | | | | 33,631,143 | | | | — | | | | 33,631,143 | |
| Ireland | | | 3,247,517 | | | | 8,297,162 | | | | — | | | | 11,544,679 | |
| Israel | | | 1,913,904 | | | | — | | | | — | | | | 1,913,904 | |
| Italy | | | — | | | | 3,711,073 | | | | — | | | | 3,711,073 | |
| Japan | | | — | | | | 72,068,766 | | | | — | | | | 72,068,766 | |
| Luxembourg | | | — | | | | 4,229,418 | | | | — | | | | 4,229,418 | |
| Netherlands | | | 2,385,150 | | | | 14,733,283 | | | | — | | | | 17,118,433 | |
| Norway | | | — | | | | 2,997,867 | | | | — | | | | 2,997,867 | |
| Republic of Korea | | | — | | | | 6,943,107 | | | | — | | | | 6,943,107 | |
| Singapore | | | — | | | | 3,323,345 | | | | — | | | | 3,323,345 | |
| Spain | | | — | | | | 1,445,220 | | | | — | | | | 1,445,220 | |
| Sweden | | | — | | | | 5,159,374 | | | | — | | | | 5,159,374 | |
| Switzerland | | | — | | | | 23,862,397 | | | | — | | | | 23,862,397 | |
| United Kingdom | | | 1,255,249 | | | | 38,514,234 | | | | — | | | | 39,769,483 | |
| Mutual Funds | | | 1,384,583 | | | | — | | | | — | | | | 1,384,583 | |
| Total Investments | | $ | 10,186,403 | | | $ | 267,685,448 | | | $ | — | | | $ | 277,871,851 | |
| | | | | | | | | | | | | | | | | |
| Fundamental Equity Fund | | | | | | | | | | | | | | | | |
| Asset Investments | | | | | | | | | | | | | | | | |
| Common Stock | | $ | 180,707,306 | | | $ | 991,633 | * | | $ | — | | | $ | 181,698,939 | |
| Mutual Funds | | | 293,570 | | | | — | | | | — | | | | 293,570 | |
| Total Investments | | $ | 181,000,876 | | | $ | 991,633 | | | $ | — | | | $ | 181,992,509 | |
| | | | | | | | | | | | | | | | | |
| Global Fund | | | | | | | | | | | | | | | | |
| Asset Investments | | | | | | | | | | | | | | | | |
| Common Stock* | | | | | | | | | | | | | | | | |
| Austria | | $ | — | | | $ | 1,027,011 | | | $ | — | | | $ | 1,027,011 | |
| Canada | | | 7,714,436 | | | | — | | | | — | | | | 7,714,436 | |
| Denmark | | | — | | | | 2,232,270 | | | | — | | | | 2,232,270 | |
240
Notes to Financial Statements (Continued) |
| | | Level 1 | | | Level 2 | | | Level 3 | | | Total | |
| Global Fund (Continued) | | | | | | | | | | | | | | | | |
| Asset Investments (Continued) | | | | | | | | | | | | | | | | |
| Common Stock* (Continued) | | | | | | | | | | | | | | | | |
| France | | $ | — | | | $ | 46,601,256 | | | $ | — | | | $ | 46,601,256 | |
| Germany | | | — | | | | 17,735,987 | | | | — | | | | 17,735,987 | |
| Ireland | | | 30,395,151 | | | | 7,047,062 | | | | — | | | | 37,442,213 | |
| Israel | | | 4,820,247 | | | | — | | | | — | | | | 4,820,247 | |
| Japan | | | — | | | | 11,055,932 | | | | — | | | | 11,055,932 | |
| Mexico | | | 846,899 | | | | — | | | | — | | | | 846,899 | |
| Netherlands | | | — | | | | 12,028,134 | | | | — | | | | 12,028,134 | |
| Republic of Korea | | | — | | | | 4,700,013 | | | | — | | | | 4,700,013 | |
| Spain | | | — | | | | 4,045,180 | | | | — | | | | 4,045,180 | |
| Sweden | | | — | | | | 7,418,286 | | | | — | | | | 7,418,286 | |
| Switzerland | | | — | | | | 30,772,497 | | | | — | | | | 30,772,497 | |
| Thailand | | | — | | | | 389,363 | | | | — | | | | 389,363 | |
| United Kingdom | | | 2,199,556 | | | | 27,076,793 | | | | — | | | | 29,276,349 | |
| United States | | | 179,093,476 | | | | — | | | | — | | | | 179,093,476 | |
| Mutual Funds | | | 4,798,170 | | | | — | | | | — | | | | 4,798,170 | |
| Warrants | | | 27,405 | | | | — | | | | — | | | | 27,405 | |
| Short-Term Investments | | | — | | | | 1,159,807 | | | | — | | | | 1,159,807 | |
| Total Investments | | $ | 229,895,340 | | | $ | 173,289,591 | | | $ | — | | | $ | 403,184,931 | |
| | | | | | | | | | | | | | | | | |
| Growth & Income Fund | | | | | | | | | | | | | | | | |
| Asset Investments | | | | | | | | | | | | | | | | |
| Common Stock | | $ | 146,181,360 | | | $ | 7,934,482 | * | | $ | — | | | $ | 154,115,842 | |
| Short-Term Investments | | | — | | | | 224,561 | | | | — | | | | 224,561 | |
| Total Investments | | $ | 146,181,360 | | | $ | 8,159,043 | | | $ | — | | | $ | 154,340,403 | |
| | | | | | | | | | | | | | | | | |
| International Equity Fund | | | | | | | | | | | | | | | | |
| Asset Investments | | | | | | | | | | | | | | | | |
| Common Stock* | | | | | | | | | | | | | | | | |
| Australia | | $ | — | | | $ | 5,541,290 | | | $ | — | | | $ | 5,541,290 | |
| Belgium | | | — | | | | 1,691,157 | | | | — | | | | 1,691,157 | |
| Canada | | | 5,148,148 | | | | — | | | | — | | | | 5,148,148 | |
| Cayman Islands | | | 1,358,992 | | | | 638,697 | | | | — | | | | 1,997,689 | |
| Finland | | | — | | | | 1,707,697 | | | | — | | | | 1,707,697 | |
| France | | | — | | | | 16,152,573 | | | | — | | | | 16,152,573 | |
| Germany | | | — | | | | 33,742,108 | | | | — | | | | 33,742,108 | |
| India | | | — | | | | 2,664,574 | | | | — | | | | 2,664,574 | |
| Indonesia | | | — | | | | 838,776 | | | | — | | | | 838,776 | |
| Ireland | | | 1,914,752 | | | | 159,354 | | | | — | | | | 2,074,106 | |
| Italy | | | — | | | | 6,845,596 | | | | — | | | | 6,845,596 | |
| Japan | | | — | | | | 3,728,793 | | | | — | | | | 3,728,793 | |
| Mexico | | | 1,438,704 | | | | — | | | | — | | | | 1,438,704 | |
| Netherlands | | | — | | | | 9,688,052 | | | | — | | | | 9,688,052 | |
| Republic of Korea | | | — | | | | 2,640,827 | | | | — | | | | 2,640,827 | |
| South Africa | | | — | | | | 4,137,438 | | | | — | | | | 4,137,438 | |
| Spain | | | — | | | | 1,882,341 | | | | — | | | | 1,882,341 | |
| Sweden | | | — | | | | 6,745,567 | | | | — | | | | 6,745,567 | |
| Switzerland | | | — | | | | 15,429,986 | | | | — | | | | 15,429,986 | |
| United Kingdom | | | 3,158,828 | | | | 34,605,934 | | | | — | | | | 37,764,762 | |
241
Notes to Financial Statements (Continued) |
| | | Level 1 | | | Level 2 | | | Level 3 | | | Total | |
| International Equity Fund (Continued) | | | | | | | | | | | | | | | | |
| Asset Invesments (Continued) | | | | | | | | | | | | | | | | |
| Preferred Stock* | | | | | | | | | | | | | | | | |
| Germany | | $ | — | | | $ | 462,005 | | | $ | — | | | $ | 462,005 | |
| Warrants | | | 11,504 | | | | — | | | | — | | | | 11,504 | |
| Short-Term Investments | | | — | | | | 4,051,484 | | | | — | | | | 4,051,484 | |
| Total Investments | | $ | 13,030,928 | | | $ | 153,354,249 | | | $ | — | | | $ | 166,385,177 | |
| Liability Derivatives | | | | | | | | | | | | | | | | |
| Forward contracts | | $ | — | | | $ | (2,916 | ) | | $ | — | | | $ | (2,916 | ) |
| | | | | | | | | | | | | | | | | |
| Managed Volatility Fund | | | | | | | | | | | | | | | | |
| Asset Investments | | | | | | | | | | | | | | | | |
| Common Stock | | $ | 135,753,669 | | | $ | — | | | $ | — | | | $ | 135,753,669 | |
| Corporate Debt | | | — | | | | — | | | | —+,** | | | | — | |
| Mutual Funds | | | 33,892 | | | | — | | | | — | | | | 33,892 | |
| Purchased Options | | | 838,968 | | | | — | | | | — | | | | 838,968 | |
| Short-Term Investments | | | — | | | | 2,709,183 | | | | — | | | | 2,709,183 | |
| Total Investments | | $ | 136,626,529 | | | $ | 2,709,183 | | | $ | — | | | $ | 139,335,712 | |
| Liability Derivatives | | | | | | | | | | | | | | | | |
| Written Options | | $ | (4,423,200 | ) | | $ | — | | | $ | — | | | $ | (4,423,200 | ) |
| | | | | | | | | | | | | | | | | |
| Mid Cap Growth Fund | | | | | | | | | | | | | | | | |
| Asset Investments | | | | | | | | | | | | | | | | |
| Common Stock | | $ | 537,530,458 | | | $ | 420,399 | | | $ | 1,916,772 | ** | | $ | 539,867,629 | |
| Preferred Stock | | | — | | | | — | | | | 3,070,818 | ** | | | 3,070,818 | |
| Warrants | | | 47,837 | | | | — | | | | — | | | | 47,837 | |
| Mutual Funds | | | 3,925,556 | | | | — | | | | — | | | | 3,925,556 | |
| Short-Term Investments | | | 372 | | | | 10,695,884 | | | | — | | | | 10,696,256 | |
| Total Investments | | $ | 541,504,223 | | | $ | 11,116,283 | | | $ | 4,987,590 | | | $ | 557,608,096 | |
| | | | | | | | | | | | | | | | | |
| Mid Cap Value Fund | | | | | | | | | | | | | | | | |
| Asset Investments | | | | | | | | | | | | | | | | |
| Common Stock | | $ | 360,287,732 | | | $ | 28,158,859 | * | | $ | — | | | $ | 388,446,591 | |
| Mutual Funds | | | 9,452,340 | | | | — | | | | — | | | | 9,452,340 | |
| Short-Term Investments | | | — | | | | 2,326,692 | | | | — | | | | 2,326,692 | |
| Total Investments | | $ | 369,740,072 | | | $ | 30,485,551 | | | $ | — | | | $ | 400,225,623 | |
| Asset Derivatives | | | | | | | | | | | | | | | | |
| Forward Contracts | | $ | — | | | $ | 41,868 | | | $ | — | | | $ | 41,868 | |
| Liability Derivatives | | | | | | | | | | | | | | | | |
| Forward Contracts | | $ | — | | | $ | (245,082 | ) | | $ | — | | | $ | (245,082 | ) |
| | | | | | | | | | | | | | | | | |
| Small Cap Growth Equity Fund | | | | | | | | | | | | | | | | |
| Asset Investments | | | | | | | | | | | | | | | | |
| Common Stock | | $ | 217,230,519 | | | $ | 943,588 | | | $ | 6,417 | ** | | $ | 218,180,524 | |
| Preferred Stock | | | — | | | | — | | | | 166,798 | ** | | | 166,798 | |
| Mutual Funds | | | 4,038,300 | | | | — | | | | — | | | | 4,038,300 | |
| Short-Term Investments | | | — | | | | 1,482,608 | | | | — | | | | 1,482,608 | |
| Total Investments | | $ | 221,268,819 | | | $ | 2,426,196 | | | $ | 173,215 | | | $ | 223,868,230 | |
242
Notes to Financial Statements (Continued) |
| | | Level 1 | | | Level 2 | | | Level 3 | | | Total | |
| Small Company Value Fund | | | | | | | | | | | | | | | | |
| Asset Investments | | | | | | | | | | | | | | | | |
| Common Stock | | $ | 91,735,510 | | | $ | — | | | $ | — | | | $ | 91,735,510 | |
| Warrants | | | 9,892 | | | | — | | | | — | | | | 9,892 | |
| Mutual Funds | | | 243,686 | | | | — | | | | — | | | | 243,686 | |
| Short-Term Investments | | | 100 | | | | 320,755 | | | | — | | | | 320,855 | |
| Total Investments | | $ | 91,989,188 | | | $ | 320,755 | | | $ | — | | | $ | 92,309,943 | |
| | | | | | | | | | | | | | | | | |
| Total Return Bond Fund | | | | | | | | | | | | | | | | |
| Asset Investments | | | | | | | | | | | | | | | | |
| Bank Loans | | $ | — | | | $ | 2,428,931 | | | $ | — | | | $ | 2,428,931 | |
| Corporate Debt | | | — | | | | 74,998,345 | | | | — | | | | 74,998,345 | |
| Municipal Obligations | | | — | | | | 6,568,123 | | | | — | | | | 6,568,123 | |
| Non-U.S. Government Agency Obligations | | | — | | | | 43,560,029 | | | | — | | | | 43,560,029 | |
| Sovereign Debt Obligations | | | — | | | | 3,015,062 | | | | — | | | | 3,015,062 | |
| U.S. Government Agency Obligations and Instrumentalities | | | — | | | | 108,046,631 | | | | — | | | | 108,046,631 | |
| U.S. Treasury Obligations | | | — | | | | 137,332,630 | | | | — | | | | 137,332,630 | |
| Short-Term Investments | | | — | | | | 4,237,061 | | | | — | | | | 4,237,061 | |
| Total Investments | | $ | — | | | $ | 380,186,812 | | | $ | — | | | $ | 380,186,812 | |
| Asset Derivatives | | | | | | | | | | | | | | | | |
| Futures Contracts | | $ | 3,362 | | | $ | — | | | $ | — | | | $ | 3,362 | |
| Liability Derivatives | | | | | | | | | | | | | | | | |
| Forward Contracts | | $ | — | | | $ | (30,073 | ) | | $ | — | | | $ | (30,073 | ) |
| Futures Contracts | | | (2,971 | ) | | | — | | | | — | | | | (2,971 | ) |
| Total | | $ | (2,971 | ) | | $ | (30,073 | ) | | $ | — | | | $ | (33,044 | ) |
* | Includes foreign equity securities whose values were adjusted to reflect market trading of comparable securities or other correlated instruments after the close of trading in their respective foreign markets, as applicable. |
** | None of the unobservable inputs for Level 3 assets, individually or collectively, had a material impact on the Fund(s). Level 3 investments at December 31, 2020 in relation to net assets were not significant and accordingly, a reconciliation of Level 3 assets for the year ended December 31, 2020 is not presented. |
+ | Represents a security at $0 value as of December 31, 2020. |
For certain Fund(s) the Statement of Assets and Liabilities shows receivables from investments sold on a delayed delivery basis and collateral pledged for open futures contracts, as well as, any applicable liabilities for investments purchased on a delayed delivery basis, amounts due to custodian, and collateral held for securities on loan. These amounts approximate fair value and would be categorized at Level 2 for each applicable Fund as of December 31, 2020.
The Funds had no Level 3 transfers during the year ended December 31, 2020.
Derivative Instruments
Derivatives are financial instruments whose values are based on the values of one or more indicators, such as a security, asset, currency, interest rate, or index. Derivative transactions can create investment leverage and may be highly volatile. Losses from derivatives can be substantially greater than the derivatives’ original cost and can sometimes be unlimited. A Fund may not be able to close out a derivative transaction at a favorable time or price.
243
Notes to Financial Statements (Continued) |
At December 31, 2020, and during the year then ended, the Fund(s) had the following derivatives and transactions in derivatives, grouped into the indicated risk categories:
| | | Equity
Risk | | | Foreign Exchange
Risk | | | Interest
Rate Risk | | | Total | |
Equity Income Fund | | | | | | | | | | | | | | | | |
Realized Gain (Loss)# | | | | | | | | | | | | | | | | |
Futures Contracts | | $ | 184,306 | | | $ | — | | | $ | — | | | $ | 184,306 | |
| | | | | | | | | | | | | | | | | |
Equity Index Fund | | | | | | | | | | | | | | | | |
Asset Derivatives | | | | | | | | | | | | | | | | |
Futures Contracts^^ | | $ | 104,816 | | | $ | — | | | $ | — | | | $ | 104,816 | |
Realized Gain (Loss)# | | | | | | | | | | | | | | | | |
Futures Contracts | | $ | 567,137 | | | $ | — | | | $ | — | | | $ | 567,137 | |
Change in Appreciation (Depreciation)## | | | | | | | | | | | | | | | | |
Futures Contracts | | $ | 16,001 | | | $ | — | | | $ | — | | | $ | 16,001 | |
| | | | | | | | | | | | | | | | | |
International Equity Fund | | | | | | | | | | | | | | | | |
Liability Derivatives | | | | | | | | | | | | | | | | |
Forward Contracts^ | | $ | — | | | $ | (2,916 | ) | | $ | — | | | $ | (2,916 | ) |
Realized Gain (Loss)# | | | | | | | | | | | | | | | | |
Forward Contracts | | $ | — | | | $ | (111,452 | ) | | $ | — | | | $ | (111,452 | ) |
Change in Appreciation (Depreciation)## | | | | | | | | | | | | | | | | |
Forward Contracts | | $ | — | | | $ | 19,395 | | | $ | — | | | $ | 19,395 | |
| | | | | | | | | | | | | | | | | |
Managed Volatility Fund | | | | | | | | | | | | | | | | |
Asset Derivatives | | | | | | | | | | | | | | | | |
Purchased Options*,^^^ | | $ | 838,968 | | | $ | — | | | $ | — | | | $ | 838,968 | |
Liability Derivatives | | | | | | | | | | | | | | | | |
Written Options^,^^^ | | $ | (4,423,200 | ) | | $ | — | | | $ | — | | | $ | (4,423,200 | ) |
Realized Gain (Loss)# | | | | | | | | | | | | | | | | |
Purchased Options | | $ | (439,071 | ) | | $ | — | | | $ | — | | | $ | (439,071 | ) |
Written Options | | | (14,687,208 | ) | | | — | | | | — | | | | (14,687,208 | ) |
Total Realized Gain (Loss) | | $ | (15,126,279 | ) | | $ | — | | | $ | — | | | $ | (15,126,279 | ) |
Change in Appreciation (Depreciation)## | | | | | | | | | | | | | | | | |
Purchased Options | | $ | (253,688 | ) | | $ | — | | | $ | — | | | $ | (253,688 | ) |
Written Options | | | 341,641 | | | | — | | | | — | | | | 341,641 | |
Total Change in Appreciation (Depreciation) | | $ | 87,953 | | | $ | — | | | $ | — | | | $ | 87,953 | |
| | | | | | | | | | | | | | | | | |
Mid Cap Value Fund | | | | | | | | | | | | | | | | |
Asset Derivatives | | | | | | | | | | | | | | | | |
Forward Contracts* | | $ | — | | | $ | 41,868 | | | $ | — | | | $ | 41,868 | |
Liability Derivatives | | | | | | | | | | | | | | | | |
Forward Contracts^ | | $ | — | | | $ | (245,082 | ) | | $ | — | | | $ | (245,082 | ) |
Realized Gain (Loss)# | | | | | | | | | | | | | | | | |
Forward Contracts | | $ | — | | | $ | (1,392,959 | ) | | $ | — | | | $ | (1,392,959 | ) |
Change in Appreciation (Depreciation)## | | | | | | | | | | | | | | | | |
Forward Contracts | | $ | — | | | $ | 119,269 | | | $ | — | | | $ | 119,269 | |
244
Notes to Financial Statements (Continued) |
| | | Equity
Risk | | | Foreign Exchange
Risk | | | Interest
Rate Risk | | | Total | |
Total Return Bond Fund | | | | | | | | | | | | | | | | |
Asset Derivatives | | | | | | | | | | | | | | | | |
Futures Contracts^^ | | $ | — | | | $ | — | | | $ | 3,362 | | | $ | 3,362 | |
Liability Derivatives | | | | | | | | | | | | | | | | |
Forward Contracts^ | | $ | — | | | $ | (30,073 | ) | | $ | — | | | $ | (30,073 | ) |
Futures Contracts^^ | | | — | | | | — | | | | (2,971 | ) | | | (2,971 | ) |
Total Value | | $ | — | | | $ | (30,073 | ) | | $ | (2,971 | ) | | $ | (33,044 | ) |
Realized Gain (Loss)# | | | | | | | | | | | | | | | | |
Forward Contracts | | $ | — | | | $ | 144,777 | | | $ | — | | | $ | 144,777 | |
Futures Contracts | | | — | | | | — | | | | 2,614,368 | | | | 2,614,368 | |
Swap Agreements | | | — | | | | — | | | | 18,450 | | | | 18,450 | |
Written Options | | | — | | | | — | | | | 80,096 | | | | 80,096 | |
Total Realized Gain (Loss) | | $ | — | | | $ | 144,777 | | | $ | 2,712,914 | | | $ | 2,857,691 | |
Change in Appreciation (Depreciation)## | | | | | | | | | | | | | | | | |
Forward Contracts | | $ | — | | | $ | (107,168 | ) | | $ | — | | | $ | (107,168 | ) |
Futures Contracts | | | — | | | | — | | | | 79,794 | | | | 79,794 | |
Swap Agreements | | | — | | | | — | | | | (395 | ) | | | (395 | ) |
Total Change in Appreciation (Depreciation) | | $ | — | | | $ | (107,168 | ) | | $ | 79,399 | | | $ | (27,769 | ) |
* | Statements of Assets and Liabilities location: Investments, at value, or Receivables from: open forward contracts, as applicable. |
^ | Statements of Assets and Liabilities location: Payables for: open forward contracts or written options outstanding, at value, as applicable. |
^^ | Cumulative appreciation (depreciation) on futures contracts is reported in “Futures Contracts” in each applicable Fund’s Portfolio of Investments. Only current day’s variation margin, if any, is reported within the Statements of Assets and Liabilities. |
^^^ | Represents exchange-traded purchased and written options, which are not subject to a master netting agreement or similar agreement. |
# | Statements of Operations location: Amounts are included in net realized gain (loss) on: investment transactions, forward contracts, futures contracts, swap agreements, or written options, as applicable. |
## | Statements of Operations location: Amounts are included in net change in unrealized appreciation (depreciation) on: investment transactions, forward contracts, futures contracts, swap agreements, or written options, as applicable. |
For the year ended December 31, 2020, the number of contracts, notional amounts, or shares/units for each derivative type was as follows:
| | | Number of Contracts, Notional Amounts, or Shares/Units† | |
| Fund Name | | Futures
Contracts | | | Forward
Contracts | | | Swap
Agreements | | | Purchased
Options | | | Written
Options | |
| Equity Income Fund | | | 12 | | | $ | — | | | $ | — | | | | — | | | | — | |
| Equity Index Fund | | | 37 | | | | — | | | | — | | | | — | | | | — | |
| International Equity Fund | | | — | | | | 1,534,796 | | | | — | | | | — | | | | — | |
| Managed Volatility Fund | | | — | | | | — | | | | — | | | | 304 | | | | 424 | |
| Mid Cap Value Fund | | | — | | | | 36,152,888 | | | | — | | | | — | | | | — | |
| Total Return Bond Fund | | | 211 | | | | 3,459,227 | | | | 41,710,000 | | | | 30 | | | | 80 | |
† | Amount(s) disclosed represent average number of contracts for futures contracts, notional amounts for forward contracts and swap agreements, or shares/units outstanding for purchased options and written options, based on absolute values, which is indicative of volume of this derivative type, for the months that the Fund held such derivatives during the year ended December 31, 2020. |
The Portfolio of Investments included in a Fund’s financial statements shows the assets or liabilities of the Fund associated with individual derivatives transactions. The terms of many of those transactions contemplate that derivatives receivables and payables between the same two parties may be netted and that the parties will collateralize certain obligations. The following tables provide an illustration of the possible effect of netting provisions and of collateral (delivered or received) on a Fund’s
245
Notes to Financial Statements (Continued) |
derivatives exposure as of December 31, 2020. Netting arrangements vary among different counterparties, and the actual disposition of derivatives receivables and payables, and of collateral, in a bankruptcy or insolvency can be complicated and difficult to predict.
The following table presents derivative assets by counterparty net of amounts available for offset under a master netting agreement (“MNA”) or similar agreement and net of the related collateral received by the Fund(s) as of December 31, 2020.
Counterparty | | Derivative
Assets Subject
to an MNA by
Counterparty† | | | Financial
Instruments
Available for
Offset | | | Collateral
Received*** | | | Net Amount* | |
Mid Cap Value Fund | | | | | | | | | | | | | | | | |
Bank of America N.A. | | $ | 302 | | | $ | (302 | ) | | $ | — | | | $ | — | |
Credit Suisse International | | | 32,607 | | | | — | | | | — | | | | 32,607 | |
JP Morgan Chase Bank N.A. | | | 8,959 | | | | (8,959 | ) | | | — | | | | — | |
| | | $ | 41,868 | | | $ | (9,261 | ) | | $ | — | | | $ | 32,607 | |
The following table presents derivative liabilities by counterparty net of amounts available for offset under an MNA or similar agreement and net of the related collateral pledged by the Fund(s) as of December 31, 2020.
Counterparty | | Derivative
Liabilities Subject
to an MNA by
Counterparty† | | | Financial
Instruments
Available for
Offset | | | Collateral
Pledged*** | | | Net Amount** | |
International Equity Fund | | | | | | | | | | | | | | | | |
State Street Bank and Trust Co. | | $ | (2,916 | ) | | $ | — | | | $ | — | | | $ | (2,916 | ) |
Mid Cap Value Fund | | | | | | | | | | | | | | | | |
Bank of America N.A. | | $ | (13,595 | ) | | $ | 302 | | | $ | — | | | $ | (13,293 | ) |
Goldman Sachs & Co. | | | (37,254 | ) | | | — | | | | — | | | | (37,254 | ) |
JP Morgan Chase Bank N.A. | | | (190,945 | ) | | | 8,959 | | | | — | | | | (181,986 | ) |
Morgan Stanley & Co. LLC | | | (3,288 | ) | | | — | | | | — | | | | (3,288 | ) |
| | | $ | (245,082 | ) | | $ | 9,261 | | | $ | — | | | $ | (235,821 | ) |
Total Return Bond Fund | | | | | | | | | | | | | | | | |
Goldman Sachs International | | $ | (30,073 | ) | | $ | — | | | $ | — | | | $ | (30,073 | ) |
* | Represents the net amount receivable from the counterparty in the event of default. |
** | Represents the net amount payable to the counterparty in the event of default. |
*** | The amount presented here may be less than the total amount of collateral received/pledged as the net amount of derivative assets and liabilities for a counterparty cannot be less than $0. |
† | The amount presented here may be less than the total amount shown in the Statements of Assets and Liabilities as some derivatives held by the counterparty are not covered within an MNA or similar agreement. |
Such agreements typically permit a single net payment in the event of default, including the bankruptcy or insolvency of the counterparty. Typically, the Fund(s) and counterparties are not permitted to sell, re-pledge, or use the collateral they receive.
Further details regarding the derivatives and other investments held by the Fund(s) during the year ended December 31, 2020, are discussed below.
246
Notes to Financial Statements (Continued) |
Foreign Currency Exchange Transactions
A Fund may engage in foreign currency exchange transactions for hedging purposes in order to protect against uncertainty in the level of future foreign currency exchange rates, or for other, non-hedging purposes.
A Fund may enter into foreign currency exchange transactions, including foreign currency forward contracts. These contracts call for the Fund to deliver in the future an amount of one currency in return for an amount of another currency, at an exchange rate determined at the time the contract is entered into. Forward contracts are private contractual arrangements and a Fund is subject to the risk that its counterparty will not, or will not be able to, perform its obligations. This type of arrangement may require the Fund to post margin. A Fund may enter into foreign currency exchange transactions in order to hedge against changes in the values of the assets or liabilities denominated in one or more foreign currencies, or otherwise to increase or reduce a Fund’s exposure to various foreign currencies. The use of foreign currency exchange transactions may create investment leverage.
Whenever a Fund enters into a foreign currency exchange transaction, it is subject to the risk that the value of the transaction will move in a direction unfavorable to it. When the Fund uses the transactions for hedging purposes, it is likely that the Fund will have an asset or liability that will offset any loss (or gain) on the transactions, at least in part. If a Fund enters into foreign currency exchange transactions other than for hedging purposes (for example, seeking to profit from an anticipated change in the values of currencies by creating directional exposures in the portfolio with respect to one or more currencies), it will generally be subject to the same risks, but is less likely to have assets or liabilities that will offset any losses on the transactions. There can be no assurance that a Fund will be able to terminate any foreign currency exchange transaction prior to its maturity in order to limit its loss on the transaction.
Forward foreign currency contracts are marked to market daily and the change in their value is recorded by the Funds as an unrealized gain or loss. Forward foreign currency contracts are valued at the settlement price established through dealers or other market sources on the day which they are traded. When a forward foreign currency contract is extinguished, through delivery or offset by entering into another forward foreign currency contract, the Funds record a realized gain or loss equal to the difference between the value of the contract at the time it was opened and the value of the contract at the time it was extinguished or offset. The notional or contractual amounts of these instruments do not necessarily represent the amounts potentially subject to risk. The measurement of the risk associated with these instruments is meaningful only when all related and offsetting transactions and counterparty risks are considered.
A Fund’s current exposure to a counterparty is the unrealized appreciation on the contract.
Futures Contracts
A Fund may seek to manage a variety of different risks, such as interest rate risk, equity price risk, and currency risk, through the use of futures contracts and related options.
Futures Contracts. A Fund may use interest rate futures contracts to adjust the interest rate sensitivity (duration) of its portfolio or the credit exposure of the portfolio. Interest rate futures contracts obligate the long or short holder to take or make delivery of a specified quantity of a financial instrument, such as a specific fixed income security, during a specified future period at a specified price. A Fund may use index futures contracts to hedge against broad market risks to its portfolio or to gain broad market exposure when it holds uninvested cash or as an inexpensive substitute for cash investments directly in securities or other assets, including commodities and precious metals. Securities index futures contracts are contracts to buy or sell units of a securities index at a specified future date at a price agreed upon when the contract is made and are settled in cash. Positions in futures contracts may be closed out only on an exchange or board of trade which provides a secondary market for such futures. Because futures contracts are exchange-traded, they typically have minimal exposure to counterparty risk.
Parties to a futures contract are not required to post the entire notional amount of the contract, but rather a small percentage of that amount (by way of margin), both at the time they enter into futures transactions, and then on a daily basis if their positions decline in value; as a result, futures contracts are highly leveraged. Such payments are known as variation margin and are recorded by the Funds as unrealized gains or losses. Because futures markets are highly leveraged, they can be extremely volatile, and there can be no assurance that the pricing of a futures contract will correlate precisely with the pricing of the asset or index underlying
247
Notes to Financial Statements (Continued) |
it or the asset or liability of the Fund that is the subject of the hedge. It may not always be possible for a Fund to enter into a closing transaction with respect to a futures contract it has entered into, at a favorable time or price. When a Fund enters into a futures transaction, it is subject to the risk that the value of the futures contract will move in a direction unfavorable to it. When a Fund uses futures contracts for hedging purposes, it is likely that the Fund will have an asset or liability that will offset any loss (or gain) on the transactions, at least in part.
Options on Futures Contracts. If a Fund buys an option on a futures contract, it will have the right to assume a futures contract at a particular price during the course of the option. Its potential loss should generally be limited to the amount of the premium paid and any transaction costs. If a Fund sells an option on a futures contract, it is subject generally to the same risks as if it had entered into a futures contract underlying the option itself.
When a futures contract is closed, the Fund records a realized gain or loss equal to the difference between the value of the contract at the time it was opened and the value at the time it was closed. Futures contracts are valued at the settlement price established each day by the board of trade or exchange on which they are traded. For information regarding the accounting treatment of options, see “Options, Rights, and Warrants” below.
Swap Agreements
Swap agreements are typically two-party contracts entered into primarily by institutional investors. In a standard “swap” transaction, two parties agree to exchange the returns (or differentials in rates of return) earned or realized on particular predetermined investments or instruments or rates, which may be adjusted for an interest factor. The gross returns to be exchanged or “swapped” between the parties are generally calculated with respect to a “notional amount,” (i.e., the return on or increase in value of a particular dollar amount invested at a particular interest rate or in a “basket” of securities representing a particular index).
Interest Rate Swaps. When a Fund enters into an interest rate swap, it typically agrees to make payments to its counterparty based on a specified long- or short-term interest rate and will receive payments from its counterparty based on another interest rate. Other forms of interest rate swap agreements include, among others, interest rate caps, under which, in return for a specified payment stream, one party agrees to make payments to the other to the extent that interest rates exceed a specified rate, or “cap”; interest rate floors, under which, in return for a specified payment stream, one party agrees to make payments to the other to the extent that interest rates fall below a specified rate, or “floor”; and interest rate collars, under which a party sells a cap and purchases a floor or vice versa in an attempt to protect itself against interest rate movements exceeding given minimum or maximum levels. A Fund may enter into an interest rate swap in order, for example, to hedge against the effect of interest rate changes on the value of specific securities in its portfolio, or to adjust the interest rate sensitivity (duration) or the credit exposure of its portfolio overall, or otherwise as a substitute for a direct investment in debt securities.
Whenever a Fund enters into a swap agreement, it takes on counterparty risk — the risk that its counterparty will be unable or unwilling to meet its obligations under the swap agreement. The Fund also takes the risk that the market will move against its position in the swap agreement. In the case of an interest rate swap, the value of the swap may increase or decrease depending on changes in interest rates. When the Fund enters into any type of swap for hedging purposes, it is likely that the Fund will have an asset or liability that will offset any loss (or gain) on the swap, at least in part. Swap agreements may be non-transferable or otherwise highly illiquid, and a Fund may not be able to terminate or transfer a swap agreement at any particular time or at an acceptable price.
Centrally Cleared Swaps. Certain clearinghouses currently offer clearing for limited types of derivatives transactions, principally certain interest rate swaps, certain index swaps, and credit derivatives. In a cleared derivative transaction, a Fund typically enters into the transaction with a financial institution counterparty, and performance of the transaction is effectively guaranteed by a central clearinghouse, thereby reducing or eliminating the Fund’s exposure to the credit risk of its original counterparty. The Fund will be required to post amounts (“initial margin”) with the clearinghouse or at the instruction of the clearinghouse. The initial margin required by a clearinghouse may be greater than the initial margin the Fund would be required to post in an uncleared transaction. If cash is deposited as the initial margin, it is shown as collateral on a Fund’s Statement of Assets and Liabilities. Swap agreements are marked-to-market daily and subsequent payments (“variation margin”) are made or received
248
Notes to Financial Statements (Continued) |
by a Fund depending on whether unrealized gains or losses are incurred. These amounts are reflected as receivables or payables on a Fund’s Statement of Assets and Liabilities (“Variation margin on open derivative instruments”) and as a component of net change in unrealized appreciation (depreciation) on a Fund’s Statement of Operations. Only a limited number of transaction types are currently eligible for clearing.
During the term of a swap transaction, changes in the value of the swap are recognized as unrealized gains or losses by marking to market to reflect the market value of the swap. When the swap is terminated, a Fund will record a realized gain or loss equal to the difference, if any, between the proceeds from (or cost of) the closing transaction and a Fund’s basis in the agreement. Upfront swap premium payments paid or received by a Fund, if any, are recorded within the value of the open swap agreement on the Fund’s Statement of Assets and Liabilities and represent payments paid or received upon entering into the swap agreement to compensate for differences between stated terms of the swap agreement and prevailing market conditions (credit spreads, currency exchange rates, and other relevant factors). These upfront payments are recorded as realized gain or loss on the Fund’s Statement of Operations upon termination or maturity of the swap agreement.
During the term of a swap transaction, the periodic net payments can be made for a set period of time or may be triggered by a predetermined credit event. The net periodic payments may be based on a fixed or variable interest rate, the change in market value of a specified security, basket of securities or index, or the return generated by a security. These periodic payments received or made by the Funds are recorded in the accompanying Statements of Operations as realized gains and losses, respectively.
A Fund’s current exposure to a counterparty is the fair value of the transaction.
Options, Rights, and Warrants
A Fund may purchase and sell put and call options on securities or an index of securities to enhance investment performance or to protect against changes in market prices. A Fund that invests in debt securities may also purchase and sell put and call options to adjust the interest rate sensitivity of its portfolio or the credit exposure of the portfolio.
Call Options. A call option gives the holder the right to purchase, and obligates the writer to sell, a security at the strike price at any time before the expiration date.
Put Options. A put option gives the holder the right to sell, and obligates the writer to buy, a security at the exercise price at any time before the expiration date.
Writing put and call options. A Fund may write call options on a security it owns, in a “directional” strategy hoping to realize a greater current return through the receipt of premiums. In return for the option premium, the Fund takes the risk that it will have to forego any increase in the value of the security over the strike price. When a Fund has written a call option on a security it does not own, its exposure on such an option is theoretically unlimited. A Fund may enter into closing purchase transactions in order to realize a profit or limit a loss on a previously written call option or, in the case of a call option on a security it owns, to free itself to sell the underlying security or to write another call on the security, or protect a security from being called in an unexpected market rise. Any profits from a closing purchase transaction in the case of a call option on a security a Fund owns may be offset by a decline in the value of the underlying security. Conversely, because increases in the market price of a call option will generally reflect increases in the market price of the underlying security, any loss resulting from a closing purchase transaction relating to a call option on a security a Fund owns is likely to be offset in whole or in part by unrealized appreciation of the underlying security owned by the Fund. A Fund may not be able to close out a call option that it has previously written. A Fund may write put options in order to enhance its current return by taking a long directional position as to a security or index of securities. By writing a put option, the Fund assumes the risk that it may be required to purchase the underlying security for an exercise price higher than its then current market value, resulting in a potential capital loss unless the security later appreciates in value. A Fund may terminate a put option that it has written before it expires by entering into a closing purchase transaction. Any loss from this transaction may be partially or entirely offset by the premium received on the terminated option. A Fund may not be able to close out a put option that it has previously written.
249
Notes to Financial Statements (Continued) |
When a Fund writes a call or put option, an amount equal to the premium received is recorded as a liability. Premiums received from writing options which expire are treated as realized gains. Premiums received from writing options which are exercised or closed are added to the proceeds or offset against the amount paid on the underlying investment to determine the realized gain or loss.
Purchasing put and call options. A Fund may purchase put options to protect portfolio holdings against a decline in market value of a security or securities held by it. A Fund may also purchase a put option hoping to profit from an anticipated decline in the value of the underlying security. If the Fund holds the security underlying the option, the option premium and any transaction costs will reduce any profit the Fund might have realized had it sold the underlying security instead of buying the put option. A Fund may purchase call options to hedge against an increase in the price of securities that the Fund wants ultimately to buy. A Fund may also purchase a call option as a long directional investment hoping to profit from an anticipated increase in the value of the underlying security. In order for a call option to be profitable, the market price of the underlying security must rise sufficiently above the exercise price to cover the premium and transaction costs. These costs will reduce any profit the Fund might have realized had it bought the underlying security at the time it purchased the call option.
When a Fund purchases an option, it runs the risk that it will lose its entire investment in the option in a relatively short period of time, unless the Fund exercises the option or enters into a closing sale transaction before the option’s expiration. If the price of the underlying security does not rise (in the case of a call) or fall (in the case of a put) to an extent sufficient to cover the option premium and transaction costs, the Fund will lose part or all of its investment in the option. This contrasts with an investment by a Fund in the underlying security, since the Fund will not realize a loss if the security’s price does not change. Premiums paid for purchasing options that expire are treated as realized losses.
Exchange Traded Options. Exchange traded options purchased or sold by a Fund may be traded on a securities or options exchange or market. Such options typically have minimal exposure to counterparty risk. However, an exchange or market may at times find it necessary to impose restrictions on particular types of options transactions, such as opening transactions. If an underlying security ceases to meet qualifications imposed by the market or the Options Clearing Corporation, new series of options on that security will no longer be opened to replace expiring series, and opening transactions in existing series may be prohibited. Exchange traded options are valued at the last sale price, or if no sales are reported, the last bid price.
Rights and Warrants. A Fund may purchase or hold warrants or rights in order to gain exposure to the underlying security without owning the security, including, for example, cases where the Fund hopes to lock in the price today of a security it may wish to purchase in the future. Warrants generally give the holder the right, but not the obligation, to buy a security at a stated price. In order for a warrant to be profitable, the market price of the underlying security must rise sufficiently above the exercise price to cover any premium and transaction costs. Rights may similarly confer on the holder the right to purchase or acquire securities, including through participation in a so-called rights offering. Bonds may be issued with warrants or other rights attached to purchase or acquire equity or other debt securities, typically of the bond issuer. The market prices of bonds with warrants or rights attached to purchase equity securities or bonds may, to some degree, reflect changes in the values of the underlying securities.
When a Fund purchases or otherwise acquires warrants or other rights, it runs the risk that it will lose its entire investment in the warrants or rights, unless the Fund exercises the warrant or right, acquires the underlying securities, or enters into a closing transaction before expiration. If the price of the underlying security does not rise to an extent sufficient to cover any premium and transaction costs, the Fund will lose part or all of its investment. Any premiums or purchase price paid for warrants or other rights that expire are treated as realized losses. Warrants and similar rights differ from options in that they are typically written by the issuer of the security underlying the warrant or right. Although some warrants and rights may be non-transferable, others may be traded over-the-counter or on an exchange.
Inflation-Linked Securities
Inflation-linked securities are typically fixed income securities whose principal values are periodically adjusted according to a measure of inflation. If the index measuring inflation falls, the principal value of an inflation-linked security will be adjusted downward, and consequently the interest payable on the security (calculated with respect to a smaller principal amount) will be
250
Notes to Financial Statements (Continued) |
reduced. Repayment of the original principal of the security upon maturity (as adjusted for inflation) is guaranteed in the case of U.S. Treasury inflation-linked securities. For securities that do not provide a similar guarantee, the adjusted principal value of the security repaid at maturity may be less than the original principal.
Alternatively, the interest rates payable on certain inflation-linked securities may be adjusted according to a measure of inflation. As a result, the principal values of such securities do not adjust according to the rate of inflation, although the interest payable on such securities may decline during times of falling inflation.
The values of inflation-linked securities are expected to change in response to changes in real interest rates. Real interest rates are tied to the relationship between nominal interest rates and the rate of inflation. If nominal interest rates increase at a faster rate than inflation, real interest rates may rise, leading to a decrease in value of inflation-linked securities. Inflation-linked securities may cause a potential cash flow mismatch to investors, because an increase in the principal amount of an inflation-linked security will be treated as interest income currently subject to tax at ordinary income rates even though investors will not receive repayment of principal until maturity. If a Fund invests in such securities, it will be required to distribute such interest income in order to qualify for treatment as a regulated investment company and eliminate the Fund-level tax, without a corresponding receipt of cash, and therefore may be required to dispose of portfolio securities at a time when it may not be advantageous to do so in order to make such distributions.
Bank Loans
A Fund may invest in bank loans including, for example, corporate loans, loan participations, direct debt, bank debt, and bridge debt. A Fund may invest in a loan by lending money to a borrower directly as part of a syndicate of lenders. In a syndicated loan, the agent that originated and structured the loan typically administers and enforces the loan on behalf of the syndicate. Failure by the agent to fulfill its obligations may delay or adversely affect receipt of payment by a Fund. A Fund may also invest in loans through novations, assignments, and participation interests. In a novation, a Fund typically assumes all of the rights of a lending institution in a loan, including the right to receive payments of principal and interest and other amounts directly from the borrower and to enforce its rights as a lender directly against the borrower. When a Fund takes an assignment of a loan, the Fund acquires some or all of the interest of another lender (or assignee) in the loan. In such cases, the Fund may be required generally to rely upon the assignor to demand payment and enforce rights under the loan. If a Fund acquires a participation in the loan, the Fund purchases an indirect interest in a loan held by a third party and the Fund typically will have a contractual relationship only with the third party loan investor, not with the borrower. As a result, a Fund may have the right to receive payments of principal, interest, and any fees to which it is entitled only from the loan investor selling the participation and only upon receipt by such loan investor of such payments from the borrower. In such cases, a Fund assumes the credit risk of both the borrower and the loan investor selling the participation, and the Fund may be unable to realize some or all of the value of its interest in the loan in the event of the insolvency of the third party.
Changes in the financial condition of the borrower or economic conditions or other circumstances may reduce the capacity of the borrower to make principal and interest payments on such instruments and may lead to defaults. The value of any collateral securing a bank loan may decline after the Fund invests, and there is a risk that the value of the collateral may not be sufficient to cover the amount owed to the Fund.
At December 31, 2020, the Funds had no unfunded loan commitments.
Repurchase Agreements
Each Fund may enter into repurchase agreements with certain banks and broker-dealers whereby a Fund acquires a security for cash and obtains a simultaneous commitment from the seller to repurchase the security at an agreed upon price and date. A Fund, through its custodian, takes possession of the securities collateralizing the repurchase agreement in a segregated account. Repurchase agreements must be fully collateralized at all times, but involve some risk to a Fund if the other party should default on its obligation and the Fund is delayed or prevented from recovering the collateral, or if the Fund is required to return collateral to a borrower at a time when it may realize a loss on the investment of that collateral.
251
Notes to Financial Statements (Continued) |
When-Issued, Delayed-Delivery, Forward Commitment, and To-Be-Announced Transactions
A Fund may enter into when-issued, delayed-delivery, forward commitment, or to-be-announced (“TBA”) transactions (collectively, the “Forward Transactions”) in order to lock in the purchase price of the underlying security, or in order to adjust the interest rate exposure of the Fund’s existing portfolio. In Forward Transactions, a Fund commits to purchase or sell particular securities, with payment and delivery to take place at a future date. In the case of TBA purchase commitments, the unit price and the estimated principal amount are established when the Fund enters into a commitment, with the actual principal amount being within a specified range of the estimate. Although a Fund does not typically pay for the securities in these types of transactions until they are delivered, it immediately assumes the risks of ownership, including the risk of price fluctuation. As a result, each of these types of transactions may create investment leverage in a Fund’s portfolio and increase the volatility of the Fund. If a Fund’s counterparty fails to deliver a security purchased in a Forward Transaction, there may be a loss, and the Fund may have missed an opportunity to make an alternative investment.
These securities are valued on the basis of valuations furnished by a pricing service, selected pursuant to procedures approved by the Trustees, which determines valuations taking into account appropriate factors such as institutional-size trading in similar groups of securities, yield, quality, coupon rate, maturity, type of issue, trading characteristics, and other market data. Securities for which no market quotation is available are valued at fair value in accordance with procedures approved by the Trustees. The Funds record on a daily basis the unrealized appreciation (depreciation) based upon changes in the values of these securities. When a Forward Transaction is closed, the Funds record a realized gain or loss equal to the difference between the value of the transaction at the time it was opened and the value of the transaction at the time it was closed.
Dollar Roll Transactions
A Fund may enter into dollar roll transactions, in which the Fund sells mortgage-backed securities for delivery in the current month and simultaneously contracts to purchase substantially similar securities on a specified future date from the same party. A Fund may invest in dollar rolls in order to benefit from anticipated changes in pricing for the mortgage-backed securities during the term of the transaction, or for the purpose of creating investment leverage. In a dollar roll, the securities that are to be purchased will be of the same type as the securities sold, but will be supported by different pools of mortgages.
Dollar rolls involve the risk that the Fund’s counterparty will be unable to deliver the mortgage-backed securities underlying the dollar roll at the fixed time. If the counterparty files for bankruptcy or becomes insolvent, a Fund’s use of the transaction proceeds may be restricted pending a determination by the counterparty or its representative, whether to enforce the Fund’s obligation to repurchase the securities. A Fund can incur a loss on a dollar roll transaction (either because its counterparty fails to perform or because the value of the mortgages subject to the transaction declines) and on the investments made by the Fund with the proceeds of the dollar roll transaction.
A Fund accounts for a dollar roll transaction as a purchase and sale whereby the difference in the sales price and purchase price of the security sold is recorded as a realized gain (loss). If certain criteria are met, these dollar roll transactions may be considered financing transactions, whereby the difference in the sales price and the future purchase price is recorded as an adjustment to interest income. Dollar roll transactions generally have the effect of creating leverage in a Fund’s portfolio.
Securities Lending
Each Fund, other than the Allocation Funds, Feeder Funds, and MML American Funds Core Allocation Fund, may lend its securities; however, lending cannot exceed 33% of the total assets of the Fund taken at current value. The Funds’ securities lending activities are governed by a Securities Lending Agency Agreement (“Lending Agreement”) between each Fund and the lending agent (“Agent”). The Lending Agreement authorizes the Agent to lend portfolio securities held by a Fund to approved borrowers (each, a “Borrower”).
Each Fund expects that in connection with any securities on loan, the loan will be secured continuously by collateral consisting of cash (U.S. currency) and/or securities (U.S. Treasury and Agency obligations) adjusted daily to have value at least equal to the current market value of the securities loaned. The market value of the loaned securities is determined at the close of business of a Fund and any additional collateral is delivered to the Fund the next business day. The Funds bear the risk of loss with respect
252
Notes to Financial Statements (Continued) |
to the investment of cash collateral. As with other extensions of credit, the Funds may bear the risk of delay in recovery of the loaned securities or even loss of rights in the collateral should the Borrower of the securities fail financially. Pursuant to the Lending Agreement, the Agent has provided indemnification to the Funds in the event of default by a Borrower with respect to a loan. The Funds receive compensation for lending their securities in the form of a securities loan fee paid by the Borrower, as well as a share of the income earned on investment of the cash collateral received for the loaned securities. At December 31, 2020, the Funds’ collateral was equal to or greater than 100% of the market value of securities on loan.
Subject to the terms of the Lending Agreement and the agreement between the Agent and the applicable Borrower (“Borrowing Agreement”), security loans can be terminated by the Agent, the Fund, or the Borrower and the related securities must be returned within the earlier of the customary settlement period for such securities or the period of time specified in the Borrowing Agreement.
The Funds employ the Agent to implement their securities lending program and the Agent receives a fee from the Funds for its services. In addition, the Funds may be required to pay a rebate to the Borrower. Accordingly, a Fund’s compensation for lending its securities is reduced by any such fees or rebate paid to the Agent or Borrower, respectively. Income received by the Funds in securities lending transactions during the year ended December 31, 2020, is reflected as securities lending income on the Statement of Operations.
Accounting for Investment Transactions
Investment transactions are accounted for on the trade date. Realized gains and losses on sales of investments and unrealized appreciation and depreciation of investments are computed by the specific identification cost method. Proceeds received from litigation, if any, are included in realized gains on investment transactions for any investments that are no longer held in the portfolio and as a reduction in cost for investments that continue to be held in the portfolio. Interest income, adjusted for amortization of discounts and premiums on debt securities, is earned from the settlement date and is recorded on the accrual basis. Dividend income, realized capital gain distributions and distributions including realized gain distributions are recorded on the ex-dividend date. Non-cash dividends received in the form of stock are recorded as dividend income at market value. Withholding taxes on foreign interest, dividends, and capital gains have been provided for in accordance with the applicable country’s tax rules and rates. Foreign dividend income is recorded on the ex-dividend date or as soon as practicable after the Fund determines the existence of a dividend declaration after exercising reasonable due diligence. Distributions received on securities that represent a return of capital or capital gains are recorded as a reduction of cost of investments and/or as a realized gain. The Funds determine the classification of distributions received as return of capital distributions or capital gain distributions.
Foreign Currency Translation
The books and records of the Funds are maintained in U.S. dollars. The market values of foreign currencies, foreign securities, and other assets and liabilities denominated in foreign currencies are translated into U.S. dollars at the mean of the buying and selling rates of such currencies against the U.S. dollar at the end of each business day. Purchases and sales of foreign securities and income and expense items are translated at the rates of exchange prevailing on the respective dates of such transactions. The Funds do not isolate that portion of the results of operations arising from changes in the exchange rates from that portion arising from changes in the market prices of securities. Net realized foreign currency gains and losses resulting from changes in exchange rates include foreign currency gains and losses between trade date and settlement date on investment securities transactions, foreign currency transactions, and the difference between the amounts of dividends or interest recorded on the books of the Funds and the amount actually received.
Allocation of Operating Activity
In maintaining the records for the Funds, the income and expense accounts are allocated daily to each class of shares. Investment income and loss, and unrealized and realized gains or losses are prorated among the classes of shares based on the relative net assets of each. Expenses are allocated to each class of shares depending on the nature of the expenditures. Administration and service fees, if any, which are directly attributable to a class of shares, are charged to that class’s operations. Expenses of a Fund not directly attributable to the operations of any specific class of shares of the Fund are prorated among the classes to which the expense relates based on relative net assets or another alternative method.
253
Notes to Financial Statements (Continued) |
In addition, each of the Allocation Funds, Feeder Funds, and MML American Funds Core Allocation Fund will also incur certain fees and expenses indirectly as a shareholder in the Underlying Funds or Master Funds. Because the Underlying Funds have varied expense and fee levels, and the Allocation Funds and MML American Funds Core Allocation Fund may own different proportions of Underlying Funds at different times, the amount of fees and expenses indirectly incurred by each of the Allocation Funds and MML American Funds Core Allocation Fund will vary.
Foreign Securities
The Global Fund invests a significant amount of its assets in foreign securities and each of the Foreign Fund and the International Equity Fund invests substantially all of its assets in foreign securities. The other Funds and certain Underlying Funds or Master Funds may also invest in foreign securities. Foreign securities, including American Depositary Receipts, are subject to additional risks compared to securities of U.S. issuers, including international trade, currency, political, regulatory, and diplomatic risks. In addition, fluctuations in currency exchange rates may adversely affect the values of foreign securities and the price of a Fund’s shares. Emerging markets securities are subject to greater risks than securities issued in developed foreign markets, including less liquidity, greater price volatility, higher relative rates of inflation, greater political, economic, and social instability, greater custody and operational risks, and greater volatility in currency exchange rates.
Federal Income Tax
It is each Fund’s intent to continue to comply with the provisions of Subchapter M of the Code, applicable to a regulated investment company. Under such provisions, the Funds would not be subject to federal income taxes on their ordinary income and net realized capital gains to the extent they are distributed or deemed to have been distributed to their shareholders. Therefore, the Funds have not made any provision for federal income tax.
Dividends and Distributions to Shareholders
Dividends from net investment income and distributions of any net realized capital gains of each Fund are declared and paid annually and at other times as may be required to satisfy tax or regulatory requirements.
Distributions to shareholders are recorded on the ex-dividend date. Income and capital gain distributions are determined in accordance with income tax regulations, which may differ from generally accepted accounting principles. As a result, net investment income and net realized capital gains on investment transactions for a reporting period may differ significantly from distributions during such period.
3. | Advisory Fees and Other Transactions |
Investment Advisory Fees and Investment Subadvisers
MML Advisers, a wholly-owned subsidiary of MassMutual, serves as investment adviser to each Fund. Under the investment advisory agreements between MML Advisers and the Trust on behalf of each Fund, MML Advisers is responsible for providing investment management services for each Fund. In return for these services, MML Advisers receives advisory fees, based upon each Fund’s average daily net assets, computed and accrued daily and payable monthly, at the annual rates shown in the following table.
MML Advisers has also entered into investment subadvisory agreements for certain Funds with the unaffiliated investment subadviser(s) shown in the following table. MML Advisers pays a subadvisory fee to each of these subadvisers based upon the aggregate net assets under management which include (1) the average daily net assets of the specified Fund which it manages, and, if applicable, (2) the average daily net assets of other Funds or accounts of MML Advisers or its affiliates for which the subadviser provides subadvisory services.
254
Notes to Financial Statements (Continued) |
The applicable Funds’ subadvisory fees are paid monthly by MML Advisers out of the advisory fees.
Fund | Investment Advisory Fee | Investment Subadviser(s) |
Conservative Allocation Fund | 0.10% | N/A |
Balanced Allocation Fund | 0.10% | N/A |
Moderate Allocation Fund | 0.10% | N/A |
Growth Allocation Fund | 0.10% | N/A |
Aggressive Allocation Fund | 0.10% | N/A |
MML American Funds Growth Fund | 0.15% on the first $500 million; and 0.125% on any excess over $500 million | N/A |
MML American Funds International Fund | 0.15% on the first $500 million; and 0.125% on any excess over $500 million | N/A |
MML American Funds Core Allocation Fund | 0.20% on the first $750 million; and 0.175% on any excess over $750 million | N/A |
Blue Chip Growth Fund | 0.75% on the first $400 million; and 0.70% on any excess over $400 million | T. Rowe Price Associates, Inc. |
Equity Income Fund | 0.75% on the first $500 million; and 0.70% on any excess over $500 million | T. Rowe Price Associates, Inc. |
Equity Index Fund | 0.10% on the first $500 million; and 0.08% on any excess over $500 million | Northern Trust Investments, Inc. |
Focused Equity Fund | 0.70% on the first $250 million; and 0.60% on any excess over $250 million | Wellington Management Company LLP |
Foreign Fund* | 0.86% on the first $500 million; and 0.82% on any excess over $500 million | Thompson, Siegel & Walmsley LLC |
Fundamental Equity Fund** | 0.60% on the first $250 million; and 0.58% on any excess over $250 million | Invesco Advisers, Inc. |
Fundamental Value Fund | 0.60% on the first $500 million; and 0.575% on any excess over $500 million | Boston Partners Global Investors, Inc. |
Global Fund | 0.60% on the first $500 million; and 0.55% on any excess over $500 million | Massachusetts Financial Services Company |
Growth & Income Fund | 0.50% on the first $500 million; and 0.475% on any excess over $500 million | Massachusetts Financial Services Company |
Income & Growth Fund | 0.65% on the first $500 million; and 0.60% on any excess over $500 million | Barrow, Hanley, Mewhinney & Strauss, LLC |
International Equity Fund | 0.80% on the first $250 million; and 0.75% on any excess over $250 million | Harris Associates L.P. |
Large Cap Growth Fund | 0.65% on the first $500 million; and 0.60% on any excess over $500 million | Loomis, Sayles & Company, L.P. |
Managed Volatility Fund | 0.75% on the first $500 million; and 0.70% on any excess over $500 million | Gateway Investment Advisers, LLC |
Mid Cap Growth Fund*** | 0.77% on the first $500 million; and 0.75% on any excess over $500 million | T. Rowe Price Associates, Inc.; and Wellington Management Company LLP |
Mid Cap Value Fund | 0.84% on the first $500 million; and 0.80% on any excess over $500 million | American Century Investment Management, Inc. |
Small Cap Growth Equity Fund | 1.04% on the first $200 million; and 1.00% on any excess over $200 million | Wellington Management Company LLP |
Small Company Value Fund | 0.80% on the first $150 million; and 0.70% on any excess over $150 million | T. Rowe Price Associates, Inc. |
Small/Mid Cap Value Fund | 0.75% on the first $500 million; and 0.70% on any excess over $500 million | AllianceBernstein L.P. |
Total Return Bond Fund | 0.40% on the first $500 million; and 0.38% on any excess over $500 million | Metropolitan West Asset Management, LLC |
* | Effective January 7, 2020, Thompson, Siegel & Walmsley LLC replaced Templeton Investment Counsel, LLC as subadviser to the Fund. Prior to July 1, 2020, the investment advisory fee for the Fund was 0.89% on the first $500 million; and 0.85% on any excess over $500 million. |
255
Notes to Financial Statements (Continued) |
** | Effective March 2, 2020, Invesco Advisers, Inc. replaced Wellington Management Company LLP as subadviser to the Fund. Prior to July 1, 2020, the investment advisory fee of the Fund was 0.62% on the first $250 million; and 0.60% on any excess over $250 million. |
*** | Effective January 7, 2020, Wellington Management Company LLP was added as a subadviser to the Fund. |
Administration Fees
For the Funds noted below, under a separate Administrative and Shareholder Services Agreement between the Trust and MML Advisers, on behalf of each Fund, MML Advisers is obligated to provide administrative and shareholder services and bear some of the Fund specific administrative expenses. In return for these services, MML Advisers receives an administrative services fee, based upon the average daily net assets of the applicable class of shares of the Funds, at the following annual rates:
| | Class I | Class II | Class III | Service
Class I |
MML American Funds Growth Fund | N/A | N/A | N/A | 0.25% |
MML American Funds International Fund | N/A | N/A | N/A | 0.25% |
MML American Funds Core Allocation Fund | N/A | N/A | N/A | 0.25% |
Equity Index Fund | 0.30% | 0.15% | None | 0.30% |
Focused Equity Fund | N/A | 0.15% | N/A | 0.15% |
Fundamental Equity Fund | N/A | 0.15% | N/A | 0.15% |
Fundamental Value Fund | N/A | 0.15% | N/A | 0.15% |
Global Fund | 0.15% | 0.15% | N/A | 0.15% |
International Equity Fund | N/A | 0.15% | N/A | 0.15% |
Small Company Value Fund | N/A | 0.15% | N/A | 0.15% |
Total Return Bond Fund | N/A | 0.15% | N/A | 0.15% |
Distribution and Service Fees
MML Distributors, LLC (the “Distributor”) acts as distributor to the Funds. Pursuant to a Distribution and Services Plan adopted by the Funds pursuant to Rule 12b-1 under the 1940 Act, Service Class shares and Service Class I shares of the Funds pay an annual fee of 0.25% of the average daily net asset value of Service Class shares and Service Class I shares. This fee, or a portion thereof, is paid to: (i) the Distributor for services provided and expenses incurred by it in connection with the distribution of Service Class shares or Service Class I shares, as applicable, of each Fund; and/or (ii) MassMutual for services provided and expenses incurred by it for purposes of maintaining or providing personal services to Service Class and Service Class I shareholders. The Distributor is a wholly-owned subsidiary of MassMutual.
Expense Caps and Waivers
MML Advisers has agreed to cap the fees and expenses of the Fund noted below (other than extraordinary litigation and legal expenses, Acquired Fund Fees and Expenses#, interest expense, short sale dividend and loan expense, or other non-recurring or unusual expenses such as organizational expenses and shareholder meeting expenses, as applicable) based upon the average daily net assets of the applicable class of shares of the Fund, as follows:
| | Class II | Service
Class I |
International Equity Fund* | 1.00% | 1.25% |
# | Acquired Fund Fees and Expenses are expenses borne indirectly by a Fund through investments in other pooled investment vehicles. |
* | Expense caps in effect through April 30, 2021. |
256
Notes to Financial Statements (Continued) |
Prior to May 1, 2020, MML Advisers agreed to cap the fees and expenses of the Fund noted below (other than extraordinary litigation and legal expenses, Acquired Fund Fees and Expenses#, interest expense, short sale dividend and loan expense, or other non-recurring or unusual expenses such as organizational expenses and shareholder meeting expenses, as applicable) based upon the average daily net assets of the applicable class of shares of the Fund, as follows:
| | Class II | Service
Class I |
Total Return Bond Fund | 0.60% | 0.85% |
# | Acquired Fund Fees and Expenses are expenses borne indirectly by a Fund through investments in other pooled investment vehicles. |
MML Advisers has agreed to voluntarily waive 0.03% of the advisory fee of the Equity Income Fund and 0.05% of the advisory fee of the Small Company Value Fund. MML Advisers may amend or discontinue these waivers at any time without advance notice.
MML Advisers has agreed to waive 0.02% of the advisory fee of the Fundamental Value Fund through April 30, 2021.
Effective March 2, 2020 through June 30, 2020, MML Advisers agreed to voluntarily waive 0.02% of the advisory fee of the Fundamental Equity Fund.
Effective July 1, 2020, MML Advisers has agreed to waive 0.02% of the advisory fee of the Foreign Fund through April 30, 2022. Prior to July 1, 2020, MML Advisers agreed to waive 0.04% of the advisory fee and agreed to voluntarily waive an additional 0.01% of the advisory fee of the Foreign Fund.
Effective October 1, 2020, MML Advisers has agreed to waive 0.03% of the advisory fee of the Small Cap Growth Equity Fund through April 30, 2022. Prior to October 1, 2020, MML Advisers agreed to waive 0.02% of the advisory fee of the Small Cap Growth Equity Fund.
Expense caps and waiver amounts are reflected as a reduction of expenses on the Statements of Operations.
Rebated Brokerage Commissions
The Funds listed below have entered into agreements with certain brokers whereby the brokers will rebate to the Funds, in cash, a portion of brokerage commissions. Rebated brokerage commissions are amounts earned by the Funds and are included with realized gain or loss on investment transactions presented in the Statements of Operations. For the year ended December 31, 2020, brokerage commissions rebated under these agreements were as follows:
| | Rebated
Commissions |
Focused Equity Fund | $ 80 |
Foreign Fund | 11,611 |
Fundamental Equity Fund | 2,990 |
Income & Growth Fund | 522 |
Large Cap Growth Fund | 3,663 |
Managed Volatility Fund | 905 |
Mid Cap Growth Fund | 360 |
Small Cap Growth Equity Fund | 3,610 |
Small/Mid Cap Value Fund | 806 |
257
Notes to Financial Statements (Continued) |
Deferred Compensation
Trustees of the Funds who are not officers or employees of MassMutual may elect to defer receipt of their annual fees in accordance with terms of a Non-Qualified Deferred Compensation Plan. Amounts deferred shall accrue interest or earnings and shall be recorded on the Funds’ books as other liabilities. Deferred compensation is included within Trustees’ fees and expenses in the Statements of Assets and Liabilities.
Other
Certain officers and trustees of the Funds may also be employees of MassMutual. The compensation of a trustee who is not an employee of MassMutual is borne by the Funds.
4. | Purchases and Sales of Investments |
Cost of purchases and proceeds from sales of investment securities (excluding short-term investments) and in Underlying Funds or Master Funds, for the year ended December 31, 2020, were as follows:
| | | Purchases | | | Sales | |
| | | Long-Term U.S.
Government
Securities | | | Other Long-Term
Securities | | | Long-Term U.S.
Government
Securities | | | Other Long-Term
Securities | |
Conservative Allocation Fund | | $ | — | | | $ | 176,841,596 | | | $ | — | | | $ | 177,835,068 | |
Balanced Allocation Fund | | | — | | | | 109,008,500 | | | | — | | | | 190,341,193 | |
Moderate Allocation Fund | | | — | | | | 367,103,997 | | | | — | | | | 711,042,711 | |
Growth Allocation Fund | | | — | | | | 251,269,547 | | | | — | | | | 636,340,010 | |
Aggressive Allocation Fund | | | — | | | | 24,811,941 | | | | — | | | | 37,707,504 | |
MML American Funds Growth Fund | | | — | | | | 17,696,591 | | | | — | | | | 46,683,208 | |
MML American Funds International Fund | | | — | | | | 2,980,521 | | | | — | | | | 13,266,992 | |
MML American Funds Core Allocation Fund | | | — | | | | 128,802,039 | | | | — | | | | 262,112,183 | |
Blue Chip Growth Fund | | | — | | | | 127,188,461 | | | | — | | | | 186,619,620 | |
Equity Income Fund | | | — | | | | 133,105,845 | | | | — | | | | 159,725,146 | |
Equity Index Fund | | | — | | | | 28,661,701 | | | | — | | | | 50,689,500 | |
Focused Equity Fund | | | — | | | | 106,237,796 | | | | — | | | | 155,578,707 | |
Foreign Fund | | | — | | | | 282,328,339 | | | | — | | | | 314,921,012 | |
Fundamental Equity Fund | | | — | | | | 204,125,268 | | | | — | | | | 171,419,060 | |
Fundamental Value Fund | | | — | | | | 163,221,964 | | | | — | | | | 175,760,224 | |
Global Fund | | | — | | | | 50,475,448 | | | | — | | | | 140,471,623 | |
Growth & Income Fund | | | — | | | | 23,612,291 | | | | — | | | | 39,746,884 | |
Income & Growth Fund | | | — | | | | 124,994,138 | | | | — | | | | 153,530,105 | |
International Equity Fund | | | — | | | | 73,715,352 | | | | — | | | | 99,757,533 | |
Large Cap Growth Fund | | | — | | | | 40,684,593 | | | | — | | | | 48,034,012 | |
Managed Volatility Fund | | | — | | | | 26,815,520 | | | | — | | | | 63,199,249 | |
Mid Cap Growth Fund | | | — | | | | 327,467,319 | | | | — | | | | 406,931,143 | |
Mid Cap Value Fund | | | — | | | | 282,525,185 | | | | — | | | | 326,175,050 | |
Small Cap Growth Equity Fund | | | — | | | | 144,497,067 | | | | — | | | | 184,805,374 | |
Small Company Value Fund | | | — | | | | 24,789,721 | | | | — | | | | 37,910,372 | |
Small/Mid Cap Value Fund | | | — | | | | 103,761,217 | | | | — | | | | 119,190,790 | |
Total Return Bond Fund | | | 1,069,704,258 | | | | 83,108,432 | | | | 1,075,560,802 | | | | 92,088,748 | |
258
Notes to Financial Statements (Continued) |
The Funds may purchase from, or sell securities to, other affiliated Funds under procedures adopted by the Trustees. These procedures have been designed to ensure that cross trades conducted by the Funds comply with Rule 17a-7 under the 1940 Act. The cross trades disclosed in the table below are included within the respective purchases and sales amounts shown in the table above, as applicable.
| | Purchases | Sales | Realized
Gains/Losses |
International Equity Fund | $ — | $ 18,180 | $ 7,331 |
5. | Capital Share Transactions |
Changes in shares outstanding for each Fund were as follows:
| | | Year Ended December 31, 2020 | | | Year Ended December 31, 2019 | |
| | | Shares | | | Amount | | | Shares | | | Amount | |
| Conservative Allocation Fund Initial Class | | | | | | | | | | | | | | | | |
| Sold | | | 8,070,287 | | | $ | 78,105,245 | | | | 1,150,644 | | | $ | 11,320,212 | |
| Issued as reinvestment of dividends | | | 533,037 | | | | 5,143,809 | | | | 624,393 | | | | 5,987,928 | |
| Redeemed | | | (8,836,415 | ) | | | (86,255,232 | ) | | | (2,032,976 | ) | | | (20,039,477 | ) |
| Net increase (decrease) | | | (233,091 | ) | | $ | (3,006,178 | ) | | | (257,939 | ) | | $ | (2,731,337 | ) |
| Conservative Allocation Fund Service Class | | | | | | | | | | | | | | | | |
| Sold | | | 12,428,691 | | | $ | 118,413,479 | | | | 3,363,488 | | | $ | 32,649,253 | |
| Issued as reinvestment of dividends | | | 1,797,609 | | | | 17,167,168 | | | | 2,092,102 | | | | 19,874,970 | |
| Redeemed | | | (12,920,993 | ) | | | (124,463,031 | ) | | | (7,207,841 | ) | | | (70,024,609 | ) |
| Net increase (decrease) | | | 1,305,307 | | | $ | 11,117,616 | | | | (1,752,251 | ) | | $ | (17,500,386 | ) |
| Balanced Allocation Fund Initial Class | | | | | | | | | | | | | | | | |
| Sold | | | 3,348,243 | | | $ | 32,393,282 | | | | 915,930 | | | $ | 9,052,968 | |
| Issued as reinvestment of dividends | | | 758,676 | | | | 7,252,946 | | | | 930,968 | | | | 8,806,961 | |
| Redeemed | | | (6,139,438 | ) | | | (59,368,011 | ) | | | (1,910,980 | ) | | | (18,697,556 | ) |
| Net increase (decrease) | | | (2,032,519 | ) | | $ | (19,721,783 | ) | | | (64,082 | ) | | $ | (837,627 | ) |
| Balanced Allocation Fund Service Class | | | | | | | | | | | | | | | | |
| Sold | | | 2,496,364 | | | $ | 23,775,082 | | | | 3,109,419 | | | $ | 30,234,589 | |
| Issued as reinvestment of dividends | | | 2,389,140 | | | | 22,625,157 | | | | 3,022,632 | | | | 28,322,059 | |
| Redeemed | | | (10,097,073 | ) | | | (96,472,899 | ) | | | (7,719,630 | ) | | | (74,646,169 | ) |
| Net increase (decrease) | | | (5,211,569 | ) | | $ | (50,072,660 | ) | | | (1,587,579 | ) | | $ | (16,089,521 | ) |
| Moderate Allocation Fund Initial Class | | | | | | | | | | | | | | | | |
| Sold | | | 4,303,316 | | | $ | 43,334,344 | | | | 1,241,801 | | | $ | 12,993,537 | |
| Issued as reinvestment of dividends | | | 2,464,075 | | | | 24,418,984 | | | | 3,168,515 | | | | 31,558,407 | |
| Redeemed | | | (14,698,891 | ) | | | (148,129,782 | ) | | | (4,530,277 | ) | | | (47,261,402 | ) |
| Net increase (decrease) | | | (7,931,500 | ) | | $ | (80,376,454 | ) | | | (119,961 | ) | | $ | (2,709,458 | ) |
| Moderate Allocation Fund Service Class | | | | | | | | | | | | | | | | |
| Sold | | | 2,891,557 | | | $ | 28,219,448 | | | | 4,281,862 | | | $ | 43,997,046 | |
| Issued as reinvestment of dividends | | | 11,091,265 | | | | 108,694,392 | | | | 14,626,731 | | | | 144,073,299 | |
| Redeemed | | | (35,056,747 | ) | | | (348,871,079 | ) | | | (26,630,216 | ) | | | (274,935,749 | ) |
| Net increase (decrease) | | | (21,073,925 | ) | | $ | (211,957,239 | ) | | | (7,721,623 | ) | | $ | (86,865,404 | ) |
| Growth Allocation Fund Initial Class | | | | | | | | | | | | | | | | |
| Sold | | | 7,228,505 | | | $ | 61,945,426 | | | | 1,271,993 | | | $ | 11,492,897 | |
| Issued as reinvestment of dividends | | | 5,176,208 | | | | 43,790,723 | | | | 6,986,716 | | | | 58,967,879 | |
| Redeemed | | | (27,114,733 | ) | | | (234,662,043 | ) | | | (9,127,828 | ) | | | (82,753,281 | ) |
| Net increase (decrease) | | | (14,710,020 | ) | | $ | (128,925,894 | ) | | | (869,119 | ) | | $ | (12,292,505 | ) |
259
Notes to Financial Statements (Continued) |
| | | Year Ended December 31, 2020 | | | Year Ended December 31, 2019 | |
| | | Shares | | | Amount | | | Shares | | | Amount | |
| Growth Allocation Fund Service Class | | | | | | | | | | | | | | | | |
| Sold | | | 2,299,902 | | | $ | 18,991,517 | | | | 1,683,402 | | | $ | 15,037,443 | |
| Issued as reinvestment of dividends | | | 8,625,889 | | | | 72,284,951 | | | | 11,917,878 | | | | 99,752,639 | |
| Redeemed | | | (35,274,738 | ) | | | (302,967,700 | ) | | | (14,899,719 | ) | | | (133,423,497 | ) |
| Net increase (decrease) | | | (24,348,947 | ) | | $ | (211,691,232 | ) | | | (1,298,439 | ) | | $ | (18,633,415 | ) |
| Aggressive Allocation Fund Initial Class | | | | | | | | | | | | | | | | |
| Sold | | | 885,937 | | | $ | 8,505,566 | | | | 605,438 | | | $ | 6,120,826 | |
| Issued as reinvestment of dividends | | | 577,711 | | | | 5,424,704 | | | | 741,988 | | | | 6,937,589 | |
| Redeemed | | | (1,830,142 | ) | | | (17,693,673 | ) | | | (790,422 | ) | | | (7,940,416 | ) |
| Net increase (decrease) | | | (366,494 | ) | | $ | (3,763,403 | ) | | | 557,004 | | | $ | 5,117,999 | |
| Aggressive Allocation Fund Service Class | | | | | | | | | | | | | | | | |
| Sold | | | 845,578 | | | $ | 7,539,036 | | | | 793,748 | | | $ | 7,711,067 | |
| Issued as reinvestment of dividends | | | 773,688 | | | | 7,141,143 | | | | 1,031,299 | | | | 9,487,948 | |
| Redeemed | | | (2,183,784 | ) | | | (19,933,035 | ) | | | (1,433,757 | ) | | | (14,167,302 | ) |
| Net increase (decrease) | | | (564,518 | ) | | $ | (5,252,856 | ) | | | 391,290 | | | $ | 3,031,713 | |
| MML American Funds Growth Fund Service Class I | | | | | | | | | | | | | | | | |
| Sold | | | 1,496,601 | | | $ | 24,284,167 | | | | 1,209,057 | | | $ | 16,921,717 | |
| Issued as reinvestment of dividends | | | 1,427,742 | | | | 24,143,106 | | | | 1,925,188 | | | | 24,103,348 | |
| Redeemed | | | (3,511,187 | ) | | | (58,166,315 | ) | | | (2,160,703 | ) | | | (30,308,338 | ) |
| Net increase (decrease) | | | (586,844 | ) | | $ | (9,739,042 | ) | | | 973,542 | | | $ | 10,716,727 | |
| MML American Funds International Fund Service Class I | | | | | | | | | | | | | | | | |
| Sold | | | 558,719 | | | $ | 4,875,407 | | | | 435,217 | | | $ | 4,297,878 | |
| Issued as reinvestment of dividends | | | 416,412 | | | | 3,830,988 | | | | 529,496 | | | | 4,781,345 | |
| Redeemed | | | (1,610,745 | ) | | | (15,226,488 | ) | | | (944,639 | ) | | | (9,360,227 | ) |
| Net increase (decrease) | | | (635,614 | ) | | $ | (6,520,093 | ) | | | 20,074 | | | $ | (281,004 | ) |
| MML American Funds Core Allocation Fund Service Class I | | | | | | | | | | | | | | | | |
| Sold | | | 3,949,042 | | | $ | 44,985,785 | | | | 2,794,411 | | | $ | 32,449,388 | |
| Issued as reinvestment of dividends | | | 5,879,250 | | | | 66,435,525 | | | | 8,591,186 | | | | 93,729,834 | |
| Redeemed | | | (17,719,081 | ) | | | (201,085,589 | ) | | | (13,002,185 | ) | | | (151,140,842 | ) |
| Net increase (decrease) | | | (7,890,789 | ) | | $ | (89,664,279 | ) | | | (1,616,588 | ) | | $ | (24,961,620 | ) |
| Blue Chip Growth Fund Initial Class | | | | | | | | | | | | | | | | |
| Sold | | | 2,779,197 | | | $ | 45,532,429 | | | | 1,945,288 | | | $ | 30,430,426 | |
| Issued as reinvestment of dividends | | | 1,420,003 | | | | 28,187,061 | | | | 2,380,301 | | | | 35,871,142 | |
| Redeemed | | | (5,519,341 | ) | | | (101,804,633 | ) | | | (3,267,709 | ) | | | (53,613,817 | ) |
| Net increase (decrease) | | | (1,320,141 | ) | | $ | (28,085,143 | ) | | | 1,057,880 | | | $ | 12,687,751 | |
| Blue Chip Growth Fund Service Class | | | | | | | | | | | | | | | | |
| Sold | | | 1,261,217 | | | $ | 21,011,993 | | | | 1,357,137 | | | $ | 21,425,008 | |
| Issued as reinvestment of dividends | | | 750,429 | | | | 14,108,057 | | | | 1,162,438 | | | | 16,692,604 | |
| Redeemed | | | (1,388,225 | ) | | | (23,419,396 | ) | | | (867,459 | ) | | | (13,661,137 | ) |
| Net increase (decrease) | | | 623,421 | | | $ | 11,700,654 | | | | 1,652,116 | | | $ | 24,456,475 | |
| Equity Income Fund Initial Class | | | | | | | | | | | | | | | | |
| Sold | | | 6,989,618 | | | $ | 63,211,371 | | | | 2,002,731 | | | $ | 21,174,454 | |
| Issued as reinvestment of dividends | | | 3,795,543 | | | | 33,362,820 | | | | 4,302,128 | | | | 42,720,131 | |
| Redeemed | | | (10,757,885 | ) | | | (100,563,613 | ) | | | (6,556,252 | ) | | | (71,841,606 | ) |
| Net increase (decrease) | | | 27,276 | | | $ | (3,989,422 | ) | | | (251,393 | ) | | $ | (7,947,021 | ) |
260
Notes to Financial Statements (Continued) |
| | | Year Ended December 31, 2020 | | | Year Ended December 31, 2019 | |
| | | Shares | | | Amount | | | Shares | | | Amount | |
| Equity Income Fund Service Class | | | | | | | | | | | | | | | | |
| Sold | | | 1,126,072 | | | $ | 9,878,222 | | | | 547,258 | | | $ | 5,901,616 | |
| Issued as reinvestment of dividends | | | 800,189 | | | | 6,937,635 | | | | 965,729 | | | | 9,473,801 | |
| Redeemed | | | (1,634,326 | ) | | | (14,954,955 | ) | | | (1,243,848 | ) | | | (13,522,355 | ) |
| Net increase (decrease) | | | 291,935 | | | $ | 1,860,902 | | | | 269,139 | | | $ | 1,853,062 | |
| Equity Index Fund Class I | | | | | | | | | | | | | | | | |
| Sold | | | 158,638 | | | $ | 4,484,060 | | | | 289,009 | | | $ | 9,065,259 | |
| Issued as reinvestment of dividends | | | 527,748 | | | | 14,127,801 | | | | 221,815 | | | | 6,401,570 | |
| Redeemed | | | (372,901 | ) | | | (10,890,498 | ) | | | (577,061 | ) | | | (18,206,612 | ) |
| Net increase (decrease) | | | 313,485 | | | $ | 7,721,363 | | | | (66,237 | ) | | $ | (2,739,783 | ) |
| Equity Index Fund Class II | | | | | | | | | | | | | | | | |
| Sold | | | 530,641 | | | $ | 15,968,112 | | | | 767,421 | | | $ | 24,666,876 | |
| Issued as reinvestment of dividends | | | 2,073,780 | | | | 55,432,137 | | | | 783,155 | | | | 22,586,203 | |
| Redeemed | | | (814,591 | ) | | | (23,496,849 | ) | | | (762,223 | ) | | | (24,112,631 | ) |
| Net increase (decrease) | | | 1,789,830 | | | $ | 47,903,400 | | | | 788,353 | | | $ | 23,140,448 | |
| Equity Index Fund Class III | | | | | | | | | | | | | | | | |
| Sold | | | 2,499,756 | | | $ | 65,345,495 | | | | 24,627 | | | $ | 747,178 | |
| Issued as reinvestment of dividends | | | 2,724,524 | | | | 72,635,801 | | | | 1,000,838 | | | | 28,794,121 | |
| Redeemed | | | (2,890,585 | ) | | | (75,837,713 | ) | | | (6,715,413 | ) | | | (217,400,488 | ) |
| Net increase (decrease) | | | 2,333,695 | | | $ | 62,143,583 | | | | (5,689,948 | ) | | $ | (187,859,189 | ) |
| Equity Index Fund Service Class I | | | | | | | | | | | | | | | | |
| Sold | | | 126,148 | | | $ | 3,336,003 | | | | 52,270 | | | $ | 1,630,880 | |
| Issued as reinvestment of dividends | | | 433,716 | | | | 11,098,783 | | | | 186,303 | | | | 5,197,860 | |
| Redeemed | | | (428,311 | ) | | | (11,892,177 | ) | | | (270,864 | ) | | | (8,309,139 | ) |
| Net increase (decrease) | | | 131,553 | | | $ | 2,542,609 | | | | (32,291 | ) | | $ | (1,480,399 | ) |
| Focused Equity Fund Class II | | | | | | | | | | | | | | | | |
| Sold | | | 4,190,889 | | | $ | 27,557,502 | | | | 40,688,967 | | | $ | 249,990,138 | |
| Issued as reinvestment of dividends | | | 2,281,227 | | | | 15,078,907 | | | | 1,044,822 | | | | 6,676,411 | |
| Redeemed | | | (12,159,930 | ) | | | (81,572,014 | ) | | | (6,863,314 | ) | | | (42,946,213 | ) |
| Net increase (decrease) | | | (5,687,814 | ) | | $ | (38,935,605 | ) | | | 34,870,475 | | | $ | 213,720,336 | |
| Focused Equity Fund Service Class I | | | | | | | | | | | | | | | | |
| Sold | | | 573,125 | | | $ | 3,507,834 | | | | 1,054,578 | | | $ | 6,302,984 | |
| Issued as reinvestment of dividends | | | 151,514 | | | | 965,147 | | | | 58,309 | | | | 359,769 | |
| Redeemed | | | (728,168 | ) | | | (4,619,674 | ) | | | (421,874 | ) | | | (2,521,223 | ) |
| Net increase (decrease) | | | (3,529 | ) | | $ | (146,693 | ) | | | 691,013 | | | $ | 4,141,530 | |
| Foreign Fund Initial Class | | | | | | | | | | | | | | | | |
| Sold | | | 3,436,660 | | | $ | 28,902,989 | | | | 2,376,131 | | | $ | 23,088,796 | |
| Issued as reinvestment of dividends | | | 1,988,950 | | | | 17,462,978 | | | | 1,111,272 | | | | 9,912,550 | |
| Redeemed | | | (9,235,463 | ) | | | (82,676,139 | ) | | | (4,840,874 | ) | | | (47,266,972 | ) |
| Net increase (decrease) | | | (3,809,853 | ) | | $ | (36,310,172 | ) | | | (1,353,471 | ) | | $ | (14,265,626 | ) |
| Foreign Fund Service Class | | | | | | | | | | | | | | | | |
| Sold | | | 109,823 | | | $ | 910,682 | | | | 95,474 | | | $ | 929,829 | |
| Issued as reinvestment of dividends | | | 62,146 | | | | 543,157 | | | | 32,260 | | | | 286,467 | |
| Redeemed | | | (313,500 | ) | | | (2,780,014 | ) | | | (163,993 | ) | | | (1,586,845 | ) |
| Net increase (decrease) | | | (141,531 | ) | | $ | (1,326,175 | ) | | | (36,259 | ) | | $ | (370,549 | ) |
| Fundamental Equity Fund Class II | | | | | | | | | | | | | | | | |
| Sold | | | 6,731,333 | | | $ | 66,303,639 | | | | 239,266 | | | $ | 2,469,054 | |
| Issued as reinvestment of dividends | | | 1,892,223 | | | | 19,054,687 | | | | 2,115,934 | | | | 19,254,998 | |
| Redeemed | | | (3,737,296 | ) | | | (37,875,208 | ) | | | (1,799,210 | ) | | | (18,456,314 | ) |
| Net increase (decrease) | | | 4,886,260 | | | $ | 47,483,118 | | | | 555,990 | | | $ | 3,267,738 | |
261
Notes to Financial Statements (Continued) |
| | | Year Ended December 31, 2020 | | | Year Ended December 31, 2019 | |
| | | Shares | | | Amount | | | Shares | | | Amount | |
| Fundamental Equity Fund Service Class I | | | | | | | | | | | | | | | | |
| Sold | | | 402,884 | | | $ | 3,900,820 | | | | 334,038 | | | $ | 3,357,964 | |
| Issued as reinvestment of dividends | | | 218,573 | | | | 2,117,974 | �� | | | 310,486 | | | | 2,735,384 | |
| Redeemed | | | (282,390 | ) | | | (2,676,182 | ) | | | (187,873 | ) | | | (1,889,738 | ) |
| Net increase (decrease) | | | 339,067 | | | $ | 3,342,612 | | | | 456,651 | | | $ | 4,203,610 | |
| Fundamental Value Fund Class II | | | | | | | | | | | | | | | | |
| Sold | | | 3,250,384 | | | $ | 36,451,213 | | | | 1,252,751 | | | $ | 15,773,985 | |
| Issued as reinvestment of dividends | | | 2,523,110 | | | | 25,483,413 | | | | 2,011,239 | | | | 23,310,264 | |
| Redeemed | | | (5,186,260 | ) | | | (55,943,088 | ) | | | (2,055,010 | ) | | | (27,104,933 | ) |
| Net increase (decrease) | | | 587,234 | | | $ | 5,991,538 | | | | 1,208,980 | | | $ | 11,979,316 | |
| Fundamental Value Fund Service Class I | | | | | | | | | | | | | | | | |
| Sold | | | 194,984 | | | $ | 2,016,509 | | | | 194,855 | | | $ | 2,498,878 | |
| Issued as reinvestment of dividends | | | 197,440 | | | | 1,948,736 | | | | 171,861 | | | | 1,954,060 | |
| Redeemed | | | (247,127 | ) | | | (2,599,090 | ) | | | (197,528 | ) | | | (2,576,940 | ) |
| Net increase (decrease) | | | 145,297 | | | $ | 1,366,155 | | | | 169,188 | | | $ | 1,875,998 | |
| Global Fund Class I | | | | | | | | | | | | | | | | |
| Sold | | | 2,916,187 | | | $ | 33,467,871 | | | | 18,053,305 | | | $ | 216,474,156 | |
| Issued as reinvestment of dividends | | | 1,525,486 | | | | 18,839,748 | | | | 1,285,902 | | | | 15,070,765 | |
| Redeemed | | | (10,498,280 | ) | | | (129,249,046 | ) | | | (4,928,971 | ) | | | (58,812,263 | ) |
| Net increase (decrease) | | | (6,056,607 | ) | | $ | (76,941,427 | ) | | | 14,410,236 | | | $ | 172,732,658 | |
| Global Fund Class II | | | | | | | | | | | | | | | | |
| Sold | | | 40,787 | | | $ | 499,749 | | | | 69,934 | | | $ | 872,601 | |
| Issued as reinvestment of dividends | | | 62,431 | | | | 790,380 | | | | 52,458 | | | | 629,501 | |
| Redeemed | | | (172,130 | ) | | | (2,109,788 | ) | | | (190,256 | ) | | | (2,324,624 | ) |
| Net increase (decrease) | | | (68,912 | ) | | $ | (819,659 | ) | | | (67,864 | ) | | $ | (822,522 | ) |
| Global Fund Service Class I | | | | | | | | | | | | | | | | |
| Sold | | | 191,853 | | | $ | 2,213,283 | | | | 252,500 | | | $ | 3,001,317 | |
| Issued as reinvestment of dividends | | | 66,044 | | | | 805,077 | | | | 47,939 | | | | 555,133 | |
| Redeemed | | | (291,522 | ) | | | (3,401,566 | ) | | | (335,890 | ) | | | (3,950,832 | ) |
| Net increase (decrease) | | | (33,625 | ) | | $ | (383,206 | ) | | | (35,451 | ) | | $ | (394,382 | ) |
| Growth & Income Fund Initial Class | | | | | | | | | | | | | | | | |
| Sold | | | 200,738 | | | $ | 3,655,539 | | | | 94,892 | | | $ | 1,791,132 | |
| Issued as reinvestment of dividends | | | 420,789 | | | | 7,969,735 | | | | 578,005 | | | | 10,219,127 | |
| Redeemed | | | (982,478 | ) | | | (18,267,234 | ) | | | (851,420 | ) | | | (15,977,062 | ) |
| Net increase (decrease) | | | (360,951 | ) | | $ | (6,641,960 | ) | | | (178,523 | ) | | $ | (3,966,803 | ) |
| Growth & Income Fund Service Class | | | | | | | | | | | | | | | | |
| Sold | | | 287,371 | | | $ | 5,182,815 | | | | 340,550 | | | $ | 6,266,996 | |
| Issued as reinvestment of dividends | | | 194,674 | | | | 3,654,039 | | | | 230,160 | | | | 4,037,009 | |
| Redeemed | | | (420,910 | ) | | | (7,692,264 | ) | | | (267,163 | ) | | | (4,977,564 | ) |
| Net increase (decrease) | | | 61,135 | | | $ | 1,144,590 | | | | 303,547 | | | $ | 5,326,441 | |
| Income & Growth Fund Initial Class | | | | | | | | | | | | | | | | |
| Sold | | | 3,767,937 | | | $ | 32,325,166 | | | | 2,138,466 | | | $ | 20,201,336 | |
| Issued as reinvestment of dividends | | | 666,588 | | | | 5,619,340 | | | | 1,598,367 | | | | 14,273,421 | |
| Redeemed | | | (7,882,508 | ) | | | (68,896,117 | ) | | | (4,459,488 | ) | | | (42,110,733 | ) |
| Net increase (decrease) | | | (3,447,983 | ) | | $ | (30,951,611 | ) | | | (722,655 | ) | | $ | (7,635,976 | ) |
| Income & Growth Fund Service Class | | | | | | | | | | | | | | | | |
| Sold | | | 338,125 | | | $ | 2,728,337 | | | | 298,281 | | | $ | 2,779,510 | |
| Issued as reinvestment of dividends | | | 63,377 | | | | 526,027 | | | | 177,012 | | | | 1,555,938 | |
| Redeemed | | | (666,759 | ) | | | (5,544,723 | ) | | | (388,075 | ) | | | (3,629,245 | ) |
| Net increase (decrease) | | | (265,257 | ) | | $ | (2,290,359 | ) | | | 87,218 | | | $ | 706,203 | |
262
Notes to Financial Statements (Continued) |
| | | Year Ended December 31, 2020 | | | Year Ended December 31, 2019 | |
| | | Shares | | | Amount | | | Shares | | | Amount | |
| International Equity Fund Class II | | | | | | | | | | | | | | | | |
| Sold | | | 3,624,857 | | | $ | 27,988,887 | | | | 1,823,191 | | | $ | 17,380,026 | |
| Issued as reinvestment of dividends | | | 1,219,463 | | | | 9,804,482 | | | | 1,724,923 | | | | 14,661,848 | |
| Redeemed | | | (6,497,422 | ) | | | (54,363,903 | ) | | | (3,241,156 | ) | | | (31,295,427 | ) |
| Net increase (decrease) | | | (1,653,102 | ) | | $ | (16,570,534 | ) | | | 306,958 | | | $ | 746,447 | |
| International Equity Fund Service Class I | | | | | | | | | | | | | | | | |
| Sold | | | 145,131 | | | $ | 1,108,693 | | | | 180,085 | | | $ | 1,715,692 | |
| Issued as reinvestment of dividends | | | 45,072 | | | | 359,225 | | | | 57,537 | | | | 485,036 | |
| Redeemed | | | (160,921 | ) | | | (1,307,043 | ) | | | (95,716 | ) | | | (917,010 | ) |
| Net increase (decrease) | | | 29,282 | | | $ | 160,875 | | | | 141,906 | | | $ | 1,283,718 | |
| Large Cap Growth Fund Initial Class | | | | | | | | | | | | | | | | |
| Sold | | | 2,116,130 | | | $ | 23,524,833 | | | | 757,370 | | | $ | 7,797,141 | |
| Issued as reinvestment of dividends | | | 417,709 | | | | 5,597,296 | | | | 1,125,271 | | | | 11,308,969 | |
| Redeemed | | | (2,510,605 | ) | | | (31,567,556 | ) | | | (1,886,569 | ) | | | (20,303,497 | ) |
| Net increase (decrease) | | | 23,234 | | | $ | (2,445,427 | ) | | | (3,928 | ) | | $ | (1,197,387 | ) |
| Large Cap Growth Fund Service Class | | | | | | | | | | | | | | | | |
| Sold | | | 390,025 | | | $ | 4,445,019 | | | | 456,792 | | | $ | 4,819,226 | |
| Issued as reinvestment of dividends | | | 70,613 | | | | 908,084 | | | | 193,633 | | | | 1,872,436 | |
| Redeemed | | | (340,624 | ) | | | (3,861,294 | ) | | | (243,988 | ) | | | (2,544,287 | ) |
| Net increase (decrease) | | | 120,014 | | | $ | 1,491,809 | | | | 406,437 | | | $ | 4,147,375 | |
| Managed Volatility Fund Initial Class | | | | | | | | | | | | | | | | |
| Sold | | | 1,598,706 | | | $ | 20,977,612 | | | | 903,580 | | | $ | 11,523,280 | |
| Issued as reinvestment of dividends | | | 119,237 | | | | 1,569,290 | | | | 160,936 | | | | 2,006,227 | |
| Redeemed | | | (2,761,263 | ) | | | (35,119,122 | ) | | | (1,776,812 | ) | | | (22,422,864 | ) |
| Net increase (decrease) | | | (1,043,320 | ) | | $ | (12,572,220 | ) | | | (712,296 | ) | | $ | (8,893,357 | ) |
| Managed Volatility Fund Service Class | | | | | | | | | | | | | | | | |
| Sold | | | 251,737 | | | $ | 3,248,172 | | | | 222,820 | | | $ | 2,815,961 | |
| Issued as reinvestment of dividends | | | 24,322 | | | | 317,733 | | | | 32,885 | | | | 406,901 | |
| Redeemed | | | (663,028 | ) | | | (8,511,098 | ) | | | (355,283 | ) | | | (4,455,507 | ) |
| Net increase (decrease) | | | (386,969 | ) | | $ | (4,945,193 | ) | | | (99,578 | ) | | $ | (1,232,645 | ) |
| Mid Cap Growth Fund Initial Class | | | | | | | | | | | | | | | | |
| Sold | | | 3,088,309 | | | $ | 40,930,051 | | | | 2,595,249 | | | $ | 42,447,148 | |
| Issued as reinvestment of dividends | | | 2,551,558 | | | | 39,651,202 | | | | 3,509,097 | | | | 51,794,275 | |
| Redeemed | | | (7,274,063 | ) | | | (115,568,075 | ) | | | (4,034,925 | ) | | | (64,094,597 | ) |
| Net increase (decrease) | | | (1,634,196 | ) | | $ | (34,986,822 | ) | | | 2,069,421 | | | $ | 30,146,826 | |
| Mid Cap Growth Fund Service Class | | | | | | | | | | | | | | | | |
| Sold | | | 501,086 | | | $ | 6,860,352 | | | | 592,734 | | | $ | 8,954,435 | |
| Issued as reinvestment of dividends | | | 722,637 | | | | 10,615,548 | | | | 1,008,644 | | | | 14,171,452 | |
| Redeemed | | | (1,536,899 | ) | | | (22,707,358 | ) | | | (1,048,108 | ) | | | (16,123,659 | ) |
| Net increase (decrease) | | | (313,176 | ) | | $ | (5,231,458 | ) | | | 553,270 | | | $ | 7,002,228 | |
| Mid Cap Value Fund Initial Class | | | | | | | | | | | | | | | | |
| Sold | | | 5,340,333 | | | $ | 44,917,037 | | | | 1,891,517 | | | $ | 19,673,030 | |
| Issued as reinvestment of dividends | | | 679,787 | | | | 6,322,018 | | | | 4,699,890 | | | | 43,755,980 | |
| Redeemed | | | (9,818,772 | ) | | | (93,934,795 | ) | | | (6,618,089 | ) | | | (69,084,598 | ) |
| Net increase (decrease) | | | (3,798,652 | ) | | $ | (42,695,740 | ) | | | (26,682 | ) | | $ | (5,655,588 | ) |
| Mid Cap Value Fund Service Class | | | | | | | | | | | | | | | | |
| Sold | | | 578,487 | | | $ | 5,063,098 | | | | 529,499 | | | $ | 5,430,477 | |
| Issued as reinvestment of dividends | | | 80,868 | | | | 737,517 | | | | 646,059 | | | | 5,898,516 | |
| Redeemed | | | (842,575 | ) | | | (7,745,062 | ) | | | (764,722 | ) | | | (7,827,110 | ) |
| Net increase (decrease) | | | (183,220 | ) | | $ | (1,944,447 | ) | | | 410,836 | | | $ | 3,501,883 | |
263
Notes to Financial Statements (Continued) |
| | | Year Ended December 31, 2020 | | | Year Ended December 31, 2019 | |
| | | Shares | | | Amount | | | Shares | | | Amount | |
| Small Cap Growth Equity Fund Initial Class | | | | | | | | | | | | | | | | |
| Sold | | | 1,383,925 | | | $ | 16,572,901 | | | | 667,827 | | | $ | 9,688,722 | |
| Issued as reinvestment of dividends | | | 1,530,354 | | | | 19,885,569 | | | | 2,306,199 | | | | 29,446,089 | |
| Redeemed | | | (4,295,245 | ) | | | (60,459,390 | ) | | | (2,763,599 | ) | | | (40,348,274 | ) |
| Net increase (decrease) | | | (1,380,966 | ) | | $ | (24,000,920 | ) | | | 210,427 | | | $ | (1,213,463 | ) |
| Small Cap Growth Equity Fund Service Class | | | | | | | | | | | | | | | | |
| Sold | | | 232,549 | | | $ | 2,762,475 | | | | 318,701 | | | $ | 4,336,752 | |
| Issued as reinvestment of dividends | | | 285,059 | | | | 3,402,966 | | | | 368,070 | | | | 4,374,302 | |
| Redeemed | | | (484,239 | ) | | | (6,010,938 | ) | | | (299,020 | ) | | | (4,139,621 | ) |
| Net increase (decrease) | | | 33,369 | | | $ | 154,503 | | | | 387,751 | | | $ | 4,571,433 | |
| Small Company Value Fund Class II | | | | | | | | | | | | | | | | |
| Sold | | | 338,532 | | | $ | 4,483,424 | | | | 198,392 | | | $ | 3,132,613 | |
| Issued as reinvestment of dividends | | | 270,351 | | | | 3,344,244 | | | | 811,986 | | | | 10,637,023 | |
| Redeemed | | | (1,359,262 | ) | | | (17,697,727 | ) | | | (767,891 | ) | | | (11,587,838 | ) |
| Net increase (decrease) | | | (750,379 | ) | | $ | (9,870,059 | ) | | | 242,487 | | | $ | 2,181,798 | |
| Small Company Value Fund Service Class I | | | | | | | | | | | | | | | | |
| Sold | | | 304,062 | | | $ | 3,526,786 | | | | 244,587 | | | $ | 3,548,308 | |
| Issued as reinvestment of dividends | | | 103,607 | | | | 1,232,924 | | | | 270,224 | | | | 3,412,926 | |
| Redeemed | | | (405,826 | ) | | | (5,013,773 | ) | | | (189,320 | ) | | | (2,802,632 | ) |
| Net increase (decrease) | | | 1,843 | | | $ | (254,063 | ) | | | 325,491 | | | $ | 4,158,602 | |
| Small/Mid Cap Value Fund Initial Class | | | | | | | | | | | | | | | | |
| Sold | | | 3,080,029 | | | $ | 24,812,916 | | | | 1,029,697 | | | $ | 11,659,265 | |
| Issued as reinvestment of dividends | | | 984,989 | | | | 8,658,051 | | | | 2,262,398 | | | | 22,035,759 | |
| Redeemed | | | (5,283,660 | ) | | | (50,362,051 | ) | | | (2,478,580 | ) | | | (28,259,786 | ) |
| Net increase (decrease) | | | (1,218,642 | ) | | $ | (16,891,084 | ) | | | 813,515 | | | $ | 5,435,238 | |
| Small/Mid Cap Value Fund Service Class | | | | | | | | | | | | | | | | |
| Sold | | | 386,463 | | | $ | 3,202,506 | | | | 286,077 | | | $ | 3,241,143 | |
| Issued as reinvestment of dividends | | | 124,257 | | | | 1,079,794 | | | | 289,953 | | | | 2,792,250 | |
| Redeemed | | | (577,178 | ) | | | (5,296,163 | ) | | | (271,623 | ) | | | (3,026,765 | ) |
| Net increase (decrease) | | | (66,458 | ) | | $ | (1,013,863 | ) | | | 304,407 | | | $ | 3,006,628 | |
| Total Return Bond Fund Class II | | | | | | | | | | | | | | | | |
| Sold | | | 6,019,322 | | | $ | 67,102,884 | | | | 3,948,884 | | | $ | 41,406,916 | |
| Issued as reinvestment of dividends | | | 936,309 | | | | 10,430,481 | | | | 964,465 | | | | 10,406,581 | |
| Redeemed | | | (13,281,923 | ) | | | (147,468,872 | ) | | | (7,875,810 | ) | | | (83,460,772 | ) |
| Net increase (decrease) | | | (6,326,292 | ) | | $ | (69,935,507 | ) | | | (2,962,461 | ) | | $ | (31,647,275 | ) |
| Total Return Bond Fund Service Class I | | | | | | | | | | | | | | | | |
| Sold | | | 2,212,987 | | | $ | 24,389,705 | | | | 923,100 | | | $ | 9,720,553 | |
| Issued as reinvestment of dividends | | | 136,362 | | | | 1,499,979 | | | | 83,845 | | | | 895,462 | |
| Redeemed | | | (950,279 | ) | | | (10,490,576 | ) | | | (342,465 | ) | | | (3,612,932 | ) |
| Net increase (decrease) | | | 1,399,070 | | | $ | 15,399,108 | | | | 664,480 | | | $ | 7,003,083 | |
264
Notes to Financial Statements (Continued) |
6. | Federal Income Tax Information |
At December 31, 2020, the aggregate cost of investments and the unrealized appreciation (depreciation) in the value of all investments owned by the Fund(s), as computed on a federal income tax basis, were as follows:
| | | Federal
Income Tax
Cost | | | Tax Basis
Unrealized
Appreciation | | | Tax Basis
Unrealized
(Depreciation) | | | Net Unrealized
Appreciation
(Depreciation) | |
Conservative Allocation Fund | | $ | 413,102,291 | | | $ | 22,229,840 | | | $ | (179,315 | ) | | $ | 22,050,525 | |
Balanced Allocation Fund | | | 455,510,809 | | | | 29,712,951 | | | | (1,802,895 | ) | | | 27,910,056 | |
Moderate Allocation Fund | | | 1,789,468,512 | | | | 103,486,087 | | | | (12,760,071 | ) | | | 90,726,016 | |
Growth Allocation Fund | | | 1,151,933,867 | | | | 102,607,151 | | | | (8,292,621 | ) | | | 94,314,530 | |
Aggressive Allocation Fund | | | 150,813,573 | | | | 11,134,733 | | | | (1,567,136 | ) | | | 9,567,597 | |
MML American Funds Growth Fund | | | 156,549,999 | | | | 101,191,839 | | | | – | | | | 101,191,839 | |
MML American Funds International Fund | | | 49,411,975 | | | | 11,706,936 | | | | – | | | | 11,706,936 | |
MML American Funds Core Allocation Fund | | | 840,577,871 | | | | 104,182,898 | | | | – | | | | 104,182,898 | |
Blue Chip Growth Fund | | | 263,244,121 | | | | 270,566,280 | | | | (122,060 | ) | | | 270,444,220 | |
Equity Income Fund | | | 370,270,477 | | | | 99,474,122 | | | | (17,377,428 | ) | | | 82,096,694 | |
Equity Index Fund | | | 367,623,982 | | | | 307,755,606 | | | | (21,775,811 | ) | | | 285,979,795 | |
Focused Equity Fund | | | 248,369,250 | | | | 47,192,569 | | | | (799,374 | ) | | | 46,393,195 | |
Foreign Fund | | | 257,188,134 | | | | 36,286,817 | | | | (15,603,100 | ) | | | 20,683,717 | |
Fundamental Equity Fund | | | 148,179,336 | | | | 34,913,219 | | | | (1,100,046 | ) | | | 33,813,173 | |
Fundamental Value Fund | | | 164,023,904 | | | | 33,392,854 | | | | (2,208,090 | ) | | | 31,184,764 | |
Global Fund | | | 313,177,571 | | | | 96,738,048 | | | | (6,730,688 | ) | | | 90,007,360 | |
Growth & Income Fund | | | 85,818,858 | | | | 69,280,336 | | | | (758,623 | ) | | | 68,521,713 | |
Income & Growth Fund | | | 228,859,358 | | | | 44,604,626 | | | | (4,118,034 | ) | | | 40,486,592 | |
International Equity Fund | | | 153,686,466 | | | | 18,501,344 | | | | (5,942,030 | ) | | | 12,559,314 | |
Large Cap Growth Fund | | | 82,365,893 | | | | 61,918,245 | | | | (1,392,473 | ) | | | 60,525,772 | |
Managed Volatility Fund | | | 82,675,458 | | | | 57,796,186 | | | | (5,559,132 | ) | | | 52,237,054 | |
Mid Cap Growth Fund | | | 380,789,846 | | | | 181,640,688 | | | | (4,822,438 | ) | | | 176,818,250 | |
Mid Cap Value Fund | | | 349,127,597 | | | | 53,401,392 | | | | (2,506,580 | ) | | | 50,894,812 | |
Small Cap Growth Equity Fund | | | 161,903,152 | | | | 65,159,278 | | | | (3,194,200 | ) | | | 61,965,078 | |
Small Company Value Fund | | | 67,615,246 | | | | 27,761,228 | | | | (3,066,531 | ) | | | 24,694,697 | |
Small/Mid Cap Value Fund | | | 164,583,339 | | | | 35,224,647 | | | | (5,138,312 | ) | | | 30,086,335 | |
Total Return Bond Fund | | | 368,190,116 | | | | 13,048,892 | | | | (1,081,877 | ) | | | 11,967,015 | |
Net capital loss carryforwards may be applied against any net realized taxable gains in succeeding years, subject to the carryforward period limitations, where applicable. On December 22, 2010, the Regulated Investment Company Modernization Act of 2010 (the “Modernization Act”) was signed by the President. The Modernization Act changed the capital loss carryforward rules as they relate to regulated investment companies. Capital losses generated in tax years beginning after the date of enactment may now be carried forward indefinitely, and retain the character of the original loss.
At December 31, 2020, the following Fund(s) had post-enactment accumulated capital loss carryforwards:
| | | Short Term
Capital Loss
Carryforward | | | Long Term
Capital Loss
Carryforward | |
Foreign Fund | | $ | 3,796,996 | | | $ | 2,617,174 | |
Fundamental Value Fund | | | 2,594,735 | | | | — | |
Income & Growth Fund | | | 5,902,034 | | | | 4,441,172 | |
International Equity Fund | | | — | | | | 9,630,995 | |
265
Notes to Financial Statements (Continued) |
| | | Short Term
Capital Loss
Carryforward | | | Long Term
Capital Loss
Carryforward | |
Managed Volatility Fund | | $ | 2,517,847 | | | $ | — | |
Small/Mid Cap Value Fund | | | — | | | | 5,296,826 | |
Net capital loss carryforwards for the Fund(s) shown in the above table are from post-enactment years and are, therefore, not subject to the eight-year carryforward period and possible expiration.
Generally accepted accounting principles in the United States of America require that only distributions in excess of tax basis earnings and profits be reported in the financial statements as a return of capital.
The tax character of distributions (including capital gain dividends, if any, designated pursuant to Section 852 of the Code) paid during the year ended December 31, 2020, was as follows:
| | | Ordinary
Income | | | Long Term
Capital Gain | |
Conservative Allocation Fund | | $ | 10,451,222 | | | $ | 11,859,755 | |
Balanced Allocation Fund | | | 12,332,889 | | | | 17,545,214 | |
Moderate Allocation Fund | | | 43,751,364 | | | | 89,362,012 | |
Growth Allocation Fund | | | 28,093,261 | | | | 87,982,413 | |
Aggressive Allocation Fund | | | 2,214,208 | | | | 10,351,639 | |
MML American Funds Growth Fund | | | 1,556,780 | | | | 22,586,326 | |
MML American Funds International Fund | | | 585,682 | | | | 3,245,306 | |
MML American Funds Core Allocation Fund | | | 16,119,849 | | | | 50,315,676 | |
Blue Chip Growth Fund | | | — | | | | 42,295,118 | |
Equity Income Fund | | | 11,325,031 | | | | 28,975,424 | |
Equity Index Fund | | | 12,122,939 | | | | 141,171,583 | |
Focused Equity Fund | | | 6,643,227 | | | | 9,400,827 | |
Foreign Fund | | | 8,258,161 | | | | 9,747,974 | |
Fundamental Equity Fund | | | 2,072,887 | | | | 19,099,774 | |
Fundamental Value Fund | | | 2,611,480 | | | | 24,820,669 | |
Global Fund | | | 4,629,338 | | | | 15,805,867 | |
Growth & Income Fund | | | 1,210,155 | | | | 10,413,619 | |
Income & Growth Fund | | | 6,073,988 | | | | 71,379 | |
International Equity Fund | | | 7,760,880 | | | | 2,402,827 | |
Large Cap Growth Fund | | | 490,579 | | | | 6,014,801 | |
Managed Volatility Fund | | | 1,887,023 | | | | — | |
Mid Cap Growth Fund | | | 1,921,875 | | | | 48,344,875 | |
Mid Cap Value Fund | | | 7,059,535 | | | | — | |
Small Cap Growth Equity Fund | | | 4,430,669 | | | | 18,857,866 | |
Small Company Value Fund | | | 504,882 | | | | 4,072,286 | |
Small/Mid Cap Value Fund | | | 2,285,693 | | | | 7,452,152 | |
Total Return Bond Fund | | | 11,930,460 | | | | — | |
266
Notes to Financial Statements (Continued) |
The tax character of distributions (including capital gain dividends, if any, designated pursuant to Section 852 of the Code) paid during the year ended December 31, 2019, was as follows:
| | | Ordinary
Income | | | Long Term
Capital Gain | |
Conservative Allocation Fund | | $ | 10,342,993 | | | $ | 15,519,906 | |
Balanced Allocation Fund | | | 12,564,829 | | | | 24,564,191 | |
Moderate Allocation Fund | | | 48,785,966 | | | | 126,845,740 | |
Growth Allocation Fund | | | 32,280,377 | | | | 126,440,141 | |
Aggressive Allocation Fund | | | 2,782,167 | | | | 13,643,370 | |
MML American Funds Growth Fund | | | 581,644 | | | | 23,521,704 | |
MML American Funds International Fund | | | 1,681,469 | | | | 3,099,876 | |
MML American Funds Core Allocation Fund | | | 23,619,099 | | | | 70,110,735 | |
Blue Chip Growth Fund | | | — | | | | 52,563,746 | |
Equity Income Fund | | | 10,992,816 | | | | 41,201,116 | |
Equity Index Fund | | | 15,714,159 | | | | 47,265,595 | |
Focused Equity Fund | | | 2,445,340 | | | | 4,590,840 | |
Foreign Fund | | | 5,562,658 | | | | 4,636,359 | |
Fundamental Equity Fund | | | 804,414 | | | | 21,185,968 | |
Fundamental Value Fund | | | 5,758,712 | | | | 19,505,612 | |
Global Fund | | | 2,941,507 | | | | 13,313,892 | |
Growth & Income Fund | | | 1,280,311 | | | | 12,975,825 | |
Income & Growth Fund | | | 7,767,467 | | | | 8,061,892 | |
International Equity Fund | | | 4,167,641 | | | | 10,979,243 | |
Large Cap Growth Fund | | | 572,002 | | | | 12,609,403 | |
Managed Volatility Fund | | | 2,413,128 | | | | — | |
Mid Cap Growth Fund | | | 4,508,524 | | | | 61,457,203 | |
Mid Cap Value Fund | | | 11,796,114 | | | | 37,858,382 | |
Small Cap Growth Equity Fund | | | 4,266,404 | | | | 29,553,987 | |
Small Company Value Fund | | | 381,109 | | | | 13,668,840 | |
Small/Mid Cap Value Fund | | | 2,820,675 | | | | 22,007,334 | |
Total Return Bond Fund | | | 11,302,043 | | | | — | |
The following Fund(s) have elected to pass through the foreign tax credit for the year ended December 31, 2020:
| | | Amount | |
Conservative Allocation Fund | | $ | 54,413 | |
Balanced Allocation Fund | | | 76,667 | |
Moderate Allocation Fund | | | 398,967 | |
Growth Allocation Fund | | | 356,836 | |
Aggressive Allocation Fund | | | 44,712 | |
MML American Funds International Fund | | | 56,855 | |
MML American Funds Core Allocation Fund | | | 113,264 | |
Foreign Fund | | | 554,838 | |
Global Fund | | | 351,642 | |
International Equity Fund | | | 223,631 | |
267
Notes to Financial Statements (Continued) |
Capital accounts within the financial statements are periodically adjusted for permanent differences between book and tax accounting. These adjustments have no impact on net assets or the results of operations. Temporary book and tax accounting differences will reverse in subsequent periods. At December 31, 2020, temporary book and tax accounting differences were primarily attributable to the deferral of wash sale losses, deferred Trustee compensation, and other temporary basis adjustments.
At December 31, 2020, the components of distributable earnings on a tax basis were as follows:
| | | Undistributed
Ordinary
Income | | | Undistributed
Long Term
Capital Gain
(Capital Loss
Carryover) | | | Other
Temporary
Differences | | | Unrealized
Appreciation
(Depreciation) | |
Conservative Allocation Fund | | $ | 4,128,921 | | | $ | 11,819,541 | | | $ | (37,996 | ) | | $ | 22,050,525 | |
Balanced Allocation Fund | | | 5,190,216 | | | | 14,035,146 | | | | (46,655 | ) | | | 27,910,056 | |
Moderate Allocation Fund | | | 21,093,264 | | | | 66,099,506 | | | | (172,441 | ) | | | 90,726,016 | |
Growth Allocation Fund | | | 17,316,130 | | | | 51,905,814 | | | | (142,145 | ) | | | 94,314,530 | |
Aggressive Allocation Fund | | | 1,925,003 | | | | 6,785,610 | | | | (9,834 | ) | | | 9,567,597 | |
MML American Funds Growth Fund | | | — | | | | 15,195,896 | | | | (8,962 | ) | | | 101,191,839 | |
MML American Funds International Fund | | | 78,134 | | | | 899,793 | | | | (4,793 | ) | | | 11,706,936 | |
MML American Funds Core Allocation Fund | | | 12,436,584 | | | | 22,679,169 | | | | (65,540 | ) | | | 104,182,898 | |
Blue Chip Growth Fund | | | — | | | | 59,439,657 | | | | (34,723 | ) | | | 270,444,221 | |
Equity Income Fund | | | 10,277,015 | | | | 7,884,209 | | | | (55,936 | ) | | | 82,097,701 | |
Equity Index Fund | | | 10,841,879 | | | | 30,554,408 | | | | (72,421 | ) | | | 285,979,795 | |
Focused Equity Fund | | | 5,336,488 | | | | 15,300,442 | | | | (6,968 | ) | | | 46,393,196 | |
Foreign Fund | | | 6,600,890 | | | | (6,414,170 | ) | | | (40,903 | ) | | | 20,736,399 | |
Fundamental Equity Fund | | | 4,821,103 | | | | 14,477,399 | | | | (13,196 | ) | | | 33,813,175 | |
Fundamental Value Fund | | | 3,297,998 | | | | (2,594,735 | ) | | | (18,520 | ) | | | 31,188,166 | |
Global Fund | | | 3,476,455 | | | | 34,229,859 | | | | (15,855 | ) | | | 90,055,250 | |
Growth & Income Fund | | | 1,357,958 | | | | 9,151,446 | | | | (18,690 | ) | | | 68,521,504 | |
Income & Growth Fund | | | 4,619,830 | | | | (10,343,206 | ) | | | (24,482 | ) | | | 40,486,592 | |
International Equity Fund | | | 1,068,813 | | | | (9,630,995 | ) | | | (10,719 | ) | | | 12,604,914 | |
Large Cap Growth Fund | | | 1,300,620 | | | | 16,591,265 | | | | (16,027 | ) | | | 60,525,772 | |
Managed Volatility Fund | | | 1,373,709 | | | | (2,517,847 | ) | | | (32,064 | ) | | | 52,237,993 | |
Mid Cap Growth Fund | | | 12,556,137 | | | | 86,004,692 | | | | (41,887 | ) | | | 176,818,250 | |
Mid Cap Value Fund | | | 5,076,599 | | | | 8,396,925 | | | | (51,183 | ) | | | 50,895,748 | |
Small Cap Growth Equity Fund | | | 14,816,699 | | | | 17,261,333 | | | | (31,534 | ) | | | 61,965,079 | |
Small Company Value Fund | | | 498,749 | | | | 5,704,596 | | | | (9,935 | ) | | | 24,694,697 | |
Small/Mid Cap Value Fund | | | 1,982,686 | | | | (5,296,826 | ) | | | (24,843 | ) | | | 30,086,336 | |
Total Return Bond Fund | | | 20,691,367 | | | | 3,692,900 | | | | (32,407 | ) | | | 11,966,866 | |
268
Notes to Financial Statements (Continued) |
During the year ended December 31, 2020, the following amounts were reclassified due to permanent differences between book and tax accounting:
| | | Paid-in
Capital | | | Accumulated
Net Realized
Gain (Loss) on
Investments | | | Undistributed
Net Investment
Income (Loss) | |
Conservative Allocation Fund | | $ | — | | | $ | (896,450 | ) | | $ | 896,450 | |
Balanced Allocation Fund | | | — | | | | (1,237,720 | ) | | | 1,237,720 | |
Moderate Allocation Fund | | | 1 | | | | (5,345,396 | ) | | | 5,345,395 | |
Growth Allocation Fund | | | — | | | | (4,398,717 | ) | | | 4,398,717 | |
Aggressive Allocation Fund | | | — | | | | (531,862 | ) | | | 531,862 | |
MML American Funds Growth Fund | | | (264,462 | ) | | | (10 | ) | | | 264,472 | |
MML American Funds Core Allocation Fund | | | 1 | | | | (2,379,501 | ) | | | 2,379,500 | |
Blue Chip Growth Fund | | | (1,752,363 | ) | | | (351,398 | ) | | | 2,103,761 | |
Equity Income Fund | | | — | | | | 9,860 | | | | (9,860 | ) |
Equity Index Fund | | | — | | | | (1,312,896 | ) | | | 1,312,896 | |
Focused Equity Fund | | | — | | | | 3,109 | | | | (3,109 | ) |
Foreign Fund | | | — | | | | (42,172 | ) | | | 42,172 | |
Fundamental Equity Fund | | | — | | | | 8,663 | | | | (8,663 | ) |
Fundamental Value Fund | | | 1 | | | | 71,484 | | | | (71,485 | ) |
Global Fund | | | — | | | | 16,967 | | | | (16,967 | ) |
Growth & Income Fund | | | (377 | ) | | | 39,300 | | | | (38,923 | ) |
Income & Growth Fund | | | 3 | | | | 169,852 | | | | (169,855 | ) |
International Equity Fund | | | — | | | | 121,711 | | | | (121,711 | ) |
Managed Volatility Fund | | | — | | | | (325,083 | ) | | | 325,083 | |
Mid Cap Growth Fund | | | — | | | | (1,210,063 | ) | | | 1,210,063 | |
Mid Cap Value Fund | | | 17,981 | | | | 1,533,001 | | | | (1,550,982 | ) |
Small Cap Growth Equity Fund | | | — | | | | (556,671 | ) | | | 556,671 | |
Small Company Value Fund | | | — | | | | (66,461 | ) | | | 66,461 | |
Small/Mid Cap Value Fund | | | — | | | | 8 | | | | (8 | ) |
Total Return Bond Fund | | | — | | | | (1,262,113 | ) | | | 1,262,113 | |
The Funds did not have any unrecognized tax benefits at December 31, 2020, nor were there any increases or decreases in unrecognized tax benefits for the year then ended. The Funds recognize interest and penalties, if any, related to unrecognized tax benefits as an income tax expense in the Statements of Operations. During the year ended December 31, 2020, the Funds did not incur any such interest or penalties. The Funds are subject to examination by U.S. federal and state tax authorities for returns filed for the prior three fiscal years. Foreign taxes are provided for based on the Funds’ understanding of the tax rules and rates that exist in the foreign markets in which they invest.
269
Notes to Financial Statements (Continued) |
7. Investment in Affiliated Issuers
A summary of the Funds’ transactions in the securities of affiliated issuers during the year ended December 31, 2020, was as follows:
| | | Beginning
Value as of
12/31/19 | | | Purchases | | | Sales | | | Change in
Unrealized
Appreciation/
Depreciation | | | Net
Realized
Gain (Loss) | | | Value as of
12/31/20 | | | Number of
Shares Held
as of
12/31/20 | | | Dividend
Income | | | Realized
Gains
Distributions | |
Conservative Allocation Fund | | | | | | | | | | | | | | | | | | | | | | | | | | | | | | | | | | | | |
MML Blue Chip Growth Fund, Initial Class | | $ | 11,636,554 | | | $ | 5,647,973 | | | $ | (5,804,349 | ) | | $ | 2,415,320 | | | $ | 627,697 | | | $ | 14,523,195 | | | | 708,103 | | | $ | — | | | $ | 1,087,460 | |
MML Dynamic Bond Fund, Class II | | | 55,344,583 | | | | 19,282,553 | | | | (24,943,864 | ) | | | 1,061,936 | | | | 692,932 | | | | 51,438,140 | | | | 4,927,025 | | | | 169,711 | | | | — | |
MML Equity Income Fund, Initial Class | | | 12,876,499 | | | | 7,730,673 | | | | (4,509,839 | ) | | | 965,693 | | | | (1,189,816 | ) | | | 15,873,210 | | | | 1,544,087 | | | | 330,365 | | | | 945,358 | |
MML Equity Index Fund, Class III | | | 944,007 | | | | 496,248 | | | | (225,400 | ) | | | (41,222 | ) | | | (30,497 | ) | | | 1,143,136 | | | | 39,446 | | | | 18,972 | | | | 231,270 | |
MML Focused Equity Fund, Class II | | | 16,672,231 | | | | 8,843,398 | | | | (6,286,939 | ) | | | 697,117 | | | | 819,970 | | | | 20,745,777 | | | | 2,861,486 | | | | 150,949 | | | | 827,598 | |
MML Foreign Fund, Initial Class | | | 8,051,494 | | | | 3,638,906 | | | | (2,910,784 | ) | | | 700,110 | | | | (411,766 | ) | | | 9,067,960 | | | | 904,986 | | | | 235,691 | | | | 277,414 | |
MML Fundamental Equity Fund, Class II | | | 7,115,314 | | | | 7,752,326 | | | | (3,182,245 | ) | | | 1,590,527 | | | | (636,607 | ) | | | 12,639,315 | | | | 1,177,942 | | | | 4,409 | | | | 1,380,635 | |
MML Fundamental Value Fund, Class II | | | 12,009,269 | | | | 7,854,441 | | | | (4,304,778 | ) | | | 524,826 | | | | (1,516,818 | ) | | | 14,566,940 | | | | 1,253,609 | | | | 168,501 | | | | 1,578,406 | |
MML Global Fund, Class I | | | 19,718,465 | | | | 12,244,694 | | | | (11,331,255 | ) | | | 2,699,574 | | | | 836,697 | | | | 24,168,175 | | | | 1,731,245 | | | | 270,305 | | | | 954,186 | |
MML High Yield Fund, Class II | | | 11,956,901 | | | | 3,239,566 | | | | (4,727,066 | ) | | | 1,085,778 | | | | (459,516 | ) | | | 11,095,663 | | | | 1,098,581 | | | | 2,542 | | | | — | |
MML Income & Growth Fund, Initial Class | | | 13,162,819 | | | | 5,543,355 | | | | (4,693,924 | ) | | | 1,676,043 | | | | (1,421,664 | ) | | | 14,266,629 | | | | 1,426,663 | | | | 250,719 | | | | 35,289 | |
MML Inflation-Protected and Income Fund, Initial Class | | | 16,866,008 | | | | 5,080,598 | | | | (8,121,470 | ) | | | 1,200,107 | | | | 386,988 | | | | 15,412,231 | | | | 1,350,765 | | | | 17,507 | | | | — | |
MML International Equity Fund, Class II | | | 9,817,292 | | | | 3,672,540 | | | | (4,885,965 | ) | | | 824,158 | | | | (436,072 | ) | | | 8,991,953 | | | | 900,997 | | | | 268,468 | | | | 237,492 | |
MML Large Cap Growth Fund, Initial Class | | | 3,063,152 | | | | 3,018,723 | | | | (1,900,628 | ) | | | 771,835 | | | | 332,267 | | | | 5,285,349 | | | | 378,065 | | | | 15,810 | | | | 214,624 | |
MML Managed Bond Fund, Initial Class | | | 85,527,270 | | | | 34,464,066 | | | | (38,259,066 | ) | | | 4,404,526 | | | | 1,599,241 | | | | 87,736,037 | | | | 6,454,684 | | | | 76,871 | | | | — | |
MML Mid Cap Growth Fund, Initial Class | | | 10,431,430 | | | | 9,202,019 | | | | (6,309,846 | ) | | | 2,668,811 | | | | 142,792 | | | | 16,135,206 | | | | 891,448 | | | | 10,621 | | | | 1,302,137 | |
MML Mid Cap Value Fund, Initial Class | | | 9,127,793 | | | | 7,090,000 | | | | (4,441,508 | ) | | | 1,509,837 | | | | (550,347 | ) | | | 12,735,775 | | | | 1,202,623 | | | | 216,730 | | | | — | |
MML Short-Duration Bond Fund, Class II | | | 22,843,273 | | | | 7,524,602 | | | | (8,130,477 | ) | | | 538,948 | | | | (158,494 | ) | | | 22,617,852 | | | | 2,298,562 | | | | 63 | | | | — | |
MML Small Cap Growth Equity Fund, Initial Class | | | 1,839,468 | | | | 775,834 | | | | (857,553 | ) | | | 394,004 | | | | 26,508 | | | | 2,178,261 | | | | 129,179 | | | | — | | | | 203,838 | |
MML Small Company Value Fund, Class II | | | 4,198,729 | | | | 1,125,085 | | | | (1,193,895 | ) | | | 399,331 | | | | (188,839 | ) | | | 4,340,411 | | | | 284,617 | | | | 9,363 | | | | 178,908 | |
MML Small/Mid Cap Value Fund, Initial Class | | | 2,511,258 | | | | 1,577,492 | | | | (993,729 | ) | | | 470,339 | | | | (321,302 | ) | | | 3,244,058 | | | | 296,532 | | | | 28,802 | | | | 119,072 | |
MML Strategic Emerging Markets Fund, Class II | | | 1,640,316 | | | | 782,446 | | | | (984,752 | ) | | | 98,108 | | | | 157,432 | | | | 1,693,550 | | | | 117,363 | | | | 7,123 | | | | 45,445 | |
MML Total Return Bond Fund, Class II | | | 47,752,538 | | | | 16,761,387 | | | | (19,972,124 | ) | | | 1,130,667 | | | | 1,148,306 | | | | 46,820,774 | | | | 4,150,778 | | | | 1,442,982 | | | | 206,590 | |
| | | $ | 385,106,663 | | | $ | 173,348,925 | | | $ | (168,971,456 | ) | | $ | 27,786,373 | | | $ | (550,908 | ) | | $ | 416,719,597 | | | | | | | $ | 3,696,504 | | | $ | 9,825,722 | |
270
Notes to Financial Statements (Continued) |
| | | Beginning
Value as of
12/31/19 | | | Purchases | | | Sales | | | Change in
Unrealized
Appreciation/
Depreciation | | | Net
Realized
Gain (Loss) | | | Value as of
12/31/20 | | | Number of
Shares Held
as of
12/31/20 | | | Dividend
Income | | | Realized
Gains
Distributions | |
Balanced Allocation Fund | | | | | | | | | | | | | | | | | | | | | | | | | | | | | | | | | | | | |
MML Blue Chip Growth Fund, Initial Class | | $ | 17,817,696 | | | $ | 7,116,112 | | | $ | (10,429,740 | ) | | $ | 3,837,812 | | | $ | 1,761,253 | | | $ | 20,103,133 | | | | 980,163 | | | $ | — | | | $ | 1,667,212 | |
MML Dynamic Bond Fund, Class II | | | 59,442,046 | | | | 11,830,975 | | | | (22,171,517 | ) | | | 1,424,961 | | | | 716,486 | | | | 51,242,951 | | | | 4,908,329 | | | | 185,742 | | | | — | |
MML Equity Income Fund, Initial Class | | | 19,564,530 | | | | 5,859,694 | | | | (4,634,142 | ) | | | (152,633 | ) | | | (905,011 | ) | | | 19,732,438 | | | | 1,919,498 | | | | 464,915 | | | | 1,330,384 | |
MML Equity Index Fund, Class III | | | 1,373,256 | | | | 362,134 | | | | (276,543 | ) | | | (104,465 | ) | | | (18,282 | ) | | | 1,336,100 | | | | 46,104 | | | | 25,198 | | | | 307,162 | |
MML Focused Equity Fund, Class II | | | 22,735,295 | | | | 5,464,072 | | | | (6,334,671 | ) | | | 1,219,290 | | | | 664,016 | | | | 23,748,002 | | | | 3,275,587 | | | | 197,506 | | | | 1,082,852 | |
MML Foreign Fund, Initial Class | | | 15,665,107 | | | | 1,754,593 | | | | (4,082,664 | ) | | | 654,512 | | | | (860,073 | ) | | | 13,131,475 | | | | 1,310,526 | | | | 379,217 | | | | 446,347 | |
MML Fundamental Equity Fund, Class II | | | 10,679,407 | | | | 12,374,323 | | | | (2,969,347 | ) | | | 2,180,933 | | | | (473,027 | ) | | | 21,792,289 | | | | 2,030,968 | | | | 7,723 | | | | 2,418,424 | |
MML Fundamental Value Fund, Class II | | | 17,308,435 | | | | 4,935,313 | | | | (4,492,537 | ) | | | (274,562 | ) | | | (1,557,183 | ) | | | 15,919,466 | | | | 1,370,006 | | | | 210,804 | | | | 1,974,668 | |
MML Global Fund, Class I | | | 35,693,340 | | | | 4,584,588 | | | | (16,308,337 | ) | | | 924,811 | | | | (183,617 | ) | | | 24,710,785 | | | | 1,770,114 | | | | 293,180 | | | | 1,034,940 | |
MML High Yield Fund, Class II | | | 12,859,143 | | | | 311,443 | | | | (2,923,442 | ) | | | 972,676 | | | | (451,198 | ) | | | 10,768,622 | | | | 1,066,200 | | | | 2,781 | | | | — | |
MML Income & Growth Fund, Initial Class | | | 19,873,747 | | | | 3,664,188 | | | | (4,984,021 | ) | | | 1,390,515 | | | | (1,299,117 | ) | | | 18,645,312 | | | | 1,864,531 | | | | 372,243 | | | | 52,393 | |
MML Inflation-Protected and Income Fund, Initial Class | | | 19,472,893 | | | | 5,499,964 | | | | (7,807,788 | ) | | | 1,488,103 | | | | 159,690 | | | | 18,812,862 | | | | 1,648,805 | | | | 17,732 | | | | — | |
MML International Equity Fund, Class II | | | 15,826,325 | | | | 4,295,259 | | | | (5,705,346 | ) | | | 1,149,766 | | | | (718,782 | ) | | | 14,847,222 | | | | 1,487,698 | | | | 471,190 | | | | 416,823 | |
MML Large Cap Growth Fund, Initial Class | | | 6,443,710 | | | | 2,637,417 | | | | (1,996,117 | ) | | | 2,164,737 | | | | 389,169 | | | | 9,638,916 | | | | 689,479 | | | | 31,171 | | | | 423,144 | |
MML Managed Bond Fund, Initial Class | | | 96,044,609 | | | | 12,826,843 | | | | (33,374,750 | ) | | | 5,801,566 | | | | 762,911 | | | | 82,061,179 | | | | 6,037,188 | | | | 83,624 | | | | — | |
MML Mid Cap Growth Fund, Initial Class | | | 17,777,164 | | | | 7,176,243 | | | | (8,283,475 | ) | | | 3,543,845 | | | | 406,593 | | | | 20,620,370 | | | | 1,139,247 | | | | 16,522 | | | | 2,025,503 | |
MML Mid Cap Value Fund, Initial Class | | | 17,097,902 | | | | 4,220,753 | | | | (6,635,889 | ) | | | 1,888,833 | | | | (1,153,123 | ) | | | 15,418,476 | | | | 1,455,947 | | | | 327,023 | | | | — | |
MML Short-Duration Bond Fund, Class II | | | 24,890,000 | | | | 3,223,170 | | | | (5,975,541 | ) | | | 480,714 | | | | (139,691 | ) | | | 22,478,652 | | | | 2,284,416 | | | | 69 | | | | — | |
MML Small Cap Growth Equity Fund, Initial Class | | | 2,943,680 | | | | 419,127 | | | | (1,079,067 | ) | | | 388,503 | | | | 90,310 | | | | 2,762,553 | | | | 163,829 | | | | — | | | | 293,858 | |
MML Small Company Value Fund, Class II | | | 6,410,281 | | | | 379,653 | | | | (1,624,990 | ) | | | 466,742 | | | | (465,148 | ) | | | 5,166,538 | | | | 338,789 | | | | 12,619 | | | | 241,137 | |
MML Small/Mid Cap Value Fund, Initial Class | | | 5,106,057 | | | | 710,470 | | | | (1,019,244 | ) | | | 271,281 | | | | (374,684 | ) | | | 4,693,880 | | | | 429,057 | | | | 46,317 | | | | 191,485 | |
MML Strategic Emerging Markets Fund, Class II | | | 4,923,621 | | | | 445,941 | | | | (1,334,425 | ) | | | 405,165 | | | | 148,237 | | | | 4,588,539 | | | | 317,986 | | | | 20,004 | | | | 127,629 | |
MML Total Return Bond Fund, Class II | | | 51,789,501 | | | | 7,404,049 | | | | (20,791,895 | ) | | | 1,240,646 | | | | 1,124,887 | | | | 40,767,188 | | | | 3,614,112 | | | | 1,406,090 | | | | 201,309 | |
| | | $ | 501,737,745 | | | $ | 107,496,324 | | | $ | (175,235,488 | ) | | $ | 31,363,751 | | | $ | (2,375,384 | ) | | $ | 462,986,948 | | | | | | | $ | 4,571,670 | | | $ | 14,235,270 | |
271
Notes to Financial Statements (Continued) |
| | | Beginning
Value as of
12/31/19 | | | Purchases | | | Sales | | | Change in
Unrealized
Appreciation/
Depreciation | | | Net
Realized
Gain (Loss) | | | Value as of
12/31/20 | | | Number of
Shares Held
as of
12/31/20 | | | Dividend
Income | | | Realized
Gains
Distributions | |
Moderate Allocation Fund | | | | | | | | | | | | | | | | | | | | | | | | | | | | | | | | | | | | |
MML Blue Chip Growth Fund, Initial Class | | $ | 86,070,475 | | | $ | 14,997,217 | | | $ | (26,048,884 | ) | | $ | 13,841,615 | | | $ | 5,527,671 | | | $ | 94,388,094 | | | | 4,602,052 | | | $ | — | | | $ | 7,342,508 | |
MML Dynamic Bond Fund, Class II | | | 184,141,398 | | | | 34,109,188 | | | | (63,543,136 | ) | | | 4,200,708 | | | | 2,251,936 | | | | 161,160,094 | | | | 15,436,791 | | | | 548,334 | | | | — | |
MML Equity Income Fund, Initial Class | | | 96,832,134 | | | | 24,657,031 | | | | (20,958,028 | ) | | | (1,374,804 | ) | | | (6,593,257 | ) | | | 92,563,076 | | | | 9,004,190 | | | | 2,072,284 | | | | 5,929,967 | |
MML Equity Index Fund, Class III | | | 5,853,538 | | | | 1,807,771 | | | | (1,125,627 | ) | | | (420,936 | ) | | | (97,701 | ) | | | 6,017,045 | | | | 207,628 | | | | 114,287 | | | | 1,393,143 | |
MML Focused Equity Fund, Class II | | | 131,131,396 | | | | 20,766,711 | | | | (28,916,633 | ) | | | 5,106,935 | | | | 3,485,603 | | | | 131,574,012 | | | | 18,148,140 | | | | 1,036,630 | | | | 5,683,468 | |
MML Foreign Fund, Initial Class | | | 70,871,296 | | | | 11,110,075 | | | | (18,901,308 | ) | | | 1,598,034 | | | | (3,890,349 | ) | | | 60,787,748 | | | | 6,066,641 | | | | 1,829,194 | | | | 2,152,995 | |
MML Fundamental Equity Fund, Class II | | | 44,894,915 | | | | 30,756,060 | | | | (12,944,100 | ) | | | 6,637,868 | | | | (1,917,596 | ) | | | 67,427,147 | | | | 6,283,984 | | | | 24,084 | | | | 7,542,316 | |
MML Fundamental Value Fund, Class II | | | 85,150,047 | | | | 25,975,102 | | | | (22,021,583 | ) | | | (820,393 | ) | | | (8,781,744 | ) | | | 79,501,429 | | | | 6,841,775 | | | | 1,065,072 | | | | 9,976,868 | |
MML Global Fund, Class I | | | 180,074,543 | | | | 18,682,507 | | | | (47,219,654 | ) | | | 10,626,565 | | | | 1,042,806 | | | | 163,206,767 | | | | 11,691,029 | | | | 1,795,793 | | | | 6,339,215 | |
MML High Yield Fund, Class II | | | 40,038,083 | | | | 69,520 | | | | (29,542,948 | ) | | | 2,765,270 | | | | (1,948,886 | ) | | | 11,381,039 | | | | 1,126,836 | | | | 7,604 | | | | — | |
MML Income & Growth Fund, Initial Class | | | 97,029,674 | | | | 14,780,849 | | | | (24,077,947 | ) | | | 6,458,488 | | | | (7,470,489 | ) | | | 86,720,575 | | | | 8,672,058 | | | | 1,767,859 | | | | 248,828 | |
MML Inflation-Protected and Income Fund, Initial Class | | | 61,247,456 | | | | 13,151,589 | | | | (22,513,969 | ) | | | 4,718,826 | | | | 863,187 | | | | 57,467,089 | | | | 5,036,555 | | | | 56,252 | | | | — | |
MML International Equity Fund, Class II | | | 78,678,686 | | | | 12,499,105 | | | | (19,743,586 | ) | | | 772,789 | | | | (3,538,640 | ) | | | 68,668,354 | | | | 6,880,597 | | | | 2,164,148 | | | | 1,914,443 | |
MML Large Cap Growth Fund, Initial Class | | | 25,961,531 | | | | 12,036,257 | | | | (8,486,080 | ) | | | 5,874,646 | | | | 1,564,507 | | | | 36,950,861 | | | | 2,643,123 | | | | 107,325 | | | | 1,456,944 | |
MML Managed Bond Fund, Initial Class | | | 284,832,981 | | | | 41,589,051 | | | | (97,551,262 | ) | | | 17,569,399 | | | | 1,674,663 | | | | 248,114,832 | | | | 18,253,650 | | | | 242,279 | | | | — | |
MML Mid Cap Growth Fund, Initial Class | | | 96,486,038 | | | | 19,202,924 | | | | (30,520,380 | ) | | | 14,145,818 | | | | 81,422 | | | | 99,395,822 | | | | 5,491,482 | | | | 74,340 | | | | 9,114,076 | |
MML Mid Cap Value Fund, Initial Class | | | 87,965,355 | | | | 6,574,540 | | | | (20,488,151 | ) | | | 4,596,728 | | | | (5,291,077 | ) | | | 73,357,395 | | | | 6,927,044 | | | | 1,358,171 | | | | — | |
MML Short-Duration Bond Fund, Class II | | | 77,813,892 | | | | 7,710,778 | | | | (22,483,739 | ) | | | 1,374,638 | | | | (448,011 | ) | | | 63,967,558 | | | | 6,500,768 | | | | 187 | | | | — | |
MML Small Cap Growth Equity Fund, Initial Class | | | 14,051,151 | | | | 3,505,019 | | | | (4,433,938 | ) | | | 2,285,330 | | | | 376,413 | | | | 15,783,975 | | | | 936,047 | | | | — | | | | 1,659,883 | |
MML Small Company Value Fund, Class II | | | 30,410,587 | | | | 3,684,943 | | | | (6,290,338 | ) | | | 2,569,553 | | | | (2,129,975 | ) | | | 28,244,770 | | | | 1,852,116 | | | | 68,527 | | | | 1,309,455 | |
MML Small/Mid Cap Value Fund, Initial Class | | | 26,579,626 | | | | 4,570,877 | | | | (5,903,511 | ) | | | 1,199,924 | | | | (1,959,901 | ) | | | 24,487,015 | | | | 2,238,301 | | | | 248,823 | | | | 1,028,692 | |
MML Strategic Emerging Markets Fund, Class II | | | 53,559,245 | | | | 7,753,124 | | | | (29,863,592 | ) | | | (1,360,530 | ) | | | 7,641,454 | | | | 37,729,701 | | | | 2,614,671 | | | | 224,735 | | | | 1,433,845 | |
MML Total Return Bond Fund, Class II | | | 165,230,445 | | | | 31,533,897 | | | | (58,837,447 | ) | | | 4,278,149 | | | | 3,405,018 | | | | 145,610,062 | | | | 12,908,693 | | | | 4,429,928 | | | | 634,228 | |
| | | $ | 2,024,904,492 | | | $ | 361,524,135 | | | $ | (622,415,841 | ) | | $ | 106,644,620 | | | $ | (16,152,946 | ) | | $ | 1,854,504,460 | | | | | | | $ | 19,235,856 | | | $ | 65,160,874 | |
272
Notes to Financial Statements (Continued) |
| | | Beginning
Value as of
12/31/19 | | | Purchases | | | Sales | | | Change in
Unrealized
Appreciation/
Depreciation | | | Net
Realized
Gain (Loss) | | | Value as of
12/31/20 | | | Number of
Shares Held
as of
12/31/20 | | | Dividend
Income | | | Realized
Gains
Distributions | |
Growth Allocation Fund | | | | | | | | | | | | | | | | | | | | | | | | | | | | | | | | | | | | |
MML Blue Chip Growth Fund, Initial Class | | $ | 70,699,258 | | | $ | 17,028,873 | | | $ | (29,028,991 | ) | | $ | 12,547,913 | | | $ | 6,943,314 | | | $ | 78,190,367 | | | | 3,812,305 | | | $ | — | | | $ | 7,212,529 | |
MML Dynamic Bond Fund, Class II | | | 85,389,620 | | | | 11,218,919 | | | | (48,972,019 | ) | | | 782,176 | | | | 1,645,636 | | | | 50,064,332 | | | | 4,795,434 | | | | 207,609 | | | | — | |
MML Equity Income Fund, Initial Class | | | 79,471,187 | | | | 18,109,232 | | | | (25,538,465 | ) | | | 666,570 | | | | (6,952,772 | ) | | | 65,755,752 | | | | 6,396,474 | | | | 1,789,398 | | | | 5,120,468 | |
MML Equity Index Fund, Class III | | | 5,204,617 | | | | 1,307,687 | | | | (1,381,371 | ) | | | (312,857 | ) | | | (184,950 | ) | | | 4,633,126 | | | | 159,873 | | | | 97,596 | | | | 1,189,688 | |
MML Focused Equity Fund, Class II | | | 112,672,816 | | | | 5,871,526 | | | | (37,076,416 | ) | | | 2,018,077 | | | | 3,856,221 | | | | 87,342,224 | | | | 12,047,203 | | | | 833,691 | | | | 4,570,821 | |
MML Foreign Fund, Initial Class | | | 67,038,756 | | | | 5,141,976 | | | | (21,483,648 | ) | | | 1,589,800 | | | | (3,407,097 | ) | | | 48,879,787 | | | | 4,878,222 | | | | 1,634,353 | | | | 1,923,664 | |
MML Fundamental Equity Fund, Class II | | | 34,227,405 | | | | 30,108,098 | | | | (17,475,505 | ) | | | 6,560,351 | | | | (2,398,218 | ) | | | 51,022,131 | | | | 4,755,091 | | | | 21,394 | | | | 6,699,834 | |
MML Fundamental Value Fund, Class II | | | 70,576,691 | | | | 20,563,625 | | | | (23,385,914 | ) | | | 386,392 | | | | (8,067,101 | ) | | | 60,073,693 | | | | 5,169,853 | | | | 901,675 | | | | 8,446,278 | |
MML Global Fund, Class I | | | 151,174,860 | | | | 13,814,498 | | | | (48,949,223 | ) | | | 9,086,870 | | | | 758,269 | | | | 125,885,274 | | | | 9,017,570 | | | | 1,552,990 | | | | 5,482,117 | |
MML High Yield Fund, Class II | | | 19,937,896 | | | | 2,093,431 | | | | (7,005,622 | ) | | | 1,577,036 | | | | (793,922 | ) | | | 15,808,819 | | | | 1,565,230 | | | | 4,688 | | | | — | |
MML Income & Growth Fund, Initial Class | | | 81,935,670 | | | | 8,333,742 | | | | (24,947,758 | ) | | | 4,811,110 | | | | (5,849,592 | ) | | | 64,283,172 | | | | 6,428,317 | | | | 1,471,475 | | | | 207,111 | |
MML Inflation-Protected and Income Fund, Initial Class | | | 58,922,504 | | | | 6,302,090 | | | | (25,681,032 | ) | | | 4,234,885 | | | | 1,102,088 | | | | 44,880,535 | | | | 3,933,439 | | | | 58,326 | | | | — | |
MML International Equity Fund, Class II | | | 65,820,648 | | | | 15,303,104 | | | | (22,686,076 | ) | | | 3,260,011 | | | | (3,503,082 | ) | | | 58,194,605 | | | | 5,831,123 | | | | 2,039,315 | | | | 1,804,013 | |
MML Large Cap Growth Fund, Initial Class | | | 24,485,326 | | | | 7,294,923 | | | | (11,438,122 | ) | | | 5,752,802 | | | | 2,237,289 | | | | 28,332,218 | | | | 2,026,625 | | | | 107,415 | | | | 1,458,172 | |
MML Managed Bond Fund, Initial Class | | | 134,403,534 | | | | 21,957,598 | | | | (67,976,552 | ) | | | 5,880,955 | | | | 2,519,167 | | | | 96,784,702 | | | | 7,120,389 | | | | 104,042 | | | | — | |
MML Mid Cap Growth Fund, Initial Class | | | 81,625,414 | | | | 19,115,042 | | | | (35,968,708 | ) | | | 11,822,019 | | | | 1,966,126 | | | | 78,559,893 | | | | 4,340,326 | | | | 68,563 | | | | 8,405,727 | |
MML Mid Cap Value Fund, Initial Class | | | 71,618,466 | | | | 11,127,505 | | | | (23,051,204 | ) | | | 5,876,210 | | | | (4,926,848 | ) | | | 60,644,129 | | | | 5,726,547 | | | | 1,250,153 | | | | — | |
MML Short-Duration Bond Fund, Class II | | | 43,263,031 | | | | 1,076,764 | | | | (14,028,545 | ) | | | 738,302 | | | | (239,653 | ) | | | 30,809,899 | | | | 3,131,087 | | | | 107 | | | | — | |
MML Small Cap Growth Equity Fund, Initial Class | | | 15,006,166 | | | | 1,855,978 | | | | (4,245,343 | ) | | | 2,531,391 | | | | 70,054 | | | | 15,218,246 | | | | 902,498 | | | | — | | | | 1,768,040 | |
MML Small Company Value Fund, Class II | | | 29,863,715 | | | | 2,183,053 | | | | (7,909,074 | ) | | | 2,773,198 | | | | (2,550,020 | ) | | | 24,360,872 | | | | 1,597,434 | | | | 66,803 | | | | 1,276,513 | |
MML Small/Mid Cap Value Fund, Initial Class | | | 24,002,391 | | | | 1,887,348 | | | | (6,453,801 | ) | | | 1,236,874 | | | | (2,059,596 | ) | | | 18,613,216 | | | | 1,701,391 | | | | 208,356 | | | | 861,390 | |
MML Strategic Emerging Markets Fund, Class II | | | 56,110,565 | | | | 4,729,734 | | | | (23,781,211 | ) | | | (120,699 | ) | | | 6,385,765 | | | | 43,324,154 | | | | 3,002,367 | | | | 228,826 | | | | 1,459,944 | |
MML Total Return Bond Fund, Class II | | | 74,065,614 | | | | 21,612,890 | | | | (45,784,524 | ) | | | 544,520 | | | | 2,775,016 | | | | 53,213,516 | | | | 4,717,510 | | | | 1,793,053 | | | | 256,709 | |
| | | $ | 1,457,516,150 | | | $ | 248,037,636 | | | $ | (574,249,124 | ) | | $ | 84,243,906 | | | $ | (10,673,906 | ) | | $ | 1,204,874,662 | | | | | | | $ | 14,439,828 | | | $ | 58,143,018 | |
273
Notes to Financial Statements (Continued) |
| | | Beginning
Value as of
12/31/19 | | | Purchases | | | Sales | | | Change in
Unrealized
Appreciation/
Depreciation | | | Net
Realized
Gain (Loss) | | | Value as of
12/31/20 | | | Number of
Shares Held
as of
12/31/20 | | | Dividend
Income | | | Realized
Gains
Distributions | |
Aggressive Allocation Fund | | | | | | | | | | | | | | | | | | | | | | | | | | | | | | | | | | | | |
MML Blue Chip Growth Fund, Initial Class | | $ | 8,834,198 | | | $ | 1,520,072 | | | $ | (1,847,091 | ) | | $ | 1,741,555 | | | $ | 410,722 | | | $ | 10,659,456 | | | | 519,720 | | | $ | — | | | $ | 840,996 | |
MML Dynamic Bond Fund, Class II | | | 3,562,486 | | | | 166,313 | | | | (2,158,581 | ) | | | 12,784 | | | | 71,112 | | | | 1,654,114 | | | | 158,440 | | | | 6,266 | | | | — | |
MML Equity Income Fund, Initial Class | | | 9,897,070 | | | | 1,784,454 | | | | (1,782,855 | ) | | | (283,575 | ) | | | (422,481 | ) | | | 9,192,613 | | | | 894,223 | | | | 208,166 | | | | 595,679 | |
MML Equity Index Fund, Class III | | | 672,032 | | | | 196,705 | | | | (103,047 | ) | | | (58,204 | ) | | | 142 | | | | 707,628 | | | | 24,418 | | | | 12,869 | | | | 156,861 | |
MML Focused Equity Fund, Class II | | | 13,914,764 | | | | 1,310,610 | | | | (2,640,025 | ) | | | 522,317 | | | | 359,803 | | | | 13,467,469 | | | | 1,857,582 | | | | 104,932 | | | | 575,307 | |
MML Foreign Fund, Initial Class | | | 8,069,490 | | | | 771,784 | | | | (1,317,026 | ) | | | 126,068 | | | | (258,684 | ) | | | 7,391,632 | | | | 737,688 | | | | 206,663 | | | | 243,245 | |
MML Fundamental Equity Fund, Class II | | | 4,227,227 | | | | 4,224,048 | | | | (1,246,991 | ) | | | 818,702 | | | | (254,620 | ) | | | 7,768,366 | | | | 723,986 | | | | 2,745 | | | | 859,696 | |
MML Fundamental Value Fund, Class II | | | 8,795,156 | | | | 2,543,211 | | | | (1,641,916 | ) | | | (428,337 | ) | | | (400,214 | ) | | | 8,867,900 | | | | 763,158 | | | | 110,493 | | | | 1,035,021 | |
MML Global Fund, Class I | | | 18,788,368 | | | | 1,908,479 | | | | (3,499,099 | ) | | | 1,373,776 | | | | 32,078 | | | | 18,603,602 | | | | 1,332,636 | | | | 191,521 | | | | 676,079 | |
MML High Yield Fund, Class II | | | 1,792,598 | | | | 77,892 | | | | (313,751 | ) | | | 92,125 | | | | (9,711 | ) | | | 1,639,153 | | | | 162,292 | | | | 398 | | | | — | |
MML Income & Growth Fund, Initial Class | | | 9,614,288 | | | | 1,633,205 | | | | (1,726,470 | ) | | | 594,138 | | | | (447,700 | ) | | | 9,667,461 | | | | 966,746 | | | | 183,625 | | | | 25,845 | |
MML Inflation-Protected and Income Fund, Initial Class | | | 3,397,173 | | | | 159,777 | | | | (889,081 | ) | | | 286,366 | | | | 33,536 | | | | 2,987,771 | | | | 261,855 | | | | 3,533 | | | | — | |
MML International Equity Fund, Class II | | | 8,161,387 | | | | 2,017,654 | | | | (1,342,859 | ) | | | 372,723 | | | | (230,005 | ) | | | 8,978,900 | | | | 899,689 | | | | 258,426 | | | | 228,608 | |
MML Large Cap Growth Fund, Initial Class | | | 3,110,371 | | | | 547,220 | | | | (774,178 | ) | | | 710,142 | | | | 92,953 | | | | 3,686,508 | | | | 263,699 | | | | 11,740 | | | | 159,371 | |
MML Managed Bond Fund, Initial Class | | | 5,914,208 | | | | 250,843 | | | | (2,760,364 | ) | | | 169,639 | | | | 147,249 | | | | 3,721,575 | | | | 273,794 | | | | 3,879 | | | | — | |
MML Mid Cap Growth Fund, Initial Class | | | 10,096,021 | | | | 2,284,541 | | | | (2,088,897 | ) | | | 1,781,710 | | | | (30,717 | ) | | | 12,042,658 | | | | 665,340 | | | | 8,466 | | | | 1,037,899 | |
MML Mid Cap Value Fund, Initial Class | | | 8,891,086 | | | | 800,618 | | | | (1,729,247 | ) | | | 384,388 | | | | (397,347 | ) | | | 7,949,498 | | | | 750,661 | | | | 138,057 | | | | — | |
MML Short-Duration Bond Fund, Class II | | | 2,909,730 | | | | 108,236 | | | | (408,632 | ) | | | 53,264 | | | | (14,867 | ) | | | 2,647,731 | | | | 269,078 | | | | 6 | | | | — | |
MML Small Cap Growth Equity Fund, Initial Class | | | 1,988,912 | | | | 321,264 | | | | (353,951 | ) | | | 354,506 | | | | 35,630 | | | | 2,346,361 | | | | 139,148 | | | | — | | | | 236,279 | |
MML Small Company Value Fund, Class II | | | 3,969,499 | | | | 337,056 | | | | (666,407 | ) | | | 302,650 | | | | (217,290 | ) | | | 3,725,508 | | | | 244,296 | | | | 8,731 | | | | 166,836 | |
MML Small/Mid Cap Value Fund, Initial Class | | | 2,744,616 | | | | 239,828 | | | | (503,677 | ) | | | 131,657 | | | | (198,505 | ) | | | 2,413,919 | | | | 220,651 | | | | 23,064 | | | | 95,357 | |
MML Strategic Emerging Markets Fund, Class II | | | 8,803,514 | | | | 682,564 | | | | (1,233,556 | ) | | | 918,642 | | | | 210,407 | | | | 9,381,571 | | | | 650,144 | | | | 36,262 | | | | 231,352 | |
MML Total Return Bond Fund, Class II | | | 3,185,272 | | | | 200,670 | | | | (2,077,729 | ) | | | (21,578 | ) | | | 145,987 | | | | 1,432,622 | | | | 127,005 | | | | 51,138 | | | | 7,321 | |
| | | $ | 151,339,466 | | | $ | 24,087,044 | | | $ | (33,105,430 | ) | | $ | 9,955,458 | | | $ | (1,342,522 | ) | | $ | 150,934,016 | | | | | | | $ | 1,570,980 | | | $ | 7,171,752 | |
Under the Funds’ organizational documents, current and former Trustees and Officers are provided with specified rights to indemnification against liabilities arising in connection with the performance of their duties to the Funds, and shareholders are indemnified against personal liability for obligations of the Funds. In the normal course of business, the Funds may also enter into contracts that provide general indemnifications. The Funds’ maximum exposure under these arrangements is unknown as this would be dependent on future claims that may be made against the Funds. The risk of material loss from such claims is considered remote.
274
Notes to Financial Statements (Continued) |
9. | New Accounting Pronouncements |
In October 2020, Accounting Standards Update 2017-08, Receivables — Nonrefundable Fees and Other Costs (Subtopic 310-20): Premium Amortization on Purchased Callable Debt Securities (“ASU 2017-08”) was amended by Accounting Standards Update 2020-08, Codification Improvements to Subtopic 310-20, Receivables—Nonrefundable Fees and Other Costs (“ASU 2020-08”). ASU 2020-08 requires entities to reevaluate whether callable debt securities fall within the scope of ASU 2017-08 at each reporting period. ASU 2020-08 also amends the relevant guidance to require premiums to be amortized to the “next call date” rather than the “earliest call date,” and further clarifies the definition of “next call date.” ASU 2020-08 is effective for fiscal years, and interim periods within those fiscal years, beginning after December 15, 2020. Early adoption of ASU 2020-08 is not permitted. Management is currently evaluating the impact, if any, of applying ASU 2020-08.
In March 2020, FASB issued Accounting Standards Update 2020-04 — Reference Rate Reform (Topic 848) — Facilitation of the Effects of Reference Rate Reform on Financial Reporting (“ASU 2020-04”). ASU 2020-04 provides optional temporary financial reporting relief from the effect of certain types of contract modifications due to the planned discontinuation of the London Interbank Offered Rate (“LIBOR”) and other interbank-offered based reference rates as of the end of 2021. ASU 2020-04 is effective for certain reference rate-related contract modifications that occur during the period March 12, 2020 through December 31, 2022. Management does not believe the impact of adopting ASU 2020-04 will have a material impact on the financial statements.
On December 7, 2010, the Trust was named as a defendant and putative member of the proposed defendant class of shareholders named in an adversary proceeding brought by The Official Committee of Unsecured Creditors of Tribune Company (the “Official Committee”) in the U.S. Bankruptcy Court for the District of Delaware, in connection with Tribune Company’s Chapter 11 bankruptcy proceeding (In re Tribune Company). The proceeding relates to a leveraged buyout (“LBO”) transaction by which Tribune Company converted to a privately-held company in 2007, and the putative defendant class is comprised of beneficial owners of shares of Tribune Company who received proceeds (the “Proceeds”) of the LBO. The Official Committee seeks to recover payments of those Proceeds. On April 5, 2012, the adversary proceeding was transferred to the Southern District of New York for consolidated pretrial proceedings. The action is now being prosecuted by the litigation trustee (“Trustee”) for the Tribune Litigation Trust.
The potential amounts sought to be recovered from the Equity Income Fund and Equity Index Fund are approximately $4,562,800 and $207,706, respectively, plus interest and the Official Committee’s court costs.
In addition, on June 2, 2011, the Equity Income Fund was named as a defendant in two closely related, parallel adversary proceedings brought in connection with the Tribune Company’s LBO by Deutsche Bank Trust Company Americas, in its capacity as successor indenture trustee for a certain series of Senior Notes, Law Debenture Trust Company of New York, in its capacity as successor indenture trustee for a certain series of Senior Notes, and Wilmington Trust Company, in its capacity as successor indenture trustee for the PHONES Notes (together, the “Plaintiffs”), one in the United States District Court for the District of Massachusetts and one in the United States District Court for the District of Connecticut. The Plaintiffs also seek to recover payments of the Proceeds. On December 20, 2011, these actions were transferred to the Southern District of New York for consolidated pretrial proceedings.
The Funds cannot predict the outcome of these proceedings. Accordingly, the Funds have not accrued any amounts related to these proceedings. If the proceedings were to be decided in a manner adverse to the Funds, or if the Funds were to enter into a settlement agreement with the Trustee or the Plaintiffs, as applicable, the payment of such judgment or settlement could potentially have a material adverse effect on the Funds’ net asset values depending on the net assets of each applicable Fund at the time of such judgment or settlement.
275
Notes to Financial Statements (Continued) |
11. | Coronavirus (COVID-19) Pandemic |
The global pandemic outbreak of the novel coronavirus known as COVID-19 has produced, and will likely continue to produce, substantial market volatility, severe market dislocations and liquidity constraints in many markets, and global business disruption, and it may result in future significant adverse effects, such as exchange trading suspensions and closures, declines in global financial markets, higher default rates, and a substantial economic downturn or recession throughout the world. Such factors may have a significant adverse effect on a Fund’s performance and have the potential to impair the ability of a Fund’s investment adviser, subadviser, or other service providers to serve the Fund and could lead to disruptions that negatively impact the Fund.
276
Report of Independent Registered Public Accounting Firm |
To the Board of Trustees of MML Series Investment Fund and Shareholders of MML Conservative Allocation Fund, MML Balanced Allocation Fund, MML Moderate Allocation Fund, MML Growth Allocation Fund, MML Aggressive Allocation Fund, MML American Funds Growth Fund, MML American Funds International Fund, MML American Funds Core Allocation Fund, MML Blue Chip Growth Fund, MML Equity Income Fund, MML Equity Index Fund, MML Focused Equity Fund, MML Foreign Fund, MML Fundamental Equity Fund (formerly known as MML Fundamental Growth Fund), MML Fundamental Value Fund, MML Global Fund, MML Growth & Income Fund, MML Income & Growth Fund, MML International Equity Fund, MML Large Cap Growth Fund, MML Managed Volatility Fund, MML Mid Cap Growth Fund, MML Mid Cap Value Fund, MML Small Cap Growth Equity Fund, MML Small Company Value Fund, MML Small/Mid Cap Value Fund, and MML Total Return Bond Fund (collectively, the “Funds”):
Opinion on the Financial Statements and Financial Highlights
We have audited the accompanying statements of assets and liabilities of the Funds, including the portfolios of investments, as of December 31, 2020, the related statements of operations for the year then ended, the statements of changes in net assets for each of the two years in the period then ended, the financial highlights for each of the five years in the period then ended, and the related notes. In our opinion, the financial statements and financial highlights present fairly, in all material respects, the financial position of each of the Funds as of December 31, 2020, and the results of their operations for the year then ended, the changes in their net assets for each of the two years in the period then ended, and the financial highlights for each of the five years in the period then ended, in conformity with accounting principles generally accepted in the United States of America.
Basis for Opinion
These financial statements and financial highlights are the responsibility of the Funds’ management. Our responsibility is to express an opinion on the Funds’ financial statements and financial highlights based on our audits. We are a public accounting firm registered with the Public Company Accounting Oversight Board (United States) (PCAOB) and are required to be independent with respect to the Funds in accordance with the U.S. federal securities laws and the applicable rules and regulations of the Securities and Exchange Commission and the PCAOB.
We conducted our audits in accordance with the standards of the PCAOB. Those standards require that we plan and perform the audit to obtain reasonable assurance about whether the financial statements and financial highlights are free of material misstatement, whether due to error or fraud. The Funds are not required to have, nor were we engaged to perform, an audit of their internal control over financial reporting. As part of our audits we are required to obtain an understanding of internal control over financial reporting but not for the purpose of expressing an opinion on the effectiveness of the Funds’ internal control over financial reporting. Accordingly, we express no such opinion.
Our audits included performing procedures to assess the risks of material misstatement of the financial statements and financial highlights, whether due to error or fraud, and performing procedures that respond to those risks. Such procedures included examining, on a test basis, evidence regarding the amounts and disclosures in the financial statements and financial highlights. Our audits also included evaluating the accounting principles used and significant estimates made by management, as well as evaluating the overall presentation of the financial statements and financial highlights. Our procedures included confirmation of securities owned as of December 31, 2020, by correspondence with the custodian and brokers; when replies were not received from brokers, we performed other auditing procedures. We believe that our audits provide a reasonable basis for our opinion.
/s/ Deloitte & Touche LLP
Boston, Massachusetts
February 23, 2021
We have served as the auditor of one or more MassMutual investment companies since 1995.
277
Trustees and Principal Officers (Unaudited) |
The following table lists the Trust’s Trustees and Principal Officers; their address and year of birth; their position with the Trust; the length of time holding that position with the Trust; their principal occupation(s) during at least the past five years; the number of portfolios in the fund complex they oversee; and other directorships they hold in companies subject to registration or reporting requirements of the Securities Exchange Act of 1934 (generally called “public companies”) or in registered investment companies. The Trust’s Statements of Additional Information include additional information about the Trust’s Trustees and is available, without charge, upon request by calling 1-888-309-3539 or by writing MML Series Investment Fund, c/o Massachusetts Mutual Life Insurance Company, 100 Bright Meadow Blvd., Enfield, Connecticut 06082-1981, Attention: MassMutual U.S. Product and Marketing.
Independent Trustees
Name, Address*,
and Year of Birth | Position(s)
Held with
Trust | Term of
Office** and
Length of
Time Served | Principal Occupation(s)
During Past 5 Years | Number of
Portfolios in
Fund Complex
Overseen by
Trustee | Other Directorships
Held by Trustee |
Allan W. Blair Year of birth: 1948 | Trustee | Since 2003 | Retired. | 109 | Trustee (since 2003), MassMutual Select Funds (open-end investment company); Trustee (since 2012), MML Series Investment Fund II (open-end investment company); Trustee (since 2012), MassMutual Premier Funds (open-end investment company). |
Nabil N. El-Hage Year of birth: 1958 | Trustee | Since 2012 | Founder and CEO (since 2018), AEE International LLC (a Puerto Rico LLC); Founder and sole member (2016-2018), PR Academy of Executive Education LLC (a Puerto Rico LLC). | 109 | Trustee (since 2012), MassMutual Select Funds (open-end investment company); Trustee (since 2005), Chairman (2006-2012), MML Series Investment Fund II (open-end investment company); Trustee (since 2003), Chairman (2006-2012), MassMutual Premier Funds (open-end investment company). |
Maria D. Furman Year of birth: 1954 | Trustee | Since 2012 | Retired. | 109 | Trustee (since 2011), GMO Series Trust (open-end investment company); Trustee (since 2012), MassMutual Select Funds (open-end investment company); Trustee (since 2005), MML Series Investment Fund II (open-end investment company); Trustee (since 2004), MassMutual Premier Funds (open-end investment company). |
R. Alan Hunter, Jr. Year of birth: 1946 | Chairperson Trustee | Since 2016 Since 2003 | Retired. | 109 | Chairperson (since 2016), Trustee (since 2003), MassMutual Select Funds (open-end investment company); Chairperson (since 2016), Trustee (since 2012), MML Series Investment Fund II (open-end investment company); Chairperson (since 2016), Trustee (since 2012), MassMutual Premier Funds (open-end investment company). |
278
Trustees and Principal Officers (Unaudited) (Continued) |
Name, Address*,
and Year of Birth | Position(s)
Held with
Trust | Term of
Office** and
Length of
Time Served | Principal Occupation(s)
During Past 5 Years | Number of
Portfolios in
Fund Complex
Overseen by
Trustee | Other Directorships
Held by Trustee |
C. Ann Merrifield Year of birth: 1951 | Trustee | Since 2012 | Retired. | 109 | Lead Director (since 2020), Lyra Therapeutics (a clinical-stage specialty pharmaceutical company); Director (since 2014), Flexion Therapeutics (specialty pharmaceutical company); Chairperson (2017-2018), Director (since 2014), InVivo Therapeutics (research and clinical-stage biomaterials and biotechnology company); Trustee (since 2012), MassMutual Select Funds (open-end investment company); Trustee (since 2005), MML Series Investment Fund II (open-end investment company); Trustee (since 2004), MassMutual Premier Funds (open-end investment company). |
Susan B. Sweeney Year of birth: 1952 | Trustee | Since 2009 | Retired. | 111^ | Trustee (since 2012), Barings Corporate Investors (closed-end investment company); Trustee (since 2012), Barings Participation Investors (closed-end investment company); Trustee (since 2009), MassMutual Select Funds (open-end investment company); Trustee (since 2012), MML Series Investment Fund II (open-end investment company); Trustee (since 2012), MassMutual Premier Funds (open-end investment company). |
Interested Trustees
Name, Address*,
and Year of Birth | Position(s)
Held with
Trust | Term of
Office** and
Length of
Time Served | Principal Occupation(s)
During Past 5 Years | Number of
Portfolios in
Fund Complex
Overseen by
Trustee | Other Directorships
Held by Trustee |
Michael R. Fanning^^ Year of birth: 1963 | Trustee | Since 2021 | Head of MassMutual U.S. (since 2016), Executive Vice President (2016-2018), Member of MassMutual’s Executive Leadership Team (since 2008), MassMutual. | 109 | Director (since 2016), MML Advisers; Trustee (since 2021), MassMutual Select Funds (open-end investment company); Trustee (since 2021), MML Series Investment Fund II (open-end investment company); Trustee (since 2021), MassMutual Premier Funds (open-end investment company). |
Clifford M, Noreen^^^ Year of birth: 1957 | Trustee | Since 2021 | Head of Global Investment Strategy (since 2019), Deputy Chief Investment Officer (2016-2018), MassMutual; President (2008-2016), Vice Chairman (2007-2008), Member of the Board of Managers (2006-2016), Managing Director (2000-2016), Barings LLC. | 111^ | Chairman (since 2009), Trustee (since 2005), President (2005-2009), CI Subsidiary Trust and PI Subsidiary Trust; Chairman and Trustee (since 2009), Barings Corporate Investors (closed-end investment company); Chairman and Trustee (since 2009), Barings Participation Investors (closed-end investment company); Trustee (since 2021), MassMutual Select Funds (open-end investment company); Trustee (since 2021), MML Series Investment Fund II (open-end investment company); Trustee (since 2021), MassMutual Premier Funds (open-end investment company). |
279
Trustees and Principal Officers (Unaudited) (Continued) |
Principal Officers
Name, Address*,
and Year of Birth | Position(s)
Held with
Trust | Term of
Office# and
Length of
Time Served | Principal Occupation(s)
During Past 5 Years | Number of
Portfolios in
Fund Complex
Overseen by
Officer |
Joseph Fallon Year of birth: 1975 | Vice President Assistant Vice President | Since 2017 2015- 2017 | Investment Director (since 2014), MML Advisers; Head of Investment Consulting & Strategy (since 2017), Investment Director (2006-2017), MassMutual; Vice President (since 2017), Assistant Vice President (2015-2017), MassMutual Select Funds (open-end investment company); Vice President (since 2017), Assistant Vice President (2015-2017), MML Series Investment Fund II (open-end investment company); Vice President (since 2017), Assistant Vice President (2015-2017), MassMutual Premier Funds (open-end investment company). | 109 |
Andrew M. Goldberg Year of birth: 1966 | Vice President, Secretary, and Chief Legal Officer Assistant Secretary | Since 2008 2001- 2008 | Lead Counsel, Investment Adviser & Mutual Funds (since 2018), Assistant Vice President and Counsel (2004-2018), MassMutual; Secretary (since 2015), Assistant Secretary (2013-2015), MML Advisers; Vice President, Secretary, and Chief Legal Officer (since 2008), Assistant Secretary (2001-2008), MassMutual Select Funds (open-end investment company); Vice President, Secretary, (formerly known as “Clerk”), and Chief Legal Officer (since 2008), Assistant Clerk (2005-2008), MML Series Investment Fund II (open-end investment company); Vice President, Secretary, (formerly known as “Clerk”), and Chief Legal Officer (since 2008), Assistant Clerk (2004-2008), MassMutual Premier Funds (open-end investment company). | 109 |
Renee Hitchcock Year of birth: 1970 | Chief Financial Officer and Treasurer Assistant Treasurer | Since 2016 2007- 2016 | Head of Mutual Fund Administration (since 2018), Assistant Vice President (2015-2018), MassMutual; Chief Financial Officer and Treasurer (since 2016), Assistant Treasurer (2007-2016), MassMutual Select Funds (open-end investment company); Chief Financial Officer and Treasurer (since 2016), Assistant Treasurer (2007-2016), MML Series Investment Fund II (open-end investment company); Chief Financial Officer and Treasurer (since 2016), Assistant Treasurer (2007-2016), MassMutual Premier Funds (open-end investment company). | 109 |
Paul LaPiana Year of birth: 1969 | President | Since 2021 | President (since 2021), MML Advisers; Head of MassMutual U.S. Product (since 2019), Head of Field Management (2016-2019), MassMutual; Executive Vice President, Head of Field Distribution (2012-2016), MetLife; President (since 2021), MassMutual Select Funds (open-end investment company); President (since 2021), MML Series Investment Fund II (open-end investment company); President (since 2021), MassMutual Premier Funds (open-end investment company). | 109 |
Jill Nareau Robert Year of birth: 1972 | Vice President and Assistant Secretary Assistant Secretary | Since 2017 2008- 2017 | Lead Counsel, Investment Adviser & Mutual Funds (since 2018), Assistant Vice President and Counsel (2009-2018), MassMutual; Assistant Secretary (since 2015), MML Advisers; Vice President and Assistant Secretary (since 2017), Assistant Secretary (2008-2017), MassMutual Select Funds (open-end investment company); Vice President and Assistant Secretary (since 2017), Assistant Secretary (formerly known as “Assistant Clerk”) (2008-2017), MML Series Investment Fund II (open-end investment company); Vice President and Assistant Secretary (since 2017), Assistant Secretary (formerly known as “Assistant Clerk”) (2008-2017), MassMutual Premier Funds (open-end investment company). | 109 |
Douglas Steele Year of birth: 1975 | Vice President | Since 2016 | Vice President and Head of Investment Management (since 2017), Head of Investment Due Diligence (2016-2017), MML Advisers; Head of Investment Management (since 2017), Assistant Vice President (2013-2017), MassMutual; Vice President (since 2016), MassMutual Select Funds (open-end investment company); Vice President (since 2016), MML Series Investment Fund II (open-end investment company); Vice President (since 2016), MassMutual Premier Funds (open-end investment company). | 109 |
280
Trustees and Principal Officers (Unaudited) (Continued) |
Name, Address*,
and Year of Birth | Position(s)
Held with
Trust | Term of
Office# and
Length of
Time Served | Principal Occupation(s)
During Past 5 Years | Number of
Portfolios in
Fund Complex
Overseen by
Officer |
Philip S. Wellman Year of birth: 1964 | Vice President and Chief Compliance Officer | Since 2007 | Vice President and Chief Compliance Officer (since 2013), MML Advisers; Head of Mutual Funds & RIA Compliance (since 2018), Vice President, Associate General Counsel, and Chief Compliance Officer (Mutual Funds) (2014-2018), MassMutual; Vice President and Chief Compliance Officer (since 2007), MassMutual Select Funds (open-end investment company); Vice President and Chief Compliance Officer (since 2007), MML Series Investment Fund II (open-end investment company); Vice President and Chief Compliance Officer (since 2007), MassMutual Premier Funds (open-end investment company). | 109 |
* | The address of each Trustee and Principal Officer is the same as that for the Trust; 100 Bright Meadow Blvd., Enfield, Connecticut 06082-1981. |
** | Each Trustee of the Trust serves until the next meeting of shareholders called for the purpose of electing Trustees and until the election and qualification of his or her successor or until he or she dies, resigns, or is removed. Notwithstanding the foregoing, unless the Trustees determine that it is desirable and in the best interest of the Trust that an exception to the retirement policy of the Trust be made, a Trustee shall retire and cease to serve as a Trustee upon the conclusion of the calendar year in which such Trustee attains the age of seventy-five years, however, an interested Trustee of the Trust shall no longer serve as a Trustee if or when they are no longer an employee of MassMutual or an affiliate. |
| The Chairperson is elected to hold such office for a term of three years or until their successor is elected and qualified to carry out the duties and responsibilities of their office, or until he or she retires, dies, resigns, is removed, or becomes disqualified. The Chairperson shall hold office at the pleasure of the Trustees. |
^ | Barings Participation Investors and Barings Corporate Investors are deemed to be a part of the Fund Complex, because they are managed by Barings LLC, an affiliate of MML Advisers. |
^^ | Mr. Fanning is an “Interested Person,” as that term is defined in the 1940 Act, as an employee of MassMutual. |
^^^ | Mr. Noreen is an “Interested Person,” as that term is defined in the 1940 Act, as an employee of MassMutual. |
# | The President, Treasurer, and Secretary and such other officers as the Trustees may in their discretion from time to time elect are elected to hold such office until their successor is elected and qualified to carry out the duties and responsibilities of their office, or until he or she dies, resigns, is removed, or becomes disqualified. Each officer shall hold office at the pleasure of the Trustees. |
281
Federal Tax Information (Unaudited) |
For corporate shareholders, a portion of the ordinary dividends paid during the Fund(s)’ year ended December 31, 2020, qualified for the dividends received deduction, as follows:
| | | Dividends
Received
Deductions | |
Conservative Allocation Fund | | | 11.35 | % |
Balanced Allocation Fund | | | 15.16 | % |
Moderate Allocation Fund | | | 19.95 | % |
Growth Allocation Fund | | | 27.53 | % |
Aggressive Allocation Fund | | | 40.99 | % |
MML American Funds Growth Fund | | | 78.54 | % |
MML American Funds International Fund | | | 1.43 | % |
MML American Funds Core Allocation Fund | | | 99.82 | % |
Equity Income Fund | | | 100.00 | % |
Equity Index Fund | | | 88.69 | % |
Focused Equity Fund | | | 45.07 | % |
Fundamental Equity Fund | | | 46.78 | % |
Fundamental Value Fund | | | 100.00 | % |
Global Fund | | | 52.79 | % |
Growth & Income Fund | | | 100.00 | % |
Income & Growth Fund | | | 94.35 | % |
Large Cap Growth Fund | | | 100.00 | % |
Managed Volatility Fund | | | 100.00 | % |
Mid Cap Growth Fund | | | 100.00 | % |
Mid Cap Value Fund | | | 100.00 | % |
Small Cap Growth Equity Fund | | | 28.37 | % |
Small Company Value Fund | | | 100.00 | % |
Small/Mid Cap Value Fund | | | 100.00 | % |
For the year ended December 31, 2020, the following Fund(s) earned the following foreign sources of income:
| | | Amount | |
Conservative Allocation Fund | | $ | 393,613 | |
Balanced Allocation Fund | | | 557,547 | |
Moderate Allocation Fund | | | 2,892,677 | |
Growth Allocation Fund | | | 2,577,690 | |
Aggressive Allocation Fund | | | 323,175 | |
MML American Funds International Fund | | | 463,650 | |
MML American Funds Core Allocation Fund | | | 910,830 | |
Foreign Fund | | | 5,458,273 | |
Global Fund | | | 2,336,662 | |
International Equity Fund | | | 1,069,759 | |
The Fund(s) intend to pass through the maximum amount allowable as Section 163(j) Interest Dividends as defined in the Treasury Regulations §1.163(j)-1(b).
282
Other Information (Unaudited) |
Proxy Voting
A description of the policies and procedures that each Fund’s investment adviser and subadvisers use to vote proxies relating to the Fund’s portfolio securities is available, without charge, upon request, by calling 1-888-309-3539, and on the SEC’s EDGAR database on its website at http://www.sec.gov.
Information regarding how the Funds voted proxies relating to portfolio securities during the most recent 12-month period ended June 30 is available, without charge, upon request, on the MassMutual website at http://www.massmutual.com/funds and on the SEC’s EDGAR database on its website at http://www.sec.gov.
Quarterly Reporting
The Funds file their complete schedule of portfolio holdings with the SEC for the first and third quarters of each fiscal year as an exhibit to their reports on Form N-PORT. The Funds’ Forms N-PORT are available on the SEC’s EDGAR database on its website at http://www.sec.gov. In addition, the Funds make the complete schedule of portfolio holdings from their filings on Form N-PORT available to shareholders at http://www.massmutual.com/funds.
Trustees’ Approval of Investment Advisory Contracts
At their meeting in September 2020, the Trustees, including the Trustees who are not “interested persons” (as such term is defined in the 1940 Act) of the Trust, MML Advisers, or the subadvisers (the “Independent Trustees”), reviewed and approved a proposal to make changes to the existing subadvisory agreement between MML Advisers and Wellington Management Company LLP (“Wellington Management”) for the Small Cap Growth Equity Fund in order to lower the subadvisory fee paid on behalf of the Fund. In arriving at their decision, the Trustees discussed the fees payable to Wellington Management by MML Advisers under the amended subadvisory agreement and the effect of such fees on the profitability to MML Advisers. The Trustees concluded that they were satisfied that MML Advisers’ projected level of profitability due to the amended subadvisory agreement is not excessive and the subadvisory fee amount under the amended subadvisory agreement is fair and reasonable. In their deliberations, the Trustees were advised by independent counsel.
Prior to the vote being taken to approve the amendment to the subadvisory agreement discussed above, the Independent Trustees met separately in executive session to discuss the appropriateness of such contract. The Independent Trustees weighed the foregoing matters in light of the advice given to them by their independent legal counsel as to the law applicable to the review of investment advisory contracts. In arriving at a decision, the Trustees, including the Independent Trustees, did not identify any single matter as all-important or controlling. The foregoing summary does not detail all of the matters considered.
The amended subadvisory agreement became effective on October 1, 2020.
Also at their meeting in September 2020, the Trustees, including the Independent Trustees, approved a new subadvisory agreement with Barrow, Hanley, Mewhinney & Strauss, LLC (“Barrow Hanley”) for the Income & Growth Fund (the “Fund” and the “September Subadvisory Agreement”) due to an expected change in control, whereby Perpetual U.S. Holding Company, Inc. (“Perpetual”) will acquire BrightSphere Investment Group Inc.’s (“BrightSphere”) equity interest in Barrow Hanley. The acquisition by Perpetual of BrightSphere’s equity interest in Barrow Hanley will trigger the automatic assignment of the current subadvisory agreement, necessitating the need for the September Subadvisory Agreement, which is substantially identical to the current subadvisory agreement. The Trustees considered the nature of the transaction and that the transaction would not result in any change in the investment strategies or portfolio management team of the Fund, or in the fees or expenses of the Fund. In addition, the Trustees considered the statements of Perpetual and Barrow Hanley that the change in control was not expected to have any material impact on Barrow Hanley or the services it provides to the Fund, including the personnel providing services to the Fund.
Prior to the votes being taken to approve the September Subadvisory Agreement discussed above, the Independent Trustees met separately in executive session to discuss the appropriateness of such contract. The Independent Trustees weighed the foregoing matters in light of the advice given to them by their independent legal counsel as to the law applicable to the review of investment advisory contracts. In arriving at a decision, the Trustees, including the Independent Trustees, did not identify any single matter as all-important or controlling. The foregoing summary does not detail all of the matters considered.
The September Subadvisory Agreement became effective on November 17, 2020.
283
Other Information (Unaudited) (Continued) |
Fund Expenses December 31, 2020
Expense Examples:
The following information is in regards to expenses for the six months ended December 31, 2020:
As a shareholder of the Funds, you incur ongoing costs, including advisory fees, distribution and/or service (12b-1) fees, and other Fund expenses. These examples are intended to help you understand your ongoing costs (in dollars) of investing in the Funds and to compare these costs with the ongoing costs of investing in other mutual funds. These examples are based on an investment of $1,000 invested for the six months ended December 31, 2020.
Actual Expenses:
The first four columns of the table below provide information about actual account values and actual expenses. You may use this information, together with the amount you invested, to estimate the expenses that you paid over the period. Simply divide your account value by $1,000 (for example, an $8,600 account value divided by $1,000 = 8.6), then multiply the result by the number under the heading entitled “Operating Expenses Incurred” to estimate the expenses you paid on your account during this period.
Hypothetical Example for Comparison Purposes:
The last two columns of the table below provide information about hypothetical account values and hypothetical expenses based on the Fund’s actual expense ratio and an assumed rate of return of 5% per year before expenses, which is not the Fund’s actual return. The hypothetical account values and expenses may not be used to estimate the actual ending account balance or expenses you paid for the period. You may use this information to compare the ongoing costs of investing in the Fund and other funds. To do so, compare this 5% hypothetical example with the 5% hypothetical examples that appear in the shareholder reports of the other funds.
Please note that the expenses shown in the table are meant to highlight your ongoing costs only and do not reflect any transactional costs. Therefore, the last two columns of the table are useful in comparing ongoing costs only, and will not help you determine the relative total costs of owning different funds. In addition, if these transactional costs were included, your costs would have been higher.
| | Beginning
Value | Annualized
Expense
Ratio | Ending
Value (Based
on Actual
Returns and
Expenses) | Operating
Expenses
Incurred* | Ending Value
(Based on
Hypothetical
Returns and
Expenses) | Operating
Expenses
Incurred* |
Conservative Allocation Fund | | | | | | |
Initial Class | $1,000 | 0.12% | $1,126.50 | $0.64 | $1,024.50 | $0.61 |
Service Class | 1,000 | 0.37% | 1,124.10 | 1.98 | 1,023.30 | 1.88 |
Balanced Allocation Fund | | | | | | |
Initial Class | 1,000 | 0.12% | 1,142.90 | 0.65 | 1,024.50 | 0.61 |
Service Class | 1,000 | 0.37% | 1,141.40 | 1.99 | 1,023.30 | 1.88 |
Moderate Allocation Fund | | | | | | |
Initial Class | 1,000 | 0.11% | 1,167.50 | 0.60 | 1,024.60 | 0.56 |
Service Class | 1,000 | 0.36% | 1,165.40 | 1.96 | 1,023.30 | 1.83 |
Growth Allocation Fund | | | | | | |
Initial Class | 1,000 | 0.11% | 1,197.80 | 0.61 | 1,024.60 | 0.56 |
Service Class | 1,000 | 0.36% | 1,196.80 | 1.99 | 1,023.30 | 1.83 |
284
Other Information (Unaudited) (Continued) |
| | Beginning
Value | Annualized
Expense
Ratio | Ending
Value (Based
on Actual
Returns and
Expenses) | Operating
Expenses
Incurred* | Ending Value
(Based on
Hypothetical
Returns and
Expenses) | Operating
Expenses
Incurred* |
Aggressive Allocation Fund | | | | | | |
Initial Class | $1,000 | 0.15% | $1,230.30 | $0.84 | $1,024.40 | $0.76 |
Service Class | 1,000 | 0.40% | 1,229.20 | 2.24 | 1,023.10 | 2.03 |
MML American Funds Growth Fund | | | | | | |
Service Class I** | 1,000 | 1.03% | 1,355.20 | 6.10 | 1,020.00 | 5.23 |
MML American Funds International Fund | | | | | | |
Service Class I** | 1,000 | 1.28% | 1,283.00 | 7.35 | 1,018.70 | 6.50 |
MML American Funds Core Allocation Fund | | | | | | |
Service Class I | 1,000 | 0.71% | 1,139.10 | 3.82 | 1,021.60 | 3.61 |
Blue Chip Growth Fund | | | | | | |
Initial Class | 1,000 | 0.77% | 1,211.80 | 4.28 | 1,021.30 | 3.91 |
Service Class | 1,000 | 1.03% | 1,209.80 | 5.72 | 1,020.00 | 5.23 |
Equity Income Fund | | | | | | |
Initial Class | 1,000 | 0.76% | 1,249.10 | 4.30 | 1,021.30 | 3.86 |
Service Class | 1,000 | 1.01% | 1,248.20 | 5.71 | 1,020.10 | 5.13 |
Equity Index Fund | | | | | | |
Class I | 1,000 | 0.43% | 1,220.80 | 2.40 | 1,023.00 | 2.19 |
Class II | 1,000 | 0.28% | 1,221.70 | 1.56 | 1,023.70 | 1.42 |
Class III | 1,000 | 0.13% | 1,223.00 | 0.73 | 1,024.50 | 0.66 |
Service Class I | 1,000 | 0.68% | 1,219.40 | 3.79 | 1,021.70 | 3.46 |
Focused Equity Fund | | | | | | |
Class II | 1,000 | 0.87% | 1,198.40 | 4.81 | 1,020.80 | 4.42 |
Service Class I | 1,000 | 1.12% | 1,196.80 | 6.18 | 1,019.50 | 5.69 |
Foreign Fund | | | | | | |
Initial Class | 1,000 | 0.88% | 1,239.70 | 4.95 | 1,020.70 | 4.47 |
Service Class | 1,000 | 1.13% | 1,236.80 | 6.35 | 1,019.50 | 5.74 |
Fundamental Equity Fund | | | | | | |
Class II | 1,000 | 0.81% | 1,207.40 | 4.49 | 1,021.10 | 4.12 |
Service Class I | 1,000 | 1.06% | 1,204.60 | 5.87 | 1,019.80 | 5.38 |
Fundamental Value Fund | | | | | | |
Class II | 1,000 | 0.79% | 1,234.20 | 4.44 | 1,021.20 | 4.01 |
Service Class I | 1,000 | 1.04% | 1,232.10 | 5.84 | 1,019.90 | 5.28 |
Global Fund | | | | | | |
Class I | 1,000 | 0.81% | 1,245.80 | 4.57 | 1,021.10 | 4.12 |
Class II | 1,000 | 0.81% | 1,245.60 | 4.57 | 1,021.10 | 4.12 |
Service Class I | 1,000 | 1.06% | 1,243.80 | 5.98 | 1,019.80 | 5.38 |
Growth & Income Fund | | | | | | |
Initial Class | 1,000 | 0.56% | 1,202.00 | 3.10 | 1,022.30 | 2.85 |
Service Class | 1,000 | 0.81% | 1,200.30 | 4.48 | 1,021.10 | 4.12 |
Income & Growth Fund | | | | | | |
Initial Class | 1,000 | 0.70% | 1,269.00 | 3.99 | 1,021.60 | 3.56 |
Service Class | 1,000 | 0.95% | 1,267.70 | 5.42 | 1,020.40 | 4.82 |
International Equity Fund | | | | | | |
Class II | 1,000 | 1.00% | 1,362.60 | 5.94 | 1,020.10 | 5.08 |
Service Class I | 1,000 | 1.25% | 1,360.60 | 7.42 | 1,018.90 | 6.34 |
Large Cap Growth Fund | | | | | | |
Initial Class | 1,000 | 0.71% | 1,200.80 | 3.93 | 1,021.60 | 3.61 |
Service Class | 1,000 | 0.97% | 1,199.40 | 5.36 | 1,020.30 | 4.93 |
285
Other Information (Unaudited) (Continued) |
| | Beginning
Value | Annualized
Expense
Ratio | Ending
Value (Based
on Actual
Returns and
Expenses) | Operating
Expenses
Incurred* | Ending Value
(Based on
Hypothetical
Returns and
Expenses) | Operating
Expenses
Incurred* |
Managed Volatility Fund | | | | | | |
Initial Class | $1,000 | 1.16% | $1,096.30 | $6.11 | $1,019.30 | $5.89 |
Service Class | 1,000 | 1.41% | 1,094.90 | 7.42 | 1,018.00 | 7.15 |
Mid Cap Growth Fund | | | | | | |
Initial Class | 1,000 | 0.81% | 1,262.80 | 4.61 | 1,021.10 | 4.12 |
Service Class | 1,000 | 1.06% | 1,260.90 | 6.02 | 1,019.80 | 5.38 |
Mid Cap Value Fund | | | | | | |
Initial Class | 1,000 | 0.89% | 1,216.80 | 4.96 | 1,020.70 | 4.52 |
Service Class | 1,000 | 1.14% | 1,216.10 | 6.35 | 1,019.40 | 5.79 |
Small Cap Growth Equity Fund | | | | | | |
Initial Class | 1,000 | 1.08% | 1,439.80 | 6.62 | 1,019.70 | 5.48 |
Service Class | 1,000 | 1.33% | 1,438.00 | 8.15 | 1,018.50 | 6.75 |
Small Company Value Fund | | | | | | |
Class II | 1,000 | 1.00% | 1,323.10 | 5.84 | 1,020.10 | 5.08 |
Service Class I | 1,000 | 1.26% | 1,321.80 | 7.35 | 1,018.80 | 6.39 |
Small/Mid Cap Value Fund | | | | | | |
Initial Class | 1,000 | 0.81% | 1,347.40 | 4.78 | 1,021.10 | 4.12 |
Service Class | 1,000 | 1.06% | 1,345.00 | 6.25 | 1,019.80 | 5.38 |
Total Return Bond Fund | | | | | | |
Class II | 1,000 | 0.62% | 1,024.90 | 3.16 | 1,022.00 | 3.15 |
Service Class I | 1,000 | 0.87% | 1,024.30 | 4.43 | 1,020.80 | 4.42 |
* | Expenses are calculated using the annualized expense ratio for the six months ended December 31, 2020, multiplied by the average account value over the period, multiplied by 184 days in the period, divided by 366 days in the year, unless stated otherwise. The annualized expense ratio does not reflect expenses deducted under the variable life insurance or variable annuity contract through which the Funds are invested in. Inclusion of these expenses would increase the annualized expense ratios shown. |
** | The annualized expense ratio reflects the expenses of both the Feeder Fund and the Master Fund in which it invests. |
286
[THIS PAGE INTENTIONALLY LEFT BLANK]
Underwriter:
MML Distributors, LLC
1295 State Street
Springfield, Massachusetts 01111-0001

© 2021 Massachusetts Mutual Life Insurance Company (MassMutual®), Springfield, MA 01111-0001. All rights reserved. www.MassMutual.com. Investment Adviser: MML Investment Advisers, LLC | RS-50504-00 |
American Funds
Insurance Series® Annual report
for the year ended
December 31, 2020 |  |

Investing in global
companies for
the long term
American Funds Insurance Series, by Capital Group, is the underlying investment vehicle for many variable annuities and insurance products. For nearly 90 years, Capital Group has invested with a long-term focus based on thorough research and attention to risk.
Investing for short periods makes losses more likely. For current information and month-end results, visit capitalgroup.com/afis. For information about your insurance contract and month-end results, go to the website of the company that issued your contract.
Investing outside the United States involves risks, such as currency fluctuations, periods of illiquidity and price volatility, as more fully described in the prospectus. These risks may be heightened in connection with investments in developing countries. Investing in small-capitalization stocks can involve greater risk than is customarily associated with investing in stocks of larger, more established companies. The return of principal for bond funds and for funds with significant underlying bond holdings is not guaranteed. Fund shares are subject to the same interest rate, inflation and credit risks associated with the underlying bond holdings. High-yield bonds are subject to greater fluctuations in value and risk of loss of income and principal than investment-grade bonds. Bond ratings, which typically range from AAA/Aaa (highest) to D (lowest), are assigned by credit rating agencies such as Standard & Poor’s, Moody’s and/or Fitch as an indication of an issuer’s creditworthiness. Futures may not provide an effective hedge of the underlying securities because changes in the prices of futures may not track those of the securities they are intended to hedge. In addition, the managed risk strategy may not effectively protect the funds from market declines and will limit the funds’ participation in market gains. The use of the managed risk strategy could cause the funds’ returns to lag those of the applicable underlying funds in certain rising market conditions. Refer to the funds’ prospectuses and the Risk Factors section of this report for more information on these and other risks associated with investing in the funds.
Investments are not FDIC-insured, nor are they deposits of or guaranteed by a bank or any other entity, so they may lose value.
Fellow investors:
Global stocks, as measured by the MSCI ACWI (All Country World Index),1,2 rose 16.25% in the face of a deadly pandemic, boosted by massive government stimulus measures and the rapid development of coronavirus vaccines. In a year marked by unprecedented volatility, stocks declined sharply from February to March, followed by a remarkable nine-month rally that lifted many market indexes to all-time highs. Technology stocks led markets higher, gaining more than 40%, followed closely by consumer discretionary stocks. Digitally focused companies prospered as millions of homebound customers switched to online services for food, entertainment and other basic needs. Conversely, energy stocks and travel-related stocks plummeted as government-imposed lockdowns brought the global economy to a crawl.
U.S. equities showed resilience during a volatile year that included civil unrest and a contentious presidential election on top of pandemic-related pressures, ending the year at all-time highs, with an increase of 21.37% recorded by the MSCI USA Index1,3. Massive stimulus helped calm markets even as government restrictions aimed at curbing the spread of COVID-19 brought segments of the economy to a near standstill. In March, Congress passed the $2 trillion CARES Act, which included aid for individuals and businesses most economically impacted by the pandemic. A $900 billion stimulus package followed in December, after COVID-19 cases accelerated in the fall. The Federal Reserve cut rates 150 basis points in March, bringing the lower range of its target rate near zero for the first time since 2015.
European stocks declined in local currency terms as the eurozone economy suffered the effects of government-imposed lockdowns and a severe recession. Italy was struck hard and early by COVID-19, which then spread quickly throughout the continent, crippling key industries including tourism, banking and aircraft manufacturing. Overall, the MSCI Europe Index1,4 fell 2.21% in local currency terms. However, in U.S. dollar terms, the index registered a 5.38% gain as a weak dollar provided a currency tailwind to international equity markets. Elsewhere among developed markets, the Japanese economy entered its first recession since 2015 as the pandemic exacerbated a slowdown that began in late 2019. The Summer Olympics in Tokyo were postponed to 2021, dealing another blow to the economy. The MSCI Japan Index1,5 gained 14.48% over the year.
Emerging markets posted solid gains for a second consecutive year, led by China’s economic rebound and the technology-export-driven economies of Taiwan and South Korea. A weakening U.S. dollar and strengthening prices for industrial metals and oil further boosted gains, which were
All market returns referenced in this report are unmanaged and, therefore, have no expenses. Investors cannot invest directly in an index. Country returns are based on MSCI indexes, which reflect reinvestment of distributions and dividends net of withholding taxes, except for the MSCI USA Index, which reflects dividends gross of withholding taxes. Source: MSCI.
| 1 | Source: MSCI. |
| 2 | The MSCI ACWI is a free float-adjusted market capitalization-weighted index that is designed to measure equity market results in the global developed and emerging markets, consisting of more than 40 developed and emerging market country indexes. Results reflect dividends gross of withholding taxes through December 31, 2000, and dividends net of withholding taxes thereafter. |
| 3 | The MSCI USA Index is a free float-adjusted, market capitalization-weighted index that is designed to measure the U.S. portion of the world market. Results reflect dividends gross of withholding taxes. |
| 4 | MSCI Europe Index is a free float-adjusted market capitalization-weighted index that is designed to measure results of more than 10 developed equity markets in Europe. Results reflect dividends net of withholding taxes. |
| 5 | MSCI Japan Index is a free float-adjusted market capitalization-weighted index that is designed to measure the equity market results of Japan. Results reflect dividends net of withholding taxes. |
| American Funds Insurance Series | 1 |
led by the information technology and health care sectors. Overall, the MSCI Emerging Markets Investable Market Index1,6 bounced back from steep losses in early 2020 to finish up 18.39% for the year. Being the first country to shut down its economy and the first to reopen during the pandemic, China led the global economic rebound after quarantine measures there eased.
Government bonds advanced as central banks around the world slashed interest rates and ramped up stimulus programs in an attempt to counter the damaging effects of the pandemic. The U.S. Federal Reserve cut rates to near zero in March, launched an array of emergency lending programs, and expanded an aggressive asset purchase program. The Bloomberg Barclays U.S. Corporate Investment Grade Index7,8 and the Bloomberg Barclays U.S. Corporate High Yield 2% Issuer Capped Index7,9 gained 9.89% and 7.05%, respectively. More broadly, the Bloomberg Barclays Global Aggregate Index7,10 was up 9.20%, while the Bloomberg Barclays U.S. Aggregate Index7,11 advanced 7.51%. The J.P. Morgan Emerging Markets Bond Index7,12 – Global gained 5.88%.
In foreign exchange markets, the U.S. dollar fell against the euro, the yen and most other currencies. Signaling a potential end to about a decade of dollar strength, the euro rose 9.00% against the greenback. Late in the year, the British pound staged a strong rally as Brexit negotiators approved a new trade agreement governing the relationship between the United Kingdom and the European Union.
Looking ahead
The future path for stocks remains difficult to predict, as always. Investors are currently counting on a strong economic recovery as vaccines roll out and reduce the impact of the coronavirus. They are also counting on a continuation of supportive fiscal and monetary policies from the government, with low, accommodative interest rates. We expect these assumptions to hold true, and that we will find plenty of attractive securities in this environment. Digital-enabled business trends have been accelerated due to the pandemic, and many old-technology businesses should improve as the recovery continues, so there is much to be excited about.
However, we must keep in mind that these conditions are not guaranteed. New variants of the virus may cause a temporary stall, and if interest rates rise too much, there may be a concomitant decrease in the valuation of stocks. So, we will be watching carefully as we execute our investment approach, which seeks to appropriately balance risk and return. New individual investors attracted by the strong recent results of the stock market may be surprised when a patch of volatility inevitably recurs — but with our long history and investment horizon, we will view any such occurrences as opportunities.
Our time-tested process, based on extensive research, a long-term outlook and close attention to valuation, has served investors well over time, and will continue. As always, we thank you for your continued support of our efforts and we look forward to reporting to you again in six months.
Sincerely,

Donald D. O’Neal
Co-President

Alan N. Berro
Co-President
February 12, 2021
| 6 | MSCI Emerging Markets Investable Market Index (IMI) is a free float-adjusted market capitalization weighted index that is designed to measure results of the large-, mid-, and small-capitalization segments of more than 20 emerging equity markets. Results reflect dividends net of withholding taxes. |
| 7 | Source: Bloomberg Index Services Ltd. |
| 8 | Bloomberg Barclays U.S. Corporate Investment Grade Index represents the universe of investment grade, publicly issued U.S. corporate and specified foreign debentures and secured notes that meet the specified maturity, liquidity, and quality requirements. |
| 9 | Bloomberg Barclays U.S. Corporate High Yield 2% Issuer Capped Index covers the universe of fixed-rate, non-investment-grade debt. The index limits the maximum exposure of any one issuer to 2%. |
| 10 | Bloomberg Barclays Global Aggregate Index represents the global investment-grade fixed income markets. |
| 11 | Bloomberg Barclays U.S. Aggregate Index represents the U.S. investment-grade fixed-rate bond market. |
| 12 | JP Morgan Emerging Markets Bond Index – Global tracks total returns for U.S. dollar-denominated debt instruments issued by emerging markets sovereign and quasi-sovereign entities, including Brady bonds, loans and Eurobonds. |
| 2 | American Funds Insurance Series |
About the series
Unless otherwise indicated, American Funds Insurance Series investment results are for Class 1 shares (Class P1 shares for managed risk funds). Class 1A shares began operations on January 6, 2017. Class 2 shares began operations on April 30, 1997. Class 3 shares began operations on January 16, 2004. Class 4 shares began operations on December 14, 2012. Results encompassing periods prior to those dates assume a hypothetical investment in Class 1 shares and include the deduction of additional annual expenses (0.25% for Class 1A shares, 0.25% for Class 2 shares, 0.18% for Class 3 shares and 0.50% for Class 4 shares).
The variable annuities and life insurance contracts that use the series’ funds contain certain fees and expenses not reflected in this report. Investment results assume all distributions are reinvested and reflect applicable fees and expenses. When applicable, investment results reflect fee waivers and/or expense reimbursements, without which results would have been lower. Visit capitalgroup.com for more information.
For New World Fund, Capital Income Builder, Capital World Bond Fund and American Funds Mortgage Fund, the investment adviser is currently waiving a portion of its management fee equal to 0.18%, 0.26%, 0.10% and 0.18%, respectively, of each fund’s net assets. This waiver will be in effect through at least May 1, 2021. The waiver may only be modified or terminated with the approval of the series’ board. Applicable fund results shown reflect the waivers, without which results would have been lower. See the Financial Highlights tables in this report for details.
For the managed risk funds, the investment adviser is currently waiving a portion of its management fee equal to 0.05% of each fund’s net assets. In addition, the investment adviser is currently reimbursing a portion of other expenses for Managed Risk International Fund. The waivers and reimbursement will be in effect through at least May 1, 2021, unless modified or terminated by the series’ board. After that time, the investment adviser may elect to extend, modify or terminate the reimbursement. The waivers may only be modified or terminated with the approval of the series’ board. Applicable fund results shown reflect the waivers and reimbursement, without which results would have been lower. See the Financial Highlights tables in this report for details.
The Managed Risk Growth Fund pursues its objective by investing in shares of American Funds Insurance Series – Growth FundSM and American Funds Insurance Series – Bond FundSM. The Managed Risk International Fund pursues its objective by investing in shares of American Funds Insurance Series – International FundSM and American Funds Insurance Series – Bond FundSM. The Managed Risk Blue Chip Income and Growth Fund pursues its objective by investing in shares of American Funds Insurance Series – Blue Chip Income and Growth FundSM and American Funds Insurance Series – U.S. Government/AAA-Rated Securities FundSM. The Managed Risk Growth-Income Fund pursues its objective by investing in shares of American Funds Insurance Series – Growth-Income FundSM and American Funds Insurance Series – Bond FundSM. The Managed Risk Asset Allocation Fund pursues its objective by investing in shares of American Funds Insurance Series – Asset Allocation FundSM. The funds seek to manage portfolio volatility and provide downside protection, primarily through the use of exchange-traded futures. The benefit of the funds’ managed risk strategy should be most apparent during periods of high volatility and in down markets. In steady or rising markets, the funds’ results can be expected to lag those of the underlying fund.
Funds are listed in the report as follows: equity, balanced, fixed income and managed risk.
| American Funds Insurance Series | 3 |
Global Growth Fund
Fund results shown are for past periods and are not predictive of results for future periods. Current and future results may be lower or higher than those shown. Prices and returns will vary, so investors may lose money. Investing for short periods makes losses more likely. For current information and month-end results, visit capitalgroup.com/afis. For information about your insurance contract and month-end results, go to the website of the company that issued your contract.
Global Growth Fund advanced 30.79% for the 12 months ended December 31, 2020, compared with a 16.25% increase in its benchmark index, MSCI ACWI (All Country World Index),1 a free float-adjusted market capitalization-weighted index that is designed to measure equity market results in the global developed and emerging markets, consisting of more than 40 developed and emerging market country indexes.
Global stocks rose in the face of a deadly pandemic, boosted by massive government stimulus measures and the rapid development of coronavirus vaccines. In a year marked by unprecedented volatility, stocks declined sharply from February to March, followed by a remarkable nine-month rally that lifted many market indexes to all-time highs. U.S. equities also ended 2020 at record highs, showing resilience during a volatile year that included a pandemic-induced recession, a sharp bear market, civil unrest and a contentious presidential election. European stocks declined in local currency terms as the eurozone economy suffered the effects of government-imposed lockdowns and a severe recession. Emerging markets posted solid gains for a second consecutive year, led by China’s economic rebound and the technology-export-driven economies of Taiwan and South Korea.
Stock selection and allocation within the information technology sector were large relative return drivers. The fund’s relative weightings in ASML and TSMC benefitted the fund as both outpaced the wider market and were among the top contributors to the fund’s relative returns. Consumer discretionary stock Amazon also helped the fund’s relative returns, as its returns outpaced the market.
The biggest drag on relative results was Apple – a stock the fund didn’t own – as it proved to be one of the strongest performers for the year.
On a geographic basis, stocks of companies domiciled in the United States and the Netherlands were additive to results, while stocks of companies based in France and Switzerland detracted.
The fund’s portfolio managers are optimistic they will continue to find good companies globally that offer high quality products, and whose values are not yet fully reflected in their share prices.
| 4 | American Funds Insurance Series |
Global Growth Fund (continued)
How a hypothetical $10,000 investment has grown

Total returns based on a $1,000 investment
For periods ended December 31, 20202
| | | 1 year | | 5 years | | 10 years | | Lifetime
(since April 30, 1997) | | Expense
ratio |
| | | | | | | | | | | |
| Class 1 | | | 30.79 | % | | | 16.55 | % | | | 13.14 | % | | | 11.01 | % | | | .56 | % |
| Class 1A | | | 30.49 | | | | 16.27 | | | | 12.86 | | | | 10.74 | | | | .81 | |
| Class 2 | | | 30.47 | | | | 16.26 | | | | 12.86 | | | | 10.74 | | | | .81 | |
| Class 4 | | | 30.17 | | | | 15.96 | | | | 12.62 | | | | 10.48 | | | | 1.06 | |
Investment results assume all distributions are reinvested and reflect applicable fees and expenses. When applicable, investment results reflect fee waivers and/or expense reimbursements, without which results would have been lower. Visit capitalgroup.com for more information. Expense ratios are as of the fund’s prospectus dated May 1, 2021 (unaudited). See the Financial Highlights table in this report for details.
Any market index shown is unmanaged and, therefore, has no expenses. Investors cannot invest directly in an index.
| 1 | Source: MSCI. The MSCI index result reflects dividends net of withholding taxes and reinvestment of distributions. |
| 2 | Periods greater than one year are annualized. |
| Where the fund’s assets were invested as of December 31, 2020 | Percent of net assets |

| American Funds Insurance Series | 5 |
Global Small Capitalization Fund
Fund results shown are for past periods and are not predictive of results for future periods. Current and future results may be lower or higher than those shown. Prices and returns will vary, so investors may lose money. Investing for short periods makes losses more likely. For current information and month-end results, visit capitalgroup.com/afis. For information about your insurance contract and month-end results, go to the website of the company that issued your contract.
Global Small Capitalization Fund increased 30.04% for the 12 months ended December 31, 2020. Its benchmark, the MSCI All Country World Small Cap Index,1 a free float-adjusted market capitalization-weighted index designed to measure equity market results of smaller capitalization companies in both developed and emerging markets, gained 16.33%.
Global stocks rose in the face of a deadly pandemic, boosted by massive government stimulus measures and the rapid development of coronavirus vaccines. In a year marked by unprecedented volatility, stocks declined sharply from February to March, followed by a remarkable nine-month rally that lifted many market indexes to all-time highs. U.S. equities also ended 2020 at record highs, showing resilience during a volatile year that included a pandemic-induced recession, a sharp bear market, civil unrest and a contentious presidential election. European stocks declined in local currency terms as the eurozone economy suffered the effects of government-imposed lockdowns and a severe recession. Emerging markets posted solid gains for a second consecutive year, led by China’s economic rebound and the technology-export-driven economies of Taiwan and South Korea.
Fund holdings in the information technology and financial sectors contributed the most to relative returns. Information technology stock Cree widely outpaced the broader market and was among the fund’s top contributors over the period. However, the fund’s holdings of health care company Cortexyme detracted from returns.
While investments in U.S. companies were additive to returns, investments in companies domiciled in Brazil detracted.
The fund’s portfolio managers continue to seek investment opportunities in undervalued companies that have the potential to change industries and benefit shareholders. They believe rigorous bottom-up research into each potential equity investment can help achieve this goal. The fund currently holds more than 250 companies diversified across geographies and industries. As always, we maintain our commitment to investing for the long term.
| 6 | American Funds Insurance Series |
Global Small Capitalization Fund (continued)
How a hypothetical $10,000 investment has grown

Total returns based on a $1,000 investment
For periods ended December 31, 20202
| | | 1 year | | 5 years | | 10 years | | Lifetime
(since April 30, 1998) | | Expense
ratio |
| | | | | | | | | | | |
| Class 1 | | | 30.04 | % | | | 14.71 | % | | | 9.70 | % | | | 10.53 | % | | | 74 | % |
| Class 1A | | | 29.72 | | | | 14.45 | | | | 9.44 | | | | 10.25 | | | | .99 | |
| Class 2 | | | 29.72 | | | | 14.43 | | | | 9.43 | | | | 10.25 | | | | .99 | |
| Class 4 | | | 29.39 | | | | 14.15 | | | | 9.17 | | | | 9.98 | | | | 1.24 | |
Investment results assume all distributions are reinvested and reflect applicable fees and expenses. When applicable, investment results reflect fee waivers and/or expense reimbursements, without which results would have been lower. Visit capitalgroup.com for more information. Expense ratios are as of the fund’s prospectus dated May 1, 2021 (unaudited). See the Financial Highlights table in this report for details.
Any market index shown is unmanaged and, therefore, has no expenses. Investors cannot invest directly in an index.
| 1 | Source: MSCI. The MSCI index result reflects dividends net of withholding taxes and reinvestment of distributions. |
| 2 | Periods greater than one year are annualized. |
| Where the fund’s assets were invested as of December 31, 2020 | Percent of net assets |

| American Funds Insurance Series | 7 |
Growth Fund
Fund results shown are for past periods and are not predictive of results for future periods. Current and future results may be lower or higher than those shown. Prices and returns will vary, so investors may lose money. Investing for short periods makes losses more likely. For current information and month-end results, visit capitalgroup.com/afis. For information about your insurance contract and month-end results, go to the website of the company that issued your contract.
Growth Fund gained 52.45% for the 12 months ended December 31, 2020, compared with a 18.40% increase in its benchmark index, Standard & Poor’s 500 Composite Index,1 a market capitalization-weighted index based on the results of approximately 500 widely held common stocks.
U.S. equities ended 2020 at record highs, showing resilience during a volatile year that included a pandemic-induced recession, a sharp bear market, civil unrest and a contentious presidential election. Information technology, consumer discretionary and communication services stocks that benefited from stay-at-home restrictions led markets, including Amazon and Netflix. Overall, the information technology sector rose 44%, while consumer discretionary and communication services gained 33% and 24%, respectively. Energy lagged all other sectors, declining 34%. The significant reduction in travel reduced the demand for oil, which was briefly priced below $0 for the first time in history amid fears of dwindling storage capacity. The real estate and financials sectors were also negative for the year, each declining 2%.
The fund’s top contributors in relative terms were the consumer discretionary and communication services sectors. Investments in Tesla and Netflix were additive to relative results. Tesla’s shares soared as founder Elon Musk’s effort to bring electric vehicles into the mainstream gained traction, transforming the company’s underlying financial performance.
On the downside, investments in Suncor Energy and MTU Aero Engines detracted from relative returns. The fund’s significantly lower-than-benchmark position in Apple, which proved to be a high-performing stock, also detracted from relative returns.
Although U.S. economic growth remained solid, the fund’s portfolio managers are keeping a close watch on the impact of COVID-recovery and stimulus measures on economic indicators. Portfolio managers continue to favor well-positioned companies with capital appreciation potential that are capable of generating outstanding returns in myriad near-term economic environments. They also remain optimistic that our global research will help us identify attractive long-term investment opportunities.
| 8 | American Funds Insurance Series |
Growth Fund (continued)
How a hypothetical $10,000 investment has grown

Total returns based on a $1,000 investment
For periods ended December 31, 20202
| | | 1 year | | 5 years | | 10 years | | Lifetime
(since February 8, 1984) | | Expense
ratio |
| | | | | | | | | | | |
| Class 1 | | | 52.45 | % | | | 23.06 | % | | | 17.14 | % | | | 13.85 | % | | | .36 | % |
| Class 1A | | | 52.07 | | | | 22.76 | | | | 16.85 | | | | 13.56 | | | | .61 | |
| Class 2 | | | 52.10 | | | | 22.75 | | | | 16.85 | | | | 13.56 | | | | .61 | |
| Class 3 | | | 52.20 | | | | 22.83 | | | | 16.93 | | | | 13.64 | | | | .54 | |
| Class 4 | | | 51.71 | | | | 22.44 | | | | 16.57 | | | | 13.28 | | | | .86 | |
Investment results assume all distributions are reinvested and reflect applicable fees and expenses. When applicable, investment results reflect fee waivers and/or expense reimbursements, without which results would have been lower. Visit capitalgroup.com for more information. Expense ratios are as of the fund’s prospectus dated May 1, 2021 (unaudited). See the Financial Highlights table in this report for details.
Any market index shown is unmanaged and, therefore, has no expenses. Investors cannot invest directly in an index.
| 1 | Source: S&P Dow Jones Indices LLC. |
| 2 | Periods greater than one year are annualized. |
| Where the fund’s assets were invested as of December 31, 2020 | Percent of net assets |

| American Funds Insurance Series | 9 |
International Fund
Fund results shown are for past periods and are not predictive of results for future periods. Current and future results may be lower or higher than those shown. Prices and returns will vary, so investors may lose money. Investing for short periods makes losses more likely. For current information and month-end results, visit capitalgroup.com/afis. For information about your insurance contract and month-end results, go to the website of the company that issued your contract.
International Fund advanced 14.28% for the 12 months ended December 31, 2020, compared with a 10.65% increase in its benchmark index, MSCI ACWI (All Country World Index) ex USA,1 a free float-adjusted market capitalization-weighted index that is designed to measure equity market results in the global developed and emerging markets (consisting of more than 40 developed and emerging market country indexes, excluding the U.S.).
Global stocks rose in the face of a deadly pandemic, boosted by massive government stimulus measures and the rapid development of coronavirus vaccines. In a year marked by unprecedented volatility, stocks declined sharply from February to March, followed by a remarkable nine-month rally that lifted many market indexes to all-time highs. U.S. equities also ended 2020 at record highs, showing resilience during a volatile year that included a pandemic-induced recession, a sharp bear market, civil unrest and a contentious presidential election. European stocks declined in local currency terms as the eurozone economy suffered the effects of government-imposed lockdowns and a severe recession. Emerging markets posted solid gains for a second consecutive year, led by China’s economic rebound and the technology-export-driven economies of Taiwan and South Korea.
Investments in the consumer discretionary and health care sectors boosted relative returns. MercadoLibre, the leading e-commerce site for Latin America, was among the top contributors as shares surged to fresh highs while the COVID-19 pandemic drove the adoption of online shopping in Latin America. On the downside, some investments in the industrials sector hindered relative returns. In particular, Airbus was a top relative detractor.
The fund’s portfolio managers continue to monitor volatility and potential headwinds brought about by political and trade uncertainty. Given how late it may be in the current bull market, they seek opportunities especially in regions, countries and sectors less affected by these global headlines. Their focus on a company’s fundamental growth drivers and intrinsic worth is critical to helping them identify investments that they believe represent the best value over the long term.
| 10 | American Funds Insurance Series |
International Fund (continued)
How a hypothetical $10,000 investment has grown

Total returns based on a $1,000 investment
For periods ended December 31, 20202
| | | 1 year | | 5 years | | 10 years | | Lifetime
(since May 1, 1990) | | Expense
ratio |
| | | | | | | | | | | |
| Class 1 | | | 14.28 | % | | | 11.00 | % | | | 6.94 | % | | | 8.40 | % | | | .55 | % |
| Class 1A | | | 13.96 | | | | 10.73 | | | | 6.68 | | | | 8.13 | | | | .80 | |
| Class 2 | | | 13.97 | | | | 10.73 | | | | 6.68 | | | | 8.13 | | | | .80 | |
| Class 3 | | | 14.00 | | | | 10.79 | | | | 6.75 | | | | 8.21 | | | | .73 | |
| Class 4 | | | 13.66 | | | | 10.45 | | | | 6.43 | | | | 7.87 | | | | 1.05 | |
Investment results assume all distributions are reinvested and reflect applicable fees and expenses. When applicable, investment results reflect fee waivers and/or expense reimbursements, without which results would have been lower. Visit capitalgroup.com for more information. Expense ratios are as of the fund’s prospectus dated May 1, 2021 (unaudited). See the Financial Highlights table in this report for details.
Any market index shown is unmanaged and, therefore, has no expenses. Investors cannot invest directly in an index.
| 1 | Source: MSCI. The MSCI index result reflects dividends net of withholding taxes and reinvestment of distributions. |
| 2 | Periods greater than one year are annualized. |
| Where the fund’s assets were invested as of December 31, 2020 | Percent of net assets |
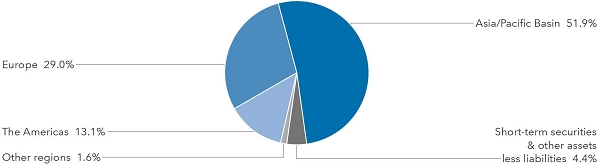
| American Funds Insurance Series | 11 |
New World Fund®
Fund results shown are for past periods and are not predictive of results for future periods. Current and future results may be lower or higher than those shown. Prices and returns will vary, so investors may lose money. Investing for short periods makes losses more likely. For current information and month-end results, visit capitalgroup.com/afis. For information about your insurance contract and month-end results, go to the website of the company that issued your contract.
New World Fund was up 23.89% for the 12 months ended December 31, 2020. Its benchmark index, the MSCI ACWI (All Country World Index),1 a free float-adjusted market capitalization-weighted index that is designed to measure equity market results in the global developed and emerging markets (consisting of more than 40 developed and emerging market country indexes), was up 16.25%. The MSCI Emerging Markets (EM) Index,1 a free float-adjusted market capitalization-weighted index that is designed to measure equity market results in the global emerging markets (consisting of more than 20 emerging market country indexes), increased by 18.31%.
Global stocks rose in the face of a deadly pandemic, boosted by massive government stimulus measures and the rapid development of coronavirus vaccines. In a year marked by unprecedented volatility, stocks declined sharply from February to March, followed by a remarkable nine-month rally that lifted many market indexes to all-time highs. U.S. equities also ended 2020 at record highs, showing resilience during a volatile year that included a pandemic-induced recession, a sharp bear market, civil unrest and a contentious presidential election. European stocks declined in local currency terms as the eurozone economy suffered the effects of government-imposed lockdowns and a severe recession. Emerging markets posted solid gains for a second consecutive year, led by China’s economic rebound and the technology-export-driven economies of Taiwan and South Korea.
The fund’s relative returns outpaced emerging markets in general. Investments in the communication services and consumer staples sectors were beneficial to the fund. MercadoLibre, the leading e-commerce site for Latin America, was among the top contributors as shares surged to fresh highs while the COVID-19 pandemic drove the adoption of online shopping in Latin America. On the downside, a position in Societe Generale detracted from relative returns, as its performance lagged the general market.
The fund’s portfolio managers continue to pursue a bottom-up approach to investing and search for undervalued companies with solid foundations around the world, as well as stocks that are domestically focused and more insulated from geopolitical events given increased volatility at this point in the market cycle.
| 12 | American Funds Insurance Series |
New World Fund® (continued)
How a hypothetical $10,000 investment has grown

Total returns based on a $1,000 investment
For periods ended December 31, 20202
| | | 1 year | | 5 years | | 10 years | | Lifetime
(since June 17, 1999) | | Gross
expense ratio | | Net
expense ratio |
| | | | | | | | | | | | | |
| Class 1 | | | 23.89 | % | | | 13.62 | % | | | 6.80 | % | | | 9.16 | % | | | .77 | % | | | .59 | % |
| Class 1A | | | 23.63 | | | | 13.34 | | | | 6.54 | | | | 8.89 | | | | 1.02 | | | | .84 | |
| Class 2 | | | 23.58 | | | | 13.33 | | | | 6.54 | | | | 8.89 | | | | 1.02 | | | | .84 | |
| Class 4 | | | 23.29 | | | | 13.05 | | | | 6.28 | | | | 8.62 | | | | 1.27 | | | | 1.09 | |
Investment results assume all distributions are reinvested and reflect applicable fees and expenses. The investment adviser is currently waiving a portion of its management fee. This waiver will be in effect through at least May 1, 2021. The waiver may only be modified or terminated with the approval of the series’ board. When applicable, investment results reflect fee waivers and/or expense reimbursements, without which results would have been lower. Visit capitalgroup.com for more information. Expense ratios are as of the fund’s prospectus dated May 1, 2021 (unaudited). See the Financial Highlights table in this report for details.
Any market index shown is unmanaged and, therefore, has no expenses. Investors cannot invest directly in an index.
| 1 | Source: MSCI. Results for MSCI indexes reflect dividends net of withholding taxes and reinvestment of distributions. |
| 2 | Periods greater than one year are annualized. |
| Where the fund’s assets were invested as of December 31, 2020 | Percent of net assets |
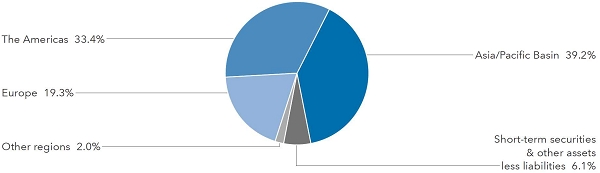
| American Funds Insurance Series | 13 |
Blue Chip Income and Growth Fund
Fund results shown are for past periods and are not predictive of results for future periods. Current and future results may be lower or higher than those shown. Prices and returns will vary, so investors may lose money. Investing for short periods makes losses more likely. For current information and month-end results, visit capitalgroup.com/afis. For information about your insurance contract and month-end results, go to the website of the company that issued your contract.
Blue Chip Income and Growth Fund gained 9.04% for the 12 months ended December 31, 2020, trailing the 18.40 % rise in its benchmark index, Standard & Poor’s 500 Composite Index,1 a market capitalization-weighted index based on the results of approximately 500 widely held common stocks.
U.S. equities ended 2020 at record highs, showing resilience during a volatile year that included a pandemic-induced recession, a sharp bear market, civil unrest and a contentious presidential election. Information technology, consumer discretionary and communication services stocks that benefited from stay-at-home restrictions led markets, including Amazon and Netflix. Overall, the information technology sector rose 44%, while consumer discretionary and communication services gained 33% and 24%, respectively. Energy lagged all other sectors, declining 34%. The significant reduction in travel reduced the demand for oil, which was briefly priced below $0 for the first time in history amid fears of dwindling storage capacity. The real estate and financials sectors were also negative for the year, each declining 2%.
Among the fund’s top contributors to relative returns was Broadcom. The semiconductor and wireless company added the most to relative returns, boosted by strong financial results, including revenues of $23.9 billion in fiscal 2020, up 6% over fiscal 2019. Another top contributor was Carrier Global, where sales growth was largely driven by record demand for residential HVAC products in North America.
On the downside, investments in the energy sector were a drag on results. Energy lagged all other sectors as a significant reduction in travel reduced the demand for oil, which was briefly priced below $0 for the first time in history over fears of dwindling storage capacity. Within the sector, investments in Exxon Mobil and Diamondback Energy hurt results. While overall results lagged the market, we continue to believe the focus on dividend-paying stocks will pay off over the long term.
Nearer term, the fund’s portfolio managers are aware that the market is keeping a close watch on U.S. monetary policy, recovery from the pandemic, economic stimulus and the resulting implications on the U.S. economy. Portfolio managers continue to favor well-managed, high-quality companies that are capable of paying dividends in myriad economic environments. We remain optimistic that this focus, supported by our global research, will help us to identify attractive long-term investment opportunities.
| 14 | American Funds Insurance Series |
Blue Chip Income and Growth Fund (continued)
How a hypothetical $10,000 investment has grown

Total returns based on a $1,000 investment
For periods ended December 31, 20203
| | | 1 year | | 5 years | | 10 years | | Lifetime
(since July 5,2001) | | Gross
expense ratio | | Net
expense ratio |
| | | | | | | | | | | | | |
| Class 1 | | | 9.04 | % | | | 11.14 | % | | | 11.18 | % | | | 6.82 | % | | | .43 | % | | | .27 | % |
| Class 1A | | | 8.79 | | | | 10.89 | | | | 10.91 | | | | 6.56 | | | | .91 | | | | .68 | |
| Class 2 | | | 8.68 | | | | 10.85 | | | | 10.90 | | | | 6.55 | | | | .68 | | | | .52 | |
| Class 4 | | | 8.47 | | | | 10.58 | | | | 10.68 | | | | 6.32 | | | | .93 | | | | .93 | |
Investment results assume all distributions are reinvested and reflect applicable fees and expenses. The investment adviser intends to waive a portion of its management fees beginning May 1, 2021. This waiver will be in effect through at least May 1, 2022. The waiver may only be modified or terminated with the approval of the series’ board. When applicable, investment results reflect fee waivers and/or expense reimbursements, without which results would have been lower. Visit capitalgroup.com for more information. Expense ratios are as of the fund’s prospectus dated May 1, 2021 (unaudited). See the Financial Highlights table in this report for details.
Any market index shown is unmanaged and, therefore, has no expenses. Investors cannot invest directly in an index.
| 1 | Source: S&P Dow Jones Indices LLC. |
| 2 | Source: Refinitiv Lipper. Results for the Lipper indexes do not reflect sales charges. Lipper indexes track the largest mutual funds (no more than 30), represented by one share class per fund, in the corresponding Lipper category. |
| 3 | Periods greater than one year are annualized. |
| Where the fund’s assets were invested as of December 31, 2020 | Percent of net assets |
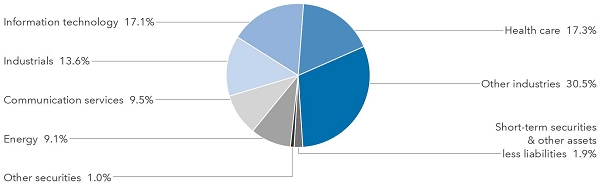
| American Funds Insurance Series | 15 |
Global Growth and Income Fund
Fund results shown are for past periods and are not predictive of results for future periods. Current and future results may be lower or higher than those shown. Prices and returns will vary, so investors may lose money. Investing for short periods makes losses more likely. For current information and month-end results, visit capitalgroup.com/afis. For information about your insurance contract and month-end results, go to the website of the company that issued your contract.
Global Growth and Income Fund advanced 9.03% for the 12 months ended December 31, 2020, compared with a 16.25% increase in its benchmark index, MSCI ACWI (All Country World Index),1 a free float-adjusted market capitalization-weighted index that is designed to measure equity market results in the global developed and emerging markets, consisting of more than 40 developed and emerging market country indexes.
Global stocks rose in the face of a deadly pandemic, boosted by massive government stimulus measures and the rapid development of coronavirus vaccines. In a year marked by unprecedented volatility, stocks declined sharply from February to March, followed by a remarkable nine-month rally that lifted many market indexes to all-time highs. U.S. equities also ended 2020 at record highs, showing resilience during a volatile year that included a pandemic-induced recession, a sharp bear market, civil unrest and a contentious presidential election. European stocks declined in local currency terms as the eurozone economy suffered the effects of government-imposed lockdowns and a severe recession. Emerging markets posted solid gains for a second consecutive year, led by China’s economic rebound and the technology-export-driven economies of Taiwan and South Korea.
The fund’s relative performance benefited from specific stock selection, particularly within the information technology and energy sectors. Information technology firm TSMC was the top contributor to results. On the downside, some investments in the industrials sector hindered relative returns. In particular, Airbus was the top relative detractor.
On a country basis, holdings in Taiwan and Australia contributed the most to relative returns, and holdings in the U.S. and France were a drag on returns.
The fund’s portfolio managers recognize that we are experiencing a slowdown in global economic growth. However, we expect that some sectors’ businesses and companies’ share prices, particularly hard-hit by COVID-19, will recover in the medium term as vaccinations are rolled out globally in 2021. Portfolio managers continue to invest based on a bottom-up approach to long-term investing and believe they can uncover promising companies with strong positions in their industries, sustainable growth and income opportunities globally – including in emerging markets.
| 16 | American Funds Insurance Series |
Global Growth and Income Fund (continued)
How a hypothetical $10,000 investment has grown

Total returns based on a $1,000 investment
For periods ended December 31, 20202
| | | 1 year | | 5 years | | 10 years | | Lifetime
(since May 1, 2006) | | Gross
expense ratio | | Net
expense ratio |
| | | | | | | | | | | | | |
| Class 1 | | | 9.03 | % | | | 12.05 | % | | | 9.83 | % | | | 7.66 | % | | | .66 | % | | | .43 | % |
| Class 1A | | | 8.78 | | | | 11.81 | | | | 9.58 | | | | 7.40 | | | | .91 | | | | .68 | |
| Class 2 | | | 8.73 | | | | 11.76 | | | | 9.56 | | | | 7.39 | | | | .91 | | | | .68 | |
| Class 4 | | | 8.55 | | | | 11.48 | | | | 9.31 | | | | 7.14 | | | | 1.16 | | | | .93 | |
Investment results assume all distributions are reinvested and reflect applicable fees and expenses. The investment adviser intends to waive a portion of its management fees beginning May 1, 2021. This waiver will be in effect through at least May 1, 2022. The waiver may only be modified or terminated with the approval of the series’ board. When applicable, investment results reflect fee waivers and/or expense reimbursements, without which results would have been lower. Visit capitalgroup.com for more information. Expense ratios are as of the fund’s prospectus dated May 1, 2021 (unaudited). See the Financial Highlights table in this report for details.
Any market index shown is unmanaged and, therefore, has no expenses. Investors cannot invest directly in an index.
| 1 | Source MSCI. The MSCI index result reflects dividends net of withholding taxes and reinvestment of distributions. |
| 2 | Periods greater than one year are annualized. |
| Where the fund’s assets were invested as of December 31, 2020 | Percent of net assets |
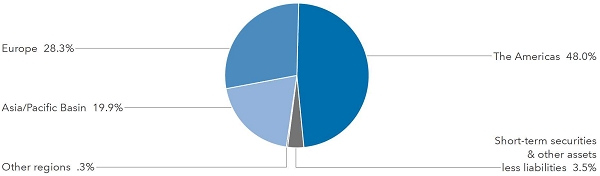
| American Funds Insurance Series | 17 |
Growth-Income Fund
Fund results shown are for past periods and are not predictive of results for future periods. Current and future results may be lower or higher than those shown. Prices and returns will vary, so investors may lose money. Investing for short periods makes losses more likely. For current information and month-end results, visit capitalgroup.com/afis. For information about your insurance contract and month-end results, go to the website of the company that issued your contract.
Growth-Income Fund gained 13.81% for the 12 months ended December 31, 2020, compared with a 18.40% increase in its benchmark index, Standard & Poor’s 500 Composite Index,1 a market capitalization-weighted index based on the results of approximately 500 widely held common stocks.
U.S. equities ended 2020 at record highs, showing resilience during a volatile year that included a pandemic-induced recession, a sharp bear market, civil unrest and a contentious presidential election. Information technology, consumer discretionary and communication services stocks that benefited from stay-at-home restrictions led markets, including Amazon and Netflix. Overall, the information technology sector rose 44%, while consumer discretionary and communication services gained 33% and 24%, respectively. Energy lagged all other sectors, declining 34%. The significant reduction in travel reduced the demand for oil, which was briefly priced below $0 for the first time in history amid fears of dwindling storage capacity. The real estate and financials sectors were also negative for the year, each declining 2%.
Regarding the fund, investments in the communication services sector contributed the most to the fund’s relative returns. Among these stocks, Netflix added the most to the fund’s relative results as shares soared while stay-at-home orders spurred demand for internet-streaming media. On the downside, the fund’s lower-than-index position in information technology stocks, a sector that performed strongly over the period, weighed on relative returns. In particular, the fund’s lower-than-index investment in Apple hindered sector results the most as Apple shares outperformed the broader market over the period.
The fund’s portfolio managers continue to look for compelling investment opportunities, buying stocks they believe represent the best value over the long term.
| 18 | American Funds Insurance Series |
Growth-Income Fund (continued)
How a hypothetical $10,000 investment has grown

Total returns based on a $1,000 investment
For periods ended December 31, 20202
| | | 1 year | | 5 years | | 10 years | | Lifetime
(since February 8, 1984) | | Expense
ratio |
| | | | | | | | | | | |
| Class 1 | | | 13.81 | % | | | 14.22 | % | | | 13.02 | % | | | 11.52 | % | | | .30 | % |
| Class 1A | | | 13.55 | | | | 13.95 | | | | 12.75 | | | | 11.25 | | | | .55 | |
| Class 2 | | | 13.54 | | | | 13.93 | | | | 12.74 | | | | 11.24 | | | | .55 | |
| Class 3 | | | 13.60 | | | | 14.01 | | | | 12.82 | | | | 11.32 | | | | .48 | |
| Class 4 | | | 13.25 | | | | 13.65 | | | | 12.47 | | | | 10.97 | | | | .80 | |
Investment results assume all distributions are reinvested and reflect applicable fees and expenses. When applicable, investment results reflect fee waivers and/or expense reimbursements, without which results would have been lower. Visit capitalgroup.com for more information. Expense ratios are as of the fund’s prospectus dated May 1, 2021 (unaudited). See the Financial Highlights table in this report for details.
Any market index shown is unmanaged and, therefore, has no expenses. Investors cannot invest directly in an index.
| 1 | Source: S&P Dow Jones Indices LLC. |
| 2 | Periods greater than one year are annualized. |
| Where the fund’s assets were invested as of December 31, 2020 | Percent of net assets |

| American Funds Insurance Series | 19 |
International Growth and Income Fund
Fund results shown are for past periods and are not predictive of results for future periods. Current and future results may be lower or higher than those shown. Prices and returns will vary, so investors may lose money. Investing for short periods makes losses more likely. For current information and month-end results, visit capitalgroup.com/afis. For information about your insurance contract and month-end results, go to the website of the company that issued your contract.
International Growth and Income Fund advanced 6.24% for the 12 months ended December 31, 2020, compared with a 10.65% increase in its benchmark index, MSCI ACWI (All Country World Index) ex USA,1 a free float-adjusted market capitalization-weighted index that is designed to measure equity market results in the global developed and emerging markets (consisting of more than 40 developed and emerging market country indexes excluding the U.S.).
Global stocks rose in the face of a deadly pandemic, boosted by massive government stimulus measures and the rapid development of coronavirus vaccines. In a year marked by unprecedented volatility, stocks declined sharply from February to March, followed by a remarkable nine-month rally that lifted many market indexes to all-time highs. U.S. equities also ended 2020 at record highs, showing resilience during a volatile year that included a pandemic-induced recession, a sharp bear market, civil unrest and a contentious presidential election. European stocks declined in local currency terms as the eurozone economy suffered the effects of government-imposed lockdowns and a severe recession. Emerging markets posted solid gains for a second consecutive year, led by China’s economic rebound and the technology-export-driven economies of Taiwan and South Korea.
The top contributors to the fund’s relative returns were the communication services and utilities sectors due in part to good stock selection. Health care stock Daiichi Sankyo was the top contributor to the fund’s relative returns as it benefited from positive sentiment on Daiichi Sankyo’s sales of mainstay products. The company also indicated it was aiming to initiate clinical studies for an mRNA coronavirus vaccine candidate in March 2021.
On the downside, investments in the industrials and information technology sectors detracted from the fund’s relative returns. Among energy stocks, Royal Dutch Shell was one of the fund’s biggest drags on returns as shares fell sharply when oil prices plummeted, a result of decreasing demand brought about by a pandemic-induced slump in global economic growth.
The fund’s portfolio managers follow global economic and geopolitical uncertainties with an aim to preserve value in any potential market correction while preparing to take advantage of buying opportunities as they arise.
| 20 | American Funds Insurance Series |
International Growth and Income Fund (continued)
How a hypothetical $10,000 investment has grown
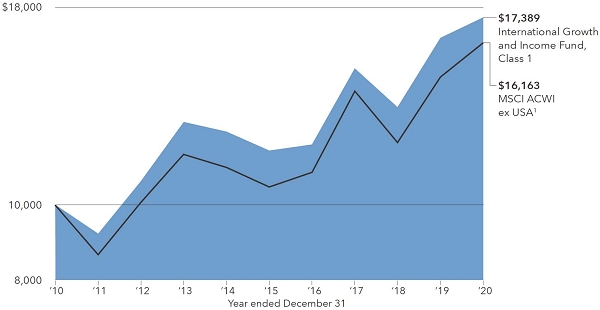
Total returns based on a $1,000 investment
For periods ended December 31, 20202
| | | 1 year | | 5 years | | 10 years | | Lifetime
(since November 18, 2008) | | Expense
ratio |
| | | | | | | | | | | |
| Class 1 | | | 6.24 | % | | | 8.20 | % | | | 5.69 | % | | | 9.06 | % | | | .68 | % |
| Class 1A | | | 5.98 | | | | 7.95 | | | | 5.44 | | | | 8.80 | | | | .93 | |
| Class 2 | | | 6.01 | | | | 7.94 | | | | 5.43 | | | | 8.79 | | | | .93 | |
| Class 4 | | | 5.73 | | | | 7.67 | | | | 5.20 | | | | 8.55 | | | | 1.18 | |
Investment results assume all distributions are reinvested and reflect applicable fees and expenses. When applicable, investment results reflect fee waivers and/or expense reimbursements, without which results would have been lower. Visit capitalgroup.com for more information. Expense ratios are as of the fund’s prospectus dated May 1, 2021 (unaudited). See the Financial Highlights table in this report for details.
Any market index shown is unmanaged and, therefore, has no expenses. Investors cannot invest directly in an index.
| 1 | Source: MSCI. The MSCI index result reflects dividends net of withholding taxes and reinvestment of distributions. |
| 2 | Periods greater than one year are annualized. |
| Where the fund’s assets were invested as of December 31, 2020 | Percent of net assets |

| American Funds Insurance Series | 21 |
Capital Income Builder®
Fund results shown are for past periods and are not predictive of results for future periods. Current and future results may be lower or higher than those shown. Prices and returns will vary, so investors may lose money. Investing for short periods makes losses more likely. For current information and month-end results, visit capitalgroup.com/afis. For information about your insurance contract and month-end results, go to the website of the company that issued your contract.
Capital Income Builder, which invests in a mix of stocks and bonds, gained 4.64% for the 12 months ended December 31, 2020. During the same period, the MSCI ACWI (All Country World Index)1, a free float-adjusted market capitalization-weighted index that is designed to measure equity market results in the global developed and emerging markets (consisting of more than 40 developed and emerging market country indexes), gained 16.25%. The Bloomberg Barclays U.S. Aggregate Index2, which represents the U.S. investment-grade (rated BBB/Baa and above) fixed-rate bond market, gained 7.51%. The index blend of 70%/30% MSCI ACWI/Bloomberg Barclays U.S. Aggregate Index3 gained 14.28%. Effective May 1, 2021, the fund has elected to use the 70%/30% MSCI ACWI/Bloomberg Barclays U.S. Aggregate Index as its primary benchmark, because it comes closest to reflecting its investment universe and best measures its long-term results and portfolio managers’ success over time. The Lipper Global Equity Income Funds Average4, a measure of similar funds, was up 2.51%.
Global stocks rose in the face of a deadly pandemic, boosted by massive government stimulus measures and the rapid development of coronavirus vaccines. In a year marked by unprecedented volatility, stocks declined sharply from February to March, followed by a remarkable nine-month rally that lifted many market indexes to all-time highs. U.S. equities also ended 2020 at record highs, showing resilience during a volatile year that included a pandemic-induced recession, a sharp bear market, civil unrest and a contentious presidential election. European stocks declined in local currency terms as the eurozone economy suffered the effects of government-imposed lockdowns and a severe recession. Emerging markets posted solid gains for a second consecutive year, led by China’s economic rebound and the technology-export-driven economies of Taiwan and South Korea.
In the equity portfolio, the top contributors in relative terms were the financials and real estate sectors. Semiconductor and wireless company Broadcom added the most to relative returns, boosted by strong financial results, including revenues of $23.9 billion in fiscal 2020, up 6% over fiscal 2019.
On the downside, the consumer discretionary sector was a drag on relative returns. The fund’s top detractor to relative returns was information technology company Apple. The fund had a significantly lower investment in Apple compared to the index and Apple proved to be one of the top performers for the year. The fund’s fixed income portfolio added to relative returns, due to duration, sector positioning and security selection.
Despite expectations for a gradual lessening of the impact of the COVID-19 pandemic, the current market environment continues to be characterized by significant uncertainty. Anticipation is strong for central bankers and legislatures to do everything in their power to maintain economic growth, but the fund’s portfolio managers continue to seek to avoid companies that take on inappropriate levels of debt to pay dividends and are focused instead on identifying companies with strong business models and a commitment to paying and growing dividends over time.
| 22 | American Funds Insurance Series |
Capital Income Builder® (continued)
How a hypothetical $10,000 investment has grown

Total returns based on a $1,000 investment
For periods ended December 31, 20205
| | | 1 year | | 5 years | | Lifetime
(since May 1, 2014) | | Gross
expense ratio | | Net
expense ratio |
| | | | | | | | | | | |
| Class 1 | | | 4.64 | % | | | 6.35 | % | | | 4.55 | % | | | .53 | % | | | .28 | % |
| Class 1A | | | 4.38 | | | | 6.09 | | | | 4.29 | | | | .78 | | | | .53 | |
| Class 2 | | | 4.48 | | | | 6.13 | | | | 4.39 | | | | .78 | | | | .53 | |
| Class 4 | | | 4.11 | | | | 5.84 | | | | 4.03 | | | | 1.03 | | | | .78 | |
Investment results assume all distributions are reinvested and reflect applicable fees and expenses. The investment adviser is currently waiving a portion of its management fee. This waiver will be in effect through at least May 1, 2021. The waiver may only be modified or terminated with the approval of the series’ board. When applicable, investment results reflect fee waivers and/or expense reimbursements, without which results would have been lower. Visit capitalgroup.com for more information. Expense ratios are as of the fund’s prospectus dated May 1, 2021 (unaudited). See the Financial Highlights table in this report for details.
Any market index shown is unmanaged and, therefore, has no expenses. Investors cannot invest directly in an index.
| 1 | Source: MSCI. The MSCI index result reflects dividends net of withholding taxes and reinvestment of distributions. |
| 2 | Source: Bloomberg Index Services Ltd. |
| 3 | Data sources: MSCI and Bloomberg Index Services Ltd. The 70%/30% MSCI ACWI/Bloomberg Barclays U.S. Aggregate Index blends the MSCI ACWI (All Country World Index) with the Bloomberg Barclays U.S. Aggregate Index by weighting their total returns at 70% and 30%, respectively. Its result assumes the blend is rebalanced monthly. |
| 4 | Source: Refinitiv Lipper. Lipper averages reflect the current composition of all eligible mutual funds (all share classes) within a given category. Lipper categories are dynamic and averages may have few funds, especially over longer periods. To see the number of funds included in the Lipper category for each fund’s lifetime, please see the Quarterly Statistical Update, available on our website. |
| 5 | Periods greater than one year are annualized. |
| Where the fund’s assets were invested as of December 31, 2020 | Percent of net assets |

| American Funds Insurance Series | 23 |
Asset Allocation Fund
Fund results shown are for past periods and are not predictive of results for future periods. Current and future results may be lower or higher than those shown. Prices and returns will vary, so investors may lose money. Investing for short periods makes losses more likely. For current information and month-end results, visit capitalgroup.com/afis. For information about your insurance contract and month-end results, go to the website of the company that issued your contract.
Asset Allocation Fund, which is a mix of stocks and bonds, gained 12.71% for the 12 months ended December 31, 2020. Standard & Poor’s 500 Composite Index1, a market capitalization-weighted index based on the results of approximately 500 widely held common stocks, was up 18.40% over the same period, while the Bloomberg Barclays U.S. Aggregate Index2, which represents the U.S. investment-grade (rated BBB/Baa and above) fixed-rate bond market, returned 7.51%. A blend of the two indexes, the 60%/40% S&P 500 Index/Bloomberg Barclays U.S. Aggregate Index3, gained 14.73%. Effective May 1, 2020, the fund has elected to use the 60%/40% S&P 500 Index/Bloomberg Barclays U.S. Aggregate Index as its primary benchmark, because it comes closest to reflecting its investment universe and best measures its long-term results and portfolio managers’ success over time.
U.S. equities ended 2020 at record highs, showing resilience during a volatile year that included a pandemic-induced recession, a sharp bear market, civil unrest and a contentious presidential election. Information technology, consumer discretionary and communication services stocks that benefited from stay-at-home restrictions led markets, including Amazon and Netflix. Overall, the information technology sector rose 44%, while consumer discretionary and communication services gained 33% and 24%, respectively. Energy lagged all other sectors, declining 34%. The significant reduction in travel reduced the demand for oil, which was briefly priced below $0 for the first time in history amid fears of dwindling storage capacity. The real estate and financials sectors were also negative for the year, each declining 2%.
Investments in the technology sector —the fund’s largest sector holding — contributed to the fund’s relative returns. Within the sector, TSMC and ASML Holding contributed to relative results with double-digit returns that outpaced the general market.
On the downside, commercial aerospace company Boeing detracted from relative returns as shares slumped in the face of unprecedented disruptions arising from the COVID-19 pandemic. The fund’s fixed income investments were additive to relative returns due to sector positioning and security selection.
The fund’s portfolio managers continue to evaluate the economic and market/sector implications of the current administration’s decisions regarding trade. The fund’s cash position allows portfolio managers to remain flexible and better navigate uncertainty by focusing on opportunities when stock prices are favorable.
| 24 | American Funds Insurance Series |
Asset Allocation Fund (continued)
How a hypothetical $10,000 investment has grown

Total returns based on a $1,000 investment
For periods ended December 31, 20204
| | | 1 year | | 5 years | | 10 years | | Lifetime
(since August 1,1989) | | Expense
ratio |
| | | | | | | | | | | |
| Class 1 | | | 12.71 | % | | | 10.86 | % | | | 10.19 | % | | | 8.76 | % | | | .30 | % |
| Class 1A | | | 12.43 | | | | 10.60 | | | | 9.92 | | | | 8.49 | | | | .55 | |
| Class 2 | | | 12.46 | | | | 10.59 | | | | 9.91 | | | | 8.49 | | | | .55 | |
| Class 3 | | | 12.50 | | | | 10.66 | | | | 9.99 | | | | 8.57 | | | | .48 | |
| Class 4 | | | 12.16 | | | | 10.31 | | | | 9.68 | | | | 8.23 | | | | .80 | |
Investment results assume all distributions are reinvested and reflect applicable fees and expenses. When applicable, investment results reflect fee waivers and/or expense reimbursements, without which results would have been lower. Visit capitalgroup.com for more information. Expense ratios are as of the fund’s prospectus dated May 1, 2021 (unaudited). See the Financial Highlights table in this report for details.
Any market index shown is unmanaged and, therefore, has no expenses. Investors cannot invest directly in an index.
| 1 | Source: S&P Dow Jones Indices LLC. |
| 2 | Source: Bloomberg Index Services Ltd. |
| 3 | Sources: Bloomberg Index Services Ltd. and S&P Dow Jones Indices LLC. Blends the S&P 500 with the Bloomberg Barclays U.S. Aggregate Index by weighting their total returns at 60% and 40%, respectively. Results assume the blend is rebalanced monthly. |
| 4 | Periods greater than one year are annualized. |
| Where the fund’s assets were invested as of December 31, 2020 | Percent of net assets |

| American Funds Insurance Series | 25 |
Global Balanced Fund
Fund results shown are for past periods and are not predictive of results for future periods. Current and future results may be lower or higher than those shown. Prices and returns will vary, so investors may lose money. Investing for short periods makes losses more likely. For current information and month-end results, visit capitalgroup.com/afis. For information about your insurance contract and month-end results, go to the website of the company that issued your contract.
Global Balanced Fund gained 10.53% for the 12 months ended December 31, 2020. The MSCI ACWI (All Country World Index),1 a free float-adjusted market capitalization-weighted index that is designed to measure equity market results in the global developed and emerging markets (consisting of more than 40 developed and emerging market country indexes), increased by 16.25%, while the Bloomberg Barclays Global Aggregate Index,2 a measure of global investment-grade bonds (rated BBB/Baa and above), increased 9.20%. The 60%/40% MSCI ACWI/Bloomberg Barclays Global Aggregate Index,3 a blend of the two indexes, gained 14.05%. Effective May 1, 2021, the fund has elected to use the 60%/40% MSCI ACWI/Bloomberg Barclays Global Aggregate Index as its primary benchmark, because it comes closest to reflecting its investment universe and best measures its long-term results and portfolio managers’ success over time.
Global stocks rose in the face of a deadly pandemic, boosted by massive government stimulus measures and the rapid development of coronavirus vaccines. In a year marked by unprecedented volatility, stocks declined sharply from February to March, followed by a remarkable nine-month rally that lifted many market indexes to all-time highs. U.S. equities also ended 2020 at record highs, showing resilience during a volatile year that included a pandemic-induced recession, a sharp bear market, civil unrest and a contentious presidential election. European stocks declined in local currency terms as the eurozone economy suffered the effects of government-imposed lockdowns and a severe recession. Emerging markets posted solid gains for a second consecutive year, led by China’s economic rebound and the technology-export-driven economies of Taiwan and South Korea.
Stock selection in the financials sector was additive to relative returns. Investments in information technology firms TSMC and ASML Holding were top contributors to results. Despite COVID-19-related supply-side disruptions, 5G, artificial intelligence and high-performance computing continued to underpin long-term demand for ASML’s extreme ultraviolet lithography products. The fund’s fixed income investments also helped relative returns, with sector positioning, duration and curve being among the additive factors. On the downside, stock selection in the consumer staples and health care sectors detracted from relative returns. An investment in aerospace firm Boeing was a drag on results as it faced unprecedented disruption arising from the pandemic, as well as uncertainty over recertification of the 737 MAX for much of the year. In fixed income, unhedged currency, particularly in euro-denominated bonds, also detracted from relative returns.
Portfolio managers continue to monitor cross-border trade discussions that could have negative economic implications due to a possible reduction in global trade. Further considerations include continued easing by monetary authorities and the possibility of increased fiscal stimulus in a number of countries. Portfolio managers continue to focus on global research and stock-by-stock, bottom-up fundamental analysis.
| 26 | American Funds Insurance Series |
Global Balanced Fund (continued)
How a hypothetical $10,000 investment has grown
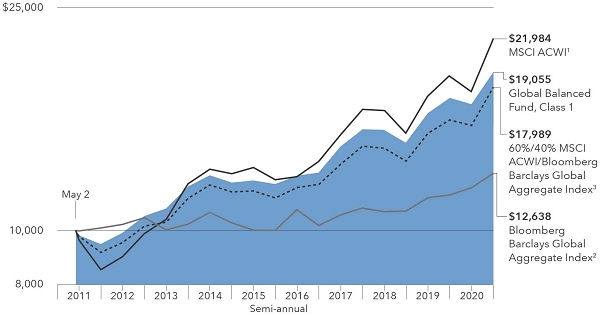
Total returns based on a $1,000 investment
For periods ended December 31, 20204
| | | 1 year | | 5 years | | Lifetime
(since May 2, 2011) | | Expense
ratio |
| | | | | | | | | |
| Class 1 | | | 10.53 | % | | | 9.57 | % | | | 6.90 | % | | | .72 | % |
| Class 1A | | | 10.25 | | | | 9.34 | | | | 6.65 | | | | .97 | |
| Class 2 | | | 10.30 | | | | 9.30 | | | | 6.63 | | | | .97 | |
| Class 4 | | | 10.00 | | | | 9.03 | | | | 6.49 | | | | 1.22 | |
Investment results assume all distributions are reinvested and reflect applicable fees and expenses. When applicable, investment results reflect fee waivers and/or expense reimbursements, without which results would have been lower. Visit capitalgroup.com for more information. Expense ratios are as of the fund’s prospectus dated May 1, 2021 (unaudited). See the Financial Highlights table in this report for details.
Any market index shown is unmanaged and, therefore, has no expenses. Investors cannot invest directly in an index.
| 1 | Source: MSCI. The MSCI index results reflect dividends net of withholding taxes and reinvestment of distributions. |
| 2 | Source: Bloomberg Index Services Ltd. |
| 3 | Data sources: MSCI and Bloomberg Index Services Ltd. The 60%/40% MSCI ACWI/Bloomberg Barclays Global Aggregate Index blends the MSCI ACWI (All Country World Index) with the Bloomberg Barclays Global Aggregate Index by weighting their cumulative total returns at 60% and 40%, respectively. Its result assumes the blend is rebalanced monthly. |
| 4 | Periods greater than one year are annualized. |
| Where the fund’s assets were invested as of December 31, 2020 | Percent of net assets |

| American Funds Insurance Series | 27 |
Bond Fund
Fund results shown are for past periods and are not predictive of results for future periods. Current and future results may be lower or higher than those shown. Prices and returns will vary, so investors may lose money. Investing for short periods makes losses more likely. For current information and month-end results, visit capitalgroup.com/afis. For information about your insurance contract and month-end results, go to the website of the company that issued your contract.
Bond Fund gained 9.96% for the 12 months ended December 31, 2020. In comparison, the fund’s benchmark, the Bloomberg Barclays U.S. Aggregate Index1, which represents the U.S. investment-grade (rated BBB/Baa and above) fixed-rate bond market, returned 7.51%.
Bond markets rebounded sharply supported by extraordinary measures from the Federal Reserve. The central bank slashed interest rates to near-zero in March, launched an array of emergency lending programs, and purchased corporate and government debt. The yield on the benchmark 10-year Treasury note closed the year at 0.92%, down from 1.92% the previous year. Corporate spreads ended the year near pre-pandemic levels. The Treasury curve steepened amid declining yields.
The fund benefitted from security selection, sector selection and duration positioning. Within sector selection, overweights in investment-grade corporates and agency mortgage backed securities helped relative results. Also, out-of-benchmark investments in Treasury Inflation Protected Securities (TIPS) and high-yield bonds all added to relative returns. Within security selection, bonds issued by Teva Pharmaceutical were notable contributors. Municipal issuers such as the State of Illinois and Chicago Board of Education detracted over the period.
Valuations have largely recovered from the lows seen in March. Consequently, managers have begun reducing risk in the portfolio and will likely continue if valuations improve further. This will enable managers to take advantage of future volatility by purchasing bonds when prices look more attractive at that time. With interest rates at relatively low levels and the Fed holding short-term rates near zero, managers expect longer term yields to rise as the economic backdrop improves.
Managers believe that stimulative fiscal and monetary policy should help to keep U.S. economic growth positive. Although the portfolio is positioned toward an economic recovery, managers anticipate a high level of uncertainty and a fragile state of the economy. As such, careful, research-driven security selection will continue to be an important driver of future investment results.
| 28 | American Funds Insurance Series |
Bond Fund (continued)
How a hypothetical $10,000 investment has grown
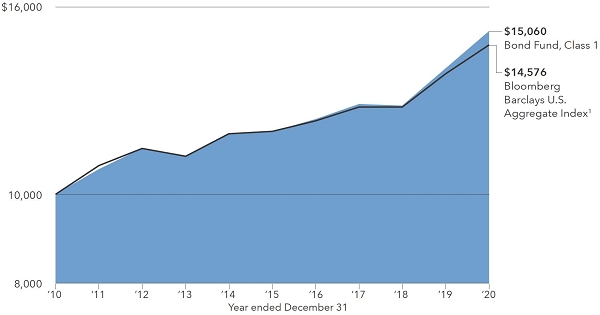
Total returns based on a $1,000 investment
For periods ended December 31, 20202
| | | 1 year | | 5 years | | 10 years | | Lifetime
(since January 2, 1996) | | Gross
expense ratio | | Net
expense ratio |
| | | | | | | | | | | | | |
| Class 1 | | | 9.96 | % | | | 5.20 | % | | | 4.18 | % | | | 4.93 | % | | | .40 | % | | | .21 | % |
| Class 1A | | | 9.68 | | | | 4.94 | | | | 3.92 | | | | 4.67 | | | | .65 | | | | .46 | |
| Class 2 | | | 9.73 | | | | 4.92 | | | | 3.92 | | | | 4.67 | | | | .65 | | | | .46 | |
| Class 4 | | | 9.38 | | | | 4.66 | | | | 3.67 | | | | 4.41 | | | | .90 | | | | .71 | |
Investment results assume all distributions are reinvested and reflect applicable fees and expenses. The investment adviser intends to waive a portion of its management fees beginning May 1, 2021. This waiver will be in effect through at least May 1, 2022. The waiver may only be modified or terminated with the approval of the series’ board. When applicable, investment results reflect fee waivers and/or expense reimbursements, without which results would have been lower. Visit capitalgroup.com for more information. Expense ratios are as of the fund’s prospectus dated May 1, 2021 (unaudited). See the Financial Highlights table in this report for details.
Any market index shown is unmanaged and, therefore, has no expenses. Investors cannot invest directly in an index.
| 1 | Source: Bloomberg Index Services Ltd. |
| 2 | Periods greater than one year are annualized. |
| Where the fund’s assets were invested as of December 31, 2020 | Percent of net assets |

| American Funds Insurance Series | 29 |
Capital World Bond Fund®
Fund results shown are for past periods and are not predictive of results for future periods. Current and future results may be lower or higher than those shown. Prices and returns will vary, so investors may lose money. Investing for short periods makes losses more likely. For current information and month-end results, visit capitalgroup.com/afis. For information about your insurance contract and month-end results, go to the website of the company that issued your contract.
Capital World Bond Fund gained 10.17% for the 12 months ended December 31, 2020. This outpaced the fund’s benchmark, the Bloomberg Barclays Global Aggregate Index1, which measures global investment-grade bonds (rated BBB/Baa and above) and increased 9.20%.
Government bonds advanced as central banks around the world slashed interest rates and ramped up stimulus programs in an attempt to counter the damaging effects of the pandemic. The U.S. Federal Reserve cut rates to near zero in March and launched an array of emergency lending programs as part of its COVID-19 response. The Treasury curve steepened amid declining yields.
Sector and security selection contributed positively to the fund’s relative returns over the period. The fund managers favored credits from Southern Europe and Eastern Europe, of which Greece and Romania were among top contributors to returns. Diversified exposures to local emerging markets, such as Mexico, also added to results. Government bonds from France and Brazil were among individual detractors to relative returns.
As growth in the U.S. moderates, the fund’s portfolio managers seek to identify long-term investments around the world such as in emerging markets where sovereign, corporate and high-yield debt may present opportunities. Given the fund’s core objective is to provide a high-level of total return over the long term, the fund’s portfolio managers maintain a cautious approach to investing in different sectors of the bond market, such as high-yield debt.
| 30 | American Funds Insurance Series |
Capital World Bond Fund® (continued)
How a hypothetical $10,000 investment has grown

Total returns based on a $1,000 investment
For periods ended December 31, 20203
| | | 1 year | | 5 years | | 10 years | | Lifetime
(since October 4, 2006) | | Gross
expense ratio | | Net
expense ratio |
| | | | | | | | | | | | | |
| Class 1 | | | 10.17 | % | | | 5.35 | % | | | 3.30 | % | | | 4.49 | % | | | .58 | % | | | .48 | % |
| Class 1A | | �� | 9.89 | | | | 5.12 | | | | 3.06 | | | | 4.24 | | | | .83 | | | | .73 | |
| Class 24 | | | 9.90 | | | | 5.10 | | | | 3.04 | | | | 4.22 | | | | .83 | | | | .73 | |
| Class 4 | | | 9.62 | | | | 4.84 | | | | 2.83 | | | | 4.00 | | | | 1.08 | | | | .98 | |
Investment results assume all distributions are reinvested and reflect applicable fees and expenses. The investment adviser is currently waiving a portion of its management fee. This waiver will be in effect through at least May 1, 2021. The waiver may only be modified or terminated with the approval of the series’ board. When applicable, investment results reflect fee waivers and/or expense reimbursements, without which results would have been lower. Visit capitalgroup.com for more information. Expense ratios are as of the fund’s prospectus dated May 1, 2021 (unaudited). See the Financial Highlights table in this report for details.
Any market index shown is unmanaged and, therefore, has no expenses. Investors cannot invest directly in an index.
| 1 | Source: Bloomberg Index Services Ltd. |
| 2 | Source: Refinitiv Lipper. Results for the Lipper indexes do not reflect sales charges. Lipper indexes track the largest mutual funds (no more than 30), represented by one share class per fund, in the corresponding Lipper category. |
| 3 | Periods greater than one year are annualized. |
| 4 | Capital World Bond Fund Class 2 shares were first sold on November 6, 2006. Results prior to that date are hypothetical based on Class 1 share results adjusted for estimated additional annual expenses of 0.25%. |
| Where the fund’s assets were invested as of December 31, 2020 | Percent of net assets |
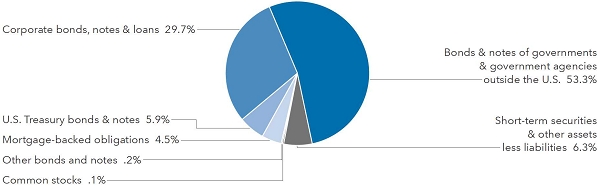
| American Funds Insurance Series | 31 |
High-Income Bond Fund
Fund results shown are for past periods and are not predictive of results for future periods. Current and future results may be lower or higher than those shown. Prices and returns will vary, so investors may lose money. Investing for short periods makes losses more likely. For current information and month-end results, visit capitalgroup.com/afis. For information about your insurance contract and month-end results, go to the website of the company that issued your contract.
High-Income Bond Fund gained 8.21% for the 12 months ended December 31, 2020. In comparison, the fund’s benchmark, the Bloomberg Barclays U.S. Corporate High Yield 2% Issuer Capped Index,1 which measures fixed-rate non-investment-grade bonds (rated BB/Ba and below) and limits the exposure of an issuer to 2%, was up 7.05%.
Credit markets rebounded sharply from their pandemic lows, supported by extraordinary measures from the Federal Reserve and other global central banks. The Federal Reserve reduced interest rates to near-zero in March and launched an array of emergency programs that included purchasing corporate bonds. The yield on the benchmark 10-year Treasury note closed the year at 0.92%, down from 1.92% the previous year. Corporate spreads ended the year near pre-pandemic levels, after increasing dramatically during the early stages of the pandemic.
Sector and security selection contributed positively to the fund’s relative returns over the period. In particular, security selection within the consumer non-cyclical sector was additive to results. Conversely, investments within the energy sector detracted from relative returns.
The fund’s portfolio managers continue to believe current fundamentals support a mildly constructive outlook for the high-yield market and that ongoing fiscal and monetary support — combined with synchronous global growth as economies gradually reopen — will mitigate adverse impacts of the pandemic. We continue to monitor these themes and believe that high-yield bonds will be supported by stronger economic growth and central bank policies.
| 32 | American Funds Insurance Series |
High-Income Bond Fund (continued)
How a hypothetical $10,000 investment has grown
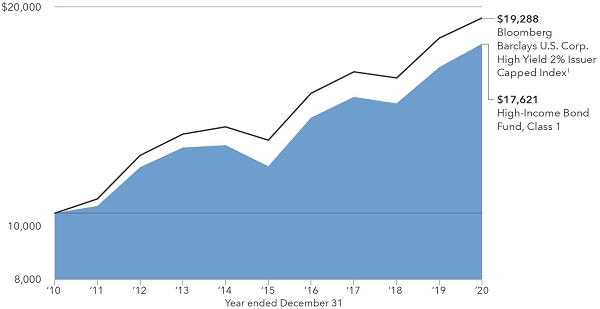
Total returns based on a $1,000 investment
For periods ended December 31, 20202
| | | 1 year | | 5 years | | 10 years | | Lifetime
(since February 8,1984) | | Gross
expense ratio | | Net
expense ratio |
| | | | | | | | | | | | | |
| Class 1 | | | 8.21 | % | | | 8.59 | % | | | 5.83 | % | | | 8.65 | % | | | .52 | % | | | .33 | % |
| Class 1A | | | 7.94 | | | | 8.35 | | | | 5.58 | | | | 8.39 | | | | .77 | | | | .58 | |
| Class 2 | | | 7.94 | | | | 8.34 | | | | 5.57 | | | | 8.38 | | | | .77 | | | | .58 | |
| Class 3 | | | 7.93 | | | | 8.39 | | | | 5.63 | | | | 8.46 | | | | .70 | | | | .51 | |
| Class 4 | | | 7.74 | | | | 8.05 | | | | 5.35 | | | | 8.13 | | | | 1.02 | | | | .83 | |
Investment results assume all distributions are reinvested and reflect applicable fees and expenses. The investment adviser intends to waive a portion of its management fees beginning May 1, 2021. This waiver will be in effect through at least May 1, 2022. The waiver may only be modified or terminated with the approval of the series’ board. When applicable, investment results reflect fee waivers and/or expense reimbursements, without which results would have been lower. Visit capitalgroup.com for more information. Expense ratios are as of the fund’s prospectus dated May 1, 2021 (unaudited). See the Financial Highlights table in this report for details.
Any market index shown is unmanaged and, therefore, has no expenses. Investors cannot invest directly in an index.
| 1 | Source: Bloomberg Index Services Ltd. |
| 2 | Periods greater than one year are annualized. |
| Where the fund’s assets were invested as of December 31, 2020 | Percent of net assets |

| American Funds Insurance Series | 33 |
American Funds Mortgage Fund®
Fund results shown are for past periods and are not predictive of results for future periods. Current and future results may be lower or higher than those shown. Prices and returns will vary, so investors may lose money. Investing for short periods makes losses more likely. For current information and month-end results, visit capitalgroup.com/afis. For information about your insurance contract and month-end results, go to the website of the company that issued your contract.
American Funds Mortgage Fund gained 6.98% for the 12 months ended December 31, 2020, while the Bloomberg Barclays U.S. Mortgage-Backed Securities Index,1 which covers the mortgage-backed pass-through securities of Ginnie Mae, Fannie Mae and Freddie Mac, rose 3.87%.
Bond markets rebounded sharply supported by extraordinary measures from the Federal Reserve. The central bank slashed interest rates to near-zero in March, launched an array of emergency lending programs, and purchased corporate and government debt. The yield on the benchmark 10-year Treasury note closed the year at 0.92%, down from 1.92% the previous year. Corporate spreads ended the year near pre-pandemic levels. The Treasury curve steepened amid declining yields.
Duration and curve positioning, as well as sector and security selection, all contributed to the fund’s relative returns over the period. The fund benefited from a lower-than-benchmark weighting in mortgages. On the downside, duration positioning in IRS swaps detracted from relative results.
The fund’s portfolio managers remain focused on meeting the core objectives of the fund providing current income and protecting capital. Rate hikes in the near future are unlikely as the Federal Reserve looks to extend economic expansion and raise inflation closer to its stated “strong commitment” for a symmetric target of 2%. Due to the Fed’s interest policy and market optimism with respect to economic growth, the Treasury yield curve steepened considerably in 2020. The fund positioning is intended to provide some stability if we experience another bout of weakness in equity or credit markets. More attractive valuations for mortgage investments are expected to emerge going forward amid a transition from our extended period of extremely low volatility to a more normal period of economic and asset price uncertainty.
| 34 | American Funds Insurance Series |
American Funds Mortgage Fund® (continued)
How a hypothetical $10,000 investment has grown

Total returns based on a $1,000 investment
For periods ended December 31, 20202
| | | 1 year | | 5 years | | Lifetime
(since May 2, 2011) | | Gross
expense ratio | | Net
expense ratio |
| | | | | | | | | | | |
| Class 1 | | | 6.98 | % | | | 3.34 | % | | | 3.12 | % | | | .48 | % | | | .27 | % |
| Class 1A | | | 6.63 | | | | 3.08 | | | | 2.86 | | | | .73 | | | | .52 | |
| Class 2 | | | 6.72 | | | | 3.08 | | | | 2.86 | | | | .73 | | | | .52 | |
| Class 4 | | | 6.38 | | | | 2.82 | | | | 2.66 | | | | .98 | | | | .77 | |
Investment results assume all distributions are reinvested and reflect applicable fees and expenses. The investment adviser is currently waiving a portion of its management fee. This waiver will be in effect through at least May 1, 2021. The waiver may only be modified or terminated with the approval of the series’ board. When applicable, investment results reflect fee waivers and/or expense reimbursements, without which results would have been lower. Visit capitalgroup.com for more information. Expense ratios are as of the fund’s prospectus dated May 1, 2021 (unaudited). See the Financial Highlights table in this report for details.
Any market index shown is unmanaged and, therefore, has no expenses. Investors cannot invest directly in an index.
| 1 | Source: Bloomberg Index Services Ltd. |
| 2 | Periods greater than one year are annualized. |
| Where the fund’s assets were invested as of December 31, 2020 | Percent of net assets |

| American Funds Insurance Series | 35 |
Ultra-Short Bond Fund
Fund results shown are for past periods and are not predictive of results for future periods. Current and future results may be lower or higher than those shown. Prices and returns will vary, so investors may lose money. Investing for short periods makes losses more likely. For current information and month-end results, visit capitalgroup.com/afis. For information about your insurance contract and month-end results, go to the website of the company that issued your contract.
Ultra-Short Bond Fund gained 0.34% for the 12 months ended December 31, 2020, compared with a 1.31% rise in the Bloomberg Barclays Short-Term Government/Corporate Index1, which consists of investment-grade (rated BBB/Baa and above), fixed-rate, publicly placed, dollar-denominated and non-convertible securities with remaining maturity from one up to (but not including) 12 months within either the government or corporate sector. With a focus on capital preservation and liquidity, the fund continues to be managed in a relatively conservative manner compared to the above-described index.
Short-term interest rates are near zero and have been since the Federal Reserve cut rates in March. The current low interest rate environment may persist, as uncertainty regarding the coronavirus continues even with positive news on the vaccine front.
| 36 | American Funds Insurance Series |
Ultra-Short Bond Fund (continued)
Total returns based on a $1,000 investment
For periods ended December 31, 20202
| | | 1 year | | 5 years | | 10 years | | Lifetime
(since February 8, 1984) | | Expense
ratio |
| | | | | | | | | | | |
| Class 1 | | | 0.34 | % | | | 0.91 | % | | | 0.34 | % | | | 3.31 | % | | | 0.37 | % |
| Class 1A | | | 0.32 | | | | 0.86 | | | | 0.19 | | | | 3.08 | | | | 0.62 | |
| Class 2 | | | 0.03 | | | | 0.65 | | | | 0.08 | | | | 3.05 | | | | 0.62 | |
| Class 3 | | | 0.13 | | | | 0.74 | | | | 0.16 | | | | 3.12 | | | | 0.55 | |
| Class 4 | | | –0.25 | | | | 0.40 | | | | –0.09 | | | | 2.81 | | | | 0.87 | |
Investment results assume all distributions are reinvested and reflect applicable fees and expenses. When applicable, investment results reflect fee waivers and/or expense reimbursements, without which results would have been lower. Visit capitalgroup.com for more information. Expense ratios are as of the fund’s prospectus dated May 1, 2021 (unaudited). See the Financial Highlights table in this report for details.
Any market index shown is unmanaged and, therefore, has no expenses. Investors cannot invest directly in an index.
| 1 | Source: Bloomberg Index Services Ltd. |
| 2 | Periods greater than one year are annualized. |
| | | Percent of
net assets |
| Where the fund’s assets were invested as of December 31, 2020 | | | | |
| Commercial paper | | | 71.5 | % |
| Federal agency bills & notes | | | 16.2 | |
| U.S. Treasury bills | | | 11.4 | |
| Other assets less liabilities | | | .9 | |
| Total | | | 100.0 | % |
| American Funds Insurance Series | 37 |
U.S. Government/AAA-Rated Securities Fund
Fund results shown are for past periods and are not predictive of results for future periods. Current and future results may be lower or higher than those shown. Prices and returns will vary, so investors may lose money. Investing for short periods makes losses more likely. For current information and month-end results, visit capitalgroup.com/afis. For information about your insurance contract and month-end results, go to the website of the company that issued your contract.
U.S. Government/AAA-Rated Securities Fund rose 10.09% for the 12 months ended December 31, 2020, while the Bloomberg Barclays U.S. Government/Mortgage-Backed Securities Index,1 which covers obligations issued by the U.S. Treasury and U.S. government agencies, increased by 6.36%.
Bond markets rebounded sharply supported by extraordinary measures from the Federal Reserve. The central bank slashed interest rates to near-zero in March, launched an array of emergency lending programs, and purchased corporate and government debt. The yield on the benchmark 10-year Treasury note closed the year at 0.92%, down from 1.92% the previous year. Corporate spreads ended the year near pre-pandemic levels. The Treasury curve steepened amid declining yields.
During the period, the fund’s duration and mortgage positioning were additive to results. On the downside, duration positioning in IRS swaps detracted from relative results.
The fund strives to meet its objective of providing a high level of current income consistent with the preservation of capital. Rate hikes in the near future are unlikely as the Federal Reserve looks to extend economic expansion and raise inflation closer to its stated “strong commitment” symmetric target of 2%. Due to the Fed’s interest policy and market optimism with respect to economic growth, the Treasury yield curve steepened considerably in 2020. The fund positioning is intended to provide some stability if we experience another bout of weakness in equity or credit markets.
| 38 | American Funds Insurance Series |
U.S. Government/AAA-Rated Securities Fund (continued)
How a hypothetical $10,000 investment has grown
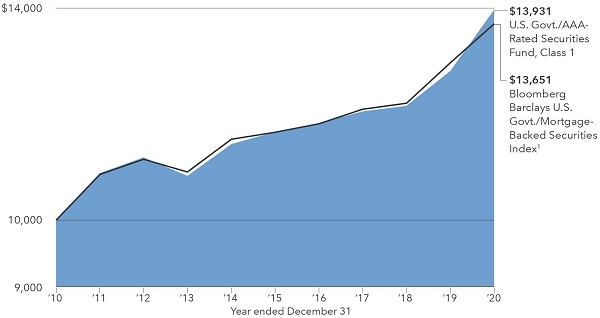
Total returns based on a $1,000 investment
For periods ended December 31, 20202
| | | 1 year | | 5 years | | 10 years | | Lifetime
(since December 2, 1985) | | Gross
expense ratio | | Net
expense ratio |
| | | | | | | | | | | | | |
| Class 1 | | | 10.09 | % | | | 3.93 | % | | | 3.37 | % | | | 5.83 | % | | | .39 | % | | | .23 | % |
| Class 1A | | | 9.75 | | | | 3.70 | | | | 3.12 | | | | 5.57 | | | | .64 | | | | .48 | |
| Class 2 | | | 9.80 | | | | 3.67 | | | | 3.10 | | | | 5.57 | | | | .64 | | | | .48 | |
| Class 3 | | | 9.91 | | | | 3.76 | | | | 3.18 | | | | 5.64 | | | | .57 | | | | .41 | |
| Class 4 | | | 9.48 | | | | 3.42 | | | | 2.90 | | | | 5.32 | | | | .89 | | | | .73 | |
Investment results assume all distributions are reinvested and reflect applicable fees and expenses. The investment adviser intends to waive a portion of its management fees beginning May 1, 2021. This waiver will be in effect through at least May 1, 2022. The waiver may only be modified or terminated with the approval of the series’ board. When applicable, investment results reflect fee waivers and/or expense reimbursements, without which results would have been lower. Visit capitalgroup.com for more information. Expense ratios are as of the fund’s prospectus dated May 1, 2021 (unaudited). See the Financial Highlights table in this report for details.
Any market index shown is unmanaged and, therefore, has no expenses. Investors cannot invest directly in an index.
| 1 | Source: Bloomberg Index Services Ltd. |
| 2 | Periods greater than one year are annualized. |
| Where the fund’s assets were invested as of December 31, 2020 | Percent of net assets |

| American Funds Insurance Series | 39 |
Managed Risk Growth Fund
Fund results shown are for past periods and are not predictive of results for future periods. Current and future results may be lower or higher than those shown. Prices and returns will vary, so investors may lose money. Investing for short periods makes losses more likely. For current information and month-end results, visit capitalgroup.com/afis. For information about your insurance contract and month-end results, go to the website of the company that issued your contract.
The fund gained 32.45% for the 12 months ended December 31, 2020. S&P 500 Managed Risk Index – Moderate Aggressive1 was up 6.92%. Standard & Poor’s 500 Composite Index2, a market capitalization-weighted index based on the results of approximately 500 widely held common stocks, increased 18.40%.
The fund pursues its objective by investing in shares of American Funds Insurance Series – Growth FundSM and American Funds Insurance Series – Bond FundSM while seeking to manage portfolio volatility and provide downside protection, primarily through the use of exchange-traded futures. The benefit of the fund’s managed risk strategy should be most apparent during periods of high volatility and in down markets. In steady or rising markets, the fund’s results can be expected to lag those of the underlying fund.
The underlying Growth Fund’s investments in consumer discretionary and communication services sectors were top contributors to relative returns, while its cash holdings detracted.
How a hypothetical $10,000 investment has grown

Total returns based on a $1,000 investment
For periods ended December 31, 20203
| | | 1 year | | 5 years | | Lifetime
(since May 1, 2013) | | Gross
expense ratio | | Net
expense ratio |
| | | | | | | | | | | |
| Class P1 | | | 32.45 | % | | | 15.97 | % | | | 12.65 | % | | | .74 | % | | | .69 | % |
| Class P2 | | | 32.03 | | | | 15.64 | | | | 12.32 | | | | .99 | | | | .94 | |
The investment adviser is currently waiving a portion of its management fee. This waiver will be in effect through at least May 1, 2022. The waiver may only be modified or terminated with the approval of the series’ board. When applicable, investment results reflect fee waivers and/or expense reimbursements, without which results would have been lower. Visit capitalgroup.com for more information. Expense ratios are restated to reflect current fees and are as of the fund’s prospectus dated May 1, 2021 (unaudited).
Any market index shown is unmanaged and, therefore, has no expenses. Investors cannot invest directly in an index.
| 1 | Source: S&P Dow Jones Indices LLC. Standard & Poor’s Managed Risk Index Series is designed to simulate a dynamic protective portfolio that allocates between the underlying equity index and cash, based on realized volatilities of the underlying equity and bond indexes, while maintaining a fixed allocation to the underlying bond index. |
| 2 | Source: S&P Dow Jones Indices LLC. |
| 3 | Periods greater than one year are annualized. |
Milliman Financial Risk Management LLC serves as the subadviser with respect to the management of the fund’s managed risk strategy.
| 40 | American Funds Insurance Series |
Managed Risk International Fund
Fund results shown are for past periods and are not predictive of results for future periods. Current and future results may be lower or higher than those shown. Prices and returns will vary, so investors may lose money. Investing for short periods makes losses more likely. For current information and month-end results, visit capitalgroup.com/afis. For information about your insurance contract and month-end results, go to the website of the company that issued your contract.
The fund gained 3.13% for the 12 months ended December 31, 2020, compared to the S&P EPAC Ex. Korea LargeMidCap Managed Risk Index – Moderate Aggressive1, which was flat at 0.00%. The MSCI ACWI (All Country World Index) ex USA2, a free float-adjusted market capitalization-weighted index that is designed to measure equity market results in the global developed and emerging markets (consisting of more than 40 developed and emerging market country indexes, excluding the U.S.), increased 10.65%.
The fund pursues its objective by investing in shares of American Funds Insurance Series – International FundSM and American Funds Insurance Series – Bond FundSM while seeking to manage portfolio volatility and provide downside protection, primarily through the use of exchange-traded futures. The benefit of the fund’s managed risk strategy should be most apparent during periods of high volatility and in down markets. In steady or rising markets, the fund’s results can be expected to lag those of the underlying fund.
The underlying International Fund’s investments in the consumer discretionary and health care sectors were additive to relative returns, while stock selection in the industrials sector detracted from relative results.
How a hypothetical $10,000 investment has grown
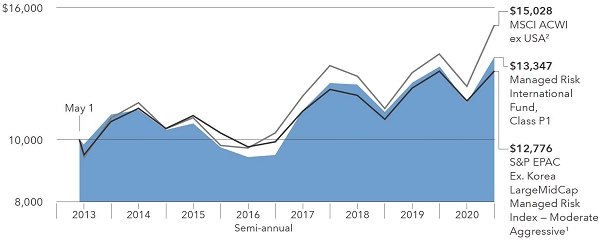
Total returns based on a $1,000 investment
For periods ended December 31, 20203
| | | 1 year | | 5 years | | Lifetime
(since May 1, 2013) | | Gross
expense ratio | | Net
expense ratio |
| | | | | | | | | | | |
| Class P1 | | | 3.13 | % | | | 6.60 | % | | | 3.84 | % | | | .94 | % | | | .86 | % |
| Class P2 | | | 2.80 | | | | 6.19 | | | | 3.46 | | | | 1.19 | | | | 1.11 | |
The investment adviser is currently waiving a portion of its management fee. In addition, the investment adviser is currently reimbursing a portion of other expenses. This waiver and reimbursement will be in effect through at least May 1, 2022. The adviser may elect at its discretion to extend, modify or terminate the reimbursement at that time. The waiver may only be modified or terminated with the approval of the series’ board. When applicable, investment results reflect fee waivers and/or expense reimbursements, without which results would have been lower. Visit capitalgroup.com for more information. Expense ratios are restated to reflect current fees and are as of the fund’s prospectus dated May 1, 2021 (unaudited).
Any market index shown is unmanaged and, therefore, has no expenses. Investors cannot invest directly in an index.
| 1 | Source: S&P Dow Jones Indices LLC. Standard & Poor’s Managed Risk Index Series is designed to simulate a dynamic protective portfolio that allocates between the underlying equity index and cash, based on realized volatilities of the underlying equity and bond indexes, while maintaining a fixed allocation to the underlying bond index. |
| 2 | Source: MSCI. The MSCI index result reflects reinvestment of distributions and dividends net of withholding taxes. |
| 3 | Periods greater than one year are annualized. |
Milliman Financial Risk Management LLC serves as the subadviser with respect to the management of the fund’s managed risk strategy.
| American Funds Insurance Series | 41 |
Managed Risk Blue Chip Income and Growth Fund
Fund results shown are for past periods and are not predictive of results for future periods. Current and future results may be lower or higher than those shown. Prices and returns will vary, so investors may lose money. Investing for short periods makes losses more likely. For current information and month-end results, visit capitalgroup.com/afis. For information about your insurance contract and month-end results, go to the website of the company that issued your contract.
The fund declined 0.93% for the 12 months ended December 31, 2020. S&P 500 Managed Risk Index – Moderate1 gained 7.01%. Standard & Poor’s 500 Composite Index2, a market capitalization-weighted index based on the results of approximately 500 widely held common stocks, increased 18.40%.
The fund pursues its objective by investing in shares of American Funds Insurance Series – Blue Chip Income and Growth FundSM and American Funds Insurance Series – U.S. Government/AAA-Rated Securities FundSM while seeking to manage portfolio volatility and provide downside protection, primarily through the use of exchange-traded futures. The benefit of the fund’s managed risk strategy should be most apparent during periods of high volatility and in down markets. In steady or rising markets, the fund’s results can be expected to lag those of the underlying fund.
The underlying Blue Chip Income and Growth Fund’s investments in the financials sector was additive to relative returns, while stock selection in the energy sector detracted from relative results.
How a hypothetical $10,000 investment has grown

Total returns based on a $1,000 investment
For periods ended December 31, 20203
| | | 1 year | | 5 years | | Lifetime
(since May 1, 2013) | | Gross
expense ratio | | Net
expense ratio |
| | | | | | | | | | | |
| Class P1 | | | –0.93 | % | | | 6.68 | % | | | 6.01 | % | | | .68 | % | | | .63 | % |
| Class P2 | | | –1.25 | | | | 6.32 | | | | 5.64 | | | | .93 | | | | .88 | |
The investment adviser is currently waiving a portion of its management fee. This waiver will be in effect through at least May 1, 2022. The waiver may only be modified or terminated with the approval of the series’ board. When applicable, investment results reflect fee waivers and/or expense reimbursements, without which results would have been lower. Visit capitalgroup.com for more information. Expense ratios are restated to reflect current fees and are as of the fund’s prospectus dated May 1, 2021 (unaudited).
Any market index shown is unmanaged and, therefore, has no expenses. Investors cannot invest directly in an index.
| 1 | Source: S&P Dow Jones Indices LLC. Standard & Poor’s Managed Risk Index Series is designed to simulate a dynamic protective portfolio that allocates between the underlying equity index and cash, based on realized volatilities of the underlying equity and bond indexes, while maintaining a fixed allocation to the underlying bond index. |
| 2 | Source: S&P Dow Jones Indices LLC. |
| 3 | Periods greater than one year are annualized. |
Milliman Financial Risk Management LLC serves as the subadviser with respect to the management of the fund’s managed risk strategy.
| 42 | American Funds Insurance Series |
Managed Risk Growth-Income Fund
Fund results shown are for past periods and are not predictive of results for future periods. Current and future results may be lower or higher than those shown. Prices and returns will vary, so investors may lose money. Investing for short periods makes losses more likely. For current information and month-end results, visit capitalgroup.com/afis. For information about your insurance contract and month-end results, go to the website of the company that issued your contract.
The fund gained 9.85% for the 12 months ended December 31, 2020, compared to the S&P 500 Managed Risk Index – Moderate1, which rose 7.01%. Standard & Poor’s 500 Composite Index2, a market capitalization-weighted index based on the results of approximately 500 widely held common stocks, increased 18.40%.
The fund pursues its objective by investing in shares of American Funds Insurance Series – Growth-Income FundSM and American Funds Insurance Series – Bond FundSM while seeking to manage portfolio volatility and provide downside protection, primarily through the use of exchange-traded futures. The benefit of the fund’s managed risk strategy should be most apparent during periods of high volatility and in down markets. In steady or rising markets, the fund’s results can be expected to lag those of the underlying fund.
The underlying Growth-Income Fund’s stock selection in the communication services sector was a top contributor to relative returns, while stock selection in the information technology sector detracted from relative results.
How a hypothetical $10,000 investment has grown

Total returns based on a $1,000 investment
For periods ended December 31, 20203
| | | 1 year | | 5 years | | Lifetime
(since May 1, 2013) | | Gross
expense ratio | | Net
expense ratio |
| | | | | | | | | | | |
| Class P1 | | | 9.85 | % | | | 10.58 | % | | | 9.08 | % | | | .68 | % | | | .63 | % |
| Class P2 | | | 9.58 | | | | 10.27 | | | | 8.76 | | | | .93 | | | | .88 | |
The investment adviser is currently waiving a portion of its management fee. This waiver will be in effect through at least May 1, 2022. The waiver may only be modified or terminated with the approval of the series’ board. When applicable, investment results reflect fee waivers and/or expense reimbursements, without which results would have been lower. Visit capitalgroup.com for more information. Expense ratios are restated to reflect current fees and are as of the fund’s prospectus dated May 1, 2021 (unaudited).
Any market index shown is unmanaged and, therefore, has no expenses. Investors cannot invest directly in an index.
| 1 | Source: S&P Dow Jones Indices LLC. Standard & Poor’s Managed Risk Index Series is designed to simulate a dynamic protective portfolio that allocates between the underlying equity index and cash, based on realized volatilities of the underlying equity and bond indexes, while maintaining a fixed allocation to the underlying bond index. |
| 2 | Source: S&P Dow Jones Indices LLC. |
| 3 | Periods greater than one year are annualized. |
Milliman Financial Risk Management LLC serves as the subadviser with respect to the management of the fund’s managed risk strategy.
| American Funds Insurance Series | 43 |
Managed Risk Asset Allocation Fund
Fund results shown are for past periods and are not predictive of results for future periods. Current and future results may be lower or higher than those shown. Prices and returns will vary, so investors may lose money. Investing for short periods makes losses more likely. For current information and month-end results, visit capitalgroup.com/afis. For information about your insurance contract and month-end results, go to the website of the company that issued your contract.
The fund gained 6.10% for the 12 months ended December 31, 2020. S&P 500 Managed Risk Index – Moderate Conservative1 was up 7.20%. Standard & Poor’s 500 Composite Index2, a market capitalization-weighted index based on the results of approximately 500 widely held common stocks, increased 18.40%.
The fund pursues its objective by investing in shares of American Funds Insurance Series – Asset Allocation FundSM while seeking to manage portfolio volatility and provide downside protection, primarily through the use of exchange-traded futures. The benefit of the fund’s managed risk strategy should be most apparent during periods of high volatility and in down markets. In steady or rising markets, the fund’s results can be expected to lag those of the underlying fund.
The underlying Asset Allocation Fund’s investments in the real estate and information technology sectors were top contributors to relative returns, while stock selection in the energy and industrials sectors detracted from relative results.
| 44 | American Funds Insurance Series |
Managed Risk Asset Allocation Fund (continued)
How a hypothetical $10,000 investment has grown

Total returns based on a $1,000 investment
For periods ended December 31, 20204
| | | 1 year | | 5 years | | Lifetime
(since September 28, 2012) | | Gross
expense ratio | | Net
expense ratio |
| | | | | | | | | | | |
| Class P1 | | | 6.10 | % | | | 8.17 | % | | | 7.77 | % | | | .70 | % | | | .65 | % |
| Class P2 | | | 5.88 | | | | 7.91 | | | | 7.51 | | | | .95 | | | | .90 | |
The investment adviser is currently waiving a portion of its management fee. This waiver will be in effect through at least May 1, 2022. The waiver may only be modified or terminated with the approval of the series’ board. When applicable, investment results reflect fee waivers and/or expense reimbursements, without which results would have been lower. Visit capitalgroup.com for more information. Expense ratios are as of the fund’s prospectus dated May 1, 2021 (unaudited).
Any market index shown is unmanaged and, therefore, has no expenses. Investors cannot invest directly in an index.
| 1 | Source: S&P Dow Jones Indices LLC. Standard & Poor’s Managed Risk Index Series is designed to simulate a dynamic protective portfolio that allocates between the underlying equity index and cash, based on realized volatilities of the underlying equity and bond indexes, while maintaining a fixed allocation to the underlying bond index. |
| 2 | Source: S&P Dow Jones Indices LLC. |
| 3 | Source: Bloomberg Index Services Ltd. |
| 4 | Periods greater than one year are annualized. |
Milliman Financial Risk Management LLC serves as the subadviser with respect to the management of the fund’s managed risk strategy.
| American Funds Insurance Series | 45 |
Global Growth Fund
Investment portfolio December 31, 2020
| Common stocks 93.72% | | Shares | | | Value
(000) | |
| Information technology 31.71% | | | | | | | | |
| ASML Holding NV1 | | | 591,992 | | | $ | 286,087 | |
| ASML Holding NV (New York registered) (ADR) | | | 464,300 | | | | 226,449 | |
| Taiwan Semiconductor Manufacturing Company, Ltd.1 | | | 24,817,000 | | | | 466,100 | |
| Taiwan Semiconductor Manufacturing Company, Ltd. (ADR) | | | 280,000 | | | | 30,531 | |
| Microsoft Corp. | | | 1,902,900 | | | | 423,243 | |
| Paycom Software, Inc.2 | | | 357,000 | | | | 161,453 | |
| Adyen NV1,2 | | | 61,500 | | | | 143,105 | |
| PayPal Holdings, Inc.2 | | | 490,000 | | | | 114,758 | |
| Visa Inc., Class A | | | 515,000 | | | | 112,646 | |
| Broadcom Inc. | | | 233,350 | | | | 102,172 | |
| PagSeguro Digital Ltd., Class A2 | | | 1,340,900 | | | | 76,270 | |
| Adobe Inc.2 | | | 135,000 | | | | 67,516 | |
| Zendesk, Inc.2 | | | 454,000 | | | | 64,977 | |
| Samsung Electronics Co., Ltd.1 | | | 785,100 | | | | 58,676 | |
| Amphenol Corp., Class A | | | 373,500 | | | | 48,843 | |
| Keyence Corp.1 | | | 72,300 | | | | 40,689 | |
| EPAM Systems, Inc.2 | | | 105,240 | | | | 37,713 | |
| Advanced Micro Devices, Inc.2 | | | 301,500 | | | | 27,651 | |
| Mastercard Inc., Class A | | | 67,500 | | | | 24,094 | |
| TeamViewer AG1,2 | | | 428,000 | | | | 22,922 | |
| Hexagon AB, Class B1 | | | 240,000 | | | | 21,855 | |
| Amadeus IT Group SA, Class A, non-registered shares1 | | | 212,301 | | | | 15,370 | |
| Worldline SA, non-registered shares1,2 | | | 152,800 | | | | 14,779 | |
| Network International Holdings PLC1,2 | | | 3,173,000 | | | | 14,168 | |
| Jack Henry & Associates, Inc. | | | 69,400 | | | | 11,242 | |
| | | | | | | | 2,613,309 | |
| | | | | | | | | |
| Consumer discretionary 20.46% | | | | | | | | |
| Amazon.com, Inc.2 | | | 145,050 | | | | 472,419 | |
| Alibaba Group Holding Ltd.1,2 | | | 5,241,300 | | | | 153,138 | |
| Chipotle Mexican Grill, Inc.2 | | | 107,400 | | | | 148,933 | |
| Just Eat Takeaway (GBP denominated)1,2 | | | 640,914 | | | | 72,424 | |
| Just Eat Takeaway (EUR denominated)1,2 | | | 347,000 | | | | 39,116 | |
| LVMH Moët Hennessy-Louis Vuitton SE1 | | | 158,900 | | | | 99,286 | |
| Ocado Group PLC1,2 | | | 2,881,000 | | | | 90,274 | |
| Domino’s Pizza, Inc. | | | 156,800 | | | | 60,127 | |
| NIKE, Inc., Class B | | | 383,100 | | | | 54,197 | |
| Floor & Decor Holdings, Inc., Class A2 | | | 546,500 | | | | 50,742 | |
| Prosus NV1 | | | 447,800 | | | | 48,171 | |
| Renault SA1,2 | | | 1,100,000 | | | | 48,132 | |
| MercadoLibre, Inc.2 | | | 16,400 | | | | 27,474 | |
| Meituan, Class B1,2 | | | 699,700 | | | | 26,761 | |
| Naspers Ltd., Class N1 | | | 122,700 | | | | 25,113 | |
| Home Depot, Inc. | | | 92,275 | | | | 24,510 | |
| Sony Corp.1 | | | 243,000 | | | | 24,432 | |
| MGM China Holdings, Ltd.1,3 | | | 12,708,000 | | | | 21,841 | |
| Peugeot SA1,2 | | | 761,800 | | | | 20,848 | |
| XPeng Inc., Class A (ADR)2,3 | | | 445,100 | | | | 19,064 | |
| Delivery Hero SE1,2 | | | 118,000 | | | | 18,315 | |
| Wynn Macau, Ltd.1,2 | | | 10,510,400 | | | | 17,672 | |
| Flutter Entertainment PLC (EUR denominated)1 | | | 84,650 | | | | 17,339 | |
| JD Health International Inc.1,2,3 | | | 893,550 | | | | 17,289 | |
| IDP Education Ltd.1 | | | 1,119,000 | | | | 17,141 | |
| EssilorLuxottica1 | | | 102,335 | | | | 15,960 | |
| Melco Resorts & Entertainment Ltd. (ADR) | | | 835,000 | | | | 15,489 | |
| Moncler SpA1,2 | | | 217,370 | | | | 13,296 | |
| THG Holdings PLC1,2 | | | 1,026,870 | | | | 10,965 | |
| Marriott International, Inc., Class A | | | 74,000 | | | | 9,762 | |
| Airbnb, Inc., Class A2 | | | 41,500 | | | | 6,092 | |
| | | | | | | | 1,686,322 | |
| 46 | American Funds Insurance Series |
Global Growth Fund (continued)
| Common stocks (continued) | | Shares | | | Value
(000) | |
| Health care 11.35% | | | | | | | | |
| UnitedHealth Group Inc. | | | 276,800 | | | $ | 97,068 | |
| DexCom, Inc.2 | | | 253,000 | | | | 93,539 | |
| Mettler-Toledo International Inc.2 | | | 65,000 | | | | 74,079 | |
| AstraZeneca PLC1 | | | 674,300 | | | | 67,369 | |
| Pfizer Inc. | | | 1,699,000 | | | | 62,540 | |
| Fisher & Paykel Healthcare Corp. Ltd.1 | | | 2,550,000 | | | | 60,555 | |
| Cigna Corp. | | | 290,214 | | | | 60,417 | |
| NovoCure Ltd.2 | | | 340,000 | | | | 58,834 | |
| Merck & Co., Inc. | | | 620,000 | | | | 50,716 | |
| Regeneron Pharmaceuticals, Inc.2 | | | 98,300 | | | | 47,490 | |
| Tandem Diabetes Care, Inc.2 | | | 285,000 | | | | 27,269 | |
| Danaher Corp. | | | 110,000 | | | | 24,435 | |
| Humana Inc. | | | 55,000 | | | | 22,565 | |
| Zoetis Inc., Class A | | | 130,000 | | | | 21,515 | |
| Bayer AG1 | | | 363,860 | | | | 21,387 | |
| Catalent, Inc.2 | | | 200,000 | | | | 20,814 | |
| bioMérieux SA1 | | | 135,000 | | | | 19,038 | |
| Olympus Corp.1 | | | 796,800 | | | | 17,442 | |
| Novartis AG1 | | | 165,600 | | | | 15,641 | |
| Rede D’Or Sao Luiz SA2 | | | 1,060,000 | | | | 13,938 | |
| Sanofi1 | | | 135,000 | | | | 13,044 | |
| Teladoc Health, Inc.2 | | | 63,600 | | | | 12,717 | |
| Vertex Pharmaceuticals Inc.2 | | | 49,500 | | | | 11,699 | |
| GN Store Nord AS1 | | | 115,500 | | | | 9,180 | |
| Coloplast A/S, Class B1 | | | 55,750 | | | | 8,516 | |
| Viatris Inc.2 | | | 179,542 | | | | 3,365 | |
| | | | | | | | 935,172 | |
| | | | | | | | | |
| Financials 9.80% | | | | | | | | |
| AIA Group Ltd.1 | | | 12,338,700 | | | | 151,984 | |
| Tradeweb Markets Inc., Class A | | | 1,685,360 | | | | 105,251 | |
| Kotak Mahindra Bank Ltd.1,2 | | | 3,704,500 | | | | 101,380 | |
| MarketAxess Holdings Inc. | | | 151,400 | | | | 86,383 | |
| JPMorgan Chase & Co. | | | 438,700 | | | | 55,746 | |
| AXA SA1 | | | 1,692,893 | | | | 40,614 | �� |
| Prudential PLC1 | | | 1,773,082 | | | | 32,728 | |
| Citigroup Inc. | | | 497,600 | | | | 30,682 | |
| Moscow Exchange MICEX-RTS PJSC1 | | | 12,640,000 | | | | 27,274 | |
| CME Group Inc., Class A | | | 144,437 | | | | 26,295 | |
| Société Générale1,2 | | | 1,011,450 | | | | 21,071 | |
| BlackRock, Inc. | | | 26,500 | | | | 19,121 | |
| Willis TowersWatson PLC | | | 73,000 | | | | 15,380 | |
| HDFC Life Insurance Company Ltd.1,2 | | | 1,589,691 | | | | 14,746 | |
| FinecoBank SpA1,2 | | | 893,000 | | | | 14,573 | |
| QBE Insurance Group Ltd.1 | | | 2,132,000 | | | | 14,036 | |
| Bank of America Corp. | | | 385,000 | | | | 11,669 | |
| Macquarie Group Ltd.1 | | | 101,500 | | | | 10,845 | |
| Lufax Holding Ltd. (ADR)2,3 | | | 680,000 | | | | 9,656 | |
| Sberbank of Russia PJSC (ADR)1 | | | 645,500 | | | | 9,305 | |
| Banco Santander, SA1,2 | | | 2,946,020 | | | | 9,147 | |
| | | | | | | | 807,886 | |
| | | | | | | | | |
| | | | | | | | | |
| Communication services 7.24% | | | | | | | | |
| Alphabet Inc., Class A2 | | | 95,500 | | | | 167,377 | |
| Alphabet Inc., Class C2 | | | 63,852 | | | | 111,861 | |
| Tencent Holdings Ltd.1 | | | 2,028,000 | | | | 148,180 | |
| Facebook, Inc., Class A2 | | | 395,600 | | | | 108,062 | |
| Altice USA, Inc., Class A2 | | | 751,200 | | | | 28,448 | |
| Sea Ltd., Class A (ADR)2 | | | 95,851 | | | | 19,079 | |
| Twitter, Inc.2 | | | 252,000 | | | | 13,646 | |
| | | | | | | | 596,653 | |
| American Funds Insurance Series | 47 |
Global Growth Fund (continued)
| Common stocks (continued) | | Shares | | | Value
(000) | |
| Consumer staples 6.07% | | | | | | | | |
| British American Tobacco PLC1 | | | 2,921,900 | | | $ | 108,680 | |
| Kweichow Moutai Co., Ltd., Class A1 | | | 269,957 | | | | 82,496 | |
| Philip Morris International Inc. | | | 919,500 | | | | 76,125 | |
| Nestlé SA1 | | | 495,497 | | | | 58,334 | |
| Keurig Dr Pepper Inc. | | | 1,624,000 | | | | 51,968 | |
| Altria Group, Inc. | | | 1,248,500 | | | | 51,189 | |
| Walgreens Boots Alliance, Inc. | | | 657,651 | | | | 26,227 | |
| Associated British Foods PLC1,2 | | | 595,000 | | | | 18,435 | |
| Costco Wholesale Corp. | | | 42,170 | | | | 15,889 | |
| Mondelez International, Inc. | | | 192,000 | | | | 11,226 | |
| | | | | | | | 500,569 | |
| | | | | | | | | |
| Industrials 3.51% | | | | | | | | |
| MTU Aero Engines AG1 | | | 167,000 | | | | 43,512 | |
| Airbus SE, non-registered shares1,2 | | | 327,000 | | | | 35,921 | |
| DSV Panalpina A/S1 | | | 201,000 | | | | 33,638 | |
| Alliance Global Group, Inc.1 | | | 135,603,500 | | | | 29,946 | |
| GT Capital Holdings, Inc.1 | | | 2,454,611 | | | | 29,915 | |
| Safran SA1,2 | | | 164,000 | | | | 23,259 | |
| NIBE Industrier AB, Class B1 | | | 685,000 | | | | 22,494 | |
| Nidec Corp.1 | | | 149,100 | | | | 18,786 | |
| SMC Corp.1 | | | 22,500 | | | | 13,741 | |
| General Electric Co. | | | 1,260,000 | | | | 13,608 | |
| Country Garden Services Holdings Co., Ltd.1 | | | 2,003,000 | | | | 13,586 | |
| Boeing Company | | | 51,300 | | | | 10,981 | |
| | | | | | | | 289,387 | |
| | | | | | | | | |
| Materials 1.84% | | | | | | | | |
| Sherwin-Williams Company | | | 153,900 | | | | 113,103 | |
| Shin-Etsu Chemical Co., Ltd.1 | | | 119,500 | | | | 20,920 | |
| Koninklijke DSM NV1 | | | 101,700 | | | | 17,519 | |
| | | | | | | | 151,542 | |
| | | | | | | | | |
| Energy 1.10% | | | | | | | | |
| Reliance Industries Ltd.1 | | | 1,807,924 | | | | 49,250 | |
| Reliance Industries Ltd., interim shares1 | | | 106,956 | | | | 1,640 | |
| Gazprom PJSC (ADR)1 | | | 4,173,000 | | | | 23,198 | |
| LUKOIL Oil Co. PJSC (ADR)1 | | | 246,300 | | | | 16,794 | |
| | | | | | | | 90,882 | |
| | | | | | | | | |
| Real estate 0.41% | | | | | | | | |
| Goodman Logistics (HK) Ltd. REIT1 | | | 1,276,503 | | | | 18,621 | |
| ESR Cayman Ltd.1,2 | | | 4,100,000 | | | | 14,735 | |
| | | | | | | | 33,356 | |
| | | | | | | | | |
| Utilities 0.23% | | | | | | | | |
| Ørsted AS1 | | | 91,250 | | | | 18,663 | |
| | | | | | | | | |
| Total common stocks (cost: $3,554,514,000) | | | | | | | 7,723,741 | |
| | | | | | | | | |
| Preferred securities 2.90% | | | | | | | | |
| Health care 1.84% | | | | | | | | |
| Sartorius AG, nonvoting preferred, non-registered shares1 | | | 360,500 | | | | 151,100 | |
| | | | | | | | | |
| Information technology 1.06% | | | | | | | | |
| Samsung Electronics Co., Ltd., nonvoting preferred shares1 | | | 1,289,000 | | | | 87,500 | |
| | | | | | | | | |
| Total preferred securities (cost: $70,623,000) | | | | | | | 238,600 | |
| 48 | American Funds Insurance Series |
Global Growth Fund (continued)
| Short-term securities 3.87% | | Principal amount
(000) | | | Value
(000) | |
| Commercial paper 2.12% | | | | | | | | |
| Toronto-Dominion Bank 0.19% due 1/19/20214 | | $ | 100,000 | | | $ | 99,993 | |
| NRW.Bank 0.21% due 1/22/20214 | | | 59,000 | | | | 58,995 | |
| LVMH Moët Hennessy Louis Vuitton Inc. 0.15% due 1/14/20214 | | | 16,000 | | | | 15,999 | |
| | | | | | | | 174,987 | |
| | | | | | | | | |
| | | | Shares | | | | | |
| Money market investments 1.75% | | | | | | | | |
| Capital Group Central Cash Fund 0.12%5,6 | | | 1,256,834 | | | | 125,696 | |
| Goldman Sachs Financial Square Government Fund, Institutional Shares 0.02%5,7 | | | 18,274,600 | | | | 18,274 | |
| | | | | | | | 143,970 | |
| | | | | | | | | |
| Total short-term securities (cost: $318,936,000) | | | | | | | 318,957 | |
| Total investment securities 100.49% (cost: $3,944,073,000) | | | | | | | 8,281,298 | |
| Other assets less liabilities (0.49)% | | | | | | | (40,328 | ) |
| | | | | | | | | |
| Net assets 100.00% | | | | | | $ | 8,240,970 | |
Investments in affiliates6
| | | Value of
affiliate at
1/1/2020
(000) | | | Additions
(000) | | | Reductions
(000) | | | Net
realized
gain
(000) | | | Net
unrealized
depreciation
(000) | | | Value of
affiliate at
12/31/2020
(000) | | | Dividend
income
(000) | |
| Short-term securities 1.53% | | | | | | | | | | | | | | | | | | | | | | | | | | | | |
| Money market investments 1.53% | | | | | | | | | | | | | | | | | | | | | | | | | | | | |
| Capital Group Central Cash Fund 0.12%5 | | $ | 137,140 | | | $ | 1,204,128 | | | $ | 1,215,496 | | | $ | 170 | | | $ | (246 | ) | | $ | 125,696 | | | $ | 973 | |
| 1 | Valued under fair value procedures adopted by authority of the board of trustees. The total value of all such securities was $3,662,002,000, which represented 44.44% of the net assets of the fund. This entire amount relates to certain securities trading outside the U.S. whose values were adjusted as a result of significant market movements following the close of local trading. |
| 2 | Security did not produce income during the last 12 months. |
| 3 | All or a portion of this security was on loan. The total value of all such securities was $21,446,000, which represented .26% of the net assets of the fund. Refer to Note 5 for more information on securities lending. |
| 4 | Acquired in a transaction exempt from registration under Section 4(2) of the Securities Act of 1933. May be resold in the U.S. in transactions exempt from registration, normally to qualified institutional buyers. The total value of all such securities was $174,987,000, which represented 2.12% of the net assets of the fund. |
| 5 | Rate represents the seven-day yield at 12/31/2020. |
| 6 | Part of the same group of investment companies as the fund as defined under the Investment Company Act of 1940. |
| 7 | Security purchased with cash collateral from securities on loan. Refer to Note 5 for more information on securities lending. |
Key to abbreviations
| ADR = | American Depositary Receipts |
| EUR = | Euros |
| GBP = | British pounds |
See notes to financial statements.
| American Funds Insurance Series | 49 |
Global Small Capitalization Fund
Investment portfolio December 31, 2020
| Common stocks 95.25% | | Shares | | | Value
(000) | |
| Information technology 27.03% | | | | | | | | |
| Cree, Inc.1 | | | 1,356,800 | | | $ | 143,685 | |
| Ceridian HCM Holding Inc.1 | | | 730,900 | | | | 77,885 | |
| Net One Systems Co., Ltd.2 | | | 1,855,865 | | | | 65,640 | |
| BE Semiconductor Industries NV2 | | | 801,930 | | | | 48,310 | |
| Kingdee International Software Group Co. Ltd.2 | | | 11,717,074 | | | | 48,085 | |
| PAR Technology Corp.1,3 | | | 700,482 | | | | 43,983 | |
| SimCorp AS2 | | | 265,750 | | | | 39,473 | |
| Unimicron Technology Corp.2 | | | 12,305,000 | | | | 38,529 | |
| Appfolio, Inc., Class A1 | | | 203,903 | | | | 36,711 | |
| Inphi Corp.1 | | | 215,191 | | | | 34,532 | |
| Avast PLC2 | | | 4,532,443 | | | | 33,340 | |
| Silergy Corp.2 | | | 383,740 | | | | 32,898 | |
| Avalara, Inc.1 | | | 194,419 | | | | 32,058 | |
| C3.ai, Inc., Class A1,3 | | | 229,200 | | | | 31,801 | |
| Qorvo, Inc.1 | | | 190,000 | | | | 31,591 | |
| Lightspeed POS Inc., subordinate voting shares1 | | | 443,300 | | | | 31,204 | |
| Skillz Inc., Class A1,2,4 | | | 1,399,676 | | | | 24,914 | |
| EuronetWorldwide, Inc.1 | | | 167,890 | | | | 24,331 | |
| Smartsheet Inc., Class A1 | | | 337,600 | | | | 23,392 | |
| Bentley Systems, Inc., Class B | | | 563,300 | | | | 22,819 | |
| Pegasystems Inc. | | | 169,591 | | | | 22,600 | |
| Nuance Communications, Inc.1 | | | 499,400 | | | | 22,019 | |
| Globant SA1 | | | 101,000 | | | | 21,979 | |
| SUMCO Corp.2 | | | 999,000 | | | | 21,934 | |
| Carel Industries SpA2 | | | 929,751 | | | | 21,804 | |
| Anaplan, Inc.1 | | | 295,733 | | | | 21,248 | |
| Alteryx, Inc., Class A1 | | | 173,000 | | | | 21,070 | |
| MACOMTechnology Solutions Holdings, Inc.1 | | | 380,000 | | | | 20,915 | |
| AI inside Inc.1,2 | | | 27,813 | | | | 19,667 | |
| Nordic Semiconductor ASA1,2 | | | 1,196,967 | | | | 19,159 | |
| LEM Holding SA2 | | | 9,570 | | | | 18,679 | |
| Paycom Software, Inc.1 | | | 40,000 | | | | 18,090 | |
| Bechtle AG, non-registered shares2 | | | 77,700 | | | | 16,945 | |
| Oneconnect Financial Technology Co., Ltd. (ADR)1 | | | 830,436 | | | | 16,368 | |
| Network International Holdings PLC1,2 | | | 3,434,882 | | | | 15,338 | |
| Silicon Laboratories Inc.1 | | | 115,900 | | | | 14,759 | |
| Keywords Studios PLC1,2 | | | 350,000 | | | | 13,734 | |
| SoftwareONE Holding AG2 | | | 449,700 | | | | 13,300 | |
| JFrog Ltd.1,3 | | | 209,100 | | | | 13,138 | |
| ON Semiconductor Corp.1 | | | 395,000 | | | | 12,928 | |
| Aspen Technology, Inc.1 | | | 93,100 | | | | 12,126 | |
| Tanla Platforms Ltd.2 | | | 1,339,330 | | | | 12,106 | |
| Asana, Inc., Class A1 | | | 401,900 | | | | 11,876 | |
| Cognex Corp. | | | 136,300 | | | | 10,943 | |
| Rapid7, Inc.1 | | | 121,000 | | | | 10,909 | |
| Nuvei Corp., subordinate voting shares1 | | | 173,200 | | | | 10,432 | |
| Computer Services, Inc. | | | 163,500 | | | | 9,712 | |
| Paya Holdings Inc., Class A1,3 | | | 667,000 | | | | 9,058 | |
| MongoDB, Inc., Class A1 | | | 25,000 | | | | 8,976 | |
| SHIFT Inc.1,2 | | | 63,700 | | | | 8,799 | |
| Renishaw PLC1,2 | | | 100,000 | | | | 7,876 | |
| Globalwafers Co., Ltd.2 | | | 311,000 | | | | 7,870 | |
| DocuSign, Inc.1 | | | 34,300 | | | | 7,625 | |
| QAD Inc., Class A | | | 115,350 | | | | 7,288 | |
| ALTEN SA, non-registered shares1,2 | | | 63,900 | | | | 7,238 | |
| Megaport Ltd.1,2 | | | 650,000 | | | | 7,134 | |
| Okta, Inc., Class A1 | | | 27,263 | | | | 6,932 | |
| INFICON Holding AG2 | | | 7,397 | | | | 6,748 | |
| Allegro Microsystems, Inc.1 | | | 246,500 | | | | 6,572 | |
| Coupa Software Inc.1 | | | 18,000 | | | | 6,100 | |
| BigCommerce Holdings, Inc., Series 11,3 | | | 90,000 | | | | 5,773 | |
| SVMK Inc.1 | | | 221,600 | | | | 5,662 | |
| 50 | American Funds Insurance Series |
Global Small Capitalization Fund (continued)
| Common stocks (continued) | | Shares | | | Value
(000) | |
| Information technology (continued) | | | | | | | | |
| Pexip Holding ASA1,2,3 | | | 676,082 | | | $ | 5,193 | |
| Yangtze Optical Fibre and Cable Joint Stock Ltd. Co., Class H2 | | | 3,605,500 | | | | 4,827 | |
| Tyro Payments Ltd.1,2,3 | | | 1,727,332 | | | | 4,251 | |
| Appen Ltd.2 | | | 162,863 | | | | 3,117 | |
| | | | | | | | 1,435,998 | |
| | | | | | | | | |
| Health care 22.94% | | | | | | | | |
| Insulet Corp.1 | | | 567,720 | | | | 145,126 | |
| Haemonetics Corp.1 | | | 796,700 | | | | 94,608 | |
| Allakos Inc.1 | | | 586,080 | | | | 82,051 | |
| Notre Dame Intermédica Participações SA | | | 4,089,700 | | | | 61,682 | |
| WuXi Biologics (Cayman) Inc.1,2 | | | 4,236,000 | | | | 56,424 | |
| GWPharmaceuticals PLC (ADR)1 | | | 473,768 | | | | 54,678 | |
| iRhythm Technologies, Inc.1 | | | 213,120 | | | | 50,554 | |
| Mani, Inc.2 | | | 1,808,129 | | | | 49,243 | |
| CanSino Biologics Inc., Class H1,2 | | | 2,132,400 | | | | 48,805 | |
| Ultragenyx Pharmaceutical Inc.1 | | | 325,474 | | | | 45,055 | |
| Applied Molecular Transport Inc.1,3 | | | 1,365,957 | | | | 42,030 | |
| Health Catalyst, Inc.1 | | | 922,700 | | | | 40,165 | |
| Integra LifeSciences Holdings Corp.1 | | | 602,696 | | | | 39,127 | |
| PRA Health Sciences, Inc.1 | | | 257,150 | | | | 32,257 | |
| New Frontier Health Corp., Class A1 | | | 3,422,000 | | | | 29,429 | |
| Kronos Bio, Inc.1,2 | | | 619,195 | | | | 17,386 | |
| Kronos Bio, Inc.1 | | | 387,795 | | | | 11,583 | |
| Globus Medical, Inc., Class A1 | | | 434,000 | | | | 28,305 | |
| CompuGroup Medical SE & Co. KGaA2 | | | 277,700 | | | | 26,669 | |
| GVS SpA1,2 | | | 1,350,919 | | | | 25,165 | |
| Allogene Therapeutics, Inc.1 | | | 947,234 | | | | 23,908 | |
| Nevro Corp.1 | | | 128,100 | | | | 22,174 | |
| Cortexyme, Inc.1,3 | | | 759,458 | | | | 21,098 | |
| CONMED Corp. | | | 157,000 | | | | 17,584 | |
| Max Healthcare Institute Ltd.1,2 | | | 8,885,394 | | | | 17,116 | |
| Amplifon SpA1,2 | | | 401,700 | | | | 16,646 | |
| Guardant Health, Inc.1 | | | 119,227 | | | | 15,366 | |
| Ambu AS, Class B, non-registered shares2,3 | | | 283,500 | | | | 12,241 | |
| Ocumension Therapeutics1,2 | | | 3,168,466 | | | | 11,051 | |
| NuCana PLC (ADR)1,3 | | | 2,356,233 | | | | 10,579 | |
| AddLife AB, Class B2 | | | 553,888 | | | | 9,693 | |
| Bluebird Bio, Inc.1 | | | 196,815 | | | | 8,516 | |
| BioMarin Pharmaceutical Inc.1 | | | 92,000 | | | | 8,067 | |
| Shandong Pharmaceutical Glass Co., Ltd., Class A2 | | | 955,000 | | | | 7,342 | |
| Madrigal Pharmaceuticals, Inc.1 | | | 61,425 | | | | 6,829 | |
| Encompass Health Corp. | | | 79,000 | | | | 6,533 | |
| Bachem Holding AG, Class B2 | | | 14,100 | | | | 6,266 | |
| Arjo AB, Class B2 | | | 765,000 | | | | 5,842 | |
| Hikma Pharmaceuticals PLC2 | | | 131,000 | | | | 4,512 | |
| Hutchison China MediTech Ltd. (ADR)1 | | | 124,000 | | | | 3,970 | |
| Uniphar PLC2 | | | 1,022,000 | | | | 2,974 | |
| NMC Health PLC1,2,5 | | | 219,652 | | | | 3 | |
| | | | | | | | 1,218,652 | |
| | | | | | | | | |
| Consumer discretionary 14.67% | | | | | | | | |
| Shop Apotheke Europe NV, non-registered shares1,2,3 | | | 282,300 | | | | 51,122 | |
| Wyndham Hotels & Resorts, Inc. | | | 808,069 | | | | 48,032 | |
| Helen of Troy Ltd.1 | | | 207,200 | | | | 46,038 | |
| Lands’ End, Inc.1,6 | | | 2,100,000 | | | | 45,297 | |
| Thor Industries, Inc. | | | 463,600 | | | | 43,110 | |
| YETI Holdings, Inc.1 | | | 593,379 | | | | 40,629 | |
| Mattel, Inc.1 | | | 2,100,069 | | | | 36,646 | |
| Five Below, Inc.1 | | | 199,700 | | | | 34,944 | |
| Evolution Gaming Group AB2 | | | 328,676 | | | | 33,323 | |
| Entain PLC1,2 | | | 1,748,600 | | | | 27,143 | |
| American Funds Insurance Series | 51 |
Global Small Capitalization Fund (continued)
| Common stocks (continued) | | Shares | | | Value
(000) | |
| Consumer discretionary (continued) | | | | | | | | |
| Leslie’s, Inc.1,3 | | | 824,800 | | | $ | 22,888 | |
| Arco Platform Ltd., Class A1 | | | 638,725 | | | | 22,668 | |
| Skechers USA, Inc., Class A1 | | | 550,000 | | | | 19,767 | |
| Tongcheng-Elong Holdings Ltd.1,2 | | | 10,084,800 | | | | 19,537 | |
| Just Eat Takeaway (EUR denominated)1,2 | | | 166,200 | | | | 18,735 | |
| Tube Investments of India Ltd.2 | | | 1,700,000 | | | | 18,641 | |
| Everi Holdings Inc.1 | | | 1,324,553 | | | | 18,292 | |
| Kindred Group PLC (SDR)1,2 | | | 1,806,800 | | | | 17,683 | |
| zooplus AG, non-registered shares1,2 | | | 78,700 | | | | 16,299 | |
| Melco International Development Ltd.2 | | | 7,826,000 | | | | 15,240 | |
| B2W - Cia. Digital, ordinary nominative1 | | | 1,010,093 | | | | 14,704 | |
| SSP Group PLC2 | | | 3,233,990 | | | | 14,687 | |
| TopBuild Corp.1 | | | 73,600 | | | | 13,548 | |
| Musti Group Oyj1,2 | | | 436,550 | | | | 13,083 | |
| Bright Horizons Family Solutions Inc.1 | | | 74,300 | | | | 12,853 | |
| Purple Innovation, Inc., Class A1 | | | 390,000 | | | | 12,847 | |
| Basic-Fit NV1,2 | | | 348,300 | | | | 12,725 | |
| Cie. Plastic Omnium SA2 | | | 308,912 | | | | 10,724 | |
| IDP Education Ltd.2 | | | 691,561 | | | | 10,594 | |
| Patrick Industries, Inc. | | | 131,700 | | | | 9,002 | |
| Thule Group AB1,2 | | | 219,800 | | | | 8,215 | |
| Cairn Homes PLC1,2 | | | 6,829,200 | | | | 7,972 | |
| Sushiro Global Holdings Ltd.2 | | | 187,000 | | | | 7,142 | |
| OneSpaWorld Holdings Ltd. | | | 695,690 | | | | 7,054 | |
| Zhongsheng Group Holdings Ltd.2 | | | 938,500 | | | | 6,691 | |
| Elior Group SA2 | | | 882,500 | | | | 5,961 | |
| Countryside Properties PLC2 | | | 743,015 | | | | 4,771 | |
| Kerry Express (Thailand) PCL, foreign registered1,2 | | | 2,250,000 | | | | 3,699 | |
| Dalata Hotel Group PLC1,2 | | | 800,000 | | | | 3,689 | |
| Coursera, Inc.1,2,5,7 | | | 160,625 | | | | 2,409 | |
| DraftKings Inc., Class A1 | | | 16,755 | | | | 780 | |
| China Zenix Auto International Ltd. (ADR)1 | | | 428,500 | | | | 111 | |
| | | | | | | | 779,295 | |
| | | | | | | | | |
| Industrials 13.20% | | | | | | | | |
| Nihon M&A Center Inc.2 | | | 1,304,292 | | | | 87,283 | |
| Boyd Group Services Inc.3 | | | 233,326 | | | | 40,246 | |
| International Container Terminal Services, Inc.2 | | | 15,047,500 | | | | 38,708 | |
| Stericycle, Inc.1 | | | 539,531 | | | | 37,406 | |
| IMCD NV2 | | | 285,600 | | | | 36,288 | |
| Meggitt PLC1,2 | | | 5,035,900 | | | | 32,174 | |
| Bingo Industries Ltd.2,3 | | | 14,571,008 | | | | 27,435 | |
| Instalco AB2 | | | 836,795 | | | | 25,503 | |
| Japan Elevator Service Holdings Co., Ltd.2 | | | 970,400 | | | | 24,707 | |
| Alfen NV1,2 | | | 227,700 | | | | 22,879 | |
| Interpump Group SpA2 | | | 447,000 | | | | 22,084 | |
| Nolato AB, Class B1,2 | | | 185,100 | | | | 18,716 | |
| Melrose Industries PLC1,2 | | | 7,236,000 | | | | 17,647 | |
| Wizz Air Holdings PLC1,2 | | | 278,200 | | | | 17,375 | |
| VAT Group AG2 | | | 68,150 | | | | 16,986 | |
| Diploma PLC2 | | | 556,200 | | | | 16,689 | |
| Avon Rubber PLC2 | | | 383,500 | | | | 16,610 | |
| Matson, Inc. | | | 289,400 | | | | 16,487 | |
| CleanawayWaste Management Ltd.2 | | | 7,580,970 | | | | 13,779 | |
| Centre Testing International Group Co., Ltd.2 | | | 3,266,269 | | | | 13,692 | |
| Han’s Laser Technology Industry Group Co., Ltd., Class A2 | | | 2,037,982 | | | | 13,354 | |
| Woodward, Inc. | | | 105,000 | | | | 12,761 | |
| Granite Construction Inc. | | | 465,000 | | | | 12,420 | |
| Guangzhou Baiyun International Airport Co. Ltd., Class A2 | | | 5,704,039 | | | | 12,329 | |
| Marel hf.2 | | | 1,971,482 | | | | 12,157 | |
| Rumo SA1 | | | 3,025,547 | | | | 11,207 | |
| CAE Inc. | | | 375,000 | | | | 10,391 | |
| 52 | American Funds Insurance Series |
Global Small Capitalization Fund (continued)
| Common stocks (continued) | | Shares | | | Value
(000) | |
| Industrials (continued) | | | | | | | | |
| IAA, Inc.1 | | | 141,750 | | | $ | 9,211 | |
| Addtech AB, Class B2 | | | 497,200 | | | | 6,583 | |
| Montrose Environmental Group, Inc.1 | | | 190,800 | | | | 5,907 | |
| Nitto Boseki Co., Ltd.2 | | | 132,500 | | | | 5,853 | |
| Atlas Corp. | | | 500,000 | | | | 5,420 | |
| Imperial Logistics Ltd.2 | | | 2,103,000 | | | | 5,351 | |
| TOMRA Systems ASA2 | | | 106,900 | | | | 5,268 | |
| BWX Technologies, Inc. | | | 85,000 | | | | 5,124 | |
| BELIMO Holding AG2 | | | 523 | | | | 4,543 | |
| VARTA AG, non-registered shares1,2,3 | | | 30,875 | | | | 4,459 | |
| LIXIL Corp.2 | | | 196,500 | | | | 4,268 | |
| Howden Joinery Group PLC1,2 | | | 440,000 | | | | 4,155 | |
| McPhy Energy SA1,2,3 | | | 74,800 | | | | 3,144 | |
| Vicor Corp, Class A1 | | | 27,800 | | | | 2,564 | |
| The AZEK Company Inc., Class A1 | | | 54,400 | | | | 2,092 | |
| | | | | | | | 701,255 | |
| | | | | | | | | |
| Financials 7.47% | | | | | | | | |
| Cannae Holdings, Inc.1 | | | 1,931,800 | | | | 85,521 | |
| Trupanion, Inc.1 | | | 671,200 | | | | 80,349 | |
| Janus Henderson Group PLC | | | 1,088,400 | | | | 35,384 | |
| Capitec Bank Holdings Ltd.1,2 | | | 232,177 | | | | 22,625 | |
| Live Oak Bancshares, Inc. | | | 462,000 | | | | 21,926 | |
| South State Corp. | | | 283,300 | | | | 20,483 | |
| Kotak Mahindra Bank Ltd.1,2 | | | 715,825 | | | | 19,590 | |
| Eurobank Ergasias Services and Holdings SA1,2 | | | 27,631,908 | | | | 19,562 | |
| EastWest Bancorp, Inc. | | | 287,300 | | | | 14,569 | |
| Stifel Financial Corp. | | | 271,050 | | | | 13,677 | |
| Independent Bank Group, Inc. | | | 192,300 | | | | 12,023 | |
| Indian Energy Exchange Ltd.2 | | | 3,150,000 | | | | 9,842 | |
| IIFLWealth Management Ltd.2 | | | 677,558 | | | | 9,388 | |
| Aavas Financiers Ltd.1,2 | | | 402,000 | | | | 9,335 | |
| Multi Commodity Exchange of India Ltd.2 | | | 342,375 | | | | 8,115 | |
| Essent Group Ltd. | | | 175,000 | | | | 7,560 | |
| Third Point Reinsurance Ltd.1 | | | 340,400 | | | | 3,241 | |
| Fanhua Inc. (ADR) | | | 157,600 | | | | 1,897 | |
| Huize Holding Ltd. (ADR)1 | | | 223,220 | | | | 1,562 | |
| | | | | | | | 396,649 | |
| | | | | | | | | |
| Materials 2.33% | | | | | | | | |
| Nanofilm Technologies International Ltd.1,2 | | | 7,424,900 | | | | 24,720 | |
| Lundin Mining Corp. | | | 2,773,100 | | | | 24,618 | |
| PI Industries Ltd.2 | | | 778,604 | | | | 23,446 | |
| Navin Fluorine International Ltd.2 | | | 445,388 | | | | 16,030 | |
| Fasadgruppen Group AB1,2 | | | 770,604 | | | | 8,233 | |
| Vidrala, SA, non-registered shares2 | | | 67,694 | | | | 7,850 | |
| Valvoline Inc. | | | 315,300 | | | | 7,296 | |
| SK Materials Co., Ltd.2 | | | 16,400 | | | | 5,411 | |
| LANXESS AG2 | | | 54,500 | | | | 4,179 | |
| Arkema SA2 | | | 15,200 | | | | 1,737 | |
| | | | | | | | 123,520 | |
| | | | | | | | | |
| Real estate 2.07% | | | | | | | | |
| Altus Group Ltd. | | | 939,007 | | | | 36,250 | |
| Embassy Office Parks REIT2 | | | 5,189,400 | | | | 24,506 | |
| MGM Growth Properties LLC REIT, Class A | | | 500,000 | | | | 15,650 | |
| JHSF Participações SA | | | 9,099,476 | | | | 13,682 | |
| Mitre Realty Empreendimentos E Participações SA1 | | | 1,955,500 | | | | 6,400 | |
| WHA Corp. PCL2 | | | 59,416,400 | | | | 5,988 | |
| Mindspace Business Parks REIT1,2,4 | | | 654,600 | | | | 2,810 | |
| American Funds Insurance Series | 53 |
Global Small Capitalization Fund (continued)
| Common stocks (continued) | | Shares | | | Value
(000) | |
| Real estate (continued) | | | | | | | | |
| Mindspace Business Parks REIT1,2 | | | 595,400 | | | $ | 2,608 | |
| DoubleDragon Properties Corp.1,2 | | | 6,395,985 | | | | 1,984 | |
| Cyrela Commercial Properties SA, ordinary nominative | | | 105,754 | | | | 279 | |
| | | | | | | | 110,157 | |
| | | | | | | | | |
| Communication services 2.00% | | | | | | | | |
| Altice Europe NV, Class A1,2 | | | 4,115,000 | | | | 26,791 | |
| Bandwidth Inc., Class A1 | | | 122,000 | | | | 18,748 | |
| Capcom Co., Ltd.2 | | | 226,800 | | | | 14,745 | |
| New York Times Co., Class A | | | 259,500 | | | | 13,434 | |
| Square Enix Holdings Co., Ltd.2 | | | 143,200 | | | | 8,690 | |
| Kamakura Shinsho, Ltd.2 | | | 677,700 | | | | 7,514 | |
| Euskaltel, SA, non-registered shares2 | | | 630,178 | | | | 6,734 | |
| Zee Entertainment Enterprises Ltd.2 | | | 1,398,700 | | | | 4,295 | |
| Daily Mail and General Trust PLC, Class A, nonvoting shares2 | | | 296,800 | | | | 3,025 | |
| Cardlytics, Inc.1,3 | | | 16,500 | | | | 2,356 | |
| | | | | | | | 106,332 | |
| | | | | | | | | |
| Consumer staples 1.86% | | | | | | | | |
| Freshpet, Inc.1 | | | 318,400 | | | | 45,210 | |
| Grocery Outlet Holding Corp.1 | | | 755,400 | | | | 29,649 | |
| AAK AB2 | | | 511,300 | | | | 10,311 | |
| Hilton Food Group PLC2 | | | 586,277 | | | | 8,938 | |
| Vector Group Ltd. | | | 224,000 | | | | 2,610 | |
| Raia Drogasil SA, ordinary nominative | | | 445,000 | | | | 2,145 | |
| | | | | | | | 98,863 | |
| | | | | | | | | |
| Utilities 1.22% | | | | | | | | |
| ENN Energy Holdings Ltd.2 | | | 4,026,200 | | | | 59,096 | |
| Neoenergia SA | | | 1,727,000 | | | | 5,859 | |
| | | | | | | | 64,955 | |
| | | | | | | | | |
| Energy 0.46% | | | | | | | | |
| Parsley Energy, Inc., Class A | | | 915,000 | | | | 12,993 | |
| Venture Global LNG, Inc., Series C1,2,4,5,7 | | | 2,760 | | | | 10,434 | |
| NuVista Energy Ltd.1 | | | 1,325,000 | | | | 979 | |
| | | | | | | | 24,406 | |
| | | | | | | | | |
| Total common stocks (cost: $2,750,940,000) | | | | | | | 5,060,082 | |
| | | | | | | | | |
| Preferred securities 1.81% | | | | | | | | |
| Information technology 1.30% | | | | | | | | |
| Marqeta, Inc., Series E-1, 8.00% noncumulative, preferred shares1,2,5,7 | | | 1,859,092 | | | | 32,887 | |
| Avidxchange, Inc., Series F, preferred shares1,2,5,7 | | | 492,864 | | | | 24,156 | |
| Gitlab Inc., Series E, preferred shares1,2,5,7 | | | 297,916 | | | | 11,917 | |
| | | | | | | | 68,960 | |
| | | | | | | | | |
| Industrials 0.36% | | | | | | | | |
| Azul SA, preferred nominative (ADR)1,3 | | | 800,316 | | | | 18,263 | |
| Azul SA, preferred nominative1 | | | 109,500 | | | | 829 | |
| | | | | | | | 19,092 | |
| Health care 0.15% | | | | | | | | |
| PACT Pharma, Inc., Series C, 8.00% noncumulative, preferred shares1,2,5,7 | | | 2,931,405 | | | | 8,231 | |
| | | | | | | | | |
| Total preferred securities (cost: $62,052,000) | | | | | | | 96,283 | |
| 54 | American Funds Insurance Series |
Global Small Capitalization Fund (continued)
| Rights & warrants 0.03% | | Shares | | | Value
(000) | |
| Consumer staples 0.03% | | | | | | | | |
| Qingdao Richen Food Co., Ltd., Class A, warrants, expire 20221,2,4 | | | 132,100 | | | $ | 1,580 | |
| | | | | | | | | |
| Total rights & warrants (cost: $1,550,000) | | | | | | | 1,580 | |
| | | | | | | | | |
| Convertible stocks 0.26% | | | | | | | | |
| Consumer discretionary 0.26% | | | | | | | | |
| Coursera, Inc., Series C, 8.00% noncumulative, convertible preferred shares2,5,7 | | | 531,643 | | | | 9,038 | |
| Coursera, Inc., Series B, noncumulative, convertible preferred shares2,5,7 | | | 246,302 | | | | 4,187 | |
| Coursera, Inc., Series F, noncumulative, convertible preferred shares2,5,7 | | | 36,964 | | | | 629 | |
| | | | | | | | 13,854 | |
| | | | | | | | | |
| Total convertible stocks (cost: $10,863,000) | | | | | | | 13,854 | |
| |
| Short-term securities 4.21% | | | | | | | | |
| Commercial paper 2.58% | | | | | | | | |
| Toronto-Dominion Bank 0.19% due 1/19/20214 | | | 100,000 | | | | 99,993 | |
| NRW.Bank 0.22% due 1/22/20214 | | | 37,000 | | | | 36,997 | |
| | | | | | | | 136,990 | |
| | | | | | | | | |
| Money market investments 1.63% | | | | | | | | |
| Goldman Sachs Financial Square Government Fund, Institutional Shares 0.02%8,9 | | 71,737,955 | | | | 71,738 | |
| Capital Group Central Cash Fund 0.12%6,8 | | | 151,346 | | | | 15,136 | |
| | | | | | | | 86,874 | |
| | | | | | | | | |
| Total short-term securities (cost: $223,856,000) | | | | | | | 223,864 | |
| Total investment securities 101.56% (cost: $3,049,261,000) | | | | | | | 5,395,663 | |
| Other assets less liabilities (1.56)% | | | | | | | (82,922 | ) |
| | | | | | | | | |
| Net assets 100.00% | | | | | | $ | 5,312,741 | |
Investments in affiliates6
| | | Value of
affiliates at
1/1/2020
(000) | | | Additions
(000) | | | Reductions
(000) | | | Net
realized
gain
(000) | | | Net
unrealized
(depreciation)
appreciation
(000) | | | Value of
affiliates at
12/31/2020
(000) | | | Dividend
income
(000) | |
| Common stocks 0.85% | | | | | | | | | | | | | | | | | | | | | | | | | | | | |
| Health care 0.00% | | | | | | | | | | | | | | | | | | | | | | | | | | | | |
| NuCana PLC (ADR)1,3,10 | | $ | 12,711 | | | $ | 1,226 | | | $ | — | | | $ | — | | | $ | (3,358 | ) | | $ | — | | | $ | — | |
| Consumer discretionary 0.85% | | | | | | | | | | | | | | | | | | | | | | | | | | | | |
| Lands’ End, Inc.1 | | | — | | | | 14,805 | | | | — | | | | — | | | | 30,492 | | | | 45,297 | | | | — | |
| Total common stocks | | | | | | | | | | | | | | | | | | | | | | | 45,297 | | | | | |
| Short-term securities 0.29% | | | | | | | | | | | | | | | | | | | | | | | | | | | | |
| Money market investments 0.29% | | | | | | | | | | | | | | | | | | | | | | | | | | | | |
| Capital Group Central Cash Fund 0.12%8 | | | 192,600 | | | | 961,788 | | | | 1,139,083 | | | | 68 | | | | (237 | ) | | | 15,136 | | | | 1,310 | |
| Total 1.14% | | | | | | | | | | | | | | $ | 68 | | | $ | 26,897 | | | $ | 60,433 | | | $ | 1,310 | |
| American Funds Insurance Series | 55 |
Global Small Capitalization Fund (continued)
| 1 | Security did not produce income during the last 12 months. |
| 2 | Valued under fair value procedures adopted by authority of the board of trustees. The total value of all such securities was $2,225,547,000, which represented 41.89% of the net assets of the fund. This amount includes $2,067,250,000 related to certain securities trading outside the U.S. whose values were adjusted as a result of significant market movements following the close of local trading. |
| 3 | All or a portion of this security was on loan. The total value of all such securities was $77,648,000, which represented 1.46% of the net assets of the fund. Refer to Note 5 for more information on securities lending. |
| 4 | Acquired in a transaction exempt from registration under Rule 144A or Section 4(2) of the Securities Act of 1933. May be resold in the U.S. in transactions exempt from registration, normally to qualified institutional buyers. The total value of all such securities was $176,728,000, which represented 3.33% of the net assets of the fund. |
| 5 | Value determined using significant unobservable inputs. |
| 6 | Affiliate of the fund or part of the same group of investment companies as the fund, in each case as defined under the Investment Company Act of 1940. |
| 7 | Acquired through a private placement transaction exempt from registration under the Securities Act of 1933. May be subject to legal or contractual restrictions on resale. Further details on these holdings appear below. |
| 8 | Rate represents the seven-day yield at 12/31/2020. |
| 9 | Security purchased with cash collateral from securities on loan. Refer to Note 5 for more information on securities lending. |
| 10 | Unaffiliated issuer at 12/31/2020. |
| Private placement securities | | Acquisition
date | | | Cost
(000) | | | Value
(000) | | | Percent
of net
assets | |
| Marqeta, Inc., Series E-1, 8.00% noncumulative, preferred shares | | | 5/27/2020 | | | $ | 15,500 | | | $ | 32,887 | | | | .62 | % |
| Avidxchange, Inc., Series F, preferred shares | | | 12/26/2019 | | | | 24,156 | | | | 24,156 | | | | .45 | |
| Gitlab Inc., Series E, preferred shares | | | 9/11/2019 | | | | 5,550 | | | | 11,917 | | | | .22 | |
| Venture Global LNG, Inc., Series C | | | 5/1/2015 | | | | 8,280 | | | | 10,434 | | | | .20 | |
| Coursera, Inc., Series C, 8.00% noncumulative, convertible preferred shares | | | 2/20/2020 | | | | 6,380 | | | | 9,038 | | | | .17 | |
| PACT Pharma, Inc., Series C, 8.00% noncumulative, preferred shares | | | 2/7/2020 | | | | 6,000 | | | | 8,231 | | | | .16 | |
| Coursera, Inc., Series B, noncumulative, convertible preferred shares | | | 8/12/2020 | | | | 3,855 | | | | 4,187 | | | | .08 | |
| Coursera, Inc. | | | 8/12/2020 | | | | 2,514 | | | | 2,409 | | | | .05 | |
| Coursera, Inc., Series F, noncumulative, convertible preferred shares | | | 7/15/2020 | | | | 628 | | | | 629 | | | | .01 | |
| Total private placement securities | | | | | | $ | 72,863 | | | $ | 103,888 | | | | 1.96 | % |
Key to abbreviations
| ADR = | American Depositary Receipts |
| EUR = | Euros |
| SDR = | Swedish Depositary Receipts |
See notes to financial statements.
| 56 | American Funds Insurance Series |
Growth Fund
Investment portfolio December 31, 2020
| Common stocks 95.50% | | Shares | | | Value
(000) | |
| Information technology 22.59% | | | | | | | | |
| Microsoft Corp. | | | 8,170,085 | | | $ | 1,817,190 | |
| Broadcom Inc. | | | 1,811,536 | | | | 793,181 | |
| ASML Holding NV (New York registered) (ADR) | | | 632,100 | | | | 308,288 | |
| ASML Holding NV1 | | | 635,000 | | | | 306,871 | |
| Taiwan Semiconductor Manufacturing Company, Ltd.1 | | | 18,618,000 | | | | 349,673 | |
| Taiwan Semiconductor Manufacturing Company, Ltd. (ADR) | | | 2,218,945 | | | | 241,954 | |
| RingCentral, Inc., Class A2 | | | 1,322,397 | | | | 501,149 | |
| Shopify Inc., Class A, subordinate voting shares2 | | | 410,400 | | | | 464,552 | |
| Visa Inc., Class A | | | 1,591,570 | | | | 348,124 | |
| PayPal Holdings, Inc.2 | | | 1,319,600 | | | | 309,050 | |
| Mastercard Inc., Class A | | | 716,844 | | | | 255,870 | |
| Advanced Micro Devices, Inc.2 | | | 2,360,947 | | | | 216,522 | |
| MongoDB, Inc., Class A2 | | | 594,973 | | | | 213,619 | |
| Autodesk, Inc.2 | | | 654,703 | | | | 199,907 | |
| FleetCor Technologies, Inc.2 | | | 710,400 | | | | 193,818 | |
| Keyence Corp.1 | | | 300,900 | | | | 169,341 | |
| Cree, Inc.2 | | | 1,495,879 | | | | 158,414 | |
| Square, Inc., Class A2 | | | 726,255 | | | | 158,062 | |
| Ceridian HCM Holding Inc.2 | | | 1,274,711 | | | | 135,833 | |
| ServiceNow, Inc.2 | | | 235,806 | | | | 129,795 | |
| Samsung Electronics Co., Ltd.1 | | | 1,538,083 | | | | 114,952 | |
| Tyler Technologies, Inc.2 | | | 263,200 | | | | 114,892 | |
| Micron Technology, Inc.2 | | | 1,447,335 | | | | 108,811 | |
| Guidewire Software, Inc.2 | | | 821,399 | | | | 105,739 | |
| Apple Inc. | | | 779,886 | | | | 103,483 | |
| Applied Materials, Inc. | | | 1,033,670 | | | | 89,206 | |
| HubSpot, Inc.2 | | | 210,067 | | | | 83,279 | |
| Trimble Inc.2 | | | 900,572 | | | | 60,131 | |
| Bill.Com Holdings, Inc.2 | | | 433,100 | | | | 59,118 | |
| Adobe Inc.2 | | | 115,899 | | | | 57,963 | |
| Intel Corp. | | | 1,136,000 | | | | 56,596 | |
| Elastic NV, non-registered shares2 | | | 346,722 | | | | 50,667 | |
| Fidelity National Information Services, Inc. | | | 328,778 | | | | 46,509 | |
| Alteryx, Inc., Class A2 | | | 353,058 | | | | 42,999 | |
| Flex Ltd.2 | | | 2,234,300 | | | | 40,173 | |
| SK hynix, Inc.1 | | | 330,800 | | | | 36,189 | |
| Zendesk, Inc.2 | | | 252,368 | | | | 36,119 | |
| NetApp, Inc. | | | 527,540 | | | | 34,944 | |
| Fiserv, Inc.2 | | | 304,473 | | | | 34,667 | |
| Jack Henry & Associates, Inc. | | | 167,789 | | | | 27,180 | |
| MKS Instruments, Inc. | | | 157,800 | | | | 23,741 | |
| Okta, Inc., Class A2 | | | 93,170 | | | | 23,689 | |
| Motorola Solutions, Inc. | | | 134,257 | | | | 22,832 | |
| ON Semiconductor Corp.2 | | | 640,919 | | | | 20,977 | |
| EPAM Systems, Inc.2 | | | 52,839 | | | | 18,935 | |
| GoDaddy Inc., Class A2 | | | 213,800 | | | | 17,735 | |
| Smartsheet Inc., Class A2 | | | 238,281 | | | | 16,511 | |
| Enphase Energy, Inc.2 | | | 87,779 | | | | 15,403 | |
| VeriSign, Inc.2 | | | 68,100 | | | | 14,737 | |
| Amadeus IT Group SA, Class A, non-registered shares1 | | | 160,263 | | | | 11,603 | |
| Concentrix Corp.2 | | | 108,272 | | | | 10,686 | |
| Global Payments Inc. | | | 46,612 | | | | 10,041 | |
| SYNNEX Corp. | | | 108,272 | | | | 8,818 | |
| Atlassian Corp. PLC, Class A2 | | | 19,317 | | | | 4,518 | |
| | | | | | | | 8,795,056 | |
| | | | | | | | | |
| Consumer discretionary 18.83% | | | | | | | | |
| Tesla, Inc.2 | | | 5,488,000 | | | | 3,872,717 | |
| Amazon.com, Inc.2 | | | 270,876 | | | | 882,224 | |
| Dollar General Corp. | | | 1,774,500 | | | | 373,177 | |
| Home Depot, Inc. | | | 848,736 | | | | 225,441 | |
| LVMH Moët Hennessy-Louis Vuitton SE1 | | | 330,000 | | | | 206,194 | |
| American Funds Insurance Series | 57 |
Growth Fund (continued)
| Common stocks (continued) | | Shares | | | Value
(000) | |
| Consumer discretionary (continued) | | | | | | | | |
| Domino’s Pizza, Inc. | | | 448,575 | | | $ | 172,011 | |
| Darden Restaurants, Inc. | | | 1,438,876 | | | | 171,399 | |
| Booking Holdings Inc.2 | | | 74,213 | | | | 165,292 | |
| Toll Brothers, Inc. | | | 3,280,000 | | | | 142,582 | |
| Bright Horizons Family Solutions Inc.2 | | | 681,000 | | | | 117,806 | |
| Burlington Stores, Inc.2 | | | 432,204 | | | | 113,043 | |
| Hermès International1 | | | 97,299 | | | | 104,631 | |
| Royal Caribbean Cruises Ltd. | | | 1,201,909 | | | | 89,771 | |
| NIKE, Inc., Class B | | | 546,407 | | | | 77,300 | |
| Floor & Decor Holdings, Inc., Class A2 | | | 769,300 | | | | 71,430 | |
| Chipotle Mexican Grill, Inc.2 | | | 46,247 | | | | 64,131 | |
| Aramark | | | 1,666,401 | | | | 64,123 | |
| Airbnb, Inc., Class A2 | | | 374,400 | | | | 54,962 | |
| Five Below, Inc.2 | | | 198,640 | | | | 34,758 | |
| Flutter Entertainment PLC (EUR denominated)1 | | | 166,291 | | | | 34,062 | |
| Wynn Resorts, Ltd. | | | 258,022 | | | | 29,113 | |
| Las Vegas Sands Corp. | | | 485,638 | | | | 28,944 | |
| Westwing Group AG, non-registered shares1,2,3 | | | 707,000 | | | | 28,606 | |
| Caesars Entertainment, Inc.2 | | | 379,500 | | | | 28,185 | |
| Norwegian Cruise Line Holdings Ltd.2,3 | | | 1,095,796 | | | | 27,866 | |
| Marriott International, Inc., Class A | | | 210,000 | | | | 27,703 | |
| Peloton Interactive, Inc., Class A2 | | | 180,000 | | | | 27,310 | |
| Grand Canyon Education, Inc.2 | | | 213,615 | | | | 19,890 | |
| Hilton Worldwide Holdings Inc. | | | 151,700 | | | | 16,878 | |
| Evolution Gaming Group AB1 | | | 160,210 | | | | 16,243 | |
| Cie. Financière Richemont SA, Class A1 | | | 174,005 | | | | 15,724 | |
| YUM! Brands, Inc. | | | 129,700 | | | | 14,080 | |
| EssilorLuxottica1 | | | 69,400 | | | | 10,823 | |
| | | | | | | | 7,328,419 | |
| | | | | | | | | |
| Communication services 18.02% | | | | | | | | |
| Facebook, Inc., Class A2 | | | 7,454,034 | | | | 2,036,144 | |
| Netflix, Inc.2 | | | 3,139,599 | | | | 1,697,675 | |
| Alphabet Inc., Class C2 | | | 466,472 | | | | 817,203 | |
| Alphabet Inc., Class A2 | | | 60,216 | | | | 105,537 | |
| T-Mobile US, Inc.2 | | | 4,003,260 | | | | 539,840 | |
| Activision Blizzard, Inc. | | | 5,097,672 | | | | 473,319 | |
| Charter Communications, Inc., Class A2 | | | 695,547 | | | | 460,139 | |
| Snap Inc., Class A2 | | | 8,325,383 | | | | 416,852 | |
| Comcast Corp., Class A | | | 4,324,019 | | | | 226,579 | |
| Zillow Group, Inc., Class C, nonvoting shares2 | | | 347,800 | | | | 45,144 | |
| Zillow Group, Inc., Class A2 | | | 271,354 | | | | 36,888 | |
| Pinterest, Inc., Class A2 | | | 1,027,744 | | | | 67,728 | |
| Match Group, Inc.2 | | | 234,000 | | | | 35,379 | |
| Live Nation Entertainment, Inc.2 | | | 400,000 | | | | 29,392 | |
| Twitter, Inc.2 | | | 460,000 | | | | 24,909 | |
| | | | | | | | 7,012,728 | |
| | | | | | | | | |
| Health care 12.72% | | | | | | | | |
| UnitedHealth Group Inc. | | | 2,472,454 | | | | 867,040 | |
| Intuitive Surgical, Inc.2 | | | 803,680 | | | | 657,491 | |
| Regeneron Pharmaceuticals, Inc.2 | | | 841,544 | | | | 406,558 | |
| Centene Corp.2 | | | 5,286,474 | | | | 317,347 | |
| Thermo Fisher Scientific Inc. | | | 632,000 | | | | 294,373 | |
| Humana Inc. | | | 496,800 | | | | 203,822 | |
| Exact Sciences Corp.2 | | | 1,296,188 | | | | 171,732 | |
| ResMed Inc. | | | 755,000 | | | | 160,483 | |
| Insulet Corp.2 | | | 622,000 | | | | 159,002 | |
| NovoCure Ltd.2 | | | 916,689 | | | | 158,624 | |
| Seagen Inc.2 | | | 874,815 | | | | 153,215 | |
| Teladoc Health, Inc.2 | | | 643,000 | | | | 128,574 | |
| Vertex Pharmaceuticals Inc.2 | | | 450,522 | | | | 106,476 | |
| 58 | American Funds Insurance Series |
Growth Fund (continued)
| Common stocks (continued) | | Shares | | | Value
(000) | |
| Health care (continued) | | | | | | | | |
| CRISPR Therapeutics AG2 | | | 652,706 | | | $ | 99,936 | |
| Biohaven Pharmaceutical Holding Co. Ltd.2 | | | 1,068,637 | | | | 91,593 | |
| Abbott Laboratories | | | 643,963 | | | | 70,508 | |
| CVS Health Corp. | | | 862,934 | | | | 58,938 | |
| DexCom, Inc.2 | | | 158,238 | | | | 58,504 | |
| Allakos Inc.2 | | | 401,374 | | | | 56,192 | |
| Cigna Corp. | | | 262,355 | | | | 54,617 | |
| Danaher Corp. | | | 235,935 | | | | 52,411 | |
| Gilead Sciences, Inc. | | | 899,185 | | | | 52,387 | |
| Edwards Lifesciences Corp.2 | | | 569,100 | | | | 51,919 | |
| Galapagos NV1,2 | | | 527,552 | | | | 51,910 | |
| Vir Biotechnology, Inc.2,3 | | | 1,555,475 | | | | 41,656 | |
| Verily Life Sciences LLC1,2,4,5 | | | 300,178 | | | | 41,103 | |
| Catalent, Inc.2 | | | 319,000 | | | | 33,198 | |
| Oak Street Health, Inc.2 | | | 538,184 | | | | 32,915 | |
| Pfizer Inc. | | | 884,714 | | | | 32,566 | |
| Neurocrine Biosciences, Inc.2 | | | 326,200 | | | | 31,266 | |
| Allogene Therapeutics, Inc.2 | | | 1,146,511 | | | | 28,938 | |
| AstraZeneca PLC1 | | | 256,500 | | | | 25,627 | |
| Guardant Health, Inc.2 | | | 196,303 | | | | 25,300 | |
| Incyte Corp.2 | | | 288,800 | | | | 25,120 | |
| Molina Healthcare, Inc.2 | | | 96,799 | | | | 20,587 | |
| Chemed Corp. | | | 37,667 | | | | 20,062 | |
| Mettler-Toledo International Inc.2 | | | 16,900 | | | | 19,261 | |
| Grail, Inc.1,2,4,5,6 | | | 1,864,884 | | | | 18,350 | |
| Eli Lilly and Company | | | 100,800 | | | | 17,019 | |
| Pacific Biosciences of California, Inc.2 | | | 619,579 | | | | 16,072 | |
| Ultragenyx Pharmaceutical Inc.2 | | | 67,100 | | | | 9,289 | |
| Adaptive Biotechnologies Corp.2 | | | 141,048 | | | | 8,340 | |
| Novavax, Inc.2 | | | 72,500 | | | | 8,084 | |
| Global Blood Therapeutics, Inc.2 | | | 125,000 | | | | 5,414 | |
| GoodRx Holdings, Inc., Class A2 | | | 97,500 | | | | 3,933 | |
| Cortexyme, Inc.2,3 | | | 128,600 | | | | 3,573 | |
| Zimmer Biomet Holdings, Inc. | | | 13,800 | | | | 2,126 | |
| | | | | | | | 4,953,451 | |
| | | | | | | | | |
| Industrials 8.44% | | | | | | | | |
| Uber Technologies, Inc.2 | | | 8,501,767 | | | | 433,590 | |
| Delta Air Lines, Inc. | | | 10,425,000 | | | | 419,189 | |
| TransDigm Group Inc.2 | | | 582,800 | | | | 360,666 | |
| MTU Aero Engines AG1 | | | 745,782 | | | | 194,314 | |
| Jacobs Engineering Group Inc. | | | 1,716,000 | | | | 186,975 | |
| CSX Corp. | | | 1,920,800 | | | | 174,313 | |
| United Rentals, Inc.2 | | | 520,800 | | | | 120,779 | |
| Airbus SE, non-registered shares1,2 | | | 944,893 | | | | 103,796 | |
| Middleby Corp.2 | | | 702,000 | | | | 90,502 | |
| Lockheed Martin Corp. | | | 243,441 | | | | 86,417 | |
| Carrier Global Corp. | | | 2,181,661 | | | | 82,292 | |
| ITOCHU Corp.1 | | | 2,545,000 | | | | 73,299 | |
| Dun & Bradstreet Holdings, Inc.2 | | | 2,885,458 | | | | 71,848 | |
| Ryanair Holdings PLC (ADR)2 | | | 634,951 | | | | 69,832 | |
| Ryanair Holdings PLC1,2 | | | 96,554 | | | | 1,923 | |
| Komatsu Ltd.1 | | | 1,995,900 | | | | 54,693 | |
| Honeywell International Inc. | | | 251,344 | | | | 53,461 | |
| Norfolk Southern Corp. | | | 216,936 | | | | 51,546 | |
| Southwest Airlines Co. | | | 1,100,000 | | | | 51,271 | |
| Equifax Inc. | | | 247,800 | | | | 47,786 | |
| Westinghouse Air Brake Technologies Corp. | | | 641,700 | | | | 46,972 | |
| ASGN Inc.2 | | | 560,000 | | | | 46,777 | |
| HEICO Corp. | | | 311,000 | | | | 41,177 | |
| HEICO Corp., Class A | | | 43,500 | | | | 5,092 | |
| Boeing Company | | | 215,302 | | | | 46,088 | |
| American Funds Insurance Series | 59 |
Growth Fund (continued)
| Common stocks (continued) | | Shares | | | Value
(000) | |
| Industrials (continued) | | | | | | | | |
| Armstrong World Industries, Inc. | | | 616,904 | | | $ | 45,892 | |
| Emerson Electric Co. | | | 508,000 | | | | 40,828 | |
| BWX Technologies, Inc. | | | 615,900 | | | | 37,126 | |
| Safran SA1,2 | | | 259,640 | | | | 36,822 | |
| Plug Power Inc.2 | | | 1,054,776 | | | | 35,767 | |
| Parker-Hannifin Corp. | | | 113,931 | | | | 31,036 | |
| AMETEK, Inc. | | | 253,600 | | | | 30,670 | |
| Waste Connections, Inc. | | | 290,200 | | | | 29,766 | |
| FedEx Corp. | | | 99,600 | | | | 25,858 | |
| Caterpillar Inc. | | | 111,500 | | | | 20,295 | |
| Lennox International Inc. | | | 55,533 | | | | 15,214 | |
| Northrop Grumman Corp. | | | 47,900 | | | | 14,596 | |
| Generac Holdings Inc.2 | | | 31,762 | | | | 7,223 | |
| | | | | | | | 3,285,691 | |
| | | | | | | | | |
| Financials 5.43% | | | | | | | | |
| Bank of America Corp. | | | 14,780,700 | | | | 448,003 | |
| First Republic Bank | | | 1,800,955 | | | | 264,614 | |
| Intercontinental Exchange, Inc. | | | 1,735,900 | | | | 200,132 | |
| Berkshire Hathaway Inc., Class B2 | | | 582,700 | | | | 135,111 | |
| Berkshire Hathaway Inc., Class A2 | | | 57 | | | | 19,825 | |
| SVB Financial Group2 | | | 349,456 | | | | 135,529 | |
| BlackRock, Inc. | | | 150,000 | | | | 108,231 | |
| S&P Global Inc. | | | 236,500 | | | | 77,745 | |
| State Street Corp. | | | 973,886 | | | | 70,879 | |
| Marsh & McLennan Companies, Inc. | | | 577,751 | | | | 67,597 | |
| American International Group, Inc. | | | 1,761,110 | | | | 66,676 | |
| JPMorgan Chase & Co. | | | 510,000 | | | | 64,806 | |
| MSCI Inc. | | | 117,900 | | | | 52,646 | |
| London Stock Exchange Group PLC1 | | | 426,339 | | | | 52,553 | |
| Arch Capital Group Ltd.2 | | | 1,326,267 | | | | 47,838 | |
| Capital One Financial Corp. | | | 390,000 | | | | 38,551 | |
| Moody’s Corp. | | | 102,277 | | | | 29,685 | |
| CME Group Inc., Class A | | | 134,493 | | | | 24,484 | |
| Onex Corp. | | | 425,000 | | | | 24,393 | |
| KKR & Co. Inc. | | | 600,300 | | | | 24,306 | |
| Bank of New York Mellon Corp. | | | 559,000 | | | | 23,724 | |
| The Blackstone Group Inc., Class A | | | 360,000 | | | | 23,332 | |
| Aon PLC, Class A | | | 110,000 | | | | 23,240 | |
| East West Bancorp, Inc. | | | 326,417 | | | | 16,553 | |
| Everest Re Group, Ltd. | | | 66,500 | | | | 15,567 | |
| Ares Management Corp., Class A | | | 310,500 | | | | 14,609 | |
| Western Alliance Bancorporation | | | 241,906 | | | | 14,502 | |
| RenaissanceRe Holdings Ltd. | | | 63,000 | | | | 10,447 | |
| BNP Paribas SA1,2 | | | 180,106 | | | | 9,500 | |
| PNC Financial Services Group, Inc. | | | 56,934 | | | | 8,483 | |
| | | | | | | | 2,113,561 | |
| | | | | | | | | |
| Consumer staples 3.22% | | | | | | | | |
| Kroger Co. | | | 8,065,000 | | | | 256,144 | |
| Philip Morris International Inc. | | | 2,996,360 | | | | 248,069 | |
| British American Tobacco PLC1 | | | 3,967,410 | | | | 147,567 | |
| British American Tobacco PLC (ADR) | | | 195,000 | | | | 7,311 | |
| Costco Wholesale Corp. | | | 403,332 | | | | 151,967 | |
| Constellation Brands, Inc., Class A | | | 617,500 | | | | 135,263 | |
| Altria Group, Inc. | | | 2,873,699 | | | | 117,822 | |
| Molson Coors Beverage Company, Class B, restricted voting shares | | | 1,104,700 | | | | 49,921 | |
| Associated British Foods PLC1,2 | | | 1,515,607 | | | | 46,958 | |
| Estée Lauder Companies Inc., Class A | | | 146,800 | | | | 39,077 | |
| Grocery Outlet Holding Corp.2 | | | 529,261 | | | | 20,774 | |
| 60 | American Funds Insurance Series |
Growth Fund (continued)
| Common stocks (continued) | | Shares | | | Value
(000) | |
| Consumer staples (continued) | | | | | | | | |
| Church & Dwight Co., Inc. | | | 151,700 | | | $ | 13,233 | |
| Anheuser-Busch InBev SA/NV1 | | | 162,528 | | | | 11,358 | |
| Monster Beverage Corp.2 | | | 73,900 | | | | 6,834 | |
| | | | | | | | 1,252,298 | |
| | | | | | | | | |
| Materials 3.09% | | | | | | | | |
| Vale SA, ordinary nominative (ADR) | | | 14,554,387 | | | | 243,931 | |
| Wheaton Precious Metals Corp. | | | 3,176,400 | | | | 132,583 | |
| Franco-Nevada Corp. | | | 937,000 | | | | 117,484 | |
| LyondellBasell Industries NV | | | 1,249,142 | | | | 114,496 | |
| Grupo México, SAB de CV, Series B | | | 25,084,100 | | | | 106,037 | |
| Barrick Gold Corp. | | | 4,058,000 | | | | 92,441 | |
| CCL Industries Inc., Class B, nonvoting shares | | | 1,615,000 | | | | 73,321 | |
| Royal Gold, Inc. | | | 517,000 | | | | 54,988 | |
| Sherwin-Williams Company | | | 71,200 | | | | 52,326 | |
| Celanese Corp. | | | 350,400 | | | | 45,531 | |
| CF Industries Holdings, Inc. | | | 979,000 | | | | 37,897 | |
| Allegheny Technologies Inc.2 | | | 2,070,860 | | | | 34,728 | |
| Shin-Etsu Chemical Co., Ltd.1 | | | 194,100 | | | | 33,980 | |
| Linde PLC | | | 120,000 | | | | 31,621 | |
| PPG Industries, Inc. | | | 149,623 | | | | 21,579 | |
| Nucor Corp. | | | 95,800 | | | | 5,096 | |
| Dow Inc. | | | 66,000 | | | | 3,663 | |
| | | | | | | | 1,201,702 | |
| | | | | | | | | |
| Energy 1.66% | | | | | | | | |
| Halliburton Co. | | | 13,300,000 | | | | 251,370 | |
| Canadian Natural Resources, Ltd. (CAD denominated) | | | 5,048,400 | | | | 121,322 | |
| Canadian Natural Resources, Ltd. | | | 105,100 | | | | 2,527 | |
| Cenovus Energy Inc. | | | 12,798,618 | | | | 77,924 | |
| EOG Resources, Inc. | | | 1,139,372 | | | | 56,820 | |
| Suncor Energy Inc. | | | 3,326,066 | | | | 55,787 | |
| ConocoPhillips | | | 527,835 | | | | 21,108 | |
| Concho Resources Inc. | | | 319,500 | | | | 18,643 | |
| Cimarex Energy Co. | | | 435,500 | | | | 16,336 | |
| Equitrans Midstream Corp. | | | 1,858,695 | | | | 14,944 | |
| Schlumberger Ltd. | | | 363,800 | | | | 7,942 | |
| | | | | | | | 644,723 | |
| | | | | | | | | |
| Real estate 0.95% | | | | | | | | |
| Equinix, Inc. REIT | | | 311,485 | | | | 222,456 | |
| American Tower Corp. REIT | | | 349,342 | | | | 78,413 | |
| Park Hotels & Resorts Inc. REIT | | | 2,181,898 | | | | 37,420 | |
| Pebblebrook Hotel Trust REIT | | | 1,660,276 | | | | 31,213 | |
| | | | | | | | 369,502 | |
| | | | | | | | | |
| Utilities 0.55% | | | | | | | | |
| PG&E Corp.2 | | | 7,278,900 | | | | 90,695 | |
| Edison International | | | 751,381 | | | | 47,202 | |
| Xcel Energy Inc. | | | 680,000 | | | | 45,336 | |
| Ørsted AS1 | | | 125,286 | | | | 25,624 | |
| AES Corp. | | | 312,000 | | | | 7,332 | |
| | | | | | | | 216,189 | |
| | | | | | | | | |
| Total common stocks (cost: $16,215,513,000) | | | | | | | 37,173,320 | |
| | | | | | | | | |
| Preferred securities 0.12% | | | | | | | | |
| Information technology 0.12% | | | | | | | | |
| Samsung Electronics Co., Ltd., nonvoting preferred shares1 | | | 654,840 | | | | 44,452 | |
| | | | | | | | | |
| Total preferred securities (cost: $27,479,000) | | | | | | | 44,452 | |
| American Funds Insurance Series | 61 |
Growth Fund (continued)
| Convertible bonds & notes 0.07% | | Principal amount
(000) | | | Value
(000) | |
| Consumer staples 0.07% | | | | | | |
| JUUL Labs, Inc., convertible notes, 7.00% 2025 (100% PIK)1,4,5,7 | | $ | 40,439 | | | $ | 29,464 | |
| | | | | | | | | |
| Total convertible bonds & notes (cost: $40,250,000) | | | | | | | 29,464 | |
| | | | | | | | | |
| Short-term securities 4.19% | | | Shares | | | | | |
| Money market investments 4.19% | | | | | | | | |
| Capital Group Central Cash Fund 0.12%8,9 | | | 16,235,284 | | | | 1,623,691 | |
| Goldman Sachs Financial Square Government Fund, Institutional Shares 0.02%8,10 | | | 6,803,461 | | | | 6,803 | |
| | | | | | | | | |
| Total short-term securities (cost: $1,630,388,000) | | | | | | | 1,630,494 | |
| Total investment securities 99.88% (cost: $17,913,630,000) | | | | | | | 38,877,730 | |
| Other assets less liabilities 0.12% | | | | | | | 46,314 | |
| | | | | | | | | |
| Net assets 100.00% | | | | | | $ | 38,924,044 | |
Investments in affiliates9
| | | Value of
affiliate at
1/1/2020
(000) | | | Additions
(000) | | | Reductions
(000) | | | Net
realized
gain
(000) | | | Net
unrealized
depreciation
(000) | | | Value of
affiliate at
12/31/2020
(000) | | | Dividend
income
(000) | |
| Short-term securities 4.17% | | | | | | | | | | | | | | | | | | | | | | | | | | | | |
| Money market investments 4.17% | | | | | | | | | | | | | | | | | | | | | | | | | | | | |
| Capital Group Central Cash Fund 0.12%8 | | $ | 1,102,492 | | | $ | 7,443,677 | | | $ | 6,923,077 | | | $ | 602 | | | $ | (3 | ) | | $ | 1,623,691 | | | $ | 6,391 | |
| 1 | Valued under fair value procedures adopted by authority of the board of trustees. The total value of all such securities was $2,408,205,000, which represented 6.19% of the net assets of the fund. This amount includes $2,319,288,000 related to certain securities trading outside the U.S. whose values were adjusted as a result of significant market movements following the close of local trading. |
| 2 | Security did not produce income during the last 12 months. |
| 3 | All or a portion of this security was on loan. The total value of all such securities was $7,302,000, which represented .02% of the net assets of the fund. Refer to Note 5 for more information on securities lending. |
| 4 | Value determined using significant unobservable inputs. |
| 5 | Acquired through a private placement transaction exempt from registration under the Securities Act of 1933. May be subject to legal or contractual restrictions on resale. Further details on these holdings appear below. |
| 6 | Acquired in a transaction exempt from registration under Rule 144A of the Securities Act of 1933. May be resold in the U.S. in transactions exempt from registration, normally to qualified institutional buyers. The total value of all such securities was $18,350,000, which represented .05% of the net assets of the fund. |
| 7 | Payment in kind; the issuer has the option of paying additional securities in lieu of cash. Most recent payment was 100% cash unless otherwise noted. 8Rate represents the seven-day yield at 12/31/2020. |
| 9 | Part of the same group of investment companies as the fund as defined under the Investment Company Act of 1940. |
| 10 | Security purchased with cash collateral from securities on loan. Refer to Note 5 for more information on securities lending. |
| Private placement securities | | Acquisition
date(s) | | | Cost
(000) | | | Value
(000) | | | Percent
of net
assets | |
| Verily Life Sciences LLC | | | 12/21/2018 | | | $ | 37,000 | | | $ | 41,103 | | | | .10 | % |
| JUUL Labs, Inc., convertible notes, 7.00% 2025 | | 2/3/2020-11/3/2020 | | | | 40,250 | | | | 29,464 | | | | .08 | |
| Grail, Inc. | | | 4/17/2020 | | | | 9,526 | | | | 18,350 | | | | .05 | |
| Total private placement securities | | | | | | $ | 86,776 | | | $ | 88,917 | | | | .23 | % |
Key To abbreviations
ADR = American Depositary Receipts
CAD = Canadian dollars
EUR = Euros
See notes to financial statements.
| 62 | American Funds Insurance Series |
International Fund
Investment portfolio December 31, 2020
| Common stocks 93.80% | | Shares | | | Value
(000) | |
| Financials 17.06% | | | | | | | | |
| AIA Group Ltd.1 | | | 36,489,500 | | | $ | 449,466 | |
| HDFC Bank Ltd.1,2 | | | 17,086,200 | | | | 336,563 | |
| HDFC Bank Ltd. (ADR)2 | | | 531,294 | | | | 38,392 | |
| Kotak Mahindra Bank Ltd.1,2 | | | 10,657,149 | | | | 291,651 | |
| Ping An Insurance (Group) Company of China, Ltd., Class H1 | | | 11,877,600 | | | | 145,893 | |
| Ping An Insurance (Group) Company of China, Ltd., Class A1 | | | 962,202 | | | | 12,803 | |
| Bank Rakyat Indonesia (Persero) Tbk PT1 | | | 214,873,000 | | | | 63,782 | |
| Sberbank of Russia PJSC (ADR)1 | | | 4,253,000 | | | | 61,311 | |
| XP Inc., Class A2 | | | 1,483,000 | | | | 58,831 | |
| BNP Paribas SA1,2 | | | 847,058 | | | | 44,677 | |
| B3 SA - Brasil, Bolsa, Balcao | | | 3,338,300 | | | | 39,834 | |
| Axis Bank Ltd.1,2 | | | 3,890,055 | | | | 33,115 | |
| Aegon NV1 | | | 7,120,095 | | | | 28,434 | |
| London Stock Exchange Group PLC1 | | | 217,000 | | | | 26,748 | |
| Banco Santander, SA1,2 | | | 7,887,200 | | | | 24,489 | |
| Lufax Holding Ltd. (ADR)2,3 | | | 1,676,700 | | | | 23,809 | |
| PICC Property and Casualty Co. Ltd., Class H1 | | | 26,414,000 | | | | 20,013 | |
| FinecoBank SpA1,2 | | | 1,211,135 | | | | 19,765 | |
| Deutsche Bank AG1,2 | | | 1,715,430 | | | | 18,676 | |
| Bajaj Finance Ltd.1 | | | 244,400 | | | | 17,750 | |
| ING Groep NV1,2 | | | 1,486,000 | | | | 14,077 | |
| IndusInd Bank Ltd.1,2 | | | 941,500 | | | | 11,568 | |
| BOC Hong Kong (Holdings) Ltd.1 | | | 3,739,000 | | | | 11,363 | |
| China Merchants Bank Co., Ltd., Class H1 | | | 1,254,500 | | | | 7,967 | |
| The People’s Insurance Co. (Group) of China Ltd., Class H1 | | | 17,500,000 | | | | 5,560 | |
| | | | | | | | 1,806,537 | |
| | | | | | | | | |
| Consumer discretionary 14.88% | | | | | | | | |
| MercadoLibre, Inc.2 | | | 190,800 | | | | 319,632 | |
| Alibaba Group Holding Ltd.1,2 | | | 8,148,200 | | | | 238,071 | |
| Alibaba Group Holding Ltd. (ADR)2 | | | 17,700 | | | | 4,119 | |
| Sony Corp.1 | | | 1,610,700 | | | | 161,946 | |
| Delivery Hero SE1,2 | | | 854,887 | | | | 132,687 | |
| Galaxy Entertainment Group Ltd.1 | | | 9,203,000 | | | | 71,582 | |
| Meituan, Class B1,2 | | | 1,755,447 | | | | 67,139 | |
| B2W - Cia. Digital, ordinary nominative2 | | | 3,734,000 | | | | 54,354 | |
| Fast Retailing Co., Ltd.1 | | | 58,900 | | | | 52,854 | |
| adidas AG1,2 | | | 138,518 | | | | 50,425 | |
| Evolution Gaming Group AB1 | | | 483,000 | | | | 48,970 | |
| LVMH Moët Hennessy-Louis Vuitton SE1 | | | 72,223 | | | | 45,127 | |
| Kering SA1 | | | 61,638 | | | | 44,811 | |
| Maruti Suzuki India Ltd.1 | | | 422,000 | | | | 44,280 | |
| Melco Resorts & Entertainment Ltd. (ADR) | | | 2,334,881 | | | | 43,312 | |
| Cie. Financière Richemont SA, Class A1 | | | 454,500 | | | | 41,070 | |
| Prosus NV1 | | | 361,000 | | | | 38,834 | |
| Naspers Ltd., Class N1 | | | 147,000 | | | | 30,087 | |
| Flutter Entertainment PLC (GBP denominated)1 | | | 112,374 | | | | 23,266 | |
| H & M Hennes & Mauritz AB, Class B1,2 | | | 768,000 | | | | 16,042 | |
| EssilorLuxottica1 | | | 90,000 | | | | 14,036 | |
| Just Eat Takeaway (GBP denominated)1,2 | | | 79,800 | | | | 9,017 | |
| Astra International Tbk PT1 | | | 19,726,000 | | | | 8,472 | |
| Pan Pacific International Holdings Corp.1 | | | 354,000 | | | | 8,177 | |
| Bandai Namco Holdings Inc.1 | | | 86,442 | | | | 7,482 | |
| | | | | | | | 1,575,792 | |
| | | | | | | | | |
| Health care 14.59% | | | | | | | | |
| Daiichi Sankyo Company, Ltd.1 | | | 6,480,000 | | | | 222,137 | |
| Chugai Pharmaceutical Co., Ltd.1 | | | 3,896,700 | | | | 208,040 | |
| WuXi Biologics (Cayman) Inc.1,2 | | | 13,919,700 | | | | 185,411 | |
| Olympus Corp.1 | | | 4,813,000 | | | | 105,357 | |
| Novartis AG1 | | | 1,008,000 | | | | 95,206 | |
| Grifols, SA, Class A, non-registered shares1,3 | | | 2,691,000 | | | | 78,559 | |
| American Funds Insurance Series | 63 |
International Fund (continued)
| Common stocks (continued) | | Shares | | | Value
(000) | |
| Health care (continued) | | | | | | | | |
| Grifols, SA, Class B (ADR) | | | 793,690 | | | $ | 14,636 | |
| Fresenius SE & Co. KGaA1 | | | 1,959,154 | | | | 90,529 | |
| M3, Inc.1 | | | 882,000 | | | | 83,426 | |
| Hikma Pharmaceuticals PLC1 | | | 2,371,000 | | | | 81,673 | |
| Teva Pharmaceutical Industries Ltd. (ADR)2 | | | 7,216,598 | | | | 69,640 | |
| Alcon Inc.1,2 | | | 872,151 | | | | 58,225 | |
| Aier Eye Hospital Group Co., Ltd., Class A1 | | | 4,254,057 | | | | 48,723 | |
| WuXi AppTec Co., Ltd., Class A1 | | | 2,102,800 | | | | 43,412 | |
| WuXi AppTec Co., Ltd., Class H1 | | | 260,000 | | | | 5,108 | |
| Notre Dame Intermédica Participações SA | | | 3,111,000 | | | | 46,921 | |
| Fresenius Medical Care AG & Co. KGaA1 | | | 325,140 | | | | 27,120 | |
| HOYA Corp.1 | | | 189,100 | | | | 26,139 | |
| Merck KGaA1 | | | 129,000 | | | | 22,112 | |
| Takeda Pharmaceutical Company, Ltd.1 | | | 533,765 | | | | 19,350 | |
| Yunnan Baiyao Group Co., Ltd., Class A1 | | | 790,600 | | | | 13,767 | |
| NMC Health PLC1,2,4 | | | 449,500 | | | | 6 | |
| | | | | | | | 1,545,497 | |
| | | | | | | | | |
| Industrials 11.54% | | | | | | | | |
| Airbus SE, non-registered shares1,2 | | | 2,732,749 | | | | 300,191 | |
| Recruit Holdings Co., Ltd.1 | | | 3,195,109 | | | | 134,014 | |
| Knorr-Bremse AG, non-registered shares1 | | | 847,671 | | | | 115,475 | |
| Melrose Industries PLC1,2 | | | 45,834,933 | | | | 111,783 | |
| Safran SA1,2 | | | 701,300 | | | | 99,459 | |
| NIBE Industrier AB, Class B1 | | | 2,666,589 | | | | 87,563 | |
| Ryanair Holdings PLC (ADR)2 | | | 591,300 | | | | 65,031 | |
| Ryanair Holdings PLC1,2 | | | 348,056 | | | | 6,933 | |
| MTU Aero Engines AG1 | | | 182,000 | | | | 47,420 | |
| Airports of Thailand PCL, foreign registered1 | | | 21,472,000 | | | | 44,267 | |
| Rheinmetall AG1 | | | 381,264 | | | | 40,293 | |
| ASSA ABLOY AB, Class B1 | | | 1,510,047 | | | | 37,142 | |
| International Container Terminal Services, Inc.1 | | | 12,890,350 | | | | 33,159 | |
| CCR SA, ordinary nominative | | | 9,410,222 | | | | 24,403 | |
| Shanghai International Airport Co., Ltd., Class A1 | | | 2,032,685 | | | | 23,527 | |
| Jardine Matheson Holdings Ltd.1 | | | 336,600 | | | | 18,852 | |
| BAE Systems PLC1 | | | 2,510,000 | | | | 16,788 | |
| Brenntag AG1 | | | 77,900 | | | | 6,029 | |
| Rumo SA2 | | | 1,514,700 | | | | 5,611 | |
| Alliance Global Group, Inc.1 | | | 20,000,000 | | | | 4,417 | |
| | | | | | | | 1,222,357 | |
| | | | | | | | | |
| Information technology 8.15% | | | | | | | | |
| StoneCo Ltd., Class A2 | | | 1,215,600 | | | | 102,013 | |
| PagSeguro Digital Ltd., Class A2 | | | 1,743,000 | | | | 99,142 | |
| Nice Ltd. (ADR)2 | | | 263,000 | | | | 74,571 | |
| Nomura Research Institute, Ltd.1 | | | 1,945,500 | | | | 69,515 | |
| Taiwan Semiconductor Manufacturing Company, Ltd.1 | | | 3,433,000 | | | | 64,477 | |
| ASML Holding NV1 | | | 125,945 | | | | 60,864 | |
| Samsung Electronics Co., Ltd.1 | | | 777,000 | | | | 58,071 | |
| Atlassian Corp. PLC, Class A2 | | | 210,500 | | | | 49,230 | |
| Keyence Corp.1 | | | 83,000 | | | | 46,711 | |
| Delta Electronics, Inc.1 | | | 4,812,409 | | | | 44,891 | |
| Silergy Corp.1 | | | 474,000 | | | | 40,636 | |
| OBIC Co., Ltd.1 | | | 172,600 | | | | 34,712 | |
| Oneconnect Financial Technology Co., Ltd. (ADR)2 | | | 1,716,000 | | | | 33,822 | |
| Avast PLC1 | | | 4,289,000 | | | | 31,550 | |
| STMicroelectronics NV1 | | | 631,500 | | | | 23,397 | |
| Hexagon AB, Class B1 | | | 208,900 | | | | 19,023 | |
| Xero Ltd.1,2 | | | 95,031 | | | | 10,819 | |
| | | | | | | | 863,444 | |
| 64 | American Funds Insurance Series |
International Fund (continued)
| Common stocks (continued) | | Shares | | | Value
(000) | |
| Communication services 7.69% | | | | | | | | |
| SoftBank Group Corp.1 | | | 2,723,400 | | | $ | 213,285 | |
| Tencent Holdings Ltd.1 | | | 1,729,587 | | | | 126,376 | |
| Z Holdings Corp.1 | | | 14,787,000 | | | | 89,685 | |
| Square Enix Holdings Co., Ltd.1 | | | 1,251,900 | | | | 75,968 | |
| SoftBank Corp.1 | | | 4,438,300 | | | | 55,641 | |
| Sea Ltd., Class A (ADR)2 | | | 273,600 | | | | 54,460 | |
| Nintendo Co., Ltd.1 | | | 82,500 | | | | 52,651 | |
| Bharti Airtel Ltd.1 | | | 6,879,515 | | | | 48,090 | |
| Altice Europe NV, Class A1,2 | | | 5,269,395 | | | | 34,307 | |
| Altice Europe NV, Class B1,2 | | | 1,077,927 | | | | 6,955 | |
| Bilibili Inc., Class Z (ADR)2 | | | 429,261 | | | | 36,796 | |
| Scout24 AG1 | | | 154,000 | | | | 12,616 | |
| América Móvil, SAB de CV, Series L (ADR) | | | 409,657 | | | | 5,957 | |
| América Móvil, SAB de CV, Series L | | | 2,139,900 | | | | 1,558 | |
| | | | | | | | 814,345 | |
| | | | | | | | | |
| Energy 6.24% | | | | | | | | |
| Reliance Industries Ltd.1 | | | 8,944,564 | | | | 243,658 | |
| Reliance Industries Ltd., interim shares1 | | | 196,599 | | | | 3,015 | |
| Neste Oyj1 | | | 1,676,225 | | | | 121,090 | |
| Royal Dutch Shell PLC, Class B1 | | | 5,001,407 | | | | 86,166 | |
| Royal Dutch Shell PLC, Class A (GBP denominated)1 | | | 620,800 | | | | 11,021 | |
| Canadian Natural Resources, Ltd. (CAD denominated) | | | 2,290,400 | | | | 55,042 | |
| Total SE1,3 | | | 1,147,298 | | | | 49,492 | |
| BP PLC1 | | | 13,959,863 | | | | 48,089 | |
| Cenovus Energy Inc. | | | 6,343,100 | | | | 38,620 | |
| Petróleo Brasileiro SA (Petrobras), ordinary nominative (ADR) | | | 426,000 | | | | 4,784 | |
| | | | | | | | 660,977 | |
| | | | | | | | | |
| Materials 5.26% | | | | | | | | |
| Vale SA, ordinary nominative (ADR) | | | 15,872,642 | | | | 266,026 | |
| Vale SA, ordinary nominative | | | 608,881 | | | | 10,251 | |
| First Quantum Minerals Ltd. | | | 5,508,100 | | | | 98,877 | |
| Shin-Etsu Chemical Co., Ltd.1 | | | 321,400 | | | | 56,265 | |
| Linde PLC (EUR denominated)1 | | | 207,300 | | | | 53,837 | |
| BHP Group PLC1 | | | 976,400 | | | | 25,732 | |
| Akzo Nobel NV1 | | | 118,578 | | | | 12,737 | |
| BASF SE1 | | | 151,600 | | | | 11,971 | |
| CRH PLC1 | | | 250,861 | | | | 10,604 | |
| Koninklijke DSM NV1 | | | 61,300 | | | | 10,560 | |
| | | | | | | | 556,860 | |
| | | | | | | | | |
| Consumer staples 4.32% | | | | | | | | |
| Nestlé SA1 | | | 970,200 | | | | 114,221 | |
| Pernod Ricard SA1 | | | 294,714 | | | | 56,493 | |
| Inner Mongolia Yili Industrial Group Co., Ltd., Class A1 | | | 8,254,713 | | | | 56,087 | |
| Imperial Brands PLC1 | | | 2,046,000 | | | | 42,989 | |
| Kweichow Moutai Co., Ltd., Class A1 | | | 134,543 | | | | 41,115 | |
| British American Tobacco PLC1 | | | 951,000 | | | | 35,372 | |
| Kirin Holdings Company, Ltd.1,3 | | | 1,365,800 | | | | 32,247 | |
| Treasury Wine Estates Ltd.1 | | | 3,771,435 | | | | 27,358 | |
| Heineken NV1 | | | 135,200 | | | | 15,077 | |
| Chocoladefabriken Lindt & Sprüngli AG1 | | | 107 | | | | 10,693 | |
| Shiseido Company, Ltd.1 | | | 152,000 | | | | 10,544 | |
| JBS SA, ordinary nominative | | | 1,811,000 | | | | 8,249 | |
| Dabur India Ltd.1 | | | 980,000 | | | | 7,170 | |
| | | | | | | | 457,615 | |
| American Funds Insurance Series | 65 |
International Fund (continued)
| Common stocks (continued) | | Shares | | | Value
(000) | |
| Utilities 3.28% | | | | | | | | |
| ENN Energy Holdings Ltd.1 | | | 13,250,000 | | | $ | 194,483 | |
| China Gas Holdings Ltd.1 | | | 24,134,000 | | | | 96,227 | |
| E.ON SE1 | | | 5,147,000 | | | | 57,003 | |
| | | | | | | | 347,713 | |
| Real estate 0.79% | | | | | | | | |
| Ayala Land, Inc.1 | | | 54,527,900 | | | | 46,441 | |
| China Overseas Land & Investment Ltd.1 | | | 13,502,000 | | | | 29,371 | |
| CK Asset Holdings Ltd.1 | | | 1,442,000 | | | | 7,417 | |
| | | | | | | | 83,229 | |
| | | | | | | | | |
| Total common stocks (cost: $6,233,438,000) | | | | | | | 9,934,366 | |
| | | | | | | | | |
| Preferred securities 1.19% | | | | | | | | |
| Energy 0.66% | | | | | | | | |
| Petróleo Brasileiro SA (Petrobras), preferred nominative (ADR) | | | 6,336,898 | | | | 70,086 | |
| | | | | | | | | |
| Health care 0.53% | | | | | | | | |
| Grifols, SA, Class B, nonvoting preferred, non-registered shares1 | | | 3,026,230 | | | | 56,376 | |
| | | | | | | | | |
| Total preferred securities (cost: $104,416,000) | | | | | | | 126,462 | |
| | | | | | | | | |
| Rights & warrants 0.40% | | | | | | | | |
| Health care 0.40% | | | | | | | | |
| Aier Eye Hospital Group Co., Ltd., Class A, warrants, expire 20211,5 | | | 1,448,500 | | | | 16,590 | |
| Aier Eye Hospital Group Co., Ltd., Class A, warrants, expire 20211,2,5 | | | 578,554 | | | | 6,527 | |
| WuXi AppTec Co., Ltd., Class A, warrants, expire 20211,5 | | | 896,000 | | | | 18,498 | |
| | | | | | | | 41,615 | |
| | | | | | | | | |
| Consumer discretionary 0.00% | | | | | | | | |
| Cie. Financière Richemont SA, Class A, warrants, expire 20232 | | | 909,000 | | | | 236 | |
| | | | | | | | | |
| Total rights & warrants (cost: $21,623,000) | | | | | | | 41,851 | |
| | | | | | | | | |
| Convertible bonds & notes 0.01% | | Principal amount
(000) | | | | | |
| Health care 0.01% | | | | | | | | |
| NMC Health Jersey Ltd., convertible notes, 1.875% 20256 | | $ | 28,000 | | | | 1,260 | |
| | | | | | | | | |
| Total convertible bonds & notes (cost: $5,855,000) | | | | | | | 1,260 | |
| | | | | | | | | |
| Bonds, notes & other debt instruments 0.17% | | | | | | | | |
| Bonds & notes of governments & government agencies outside the U.S. 0.11% | | | | | | |
| United Mexican States, Series M, 8.00% 2023 | | MXN | 203,000 | | | | 11,204 | |
| | | | | | | | | |
| Corporate bonds, notes & loans 0.06% | | | | | | | | |
| Materials 0.06% | | | | | | | | |
| Vale Overseas Ltd. 3.75% 2030 | | $ | 5,936 | | | | 6,610 | |
| | | | | | | | | |
| Total bonds, notes & other debt instruments (cost: $15,915,000) | | | | | | | 17,814 | |
| 66 | American Funds Insurance Series |
International Fund (continued)
| Short-term securities 5.08% | | Shares | | | Value
(000) | |
| Money market investments 5.08% | | | | | | |
| Capital Group Central Cash Fund 0.12%7,8 | | | 5,237,912 | | | $ | 523,844 | |
| Goldman Sachs Financial Square Government Fund, Institutional Shares 0.02%7,9 | | | 13,975,150 | | | | 13,975 | |
| | | | | | | | | |
| Total short-term securities (cost: $537,755,000) | | | | | | | 537,819 | |
| Total investment securities 100.65% (cost: $6,919,002,000) | | | | | | | 10,659,572 | |
| Other assets less liabilities (0.65)% | | | | | | | (68,714 | ) |
| | | | | | | | | |
| Net assets 100.00% | | | | | | $ | 10,590,858 | |
Forward currency contracts
| Contract amount | | | | | | Unrealized
appreciation
(depreciation) | |
Purchases
(000) | | Sales
(000) | | Counterparty | | Settlement
date | | at 12/31/2020
(000) | |
| GBP18,500 | | USD24,992 | | Citibank | | 1/11/2021 | | | $ | 309 | |
| USD24,907 | | GBP18,500 | | Citibank | | 1/11/2021 | | | | (395 | ) |
| | | | | | | | | | $ | (86 | ) |
Investments in affiliates8
| | | Value of
affiliate at
1/1/2020
(000) | | | Additions
(000) | | | Reductions
(000) | | | Net
realized
gain
(000) | | | Net
unrealized
depreciation
(000) | | | Value of
affiliate at
12/31/2020
(000) | | | Dividend
income
(000) | |
| Short-term securities 4.95% | | | | | | | | | | | | | | | | | | | | | | | | | | | | |
| Money market investments 4.95% | | | | | | | | | | | | | | | | | | | | | | | | | | | | |
| Capital Group Central Cash Fund 0.12%7 | | $ | 544,457 | | | $ | 2,134,592 | | | $ | 2,155,054 | | | $ | 36 | | | $ | (187 | ) | | $ | 523,844 | | | $ | 3,029 | |
| 1 | Valued under fair value procedures adopted by authority of the board of trustees. The total value of all such securities was $8,284,434,000, which represented 78.22% of the net assets of the fund. This amount includes $8,284,428,000 related to certain securities trading outside the U.S. whose values were adjusted as a result of significant market movements following the close of local trading. |
| 2 | Security did not produce income during the last 12 months. |
| 3 | All or a portion of this security was on loan. The total value of all such securities was $83,899,000, which represented .79% of the net assets of the fund. Refer to Note 5 for more information on securities lending. |
| 4 | Value determined using significant unobservable inputs. |
| 5 | Acquired in a transaction exempt from registration under Rule 144A of the Securities Act of 1933. May be resold in the U.S. in transactions exempt from registration, normally to qualified institutional buyers. The total value of all such securities was $41,615,000, which represented .39% of the net assets of the fund. |
| 6 | Scheduled interest and/or principal payment was not received. |
| 7 | Rate represents the seven-day yield at 12/31/2020. |
| 8 | Part of the same group of investment companies as the fund as defined under the Investment Company Act of 1940. |
| 9 | Security purchased with cash collateral from securities on loan. Refer to Note 5 for more information on securities lending. |
Key to abbreviations and symbol
ADR = American Depositary Receipts
CAD = Canadian dollars
EUR = Euros
GBP = British pounds
MXN = Mexican pesos
USD/$ = U.S. dollars
See notes to financial statements.
| American Funds Insurance Series | 67 |
New World Fund
Investment portfolio December 31, 2020
| Common stocks 89.66% | | Shares | | | Value
(000) | |
| Information technology 18.98% | | | | | | | | |
| Microsoft Corp. | | | 410,007 | | | $ | 91,194 | |
| Taiwan Semiconductor Manufacturing Company, Ltd.1 | | | 3,960,000 | | | | 74,375 | |
| PagSeguro Digital Ltd., Class A2 | | | 1,145,350 | | | | 65,147 | |
| StoneCo Ltd., Class A2 | | | 712,435 | | | | 59,788 | |
| Mastercard Inc., Class A | | | 146,107 | | | | 52,151 | |
| PayPal Holdings, Inc.2 | | | 204,345 | | | | 47,858 | |
| Keyence Corp.1 | | | 68,700 | | | | 38,663 | |
| Broadcom Inc. | | | 86,409 | | | | 37,834 | |
| Adobe Inc.2 | | | 67,840 | | | | 33,928 | |
| ASML Holding NV1 | | | 62,856 | | | | 30,376 | |
| Cree, Inc.2 | | | 253,513 | | | | 26,847 | |
| Silergy Corp.1 | | | 307,000 | | | | 26,319 | |
| Samsung Electronics Co., Ltd.1 | | | 308,854 | | | | 23,083 | |
| EPAM Systems, Inc.2 | | | 52,701 | | | | 18,885 | |
| Kingdee International Software Group Co. Ltd.1 | | | 3,135,000 | | | | 12,866 | |
| Accenture PLC, Class A | | | 43,462 | | | | 11,353 | |
| Apple Inc. | | | 82,604 | | | | 10,961 | |
| Visa Inc., Class A | | | 45,355 | | | | 9,920 | |
| Trimble Inc.2 | | | 143,946 | | | | 9,611 | |
| Hexagon AB, Class B1 | | | 91,408 | | | | 8,324 | |
| Oneconnect Financial Technology Co., Ltd. (ADR)2 | | | 417,419 | | | | 8,227 | |
| Tokyo Electron Ltd.1 | | | 18,600 | | | | 6,937 | |
| MediaTek Inc.1 | | | 259,000 | | | | 6,917 | |
| Edenred SA1 | | | 112,405 | | | | 6,378 | |
| Advanced Micro Devices, Inc.2 | | | 67,034 | | | | 6,148 | |
| FleetCor Technologies, Inc.2 | | | 20,916 | | | | 5,706 | |
| Network International Holdings PLC1,2 | | | 1,260,807 | | | | 5,630 | |
| Inphi Corp.2 | | | 32,349 | | | | 5,191 | |
| Atlassian Corp. PLC, Class A2 | | | 20,258 | | | | 4,738 | |
| Chindata Group Holdings Ltd., Class A (ADR)2 | | | 172,368 | | | | 4,130 | |
| Halma PLC1 | | | 121,095 | | | | 4,057 | |
| Autodesk, Inc.2 | | | 12,375 | | | | 3,779 | |
| NetEase, Inc.1 | | | 194,400 | | | | 3,720 | |
| Logitech International SA1 | | | 37,097 | | | | 3,598 | |
| Nokia Corp.1,2 | | | 802,140 | | | | 3,059 | |
| Micron Technology, Inc.2 | | | 39,018 | | | | 2,933 | |
| Cognizant Technology Solutions Corp., Class A | | | 35,343 | | | | 2,896 | |
| ON Semiconductor Corp.2 | | | 82,489 | | | | 2,700 | |
| GDS Holdings Ltd., Class A1,2 | | | 230,900 | | | | 2,691 | |
| Nice Ltd. (ADR)2 | | | 9,355 | | | | 2,652 | |
| Aspen Technology, Inc.2 | | | 19,209 | | | | 2,502 | |
| Elastic NV, non-registered shares2 | | | 15,997 | | | | 2,338 | |
| Globant SA2 | | | 10,638 | | | | 2,315 | |
| Amphenol Corp., Class A | | | 16,828 | | | | 2,201 | |
| Hamamatsu Photonics KK1 | | | 30,700 | | | | 1,758 | |
| SAP SE1 | | | 12,349 | | | | 1,623 | |
| TravelSky Technology Ltd., Class H1 | | | 664,000 | | | | 1,602 | |
| KLA Corp. | | | 5,692 | | | | 1,474 | |
| Hangzhou Hikvision Digital Technology Co., Ltd., Class A1 | | | 193,443 | | | | 1,438 | |
| Intel Corp. | | | 28,781 | | | | 1,434 | |
| CMC Materials, Inc. | | | 8,338 | | | | 1,261 | |
| VeriSign, Inc.2 | | | 5,316 | | | | 1,150 | |
| Amadeus IT Group SA, Class A, non-registered shares1 | | | 14,929 | | | | 1,081 | |
| Vontier Corp.2 | | | 31,087 | | | | 1,038 | |
| Coforge Ltd.1 | | | 20,580 | | | | 765 | |
| | | | | | | | 805,550 | |
| | | | | | | | | |
| Consumer discretionary 14.40% | | | | | | | | |
| MercadoLibre, Inc.2 | | | 53,020 | | | | 88,820 | |
| Alibaba Group Holding Ltd.1,2 | | | 2,075,204 | | | | 60,633 | |
| LVMH Moët Hennessy-Louis Vuitton SE1 | | | 57,683 | | | | 36,042 | |
| Delivery Hero SE1,2 | | | 228,670 | | | | 35,492 | |
| | |
| 68 | American Funds Insurance Series |
New World Fund (continued)
| Common stocks (continued) | | Shares | | | Value
(000) | |
| Consumer discretionary (continued) |
| Naspers Ltd., Class N1 | | | 129,169 | | | $ | 26,437 | |
| General Motors Company | | | 531,686 | | | | 22,139 | |
| Galaxy Entertainment Group Ltd.1 | | | 2,777,000 | | | | 21,600 | |
| Hermès International1 | | | 19,805 | | | | 21,297 | |
| Meituan, Class B1,2 | | | 523,802 | | | | 20,034 | |
| Kering SA1 | | | 26,627 | | | | 19,358 | |
| XPeng Inc., Class A (ADR)2,3 | | | 434,541 | | | | 18,611 | |
| EssilorLuxottica1 | | | 106,218 | | | | 16,565 | |
| Evolution Gaming Group AB1 | | | 158,058 | | | | 16,025 | |
| JD Health International Inc.1,2 | | | 710,150 | | | | 13,741 | |
| adidas AG1,2 | | | 32,858 | | | | 11,961 | |
| Cie. Financière Richemont SA, Class A1 | | | 115,827 | | | | 10,466 | |
| Sony Corp.1 | | | 103,800 | | | | 10,436 | |
| NIKE, Inc., Class B | | | 71,017 | | | | 10,047 | |
| Booking Holdings Inc.2 | | | 4,420 | | | | 9,845 | |
| Gree Electric Appliances, Inc. of Zhuhai, Class A1 | | | 895,846 | | | | 8,504 | |
| Li Ning Co. Ltd.1 | | | 1,231,501 | | | | 8,484 | |
| Pop Mart International Group Ltd.1,2 | | | 778,200 | | | | 8,166 | |
| Melco Resorts & Entertainment Ltd. (ADR) | | | 411,713 | | | | 7,637 | |
| IDP Education Ltd.1 | | | 418,781 | | | | 6,415 | |
| Jumbo SA1 | | | 362,261 | | | | 6,308 | |
| Astra International Tbk PT1 | | | 14,461,800 | | | | 6,211 | |
| YUM! Brands, Inc. | | | 52,525 | | | | 5,702 | |
| Wyndham Hotels & Resorts, Inc. | | | 95,196 | | | | 5,659 | |
| Marriott International, Inc., Class A | | | 42,036 | | | | 5,545 | |
| JD.com, Inc., Class A1,2 | | | 120,550 | | | | 5,309 | |
| Zhongsheng Group Holdings Ltd.1 | | | 683,500 | | | | 4,873 | |
| Midea Group Co., Ltd., Class A1 | | | 307,835 | | | | 4,642 | |
| Fast Retailing Co., Ltd.1 | | | 4,900 | | | | 4,397 | |
| Suzuki Motor Corp.1 | | | 86,400 | | | | 4,011 | |
| Wynn Macau, Ltd.1,2 | | | 2,336,800 | | | | 3,929 | |
| Ferrari NV1 | | | 14,576 | | | | 3,371 | |
| China MeiDong Auto Holdings Ltd.1 | | | 816,000 | | | | 3,318 | |
| Prosus NV1 | | | 30,717 | | | | 3,304 | |
| Industria de Diseño Textil, SA1 | | | 101,889 | | | | 3,244 | |
| Samsonite International SA1,2 | | | 1,787,100 | | | | 3,175 | |
| Allegro.eu1,2 | | | 136,887 | | | | 3,111 | |
| Maruti Suzuki India Ltd.1 | | | 28,401 | | | | 2,980 | |
| Domino’s Pizza, Inc. | | | 7,473 | | | | 2,866 | |
| Flutter Entertainment PLC (GBP denominated)1 | | | 12,491 | | | | 2,586 | |
| Hyundai Motor Co.1 | | | 12,662 | | | | 2,246 | |
| Shangri-La Asia Ltd.1,2 | | | 2,212,000 | | | | 1,973 | |
| Aptiv PLC | | | 14,036 | | | | 1,829 | |
| InterContinental Hotels Group PLC1,2 | | | 26,077 | | | | 1,694 | |
| Airbnb, Inc., Class A2 | | | 10,563 | | | | 1,551 | |
| Lojas Americanas SA, ordinary nominative | | | 384,328 | | | | 1,513 | |
| Entain PLC1,2 | | | 94,780 | | | | 1,471 | |
| Peugeot SA1,2 | | | 39,005 | | | | 1,068 | |
| Vivo Energy PLC1 | | | 919,486 | | | | 1,063 | |
| Dada Nexus Ltd. (ADR)2,3 | | | 25,200 | | | | 920 | |
| Levi Strauss & Co., Class A | | | 45,515 | | | | 914 | |
| Wynn Resorts, Ltd. | | | 7,397 | | | | 835 | |
| Bayerische Motoren Werke AG1 | | | 6,118 | | | | 540 | |
| | | | | | | | 610,913 | |
| | | | | | | | | |
| Health care 12.35% | | | | | | | | |
| Zai Lab Ltd. (ADR)2 | | | 384,191 | | | | 51,996 | |
| Thermo Fisher Scientific Inc. | | | 83,711 | | | | 38,991 | |
| WuXi Biologics (Cayman) Inc.1,2 | | | 2,647,600 | | | | 35,266 | |
| Carl Zeiss Meditec AG, non-registered shares1 | | | 205,241 | | | | 27,310 | |
| WuXi AppTec Co., Ltd., Class A1 | | | 871,716 | | | | 17,996 | |
| WuXi AppTec Co., Ltd., Class H1 | | | 459,100 | | | | 9,020 | |
| | |
| American Funds Insurance Series | 69 |
New World Fund (continued)
| Common stocks (continued) | | Shares | | | Value
(000) | |
| Health care (continued) |
| AstraZeneca PLC1 | | | 232,864 | | | $ | 23,265 | |
| Notre Dame Intermédica Participações SA | | | 1,465,403 | | | | 22,102 | |
| Abbott Laboratories | | | 200,515 | | | | 21,954 | |
| BioMarin Pharmaceutical Inc.2 | | | 179,080 | | | | 15,704 | |
| PerkinElmer, Inc. | | | 107,200 | | | | 15,383 | |
| Asahi Intecc Co., Ltd.1 | | | 412,600 | | | | 15,062 | |
| bioMérieux SA1 | | | 95,915 | | | | 13,526 | |
| Jiangsu Hengrui Medicine Co., Ltd., Class A1 | | | 779,198 | | | | 13,311 | |
| BeiGene, Ltd. (ADR)2 | | | 46,796 | | | | 12,091 | |
| BeiGene, Ltd.1,2 | | | 54,000 | | | | 1,086 | |
| CSL Ltd.1 | | | 57,968 | | | | 12,666 | |
| Pharmaron Beijing Co., Ltd., Class H1 | | | 431,200 | | | | 7,308 | |
| Pharmaron Beijing Co., Ltd., Class A1 | | | 265,800 | | | | 4,894 | |
| Aier Eye Hospital Group Co., Ltd., Class A1 | | | 1,033,827 | | | | 11,841 | |
| Yunnan Baiyao Group Co., Ltd., Class A1 | | | 679,100 | | | | 11,826 | |
| Koninklijke Philips NV (EUR denominated)1,2 | | | 205,320 | | | | 10,988 | |
| Shionogi & Co., Ltd.1 | | | 179,300 | | | | 9,801 | |
| Olympus Corp.1 | | | 440,900 | | | | 9,651 | |
| Novo Nordisk A/S, Class B1 | | | 111,509 | | | | 7,800 | |
| Hypera SA, ordinary nominative | | | 1,156,915 | | | | 7,629 | |
| Hugel, Inc.1,2 | | | 43,840 | | | | 7,585 | |
| CanSino Biologics Inc., Class H1,2 | | | 323,600 | | | | 7,406 | |
| Straumann Holding AG1 | | | 6,192 | | | | 7,211 | |
| Guangzhou Kingmed Diagnostics Group Co., Ltd., Class A1 | | | 346,233 | | | | 6,802 | |
| Pfizer Inc. | | | 171,061 | | | | 6,297 | |
| Hangzhou Tigermed Consulting Co., Ltd., Class A1 | | | 227,271 | | | | 5,632 | |
| Teva Pharmaceutical Industries Ltd. (ADR)2 | | | 573,624 | | | | 5,536 | |
| Novartis AG1 | | | 55,224 | | | | 5,216 | |
| Zoetis Inc., Class A | | | 31,037 | | | | 5,137 | |
| Alibaba Health Information Technology Ltd.1,2 | | | 1,650,600 | | | | 4,898 | |
| Hikma Pharmaceuticals PLC1 | | | 135,368 | | | | 4,663 | |
| Medtronic PLC | | | 39,620 | | | | 4,641 | |
| Danaher Corp. | | | 20,736 | | | | 4,606 | |
| HOYA Corp.1 | | | 27,600 | | | | 3,815 | |
| Baxter International Inc. | | | 47,480 | | | | 3,810 | |
| Alcon Inc.1,2 | | | 55,002 | | | | 3,672 | |
| Grifols, SA, Class A, non-registered shares1 | | | 84,195 | | | | 2,458 | |
| Grifols, SA, Class B (ADR) | | | 30,657 | | | | 565 | |
| Mettler-Toledo International Inc.2 | | | 1,661 | | | | 1,893 | |
| Lupin Ltd.1 | | | 140,828 | | | | 1,885 | |
| OdontoPrev SA, ordinary nominative | | | 554,693 | | | | 1,554 | |
| Viatris Inc.2 | | | 21,294 | | | | 399 | |
| NMC Health PLC1,2,4 | | | 49,400 | | | | 1 | |
| | | | | | | | 524,149 | |
| | | | | | | | | |
| Financials 11.00% | | | | | | | | |
| Kotak Mahindra Bank Ltd.1,2 | | | 2,768,189 | | | | 75,756 | |
| AIA Group Ltd.1 | | | 4,488,200 | | | | 55,284 | |
| HDFC Bank Ltd.1,2 | | | 2,384,834 | | | | 46,976 | |
| HDFC Bank Ltd. (ADR)2 | | | 76,097 | | | | 5,499 | |
| B3 SA - Brasil, Bolsa, Balcao | | | 2,627,316 | | | | 31,351 | |
| Société Générale1,2 | | | 1,218,593 | | | | 25,386 | |
| XP Inc., Class A2 | | | 480,952 | | | | 19,079 | |
| Bajaj Finance Ltd.1 | | | 261,996 | | | | 19,028 | |
| Capitec Bank Holdings Ltd.1,2 | | | 185,645 | | | | 18,091 | |
| Sberbank of Russia PJSC (ADR)1 | | | 1,012,500 | | | | 14,596 | |
| Sberbank of Russia PJSC (ADR) | | | 226,687 | | | | 3,287 | |
| Ping An Insurance (Group) Company of China, Ltd., Class H1 | | | 1,371,300 | | | | 16,844 | |
| Ping An Insurance (Group) Company of China, Ltd., Class A1 | | | 36,100 | | | | 480 | |
| UniCredit SpA1,2 | | | 1,762,672 | | | | 16,312 | |
| HDFC Life Insurance Company Ltd.1,2 | | | 1,109,818 | | | | 10,295 | |
| ICICI Bank Ltd. (ADR)2 | | | 495,101 | | | | 7,357 | |
| | |
| 70 | American Funds Insurance Series |
New World Fund (continued)
| Common stocks (continued) | | Shares | | | Value
(000) | |
| Financials (continued) | | | | | | | | |
| ICICI Bank Ltd.1,2 | | | 384,782 | | | $ | 2,825 | |
| Moody’s Corp. | | | 31,860 | | | | 9,247 | |
| Banco Bilbao Vizcaya Argentaria, SA1 | | | 1,830,437 | | | | 8,973 | |
| Hong Kong Exchanges and Clearing Ltd.1 | | | 153,700 | | | | 8,454 | |
| S&P Global Inc. | | | 22,691 | | | | 7,459 | |
| Discovery Ltd.1 | | | 565,192 | | | | 5,849 | |
| Bajaj Finserv Ltd.1 | | | 45,189 | | | | 5,518 | |
| Fairfax Financial Holdings Ltd., subordinate voting shares | | | 15,658 | | | | 5,337 | |
| TCS Group Holding PLC (GDR)1,5 | | | 140,222 | | | | 4,584 | |
| TCS Group Holding PLC (GDR)1 | | | 1,553 | | | | 51 | |
| Bank Central Asia Tbk PT1 | | | 1,879,300 | | | | 4,528 | |
| Lufax Holding Ltd. (ADR)2 | | | 291,670 | | | | 4,142 | |
| China Merchants Bank Co., Ltd., Class H1 | | | 605,500 | | | | 3,845 | |
| UBS Group AG1 | | | 225,557 | | | | 3,155 | |
| AU Small Finance Bank Ltd.1,2 | | | 259,859 | | | | 3,050 | |
| Moscow Exchange MICEX-RTS PJSC1 | | | 1,404,664 | | | | 3,031 | |
| Eurobank Ergasias Services and Holdings SA1,2 | | | 4,206,715 | | | | 2,978 | |
| PICC Property and Casualty Co. Ltd., Class H1 | | | 3,623,000 | | | | 2,745 | |
| Alpha Bank SA1,2 | | | 2,100,154 | | | | 2,453 | |
| Chubb Ltd. | | | 15,529 | | | | 2,390 | |
| The People’s Insurance Co. (Group) of China Ltd., Class H1 | | | 6,833,000 | | | | 2,171 | |
| Axis Bank Ltd.1,2 | | | 219,958 | | | | 1,872 | |
| BB Seguridade Participações SA | | | 273,314 | | | | 1,559 | |
| Bank of the Philippine Islands1 | | | 839,100 | | | | 1,424 | |
| Kasikornbank PCL, foreign registered1 | | | 345,200 | | | | 1,318 | |
| Banco Santander México, SA, Institución de Banca Múltiple, Grupo Financiero Santander México, Class B2 | | | 1,278,484 | | | | 1,305 | |
| Credicorp Ltd. | | | 4,951 | | | | 812 | |
| | | | | | | | 466,696 | |
| | | | | | | | | |
| Communication services 8.28% | | | | | | | | |
| Tencent Holdings Ltd.1 | | | 1,058,700 | | | | 77,356 | |
| Sea Ltd., Class A (ADR)2 | | | 259,149 | | | | 51,584 | |
| Facebook, Inc., Class A2 | | | 183,040 | | | | 49,999 | |
| Alphabet Inc., Class C2 | | | 22,802 | | | | 39,946 | |
| Alphabet Inc., Class A2 | | | 3,487 | | | | 6,112 | |
| Netflix, Inc.2 | | | 48,388 | | | | 26,165 | |
| Yandex NV, Class A2 | | | 283,230 | | | | 19,707 | |
| América Móvil, SAB de CV, Series L (ADR) | | | 1,066,269 | | | | 15,504 | |
| Electronic Arts Inc. | | | 92,639 | | | | 13,303 | |
| Activision Blizzard, Inc. | | | 126,033 | | | | 11,702 | |
| Bharti Airtel Ltd.1 | | | 892,598 | | | | 6,239 | |
| Indus Towers Ltd.1 | | | 1,872,343 | | | | 5,909 | |
| Vodafone Group PLC1 | | | 3,261,452 | | | | 5,367 | |
| JOYY Inc., Class A (ADR) | | | 53,334 | | | | 4,266 | |
| Bilibili Inc., Class Z (ADR)2 | | | 47,070 | | | | 4,035 | |
| MTN Group Ltd.1 | | | 943,276 | | | | 3,868 | |
| China Tower Corp. Ltd., Class H1 | | | 23,738,000 | | | | 3,494 | |
| SoftBank Group Corp.1 | | | 39,400 | | | | 3,086 | |
| Informa PLC1 | | | 186,868 | | | | 1,404 | |
| JCDecaux SA1,2 | | | 48,473 | | | | 1,107 | |
| Telkom Indonesia (Persero) Tbk PT, Class B1 | | | 4,360,300 | | | | 1,029 | |
| | | | | | | | 351,182 | |
| | | | | | | | | |
| Materials 5.95% | | | | | | | | |
| Vale SA, ordinary nominative | | | 1,721,168 | | | | 28,977 | |
| Vale SA, ordinary nominative (ADR) | | | 1,497,718 | | | | 25,102 | |
| First Quantum Minerals Ltd. | | | 1,278,353 | | | | 22,948 | |
| Sika AG1 | | | 70,329 | | | | 19,200 | |
| Asian Paints Ltd.1 | | | 499,171 | | | | 18,927 | |
| Freeport-McMoRan Inc. | | | 394,687 | | | | 10,270 | |
| Shin-Etsu Chemical Co., Ltd.1 | | | 56,900 | | | | 9,961 | |
| | |
| American Funds Insurance Series | 71 |
New World Fund (continued)
| Common stocks (continued) | | Shares | | | Value
(000) | |
| Materials (continued) | | | | | | | | |
| Rio Tinto PLC1 | | | 106,811 | | | $ | 7,992 | |
| Linde PLC | | | 29,913 | | | | 7,882 | |
| LANXESS AG1 | | | 98,732 | | | | 7,571 | |
| Koninklijke DSM NV1 | | | 39,449 | | | | 6,796 | |
| Givaudan SA1 | | | 1,578 | | | | 6,647 | |
| AngloGold Ashanti Ltd. (ADR) | | | 210,144 | | | | 4,753 | |
| AngloGold Ashanti Ltd.1 | | | 70,895 | | | | 1,621 | |
| Gerdau SA (ADR) | | | 1,298,914 | | | | 6,066 | |
| Shree Cement Ltd.1 | | | 18,011 | | | | 5,933 | |
| Arkema SA1 | | | 44,846 | | | | 5,126 | |
| BHP Group PLC1 | | | 192,429 | | | | 5,071 | |
| CCL Industries Inc., Class B, nonvoting shares | | | 93,655 | | | | 4,252 | |
| Umicore SA1 | | | 87,348 | | | | 4,196 | |
| Air Liquide SA, non-registered shares1 | | | 25,294 | | | | 4,151 | |
| Akzo Nobel NV1 | | | 36,592 | | | | 3,931 | |
| Loma Negra Compania Industrial Argentina SA (ADR) | | | 599,550 | | | | 3,687 | |
| BASF SE1 | | | 45,331 | | | | 3,580 | |
| Alrosa PJSC1 | | | 2,643,724 | | | | 3,515 | |
| Barrick Gold Corp. | | | 142,586 | | | | 3,248 | |
| Beijing Oriental Yuhong Waterproof Technology Co., Ltd., Class A1 | | | 546,193 | | | | 3,242 | |
| Chr. Hansen Holding A/S1,2 | | | 27,666 | | | | 2,847 | |
| SIG Combibloc Group AG1 | | | 122,353 | | | | 2,834 | |
| Huntsman Corp. | | | 103,725 | | | | 2,608 | |
| Turquoise Hill Resources Ltd.2 | | | 156,812 | | | | 1,948 | |
| Turquoise Hill Resources Ltd. (CAD denominated)2 | | | 49,730 | | | | 618 | |
| Amcor PLC (CDI)1 | | | 162,847 | | | | 1,934 | |
| Celanese Corp. | | | 14,743 | | | | 1,916 | |
| Dow Inc. | | | 32,269 | | | | 1,791 | |
| Asahi Kasei Corp.1 | | | 130,400 | | | | 1,341 | |
| | | | | | | | 252,482 | |
| | | | | | | | | |
| Industrials 5.91% | | | | | | | | |
| Shanghai International Airport Co., Ltd., Class A1 | | | 2,560,277 | | | | 29,634 | |
| Airbus SE, non-registered shares1,2 | | | 244,231 | | | | 26,829 | |
| Safran SA1,2 | | | 162,243 | | | | 23,009 | |
| CCR SA, ordinary nominative | | | 8,621,584 | | | | 22,358 | |
| Wizz Air Holdings PLC1,2 | | | 220,032 | | | | 13,742 | |
| IMCD NV1 | | | 99,924 | | | | 12,696 | |
| International Container Terminal Services, Inc.1 | | | 4,297,260 | | | | 11,054 | |
| DSV Panalpina A/S1 | | | 64,161 | | | | 10,738 | |
| SMC Corp.1 | | | 16,500 | | | | 10,077 | |
| Rumo SA2 | | | 2,191,897 | | | | 8,119 | |
| Nidec Corp.1 | | | 56,800 | | | | 7,157 | |
| TransDigm Group Inc.2 | | | 11,118 | | | | 6,880 | |
| Ryanair Holdings PLC (ADR)2 | | | 52,278 | | | | 5,750 | |
| Fortive Corp. | | | 76,735 | | | | 5,434 | |
| Daikin Industries, Ltd.1 | | | 23,300 | | | | 5,189 | |
| Han’s Laser Technology Industry Group Co., Ltd., Class A1 | | | 771,125 | | | | 5,053 | |
| Airports of Thailand PCL, foreign registered1 | | | 2,363,200 | | | | 4,872 | |
| Spirax-Sarco Engineering PLC1 | | | 28,754 | | | | 4,444 | |
| Centre Testing International Group Co., Ltd.1 | | | 1,056,096 | | | | 4,427 | |
| Copa Holdings, SA, Class A | | | 48,964 | | | | 3,782 | |
| Jardine Matheson Holdings Ltd.1 | | | 59,000 | | | | 3,305 | |
| Guangzhou Baiyun International Airport Co. Ltd., Class A1 | | | 1,501,303 | | | | 3,245 | |
| Epiroc AB, Class B1 | | | 178,529 | | | | 3,025 | |
| A-Living Smart City Services Co., Ltd., Class H1 | | | 659,500 | | | | 2,938 | |
| Boeing Company | | | 11,550 | | | | 2,472 | |
| ABB Ltd.1 | | | 83,200 | | | | 2,327 | |
| Komatsu Ltd.1 | | | 81,500 | | | | 2,233 | |
| Experian PLC1 | | | 56,793 | | | | 2,164 | |
| Air Lease Corp., Class A | | | 43,452 | | | | 1,930 | |
| Hefei Meyer Optoelectronic Technology Inc., Class A1 | | | 254,600 | | | | 1,728 | |
| | |
| 72 | American Funds Insurance Series |
New World Fund (continued)
| Common stocks (continued) | | Shares | | | Value
(000) | |
| Industrials (continued) | | | | | | | | |
| Atlas Copco AB, Class B1 | | | 37,156 | | | $ | 1,669 | |
| Havells India Ltd.1 | | | 126,664 | | | | 1,589 | |
| Carrier Global Corp. | | | 23,873 | | | | 901 | |
| | | | | | | | 250,770 | |
| | | | | | | | | |
| Consumer staples 5.71% | | | | | | | | |
| Kweichow Moutai Co., Ltd., Class A1 | | | 253,607 | | | | 77,500 | |
| Nestlé SA1 | | | 162,495 | | | | 19,130 | |
| Foshan Haitian Flavouring and Food Co. Ltd., Class A1 | | | 597,861 | | | | 18,388 | |
| Nongfu Spring Co., Ltd., Class H1,2,3 | | | 2,018,605 | | | | 14,354 | |
| Anheuser-Busch InBev SA/NV1 | | | 176,745 | | | | 12,351 | |
| Carlsberg A/S, Class B1 | | | 55,396 | | | | 8,881 | |
| Raia Drogasil SA, ordinary nominative | | | 1,594,597 | | | | 7,687 | |
| Pernod Ricard SA1 | | | 39,282 | | | | 7,530 | |
| Avenue Supermarts Ltd.1,2 | | | 142,505 | | | | 5,389 | |
| Mondelez International, Inc. | | | 85,994 | | | | 5,028 | |
| Reckitt Benckiser Group PLC1 | | | 53,352 | | | | 4,772 | |
| Fomento Económico Mexicano, SAB de CV | | | 618,449 | | | | 4,672 | |
| Unilever PLC1 | | | 76,805 | | | | 4,623 | |
| British American Tobacco PLC1 | | | 117,770 | | | | 4,380 | |
| United Spirits Ltd.1,2 | | | 535,599 | | | | 4,246 | |
| Wal-Mart de México, SAB de CV, Series V | | | 1,351,284 | | | | 3,801 | |
| Shiseido Company, Ltd.1 | | | 50,800 | | | | 3,524 | |
| Inner Mongolia Yili Industrial Group Co., Ltd., Class A1 | | | 513,300 | | | | 3,488 | |
| ITC Ltd.1 | | | 1,169,574 | | | | 3,350 | |
| Heineken NV1 | | | 27,072 | | | | 3,019 | |
| Kimberly-Clark de México, SAB de CV, Class A | | | 1,647,040 | | | | 2,813 | |
| Jonjee Hi-Tech Industrial and Commercial Holding Co., Ltd., Class A1 | | | 266,585 | | | | 2,725 | |
| Constellation Brands, Inc., Class A | | | 11,586 | | | | 2,538 | |
| Uni-Charm Corp.1 | | | 52,100 | | | | 2,472 | |
| L’Oréal SA, non-registered shares1 | | | 6,491 | | | | 2,466 | |
| Kirin Holdings Company, Ltd.1 | | | 89,700 | | | | 2,118 | |
| Herbalife Nutrition Ltd.2 | | | 41,972 | | | | 2,017 | |
| Japan Tobacco Inc.1,3 | | | 97,300 | | | | 1,983 | |
| Colgate-Palmolive Company | | | 18,811 | | | | 1,609 | |
| Danone SA1 | | | 21,048 | | | | 1,383 | |
| McCormick & Co., Inc., nonvoting shares | | | 13,126 | | | | 1,255 | |
| JBS SA, ordinary nominative | | | 259,002 | | | | 1,180 | |
| Chengdu Hongqi Chain Co., Ltd.1 | | | 1,109,901 | | | | 1,124 | |
| Diageo PLC1 | | | 11,617 | | | | 459 | |
| | | | | | | | 242,255 | |
| | | | | | | | | |
| Energy 3.77% | | | | | | | | |
| Reliance Industries Ltd.1 | | | 2,911,135 | | | | 79,302 | |
| Reliance Industries Ltd., interim shares1 | | | 152,741 | | | | 2,343 | |
| Petróleo Brasileiro SA (Petrobras), ordinary nominative (ADR) | | | 3,866,812 | | | | 43,424 | |
| Royal Dutch Shell PLC, Class B1 | | | 446,106 | | | | 7,686 | |
| Rosneft Oil Company PJSC (GDR)1 | | | 1,301,724 | | | | 7,340 | |
| New Fortress Energy Inc., Class A | | | 96,956 | | | | 5,196 | |
| Gazprom PJSC (ADR)1 | | | 780,774 | | | | 4,341 | |
| Schlumberger Ltd. | | | 172,397 | | | | 3,763 | |
| Total SE1,3 | | | 74,483 | | | | 3,213 | |
| Chevron Corp. | | | 31,798 | | | | 2,685 | |
| United Tractors Tbk PT1 | | | 326,800 | | | | 620 | |
| | | | | | | | 159,913 | |
| | | | | | | | | |
| Real estate 1.68% | | | | | | | | |
| American Tower Corp. REIT | | | 45,257 | | | | 10,158 | |
| Shimao Services Holdings Ltd.1,2 | | | 6,203,187 | | | | 9,570 | |
| ESR Cayman Ltd.1,2 | | | 2,262,400 | | | | 8,131 | |
| CK Asset Holdings Ltd.1 | | | 1,249,500 | | | | 6,427 | |
| BR Malls Participacoes SA, ordinary nominative2 | | | 3,304,622 | | | | 6,298 | |
| | |
| American Funds Insurance Series | 73 |
New World Fund (continued)
| Common stocks (continued) | | Shares | | | Value
(000) | |
| Real estate (continued) | | | | | | | | |
| Ayala Land, Inc.1 | | | 6,681,900 | | | $ | 5,691 | |
| KE Holdings Inc., Class A (ADR)2 | | | 87,058 | | | | 5,358 | |
| CIFI Holdings (Group) Co. Ltd.1 | | | 5,873,674 | | | | 4,981 | |
| Embassy Office Parks REIT1 | | | 939,200 | | | | 4,435 | |
| Shimao Group Holdings Ltd.1 | | | 1,282,000 | | | | 4,099 | |
| China Overseas Land & Investment Ltd.1 | | | 1,464,500 | | | | 3,186 | |
| Longfor Group Holdings Ltd.1 | | | 495,000 | | | | 2,907 | |
| | | | | | | | 71,241 | |
| | | | | | | | | |
| Utilities 1.63% | | | | | | | | |
| ENN Energy Holdings Ltd.1 | | | 1,619,800 | | | | 23,776 | |
| China Gas Holdings Ltd.1 | | | 5,533,000 | | | | 22,061 | |
| AES Corp. | | | 345,838 | | | | 8,127 | |
| China Resources Gas Group Ltd.1 | | | 1,092,000 | | | | 5,808 | |
| Enel SpA1 | | | 515,991 | | | | 5,211 | |
| Engie SA1,2 | | | 275,227 | | | | 4,214 | |
| | | | | | | | 69,197 | |
| | | | | | | | | |
| Total common stocks (cost: $2,195,857,000) | | | | | | | 3,804,348 | |
| | | | | | | | | |
| Preferred securities 1.14% | | | | | | | | |
| Industrials 0.31% | | | | | | | | |
| Azul SA, preferred nominative (ADR)2,3 | | | 357,605 | | | | 8,161 | |
| GOL Linhas Aéreas Inteligentes SA, preferred nominative2 | | | 847,943 | | | | 4,071 | |
| GOL Linhas Aéreas Inteligentes SA, preferred nominative (ADR)2 | | | 72,525 | | | | 712 | |
| | | | | | | | 12,944 | |
| | | | | | | | | |
| Materials 0.29% | | | | | | | | |
| Gerdau SA, preferred nominative | | | 2,652,635 | | | | 12,487 | |
| | | | | | | | | |
| Consumer discretionary 0.22% | | | | | | | | |
| Volkswagen AG, nonvoting preferred shares1 | | | 35,834 | | | | 6,676 | |
| Lojas Americanas SA, preferred nominative | | | 489,555 | | | | 2,478 | |
| | | | | | | | 9,154 | |
| | | | | | | | | |
| Health care 0.10% | | | | | | | | |
| Grifols, SA, Class B, nonvoting preferred, non-registered shares1 | | | 235,609 | | | | 4,389 | |
| | | | | | | | | |
| Consumer staples 0.07% | | | | | | | | |
| Henkel AG & Co. KGaA, nonvoting preferred shares1 | | | 27,859 | | | | 3,139 | |
| | | | | | | | | |
| Information technology 0.07% | | | | | | | | |
| Samsung Electronics Co., Ltd., nonvoting preferred shares1 | | | 44,182 | | | | 2,999 | |
| | | | | | | | | |
| Energy 0.05% | | | | | | | | |
| Petróleo Brasileiro SA (Petrobras), preferred nominative (ADR) | | | 101,360 | | | | 1,121 | |
| Petróleo Brasileiro SA (Petrobras), preferred nominative | | | 182,615 | | | | 997 | |
| | | | | | | | 2,118 | |
| | | | | | | | | |
| Financials 0.03% | | | | | | | | |
| Itaúsa SA, preferred nominative | | | 525,633 | | | | 1,187 | |
| | | | | | | | | |
| Real estate 0.00% | | | | | | | | |
| Ayala Land, Inc., preferred shares1,2,4 | | | 15,000,000 | | | | — | 6 |
| | | | | | | | | |
| Total preferred securities (cost: $30,866,000) | | | | | | | 48,417 | |
| | |
| 74 | American Funds Insurance Series |
New World Fund (continued)
| Rights & warrants 0.27% | | Shares | | | Value
(000) | |
| Consumer staples 0.25% | | | | | | | | |
| Foshan Haitian Flavouring and Food Co., Ltd., Class A, warrants, expire 20221,5 | | | 336,160 | | | $ | 10,339 | |
| | | | | | | | | |
| Health care 0.02% | | | | | | | | |
| Aier Eye Hospital Group Co., Ltd., Class A, warrants, expire 20211,5 | | | 54,200 | | | | 621 | |
| Aier Eye Hospital Group Co., Ltd., Class A, warrants, expire 20211,2,5 | | | 21,625 | | | | 244 | |
| | | | | | | | 865 | |
| | | | | | | | | |
| Consumer discretionary 0.00% | | | | | | | | |
| Cie. Financière Richemont SA, Class A, warrants, expire 20232 | | | 144,354 | | | | 37 | |
| | | | | | | | | |
| Total rights & warrants (cost: $3,236,000) | | | | | | | 11,241 | |
| | | | | | | | | |
| Convertible bonds & notes 0.00% | | Principal amount
(000 | ) | | | | |
| Health care 0.00% | | | | | | | | |
| BioMarin Pharmaceutical Inc., convertible bonds, 1.25% 20275 | | $ | 114 | | | | 120 | |
| | | | | | | | | |
| Total convertible bonds & notes (cost: $121,000) | | | | | | | 120 | |
| | | | | | | | | |
| Bonds, notes & other debt instruments 2.83% | | | | | | | | |
| Bonds & notes of governments & government agencies outside the U.S. 2.47% | | | | | |
| Abu Dhabi (Emirate of) 2.50% 20295 | | | 1,900 | | | | 2,055 | |
| Abu Dhabi (Emirate of) 1.70% 20315 | | | 455 | | | | 456 | |
| Angola (Republic of) 9.50% 2025 | | | 800 | | | | 833 | |
| Angola (Republic of) 8.25% 2028 | | | 200 | | | | 192 | |
| Angola (Republic of) 8.00% 20295 | | | 2,800 | | | | 2,639 | |
| Angola (Republic of) 8.00% 2029 | | | 200 | | | | 189 | |
| Argentine Republic 1.00% 2029 | | | 384 | | | | 167 | |
| Argentine Republic 0.125% 2030 (0.50% on 7/9/2021)7 | | | 757 | | | | 308 | |
| Argentine Republic 0.125% 2035 (1.125% on 7/9/2021)7 | | | 4,190 | | | | 1,538 | |
| Argentine Republic 0.125% 2038 (2.00% on 7/9/2021)7 | | | 1,318 | | | | 541 | |
| Argentine Republic 0.125% 2041 (2.50% on 7/9/2021)7 | | | 5,900 | | | | 2,239 | |
| Armenia (Republic of) 7.15% 2025 | | | 490 | | | | 566 | |
| Bahrain (Kingdom of) 6.75% 20295 | | | 500 | | | | 576 | |
| Belarus (Republic of) 6.875% 2023 | | | 1,775 | | | | 1,860 | |
| Belarus (Republic of) 5.875% 2026 | | | 230 | | | | 237 | |
| Belarus (Republic of) 7.625% 2027 | | | 335 | | | | 370 | |
| Buenos Aires (City of) 8.95% 2021 | | | 359 | | | | 359 | |
| Cameroon (Republic of) 9.50% 2025 | | | 805 | | | | 899 | |
| Colombia (Republic of) 4.50% 2026 | | | 1,250 | | | | 1,419 | |
| Colombia (Republic of) 7.375% 2037 | | | 600 | | | | 878 | |
| Colombia (Republic of) 4.125% 2051 | | | 350 | | | | 390 | |
| Costa Rica (Republic of) 4.375% 2025 | | | 234 | | | | 219 | |
| Costa Rica (Republic of) 6.125% 20315 | | | 1,250 | | | | 1,170 | |
| Costa Rica (Republic of) 6.125% 2031 | | | 818 | | | | 766 | |
| Costa Rica (Republic of) 7.158% 2045 | | | 498 | | | | 464 | |
| Cote d’Ivoire (Republic of) 4.875% 2032 | | € | 150 | | | | 189 | |
| Dominican Republic 9.75% 2026 | | DOP | 18,150 | | | | 336 | |
| Dominican Republic 8.625% 20275 | | $ | 575 | | | | 733 | |
| Dominican Republic 11.375% 2029 | | DOP | 12,800 | | | | 265 | |
| Dominican Republic 7.45% 20445 | | $ | 1,125 | | | | 1,458 | |
| Dominican Republic 7.45% 2044 | | | 1,100 | | | | 1,426 | |
| Dominican Republic 6.85% 2045 | | | 100 | | | | 122 | |
| Dominican Republic 5.875% 20605 | | | 280 | | | | 309 | |
| Egypt (Arab Republic of) 5.75% 20245 | | | 450 | | | | 483 | |
| Egypt (Arab Republic of) 5.625% 2030 | | € | 260 | | | | 333 | |
| Egypt (Arab Republic of) 7.625% 20325 | | $ | 1,140 | | | | 1,294 | |
| Egypt (Arab Republic of) 8.50% 2047 | | | 1,200 | | | | 1,364 | |
| Egypt (Arab Republic of) 8.15% 20595 | | | 900 | | | | 993 | |
| | |
| American Funds Insurance Series | 75 |
New World Fund (continued)
| Bonds, notes & other debt instruments (continued) | | Principal amount
(000) | | | Value
(000) | |
| Bonds & notes of governments & government agencies outside the U.S. (continued) |
| Ethiopia (Federal Democratic Republic of) 6.625% 2024 | | $ | 1,230 | | | $ | 1,255 | |
| Export-Import Bank of India 3.25% 2030 | | | 1,180 | | | | 1,265 | |
| Gabonese Republic 6.375% 2024 | | | 2,480 | | | | 2,589 | |
| Guatemala (Republic of) 4.375% 2027 | | | 600 | | | | 668 | |
| Honduras (Republic of) 6.25% 2027 | | | 1,750 | | | | 2,032 | |
| Honduras (Republic of) 5.625% 20305 | | | 200 | | | | 230 | |
| Indonesia (Republic of) 6.625% 2037 | | | 700 | | | | 999 | |
| Indonesia (Republic of) 5.25% 2042 | | | 840 | | | | 1,091 | |
| Iraq (Republic of) 6.752% 2023 | | | 960 | | | | 941 | |
| Jordan (Hashemite Kingdom of) 4.95% 20255 | | | 600 | | | | 639 | |
| Jordan (Hashemite Kingdom of) 5.75% 20275 | | | 1,530 | | | | 1,691 | |
| Jordan (Hashemite Kingdom of) 5.75% 2027 | | | 200 | | | | 221 | |
| Kazakhstan (Republic of) 5.125% 20255 | | | 900 | | | | 1,066 | |
| Kazakhstan (Republic of) 6.50% 20455 | | | 800 | | | | 1,294 | |
| Kenya (Republic of) 6.875% 20245 | | | 900 | | | | 988 | |
| Kenya (Republic of) 8.25% 20485 | | | 2,200 | | | | 2,526 | |
| Malaysia (Federation of), Series 0419, 3.828% 2034 | | MYR | 430 | | | | 114 | |
| Malaysia (Federation of), Series 0418, 4.893% 2038 | | | 1,150 | | | | 338 | |
| Pakistan (Islamic Republic of) 8.25% 2024 | | $ | 500 | | | | 547 | |
| Pakistan (Islamic Republic of) 8.25% 20255 | | | 410 | | | | 453 | |
| Pakistan (Islamic Republic of) 6.875% 20275 | | | 1,250 | | | | 1,309 | |
| Pakistan (Islamic Republic of) 7.875% 2036 | | | 400 | | | | 415 | |
| Panama (Republic of) 3.75% 20265 | | | 1,380 | | | | 1,513 | |
| Panama (Republic of) 4.50% 2047 | | | 1,155 | | | | 1,489 | |
| Panama (Republic of) 4.50% 2050 | | | 400 | | | | 516 | |
| Panama (Republic of) 4.30% 2053 | | | 400 | | | | 510 | |
| Paraguay (Republic of) 5.00% 20265 | | | 500 | | | | 588 | |
| Paraguay (Republic of) 5.00% 2026 | | | 210 | | | | 247 | |
| Paraguay (Republic of) 4.70% 20275 | | | 800 | | | | 938 | |
| Paraguay (Republic of) 4.70% 2027 | | | 500 | | | | 586 | |
| Paraguay (Republic of) 4.95% 2031 | | | 320 | | | | 388 | |
| Peru (Republic of) 6.55% 2037 | | | 1,070 | | | | 1,628 | |
| Peru (Republic of) 2.78% 2060 | | | 840 | | | | 849 | |
| PETRONAS Capital Ltd. 3.50% 20305 | | | 200 | | | | 230 | |
| PETRONAS Capital Ltd. 4.55% 20505 | | | 400 | | | | 536 | |
| Philippines (Republic of) 6.375% 2034 | | | 820 | | | | 1,206 | |
| Philippines (Republic of) 2.95% 2045 | | | 1,220 | | | | 1,291 | |
| PT Indonesia Asahan Aluminium Tbk 6.757% 2048 | | | 200 | | | | 274 | |
| Qatar (State of) 4.50% 20285 | | | 3,000 | | | | 3,640 | |
| Qatar (State of) 4.50% 2028 | | | 1,000 | | | | 1,213 | |
| Romania 2.00% 2032 | | € | 1,510 | | | | 1,940 | |
| Romania 5.125% 20485 | | $ | 1,700 | | | | 2,180 | |
| Russian Federation 4.375% 20295 | | | 1,000 | | | | 1,169 | |
| Russian Federation 5.10% 2035 | | | 1,200 | | | | 1,520 | |
| Russian Federation 5.25% 2047 | | | 1,400 | | | | 1,943 | |
| Senegal (Republic of) 4.75% 2028 | | € | 1,100 | | | | 1,436 | |
| Serbia (Republic of) 3.125% 2027 | | | 1,020 | | | | 1,403 | |
| South Africa (Republic of) 5.875% 2030 | | $ | 2,110 | | | | 2,396 | |
| Sri Lanka (Democratic Socialist Republic of) 5.75% 2022 | | | 250 | | | | 196 | |
| Sri Lanka (Democratic Socialist Republic of) 5.875% 2022 | | | 1,000 | | | | 697 | |
| Sri Lanka (Democratic Socialist Republic of) 6.125% 2025 | | | 410 | | | | 247 | |
| Sri Lanka (Democratic Socialist Republic of) 6.85% 2025 | | | 700 | | | | 426 | |
| Sri Lanka (Democratic Socialist Republic of) 6.825% 2026 | | | 1,610 | | | | 934 | |
| Sri Lanka (Democratic Socialist Republic of) 7.55% 2030 | | | 800 | | | | 462 | |
| Sri Lanka (Democratic Socialist Republic of) 7.55% 20305 | | | 500 | | | | 289 | |
| Tunisia (Republic of) 6.75% 2023 | | € | 110 | | | | 129 | |
| Tunisia (Republic of) 5.625% 2024 | | | 710 | | | | 805 | |
| Tunisia (Republic of) 5.75% 2025 | | $ | 875 | | | | 801 | |
| Turkey (Republic of) 6.375% 2025 | | | 475 | | | | 514 | |
| Turkey (Republic of) 11.875% 2030 | | | 600 | | | | 877 | |
| Turkey (Republic of) 4.875% 2043 | | | 1,295 | | | | 1,137 | |
| | |
| 76 | American Funds Insurance Series |
New World Fund (continued)
| Bonds, notes & other debt instruments (continued) | | Principal amount
(000) | | | Value
(000) | |
| Bonds & notes of governments & government agencies outside the U.S. (continued) | | | | |
| Turkey (Republic of) 5.75% 2047 | | $ | 2,205 | | | $ | 2,106 | |
| Ukraine 7.75% 2027 | | | 2,328 | | | | 2,648 | |
| Ukraine 9.75% 2028 | | | 700 | | | | 863 | |
| Ukraine 7.375% 2032 | | | 2,180 | | | | 2,402 | |
| United Mexican States 3.90% 2025 | | | 320 | | | | 360 | |
| United Mexican States 4.50% 2029 | | | 1,070 | | | | 1,258 | |
| United Mexican States 4.75% 2032 | | | 870 | | | | 1,049 | |
| United Mexican States 4.75% 2044 | | | 1,090 | | | | 1,300 | |
| Venezuela (Bolivarian Republic of) 7.00% 20188 | | | 64 | | | | 6 | |
| Venezuela (Bolivarian Republic of) 7.75% 20198 | | | 1,149 | | | | 111 | |
| Venezuela (Bolivarian Republic of) 6.00% 20208 | | | 950 | | | | 92 | |
| Venezuela (Bolivarian Republic of) 12.75% 20228 | | | 85 | | | | 8 | |
| Venezuela (Bolivarian Republic of) 9.00% 20238 | | | 1,383 | | | | 134 | |
| Venezuela (Bolivarian Republic of) 8.25% 20248 | | | 299 | | | | 29 | |
| Venezuela (Bolivarian Republic of) 7.65% 20258 | | | 129 | | | | 13 | |
| Venezuela (Bolivarian Republic of) 11.75% 20268 | | | 64 | | | | 6 | |
| Venezuela (Bolivarian Republic of) 9.25% 20278 | | | 170 | | | | 17 | |
| Venezuela (Bolivarian Republic of) 9.25% 20288 | | | 319 | | | | 31 | |
| Venezuela (Bolivarian Republic of) 11.95% 20318 | | | 106 | | | | 10 | |
| Venezuela (Bolivarian Republic of) 7.00% 20388 | | | 107 | | | | 10 | |
| | | | | | | | 104,902 | |
| | | | | | | | | |
| Corporate bonds, notes & loans 0.36% | | | | | | | | |
| Energy 0.10% | | | | | | | | |
| Oleoducto Central SA 4.00% 20275 | | | 255 | | | | 277 | |
| Petrobras Global Finance Co. 5.60% 2031 | | | 575 | | | | 662 | |
| Petrobras Global Finance Co. 6.75% 2050 | | | 110 | | | | 137 | |
| Petrobras Global Finance Co. 6.85% 2115 | | | 314 | | | | 392 | |
| Petróleos Mexicanos 6.875% 20255 | | | 624 | | | | 685 | |
| Petróleos Mexicanos 6.875% 2026 | | | 755 | | | | 826 | |
| Petróleos Mexicanos 6.49% 2027 | | | 910 | | | | 962 | |
| PTT Exploration and Production PCL 2.587% 20275 | | | 320 | | | | 335 | |
| | | | | | | | 4,276 | |
| | | | | | | | | |
| Financials 0.08% | | | | | | | | |
Bangkok Bank PCL 3.733% 2034
(UST Yield Curve Rate T Note Constant Maturity 5-year + 1.90% on 9/25/2029)7 | | | 1,140 | | | | 1,189 | |
| HSBK (Europe) BV 7.25% 20215 | | | 665 | | | | 674 | |
| Power Financial Corp Ltd. 5.25% 2028 | | | 425 | | | | 491 | |
| Power Financial Corp Ltd. 6.15% 2028 | | | 432 | | | | 527 | |
| Power Financial Corp Ltd. 4.50% 2029 | | | 273 | | | | 301 | |
| | | | | | | | 3,182 | |
| | | | | | | | | |
| Utilities 0.06% | | | | | | | | |
| AES Panama Generation Holdings SRL 4.375% 20305 | | | 280 | | | | 303 | |
| Empresas Publicas de Medellin ESP 4.25% 20295 | | | 665 | | | | 716 | |
| Empresas Publicas de Medellin ESP 4.375% 20315 | | | 360 | | | | 387 | |
| State Grid Overseas Investment Ltd. 3.50% 20275 | | | 900 | | | | 1,002 | |
| State Grid Overseas Investment Ltd. 4.25% 2028 | | | 200 | | | | 234 | |
| | | | | | | | 2,642 | |
| | | | | | | | | |
| Industrials 0.05% | | | | | | | | |
| DP World Crescent 4.848% 20285 | | | 835 | | | | 973 | |
| Empresa de Transporte de Pasajeros Metro SA 4.70% 20505 | | | 270 | | | | 340 | |
| Mexico City Airport Trust 4.25% 2026 | | | 675 | | | | 716 | |
| Mexico City Airport Trust 3.875% 2028 | | | 200 | | | | 207 | |
| | | | | | | | 2,236 | |
| | |
| American Funds Insurance Series | 77 |
New World Fund (continued)
| Bonds, notes & other debt instruments (continued) | | Principal amount
(000) | | | Value
(000) | |
| Corporate bonds, notes & loans (continued) | | | | | | | | |
| Communication services 0.04% | | | | | | | | |
| Axiata SPV5 Labuan Ltd. 3.064% 2050 | | $ | 357 | | | $ | 359 | |
| PLDT Inc. 2.50% 2031 | | | 210 | | | | 220 | |
| Tencent Holdings Ltd. 3.975% 2029 | | | 400 | | | | 456 | |
| Tencent Holdings Ltd. 3.24% 20505 | | | 580 | | | | 601 | |
| | | | | | | | 1,636 | |
| | | | | | | | | |
| Materials 0.02% | | | | | | | | |
| Braskem Idesa SAPI 7.45% 2029 | | | 775 | | | | 728 | |
| Braskem Idesa SAPI 7.45% 20295 | | | 300 | | | | 282 | |
| | | | | | | | 1,010 | |
| | | | | | | | | |
| Consumer discretionary 0.01% | | | | | | | | |
| Sands China Ltd. 4.375% 20305 | | | 220 | | | | 246 | |
| | | | | | | | | |
| Total corporate bonds, notes & loans | | | | | | | 15,228 | |
| | | | | | | | | |
| Total bonds, notes & other debt instruments (cost: $110,988,000) | | | | | | | 120,130 | |
| | | | | | | | | |
| Short-term securities 5.62% | | Shares | | | | | |
| Money market investments 5.62% | | | | | | | | |
| Capital Group Central Cash Fund 0.12%9,10 | | | 2,244,744 | | | | 224,497 | |
| Goldman Sachs Financial Square Government Fund, Institutional Shares 0.02%9,11 | | | 14,020,660 | | | | 14,020 | |
| | | | | | | | | |
| Total short-term securities (cost: $238,510,000) | | | | | | | 238,517 | |
| Total investment securities 99.52% (cost: $2,579,578,000) | | | | | | | 4,222,773 | |
| Other assets less liabilities 0.48% | | | | | | | 20,380 | |
| | | | | | | | | |
| Net assets 100.00% | | | | | | $ | 4,243,153 | |
Futures contracts
| Contracts | | Type | | Number of
contracts | | Expiration | | Notional
amount
(000) | 12
| | Value at
12/31/2020
(000) | 13
| Unrealized
appreciation
(depreciation)
at 12/31/2020
(000) | |
| 10 Year Ultra U.S. Treasury Note Futures | | Short | | 8 | | March 2021 | | $ | (800 | ) | | $ | (1,251 | ) | | $ | 3 | |
| 30 Year Ultra U.S. Treasury Bond Futures | | Long | | 10 | | March 2021 | | | 1,000 | | | | 2,136 | | | | (13 | ) |
| | | | | | | | | | | | | | | | | $ | (10 | ) |
Forward currency contracts
| | | | | | | | | Unrealized | |
| Contract amount | | | | | | depreciation | |
| Purchases | | Sales | | | | Settlement | | at 12/31/2020 | |
| (000) | | (000) | | Counterparty | | date | | | (000) | |
| USD | 3,404 | | EUR | 2,830 | | Bank of New York Mellon | | 1/8/2021 | | $ | (54 | ) |
| | |
| 78 | American Funds Insurance Series |
New World Fund (continued)
Investments in affiliates10
| | | Value of
affiliate at
1/1/2020
(000) | | | Additions
(000) | | | Reductions
(000) | | | Net
realized
gain
(000) | | | Net
unrealized
depreciation
(000) | | | Value of
affiliate at
12/31/2020
(000) | | | Dividend
income
(000) | |
| Short-term securities 5.29% | | | | | | | | | | | | | | | | | | | | | | | | | | | | |
| Money market investments 5.29% | | | | | | | | | | | | | | | | | | | | | | | | | | | | |
| Capital Group Central Cash Fund 0.12%9 | | $ | 238,673 | | | $ | 930,010 | | | $ | 944,104 | | | $ | 40 | | | $ | (122 | ) | | $ | 224,497 | | | $ | 1,220 | |
| 1 | Valued under fair value procedures adopted by authority of the board of trustees. The total value of all such securities was $2,245,296,000, which represented 52.92% of the net assets of the fund. This amount includes $2,245,295,000 related to certain securities trading outside the U.S. whose values were adjusted as a result of significant market movements following the close of local trading. |
| 2 | Security did not produce income during the last 12 months. |
| 3 | All or a portion of this security was on loan. The total value of all such securities was $18,411,000, which represented .43% of the net assets of the fund. Refer to Note 5 for more information on securities lending. |
| 4 | Value determined using significant unobservable inputs. |
| 5 | Acquired in a transaction exempt from registration under Rule 144A of the Securities Act of 1933. May be resold in the U.S. in transactions exempt from registration, normally to qualified institutional buyers. The total value of all such securities was $56,174,000, which represented 1.32% of the net assets of the fund. |
| 6 | Amount less than one thousand. |
| 7 | Step bond; coupon rate may change at a later date. |
| 8 | Scheduled interest and/or principal payment was not received. |
| 9 | Rate represents the seven-day yield at 12/31/2020. |
| 10 | Part of the same group of investment companies as the fund as defined under the Investment Company Act of 1940. |
| 11 | Security purchased with cash collateral from securities on loan. Refer to Note 5 for more information on securities lending. |
| 12 | Notional amount is calculated based on the number of contracts and notional contract size. |
| 13 | Value is calculated based on the notional amount and current market price. |
Key to abbreviations and symbols
ADR = American Depositary Receipts
CAD = Canadian dollars
CDI = CREST Depository Interest
DOP = Dominican pesos
EUR/€ = Euros
GBP = British pounds
GDR = Global Depositary Receipts
MYR = Malaysian ringgits
USD/$ = U.S. dollars
See notes to financial statements.
| American Funds Insurance Series | 79 |
Blue Chip Income and Growth Fund
Investment portfolio December 31, 2020
| Common stocks 97.04% | | Shares | | | Value
(000) | |
| Health care 17.33% | | | | | | | | |
| Abbott Laboratories | | | 3,362,500 | | | $ | 368,160 | |
| Amgen Inc. | | | 1,258,510 | | | | 289,357 | |
| UnitedHealth Group Inc. | | | 593,400 | | | | 208,093 | |
| AbbVie Inc. | | | 1,890,460 | | | | 202,563 | |
| Gilead Sciences, Inc. | | | 3,005,712 | | | | 175,113 | |
| Teva Pharmaceutical Industries Ltd. (ADR)1 | | | 10,333,800 | | | | 99,721 | |
| Medtronic PLC | | | 700,000 | | | | 81,998 | |
| Stryker Corp. | | | 296,800 | | | | 72,728 | |
| Humana Inc. | | | 124,700 | | | | 51,161 | |
| Merck & Co., Inc. | | | 500,000 | | | | 40,900 | |
| Zimmer Biomet Holdings, Inc. | | | 225,000 | | | | 34,670 | |
| PerkinElmer, Inc. | | | 210,400 | | | | 30,192 | |
| GlaxoSmithKline PLC (ADR) | | | 148,000 | | | | 5,446 | |
| | | | | | | | 1,660,102 | |
| | | | | | | | | |
| Information technology 17.11% | | | | | | | | |
| Microsoft Corp. | | | 2,598,300 | | | | 577,914 | |
| Broadcom Inc. | | | 1,007,100 | | | | 440,959 | |
| Mastercard Inc., Class A | | | 613,600 | | | | 219,018 | |
| Apple Inc. | | | 1,600,000 | | | | 212,304 | |
| SS&C Technologies Holdings, Inc. | | | 1,153,800 | | | | 83,939 | |
| Intel Corp. | | | 1,100,000 | | | | 54,802 | |
| Cognizant Technology Solutions Corp., Class A | | | 486,000 | | | | 39,828 | |
| QUALCOMM Inc. | | | 68,000 | | | | 10,359 | |
| | | | | | | | 1,639,123 | |
| | | | | | | | | |
| Industrials 13.56% | | | | | | | | |
| CSX Corp. | | | 3,255,142 | | | | 295,404 | |
| Raytheon Technologies Corp. | | | 3,935,100 | | | | 281,399 | |
| General Dynamics Corp. | | | 908,000 | | | | 135,129 | |
| Union Pacific Corp. | | | 565,600 | | | | 117,769 | |
| General Electric Co. | | | 9,974,300 | | | | 107,722 | |
| Carrier Global Corp. | | | 2,549,000 | | | | 96,148 | |
| Illinois Tool Works Inc. | | | 450,000 | | | | 91,746 | |
| Airbus Group SE (ADR)1 | | | 2,639,000 | | | | 72,097 | |
| RELX PLC (ADR) | | | 1,225,000 | | | | 30,209 | |
| Stanley Black & Decker, Inc. | | | 136,000 | | | | 24,284 | |
| Otis Worldwide Corp. | | | 277,500 | | | | 18,745 | |
| L3Harris Technologies, Inc. | | | 85,000 | | | | 16,067 | |
| ManpowerGroup Inc. | | | 131,500 | | | | 11,859 | |
| Rolls-Royce Holdings PLC (ADR)2 | | | 356,800 | | | | 564 | |
| | | | | | | | 1,299,142 | |
| | | | | | | | | |
| Communication services 9.47% | | | | | | | | |
| Comcast Corp., Class A | | | 5,789,400 | | | | 303,364 | |
| Facebook, Inc., Class A1 | | | 967,600 | | | | 264,310 | |
| Alphabet Inc., Class A1 | | | 80,975 | | | | 141,920 | |
| Alphabet Inc., Class C1 | | | 3,000 | | | | 5,256 | |
| Netflix, Inc.1 | | | 201,800 | | | | 109,119 | |
| Omnicom Group Inc. | | | 1,000,000 | | | | 62,370 | |
| Activision Blizzard, Inc. | | | 113,000 | | | | 10,492 | |
| Electronic Arts Inc. | | | 73,000 | | | | 10,483 | |
| | | | | | | | 907,314 | |
| | | | | | | | | |
| Energy 9.05% | | | | | | | | |
| EOG Resources, Inc. | | | 4,588,100 | | | | 228,809 | |
| Baker Hughes Co., Class A | | | 10,437,000 | | | | 217,611 | |
| Chevron Corp. | | | 1,099,000 | | | | 92,811 | |
| Diamondback Energy, Inc. | | | 1,320,033 | | | | 63,890 | |
| Royal Dutch Shell PLC, Class B (ADR) | | | 1,839,000 | | | | 61,809 | |
| Pioneer Natural Resources Company | | | 486,800 | | | | 55,442 | |
| Concho Resources Inc. | | | 616,100 | | | | 35,949 | |
| | | | | | | | | |
| 80 | American Funds Insurance Series |
Blue Chip Income and Growth Fund (continued)
| Common stocks (continued) | | Shares | | | Value
(000) | |
| Energy (continued) | | | | | | | | |
| Williams Companies, Inc. | | | 1,661,000 | | | $ | 33,303 | |
| Canadian Natural Resources, Ltd. | | | 1,230,250 | | | | 29,587 | |
| TC Energy Corp. | | | 600,000 | | | | 24,432 | |
| Schlumberger Ltd. | | | 1,045,400 | | | | 22,821 | |
| | | | | | | | 866,464 | |
| | | | | | | | | |
| Consumer staples 8.16% | | | | | | | | |
| Philip Morris International Inc. | | | 3,090,600 | | | | 255,871 | |
| Altria Group, Inc. | | | 2,448,000 | | | | 100,368 | |
| British American Tobacco PLC (ADR) | | | 2,630,706 | | | | 98,625 | |
| Constellation Brands, Inc., Class A | | | 408,300 | | | | 89,438 | |
| Coca-Cola Company | | | 1,250,000 | | | | 68,550 | |
| PepsiCo, Inc. | | | 400,000 | | | | 59,320 | |
| Keurig Dr Pepper Inc. | | | 1,746,500 | | | | 55,888 | |
| Lamb Weston Holdings, Inc. | | | 400,000 | | | | 31,496 | |
| Mondelez International, Inc. | | | 384,000 | | | | 22,452 | |
| | | | | | | | 782,008 | |
| | | | | | | | | |
| Consumer discretionary 7.63% | | | | | | | | |
| General Motors Company | | | 4,485,500 | | | | 186,776 | |
| Royal Caribbean Cruises Ltd. | | | 1,525,200 | | | | 113,917 | |
| McDonald’s Corp. | | | 500,000 | | | | 107,290 | |
| Starbucks Corp. | | | 608,000 | | | | 65,044 | |
| Lowe’s Companies, Inc. | | | 392,000 | | | | 62,920 | |
| Sony Corp. (ADR) | | | 561,000 | | | | 56,717 | |
| Home Depot, Inc. | | | 150,000 | | | | 39,843 | |
| NIKE, Inc., Class B | | | 225,000 | | | | 31,831 | |
| Hasbro, Inc. | | | 315,000 | | | | 29,465 | |
| Williams-Sonoma, Inc. | | | 273,700 | | | | 27,874 | |
| Darden Restaurants, Inc. | | | 76,000 | | | | 9,053 | |
| | | | | | | | 730,730 | |
| | | | | | | | | |
| Financials 6.98% | | | | | | | | |
| Citigroup Inc. | | | 2,947,300 | | | | 181,730 | |
| JPMorgan Chase & Co. | | | 1,349,300 | | | | 171,456 | |
| American International Group, Inc. | | | 3,230,000 | | | | 122,288 | |
| Discover Financial Services | | | 920,000 | | | | 83,288 | |
| Franklin Resources, Inc. | | | 1,550,000 | | | | 38,734 | |
| Nasdaq, Inc. | | | 260,000 | | | | 34,512 | |
| PNC Financial Services Group, Inc. | | | 125,300 | | | | 18,670 | |
| CME Group Inc., Class A | | | 96,500 | | | | 17,568 | |
| | | | | | | | 668,246 | |
| | | | | | | | | |
| Utilities 3.42% | | | | | | | | |
| Public Service Enterprise Group Inc. | | | 1,520,000 | | | | 88,616 | |
| Entergy Corp. | | | 812,300 | | | | 81,100 | |
| DTE Energy Company | | | 421,000 | | | | 51,114 | |
| Sempra Energy | | | 331,000 | | | | 42,173 | |
| American Electric Power Company, Inc. | | | 450,000 | | | | 37,471 | |
| NextEra Energy, Inc. | | | 200,000 | | | | 15,430 | |
| E.ON SE (ADR) | | | 1,090,000 | | | | 12,055 | |
| | | | | | | | 327,959 | |
| | | | | | | | | |
| Materials 2.58% | | | | | | | | |
| Linde PLC | | | 782,200 | | | | 206,118 | |
| Freeport-McMoRan Inc. | | | 1,565,000 | | | | 40,721 | |
| | | | | | | | 246,839 | |
| | |
| American Funds Insurance Series | 81 |
Blue Chip Income and Growth Fund (continued)
| Common stocks (continued) | | Shares | | | Value
(000) | |
| Real estate 1.75% | | | | | | | | |
| Crown Castle International Corp. REIT | | | 525,000 | | | $ | 83,575 | |
| Americold Realty Trust REIT | | | 690,000 | | | | 25,758 | |
| Digital Realty Trust, Inc. REIT | | | 177,500 | | | | 24,763 | |
| Alexandria Real Estate Equities, Inc. REIT | | | 98,500 | | | | 17,555 | |
| Equinix, Inc. REIT | | | 22,400 | | | | 15,997 | |
| | | | | | | | 167,648 | |
| | | | | | | | | |
| Total common stocks (cost: $6,473,788,000) | | | | | | | 9,295,575 | |
| | | | | | | | | |
| Rights & warrants 0.00% | | | | | | | | |
| Financials 0.00% | | | | | | | | |
| American International Group, Inc., warrants, expire 20211 | | | 1,151,554 | | | | 138 | |
| | | | | | | | | |
| Total rights & warrants (cost: $17,794,000) | | | | | | | 138 | |
| | | | | | | | | |
| Convertible stocks 0.90% | | | | | | | | |
| Consumer discretionary 0.70% | | | | | | | | |
| Aptiv PLC, Series A, convertible preferred shares, 5.50% 2023 | | | 431,213 | | | | 66,536 | |
| | | | | | | | | |
| Health care 0.20% | | | | | | | | |
| Danaher Corp., Series B, cumulative convertible preferred shares, 5.00% 20232 | | | 8,921 | | | | 11,607 | |
| Danaher Corp., Series A, cumulative convertible preferred shares, 4.75% 2022 | | | 4,900 | | | | 7,437 | |
| | | | | | | | 19,044 | |
| | | | | | | | | |
| Total convertible stocks (cost: $57,918,000) | | | | | | | 85,580 | |
| | | | | | | | | |
| Convertible bonds & notes 0.14% | | Principal amount
(000) | | | | | |
| Consumer discretionary 0.14% | | | | | | | | |
| Royal Caribbean Cruises Ltd., convertible notes, 2.875% 20233 | | $ | 11,376 | | | | 13,651 | |
| | | | | | | | | |
| Total convertible bonds & notes (cost: $11,376,000) | | | | | | | 13,651 | |
| | | | | | | | | |
| Short-term securities 1.90% | | Shares | | | | | |
| Money market investments 1.90% | | | | | | | | |
| Capital Group Central Cash Fund 0.12%4,5 | | | 1,785,145 | | | | 178,532 | |
| Goldman Sachs Financial Square Government Fund, Institutional Shares 0.02%4,6 | | | 3,229,762 | | | | 3,230 | |
| | | | | | | | | |
| Total short-term securities (cost: $181,729,000) | | | | | | | 181,762 | |
| Total investment securities 99.98% (cost: $6,742,605,000) | | | | | | | 9,576,706 | |
| Other assets less liabilities 0.02% | | | | | | | 2,360 | |
| | | | | | | | | |
| Net assets 100.00% | | | | | | $ | 9,579,066 | |
Investments in affiliates5
| | | Value of
affiliate at
1/1/2020
(000) | | | Additions
(000) | | | Reductions
(000) | | | Net
realized
gain
(000) | | | Net
unrealized
appreciation
(000) | | | Value of
affiliate at
12/31/2020
(000) | | | Dividend
income
(000) | |
| Short-term securities 1.86% | | | | | | | | | | | | | | | | | | | | | | | | | | | | |
| Money market investments 1.86% | | | | | | | | | | | | | | | | | | | | | | | | | | | | |
| Capital Group Central Cash Fund 0.12%4 | | $ | 312,462 | | | $ | 1,545,068 | | | $ | 1,679,415 | | | $ | 414 | | | $ | 3 | | | $ | 178,532 | | | $ | 2,015 | |
| | | | | | | | | | | | | | | | | | | | | | | | | | | | | |
| 82 | American Funds Insurance Series |
Blue Chip Income and Growth Fund (continued)
| 1 | Security did not produce income during the last 12 months. |
| 2 | All or a portion of this security was on loan. The total value of all such securities was $3,447,000, which represented .04% of the net assets of the fund. Refer to Note 5 for more information on securities lending. |
| 3 | Acquired in a transaction exempt from registration under Rule 144A of the Securities Act of 1933. May be resold in the U.S. in transactions exempt from registration, normally to qualified institutional buyers. The total value of all such securities was $13,651,000, which represented .14% of the net assets of the fund. |
| 4 | Rate represents the seven-day yield at 12/31/2020. |
| 5 | Part of the same group of investment companies as the fund as defined under the Investment Company Act of 1940. |
| 6 | Security purchased with cash collateral from securities on loan. Refer to Note 5 for more information on securities lending. |
Key to abbreviation
ADR = American Depositary Receipts
See notes to financial statements.
| American Funds Insurance Series | 83 |
Global Growth and Income Fund
Investment portfolio December 31, 2020
| Common stocks 94.88% | | Shares | | | Value
(000) | |
| Information technology 18.51% | | | | | | | | |
| Taiwan Semiconductor Manufacturing Company, Ltd.1 | | | 4,709,800 | | | $ | 88,457 | |
| Broadcom Inc. | | | 155,700 | | | | 68,173 | |
| Apple Inc. | | | 423,960 | | | | 56,255 | |
| Microsoft Corp. | | | 213,200 | | | | 47,420 | |
| ASML Holding NV1 | | | 70,000 | | | | 33,828 | |
| Tokyo Electron Ltd.1 | | | 49,000 | | | | 18,276 | |
| Afterpay Ltd.1,2 | | | 184,495 | | | | 16,914 | |
| GoDaddy Inc., Class A2 | | | 142,000 | | | | 11,779 | |
| Fiserv, Inc.2 | | | 88,000 | | | | 10,020 | |
| Advanced Micro Devices, Inc.2 | | | 98,400 | | | | 9,024 | |
| NetEase, Inc.1 | | | 420,800 | | | | 8,052 | |
| PagSeguro Digital Ltd., Class A2 | | | 130,000 | | | | 7,395 | |
| Texas Instruments Inc. | | | 40,000 | | | | 6,565 | |
| Murata Manufacturing Co., Ltd.1 | | | 67,000 | | | | 6,034 | |
| MediaTek Inc.1 | | | 194,000 | | | | 5,181 | |
| SAP SE1 | | | 34,500 | | | | 4,534 | |
| Atlassian Corp. PLC, Class A2 | | | 19,200 | | | | 4,490 | |
| | | | | | | | 402,397 | |
| | | | | | | | | |
| Financials 15.82% | | | | | | | | |
| Société Générale1,2 | | | 2,306,018 | | | | 48,040 | |
| Fannie Mae2 | | | 16,006,000 | | | | 38,254 | |
| Sberbank of Russia PJSC (ADR)1 | | | 2,177,000 | | | | 31,383 | |
| HDFC Bank Ltd.1,2 | | | 1,166,577 | | | | 22,979 | |
| Discover Financial Services | | | 249,000 | | | | 22,542 | |
| AIA Group Ltd.1 | | | 1,590,000 | | | | 19,585 | |
| Toronto-Dominion Bank (CAD denominated) | | | 320,492 | | | | 18,108 | |
| B3 SA - Brasil, Bolsa, Balcao | | | 1,500,000 | | | | 17,899 | |
| UniCredit SpA1,2 | | | 1,686,696 | | | | 15,608 | |
| DBS Group Holdings Ltd.1 | | | 805,000 | | | | 15,226 | |
| Macquarie Group Ltd.1 | | | 142,118 | | | | 15,186 | |
| Ping An Insurance (Group) Company of China, Ltd., Class H1 | | | 1,195,000 | | | | 14,678 | |
| CME Group Inc., Class A | | | 70,000 | | | | 12,744 | |
| JPMorgan Chase & Co. | | | 92,000 | | | | 11,690 | |
| The Blackstone Group Inc., Class A | | | 136,700 | | | | 8,860 | |
| HDFC Life Insurance Company Ltd.1,2 | | | 773,990 | | | | 7,180 | |
| Barclays PLC1,2 | | | 3,365,000 | | | | 6,754 | |
| Zurich Insurance Group AG1 | | | 14,000 | | | | 5,934 | |
| BB Seguridade Participações SA | | | 997,600 | | | | 5,691 | |
| Truist Financial Corp. | | | 116,550 | | | | 5,586 | |
| | | | | | | | 343,927 | |
| | | | | | | | | |
| Industrials 11.32% | | | | | | | | |
| Airbus SE, non-registered shares1,2 | | | 607,200 | | | | 66,700 | |
| CCR SA, ordinary nominative | | | 18,355,800 | | | | 47,602 | |
| Lockheed Martin Corp. | | | 66,000 | | | | 23,429 | |
| Safran SA1,2 | | | 123,500 | | | | 17,515 | |
| Honeywell International Inc. | | | 71,700 | | | | 15,251 | |
| Illinois Tool Works Inc. | | | 54,000 | | | | 11,009 | |
| Rheinmetall AG1 | | | 98,800 | | | | 10,441 | |
| VAT Group AG1 | | | 35,200 | | | | 8,773 | |
| Boeing Company | | | 35,500 | | | | 7,599 | |
| CSX Corp. | | | 73,000 | | | | 6,625 | |
| Experian PLC1 | | | 171,000 | | | | 6,516 | |
| Watsco, Inc. | | | 23,500 | | | | 5,324 | |
| Union Pacific Corp. | | | 24,400 | | | | 5,081 | |
| PACCAR Inc. | | | 58,600 | | | | 5,056 | |
| Aeroflot - Russian Airlines PJSC1,2 | | | 3,920,000 | | | | 3,773 | |
| Seven Group Holdings Ltd.1 | | | 180,000 | | | | 3,244 | |
| International Consolidated Airlines Group SA (CDI)1,2 | | | 1,035,000 | | | | 2,265 | |
| | | | | | | | 246,203 | |
| | | | | | | | | |
| 84 | American Funds Insurance Series |
Global Growth and Income Fund (continued)
| Common stocks (continued) | | Shares | | | Value
(000) | |
| Health care 9.11% | | | | | | | | |
| Novartis AG1 | | | 337,000 | | | $ | 31,830 | |
| UnitedHealth Group Inc. | | | 86,300 | | | | 30,264 | |
| Sarepta Therapeutics, Inc.2 | | | 94,500 | | | | 16,111 | |
| Abbott Laboratories | | | 125,000 | | | | 13,686 | |
| Hikma Pharmaceuticals PLC1 | | | 340,000 | | | | 11,712 | |
| Allogene Therapeutics, Inc.2 | | | 461,000 | | | | 11,636 | |
| Centene Corp.2 | | | 186,000 | | | | 11,166 | |
| HOYA Corp.1 | | | 76,700 | | | | 10,602 | |
| DexCom, Inc.2 | | | 23,700 | | | | 8,762 | |
| AstraZeneca PLC1 | | | 83,000 | | | | 8,292 | |
| CSL Ltd.1 | | | 35,200 | | | | 7,691 | |
| Eli Lilly and Company | | | 45,000 | | | | 7,598 | |
| Gilead Sciences, Inc. | | | 130,000 | | | | 7,574 | |
| Insulet Corp.2 | | | 28,300 | | | | 7,234 | |
| CVS Health Corp. | | | 95,000 | | | | 6,489 | |
| Pfizer Inc. | | | 104,000 | | | | 3,828 | |
| Regeneron Pharmaceuticals, Inc.2 | | | 7,650 | | | | 3,696 | |
| | | | | | | | 198,171 | |
| | | | | | | | | |
| Consumer discretionary 9.09% | | | | | | | | |
| LVMH Moët Hennessy-Louis Vuitton SE1 | | | 74,096 | | | | 46,298 | |
| Flutter Entertainment PLC (EUR denominated)1 | | | 126,077 | | | | 25,825 | |
| Home Depot, Inc. | | | 81,000 | | | | 21,515 | |
| General Motors Company | | | 400,000 | | | | 16,656 | |
| Alibaba Group Holding Ltd.1,2 | | | 522,600 | | | | 15,269 | |
| Li Ning Co. Ltd.1 | | | 1,685,000 | | | | 11,608 | |
| Amazon.com, Inc.2 | | | 3,005 | | | | 9,787 | |
| Aston Martin Lagonda Global Holdings PLC1,2 | | | 267,252 | | | | 7,360 | |
| NIKE, Inc., Class B | | | 51,800 | | | | 7,328 | |
| Tesla, Inc.2 | | | 9,000 | | | | 6,351 | |
| Restaurant Brands International Inc. (CAD denominated) | | | 103,600 | | | | 6,335 | |
| Gentex Corp. | | | 166,000 | | | | 5,632 | |
| Naspers Ltd., Class N1 | | | 27,000 | | | | 5,526 | |
| Melco Resorts & Entertainment Ltd. (ADR) | | | 297,000 | | | | 5,509 | |
| lululemon athletica inc.2 | | | 9,800 | | | | 3,411 | |
| Strategic Education, Inc. | | | 34,000 | | | | 3,241 | |
| | | | | | | | 197,651 | |
| | | | | | | | | |
| Communication services 7.63% | | | | | | | | |
| Alphabet Inc., Class A2 | | | 21,800 | | | | 38,208 | |
| Alphabet Inc., Class C2 | | | 7,000 | | | | 12,263 | |
| Comcast Corp., Class A | | | 546,000 | | | | 28,610 | |
| Facebook, Inc., Class A2 | | | 65,000 | | | | 17,755 | |
| Warner Music Group Corp., Class A | | | 419,376 | | | | 15,932 | |
| Walt Disney Company2 | | | 67,000 | | | | 12,139 | |
| Activision Blizzard, Inc. | | | 101,000 | | | | 9,378 | |
| SoftBank Corp.1 | | | 663,800 | | | | 8,322 | |
| New York Times Co., Class A | | | 160,000 | | | | 8,283 | |
| Tencent Holdings Ltd.1 | | | 100,000 | | | | 7,307 | |
| Koninklijke KPN NV1 | | | 1,528,000 | | | | 4,633 | |
| Netflix, Inc.2 | | | 5,500 | | | | 2,974 | |
| | | | | | | | 165,804 | |
| | | | | | | | | |
| Utilities 6.03% | | | | | | | | |
| Ørsted AS1 | | | 189,456 | | | | 38,748 | |
| Enel SpA1 | | | 3,539,000 | | | | 35,738 | |
| Dominion Energy, Inc. | | | 150,000 | | | | 11,280 | |
| E.ON SE1 | | | 1,015,000 | | | | 11,241 | |
| China Resources Gas Group Ltd.1 | | | 1,778,000 | | | | 9,457 | |
| National Grid PLC1 | | | 750,000 | | | | 8,933 | |
| | | | | | | | | |
| American Funds Insurance Series | 85 |
Global Growth and Income Fund (continued)
| Common stocks (continued) | | Shares | | | Value
(000) | |
| Utilities (continued) | | | | | | | | |
| Brookfield Infrastructure Partners LP | | | 170,000 | | | $ | 8,411 | |
| American Electric Power Company, Inc. | | | 72,700 | | | | 6,054 | |
| Brookfield Infrastructure Corp., Class A, subordinate voting shares | | | 18,888 | | | | 1,368 | |
| | | | | | | | 131,230 | |
| | | | | | | | | |
| Materials 5.75% | | | | | | | | |
| Vale SA, ordinary nominative | | | 1,409,600 | | | | 23,732 | |
| Vale SA, ordinary nominative (ADR) | | | 385,600 | | | | 6,463 | |
| BHP Group PLC1 | | | 870,000 | | | | 22,928 | |
| Koninklijke DSM NV1 | | | 96,800 | | | | 16,675 | |
| Fortescue Metals Group Ltd.1 | | | 915,000 | | | | 16,544 | |
| Evonik Industries AG1 | | | 375,000 | | | | 12,217 | |
| Shin-Etsu Chemical Co., Ltd.1 | | | 63,000 | | | | 11,029 | |
| Eastman Chemical Company | | | 68,000 | | | | 6,819 | |
| Air Products and Chemicals, Inc. | | | 18,700 | | | | 5,109 | |
| Lynas Rare Earths Ltd.1,2 | | | 1,180,000 | | | | 3,624 | |
| | | | | | | | 125,140 | |
| | | | | | | | | |
| Energy 4.63% | | | | | | | | |
| Reliance Industries Ltd.1 | | | 1,606,099 | | | | 43,752 | |
| Reliance Industries Ltd., interim shares1 | | | 107,073 | | | | 1,642 | |
| Canadian Natural Resources, Ltd. (CAD denominated) | | | 904,000 | | | | 21,725 | |
| EOG Resources, Inc. | | | 350,000 | | | | 17,454 | |
| Gazprom PJSC (ADR)1 | | | 2,141,000 | | | | 11,902 | |
| Total SE1,3 | | | 95,600 | | | | 4,124 | |
| | | | | | | | 100,599 | |
| | | | | | | | | |
| Consumer staples 4.47% | | | | | | | | |
| Nestlé SA1 | | | 298,275 | | | | 35,116 | |
| Keurig Dr Pepper Inc. | | | 405,000 | | | | 12,960 | |
| ITC Ltd.1 | | | 3,410,972 | | | | 9,769 | |
| British American Tobacco PLC1 | | | 252,000 | | | | 9,373 | |
| Pernod Ricard SA1 | | | 35,000 | | | | 6,709 | |
| Philip Morris International Inc. | | | 80,000 | | | | 6,623 | |
| Altria Group, Inc. | | | 145,000 | | | | 5,945 | |
| Mondelez International, Inc. | | | 72,000 | | | | 4,210 | |
| Reckitt Benckiser Group PLC1 | | | 42,000 | | | | 3,756 | |
| Beyond Meat, Inc.2,3 | | | 21,500 | | | | 2,688 | |
| | | | | | | | 97,149 | |
| | | | | | | | | |
| Real estate 2.52% | | | | | | | | |
| Mindspace Business Parks REIT1,2 | | | 2,124,800 | | | | 9,308 | |
| Mindspace Business Parks REIT1,2,4 | | | 1,309,000 | | | | 5,619 | |
| Alexandria Real Estate Equities, Inc. REIT | | | 75,000 | | | | 13,367 | |
| Prologis, Inc. REIT | | | 90,000 | | | | 8,969 | |
| Iron Mountain Inc. REIT | | | 219,200 | | | | 6,462 | |
| Longfor Group Holdings Ltd.1 | | | 1,025,000 | | | | 6,020 | |
| CIFI Holdings (Group) Co. Ltd.1 | | | 5,910,000 | | | | 5,011 | |
| | | | | | | | 54,756 | |
| | | | | | | | | |
| Total common stocks (cost: $1,313,317,000) | | | | | | | 2,063,027 | |
| | | | | | | | | |
| Bonds, notes & other debt instruments 1.58% | | Principal amount
(000) | | | | | |
| Corporate bonds, notes & loans 1.58% | | | | | | | | |
| Communication services 1.58% | | | | | | | | |
| Sprint Corp. 7.25% 2021 | | $ | 33,000 | | | | 34,378 | |
| | | | | | | | | |
| Total bonds, notes & other debt instruments (cost: $32,569,000) | | | | | | | 34,378 | |
| | | | | | | | | |
| 86 | American Funds Insurance Series |
Global Growth and Income Fund (continued)
| Short-term securities 3.35% | | Shares | | | Value
(000) | |
| Money market investments 3.35% | | | | | | |
| Capital Group Central Cash Fund 0.12%5,6 | | | 664,822 | | | $ | 66,489 | |
| Goldman Sachs Financial Square Government Fund, Institutional Shares 0.02%5,7 | | | 6,440,115 | | | | 6,440 | |
| | | | | | | | | |
| Total short-term securities (cost: $72,921,000) | | | | | | | 72,929 | |
| Total investment securities 99.81% (cost: $1,418,807,000) | | | | | | | 2,170,334 | |
| Other assets less liabilities 0.19% | | | | | | | 4,116 | |
| | | | | | | | | |
| Net assets 100.00% | | | | | | $ | 2,174,450 | |
Investments in affiliates6
| | | Value of
affiliate at
1/1/2020
(000) | | | Additions
(000) | | | Reductions
(000) | | | Net
realized
gain
(000) | | | Net
unrealized
depreciation
(000) | | | Value of
affiliate at
12/31/2020
(000) | | | Dividend
income
(000) | |
| Short-term securities 3.06% | | | | | | | | | | | | | | | | | | | | | | | | | | | | |
| Money market investments 3.06% | | | | | | | | | | | | | | | | | | | | | | | | | | | | |
| Capital Group Central Cash Fund 0.12%5 | | $ | 28,561 | | | $ | 583,471 | | | $ | 545,530 | | | $ | 51 | | | $ | (64 | ) | | $ | 66,489 | | | $ | 578 | |
| | |
| 1 | Valued under fair value procedures adopted by authority of the board of trustees. The total value of all such securities was $1,044,566,000, which represented 48.04% of the net assets of the fund. This entire amount relates to certain securities trading outside the U.S. whose values were adjusted as a result of significant market movements following the close of local trading. |
| 2 | Security did not produce income during the last 12 months. |
| 3 | All or a portion of this security was on loan. The total value of all such securities was $6,890,000, which represented .32% of the net assets of the fund. Refer to Note 5 for more information on securities lending. |
| 4 | Acquired in a transaction exempt from registration under Rule 144A of the Securities Act of 1933. May be resold in the U.S. in transactions exempt from registration, normally to qualified institutional buyers. The total value of all such securities was $5,619,000, which represented .26% of the net assets of the fund. |
| 5 | Rate represents the seven-day yield at 12/31/2020. |
| 6 | Part of the same group of investment companies as the fund as defined under the Investment Company Act of 1940. |
| 7 | Security purchased with cash collateral from securities on loan. Refer to Note 5 for more information on securities lending. |
Key to abbreviations
ADR = American Depositary Receipts
CAD = Canadian dollars
CDI = CREST Depository Interest
EUR = Euros
See notes to financial statements.
| American Funds Insurance Series | 87 |
Growth-Income Fund
Investment portfolio December 31, 2020
| Common stocks 96.33% | | Shares | | | Value
(000) | |
| Information technology 19.97% | | | | | | | | |
| Microsoft Corp. | | | 10,689,658 | | | $ | 2,377,594 | |
| Broadcom Inc. | | | 2,735,734 | | | | 1,197,841 | |
| Mastercard Inc., Class A | | | 1,692,300 | | | | 604,049 | |
| Accenture PLC, Class A | | | 991,200 | | | | 258,911 | |
| Intel Corp. | | | 4,856,300 | | | | 241,941 | |
| Visa Inc., Class A | | | 1,093,800 | | | | 239,247 | |
| Taiwan Semiconductor Manufacturing Company, Ltd.1 | | | 10,147,000 | | | | 190,576 | |
| Adobe Inc.2 | | | 360,100 | | | | 180,093 | |
| Apple Inc. | | | 1,220,400 | | | | 161,935 | |
| Autodesk, Inc.2 | | | 530,000 | | | | 161,830 | |
| ServiceNow, Inc.2 | | | 280,100 | | | | 154,175 | |
| QUALCOMM Inc. | | | 1,007,952 | | | | 153,551 | |
| Automatic Data Processing, Inc. | | | 845,000 | | | | 148,889 | |
| ASML Holding NV (New York registered) (ADR) | | | 147,800 | | | | 72,085 | |
| ASML Holding NV1 | | | 140,000 | | | | 67,657 | |
| Ceridian HCM Holding Inc.2 | | | 1,240,574 | | | | 132,196 | |
| StoneCo Ltd., Class A2 | | | 1,285,500 | | | | 107,879 | |
| Global Payments Inc. | | | 498,100 | | | | 107,301 | |
| CDK Global, Inc. | | | 2,042,800 | | | | 105,878 | |
| Cognizant Technology Solutions Corp., Class A | | | 1,219,000 | | | | 99,897 | |
| Samsung Electronics Co., Ltd.1 | | | 1,110,000 | | | | 82,958 | |
| MKS Instruments, Inc. | | | 481,000 | | | | 72,366 | |
| Fidelity National Information Services, Inc. | | | 504,200 | | | | 71,324 | |
| Euronet Worldwide, Inc.2 | | | 491,600 | | | | 71,243 | |
| PayPal Holdings, Inc.2 | | | 298,500 | | | | 69,909 | |
| Concentrix Corp.2 | | | 641,935 | | | | 63,359 | |
| Fiserv, Inc.2 | | | 536,700 | | | | 61,109 | |
| Atlassian Corp. PLC, Class A2 | | | 247,800 | | | | 57,953 | |
| NetApp, Inc. | | | 873,100 | | | | 57,834 | |
| Micron Technology, Inc.2 | | | 760,600 | | | | 57,182 | |
| Amphenol Corp., Class A | | | 386,000 | | | | 50,477 | |
| FleetCor Technologies, Inc.2 | | | 167,000 | | | | 45,563 | |
| SAP SE1 | | | 239,500 | | | | 31,472 | |
| Applied Materials, Inc. | | | 337,400 | | | | 29,118 | |
| Trimble Inc.2 | | | 413,300 | | | | 27,596 | |
| Teradata Corp.2 | | | 1,056,057 | | | | 23,730 | |
| Vontier Corp.2 | | | 434,000 | | | | 14,496 | |
| VeriSign, Inc.2 | | | 61,000 | | | | 13,200 | |
| GoDaddy Inc., Class A2 | | | 143,400 | | | | 11,895 | |
| Analog Devices, Inc. | | | 75,000 | | | | 11,080 | |
| | | | | | | | 7,687,389 | |
| | | | | | | | | |
| Communication services 15.48% | | | | | | | | |
| Facebook, Inc., Class A2 | | | 7,410,800 | | | | 2,024,334 | |
| Alphabet Inc., Class C2 | | | 336,784 | | | | 590,005 | |
| Alphabet Inc., Class A2 | | | 308,780 | | | | 541,180 | |
| Netflix, Inc.2 | | | 1,952,025 | | | | 1,055,518 | |
| Comcast Corp., Class A | | | 15,095,800 | | | | 791,020 | |
| Charter Communications, Inc., Class A2 | | | 443,970 | | | | 293,708 | |
| Electronic Arts Inc. | | | 1,168,000 | | | | 167,725 | |
| Verizon Communications Inc. | | | 2,665,513 | | | | 156,599 | |
| ViacomCBS Inc., Class B | | | 2,666,983 | | | | 99,372 | |
| Tencent Holdings Ltd.1 | | | 1,295,500 | | | | 94,659 | |
| Cable One, Inc. | | | 33,300 | | | | 74,183 | |
| Vodafone Group PLC1 | | | 20,000,000 | | | | 32,913 | |
| Activision Blizzard, Inc. | | | 262,939 | | | | 24,414 | |
| Fox Corp., Class A | | | 473,666 | | | | 13,793 | |
| | | | | | | | 5,959,423 | |
| 88 | American Funds Insurance Series |
Growth-Income Fund (continued)
| Common stocks (continued) | | Shares | | | Value
(000) | |
| Health care 14.22% | | | | | | | | |
| UnitedHealth Group Inc. | | | 2,609,900 | | | $ | 915,240 | |
| Abbott Laboratories | | | 6,645,169 | | | | 727,580 | |
| Gilead Sciences, Inc. | | | 9,502,600 | | | | 553,621 | |
| Amgen Inc. | | | 1,909,500 | | | | 439,032 | |
| Merck & Co., Inc. | | | 3,038,880 | | | | 248,580 | |
| Thermo Fisher Scientific Inc. | | | 392,000 | | | | 182,586 | |
| AstraZeneca PLC1 | | | 1,451,800 | | | | 145,048 | |
| AstraZeneca PLC (ADR) | | | 721,200 | | | | 36,053 | |
| Seagen Inc.2 | | | 871,319 | | | | 152,603 | |
| Daiichi Sankyo Company, Ltd.1 | | | 4,176,000 | | | | 143,155 | |
| AbbVie Inc. | | | 1,296,036 | | | | 138,870 | |
| PRA Health Sciences, Inc.2 | | | 1,023,500 | | | | 128,388 | |
| Royalty Pharma PLC, Class A | | | 2,557,706 | | | | 128,013 | |
| Novo Nordisk A/S, Class B1 | | | 1,611,056 | | | | 112,686 | |
| Chugai Pharmaceutical Co., Ltd.1 | | | 2,105,700 | | | | 112,421 | |
| Anthem, Inc. | | | 342,000 | | | | 109,813 | |
| GlaxoSmithKline PLC1 | | | 5,827,300 | | | | 106,774 | |
| Eli Lilly and Company | | | 625,800 | | | | 105,660 | |
| Medtronic PLC | | | 860,000 | | | | 100,740 | |
| Novartis AG1 | | | 1,066,059 | | | | 100,690 | |
| PerkinElmer, Inc. | | | 596,500 | | | | 85,598 | |
| Baxter International Inc. | | | 995,800 | | | | 79,903 | |
| Allakos Inc.2 | | | 511,000 | | | | 71,540 | |
| Ultragenyx Pharmaceutical Inc.2 | | | 508,100 | | | | 70,336 | |
| Galapagos NV1,2 | | | 268,105 | | | | 26,381 | |
| Galapagos NV (ADR)2,3 | | | 209,697 | | | | 20,756 | |
| Zimmer Biomet Holdings, Inc. | | | 305,670 | | | | 47,101 | |
| Vertex Pharmaceuticals Inc.2 | | | 192,000 | | | | 45,377 | |
| Incyte Corp.2 | | | 473,200 | | | | 41,159 | |
| NovoCure Ltd.2 | | | 193,600 | | | | 33,501 | |
| Roche Holding AG, nonvoting, non-registered shares1 | | | 93,081 | | | | 32,477 | |
| Allogene Therapeutics, Inc.2 | | | 1,258,500 | | | | 31,764 | |
| Edwards Lifesciences Corp.2 | | | 330,750 | | | | 30,174 | |
| AmerisourceBergen Corp. | | | 283,400 | | | | 27,705 | |
| Humana Inc. | | | 65,300 | | | | 26,791 | |
| Stryker Corp. | | | 106,535 | | | | 26,105 | |
| Biohaven Pharmaceutical Holding Co. Ltd.2 | | | 259,600 | | | | 22,250 | |
| Karuna Therapeutics, Inc.2 | | | 215,600 | | | | 21,903 | |
| Cigna Corp. | | | 59,413 | | | | 12,369 | |
| GoodRx Holdings, Inc., Class A2 | | | 243,100 | | | | 9,807 | |
| Cortexyme, Inc.2 | | | 258,690 | | | | 7,186 | |
| Vir Biotechnology, Inc.2,3 | | | 258,400 | | | | 6,920 | |
| Bluebird Bio, Inc.2 | | | 109,400 | | | | 4,734 | |
| Agios Pharmaceuticals, Inc.2 | | | 89,350 | | | | 3,871 | |
| | | | | | | | 5,473,261 | |
| | | | | | | | | |
| Financials 10.23% | | | | | | | | |
| JPMorgan Chase & Co. | | | 4,105,630 | | | | 521,702 | |
| Intercontinental Exchange, Inc. | | | 3,183,555 | | | | 367,032 | |
| CME Group Inc., Class A | | | 1,779,800 | | | | 324,013 | |
| Aon PLC, Class A | | | 1,214,800 | | | | 256,651 | |
| Marsh & McLennan Companies, Inc. | | | 2,162,201 | | | | 252,978 | |
| PNC Financial Services Group, Inc. | | | 1,587,422 | | | | 236,526 | |
| State Street Corp. | | | 3,126,915 | | | | 227,577 | |
| Nasdaq, Inc. | | | 1,609,900 | | | | 213,698 | |
| Chubb Ltd. | | | 1,239,153 | | | | 190,730 | |
| Moody’s Corp. | | | 640,058 | | | | 185,770 | |
| BlackRock, Inc. | | | 180,700 | | | | 130,382 | |
| Travelers Companies, Inc. | | | 906,955 | | | | 127,309 | |
| S&P Global Inc. | | | 342,408 | | | | 112,560 | |
| Bank of New York Mellon Corp. | | | 2,299,000 | | | | 97,570 | |
| American International Group, Inc. | | | 2,572,000 | | | | 97,376 | |
| American Funds Insurance Series | 89 |
Growth-Income Fund (continued)
| Common stocks (continued) | | Shares | | | Value
(000) | |
| Financials (continued) | | | | | | | | |
| KeyCorp | | | 4,886,953 | | | $ | 80,195 | |
| Arthur J. Gallagher & Co. | | | 617,000 | | | | 76,329 | |
| Power Corp. of Canada, subordinate voting shares3 | | | 2,625,000 | | | | 60,279 | |
| B3 SA - Brasil, Bolsa, Balcao | | | 5,032,000 | | | | 60,045 | |
| London Stock Exchange Group PLC1 | | | 424,000 | | | | 52,264 | |
| Citizens Financial Group, Inc. | | | 1,457,453 | | | | 52,119 | |
| Charles Schwab Corp. | | | 879,000 | | | | 46,622 | |
| Discover Financial Services | | | 478,900 | | | | 43,355 | |
| Truist Financial Corp. | | | 870,732 | | | | 41,734 | |
| Wells Fargo & Company | | | 1,222,300 | | | | 36,889 | |
| Bank of America Corp. | | | 914,300 | | | | 27,712 | |
| UBS Group AG1 | | | 1,343,666 | | | | 18,793 | |
| | | | | | | | 3,938,210 | |
| | | | | | | | | |
| Industrials 9.50% | | | | | | | | |
| CSX Corp. | | | 3,114,900 | | | | 282,677 | |
| Woodward, Inc. | | | 2,204,500 | | | | 267,913 | |
| Carrier Global Corp. | | | 6,668,375 | | | | 251,531 | |
| Norfolk Southern Corp. | | | 946,977 | | | | 225,011 | |
| Northrop Grumman Corp. | | | 733,200 | | | | 223,421 | |
| BWX Technologies, Inc. | | | 3,080,911 | | | | 185,717 | |
| TransDigm Group Inc.2 | | | 295,700 | | | | 182,994 | |
| Airbus SE, non-registered shares1,2 | | | 1,617,590 | | | | 177,691 | |
| Raytheon Technologies Corp. | | | 2,349,100 | | | | 167,984 | |
| Union Pacific Corp. | | | 746,200 | | | | 155,374 | |
| Meggitt PLC1,2 | | | 24,131,952 | | | | 154,177 | |
| Equifax Inc. | | | 777,300 | | | | 149,895 | |
| Waste Connections, Inc. | | | 1,042,100 | | | | 106,888 | |
| Lockheed Martin Corp. | | | 294,900 | | | | 104,684 | |
| Westinghouse Air Brake Technologies Corp. | | | 1,422,942 | | | | 104,159 | |
| Air Lease Corp., Class A | | | 2,097,300 | | | | 93,162 | |
| Waste Management, Inc. | | | 767,700 | | | | 90,535 | |
| L3Harris Technologies, Inc. | | | 443,000 | | | | 83,736 | |
| Old Dominion Freight Line, Inc. | | | 405,000 | | | | 79,048 | |
| Fortive Corp. | | | 1,085,000 | | | | 76,840 | |
| Safran SA1,2 | | | 539,713 | | | | 76,542 | |
| General Electric Co. | | | 7,022,250 | | | | 75,840 | |
| General Dynamics Corp. | | | 482,600 | | | | 71,821 | |
| Ryanair Holdings PLC (ADR)2 | | | 445,550 | | | | 49,002 | |
| Ryanair Holdings PLC1,2 | | | 611,907 | | | | 12,189 | |
| Middleby Corp.2 | | | 441,000 | | | | 56,854 | |
| Otis Worldwide Corp. | | | 555,100 | | | | 37,497 | |
| Fastenal Co. | | | 635,000 | | | | 31,007 | |
| ManpowerGroup Inc. | | | 252,000 | | | | 22,725 | |
| Cummins Inc. | | | 100,000 | | | | 22,710 | |
| Caterpillar Inc. | | | 101,600 | | | | 18,493 | |
| Nielsen Holdings PLC | | | 856,400 | | | | 17,873 | |
| | | | | | | | 3,655,990 | |
| | | | | | | | | |
| Consumer discretionary 8.11% | | | | | | | | |
| Amazon.com, Inc.2 | | | 346,130 | | | | 1,127,321 | |
| General Motors Company | | | 7,736,000 | | | | 322,127 | |
| Wyndham Hotels & Resorts, Inc. | | | 3,198,334 | | | | 190,109 | |
| Home Depot, Inc. | | | 623,900 | | | | 165,720 | |
| Royal Caribbean Cruises Ltd. | | | 2,084,381 | | | | 155,683 | |
| Burlington Stores, Inc.2 | | | 555,458 | | | | 145,280 | |
| Thor Industries, Inc. | | | 1,289,600 | | | | 119,920 | |
| MercadoLibre, Inc.2 | | | 70,000 | | | | 117,265 | |
| Lowe’s Companies, Inc. | | | 666,000 | | | | 106,900 | |
| Booking Holdings Inc.2 | | | 47,600 | | | | 106,018 | |
| Flutter Entertainment PLC (GBP denominated)1 | | | 387,005 | | | | 80,125 | |
| Chipotle Mexican Grill, Inc.2 | | | 53,110 | | | | 73,648 | |
| 90 | American Funds Insurance Series |
Growth-Income Fund (continued)
| Common stocks (continued) | | Shares | | | Value
(000) | |
| Consumer discretionary (continued) | | | | | | | | |
| Darden Restaurants, Inc. | | | 600,000 | | | $ | 71,472 | |
| D.R. Horton, Inc. | | | 913,000 | | | | 62,924 | |
| Hasbro, Inc. | | | 600,000 | | | | 56,124 | |
| Wynn Resorts, Ltd. | | | 490,966 | | | | 55,396 | |
| Kering SA1 | | | 62,207 | | | | 45,224 | |
| Marriott International, Inc., Class A | | | 250,500 | | | | 33,046 | |
| Aptiv PLC | | | 233,000 | | | | 30,358 | |
| Hilton Worldwide Holdings Inc. | | | 197,720 | | | | 21,998 | |
| YUM! Brands, Inc. | | | 196,630 | | | | 21,346 | |
| Airbnb, Inc., Class A2 | | | 99,500 | | | | 14,607 | |
| | | | | | | | 3,122,611 | |
| | | | | | | | | |
| Consumer staples 5.06% | | | | | | | | |
| Keurig Dr Pepper Inc. | | | 10,220,935 | | | | 327,070 | |
| British American Tobacco PLC1 | | | 8,704,673 | | | | 323,770 | |
| Philip Morris International Inc. | | | 3,549,640 | | | | 293,875 | |
| Costco Wholesale Corp. | | | 459,800 | | | | 173,243 | |
| Nestlé SA1 | | | 1,227,796 | | | | 144,547 | |
| Lamb Weston Holdings, Inc. | | | 1,506,566 | | | | 118,627 | |
| Carlsberg A/S, Class B1 | | | 720,474 | | | | 115,505 | |
| Reckitt Benckiser Group PLC1 | | | 1,275,000 | | | | 114,030 | |
| Mondelez International, Inc. | | | 1,676,300 | | | | 98,013 | |
| Clorox Co. | | | 255,000 | | | | 51,490 | |
| Herbalife Nutrition Ltd.2 | | | 849,000 | | | | 40,795 | |
| Church & Dwight Co., Inc. | | | 424,500 | | | | 37,029 | |
| General Mills, Inc. | | | 428,800 | | | | 25,213 | |
| Pernod Ricard SA1 | | | 117,200 | | | | 22,466 | |
| Constellation Brands, Inc., Class A | | | 100,700 | | | | 22,058 | |
| Anheuser-Busch InBev SA/NV1 | | | 281,571 | | | | 19,677 | |
| Kraft Heinz Company | | | 567,200 | | | | 19,659 | |
| | | | | | | | 1,947,067 | |
| | | | | | | | | |
| Materials 4.89% | | | | | | | | |
| Celanese Corp. | | | 2,593,233 | | | | 336,965 | |
| LyondellBasell Industries NV | | | 2,453,100 | | | | 224,851 | |
| Vale SA, ordinary nominative (ADR) | | | 9,206,039 | | | | 154,293 | |
| Vale SA, ordinary nominative | | | 3,404,848 | | | | 57,325 | |
| Linde PLC | | | 774,300 | | | | 204,036 | |
| Dow Inc. | | | 2,859,700 | | | | 158,713 | |
| Sherwin-Williams Company | | | 162,500 | | | | 119,423 | |
| International Flavors & Fragrances Inc.3 | | | 1,075,000 | | | | 117,003 | |
| Freeport-McMoRan Inc. | | | 4,073,000 | | | | 105,980 | |
| Air Products and Chemicals, Inc. | | | 312,100 | | | | 85,272 | |
| Rio Tinto PLC1 | | | 1,020,655 | | | | 76,369 | |
| Barrick Gold Corp. | | | 2,373,000 | | | | 54,057 | |
| Mosaic Co. | | | 2,333,266 | | | | 53,688 | |
| PPG Industries, Inc. | | | 295,550 | | | | 42,624 | |
| Centerra Gold Inc. | | | 2,917,909 | | | | 33,789 | |
| DuPont de Nemours Inc. | | | 459,700 | | | | 32,689 | |
| Asahi Kasei Corp.1 | | | 2,392,300 | | | | 24,606 | |
| | | | | | | | 1,881,683 | |
| | | | | | | | | |
| Energy 3.42% | | | | | | | | |
| Canadian Natural Resources, Ltd. (CAD denominated) | | | 10,768,800 | | | | 258,793 | |
| Chevron Corp. | | | 2,670,200 | | | | 225,498 | |
| Enbridge Inc. (CAD denominated) | | | 5,382,362 | | | | 172,139 | |
| EOG Resources, Inc. | | | 3,255,400 | | | | 162,347 | |
| Baker Hughes Co., Class A | | | 5,510,024 | | | | 114,884 | |
| ConocoPhillips | | | 2,307,010 | | | | 92,257 | |
| Equitrans Midstream Corp. | | | 8,547,400 | | | | 68,721 | |
| Schlumberger Ltd. | | | 2,727,900 | | | | 59,550 | |
| Royal Dutch Shell PLC, Class B (ADR) | | | 1,622,300 | | | | 54,525 | |
| American Funds Insurance Series | 91 |
Growth-Income Fund (continued)
| Common stocks (continued) | | Shares | | | Value
(000) | |
| Energy (continued) | | | | | | | | |
| Royal Dutch Shell PLC, Class A (ADR) | | | 13,204 | | | $ | 464 | |
| TC Energy Corp. (CAD denominated)3 | | | 1,168,019 | | | | 47,486 | |
| Concho Resources Inc. | | | 653,000 | | | | 38,103 | |
| Exxon Mobil Corp. | | | 500,000 | | | | 20,610 | |
| Tullow Oil PLC1,2 | | | 3,674,051 | | | | 1,473 | |
| Weatherford International2 | | | 128,424 | | | | 771 | |
| | | | | | | | 1,317,621 | |
| | | | | | | | | |
| Utilities 2.89% | | | | | | | | |
| Edison International | | | 2,916,721 | | | | 183,228 | |
| CenterPoint Energy, Inc. | | | 6,548,899 | | | | 141,718 | |
| Enel SpA1 | | | 13,587,341 | | | | 137,210 | |
| AES Corp. | | | 5,203,200 | | | | 122,275 | |
| Sempra Energy | | | 750,000 | | | | 95,557 | |
| American Electric Power Company, Inc. | | | 1,036,600 | | | | 86,318 | |
| Exelon Corp. | | | 1,576,100 | | | | 66,543 | |
| Endesa, SA1 | | | 2,286,838 | | | | 62,703 | |
| PG&E Corp.2 | | | 4,171,900 | | | | 51,982 | |
| CMS Energy Corp. | | | 692,700 | | | | 42,262 | |
| Public Service Enterprise Group Inc. | | | 686,500 | | | | 40,023 | |
| Xcel Energy Inc. | | | 423,300 | | | | 28,221 | |
| Entergy Corp. | | | 274,900 | | | | 27,446 | |
| DTE Energy Company | | | 125,900 | | | | 15,286 | |
| E.ON SE1 | | | 937,841 | | | | 10,387 | |
| | | | | | | | 1,111,159 | |
| | | | | | | | | |
| Real estate 2.56% | | | | | | | | |
| Equinix, Inc. REIT | | | 541,418 | | | | 386,670 | |
| Crown Castle International Corp. REIT | | | 1,561,966 | | | | 248,649 | |
| MGM Growth Properties LLC REIT, Class A | | | 3,346,000 | | | | 104,730 | |
| American Tower Corp. REIT | | | 421,300 | | | | 94,565 | |
| Digital Realty Trust, Inc. REIT | | | 645,000 | | | | 89,984 | |
| SBA Communications Corp. REIT | | | 210,000 | | | | 59,247 | |
| | | | | | | | 983,845 | |
| | | | | | | | | |
| Total common stocks (cost: $22,668,560,000) | | | | | | | 37,078,259 | |
| | | | | | | | | |
| Convertible stocks 0.81% | | | | | | | | |
| Health care 0.47% | | | | | | | | |
| Danaher Corp., Series B, cumulative convertible preferred shares, 5.00% 20233 | | | 80,972 | | | | 105,353 | |
| Danaher Corp., Series A, cumulative convertible preferred shares, 4.75% 2022 | | | 50,000 | | | | 75,882 | |
| | | | | | | | 181,235 | |
| | | | | | | | | |
| Information technology 0.33% | | | | | | | | |
| Broadcom Inc., Series A, cumulative convertible preferred shares, 8.00% 2022 | | | 88,400 | | | | 125,746 | |
| | | | | | | | | |
| Industrials 0.01% | | | | | | | | |
| Stanley Black & Decker, Inc., convertible preferred shares, 5.25% 2022 | | | 35,448 | | | | 3,965 | |
| | | | | | | | | |
| Consumer discretionary 0.00% | | | | | | | | |
| Aptiv PLC, Series A, convertible preferred shares, 5.50% 2023 | | | 675 | | | | 104 | |
| | | | | | | | | |
| Total convertible stocks (cost: $234,248,000) | | | | | | | 311,050 | |
| 92 | American Funds Insurance Series |
Growth-Income Fund (continued)
| | | | | | | |
| Bonds, notes & other debt instruments 0.12% | | Principal amount
(000) | | | Value
(000) | |
| Corporate bonds, notes & loans 0.12% | | | | | | | | |
| Consumer discretionary 0.09% | | | | | | | | |
| Carnival Corp. 11.50% 20234 | | $ | 27,790 | | | $ | 32,174 | |
| General Motors Financial Co. 4.30% 2025 | | | 160 | | | | 180 | |
| General Motors Financial Co. 5.25% 2026 | | | 827 | | | | 976 | |
| | | | | | | | 33,330 | |
| | | | | | | | | |
| Energy 0.02% | | | | | | | | |
| Weatherford International PLC 8.75% 20244 | | | 1,983 | | | | 1,990 | |
| Weatherford International PLC 11.00% 20244 | | | 5,280 | | | | 4,132 | |
| | | | | | | | 6,122 | |
| | | | | | | | | |
| Industrials 0.01% | | | | | | | | |
| Boeing Company 4.875% 2025 | | | 4,706 | | | | 5,367 | |
| | | | | | | | | |
| Total corporate bonds, notes & loans | | | | | | | 44,819 | |
| | | | | | | | | |
| Total bonds, notes & other debt instruments (cost: $40,235,000) | | | | | | | 44,819 | |
| | | | | | | | | |
| Short-term securities 3.06% | | | Shares | | | | | |
| Money market investments 3.06% | | | | | | | | |
| Capital Group Central Cash Fund 0.12%5,6 | | | 10,056,640 | | | | 1,005,764 | |
| Goldman Sachs Financial Square Government Fund, Institutional Shares 0.02%5,7 | | | 174,462,623 | | | | 174,463 | |
| | | | | | | | 1,180,227 | |
| | | | | | | | | |
| Total short-term securities (cost: $1,180,023,000) | | | | | | | 1,180,227 | |
| Total investment securities 100.32% (cost: $24,123,066,000) | | | | | | | 38,614,355 | |
| Other assets less liabilities (0.32)% | | | | | | | (122,820 | ) |
| | | | | | | | | |
| Net assets 100.00% | | | | | | $ | 38,491,535 | |
| Investments in affiliates6 | | | | | | | | | | | | | | | | | | |
| | | Value of
affiliates at
1/1/2020
(000) | | | Additions
(000) | | | Reductions
(000) | | | Net
realized
(loss) gain
(000) | | | Net
unrealized
depreciation
(000) | | | Value of
affiliates at
12/31/2020
(000) | | | Dividend
income
(000) | |
| Common stocks 0.00% | | | | | | | | | | | | | | | | | | | | | | | | | | | | |
| Industrials 0.00% | | | | | | | | | | | | | | | | | | | | | | | | | |
| BWX Technologies, Inc.8 | | $ | 336,143 | | | $ | 16,890 | | | $ | 138,597 | | | $ | (18,623 | ) | | $ | (10,096 | ) | | $ | — | | | $ | 3,020 | |
| Short-term securities 2.61% | | | | | | | | | | | | | | | | | | | | | | | | | | | | |
| Money market investments 2.61% | | | | | | | | | | | | | | | | | | | | | | | | | |
| Capital Group Central Cash Fund 0.12%5 | | | 1,940,600 | | | | 5,169,467 | | | | 6,103,677 | | | | 262 | | | | (888 | ) | | | 1,005,764 | | | | 9,905 | |
| Total 2.61% | | | | | | | | | | | | | | $ | (18,361 | ) | | $ | (10,984 | ) | | $ | 1,005,764 | | | $ | 12,925 | |
| 1 | Valued under fair value procedures adopted by authority of the board of trustees. The total value of all such securities was $2,949,615,000, which represented 7.66% of the net assets of the fund. This entire amount relates to certain securities trading outside the U.S. whose values were adjusted as a result of significant market movements following the close of local trading. |
| 2 | Security did not produce income during the last 12 months. |
| 3 | All or a portion of this security was on loan. The total value of all such securities was $188,806,000, which represented .49% of the net assets of the fund. Refer to Note 5 for more information on securities lending. |
| 4 | Acquired in a transaction exempt from registration under Rule 144A of the Securities Act of 1933. May be resold in the U.S. in transactions exempt from registration, normally to qualified institutional buyers. The total value of all such securities was $38,296,000, which represented .10% of the net assets of the fund. |
| 5 | Rate represents the seven-day yield at 12/31/2020. |
| 6 | Affiliate of the fund or part of the same group of investment companies as the fund, in each case as defined under the Investment Company Act of 1940. |
| 7 | Security purchased with cash collateral from securities on loan. Refer to Note 5 for more information on securities lending. |
| 8 | Unaffiliated issuer at 12/31/2020. |
| American Funds Insurance Series | 93 |
Growth-Income Fund (continued)
Key to abbreviations
ADR = American Depositary Receipts
CAD = Canadian dollars
GBP = British pounds
See notes to financial statements.
| 94 | American Funds Insurance Series |
International Growth and Income Fund
Investment portfolio December 31, 2020
| Common stocks 94.17% | | Shares | | | Value
(000) | |
| Financials 17.86% | | | | | | | | |
| HDFC Bank Ltd.1,2 | | | 2,457,600 | | | $ | 48,410 | |
| AIA Group Ltd.1 | | | 2,338,600 | | | | 28,806 | |
| ING Groep NV1,2 | | | 2,789,300 | | | | 26,424 | |
| Zurich Insurance Group AG1 | | | 54,100 | | | | 22,930 | |
| DNB ASA1,2 | | | 825,000 | | | | 16,243 | |
| B3 SA - Brasil, Bolsa, Balcao | | | 1,302,000 | | | | 15,536 | |
| Sberbank of Russia PJSC (ADR)1 | | | 999,000 | | | | 14,402 | |
| IndusInd Bank Ltd.1,2 | | | 1,105,000 | | | | 13,577 | |
| Moscow Exchange MICEX-RTS PJSC1 | | | 5,665,000 | | | | 12,224 | |
| DBS Group Holdings Ltd.1 | | | 558,000 | | | | 10,555 | |
| Banco Santander, SA1,2 | | | 3,393,521 | | | | 10,536 | |
| Haci Ömer Sabanci Holding AS1 | | | 6,520,900 | | | | 10,063 | |
| Aegon NV1 | | | 2,483,308 | | | | 9,917 | |
| Ping An Insurance (Group) Company of China, Ltd., Class H1 | | | 690,500 | | | | 8,481 | |
| PICC Property and Casualty Co. Ltd., Class H1 | | | 7,905,000 | | | | 5,989 | |
| Great-West Lifeco Inc. (CAD denominated) | | | 248,102 | | | | 5,916 | |
| | | | | | | | 260,009 | |
| | | | | | | | | |
| Industrials 12.94% | | | | | | | | |
| Shanghai International Airport Co., Ltd., Class A1 | | | 3,091,967 | | | | 35,788 | |
| Airbus SE, non-registered shares1,2 | | | 246,912 | | | | 27,123 | |
| Ryanair Holdings PLC (ADR)2 | | | 179,000 | | | | 19,686 | |
| Singapore Technologies Engineering Ltd1 | | | 5,270,000 | | | | 15,216 | |
| SAAB AB, Class B1,2 | | | 510,000 | | | | 14,838 | |
| Recruit Holdings Co., Ltd.1 | | | 319,900 | | | | 13,418 | |
| Komatsu Ltd.1 | | | 445,000 | | | | 12,194 | |
| Alliance Global Group, Inc.1 | | | 54,617,900 | | | | 12,062 | |
| Airports of Thailand PCL, foreign registered1 | | | 5,250,000 | | | | 10,824 | |
| GT Capital Holdings, Inc.1 | | | 797,142 | | | | 9,715 | |
| Aena SME, SA, non-registered shares1,2 | | | 52,450 | | | | 9,159 | |
| LIXIL Corp.1 | | | 385,000 | | | | 8,362 | |
| | | | | | | | 188,385 | |
| | | | | | | | | |
| Communication services 12.10% | | | | | | | | |
| SoftBank Corp.1 | | | 4,691,700 | | | | 58,818 | |
| SoftBank Group Corp.1 | | | 580,800 | | | | 45,486 | |
| Yandex NV, Class A2 | | | 470,000 | | | | 32,702 | |
| Tencent Holdings Ltd.1 | | | 297,700 | | | | 21,752 | |
| Rightmove PLC1,2 | | | 1,290,000 | | | | 11,488 | |
| Bilibili Inc., Class Z (ADR)2,3 | | | 69,200 | | | | 5,932 | |
| | | | | | | | 176,178 | |
| | | | | | | | | |
| Consumer discretionary 11.91% | | | | | | | | |
| LVMH Moët Hennessy-Louis Vuitton SE1 | | | 48,000 | | | | 29,992 | |
| Sony Corp.1 | | | 265,900 | | | | 26,734 | |
| Taylor Wimpey PLC1,2 | | | 10,317,400 | | | | 23,457 | |
| Kering SA1 | | | 29,000 | | | | 21,083 | |
| Naspers Ltd., Class N1 | | | 95,400 | | | | 19,526 | |
| Flutter Entertainment PLC (GBP denominated)1 | | | 73,000 | | | | 15,114 | |
| Alibaba Group Holding Ltd.1,2 | | | 442,500 | | | | 12,929 | |
| Galaxy Entertainment Group Ltd.1 | | | 1,345,000 | | | | 10,461 | |
| Entain PLC1,2 | | | 494,100 | | | | 7,670 | |
| Prosus NV1 | | | 59,100 | | | | 6,357 | |
| | | | | | | | 173,323 | |
| | | | | | | | | |
| Health care 9.62% | | | | | | | | |
| Daiichi Sankyo Company, Ltd.1 | | | 1,359,000 | | | | 46,587 | |
| Aier Eye Hospital Group Co., Ltd., Class A1 | | | 1,937,655 | | | | 22,193 | |
| Fresenius SE & Co. KGaA1 | | | 283,701 | | | | 13,109 | |
| Chugai Pharmaceutical Co., Ltd.1 | | | 228,900 | | | | 12,221 | |
| HOYA Corp.1 | | | 85,000 | | | | 11,750 | |
| Novartis AG1 | | | 113,564 | | | | 10,726 | |
| American Funds Insurance Series | 95 |
International Growth and Income Fund (continued)
| Common stocks (continued) | | Shares | | | Value
(000) | |
| Health care (continued) | | | | | | | | |
| GlaxoSmithKline PLC1 | | | 386,500 | | | $ | 7,082 | |
| Richter Gedeon Nyrt.1 | | | 265,232 | | | | 6,656 | |
| Teva Pharmaceutical Industries Ltd. (ADR)2 | | | 662,000 | | | | 6,388 | |
| Alcon Inc.1,2 | | | 48,672 | | | | 3,249 | |
| NMC Health PLC1,2,4 | | | 304,610 | | | | 4 | |
| | | | | | | | 139,965 | |
| | | | | | | | | |
| Materials 6.96% | | | | | | | | |
| Vale SA, ordinary nominative | | | 1,712,500 | | | | 28,832 | |
| Vale SA, ordinary nominative (ADR) | | | 424,300 | | | | 7,111 | |
| Rio Tinto PLC1 | | | 379,300 | | | | 28,381 | |
| Linde PLC | | | 53,000 | | | | 13,966 | |
| Air Liquide SA, non-registered shares1 | | | 79,200 | | | | 12,999 | |
| Akzo Nobel NV1 | | | 93,955 | | | | 10,092 | |
| | | | | | | | 101,381 | |
| | | | | | | | | |
| Consumer staples 6.72% | | | | | | | | |
| Imperial Brands PLC1 | | | 2,228,016 | | | | 46,814 | |
| Treasury Wine Estates Ltd.1 | | | 2,607,742 | | | | 18,916 | |
| Philip Morris International Inc. | | | 140,000 | | | | 11,591 | |
| British American Tobacco PLC1 | | | 216,802 | | | | 8,064 | |
| Pernod Ricard SA1 | | | 39,400 | | | | 7,553 | |
| Kirin Holdings Company, Ltd.1 | | | 209,500 | | | | 4,946 | |
| | | | | | | | 97,884 | |
| | | | | | | | | |
| Information technology 5.36% | | | | | | | | |
| ASML Holding NV1 | | | 47,800 | | | | 23,100 | |
| Nice Ltd. (ADR)2 | | | 73,400 | | | | 20,812 | |
| Taiwan Semiconductor Manufacturing Company, Ltd.1 | | | 1,010,000 | | | | 18,969 | |
| SUMCO Corp.1 | | | 692,000 | | | | 15,193 | |
| | | | | | | | 78,074 | |
| | | | | | | | | |
| Utilities 5.20% | | | | | | | | |
| E.ON SE1 | | | 2,453,000 | | | | 27,167 | |
| ENN Energy Holdings Ltd.1 | | | 1,358,000 | | | | 19,933 | |
| Ørsted AS1 | | | 63,707 | | | | 13,030 | |
| Iberdrola, SA, non-registered shares1 | | | 623,669 | | | | 8,919 | |
| SSE PLC1 | | | 325,350 | | | | 6,706 | |
| | | | | | | | 75,755 | |
| | | | | | | | | |
| Energy 2.84% | | | | | | | | |
| Royal Dutch Shell PLC, Class A (GBP denominated)1 | | | 792,000 | | | | 14,061 | |
| Royal Dutch Shell PLC, Class B1 | | | 482,000 | | | | 8,304 | |
| Canadian Natural Resources, Ltd. (CAD denominated) | | | 272,500 | | | | 6,549 | |
| Canadian Natural Resources, Ltd. | | | 92,000 | | | | 2,212 | |
| Cenovus Energy Inc. | | | 935,000 | | | | 5,692 | |
| Total SE1,3 | | | 104,750 | | | | 4,519 | |
| | | | | | | | 41,337 | |
| | | | | | | | | |
| Real estate 2.66% | | | | | | | | |
| CK Asset Holdings Ltd.1 | | | 2,626,000 | | | | 13,507 | |
| China Resources Mixc Lifestyle Services Ltd.1,2 | | | 2,193,461 | | | | 10,171 | |
| Sun Hung Kai Properties Ltd.1 | | | 747,000 | | | | 9,644 | |
| China Resources Land Ltd.1 | | | 1,308,000 | | | | 5,420 | |
| | | | | | | | 38,742 | |
| | | | | | | | | |
| Total common stocks (cost: $998,798,000) | | | | | | | 1,371,033 | |
| 96 | American Funds Insurance Series |
International Growth and Income Fund (continued)
| Preferred securities 1.67% | | Shares | | | Value
(000) | |
| Energy 1.67% | | | | | | |
| Petróleo Brasileiro SA (Petrobras), preferred nominative (ADR) | | | 1,182,200 | | | $ | 13,075 | |
| Petróleo Brasileiro SA (Petrobras), preferred nominative | | | 2,062,500 | | | | 11,253 | |
| | | | | | | | 24,328 | |
| | | | | | | | | |
| Total preferred securities (cost: $16,583,000) | | | | | | | 24,328 | |
| | | | | | | | | |
| Rights & warrants 1.05% | | | | | | | | |
| Health care 1.05% | | | | | | | | |
| Aier Eye Hospital Group Co., Ltd., Class A, warrants, expire 20211,5 | | | 958,500 | | | | 10,978 | |
| Aier Eye Hospital Group Co., Ltd., Class A, warrants, expire 20211,2,5 | | | 382,799 | | | | 4,319 | |
| | | | | | | | | |
| Total rights & warrants (cost: $8,134,000) | | | | | | | 15,297 | |
| | | | | | | | | |
| Bonds, notes & other debt instruments 0.61% | Principal amount
(000) | | | | | |
| Bonds & notes of governments & government agencies outside the U.S. 0.34% | | | | | | |
| Brazil (Federative Republic of) 10.00% 2025 | | BRL | 22,000 | | | | 4,900 | |
| | | | | | | | | |
| Corporate bonds, notes & loans 0.27% | | | | | | | | |
| Health care 0.27% | | | | | | | | |
| Teva Pharmaceutical Finance Co. BV 3.15% 2026 | | $ | 1,060 | | | | 1,021 | |
| Teva Pharmaceutical Finance Co. BV 4.10% 2046 | | | 1,160 | | | | 1,035 | |
| Valeant Pharmaceuticals International, Inc. 6.125% 20255 | | | 1,865 | | | | 1,924 | |
| | | | | | | | 3,980 | |
| | | | | | | | | |
| Total bonds, notes & other debt instruments (cost: $9,565,000) | | | | | | | 8,880 | |
| | | | | | | | | |
| Short-term securities 2.62% | | | Shares | | | | | |
| Money market investments 2.62% | | | | | | | | |
| Capital Group Central Cash Fund 0.12%6,7 | | | 317,516 | | | | 31,755 | |
| Goldman Sachs Financial Square Government Fund, Institutional Shares 0.02%6,8 | | | 6,385,194 | | | | 6,385 | |
| | | | | | | | | |
| Total short-term securities (cost: $38,133,000) | | | | | | | 38,140 | |
| Total investment securities 100.12% (cost: $1,071,213,000) | | | | | | | 1,457,678 | |
| Other assets less liabilities (0.12)% | | | | | | | (1,795 | ) |
| | | | | | | | | |
| Net assets 100.00% | | | | | | $ | 1,455,883 | |
| Investments in affiliates7 | | | | | | | | | | | | | | | | |
| | | Value of
affiliate at
1/1/2020
(000) | | | Additions
(000) | | | Reductions
(000) | | | Net
realized
gain
(000) | | | Net
unrealized
depreciation
(000) | | | Value of
affiliate at
12/31/2020
(000) | | | Dividend
income
(000) | |
| Short-term securities 2.18% | | | | | | | | | | | | | | | | | | | | | | | | | | | | |
| Money market investments 2.18% | | | | | | | | | | | | | | | | | | | | |
| Capital Group Central Cash Fund 0.12%6 | | $ | 128,026 | | | $ | 424,730 | | | $ | 520,991 | | | $ | 29 | | | $ | (39 | ) | | $ | 31,755 | | | $ | 543 | |
| American Funds Insurance Series | 97 |
International Growth and Income Fund (continued)
| 1 | Valued under fair value procedures adopted by authority of the board of trustees. The total value of all such securities was $1,203,405,000, which represented 82.66% of the net assets of the fund. This amount includes $1,203,401,000 related to certain securities trading outside the U.S. whose values were adjusted as a result of significant market movements following the close of local trading. |
| 2 | Security did not produce income during the last 12 months. |
| 3 | All or a portion of this security was on loan. The total value of all such securities was $6,820,000, which represented .47% of the net assets of the fund. Refer to Note 5 for more information on securities lending. |
| 4 | Value determined using significant unobservable inputs. |
| 5 | Acquired in a transaction exempt from registration under Rule 144A of the Securities Act of 1933. May be resold in the U.S. in transactions exempt from registration, normally to qualified institutional buyers. The total value of all such securities was $17,221,000, which represented 1.18% of the net assets of the fund. |
| 6 | Rate represents the seven-day yield at 12/31/2020. |
| 7 | Part of the same group of investment companies as the fund as defined under the Investment Company Act of 1940. |
| 8 | Security purchased with cash collateral from securities on loan. Refer to Note 5 for more information on securities lending. |
Key to abbreviations
ADR = American Depositary Receipts
BRL = Brazilian reais
CAD = Canadian dollars
GBP = British pounds
See notes to financial statements.
| 98 | American Funds Insurance Series |
Capital Income Builder
Investment portfolio December 31, 2020
| Common stocks 73.08% | | Shares | | | Value
(000) | |
| Financials 13.08% | | | | | | |
| Zurich Insurance Group AG1 | | | 31,951 | | | $ | 13,542 | |
| JPMorgan Chase & Co. | | | 93,281 | | | | 11,853 | |
| Toronto-Dominion Bank (CAD denominated) | | | 177,227 | | | | 10,014 | |
| Münchener Rückversicherungs-Gesellschaft AG1 | | | 32,434 | | | | 9,606 | |
| Ping An Insurance (Group) Company of China, Ltd., Class H1 | | | 519,000 | | | | 6,375 | |
| Ping An Insurance (Group) Company of China, Ltd., Class A1 | | | 67,300 | | | | 895 | |
| Truist Financial Corp. | | | 146,476 | | | | 7,021 | |
| CME Group Inc., Class A | | | 37,418 | | | | 6,812 | |
| Hong Kong Exchanges and Clearing Ltd.1 | | | 107,600 | | | | 5,918 | |
| PNC Financial Services Group, Inc. | | | 38,822 | | | | 5,784 | |
| DBS Group Holdings Ltd.1 | | | 258,926 | | | | 4,898 | |
| Power Corp. of Canada, subordinate voting shares | | | 200,855 | | | | 4,612 | |
| Principal Financial Group, Inc. | | | 89,574 | | | | 4,444 | |
| Great-West Lifeco Inc. (CAD denominated) | | | 179,325 | | | | 4,276 | |
| State Street Corp. | | | 56,582 | | | | 4,118 | |
| Citizens Financial Group, Inc. | | | 99,875 | | | | 3,572 | |
| American International Group, Inc. | | | 78,458 | | | | 2,970 | |
| Kaspi.kz JSC1,2,3 | | | 42,503 | | | | 2,855 | |
| Kaspi.kz JSC (GDR)1,2 | | | 528 | | | | 35 | |
| Royal Bank of Canada | | | 34,719 | | | | 2,853 | |
| China Pacific Insurance (Group) Co., Ltd., Class H1 | | | 672,000 | | | | 2,639 | |
| KeyCorp | | | 159,523 | | | | 2,618 | |
| Citigroup Inc. | | | 34,320 | | | | 2,116 | |
| East West Bancorp, Inc. | | | 41,043 | | | | 2,081 | |
| Moscow Exchange MICEX-RTS PJSC1 | | | 879,942 | | | | 1,899 | |
| Travelers Companies, Inc. | | | 13,301 | | | | 1,867 | |
| Sberbank of Russia PJSC (ADR)1 | | | 124,715 | | | | 1,798 | |
| DNB ASA1,2 | | | 89,834 | | | | 1,769 | |
| AIA Group Ltd.1 | | | 109,200 | | | | 1,345 | |
| U.S. Bancorp | | | 27,892 | | | | 1,300 | |
| National Bank of Canada (Canada) | | | 21,800 | | | | 1,227 | |
| BOC Hong Kong (Holdings) Ltd.1 | | | 401,500 | | | | 1,220 | |
| BNP Paribas SA1,2 | | | 21,885 | | | | 1,154 | |
| Tryg A/S1 | | | 32,699 | | | | 1,031 | |
| Franklin Resources, Inc. | | | 36,936 | | | | 923 | |
| PICC Property and Casualty Co. Ltd., Class H1 | | | 1,170,000 | | | | 887 | |
| Everest Re Group, Ltd. | | | 3,444 | | | | 806 | |
| Banco Santander, SA1,2 | | | 256,104 | | | | 795 | |
| Banca Mediolanum SpA1,2 | | | 79,459 | | | | 688 | |
| B3 SA - Brasil, Bolsa, Balcao | | | 51,891 | | | | 619 | |
| Marsh & McLennan Companies, Inc. | | | 5,080 | | | | 594 | |
| China Merchants Bank Co., Ltd., Class H1 | | | 92,000 | | | | 584 | |
| Euronext NV1 | | | 3,260 | | | | 359 | |
| Wells Fargo & Company | | | 9,632 | | | | 291 | |
| The Blackstone Group Inc., Class A | | | 2,897 | | | | 188 | |
| UBS Group AG1 | | | 12,103 | | | | 169 | |
| TISCO Financial Group PCL, foreign registered1 | | | 31,200 | | | | 93 | |
| | | | | | | | 143,513 | |
| | | | | | | | | |
| Information technology 9.11% | | | | | | | | |
| Broadcom Inc. | | | 85,538 | | | | 37,453 | |
| Microsoft Corp. | | | 80,505 | | | | 17,906 | |
| Taiwan Semiconductor Manufacturing Company, Ltd.1 | | | 710,800 | | | | 13,350 | |
| Vanguard International Semiconductor Corp.1 | | | 1,036,700 | | | | 4,296 | |
| International Business Machines Corp. | | | 29,876 | | | | 3,761 | |
| Intel Corp. | | | 70,500 | | | | 3,512 | |
| NetApp, Inc. | | | 51,604 | | | | 3,418 | |
| Globalwafers Co., Ltd.1 | | | 111,000 | | | | 2,809 | |
| Paychex, Inc. | | | 30,081 | | | | 2,803 | |
| Western Union Company | | | 127,630 | | | | 2,800 | |
| QUALCOMM Inc. | | | 14,936 | | | | 2,275 | |
| KLA Corp. | | | 8,387 | | | | 2,172 | |
| American Funds Insurance Series | 99 |
Capital Income Builder (continued)
| Common stocks (continued) | | Shares | | | Value
(000) | |
| Information technology (continued) | | | | | | | | |
| Apple Inc. | | | 11,238 | | | $ | 1,491 | |
| Texas Instruments Inc. | | | 6,003 | | | | 985 | |
| Tokyo Electron Ltd.1 | | | 2,300 | | | | 858 | |
| | | | | | | | 99,889 | |
| | | | | | | | | |
| Consumer staples 9.03% | | | | | | | | |
| Philip Morris International Inc. | | | 310,514 | | | | 25,706 | |
| British American Tobacco PLC1 | | | 439,883 | | | | 16,361 | |
| Coca-Cola Company | | | 141,409 | | | | 7,755 | |
| Altria Group, Inc. | | | 157,834 | | | | 6,471 | |
| General Mills, Inc. | | | 103,684 | | | | 6,097 | |
| Nestlé SA1 | | | 49,230 | | | | 5,796 | |
| Unilever PLC1 | | | 77,436 | | | | 4,661 | |
| Imperial Brands PLC1 | | | 204,285 | | | | 4,292 | |
| Carlsberg A/S, Class B1 | | | 25,128 | | | | 4,029 | |
| Danone SA1 | | | 48,065 | | | | 3,159 | |
| Kraft Heinz Company | | | 54,961 | | | | 1,905 | |
| Anheuser-Busch InBev SA/NV1 | | | 25,927 | | | | 1,812 | |
| ITC Ltd.1 | | | 581,859 | | | | 1,667 | |
| Kirin Holdings Company, Ltd.1 | | | 63,700 | | | | 1,504 | |
| Kimberly-Clark Corp. | | | 10,979 | | | | 1,480 | |
| Keurig Dr Pepper Inc. | | | 43,352 | | | | 1,387 | |
| Japan Tobacco Inc.1,4 | | | 62,300 | | | | 1,270 | |
| Reckitt Benckiser Group PLC1 | | | 14,019 | | | | 1,254 | |
| Vector Group Ltd. | | | 102,492 | | | | 1,194 | |
| Procter & Gamble Company | | | 4,639 | | | | 645 | |
| PepsiCo, Inc. | | | 3,593 | | | | 533 | |
| Treasury Wine Estates Ltd.1 | | | 13,106 | | | | 95 | |
| Convenience Retail Asia Ltd.1 | | | 510,000 | | | | 39 | |
| | | | | | | | 99,112 | |
| | | | | | | | | |
| Health care 8.92% | | | | | | | | |
| AbbVie Inc. | | | 195,093 | | | | 20,904 | |
| Amgen Inc. | | | 79,926 | | | | 18,377 | |
| GlaxoSmithKline PLC1 | | | 894,600 | | | | 16,392 | |
| Gilead Sciences, Inc. | | | 263,841 | | | | 15,371 | |
| Novartis AG1 | | | 111,820 | | | | 10,561 | |
| Merck & Co., Inc. | | | 52,966 | | | | 4,333 | |
| AstraZeneca PLC1 | | | 36,532 | | | | 3,650 | |
| Roche Holding AG, nonvoting, non-registered shares1 | | | 7,659 | | | | 2,672 | |
| Abbott Laboratories | | | 23,690 | | | | 2,594 | |
| Royalty Pharma PLC, Class A | | | 33,980 | | | | 1,701 | |
| Eli Lilly and Company | | | 5,814 | | | | 982 | |
| UnitedHealth Group Inc. | | | 811 | | | | 284 | |
| | | | | | | | 97,821 | |
| | | | | | | | | |
| Utilities 8.26% | | | | | | | | |
| E.ON SE1 | | | 1,163,311 | | | | 12,884 | |
| Iberdrola, SA, non-registered shares1 | | | 883,550 | | | | 12,636 | |
| Dominion Energy, Inc. | | | 125,783 | | | | 9,459 | |
| Enel SpA1 | | | 707,229 | | | | 7,142 | |
| Duke Energy Corp. | | | 75,190 | | | | 6,884 | |
| DTE Energy Company | | | 55,834 | | | | 6,779 | |
| National Grid PLC1 | | | 527,889 | | | | 6,287 | |
| SSE PLC1 | | | 182,254 | | | | 3,756 | |
| Southern Co. | | | 56,300 | | | | 3,459 | |
| Consolidated Edison, Inc. | | | 42,140 | | | | 3,045 | |
| Exelon Corp. | | | 58,099 | | | | 2,453 | |
| Naturgy Energy Group, SA1 | | | 95,933 | | | | 2,239 | |
| Power Grid Corp. of India Ltd.1 | | | 707,310 | | | | 1,844 | |
| EDP - Energias de Portugal, SA1 | | | 237,733 | | | | 1,498 | |
| Endesa, SA1 | | | 54,319 | | | | 1,489 | |
| 100 | American Funds Insurance Series |
Capital Income Builder (continued)
| Common stocks (continued) | | Shares | | | Value
(000) | |
| Utilities (continued) | | | | | | | | |
| Public Service Enterprise Group Inc. | | | 21,289 | | | $ | 1,241 | |
| AES Corp. | | | 51,108 | | | | 1,201 | |
| Infratil Ltd.1 | | | 177,514 | | | | 932 | |
| Centrica PLC1,2 | | | 1,385,547 | | | | 884 | |
| China Gas Holdings Ltd.1 | | | 218,200 | | | | 870 | |
| Power Assets Holdings Ltd.1 | | | 134,500 | | | | 730 | |
| Engie SA1,2 | | | 43,725 | | | | 670 | |
| Sempra Energy | | | 3,323 | | | | 423 | |
| Ratch Group PCL, foreign registered1 | | | 239,000 | | | | 421 | |
| Keppel Infrastructure Trust1 | | | 1,021,236 | | | | 421 | |
| CLP Holdings Ltd.1 | | | 44,000 | | | | 407 | |
| Guangdong Investment Ltd.1 | | | 222,000 | | | | 401 | |
| NextEra Energy, Inc. | | | 1,367 | | | | 106 | |
| | | | | | | | 90,561 | |
| | | | | | | | | |
| Real estate 5.64% | | | | | | | | |
| Crown Castle International Corp. REIT | | | 124,703 | | | | 19,851 | |
| Digital Realty Trust, Inc. REIT | | | 62,741 | | | | 8,753 | |
| Link Real Estate Investment Trust REIT1 | | | 528,018 | | | | 4,811 | |
| VICI Properties Inc. REIT | | | 180,807 | | | | 4,611 | |
| CK Asset Holdings Ltd.1 | | | 683,000 | | | | 3,513 | |
| Gaming and Leisure Properties, Inc. REIT | | | 82,780 | | | | 3,510 | |
| Federal Realty Investment Trust REIT | | | 32,070 | | | | 2,730 | |
| Longfor Group Holdings Ltd.1 | | | 394,500 | | | | 2,317 | |
| TAG Immobilien AG1 | | | 70,512 | | | | 2,229 | |
| Charter Hall Group REIT1 | | | 160,868 | | | | 1,826 | |
| MGM Growth Properties LLC REIT, Class A | | | 50,154 | | | | 1,570 | |
| American Tower Corp. REIT | | | 4,721 | | | | 1,060 | |
| Embassy Office Parks REIT1 | | | 223,400 | | | | 1,055 | |
| Mindspace Business Parks REIT1,2 | | | 115,800 | | | | 507 | |
| Mindspace Business Parks REIT1,2,3 | | | 110,400 | | | | 474 | |
| Americold Realty Trust REIT | | | 25,291 | | | | 944 | |
| Sun Hung Kai Properties Ltd.1 | | | 61,755 | | | | 797 | |
| China Overseas Land & Investment Ltd.1 | | | 215,000 | | | | 468 | |
| Ventas, Inc. REIT | | | 6,719 | | | | 329 | |
| China Resources Land Ltd.1 | | | 72,000 | | | | 298 | |
| AvalonBay Communities, Inc. REIT | | | 1,264 | | | | 203 | |
| | | | | | | | 61,856 | |
| | | | | | | | | |
| Communication services 5.11% | | | | | | | | |
| Verizon Communications Inc. | | | 169,518 | | | | 9,959 | |
| BCE Inc. | | | 186,983 | | | | 7,996 | |
| SoftBank Corp.1 | | | 573,300 | | | | 7,187 | |
| Comcast Corp., Class A | | | 129,064 | | | | 6,763 | |
| Koninklijke KPN NV1 | | | 1,905,767 | | | | 5,778 | |
| Nippon Telegraph and Telephone Corp.1 | | | 141,600 | | | | 3,631 | |
| HKT Trust and HKT Ltd., units1 | | | 2,729,240 | | | | 3,543 | |
| Vodafone Group PLC1 | | | 1,455,807 | | | | 2,396 | |
| AT&T Inc. | | | 59,287 | | | | 1,705 | |
| TELUS Corp. | | | 75,253 | | | | 1,490 | |
| Indus Towers Ltd.1 | | | 362,801 | | | | 1,145 | |
| ITV PLC1,2 | | | 755,275 | | | | 1,104 | |
| HKBN Ltd.1 | | | 466,500 | | | | 722 | |
| KT Corp. (ADR) | | | 65,529 | | | | 721 | |
| ProSiebenSat.1 Media SE1,2 | | | 38,716 | | | | 651 | |
| Omnicom Group Inc. | | | 10,004 | | | | 624 | |
| Lumen Technologies, Inc. | | | 39,066 | | | | 381 | |
| Zegona Communications PLC1 | | | 190,674 | | | | 274 | |
| | | | | | | | 56,070 | |
| American Funds Insurance Series | 101 |
Capital Income Builder (continued)
| Common stocks (continued) | | Shares | | | Value
(000) | |
| Energy 4.55% | | | | | | |
| Chevron Corp. | | | 145,007 | | | $ | 12,246 | |
| TC Energy Corp. (CAD denominated) | | | 168,661 | | | | 6,857 | |
| TC Energy Corp. | | | 50,505 | | | | 2,056 | |
| Enbridge Inc. (CAD denominated) | | | 205,928 | | | | 6,586 | |
| Canadian Natural Resources, Ltd. (CAD denominated) | | | 216,326 | | | | 5,199 | |
| Total SE1,4 | | | 81,796 | | | | 3,528 | |
| ConocoPhillips | | | 73,490 | | | | 2,939 | |
| Royal Dutch Shell PLC, Class B1 | | | 150,315 | | | | 2,590 | |
| Royal Dutch Shell PLC, Class B (ADR) | | | 8,064 | | | | 271 | |
| EOG Resources, Inc. | | | 54,719 | | | | 2,729 | |
| BP PLC1 | | | 719,280 | | | | 2,478 | |
| Equitrans Midstream Corp. | | | 199,833 | | | | 1,606 | |
| Gazprom PJSC (ADR)1 | | | 113,653 | | | | 632 | |
| Exxon Mobil Corp. | | | 4,511 | | | | 186 | |
| | | | | | | | 49,903 | |
| | | | | | | | | |
| Industrials 4.27% | | | | | | | | |
| Raytheon Technologies Corp. | | | 140,295 | | | | 10,032 | |
| United Parcel Service, Inc., Class B | | | 38,043 | | | | 6,406 | |
| VINCI SA1 | | | 38,230 | | | | 3,804 | |
| Singapore Technologies Engineering Ltd1 | | | 1,141,700 | | | | 3,296 | |
| BOC Aviation Ltd.1 | | | 378,700 | | | | 3,275 | |
| Caterpillar Inc. | | | 14,767 | | | | 2,688 | |
| Deutsche Post AG1 | | | 45,308 | | | | 2,242 | |
| Trinity Industries, Inc. | | | 81,264 | | | | 2,145 | |
| RELX PLC1 | | | 75,368 | | | | 1,854 | |
| Cía. de Distribución Integral Logista Holdings, SA, non-registered shares1 | | | 76,271 | | | | 1,479 | |
| Stanley Black & Decker, Inc. | | | 7,147 | | | | 1,276 | |
| Union Pacific Corp. | | | 6,033 | | | | 1,256 | |
| BAE Systems PLC1 | | | 162,460 | | | | 1,087 | |
| ABB Ltd.1 | | | 36,607 | | | | 1,024 | |
| CCR SA, ordinary nominative | | | 320,739 | | | | 832 | |
| ComfortDelGro Corp., Ltd.1 | | | 643,200 | | | | 813 | |
| Lockheed Martin Corp. | | | 2,118 | | | | 752 | |
| ALD SA1 | | | 52,301 | | | | 735 | |
| Cummins Inc. | | | 2,832 | | | | 643 | |
| Melrose Industries PLC1,2 | | | 200,791 | | | | 490 | |
| General Dynamics Corp. | | | 2,392 | | | | 356 | |
| Honeywell International Inc. | | | 1,235 | | | | 263 | |
| L3Harris Technologies, Inc. | | | 655 | | | | 124 | |
| | | | | | | | 46,872 | |
| | | | | | | | | |
| Materials 3.88% | | | | | | | | |
| Dow Inc. | | | 143,551 | | | | 7,967 | |
| Rio Tinto PLC1 | | | 93,848 | | | | 7,022 | |
| BHP Group PLC1 | | | 250,488 | | | | 6,601 | |
| LyondellBasell Industries NV | | | 54,261 | | | | 4,974 | |
| Vale SA, ordinary nominative | | | 100,331 | | | | 1,689 | |
| Vale SA, ordinary nominative (ADR) | | | 87,319 | | | | 1,464 | |
| Fortescue Metals Group Ltd.1 | | | 138,322 | | | | 2,501 | |
| Evonik Industries AG1 | | | 74,726 | | | | 2,435 | |
| Nutrien Ltd. | | | 30,705 | | | | 1,479 | |
| BASF SE1 | | | 18,013 | | | | 1,422 | |
| Asahi Kasei Corp.1 | | | 121,900 | | | | 1,254 | |
| Amcor PLC (CDI)1 | | | 90,984 | | | | 1,081 | |
| Celanese Corp. | | | 6,820 | | | | 886 | |
| Nexa Resources SA4 | | | 49,159 | | | | 474 | |
| CRH PLC1 | | | 9,678 | | | | 409 | |
| 102 | American Funds Insurance Series |
Capital Income Builder (continued)
| Common stocks (continued) | | Shares | | | Value
(000) | |
| Materials (continued) | | | | | | | | |
| Linde PLC | | | 1,401 | | | $ | 369 | |
| WestRock Co. | | | 7,219 | | | | 314 | |
| Air Products and Chemicals, Inc. | | | 704 | | | | 192 | |
| | | | | | | | 42,533 | |
| | | | | | | | | |
| Consumer discretionary 1.23% | | | | | | | | |
| McDonald’s Corp. | | | 10,713 | | | | 2,299 | |
| Kering SA1 | | | 2,740 | | | | 1,992 | |
| Hasbro, Inc. | | | 17,740 | | | | 1,659 | |
| Sands China Ltd.1 | | | 290,000 | | | | 1,275 | |
| Home Depot, Inc. | | | 4,332 | | | | 1,151 | |
| Gree Electric Appliances, Inc. of Zhuhai, Class A1 | | | 109,338 | | | | 1,038 | |
| LVMH Moët Hennessy-Louis Vuitton SE1 | | | 1,515 | | | | 946 | |
| Taylor Wimpey PLC1,2 | | | 307,380 | | | | 699 | |
| Starbucks Corp. | | | 5,854 | | | | 626 | |
| VF Corp. | | | 6,812 | | | | 582 | |
| Industria de Diseño Textil, SA1 | | | 15,355 | | | | 489 | |
| YUM! Brands, Inc. | | | 3,958 | | | | 430 | |
| Cie. Financière Richemont SA, Class A1 | | | 3,565 | | | | 322 | |
| | | | | | | | 13,508 | |
| | | | | | | | | |
| Total common stocks (cost: $658,866,000) | | | | | | | 801,638 | |
| | | | | | | | | |
| Preferred securities 0.18% | | | | | | | | |
| Information technology 0.18% | | | | | | | | |
| Samsung Electronics Co., Ltd., nonvoting preferred shares1 | | | 29,272 | | | | 1,987 | |
| | | | | | | | | |
| Total preferred securities (cost: $1,093,000) | | | | | | | 1,987 | |
| | | | | | | | | |
| Rights & warrants 0.00% | | | | | | | | |
| Consumer discretionary 0.00% | | | | | | | | |
| Cie. Financière Richemont SA, Class A, warrants, expire 20232 | | | 7,130 | | | | 2 | |
| | | | | | | | | |
| Total rights & warrants (cost: $0) | | | | | | | 2 | |
| | | | | | | | | |
| Convertible stocks 1.26% | | | | | | | | |
| Utilities 0.57% | | | | | | | | |
| Sempra Energy, Series A, convertible preferred shares, 6.00% 2021 | | | 17,965 | | | | 1,792 | |
| NextEra Energy, Inc., convertible preferred units, 4.872% 2022 | | | 29,485 | | | | 1,745 | |
| Dominion Energy, Inc., Series A, convertible preferred shares, 7.25% 2022 | | | 16,000 | | | | 1,605 | |
| American Electric Power Company, Inc., convertible preferred units, 6.125% 2023 | | | 15,148 | | | | 767 | |
| American Electric Power Company, Inc., convertible preferred shares, 6.125% 2022 | | | 6,400 | | | | 321 | |
| | | | | | | | 6,230 | |
| | | | | | | | | |
| Information technology 0.35% | | | | | | | | |
| Broadcom Inc., Series A, cumulative convertible preferred shares, 8.00% 2022 | | | 2,746 | | | | 3,906 | |
| | | | | | | | | |
| Health care 0.21% | | | | | | | | |
| Danaher Corp., Series B, cumulative convertible preferred shares, 5.00% 20234 | | | 1,745 | | | | 2,270 | |
| | | | | | | | | |
| Industrials 0.10% | | | | | | | | |
| Stanley Black & Decker, Inc., convertible preferred shares, 5.25% 20224 | | | 10,100 | | | | 1,130 | |
| American Funds Insurance Series | 103 |
Capital Income Builder (continued)
| Convertible stocks (continued) | | Shares | | | Value
(000) | |
| Consumer discretionary 0.03% | | | | | | | | |
| Aptiv PLC, Series A, convertible preferred shares, 5.50% 2023 | | | 1,948 | | | $ | 301 | |
| | | | | | | | | |
| Total convertible stocks (cost: $11,489,000) | | | | | | | 13,837 | |
| | | | | | | | | |
| Convertible bonds & notes 0.07% | | Principal amount
(000) | | | | | |
| Consumer discretionary 0.07% | | | | | | | | |
| Carnival Corp., convertible notes, 5.75% 20233 | | $ | 110 | | | | 261 | |
| Royal Caribbean Cruises Ltd., convertible notes, 4.25% 20233 | | | 392 | | | | 523 | |
| | | | | | | | 784 | |
| | | | | | | | | |
| Total convertible bonds & notes (cost: $540,000) | | | | | | | 784 | |
| | | | | | | | | |
| Bonds, notes & other debt instruments 20.79% | | | | | |
| U.S. Treasury bonds & notes 9.20% | | | | | | | | |
| U.S. Treasury 8.40% | | | | | | | | |
| U.S. Treasury 0.125% 2022 | | | 20,800 | | | | 20,806 | |
| U.S. Treasury 0.125% 2022 | | | 9,600 | | | | 9,601 | |
| U.S. Treasury 0.125% 2022 | | | 5,850 | | | | 5,851 | |
| U.S. Treasury 0.125% 2022 | | | 2,600 | | | | 2,600 | |
| U.S. Treasury 0.125% 2022 | | | 2,500 | | | | 2,501 | |
| U.S. Treasury 0.25% 2025 | | | 7,612 | | | | 7,582 | |
| U.S. Treasury 0.375% 2025 | | | 907 | | | | 910 | |
| U.S. Treasury 0.375% 2025 | | | 850 | | | | 851 | |
| U.S. Treasury 2.00% 20255 | | | 10,000 | | | | 10,773 | |
| U.S. Treasury 1.875% 2026 | | | 6,300 | | | | 6,795 | |
| U.S. Treasury 2.00% 20265 | | | 2,800 | | | | 3,047 | |
| U.S. Treasury 0.50% 2027 | | | 2,900 | | | | 2,892 | |
| U.S. Treasury 0.875% 2030 | | | 3,154 | | | | 3,142 | |
| U.S. Treasury 1.125% 20405 | | | 2,400 | | | | 2,278 | |
| U.S. Treasury 1.375% 20505 | | | 13,332 | | | | 12,475 | |
| | | | | | | | 92,104 | |
| | | | | | | | | |
| U.S. Treasury inflation-protected securities 0.80% | | | | | | | | |
| U.S. Treasury Inflation-Protected Security 0.125% 20256 | | | 4,133 | | | | 4,445 | |
| U.S. Treasury Inflation-Protected Security 0.125% 20306 | | | 2,226 | | | | 2,484 | |
| U.S. Treasury Inflation-Protected Security 0.25% 20505,6 | | | 1,544 | | | | 1,840 | |
| | | | | | | | 8,769 | |
| | | | | | | | | |
| Total U.S. Treasury bonds & notes | | | | | | | 100,873 | |
| | | | | | | | | |
| Corporate bonds, notes & loans 5.98% | | | | | | | | |
| Health care 0.87% | | | | | | | | |
| Abbott Laboratories 3.75% 2026 | | | 240 | | | | 281 | |
| AbbVie Inc. 2.95% 2026 | | | 369 | | | | 409 | |
| AbbVie Inc. 4.25% 2049 | | | 92 | | | | 116 | |
| Amgen Inc. 3.375% 2050 | | | 150 | | | | 168 | |
| AstraZeneca PLC 3.375% 2025 | | | 200 | | | | 225 | |
| Becton, Dickinson and Company 3.70% 2027 | | | 930 | | | | 1,067 | |
| Boston Scientific Corp. 2.65% 2030 | | | 250 | | | | 268 | |
| Centene Corp. 4.625% 2029 | | | 530 | | | | 589 | |
| Centene Corp. 3.375% 2030 | | | 179 | | | | 189 | |
| Novartis Capital Corp. 1.75% 2025 | | | 208 | | | | 218 | |
| Novartis Capital Corp. 2.00% 2027 | | | 120 | | | | 128 | |
| Partners HealthCare System, Inc. 3.192% 2049 | | | 210 | | | | 232 | |
| Pfizer Inc. 2.70% 2050 | | | 425 | | | | 457 | |
| Regeneron Pharmaceuticals, Inc. 1.75% 2030 | | | 54 | | | | 53 | |
| Regeneron Pharmaceuticals, Inc. 2.80% 2050 | | | 109 | | | | 106 | |
| Shire PLC 3.20% 2026 | | | 182 | | | | 204 | |
| Takeda Pharmaceutical Company, Ltd. 4.40% 2023 | | | 1,330 | | | | 1,475 | |
| Tenet Healthcare Corp. 7.50% 20253 | | | 325 | | | | 356 | |
| 104 | American Funds Insurance Series |
Capital Income Builder (continued)
| Bonds, notes & other debt instruments (continued) | | Principal amount
(000) | | | Value
(000) | |
| Corporate bonds, notes & loans (continued) | | | | | | |
| Health care (continued) | | | | | | | | |
| Teva Pharmaceutical Finance Co. BV 6.00% 2024 | | $ | 700 | | | $ | 744 | |
| Teva Pharmaceutical Finance Co. BV 3.15% 2026 | | | 1,375 | | | | 1,324 | |
| Teva Pharmaceutical Finance Co. BV 4.10% 2046 | | | 300 | | | | 268 | |
| Thermo Fisher Scientific Inc. 4.497% 2030 | | | 95 | | | | 119 | |
| UnitedHealth Group Inc. 2.375% 2024 | | | 35 | | | | 37 | |
| UnitedHealth Group Inc. 4.45% 2048 | | | 170 | | | | 235 | |
| Upjohn Inc. 2.70% 20303 | | | 83 | | | | 88 | |
| Upjohn Inc. 3.85% 20403 | | | 32 | | | | 36 | |
| Upjohn Inc. 4.00% 20503 | | | 70 | | | | 80 | |
| | | | | | | | 9,472 | |
| | | | | | | | | |
| Energy 0.82% | | | | | | | | |
| Apache Corp. 4.25% 2030 | | | 385 | | | | 405 | |
| Baker Hughes, a GE Co. 4.08% 2047 | | | 37 | | | | 42 | |
| BP Capital Markets America Inc. 3.633% 2030 | | | 360 | | | | 419 | |
| BP Capital Markets America Inc. 2.772% 2050 | | | 90 | | | | 89 | |
| BP Capital Markets America Inc. 2.939% 2051 | | | 80 | | | | 82 | |
| Canadian Natural Resources Ltd. 3.85% 2027 | | | 185 | | | | 208 | |
| Canadian Natural Resources Ltd. 2.95% 2030 | | | 83 | | | | 89 | |
| Canadian Natural Resources Ltd. 4.95% 2047 | | | 91 | | | | 115 | |
| Cenovus Energy Inc. 5.40% 2047 | | | 75 | | | | 88 | |
| Cheniere Energy, Inc. 3.70% 2029 | | | 252 | | | | 281 | |
| Concho Resources Inc. 4.30% 2028 | | | 210 | | | | 248 | |
| Enbridge Energy Partners, LP 7.375% 2045 | | | 37 | | | | 56 | |
| Energy Transfer Operating, LP 5.00% 2050 | | | 361 | | | | 391 | |
| Energy Transfer Partners, LP 5.30% 2047 | | | 60 | | | | 67 | |
| Energy Transfer Partners, LP 6.00% 2048 | | | 161 | | | | 192 | |
| Energy Transfer Partners, LP 6.25% 2049 | | | 150 | | | | 181 | |
| Enterprise Products Operating LLC 3.20% 2052 | | | 24 | | | | 24 | |
| EQT Corp. 5.00% 2029 | | | 35 | | | | 37 | |
| Equinor ASA 2.375% 2030 | | | 365 | | | | 391 | |
| Exxon Mobil Corp. 2.995% 2039 | | | 200 | | | | 217 | |
| Exxon Mobil Corp. 3.452% 2051 | | | 72 | | | | 82 | |
| Kinder Morgan, Inc. 5.05% 2046 | | | 925 | | | | 1,134 | |
| MPLX LP 5.50% 2049 | | | 625 | | | | 823 | |
| ONEOK, Inc. 3.10% 2030 | | | 42 | | | | 45 | |
| ONEOK, Inc. 4.95% 2047 | | | 51 | | | | 57 | |
| ONEOK, Inc. 5.20% 2048 | | | 184 | | | | 215 | |
| ONEOK, Inc. 7.15% 2051 | | | 97 | | | | 134 | |
| Pemex Project Funding Master Trust, Series 13, 6.625% 2035 | | | 150 | | | | 149 | |
| Petrobras Global Finance Co. 5.60% 2031 | | | 150 | | | | 173 | |
| Petróleos Mexicanos 7.69% 2050 | | | 75 | | | | 76 | |
| Pioneer Natural Resources Company 1.90% 2030 | | | 163 | | | | 162 | |
| Plains All American Pipeline, LP 3.80% 2030 | | | 11 | | | | 12 | |
| Sabine Pass Liquefaction, LLC 4.50% 20303 | | | 215 | | | | 255 | |
| Shell International Finance BV 2.00% 2024 | | | 420 | | | | 443 | |
| Total Capital International 2.434% 2025 | | | 175 | | | | 187 | |
| Total Capital International 3.127% 2050 | | | 250 | | | | 271 | |
| TransCanada PipeLines Ltd. 4.10% 2030 | | | 205 | | | | 242 | |
| TransCanada PipeLines Ltd. 5.10% 2049 | | | 425 | | | | 569 | |
| Williams Companies, Inc. 3.50% 2030 | | | 216 | | | | 245 | |
| Williams Partners LP 6.30% 2040 | | | 95 | | | | 126 | |
| | | | | | | | 9,022 | |
| | | | | | | | | |
| Financials 0.82% | | | | | | | | |
| Allstate Corp. 3.85% 2049 | | | 170 | | | | 214 | |
| American International Group, Inc. 4.375% 2050 | | | 250 | | | | 327 | |
| AON Corp. 2.20% 2022 | | | 249 | | | | 258 | |
| Bank of America Corp. 0.81% 2024 (USD-SOFR + 0.74% on 10/24/2023)7 | | | 150 | | | | 151 | |
| Bank of America Corp. 1.922% 2031 (USD-SOFR + 1.37% on 10/24/2030)7 | | | 1,125 | | | | 1,140 | |
| American Funds Insurance Series | 105 |
Capital Income Builder (continued)
| Bonds, notes & other debt instruments (continued) | | Principal amount
(000) | | | Value
(000) | |
| Corporate bonds, notes & loans (continued) | | | | | | |
| Financials (continued) | | | | | | | | |
| Citigroup Inc. 2.572% 2031 (USD-SOFR + 2.107% on 6/3/2030)7 | | $ | 540 | | | $ | 576 | |
| Credit Suisse Group AG 4.194% 2031 (USD-SOFR + 3.73% on 4/1/2030)3,7 | | | 500 | | | | 589 | |
| Deutsche Bank AG 2.129% 2026 (USD-SOFR + 1.87% on 11/24/2025)7 | | | 150 | | | | 154 | |
| Goldman Sachs Group, Inc. 3.50% 2025 | | | 177 | | | | 197 | |
| Goldman Sachs Group, Inc. 2.60% 2030 | | | 400 | | | | 431 | |
| Hartford Financial Services Group, Inc. 2.80% 2029 | | | 300 | | | | 326 | |
| HSBC Holdings PLC 2.633% 2025 (3-month USD-LIBOR + 1.14% on 11/7/2024)7 | | | 500 | | | | 532 | |
| HSBC Holdings PLC 3.973% 2030 (3-month USD-LIBOR + 1.61% on 5/22/2029)7 | | | 250 | | | | 289 | |
| JPMorgan Chase & Co. 1.764% 2031 (USD-SOFR + 1.05% on 11/19/2030)7 | | | 120 | | | | 121 | |
| JPMorgan Chase & Co. 2.522% 2031 (USD-SOFR + 2.04% on 4/22/2030)7 | | | 475 | | | | 511 | |
| JPMorgan Chase & Co. 2.525% 2041 (USD-SOFR + 1.51% on 11/19/2040)7 | | | 75 | | | | 77 | |
| JPMorgan Chase & Co. 3.109% 2051 (USD-SOFR + 3.109% on 4/22/2050)7 | | | 241 | | | | 268 | |
| Lloyds Banking Group PLC 3.87% 2025 (UST Yield Curve Rate T Note Constant Maturity 1-year + 3.50% on 7/9/2024)7 | | | 390 | | | | 430 | |
| MetLife, Inc. 4.55% 2030 | | | 190 | | | | 238 | |
| Metropolitan Life Global Funding I 1.95% 20233 | | | 380 | | | | 392 | |
| Mitsubishi UFJ Financial Group, Inc. 3.195% 2029 | | | 290 | | | | 327 | |
| Morgan Stanley 3.70% 2024 | | | 260 | | | | 290 | |
| Morgan Stanley 1.794% 2032 (USD-SOFR + 1.034% on 2/13/2031)7 | | | 100 | | | | 101 | |
| Morgan Stanley 5.597% 2051 (USD-SOFR + 4.84% on 3/24/2050)7 | | | 115 | | | | 185 | |
| Navient Corp. 5.00% 2027 | | | 150 | | | | 152 | |
| New York Life Global Funding 3.00% 20283 | | | 150 | | | | 168 | |
| New York Life Insurance Company 3.75% 20503 | | | 62 | | | | 74 | |
| Travelers Companies, Inc. 4.10% 2049 | | | 130 | | | | 171 | |
| Wells Fargo & Company 4.60% 2021 | | | 300 | | | | 303 | |
| | | | | | | | 8,992 | |
| | | | | | | | | |
| Communication services 0.77% | | | | | | | | |
| Alphabet Inc. 2.05% 2050 | | | 80 | | | | 76 | |
| AT&T Inc. 2.25% 2032 | | | 75 | | | | 76 | |
| AT&T Inc. 3.50% 2041 | | | 75 | | | | 81 | |
| AT&T Inc. 3.50% 20533 | | | 624 | | | | 624 | |
| CCO Holdings LLC and CCO Holdings Capital Corp. 5.125% 20273 | | | 235 | | | | 250 | |
| CCO Holdings LLC and CCO Holdings Capital Corp. 2.80% 2031 | | | 158 | | | | 167 | |
| CCO Holdings LLC and CCO Holdings Capital Corp. 4.25% 20313 | | | 360 | | | | 380 | |
| CCO Holdings LLC and CCO Holdings Capital Corp. 4.50% 20323 | | | 950 | | | | 1,016 | |
| CCO Holdings LLC and CCO Holdings Capital Corp. 5.125% 2049 | | | 65 | | | | 79 | |
| CCO Holdings LLC and CCO Holdings Capital Corp. 3.70% 2051 | | | 100 | | | | 104 | |
| CenturyLink, Inc. 7.50% 2024 | | | 300 | | | | 340 | |
| Comcast Corp. 3.75% 2040 | | | 138 | | | | 166 | |
| Comcast Corp. 2.80% 2051 | | | 200 | | | | 208 | |
| Discovery Communications, Inc. 4.65% 2050 | | | 139 | | | | 174 | |
| NBCUniversal Enterprise, Inc., junior subordinated, 5.25% 20493 | | | 630 | | | | 643 | |
| Sprint Corp. 11.50% 2021 | | | 1,425 | | | | 1,549 | |
| Sprint Corp. 6.875% 2028 | | | 325 | | | | 429 | |
| T-Mobile US, Inc. 3.875% 20303 | | | 625 | | | | 725 | |
| T-Mobile US, Inc. 3.00% 20413 | | | 100 | | | | 104 | |
| T-Mobile US, Inc. 3.30% 20513 | | | 186 | | | | 192 | |
| Verizon Communications Inc. 4.329% 2028 | | | 192 | | | | 231 | |
| Verizon Communications Inc. 3.875% 2029 | | | 25 | | | | 30 | |
| Verizon Communications Inc. 4.016% 2029 | | | 215 | | | | 255 | |
| Verizon Communications Inc. 1.75% 2031 | | | 98 | | | | 98 | |
| Verizon Communications Inc. 2.875% 2050 | | | 125 | | | | 126 | |
| Vodafone Group PLC 4.25% 2050 | | | 75 | | | | 93 | |
| Walt Disney Co. 4.625% 2040 | | | 120 | | | | 160 | |
| | | | | | | | 8,376 | |
| 106 | American Funds Insurance Series |
Capital Income Builder (continued)
| Bonds, notes & other debt instruments (continued) | | Principal amount
(000) | | | Value
(000) | |
| Corporate bonds, notes & loans (continued) | | | | | | |
| Utilities 0.67% | | | | | | | | |
| AEP Transmission Co. LLC 3.15% 2049 | | $ | 60 | | | $ | 67 | |
| AEP Transmission Co. LLC 3.80% 2049 | | | 45 | | | | 56 | |
| AEP Transmission Co. LLC 3.65% 2050 | | | 75 | | | | 91 | |
| American Electric Power Company, Inc. 3.65% 2021 | | | 300 | | | | 309 | |
| American Electric Power Company, Inc. 1.00% 2025 | | | 25 | | | | 25 | |
| CenterPoint Energy, Inc. 2.95% 2030 | | | 345 | | | | 376 | |
| Connecticut Light and Power Co. 3.20% 2027 | | | 445 | | | | 500 | |
| Consumers Energy Co. 3.10% 2050 | | | 159 | | | | 184 | |
| Duke Energy Florida, LLC 2.50% 2029 | | | 430 | | | | 470 | |
| Edison International 3.55% 2024 | | | 375 | | | | 404 | |
| Edison International 5.75% 2027 | | | 158 | | | | 189 | |
| Edison International 4.125% 2028 | | | 332 | | | | 370 | |
| Emera Inc. 6.75% 2076 (3-month USD-LIBOR + 5.44% on 6/15/2026)7 | | | 120 | | | | 140 | |
| Evergy Metro, Inc. 2.25% 2030 | | | 125 | | | | 132 | |
| FirstEnergy Corp. 3.90% 2027 (4.40% on 1/16/2021)7 | | | 50 | | | | 55 | |
| FirstEnergy Corp. 2.25% 2030 | | | 162 | | | | 157 | |
| FirstEnergy Corp. 2.65% 2030 | | | 493 | | | | 495 | |
| Jersey Central Power & Light Co. 4.30% 20263 | | | 115 | | | | 129 | |
| NSTAR Electric Co. 3.95% 2030 | | | 50 | | | | 61 | |
| Pacific Gas and Electric Co. 2.95% 2026 | | | 97 | | | | 103 | |
| Pacific Gas and Electric Co. 3.75% 2028 | | | 105 | | | | 115 | |
| Pacific Gas and Electric Co. 4.65% 2028 | | | 284 | | | | 325 | |
| Pacific Gas and Electric Co. 2.50% 2031 | | | 450 | | | | 451 | |
| Pacific Gas and Electric Co. 3.30% 2040 | | | 100 | | | | 100 | |
| Pacific Gas and Electric Co. 3.50% 2050 | | | 325 | | | | 324 | |
| Public Service Company of Colorado 3.80% 2047 | | | 20 | | | | 25 | |
| San Diego Gas & Electric Co. 3.75% 2047 | | | 227 | | | | 266 | |
| San Diego Gas & Electric Co. 4.10% 2049 | | | 115 | | | | 144 | |
| Southern California Edison Co. 4.125% 2048 | | | 235 | | | | 281 | |
| Southern California Edison Co. 3.65% 2050 | | | 298 | | | | 339 | |
| Southern California Edison Co., Series C, 3.60% 2045 | | | 256 | | | | 284 | |
| Virginia Electric and Power Co. 2.45% 2050 | | | 25 | | | | 25 | |
| Xcel Energy Inc. 2.60% 2029 | | | 175 | | | | 189 | |
| Xcel Energy Inc. 3.50% 2049 | | | 145 | | | | 170 | |
| | | | | | | | 7,351 | |
| | | | | | | | | |
| Consumer discretionary 0.63% | | | | | | | | |
| Amazon.com, Inc. 2.50% 2050 | | | 75 | | | | 78 | |
| Amazon.com, Inc. 2.70% 2060 | | | 30 | | | | 32 | |
| Bayerische Motoren Werke AG 4.15% 20303 | | | 290 | | | | 351 | |
| Carnival Corp. 11.50% 20233 | | | 775 | | | | 897 | |
| Carnival Corp. 10.50% 20263 | | | 165 | | | | 192 | |
| Ford Motor Co. 9.625% 2030 | | | 50 | | | | 71 | |
| General Motors Company 5.95% 2049 | | | 90 | | | | 122 | |
| Home Depot, Inc. 3.35% 2050 | | | 350 | | | | 417 | |
| PetSmart, Inc. 7.125% 20233 | | | 125 | | | | 125 | |
| Royal Caribbean Cruises Ltd. 10.875% 20233 | | | 600 | | | | 684 | |
| Royal Caribbean Cruises Ltd. 11.50% 20253 | | | 1,210 | | | | 1,416 | |
| Toyota Motor Credit Corp. 2.15% 2022 | | | 505 | | | | 521 | |
| Toyota Motor Credit Corp. 2.60% 2022 | | | 856 | | | | 876 | |
| Toyota Motor Credit Corp. 3.00% 2025 | | | 1,010 | | | | 1,111 | |
| | | | | | | | 6,893 | |
| | | | | | | | | |
| Consumer staples 0.46% | | | | | | | | |
| Altria Group, Inc. 5.95% 2049 | | | 327 | | | | 458 | |
| Anheuser-Busch Co. / InBev Worldwide 4.90% 2046 | | | 420 | | | | 548 | |
| British American Tobacco PLC 3.215% 2026 | | | 250 | | | | 276 | |
| British American Tobacco PLC 3.557% 2027 | | | 660 | | | | 735 | |
| British American Tobacco PLC 4.906% 2030 | | | 350 | | | | 423 | |
| British American Tobacco PLC 4.54% 2047 | | | 73 | | | | 81 | |
| American Funds Insurance Series | 107 |
Capital Income Builder (continued)
| Bonds, notes & other debt instruments (continued) | | Principal amount
(000) | | | Value
(000) | |
| Corporate bonds, notes & loans (continued) | | | | | | |
| Consumer staples (continued) | | | | | | | | |
| British American Tobacco PLC 4.758% 2049 | | $ | 130 | | | $ | 151 | |
| Coca-Cola Co. 1.375% 2031 | | | 100 | | | | 100 | |
| Coca-Cola Co. 2.50% 2051 | | | 65 | | | | 67 | |
| Conagra Brands, Inc. 5.30% 2038 | | | 18 | | | | 24 | |
| Conagra Brands, Inc. 5.40% 2048 | | | 52 | | | | 74 | |
| Constellation Brands, Inc. 3.15% 2029 | | | 190 | | | | 212 | |
| Constellation Brands, Inc. 2.875% 2030 | | | 210 | | | | 230 | |
| Keurig Dr Pepper Inc. 3.20% 2030 | | | 25 | | | | 28 | |
| Keurig Dr Pepper Inc. 5.085% 2048 | | | 64 | | | | 91 | |
| Keurig Dr Pepper Inc. 3.80% 2050 | | | 51 | | | | 61 | |
| Kimberly-Clark Corp. 3.10% 2030 | | | 56 | | | | 65 | |
| Kraft Heinz Company 3.00% 2026 | | | 100 | | | | 104 | |
| Molson Coors Brewing Co. 4.20% 2046 | | | 65 | | | | 75 | |
| PepsiCo, Inc. 1.40% 2031 | | | 40 | | | | 40 | |
| PepsiCo, Inc. 3.625% 2050 | | | 240 | | | | 305 | |
| Philip Morris International Inc. 3.375% 2029 | | | 450 | | | | 516 | |
| Procter & Gamble Company 0.55% 2025 | | | 185 | | | | 187 | |
| Wal-Mart Stores, Inc. 2.85% 2024 | | | 210 | | | | 227 | |
| | | | | | | | 5,078 | |
| | | | | | | | | |
| Industrials 0.45% | | | | | | | | |
| Boeing Company 2.70% 2022 | | | 300 | | | | 308 | |
| Boeing Company 2.75% 2026 | | | 91 | | | | 96 | |
| Boeing Company 2.95% 2030 | | | 190 | | | | 197 | |
| Boeing Company 3.60% 2034 | | | 90 | | | | 95 | |
| Boeing Company 5.805% 2050 | | | 235 | | | | 325 | |
| Carrier Global Corp. 2.242% 2025 | | | 102 | | | | 108 | |
| Carrier Global Corp. 2.493% 2027 | | | 84 | | | | 91 | |
| Carrier Global Corp. 2.722% 2030 | | | 74 | | | | 79 | |
| CSX Corp. 4.75% 2048 | | | 50 | | | | 68 | |
| CSX Corp. 3.35% 2049 | | | 310 | | | | 354 | |
| CSX Corp. 2.50% 2051 | | | 50 | | | | 50 | |
| General Electric Co. 3.45% 2027 | | | 50 | | | | 56 | |
| General Electric Co. 4.25% 2040 | | | 75 | | | | 89 | |
| General Electric Co. 4.35% 2050 | | | 50 | | | | 61 | |
| Honeywell International Inc. 2.15% 2022 | | | 305 | | | | 313 | |
| Honeywell International Inc. 2.30% 2024 | | | 175 | | | | 187 | |
| Honeywell International Inc. 2.70% 2029 | | | 70 | | | | 78 | |
| Norfolk Southern Corp. 3.00% 2022 | | | 224 | | | | 230 | |
| Raytheon Technologies Corp. 3.125% 2050 | | | 125 | | | | 138 | |
| TransDigm Inc. 6.50% 2024 | | | 455 | | | | 464 | |
| TransDigm Inc. 8.00% 20253 | | | 230 | | | | 255 | |
| TransDigm Inc. 6.25% 20263 | | | 445 | | | | 474 | |
| Union Pacific Corp. 3.70% 2029 | | | 430 | | | | 499 | |
| Union Pacific Corp. 4.30% 2049 | | | 110 | | | | 144 | |
| Union Pacific Corp. 3.25% 2050 | | | 53 | | | | 60 | |
| Union Pacific Corp. 3.95% 2059 | | | 45 | | | | 56 | |
| Westinghouse Air Brake Technologies Corp. 4.40% 20247 | | | 39 | | | | 43 | |
| | | | | | | | 4,918 | |
| | | | | | | | | |
| Information technology 0.35% | | | | | | | | |
| Adobe Inc. 2.30% 2030 | | | 645 | | | | 698 | |
| Apple Inc. 0.55% 2025 | | | 125 | | | | 126 | |
| Apple Inc. 2.40% 2050 | | | 75 | | | | 77 | |
| Broadcom Inc. 5.00% 2030 | | | 420 | | | | 511 | |
| Broadcom Ltd. 3.875% 2027 | | | 370 | | | | 416 | |
| Fiserv, Inc. 3.50% 2029 | | | 870 | | | | 995 | |
| Intuit Inc. 0.95% 2025 | | | 50 | | | | 51 | |
| Lenovo Group Ltd. 5.875% 2025 | | | 400 | | | | 461 | |
| 108 | American Funds Insurance Series |
Capital Income Builder (continued)
| Bonds, notes & other debt instruments (continued) | | Principal amount
(000) | | | Value
(000) | |
| Corporate bonds, notes & loans (continued) | | | | | | |
| Information technology (continued) | | | | | | | | |
| Microsoft Corp. 2.525% 2050 | | $ | 227 | | | $ | 239 | |
| Oracle Corp. 3.60% 2050 | | | 150 | | | | 175 | |
| ServiceNow, Inc. 1.40% 2030 | | | 130 | | | | 127 | |
| | | | | | | | 3,876 | |
| | | | | | | | | |
| Real estate 0.07% | | | | | | | | |
| Corporate Office Properties LP 2.25% 2026 | | | 68 | | | | 71 | |
| Equinix, Inc. 2.90% 2026 | | | 266 | | | | 291 | |
| Equinix, Inc. 1.55% 2028 | | | 25 | | | | 26 | |
| Equinix, Inc. 3.20% 2029 | | | 288 | | | | 318 | |
| Equinix, Inc. 3.00% 2050 | | | 18 | | | | 18 | |
| Equinix, Inc. 2.95% 2051 | | | 25 | | | | 25 | |
| Westfield Corp. Ltd. 3.50% 20293 | | | 54 | | | | 57 | |
| | | | | | | | 806 | |
| | | | | | | | | |
| Materials 0.07% | | | | | | | | |
| Anglo American Capital PLC 5.625% 20303 | | | 240 | | | | 306 | |
| Braskem SA 4.50% 20303 | | | 200 | | | | 206 | |
| Dow Chemical Co. 4.80% 2049 | | | 67 | | | | 90 | |
| LYB International Finance III, LLC 2.25% 2030 | | | 32 | | | | 33 | |
| LYB International Finance III, LLC 4.20% 2050 | | | 75 | | | | 88 | |
| LYB International Finance III, LLC 3.625% 2051 | | | 52 | | | | 57 | |
| | | | | | | | 780 | |
| | | | | | | | | |
| Total corporate bonds, notes & loans | | | | | | | 65,564 | |
| | | | | | | | | |
| Mortgage-backed obligations 5.07% | | | | | | | | |
| Federal agency mortgage-backed obligations 4.46% | | | | | | | | |
| Fannie Mae Pool #695412 5.00% 20338 | | | — | 9 | | | — | 9 |
| Fannie Mae Pool #MA4124 2.50% 20358 | | | 2,633 | | | | 2,755 | |
| Fannie Mae Pool #AD3566 5.00% 20358 | | | 2 | | | | 2 | |
| Fannie Mae Pool #MA4228 1.50% 20368 | | | 2,670 | | | | 2,749 | |
| Fannie Mae Pool #AC0794 5.00% 20398 | | | 10 | | | | 11 | |
| Fannie Mae Pool #931768 5.00% 20398 | | | 2 | | | | 2 | |
| Fannie Mae Pool #AE0311 3.50% 20408 | | | 17 | | | | 18 | |
| Fannie Mae Pool #932606 5.00% 20408 | | | 5 | | | | 6 | |
| Fannie Mae Pool #AJ1873 4.00% 20418 | | | 7 | | | | 8 | |
| Fannie Mae Pool #AE1248 5.00% 20418 | | | 11 | | | | 13 | |
| Fannie Mae Pool #AE1274 5.00% 20418 | | | 9 | | | | 10 | |
| Fannie Mae Pool #AE1277 5.00% 20418 | | | 5 | | | | 6 | |
| Fannie Mae Pool #AE1283 5.00% 20418 | | | 3 | | | | 4 | |
| Fannie Mae Pool #AE1290 5.00% 20428 | | | 6 | | | | 7 | |
| Fannie Mae Pool #AL3829 3.50% 20438 | | | 64 | | | | 70 | |
| Fannie Mae Pool #AT7161 3.50% 20438 | | | 29 | | | | 31 | |
| Fannie Mae Pool #AR1512 3.50% 20438 | | | 14 | | | | 15 | |
| Fannie Mae Pool #AT0412 3.50% 20438 | | | 7 | | | | 8 | |
| Fannie Mae Pool #AT3954 3.50% 20438 | | | 4 | | | | 4 | |
| Fannie Mae Pool #AT0300 3.50% 20438 | | | 3 | | | | 3 | |
| Fannie Mae Pool #AY1829 3.50% 20448 | | | 5 | | | | 6 | |
| Fannie Mae Pool #AW8240 3.50% 20448 | | | 1 | | | | 1 | |
| Fannie Mae Pool #BE5017 3.50% 20458 | | | 36 | | | | 39 | |
| Fannie Mae Pool #BE5009 3.50% 20458 | | | 29 | | | | 31 | |
| Fannie Mae Pool #BE8740 3.50% 20478 | | | 33 | | | | 36 | |
| Fannie Mae Pool #BE8742 3.50% 20478 | | | 10 | | | | 11 | |
| Fannie Mae Pool #BH2848 3.50% 20478 | | | 5 | | | | 5 | |
| Fannie Mae Pool #BH2847 3.50% 20478 | | | 3 | | | | 4 | |
| Fannie Mae Pool #BH2846 3.50% 20478 | | | 4 | | | | 4 | |
| Fannie Mae Pool #BJ5015 4.00% 20478 | | | 79 | | | | 87 | |
| Fannie Mae Pool #BH3122 4.00% 20478 | | | 3 | | | | 3 | |
| Fannie Mae Pool #BJ4901 3.50% 20488 | | | 23 | | | | 25 | |
| Fannie Mae Pool #CA2850 4.00% 20488 | | | 91 | | | | 102 | |
| American Funds Insurance Series | 109 |
Capital Income Builder (continued)
| Bonds, notes & other debt instruments (continued) | | Principal amount
(000) | | | Value
(000) | |
| Mortgage-backed obligations (continued) | | | | | | |
| Federal agency mortgage-backed obligations (continued) | | | | | | | | |
| Fannie Mae Pool #BK6840 4.00% 20488 | | $ | 51 | | | $ | 55 | |
| Fannie Mae Pool #BK5232 4.00% 20488 | | | 40 | | | | 45 | |
| Fannie Mae Pool #BK9743 4.00% 20488 | | | 14 | | | | 15 | |
| Fannie Mae Pool #CA2804 4.50% 20488 | | | 654 | | | | 709 | |
| Fannie Mae Pool #BK7665 4.50% 20488 | | | 336 | | | | 373 | |
| Fannie Mae Pool #BK0951 4.50% 20488 | | | 257 | | | | 288 | |
| Fannie Mae Pool #BK9761 4.50% 20488 | | | 14 | | | | 15 | |
| Fannie Mae Pool #CA4151 3.50% 20498 | | | 318 | | | | 350 | |
| Fannie Mae Pool #BJ8411 3.50% 20498 | | | 67 | | | | 73 | |
| Fannie Mae Pool #CA5540 3.00% 20508 | | | 5,289 | | | | 5,632 | |
| Freddie Mac Pool #SB8083 1.50% 20368 | | | 285 | | | | 294 | |
| Freddie Mac Pool #Q18236 3.50% 20438 | | | 29 | | | | 31 | |
| Freddie Mac Pool #Q19133 3.50% 20438 | | | 18 | | | | 20 | |
| Freddie Mac Pool #Q17696 3.50% 20438 | | | 16 | | | | 18 | |
| Freddie Mac Pool #Q15874 4.00% 20438 | | | 2 | | | | 2 | |
| Freddie Mac Pool #Q52069 3.50% 20478 | | | 48 | | | | 52 | |
| Freddie Mac Pool #Q55056 3.50% 20488 | | | 60 | | | | 65 | |
| Freddie Mac Pool #Q54709 3.50% 20488 | | | 36 | | | | 39 | |
| Freddie Mac Pool #Q54701 3.50% 20488 | | | 34 | | | | 37 | |
| Freddie Mac Pool #Q54782 3.50% 20488 | | | 30 | | | | 32 | |
| Freddie Mac Pool #Q54781 3.50% 20488 | | | 27 | | | | 30 | |
| Freddie Mac Pool #Q54700 3.50% 20488 | | | 26 | | | | 29 | |
| Freddie Mac Pool #Q55060 3.50% 20488 | | | 19 | | | | 20 | |
| Freddie Mac Pool #Q56591 3.50% 20488 | | | 18 | | | | 19 | |
| Freddie Mac Pool #Q56590 3.50% 20488 | | | 17 | | | | 18 | |
| Freddie Mac Pool #Q56589 3.50% 20488 | | | 16 | | | | 17 | |
| Freddie Mac Pool #Q54698 3.50% 20488 | | | 14 | | | | 15 | |
| Freddie Mac Pool #Q54699 3.50% 20488 | | | 13 | | | | 14 | |
| Freddie Mac Pool #Q54831 3.50% 20488 | | | 9 | | | | 10 | |
| Freddie Mac Pool #G67711 4.00% 20488 | | | 440 | | | | 486 | |
| Freddie Mac Pool #Q56599 4.00% 20488 | | | 57 | | | | 63 | |
| Freddie Mac Pool #Q56175 4.00% 20488 | | | 43 | | | | 47 | |
| Freddie Mac Pool #Q55971 4.00% 20488 | | | 38 | | | | 42 | |
| Freddie Mac Pool #Q56576 4.00% 20488 | | | 29 | | | | 31 | |
| Freddie Mac Pool #Q55970 4.00% 20488 | | | 19 | | | | 21 | |
| Freddie Mac Pool #Q58411 4.50% 20488 | | | 116 | | | | 129 | |
| Freddie Mac Pool #Q58436 4.50% 20488 | | | 52 | | | | 59 | |
| Freddie Mac Pool #Q58378 4.50% 20488 | | | 43 | | | | 48 | |
| Freddie Mac Pool #Q57242 4.50% 20488 | | | 31 | | | | 34 | |
| Freddie Mac Pool #RA1463 3.50% 20498 | | | 216 | | | | 238 | |
| Freddie Mac Pool #QA2748 3.50% 20498 | | | 29 | | | | 32 | |
| Freddie Mac Pool #SD7512 3.00% 20508 | | | 6,954 | | | | 7,446 | |
| Freddie Mac Seasoned Credit Risk Transfer Trust, Series 2017-2, Class MA, 3.00% 20568 | | | 390 | | | | 418 | |
| Freddie Mac Seasoned Credit Risk Transfer Trust, Series 2017-2, Class HA, 3.00% 20568,10 | | | 390 | | | | 410 | |
| Freddie Mac Seasoned Credit Risk Transfer Trust, Series 2017-1, Class HA, 3.00% 20568,10 | | | 193 | | | | 203 | |
| Freddie Mac Seasoned Credit Risk Transfer Trust, Series 2017-4, Class HT, 3.25% 20578,10 | | | 149 | | | | 162 | |
| Freddie Mac Seasoned Credit Risk Transfer Trust, Series 2017-4, Class MT, 3.50% 20578 | | | 121 | | | | 132 | |
| Freddie Mac Seasoned Credit Risk Transfer Trust, Series 2018-3, Class MA, 3.50% 20578 | | | 36 | | | | 39 | |
| Freddie Mac Seasoned Credit Risk Transfer Trust, Series 2019-1, Class MT, 3.50% 20588 | | | 1,422 | | | | 1,553 | |
| Freddie Mac Seasoned Credit Risk Transfer Trust, Series 2019-2, Class MA, 3.50% 20588 | | | 1,026 | | | | 1,118 | |
| Freddie Mac Seasoned Credit Risk Transfer Trust, Series 2019-1, Class MA, 3.50% 20588 | | | 715 | | | | 777 | |
| Freddie Mac Seasoned Credit Risk Transfer Trust, Series 2019-3, Class MA, 3.50% 20588 | | | 34 | | | | 37 | |
| Freddie Mac Seasoned Credit Risk Transfer Trust, Series 2019-3, Class MT, 3.50% 20588 | | | 15 | | | | 16 | |
| Freddie Mac Seasoned Loan Structured Transaction Trust, Series 2018-2, Class A1, 3.50% 20288 | | | 1,440 | | | | 1,524 | |
| Freddie Mac Seasoned Loan Structured Transaction Trust, Series 2019-2, Class A1C, 2.75% 20298 | | | 2,121 | | | | 2,232 | |
| Government National Mortgage Assn. 2.00% 20518,11 | | | 3,390 | | | | 3,533 | |
| Government National Mortgage Assn. 2.00% 20518,11 | | | 1,710 | | | | 1,786 | |
| 110 | American Funds Insurance Series |
Capital Income Builder (continued)
| Bonds, notes & other debt instruments (continued) | | Principal amount
(000) | | | Value
(000) | |
| Mortgage-backed obligations (continued) | | | | | | |
| Federal agency mortgage-backed obligations (continued) | | | | | | | | |
| Government National Mortgage Assn. 2.50% 20518,11 | | $ | 2,650 | | | $ | 2,794 | |
| Government National Mortgage Assn. 3.50% 20518,11 | | | 21 | | | | 22 | |
| Government National Mortgage Assn. 3.50% 20518,11 | | | 21 | | | | 22 | |
| Government National Mortgage Assn. Pool #MA5764 4.50% 20498 | | | 1,476 | | | | 1,597 | |
| Government National Mortgage Assn. Pool #MA5877 4.50% 20498 | | | 165 | | | | 179 | |
| Government National Mortgage Assn. Pool #694836 5.661% 20598 | | | 1 | | | | 1 | |
| Government National Mortgage Assn. Pool #765152 4.14% 20618 | | | — | 9 | | | — | 9 |
| Government National Mortgage Assn. Pool #766525 4.70% 20628 | | | — | 9 | | | — | 9 |
| Government National Mortgage Assn. Pool #777452 3.676% 20638 | | | 6 | | | | 7 | |
| Government National Mortgage Assn. Pool #767639 3.913% 20638 | | | 9 | | | | 9 | |
| Government National Mortgage Assn. Pool #AA1709 4.343% 20638 | | | 4 | | | | 4 | |
| Government National Mortgage Assn. Pool #725893 5.20% 20648 | | | 1 | | | | 1 | |
| Government National Mortgage Assn. Pool #AA7554 6.64% 20648 | | | 2 | | | | 2 | |
| Uniform Mortgage-Backed Security 1.50% 20368,11 | | | 1,632 | | | | 1,676 | |
| Uniform Mortgage-Backed Security 2.00% 20368,11 | | | 2,100 | | | | 2,193 | |
| Uniform Mortgage-Backed Security 3.50% 20518,11 | | | 1,775 | | | | 1,879 | |
| Uniform Mortgage-Backed Security 4.50% 20518,11 | | | 1,477 | | | | 1,603 | |
| | | | | | | | 48,998 | |
| | | | | | | | | |
| Collateralized mortgage-backed obligations (privately originated) 0.45% | | | | | | | | |
| Cascade Funding Mortgage Trust, Series 2019-HB1, Class A, 2.386% 20293,8,10 | | | 295 | | | | 297 | |
| Cascade Funding Mortgage Trust, Series 2020-HB4, Class A, 0.946% 20303,8,10 | | | 194 | | | | 194 | |
| Citigroup Mortgage Loan Trust Inc., Series 2020-EXP1, Class A1A, 1.804% 20603,8,10 | | | 75 | | | | 76 | |
| Finance of America HECM Buyout, Series 2020-HB1, Class A, 2.012% 20303,8,10 | | | 592 | | | | 597 | |
| Legacy Mortgage Asset Trust, Series 2019-GS5, Class A1, 3.20% 20593,8,10 | | | 213 | | | | 215 | |
| Legacy Mortgage Asset Trust, Series 2019-GS2, Class A1, 3.75% 20593,8,10 | | | 186 | | | | 186 | |
| Mello Warehouse Securitization Trust, Series 2019-2, Class A, (1-month USD-LIBOR + 0.75%) 0.898% 20523,8,10 | | | 1,000 | | | | 1,001 | |
| Mello Warehouse Securitization Trust, Series 2020-2, Class A, (1-month USD-LIBOR + 0.80%) 0.996% 20533,8,10 | | | 175 | | | | 175 | |
| Mello Warehouse Securitization Trust, Series 2020-1, Class A, (1-month USD-LIBOR + 0.90%) 1.048% 20533,8,10 | | | 279 | | | | 280 | |
| Nationstar HECM Loan Trust, Series 2019-2A, Class A, 2.272% 20293,8,10 | | | 82 | | | | 83 | |
| Nationstar HECM Loan Trust, Series 2019-1A, Class A, 2.651% 20293,8,10 | | | 58 | | | | 58 | |
| New York Mortgage Trust, Series 2020-SP1, Class A1, 3.962% 20603,8 | | | 302 | | | | 305 | |
| Towd Point Mortgage Trust, Series 2016-5, Class A1, 2.50% 20563,8,10 | | | 106 | | | | 108 | |
| Towd Point Mortgage Trust, Series 2017-3, Class A1, 2.75% 20573,8,10 | | | 115 | | | | 119 | |
| Towd Point Mortgage Trust, Series 2017-6, Class A1, 2.75% 20573,8,10 | | | 94 | | | | 97 | |
| Towd Point Mortgage Trust, Series 2018-2, Class A1, 3.25% 20583,8,10 | | | 261 | | | | 274 | |
| Towd Point Mortgage Trust, Series 2018-5, Class A1A, 3.25% 20583,8,10 | | | 63 | | | | 66 | |
| Towd Point Mortgage Trust, Series 2020-4, Class A1, 1.75% 20603,8 | | | 787 | | | | 806 | |
| | | | | | | | 4,937 | |
| | | | | | | | | |
| Commercial mortgage-backed securities 0.16% | | | | | | | | |
| GS Mortgage Securities Trust, Series 2018-HULA, Class A, 1.079% 20253,8,10 | | | 243 | | | | 239 | |
| Hawaii Hotel Trust, Series 2019-MAUI, Class A, (1-month USD-LIBOR + 1.15%) 1.309% 20383,8,10 | | | 300 | | | | 299 | |
| MRA Issuance Trust, Series 2020-10, Class A, (1-month USD-LIBOR + 1.75%) 2.25% 20211,3,8,10 | | | 1,057 | | | | 1,057 | |
| Multi Family Connecticut Avenue Securities, Series 2019-1, Class M10, (1-month USD-LIBOR + 3.25%) 3.398% 20493,8,10 | | | 150 | | | | 141 | |
| | | | | | | | 1,736 | |
| | | | | | | | | |
| Total mortgage-backed obligations | | | | | | | 55,671 | |
| | | | | | | | | |
| Asset-backed obligations 0.35% | | | | | | | | |
| Aesop Funding LLC, Series 2020-2, Class A, 2.02% 20273,8 | | | 297 | | | | 303 | |
| Aesop Funding LLC, Series 2020-2A, Class B, 2.96% 20273,8 | | | 100 | | | | 102 | |
| CF Hippolyta LLC, Series 2020-1, Class A1, 1.69% 20603,8 | | | 372 | | | | 380 | |
| CF Hippolyta LLC, Series 2020-1, Class A2, 1.99% 20603,8 | | | 95 | | | | 97 | |
| American Funds Insurance Series | 111 |
Capital Income Builder (continued)
| Bonds, notes & other debt instruments (continued) | | Principal amount
(000) | | | Value
(000) | |
| Asset-backed obligations (continued) | | | | | | |
| CF Hippolyta LLC, Series 2020-1, Class B1, 2.28% 20603,8 | | $ | 95 | | | $ | 97 | |
| CF Hippolyta LLC, Series 2020-1, Class B2, 2.60% 20603,8 | | | 95 | | | | 97 | |
| Drivetime Auto Owner Trust, Series 2019-3, Class A, 2.55% 20223,8 | | | 40 | | | | 40 | |
| Drivetime Auto Owner Trust, Series 2020-1, Class A, 1.94% 20233,8 | | | 222 | | | | 223 | |
| Exeter Automobile Receivables Trust, Series 2019-4A, Class A, 2.18% 20233,8 | | | 96 | | | | 97 | |
| FirstKey Homes Trust, Series 2020-SFR2, Class A, 1.266% 20373,8 | | | 425 | | | | 428 | |
| GCI Funding I LLC, Series 2020-1, Class A, 2.82% 20453,8 | | | 678 | | | | 682 | |
| Global SC Finance V SRL, Series 2019-1A, Class B, 4.81% 20393,8 | | | 172 | | | | 173 | |
| OSW Structured Asset Trust, Series 2020-RPL1, Class A1, 3.072% 20603,8,10 | | | 226 | | | | 231 | |
| Westlake Automobile Receivables Trust, Series 2019-3A, Class A2, 2.15% 20233,8 | | | 845 | | | | 851 | |
| | | | | | | | 3,801 | |
| | | | | | | | | |
| Bonds & notes of governments & government agencies outside the U.S. 0.13% | | | | | |
| Portuguese Republic 5.125% 2024 | | | 18 | | | | 21 | |
| Qatar (State of) 4.50% 2028 | | | 200 | | | | 243 | |
| Saudi Arabia (Kingdom of) 3.625% 2028 | | | 200 | | | | 225 | |
| United Mexican States, Series M, 6.50% 2021 | | MXN | 15,000 | | | | 760 | |
| United Mexican States 3.25% 2030 | | $ | 200 | | | | 216 | |
| | | | | | | | 1,465 | |
| Municipals 0.06% | | | | | | | | |
| Illinois 0.02% | | | | | | | | |
| G.O. Bonds, Pension Funding Series 2003, 5.10% 2033 | | | 225 | | | | 242 | |
| | | | | | | | | |
| South Carolina 0.04% | | | | | | | | |
| Public Service Auth., Rev. Ref. Obligations (Santee Cooper), Series 2016-C, 5.00% 2035 | | | 350 | | | | 429 | |
| | | | | | | | | |
| Total municipals | | | | | | | 671 | |
| | | | | | | | | |
| Total bonds, notes & other debt instruments (cost: $218,849,000) | | | | | | | 228,045 | |
| | | | | | | | | |
| Short-term securities 5.28% | | | Shares | | | | | |
| Money market investments 5.28% | | | | | | | | |
| Capital Group Central Cash Fund 0.12%12,13 | �� | | 567,564 | | | | 56,762 | |
| Goldman Sachs Financial Square Government Fund, Institutional Shares 0.02%12,14 | | | 1,184,688 | | | | 1,185 | |
| | | | | | | | | |
| Total short-term securities (cost: $57,947,000) | | | | | | | 57,947 | |
| Total investment securities 100.66% (cost: $948,784,000) | | | | | | | 1,104,240 | |
| Other assets less liabilities (0.66)% | | | | | | | (7,288 | ) |
| | | | | | | | | |
| Net assets 100.00% | | | | | | $ | 1,096,952 | |
Futures contracts
| Contracts | | Type | | Number of
contracts | | Expiration | | Notional
amount
(000) | 15
| | Value at
12/31/2020
(000) | 16
| Unrealized
(depreciation)
appreciation
at 12/31/2020
(000) | |
| 90 Day Euro Dollar Futures | | Short | | 80 | | March 2021 | | $(20,000 | ) | | $ | (19,966 | ) | | $ | (13 | ) |
| 2 Year U.S. Treasury Note Futures | | Short | | 8 | | April 2021 | | (1,600 | ) | | | (1,768 | ) | | | (1 | ) |
| 5 Year U.S. Treasury Note Futures | | Long | | 83 | | April 2021 | | 8,300 | | | | 10,472 | | | | 23 | |
| 10 Year U.S. Treasury Note Futures | | Long | | 14 | | March 2021 | | 1,400 | | | | 1,933 | | | | 2 | |
| 10 Year Ultra U.S. Treasury Note Futures | | Short | | 38 | | March 2021 | | (3,800 | ) | | | (5,942 | ) | | | 14 | |
| 112 | American Funds Insurance Series |
Capital Income Builder (continued)
Futures contracts (continued)
| Contracts | | Type | | Number of
contracts | | Expiration | | Notional
amount
(000) | 15
| | Value at
12/31/2020
(000) | 16
| | Unrealized
(depreciation)
appreciation
at 12/31/2020
(000) | |
| 20 Year U.S. Treasury Bond Futures | | Long | | 6 | | March 2021 | | $ 600 | | | $ | 1,039 | | | $ | (10 | ) |
| 30 Year Ultra U.S. Treasury Bond Futures | | Long | | 48 | | March 2021 | | 4,800 | | | | 10,251 | | | | (65 | ) |
| | | | | | | | | | | | | | | | $ | (50 | ) |
Forward currency contracts
| Contract amount | | | | | | | Unrealized
appreciation
(depreciation) | |
Purchases
(000) | | | Sales
(000) | | | Counterparty | | Settlement
date | | at 12/31/2020
(000) | |
| | MXN3,100 | | | | USD154 | | | HSBC Bank | | 1/8/2021 | | $ | 1 | |
| | GBP1,594 | | | | USD2,151 | | | Bank of New York Mellon | | 1/11/2021 | | | 29 | |
| | GBP382 | | | | USD519 | | | Goldman Sachs | | 1/11/2021 | | | 4 | |
| | USD169 | | | | GBP127 | | | Bank of New York Mellon | | 1/11/2021 | | | (4 | ) |
| | USD2,663 | | | | GBP1,985 | | | Standard Chartered Bank | | 1/11/2021 | | | (52 | ) |
| | | | | | | | | | | | | $ | (22 | ) |
Swap contracts
| Interest rate swaps |
| Receive | | Pay | | Expiration
date | | Notional
(000 | ) | | Value at
12/31/2020
(000 | ) | | Upfront
premium
paid
(000 | ) | | Unrealized
appreciation
at 12/31/2020
(000 | ) |
| U.S. EFFR | | 0.11% | | 5/18/2024 | | $ | 6,200 | | | $ | 7 | | | $ | — | | | $ | 7 | |
| 3-month USD-LIBOR | | 0.337% | | 5/18/2025 | | | 21,500 | | | | 23 | | | | — | | | | 23 | |
| U.S. EFFR | | 0.1275% | | 6/25/2025 | | | 2,700 | | | | 10 | | | | — | | | | 10 | |
| U.S. EFFR | | 0.105% | | 6/30/2025 | | | 2,700 | | | | 13 | | | | — | | | | 13 | |
| U.S. EFFR | | 0.0975% | | 6/30/2025 | | | 1,460 | | | | 8 | | | | — | | | | 8 | |
| U.S. EFFR | | 0.106% | | 6/30/2025 | | | 1,190 | | | | 6 | | | | — | | | | 6 | |
| U.S. EFFR | | 0.10875% | | 7/6/2025 | | | 2,600 | | | | 13 | | | | — | | | | 13 | |
| U.S. EFFR | | 0.105% | | 7/9/2025 | | | 1,300 | | | | 7 | | | | — | | | | 7 | |
| U.S. EFFR | | 0.0995% | | 7/9/2025 | | | 1,300 | | | | 7 | | | | — | | | | 7 | |
| U.S. EFFR | | 0.099% | | 7/10/2025 | | | 3,000 | | | | 16 | | | | — | | | | 16 | |
| 3-month USD-LIBOR | | 0.5935% | | 5/18/2030 | | | 7,200 | | | | 187 | | | | — | | | | 187 | |
| 3-month USD-LIBOR | | 0.807% | | 5/18/2050 | | | 1,800 | | | | 272 | | | | — | | | | 272 | |
| | | | | | | | | | | | | | | $ | — | | | $ | 569 | |
Credit default swaps
Centrally cleared credit default swaps on credit indices — sell protection
Receive/
Payment frequency | | Pay | | Expiration
date | | Notional
(000) | | | Value at
12/31/2020
(000) | | | Upfront
premium
paid
(000) | | | Unrealized
appreciation
at 12/31/2020
(000) | |
| 5.00%/Quarterly | | CDX.NA.HY.25 | | 6/20/2025 | | $ | 3,335 | | | $ | 309 | | | $ | 157 | | | $ | 152 | |
| American Funds Insurance Series | 113 |
Capital Income Builder (continued)
Investments in affiliates13
| | | Value of
affiliate at
1/1/2020
(000) | | | Additions
(000) | | | Reductions
(000) | | | Net
realized
gain
(000) | | | Net
unrealized
depreciation
(000) | | | Value of
affiliate at
12/31/2020
(000) | | | Dividend
income
(000) | |
| Short-term securities 5.17% | | | | | | | | | | | | | | | | | | | | | | | | | | | | |
| Money market investments 5.17% | | | | | | | | | | | | | | | | | | | | | | | | | | | | |
| Capital Group Central Cash Fund 0.12%12 | | | $76,520 | | | | $398,466 | | | | $418,149 | | | | $52 | | | | $(127 | ) | | | $56,762 | | | | $436 | |
| 1 | Valued under fair value procedures adopted by authority of the board of trustees. The total value of all such securities was $323,175,000, which represented 29.46% of the net assets of the fund. This amount includes $322,118,000 related to certain securities trading outside the U.S. whose values were adjusted as a result of significant market movements following the close of local trading. |
| 2 | Security did not produce income during the last 12 months. |
| 3 | Acquired in a transaction exempt from registration under Rule 144A of the Securities Act of 1933. May be resold in the U.S. in transactions exempt from registration, normally to qualified institutional buyers. The total value of all such securities was $25,651,000, which represented 2.34% of the net assets of the fund. |
| 4 | All or a portion of this security was on loan. The total value of all such securities was $5,528,000, which represented .50% of the net assets of the fund. Refer to Note 5 for more information on securities lending. |
| 5 | All or a portion of this security was pledged as collateral. The total value of pledged collateral was $2,268,000, which represented .21% of the net assets of the fund. |
| 6 | Index-linked bond whose principal amount moves with a government price index. |
| 7 | Step bond; coupon rate may change at a later date. |
| 8 | Principal payments may be made periodically. Therefore, the effective maturity date may be earlier than the stated maturity date. |
| 9 | Amount less than one thousand. |
| 10 | Coupon rate may change periodically. Reference rate and spread are as of the most recent information available. Some coupon rates are determined by the issuer or agent based on current market conditions; therefore, the reference rate and spread are not available. |
| 11 | Purchased on a TBA basis. |
| 12 | Rate represents the seven-day yield at 12/31/2020. |
| 13 | Part of the same group of investment companies as the fund as defined under the Investment Company Act of 1940. |
| 14 | Security purchased with cash collateral from securities on loan. Refer to Note 5 for more information on securities lending. |
| 15 | Notional amount is calculated based on the number of contracts and notional contract size. |
| 16 | Value is calculated based on the notional amount and current market price. |
Key to abbreviations and symbol
ADR = American Depositary Receipts
Auth. = Authority
CAD = Canadian dollars
CDI = CREST Depository Interest
EFFR = Effective Federal Funds Rate
G.O. = General Obligation
GBP = British pounds
GDR = Global Depositary Receipts
LIBOR = London Interbank Offered Rate
MXN = Mexican pesos
Ref. = Refunding
Rev. = Revenue
SOFR = Secured Overnight Financing Rate
TBA = To-be-announced
USD/$ = U.S. dollars
See notes to financial statements.
| 114 | American Funds Insurance Series |
Asset Allocation Fund
Investment portfolio December 31, 2020
| Common stocks 65.78% | | Shares | | | Value
(000) | |
| Information technology 16.49% | | | | | | | | |
| Microsoft Corp. | | | 4,891,900 | | | $ | 1,088,056 | |
| Taiwan Semiconductor Manufacturing Company, Ltd. (ADR) | | | 6,056,700 | | | | 660,423 | |
| Broadcom Inc. | | | 1,490,000 | | | | 652,397 | |
| ASML Holding NV (New York registered) (ADR) | | | 795,900 | | | | 388,177 | |
| ASML Holding NV1 | | | 70,000 | | | | 33,828 | |
| MKS Instruments, Inc. | | | 2,200,000 | | | | 330,990 | |
| Flex Ltd.2 | | | 14,500,000 | | | | 260,710 | |
| FleetCor Technologies, Inc.2 | | | 900,000 | | | | 245,547 | |
| Dell Technologies Inc., Class C2 | | | 3,250,000 | | | | 238,193 | |
| VeriSign, Inc.2 | | | 1,100,000 | | | | 238,040 | |
| Mastercard Inc., Class A | | | 510,000 | | | | 182,039 | |
| Visa Inc., Class A | | | 700,200 | | | | 153,155 | |
| RingCentral, Inc., Class A2 | | | 221,100 | | | | 83,790 | |
| PayPal Holdings, Inc.2 | | | 316,300 | | | | 74,077 | |
| Shopify Inc., Class A, subordinate voting shares2 | | | 55,800 | | | | 63,163 | |
| Intel Corp. | | | 1,250,000 | | | | 62,275 | |
| Okta, Inc., Class A2 | | | 174,680 | | | | 44,414 | |
| NVIDIA Corp. | | | 68,566 | | | | 35,805 | |
| MongoDB, Inc., Class A2 | | | 94,819 | | | | 34,044 | |
| Smartsheet Inc., Class A2 | | | 311,910 | | | | 21,612 | |
| | | | | | | | 4,890,735 | |
| | | | | | | | | |
| Health care 10.70% | | | | | | | | |
| Johnson & Johnson | | | 3,885,000 | | | | 611,421 | |
| UnitedHealth Group Inc. | | | 1,322,300 | | | | 463,704 | |
| Humana Inc. | | | 865,000 | | | | 354,884 | |
| Cigna Corp. | | | 1,275,000 | | | | 265,429 | |
| Thermo Fisher Scientific Inc. | | | 507,000 | | | | 236,150 | |
| Abbott Laboratories | | | 2,000,000 | | | | 218,980 | |
| Daiichi Sankyo Company, Ltd.1 | | | 3,873,900 | | | | 132,799 | |
| Vertex Pharmaceuticals Inc.2 | | | 550,000 | | | | 129,987 | |
| Merck & Co., Inc. | | | 1,400,000 | | | | 114,520 | |
| Pfizer Inc. | | | 3,060,000 | | | | 112,639 | |
| Gilead Sciences, Inc. | | | 1,600,000 | | | | 93,216 | |
| Regeneron Pharmaceuticals, Inc.2 | | | 150,000 | | | | 72,466 | |
| Zoetis Inc., Class A | | | 434,700 | | | | 71,943 | |
| IDEXX Laboratories, Inc.2 | | | 94,102 | | | | 47,039 | |
| Allakos Inc.2 | | | 293,700 | | | | 41,118 | |
| Cortexyme, Inc.2,3 | | | 1,218,038 | | | | 33,837 | |
| Centene Corp.2 | | | 562,770 | | | | 33,783 | |
| Ultragenyx Pharmaceutical Inc.2 | | | 217,400 | | | | 30,095 | |
| AbCellera Biologics Inc.2,3 | | | 625,100 | | | | 25,154 | |
| Viatris Inc.2 | | | 1,121,937 | | | | 21,025 | |
| Sarepta Therapeutics, Inc.2 | | | 115,700 | | | | 19,726 | |
| Bluebird Bio, Inc.2 | | | 378,900 | | | | 16,395 | |
| NuCana PLC (ADR)2,4 | | | 2,977,153 | | | | 13,367 | |
| Rotech Healthcare Inc.1,2,5,6 | | | 184,138 | | | | 13,074 | |
| Advanz Pharma Corp. Ltd.2,6 | | | 175,310 | | | | 773 | |
| Advanz Pharma Corp. Ltd.2 | | | 41,657 | | | | 184 | |
| | | | | | | | 3,173,708 | |
| | | | | | | | | |
| Financials 10.36% | | | | | | | | |
| Chubb Ltd. | | | 2,200,000 | | | | 338,624 | |
| First Republic Bank | | | 1,780,000 | | | | 261,535 | |
| Capital One Financial Corp. | | | 2,000,000 | | | | 197,700 | |
| CME Group Inc., Class A | | | 977,200 | | | | 177,899 | |
| JPMorgan Chase & Co. | | | 1,400,000 | | | | 177,898 | |
| Bank of America Corp. | | | 5,750,000 | | | | 174,283 | |
| Synchrony Financial | | | 5,000,000 | | | | 173,550 | |
| The Blackstone Group Inc., Class A | | | 2,190,950 | | | | 141,995 | |
| Sberbank of Russia PJSC (ADR)1 | | | 9,788,000 | | | | 141,103 | |
| Citigroup Inc. | | | 2,250,000 | | | | 138,735 | |
| American Funds Insurance Series | 115 |
Asset Allocation Fund (continued)
| Common stocks (continued) | | Shares | | | Value
(000) | |
| Financials (continued) | | | | | | | | |
| Apollo Global Management, Inc., Class A | | | 2,769,732 | | | $ | 135,661 | |
| Aon PLC, Class A | | | 620,000 | | | | 130,987 | |
| Arch Capital Group Ltd.2 | | | 3,234,000 | | | | 116,650 | |
| Nasdaq, Inc. | | | 844,100 | | | | 112,046 | |
| MSCI Inc. | | | 225,200 | | | | 100,559 | |
| Intercontinental Exchange, Inc. | | | 840,000 | | | | 96,844 | |
| Truist Financial Corp. | | | 1,966,000 | | | | 94,230 | |
| PNC Financial Services Group, Inc. | | | 500,000 | | | | 74,500 | |
| Kotak Mahindra Bank Ltd.1,2 | | | 2,713,240 | | | | 74,253 | |
| RenaissanceRe Holdings Ltd. | | | 357,000 | | | | 59,198 | |
| Ares Management Corp., Class A | | | 1,015,403 | | | | 47,775 | |
| BlackRock, Inc. | | | 56,000 | | | | 40,406 | |
| S&P Global Inc. | | | 102,000 | | | | 33,530 | |
| Berkshire Hathaway Inc., Class A2 | | | 61 | | | | 21,217 | |
| Tradeweb Markets Inc., Class A | | | 156,400 | | | | 9,767 | |
| Jonah Energy Parent LLC1,2,5 | | | 32,117 | | | | 482 | |
| | | | | | | | 3,071,427 | |
| | | | | | | | | |
| Consumer discretionary 6.66% | | | | | | | | |
| Amazon.com, Inc.2 | | | 134,822 | | | | 439,106 | |
| Aramark | | | 8,000,000 | | | | 307,840 | |
| Home Depot, Inc. | | | 1,113,000 | | | | 295,635 | |
| General Motors Company | | | 4,100,000 | | | | 170,724 | |
| LVMH Moët Hennessy-Louis Vuitton SE1 | | | 256,896 | | | | 160,516 | |
| MercadoLibre, Inc.2 | | | 91,300 | | | | 152,948 | |
| Kontoor Brands, Inc.4 | | | 3,700,000 | | | | 150,072 | |
| VF Corp. | | | 1,000,000 | | | | 85,410 | |
| Darden Restaurants, Inc. | | | 627,109 | | | | 74,701 | |
| NIKE, Inc., Class B | | | 357,000 | | | | 50,505 | |
| Restaurant Brands International Inc. | | | 595,000 | | | | 36,360 | |
| Booking Holdings Inc.2 | | | 12,750 | | | | 28,398 | |
| XPeng Inc., Class A (ADR)2,3 | | | 517,000 | | | | 22,143 | |
| | | | | | | | 1,974,358 | |
| | | | | | | | | |
| Consumer staples 5.31% | | | | | | | | |
| Philip Morris International Inc. | | | 7,543,000 | | | | 624,485 | |
| Nestlé SA1 | | | 2,700,000 | | | | 317,868 | |
| Nestlé SA (ADR) | | | 665,000 | | | | 78,337 | |
| British American Tobacco PLC (ADR) | | | 3,919,700 | | | | 146,949 | |
| British American Tobacco PLC1 | | | 1,060,000 | | | | 39,427 | |
| Altria Group, Inc. | | | 3,750,000 | | | | 153,750 | |
| Mondelez International, Inc. | | | 1,200,000 | | | | 70,164 | |
| Colgate-Palmolive Company | | | 677,300 | | | | 57,916 | |
| Archer Daniels Midland Company | | | 1,000,000 | | | | 50,410 | |
| Avenue Supermarts Ltd.1,2 | | | 970,539 | | | | 36,704 | |
| | | | | | | | 1,576,010 | |
| | | | | | | | | |
| Communication services 5.01% | | | | | | | | |
| Charter Communications, Inc., Class A2 | | | 754,600 | | | | 499,206 | |
| Facebook, Inc., Class A2 | | | 952,100 | | | | 260,076 | |
| Comcast Corp., Class A | | | 4,278,910 | | | | 224,215 | |
| Alphabet Inc., Class C2 | | | 78,600 | | | | 137,698 | |
| Alphabet Inc., Class A2 | | | 27,616 | | | | 48,401 | |
| Netflix, Inc.2 | | | 226,700 | | | | 122,583 | |
| New York Times Co., Class A | | | 1,450,000 | | | | 75,066 | |
| Tencent Holdings Ltd.1 | | | 965,000 | | | | 70,510 | |
| Activision Blizzard, Inc. | | | 519,500 | | | | 48,235 | |
| | | | | | | | 1,485,990 | |
| 116 | American Funds Insurance Series |
Asset Allocation Fund (continued)
| Common stocks (continued) | | Shares | | | Value
(000) | |
| Industrials 4.28% | | | | | | | | |
| Northrop Grumman Corp. | | | 1,211,900 | | | $ | 369,290 | |
| Lockheed Martin Corp. | | | 663,000 | | | | 235,352 | |
| CSX Corp. | | | 2,038,000 | | | | 184,949 | |
| L3Harris Technologies, Inc. | | | 791,100 | | | | 149,534 | |
| Komatsu Ltd.1 | | | 4,604,900 | | | | 126,186 | |
| Boeing Company | | | 583,000 | | | | 124,797 | |
| Honeywell International Inc. | | | 152,000 | | | | 32,330 | |
| Waste Management, Inc. | | | 214,000 | | | | 25,237 | |
| Cintas Corp. | | | 34,000 | | | | 12,018 | |
| Associated Materials Group Inc.1,2,5 | | | 1,588,250 | | | | 9,974 | |
| ACR III LSC Holdings LLC1,2,5 | | | 467 | | | | 703 | |
| | | | | | | | 1,270,370 | |
| | | | | | | | | |
| Materials 3.16% | | | | | | | | |
| Dow Inc. | | | 4,800,000 | | | | 266,400 | |
| LyondellBasell Industries NV | | | 2,368,100 | | | | 217,060 | |
| Franco-Nevada Corp. | | | 838,620 | | | | 105,149 | |
| Rio Tinto PLC1 | | | 1,250,000 | | | | 93,530 | |
| Royal Gold, Inc. | | | 695,000 | | | | 73,920 | |
| Nucor Corp. | | | 1,000,000 | | | | 53,190 | |
| First Quantum Minerals Ltd. | | | 2,775,000 | | | | 49,814 | |
| Allegheny Technologies Inc.2 | | | 2,589,437 | | | | 43,425 | |
| Barrick Gold Corp. | | | 1,455,000 | | | | 33,145 | |
| | | | | | | | 935,633 | |
| | | | | | | | | |
| Energy 1.53% | | | | | | | | |
| Chevron Corp. | | | 2,100,000 | | | | 177,345 | |
| Pioneer Natural Resources Company | | | 800,000 | | | | 91,112 | |
| EOG Resources, Inc. | | | 1,352,400 | | | | 67,444 | |
| Suncor Energy Inc. | | | 4,000,000 | | | | 67,091 | |
| Rosneft Oil Company PJSC (GDR)1 | | | 3,730,353 | | | | 21,035 | |
| ConocoPhillips | | | 335,000 | | | | 13,397 | |
| Euronav NV | | | 750,000 | | | | 6,000 | |
| Scorpio Tankers Inc. | | | 345,000 | | | | 3,860 | |
| Oasis Petroleum Inc.2 | | | 79,058 | | | | 2,930 | |
| Weatherford International2 | | | 289,547 | | | | 1,737 | |
| Tribune Resources, LLC1,2,5 | | | 926,514 | | | | 843 | |
| McDermott International, Inc.2 | | | 40,219 | | | | 33 | |
| Sable Permian Resources, LLC, units1,2,5 | | | 24,001,604 | | | | — | 7 |
| | | | | | | | 452,827 | |
| | | | | | | | | |
| Real estate 1.28% | | | | | | | | |
| Crown Castle International Corp. REIT | | | 1,032,335 | | | | 164,337 | |
| American Tower Corp. REIT | | | 328,100 | | | | 73,645 | |
| VICI Properties Inc. REIT | | | 2,805,000 | | | | 71,528 | |
| Alexandria Real Estate Equities, Inc. REIT | | | 399,000 | | | | 71,110 | |
| | | | | | | | 380,620 | |
| | | | | | | | | |
| Utilities 1.00% | | | | | | | | |
| Enel SpA1 | | | 24,000,000 | | | | 242,361 | |
| DTE Energy Company | | | 226,000 | | | | 27,439 | |
| Xcel Energy Inc. | | | 400,000 | | | | 26,668 | |
| | | | | | | | 296,468 | |
| | | | | | | | | |
| Total common stocks (cost: $11,273,725,000) | | | | | | | 19,508,146 | |
| American Funds Insurance Series | 117 |
Asset Allocation Fund (continued)
| Rights & warrants 0.00% | | Shares | | | Value
(000) | |
| Energy 0.00% | | | | | | |
| Tribune Resources, LLC, Class A, warrants, expire 20231,2,5 | | | 311,755 | | | $ | — | 7 |
| Tribune Resources, LLC, Class B, warrants, expire 20231,2,5 | | | 242,476 | | | | — | 7 |
| Tribune Resources, LLC, Class C, warrants, expire 20231,2,5 | | | 227,540 | | | | — | 7 |
| | | | | | | | | |
| Total rights & warrants (cost: $47,000) | | | | | | | — | 7 |
| | | | | | | | | |
| Convertible stocks 0.50% | | | | | | | | |
| Information technology 0.29% | | | | | | | | |
| Broadcom Inc., Series A, cumulative convertible preferred shares, 8.00% 2022 | | | 60,000 | | | | 85,348 | |
| | | | | | | | | |
| Financials 0.15% | | | | | | | | |
| 2020 Cash Mandatory Exchangeable Trust, convertible preferred shares, 5.25% 20238 | | | 37,778 | | | | 45,378 | |
| | | | | | | | | |
| Health care 0.06% | | | | | | | | |
| Danaher Corp., Series B, cumulative convertible preferred shares, 5.00% 20233 | | | 13,300 | | | | 17,304 | |
| | | | | | | | | |
| Total convertible stocks (cost: $110,591,000) | | | | | | | 148,030 | |
| | | | | | | | | |
| Bonds, notes & other debt instruments 30.11% | Principal amount
(000) | | | | | |
| Corporate bonds, notes & loans 12.99% | | | | | | | | |
| Financials 2.27% | | | | | | | | |
| ACE INA Holdings Inc. 2.875% 2022 | | $ | 3,880 | | | | 4,047 | |
| ACE INA Holdings Inc. 3.35% 2026 | | | 1,380 | | | | 1,556 | |
| ACE INA Holdings Inc. 4.35% 2045 | | | 800 | | | | 1,085 | |
| Advisor Group Holdings, LLC 6.25% 20288 | | | 2,445 | | | | 2,479 | |
| AG Merger Sub II, Inc. 10.75% 20278 | | | 2,484 | | | | 2,752 | |
| Allstate Corp. 3.85% 2049 | | | 950 | | | | 1,194 | |
| Ally Financial Inc. 8.00% 2031 | | | 3,000 | | | | 4,274 | |
| American International Group, Inc. 2.50% 2025 | | | 15,800 | | | | 16,992 | |
| American International Group, Inc. 4.20% 2028 | | | 565 | | | | 671 | |
| American International Group, Inc. 3.40% 2030 | | | 4,540 | | | | 5,203 | |
| American International Group, Inc. 4.375% 2050 | | | 1,770 | | | | 2,318 | |
| AON Corp. 2.20% 2022 | | | 2,236 | | | | 2,312 | |
| Banco Santander, SA 2.749% 2030 | | | 5,400 | | | | 5,578 | |
| Bangkok Bank PCL 3.733% 2034 (UST Yield Curve Rate T Note Constant Maturity 5-year + 1.90% on 9/25/2029)9 | | | 1,278 | | | | 1,333 | |
| Bank of America Corp. 3.55% 2024 (3-month USD-LIBOR + 0.78% on 3/5/2023)9 | | | 6,000 | | | | 6,413 | |
| Bank of America Corp. 1.197% 2026 (USD-SOFR + 1.01% on 10/24/2025)9 | | | 2,500 | | | | 2,534 | |
| Bank of America Corp. 3.419% 2028 (3-month USD-LIBOR + 1.04% on 12/20/2027)9 | | | 2,345 | | | | 2,653 | |
| Bank of America Corp. 1.898% 2031 (USD-SOFR + 1.53% on 7/23/2030)9 | | | 42,674 | | | | 43,128 | |
| Bank of America Corp. 1.922% 2031 (USD-SOFR + 1.37% on 10/24/2030)9 | | | 11,065 | | | | 11,215 | |
| Bank of America Corp. 2.676% 2041 (USD-SOFR + 1.93% on 6/19/2040)9 | | | 750 | | | | 783 | |
| Bank of Nova Scotia 1.625% 2023 | | | 5,000 | | | | 5,145 | |
| BB&T Corp. 2.625% 2022 | | | 2,500 | | | | 2,557 | |
| BB&T Corp. 2.75% 2022 | | | 762 | | | | 784 | |
| Berkshire Hathaway Finance Corp. 4.20% 2048 | | | 6,570 | | | | 8,679 | |
| Berkshire Hathaway Finance Corp. 4.25% 2049 | | | 1,125 | | | | 1,495 | |
| Berkshire Hathaway Inc. 2.20% 2021 | | | 500 | | | | 501 | |
| Berkshire Hathaway Inc. 2.75% 2023 | | | 1,615 | | | | 1,696 | |
| Berkshire Hathaway Inc. 3.125% 2026 | | | 500 | | | | 559 | |
| BNP Paribas 3.375% 20258 | | | 3,225 | | | | 3,538 | |
| Citigroup Inc. 2.312% 2022 (USD-SOFR + 0.867% on 11/4/2021)9 | | | 9,000 | | | | 9,146 | |
| Citigroup Inc. 2.976% 2030 (USD-SOFR + 1.422% on 11/5/2029)9 | | | 3,254 | | | | 3,585 | |
| Citigroup Inc. 2.572% 2031 (USD-SOFR + 2.107% on 6/3/2030)9 | | | 5,575 | | | | 5,944 | |
| CME Group Inc. 3.75% 2028 | | | 3,425 | | | | 4,059 | |
| Commonwealth Bank of Australia 3.35% 2024 | | | 1,225 | | | | 1,342 | |
| Commonwealth Bank of Australia 3.35% 20248 | | | 1,000 | | | | 1,096 | |
| Compass Diversified Holdings 8.00% 20268 | | | 3,245 | | | | 3,419 | |
| 118 | American Funds Insurance Series |
Asset Allocation Fund (continued)
| Bonds, notes & other debt instruments (continued) | Principal amount
(000) | | | Value
(000) | |
| Corporate bonds, notes & loans (continued) | | | | | | |
| Financials (continued) | | | | | | |
| Crédit Agricole SA 4.375% 20258 | | $ | 850 | | | $ | 955 | |
| Credit Suisse AG (New York Branch) 2.95% 2025 | | | 2,700 | | | | 2,963 | |
| Credit Suisse Group AG 3.80% 2023 | | | 1,625 | | | | 1,751 | |
| Credit Suisse Group AG 3.869% 2029 (3-month USD-LIBOR + 1.41% on 1/12/2028)8,9 | | | 800 | | | | 907 | |
| Credit Suisse Group AG 4.194% 2031 (USD-SOFR + 3.73% on 4/1/2030)8,9 | | | 11,625 | | | | 13,683 | |
| Danske Bank AS 2.70% 20228 | | | 1,000 | | | | 1,025 | |
| Deutsche Bank AG 2.129% 2026 (USD-SOFR + 1.87% on 11/24/2025)9 | | | 5,800 | | | | 5,935 | |
| Deutsche Bank AG 3.547% 2031 (USD-SOFR + 3.043% on 9/18/2030)9 | | | 4,050 | | | | 4,401 | |
| DNB Bank ASA 2.375% 20218 | | | 2,000 | | | | 2,018 | |
| Ford Motor Credit Co. 3.375% 2025 | | | 5,750 | | | | 5,896 | |
| FS Energy and Power Fund 7.50% 20238 | | | 2,995 | | | | 2,883 | |
| Goldman Sachs Group, Inc. 1.093% 2026 (USD-SOFR + 0.789% on 12/9/2025)9 | | | 11,150 | | | | 11,275 | |
| Goldman Sachs Group, Inc. 3.691% 2028 (3-month USD-LIBOR + 1.51% on 6/5/2027)9 | | | 2,000 | | | | 2,307 | |
| Goldman Sachs Group, Inc. 3.814% 2029 (3-month USD-LIBOR + 1.158% on 4/23/2028)9 | | | 390 | | | | 452 | |
| Goldman Sachs Group, Inc. 2.60% 2030 | | | 7,000 | | | | 7,538 | |
| Groupe BPCE SA 2.75% 20238 | | | 600 | | | | 628 | |
| Groupe BPCE SA 5.70% 20238 | | | 3,460 | | | | 3,918 | |
| Groupe BPCE SA 5.15% 20248 | | | 2,500 | | | | 2,849 | |
| Groupe BPCE SA 1.652% 2026 (USD-SOFR + 1.52% on 10/6/2025)8,9 | | | 6,375 | | | | 6,530 | |
| Hartford Financial Services Group, Inc. 2.80% 2029 | | | 3,480 | | | | 3,786 | |
| Hartford Financial Services Group, Inc. 3.60% 2049 | | | 1,000 | | | | 1,175 | |
| HSBC Holdings PLC 3.262% 2023 (3-month USD-LIBOR + 1.055% on 3/13/2022)9 | | | 1,500 | | | | 1,551 | |
| HSBC Holdings PLC 4.25% 2024 | | | 3,000 | | | | 3,312 | |
| HSBC Holdings PLC 2.633% 2025 (3-month USD-LIBOR + 1.14% on 11/7/2024)9 | | | 625 | | | | 665 | |
| HSBC Holdings PLC 2.099% 2026 (USD-SOFR + 1.929% on 6/4/2025)9 | | | 6,000 | | | | 6,240 | |
| HSBC Holdings PLC 4.583% 2029 (3-month USD-LIBOR + 1.535% on 6/19/2028)9 | | | 4,675 | | | | 5,532 | |
| HSBC Holdings PLC 3.973% 2030 (3-month USD-LIBOR + 1.61% on 5/22/2029)9 | | | 9,675 | | | | 11,191 | |
| HSBC Holdings PLC 2.357% 2031 (USD-SOFR + 1.947% on 8/18/2030)9 | | | 12,025 | | | | 12,439 | |
| Icahn Enterprises Finance Corp. 6.25% 2022 | | | 5,675 | | | | 5,702 | |
| Icahn Enterprises Finance Corp. 5.25% 2027 | | | 1,185 | | | | 1,273 | |
| Intercontinental Exchange, Inc. 2.65% 2040 | | | 7,425 | | | | 7,643 | |
| Intercontinental Exchange, Inc. 3.00% 2060 | | | 2,380 | | | | 2,499 | |
| Intesa Sanpaolo SpA 3.375% 20238 | | | 750 | | | | 786 | |
| Intesa Sanpaolo SpA 3.25% 20248 | | | 750 | | | | 802 | |
| Intesa Sanpaolo SpA 5.017% 20248 | | | 1,730 | | | | 1,893 | |
| Intesa Sanpaolo SpA 3.875% 20278 | | | 300 | | | | 330 | |
| JPMorgan Chase & Co. 3.559% 2024 (3-month USD-LIBOR + 0.73% on 4/23/2023)9 | | | 4,725 | | | | 5,066 | |
| JPMorgan Chase & Co. 1.045% 2026 (USD-SOFR + 0.80% on 11/19/2025)9 | | | 3,955 | | | | 4,001 | |
| JPMorgan Chase & Co. 1.764% 2031 (USD-SOFR + 1.05% on 11/19/2030)9 | | | 5,000 | | | | 5,053 | |
| JPMorgan Chase & Co. 2.522% 2031 (USD-SOFR + 2.04% on 4/22/2030)9 | | | 7,325 | | | | 7,879 | |
| JPMorgan Chase & Co. 3.109% 2051 (USD-SOFR + 3.109% on 4/22/2050)9 | | | 3,236 | | | | 3,603 | |
| JPMorgan Chase & Co., Series Z, junior subordinated, 4.014% (3-month USD-LIBOR + 3.80% on 2/1/2021)9 | | | 500 | | | | 498 | |
| Kasikornbank PC HK 3.343% 2031 (UST Yield Curve Rate T Note Constant Maturity 5-year + 1.70% on 10/2/2026)9 | | | 1,222 | | | | 1,257 | |
| Ladder Capital Corp. 5.25% 20228 | | | 475 | | | | 478 | |
| Ladder Capital Corp. 4.25% 20278 | | | 3,157 | | | | 3,110 | |
| Lloyds Banking Group PLC 2.907% 2023 (3-month USD-LIBOR + 0.81% on11/7/2022)9 | | | 750 | | | | 784 | |
| Lloyds Banking Group PLC 4.05% 2023 | | | 2,000 | | | | 2,187 | |
| Lloyds Banking Group PLC 3.87% 2025 (UST Yield Curve Rate T Note Constant Maturity 1-year + 3.50% on 7/9/2024)9 | | | 6,340 | | | | 6,998 | |
| Lloyds Banking Group PLC 4.45% 2025 | | | 800 | | | | 918 | |
| Lloyds Banking Group PLC 4.375% 2028 | | | 2,150 | | | | 2,559 | |
| LPL Financial Holdings Inc. 4.625% 20278 | | | 2,200 | | | | 2,284 | |
| Marsh & McLennan Companies, Inc. 3.875% 2024 | | | 820 | | | | 905 | |
| Marsh & McLennan Companies, Inc. 4.375% 2029 | | | 1,705 | | | | 2,076 | |
| Marsh & McLennan Companies, Inc. 4.90% 2049 | | | 1,539 | | | | 2,233 | |
| MetLife, Inc. 4.55% 2030 | | | 3,770 | | | | 4,715 | |
| Metropolitan Life Global Funding I 1.95% 20218 | | | 1,250 | | | | 1,265 | |
| Metropolitan Life Global Funding I 1.95% 20238 | | | 7,800 | | | | 8,050 | |
| American Funds Insurance Series | 119 |
Asset Allocation Fund (continued)
| Bonds, notes & other debt instruments (continued) | Principal amount
(000) | | | Value
(000) | |
| Corporate bonds, notes & loans (continued) | | | | | | | | |
| Financials (continued) | | | | | | | | |
| Metropolitan Life Global Funding I 0.95% 20258 | | $ | 18,767 | | | $ | 19,024 | |
| MGIC Investment Corp. 5.25% 2028 | | | 1,175 | | | | 1,259 | |
| Mitsubishi UFJ Financial Group, Inc. 2.623% 2022 | | | 1,610 | | | | 1,665 | |
| Mitsubishi UFJ Financial Group, Inc. 2.801% 2024 | | | 1,610 | | | | 1,727 | |
| Mitsubishi UFJ Financial Group, Inc. 3.195% 2029 | | | 5,000 | | | | 5,636 | |
| Morgan Stanley 2.50% 2021 | | | 3,000 | | | | 3,019 | |
| Morgan Stanley 3.70% 2024 | | | 2,410 | | | | 2,684 | |
| Morgan Stanley 3.737% 2024 (3-month USD-LIBOR + 0.847% on 4/24/2023)9 | | | 300 | | | | 323 | |
| Morgan Stanley 0.985% 2026 (USD-SOFR + 0.72% on 12/10/2025)9 | | | 18,706 | | | | 18,853 | |
| Morgan Stanley 3.125% 2026 | | | 325 | | | | 364 | |
| Morgan Stanley 2.699% 2031 (USD-SOFR + 1.143% on 1/22/2030)9 | | | 6,000 | | | | 6,518 | |
| Morgan Stanley 1.794% 2032 (USD-SOFR + 1.034% on 2/13/2031)9 | | | 3,000 | | | | 3,020 | |
| Navient Corp. 6.50% 2022 | | | 3,675 | | | | 3,898 | |
| Navient Corp. 5.50% 2023 | | | 10,165 | | | | 10,654 | |
| Navient Corp. 7.25% 2023 | | | 725 | | | | 796 | |
| Navient Corp. 5.875% 2024 | | | 1,005 | | | | 1,070 | |
| Navient Corp. 6.125% 2024 | | | 8,030 | | | | 8,597 | |
| New York Life Global Funding 1.70% 20218 | | | 1,125 | | | | 1,136 | |
| New York Life Global Funding 2.30% 20228 | | | 250 | | | | 257 | |
| New York Life Global Funding 0.95% 20258 | | | 8,537 | | | | 8,658 | |
| New York Life Global Funding 2.35% 20268 | | | 890 | | | | 951 | |
| New York Life Global Funding 1.20% 20308 | | | 3,528 | | | | 3,424 | |
| New York Life Insurance Company 3.75% 20508 | | | 527 | | | | 631 | |
| Owl Rock Capital Corp. 4.625% 20248 | | | 2,305 | | | | 2,363 | |
| Owl Rock Capital Corp. 3.75% 2025 | | | 2,874 | | | | 2,985 | |
| Owl Rock Capital Corp. 4.00% 2025 | | | 102 | | | | 107 | |
| Owl Rock Capital Corp. 3.375% 2026 | | | 1,290 | | | | 1,308 | |
| PNC Bank 2.55% 2021 | | | 4,000 | | | | 4,079 | |
| PNC Financial Services Group, Inc. 2.854% 20229 | | | 1,445 | | | | 1,513 | |
| PNC Financial Services Group, Inc. 3.50% 2024 | | | 3,850 | | | | 4,198 | |
| PNC Financial Services Group, Inc. 3.90% 2024 | | | 2,000 | | | | 2,217 | |
| PNC Financial Services Group, Inc. 2.55% 2030 | | | 2,000 | | | | 2,192 | |
| Power Financial Corp Ltd. 5.25% 2028 | | | 383 | | | | 442 | |
| Power Financial Corp Ltd. 6.15% 2028 | | | 350 | | | | 427 | |
| Power Financial Corp Ltd. 4.50% 2029 | | | 554 | | | | 611 | |
| Power Financial Corp Ltd. 3.95% 2030 | | | 1,213 | | | | 1,298 | |
| Progressive Corp. 3.20% 2030 | | | 1,380 | | | | 1,592 | |
| Prudential Financial, Inc. 3.878% 2028 | | | 500 | | | | 588 | |
| Prudential Financial, Inc. 4.35% 2050 | | | 7,000 | | | | 9,196 | |
| Quicken Loans, LLC 3.625% 20298 | | | 1,505 | | | | 1,538 | |
| Rabobank Nederland 2.75% 2022 | | | 2,250 | | | | 2,307 | |
| Rabobank Nederland 4.375% 2025 | | | 4,500 | | | | 5,138 | |
| Royal Bank of Canada 3.20% 2021 | | | 12,000 | | | | 12,115 | |
| Royal Bank of Canada 1.15% 2025 | | | 11,711 | | | | 11,972 | |
| Skandinaviska Enskilda Banken AB 1.875% 2021 | | | 1,675 | | | | 1,694 | |
| Skandinaviska Enskilda Banken AB 2.625% 2021 | | | 250 | | | | 251 | |
| Skandinaviska Enskilda Banken AB 2.80% 2022 | | | 700 | | | | 721 | |
| Springleaf Finance Corp. 6.125% 2024 | | | 5,825 | | | | 6,371 | |
| Starwood Property Trust, Inc. 5.00% 2021 | | | 6,625 | | | | 6,753 | |
| Starwood Property Trust, Inc. 5.50% 20238 | | | 1,160 | | | | 1,214 | |
| Swiss Re Finance (Luxembourg) SA 5.00% 2049 (UST Yield Curve Rate T Note Constant Maturity 5-year + 3.582% on 4/2/2029)8,9 | | | 2,800 | | | | 3,271 | |
| Toronto-Dominion Bank 2.65% 2024 | | | 625 | | | | 670 | |
| Toronto-Dominion Bank 0.75% 2025 | | | 5,375 | | | | 5,398 | |
| Toronto-Dominion Bank 1.15% 2025 | | | 12,000 | | | | 12,259 | |
| Travelers Companies, Inc. 4.00% 2047 | | | 860 | | | | 1,116 | |
| Travelers Companies, Inc. 4.10% 2049 | | | 910 | | | | 1,199 | |
| Travelers Companies, Inc. 2.55% 2050 | | | 172 | | | | 181 | |
| Travelport Finance Luxembourg SARL, Term Loan, (3-month USD-LIBOR + 8.00%) 1.06% 2025 (72.22% PIK)10,11,12 | | | 1,460 | | | | 1,445 | |
| 120 | American Funds Insurance Series |
Asset Allocation Fund (continued)
| Bonds, notes & other debt instruments (continued) | Principal amount
(000) | | | Value
(000) | |
| Corporate bonds, notes & loans (continued) | | | | | | | | |
| Financials (continued) | | | | | | | | |
| Travelport Finance Luxembourg SARL, Term Loan, (3-month USD-LIBOR + 5.00%) 5.254% 202610,12 | | $ | 1,795 | | | $ | 1,244 | |
| U.S. Bancorp 2.625% 2022 | | | 1,805 | | | | 1,847 | |
| U.S. Bancorp 2.40% 2024 | | | 2,000 | | | | 2,133 | |
| U.S. Bancorp 3.70% 2024 | | | 5,000 | | | | 5,486 | |
| U.S. Bancorp 2.375% 2026 | | | 4,000 | | | | 4,339 | |
| UBS Group AG 4.125% 20258 | | | 2,750 | | | | 3,152 | |
| UBS Group AG 1.364% 2027 (UST Yield Curve Rate T Note Constant Maturity 5-year + 1.08% on 1/30/2026)8,9 | | | 2,925 | | | | 2,959 | |
| UniCredit SpA 3.75% 20228 | | | 5,725 | | | | 5,934 | |
| UniCredit SpA 6.572% 20228 | | | 475 | | | | 501 | |
| UniCredit SpA 4.625% 20278 | | | 625 | | | | 712 | |
| UniCredit SpA 5.861% 2032 (5-year USD-ICE Swap + 3.703% on 6/19/2027)8,9 | | | 1,200 | | | | 1,353 | |
| Wells Fargo & Company 2.164% 2026 (3-month USD-LIBOR + 0.75% on 2/11/2025)9 | | | 8,000 | | | | 8,416 | |
| Wells Fargo & Company 3.196% 2027 (3-month USD-LIBOR + 1.17% on 6/17/2026)9 | | | 1,988 | | | | 2,205 | |
| Wells Fargo & Company 3.584% 2028 (3-month USD-LIBOR + 1.31% on 5/22/2027)9 | | | 217 | | | | 246 | |
| Wells Fargo & Company 2.879% 2030 (3-month USD-LIBOR + 1.17% on 10/30/2029)9 | | | 2,904 | | | | 3,169 | |
| Wells Fargo & Company 2.572% 2031 (3-month USD-LIBOR + 1.00% on 2/11/2030)9 | | | 12,846 | | | | 13,604 | |
| Wells Fargo & Company 3.068% 2041 (USD-SOFR + 2.53% on 4/30/2040)9 | | | 3,076 | | | | 3,351 | |
| Westpac Banking Corp. 2.75% 2023 | | | 1,750 | | | | 1,840 | |
| Westpac Banking Corp. 2.894% 2030 (UST Yield Curve Rate T Note Constant Maturity 5-year + 1.35% on 2/4/2025)9 | | | 8,500 | | | | 8,914 | |
| Westpac Banking Corp. 2.668% 2035 (UST Yield Curve Rate T Note Constant Maturity 5-year + 1.75% on 11/15/2030)9 | | | 3,325 | | | | 3,429 | |
| Westpac Banking Corp. 2.963% 2040 | | | 1,500 | | | | 1,597 | |
| | | | | | | | 674,041 | |
| | | | | | | | | |
| Utilities 1.54% | | | | | | | | |
| AEP Transmission Co. LLC 3.75% 2047 | | | 2,390 | | | | 2,915 | |
| AEP Transmission Co. LLC 4.25% 2048 | | | 1,524 | | | | 2,015 | |
| AEP Transmission Co. LLC 3.65% 2050 | | | 550 | | | | 669 | |
| Ameren Corp. 2.50% 2024 | | | 969 | | | | 1,034 | |
| Ameren Corp. 3.50% 2031 | | | 4,829 | | | | 5,560 | |
| Ameren Corp. 4.50% 2049 | | | 425 | | | | 579 | |
| American Electric Power Company, Inc. 2.95% 2022 | | | 3,020 | | | | 3,155 | |
| American Electric Power Company, Inc. 1.00% 2025 | | | 625 | | | | 633 | |
| American Electric Power Company, Inc. 2.30% 2030 | | | 4,500 | | | | 4,706 | |
| CenterPoint Energy, Inc. 2.50% 2022 | | | 900 | | | | 931 | |
| CenterPoint Energy, Inc. 3.85% 2024 | | | 3,275 | | | | 3,585 | |
| CenterPoint Energy, Inc. 2.95% 2030 | | | 1,350 | | | | 1,471 | |
| CenterPoint Energy, Inc. 3.70% 2049 | | | 2,775 | | | | 3,202 | |
| CenterPoint Energy, Inc. 2.90% 2050 | | | 350 | | | | 380 | |
| CMS Energy Corp. 3.00% 2026 | | | 1,004 | | | | 1,108 | |
| CMS Energy Corp. 3.45% 2027 | | | 1,850 | | | | 2,093 | |
| Comisión Federal de Electricidad 4.75% 20278 | | | 645 | | | | 734 | |
| Commonwealth Edison Co. 4.35% 2045 | | | 1,585 | | | | 2,070 | |
| Commonwealth Edison Co. 4.00% 2048 | | | 2,600 | | | | 3,293 | |
| Connecticut Light and Power Co. 0.75% 2025 | | | 825 | | | | 835 | |
| Connecticut Light and Power Co. 3.20% 2027 | | | 1,525 | | | | 1,713 | |
| Consolidated Edison Co. of New York, Inc. 4.50% 2058 | | | 6,100 | | | | 8,064 | |
| Consumers Energy Co. 3.25% 2046 | | | 507 | | | | 580 | |
| Consumers Energy Co. 4.05% 2048 | | | 3,017 | | | | 3,954 | |
| Consumers Energy Co. 3.10% 2050 | | | 1,730 | | | | 2,004 | |
| Consumers Energy Co. 3.75% 2050 | | | 1,193 | | | | 1,500 | |
| Dominion Resources, Inc. 2.00% 2021 | | | 665 | | | | 671 | |
| Dominion Resources, Inc. 2.75% 2022 | | | 800 | | | | 818 | |
| Dominion Resources, Inc. 3.30% 2025 | | | 1,164 | | | | 1,283 | |
| Dominion Resources, Inc. 2.85% 2026 | | | 750 | | | | 827 | |
| Dominion Resources, Inc., junior subordinated, 3.071% 20249 | | | 1,775 | | | | 1,917 | |
| DPL Inc. 4.125% 20258 | | | 1,160 | | | | 1,254 | |
| American Funds Insurance Series | 121 |
Asset Allocation Fund (continued)
| Bonds, notes & other debt instruments (continued) | Principal amount
(000) | | | Value
(000) | |
| Corporate bonds, notes & loans (continued) | | | | | | | | |
| Utilities (continued) | | | | | | | | |
| DTE Energy Co. 3.95% 2049 | | $ | 1,800 | | | $ | 2,337 | |
| Duke Energy Carolinas, LLC 3.95% 2028 | | | 1,250 | | | | 1,491 | |
| Duke Energy Corp. 0.90% 2025 | | | 800 | | | | 802 | |
| Duke Energy Florida, LLC 3.20% 2027 | | | 1,445 | | | | 1,615 | |
| Duke Energy Florida, LLC 1.75% 2030 | | | 5,000 | | | | 5,116 | |
| Duke Energy Indiana, Inc. 3.25% 2049 | | | 1,225 | | | | 1,387 | |
| Duke Energy Ohio, Inc. 2.125% 2030 | | | 850 | | | | 891 | |
| Duke Energy Progress Inc. 3.70% 2046 | | | 750 | | | | 907 | |
| Duke Energy Progress, LLC 2.50% 2050 | | | 1,459 | | | | 1,471 | |
| Edison International 3.55% 2024 | | | 4,763 | | | | 5,133 | |
| Edison International 4.95% 2025 | | | 250 | | | | 286 | |
| Edison International 5.75% 2027 | | | 5,436 | | | | 6,512 | |
| Edison International 4.125% 2028 | | | 5,904 | | | | 6,584 | |
| EDP Finance BV 3.625% 20248 | | | 4,100 | | | | 4,478 | |
| Electricité de France SA 4.75% 20358 | | | 1,250 | | | | 1,558 | |
| Electricité de France SA 4.875% 20388 | | | 2,750 | | | | 3,434 | |
| Electricité de France SA 5.60% 2040 | | | 525 | | | | 705 | |
| Emera US Finance LP 3.55% 2026 | | | 320 | | | | 360 | |
| Enersis Américas SA 4.00% 2026 | | | 245 | | | | 275 | |
| Entergy Corp. 2.95% 2026 | | | 872 | | | | 962 | |
| Entergy Corp. 3.12% 2027 | | | 3,000 | | | | 3,346 | |
| Entergy Corp. 1.60% 2030 | | | 875 | | | | 885 | |
| Entergy Corp. 2.80% 2030 | | | 4,700 | | | | 5,081 | |
| Entergy Corp. 3.75% 2050 | | | 850 | | | | 987 | |
| Entergy Louisiana, LLC 4.20% 2048 | | | 4,200 | | | | 5,475 | |
| Entergy Texas, Inc. 1.75% 2031 | | | 5,575 | | | | 5,597 | |
| Evergy Metro, Inc. 2.25% 2030 | | | 1,320 | | | | 1,399 | |
| Eversource Energy 3.80% 2023 | | | 2,730 | | | | 2,991 | |
| Exelon Corp. 3.40% 2026 | | | 100 | | | | 113 | |
| Exelon Corp. 4.70% 2050 | | | 500 | | | | 666 | |
| Exelon Corp., junior subordinated, 3.497% 20229 | | | 1,075 | | | | 1,118 | |
| FirstEnergy Corp. 1.60% 2026 | | | 4,160 | | | | 4,070 | |
| FirstEnergy Corp. 3.90% 2027 (4.40% on 1/16/2021)9 | | | 6,708 | | | | 7,400 | |
| FirstEnergy Corp. 2.25% 2030 | | | 25,443 | | | | 24,629 | |
| FirstEnergy Corp. 2.65% 2030 | | | 11,581 | | | | 11,630 | |
| FirstEnergy Corp. 3.40% 2050 | | | 9,400 | | | | 9,037 | |
| Florida Power & Light Co. 3.15% 2049 | | | 1,975 | | | | 2,276 | |
| Gulf Power Co. 3.30% 2027 | | | 4,500 | | | | 5,075 | |
| Interstate Power and Light Co. 2.30% 2030 | | | 825 | | | | 874 | |
| Jersey Central Power & Light Co. 4.30% 20268 | | | 1,790 | | | | 2,004 | |
| MidAmerican Energy Holdings Co. 3.10% 2027 | | | 2,000 | | | | 2,244 | |
| Mississippi Power Co. 3.95% 2028 | | | 2,814 | | | | 3,283 | |
| National Grid PLC 3.15% 20278 | | | 275 | | | | 306 | |
| NextEra Energy Capital Holdings, Inc. 2.75% 2029 | | | 641 | | | | 699 | |
| Northern States Power Co. 4.125% 2044 | | | 6,000 | | | | 7,781 | |
| Northern States Power Co. 2.60% 2051 | | | 147 | | | | 156 | |
| Oncor Electric Delivery Company LLC 2.75% 2024 | | | 1,525 | | | | 1,636 | |
| Oncor Electric Delivery Company LLC 0.55% 20258 | | | 1,625 | | | | 1,624 | |
| Pacific Gas and Electric Co. 1.75% 2022 | | | 1,575 | | | | 1,580 | |
| Pacific Gas and Electric Co. 4.25% 2023 | | | 3,445 | | | | 3,701 | |
| Pacific Gas and Electric Co. 3.40% 2024 | | | 1,385 | | | | 1,476 | |
| Pacific Gas and Electric Co. 2.95% 2026 | | | 7,825 | | | | 8,282 | |
| Pacific Gas and Electric Co. 3.15% 2026 | | | 6,925 | | | | 7,385 | |
| Pacific Gas and Electric Co. 2.10% 2027 | | | 14,885 | | | | 15,127 | |
| Pacific Gas and Electric Co. 3.30% 2027 | | | 5,118 | | | | 5,484 | |
| Pacific Gas and Electric Co. 3.30% 2027 | | | 4,775 | | | | 5,104 | |
| Pacific Gas and Electric Co. 3.75% 2028 | | | 500 | | | | 547 | |
| Pacific Gas and Electric Co. 4.65% 2028 | | | 5,449 | | | | 6,229 | |
| Pacific Gas and Electric Co. 2.50% 2031 | | | 21,246 | | | | 21,300 | |
| Pacific Gas and Electric Co. 3.30% 2040 | | | 375 | | | | 375 | |
| Pacific Gas and Electric Co. 3.75% 2042 | | | 1,505 | | | | 1,517 | |
| 122 | American Funds Insurance Series |
Asset Allocation Fund (continued)
| Bonds, notes & other debt instruments (continued) | Principal amount
(000) | | | Value
(000) | |
| Corporate bonds, notes & loans (continued) | | | | | | | | |
| Utilities (continued) | | | | | | | | |
| Pacific Gas and Electric Co. 3.50% 2050 | | $ | 5,012 | | | $ | 4,993 | |
| PacifiCorp., First Mortgage Bonds, 3.60% 2024 | | | 5,695 | | | | 6,210 | |
| PacifiCorp., First Mortgage Bonds, 4.125% 2049 | | | 5,500 | | | | 7,072 | |
| Peco Energy Co. 2.80% 2050 | | | 975 | | | | 1,038 | |
| PG&E Corp. 5.00% 2028 | | | 3,850 | | | | 4,105 | |
| Public Service Company of Colorado 2.25% 2022 | | | 2,000 | | | | 2,048 | |
| Public Service Company of Colorado 1.90% 2031 | | | 2,500 | | | | 2,612 | |
| Public Service Company of Colorado 3.80% 2047 | | | 1,720 | | | | 2,132 | |
| Public Service Electric and Gas Co. 3.65% 2028 | | | 1,700 | | | | 1,975 | |
| Public Service Electric and Gas Co. 3.20% 2029 | | | 2,333 | | | | 2,663 | |
| Public Service Electric and Gas Co. 2.45% 2030 | | | 679 | | | | 738 | |
| Public Service Electric and Gas Co. 3.60% 2047 | | | 548 | | | | 661 | |
| Public Service Electric and Gas Co. 2.05% 2050 | | | 1,840 | | | | 1,731 | |
| Public Service Electric and Gas Co. 3.15% 2050 | | | 4,150 | | | | 4,740 | |
| Public Service Enterprise Group Inc. 2.65% 2022 | | | 1,900 | | | | 1,981 | |
| Public Service Enterprise Group Inc. 2.25% 2026 | | | 345 | | | | 373 | |
| Public Service Enterprise Group Inc. 1.60% 2030 | | | 4,375 | | | | 4,320 | |
| Puget Energy, Inc. 6.00% 2021 | | | 1,823 | | | | 1,887 | |
| Puget Energy, Inc. 5.625% 2022 | | | 1,965 | | | | 2,081 | |
| Puget Sound Energy, Inc. 3.25% 2049 | | | 3,000 | | | | 3,339 | |
| San Diego Gas & Electric Co. 1.70% 2030 | | | 851 | | | | 861 | |
| San Diego Gas & Electric Co. 6.125% 2037 | | | 1,450 | | | | 1,998 | |
| San Diego Gas & Electric Co. 4.50% 2040 | | | 750 | | | | 956 | |
| San Diego Gas & Electric Co. 3.75% 2047 | | | 331 | | | | 388 | |
| San Diego Gas & Electric Co. 4.10% 2049 | | | 1,607 | | | | 2,008 | |
| San Diego Gas & Electric Co. 3.32% 2050 | | | 500 | | | | 570 | |
| Southern California Edison Co. 2.90% 2021 | | | 8,000 | | | | 8,033 | |
| Southern California Edison Co. 3.70% 2025 | | | 611 | | | | 686 | |
| Southern California Edison Co. 3.65% 2028 | | | 821 | | | | 922 | |
| Southern California Edison Co. 2.85% 2029 | | | 5,450 | | | | 5,949 | |
| Southern California Edison Co. 2.25% 2030 | | | 7,642 | | | | 7,965 | |
| Southern California Edison Co. 6.00% 2034 | | | 2,500 | | | | 3,482 | |
| Southern California Edison Co. 5.35% 2035 | | | 3,000 | | | | 4,075 | |
| Southern California Edison Co. 5.75% 2035 | | | 675 | | | | 933 | |
| Southern California Edison Co. 4.00% 2047 | | | 1,406 | | | | 1,652 | |
| Southern California Edison Co. 4.125% 2048 | | | 2,902 | | | | 3,468 | |
| Southern California Edison Co. 4.875% 2049 | | | 3,745 | | | | 4,946 | |
| Southern California Edison Co. 3.65% 2050 | | | 1,030 | | | | 1,171 | |
| Southern California Edison Co., Series C, 3.60% 2045 | | | 3,840 | | | | 4,261 | |
| Southern California Gas Company 2.55% 2030 | | | 4,650 | | | | 5,047 | |
| Talen Energy Corp. 10.50% 20268 | | | 885 | | | | 789 | |
| Talen Energy Corp. 7.25% 20278 | | | 4,130 | | | | 4,405 | |
| Talen Energy Supply, LLC 7.625% 20288 | | | 1,575 | | | | 1,700 | |
| Union Electric Co. 2.625% 2051 | | | 5,625 | | | | 5,896 | |
| Virginia Electric and Power Co. 3.80% 2028 | | | 2,000 | | | | 2,343 | |
| Virginia Electric and Power Co. 4.00% 2043 | | | 969 | | | | 1,220 | |
| Virginia Electric and Power Co. 4.60% 2048 | | | 2,650 | | | | 3,723 | |
| Virginia Electric and Power Co. 2.45% 2050 | | | 1,825 | | | | 1,835 | |
| Xcel Energy Inc. 3.35% 2026 | | | 5,000 | | | | 5,646 | |
| Xcel Energy Inc. 2.60% 2029 | | | 4,758 | | | | 5,155 | |
| Xcel Energy Inc. 3.40% 2030 | | | 1,000 | | | | 1,151 | |
| Xcel Energy Inc. 6.50% 2036 | | | 2,000 | | | | 3,011 | |
| Xcel Energy Inc. 3.50% 2049 | | | 1,276 | | | | 1,496 | |
| | | | | | | | 456,786 | |
| | | | | | | | | |
| Energy 1.53% | | | | | | | | |
| American Energy-Permian Basin, LLC / AEPB Finance Corp. 12.00% 20248,13 | | | 2,935 | | | | 22 | |
| Antero Resources Corp. 7.875% 20268 | | | 207 | | | | 214 | |
| Apache Corp. 4.875% 2027 | | | 2,150 | | | | 2,282 | |
| Apache Corp. 4.375% 2028 | | | 2,580 | | | | 2,690 | |
| American Funds Insurance Series | 123 |
Asset Allocation Fund (continued)
| Bonds, notes & other debt instruments (continued) | Principal amount
(000) | | | Value
(000) | |
| Corporate bonds, notes & loans (continued) | | | | | | | | |
| Energy (continued) | | | | | | | | |
| Baker Hughes, a GE Co. 4.486% 2030 | | $ | 1,596 | | | $ | 1,919 | |
| Baker Hughes, a GE Co. 4.08% 2047 | | | 571 | | | | 645 | |
| BP Capital Markets America Inc. 1.749% 2030 | | | 2,024 | | | | 2,032 | |
| BP Capital Markets America Inc. 3.633% 2030 | | | 1,190 | | | | 1,385 | |
| BP Capital Markets America Inc. 2.772% 2050 | | | 7,552 | | | | 7,472 | |
| BP Capital Markets America Inc. 2.939% 2051 | | | 1,260 | | | | 1,287 | |
| Canadian Natural Resources Ltd. 2.95% 2023 | | | 1,935 | | | | 2,024 | |
| Canadian Natural Resources Ltd. 2.05% 2025 | | | 5,814 | | | | 6,104 | |
| Canadian Natural Resources Ltd. 3.85% 2027 | | | 4,448 | | | | 4,996 | |
| Canadian Natural Resources Ltd. 2.95% 2030 | | | 10,682 | | | | 11,439 | |
| Canadian Natural Resources Ltd. 4.95% 2047 | | | 1,559 | | | | 1,980 | |
| Cenovus Energy Inc. 3.80% 2023 | | | 3,970 | | | | 4,125 | |
| Cenovus Energy Inc. 4.25% 2027 | | | 5,690 | | | | 6,216 | |
| Cenovus Energy Inc. 6.75% 2039 | | | 400 | | | | 529 | |
| Cheniere Energy Partners, LP 5.625% 2026 | | | 2,475 | | | | 2,584 | |
| Cheniere Energy, Inc. 4.625% 20288 | | | 4,595 | | | | 4,831 | |
| Cheniere Energy, Inc. 3.70% 2029 | | | 5,977 | | | | 6,663 | |
| Chesapeake Energy Corp. 4.875% 202213 | | | 7,225 | | | | 361 | |
| Chesapeake Energy Corp. 11.50% 20258,13 | | | 5,122 | | | | 904 | |
| Chesapeake Energy Corp., Term Loan, (3-month USD-LIBOR + 8.00%) 8.223% 202410,12,13 | | | 6,132 | | | | 5,028 | |
| Chevron Corp. 1.995% 2027 | | | 2,631 | | | | 2,791 | |
| Chevron Corp. 2.236% 2030 | | | 1,862 | | | | 1,994 | |
| Chevron Corp. 2.978% 2040 | | | 268 | | | | 297 | |
| Chevron Corp. 3.078% 2050 | | | 301 | | | | 335 | |
| Chevron USA Inc. 0.687% 2025 | | | 3,135 | | | | 3,154 | |
| Chevron USA Inc. 1.018% 2027 | | | 7,311 | | | | 7,309 | |
| CNX Resources Corp. 7.25% 20278 | | | 1,725 | | | | 1,848 | |
| CNX Resources Corp. 6.00% 20298 | | | 425 | | | | 436 | |
| Comstock Resources, Inc. 9.75% 2026 | | | 1,266 | | | | 1,360 | |
| Concho Resources Inc. 4.30% 2028 | | | 9,615 | | | | 11,370 | |
| Concho Resources Inc. 2.40% 2031 | | | 963 | | | | 1,010 | |
| Concho Resources Inc. 4.85% 2048 | | | 750 | | | | 1,010 | |
| Constellation Oil Services Holding SA 10.00% 2024 (100% PIK)8,11 | | | 1,084 | | | | 309 | |
| Continental Resources Inc. 5.75% 20318 | | | 1,430 | | | | 1,590 | |
| DCP Midstream Operating LP 4.95% 2022 | | | 3,145 | | | | 3,250 | |
| Diamond Offshore Drilling, Inc. 4.875% 204313 | | | 5,610 | | | | 711 | |
| Enbridge Energy Partners, LP 5.875% 2025 | | | 3,200 | | | | 3,915 | |
| Enbridge Energy Partners, LP 7.375% 2045 | | | 544 | | | | 831 | |
| Enbridge Energy Partners, LP, Series B, 7.50% 2038 | | | 2,000 | | | | 2,841 | |
| Enbridge Inc. 4.00% 2023 | | | 1,678 | | | | 1,827 | |
| Enbridge Inc. 2.50% 2025 | | | 1,700 | | | | 1,822 | |
| Enbridge Inc. 3.70% 2027 | | | 162 | | | | 185 | |
| Energy Transfer Operating, LP 2.90% 2025 | | | 1,601 | | | | 1,695 | |
| Energy Transfer Operating, LP 3.75% 2030 | | | 1,361 | | | | 1,469 | |
| Energy Transfer Operating, LP 5.00% 2050 | | | 23,216 | | | | 25,161 | |
| Energy Transfer Partners, LP 4.50% 2024 | | | 1,210 | | | | 1,325 | |
| Energy Transfer Partners, LP 4.75% 2026 | | | 2,494 | | | | 2,823 | |
| Energy Transfer Partners, LP 5.25% 2029 | | | 5,757 | | | | 6,723 | |
| Energy Transfer Partners, LP 6.00% 2048 | | | 774 | | | | 921 | |
| Energy Transfer Partners, LP 6.25% 2049 | | | 6,257 | | | | 7,569 | |
| Enterprise Products Operating LLC 2.80% 2030 | | | 942 | | | | 1,022 | |
| Enterprise Products Operating LLC 4.90% 2046 | | | 500 | | | | 637 | |
| Enterprise Products Operating LLC 3.20% 2052 | | | 1,954 | | | | 1,993 | |
| EQM Midstream Partners, LP 4.125% 2026 | | | 686 | | | | 692 | |
| EQM Midstream Partners, LP 6.50% 20278 | | | 2,690 | | | | 3,033 | |
| EQM Midstream Partners, LP 5.50% 2028 | | | 2,588 | | | | 2,834 | |
| EQT Corp. 7.875% 2025 | | | 1,295 | | | | 1,477 | |
| EQT Corp. 3.90% 2027 | | | 450 | | | | 448 | |
| EQT Corp. 5.00% 2029 | | | 340 | | | | 359 | |
| EQT Corp. 8.75% 2030 | | | 1,110 | | | | 1,358 | |
| 124 | American Funds Insurance Series |
Asset Allocation Fund (continued)
| Bonds, notes & other debt instruments (continued) | Principal amount
(000) | | | Value
(000) | |
| Corporate bonds, notes & loans (continued) | | | | | | | | |
| Energy (continued) | | | | | | | | |
| Equinor ASA 1.75% 2026 | | $ | 4,064 | | | $ | 4,270 | |
| Equinor ASA 3.625% 2028 | | | 3,685 | | | | 4,295 | |
| Equinor ASA 3.25% 2049 | | | 5,320 | | | | 5,912 | |
| Extraction Oil & Gas, Inc. 5.625% 20268,13 | | | 4,125 | | | | 757 | |
| Exxon Mobil Corp. 2.222% 2021 | | | 3,070 | | | | 3,074 | |
| Exxon Mobil Corp. 2.019% 2024 | | | 643 | | | | 677 | |
| Exxon Mobil Corp. 2.992% 2025 | | | 2,000 | | | | 2,190 | |
| Exxon Mobil Corp. 2.44% 2029 | | | 1,963 | | | | 2,133 | |
| Exxon Mobil Corp. 3.452% 2051 | | | 596 | | | | 681 | |
| Genesis Energy, LP 5.625% 2024 | | | 575 | | | | 560 | |
| Genesis Energy, LP 6.50% 2025 | | | 3,572 | | | | 3,480 | |
| Genesis Energy, LP 8.00% 2027 | | | 595 | | | | 594 | |
| Halliburton Company 3.80% 2025 | | | 16 | | | | 18 | |
| Harvest Midstream I, LP 7.50% 20288 | | | 850 | | | | 906 | |
| Hess Midstream Partners LP 5.125% 20288 | | | 2,155 | | | | 2,255 | |
| Hilcorp Energy I, LP 5.75% 20258 | | | 2,575 | | | | 2,613 | |
| Kinder Morgan, Inc. 4.30% 2028 | | | 4,359 | | | | 5,116 | |
| Kinder Morgan, Inc. 2.00% 2031 | | | 3,000 | | | | 3,034 | |
| Kinder Morgan, Inc. 3.25% 2050 | | | 1,338 | | | | 1,347 | |
| Marathon Oil Corp. 4.40% 2027 | | | 1,005 | | | | 1,117 | |
| MPLX LP 1.75% 2026 | | | 1,756 | | | | 1,818 | |
| MPLX LP 4.125% 2027 | | | 500 | | | | 577 | |
| MPLX LP 4.80% 2029 | | | 1,724 | | | | 2,084 | |
| MPLX LP 2.65% 2030 | | | 8,266 | | | | 8,672 | |
| MPLX LP 4.50% 2038 | | | 750 | | | | 858 | |
| MPLX LP 4.70% 2048 | | | 2,500 | | | | 2,970 | |
| MPLX LP 5.50% 2049 | | | 6,393 | | | | 8,419 | |
| New Fortress Energy Inc. 6.75% 20258 | | | 17 | | | | 18 | |
| NGL Energy Partners LP 7.50% 2023 | | | 1,610 | | | | 1,143 | |
| NGL Energy Partners LP 6.125% 2025 | | | 8,322 | | | | 5,295 | |
| Occidental Petroleum Corp. 4.85% 2021 | | | 2,751 | | | | 2,763 | |
| Occidental Petroleum Corp. 2.90% 2024 | | | 2,698 | | | | 2,601 | |
| Occidental Petroleum Corp. 5.50% 2025 | | | 1,640 | | | | 1,713 | |
| Occidental Petroleum Corp. 6.375% 2028 | | | 1,855 | | | | 1,965 | |
| ONEOK, Inc. 2.20% 2025 | | | 527 | | | | 550 | |
| ONEOK, Inc. 5.85% 2026 | | | 16,837 | | | | 20,185 | |
| ONEOK, Inc. 3.10% 2030 | | | 2,141 | | | | 2,283 | |
| ONEOK, Inc. 6.35% 2031 | | | 1,601 | | | | 2,056 | |
| ONEOK, Inc. 5.20% 2048 | | | 298 | | | | 348 | |
| ONEOK, Inc. 4.50% 2050 | | | 873 | | | | 918 | |
| ONEOK, Inc. 7.15% 2051 | | | 812 | | | | 1,125 | |
| Ovintiv Inc. 6.50% 2034 | | | 1,825 | | | | 2,114 | |
| Parsley Energy, Inc. 5.25% 20258 | | | 403 | | | | 421 | |
| Peabody Energy Corp. 6.00% 20228 | | | 2,750 | | | | 2,013 | |
| Petrobras Global Finance Co. 6.75% 2050 | | | 2,240 | | | | 2,786 | |
| Petróleos Mexicanos 6.875% 20258 | | | 5,700 | | | | 6,255 | |
| Petróleos Mexicanos 5.35% 2028 | | | 1,870 | | | | 1,848 | |
| Phillips 66 3.90% 2028 | | | 2,107 | | | | 2,432 | |
| Phillips 66 2.15% 2030 | | | 1,541 | | | | 1,567 | |
| Phillips 66 Partners LP 3.55% 2026 | | | 160 | | | | 175 | |
| Phillips 66 Partners LP 4.68% 2045 | | | 400 | | | | 434 | |
| Phillips 66 Partners LP 4.90% 2046 | | | 275 | | | | 308 | |
| Pioneer Natural Resources Company 1.90% 2030 | | | 2,564 | | | | 2,542 | |
| Plains All American Pipeline, LP 3.80% 2030 | | | 830 | | | | 893 | |
| Rattler Midstream Partners LP 5.625% 20258 | | | 355 | | | | 376 | |
| Rockies Express Pipeline LLC 4.95% 20298 | | | 2,689 | | | | 2,802 | |
| Sabine Pass Liquefaction, LLC 5.875% 2026 | | | 923 | | | | 1,117 | |
| Sabine Pass Liquefaction, LLC 4.20% 2028 | | | 1,307 | | | | 1,501 | |
| Sabine Pass Liquefaction, LLC 4.50% 20308 | | | 11,548 | | | | 13,696 | |
| Saudi Arabian Oil Co. 1.25% 20238 | | | 250 | | | | 253 | |
| Saudi Arabian Oil Co. 1.625% 20258 | | | 1,160 | | | | 1,189 | |
| American Funds Insurance Series | 125 |
Asset Allocation Fund (continued)
| Bonds, notes & other debt instruments (continued) | Principal amount
(000) | | | Value
(000) | |
| Corporate bonds, notes & loans (continued) | | | | | | | | |
| Energy (continued) | | | | | | | | |
| Saudi Arabian Oil Co. 2.25% 20308 | | $ | 1,800 | | | $ | 1,834 | |
| Schlumberger BV 3.75% 20248 | | | 495 | | | | 540 | |
| Schlumberger BV 4.00% 20258 | | | 70 | | | | 80 | |
| Shell International Finance BV 3.875% 2028 | | | 2,787 | | | | 3,302 | |
| Shell International Finance BV 2.75% 2030 | | | 5,000 | | | | 5,520 | |
| Shell International Finance BV 3.25% 2050 | | | 907 | | | | 1,029 | |
| Southwestern Energy Co. 6.45% 20259 | | | 1,760 | | | | 1,829 | |
| Southwestern Energy Co. 7.50% 2026 | | | 335 | | | | 352 | |
| Southwestern Energy Co. 8.375% 2028 | | | 395 | | | | 429 | |
| Statoil ASA 2.75% 2021 | | | 1,925 | | | | 1,964 | |
| Statoil ASA 3.25% 2024 | | | 2,850 | | | | 3,143 | |
| Statoil ASA 4.25% 2041 | | | 2,000 | | | | 2,515 | |
| Suncor Energy Inc. 3.10% 2025 | | | 3,687 | | | | 4,042 | |
| Sunoco Logistics Operating Partners, LP 5.40% 2047 | | | 650 | | | | 733 | |
| Tallgrass Energy Partners, LP 7.50% 20258 | | | 550 | | | | 595 | |
| Targa Resources Partners LP 5.875% 2026 | | | 1,350 | | | | 1,434 | |
| Targa Resources Partners LP 5.50% 2030 | | | 2,260 | | | | 2,456 | |
| Targa Resources Partners LP 4.875% 20318 | | | 1,065 | | | | 1,157 | |
| Teekay Corp. 9.25% 20228 | | | 4,825 | | | | 4,934 | |
| Teekay Offshore Partners LP 8.50% 20238 | | | 3,550 | | | | 3,026 | |
| Total Capital International 3.127% 2050 | | | 808 | | | | 877 | |
| Total SE 2.986% 2041 | | | 11,607 | | | | 12,705 | |
| TransCanada PipeLines Ltd. 4.25% 2028 | | | 1,090 | | | | 1,288 | |
| TransCanada PipeLines Ltd. 4.10% 2030 | | | 7,951 | | | | 9,400 | |
| TransCanada PipeLines Ltd. 4.75% 2038 | | | 3,000 | | | | 3,754 | |
| TransCanada PipeLines Ltd. 4.875% 2048 | | | 700 | | | | 905 | |
| Valero Energy Corp. 4.00% 2029 | | | 4,000 | | | | 4,501 | |
| Vine Oil & Gas LP 8.75% 20238 | | | 2,500 | | | | 2,000 | |
| Weatherford International PLC 8.75% 20248 | | | 3,571 | | | | 3,584 | |
| Weatherford International PLC 11.00% 20248 | | | 9,918 | | | | 7,761 | |
| Western Gas Partners LP 4.50% 2028 | | | 4,450 | | | | 4,628 | |
| Williams Companies, Inc. 3.50% 2030 | | | 10,474 | | | | 11,871 | |
| Williams Partners LP 4.30% 2024 | | | 85 | | | | 94 | |
| Woodside Finance Ltd. 4.60% 20218 | | | 1,965 | | | | 1,973 | |
| | | | | | | | 453,833 | |
| | | | | | | | | |
| Health care 1.51% | | | | | | | | |
| Abbott Laboratories 3.40% 2023 | | | 185 | | | | 201 | |
| Abbott Laboratories 3.75% 2026 | | | 5,012 | | | | 5,874 | |
| Abbott Laboratories 4.75% 2036 | | | 460 | | | | 634 | |
| Abbott Laboratories 4.90% 2046 | | | 500 | | | | 740 | |
| AbbVie Inc. 2.60% 2024 | | | 3,000 | | | | 3,218 | |
| AbbVie Inc. 3.60% 2025 | | | 10,000 | | | | 11,150 | |
| AbbVie Inc. 3.80% 2025 | | | 206 | | | | 230 | |
| AbbVie Inc. 2.95% 2026 | | | 1,445 | | | | 1,600 | |
| Amgen Inc. 2.20% 2027 | | | 2,429 | | | | 2,605 | |
| Anthem, Inc. 2.375% 2025 | | | 818 | | | | 875 | |
| AstraZeneca PLC 2.375% 2022 | | | 4,072 | | | | 4,186 | |
| AstraZeneca PLC 3.375% 2025 | | | 13,790 | | | | 15,515 | |
| AstraZeneca PLC 0.70% 2026 | | | 8,935 | | | | 8,892 | |
| AstraZeneca PLC 1.375% 2030 | | | 2,000 | | | | 1,981 | |
| Bausch Health Companies Inc. 5.00% 20288 | | | 1,735 | | | | 1,790 | |
| Bausch Health Companies Inc. 5.25% 20318 | | | 1,610 | | | | 1,685 | |
| Bayer US Finance II LLC 3.875% 20238 | | | 1,685 | | | | 1,837 | |
| Bayer US Finance II LLC 4.25% 20258 | | | 425 | | | | 486 | |
| Bayer US Finance II LLC 4.375% 20288 | | | 312 | | | | 367 | |
| Bayer US Finance II LLC 4.20% 20348 | | | 460 | | | | 510 | |
| Becton, Dickinson and Company 2.894% 2022 | | | 9,020 | | | | 9,325 | |
| Becton, Dickinson and Company 3.363% 2024 | | | 647 | | | | 703 | |
| Becton, Dickinson and Company 3.70% 2027 | | | 19,246 | | | | 22,091 | |
| 126 | American Funds Insurance Series |
Asset Allocation Fund (continued)
| Bonds, notes & other debt instruments (continued) | Principal amount
(000) | | | Value
(000) | |
| Corporate bonds, notes & loans (continued) | | | | | | | | |
| Health care (continued) | | | | | | | | |
| Becton, Dickinson and Company 2.823% 2030 | | $ | 1,271 | | | $ | 1,398 | |
| Boston Scientific Corp. 3.45% 2024 | | | 3,100 | | | | 3,361 | |
| Boston Scientific Corp. 1.90% 2025 | | | 5,856 | | | | 6,154 | |
| Boston Scientific Corp. 3.85% 2025 | | | 2,289 | | | | 2,584 | |
| Boston Scientific Corp. 3.75% 2026 | | | 2,595 | | | | 2,946 | |
| Boston Scientific Corp. 4.00% 2029 | | | 1,550 | | | | 1,827 | |
| Boston Scientific Corp. 2.65% 2030 | | | 4,030 | | | | 4,328 | |
| Boston Scientific Corp. 4.70% 2049 | | | 515 | | | | 707 | |
| Centene Corp. 4.75% 2025 | | | 4,000 | | | | 4,110 | |
| Centene Corp. 4.25% 2027 | | | 565 | | | | 600 | |
| Centene Corp. 4.625% 2029 | | | 9,665 | | | | 10,743 | |
| Centene Corp. 3.00% 2030 | | | 6,895 | | | | 7,317 | |
| Centene Corp. 3.375% 2030 | | | 3,397 | | | | 3,579 | |
| Cigna Corp. 3.40% 2021 | | | 1,350 | | | | 1,379 | |
| Cigna Corp. 3.75% 2023 | | | 1,836 | | | | 1,985 | |
| Cigna Corp. 4.125% 2025 | | | 2,000 | | | | 2,304 | |
| Cigna Corp. 4.80% 2038 | | | 3,880 | | | | 5,058 | |
| CVS Health Corp. 3.35% 2021 | | | 194 | | | | 195 | |
| CVS Health Corp. 3.70% 2023 | | | 69 | | | | 74 | |
| CVS Health Corp. 1.30% 2027 | | | 3,760 | | | | 3,778 | |
| CVS Health Corp. 4.30% 2028 | | | 588 | | | | 700 | |
| CVS Health Corp. 1.75% 2030 | | | 4,000 | | | | 4,025 | |
| CVS Health Corp. 1.875% 2031 | | | 4,000 | | | | 4,050 | |
| Eli Lilly and Co. 3.375% 2029 | | | 3,330 | | | | 3,867 | |
| Encompass Health Corp. 4.50% 2028 | | | 1,449 | | | | 1,517 | |
| Endo Dac / Endo Finance LLC / Endo Finco 9.50% 20278 | | | 4,517 | | | | 5,051 | |
| Endo International PLC 5.75% 20228 | | | 7,340 | | | | 7,129 | |
| GlaxoSmithKline PLC 3.625% 2025 | | | 4,585 | | | | 5,154 | |
| HCA Inc. 5.875% 2023 | | | 2,125 | | | | 2,338 | |
| HCA Inc. 5.375% 2025 | | | 515 | | | | 580 | |
| HCA Inc. 4.125% 2029 | | | 2,250 | | | | 2,612 | |
| HCA Inc. 3.50% 2030 | | | 2,125 | | | | 2,259 | |
| HealthSouth Corp. 5.75% 2025 | | | 2,685 | | | | 2,779 | |
| LifePoint Health, Inc. 5.375% 20298 | | | 1,680 | | | | 1,681 | |
| Mallinckrodt PLC 10.00% 20258 | | | 7,120 | | | | 7,743 | |
| Medtronic, Inc. 3.50% 2025 | | | 701 | | | | 787 | |
| Molina Healthcare, Inc. 5.375% 2022 | | | 6,985 | | | | 7,408 | |
| Molina Healthcare, Inc. 3.875% 20308 | | | 720 | | | | 774 | |
| Novartis Capital Corp. 1.75% 2025 | | | 4,731 | | | | 4,965 | |
| Novartis Capital Corp. 2.00% 2027 | | | 4,336 | | | | 4,630 | |
| Novartis Capital Corp. 2.20% 2030 | | | 2,385 | | | | 2,562 | |
| Owens & Minor, Inc. 4.375% 2024 | | | 5,615 | | | | 5,773 | |
| Owens & Minor, Inc., Term Loan B, (3-month USD-LIBOR + 4.50%) 4.655% 202510,12 | | | 1,867 | | | | 1,865 | |
| Par Pharmaceutical Inc. 7.50% 20278 | | | 7,028 | | | | 7,635 | |
| Partners HealthCare System, Inc. 3.192% 2049 | | | 1,920 | | | | 2,124 | |
| Pfizer Inc. 2.95% 2024 | | | 3,825 | | | | 4,128 | |
| Pfizer Inc. 3.45% 2029 | | | 8,000 | | | | 9,352 | |
| Regeneron Pharmaceuticals, Inc. 1.75% 2030 | | | 5,529 | | | | 5,451 | |
| Regeneron Pharmaceuticals, Inc. 2.80% 2050 | | | 6,055 | | | | 5,891 | |
| Rotech Healthcare Inc., Term Loan, (3-month USD-LIBOR + 11.00%) 13.00% 2023 (100% PIK)1,5,10,11,12 | | | 4,079 | | | | 4,079 | |
| Shire PLC 2.40% 2021 | | | 1,227 | | | | 1,243 | |
| Shire PLC 2.875% 2023 | | | 3,413 | | | | 3,621 | |
| Shire PLC 3.20% 2026 | | | 14,821 | | | | 16,589 | |
| Takeda Pharmaceutical Company, Ltd. 2.05% 2030 | | | 3,408 | | | | 3,489 | |
| Team Health Holdings, Inc. 6.375% 20258 | | | 8,415 | | | | 7,279 | |
| Team Health Holdings, Inc., Term Loan B, 3.75% 202410,12 | | | 2,177 | | | | 1,962 | |
| Tenet Healthcare Corp. 4.625% 2024 | | | 1,953 | | | | 2,004 | |
| Tenet Healthcare Corp. 4.875% 20268 | | | 16,225 | | | | 16,993 | |
| Teva Pharmaceutical Finance Co. BV 2.80% 2023 | | | 12,560 | | | | 12,457 | |
| Teva Pharmaceutical Finance Co. BV 6.00% 2024 | | | 12,016 | | | | 12,765 | |
| American Funds Insurance Series | 127 |
Asset Allocation Fund (continued)
| Bonds, notes & other debt instruments (continued) | Principal amount
(000) | | | Value
(000) | |
| Corporate bonds, notes & loans (continued) | | | | | | | | |
| Health care (continued) | | | | | | | | |
| Teva Pharmaceutical Finance Co. BV 7.125% 2025 | | $ | 1,935 | | | $ | 2,143 | |
| Teva Pharmaceutical Finance Co. BV 3.15% 2026 | | | 28,373 | | | | 27,327 | |
| Teva Pharmaceutical Finance Co. BV 4.10% 2046 | | | 3,550 | | | | 3,168 | |
| Thermo Fisher Scientific Inc. 4.497% 2030 | | | 883 | | | | 1,104 | |
| UnitedHealth Group Inc. 2.375% 2024 | | | 590 | | | | 629 | |
| UnitedHealth Group Inc. 3.50% 2024 | | | 4,500 | | | | 4,925 | |
| UnitedHealth Group Inc. 3.375% 2027 | | | 245 | | | | 280 | |
| UnitedHealth Group Inc. 3.875% 2028 | | | 2,500 | | | | 3,001 | |
| UnitedHealth Group Inc. 2.875% 2029 | | | 1,050 | | | | 1,194 | |
| UnitedHealth Group Inc. 4.45% 2048 | | | 5,315 | | | | 7,337 | |
| Upjohn Inc. 2.30% 20278 | | | 2,447 | | | | 2,608 | |
| Upjohn Inc. 2.70% 20308 | | | 5,692 | | | | 6,042 | |
| Upjohn Inc. 3.85% 20408 | | | 3,531 | | | | 3,985 | |
| Upjohn Inc. 4.00% 20508 | | | 2,907 | | | | 3,331 | |
| Valeant Pharmaceuticals International, Inc. 6.125% 20258 | | | 14,550 | | | | 15,011 | |
| Zimmer Holdings, Inc. 3.15% 2022 | | | 7,070 | | | | 7,273 | |
| | | | | | | | 447,591 | |
| | | | | | | | | |
| Communication services 1.37% | | | | | | | | |
| Alphabet Inc. 1.998% 2026 | | | 3,000 | | | | 3,218 | |
| Alphabet Inc. 1.10% 2030 | | | 10,770 | | | | 10,620 | |
| Alphabet Inc. 1.90% 2040 | | | 2,190 | | | | 2,150 | |
| Alphabet Inc. 2.05% 2050 | | | 440 | | | | 420 | |
| Alphabet Inc. 2.25% 2060 | | | 4,085 | | | | 3,955 | |
| AT&T Inc. 1.65% 2028 | | | 10,775 | | | | 11,003 | |
| AT&T Inc. 2.75% 2031 | | | 9,742 | | | | 10,417 | |
| AT&T Inc. 2.25% 2032 | | | 7,525 | | | | 7,644 | |
| AT&T Inc. 2.55% 20338 | | | 348 | | | | 359 | |
| AT&T Inc. 3.50% 20538 | | | 6,966 | | | | 6,966 | |
| CCO Holdings LLC and CCO Holdings Capital Corp. 4.908% 2025 | | | 500 | | | | 581 | |
| CCO Holdings LLC and CCO Holdings Capital Corp. 5.75% 20268 | | | 5,050 | | | | 5,217 | |
| CCO Holdings LLC and CCO Holdings Capital Corp. 5.05% 2029 | | | 1,150 | | | | 1,399 | |
| CCO Holdings LLC and CCO Holdings Capital Corp. 4.50% 20308 | | | 3,500 | | | | 3,719 | |
| CCO Holdings LLC and CCO Holdings Capital Corp. 4.75% 20308 | | | 2,500 | | | | 2,701 | |
| CCO Holdings LLC and CCO Holdings Capital Corp. 2.80% 2031 | | | 10,842 | | | | 11,468 | |
| CCO Holdings LLC and CCO Holdings Capital Corp. 4.25% 20318 | | | 2,975 | | | | 3,139 | |
| CCO Holdings LLC and CCO Holdings Capital Corp. 2.30% 2032 | | | 2,500 | | | | 2,504 | |
| CCO Holdings LLC and CCO Holdings Capital Corp. 4.50% 20328 | | | 2,710 | | | | 2,897 | |
| CCO Holdings LLC and CCO Holdings Capital Corp. 5.125% 2049 | | | 570 | | | | 696 | |
| CCO Holdings LLC and CCO Holdings Capital Corp. 4.80% 2050 | | | 800 | | | | 956 | |
| CCO Holdings LLC and CCO Holdings Capital Corp. 3.70% 2051 | | | 3,770 | | | | 3,922 | |
| CenturyLink, Inc. 6.75% 2023 | | | 2,500 | | | | 2,789 | |
| CenturyLink, Inc. 7.50% 2024 | | | 1,500 | | | | 1,701 | |
| CenturyLink, Inc. 5.125% 20268 | | | 2,050 | | | | 2,168 | |
| CenturyLink, Inc. 4.00% 20278 | | | 700 | | | | 724 | |
| Comcast Corp. 3.00% 2024 | | | 500 | | | | 538 | |
| Comcast Corp. 3.70% 2024 | | | 2,245 | | | | 2,471 | |
| Comcast Corp. 3.95% 2025 | | | 1,470 | | | | 1,690 | |
| Comcast Corp. 2.35% 2027 | | | 4,000 | | | | 4,307 | |
| Comcast Corp. 4.15% 2028 | | | 2,608 | | | | 3,140 | |
| Comcast Corp. 1.50% 2031 | | | 4,000 | | | | 3,976 | |
| Comcast Corp. 1.95% 2031 | | | 9,236 | | | | 9,506 | |
| Comcast Corp. 3.20% 2036 | | | 750 | | | | 853 | |
| Comcast Corp. 3.90% 2038 | | | 1,000 | | | | 1,224 | |
| Comcast Corp. 4.60% 2038 | | | 2,000 | | | | 2,635 | |
| Comcast Corp. 3.75% 2040 | | | 594 | | | | 716 | |
| Comcast Corp. 4.00% 2048 | | | 250 | | | | 315 | |
| Comcast Corp. 2.80% 2051 | | | 1,791 | | | | 1,866 | |
| Comcast Corp. 2.45% 2052 | | | 2,000 | | | | 1,948 | |
| Deutsche Telekom International Finance BV 9.25% 2032 | | | 3,570 | | | | 6,016 | |
| 128 | American Funds Insurance Series |
Asset Allocation Fund (continued)
| Bonds, notes & other debt instruments (continued) | Principal amount
(000) | | | Value
(000) | |
| Corporate bonds, notes & loans (continued) | | | | | | | | |
| Communication services (continued) | | | | | | | | |
| Discovery Communications, Inc. 3.625% 2030 | | $ | 5,512 | | | $ | 6,318 | |
| Discovery Communications, Inc. 4.65% 2050 | | | 920 | | | | 1,152 | |
| Embarq Corp. 7.995% 2036 | | | 3,075 | | | | 3,799 | |
| Fox Corp. 4.03% 2024 | | | 1,120 | | | | 1,234 | |
| France Télécom 4.125% 2021 | | | 2,500 | | | | 2,563 | |
| Frontier Communications Corp. 5.875% 20278 | | | 2,225 | | | | 2,410 | |
| Frontier Communications Corp. 5.00% 20288 | | | 2,175 | | | | 2,272 | |
| Frontier Communications Corp. 6.75% 20298 | | | 775 | | | | 831 | |
| Gogo Inc. 9.875% 20248 | | | 20,346 | | | | 21,823 | |
| iHeartCommunications, Inc. 5.25% 20278 | | | 2,493 | | | | 2,616 | |
| Intelsat Jackson Holding Co. 8.00% 20248 | | | 7,275 | | | | 7,460 | |
| Intelsat Jackson Holding Co. 8.50% 20248,13 | | | 7,650 | | | | 5,488 | |
| Intelsat Jackson Holding Co., Term Loan, (3-month USD-LIBOR + 5.50%) 6.50% 202110,12 | | | 2,072 | | | | 2,122 | |
| Intelsat Jackson Holding Co., Term Loan, 6.625% 202410 | | | 1,400 | | | | 1,428 | |
| Liberty Global PLC 5.50% 20288 | | | 2,075 | | | | 2,193 | |
| Ligado Networks LLC 15.50% 20238,11 | | | 4,325 | | | | 4,217 | |
| Live Nation Entertainment, Inc. 3.75% 20288 | | | 575 | | | | 582 | |
| MDC Partners Inc. 6.50% 20248 | | | 3,225 | | | | 3,274 | |
| NBCUniversal Enterprise, Inc., junior subordinated, 5.25% 20498 | | | 4,630 | | | | 4,728 | |
| Nexstar Broadcasting, Inc. 4.75% 20288 | | | 1,350 | | | | 1,415 | |
| Scripps Escrow II, Inc. 3.875% 20298 | | | 450 | | | | 470 | |
| Sinclair Television Group, Inc. 4.125% 20308 | | | 1,175 | | | | 1,206 | |
| Sirius XM Radio Inc. 3.875% 20228 | | | 3,450 | | | | 3,506 | |
| Sirius XM Radio Inc. 4.625% 20248 | | | 3,345 | | | | 3,470 | |
| Sprint Corp. 7.625% 2026 | | | 4,125 | | | | 5,126 | |
| Sprint Corp. 6.875% 2028 | | | 6,900 | | | | 9,110 | |
| TEGNA Inc. 4.75% 20268 | | | 2,350 | | | | 2,512 | |
| TEGNA Inc. 4.625% 20288 | | | 425 | | | | 435 | |
| T-Mobile US, Inc. 1.50% 20268 | | | 3,000 | | | | 3,077 | |
| T-Mobile US, Inc. 2.05% 20288 | | | 10,100 | | | | 10,518 | |
| T-Mobile US, Inc. 3.875% 20308 | | | 18,459 | | | | 21,399 | |
| T-Mobile US, Inc. 2.55% 20318 | | | 9,149 | | | | 9,619 | |
| T-Mobile US, Inc. 4.50% 20508 | | | 7,638 | | | | 9,435 | |
| T-Mobile US, Inc. 3.30% 20518 | | | 7,565 | | | | 7,797 | |
| Trilogy International Partners, LLC 8.875% 20228 | | | 12,800 | | | | 12,381 | |
| Uniti Group LP / Uniti Fiber Holdings Inc. / CSL Capital LLC 7.875% 20258 | | | 425 | | | | 457 | |
| Univision Communications Inc. 6.625% 20278 | | | 4,800 | | | | 5,164 | |
| Verizon Communications Inc. 3.00% 2027 | | | 2,200 | | | | 2,439 | |
| Verizon Communications Inc. 4.329% 2028 | | | 5,785 | | | | 6,968 | |
| Verizon Communications Inc. 3.875% 2029 | | | 250 | | | | 295 | |
| Verizon Communications Inc. 4.016% 2029 | | | 1,902 | | | | 2,259 | |
| Verizon Communications Inc. 1.68% 20308 | | | 983 | | | | 980 | |
| Verizon Communications Inc. 1.75% 2031 | | | 6,012 | | | | 5,989 | |
| Verizon Communications Inc. 4.50% 2033 | | | 2,000 | | | | 2,522 | |
| Verizon Communications Inc. 4.272% 2036 | | | 582 | | | | 722 | |
| Verizon Communications Inc. 2.65% 2040 | | | 16,740 | | | | 16,931 | |
| Verizon Communications Inc. 2.875% 2050 | | | 5,500 | | | | 5,547 | |
| Verizon Communications Inc. 3.00% 2060 | | | 2,500 | | | | 2,517 | |
| Virgin Media O2 4.25% 20318 | | | 2,075 | | | | 2,125 | |
| Virgin Media Secured Finance PLC 4.50% 20308 | | | 2,590 | | | | 2,709 | |
| Vodafone Group PLC 3.75% 2024 | | | 3,788 | | | | 4,141 | |
| Vodafone Group PLC 4.125% 2025 | | | 2,500 | | | | 2,860 | |
| Vodafone Group PLC 4.375% 2028 | | | 350 | | | | 419 | |
| Vodafone Group PLC 5.25% 2048 | | | 500 | | | | 696 | |
| Vodafone Group PLC 4.25% 2050 | | | 8,000 | | | | 9,928 | |
| Walt Disney Company 2.65% 2031 | | | 2,000 | | | | 2,193 | |
| Ziggo Bond Co. BV 5.125% 20308 | | | 1,775 | | | | 1,875 | |
| Ziggo Bond Finance BV 5.50% 20278 | | | 4,813 | | | | 5,032 | |
| | | | | | | | 407,288 | |
| American Funds Insurance Series | 129 |
Asset Allocation Fund (continued)
| Bonds, notes & other debt instruments (continued) | Principal amount
(000) | | | Value
(000) | |
| Corporate bonds, notes & loans (continued) | | | | | | | | |
| Industrials 1.01% | | | | | | | | |
| Allison Transmission Holdings, Inc. 3.75% 20318 | | $ | 2,175 | | | $ | 2,229 | |
| Associated Materials, LLC 9.00% 20258 | | | 3,749 | | | | 3,983 | |
| Avis Budget Car Rental, LLC 5.75% 20278 | | | 2,025 | | | | 2,072 | |
| Avis Budget Group, Inc. 5.25% 20258 | | | 2,275 | | | | 2,291 | |
| Avis Budget Group, Inc. 10.50% 20258 | | | 2,719 | | | | 3,214 | |
| Avolon Holdings Funding Ltd. 3.625% 20228 | | | 1,254 | | | | 1,281 | |
| Avolon Holdings Funding Ltd. 3.95% 20248 | | | 1,587 | | | | 1,677 | |
| Avolon Holdings Funding Ltd. 4.25% 20268 | | | 1,126 | | | | 1,214 | |
| Avolon Holdings Funding Ltd. 4.375% 20268 | | | 1,975 | | | | 2,141 | |
| Boeing Company 2.70% 2022 | | | 4,400 | | | | 4,524 | |
| Boeing Company 4.875% 2025 | | | 5,529 | | | | 6,306 | |
| Boeing Company 2.75% 2026 | | | 18,731 | | | | 19,706 | |
| Boeing Company 3.10% 2026 | | | 1,508 | | | | 1,615 | |
| Boeing Company 5.04% 2027 | | | 3,000 | | | | 3,511 | |
| Boeing Company 3.25% 2028 | | | 13,481 | | | | 14,460 | |
| Boeing Company 5.15% 2030 | | | 2,061 | | | | 2,498 | |
| Boeing Company 3.625% 2031 | | | 4,615 | | | | 5,064 | |
| Boeing Company 3.60% 2034 | | | 7,500 | | | | 7,933 | |
| Boeing Company 3.50% 2039 | | | 250 | | | | 253 | |
| Boeing Company 3.75% 2050 | | | 1,300 | | | | 1,367 | |
| Boeing Company 5.805% 2050 | | | 1,100 | | | | 1,520 | |
| Bombardier Inc. 8.75% 20218 | | | 1,250 | | | | 1,302 | |
| Bombardier Inc. 7.875% 20278 | | | 2,120 | | | | 1,952 | |
| Burlington Northern Santa Fe, LLC 4.40% 2042 | | | 5,000 | | | | 6,639 | |
| Burlington Northern Santa Fe, LLC 3.05% 2051 | | | 4,860 | | | | 5,519 | |
| Canadian National Railway Company 3.20% 2046 | | | 1,320 | | | | 1,566 | |
| Carrier Global Corp. 2.242% 2025 | | | 1,560 | | | | 1,653 | |
| Carrier Global Corp. 2.493% 2027 | | | 762 | | | | 823 | |
| Carrier Global Corp. 2.722% 2030 | | | 687 | | | | 735 | |
| CSX Corp. 3.80% 2028 | | | 4,060 | | | | 4,737 | |
| CSX Corp. 4.25% 2029 | | | 3,062 | | | | 3,713 | |
| CSX Corp. 4.30% 2048 | | | 1,125 | | | | 1,448 | |
| CSX Corp. 3.35% 2049 | | | 563 | | | | 642 | |
| CSX Corp. 2.50% 2051 | | | 5,350 | | | | 5,314 | |
| Dun & Bradstreet Corp. 6.875% 20268 | | | 1,067 | | | | 1,149 | |
| Fortress Transportation and Infrastructure Investors LLC 6.50% 20258 | | | 1,040 | | | | 1,091 | |
| GE Capital International Funding Co. 4.418% 2035 | | | 1,200 | | | | 1,433 | |
| General Dynamics Corp. 3.375% 2023 | | | 1,000 | | | | 1,070 | |
| General Dynamics Corp. 3.50% 2025 | | | 329 | | | | 368 | |
| General Electric Co. 3.45% 2027 | | | 2,150 | | | | 2,428 | |
| General Electric Co. 3.625% 2030 | | | 800 | | | | 915 | |
| General Electric Co. 4.25% 2040 | | | 550 | | | | 650 | |
| General Electric Co. 4.35% 2050 | | | 1,075 | | | | 1,307 | |
| Honeywell International Inc. 2.15% 2022 | | | 4,400 | | | | 4,519 | |
| Honeywell International Inc. 2.30% 2024 | | | 6,925 | | | | 7,386 | |
| Honeywell International Inc. 1.35% 2025 | | | 5,947 | | | | 6,157 | |
| Honeywell International Inc. 2.70% 2029 | | | 4,330 | | | | 4,849 | |
| Honeywell International Inc. 1.95% 2030 | | | 2,000 | | | | 2,119 | |
| Howmet Aerospace Inc. 6.875% 2025 | | | 1,885 | | | | 2,227 | |
| Icahn Enterprises Finance Corp. 4.75% 2024 | | | 3,590 | | | | 3,735 | |
| L3Harris Technologies, Inc. 1.80% 2031 | | | 2,625 | | | | 2,675 | |
| MasTec, Inc. 4.50% 20288 | | | 1,425 | | | | 1,498 | |
| Meritor, Inc. 4.50% 20288 | | | 1,025 | | | | 1,053 | |
| Nielsen Finance LLC and Nielsen Finance Co. 5.00% 20258 | | | 2,175 | | | | 2,236 | |
| Norfolk Southern Corp. 3.00% 2022 | | | 2,056 | | | | 2,111 | |
| Norfolk Southern Corp. 3.05% 2050 | | | 4,151 | | | | 4,552 | |
| Northrop Grumman Corp. 2.55% 2022 | | | 5,400 | | | | 5,610 | |
| Northrop Grumman Corp. 2.93% 2025 | | | 1,820 | | | | 1,980 | |
| Northrop Grumman Corp. 3.25% 2028 | | | 3,495 | | | | 3,953 | |
| Otis Worldwide Corp. 2.293% 2027 | | | 2,135 | | | | 2,283 | |
| Otis Worldwide Corp. 2.565% 2030 | | | 3,000 | | | | 3,225 | |
| 130 | American Funds Insurance Series |
Asset Allocation Fund (continued)
| Bonds, notes & other debt instruments (continued) | Principal amount
(000) | | | Value
(000) | |
| Corporate bonds, notes & loans (continued) | | | | | | | | |
| Industrials (continued) | | | | | | | | |
| R.R. Donnelley & Sons Co. 6.50% 2023 | | $ | 2,635 | | | $ | 2,724 | |
| Raytheon Technologies Corp. 2.80% 2022 | | | 1,500 | | | | 1,543 | |
| Rolls-Royce PLC 5.75% 20278 | | | 765 | | | | 848 | |
| Siemens AG 2.70% 20228 | | | 2,685 | | | | 2,758 | |
| SkyMiles IP Ltd. 4.75% 20288 | | | 3,975 | | | | 4,342 | |
| The Brink’s Co. 4.625% 20278 | | | 2,385 | | | | 2,497 | |
| TransDigm Inc. 6.50% 2024 | | | 33,817 | | | | 34,480 | |
| TransDigm Inc. 6.25% 20268 | | | 451 | | | | 481 | |
| TransDigm Inc. 5.50% 2027 | | | 1,100 | | | | 1,158 | |
| Triumph Group, Inc. 5.25% 2022 | | | 740 | | | | 707 | |
| Triumph Group, Inc. 6.25% 20248 | | | 970 | | | | 964 | |
| Triumph Group, Inc. 8.875% 20248 | | | 970 | | | | 1,066 | |
| Triumph Group, Inc. 7.75% 20258 | | | 875 | | | | 803 | |
| Union Pacific Corp. 3.15% 2024 | | | 1,287 | | | | 1,394 | |
| Union Pacific Corp. 3.75% 2025 | | | 4,643 | | | | 5,273 | |
| Union Pacific Corp. 2.15% 2027 | | | 2,318 | | | | 2,465 | |
| Union Pacific Corp. 3.95% 2028 | | | 1,875 | | | | 2,228 | |
| Union Pacific Corp. 3.70% 2029 | | | 6,500 | | | | 7,547 | |
| Union Pacific Corp. 2.40% 2030 | | | 2,414 | | | | 2,603 | |
| Union Pacific Corp. 4.30% 2049 | | | 2,690 | | | | 3,511 | |
| Union Pacific Corp. 3.25% 2050 | | | 371 | | | | 423 | |
| Union Pacific Corp. 3.95% 2059 | | | 1,365 | | | | 1,697 | |
| Union Pacific Corp. 3.75% 2070 | | | 1,091 | | | | 1,323 | |
| United Airlines Holdings, Inc. 6.50% 20278 | | | 2,200 | | | | 2,369 | |
| United Rentals, Inc. 3.875% 2031 | | | 675 | | | | 709 | |
| United Technologies Corp. 3.65% 2023 | | | 52 | | | | 56 | |
| United Technologies Corp. 3.95% 2025 | | | 5,155 | | | | 5,914 | |
| United Technologies Corp. 4.125% 2028 | | | 1,960 | | | | 2,337 | |
| Vertical U.S. Newco Inc. 5.25% 20278 | | | 2,000 | | | | 2,124 | |
| Vinci SA 3.75% 20298 | | | 2,237 | | | | 2,626 | |
| Wesco Aircraft Holdings, Inc. 9.00% 20268 | | | 1,045 | | | | 991 | |
| WESCO Distribution, Inc. 7.125% 20258 | | | 1,210 | | | | 1,332 | |
| WESCO Distribution, Inc. 7.25% 20288 | | | 1,320 | | | | 1,503 | |
| XPO Logistics, Inc. 6.25% 20258 | | | 660 | | | | 711 | |
| | | | | | | | 300,988 | |
| | | | | | | | | |
| Consumer discretionary 0.95% | | | | | | | | |
| Adient US LLC 9.00% 20258 | | | 521 | | | | 582 | |
| Amazon.com, Inc. 1.50% 2030 | | | 2,000 | | | | 2,033 | |
| Amazon.com, Inc. 2.50% 2050 | | | 920 | | | | 955 | |
| Amazon.com, Inc. 2.70% 2060 | | | 4,485 | | | | 4,802 | |
| American Honda Finance Corp. 0.875% 2023 | | | 13,000 | | | | 13,162 | |
| American Honda Finance Corp. 1.20% 2025 | | | 2,546 | | | | 2,607 | |
| American Honda Finance Corp. 3.50% 2028 | | | 750 | | | | 865 | |
| Bayerische Motoren Werke AG 2.25% 20238 | | | 300 | | | | 313 | |
| Bayerische Motoren Werke AG 3.45% 20238 | | | 1,870 | | | | 1,994 | |
| Bayerische Motoren Werke AG 3.15% 20248 | | | 8,510 | | | | 9,179 | |
| Caesars Entertainment, Inc. 6.25% 20258 | | | 3,315 | | | | 3,535 | |
| Carnival Corp. 11.50% 20238 | | | 5,575 | | | | 6,455 | |
| Ford Motor Credit Co. 3.20% 2021 | | | 2,250 | | | | 2,255 | |
| Ford Motor Credit Co. 3.087% 2023 | | | 405 | | | | 413 | |
| Ford Motor Credit Co. 3.664% 2024 | | | 455 | | | | 468 | |
| Ford Motor Credit Co. 3.81% 2024 | | | 1,070 | | | | 1,098 | |
| Ford Motor Credit Co. 5.584% 2024 | | | 423 | | | | 457 | |
| Ford Motor Credit Co. 5.125% 2025 | | | 12,355 | | | | 13,449 | |
| Ford Motor Credit Co. 4.542% 2026 | | | 2,455 | | | | 2,624 | |
| Ford Motor Credit Co. 3.815% 2027 | | | 250 | | | | 257 | |
| General Motors Company 4.20% 2027 | | | 5,156 | | | | 5,844 | |
| General Motors Company 5.95% 2049 | | | 2,200 | | | | 2,978 | |
| General Motors Financial Co. 3.45% 2022 | | | 2,000 | | | | 2,054 | |
| American Funds Insurance Series | 131 |
Asset Allocation Fund (continued)
| Bonds, notes & other debt instruments (continued) | Principal amount
(000) | | | Value
(000) | |
| Corporate bonds, notes & loans (continued) | | | | | | | | |
| Consumer discretionary (continued) | | | | | | | | |
| General Motors Financial Co. 3.55% 2022 | | $ | 1,780 | | | $ | 1,857 | |
| General Motors Financial Co. 5.20% 2023 | | | 7,768 | | | | 8,521 | |
| General Motors Financial Co. 3.50% 2024 | | | 4,145 | | | | 4,483 | |
| General Motors Financial Co. 2.75% 2025 | | | 5,000 | | | | 5,350 | |
| General Motors Financial Co. 4.30% 2025 | | | 400 | | | | 449 | |
| General Motors Financial Co. 4.35% 2027 | | | 500 | | | | 570 | |
| Hanesbrands Inc. 4.625% 20248 | | | 860 | | | | 902 | |
| Hanesbrands Inc. 5.375% 20258 | | | 706 | | | | 748 | |
| Hanesbrands Inc. 4.875% 20268 | | | 2,700 | | | | 2,936 | |
| Hilton Worldwide Holdings Inc. 5.125% 2026 | | | 2,675 | | | | 2,769 | |
| Hilton Worldwide Holdings Inc. 4.00% 20318 | | | 1,035 | | | | 1,094 | |
| Home Depot, Inc. 3.90% 2028 | | | 825 | | | | 993 | |
| Home Depot, Inc. 2.95% 2029 | | | 9,301 | | | | 10,575 | |
| Home Depot, Inc. 2.70% 2030 | | | 2,180 | | | | 2,434 | |
| Home Depot, Inc. 4.25% 2046 | | | 3,500 | | | | 4,643 | |
| Home Depot, Inc. 4.50% 2048 | | | 428 | | | | 601 | |
| Home Depot, Inc. 3.35% 2050 | | | 3,060 | | | | 3,642 | |
| Hyundai Capital America 3.25% 20228 | | | 480 | | | | 500 | |
| Hyundai Capital America 1.80% 20258 | | | 4,523 | | | | 4,641 | |
| Hyundai Capital America 2.375% 20278 | | | 2,579 | | | | 2,707 | |
| International Game Technology PLC 6.25% 20228 | | | 687 | | | | 711 | |
| International Game Technology PLC 6.50% 20258 | | | 4,555 | | | | 5,104 | |
| International Game Technology PLC 5.25% 20298 | | | 940 | | | | 1,014 | |
| Lithia Motors, Inc. 4.375% 20318 | | | 1,025 | | | | 1,101 | |
| Lowe’s Companies, Inc. 3.65% 2029 | | | 3,574 | | | | 4,172 | |
| Macy’s, Inc. 8.375% 20258 | | | 1,230 | | | | 1,367 | |
| Magna International Inc. 2.45% 2030 | | | 6,875 | | | | 7,400 | |
| Mattel, Inc. 6.75% 20258 | | | 3,225 | | | | 3,407 | |
| Melco International Development Ltd. 5.75% 20288 | | | 1,485 | | | | 1,584 | |
| MGM Growth Properties LLC 4.625% 20258 | | | 1,050 | | | | 1,126 | |
| MGM Growth Properties LLC 3.875% 20298 | | | 1,175 | | | | 1,204 | |
| MGM Resorts International 7.75% 2022 | | | 1,700 | | | | 1,814 | |
| Nissan Motor Co., Ltd. 3.043% 20238 | | | 1,686 | | | | 1,764 | |
| Nissan Motor Co., Ltd. 3.522% 20258 | | | 4,180 | | | | 4,485 | |
| Nissan Motor Co., Ltd. 4.345% 20278 | | | 9,815 | | | | 10,849 | |
| Nissan Motor Co., Ltd. 4.81% 20308 | | | 4,000 | | | | 4,514 | |
| Panther BF Aggregator 2, LP 6.25% 20268 | | | 556 | | | | 597 | |
| PetSmart, Inc. 8.875% 20258 | | | 12,215 | | | | 12,561 | |
| PetSmart, Inc., Term Loan, (3-month USD-LIBOR + 3.00%) 4.00% 202210,12 | | | 5,870 | | | | 5,824 | |
| Royal Caribbean Cruises Ltd. 11.50% 20258 | | | 1,225 | | | | 1,434 | |
| Sally Holdings LLC and Sally Capital Inc. 5.625% 2025 | | | 5,255 | | | | 5,407 | |
| Sally Holdings LLC and Sally Capital Inc. 8.75% 20258 | | | 2,347 | | | | 2,614 | |
| Scientific Games Corp. 5.00% 20258 | | | 1,996 | | | | 2,062 | |
| Scientific Games Corp. 8.625% 20258 | | | 1,260 | | | | 1,381 | |
| Scientific Games Corp. 8.25% 20268 | | | 6,905 | | | | 7,453 | |
| Scientific Games Corp. 7.00% 20288 | | | 950 | | | | 1,023 | |
| Scientific Games Corp. 7.25% 20298 | | | 1,615 | | | | 1,775 | |
| Staples, Inc. 7.50% 20268 | | | 3,055 | | | | 3,195 | |
| Toyota Motor Credit Corp. 2.15% 2022 | | | 545 | | | | 562 | |
| Toyota Motor Credit Corp. 2.60% 2022 | | | 924 | | | | 946 | |
| Toyota Motor Credit Corp. 0.80% 2025 | | | 2,994 | | | | 3,016 | |
| Toyota Motor Credit Corp. 3.05% 2028 | | | 2,430 | | | | 2,732 | |
| Toyota Motor Credit Corp. 3.375% 2030 | | | 2,225 | | | | 2,605 | |
| VICI Properties LP 4.625% 20298 | | | 995 | | | | 1,066 | |
| VICI Properties LP / VICI Note Co. Inc. 3.50% 20258 | | | 2,100 | | | | 2,152 | |
| VICI Properties LP / VICI Note Co. Inc. 3.75% 20278 | | | 450 | | | | 461 | |
| VICI Properties LP / VICI Note Co. Inc. 4.125% 20308 | | | 2,225 | | | | 2,351 | |
| Volkswagen Group of America Finance, LLC 4.00% 20218 | | | 2,500 | | | | 2,577 | |
| Volkswagen Group of America Finance, LLC 4.25% 20238 | | | 5,320 | | | | 5,856 | |
| Volkswagen Group of America Finance, LLC 1.25% 20258 | | | 3,610 | | | | 3,642 | |
| Volkswagen Group of America Finance, LLC 3.35% 20258 | | | 2,578 | | | | 2,836 | |
| 132 | American Funds Insurance Series |
Asset Allocation Fund (continued)
| Bonds, notes & other debt instruments (continued) | Principal amount
(000) | | | Value
(000) | |
| Corporate bonds, notes & loans (continued) | | | | | | | | |
| Consumer discretionary (continued) | | | | | | | | |
| Volkswagen Group of America Finance, LLC 4.625% 20258 | | $ | 3,845 | | | $ | 4,485 | |
| Volkswagen Group of America Finance, LLC 3.20% 20268 | | | 3,201 | | | | 3,539 | |
| Volkswagen Group of America Finance, LLC 1.625% 20278 | | | 985 | | | | 994 | |
| Wyndham Worldwide Corp. 5.375% 20268 | | | 625 | | | | 648 | |
| Wyndham Worldwide Corp. 4.375% 20288 | | | 1,855 | | | | 1,931 | |
| Wynn Las Vegas, LLC and Wynn Capital Corp. 4.25% 20238 | | | 3,468 | | | | 3,525 | |
| | | | | | | | 281,660 | |
| | | | | | | | | |
| Consumer staples 0.89% | | | | | | | | |
| Albertsons Companies, Inc. 3.50% 20298 | | | 660 | | | | 668 | |
| Altria Group, Inc. 3.80% 2024 | | | 2,630 | | | | 2,873 | |
| Altria Group, Inc. 4.40% 2026 | | | 445 | | | | 517 | |
| Altria Group, Inc. 4.80% 2029 | | | 1,681 | | | | 2,017 | |
| Altria Group, Inc. 3.40% 2030 | | | 437 | | | | 491 | |
| Altria Group, Inc. 5.80% 2039 | | | 4,820 | | | | 6,351 | |
| Altria Group, Inc. 4.50% 2043 | | | 3,000 | | | | 3,445 | |
| Altria Group, Inc. 5.95% 2049 | | | 490 | | | | 686 | |
| Altria Group, Inc. 4.45% 2050 | | | 3,500 | | | | 4,145 | |
| Anheuser-Busch InBev NV 4.15% 2025 | | | 8,000 | | | | 9,112 | |
| Anheuser-Busch InBev NV 4.00% 2028 | | | 4,345 | | | | 5,124 | |
| Anheuser-Busch InBev NV 4.75% 2029 | | | 886 | | | | 1,093 | |
| Anheuser-Busch InBev NV 5.45% 2039 | | | 7,070 | | | | 9,557 | |
| Anheuser-Busch InBev NV 5.55% 2049 | | | 2,500 | | | | 3,554 | |
| Anheuser-Busch InBev NV 4.50% 2050 | | | 2,150 | | | | 2,710 | |
| B&G Foods, Inc. 5.25% 2025 | | | 2,175 | | | | 2,248 | |
| British American Tobacco International Finance PLC 3.95% 20258 | | | 4,250 | | | | 4,783 | |
| British American Tobacco PLC 2.789% 2024 | | | 4,000 | | | | 4,280 | |
| British American Tobacco PLC 3.222% 2024 | | | 2,826 | | | | 3,061 | |
| British American Tobacco PLC 3.215% 2026 | | | 3,323 | | | | 3,664 | |
| British American Tobacco PLC 3.557% 2027 | | | 1,384 | | | | 1,541 | |
| British American Tobacco PLC 2.259% 2028 | | | 2,509 | | | | 2,607 | |
| British American Tobacco PLC 3.462% 2029 | | | 2,000 | | | | 2,185 | |
| British American Tobacco PLC 4.906% 2030 | | | 4,770 | | | | 5,764 | |
| British American Tobacco PLC 2.726% 2031 | | | 4,000 | | | | 4,148 | |
| British American Tobacco PLC 4.39% 2037 | | | 5,500 | | | | 6,157 | |
| British American Tobacco PLC 4.54% 2047 | | | 2,953 | | | | 3,279 | |
| Coca-Cola Co. 1.00% 2028 | | | 3,015 | | | | 3,028 | |
| Coca-Cola Co. 1.375% 2031 | | | 1,460 | | | | 1,458 | |
| Coca-Cola Co. 2.50% 2051 | | | 1,040 | | | | 1,075 | |
| Conagra Brands, Inc. 4.30% 2024 | | | 4,685 | | | | 5,245 | |
| Conagra Brands, Inc. 1.375% 2027 | | | 4,105 | | | | 4,145 | |
| Conagra Brands, Inc. 5.30% 2038 | | | 55 | | | | 74 | |
| Conagra Brands, Inc. 5.40% 2048 | | | 412 | | | | 588 | |
| Constellation Brands, Inc. 2.65% 2022 | | | 7,846 | | | | 8,156 | |
| Constellation Brands, Inc. 2.70% 2022 | | | 195 | | | | 201 | |
| Constellation Brands, Inc. 3.20% 2023 | | | 1,340 | | | | 1,416 | |
| Constellation Brands, Inc. 3.60% 2028 | | | 938 | | | | 1,072 | |
| Constellation Brands, Inc. 2.875% 2030 | | | 2,259 | | | | 2,479 | |
| Constellation Brands, Inc. 4.50% 2047 | | | 220 | | | | 278 | |
| Constellation Brands, Inc. 3.75% 2050 | | | 351 | | | | 414 | |
| Costco Wholesale Corp. 2.75% 2024 | | | 10,000 | | | | 10,763 | |
| Costco Wholesale Corp. 1.60% 2030 | | | 5,000 | | | | 5,127 | |
| H.J. Heinz Co. 3.875% 20278 | | | 2,475 | | | | 2,669 | |
| H.J. Heinz Co. 5.50% 20508 | | | 1,215 | | | | 1,534 | |
| Imperial Tobacco Finance PLC 3.50% 20238 | | | 4,000 | | | | 4,190 | |
| Keurig Dr Pepper Inc. 4.057% 2023 | | | 2,000 | | | | 2,174 | |
| Keurig Dr Pepper Inc. 4.597% 2028 | | | 2,000 | | | | 2,437 | |
| Keurig Dr Pepper Inc. 3.20% 2030 | | | 3,771 | | | | 4,274 | |
| Keurig Dr Pepper Inc. 4.985% 2038 | | | 3,351 | | | | 4,495 | |
| Keurig Dr Pepper Inc. 5.085% 2048 | | | 75 | | | | 106 | |
| American Funds Insurance Series | 133 |
Asset Allocation Fund (continued)
| Bonds, notes & other debt instruments (continued) | Principal amount
(000) | | | Value
(000) | |
| Corporate bonds, notes & loans (continued) | | | | | | | | |
| Consumer staples (continued) | | | | | | | | |
| Keurig Dr Pepper Inc. 3.80% 2050 | | $ | 2,552 | | | $ | 3,062 | |
| Kimberly-Clark Corp. 1.05% 2027 | | | 1,395 | | | | 1,414 | |
| Kimberly-Clark Corp. 3.10% 2030 | | | 844 | | | | 972 | |
| Kraft Heinz Company 3.95% 2025 | | | 2,195 | | | | 2,418 | |
| Kraft Heinz Company 4.375% 2046 | | | 840 | | | | 909 | |
| Kraft Heinz Company 4.875% 20498 | | | 1,725 | | | | 2,013 | |
| Molson Coors Brewing Co. 4.20% 2046 | | | 2,270 | | | | 2,605 | |
| Nestlé Holdings, Inc. 3.35% 20238 | | | 750 | | | | 809 | |
| Nestlé Holdings, Inc. 0.625% 20268 | | | 5,240 | | | | 5,217 | |
| Nestlé Holdings, Inc. 1.00% 20278 | | | 19,720 | | | | 19,773 | |
| Nestlé Holdings, Inc. 1.25% 20308 | | | 5,000 | | | | 4,979 | |
| PepsiCo, Inc. 1.40% 2031 | | | 3,795 | | | | 3,825 | |
| PepsiCo, Inc. 3.625% 2050 | | | 2,180 | | | | 2,769 | |
| Philip Morris International Inc. 1.875% 2021 | | | 1,500 | | | | 1,500 | |
| Philip Morris International Inc. 2.375% 2022 | | | 1,960 | | | | 2,023 | |
| Philip Morris International Inc. 2.625% 2022 | | | 1,670 | | | | 1,712 | |
| Philip Morris International Inc. 2.875% 2024 | | | 788 | | | | 849 | |
| Philip Morris International Inc. 3.25% 2024 | | | 2,000 | | | | 2,203 | |
| Philip Morris International Inc. 0.875% 2026 | | | 2,990 | | | | 3,004 | |
| Philip Morris International Inc. 3.375% 2029 | | | 3,268 | | | | 3,746 | |
| Philip Morris International Inc. 1.75% 2030 | | | 4,974 | | | | 5,039 | |
| Philip Morris International Inc. 2.10% 2030 | | | 2,477 | | | | 2,585 | |
| Post Holdings, Inc. 4.625% 20308 | | | 2,886 | | | | 3,040 | |
| Procter & Gamble Company 1.70% 2021 | | | 400 | | | | 405 | |
| Procter & Gamble Company 0.55% 2025 | | | 5,595 | | | | 5,646 | |
| Procter & Gamble Company 1.20% 2030 | | | 8,210 | | | | 8,224 | |
| Reckitt Benckiser Group PLC 2.375% 20228 | | | 1,125 | | | | 1,157 | |
| Reynolds American Inc. 4.45% 2025 | | | 1,425 | | | | 1,623 | |
| Reynolds American Inc. 5.85% 2045 | | | 2,030 | | | | 2,598 | |
| TreeHouse Foods, Inc. 4.00% 2028 | | | 320 | | | | 332 | |
| Wal-Mart Stores, Inc. 2.35% 2022 | | | 1,000 | | | | 1,042 | |
| Wal-Mart Stores, Inc. 2.85% 2024 | | | 1,805 | | | | 1,953 | |
| Wal-Mart Stores, Inc. 3.05% 2026 | | | 2,060 | | | | 2,320 | |
| | | | | | | | 265,224 | |
| | | | | | | | | |
| Materials 0.76% | | | | | | | | |
| Anglo American Capital PLC 2.625% 20308 | | | 11,275 | | | | 11,808 | |
| Anglo American Capital PLC 5.625% 20308 | | | 720 | | | | 918 | |
| Anglo American Capital PLC 3.95% 20508 | | | 2,945 | | | | 3,313 | |
| Ardagh Packaging Finance 5.25% 20258 | | | 833 | | | | 880 | |
| Chevron Phillips Chemical Co. LLC 3.30% 20238 | | | 595 | | | | 630 | |
| Cleveland-Cliffs Inc. 4.875% 20248 | | | 3,975 | | | | 4,057 | |
| Cleveland-Cliffs Inc. 5.75% 2025 | | | 9,456 | | | | 9,616 | |
| Cleveland-Cliffs Inc. 9.875% 20258 | | | 925 | | | | 1,089 | |
| Cleveland-Cliffs Inc. 6.75% 20268 | | | 2,035 | | | | 2,200 | |
| Cleveland-Cliffs Inc. 5.875% 2027 | | | 10,500 | | | | 10,719 | |
| CVR Partners, LP 9.25% 20238 | | | 2,350 | | | | 2,355 | |
| Dow Chemical Co. 4.55% 2025 | | | 1,405 | | | | 1,645 | |
| Dow Chemical Co. 3.625% 2026 | | | 1,884 | | | | 2,124 | |
| Dow Chemical Co. 2.10% 2030 | | | 4,000 | | | | 4,105 | |
| Dow Chemical Co. 4.80% 2049 | | | 627 | | | | 845 | |
| Dow Chemical Co. 3.60% 2050 | | | 15,250 | | | | 17,135 | |
| First Quantum Minerals Ltd. 7.25% 20238 | | | 1,200 | | | | 1,239 | |
| First Quantum Minerals Ltd. 6.50% 20248 | | | 4,704 | | | | 4,842 | |
| First Quantum Minerals Ltd. 7.50% 20258 | | | 15,400 | | | | 16,055 | |
| First Quantum Minerals Ltd. 6.875% 20268 | | | 11,375 | | | | 11,880 | |
| First Quantum Minerals Ltd. 6.875% 20278 | | | 3,240 | | | | 3,520 | |
| Freeport-McMoRan Inc. 3.875% 2023 | | | 825 | | | | 862 | |
| Freeport-McMoRan Inc. 4.25% 2030 | | | 2,550 | | | | 2,750 | |
| FXI Holdings, Inc. 7.875% 20248 | | | 2,226 | | | | 2,248 | |
| 134 | American Funds Insurance Series |
Asset Allocation Fund (continued)
| Bonds, notes & other debt instruments (continued) | Principal amount
(000) | | | Value
(000) | |
| Corporate bonds, notes & loans (continued) | | | | | | | | |
| Materials (continued) | | | | | | | | |
| FXI Holdings, Inc. 12.25% 20268 | | $ | 4,392 | | | $ | 5,014 | |
| Glencore Funding LLC 4.125% 20248 | | | 945 | | | | 1,041 | |
| Hexion Inc. 7.875% 20278 | | | 2,045 | | | | 2,192 | |
| International Paper Co. 7.30% 2039 | | | 2,005 | | | | 3,218 | |
| Joseph T. Ryerson & Son, Inc. 8.50% 20288 | | | 1,148 | | | | 1,302 | |
| LSB Industries, Inc. 9.625% 20238 | | | 5,170 | | | | 5,344 | |
| LYB International Finance III, LLC 1.25% 2025 | | | 5,780 | | | | 5,885 | |
| LYB International Finance III, LLC 2.25% 2030 | | | 3,690 | | | | 3,819 | |
| LYB International Finance III, LLC 3.375% 2040 | | | 11,184 | | | | 11,977 | |
| LYB International Finance III, LLC 3.625% 2051 | | | 2,922 | | | | 3,199 | |
| LYB International Finance III, LLC 3.80% 2060 | | | 1,186 | | | | 1,281 | |
| Methanex Corp. 5.125% 2027 | | | 4,525 | | | | 4,924 | |
| Mosaic Co. 3.25% 2022 | | | 1,788 | | | | 1,869 | |
| Mosaic Co. 4.05% 2027 | | | 1,587 | | | | 1,799 | |
| Newcrest Finance Pty Ltd. 3.25% 20308 | | | 1,329 | | | | 1,470 | |
| Newcrest Finance Pty Ltd. 4.20% 20508 | | | 371 | | | | 455 | |
| Nutrition & Biosciences, Inc. 1.832% 20278 | | | 7,468 | | | | 7,699 | |
| Nutrition & Biosciences, Inc. 2.30% 20308 | | | 5,310 | | | | 5,471 | |
| Praxair, Inc. 1.10% 2030 | | | 6,604 | | | | 6,540 | |
| Praxair, Inc. 2.00% 2050 | | | 1,605 | | | | 1,505 | |
| Sherwin-Williams Co. 2.75% 2022 | | | 29 | | | | 30 | |
| Sherwin-Williams Co. 3.125% 2024 | | | 275 | | | | 299 | |
| Sherwin-Williams Co. 2.95% 2029 | | | 4,000 | | | | 4,407 | |
| Sherwin-Williams Co. 3.80% 2049 | | | 5,208 | | | | 6,295 | |
| Tronox Ltd. 6.50% 20268 | | | 1,980 | | | | 2,064 | |
| Vale Overseas Ltd. 3.75% 2030 | | | 3,949 | | | | 4,397 | |
| Valvoline Inc. 4.375% 2025 | | | 670 | | | | 692 | |
| Venator Materials Corp. 5.75% 20258 | | | 5,845 | | | | 5,476 | |
| Venator Materials Corp. 9.50% 20258 | | | 1,495 | | | | 1,637 | |
| Warrior Met Coal, Inc. 8.00% 20248 | | | 5,095 | | | | 5,214 | |
| Westlake Chemical Corp. 4.375% 2047 | | | 500 | | | | 595 | |
| | | | | | | | 223,945 | |
| | | | | | | | | |
| Information technology 0.74% | | | | | | | | |
| Adobe Inc. 1.90% 2025 | | | 2,216 | | | | 2,344 | |
| Adobe Inc. 2.30% 2030 | | | 11,627 | | | | 12,593 | |
| Almonde Inc., Term Loan, (3-month USD-LIBOR + 7.25%) 8.25% 202510,12 | | | 4,150 | | | | 4,172 | |
| Apple Inc. 3.00% 2024 | | | 625 | | | | 673 | |
| Apple Inc. 0.55% 2025 | | | 14,140 | | | | 14,213 | |
| Apple Inc. 1.125% 2025 | | | 1,866 | | | | 1,920 | |
| Apple Inc. 3.35% 2027 | | | 40 | | | | 46 | |
| Apple Inc. 1.25% 2030 | | | 8,760 | | | | 8,768 | |
| Apple Inc. 2.40% 2050 | | | 3,000 | | | | 3,077 | |
| Avaya Inc. 6.125% 20288 | | | 1,600 | | | | 1,712 | |
| Broadcom Inc. 3.125% 2022 | | | 1,575 | | | | 1,649 | |
| Broadcom Inc. 3.625% 2024 | | | 1,575 | | | | 1,731 | |
| Broadcom Inc. 4.25% 2026 | | | 7,508 | | | | 8,606 | |
| Broadcom Inc. 4.75% 2029 | | | 4,710 | | | | 5,634 | |
| Broadcom Inc. 4.15% 2030 | | | 5,000 | | | | 5,791 | |
| Broadcom Inc. 5.00% 2030 | | | 1,807 | | | | 2,198 | |
| Broadcom Ltd. 3.625% 2024 | | | 750 | | | | 811 | |
| Broadcom Ltd. 3.875% 2027 | | | 3,060 | | | | 3,440 | |
| CommScope Finance LLC 6.00% 20268 | | | 2,425 | | | | 2,558 | |
| Diebold Nixdorf AG, Term Loan B, (3-month USD-LIBOR + 2.75%) 3.004% 202310,12 | | | 1,342 | | | | 1,312 | |
| Diebold Nixdorf, Inc. 9.375% 20258 | | | 3,775 | | | | 4,235 | |
| Diebold, Inc. 8.50% 2024 | | | 1,400 | | | | 1,419 | |
| Fiserv, Inc. 2.75% 2024 | | | 1,600 | | | | 1,719 | |
| Fiserv, Inc. 3.20% 2026 | | | 7,455 | | | | 8,355 | |
| Fiserv, Inc. 2.25% 2027 | | | 1,030 | | | | 1,099 | |
| Fiserv, Inc. 3.50% 2029 | | | 4,070 | | | | 4,654 | |
| American Funds Insurance Series | 135 |
Asset Allocation Fund (continued)
| Bonds, notes & other debt instruments (continued) | Principal amount
(000) | | | Value
(000) | |
| Corporate bonds, notes & loans (continued) | | | | | | | | |
| Information technology (continued) | | | | | | | | |
| Fiserv, Inc. 2.65% 2030 | | $ | 12,611 | | | $ | 13,653 | |
| Fiserv, Inc. 4.40% 2049 | | | 1,800 | | | | 2,411 | |
| Gartner, Inc. 4.50% 20288 | | | 650 | | | | 687 | |
| Global Payments Inc. 2.90% 2030 | | | 3,528 | | | | 3,839 | |
| Intuit Inc. 0.95% 2025 | | | 1,530 | | | | 1,551 | |
| Intuit Inc. 1.35% 2027 | | | 3,565 | | | | 3,652 | |
| Intuit Inc. 1.65% 2030 | | | 4,870 | | | | 5,006 | |
| McAfee, LLC, Term Loan, (3-month USD-LIBOR + 3.75%) 4.004% 202410,12 | | | 2,602 | | | | 2,606 | |
| Microsoft Corp. 3.30% 2027 | | | 4,000 | | | | 4,565 | |
| Microsoft Corp. 4.20% 2035 | | | 6,000 | | | | 7,890 | |
| Microsoft Corp. 4.10% 2037 | | | 628 | | | | 825 | |
| Microsoft Corp. 2.525% 2050 | | | 2,961 | | | | 3,123 | |
| Oracle Corp. 3.60% 2050 | | | 6,730 | | | | 7,860 | |
| PayPal Holdings, Inc. 2.65% 2026 | | | 2,364 | | | | 2,599 | |
| PayPal Holdings, Inc. 2.85% 2029 | | | 2,770 | | | | 3,081 | |
| PayPal Holdings, Inc. 2.30% 2030 | | | 3,303 | | | | 3,541 | |
| PayPal Holdings, Inc. 3.25% 2050 | | | 932 | | | | 1,077 | |
| Sabre Holdings Corp. 5.25% 20238 | | | 325 | | | | 330 | |
| Sabre Holdings Corp. 9.25% 20258 | | | 1,025 | | | | 1,221 | |
| ServiceNow, Inc. 1.40% 2030 | | | 8,965 | | | | 8,752 | |
| Unisys Corp. 6.875% 20278 | | | 725 | | | | 794 | |
| Veritas Holdings Ltd. 7.50% 20258 | | | 3,860 | | | | 3,966 | |
| ViaSat, Inc. 5.625% 20278 | | | 555 | | | | 584 | |
| Visa Inc. 2.80% 2022 | | | 2,000 | | | | 2,093 | |
| Visa Inc. 3.15% 2025 | | | 5,500 | | | | 6,173 | |
| Visa Inc. 0.75% 2027 | | | 4,450 | | | | 4,441 | |
| Visa Inc. 1.10% 2031 | | | 10,000 | | | | 9,872 | |
| Visa Inc. 2.00% 2050 | | | 5,000 | | | | 4,776 | |
| Xerox Corp. 4.125% 2023 | | | 906 | | | | 953 | |
| Xerox Corp. 5.50% 20288 | | | 2,450 | | | | 2,604 | |
| | | | | | | | 219,254 | |
| | | | | | | | | |
| Real estate 0.42% | | | | | | | | |
| Alexandria Real Estate Equities, Inc. 3.80% 2026 | | | 315 | | | | 363 | |
| Alexandria Real Estate Equities, Inc. 3.95% 2028 | | | 1,220 | | | | 1,418 | |
| Alexandria Real Estate Equities, Inc. 2.75% 2029 | | | 1,940 | | | | 2,122 | |
| Alexandria Real Estate Equities, Inc. 3.375% 2031 | | | 1,320 | | | | 1,513 | |
| Alexandria Real Estate Equities, Inc. 1.875% 2033 | | | 4,095 | | | | 4,097 | |
| Alexandria Real Estate Equities, Inc. 4.85% 2049 | | | 410 | | | | 576 | |
| American Campus Communities, Inc. 3.75% 2023 | | | 3,055 | | | | 3,230 | |
| American Campus Communities, Inc. 4.125% 2024 | | | 2,075 | | | | 2,267 | |
| American Campus Communities, Inc. 3.30% 2026 | | | 1,698 | | | | 1,855 | |
| American Campus Communities, Inc. 3.625% 2027 | | | 9,545 | | | | 10,528 | |
| American Campus Communities, Inc. 2.85% 2030 | | | 144 | | | | 151 | |
| American Campus Communities, Inc. 3.875% 2031 | | | 744 | | | | 844 | |
| American Tower Corp. 3.55% 2027 | | | 1,425 | | | | 1,613 | |
| American Tower Corp. 1.50% 2028 | | | 10,000 | | | | 10,068 | |
| American Tower Corp. 3.60% 2028 | | | 1,000 | | | | 1,137 | |
| Brandywine Operating Partnership, LP 3.95% 2023 | | | 1,070 | | | | 1,115 | |
| Brookfield Property REIT Inc. 5.75% 20268 | | | 6,050 | | | | 5,980 | |
| Communications Sales & Leasing, Inc. 6.00% 20238 | | | 2,475 | | | | 2,529 | |
| Corporate Office Properties LP 3.60% 2023 | | | 390 | | | | 413 | |
| Corporate Office Properties LP 5.25% 2024 | | | 3,595 | | | | 3,976 | |
| Corporate Office Properties LP 2.25% 2026 | | | 1,431 | | | | 1,493 | |
| Equinix, Inc. 2.625% 2024 | | | 501 | | | | 536 | |
| Equinix, Inc. 2.90% 2026 | | | 6,087 | | | | 6,664 | |
| Equinix, Inc. 1.80% 2027 | | | 1,295 | | | | 1,334 | |
| Equinix, Inc. 1.55% 2028 | | | 5,920 | | | | 6,023 | |
| Equinix, Inc. 3.20% 2029 | | | 6,170 | | | | 6,810 | |
| Equinix, Inc. 2.15% 2030 | | | 2,969 | | | | 3,025 | |
| 136 | American Funds Insurance Series |
Asset Allocation Fund (continued)
| Bonds, notes & other debt instruments (continued) | Principal amount
(000) | | | Value
(000) | |
| Corporate bonds, notes & loans (continued) | | | | | | | | |
| Real estate (continued) | | | | | | | | |
| Equinix, Inc. 3.00% 2050 | | $ | 2,095 | | | $ | 2,128 | |
| Essex Portfolio LP 3.875% 2024 | | | 1,000 | | | | 1,099 | |
| Essex Portfolio LP 3.50% 2025 | | | 6,825 | | | | 7,566 | |
| Gaming and Leisure Properties, Inc. 3.35% 2024 | | | 1,263 | | | | 1,330 | |
| Hospitality Properties Trust 4.50% 2023 | | | 1,945 | | | | 1,958 | |
| Hospitality Properties Trust 4.50% 2025 | | | 150 | | | | 148 | |
| Hospitality Properties Trust 4.95% 2027 | | | 500 | | | | 504 | |
| Hospitality Properties Trust 3.95% 2028 | | | 1,950 | | | | 1,888 | |
| Host Hotels & Resorts LP 4.50% 2026 | | | 355 | | | | 389 | |
| Howard Hughes Corp. 5.375% 20288 | | | 2,450 | | | | 2,640 | |
| Iron Mountain Inc. 5.25% 20308 | | | 3,695 | | | | 3,995 | |
| Iron Mountain Inc. 4.50% 20318 | | | 2,015 | | | | 2,113 | |
| Ladder Capital Corp. 5.25% 20258 | | | 440 | | | | 440 | |
| Public Storage 2.37% 2022 | | | 565 | | | | 584 | |
| QTS Realty Trust, Inc. 3.875% 20288 | | | 2,025 | | | | 2,068 | |
| Scentre Group 3.25% 20258 | | | 1,000 | | | | 1,066 | |
| Scentre Group 3.50% 20258 | | | 3,075 | | | | 3,290 | |
| Scentre Group 3.75% 20278 | | | 2,430 | | | | 2,620 | |
| UDR, Inc. 2.95% 2026 | | | 760 | | | | 835 | |
| Westfield Corp. Ltd. 3.15% 20228 | | | 4,290 | | | | 4,364 | |
| Westfield Corp. Ltd. 3.50% 20298 | | | 443 | | | | 465 | |
| | | | | | | | 123,170 | |
| | | | | | | | | |
| Total corporate bonds, notes & loans | | | | | | | 3,853,780 | |
| | | | | | | | | |
| U.S. Treasury bonds & notes 8.47% | | | | | | | | |
| U.S. Treasury 6.99% | | | | | | | | |
| U.S. Treasury 1.50% 2021 | | | 3,777 | | | | 3,811 | |
| U.S. Treasury 1.625% 2021 | | | 3,704 | | | | 3,732 | |
| U.S. Treasury 1.625% 2021 | | | 98 | | | | 99 | |
| U.S. Treasury 1.75% 2021 | | | 425 | | | | 431 | |
| U.S. Treasury 2.25% 202114 | | | 95,000 | | | | 95,664 | |
| U.S. Treasury 2.50% 2021 | | | 200,000 | | | | 200,359 | |
| U.S. Treasury 2.75% 2021 | | | 19,232 | | | | 19,586 | |
| U.S. Treasury 0.125% 2022 | | | 114,525 | | | | 114,548 | |
| U.S. Treasury 0.125% 2022 | | | 20,000 | | | | 20,004 | |
| U.S. Treasury 1.375% 2022 | | | 5,000 | | | | 5,068 | |
| U.S. Treasury 1.375% 2022 | | | 280 | | | | 286 | |
| U.S. Treasury 1.50% 2022 | | | 9,407 | | | | 9,627 | |
| U.S. Treasury 1.625% 2022 | | | 94 | | | | 97 | |
| U.S. Treasury 1.875% 2022 | | | 80,000 | | | | 81,633 | |
| U.S. Treasury 1.875% 2022 | | | 4,000 | | | | 4,122 | |
| U.S. Treasury 2.125% 2022 | | | 37,000 | | | | 38,471 | |
| U.S. Treasury 0.125% 2023 | | | 5,362 | | | | 5,355 | |
| U.S. Treasury 0.125% 2023 | | | 2,000 | | | | 1,999 | |
| U.S. Treasury 0.25% 2023 | | | 30,000 | | | | 30,077 | |
| U.S. Treasury 1.375% 2023 | | | 5,309 | | | | 5,449 | |
| U.S. Treasury 2.25% 2023 | | | 5,000 | | | | 5,312 | |
| U.S. Treasury 2.375% 2023 | | | 5,000 | | | | 5,233 | |
| U.S. Treasury 2.75% 2023 | | | 15,000 | | | | 15,908 | |
| U.S. Treasury 1.50% 2024 | | | 22,500 | | | | 23,583 | |
| U.S. Treasury 1.50% 2024 | | | 907 | | | | 950 | |
| U.S. Treasury 2.125% 2024 | | | 5,000 | | | | 5,313 | |
| U.S. Treasury 2.25% 2024 | | | 5,000 | | | | 5,319 | |
| U.S. Treasury 2.375% 2024 | | | 70,000 | | | | 75,442 | |
| U.S. Treasury 2.50% 2024 | | | 225,000 | | | | 241,055 | |
| U.S. Treasury 2.50% 2024 | | | 700 | | | | 754 | |
| U.S. Treasury 0.25% 2025 | | | 89,250 | | | | 89,011 | |
| U.S. Treasury 0.25% 2025 | | | 84,812 | | | | 84,641 | |
| U.S. Treasury 0.25% 2025 | | | 2,272 | | | | 2,263 | |
| U.S. Treasury 0.375% 2025 | | | 3,368 | | | | 3,372 | |
| American Funds Insurance Series | 137 |
Asset Allocation Fund (continued)
| Bonds, notes & other debt instruments (continued) | Principal amount
(000) | | | Value
(000) | |
| U.S. Treasury bonds & notes (continued) | | | | | | | | |
| U.S. Treasury (continued) | | | | | | | | |
| U.S. Treasury 0.375% 2025 | | $ | 2,705 | | | $ | 2,715 | |
| U.S. Treasury 2.50% 2025 | | | 3,500 | | | | 3,818 | |
| U.S. Treasury 2.75% 2025 | | | 3,229 | | | | 3,581 | |
| U.S. Treasury 1.50% 2026 | | | 500 | | | | 529 | |
| U.S. Treasury 1.625% 2026 | | | 60,000 | | | | 63,990 | |
| U.S. Treasury 1.625% 2026 | | | 27,000 | | | | 28,786 | |
| U.S. Treasury 1.625% 2026 | | | 7,000 | | | | 7,444 | |
| U.S. Treasury 1.625% 2026 | | | 1,500 | | | | 1,597 | |
| U.S. Treasury 0.50% 2027 | | | 46,770 | | | | 46,591 | |
| U.S. Treasury 0.50% 2027 | | | 33,050 | | | | 32,899 | |
| U.S. Treasury 0.50% 2027 | | | 4,418 | | | | 4,389 | |
| U.S. Treasury 1.125% 2027 | | | 762 | | | | 790 | |
| U.S. Treasury 2.25% 2027 | | | 78,250 | | | | 86,472 | |
| U.S. Treasury 2.375% 2027 | | | 880 | | | | 981 | |
| U.S. Treasury 2.875% 2028 | | | 5,217 | | | | 6,042 | |
| U.S. Treasury 0.625% 2030 | | | 18,400 | | | | 17,985 | |
| U.S. Treasury 0.875% 2030 | | | 128,258 | | | | 127,767 | |
| U.S. Treasury 1.50% 2030 | | | 36,651 | | | | 38,765 | |
| U.S. Treasury 1.125% 2040 | | | 60,975 | | | | 57,877 | |
| U.S. Treasury 2.50% 2046 | | | 3,755 | | | | 4,486 | |
| U.S. Treasury 3.00% 2047 | | | 9,355 | | | | 12,252 | |
| U.S. Treasury 3.00% 2048 | | | 336 | | | | 441 | |
| U.S. Treasury 2.25% 204914 | | | 15,000 | | | | 17,169 | |
| U.S. Treasury 2.375% 204914 | | | 75,000 | | | | 88,101 | |
| U.S. Treasury 1.375% 2050 | | | 194,447 | | | | 181,954 | |
| U.S. Treasury 1.625% 2050 | | | 20,000 | | | | 19,905 | |
| U.S. Treasury 2.00% 205014 | | | 15,075 | | | | 16,370 | |
| | | | | | | | 2,072,270 | |
| | | | | | | | | |
| U.S. Treasury inflation-protected securities 1.48% | | | | | | | | |
| U.S. Treasury Inflation-Protected Security 0.125% 202415 | | | 86,266 | | | | 92,498 | |
| U.S. Treasury Inflation-Protected Security 0.625% 202415 | | | 87,479 | | | | 93,915 | |
| U.S. Treasury Inflation-Protected Security 0.125% 202515 | | | 23,186 | | | | 24,937 | |
| U.S. Treasury Inflation-Protected Security 0.75% 202815 | | | 18,153 | | | | 21,133 | |
| U.S. Treasury Inflation-Protected Security 0.875% 202915 | | | 20,465 | | | | 24,068 | |
| U.S. Treasury Inflation-Protected Security 0.125% 203015 | | | 23,488 | | | | 26,199 | |
| U.S. Treasury Inflation-Protected Security 1.00% 204915 | | | 102,525 | | | | 144,589 | |
| U.S. Treasury Inflation-Protected Security 0.25% 205015 | | | 10,301 | | | | 12,271 | |
| | | | | | | | 439,610 | |
| | | | | | | | | |
| Total U.S. Treasury bonds & notes | | | | | | | 2,511,880 | |
| | | | | | | | | |
| Mortgage-backed obligations 7.41% | | | | | | | | |
| Federal agency mortgage-backed obligations 7.05% | | | | | | | | |
| Fannie Mae Pool #885290 6.00% 202116 | | | 2 | | | | 2 | |
| Fannie Mae Pool #AD7072 4.00% 202516 | | | 5 | | | | 5 | |
| Fannie Mae Pool #AE3069 4.00% 202516 | | | 3 | | | | 3 | |
| Fannie Mae Pool #AE2321 4.00% 202516 | | | 2 | | | | 2 | |
| Fannie Mae Pool #AH9695 4.00% 202616 | | | 519 | | | | 552 | |
| Fannie Mae Pool #AH6431 4.00% 202616 | | | 472 | | | | 503 | |
| Fannie Mae Pool #890329 4.00% 202616 | | | 72 | | | | 76 | |
| Fannie Mae Pool #AJ3010 4.00% 202616 | | | 42 | | | | 45 | |
| Fannie Mae Pool #AH8174 4.00% 202616 | | | 5 | | | | 6 | |
| Fannie Mae Pool #AL3908 4.00% 202616 | | | 4 | | | | 4 | |
| Fannie Mae Pool #AH5618 4.00% 202616 | | | 4 | | | | 4 | |
| Fannie Mae Pool #AH0829 4.00% 202616 | | | 4 | | | | 4 | |
| Fannie Mae Pool #AH8275 4.00% 202616 | | | 2 | | | | 3 | |
| Fannie Mae Pool #AL7299 4.00% 202716 | | | 265 | | | | 281 | |
| Fannie Mae Pool #MA1109 4.00% 202716 | | | 5 | | | | 5 | |
| Fannie Mae Pool #MA3653 3.00% 202916 | | | 45 | | | | 48 | |
| Fannie Mae Pool #AL8347 4.00% 202916 | | | 534 | | | | 567 | |
| 138 | American Funds Insurance Series |
Asset Allocation Fund (continued)
| Bonds, notes & other debt instruments (continued) | Principal amount
(000) | | | Value
(000) | |
| Mortgage-backed obligations (continued) | | | | | | | | |
| Federal agency mortgage-backed obligations (continued) | | | | | | | | |
| Fannie Mae Pool #254767 5.50% 203316 | | $ | 321 | | | $ | 374 | |
| Fannie Mae Pool #555956 5.50% 203316 | | | 217 | | | | 253 | |
| Fannie Mae Pool #BN1085 4.00% 203416 | | | 820 | | | | 870 | |
| Fannie Mae Pool #BN3172 4.00% 203416 | | | 408 | | | | 432 | |
| Fannie Mae Pool #MA4228 1.50% 203616 | | | 64,738 | | | | 66,646 | |
| Fannie Mae Pool #MA4229 2.00% 203616 | | | 12,064 | | | | 12,621 | |
| Fannie Mae Pool #AS8554 3.00% 203616 | | | 12,279 | | | | 12,934 | |
| Fannie Mae Pool #929185 5.50% 203616 | | | 473 | | | | 556 | |
| Fannie Mae Pool #893641 6.00% 203616 | | | 1,046 | | | | 1,251 | |
| Fannie Mae Pool #893688 6.00% 203616 | | | 286 | | | | 342 | |
| Fannie Mae Pool #907239 6.00% 203616 | | | 60 | | | | 70 | |
| Fannie Mae Pool #AD0249 5.50% 203716 | | | 177 | | | | 206 | |
| Fannie Mae Pool #190379 5.50% 203716 | | | 94 | | | | 111 | |
| Fannie Mae Pool #924952 6.00% 203716 | | | 1,205 | | | | 1,431 | |
| Fannie Mae Pool #888292 6.00% 203716 | | | 969 | | | | 1,153 | |
| Fannie Mae Pool #928031 6.00% 203716 | | | 117 | | | | 138 | |
| Fannie Mae Pool #888637 6.00% 203716 | | | 16 | | | | 19 | |
| Fannie Mae Pool #AD0119 6.00% 203816 | | | 1,484 | | | | 1,761 | |
| Fannie Mae Pool #AD0095 6.00% 203816 | | | 1,154 | | | | 1,365 | |
| Fannie Mae Pool #995674 6.00% 203816 | | | 562 | | | | 667 | |
| Fannie Mae Pool #AE0021 6.00% 203816 | | | 468 | | | | 553 | |
| Fannie Mae Pool #AL7164 6.00% 203816 | | | 281 | | | | 328 | |
| Fannie Mae Pool #AB0538 6.00% 203816 | | | 222 | | | | 260 | |
| Fannie Mae Pool #995391 6.00% 203816 | | | 32 | | | | 38 | |
| Fannie Mae Pool #889983 6.00% 203816 | | | 30 | | | | 35 | |
| Fannie Mae Pool #995224 6.00% 203816 | | | 18 | | | | 21 | |
| Fannie Mae Pool #AD0833 6.00% 203916 | | | 1 | | | | 1 | |
| Fannie Mae Pool #AL0013 6.00% 204016 | | | 294 | | | | 347 | |
| Fannie Mae Pool #AL0309 6.00% 204016 | | | 96 | | | | 114 | |
| Fannie Mae Pool #AB4536 6.00% 204116 | | | 565 | | | | 669 | |
| Fannie Mae Pool #AL7228 6.00% 204116 | | | 395 | | | | 467 | |
| Fannie Mae Pool #AP2131 3.50% 204216 | | | 5,880 | | | | 6,346 | |
| Fannie Mae Pool #AU8813 4.00% 204316 | | | 2,968 | | | | 3,356 | |
| Fannie Mae Pool #AU9348 4.00% 204316 | | | 1,768 | | | | 2,000 | |
| Fannie Mae Pool #AU9350 4.00% 204316 | | | 1,410 | | | | 1,568 | |
| Fannie Mae Pool #AL8773 3.50% 204516 | | | 9,959 | | | | 10,820 | |
| Fannie Mae Pool #AL8354 3.50% 204516 | | | 2,392 | | | | 2,614 | |
| Fannie Mae Pool #BC4764 3.00% 204616 | | | 21,678 | | | | 22,815 | |
| Fannie Mae Pool #AL8522 3.50% 204616 | | | 4,748 | | | | 5,188 | |
| Fannie Mae Pool #BD9699 3.50% 204616 | | | 1,895 | | | | 2,040 | |
| Fannie Mae Pool #BD9307 4.00% 204616 | | | 1,733 | | | | 1,897 | |
| Fannie Mae Pool #BC7611 4.00% 204616 | | | 501 | | | | 549 | |
| Fannie Mae Pool #BH4084 3.50% 204716 | | | 20,500 | | | | 21,774 | |
| Fannie Mae Pool #BE1290 3.50% 204716 | | | 3,822 | | | | 4,145 | |
| Fannie Mae Pool #CA0770 3.50% 204716 | | | 3,514 | | | | 3,735 | |
| Fannie Mae Pool #MA3211 4.00% 204716 | | | 6,971 | | | | 7,490 | |
| Fannie Mae Pool #257036 7.00% 204716 | | | 11 | | | | 12 | |
| Fannie Mae Pool #256975 7.00% 204716 | | | 2 | | | | 2 | |
| Fannie Mae Pool #BJ3775 3.50% 204816 | | | 13,514 | | | | 14,336 | |
| Fannie Mae Pool #BK7655 3.899% 204812,16 | | | 683 | | | | 719 | |
| Fannie Mae Pool #CA2377 4.00% 204816 | | | 16,923 | | | | 18,085 | |
| Fannie Mae Pool #BK0920 4.00% 204816 | | | 2,979 | | | | 3,182 | |
| Fannie Mae Pool #BJ9256 4.00% 204816 | | | 2,968 | | | | 3,170 | |
| Fannie Mae Pool #BJ9252 4.00% 204816 | | | 891 | | | | 952 | |
| Fannie Mae Pool #BK0915 4.00% 204816 | | | 265 | | | | 283 | |
| Fannie Mae Pool #BK6971 4.00% 204816 | | | 216 | | | | 231 | |
| Fannie Mae Pool #MA3277 4.00% 204816 | | | 28 | | | | 30 | |
| Fannie Mae Pool #BK5255 4.00% 204816 | | | 27 | | | | 30 | |
| Fannie Mae Pool #CA2493 4.50% 204816 | | | 1,894 | | | | 2,058 | |
| Fannie Mae Pool #CA4756 3.00% 204916 | | | 10,033 | | | | 10,863 | |
| Fannie Mae Pool #BK8767 4.00% 204916 | | | 189 | | | | 206 | |
| American Funds Insurance Series | 139 |
Asset Allocation Fund (continued)
| Bonds, notes & other debt instruments (continued) | Principal amount
(000) | | | Value
(000) | |
| Mortgage-backed obligations (continued) | | | | | | | | |
| Federal agency mortgage-backed obligations (continued) | | | | | | | | |
| Fannie Mae Pool #MA4256 2.50% 205116 | | $ | 3,051 | | | $ | 3,218 | |
| Fannie Mae, Series 2001-T10, Class A1, 7.00% 204116 | | | 121 | | | | 144 | |
| Fannie Mae, Series 2002-W3, Class A5, 7.50% 204116 | | | 32 | | | | 39 | |
| Fannie Mae, Series 2012-M14, Class A2, Multi Family, 2.301% 202212,16 | | | 1,160 | | | | 1,191 | |
| Fannie Mae, Series 2012-M9, Class A2, Multi Family, 2.482% 202216 | | | 2,248 | | | | 2,288 | |
| Fannie Mae, Series 2012-M5, Class A2, Multi Family, 2.715% 202216 | | | 1,603 | | | | 1,627 | |
| Fannie Mae, Series 2014-M1, Class A2, Multi Family, 3.128% 202312,16 | | | 5,566 | | | | 5,880 | |
| Fannie Mae, Series 2013-M14, Class A2, Multi Family, 3.329% 202312,16 | | | 5,262 | | | | 5,589 | |
| Fannie Mae, Series 2014-M2, Class A2, Multi Family, 3.513% 202312,16 | | | 4,544 | | | | 4,869 | |
| Fannie Mae, Series 2014-M9, Class A2, Multi Family, 3.103% 202412,16 | | | 5,881 | | | | 6,372 | |
| Fannie Mae, Series 2014-M3, Class A2, Multi Family, 3.501% 202412,16 | | | 4,697 | | | | 5,080 | |
| Fannie Mae, Series 2017-M3, Class A2, Multi Family, 2.477% 202612,16 | | | 9,665 | | | | 10,575 | |
| Fannie Mae, Series 2017-M7, Class A2, Multi Family, 2.961% 202712,16 | | | 2,891 | | | | 3,241 | |
| Fannie Mae, Series 2006-43, Class JO, principal only, 0% 203616 | | | 67 | | | | 63 | |
| Freddie Mac Pool #Q46021 3.50% 204716 | | | 2,396 | | | | 2,592 | |
| Freddie Mac Pool #ZK7598 3.00% 202716 | | | 10,439 | | | | 10,976 | |
| Freddie Mac Pool #ZK7580 3.00% 202716 | | | 4,541 | | | | 4,828 | |
| Freddie Mac Pool #QN1174 2.50% 203416 | | | 642 | | | | 670 | |
| Freddie Mac Pool #SB8083 1.50% 203616 | | | 14,002 | | | | 14,415 | |
| Freddie Mac Pool #SB8084 2.00% 203616 | | | 3,275 | | | | 3,426 | |
| Freddie Mac Pool #C91912 3.00% 203716 | | | 19,815 | | | | 20,882 | |
| Freddie Mac Pool #G03978 5.00% 203816 | | | 692 | | | | 805 | |
| Freddie Mac Pool #G04553 6.50% 203816 | | | 84 | | | | 95 | |
| Freddie Mac Pool #G08347 4.50% 203916 | | | 121 | | | | 135 | |
| Freddie Mac Pool #C03518 5.00% 204016 | | | 1,211 | | | | 1,409 | |
| Freddie Mac Pool #Q05807 4.00% 204216 | | | 2,988 | | | | 3,295 | |
| Freddie Mac Pool #Q23185 4.00% 204316 | | | 1,886 | | | | 2,134 | |
| Freddie Mac Pool #Q23190 4.00% 204316 | | | 1,446 | | | | 1,608 | |
| Freddie Mac Pool #760014 3.116% 204512,16 | | | 420 | | | | 439 | |
| Freddie Mac Pool #Q37988 4.00% 204516 | | | 10,020 | | | | 11,077 | |
| Freddie Mac Pool #G60344 4.00% 204516 | | | 8,736 | | | | 9,678 | |
| Freddie Mac Pool #Z40130 3.00% 204616 | | | 6,415 | | | | 7,004 | |
| Freddie Mac Pool #Q41909 4.50% 204616 | | | 884 | | | | 970 | |
| Freddie Mac Pool #Q41090 4.50% 204616 | | | 547 | | | | 600 | |
| Freddie Mac Pool #760015 2.849% 204712,16 | | | 980 | | | | 1,013 | |
| Freddie Mac Pool #Q52216 3.50% 204716 | | | 13,195 | | | | 14,009 | |
| Freddie Mac Pool #Q52157 3.50% 204716 | | | 2,902 | | | | 3,081 | |
| Freddie Mac Pool #SI2002 4.00% 204816 | | | 6,236 | | | | 6,675 | |
| Freddie Mac Pool #ZM6968 4.00% 204816 | | | 3,718 | | | | 3,970 | |
| Freddie Mac Pool #SD7507 3.00% 204916 | | | 33,113 | | | | 35,812 | |
| Freddie Mac Pool #RA2020 3.00% 205016 | | | 13,908 | | | | 14,949 | |
| Freddie Mac, Series T041, Class 3A, 5.222% 203212,16 | | | 240 | | | | 272 | |
| Freddie Mac, Series K723, Class A2, Multi Family, 2.454% 202316 | | | 3,025 | | | | 3,176 | |
| Freddie Mac, Series K725, Class A2, Multi Family, 3.002% 202416 | | | 5,555 | | | | 5,981 | |
| Freddie Mac, Series K044, Class A2, Multi Family, 2.811% 202516 | | | 4,265 | | | | 4,648 | |
| Freddie Mac, Series K047, Class A2, Multi Family, 3.329% 202516 | | | 4,000 | | | | 4,466 | |
| Freddie Mac, Series K733, Class A2, Multi Family, 3.75% 202512,16 | | | 9,778 | | | | 10,998 | |
| Freddie Mac, Series K055, Class A2, Multi Family, 2.673% 202616 | | | 10,050 | | | | 11,062 | |
| Freddie Mac, Series K734, Class A2, Multi Family, 3.208% 202616 | | | 7,370 | | | | 8,226 | |
| Freddie Mac, Series K066, Class A2, Multi Family, 3.117% 202716 | | | 4,755 | | | | 5,420 | |
| Freddie Mac, Series K067, Class A2, Multi Family, 3.194% 202716 | | | 5,770 | | | | 6,622 | |
| Freddie Mac, Series K063, Class A2, Multi Family, 3.43% 202716 | | | 4,375 | | | | 5,035 | |
| Freddie Mac, Series K076, Class A2, Multi Family, 3.90% 202816 | | | 3,237 | | | | 3,884 | |
| Freddie Mac Seasoned Credit Risk Transfer Trust, Series 2017-2, Class MA, 3.00% 205616 | | | 8,475 | | | | 9,091 | |
| Freddie Mac Seasoned Credit Risk Transfer Trust, Series 2017-2, Class HA, 3.00% 205612,16 | | | 8,495 | | | | 8,927 | |
| Freddie Mac Seasoned Credit Risk Transfer Trust, Series 2017-1, Class HA, 3.00% 205612,16 | | | 4,449 | | | | 4,677 | |
| Freddie Mac Seasoned Credit Risk Transfer Trust, Series 2017-3, Class HA, 3.25% 205612,16 | | | 1,877 | | | | 1,990 | |
| 140 | American Funds Insurance Series |
Asset Allocation Fund (continued)
| Bonds, notes & other debt instruments (continued) | Principal amount
(000) | | | Value
(000) | |
| Mortgage-backed obligations (continued) | | | | | | | | |
| Federal agency mortgage-backed obligations (continued) | | | | | | | | |
| Freddie Mac Seasoned Credit Risk Transfer Trust, Series 2017-4, Class HT, 3.25% 205712,16 | | $ | 1,401 | | | $ | 1,527 | |
| Freddie Mac Seasoned Credit Risk Transfer Trust, Series 2018-3, Class MA, 3.50% 205716 | | | 3,306 | | | | 3,582 | |
| Freddie Mac Seasoned Credit Risk Transfer Trust, Series 2018-2, Class MT, 3.50% 205716 | | | 2,852 | | | | 3,115 | |
| Freddie Mac Seasoned Credit Risk Transfer Trust, Series 2017-4, Class MT, 3.50% 205716 | | | 1,135 | | | | 1,239 | |
| Freddie Mac Seasoned Credit Risk Transfer Trust, Series 2019-2, Class MA, 3.50% 205816 | | | 15,488 | | | | 16,882 | |
| Freddie Mac Seasoned Credit Risk Transfer Trust, Series 2019-4, Class MA, 3.00% 205916 | | | 8,737 | | | | 9,322 | |
| Freddie Mac Seasoned Loan Structured Transaction Trust, Series 2018-2, Class A1, 3.50% 202816 | | | 3,363 | | | | 3,558 | |
| Freddie Mac Seasoned Loan Structured Transaction Trust, Series 2019-3, Class A1C, 2.75% 202916 | | | 4,393 | | | | 4,650 | |
| Freddie Mac Seasoned Loan Structured Transaction Trust, Series 2019-1, Class A1, 3.50% 202916 | | | 7,001 | | | | 7,426 | |
| Freddie Mac Seasoned Loan Structured Transaction Trust, Series 2019-1, Class A2, 3.50% 202916 | | | 2,455 | | | | 2,714 | |
| Freddie Mac Structured Agency Credit Risk Debt Notes, Series 2015-DNA1, Class M3, 3.448% 202712,16 | | | 1,301 | | | | 1,338 | |
| Government National Mortgage Assn. 2.00% 205116,17 | | | 149,150 | | | | 155,465 | |
| Government National Mortgage Assn. 2.00% 205116,17 | | | 83,050 | | | | 86,703 | |
| Government National Mortgage Assn. 2.50% 205116,17 | | | 5,375 | | | | 5,668 | |
| Government National Mortgage Assn. 3.00% 205116,17 | | | 74,000 | | | | 77,425 | |
| Government National Mortgage Assn. 3.50% 205116,17 | | | 13,404 | | | | 14,202 | |
| Government National Mortgage Assn. 3.50% 205116,17 | | | 13,352 | | | | 14,139 | |
| Government National Mortgage Assn. 4.00% 205116,17 | | | 13,107 | | | | 13,981 | |
| Government National Mortgage Assn. 4.50% 205116,17 | | | 7,053 | | | | 7,560 | |
| Government National Mortgage Assn. 4.50% 205116,17 | | | 2,947 | | | | 3,156 | |
| Government National Mortgage Assn. Pool #BD7245 4.00% 204816 | | | 1,191 | | | | 1,302 | |
| Government National Mortgage Assn. Pool #MA5876 4.00% 204916 | | | 17,039 | | | | 18,229 | |
| Government National Mortgage Assn. Pool #MA5986 4.00% 204916 | | | 2,226 | | | | 2,391 | |
| Government National Mortgage Assn. Pool #MA5764 4.50% 204916 | | | 28,452 | | | | 30,796 | |
| Government National Mortgage Assn. Pool #MA6092 4.50% 204916 | | | 6,837 | | | | 7,374 | |
| Government National Mortgage Assn. Pool #MA5877 4.50% 204916 | | | 4,167 | | | | 4,506 | |
| Government National Mortgage Assn. Pool #MA7052 2.50% 205016 | | | 15,905 | | | | 16,854 | |
| Uniform Mortgage-Backed Security 1.50% 203616,17 | | | 89,384 | | | | 91,842 | |
| Uniform Mortgage-Backed Security 1.50% 203616,17 | | | 15,049 | | | | 15,455 | |
| Uniform Mortgage-Backed Security 2.00% 203616,17 | | | 54,690 | | | | 57,117 | |
| Uniform Mortgage-Backed Security 2.00% 203616,17 | | | 17,235 | | | | 18,017 | |
| Uniform Mortgage-Backed Security 3.00% 203616,17 | | | 8,784 | | | | 9,218 | |
| Uniform Mortgage-Backed Security 2.00% 205116,17 | | | 69,840 | | | | 72,297 | |
| Uniform Mortgage-Backed Security 2.00% 205116,17 | | | 45,476 | | | | 47,153 | |
| Uniform Mortgage-Backed Security 2.50% 205116,17 | | | 123,053 | | | | 129,292 | |
| Uniform Mortgage-Backed Security 2.50% 205116,17 | | | 92,374 | | | | 97,198 | |
| Uniform Mortgage-Backed Security 3.00% 205116,17 | | | 114,305 | | | | 119,939 | |
| Uniform Mortgage-Backed Security 3.00% 205116,17 | | | 24,371 | | | | 25,555 | |
| Uniform Mortgage-Backed Security 3.50% 205116,17 | | | 147,126 | | | | 155,725 | |
| Uniform Mortgage-Backed Security 4.00% 205116,17 | | | 105,276 | | | | 112,587 | |
| Uniform Mortgage-Backed Security 4.50% 205116,17 | | | 41,792 | | | | 45,352 | |
| | | | | | | | 2,091,688 | |
| | | | | | | | | |
| Collateralized mortgage-backed obligations (privately originated) 0.18% | | | | | | | | |
| Arroyo Mortgage Trust, Series 2018-1, Class A1, 3.763% 20488,12,16 | | | 1,624 | | | | 1,651 | |
| Bellemeade Re Ltd., Series 2019-3A, Class M1B, (1-month USD-LIBOR + 1.60%) 1.748% 20298,12,16 | | | 3,810 | | | | 3,817 | |
| Cascade Funding Mortgage Trust, Series 2018-RM2, Class A, 4.00% 20688,12,16 | | | 2,163 | | | | 2,240 | |
| Credit Suisse Mortgage Trust, Series 2020-NET, Class A, 2.257% 20378,16 | | | 4,191 | | | | 4,353 | |
| CS First Boston Mortgage Securities Corp., Series 2004-5, Class IVA1, 6.00% 203416 | | | 216 | | | | 228 | |
| Finance of America Structured Securities Trust, Series 2019-JR2, Class A1, 2.00% 20698,16 | | | 10,763 | | | | 11,678 | |
| Finance of America Structured Securities Trust, Series 2019-JR1, Class A, 2.00% 20698,16 | | | 3,798 | | | | 4,172 | |
| JPMorgan Mortgage Trust, Series 2019-INV3, Class A13, 3.50% 20508,12,16 | | | 1,120 | | | | 1,167 | |
| American Funds Insurance Series | 141 |
Asset Allocation Fund (continued)
| Bonds, notes & other debt instruments (continued) | Principal amount
(000) | | | Value
(000) | |
| Mortgage-backed obligations (continued) | | | | | | | | |
| Collateralized mortgage-backed obligations (privately originated) (continued) | | | | | | | | |
| JPMorgan Mortgage Trust, Series 2019-INV3, Class A3, 3.50% 20508,12,16 | | $ | 1,069 | | | $ | 1,114 | |
| Legacy Mortgage Asset Trust, Series 2019-GS5, Class A1, 3.20% 20598,12,16 | | | 5,422 | | | | 5,483 | |
| Legacy Mortgage Asset Trust, Series 2019-GS7, Class A1, 3.25% 20598,12,16 | | | 1,408 | | | | 1,412 | �� |
| Legacy Mortgage Asset Trust, Series 2019-GS2, Class A1, 3.75% 20598,12,16 | | | 765 | | | | 768 | |
| MASTR Alternative Loan Trust, Series 2004-2, Class 2A1, 6.00% 203416 | | | 495 | | | | 518 | |
| Mello Warehouse Securitization Trust, Series 2019-2, Class A, (1-month USD-LIBOR + 0.75%) 0.898% 20528,12,16 | | | 3,001 | | | | 3,005 | |
| Mortgage Repurchase Agreement Financing Trust, Series 2020-1, Class A1, (1-month USD-LIBOR + 2.00%) 2.149% 20228,12,16 | | | 1,625 | | | | 1,629 | |
| Mortgage Repurchase Agreement Financing Trust, Series 2020-5, Class A1, (1-month USD-LIBOR + 1.00%) 1.149% 20238,12,16 | | | 2,862 | | | | 2,884 | |
| Onslow Bay Financial LLC, Series 2020-INV1, Class A5, 3.50% 20498,12,16 | | | 2,427 | | | | 2,505 | |
| RMF Proprietary Issuance Trust, Series 2019-1, Class A, 2.75% 20638,12,16 | | | 981 | | | | 987 | |
| Sequoia Mortgage Trust, Series 2018-CH1, Class A1, 4.00% 20488,12,16 | | | 1,794 | | | | 1,845 | |
| Station Place Securitization Trust, Series 2020-WL1, Class A, (1-month USD-LIBOR + 1.15%) 1.298% 20518,12,16 | | | 2,500 | | | | 2,504 | |
| | | | | | | | 53,960 | |
| | | | | | | | | |
| Commercial mortgage-backed securities 0.18% | | | | | | | | |
| Bank Commercial Mortgage Trust, Series 2020-BN26, Class A4, 2.403% 206316 | | | 2,909 | | | | 3,130 | |
| Barclays Commercial Mortgage Securities LLC, Series 2017-DELC, Class A, 1.009% 20368,12,16 | | | 2,000 | | | | 1,982 | |
| Benchmark Mortgage Trust, Series 2018-B2, Class A4, 3.615% 205116 | | | 1,000 | | | | 1,146 | |
| Benchmark Mortgage Trust, Series 2020-B17, Class A5, 2.289% 205316 | | | 2,960 | | | | 3,168 | |
| Citigroup Commercial Mortgage Trust, Series 2015-GC29, Class AAB, 2.984% 204816 | | | 1,015 | | | | 1,058 | |
| Commercial Mortgage Trust, Series 2015-PC1, Class A5, 3.902% 205016 | | | 4,735 | | | | 5,308 | |
| CSAIL Commercial Mortgage Trust, Series 2015-C4, Class ASB, 3.617% 204816 | | | 1,335 | | | | 1,426 | |
| Grace Mortgage Trust, Series 2020-GRCE, Class A, 2.347% 20408,16 | | | 5,201 | | | | 5,517 | |
| GS Mortgage Securities Trust, Series 2020-GC47, Class A5, 2.377% 205316 | | | 5,602 | | | | 6,040 | |
| Manhattan West, Series 2020-OMW, Class A, 2.13% 20398,16 | | | 13,772 | | | | 14,516 | |
| Morgan Stanley Bank of America Merrill Lynch Trust, Series 2015-C27, Class ASB, 3.557% 204716 | | | 981 | | | | 1,044 | |
| Morgan Stanley Bank of America Merrill Lynch Trust, Series 2015-C22, Class ASB, 3.04% 204816 | | | 1,038 | | | | 1,086 | |
| Morgan Stanley Capital I Trust, Series 2014-CPT, Class A, 3.35% 20298,16 | | | 2,650 | | | | 2,669 | |
| MRA Issuance Trust, Series 2020-10, Class A, (1-month USD-LIBOR + 1.75%) 2.25% 20211,8,12,16 | | | 5,219 | | | | 5,219 | |
| | | | | | | | 53,309 | |
| | | | | | | | | |
| Total mortgage-backed obligations | | | | | | | 2,198,957 | |
| | | | | | | | | |
| Asset-backed obligations 0.79% | | | | | | | | |
| Aesop Funding LLC, Series 2017-2A, Class A, 2.97% 20248,16 | | | 1,920 | | | | 1,998 | |
| Aesop Funding LLC, Series 2018-1A, Class A, 3.70% 20248,16 | | | 1,114 | | | | 1,176 | |
| Aesop Funding LLC, Series 2020-2, Class A, 2.02% 20278,16 | | | 539 | | | | 551 | |
| Aesop Funding LLC, Series 2020-2A, Class B, 2.96% 20278,16 | | | 138 | | | | 141 | |
| CarMaxAuto Owner Trust, Series 2020-1, Class A2, 1.87% 202316 | | | 993 | | | | 1,000 | |
| CF Hippolyta LLC, Series 2020-1, Class A1, 1.69% 20608,16 | | | 15,289 | | | | 15,616 | |
| CF Hippolyta LLC, Series 2020-1, Class A2, 1.99% 20608,16 | | | 2,633 | | | | 2,677 | |
| CF Hippolyta LLC, Series 2020-1, Class B1, 2.28% 20608,16 | | | 945 | | | | 962 | |
| CF Hippolyta LLC, Series 2020-1, Class B2, 2.60% 20608,16 | | | 177 | | | | 179 | |
| CLI Funding V LLC, Series 2020-2A, Class A, 2.03% 20458,16 | | | 7,267 | | | | 7,339 | |
| CLI Funding V LLC, Series 2020-3A, Class A, 2.07% 20458,16 | | | 1,527 | | | | 1,544 | |
| CLI Funding V LLC, Series 2020-1A, Class A, 2.08% 20458,16 | | | 9,277 | | | | 9,403 | |
| CLI Funding V LLC, Series 2020-3A, Class B, 3.30% 20458,16 | | | 973 | | | | 983 | |
| Cloud Pass-Through Trust, Series 2019-1A, Class CLOU, 3.554% 20228,12,16 | | | 918 | | | | 930 | |
| Credit Acceptance Auto Loan Trust, Series 2020-1A, Class A, 2.01% 20298,16 | | | 2,964 | | | | 3,032 | |
| Drive Auto Receivables Trust, Series 2020-1, Class A2, 1.99% 202216 | | | 153 | | | | 153 | |
| Drive Auto Receivables Trust, Series 2019-3, Class A3, 2.49% 202316 | | | 1,498 | | | | 1,502 | |
| Drive Auto Receivables Trust, Series 2019-3, Class B, 2.65% 202416 | | | 595 | | | | 601 | |
| 142 | American Funds Insurance Series |
Asset Allocation Fund (continued)
| Bonds, notes & other debt instruments (continued) | Principal amount
(000) | | | Value
(000) | |
| Asset-backed obligations (continued) | | | | | | | | |
| Drive Auto Receivables Trust, Series 2019-3, Class C, 2.90% 202516 | | $ | 820 | | | $ | 845 | |
| Drive Auto Receivables Trust, Series 2020-1, Class C, 2.36% 202616 | | | 2,262 | | | | 2,316 | |
| Drivetime Auto Owner Trust, Series 2019-3, Class A, 2.55% 20228,16 | | | 40 | | | | 40 | |
| Drivetime Auto Owner Trust, Series 2019-2A, Class A, 2.85% 20228,16 | | | 36 | | | | 36 | |
| Drivetime Auto Owner Trust, Series 2019-3, Class B, 2.60% 20238,16 | | | 285 | | | | 287 | |
| Drivetime Auto Owner Trust, Series 2019-3, Class C, 2.74% 20258,16 | | | 110 | | | | 112 | |
| Exeter Automobile Receivables Trust, Series 2018-1A, Class C, 3.03% 20238,16 | | | 688 | | | | 690 | |
| FirstKey Homes Trust, Series 2020-SFR2, Class A, 1.266% 20378,16 | | | 13,474 | | | | 13,572 | |
| Ford Credit Auto Owner Trust, Series 2016-2, Class A, 2.03% 20278,16 | | | 3,900 | | | | 3,932 | |
| Ford Credit Auto Owner Trust, Series 2017-1, Class A, 2.62% 20288,16 | | | 4,330 | | | | 4,441 | |
| Ford Credit Auto Owner Trust, Series 2018-2, Class A, 3.47% 20308,16 | | | 13,095 | | | | 14,053 | |
| Ford Credit Auto Owner Trust, Series 2018-1, Class A, 3.52% 20308,16 | | | 9,756 | | | | 10,650 | |
| Ford Credit Auto Owner Trust, Series 2020-1, Class A, 2.04% 20318,16 | | | 8,861 | | | | 9,354 | |
| Ford Credit Auto Owner Trust, Series 2018-1, Class A, 3.19% 20318,16 | | | 11,965 | | | | 13,165 | |
| Ford Credit Auto Owner Trust, Series 2020-2, Class A, 1.06% 20338,16 | | | 12,376 | | | | 12,516 | |
| Ford Credit Floorplan Master Owner Trust, Series 2020-2, Class A, 1.06% 202716 | | | 10,000 | | | | 10,172 | |
| GCI Funding I LLC, Series 2020-1, Class A, 2.82% 20458,16 | | | 917 | | | | 922 | |
| GCI Funding I LLC, Series 2020-1, Class B, 3.81% 20458,16 | | | 369 | | | | 359 | |
| Global SC Finance II SRL, Series 2014-1A, Class A1, 3.19% 20298,16 | | | 159 | | | | 159 | |
| Global SC Finance V SRL, Series 2019-1A, Class B, 4.81% 20398,16 | | | 3,152 | | | | 3,169 | |
| Global SC Finance V SRL, Series 2020-1A, Class A, 2.17% 20408,16 | | | 13,337 | | | | 13,504 | |
| Global SC Finance VII SRL, Series 2020-2A, Class A, 2.26% 20408,16 | | | 16,701 | | | | 16,926 | |
| Global SC Finance VII SRL, Series 2020-2A, Class B, 3.32% 20408,16 | | | 691 | | | | 700 | |
| Hertz Vehicle Financing LLC, Rental Car Asset-Backed Notes, Series 2017-2A, Class A, 3.29% 20238,16 | | | 483 | | | | 484 | |
| Hertz Vehicle Financing LLC, Rental Car Asset-Backed Notes, Series 2018-1A, Class A, 3.29% 20248,16 | | | 746 | | | | 748 | |
| Hertz Vehicle Financing LLC, Rental Car Asset-Backed Notes, Series 2018-3A, Class A, 4.03% 20248,16 | | | 280 | | | | 281 | |
| Hertz Vehicle Financing LLC, Rental Car Asset-Backed Notes, Series 2019-3A, Class A, 2.67% 20258,16 | | | 730 | | | | 731 | |
| Honda Auto Receivables Owner Trust, Series 2019-2, Class A3, 2.52% 202316 | | | 2,815 | | | | 2,868 | |
| Palmer Square Loan Funding, CLO, Series 2020-4, Class A1, (3-month USD-LIBOR + 1.00%) 1.134% 20288,12,16 | | | 3,400 | | | | 3,404 | |
| Santander Drive Auto Receivables Trust, Series 2020-1, Class A2A, 2.07% 202316 | | | 380 | | | | 382 | |
| Santander Drive Auto Receivables Trust, Series 2020-1, Class A3, 2.03% 202416 | | | 444 | | | | 450 | |
| Santander Drive Auto Receivables Trust, Series 2020-1, Class B, 3.03% 202416 | | | 345 | | | | 357 | |
| Santander Drive Auto Receivables Trust, Series 2020-1, Class C, 4.11% 202516 | | | 1,000 | | | | 1,069 | |
| Symphony Ltd., CLO, Series 2013-12A, Class AR, (3-month USD-LIBOR + 1.03%) 1.267% 20258,12,16 | | | 2,976 | | | | 2,977 | |
| TAL Advantage V LLC, Series 2020-1A, Class A, 2.05% 20458,16 | | | 2,320 | | | | 2,348 | |
| TAL Advantage V LLC, Series 2020-1A, Class B, 3.29% 20458,16 | | | 260 | | | | 263 | |
| Textainer Marine Containers Ltd., Series 2020-2A, Class A, 2.10% 20458,16 | | | 3,648 | | | | 3,710 | |
| Toyota Auto Loan Extended Note Trust, Series 2019-1, Class A, 2.56% 20318,16 | | | 3,250 | | | | 3,474 | |
| Toyota Auto Loan Extended Note Trust, Series 2020-1, Class A, 1.35% 20338,16 | | | 889 | | | | 917 | |
| Triton Container Finance LLC, Series 2020-1A, Class A, 2.11% 20458,16 | | | 18,596 | | | | 18,875 | |
| Westlake Automobile Receivables Trust, Series 2019-2A, Class A2, 2.57% 20238,16 | | | 915 | | | | 919 | |
| Westlake Automobile Receivables Trust, Series 2019-2A, Class B, 2.62% 20248,16 | | | 870 | | | | 881 | |
| Westlake Automobile Receivables Trust, Series 2019-2A, Class C, 2.84% 20248,16 | | | 1,390 | | | | 1,419 | |
| World Financial Network Credit Card Master Note Trust, Series 2018-A, Class A, 3.07% 202416 | | | 7,000 | | | | 7,023 | |
| | | | | | | | 235,287 | |
| | | | | | | | | |
| Bonds & notes of governments & government agencies outside the U.S. 0.21% | | | | | | | | |
| CPPIB Capital Inc. 2.375% 20218 | | | 6,000 | | | | 6,009 | |
| CPPIB Capital Inc. 2.25% 20228 | | | 4,286 | | | | 4,377 | |
| CPPIB Capital Inc. 2.75% 20278 | | | 6,600 | | | | 7,436 | |
| KfW 2.125% 2022 | | | 375 | | | | 384 | |
| Manitoba (Province of) 3.05% 2024 | | | 2,600 | | | | 2,824 | |
| Morocco (Kingdom of) 3.00% 20328 | | | 3,000 | | | | 3,054 | |
| American Funds Insurance Series | 143 |
Asset Allocation Fund (continued)
| Bonds, notes & other debt instruments (continued) | Principal amount
(000) | | | Value
(000) | |
| Bonds & notes of governments & government agencies outside the U.S. (continued) | | | | | |
| Morocco (Kingdom of) 4.00% 20508 | | $ | 3,000 | | | $ | 3,103 | |
| Peru (Republic of) 1.862% 2032 | | | 2,525 | | | | 2,550 | |
| Peru (Republic of) 2.78% 2060 | | | 3,775 | | | | 3,817 | |
| Qatar (State of) 3.375% 20248 | | | 2,315 | | | | 2,511 | |
| Qatar (State of) 4.00% 20298 | | | 745 | | | | 885 | |
| Qatar (State of) 4.817% 20498 | | | 750 | | | | 1,025 | |
| Quebec (Province of) 2.375% 2022 | | | 5,057 | | | | 5,173 | |
| Quebec (Province of) 2.75% 2027 | | | 9,000 | | | | 10,077 | |
| Saudi Arabia (Kingdom of) 3.25% 20308 | | | 1,750 | | | | 1,933 | |
| Saudi Arabia (Kingdom of) 5.25% 20508 | | | 1,000 | | | | 1,366 | |
| United Mexican States 2.659% 2031 | | | 2,703 | | | | 2,773 | |
| United Mexican States 3.771% 2061 | | | 1,528 | | | | 1,595 | |
| | | | | | | | 60,892 | |
| | | | | | | | | |
| Federal agency bonds & notes 0.13% | | | | | | | | |
| Fannie Mae 1.875% 2026 | | | 13,000 | | | | 14,062 | |
| Fannie Mae 0.875% 2030 | | | 23,958 | | | | 23,506 | |
| | | | | | | | 37,568 | |
| | | | | | | | | |
| Municipals 0.11% | | | | | | | | |
| California 0.01% | | | | | | | | |
| Regents of the University of California, General Rev. Bonds, Series 2020-BG, 1.316% 2027 | | | 2,285 | | | | 2,323 | |
| Regents of the University of California, General Rev. Bonds, Series 2020-BG, 1.614% 2030 | | | 1,340 | | | | 1,355 | |
| | | | | | | | 3,678 | |
| | | | | | | | | |
| Connecticut 0.00% | | | | | | | | |
| Housing Fin. Auth., Housing Mortgage Fin. Program Bonds, Series 2014-A-1, 4.00% 2044 | | | 25 | | | | 26 | |
| Housing Fin. Auth., Housing Mortgage Fin. Program Bonds, Series 2014-C-1, 4.00% 2044 | | | 35 | | | | 37 | |
| | | | | | | | 63 | |
| | | | | | | | | |
| Florida 0.04% | | | | | | | | |
| Board of Administration Fin. Corp., Rev. Bonds, Series 2020-A, 1.705% 2027 | | | 5,335 | | | | 5,541 | |
| Board of Administration Fin. Corp., Rev. Bonds, Series 2020-A, 2.154% 2030 | | | 5,365 | | | | 5,650 | |
| | | | | | | | 11,191 | |
| | | | | | | | | |
| Illinois 0.02% | | | | | | | | |
| G.O. Bonds, Pension Funding Series 2003, Assured Guaranty Municipal insured, 5.10% 2033 | | | 4,125 | | | | 4,757 | |
| | | | | | | | | |
| Maryland 0.00% | | | | | | | | |
| Community Dev. Administration, Dept. of Housing and Community Dev., Residential Rev. Ref. Bonds, Series 2014-E, 2.857% 2040 | | | 40 | | | | 40 | |
| | | | | | | | | |
| Minnesota 0.00% | | | | | | | | |
| Housing Fin. Agcy., Residential Housing Fin. Bonds, Series 2014-A, 4.00% 2038 | | | 70 | | | | 74 | |
| | | | | | | | | |
| Nebraska 0.00% | | | | | | | | |
| Investment Fin. Auth., Single Family Housing Rev. Bonds, Series 2013-A, 3.00% 2043 | | | 15 | | | | 15 | |
| | | | | | | | | |
| South Carolina 0.04% | | | | | | | | |
| Housing Fin. Auth., Mortgage Rev. Ref. Bonds, Series 2014, AMT, 4.00% 2041 | | | 20 | | | | 21 | |
| Public Service Auth., Rev. Obligations (Santee Cooper), Series 2013-E, 5.00% 2048 | | | 20 | | | | 22 | |
| Public Service Auth., Rev. Obligations (Santee Cooper), Series 2014-A, 5.50% 2054 | | | 1,350 | | | | 1,552 | |
| 144 | American Funds Insurance Series |
Asset Allocation Fund (continued)
| Bonds, notes & other debt instruments (continued) | Principal amount
(000) | | | Value
(000) | |
| Municipals (continued) | | | | | | | | |
| South Carolina (continued) | | | | | | | | |
| Public Service Auth., Rev. Obligations (Santee Cooper), Series 2015-A, 5.00% 2050 | | $ | 1,390 | | | $ | 1,606 | |
| Public Service Auth., Rev. Obligations (Santee Cooper), Series 2015-A, 5.00% 2055 | | | 2,955 | | | | 3,408 | |
| Public Service Auth., Rev. Obligations (Santee Cooper), Series 2015-E, 5.25% 2055 | | | 3,020 | | | | 3,572 | |
| Public Service Auth., Rev. Obligations (Santee Cooper), Series 2016-B, 5.00% 2035 | | | 410 | | | | 502 | |
| Public Service Auth., Rev. Obligations (Santee Cooper), Series 2016-B, 5.00% 2036 | | | 1,685 | | | | 2,058 | |
| Public Service Auth., Rev. Ref. Obligations (Santee Cooper), Series 2016-C, 5.00% 2035 | | | 650 | | | | 796 | |
| | | | | | | | 13,537 | |
| South Dakota 0.00% | | | | | | | | |
| Housing Dev. Auth., Homeownership Mortgage Bonds, Series 2014-F, 4.00% 2034 | | | 10 | | | | 10 | |
| | | | | | | | | |
| Tennessee 0.00% | | | | | | | | |
| Housing Dev. Agcy., Residential Fin. Program Bonds, Series 2013-2-A, AMT, 4.00% 2043 | | | 15 | | | | 16 | |
| | | | | | | | | |
| Total municipals | | | | | | | 33,381 | |
| | | | | | | | | |
| Total bonds, notes & other debt instruments (cost: $8,502,239,000) | | | | | | | 8,931,745 | |
| | | | | | | | | |
| Short-term securities 7.71% | | Shares | | | | | |
| Money market investments 7.71% | | | | | | | | |
| Capital Group Central Cash Fund 0.12%4,18 | | | 22,734,631 | | | | 2,273,691 | |
| Goldman Sachs Financial Square Government Fund, Institutional Shares 0.02%18,19 | | | 12,643,336 | | | | 12,643 | |
| | | | | | | | | |
| Total short-term securities (cost: $2,285,981,000) | | | | | | | 2,286,334 | |
| Total investment securities 104.10% (cost: $22,172,583,000) | | | | | | | 30,874,255 | |
| Other assets less liabilities (4.10)% | | | | | | | (1,216,604 | ) |
| | | | | | | | | |
| Net assets 100.00% | | | | | | $ | 29,657,651 | |
| American Funds Insurance Series | 145 |
Asset Allocation Fund (continued)
Futures contracts
| Contracts | | Type | | Number of
contracts | | Expiration | | Notional
amount
(000) | 20
| Value at
12/31/2020
(000) | 21
| Unrealized
appreciation
(depreciation)
at 12/31/2020 (000) | |
| 2 Year U.S. Treasury Note Futures | | Long | | 1,726 | | April 2021 | | $345,200 | | $381,405 | | | $ | 362 | |
| 5 Year U.S. Treasury Note Futures | | Long | | 485 | | April 2021 | | 48,500 | | 61,190 | | | | 128 | |
| 10 Year U.S. Treasury Note Futures | | Long | | 116 | | March 2021 | | 11,600 | | 16,017 | | | | 27 | |
| 10 Year Ultra U.S. Treasury Note Futures | | Short | | 3,275 | | March 2021 | | (327,500) | | (512,077) | | | | 1,093 | |
| 20 Year U.S. Treasury Bond Futures | | Long | | 1,185 | | March 2021 | | 118,500 | | 205,227 | | | | (1,792 | ) |
| 30 Year Ultra U.S. Treasury Bond Futures | | Long | | 494 | | March 2021 | | 49,400 | | 105,500 | | | | (590 | ) |
| | | | | | | | | | | | | | $ | (772 | ) |
| Swap contracts | | | | | | | | | | | | | | | | |
| | | | | | | | | | | | | | | | | |
| Interest rate swaps | | | | | | | | | | | | | | |
| Receive | | Pay | | Expiration
date | | Notional
(000) | | | Value at
12/31/2020
(000) | | Upfront
premium
paid
(000) | | Unrealized
appreciation
at 12/31/2020
(000) | |
| U.S. EFFR | | 0.0795% | | 7/13/2025 | | $ | 125,400 | | | | $796 | | | $ | — | | | $ | 796 | |
| | | | | | | | | | | | | | | | | | | | | |
| Credit default swaps | | | | | | | | | | | | | | | | | | |
| | | | | | | | | | | | | | | | | | | | | |
| Centrally cleared credit default swaps on credit indices — sell protection | | | | | | | |
| | | | | | | | | | | | | | | | | | | | | |
Receive/
Payment frequency | | Pay | | Expiration
date | | Notional
(000) | | | Value at
12/31/2020
(000) | | Upfront
premium
paid
(000) | | Unrealized
appreciation
at 12/31/2020
(000) | |
| 1.00%/Quarterly | | CDX.NA.IG.35 | | 12/20/2025 | | | $100 | | | | $2 | | | $ | 2 | | | $ | — | 7 |
Investments in affiliates4
| | | Value of
affiliates at
1/1/2020
(000) | | | Additions
(000) | | | Reductions
(000) | | | Net
realized
gain
(000) | | | Net
unrealized
appreciation
(depreciation)
(000) | | | Value of
affiliates at
12/31/2020
(000) | | | Dividend
income
(000) | |
| Common stocks 0.55% | | | | | | | | | | | | | | | | | | | | | | | | | | | | |
| Information technology 0.00% | | | | | | | | | | | | | | | | | | | | | | | | | | | | |
| MKS Instruments, Inc.22 | | $ | 308,028 | | | $ | 14,580 | | | $ | 87,945 | | | $ | 13,498 | | | $ | 82,829 | | | $ | — | | | $ | 2,040 | |
| Health care 0.04% | | | | | | | | | | | | | | | | | | | | | | | | | | | | |
| NuCana PLC (ADR)2 | | | 7,257 | | | | 8,574 | | | | 1 | | | | — | | | | (2,463 | ) | | | 13,367 | | | | — | |
| Consumer discretionary 0.51% | | | | | | | | | | | | | | | | | | | | | | | | | | | | |
| Kontoor Brands, Inc. | | | 136,467 | | | | 9,313 | | | | — | | | | — | | | | 4,292 | | | | 150,072 | | | | 3,300 | |
| Total common stocks | | | | | | | | | | | | | | | | | | | | | | | 163,439 | | | | | |
| Short-term securities 7.67% | | | | | | | | | | | | | | | | | | | | | | | | | | | | |
| Money market investments 7.67% | | | | | | | | | | | | | | | | | | | | | | | | | | | | |
| Capital Group Central Cash Fund 0.12%18 | | | 1,584,844 | | | | 5,613,428 | | | | 4,925,712 | | | | 1,347 | | | | (216 | ) | | | 2,273,691 | | | | 10,928 | |
| Total 8.22% | | | | | | | | | | | | | | $ | 14,845 | | | $ | 84,442 | | | $ | 2,437,130 | | | $ | 16,268 | |
| 146 | American Funds Insurance Series |
Asset Allocation Fund (continued)
| 1 | Valued under fair value procedures adopted by authority of the board of trustees. The total value of all such securities was $1,524,494,000, which represented 5.14% of the net assets of the fund. This amount includes $1,490,120,000 related to certain securities trading outside the U.S. whose values were adjusted as a result of significant market movements following the close of local trading. |
| 2 | Security did not produce income during the last 12 months. |
| 3 | All or a portion of this security was on loan. The total value of all such securities was $13,741,000, which represented .05% of the net assets of the fund. Refer to Note 5 for more information on securities lending. |
| 4 | Affiliate of the fund or part of the same group of investment companies as the fund, in each case as defined under the Investment Company Act of 1940. |
| 5 | Value determined using significant unobservable inputs. |
| 6 | Acquired through a private placement transaction exempt from registration under the Securities Act of 1933. May be subject to legal or contractual restrictions on resale. Further details on these holdings appear below. |
| 7 | Amount less than one thousand. |
| 8 | Acquired in a transaction exempt from registration under Rule 144A of the Securities Act of 1933. May be resold in the U.S. in transactions exempt from registration, normally to qualified institutional buyers. The total value of all such securities was $1,283,591,000, which represented 4.33% of the net assets of the fund. |
| 9 | Step bond; coupon rate may change at a later date. |
| 10 | Loan participations and assignments; may be subject to legal or contractual restrictions on resale. The total value of all such loans was $33,087,000, which represented .11% of the net assets of the fund. |
| 11 | Payment in kind; the issuer has the option of paying additional securities in lieu of cash. Most recent payment was 100% cash unless otherwise noted. |
| 12 | Coupon rate may change periodically. Reference rate and spread are as of the most recent information available. Some coupon rates are determined by the issuer or agent based on current market conditions; therefore, the reference rate and spread are not available. |
| 13 | Scheduled interest and/or principal payment was not received. |
| 14 | All or a portion of this security was pledged as collateral. The total value of pledged collateral was $8,238,000, which represented .03% of the net assets of the fund. |
| 15 | Index-linked bond whose principal amount moves with a government price index. |
| 16 | Principal payments may be made periodically. Therefore, the effective maturity date may be earlier than the stated maturity date. |
| 17 | Purchased on a TBA basis. |
| 18 | Rate represents the seven-day yield at 12/31/2020. |
| 19 | Security purchased with cash collateral from securities on loan. Refer to Note 5 for more information on securities lending. |
| 20 | Notional amount is calculated based on the number of contracts and notional contract size. |
| 21 | Value is calculated based on the notional amount and current market price. |
| 22 | Unaffiliated issuer at 12/31/2020. |
| Private placement securities | | Acquisition
date(s) | | Cost
(000) | | | Value
(000) | | | Percent
of net
assets | |
| Rotech Healthcare Inc. | | 9/26/2013 | | $ | 6,949 | | | $ | 13,074 | | | | .04 | % |
| Advanz Pharma Corp. Ltd. | | 8/31/2018-9/4/2018 | | | 2,219 | | | | 773 | | | | .01 | |
| Total private placement securities | | | | $ | 9,168 | | | $ | 13,847 | | | | .05 | % |
Key to abbreviations and symbol
ADR = American Depositary Receipts
Agcy. = Agency
AMT = Alternative Minimum Tax
Auth. = Authority
CLO = Collateralized Loan Obligations
Dept. = Department
Dev. = Development
EFFR = Effective Federal Funds Rate
Fin. = Finance
G.O. = General Obligation
GDR = Global Depositary Receipts
ICE = Intercontinental Exchange, Inc.
LIBOR = London Interbank Offered Rate
Ref. = Refunding
Rev. = Revenue
SOFR = Secured Overnight Financing Rate
TBA = To-be-announced
USD/$ = U.S. dollars
See notes to financial statements.
| American Funds Insurance Series | 147 |
Global Balanced Fund
Investment portfolio December 31, 2020
| Common stocks 58.02% | | Shares | | | Value
(000) | |
| Information technology 14.67% | | | | | | | | |
| Taiwan Semiconductor Manufacturing Company, Ltd.1 | | | 772,000 | | | $ | 14,499 | |
| Microsoft Corp. | | | 51,361 | | | | 11,423 | |
| ASML Holding NV1 | | | 21,414 | | | | 10,349 | |
| Broadcom Inc. | | | 19,688 | | | | 8,620 | |
| PagSeguro Digital Ltd., Class A2 | | | 98,303 | | | | 5,591 | |
| Tokyo Electron Ltd.1 | | | 12,300 | | | | 4,588 | |
| Keyence Corp.1 | | | 3,900 | | | | 2,195 | |
| Edenred SA1 | | | 38,207 | | | | 2,168 | |
| Visa Inc., Class A | | | 8,945 | | | | 1,957 | |
| Mastercard Inc., Class A | | | 5,259 | | | | 1,877 | |
| Amphenol Corp., Class A | | | 13,928 | | | | 1,821 | |
| Murata Manufacturing Co., Ltd.1 | | | 18,800 | | | | 1,693 | |
| | | | | | | | 66,781 | |
| | | | | | | | | |
| Health care 8.83% | | | | | | | | |
| AstraZeneca PLC1 | | | 68,312 | | | | 6,825 | |
| UnitedHealth Group Inc. | | | 14,645 | | | | 5,136 | |
| Humana Inc. | | | 8,875 | | | | 3,641 | |
| Pfizer Inc. | | | 88,181 | | | | 3,246 | |
| Thermo Fisher Scientific Inc. | | | 6,032 | | | | 2,810 | |
| Merck & Co., Inc. | | | 33,487 | | | | 2,739 | |
| Coloplast A/S, Class B1 | | | 17,427 | | | | 2,662 | |
| Mettler-Toledo International Inc.2 | | | 2,089 | | | | 2,381 | |
| Fisher & Paykel Healthcare Corp. Ltd.1 | | | 87,349 | | | | 2,074 | |
| Novartis AG1 | | | 20,845 | | | | 1,969 | |
| Cigna Corp. | | | 6,958 | | | | 1,449 | |
| Carl Zeiss Meditec AG, non-registered shares1 | | | 10,029 | | | | 1,334 | |
| Viatris Inc.2 | | | 63,052 | | | | 1,182 | |
| Gilead Sciences, Inc. | | | 16,639 | | | | 969 | |
| Koninklijke Philips NV (EUR denominated)1,2 | | | 16,938 | | | | 906 | |
| Bayer AG1 | | | 14,514 | | | | 853 | |
| | | | | | | | 40,176 | |
| | | | | | | | | |
| Financials 7.28% | | | | | | | | |
| JPMorgan Chase & Co. | | | 53,654 | | | | 6,818 | |
| Zurich Insurance Group AG1 | | | 13,094 | | | | 5,550 | |
| Berkshire Hathaway Inc., Class A2 | | | 11 | | | | 3,826 | |
| BlackRock, Inc. | | | 4,013 | | | | 2,895 | |
| AIA Group Ltd.1 | | | 206,600 | | | | 2,545 | |
| Hong Kong Exchanges and Clearing Ltd.1 | | | 43,100 | | | | 2,370 | |
| Tokio Marine Holdings, Inc.1 | | | 40,000 | | | | 2,072 | |
| S&P Global Inc. | | | 5,890 | | | | 1,936 | |
| B3 SA - Brasil, Bolsa, Balcao | | | 154,305 | | | | 1,841 | |
| Deutsche Boerse AG1 | | | 10,789 | | | | 1,832 | |
| FinecoBank SpA1,2 | | | 89,681 | | | | 1,464 | |
| | | | | | | | 33,149 | |
| | | | | | | | | |
| Consumer staples 6.32% | | | | | | | | |
| Nestlé SA1 | | | 49,011 | | | | 5,770 | |
| Philip Morris International Inc. | | | 62,968 | | | | 5,213 | |
| Kweichow Moutai Co., Ltd., Class A1 | | | 12,400 | | | | 3,790 | |
| British American Tobacco PLC1 | | | 88,645 | | | | 3,297 | |
| British American Tobacco PLC (ADR) | | | 4,587 | | | | 172 | |
| Altria Group, Inc. | | | 81,153 | | | | 3,327 | |
| Keurig Dr Pepper Inc. | | | 98,392 | | | | 3,149 | |
| Budweiser Brewing Co. APAC Ltd.1 | | | 367,900 | | | | 1,216 | |
| Coca-Cola European Partners PLC | | | 20,787 | | | | 1,036 | |
| Coca-Cola Company | | | 17,456 | | | | 957 | |
| Procter & Gamble Company | | | 5,916 | | | | 823 | |
| | | | | | | | 28,750 | |
| 148 | American Funds Insurance Series |
Global Balanced Fund (continued)
| Common stocks (continued) | | Shares | | | Value
(000) | |
| Consumer discretionary 5.27% | | | | | | | | |
| LVMH Moët Hennessy-Louis Vuitton SE1 | | | 7,305 | | | $ | 4,564 | |
| Home Depot, Inc. | | | 14,441 | | | | 3,836 | |
| Amazon.com, Inc.2 | | | 905 | | | | 2,947 | |
| Ocado Group PLC1,2 | | | 91,873 | | | | 2,879 | |
| Darden Restaurants, Inc. | | | 17,400 | | | | 2,073 | |
| Domino’s Pizza, Inc. | | | 4,733 | | | | 1,815 | |
| Alibaba Group Holding Ltd.1,2 | | | 57,300 | | | | 1,674 | |
| General Motors Company | | | 34,796 | | | | 1,449 | |
| Ferrari NV1 | | | 5,608 | | | | 1,297 | |
| Peugeot SA1,2 | | | 31,465 | | | | 861 | |
| Wynn Resorts, Ltd. | | | 5,258 | | | | 593 | |
| | | | | | | | 23,988 | |
| | | | | | | | | |
| Industrials 4.99% | | | | | | | | |
| Airbus SE, non-registered shares1,2 | | | 25,944 | | | | 2,850 | |
| SITC International Holdings Co. Ltd.1 | | | 1,109,000 | | | | 2,401 | |
| SMC Corp.1 | | | 3,700 | | | | 2,260 | |
| Lockheed Martin Corp. | | | 6,285 | | | | 2,231 | |
| Spirax-Sarco Engineering PLC1 | | | 12,695 | | | | 1,962 | |
| MTU Aero Engines AG1 | | | 7,308 | | | | 1,904 | |
| Watsco, Inc. | | | 6,594 | | | | 1,494 | |
| CSX Corp. | | | 16,155 | | | | 1,466 | |
| BAE Systems PLC1 | | | 201,878 | | | | 1,350 | |
| Honeywell International Inc. | | | 5,705 | | | | 1,214 | |
| United Parcel Service, Inc., Class B | | | 6,356 | | | | 1,070 | |
| Union Pacific Corp. | | | 4,976 | | | | 1,036 | |
| Nidec Corp.1 | | | 7,400 | | | | 932 | |
| Boeing Company | | | 2,458 | | | | 526 | |
| | | | | | | | 22,696 | |
| | | | | | | | | |
| Communication services 2.86% | | | | | | | | |
| SoftBank Corp.1 | | | 295,200 | | | | 3,701 | |
| Alphabet Inc., Class C2 | | | 1,708 | | | | 2,992 | |
| Nintendo Co., Ltd.1 | | | 4,500 | | | | 2,872 | |
| Verizon Communications Inc. | | | 46,262 | | | | 2,718 | |
| América Móvil, SAB de CV, Series L (ADR) | | | 49,856 | | | | 725 | |
| | | | | | | | 13,008 | |
| | | | | | | | | |
| Materials 2.86% | | | | | | | | |
| Givaudan SA1 | | | 657 | | | | 2,768 | |
| Vale SA, ordinary nominative | | | 138,510 | | | | 2,332 | |
| Croda International PLC1 | | | 24,263 | | | | 2,192 | |
| LyondellBasell Industries NV | | | 17,400 | | | | 1,595 | |
| Akzo Nobel NV1 | | | 14,721 | | | | 1,581 | |
| Koninklijke DSM NV1 | | | 8,699 | | | | 1,499 | |
| Rio Tinto PLC1 | | | 13,862 | | | | 1,037 | |
| | | | | | | | 13,004 | |
| | | | | | | | | |
| Real estate 2.69% | | | | | | | | |
| Crown Castle International Corp. REIT | | | 18,510 | | | | 2,947 | |
| Equinix, Inc. REIT | | | 3,430 | | | | 2,450 | |
| Longfor Group Holdings Ltd.1 | | | 374,000 | | | | 2,196 | |
| Gaming and Leisure Properties, Inc. REIT | | | 43,213 | | | | 1,832 | |
| American Tower Corp. REIT | | | 7,855 | | | | 1,763 | |
| Shimao Group Holdings Ltd.1 | | | 334,500 | | | | 1,069 | |
| Shimao Services Holdings Ltd.1,2 | | | 4,271 | | | | 7 | |
| | | | | | | | 12,264 | |
| American Funds Insurance Series | 149 |
Global Balanced Fund (continued)
| Common stocks (continued) | | Shares | | | Value
(000) | |
| Energy 1.25% | | | | | | | | |
| TC Energy Corp. (CAD denominated) | | | 51,157 | | | $ | 2,080 | |
| Baker Hughes Co., Class A | | | 78,260 | | | | 1,632 | |
| Chevron Corp. | | | 13,871 | | | | 1,171 | |
| Petróleo Brasileiro SA (Petrobras), ordinary nominative (ADR) | | | 73,448 | | | | 825 | |
| | | | | | | | 5,708 | |
| | | | | | | | | |
| Utilities 1.00% | | | | | | | | |
| Enel SpA1 | | | 365,980 | | | | 3,696 | |
| Brookfield Infrastructure Partners LP | | | 17,213 | | | | 852 | |
| | | | | | | | 4,548 | |
| | | | | | | | | |
| Total common stocks (cost: $171,327,000) | | | | | | | 264,072 | |
| | | | | | | | | |
| | | | | | | | | |
| Preferred securities 0.45% | | | | | | | | |
| Information technology 0.45% | | | | | | | | |
| Samsung Electronics Co., Ltd., nonvoting preferred shares1 | | | 30,276 | | | | 2,055 | |
| | | | | | | | | |
| Total preferred securities (cost: $1,560,000) | | | | | | | 2,055 | |
| | | | | | | | | |
| Bonds, notes & other debt instruments 31.89% | | Principal amount
(000) | | | | | |
| Bonds & notes of governments & government agencies outside the U.S. 14.75% | | | | | | | | |
| Abu Dhabi (Emirate of) 2.50% 20223 | | $ | 200 | | | | 207 | |
| Abu Dhabi (Emirate of) 0.75% 20233 | | | 275 | | | | 276 | |
| Abu Dhabi (Emirate of) 3.125% 20273 | | | 200 | | | | 225 | |
| Agricultural Development Bank of China 3.75% 2029 | | CNY | 550 | | | | 85 | |
| Agricultural Development Bank of China 2.96% 2030 | | | 4,350 | | | | 630 | |
| Australia (Commonwealth of), Series 152, 2.75% 2028 | | A$ | 1,175 | | | | 1,046 | |
| Australia (Commonwealth of), Series 162, 1.75% 2051 | | | 400 | | | | 294 | |
| Bermuda 2.375% 20303 | | $ | 200 | | | | 210 | |
| Brazil (Federative Republic of) 0% 2021 | | BRL | 3,000 | | | | 572 | |
| Brazil (Federative Republic of) 6.00% 20244 | | | 2,395 | | | | 532 | |
| Brazil (Federative Republic of) 10.00% 2027 | | | 1,200 | | | | 273 | |
| Canada 2.25% 2025 | | C$ | 1,400 | | | | 1,191 | |
| Canada 2.25% 2029 | | | 1,440 | | | | 1,286 | |
| Chile (Republic of) 4.50% 2026 | | CLP | 235,000 | | | | 379 | |
| China (People’s Republic of), Series 1916, 3.12% 2026 | | CNY | 6,650 | | | | 1,017 | |
| China (People’s Republic of), Series INBK, 2.85% 2027 | | | 6,000 | | | | 902 | |
| China (People’s Republic of), Series 1906, 3.29% 2029 | | | 5,500 | | | | 845 | |
| China (People’s Republic of), Series 1910, 3.86% 2049 | | | 5,010 | | | | 778 | |
| China (People’s Republic of), Series INBK, 3.39% 2050 | | | 300 | | | | 43 | |
| China Development Bank Corp., Series 1805, 4.04% 2028 | | | 5,000 | | | | 789 | |
| China Development Bank Corp., Series 1905, 3.48% 2029 | | | 11,780 | | | | 1,785 | |
| Colombia (Republic of) 5.75% 2027 | | COP | 2,154,200 | | | | 669 | |
| Colombia (Republic of), Series B, 7.75% 2030 | | | 453,000 | | | | 156 | |
| French Republic O.A.T. 3.25% 2045 | | € | 160 | | | | 338 | |
| Germany (Federal Republic of) 0% 2025 | | | 910 | | | | 1,152 | |
| Germany (Federal Republic of) 0.50% 2027 | | | 675 | | | | 893 | |
| Germany (Federal Republic of) 0.25% 2029 | | | 830 | | | | 1,091 | |
| Germany (Federal Republic of) 0% 2030 | | | 705 | | | | 910 | |
| Germany (Federal Republic of) 0% 2030 | | | 400 | | | | 516 | |
| Germany (Federal Republic of) 0% 2050 | | | 610 | | | | 782 | |
| Greece (Hellenic Republic of) 3.375% 2025 | | | 475 | | | | 659 | |
| Greece (Hellenic Republic of) 3.75% 2028 | | | 280 | | | | 421 | |
| Greece (Hellenic Republic of) 3.875% 2029 | | | 270 | | | | 418 | |
| Indonesia (Republic of) 3.75% 2022 | | $ | 410 | | | | 427 | |
| Indonesia (Republic of) 3.85% 20273 | | | 400 | | | | 458 | |
| Indonesia (Republic of), Series 78, 8.25% 2029 | | IDR | 3,977,000 | | | | 327 | |
| Indonesia (Republic of), Series 82, 7.00% 2030 | | | 1,000,000 | | | | 77 | |
| 150 | American Funds Insurance Series |
Global Balanced Fund (continued)
| Bonds, notes & other debt instruments (continued) | | Principal amount
(000) | | | Value
(000) | |
| Bonds & notes of governments & government agencies outside the U.S. (continued) | | | |
| Indonesia (Republic of), Series 87, 6.50% 2031 | | IDR | 2,010,000 | | | $ | 150 | |
| Indonesia (Republic of), Series 74, 7.50% 2032 | | | 597,000 | | | | 46 | |
| Indonesia (Republic of), Series 65, 6.625% 2033 | | | 1,493,000 | | | | 109 | |
| Israel (State of) 2.875% 2024 | | € | 200 | | | | 267 | |
| Israel (State of) 1.50% 2027 | | | 100 | | | | 133 | |
| Israel (State of) 2.00% 2027 | | ILS | 2,600 | | | | 888 | |
| Israel (State of) 5.50% 2042 | | | 700 | | | | 373 | |
| Italy (Republic of) 0.10% 20234 | | € | 772 | | | | 965 | |
| Italy (Republic of) 0.95% 2027 | | | 1,025 | | | | 1,315 | |
| Japan, Series 134, 0.10% 2022 | | ¥ | 31,900 | | | | 310 | |
| Japan, Series 17, 0.10% 20234 | | | 10,450 | | | | 101 | |
| Japan, Series 19, 0.10% 20244 | | | 30,330 | | | | 294 | |
| Japan, Series 18, 0.10% 20244 | | | 20,780 | | | | 202 | |
| Japan, Series 145, 0.10% 2025 | | | 110,200 | | | | 1,078 | |
| Japan, Series 21, 0.10% 20264 | | | 40,483 | | | | 394 | |
| Japan, Series 346, 0.10% 2027 | | | 173,250 | | | | 1,699 | |
| Japan, Series 22, 0.10% 20274 | | | 25,376 | | | | 247 | |
| Japan, Series 23, 0.10% 20284 | | | 66,293 | | | | 644 | |
| Japan, Series 24, 0.10% 20294 | | | 213,289 | | | | 2,076 | |
| Japan, Series 356, 0.10% 2029 | | | 112,800 | | | | 1,105 | |
| Japan, Series 360, 0.10% 2030 | | | 415,150 | | | | 4,052 | |
| Japan, Series 152, 1.20% 2035 | | | 212,000 | | | | 2,339 | |
| Japan, Series 42, 1.70% 2044 | | | 94,100 | | | | 1,156 | |
| Kuwait (State of) 2.75% 20223 | | $ | 200 | | | | 206 | |
| Malaysia (Federation of), Series 0119, 3.906% 2026 | | MYR | 1,380 | | | | 372 | |
| Malaysia (Federation of), Series 0417, 3.899% 2027 | | | 1,300 | | | | 355 | |
| Malaysia (Federation of), Series 0418, 4.893% 2038 | | | 2,800 | | | | 822 | |
| Malaysia (Federation of), Series 0519, 3.757% 2040 | | | 1,650 | | | | 431 | |
| Malaysia (Federation of), Series 0216, 4.736% 2046 | | | 609 | | | | 173 | |
| Morocco (Kingdom of) 4.25% 2022 | | $ | 200 | | | | 211 | |
| Morocco (Kingdom of) 3.50% 2024 | | € | 100 | | | | 133 | |
| Morocco (Kingdom of) 1.375% 2026 | | | 130 | | | �� | 160 | |
| Morocco (Kingdom of) 1.50% 2031 | | | 125 | | | | 149 | |
| Morocco (Kingdom of) 1.50% 2031 | | | 100 | | | | 119 | |
| Morocco (Kingdom of) 3.00% 20323 | | $ | 200 | | | | 204 | |
| National Highways Authority of India 7.17% 2021 | | INR | 30,000 | | | | 424 | |
| Netherlands (Kingdom of the) 0% 2027 | | € | 810 | | | | 1,029 | |
| Netherlands (Kingdom of the) 5.50% 2028 | | | 100 | | | | 176 | |
| Norway (Kingdom of) 1.75% 2025 | | NKr | 4,000 | | | | 489 | |
| Nova Scotia (Province of) 3.15% 2051 | | C$ | 170 | | | | 165 | |
| Panama (Republic of) 3.16% 2030 | | $ | 265 | | | | 294 | |
| Peru (Republic of) 2.392% 2026 | | | 90 | | | | 96 | |
| Peru (Republic of) 6.15% 2032 | | PEN | 600 | | | | 202 | |
| Peru (Republic of) 5.625% 2050 | | $ | 20 | | | | 32 | |
| Philippines (Republic of) 1.648% 2031 | | | 200 | | | | 203 | |
| Qatar (State of) 3.40% 20253 | | | 200 | | | | 221 | |
| Qatar (State of) 4.50% 20283 | | | 500 | | | | 607 | |
| Quebec (Province of) 1.90% 2030 | | C$ | 700 | | | | 581 | |
| Romania 3.624% 2030 | | € | 692 | | | | 1,011 | |
| Romania 3.624% 2030 | | | 225 | | | | 329 | |
| Romania 2.00% 2032 | | | 100 | | | | 128 | |
| Romania 3.50% 2034 | | | 65 | | | | 95 | |
| Romania 3.875% 2035 | | | 170 | | | | 255 | |
| Romania 3.375% 2038 | | | 250 | | | | 352 | |
| Romania 4.625% 2049 | | | 184 | | | | 304 | |
| Romania 4.625% 2049 | | | 25 | | | | 41 | |
| Romania 3.375% 2050 | | | 73 | | | | 103 | |
| Russian Federation 7.00% 2023 | | RUB | 16,600 | | | | 237 | |
| Russian Federation 2.875% 2025 | | € | 200 | | | | 270 | |
| Russian Federation 2.875% 2025 | | | 100 | | | | 135 | |
| Russian Federation 4.25% 2027 | | $ | 200 | | | | 229 | |
| American Funds Insurance Series | 151 |
Global Balanced Fund (continued)
| Bonds, notes & other debt instruments (continued) | | Principal amount
(000) | | | Value
(000) | |
| Bonds & notes of governments & government agencies outside the U.S. (continued) | | | |
| Russian Federation 6.90% 2029 | | RUB | 25,250 | | | $ | 367 | |
| Russian Federation 7.65% 2030 | | | 6,000 | | | | 92 | |
| Russian Federation 8.50% 2031 | | | 5,530 | | | | 90 | |
| Russian Federation 7.70% 2033 | | | 23,030 | | | | 351 | |
| Russian Federation 7.25% 2034 | | | 8,140 | | | | 120 | |
| Saudi Arabia (Kingdom of) 2.894% 20223 | | $ | 200 | | | | 206 | |
| Saudi Arabia (Kingdom of) 3.625% 20283 | | | 200 | | | | 224 | |
| Serbia (Republic of) 3.125% 2027 | | € | 915 | | | | 1,259 | |
| Singapore (Republic of) 2.625% 2028 | | S$ | 275 | | | | 236 | |
| Singapore (Republic of) 2.875% 2029 | | | 155 | | | | 137 | |
| Singapore (Republic of) 2.875% 2030 | | | 165 | | | | 148 | |
| South Africa (Republic of), Series R-214, 6.50% 2041 | | ZAR | 2,200 | | | | 98 | |
| South Africa (Republic of), Series R-2048, 8.75% 2048 | | | 6,300 | | | | 353 | |
| South Korea (Republic of), Series 2209, 2.00% 2022 | | KRW | 560,000 | | | | 525 | |
| South Korea (Republic of), Series 2503, 1.50% 2025 | | | 639,700 | | | | 595 | |
| Sri Lanka (Democratic Socialist Republic of) 6.25% 2021 | | $ | 250 | | | | 218 | |
| Thailand (Kingdom of) 2.125% 2026 | | THB | 16,450 | | | | 594 | |
| Ukraine 6.75% 2026 | | € | 150 | | | | 202 | |
| United Kingdom 1.75% 2022 | | £ | 280 | | | | 395 | |
| United Kingdom 2.75% 2024 | | | 50 | | | | 76 | |
| United Kingdom 4.75% 2030 | | | 460 | | | | 911 | |
| United Kingdom 4.25% 2032 | | | 280 | | | | 553 | |
| United Kingdom 4.50% 2034 | | | 225 | | | | 476 | |
| United Kingdom 0.625% 2035 | | | 600 | | | | 833 | |
| United Kingdom 3.25% 2044 | | | 250 | | | | 526 | |
| United Mexican States 0.70% 2021 | | ¥ | 100,000 | | | | 968 | |
| United Mexican States, Series M, 7.50% 2027 | | MXN | 25,740 | | | | 1,473 | |
| United Mexican States, Series M20, 8.50% 2029 | | | 11,500 | | | | 705 | |
| United Mexican States 2.659% 2031 | | $ | 216 | | | | 222 | |
| United Mexican States, Series M, 8.00% 2047 | | MXN | 4,000 | | | | 237 | |
| | | | | | | | 67,135 | |
| | | | | | | | | |
| U.S. Treasury bonds & notes 10.85% | | | | | | | | |
| U.S. Treasury 10.36% | | | | | | | | |
| U.S. Treasury 0.125% 2022 | | $ | 8,318 | | | | 8,319 | |
| U.S. Treasury 1.875% 2022 | | | 700 | | | | 713 | |
| U.S. Treasury 1.875% 2022 | | | 600 | | | | 617 | |
| U.S. Treasury 0.375% 2025 | | | 8,605 | | | | 8,616 | |
| U.S. Treasury 2.25% 2027 | | | 700 | | | | 774 | |
| U.S. Treasury 2.25% 2027 | | | 300 | | | | 333 | |
| U.S. Treasury 2.875% 20285 | | | 1,275 | | | | 1,477 | |
| U.S. Treasury 2.875% 2028 | | | 700 | | | | 813 | |
| U.S. Treasury 0.625% 2030 | | | 2,640 | | | | 2,580 | |
| U.S. Treasury 0.625% 2030 | | | 650 | | | | 633 | |
| U.S. Treasury 0.875% 2030 | | | 14,286 | | | | 14,231 | |
| U.S. Treasury 2.875% 2046 | | | 400 | | | | 511 | |
| U.S. Treasury 1.375% 20505 | | | 8,058 | | | | 7,540 | |
| | | | | | | | 47,157 | |
| | | | | | | | | |
| U.S. Treasury inflation-protected securities 0.49% | | | | | | | | |
| U.S. Treasury Inflation-Protected Security 0.25% 20294 | | | 713 | | | | 807 | |
| U.S. Treasury Inflation-Protected Security 1.375% 20444,5 | | | 279 | | | | 403 | |
| U.S. Treasury Inflation-Protected Security 1.00% 20494,5 | | | 724 | | | | 1,021 | |
| | | | | | | | 2,231 | |
| | | | | | | | | |
| Total U.S. Treasury bonds & notes | | | | | | | 49,388 | |
| 152 | American Funds Insurance Series |
Global Balanced Fund (continued)
| Bonds, notes & other debt instruments (continued) | | Principal amount
(000) | | | Value
(000) | |
| Corporate bonds, notes & loans 4.81% | | | | | | | | |
| Financials 1.23% | | | | | | | | |
| ACE INA Holdings Inc. 2.875% 2022 | | $ | 10 | | | $ | 10 | |
| ACE INA Holdings Inc. 3.35% 2026 | | | 10 | | | | 11 | |
| ACE INA Holdings Inc. 4.35% 2045 | | | 20 | | | | 27 | |
| Allianz SE 4.75% 2049 (3-month EUR-EURIBOR + 3.60% on 10/24/2023)6 | | € | 100 | | | | 137 | |
| Bank of America Corp. 3.55% 2024 (3-month USD-LIBOR + 0.78% on 3/5/2023)6 | | $ | 100 | | | | 107 | |
| Bank of America Corp. 1.319% 2026 (USD-SOFR + 1.15% on 6/19/2025)6 | | | 500 | | | | 511 | |
| Bank of America Corp. 3.419% 2028 (3-month USD-LIBOR + 1.04% on 12/20/2027)6 | | | 236 | | | | 267 | |
| Bank of America Corp. 2.496% 2031 (3-month USD-LIBOR + 0.99% on 2/13/2030)6 | | | 20 | | | | 21 | |
| CaixaBank, SA 3.50% 2027 (5-year EUR Mid-Swap + 3.35% on 2/15/2022)6 | | € | 100 | | | | 126 | |
| China Construction Bank Corp. 2.45% 2030 (UST Yield Curve Rate T Note Constant Maturity 5-year + 2.15% on 6/24/2025)6 | | $ | 300 | | | | 308 | |
| Citigroup Inc. 3.106% 2026 (USD-SOFR + 2.842% on 3/8/2026)6 | | | 175 | | | | 192 | |
| Goldman Sachs Group, Inc. 2.905% 2023 (3-month USD-LIBOR + 0.99% on 7/24/2022)6 | | | 130 | | | | 135 | |
| Goldman Sachs Group, Inc. 3.50% 2025 | | | 207 | | | | 230 | |
| Goldman Sachs Group, Inc. 4.017% 2038 (3-month USD-LIBOR + 1.373% on 10/31/2037)6 | | | 78 | | | | 95 | |
| Groupe BPCE SA 0.64% 2022 | | ¥ | 100,000 | | | | 972 | |
| Groupe BPCE SA 5.70% 20233 | | $ | 200 | | | | 227 | |
| Groupe BPCE SA 1.00% 2025 | | € | 100 | | | | 127 | |
| HSBC Holdings PLC 4.292% 2026 (3-month USD-LIBOR + 1.348% on 9/12/2025)6 | | $ | 200 | | | | 228 | |
| JPMorgan Chase & Co. 3.25% 2022 | | | 28 | | | | 30 | |
| JPMorgan Chase & Co. 4.493% 2031 (USD-SOFR + 3.79% on 3/24/2030)6 | | | 160 | | | | 197 | |
| Mizuho Financial Group, Ltd. 2.721% 2023 (3-month USD-LIBOR + 0.84% on 7/16/2022)6 | | | 271 | | | | 280 | |
| Morgan Stanley 0.985% 2026 (USD-SOFR + 0.72% on 12/10/2025)6 | | | 200 | | | | 202 | |
| Morgan Stanley 3.125% 2026 | | | 110 | | | | 123 | |
| Morgan Stanley 2.699% 2031 (USD-SOFR + 1.143% on 1/22/2030)6 | | | 72 | | | | 78 | |
| New York Life Insurance Company 3.75% 20503 | | | 23 | | | | 28 | |
| PNC Financial Services Group, Inc. 2.854% 20226 | | | 100 | | | | 105 | |
| Rabobank Nederland 3.875% 2023 | | € | 100 | | | | 134 | |
| Skandinaviska Enskilda Banken AB 2.80% 2022 | | $ | 250 | | | | 257 | |
| Wells Fargo & Company 2.393% 2028 (USD-SOFR + 2.10% on 6/2/2027)6 | | | 400 | | | | 426 | |
| | | | | | | | 5,591 | |
| | | | | | | | | |
| Utilities 1.05% | | | | | | | | |
| Abu Dhabi National Energy Company PJSC (TAQA) 3.625% 20233 | | | 200 | | | | 212 | |
| Berkshire Hathaway Energy Company 3.70% 20303 | | | 25 | | | | 30 | |
| Berkshire Hathaway Energy Company 1.65% 20313 | | | 175 | | | | 175 | |
| CMS Energy Corp. 3.00% 2026 | | | 150 | | | | 166 | |
| Duke Energy Carolinas, LLC 3.05% 2023 | | | 280 | | | | 296 | |
| Duke Energy Progress, LLC 3.70% 2028 | | | 75 | | | | 88 | |
| Edison International 4.125% 2028 | | | 160 | | | | 178 | |
| Enel Finance International SA 2.75% 20233 | | | 200 | | | | 209 | |
| Enel Finance International SA 3.50% 20283 | | | 200 | | | | 228 | |
| Enersis Américas SA 4.00% 2026 | | | 35 | | | | 39 | |
| Exelon Corp. 3.40% 2026 | | | 150 | | | | 169 | |
| Exelon Corp., junior subordinated, 3.497% 20226 | | | 25 | | | | 26 | |
| FirstEnergy Corp. 3.90% 2027 (4.40% on 1/16/2021)6 | | | 120 | | | | 132 | |
| FirstEnergy Corp. 3.50% 20283 | | | 35 | | | | 37 | |
| Interstate Power and Light Co. 2.30% 2030 | | | 50 | | | | 53 | |
| NextEra Energy Capital Holdings, Inc. 2.75% 2029 | | | 234 | | | | 255 | |
| NextEra Energy Capital Holdings, Inc. 2.25% 2030 | | | 478 | | | | 502 | |
| Niagara Mohawk Power Corp. 3.508% 20243 | | | 85 | | | | 93 | |
| Pacific Gas and Electric Co. 2.95% 2026 | | | 25 | | | | 26 | |
| Pacific Gas and Electric Co. 2.10% 2027 | | | 100 | | | | 102 | |
| Pacific Gas and Electric Co. 4.65% 2028 | | | 114 | | | | 130 | |
| Pacific Gas and Electric Co. 4.55% 2030 | | | 31 | | | | 35 | |
| Pacific Gas and Electric Co. 2.50% 2031 | | | 600 | | | | 602 | |
| Pacific Gas and Electric Co. 3.50% 2050 | | | 137 | | | | 137 | |
| American Funds Insurance Series | 153 |
Global Balanced Fund (continued)
| Bonds, notes & other debt instruments (continued) | | Principal amount
(000) | | | Value
(000) | |
| Corporate bonds, notes & loans (continued) | | | | | | | | |
| Utilities (continued) | | | | | | | | |
| State Grid Overseas Investment Ltd. 1.25% 2022 | | € | 100 | | | $ | 124 | |
| State Grid Overseas Investment Ltd. 3.50% 20273 | | $ | 450 | | | | 501 | |
| Xcel Energy Inc. 3.35% 2026 | | | 216 | | | | 244 | |
| | | | | | | | 4,789 | |
| | | | | | | | | |
| Communication services 0.48% | | | | | | | | |
| AT&T Inc. 2.75% 2031 | | | 375 | | | | 401 | |
| AT&T Inc. 2.55% 20333 | | | 64 | | | | 66 | |
| Comcast Corp. 3.95% 2025 | | | 80 | | | | 92 | |
| Deutsche Telekom International Finance BV 9.25% 2032 | | | 45 | | | | 76 | |
| France Télécom 9.00% 20316 | | | 65 | | | | 107 | |
| KT Corp. 0.22% 2022 | | ¥ | 100,000 | | | | 966 | |
| T-Mobile US, Inc. 2.05% 20283 | | $ | 200 | | | | 208 | |
| Walt Disney Company 2.65% 2031 | | | 240 | | | | 263 | |
| | | | | | | | 2,179 | |
| | | | | | | | | |
| Health care 0.46% | | | | | | | | |
| Abbott Laboratories 3.75% 2026 | | | 51 | | | | 60 | |
| Aetna Inc. 2.80% 2023 | | | 10 | | | | 10 | |
| Amgen Inc. 1.90% 2025 | | | 40 | | | | 42 | |
| Amgen Inc. 2.20% 2027 | | | 30 | | | | 32 | |
| AstraZeneca PLC 3.50% 2023 | | | 150 | | | | 162 | |
| Bayer US Finance II LLC 3.875% 20233 | | | 200 | | | | 218 | |
| Becton, Dickinson and Company 2.894% 2022 | | | 47 | | | | 49 | |
| Becton, Dickinson and Company 3.734% 2024 | | | 35 | | | | 39 | |
| Becton, Dickinson and Company 3.70% 2027 | | | 43 | | | | 49 | |
| Becton, Dickinson and Company 2.823% 2030 | | | 28 | | | | 31 | |
| Bristol-Myers Squibb Co. 2.90% 2024 | | | 178 | | | | 193 | |
| Cigna Corp. 4.125% 2025 | | | 80 | | | | 92 | |
| EMD Finance LLC 3.25% 20253 | | | 250 | | | | 274 | |
| Medtronic, Inc. 3.50% 2025 | | | 31 | | | | 35 | |
| Novartis Capital Corp. 1.75% 2025 | | | 31 | | | | 33 | |
| Novartis Capital Corp. 2.00% 2027 | | | 34 | | | | 36 | |
| Novartis Capital Corp. 2.20% 2030 | | | 73 | | | | 78 | |
| Stryker Corp. 0.75% 2029 | | € | 210 | | | | 267 | |
| Takeda Pharmaceutical Company, Ltd. 2.25% 2026 | | | 100 | | | | 137 | |
| Thermo Fisher Scientific Inc. 4.133% 2025 | | $ | 84 | | | | 96 | |
| Upjohn Inc. 2.70% 20303 | | | 142 | | | | 151 | |
| | | | | | | | 2,084 | |
| | | | | | | | | |
| Energy 0.39% | | | | | | | | |
| Canadian Natural Resources Ltd. 2.95% 2030 | | | 161 | | | | 173 | |
| Enbridge Inc. 4.25% 2026 | | | 70 | | | | 82 | |
| Enbridge Inc. 3.70% 2027 | | | 45 | | | | 51 | |
| Equinor ASA 1.75% 2026 | | | 35 | | | | 37 | |
| Equinor ASA 2.375% 2030 | | | 70 | | | | 75 | |
| Exxon Mobil Corp. 2.992% 2025 | | | 135 | | | | 148 | |
| Exxon Mobil Corp. 3.482% 2030 | | | 170 | | | | 198 | |
| Halliburton Company 3.80% 2025 | | | 3 | | | | 3 | |
| MPLX LP 2.65% 2030 | | | 75 | | | | 79 | |
| Petróleos Mexicanos 7.19% 2024 | | MXN | 1,335 | | | | 61 | |
| Petróleos Mexicanos 7.47% 2026 | | | 5,330 | | | | 224 | |
| Saudi Arabian Oil Co. 1.625% 20253 | | $ | 200 | | | | 205 | |
| Shell International Finance BV 3.50% 2023 | | | 330 | | | | 359 | |
| Statoil ASA 3.70% 2024 | | | 50 | | | | 55 | |
| | | | | | | | 1,750 | |
| 154 | American Funds Insurance Series |
Global Balanced Fund (continued)
| Bonds, notes & other debt instruments (continued) | | Principal amount
(000) | | | Value
(000) | |
| Corporate bonds, notes & loans (continued) | | | | | | | | |
| Consumer discretionary 0.36% | | | | | | | | |
| Amazon.com, Inc. 2.80% 2024 | | $ | 170 | | | $ | 184 | |
| Amazon.com, Inc. 1.20% 2027 | | | 50 | | | | 51 | |
| Amazon.com, Inc. 2.50% 2050 | | | 305 | | | | 316 | |
| Bayerische Motoren Werke AG 3.90% 20253 | | | 70 | | | | 79 | |
| Bayerische Motoren Werke AG 4.15% 20303 | | | 70 | | | | 85 | |
| DaimlerChrysler North America Holding Corp. 2.00% 20213 | | | 200 | | | | 201 | |
| Hyundai Capital America 3.25% 20223 | | | 65 | | | | 68 | |
| Hyundai Capital America 2.375% 20273 | | | 109 | | | | 114 | |
| Hyundai Capital Services Inc. 3.75% 20233 | | | 250 | | | | 266 | |
| Toyota Motor Credit Corp. 2.90% 2023 | | | 100 | | | | 106 | |
| Toyota Motor Credit Corp. 3.00% 2025 | | | 100 | | | | 110 | |
| Toyota Motor Credit Corp. 3.375% 2030 | | | 33 | | | | 39 | |
| | | | | | | | 1,619 | |
| | | | | | | | | |
| Consumer staples 0.35% | | | | | | | | |
| Altria Group, Inc. 1.00% 2023 | | € | 110 | | | | 137 | |
| Altria Group, Inc. 2.20% 2027 | | | 270 | | | | 360 | |
| Anheuser-Busch InBev NV 4.00% 2028 | | $ | 100 | | | | 118 | |
| Anheuser-Busch InBev NV 4.75% 2029 | | | 220 | | | | 272 | |
| British American Tobacco PLC 3.215% 2026 | | | 62 | | | | 68 | |
| British American Tobacco PLC 3.557% 2027 | | | 105 | | | | 117 | |
| British American Tobacco PLC 3.462% 2029 | | | 75 | | | | 82 | |
| Conagra Brands, Inc. 4.30% 2024 | | | 210 | | | | 235 | |
| Keurig Dr Pepper Inc. 4.597% 2028 | | | 175 | | | | 213 | |
| | | | | | | | 1,602 | |
| | | | | | | | | |
| Real estate 0.19% | | | | | | | | |
| American Campus Communities, Inc. 3.75% 2023 | | | 100 | | | | 106 | |
| American Campus Communities, Inc. 4.125% 2024 | | | 90 | | | | 98 | |
| Corporate Office Properties LP 3.60% 2023 | | | 65 | | | | 69 | |
| Equinix, Inc. 2.15% 2030 | | | 197 | | | | 201 | |
| Essex Portfolio LP 3.50% 2025 | | | 120 | | | | 133 | |
| Essex Portfolio LP 3.375% 2026 | | | 40 | | | | 45 | |
| WEA Finance LLC 3.75% 20243 | | | 200 | | | | 211 | |
| | | | | | | | 863 | |
| | | | | | | | | |
| Industrials 0.15% | | | | | | | | |
| Carrier Global Corp. 2.242% 2025 | | | 36 | | | | 38 | |
| Carrier Global Corp. 2.493% 2027 | | | 30 | | | | 32 | |
| CCCI Treasure Ltd. 3.425% (UST Yield Curve Rate T Note Constant Maturity 5-year + 1.998% on 2/21/2025)6 | | | 200 | | | | 198 | |
| CSX Corp. 3.80% 2050 | | | 6 | | | | 7 | |
| CSX Corp. 2.50% 2051 | | | 75 | | | | 75 | |
| Lima Metro Line 2 Finance Ltd. 5.875% 20343 | | | 105 | | | | 127 | |
| United Technologies Corp. 4.125% 2028 | | | 170 | | | | 203 | |
| | | | | | | | 680 | |
| | | | | | | | | |
| Information technology 0.13% | | | | | | | | |
| Broadcom Inc. 3.15% 2025 | | | 70 | | | | 76 | |
| Broadcom Inc. 4.15% 2030 | | | 70 | | | | 81 | |
| Microsoft Corp. 2.40% 2026 | | | 187 | | | | 204 | |
| Oracle Corp. 2.65% 2026 | | | 216 | | | | 238 | |
| | | | | | | | 599 | |
| | | | | | | | | |
| Materials 0.02% | | | | | | | | |
| Vale Overseas Ltd. 3.75% 2030 | | | 94 | | | | 105 | |
| | | | | | | | | |
| Total corporate bonds, notes & loans | | | | | | | 21,861 | |
| American Funds Insurance Series | 155 |
Global Balanced Fund (continued)
| Bonds, notes & other debt instruments (continued) | | Principal amount
(000) | | | Value
(000) | |
| Mortgage-backed obligations 1.42% | | | | | | | | |
| Other mortgage-backed securities 0.73% | | | | | | | | |
| Korea Housing Finance Corp. 2.00% 20213,7 | | $ | 250 | | | $ | 253 | |
| Nordea Kredit 0.50% 20407 | | DKr | 1,846 | | | | 305 | |
| Nykredit Realkredit AS, Series 01E, 1.50% 20377 | | | 821 | | | | 140 | |
| Nykredit Realkredit AS, Series 01E, 0.50% 20407 | | | 12,241 | | | | 2,021 | |
| Nykredit Realkredit AS, Series 01E, 1.50% 20407 | | | 2,102 | | | | 358 | |
| Nykredit Realkredit AS, Series 01E, 0.50% 20507 | | | 1,466 | | | | 238 | |
| | | | | | | | 3,315 | |
| | | | | | | | | |
| Federal agency mortgage-backed obligations 0.69% | | | | | | | | |
| Fannie Mae Pool #MA4228 1.50% 20367 | | $ | 1,042 | | | | 1,073 | |
| Freddie Mac Pool #SB8083 1.50% 20367 | | | 267 | | | | 275 | |
| Freddie Mac Pool #2B7343 3.711% 20497,8 | | | 136 | | | | 142 | |
| Government National Mortgage Assn. 4.00% 20517,9 | | | 75 | | | | 80 | |
| Government National Mortgage Assn. Pool #MA5986 4.00% 20497 | | | 18 | | | | 19 | |
| Uniform Mortgage-Backed Security 1.50% 20367,9 | | | 1,508 | | | | 1,550 | |
| | | | | | | | 3,139 | |
| | | | | | | | | |
| Total mortgage-backed obligations | | | | | | | 6,454 | |
| | | | | | | | | |
| Municipals 0.04% | | | | | | | | |
| Ohio 0.02% | | | | | | | | |
| Turnpike and Infrastructure Commission, Turnpike Rev. Ref. Bonds (Infrastructure Projects), Series 2020-A, 3.216% 2048 | | | 100 | | | | 102 | |
| | | | | | | | | |
| Texas 0.02% | | | | | | | | |
| Grand Parkway Transportation Corp., Grand Parkway System Toll Rev. Ref. Bonds, Series 2020-B, 3.236% 2052 | | | 80 | | | | 84 | |
| | | | | | | | | |
| Total municipals | | | | | | | 186 | |
| | | | | | | | | |
| Asset-backed obligations 0.02% | | | | | | | | |
| OSW Structured Asset Trust, Series 2020-RPL1, Class A1, 3.072% 20603,7,8 | | | 93 | | | | 95 | |
| | | | | | | | | |
| Total bonds, notes & other debt instruments (cost: $137,636,000) | | | | | | | 145,119 | |
| | | | | | | | | |
| Short-term securities 9.30% | | | | | | | | |
| Money market investments 5.35% | | | | | | | | |
| Capital Group Central Cash Fund 0.12%10,11 | | | 243,271 | | | | 24,329 | |
| | | | | | | | | |
| Commercial paper 3.95% | | | | | | | | |
| Toronto-Dominion Bank 0.19% due 1/19/20213 | | | 9,000 | | | | 9,000 | |
| NRW.Bank 0.21% due 1/22/20213 | | | 9,000 | | | | 8,999 | |
| | | | | | | | 17,999 | |
| | | | | | | | | |
| Total short-term securities (cost: $42,325,000) | | | | | | | 42,328 | |
| Total investment securities 99.66% (cost: $352,848,000) | | | | | | | 453,574 | |
| Other assets less liabilities 0.34% | | | | | | | 1,558 | |
| | | | | | | | | |
| Net assets 100.00% | | | | | | $ | 455,132 | |
| 156 | American Funds Insurance Series |
Global Balanced Fund (continued)
Futures contracts
| Contracts | | Type | | Number of
contracts | | Expiration | | Notional
amount
(000) | 12 | | Value at
12/31/2020
(000) | 13 | | Unrealized
appreciation
at 12/31/2020
(000) | |
| 10 Year Ultra U.S. Treasury Note Futures | | Short | | 18 | | March 2021 | | | $ | (1,800 | ) | | | $ | (2,814 | ) | | | $ | 3 | |
Forward currency contracts
| Contract amount | | | | | | | Unrealized
appreciation
(depreciation) | |
Purchases
(000) | | | Sales
(000) | | | Counterparty | | Settlement
date | | at 12/31/2020
(000) | |
| | GBP626 | | | | USD833 | | | Citibank | | 1/6/2021 | | $ | 24 | |
| | EUR560 | | | | USD665 | | | Goldman Sachs | | 1/6/2021 | | | 19 | |
| | ILS800 | | | | USD239 | | | Standard Chartered Bank | | 1/6/2021 | | | 9 | |
| | JPY39,700 | | | | USD383 | | | UBS AG | | 1/6/2021 | | | 2 | |
| | CAD10 | | | | USD8 | | | Standard Chartered Bank | | 1/6/2021 | | | — | 14 |
| | GBP200 | | | | EUR224 | | | Citibank | | 1/6/2021 | | | — | 14 |
| | USD275 | | | | MXN5,550 | | | HSBC Bank | | 1/6/2021 | | | (4 | ) |
| | PLN1,400 | | | | USD372 | | | Citibank | | 1/7/2021 | | | 3 | |
| | EUR715 | | | | USD860 | | | Bank of New York Mellon | | 1/8/2021 | | | 14 | |
| | CNH3,320 | | | | USD505 | | | HSBC Bank | | 1/8/2021 | | | 6 | |
| | USD377 | | | | PLN1,400 | | | Barclays Bank PLC | | 1/8/2021 | | | 3 | |
| | USD451 | | | | EUR370 | | | Citibank | | 1/8/2021 | | | (1 | ) |
| | USD520 | | | | EUR430 | | | JPMorgan Chase | | 1/8/2021 | | | (5 | ) |
| | USD717 | | | | MXN14,415 | | | HSBC Bank | | 1/8/2021 | | | (6 | ) |
| | USD541 | | | | CAD700 | | | Standard Chartered Bank | | 1/8/2021 | | | (9 | ) |
| | USD397 | | | | ZAR6,080 | | | Standard Chartered Bank | | 1/8/2021 | | | (16 | ) |
| | USD899 | | | | ILS2,960 | | | Citibank | | 1/8/2021 | | | (23 | ) |
| | CAD1,400 | | | | USD1,094 | | | Goldman Sachs | | 1/12/2021 | | | 6 | |
| | USD260 | | | | AUD350 | | | Citibank | | 1/12/2021 | | | (10 | ) |
| | JPY234,930 | | | | USD2,252 | | | HSBC Bank | | 1/14/2021 | | | 24 | |
| | CLP175,000 | | | | USD237 | | | Citibank | | 1/14/2021 | | | 9 | |
| | KRW320,500 | | | | USD295 | | | Standard Chartered Bank | | 1/14/2021 | | | — | 14 |
| | USD421 | | | | INR31,100 | | | HSBC Bank | | 1/14/2021 | | | (4 | ) |
| | USD11 | | | | RUB800 | | | Citibank | | 1/15/2021 | | | — | 14 |
| | EUR717 | | | | USD871 | | | Goldman Sachs | | 1/19/2021 | | | 5 | |
| | CZK11,700 | | | | EUR444 | | | Standard Chartered Bank | | 1/19/2021 | | | 2 | |
| | USD549 | | | | CAD700 | | | Barclays Bank PLC | | 1/19/2021 | | | (1 | ) |
| | USD513 | | | | CNH3,360 | | | Goldman Sachs | | 1/19/2021 | | | (3 | ) |
| | USD540 | | | | CZK11,700 | | | Standard Chartered Bank | | 1/19/2021 | | | (5 | ) |
| | ILS2,000 | | | | USD617 | | | Goldman Sachs | | 1/21/2021 | | | 6 | |
| | MXN8,100 | | | | USD404 | | | Morgan Stanley | | 1/21/2021 | | | 2 | |
| | CNH1,700 | | | | USD261 | | | Goldman Sachs | | 1/21/2021 | | | — | 14 |
| | USD174 | | | | JPY18,000 | | | Goldman Sachs | | 1/21/2021 | | | — | 14 |
| | USD523 | | | | ILS1,700 | | | JPMorgan Chase | | 1/21/2021 | | | (6 | ) |
| | USD545 | | | | BRL2,788 | | | Goldman Sachs | | 1/22/2021 | | | 8 | |
| | KRW476,000 | | | | USD435 | | | Citibank | | 1/22/2021 | | | 3 | |
| | USD431 | | | | KRW476,000 | | | Citibank | | 1/22/2021 | | | (7 | ) |
| | EUR3,234 | | | | USD3,945 | | | HSBC Bank | | 1/25/2021 | | | 8 | |
| | CAD1,170 | | | | USD896 | | | Morgan Stanley | | 1/29/2021 | | | 24 | |
| | CAD1,170 | | | | USD897 | | | Citibank | | 1/29/2021 | | | 22 | |
| | MXN6,630 | | | | USD317 | | | Morgan Stanley | | 1/29/2021 | | | 15 | |
| | MXN6,640 | | | | USD319 | | | Morgan Stanley | | 1/29/2021 | | | 13 | |
| | ZAR2,790 | | | | USD177 | | | JPMorgan Chase | | 1/29/2021 | | | 12 | |
| | EUR502 | | | | DKK3,737 | | | Citibank | | 1/29/2021 | | | — | 14 |
| | EUR63 | | | | DKK467 | | | Goldman Sachs | | 1/29/2021 | | | — | 14 |
| | EUR63 | | | | DKK467 | | | Citibank | | 1/29/2021 | | | — | 14 |
| American Funds Insurance Series | 157 |
Global Balanced Fund (continued)
Forward currency contracts (continued)
| Contract amount | | | | | | | Unrealized
appreciation
(depreciation) | |
Purchases
(000) | | | Sales
(000) | | | Counterparty | | Settlement
date | | at 12/31/2020
(000) | |
| | EUR1,219 | | | | DKK9,069 | | | Citibank | | 1/29/2021 | | $ | — | 14 |
| | USD280 | | | | AUD370 | | | HSBC Bank | | 1/29/2021 | | | (5 | ) |
| | USD169 | | | | ZAR2,790 | | | Bank of America | | 1/29/2021 | | | (21 | ) |
| | USD617 | | | | MXN13,270 | | | Morgan Stanley | | 1/29/2021 | | | (48 | ) |
| | USD1,764 | | | | CAD2,340 | | | Citibank | | 1/29/2021 | | | (74 | ) |
| | CAD1,390 | | | | USD1,074 | | | Barclays Bank PLC | | 2/10/2021 | | | 18 | |
| | USD1,027 | | | | CAD1,320 | | | Goldman Sachs | | 2/10/2021 | | | (11 | ) |
| | | | | | | | | | | | | $ | (2 | ) |
Swap contracts
Interest rate swaps
| Receive | | Pay | | Expiration
date | | Notional
(000) | | | Value at
12/31/2020
(000) | | | Upfront
premium
paid
(000) | | | Unrealized
appreciation
at 12/31/2020
(000) | |
| (0.0955)% | | 6-month EURIBOR | | 7/22/2024 | | € | 2,200 | | | $ | 21 | | | | $ | — | | | | $ | 21 | |
Credit default swaps
Centrally cleared credit default swaps on credit indices — sell protection
Receive/
Payment frequency | | Pay | | Expiration
date | | Notional
(000) | | | Value at
12/31/2020
(000) | | | Upfront
premium
paid
(000) | | | Unrealized
depreciation
at 12/31/2020
(000) | |
| 1.00%/Quarterly | | CDX.NA.IG.35 | | 12/20/2025 | | $ | 3,800 | | | $ | 93 | | | | $ | 93 | | | | $ | — | 14 |
Investments in affiliates11
| | | Value of
affiliate at
1/1/2020
(000) | | | Additions
(000) | | | Reductions
(000) | | | Net
realized
gain
(000) | | | Net
unrealized
depreciation
(000) | | | Value of
affiliate at
12/31/2020
(000) | | | Dividend
income
(000) | |
| Short-term securities 5.35% | | | | | | | | | | | | | | | | | | | | | | | |
| Money market investments 5.35% | | | | | | | | | | | | | | | | | | |
| Capital Group Central Cash Fund 0.12%10 | | $ | 2,825 | | | $ | 130,916 | | | $ | 109,410 | | | $ | 3 | | | $ | (5 | ) | | $ | 24,329 | | | $ | 103 | |
| 158 | American Funds Insurance Series |
Global Balanced Fund (continued)
| 1 | Valued under fair value procedures adopted by authority of the board of trustees. The total value of all such securities was $131,628,000, which represented 28.92% of the net assets of the fund. This entire amount relates to certain securities trading outside the U.S. whose values were adjusted as a result of significant market movements following the close of local trading. |
| 2 | Security did not produce income during the last 12 months. |
| 3 | Acquired in a transaction exempt from registration under Rule 144A or Section 4(2) of the Securities Act of 1933. May be resold in the U.S. in transactions exempt from registration, normally to qualified institutional buyers. The total value of all such securities was $25,404,000, which represented 5.58% of the net assets of the fund. |
| 4 | Index-linked bond whose principal amount moves with a government price index. |
| 5 | All or a portion of this security was pledged as collateral. The total value of pledged collateral was $184,000, which represented .04% of the net assets of the fund. |
| 6 | Step bond; coupon rate may change at a later date. |
| 7 | Principal payments may be made periodically. Therefore, the effective maturity date may be earlier than the stated maturity date. |
| 8 | Coupon rate may change periodically. Reference rate and spread are as of the most recent information available. Some coupon rates are determined by the issuer or agent based on current market conditions; therefore, the reference rate and spread are not available. |
| 9 | Purchased on a TBA basis. |
| 10 | Rate represents the seven-day yield at 12/31/2020. |
| 11 | Part of the same group of investment companies as the fund as defined under the Investment Company Act of 1940. |
| 12 | Notional amount is calculated based on the number of contracts and notional contract size. |
| 13 | Value is calculated based on the notional amount and current market price. |
| 14 | Amount less than one thousand. |
Key to abbreviations and symbols
ADR = American Depositary Receipts
AUD/A$ = Australian dollars
BRL = Brazilian reais
CAD/C$ = Canadian dollars
CLP = Chilean pesos
CNH/CNY = Chinese yuan renminbi
COP = Colombian pesos
CZK = Czech korunas
DKK/DKr = Danish kroner
EUR/€ = Euros
EURIBOR = Euro Interbank Offered Rate
GBP/£ = British pounds
IDR = Indonesian rupiah
ILS = Israeli shekels
INR = Indian rupees
JPY/¥ = Japanese yen
KRW = South Korean won
LIBOR = London Interbank Offered Rate
MXN = Mexican pesos
MYR = Malaysian ringgits
NKr = Norwegian kroner
PEN = Peruvian nuevos soles
PLN = Polish zloty
Ref. = Refunding
Rev. = Revenue
RUB = Russian rubles
S$ = Singapore dollars
SOFR = Secured Overnight Financing Rate
TBA = To-be-announced
THB = Thai baht
USD/$ = U.S. dollars
ZAR = South African rand
See notes to financial statements.
| American Funds Insurance Series | 159 |
Bond Fund
Investment portfolio December 31, 2020
| Bonds, notes & other debt instruments 96.71% | | Principal amount
(000) | | | Value
(000) | |
| Corporate bonds, notes & loans 33.25% | | | | | | | | |
| Financials 7.75% | | | | | | | | |
| ACE INA Holdings Inc. 2.875% 2022 | | $ | 3,625 | | | $ | 3,781 | |
| ACE INA Holdings Inc. 3.35% 2026 | | | 2,025 | | | | 2,283 | |
| ACE INA Holdings Inc. 4.35% 2045 | | | 2,220 | | | | 3,011 | |
| AerCap Holdings NV 6.50% 2025 | | | 1,798 | | | | 2,151 | |
| Ally Financial Inc. 5.125% 2024 | | | 1,500 | | | | 1,730 | |
| Ally Financial Inc. 8.00% 2031 | | | 8,479 | | | | 12,081 | |
| Ally Financial Inc. 8.00% 2031 | | | 7,070 | | | | 10,393 | |
| American International Group, Inc. 4.20% 2028 | | | 9,875 | | | | 11,733 | |
| American International Group, Inc. 3.40% 2030 | | | 12,313 | | | | 14,111 | |
| American International Group, Inc. 4.375% 2050 | | | 3,455 | | | | 4,524 | |
| Assicurazioni Generali SpA 10.125% 2042 (3-month EUR-EURIBOR + 9.181% on 7/10/2022)1 | | € | 3,800 | | | | 5,376 | |
| Banco Do Brasil, SA 4.75% 20242 | | $ | 10,000 | | | | 10,775 | |
| Bank of America Corp. 3.419% 2028 (3-month USD-LIBOR + 1.04% on 12/20/2027)1 | | | 16,676 | | | | 18,867 | |
| Bank of America Corp. 1.898% 2031 (USD-SOFR + 1.53% on 7/23/2030)1 | | | 2,515 | | | | 2,542 | |
| Bank of America Corp. 1.922% 2031 (USD-SOFR + 1.37% on 10/24/2030)1 | | | 21,177 | | | | 21,463 | |
| Berkshire Hathaway Finance Corp. 4.20% 2048 | | | 8,720 | | | | 11,520 | |
| BNP Paribas 3.80% 20242 | | | 18,775 | | | | 20,490 | |
| BNP Paribas 2.819% 2025 (3-month USD-LIBOR + 1.111% on 11/19/2024)1,2 | | | 2,875 | | | | 3,073 | |
| BNP Paribas 3.375% 20252 | | | 6,425 | | | | 7,049 | |
| BNP Paribas 2.219% 2026 (USD-SOFR + 2.074% on 6/9/2025)1,2 | | | 12,000 | | | | 12,565 | |
| CIT Group Inc. 3.929% 2024 (USD-SOFR + 3.827% on 6/19/2023)1 | | | 5,410 | | | | 5,728 | |
| CIT Group Inc. 4.75% 2024 | | | 2,066 | | | | 2,263 | |
| Citigroup Inc. 4.60% 2026 | | | 1,800 | | | | 2,111 | |
| Citigroup Inc. 3.668% 2028 (3-month USD-LIBOR + 1.39% on 7/24/2027)1 | | | 1,000 | | | | 1,134 | |
| Citigroup Inc. 2.976% 2030 (USD-SOFR + 1.422% on 11/5/2029)1 | | | 3,001 | | | | 3,306 | |
| Citigroup Inc. 2.572% 2031 (USD-SOFR + 2.107% on 6/3/2030)1 | | | 18,102 | | | | 19,300 | |
| Citigroup Inc. 4.412% 2031 (USD-SOFR + 3.914% on 3/31/2030)1 | | | 18,470 | | | | 22,399 | |
| Crédit Agricole SA 1.907% 2026 (USD-SOFR + 1.676% on 6/16/2025)1,2 | | | 4,450 | | | | 4,620 | |
| Credit Suisse Group AG 2.997% 2023 (3-month USD-LIBOR + 1.20% on 12/14/2022)1,2 | | | 12,000 | | | | 12,555 | |
| Credit Suisse Group AG 3.80% 2023 | | | 12,925 | | | | 13,927 | |
| Credit Suisse Group AG 4.207% 2024 (3-month USD-LIBOR + 1.24% on 6/12/2023)1,2 | | | 500 | | | | 542 | |
| Credit Suisse Group AG 2.593% 2025 (USD-SOFR + 1.56% on 9/11/2024)1,2 | | | 850 | | | | 895 | |
| Credit Suisse Group AG 2.193% 2026 (USD-SOFR + 2.044% on 6/5/2025)1,2 | | | 5,750 | | | | 6,014 | |
| Credit Suisse Group AG 4.194% 2031 (USD-SOFR + 3.73% on 4/1/2030)1,2 | | | 3,096 | | | | 3,644 | |
| Deutsche Bank AG 3.15% 2021 | | | 28,037 | | | | 28,068 | |
| Deutsche Bank AG 3.375% 2021 | | | 1,300 | | | | 1,313 | |
| Deutsche Bank AG 4.25% 2021 | | | 27,043 | | | | 27,116 | |
| Deutsche Bank AG 4.25% 2021 | | | 525 | | | | 538 | |
| Deutsche Bank AG 3.30% 2022 | | | 2,695 | | | | 2,812 | |
| Deutsche Bank AG 5.00% 2022 | | | 2,675 | | | | 2,798 | |
| Deutsche Bank AG 3.95% 2023 | | | 6,350 | | | | 6,751 | |
| Deutsche Bank AG 2.222% 2024 (USD-SOFR + 2.159% on 9/18/2023)1 | | | 10,475 | | | | 10,782 | |
| Deutsche Bank AG 3.70% 2024 | | | 4,950 | | | | 5,330 | |
| Deutsche Bank AG 3.70% 2024 | | | 2,750 | | | | 2,967 | |
| Deutsche Bank AG 3.961% 2025 (USD-SOFR + 2.581% on 11/26/2024)1 | | | 8,835 | | | | 9,662 | |
| Deutsche Bank AG 2.129% 2026 (USD-SOFR + 1.87% on 11/24/2025)1 | | | 42,015 | | | | 42,990 | |
| Deutsche Bank AG 4.10% 2026 | | | 7,305 | | | | 8,154 | |
| Deutsche Bank AG 4.10% 2026 | | | 857 | | | | 950 | |
| Deutsche Bank AG 3.547% 2031 (USD-SOFR + 3.043% on 9/18/2030)1 | | | 2,900 | | | | 3,151 | |
| GE Capital Funding, LLC 4.05% 20272 | | | 5,346 | | | | 6,119 | |
| GE Capital Funding, LLC 4.40% 20302 | | | 10,000 | | | | 11,791 | |
| Goldman Sachs Group, Inc. 5.75% 2022 | | | 4,800 | | | | 5,074 | |
| Goldman Sachs Group, Inc. 3.814% 2029 (3-month USD-LIBOR + 1.158% on 4/23/2028)1 | | | 9,600 | | | | 11,126 | |
| Goldman Sachs Group, Inc., junior subordinated, 5.30% (3-month USD-LIBOR + 3.834% on 11/10/2026)1 | | | 1,750 | | | | 1,916 | |
| Groupe BPCE SA 2.75% 20232 | | | 6,875 | | | | 7,192 | |
| Groupe BPCE SA 5.70% 20232 | | | 28,166 | | | | 31,898 | |
| Groupe BPCE SA 5.15% 20242 | | | 5,481 | | | | 6,247 | |
| Groupe BPCE SA 1.652% 2026 (USD-SOFR + 1.52% on 10/6/2025)1,2 | | | 6,350 | | | | 6,504 | |
| 160 | American Funds Insurance Series |
Bond Fund (continued)
| Bonds, notes & other debt instruments (continued) | | Principal amount
(000) | | | Value
(000) | |
| Corporate bonds, notes & loans (continued) | | | | | | | | |
| Financials (continued) | | | | | | | | |
| HSBC Holdings PLC 4.583% 2029 (3-month USD-LIBOR + 1.535% on 6/19/2028)1 | | $ | 12,000 | | | $ | 14,200 | |
| Intesa Sanpaolo SpA 3.375% 20232 | | | 10,035 | | | | 10,514 | |
| Intesa Sanpaolo SpA 3.25% 20242 | | | 770 | | | | 823 | |
| Intesa Sanpaolo SpA 5.017% 20242 | | | 68,143 | | | | 74,578 | |
| Intesa Sanpaolo SpA 5.71% 20262 | | | 15,400 | | | | 17,634 | |
| Intesa Sanpaolo SpA 3.875% 20272 | | | 6,250 | | | | 6,866 | |
| Intesa Sanpaolo SpA 3.875% 20282 | | | 1,986 | | | | 2,194 | |
| JPMorgan Chase & Co. 2.182% 2028 (USD-SOFR + 1.89% on 6/1/2027)1 | | | 4,750 | | | | 5,046 | |
| JPMorgan Chase & Co. 3.509% 2029 (3-month USD-LIBOR + 0.945% on 1/23/2028)1 | | | 9,600 | | | | 10,958 | |
| JPMorgan Chase & Co. 4.203% 2029 (3-month USD-LIBOR + 1.26% on 7/23/2028)1 | | | 11,980 | | | | 14,331 | |
| JPMorgan Chase & Co. 2.522% 2031 (USD-SOFR + 2.04% on 4/22/2030)1 | | | 1,766 | | | | 1,900 | |
| Lloyds Banking Group PLC 2.438% 2026 (UST Yield Curve Rate T Note Constant Maturity 1-year + 1.00% on 2/5/2025)1 | | | 2,675 | | | | 2,827 | |
| Lloyds Banking Group PLC 4.375% 2028 | | | 8,825 | | | | 10,505 | |
| MetLife Capital Trust IV, junior subordinated, 7.875% 2067 (3-month USD-LIBOR + 3.96% on 12/1/2037)1,2 | | | 1,405 | | | | 1,985 | |
| MetLife, Inc. 3.60% 2025 | | | 3,490 | | | | 3,954 | |
| Mizuho Financial Group, Inc. 0.849% 2024 (3-month USD-LIBOR + 0.61% on 9/8/2023)1 | | 6,000 | | | | 6,036 | |
| Morgan Stanley 2.50% 2021 | | | 19,200 | | | | 19,320 | |
| Morgan Stanley 2.72% 2025 (USD-SOFR + 1.152% on 7/22/2024)1 | | | 2,300 | | | | 2,461 | |
| New York Life Insurance Company 3.75% 20502 | | | 5,749 | | | | 6,884 | |
| PNC Financial Services Group, Inc. 2.854% 20221 | | | 5,850 | | | | 6,127 | |
| PNC Funding Corp. 3.30% 2022 | | | 8,700 | | | | 8,989 | |
| Rede D’Or Finance SARL 4.50% 20302 | | | 3,000 | | | | 3,133 | |
| Santander Holdings USA, Inc. 3.50% 2024 | | | 8,325 | | | | 8,997 | |
| Synchrony Financial 2.85% 2022 | | | 5,400 | | | | 5,578 | |
| Synchrony Financial 4.375% 2024 | | | 3,640 | | | | 4,009 | |
| Travelers Companies, Inc. 2.55% 2050 | | | 768 | | | | 809 | |
| UBS Group AG 1.364% 2027 (UST Yield Curve Rate T Note Constant Maturity 5-year + 1.08% on 1/30/2026)1,2 | | | 1,675 | | | | 1,695 | |
| UniCredit SpA 3.75% 20222 | | | 2,545 | | | | 2,638 | |
| UniCredit SpA 6.572% 20222 | | | 11,295 | | | | 11,904 | |
| UniCredit SpA 4.625% 20272 | | | 1,395 | | | | 1,588 | |
| UniCredit SpA 5.861% 2032 (5-year USD-ICE Swap + 3.703% on 6/19/2027)1,2 | | | 16,130 | | | | 18,192 | |
| UniCredit SpA 7.296% 2034 (5-year USD-ICE Swap + 4.914% on 4/2/2029)1,2 | | | 10,221 | | | | 12,362 | |
| UniCredit SpA 5.459% 2035 (5-year USD-ICE Swap + 4.75% on 6/30/2030)1,2 | | | 606 | | | | 668 | |
| Wells Fargo & Company 2.10% 2021 | | | 16,800 | | | | 16,971 | |
| Wells Fargo & Company 2.406% 2025 (3-month USD-LIBOR + 0.825% on 10/30/2024)1 | | 20,480 | | | | 21,659 | |
| Wells Fargo & Company 2.188% 2026 (USD-SOFR + 2.00% on 4/30/2025)1 | | | 10,408 | | | | 10,968 | |
| Wells Fargo & Company 2.572% 2031 (3-month USD-LIBOR + 1.00% on 2/11/2030)1 | | | 14,200 | | | | 15,038 | |
| | | | | | | | 883,546 | |
| | | | | | | | | |
| Energy 5.65% | | | | | | | | |
| Apache Corp. 4.625% 2025 | | | 645 | | | | 678 | |
| Apache Corp. 4.875% 2027 | | | 5,475 | | | | 5,812 | |
| Apache Corp. 4.25% 2030 | | | 2,465 | | | | 2,593 | |
| Apache Corp. 4.75% 2043 | | | 12,100 | | | | 12,569 | |
| Apache Corp. 4.25% 2044 | | | 2,100 | | | | 2,077 | |
| Apache Corp. 5.35% 2049 | | | 800 | | | | 823 | |
| Baker Hughes, a GE Co. 4.486% 2030 | | | 914 | | | | 1,099 | |
| Boardwalk Pipeline Partners, LP 3.375% 2023 | | | 1,900 | | | | 1,984 | |
| BP Capital Markets America Inc. 2.772% 2050 | | | 6,417 | | | | 6,349 | |
| BP Capital Markets PLC 3.00% 2050 | | | 8,284 | | | | 8,490 | |
| Canadian Natural Resources Ltd. 2.05% 2025 | | | 3,849 | | | | 4,041 | |
| Canadian Natural Resources Ltd. 3.85% 2027 | | | 1,151 | | | | 1,293 | |
| Canadian Natural Resources Ltd. 2.95% 2030 | | | 2,374 | | | | 2,542 | |
| Cenovus Energy Inc. 3.80% 2023 | | | 1,120 | | | | 1,164 | |
| Cenovus Energy Inc. 4.25% 2027 | | | 12,685 | | | | 13,858 | |
| Cenovus Energy Inc. 5.25% 2037 | | | 770 | | | | 872 | |
| Cenovus Energy Inc. 5.40% 2047 | | | 15,180 | | | | 17,821 | |
| American Funds Insurance Series | 161 |
Bond Fund (continued)
| Bonds, notes & other debt instruments (continued) | | Principal amount
(000) | | | Value
(000) | |
| Corporate bonds, notes & loans (continued) | | | | | | | | |
| Energy (continued) | | | | | | | | |
| Cheniere Energy, Inc. 7.00% 2024 | | $ | 410 | | | $ | 479 | |
| Cheniere Energy, Inc. 5.125% 2027 | | | 16,000 | | | | 18,946 | |
| Cheniere Energy, Inc. 3.70% 2029 | | | 7,369 | | | | 8,215 | |
| Chevron Corp. 2.355% 2022 | | | 4,800 | | | | 4,973 | |
| Chevron Corp. 3.078% 2050 | | | 1,114 | | | | 1,239 | |
| Chevron USA Inc. 2.343% 2050 | | | 1,365 | | | | 1,330 | |
| Columbia Pipeline Partners LP 5.80% 2045 | | | 1,410 | | | | 1,929 | |
| Concho Resources Inc. 4.30% 2028 | | | 6,095 | | | | 7,207 | |
| Concho Resources Inc. 4.85% 2048 | | | 5,000 | | | | 6,735 | |
| DCP Midstream Operating LP 4.95% 2022 | | | 500 | | | | 517 | |
| Enbridge Energy Partners, LP 4.20% 2021 | | | 6,325 | | | | 6,432 | |
| Enbridge Energy Partners, LP 5.875% 2025 | | | 7,700 | | | | 9,420 | |
| Enbridge Energy Partners, LP 7.375% 2045 | | | 18,154 | | | | 27,723 | |
| Enbridge Inc. 4.00% 2023 | | | 1,500 | | | | 1,633 | |
| Energy Transfer Operating, LP 5.875% 2024 | | | 294 | | | | 331 | |
| Energy Transfer Operating, LP 2.90% 2025 | | | 4,402 | | | | 4,661 | |
| Energy Transfer Operating, LP 3.75% 2030 | | | 7,707 | | | | 8,319 | |
| Energy Transfer Operating, LP 5.00% 2050 | | | 15,408 | | | | 16,699 | |
| Energy Transfer Partners, LP 4.20% 2023 | | | 2,860 | | | | 3,085 | |
| Energy Transfer Partners, LP 4.50% 2024 | | | 4,915 | | | | 5,380 | |
| Energy Transfer Partners, LP 4.75% 2026 | | | 1,506 | | | | 1,705 | |
| Energy Transfer Partners, LP 4.20% 2027 | | | 45 | | | | 50 | |
| Energy Transfer Partners, LP 4.95% 2028 | | | 4,559 | | | | 5,256 | |
| Energy Transfer Partners, LP 5.25% 2029 | | | 1,275 | | | | 1,489 | |
| Energy Transfer Partners, LP 6.125% 2045 | | | 11,780 | | | | 13,993 | |
| Energy Transfer Partners, LP 5.30% 2047 | | | 10,459 | | | | 11,681 | |
| Energy Transfer Partners, LP 6.00% 2048 | | | 1,868 | | | | 2,223 | |
| Energy Transfer Partners, LP 6.25% 2049 | | | 1,775 | | | | 2,147 | |
| Energy Transfer Partners, LP, junior subordinated, 6.25% (3-month USD-LIBOR + 4.028% on 2/15/2023)1 | | | 7,850 | | | | 6,260 | |
| Energy Transfer Partners, LP, junior subordinated, 6.625% (3-month USD-LIBOR + 4.155% on 2/15/2028)1 | | | 500 | | | | 425 | |
| Enterprise Products Operating LLC 3.20% 2052 | | | 3,031 | | | | 3,091 | |
| EOG Resources, Inc. 4.375% 2030 | | | 451 | | | | 549 | |
| EOG Resources, Inc. 4.95% 2050 | | | 1,776 | | | | 2,409 | |
| EQT Corp. 3.00% 2022 | | | 6,700 | | | | 6,763 | |
| EQT Corp. 8.75% 2030 | | | 7,500 | | | | 9,178 | |
| Equinor ASA 3.625% 2028 | | | 4,928 | | | | 5,744 | |
| Equinor ASA 3.125% 2030 | | | 20,000 | | | | 22,706 | |
| Equinor ASA 3.25% 2049 | | | 5,687 | | | | 6,320 | |
| Exxon Mobil Corp. 3.043% 2026 | | | 4,625 | | | | 5,127 | |
| Exxon Mobil Corp. 2.61% 2030 | | | 1,293 | | | | 1,413 | |
| Exxon Mobil Corp. 3.452% 2051 | | | 4,701 | | | | 5,373 | |
| Kinder Morgan Energy Partners, LP 6.50% 2037 | | | 900 | | | | 1,167 | |
| Kinder Morgan Energy Partners, LP 5.50% 2044 | | | 700 | | | | 881 | |
| Kinder Morgan, Inc. 5.30% 2034 | | | 760 | | | | 937 | |
| MPLX LP 1.75% 2026 | | | 5,557 | | | | 5,754 | |
| MPLX LP 4.00% 2028 | | | 4,665 | | | | 5,368 | |
| MPLX LP 2.65% 2030 | | | 2,404 | | | | 2,522 | |
| MPLX LP 5.50% 2049 | | | 4,741 | | | | 6,243 | |
| Noble Energy, Inc. 3.25% 2029 | | | 744 | | | | 855 | |
| Noble Energy, Inc. 5.05% 2044 | | | 2,407 | | | | 3,386 | |
| Noble Energy, Inc. 4.95% 2047 | | | 4,845 | | | | 6,889 | |
| Noble Energy, Inc. 4.20% 2049 | | | 10,334 | | | | 13,419 | |
| Occidental Petroleum Corp. 2.90% 2024 | | | 4,336 | | | | 4,180 | |
| Odebrecht Drilling Norbe 7.35% 20262,3 | | | 37 | | | | 10 | |
| Odebrecht Drilling Norbe 0% 20492 | | | 1,150 | | | | 7 | |
| ONEOK, Inc. 2.20% 2025 | | | 193 | | | | 201 | |
| ONEOK, Inc. 5.85% 2026 | | | 896 | | | | 1,074 | |
| ONEOK, Inc. 3.10% 2030 | | | 540 | | | | 576 | |
| ONEOK, Inc. 6.35% 2031 | | | 2,794 | | | | 3,587 | |
| 162 | American Funds Insurance Series |
Bond Fund (continued)
| Bonds, notes & other debt instruments (continued) | | Principal amount
(000) | | | Value
(000) | |
| Corporate bonds, notes & loans (continued) | | | | | | | | |
| Energy (continued) | | | | | | | | |
| ONEOK, Inc. 5.20% 2048 | | $ | 9,563 | | | $ | 11,162 | |
| ONEOK, Inc. 4.50% 2050 | | | 1,266 | | | | 1,331 | |
| ONEOK, Inc. 7.15% 2051 | | | 3,275 | | | | 4,538 | |
| Petrobras Global Finance Co. 5.093% 2030 | | | 5,000 | | | | 5,594 | |
| Petrobras Global Finance Co. 6.90% 2049 | | | 4,000 | | | | 5,080 | |
| Petróleos Mexicanos 6.875% 2026 | | | 43,810 | | | | 47,928 | |
| Petróleos Mexicanos 6.50% 2027 | | | 29,533 | | | | 31,156 | |
| Pioneer Natural Resources Company 1.90% 2030 | | | 5,726 | | | | 5,676 | |
| Plains All American Pipeline, LP 3.80% 2030 | | | 590 | | | | 635 | |
| QEP Resources, Inc. 5.25% 2023 | | | 3,420 | | | | 3,605 | |
| Sabine Pass Liquefaction, LLC 6.25% 2022 | | | 2,300 | | | | 2,421 | |
| Sabine Pass Liquefaction, LLC 5.625% 20231 | | | 1,000 | | | | 1,099 | |
| Sabine Pass Liquefaction, LLC 5.75% 2024 | | | 8,000 | | | | 9,149 | |
| Sabine Pass Liquefaction, LLC 5.625% 2025 | | | 10,000 | | | | 11,667 | |
| Sabine Pass Liquefaction, LLC 5.875% 2026 | | | 15,700 | | | | 18,991 | |
| Sabine Pass Liquefaction, LLC 4.50% 20302 | | | 1,797 | | | | 2,131 | |
| Saudi Arabian Oil Co. 2.875% 20242 | | | 4,885 | | | | 5,189 | |
| Saudi Arabian Oil Co. 1.625% 20252 | | | 1,410 | | | | 1,446 | |
| Schlumberger BV 4.00% 20252 | | | 7,915 | | | | 9,004 | |
| Shell International Finance BV 3.875% 2028 | | | 9,410 | | | | 11,149 | |
| Southwestern Energy Co. 6.45% 20251 | | | 920 | | | | 956 | |
| Sunoco Logistics Operating Partners, LP 5.40% 2047 | | | 6,190 | | | | 6,982 | |
| Targa Resources Partners LP 5.125% 2025 | | | 175 | | | | 180 | |
| Targa Resources Partners LP 5.375% 2027 | | | 175 | | | | 184 | |
| TC PipeLines, LP 4.375% 2025 | | | 405 | | | | 457 | |
| Total Capital Canada Ltd. 2.75% 2023 | | | 2,140 | | | | 2,273 | |
| Total Capital International 3.127% 2050 | | | 6,910 | | | | 7,496 | |
| Total SE 2.986% 2041 | | | 1,726 | | | | 1,889 | |
| Total SE 3.386% 2060 | | | 5,200 | | | | 5,916 | |
| TransCanada PipeLines Ltd. 4.25% 2028 | | | 11,275 | | | | 13,320 | |
| TransCanada PipeLines Ltd. 4.10% 2030 | | | 4,776 | | | | 5,646 | |
| Transcontinental Gas Pipe Line Company, LLC 3.95% 2050 | | | 1,372 | | | | 1,556 | |
| Western Midstream Operating, LP 4.10% 20251 | | | 2,782 | | | | 2,871 | |
| Western Midstream Operating, LP 4.05% 2030 | | | 2,202 | | | | 2,453 | |
| Western Midstream Operating, LP 5.25% 2050 | | | 3,079 | | | | 3,392 | |
| Williams Partners LP 4.50% 2023 | | | 500 | | | | 552 | |
| Williams Partners LP 4.30% 2024 | | | 595 | | | | 657 | |
| WPX Energy, Inc. 4.50% 2030 | | | 7,995 | | | | 8,487 | |
| | | | | | | | 644,494 | |
| | | | | | | | | |
| Utilities 4.13% | | | | | | | | |
| Abu Dhabi National Energy Co. PJSC (TAQA) 4.375% 20252 | | | 10,500 | | | | 11,896 | |
| Abu Dhabi National Energy Co. PJSC (TAQA) 4.375% 20262 | | | 300 | | | | 348 | |
| AEP Transmission Co. LLC 3.65% 2050 | | | 350 | | | | 426 | |
| Alliant Energy Finance LLC 4.25% 20282 | | | 500 | | | | 581 | |
| Ameren Corp. 3.50% 2031 | | | 325 | | | | 374 | |
| Ameren Corp. 4.50% 2049 | | | 2,875 | | | | 3,914 | |
| American Electric Power Company, Inc. 2.30% 2030 | | | 1,825 | | | | 1,909 | |
| Berkshire Hathaway Energy Company 4.50% 2045 | | | 5,895 | | | | 7,475 | |
| Consolidated Edison Co. of New York, Inc. 3.875% 2047 | | | 9,200 | | | | 10,892 | |
| Consumers Energy Co. 4.05% 2048 | | | 8,270 | | | | 10,839 | |
| Consumers Energy Co. 3.75% 2050 | | | 5,625 | | | | 7,074 | |
| Duke Energy Corp. 3.75% 2024 | | | 3,826 | | | | 4,214 | |
| Duke Energy Florida, LLC 3.40% 2046 | | | 6,445 | | | | 7,372 | |
| Duke Energy Progress, LLC 3.70% 2028 | | | 3,750 | | | | 4,393 | |
| Edison International 3.125% 2022 | | | 2,900 | | | | 3,013 | |
| Edison International 3.55% 2024 | | | 6,850 | | | | 7,382 | |
| Edison International 4.95% 2025 | | | 175 | | | | 200 | |
| Edison International 5.75% 2027 | | | 3,181 | | | | 3,810 | |
| Edison International 4.125% 2028 | | | 3,644 | | | | 4,064 | |
| American Funds Insurance Series | 163 |
Bond Fund (continued)
| Bonds, notes & other debt instruments (continued) | | Principal amount
(000) | | | Value
(000) | |
| Corporate bonds, notes & loans (continued) | | | | | | | | |
| Utilities (continued) | | | | | | | | |
| Emera Inc. 6.75% 2076 (3-month USD-LIBOR + 5.44% on 6/15/2026)1 | | $ | 1,950 | | | $ | 2,282 | |
| Enel Società per Azioni 8.75% 2073 (USD Semi Annual 30/360 (vs. 3-month USD-LIBOR) + 5.88% on 9/24/2023)1,2 | | | 1,000 | | | | 1,170 | |
| Entergy Louisiana, LLC 4.20% 2048 | | | 6,325 | | | | 8,245 | |
| Eversource Energy 2.75% 2022 | | | 527 | | | | 541 | |
| Eversource Energy 3.80% 2023 | | | 5,000 | | | | 5,478 | |
| Exelon Corp. 3.40% 2026 | | | 1,570 | | | | 1,769 | |
| Exelon Corp. 4.05% 2030 | | | 1,250 | | | | 1,481 | |
| Exelon Corp. 4.70% 2050 | | | 250 | | | | 333 | |
| FirstEnergy Corp. 2.85% 2022 (3.10% on 1/15/2021)1 | | | 8,750 | | | | 8,897 | |
| FirstEnergy Corp. 1.60% 2026 | | | 481 | | | | 471 | |
| FirstEnergy Corp. 3.90% 2027 (4.40% on 1/16/2021)1 | | | 12,178 | | | | 13,434 | |
| FirstEnergy Corp. 3.50% 20282 | | | 2,400 | | | | 2,555 | |
| FirstEnergy Corp. 2.25% 2030 | | | 1,184 | | | | 1,146 | |
| FirstEnergy Corp. 2.65% 2030 | | | 3,428 | | | | 3,442 | |
| FirstEnergy Corp. 7.375% 2031 | | | 5,150 | | | | 7,349 | |
| FirstEnergy Corp., Series B, 4.25% 2023 (4.75% on 3/15/2021)1 | | | 2,750 | | | | 2,905 | |
| Georgia Power Co. 3.70% 2050 | | | 1,938 | | | | 2,337 | |
| IPALCO Enterprises, Inc. 3.70% 2024 | | | 200 | | | | 218 | |
| Mississippi Power Co. 4.25% 2042 | | | 11,247 | | | | 13,614 | |
| NextEra Energy Capital Holdings, Inc. 2.25% 2030 | | | 2,700 | | | | 2,833 | |
| Niagara Mohawk Power Corp. 3.508% 20242 | | | 7,575 | | | | 8,325 | |
| Niagara Mohawk Power Corp. 4.278% 20342 | | | 1,000 | | | | 1,248 | |
| Pacific Gas and Electric Co. 1.75% 2022 | | | 13,000 | | | | 13,038 | |
| Pacific Gas and Electric Co. 3.25% 2023 | | | 5,615 | | | | 5,862 | |
| Pacific Gas and Electric Co. 3.40% 2024 | | | 850 | | | | 906 | |
| Pacific Gas and Electric Co. 2.95% 2026 | | | 9,436 | | | | 9,988 | |
| Pacific Gas and Electric Co. 3.15% 2026 | | | 8,705 | | | | 9,283 | |
| Pacific Gas and Electric Co. 2.10% 2027 | | | 456 | | | | 463 | |
| Pacific Gas and Electric Co. 3.30% 2027 | | | 9,125 | | | | 9,754 | |
| Pacific Gas and Electric Co. 3.30% 2027 | | | 4,675 | | | | 5,009 | |
| Pacific Gas and Electric Co. 3.75% 2028 | | | 6,788 | | | | 7,421 | |
| Pacific Gas and Electric Co. 4.65% 2028 | | | 7,900 | | | | 9,030 | |
| Pacific Gas and Electric Co. 4.55% 2030 | | | 14,505 | | | | 16,539 | |
| Pacific Gas and Electric Co. 2.50% 2031 | | | 19,695 | | | | 19,745 | |
| Pacific Gas and Electric Co. 3.30% 2040 | | | 8,898 | | | | 8,891 | |
| Pacific Gas and Electric Co. 3.75% 2042 | | | 7,825 | | | | 7,885 | |
| Pacific Gas and Electric Co. 4.75% 2044 | | | 336 | | | | 378 | |
| Pacific Gas and Electric Co. 3.95% 2047 | | | 2,835 | | | | 2,941 | |
| Pacific Gas and Electric Co. 3.50% 2050 | | | 6,567 | | | | 6,542 | |
| Progress Energy, Inc. 7.75% 2031 | | | 1,820 | | | | 2,713 | |
| Public Service Electric and Gas Co. 3.20% 2029 | | | 6,000 | | | | 6,849 | |
| Puget Energy, Inc. 6.00% 2021 | | | 3,135 | | | | 3,245 | |
| Puget Energy, Inc. 5.625% 2022 | | | 8,004 | | | | 8,477 | |
| Puget Energy, Inc. 3.65% 2025 | | | 3,000 | | | | 3,312 | |
| San Diego Gas & Electric Co. 3.32% 2050 | | | 1,350 | | | | 1,539 | |
| Southern California Edison Co. 3.70% 2025 | | | 1,275 | | | | 1,431 | |
| Southern California Edison Co. 2.85% 2029 | | | 7,500 | | | | 8,186 | |
| Southern California Edison Co. 4.20% 2029 | | | 11,700 | | | | 13,853 | |
| Southern California Edison Co. 5.35% 2035 | | | 6,450 | | | | 8,762 | |
| Southern California Edison Co. 5.75% 2035 | | | 4,550 | | | | 6,291 | |
| Southern California Edison Co. 5.625% 2036 | | | 7,050 | | | | 9,007 | |
| Southern California Edison Co. 5.55% 2037 | | | 2,775 | | | | 3,553 | |
| Southern California Edison Co. 5.95% 2038 | | | 5,654 | | | | 7,691 | |
| Southern California Edison Co. 4.50% 2040 | | | 8,620 | | | | 10,400 | |
| Southern California Edison Co. 5.50% 2040 | | | 607 | | | | 811 | |
| Southern California Edison Co. 4.00% 2047 | | | 9,061 | | | | 10,644 | |
| Southern California Edison Co. 4.125% 2048 | | | 9,027 | | | | 10,788 | |
| Southern California Edison Co. 4.875% 2049 | | | 5,034 | | | | 6,649 | |
| Southern California Edison Co. 3.65% 2050 | | | 3,461 | | | | 3,935 | |
| Southern California Edison Co., Series C, 3.60% 2045 | | | 2,717 | | | | 3,015 | |
| 164 | American Funds Insurance Series |
Bond Fund (continued)
| Bonds, notes & other debt instruments (continued) | | Principal amount (000) | | | Value
(000) | |
| Corporate bonds, notes & loans (continued) | | | | | | | | |
| Utilities (continued) | | | | | | | | |
| Southern California Gas Company 2.55% 2030 | | $ | 625 | | | $ | 678 | |
| Southern Co. 3.70% 2030 | | | 5,450 | | | | 6,318 | |
| Southern Co. 4.25% 2036 | | | 1,725 | | | | 2,118 | |
| Southern Co. 4.40% 2046 | | | 787 | | | | 991 | |
| Tampa Electric Co. 2.60% 2022 | | | 4,350 | | | | 4,486 | |
| Wisconsin Power and Light Co. 3.65% 2050 | | | 1,550 | | | | 1,842 | |
| Xcel Energy Inc. 3.30% 2025 | | | 5,650 | | | | 6,215 | |
| Xcel Energy Inc. 2.60% 2029 | | | 2,925 | | | | 3,169 | |
| | | | | | | | 470,892 | |
| | | | | | | | | |
| Health care 3.88% | | | | | | | | |
| Abbott Laboratories 3.40% 2023 | | | 910 | | | | 987 | |
| Abbott Laboratories 3.75% 2026 | | | 2,244 | | | | 2,630 | |
| Abbott Laboratories 4.75% 2036 | | | 4,565 | | | | 6,291 | |
| AbbVie Inc. 3.20% 2022 | | | 9,600 | | | | 10,054 | |
| AbbVie Inc. 3.20% 2029 | | | 23,754 | | | | 26,648 | |
| Amgen Inc. 2.45% 2030 | | | 10,000 | | | | 10,720 | |
| Anthem, Inc. 2.375% 2025 | | | 1,534 | | | | 1,641 | |
| AstraZeneca PLC 4.00% 2029 | | | 5,920 | | | | 7,056 | |
| Bayer US Finance II LLC 3.875% 20232 | | | 8,783 | | | | 9,576 | |
| Bayer US Finance II LLC 4.25% 20252 | | | 17,570 | | | | 20,106 | |
| Becton, Dickinson and Company 3.734% 2024 | | | 903 | | | | 1,001 | |
| Becton, Dickinson and Company 4.669% 2047 | | | 3,395 | | | | 4,458 | |
| Boston Scientific Corp. 3.375% 2022 | | | 350 | | | | 365 | |
| Boston Scientific Corp. 3.85% 2025 | | | 255 | | | | 288 | |
| Centene Corp. 4.75% 2025 | | | 325 | | | | 334 | |
| Centene Corp. 4.25% 2027 | | | 14,860 | | | | 15,786 | |
| Centene Corp. 4.625% 2029 | | | 14,945 | | | | 16,611 | |
| Centene Corp. 3.375% 2030 | | | 15,718 | | | | 16,561 | |
| Cigna Corp. 4.375% 2028 | | | 7,090 | | | | 8,571 | |
| EMD Finance LLC 2.95% 20222 | | | 2,100 | | | | 2,157 | |
| Gilead Sciences, Inc. 1.20% 2027 | | | 3,828 | | | | 3,859 | |
| GlaxoSmithKline PLC 3.375% 2023 | | | 16,800 | | | | 18,030 | |
| Laboratory Corp. of America Holdings 4.70% 2045 | | | 4,160 | | | | 5,465 | |
| Novartis Capital Corp. 1.75% 2025 | | | 2,361 | | | | 2,478 | |
| Novartis Capital Corp. 2.20% 2030 | | | 5,446 | | | | 5,851 | |
| Shire PLC 3.20% 2026 | | | 15,100 | | | | 16,901 | |
| Teva Pharmaceutical Finance Co. BV 2.20% 2021 | | | 4,911 | | | | 4,908 | |
| Teva Pharmaceutical Finance Co. BV 2.80% 2023 | | | 16,420 | | | | 16,286 | |
| Teva Pharmaceutical Finance Co. BV 7.125% 2025 | | | 45,000 | | | | 49,828 | |
| Teva Pharmaceutical Finance Co. BV 3.15% 2026 | | | 68,853 | | | | 66,315 | |
| Teva Pharmaceutical Finance Co. BV 6.75% 2028 | | | 26,824 | | | | 30,394 | |
| Teva Pharmaceutical Finance Co. BV 4.10% 2046 | | | 46,666 | | | | 41,649 | |
| UnitedHealth Group Inc. 3.35% 2022 | | | 4,385 | | | | 4,597 | |
| UnitedHealth Group Inc. 3.75% 2025 | | | 5,410 | | | | 6,166 | |
| Zimmer Holdings, Inc. 3.15% 2022 | | | 7,845 | | | | 8,070 | |
| | | | | | | | 442,638 | |
| | | | | | | | | |
| Consumer discretionary 3.74% | | | | | | | | |
| Carnival Corp. 11.50% 20232 | | | 9,140 | | | | 10,582 | |
| DaimlerChrysler North America Holding Corp. 1.75% 20232 | | | 8,000 | | | | 8,216 | |
| DaimlerChrysler North America Holding Corp. 3.35% 20232 | | | 2,000 | | | | 2,118 | |
| Ford Motor Credit Co. 4.375% 2023 | | | 16,400 | | | | 17,056 | |
| Ford Motor Credit Co. 4.063% 2024 | | | 17,230 | | | | 18,123 | |
| Ford Motor Credit Co. 3.815% 2027 | | | 3,630 | | | | 3,737 | |
| Ford Motor Credit Co. 4.125% 2027 | | | 28,345 | | | | 29,727 | |
| Ford Motor Credit Co. 4.271% 2027 | | | 17,442 | | | | 18,314 | |
| Ford Motor Credit Co. 5.113% 2029 | | | 8,075 | | | | 9,003 | |
| General Motors Company 5.40% 2023 | | | 421 | | | | 472 | |
| General Motors Company 6.125% 2025 | | | 28,743 | | | | 34,886 | |
| American Funds Insurance Series | 165 |
Bond Fund (continued)
| Bonds, notes & other debt instruments (continued) | | Principal amount
(000) | | | Value
(000) | |
| Corporate bonds, notes & loans (continued) | | | | | | | | |
| Consumer discretionary (continued) | | | | | | | | |
| General Motors Company 6.80% 2027 | | $ | 1,030 | | | $ | 1,325 | |
| General Motors Company 5.00% 2035 | | | 5,000 | | | | 6,026 | |
| General Motors Company 6.75% 2046 | | | 1,093 | | | | 1,579 | |
| General Motors Company 5.40% 2048 | | | 7,200 | | | | 9,068 | |
| General Motors Company 5.95% 2049 | | | 334 | | | | 452 | |
| General Motors Financial Co. 3.15% 2022 | | | 25 | | | | 26 | |
| General Motors Financial Co. 3.45% 2022 | | | 200 | | | | 205 | |
| General Motors Financial Co. 3.55% 2022 | | | 3,703 | | | | 3,863 | |
| General Motors Financial Co. 3.25% 2023 | | | 964 | | | | 1,011 | |
| General Motors Financial Co. 3.70% 2023 | | | 2,076 | | | | 2,202 | |
| General Motors Financial Co. 5.20% 2023 | | | 4,371 | | | | 4,795 | |
| General Motors Financial Co. 3.50% 2024 | | | 9,945 | | | | 10,757 | |
| General Motors Financial Co. 3.95% 2024 | | | 6,269 | | | | 6,830 | |
| General Motors Financial Co. 5.10% 2024 | | | 1,081 | | | | 1,210 | |
| General Motors Financial Co. 2.75% 2025 | | | 3,819 | | | | 4,086 | |
| General Motors Financial Co. 2.90% 2025 | | | 1,032 | | | | 1,103 | |
| General Motors Financial Co. 4.00% 2025 | | | 587 | | | | 647 | |
| General Motors Financial Co. 4.35% 2025 | | | 11,358 | | | | 12,692 | |
| General Motors Financial Co. 5.25% 2026 | | | 995 | | | | 1,174 | |
| General Motors Financial Co. 2.70% 2027 | | | 6,079 | | | | 6,454 | |
| General Motors Financial Co. 3.60% 2030 | | | 465 | | | | 519 | |
| Home Depot, Inc. 4.40% 2021 | | | 7,200 | | | | 7,200 | |
| Home Depot, Inc. 2.95% 2029 | | | 6,081 | | | | 6,914 | |
| Home Depot, Inc. 4.50% 2048 | | | 1,915 | | | | 2,691 | |
| Hyundai Capital America 3.75% 20212 | | | 8,500 | | | | 8,626 | |
| Hyundai Capital America 2.85% 20222 | | | 4,118 | | | | 4,270 | |
| Hyundai Capital America 3.00% 20222 | | | 4,500 | | | | 4,642 | |
| Hyundai Capital America 3.25% 20222 | | | 1,521 | | | | 1,584 | |
| Hyundai Capital America 3.95% 20222 | | | 8,000 | | | | 8,268 | |
| Hyundai Capital America 1.25% 20232 | | | 3,150 | | | | 3,189 | |
| Hyundai Capital America 2.375% 20232 | | | 9,977 | | | | 10,292 | |
| Hyundai Capital America 3.40% 20242 | | | 8,180 | | | | 8,730 | |
| Hyundai Capital America 1.80% 20252 | | | 12,714 | | | | 13,047 | |
| Hyundai Capital America 2.65% 20252 | | | 13,054 | | | | 13,854 | |
| Hyundai Capital America 2.375% 20272 | | | 6,264 | | | | 6,575 | |
| Hyundai Capital America 3.00% 20272 | | | 10,408 | | | | 11,325 | |
| International Game Technology PLC 6.25% 20272 | | | 880 | | | | 1,009 | |
| International Game Technology PLC 5.25% 20292 | | | 4,075 | | | | 4,397 | |
| McDonald’s Corp. 2.125% 2030 | | | 2,482 | | | | 2,620 | |
| McDonald’s Corp. 4.45% 2047 | | | 3,535 | | | | 4,593 | |
| McDonald’s Corp. 3.625% 2049 | | | 2,938 | | | | 3,454 | |
| MGM Resorts International 7.75% 2022 | | | 2,000 | | | | 2,134 | |
| NIKE, Inc. 3.25% 2040 | | | 6,171 | | | | 7,183 | |
| NIKE, Inc. 3.875% 2045 | | | 1,560 | | | | 2,025 | |
| Nissan Motor Co., Ltd. 2.60% 20222 | | | 1,415 | | | | 1,452 | |
| Sally Holdings LLC and Sally Capital Inc. 5.625% 2025 | | | 300 | | | | 309 | |
| Starbucks Corp. 3.75% 2047 | | | 3,785 | | | | 4,429 | |
| Starbucks Corp. 4.50% 2048 | | | 7,680 | | | | 10,027 | |
| Toyota Motor Credit Corp. 3.375% 2030 | | | 6,664 | | | | 7,802 | |
| Volkswagen Group of America Finance, LLC 4.00% 20212 | | | 4,510 | | | | 4,649 | |
| Volkswagen Group of America Finance, LLC 2.70% 20222 | | | 2,473 | | | | 2,565 | |
| Volkswagen Group of America Finance, LLC 3.125% 20232 | | | 2,459 | | | | 2,598 | |
| Volkswagen Group of America Finance, LLC 4.25% 20232 | | | 15,000 | | | | 16,512 | |
| Volkswagen Group of America Finance, LLC 2.85% 20242 | | | 2,996 | | | | 3,202 | |
| Volkswagen Group of America Finance, LLC 3.35% 20252 | | | 2,636 | | | | 2,900 | |
| Volkswagen Group of America Finance, LLC 4.625% 20252 | | | 1,177 | | | | 1,373 | |
| Volkswagen Group of America Finance, LLC 1.625% 20272 | | | 1,645 | | | | 1,660 | |
| | | | | | | | 426,358 | |
| 166 | American Funds Insurance Series |
Bond Fund (continued)
| Bonds, notes & other debt instruments (continued) | | Principal amount
(000) | | | Value
(000) | |
| Corporate bonds, notes & loans (continued) | | | | | | | | |
| Industrials 2.75% | | | | | | | | |
| Air Lease Corp. 2.875% 2026 | | $ | 11,453 | | | $ | 12,127 | |
| Airbus Group SE 2.70% 20232 | | | 2,120 | | | | 2,227 | |
| Avolon Holdings Funding Ltd. 3.625% 20222 | | | 2,810 | | | | 2,872 | |
| Avolon Holdings Funding Ltd. 3.95% 20242 | | | 12,514 | | | | 13,225 | |
| Avolon Holdings Funding Ltd. 4.25% 20262 | | | 3,302 | | | | 3,560 | |
| Avolon Holdings Funding Ltd. 3.25% 20272 | | | 8,000 | | | | 8,181 | |
| BNSF Funding Trust I, junior subordinated, 6.613% 2055 (3-month USD-LIBOR + 2.35% on 1/15/2026)1 | | | 1,680 | | | | 1,922 | |
| Boeing Company 4.508% 2023 | | | 7,801 | | | | 8,435 | |
| Boeing Company 1.95% 2024 | | | 8,719 | | | | 8,983 | |
| Boeing Company 2.80% 2024 | | | 500 | | | | 525 | |
| Boeing Company 4.875% 2025 | | | 31,752 | | | | 36,216 | |
| Boeing Company 2.75% 2026 | | | 15,262 | | | | 16,056 | |
| Boeing Company 3.10% 2026 | | | 649 | | | | 695 | |
| Boeing Company 2.70% 2027 | | | 12,728 | | | | 13,241 | |
| Boeing Company 5.04% 2027 | | | 10,099 | | | | 11,818 | |
| Boeing Company 3.25% 2028 | | | 5,379 | | | | 5,770 | |
| Boeing Company 3.25% 2028 | | | 1,925 | | | | 2,039 | |
| Boeing Company 3.45% 2028 | | | 1,400 | | | | 1,504 | |
| Boeing Company 3.20% 2029 | | | 675 | | | | 713 | |
| Boeing Company 5.15% 2030 | | | 13,626 | | | | 16,514 | |
| Boeing Company 3.625% 2031 | | | 7,358 | | | | 8,074 | |
| Boeing Company 3.90% 2049 | | | 1,411 | | | | 1,497 | |
| Boeing Company 5.805% 2050 | | | 1,782 | | | | 2,462 | |
| Bohai Financial Investment Holding Co., Ltd. 5.25% 20222 | | | 2,485 | | | | 2,609 | |
| Carrier Global Corp. 2.722% 2030 | | | 855 | | | | 914 | |
| Carrier Global Corp. 3.377% 2040 | | | 15,000 | | | | 16,400 | |
| Continental Airlines, Inc., Series 2001-1, Class A1, 6.703% 2022 | | | 38 | | | | 38 | |
| Continental Airlines, Inc., Series 2000-2, Class A1, 7.707% 2022 | | | 164 | | | | 163 | |
| GE Capital International Funding Co. 4.418% 2035 | | | 20,075 | | | | 23,965 | |
| General Electric Capital Corp. 3.373% 2025 | | | 4,615 | | | | 5,139 | |
| General Electric Capital Corp. 6.15% 2037 | | | 1,425 | | | | 1,967 | |
| General Electric Co. 3.45% 2027 | | | 1,250 | | | | 1,412 | |
| General Electric Co. 3.625% 2030 | | | 675 | | | | 772 | |
| General Electric Co. 4.25% 2040 | | | 5,500 | | | | 6,502 | |
| General Electric Co. 4.35% 2050 | | | 6,575 | | | | 7,997 | |
| Mexico City Airport Trust 5.50% 2046 | | | 1,959 | | | | 2,090 | |
| Mexico City Airport Trust 5.50% 2047 | | | 5,909 | | | | 6,238 | |
| Mexico City Airport Trust 5.50% 20472 | | | 1,132 | | | | 1,195 | |
| Northrop Grumman Corp. 3.25% 2028 | | | 10,845 | | | | 12,266 | |
| Union Pacific Corp. 2.15% 2027 | | | 2,213 | | | | 2,354 | |
| Union Pacific Corp. 2.40% 2030 | | | 4,454 | | | | 4,802 | |
| Union Pacific Corp. 3.25% 2050 | | | 7,000 | | | | 7,980 | |
| United Rentals, Inc. 5.50% 2027 | | | 5,000 | | | | 5,366 | |
| United Technologies Corp. 3.125% 2027 | | | 9,525 | | | | 10,695 | |
| Vinci SA 3.75% 20292 | | | 12,456 | | | | 14,620 | |
| | | | | | | | 314,140 | |
| | | | | | | | | |
| Consumer staples 2.24% | | | | | | | | |
| Altria Group, Inc. 2.85% 2022 | | | 4,800 | | | | 4,986 | |
| Altria Group, Inc. 4.40% 2026 | | | 8,840 | | | | 10,266 | |
| Altria Group, Inc. 4.50% 2043 | | | 1,585 | | | | 1,820 | |
| Altria Group, Inc. 5.95% 2049 | | | 9,039 | | | | 12,664 | |
| Anheuser-Busch InBev NV 4.75% 2029 | | | 7,500 | | | | 9,255 | |
| Anheuser-Busch InBev NV 5.55% 2049 | | | 11,149 | | | | 15,850 | |
| Anheuser-Busch InBev NV 4.50% 2050 | | | 5,000 | | | | 6,302 | |
| British American Tobacco International Finance PLC 3.95% 20252 | | | 16,879 | | | | 18,997 | |
| British American Tobacco International Finance PLC 1.668% 2026 | | | 4,070 | | | | 4,168 | |
| British American Tobacco PLC 3.557% 2027 | | | 10,991 | | | | 12,241 | |
| British American Tobacco PLC 2.259% 2028 | | | 4,348 | | | | 4,517 | |
| American Funds Insurance Series | 167 |
Bond Fund (continued)
| Bonds, notes & other debt instruments (continued) | | Principal amount
(000) | | | Value
(000) | |
| Corporate bonds, notes & loans (continued) | | | | | | | | |
| Consumer staples (continued) | | | | | | | | |
| British American Tobacco PLC 4.39% 2037 | | $ | 1,500 | | | $ | 1,679 | |
| British American Tobacco PLC 4.54% 2047 | | | 12,786 | | | | 14,199 | |
| British American Tobacco PLC 4.758% 2049 | | | 23,659 | | | | 27,475 | |
| Conagra Brands, Inc. 5.30% 2038 | | | 436 | | | | 584 | |
| Conagra Brands, Inc. 5.40% 2048 | | | 57 | | | | 81 | |
| Constellation Brands, Inc. 3.50% 2027 | | | 7,500 | | | | 8,470 | |
| General Mills, Inc. (3-month USD-LIBOR + 0.54%) 0.770% 20214 | | | 10,620 | | | | 10,636 | |
| General Mills, Inc. 3.20% 2021 | | | 2,170 | | | | 2,187 | |
| Imperial Tobacco Finance PLC 3.50% 20232 | | | 2,335 | | | | 2,446 | |
| JBS Investments GmbH II 7.00% 20262 | | | 3,868 | | | | 4,181 | |
| JBS Investments GmbH II 7.00% 2026 | | | 1,665 | | | | 1,800 | |
| Keurig Dr Pepper Inc. 4.057% 2023 | | | 6,190 | | | | 6,730 | |
| Keurig Dr Pepper Inc. 4.597% 2028 | | | 10,752 | | | | 13,101 | |
| Molson Coors Brewing Co. 2.10% 2021 | | | 2,415 | | | | 2,435 | |
| Molson Coors Brewing Co. 4.20% 2046 | | | 9,955 | | | | 11,423 | |
| Philip Morris International Inc. 4.25% 2044 | | | 9,550 | | | | 12,029 | |
| Reynolds American Inc. 4.45% 2025 | | | 14,570 | | | | 16,598 | |
| Reynolds American Inc. 5.85% 2045 | | | 1,970 | | | | 2,521 | |
| Wal-Mart Stores, Inc. 2.85% 2024 | | | 6,765 | | | | 7,321 | |
| Wal-Mart Stores, Inc. 3.05% 2026 | | | 7,720 | | | | 8,694 | |
| | | | | | | | 255,656 | |
| | | | | | | | | |
| Communication services 1.48% | | | | | | | | |
| AT&T Inc. 2.55% 20332 | | | 4,953 | | | | 5,104 | |
| AT&T Inc. 3.50% 20532 | | | 1,915 | | | | 1,915 | |
| AT&T Inc. 3.55% 20552 | | | 8,325 | | | | 8,297 | |
| CCO Holdings LLC and CCO Holdings Capital Corp. 5.125% 20272 | | | 4,800 | | | | 5,100 | |
| CCO Holdings LLC and CCO Holdings Capital Corp. 2.80% 2031 | | | 5,642 | | | | 5,968 | |
| CCO Holdings LLC and CCO Holdings Capital Corp. 5.75% 2048 | | | 5,000 | | | | 6,547 | |
| CenturyLink, Inc. 4.00% 20272 | | | 16,374 | | | | 16,929 | |
| CenturyLink, Inc. 7.65% 2042 | | | 5,000 | | | | 6,066 | |
| Comcast Corp. 3.15% 2028 | | | 7,200 | | | | 8,130 | |
| Comcast Corp. 2.65% 2030 | | | 7,500 | | | | 8,199 | |
| Comcast Corp. 4.00% 2048 | | | 5,000 | | | | 6,292 | |
| NBCUniversal Enterprise, Inc., junior subordinated, 5.25% 20492 | | | 5,170 | | | | 5,280 | |
| SoftBank Group Corp. 3.36% 20232 | | | 2,175 | | | | 2,199 | |
| Tencent Holdings Ltd. 2.39% 20302 | | | 10,000 | | | | 10,264 | |
| T-Mobile US, Inc. 3.50% 20252 | | | 3,275 | | | | 3,622 | |
| T-Mobile US, Inc. 3.75% 20272 | | | 5,000 | | | | 5,699 | |
| T-Mobile US, Inc. 3.875% 20302 | | | 4,500 | | | | 5,217 | |
| T-Mobile US, Inc. 3.00% 20412 | | | 2,100 | | | | 2,181 | |
| T-Mobile US, Inc. 4.50% 20502 | | | 11,575 | | | | 14,298 | |
| Verizon Communications Inc. 4.40% 2034 | | | 5,080 | | | | 6,342 | |
| Verizon Communications Inc. 2.875% 2050 | | | 3,000 | | | | 3,026 | |
| Vodafone Group PLC 4.375% 2028 | | | 10,000 | | | | 11,979 | |
| Vodafone Group PLC 4.25% 2050 | | | 3,050 | | | | 3,785 | |
| Walt Disney Company 2.65% 2031 | | | 15,000 | | | | 16,450 | |
| | | | | | | | 168,889 | |
| | | | | | | | | |
| Information technology 1.02% | | | | | | | | |
| Apple Inc. 1.55% 2021 | | | 11,630 | | | | 11,714 | |
| Broadcom Inc. 3.625% 2024 | | | 3,000 | | | | 3,297 | |
| Broadcom Inc. 3.15% 2025 | | | 5,000 | | | | 5,462 | |
| Broadcom Inc. 4.25% 2026 | | | 41,375 | | | | 47,428 | |
| Broadcom Ltd. 3.875% 2027 | | | 14,860 | | | | 16,706 | |
| Financial & Risk US Holdings, Inc. 6.25% 20262 | | | 3,325 | | | | 3,556 | |
| Microsoft Corp. 2.525% 2050 | | | 10,000 | | | | 10,546 | |
| 168 | American Funds Insurance Series |
Bond Fund (continued)
| Bonds, notes & other debt instruments (continued) | | Principal amount
(000) | | | Value
(000) | |
| Corporate bonds, notes & loans (continued) | | | | | | | | |
| Information technology (continued) | | | | | | | | |
| PayPal Holdings, Inc. 1.65% 2025 | | $ | 6,989 | | | $ | 7,308 | |
| Simon Property Group, LP 3.50% 2025 | | | 4,775 | | | | 5,305 | |
| Simon Property Group, LP 2.65% 2030 | | | 5,225 | | | | 5,569 | |
| | | | | | | | 116,891 | |
| | | | | | | | | |
| Real estate 0.36% | | | | | | | | |
| Alexandria Real Estate Equities, Inc. 3.95% 2028 | | | 1,425 | | | | 1,657 | |
| Alexandria Real Estate Equities, Inc. 4.50% 2029 | | | 150 | | | | 184 | |
| American Campus Communities, Inc. 3.75% 2023 | | | 2,900 | | | | 3,066 | |
| American Campus Communities, Inc. 3.875% 2031 | | | 620 | | | | 703 | |
| Corporate Office Properties LP 5.25% 2024 | | | 10 | | | | 11 | |
| Equinix, Inc. 2.90% 2026 | | | 3,287 | | | | 3,599 | |
| Equinix, Inc. 3.20% 2029 | | | 3,846 | | | | 4,245 | |
| Essex Portfolio LP 3.25% 2023 | | | 335 | | | | 353 | |
| Essex Portfolio LP 3.875% 2024 | | | 1,000 | | | | 1,099 | |
| Hospitality Properties Trust 5.00% 2022 | | | 1,270 | | | | 1,295 | |
| Hospitality Properties Trust 4.50% 2025 | | | 855 | | | | 844 | |
| Hospitality Properties Trust 3.95% 2028 | | | 1,710 | | | | 1,655 | |
| Iron Mountain Inc. 4.875% 20272 | | | 1,605 | | | | 1,682 | |
| Iron Mountain Inc. 5.25% 20282 | | | 3,500 | | | | 3,700 | |
| Iron Mountain Inc. 4.875% 20292 | | | 2,770 | | | | 2,925 | |
| Iron Mountain Inc. 5.25% 20302 | | | 3,000 | | | | 3,244 | |
| Iron Mountain Inc. 4.50% 20312 | | | 2,080 | | | | 2,181 | |
| Kimco Realty Corp. 3.40% 2022 | | | 1,045 | | | | 1,098 | |
| Omega Healthcare Investors, Inc. 4.375% 2023 | | | 900 | | | | 974 | |
| Piedmont Operating Partnership LP 4.45% 2024 | | | 1,000 | | | | 1,072 | |
| Scentre Group 2.375% 20212 | | | 175 | | | | 176 | |
| Scentre Group 3.50% 20252 | | | 4,565 | | | | 4,885 | |
| | | | | | | | 40,648 | |
| | | | | | | | | |
| Materials 0.25% | | | | | | | | |
| Air Products and Chemicals, Inc. 2.70% 2040 | | | 5,736 | | | | 6,182 | |
| Braskem SA 4.50% 20302 | | | 2,500 | | | | 2,572 | |
| LYB International Finance III, LLC 2.25% 2030 | | | 3,802 | | | | 3,935 | |
| LYB International Finance III, LLC 3.375% 2040 | | | 2,996 | | | | 3,208 | |
| LYB International Finance III, LLC 3.625% 2051 | | | 8,881 | | | | 9,723 | |
| LYB International Finance III, LLC 3.80% 2060 | | | 2,833 | | | | 3,061 | |
| | | | | | | | 28,681 | |
| | | | | | | | | |
| Total corporate bonds, notes & loans | | | | | | | 3,792,833 | |
| | | | | | | | | |
| Mortgage-backed obligations 31.72% | | | | | | | | |
| Federal agency mortgage-backed obligations 30.74% | | | | | | | | |
| Fannie Mae Pool #976945 5.50% 20235 | | | 67 | | | | 68 | |
| Fannie Mae Pool #AB1068 4.50% 20255 | | | 136 | | | | 145 | |
| Fannie Mae Pool #AB4088 3.00% 20265 | | | 629 | | | | 662 | |
| Fannie Mae Pool #AJ9156 3.00% 20265 | | | 326 | | | | 343 | |
| Fannie Mae Pool #AJ6967 3.00% 20265 | | | 164 | | | | 173 | |
| Fannie Mae Pool #AJ5522 3.00% 20265 | | | 4 | | | | 4 | |
| Fannie Mae Pool #256133 4.50% 20265 | | | 161 | | | | 175 | |
| Fannie Mae Pool #AK5394 3.00% 20275 | | | 774 | | | | 814 | |
| Fannie Mae Pool #AL5603 3.00% 20275 | | | 685 | | | | 719 | |
| Fannie Mae Pool #AX3597 3.00% 20275 | | | 318 | | | | 335 | |
| Fannie Mae Pool #AL4641 3.00% 20275 | | | 300 | | | | 315 | |
| Fannie Mae Pool #AB4281 3.00% 20275 | | | 136 | | | | 143 | |
| Fannie Mae Pool #AJ9355 3.00% 20275 | | | 88 | | | | 92 | |
| Fannie Mae Pool #AB4486 3.00% 20275 | | | 69 | | | | 73 | |
| Fannie Mae Pool #AB5236 3.00% 20275 | | | 27 | | | | 29 | |
| Fannie Mae Pool #AO0800 3.00% 20275 | | | 24 | | | | 25 | |
| Fannie Mae Pool #AK0971 3.00% 20275 | | | 12 | | | | 12 | |
| Fannie Mae Pool #AL3802 3.00% 20285 | | | 957 | | | | 1,005 | |
| American Funds Insurance Series | 169 |
Bond Fund (continued)
| Bonds, notes & other debt instruments (continued) | | Principal amount
(000) | | | Value
(000) | |
| Mortgage-backed obligations (continued) | | | | | | | | |
| Federal agency mortgage-backed obligations (continued) | | | | | | | | |
| Fannie Mae Pool #AR3058 3.00% 20285 | | $ | 107 | | | $ | 113 | |
| Fannie Mae Pool #AL8241 3.00% 20295 | | | 908 | | | | 954 | |
| Fannie Mae Pool #BM4299 3.00% 20305 | | | 2,701 | | | | 2,834 | |
| Fannie Mae Pool #AL9573 3.00% 20315 | | | 109 | | | | 114 | |
| Fannie Mae Pool #AS8018 3.00% 20315 | | | 81 | | | | 87 | |
| Fannie Mae Pool #BM4741 3.00% 20325 | | | 66 | | | | 69 | |
| Fannie Mae Pool #MA4229 2.00% 20365 | | | 58,877 | | | | 61,594 | |
| Fannie Mae Pool #924866 2.265% 20374,5 | | | 728 | | | | 737 | |
| Fannie Mae Pool #945680 6.00% 20375 | | | 709 | | | | 840 | |
| Fannie Mae Pool #913966 6.00% 20375 | | | 70 | | | | 81 | |
| Fannie Mae Pool #889982 5.50% 20385 | | | 1,514 | | | | 1,779 | |
| Fannie Mae Pool #988588 5.50% 20385 | | | 271 | | | | 319 | |
| Fannie Mae Pool #AB1297 5.00% 20405 | | | 323 | | | | 376 | |
| Fannie Mae Pool #AH8144 5.00% 20415 | | | 1,915 | | | | 2,228 | |
| Fannie Mae Pool #AH9479 5.00% 20415 | | | 1,866 | | | | 2,170 | |
| Fannie Mae Pool #AI1862 5.00% 20415 | | | 1,569 | | | | 1,825 | |
| Fannie Mae Pool #AI3510 5.00% 20415 | | | 923 | | | | 1,073 | |
| Fannie Mae Pool #AJ0704 5.00% 20415 | | | 837 | | | | 974 | |
| Fannie Mae Pool #AJ5391 5.00% 20415 | | | 479 | | | | 554 | |
| Fannie Mae Pool #BM6240 2.754% 20444,5 | | | 3,104 | | | | 3,245 | |
| Fannie Mae Pool #AZ3904 4.00% 20455 | | | 85 | | | | 92 | |
| Fannie Mae Pool #AL8522 3.50% 20465 | | | 1,516 | | | | 1,656 | |
| Fannie Mae Pool #BD1968 4.00% 20465 | | | 2,149 | | | | 2,347 | |
| Fannie Mae Pool #BE0592 4.00% 20465 | | | 851 | | | | 912 | |
| Fannie Mae Pool #BD5477 4.00% 20465 | | | 517 | | | | 566 | |
| Fannie Mae Pool #CA0770 3.50% 20475 | | | 10,841 | | | | 11,523 | |
| Fannie Mae Pool #BJ1910 3.50% 20475 | | | 4,361 | | | | 4,626 | |
| Fannie Mae Pool #CA0706 4.00% 20475 | | | 268 | | | | 288 | |
| Fannie Mae Pool #MA3058 4.00% 20475 | | | 108 | | | | 116 | |
| Fannie Mae Pool #BM4413 4.50% 20475 | | | 7,086 | | | | 7,724 | |
| Fannie Mae Pool #BF0293 3.00% 20485 | | | 13,107 | | | | 13,989 | |
| Fannie Mae Pool #BF0318 3.50% 20485 | | | 12,283 | | | | 13,278 | |
| Fannie Mae Pool #CA1189 3.50% 20485 | | | 3,157 | | | | 3,352 | |
| Fannie Mae Pool #BK0920 4.00% 20485 | | | 1,600 | | | | 1,709 | |
| Fannie Mae Pool #BJ9252 4.00% 20485 | | | 506 | | | | 540 | |
| Fannie Mae Pool #MA3384 4.00% 20485 | | | 308 | | | | 330 | |
| Fannie Mae Pool #BJ9256 4.00% 20485 | | | 287 | | | | 306 | |
| Fannie Mae Pool #BJ0639 4.00% 20485 | | | 214 | | | | 229 | |
| Fannie Mae Pool #BJ9169 4.00% 20485 | | | 182 | | | | 195 | |
| Fannie Mae Pool #BK0915 4.00% 20485 | | | 150 | | | | 160 | |
| Fannie Mae Pool #BJ5749 4.00% 20485 | | | 33 | | | | 36 | |
| Fannie Mae Pool #BM4676 4.00% 20485 | | | 25 | | | | 27 | |
| Fannie Mae Pool #CA2493 4.50% 20485 | | | 1,774 | | | | 1,928 | |
| Fannie Mae Pool #CA4534 3.00% 20495 | | | 16,409 | | | | 17,767 | |
| Fannie Mae Pool #CA3807 3.00% 20495 | | | 2,275 | | | | 2,468 | |
| Fannie Mae Pool #CA3806 3.00% 20495 | | | 1,230 | | | | 1,338 | |
| Fannie Mae Pool #FM0007 3.50% 20495 | | | 31,664 | | | | 34,351 | |
| Fannie Mae Pool #CA4802 3.50% 20495 | | | 30,616 | | | | 33,658 | |
| Fannie Mae Pool #FM1954 3.50% 20495 | | | 14,979 | | | | 16,159 | |
| Fannie Mae Pool #FM1589 3.50% 20495 | | | 9,307 | | | | 10,016 | |
| Fannie Mae Pool #FM2092 3.50% 20495 | | | 9,040 | | | | 9,875 | |
| Fannie Mae Pool #FM1262 4.00% 20495 | | | 125,351 | | | | 136,525 | |
| Fannie Mae Pool #MA4256 2.50% 20515 | | | 2,843 | | | | 2,998 | |
| Fannie Mae Pool #BF0264 3.50% 20585 | | | 14,025 | | | | 15,509 | |
| Fannie Mae Pool #BF0332 3.00% 20595 | | | 30,573 | | | | 33,245 | |
| Fannie Mae, Series 2001-4, Class GA, 9.081% 20254,5 | | | — | 6 | | | — | 6 |
| Fannie Mae, Series 2001-50, Class BA, 7.00% 20415 | | | 10 | | | | 12 | |
| Fannie Mae, Series 2002-W3, Class A5, 7.50% 20415 | | | 23 | | | | 28 | |
| Fannie Mae, Series 2002-W1, Class 2A, 5.522% 20424,5 | | | 30 | | | | 34 | |
| Freddie Mac Pool #ZA2657 3.00% 20265 | | | 455 | | | | 479 | |
| Freddie Mac Pool #ZK3537 3.00% 20265 | | | 88 | | | | 92 | |
| 170 | American Funds Insurance Series |
Bond Fund (continued)
| Bonds, notes & other debt instruments (continued) | | Principal amount
(000) | | | Value
(000) | |
| Mortgage-backed obligations (continued) | | | | | | | | |
| Federal agency mortgage-backed obligations (continued) | | | | | | | | |
| Freddie Mac Pool #ZK4277 3.00% 20275 | | $ | 575 | | | $ | 605 | |
| Freddie Mac Pool #ZK3836 3.00% 20275 | | | 190 | | | | 200 | |
| Freddie Mac Pool #ZK3970 3.00% 20275 | | | 181 | | | | 190 | |
| Freddie Mac Pool #ZS6521 3.00% 20275 | | | 119 | | | | 125 | |
| Freddie Mac Pool #ZK3893 3.00% 20275 | | | 59 | | | | 62 | |
| Freddie Mac Pool #ZK4162 3.00% 20275 | | | 45 | | | | 47 | |
| Freddie Mac Pool #ZS8452 3.00% 20275 | | | 15 | | | | 15 | |
| Freddie Mac Pool #ZK4039 3.00% 20275 | | | 6 | | | | 7 | |
| Freddie Mac Pool #ZS8463 3.00% 20275 | | | 6 | | | | 6 | |
| Freddie Mac Pool #ZS8507 3.00% 20285 | | | 225 | | | | 236 | |
| Freddie Mac Pool #ZK7590 3.00% 20295 | | | 4,648 | | | | 4,925 | |
| Freddie Mac Pool #ZK7593 3.00% 20295 | | | 235 | | | | 249 | |
| Freddie Mac Pool #ZT1931 3.00% 20335 | | | 306 | | | | 322 | |
| Freddie Mac Pool #A15120 5.50% 20335 | | | 64 | | | | 72 | |
| Freddie Mac Pool #QN1073 3.00% 20345 | | | 154 | | | | 163 | |
| Freddie Mac Pool #SB8083 1.50% 20365 | | | 14,702 | | | | 15,135 | |
| Freddie Mac Pool #SB8084 2.00% 20365 | | | 15,986 | | | | 16,724 | |
| Freddie Mac Pool #G05196 5.50% 20385 | | | 84 | | | | 99 | |
| Freddie Mac Pool #G05267 5.50% 20385 | | | 62 | | | | 73 | |
| Freddie Mac Pool #G06020 5.50% 20395 | | | 121 | | | | 142 | |
| Freddie Mac Pool #A93948 4.50% 20405 | | | 269 | | | | 303 | |
| Freddie Mac Pool #G05860 5.50% 20405 | | | 448 | | | | 525 | |
| Freddie Mac Pool #G06868 4.50% 20415 | | | 294 | | | | 329 | |
| Freddie Mac Pool #G06841 5.50% 20415 | | | 689 | | | | 810 | |
| Freddie Mac Pool #841039 3.54% 20434,5 | | | 3,059 | | | | 3,166 | |
| Freddie Mac Pool #G60138 3.50% 20455 | | | 23,567 | | | | 25,901 | |
| Freddie Mac Pool #Z40130 3.00% 20465 | | | 29,938 | | | | 32,684 | |
| Freddie Mac Pool #G61733 3.00% 20475 | | | 7,668 | | | | 8,318 | |
| Freddie Mac Pool #Q52157 3.50% 20475 | | | 4,216 | | | | 4,476 | |
| Freddie Mac Pool #G08789 4.00% 20475 | | | 1,664 | | | | 1,788 | |
| Freddie Mac Pool #G67709 3.50% 20485 | | | 23,635 | | | | 25,832 | |
| Freddie Mac Pool #G67710 3.50% 20485 | | | 21,713 | | | | 23,367 | |
| Freddie Mac Pool #G61628 3.50% 20485 | | | 657 | | | | 712 | |
| Freddie Mac Pool #SI2002 4.00% 20485 | | | 3,356 | | | | 3,592 | |
| Freddie Mac Pool #Q58494 4.00% 20485 | | | 1,884 | | | | 2,015 | |
| Freddie Mac Pool #QA4673 3.00% 20495 | | | 42,800 | | | | 46,229 | |
| Freddie Mac Pool #SD7507 3.00% 20495 | | | 28,385 | | | | 30,699 | |
| Freddie Mac Pool #SD7509 3.00% 20495 | | | 8,724 | | | | 9,372 | |
| Freddie Mac Pool #QA5125 3.50% 20495 | | | 27,889 | | | | 30,661 | |
| Freddie Mac Pool #SD7508 3.50% 20495 | | | 19,850 | | | | 21,774 | |
| Freddie Mac Pool #RA1369 3.50% 20495 | | | 4,667 | | | | 5,071 | |
| Freddie Mac Pool #ZN4842 3.50% 20495 | | | 1,676 | | | | 1,818 | |
| Freddie Mac Pool #RA2020 3.00% 20505 | | | 3,353 | | | | 3,604 | |
| Freddie Mac Pool #SD7514 3.50% 20505 | | | 39,178 | | | | 42,144 | |
| Freddie Mac, Series 3061, Class PN, 5.50% 20355 | | | 90 | | | | 105 | |
| Freddie Mac, Series 3318, Class JT, 5.50% 20375 | | | 236 | | | | 272 | |
| Freddie Mac, Series K716, Class A2, Multi Family, 3.13% 20215 | | | 6,104 | | | | 6,143 | |
| Freddie Mac, Series K020, Class A2, Multi Family, 2.373% 20225 | | | 4,300 | | | | 4,402 | |
| Freddie Mac, Series K718, Class A2, Multi Family, 2.791% 20225 | | | 9,240 | | | | 9,432 | |
| Freddie Mac, Series 3156, Class PO, principal only, 0% 20365 | | | 189 | | | | 177 | |
| Freddie Mac, Series 3146, Class PO, principal only, 0% 20365 | | | 190 | | | | 175 | |
| Freddie Mac Seasoned Credit Risk Transfer Trust, Series 2018-3, Class MA, 3.50% 20575 | | | 15,166 | | | | 16,431 | |
| Freddie Mac Seasoned Credit Risk Transfer Trust, Series 2019-2, Class MA, 3.50% 20585 | | | 3,146 | | | | 3,429 | |
| Government National Mortgage Assn. 2.00% 20515,7 | | | 285,328 | | | | 297,877 | |
| Government National Mortgage Assn. 2.00% 20515,7 | | | 144,122 | | | | 150,225 | |
| Government National Mortgage Assn. Pool #MA5817 4.00% 20495 | | | 38,672 | | | | 41,466 | |
| Government National Mortgage Assn. Pool #MA5876 4.00% 20495 | | | 5,631 | | | | 6,024 | |
| Government National Mortgage Assn. Pool #MA6221 4.50% 20495 | | | 17,517 | | | | 18,955 | |
| Government National Mortgage Assn. Pool #MA5764 4.50% 20495 | | | 1,913 | | | | 2,071 | |
| Government National Mortgage Assn. Pool #MA5878 5.00% 20495 | | | 44,710 | | | | 48,986 | |
| Government National Mortgage Assn. Pool #MA6042 5.00% 20495 | | | 119 | | | | 131 | |
| American Funds Insurance Series | 171 |
Bond Fund (continued)
| Bonds, notes & other debt instruments (continued) | | Principal amount
(000) | | | Value
(000) | |
| Mortgage-backed obligations (continued) | | | | | | | | |
| Federal agency mortgage-backed obligations (continued) | | | | | | | | |
| Uniform Mortgage-Backed Security 1.50% 20365,7 | | $ | 408,695 | | | $ | 419,729 | |
| Uniform Mortgage-Backed Security 1.50% 20365,7 | | | 343,501 | | | | 352,950 | |
| Uniform Mortgage-Backed Security 2.00% 20365,7 | | | 197,784 | | | | 206,562 | |
| Uniform Mortgage-Backed Security 2.00% 20515,7 | | | 330,010 | | | | 341,624 | |
| Uniform Mortgage-Backed Security 2.00% 20515,7 | | | 170,554 | | | | 176,843 | |
| Uniform Mortgage-Backed Security 2.50% 20515,7 | | | 134,685 | | | | 141,513 | |
| Uniform Mortgage-Backed Security 2.50% 20515,7 | | | 86,091 | | | | 90,588 | |
| Uniform Mortgage-Backed Security 3.00% 20515,7 | | | 166,000 | | | | 174,066 | |
| Uniform Mortgage-Backed Security 3.50% 20515,7 | | | 31,602 | | | | 33,449 | |
| Uniform Mortgage-Backed Security 4.00% 20515,7 | | | 52,938 | | | | 56,615 | |
| Uniform Mortgage-Backed Security 4.50% 20515,7 | | | 68,056 | | | | 73,853 | |
| | | | | | | | 3,506,261 | |
| | | | | | | | | |
| Collateralized mortgage-backed obligations (privately originated) 0.64% | | | | | | | | |
| Arroyo Mortgage Trust, Series 2020-1, Class A1A, 1.662% 20552,5 | | | 390 | | | | 394 | |
| Bellemeade Re Ltd., Series 2019-3A, Class M1B, (1-month USD-LIBOR + 1.60%) 1.748% 20292,4,5 | | | 3,175 | | | | 3,181 | |
| BRAVO Residential Funding Trust, Series 2020-RPL2, Class A1, 2.00% 20592,5 | | | 1,381 | | | | 1,426 | |
| BRAVO Residential Funding Trust, Series 2020-RPL1, Class A1, 2.50% 20592,4,5 | | | 1,127 | | | | 1,167 | |
| Bunker Hill Loan Depositary Trust, Series 2019-1, Class A1, 3.613% 20482,4,5 | | | 1,038 | | | | 1,050 | |
| Bunker Hill Loan Depositary Trust, Series 2019-1, Class A3, 3.919% 20482,4,5 | | | 1,546 | | | | 1,572 | |
| Cascade Funding Mortgage Trust, Series 2019-HB1, Class M1, 2.572% 20292,4,5 | | | 1,950 | | | | 1,960 | |
| Cascade Funding Mortgage Trust, Series 2019-HB1, Class M2, 2.863% 20292,4,5 | | | 475 | | | | 478 | |
| Cascade Funding Mortgage Trust, Series 2019-HB1, Class M3, 3.257% 20292,4,5 | | | 243 | | | | 241 | |
| Cascade Funding Mortgage Trust, Series 2020-HB4, Class A, 0.946% 20302,4,5 | | | 1,162 | | | | 1,163 | |
| Citigroup Mortgage Loan Trust Inc., Series 2020-EXP1, Class A1A, 1.804% 20602,4,5 | | | 1,479 | | | | 1,491 | |
| Credit Suisse Mortgage Trust, Series 2020-NET, Class A, 2.257% 20372,5 | | | 1,612 | | | | 1,674 | |
| Finance of America HECM Buyout, Series 2019-HB1, Class M1, 2.105% 20302,4,5 | | | 1,400 | | | | 1,407 | |
| Finance of America HECM Buyout, Series 2020-HB1, Class M2, 2.389% 20302,4,5 | | | 500 | | | | 490 | |
| Finance of America HECM Buyout, Series 2020-HB1, Class M3, 2.723% 20302,4,5 | | | 253 | | | | 243 | |
| Finance of America Structured Securities Trust, Series 2019-JR2, Class A1, 2.00% 20692,5 | | | 4,485 | | | | 4,866 | |
| Finance of America Structured Securities Trust, Series 2019-JR1, Class A, 2.00% 20692,5 | | | 3,798 | | | | 4,172 | |
| JPMorgan Mortgage Trust, Series 2020-INV1, Class A3, 3.50% 20502,4,5 | | | 4,399 | | | | 4,584 | |
| Legacy Mortgage Asset Trust, Series 2019-GS2, Class A1, 3.75% 20592,4,5 | | | 1,529 | | | | 1,536 | |
| Mortgage Repurchase Agreement Financing Trust, Series 2020-1, Class A1, (1-month USD-LIBOR + 2.00%) 2.149% 20222,4,5 | | | 6,556 | | | | 6,571 | |
| Mortgage Repurchase Agreement Financing Trust, Series 2020-5, Class A1, (1-month USD-LIBOR + 1.00%) 1.149% 20232,4,5 | | | 11,402 | | | | 11,490 | |
| Onslow Bay Financial LLC, Series 2020-INV1, Class A5, 3.50% 20492,4,5 | | | 2,119 | | | | 2,187 | |
| Starwood Mortgage Residential Trust, Series 2019-IMC1, Class A1, 3.468% 20492,4,5 | | | 1,684 | | | | 1,697 | |
| Towd Point Mortgage Trust, Series 2020-4, Class A1, 1.75% 20602,5 | | | 17,877 | | | | 18,323 | |
| | | | | | | | 73,363 | |
| | | | | | | | | |
| Commercial mortgage-backed securities 0.34% | | | | | | | | |
| Bank Commercial Mortgage Trust, Series 2019-BN17, Class A4, 3.714% 20525 | | | 100 | | | | 117 | |
| Bank Commercial Mortgage Trust, Series 2019-BN16, Class A4, 4.005% 20525 | | | 770 | | | | 915 | |
| Bank Commercial Mortgage Trust, Series 2019-BN19, Class A3, 3.183% 20615 | | | 1,018 | | | | 1,156 | |
| Bank Commercial Mortgage Trust, Series 2018-BN10, Class A4, 3.428% 20615 | | | 130 | | | | 147 | |
| Bank Commercial Mortgage Trust, Series 2018-BN10, Class A5, 3.688% 20615 | | | 205 | | | | 237 | |
| Bank Commercial Mortgage Trust, Series 2018-BN12, Class A4, 4.255% 20614,5 | | | 2,444 | | | | 2,916 | |
| Bank Commercial Mortgage Trust, Series 2020-BN26, Class A4, 2.403% 20635 | | | 295 | | | | 317 | |
| Benchmark Mortgage Trust, Series 2018-B8, Class A5, 4.232% 20525 | | | 2,541 | | | | 3,057 | |
| Benchmark Mortgage Trust, Series 2018-B7, Class A4, 4.51% 20534,5 | | | 781 | | | | 955 | |
| Citigroup Commercial Mortgage Trust, Series 2016-C1, Class AS, 3.514% 20495 | | | 250 | | | | 277 | |
| Citigroup Commercial Mortgage Trust, Series 2016-GC36, Class A5, 3.616% 20495 | | | 610 | | | | 687 | |
| Commercial Mortgage Trust, Series 2012-CR3, Class B, 3.922% 20452,5 | | | 430 | | | | 425 | |
| Commercial Mortgage Trust, Series 2013-LC13, Class B, 5.009% 20462,4,5 | | | 312 | | | | 330 | |
| Commercial Mortgage Trust, Series 2014-LC15, Class AM, 4.198% 20475 | | | 350 | | | | 385 | |
| CSAIL Commercial Mortgage Trust, Series 2015-C4, Class C, 4.563% 20484,5 | | | 204 | | | | 211 | |
| CSAIL Commercial Mortgage Trust, Series 2015-C1, Class B, 4.044% 20504,5 | | | 300 | | | | 318 | |
| 172 | American Funds Insurance Series |
Bond Fund (continued)
| Bonds, notes & other debt instruments (continued) | | Principal amount
(000) | | | Value
(000) | |
| Mortgage-backed obligations (continued) | | | | | | | | |
| Commercial mortgage-backed securities (continued) | | | | | | | | |
| Deutsche Bank Commercial Mortgage Trust, Series 2016-C1, Class AM, 3.539% 20495 | | $ | 200 | | | $ | 219 | |
| Grace Mortgage Trust, Series 2020-GRCE, Class A, 2.347% 20402,5 | | | 2,601 | | | | 2,759 | |
| GS Mortgage Securities Trust, Series 2011-GC5, Class B, 5.555% 20442,4,5 | | | 530 | | | | 529 | |
| GS Mortgage Securities Trust, Series 2017-GS7, Class A4, 3.43% 20505 | | | 400 | | | | 457 | |
| GS Mortgage Securities Trust, Series 2019-GC38, Class A4, 3.968% 20525 | | | 100 | | | | 119 | |
| GS Mortgage Securities Trust, Series 2020-GC47, Class A5, 2.377% 20535 | | | 1,536 | | | | 1,656 | |
| JPMBB Commercial Mortgage Securities Trust, Series 2014-C18, Class A5, 4.079% 20475 | | | 3,280 | | | | 3,597 | |
| JPMDB Commercial Mortgage Securities Trust, Series 2017-C7, Class A5, 3.409% 20505 | | | 240 | | | | 272 | |
| JPMDB Commercial Mortgage Securities Trust, Series 2017-C5, Class A5, 3.694% 20505 | | | 640 | | | | 732 | |
| JPMorgan Chase Commercial Mortgage Securities Trust, Series 2018-BCON, Class A, 3.735% 20312,5 | | | 785 | | | | 818 | |
| JPMorgan Chase Commercial Mortgage Securities Trust, Series 2016-JP4, Class A4, 3.648% 20494,5 | | | 2,040 | | | | 2,327 | |
| L.A. Arena Funding, LLC, Series 1, Class A, 7.656% 20262,5 | | | 153 | | | | 153 | |
| Morgan Stanley Bank of America Merrill Lynch Trust, Series 2014-C17, Class A5, 3.741% 20475 | | | 2,038 | | | | 2,224 | |
| Morgan Stanley Bank of America Merrill Lynch Trust, Series 2015-C22, Class A4, 3.306% 20485 | | | 410 | | | | 447 | |
| Morgan Stanley Bank of America Merrill Lynch Trust, Series 2016-C32, Class A4, 3.72% 20495 | | | 245 | | | | 281 | |
| Morgan Stanley Capital I Trust, Series 2015-UBS8, Class AS, 4.114% 20485 | | | 730 | | | | 814 | |
| Morgan Stanley Capital I Trust, Series 2016-UBS9, Class C, 4.608% 20494,5 | | | 208 | | | | 204 | |
| Wells Fargo Commercial Mortgage Trust, Series 2015-SG1, Class A4, 3.789% 20485 | | | 2,437 | | | | 2,714 | |
| Wells Fargo Commercial Mortgage Trust, Series 2015-C28, Class C, 4.094% 20484,5 | | | 220 | | | | 225 | |
| Wells Fargo Commercial Mortgage Trust, Series 2016-BNK1, Class B, 2.967% 20495 | | | 350 | | | | 360 | |
| Wells Fargo Commercial Mortgage Trust, Series 2016-C34, Class AS, 3.484% 20495 | | | 130 | | | | 143 | |
| Wells Fargo Commercial Mortgage Trust, Series 2016-C37, Class A5, 3.794% 20495 | | | 2,550 | | | | 2,932 | |
| Wells Fargo Commercial Mortgage Trust, Series 2019-C54, Class A4, 3.146% 20525 | | | 1,019 | | | | 1,154 | |
| Wells Fargo Commercial Mortgage Trust, Series 2016-NXS5, Class AS, 3.988% 20595 | | | 250 | | | | 280 | |
| Wells Fargo Commercial Mortgage Trust, Series 2017-RC1, Class A4, 3.631% 20605 | | | 205 | | | | 235 | |
| | | | | | | | 38,101 | |
| | | | | | | | | |
| Total mortgage-backed obligations | | | | | | | 3,617,725 | |
| | | | | | | | | |
| U.S. Treasury bonds & notes 24.40% | | | | | | | | |
| U.S. Treasury 22.29% | | | | | | | | |
| U.S. Treasury 0.125% 2022 | | | 63,000 | | | | 63,006 | |
| U.S. Treasury 2.625% 2023 | | | 70,000 | | | | 75,132 | |
| U.S. Treasury 2.75% 2023 | | | 173,600 | | | | 184,108 | |
| U.S. Treasury 2.125% 2024 | | | 72,100 | | | | 77,178 | |
| U.S. Treasury 2.125% 20248 | | | 72,100 | | | | 77,015 | |
| U.S. Treasury 0.25% 20258 | | | 402,459 | | | | 401,224 | |
| U.S. Treasury 0.25% 2025 | | | 11,240 | | | | 11,190 | |
| U.S. Treasury 2.875% 20258 | | | 96,200 | | | | 107,380 | |
| U.S. Treasury 2.875% 2025 | | | 72,100 | | | | 80,105 | |
| U.S. Treasury 1.375% 20268 | | | 75,000 | | | | 78,872 | |
| U.S. Treasury 1.625% 2026 | | | 50,000 | | | | 53,288 | |
| U.S. Treasury 0.50% 2027 | | | 185,625 | | | | 185,110 | |
| U.S. Treasury 0.50% 2027 | | | 160,000 | | | | 158,960 | |
| U.S. Treasury 2.25% 20278 | | | 120,200 | | | | 133,420 | |
| U.S. Treasury 2.25% 20278 | | | 72,100 | | | | 79,675 | |
| U.S. Treasury 6.125% 2027 | | | 24,000 | | | | 32,951 | |
| U.S. Treasury 2.875% 2028 | | | 72,100 | | | | 83,726 | |
| U.S. Treasury 0.875% 2030 | | | 147,750 | | | | 147,185 | |
| U.S. Treasury 1.125% 2040 | | | 88,288 | | | | 83,802 | |
| U.S. Treasury 2.25% 2049 | | | 41,697 | | | | 47,726 | |
| American Funds Insurance Series | 173 |
Bond Fund (continued)
| Bonds, notes & other debt instruments (continued) | | Principal amount
(000) | | | | Value
(000) | |
| U.S. Treasury bonds & notes (continued) | | | | | | | | |
| U.S. Treasury (continued) | | | | | | | | |
| U.S. Treasury 3.00% 20498 | | $ | 150,000 | | | $ | 197,801 | |
| U.S. Treasury 1.25% 2050 | | | 44,000 | | | | 39,906 | |
| U.S. Treasury 1.375% 2050 | | | 153,811 | | | | 143,929 | |
| | | | | | | | 2,542,689 | |
| | | | | | | | | |
| U.S. Treasury inflation-protected securities 2.11% | | | | | | | | |
| U.S. Treasury Inflation-Protected Security 0.375% 20278,9 | | | 79,834 | | | | 89,865 | |
| U.S. Treasury Inflation-Protected Security 0.50% 20288,9 | | | 79,172 | | | | 89,819 | |
| U.S. Treasury Inflation-Protected Security 1.00% 20499 | | | 14,978 | | | | 21,124 | |
| U.S. Treasury Inflation-Protected Security 0.25% 20509 | | | 33,837 | | | | 40,307 | |
| | | | | | | | 241,115 | |
| | | | | | | | | |
| Total U.S. Treasury bonds & notes | | | | | | | 2,783,804 | |
| | | | | | | | | |
| Bonds & notes of governments & government agencies outside the U.S. 3.06% | | | | | | | | |
| Dominican Republic 5.95% 20272 | | | 8,100 | | | | 9,548 | |
| Italy (Republic of) 0.95% 2023 | | € | 45,000 | | | | 56,628 | |
| Italy (Republic of) 1.50% 2025 | | | 33,327 | | | | 43,649 | |
| Japan, Series 20, 0.10% 20259 | | ¥ | 11,396,250 | | | | 110,591 | |
| Paraguay (Republic of) 4.625% 2023 | | $ | 1,025 | | | | 1,104 | |
| Paraguay (Republic of) 5.00% 2026 | | | 1,250 | | | | 1,469 | |
| Paraguay (Republic of) 4.95% 2031 | | | 3,487 | | | | 4,232 | |
| Portuguese Republic 5.125% 2024 | | | 24,775 | | | | 28,835 | |
| Portuguese Republic 5.65% 2024 | | € | 20,000 | | | | 29,205 | |
| PT Indonesia Asahan Aluminium Tbk 5.23% 20212 | | $ | 1,862 | | | | 1,935 | |
| PT Indonesia Asahan Aluminium Tbk 5.71% 20232 | | | 1,020 | | | | 1,129 | |
| PT Indonesia Asahan Aluminium Tbk 4.75% 20252 | | | 1,270 | | | | 1,405 | |
| PT Indonesia Asahan Aluminium Tbk 5.45% 20302 | | | 340 | | | | 410 | |
| PT Indonesia Asahan Aluminium Tbk 5.80% 20502 | | | 1,150 | | | | 1,431 | |
| Qatar (State of) 4.50% 20282 | | | 5,100 | | | | 6,188 | |
| Qatar (State of) 5.103% 20482 | | | 3,400 | | | | 4,790 | |
| Saudi Arabia (Kingdom of) 3.628% 20272 | | | 5,000 | | | | 5,624 | |
| Saudi Arabia (Kingdom of) 3.625% 20282 | | | 11,435 | | | | 12,835 | |
| United Mexican States, Series M, 5.75% 2026 | | MXN | 527,500 | | | | 27,728 | |
| | | | | | | | 348,736 | |
| | | | | | | | | |
| Asset-backed obligations 2.19% | | | | | | | | |
| Aesop Funding LLC, Series 2020-1A, Class A, 2.33% 20262,5 | | $ | 7,689 | | | | 7,958 | |
| Aesop Funding LLC, Series 2020-2, Class A, 2.02% 20272,5 | | | 2,427 | | | | 2,480 | |
| Aesop Funding LLC, Series 2020-2A, Class B, 2.96% 20272,5 | | | 623 | | | | 637 | |
| Aesop Funding LLC, Series 2020-2A, Class C, 4.25% 20272,5 | | | 1,279 | | | | 1,316 | |
| American Credit Acceptance Receivables Trust, Series 2020-3, Class B, 1.15% 20242,5 | | | 900 | | | | 905 | |
| American Credit Acceptance Receivables Trust, Series 2020-3, Class C, 1.85% 20262,5 | | | 2,602 | | | | 2,648 | |
| American Credit Acceptance Receivables Trust, Series 2020-3, Class D, 2.40% 20262,5 | | | 2,500 | | | | 2,587 | |
| AmeriCredit Automobile Receivables Trust, Series 2017-1, Class C, 2.71% 20225 | | | 3,749 | | | | 3,771 | |
| CarMaxAuto Owner Trust, Series 2019-2, Class C, 3.16% 20255 | | | 400 | | | | 420 | |
| CF Hippolyta LLC, Series 2020-1, Class A1, 1.69% 20602,5 | | | 10,894 | | | | 11,127 | |
| CF Hippolyta LLC, Series 2020-1, Class A2, 1.99% 20602,5 | | | 2,086 | | | | 2,121 | |
| CF Hippolyta LLC, Series 2020-1, Class B1, 2.28% 20602,5 | | | 3,567 | | | | 3,634 | |
| CF Hippolyta LLC, Series 2020-1, Class B2, 2.60% 20602,5 | | | 387 | | | | 392 | |
| CPS Auto Receivables Trust, Series 2019-B, Class C, 3.35% 20242,5 | | | 835 | | | | 852 | |
| CPS Auto Receivables Trust, Series 2019-C, Class C, 2.84% 20252,5 | | | 743 | | | | 759 | |
| CPS Auto Receivables Trust, Series 2019-C, Class D, 3.17% 20252,5 | | | 1,125 | | | | 1,166 | |
| CPS Auto Receivables Trust, Series 2019-B, Class D, 3.69% 20252,5 | | | 3,045 | | | | 3,140 | |
| Credit Acceptance Auto Loan Trust, Series 2020-1A, Class A, 2.01% 20292,5 | | | 7,411 | | | | 7,581 | |
| Drive Auto Receivables Trust, Series 2019-2, Class B, 3.17% 20235 | | | 2,087 | | | | 2,101 | |
| Drive Auto Receivables Trust, Series 2019-3, Class C, 2.90% 20255 | | | 4,910 | | | | 5,060 | |
| Drive Auto Receivables Trust, Series 2019-2, Class C, 3.42% 20255 | | | 4,665 | | | | 4,794 | |
| Drive Auto Receivables Trust, Series 2019-3, Class D, 3.18% 20265 | | | 4,020 | | | | 4,190 | |
| 174 | American Funds Insurance Series |
Bond Fund (continued)
| Bonds, notes & other debt instruments (continued) | | Principal amount
(000) | | | Value
(000) | |
| Asset-backed obligations (continued) | | | | | | | | |
| Drivetime Auto Owner Trust, Series 2019-3, Class C, 2.74% 20252,5 | | $ | 880 | | | $ | 898 | |
| Drivetime Auto Owner Trust, Series 2019-3, Class D, 2.96% 20252,5 | | | 1,915 | | | | 1,981 | |
| Drivetime Auto Owner Trust, Series 2019-2A, Class C, 3.18% 20252,5 | | | 2,565 | | | | 2,619 | |
| Drivetime Auto Owner Trust, Series 2019-2A, Class D, 3.48% 20252,5 | | | 4,250 | | | | 4,414 | |
| Drivetime Auto Owner Trust, Series 2020-3A, Class C, 1.47% 20262,5 | | | 817 | | | | 825 | |
| Exeter Automobile Receivables Trust, Series 2017-3A, Class B, 2.81% 20222,5 | | | 572 | | | | 572 | |
| Exeter Automobile Receivables Trust, Series 2019-2A, Class B, 3.06% 20232,5 | | | 1,791 | | | | 1,800 | |
| Exeter Automobile Receivables Trust, Series 2019-3A, Class C, 2.79% 20242,5 | | | 5,000 | | | | 5,108 | |
| Exeter Automobile Receivables Trust, Series 2019-2A, Class C, 3.30% 20242,5 | | | 2,500 | | | | 2,553 | |
| Exeter Automobile Receivables Trust, Series 2019-1A, Class C, 3.82% 20242,5 | | | 4,145 | | | | 4,208 | |
| Exeter Automobile Receivables Trust, Series 2020-3A, Class C, 1.32% 20255 | | | 780 | | | | 787 | |
| Exeter Automobile Receivables Trust, Series 2019-3A, Class D, 3.11% 20252,5 | | | 5,000 | | | | 5,171 | |
| Exeter Automobile Receivables Trust, Series 2019-2A, Class D, 3.71% 20252,5 | | | 6,000 | | | | 6,271 | |
| Exeter Automobile Receivables Trust, Series 2020-3A, Class D, 1.73% 20265 | | | 1,012 | | | | 1,027 | |
| FirstKey Homes Trust, Series 2020-SFR2, Class A, 1.266% 20372,5 | | | 18,161 | | | | 18,292 | |
| Ford Credit Auto Owner Trust, Series 2016-2, Class A, 2.03% 20272,5 | | | 26,755 | | | | 26,972 | |
| Ford Credit Auto Owner Trust, Series 2018-2, Class A, 3.47% 20302,5 | | | 17,675 | | | | 18,968 | |
| Ford Credit Auto Owner Trust, Series 2018-1, Class A, 3.52% 20302,5 | | | 939 | | | | 1,025 | |
| Ford Credit Auto Owner Trust, Series 2020-1, Class A, 2.04% 20312,5 | | | 6,672 | | | | 7,043 | |
| Ford Credit Auto Owner Trust, Series 2018-1, Class A, 3.19% 20312,5 | | | 30,740 | | | | 33,823 | |
| Ford Credit Floorplan Master Owner Trust, Series 2019-3, Class A1, 2.23% 20245 | | | 2,625 | | | | 2,709 | |
| GM Financial Automobile Leasing Trust, Series 2020-2, Class B, 1.56% 20245 | | | 360 | | | | 367 | |
| GM Financial Automobile Leasing Trust, Series 2020-2, Class C, 2.56% 20245 | | | 301 | | | | 312 | |
| GM Financial Automobile Leasing Trust, Series 2020-2, Class D, 3.21% 20245 | | | 425 | | | | 444 | |
| GM Financial Consumer Automobile Receivables Trust, Series 2018-1, Class B, 2.57% 20235 | | | 520 | | | | 528 | |
| GM Financial Consumer Automobile Receivables Trust, Series 2018-1, Class C, 2.77% 20235 | | | 360 | | | | 366 | |
| Hertz Vehicle Financing LLC, Rental Car Asset-Backed Notes, Series 2016-4A, Class A, 2.65% 20222,5 | | | 838 | | | | 840 | |
| Hertz Vehicle Financing LLC, Rental Car Asset-Backed Notes, Series 2019-3A, Class A, 2.67% 20252,5 | | | 1,894 | | | | 1,898 | |
| Hertz Vehicle Financing LLC, Rental Car Asset-Backed Notes, Series 2019-2A, Class A, 3.42% 20252,5 | | | 1,027 | | | | 1,031 | |
| Prestige Auto Receivables Trust, Series 2019-1A, Class C, 2.70% 20242,5 | | | 2,190 | | | | 2,248 | |
| Prestige Auto Receivables Trust, Series 2019-1A, Class D, 3.01% 20252,5 | | | 1,355 | | | | 1,402 | |
| Santander Drive Auto Receivables Trust, Series 2017-3, Class C, 2.76% 20225 | | | 435 | | | | 436 | |
| Santander Drive Auto Receivables Trust, Series 2019-2, Class D, 3.22% 20255 | | | 3,110 | | | | 3,236 | |
| Santander Drive Auto Receivables Trust, Series 2020-3, Class C, 1.12% 20265 | | | 3,344 | | | | 3,373 | |
| Santander Drive Auto Receivables Trust, Series 2020-3, Class D, 1.64% 20265 | | | 2,211 | | | | 2,246 | |
| Social Professional Loan Program LLC, Series 2015-C, Class A2, 2.51% 20332,5 | | | 688 | | | | 691 | |
| Toyota Auto Loan Extended Note Trust, Series 2019-1, Class A, 2.56% 20312,5 | | | 6,000 | | | | 6,414 | |
| Verizon Owner Trust, Series 2017-3A, Class B, 2.38% 20222,5 | | | 1,572 | | | | 1,575 | |
| Voya Ltd., CLO, Series 2014-3A, Class A1R, (3-month USD-LIBOR + 0.72%) 0.935% 20262,4,5 | | | 928 | | | | 927 | |
| Westlake Automobile Receivables Trust, Series 2020-3A, Class C, 1.24% 20252,5 | | | 1,557 | | | | 1,567 | |
| Westlake Automobile Receivables Trust, Series 2020-3A, Class D, 1.65% 20262,5 | | | 3,023 | | | | 3,062 | |
| | | | | | | | 249,668 | |
| | | | | | | | | |
| Municipals 1.98% | | | | | | | | |
| California 0.06% | | | | | | | | |
| G.O. Bonds, Series 2009, 7.50% 2034 | | | 2,100 | | | | 3,503 | |
| High-Speed Passenger Train G.O. Rev. Ref. Bonds, Series 2017-A, 2.367% 2022 | | | 3,775 | | | | 3,871 | |
| | | | | | | | 7,374 | |
| American Funds Insurance Series | 175 |
Bond Fund (continued)
| Bonds, notes & other debt instruments (continued) | | Principal amount
(000) | | | Value
(000) | |
| Municipals (continued) | | | | | | | | |
| Illinois 1.88% | | | | | | | | |
| City of Chicago, Board of Education, Unlimited Tax G.O. Bonds (Dedicated Rev.), Series 2009-E, 6.138% 2039 | | $ | 30,835 | | | $ | 32,542 | |
| City of Chicago, Board of Education, Unlimited Tax G.O. Bonds (Dedicated Rev.), Series 2010-C, 6.319% 2029 | | | 65 | | | | 70 | |
| City of Chicago, Board of Education, Unlimited Tax G.O. Bonds (Dedicated Rev.), Series 2010-D, 6.519% 2040 | | | 8,945 | | | | 9,285 | |
| City of Chicago, Board of Education, Unlimited Tax G.O. Bonds (Dedicated Rev.), Series 2011-A, 5.50% 2039 | | | 410 | | | | 417 | |
| City of Chicago, Board of Education, Unlimited Tax G.O. Bonds (Dedicated Rev.), Series 2015-C, 5.25% 2039 | | | 1,190 | | | | 1,288 | |
| City of Chicago, Board of Education, Unlimited Tax G.O. Rev. Ref. Bonds (Dedicated Rev.), Series 2017-C, 5.00% 2026 | | | 1,100 | | | | 1,260 | |
| City of Chicago, Board of Education, Unlimited Tax G.O. Rev. Ref. Bonds (Dedicated Rev.), Series 2017-C, 5.00% 2030 | | | 2,205 | | | | 2,537 | |
| City of Chicago, Board of Education, Unlimited Tax G.O. Rev. Ref. Bonds (Dedicated Rev.), Series 2017-C, 5.00% 2034 | | | 490 | | | | 556 | |
| City of Chicago, Board of Education, Unlimited Tax G.O. Rev. Ref. Bonds (Dedicated Rev.), Series 2017-D, 5.00% 2031 | | | 980 | | | | 1,123 | |
| City of Chicago, Board of Education, Unlimited Tax G.O. Rev. Ref. Bonds (Dedicated Rev.), Series 2017-G, 5.00% 2044 | | | 1,350 | | | | 1,514 | |
| City of Chicago, Board of Education, Unlimited Tax G.O. Rev. Ref. Bonds (Dedicated Rev.), Series 2017-H, 5.00% 2036 | | | 980 | | | | 1,107 | |
| City of Chicago, Board of Education, Unlimited Tax G.O. Rev. Ref. Bonds (Dedicated Rev.), Series 2017-H, 5.00% 2046 | | | 2,770 | | | | 3,090 | |
| City of Chicago, Board of Education, Unlimited Tax G.O. Rev. Ref. Bonds (Dedicated Rev.), Series 2018-A, Assured Guaranty Municipal insured, 5.00% 2026 | | | 730 | | | | 836 | |
| City of Chicago, Board of Education, Unlimited Tax G.O. Rev. Ref. Bonds (Dedicated Rev.), Series 2018-A, Assured Guaranty Municipal insured, 5.00% 2028 | | | 855 | | | | 1,079 | |
| City of Chicago, Board of Education, Unlimited Tax G.O. Rev. Ref. Bonds (Dedicated Rev.), Series 2018-A, Assured Guaranty Municipal insured, 5.00% 2029 | | | 430 | | | | 536 | |
| City of Chicago, Board of Education, Unlimited Tax G.O. Rev. Ref. Bonds (Dedicated Rev.), Series 2018-A, Assured Guaranty Municipal insured, 5.00% 2029 | | | 245 | | | | 286 | |
| City of Chicago, Board of Education, Unlimited Tax G.O. Rev. Ref. Bonds (Dedicated Rev.), Series 2018-A, Assured Guaranty Municipal insured, 5.00% 2030 | | | 245 | | | | 304 | |
| City of Chicago, Board of Education, Unlimited Tax G.O. Rev. Ref. Bonds (Dedicated Rev.), Series 2018-A, Assured Guaranty Municipal insured, 5.00% 2030 | | | 245 | | | | 286 | |
| City of Chicago, Board of Education, Unlimited Tax G.O. Rev. Ref. Bonds (Dedicated Rev.), Series 2018-A, Assured Guaranty Municipal insured, 5.00% 2031 | | | 490 | | | | 605 | |
| City of Chicago, Board of Education, Unlimited Tax G.O. Rev. Ref. Bonds (Dedicated Rev.), Series 2018-A, Assured Guaranty Municipal insured, 5.00% 2032 | | | 490 | | | | 602 | |
| City of Chicago, Board of Education, Unlimited Tax G.O. Rev. Ref. Bonds (Dedicated Rev.), Series 2018-A, Assured Guaranty Municipal insured, 5.00% 2033 | | | 245 | | | | 300 | |
| City of Chicago, Board of Education, Unlimited Tax G.O. Rev. Ref. Bonds (Dedicated Rev.), Series 2018-A, Assured Guaranty Municipal insured, 5.00% 2034 | | | 280 | | | | 323 | |
| City of Chicago, Board of Education, Unlimited Tax G.O. Rev. Ref. Bonds (Dedicated Rev.), Series 2018-C, Assured Guaranty Municipal insured, 5.00% 2028 | | | 1,090 | | | | 1,378 | |
| City of Chicago, Board of Education, Unlimited Tax G.O. Rev. Ref. Bonds (Dedicated Rev.), Series 2018-C, Assured Guaranty Municipal insured, 5.00% 2029 | | | 730 | | | | 914 | |
| City of Chicago, School Reform Board of Trustees of the Board of Education, Unlimited Tax G.O. Bonds (Dedicated Tax Rev.), Capital Appreciation Bonds, Series 1998-B-1, National insured, 0% 2031 | | | 490 | | | | 351 | |
| City of Chicago, School Reform Board of Trustees of the Board of Education, Unlimited Tax G.O. Bonds (Dedicated Tax Rev.), Series 2011-A, 5.00% 2041 | | | 665 | | | | 674 | |
| City of Chicago, School Reform Board of Trustees of the Board of Education, Unlimited Tax G.O. Bonds (Dedicated Tax Rev.), Series 2012-A, 5.00% 2042 | | | 1,875 | | | | 1,923 | |
| G.O. Bonds, Pension Funding Series 2003, 4.95% 2023 | | | 22,553 | | | | 23,112 | |
| G.O. Bonds, Pension Funding Series 2003, 5.10% 2033 | | | 107,310 | | | | 115,570 | |
| G.O. Bonds, Series 2013-B, 4.11% 2022 | | | 750 | | | | 761 | |
| G.O. Bonds, Series 2013-B, 4.31% 2023 | | | 2,125 | | | | 2,175 | |
| 176 | American Funds Insurance Series |
Bond Fund (continued)
| Bonds, notes & other debt instruments (continued) | | Principal amount
(000) | | | Value
(000) | |
| Municipals (continued) | | | | | | | | |
| Illinois (continued) | | | | | | | | |
| G.O. Bonds, Taxable Build America Bonds, Series 2010-2, 5.85% 2022 | | $ | 2,370 | | | $ | 2,449 | |
| G.O. Bonds, Taxable Build America Bonds, Series 2010-2, 5.95% 2023 | | | 3,210 | | | | 3,396 | |
| G.O. Bonds, Taxable Build America Bonds, Series 2010-5, 6.20% 2021 | | | 1,946 | | | | 1,979 | |
| | | | | | | | 214,628 | |
| | | | | | | | | |
| Texas 0.04% | | | | | | | | |
| Grand Parkway Transportation Corp., Grand Parkway System Toll Rev. Ref. Bonds, Series 2020-B, 3.236% 2052 | | | 4,075 | | | | 4,265 | |
| | | | | | | | | |
| Total municipals | | | | | | | 226,267 | |
| | | | | | | | | |
| Federal agency bonds & notes 0.11% | | | | | | | | |
| Fannie Mae 2.125% 2026 | | | 11,910 | | | | 12,979 | |
| | | | | | | | | |
| Total bonds, notes & other debt instruments (cost: $10,403,219,000) | | | | | | | 11,032,012 | |
| | | | | | | | | |
| Short-term securities 23.58% | | | Shares | | | | | |
| Money market investments 23.58% | | | | | | | | |
| Capital Group Central Cash Fund 0.12%10,11 | | | 26,897,764 | | | | 2,690,045 | |
| | | | | | | | | |
| Total short-term securities (cost: $2,690,027,000) | | | | | | | 2,690,045 | |
| Total investment securities 120.29% (cost: $13,093,246,000) | | | | | | | 13,722,057 | |
| Other assets less liabilities (20.29)% | | | | | | | (2,314,638 | ) |
| | | | | | | | | |
| Net assets 100.00% | | | | | | $ | 11,407,419 | |
Futures contracts
| | | | | | | | | | | | | | | | | | Unrealized | |
| | | | | | | | | | | | | | | | | | appreciation | |
| | | | | | | | | | Notional | | | | Value at | | | | (depreciation) | |
| | | | | Number of | | | | | amount | 12 | | | 12/31/2020 | 13 | | | at 12/31/2020 | |
| Contracts | | Type | | contracts | | Expiration | | | (000) | | | | (000) | | | | (000) | |
| 2 Year U.S. Treasury Note Futures | | Long | | 4,793 | | April 2021 | | $ | 958,600 | | | $ | 1,059,141 | | | $ | 791 | |
| 5 Year Euro-Bobl Futures | | Short | | 1,321 | | March 2021 | | € | (132,100 | ) | | | (218,153 | ) | | | (211 | ) |
| 5 Year U.S. Treasury Note Futures | | Long | | 18,935 | | April 2021 | | $ | 1,893,500 | | | | 2,388,916 | | | | 5,023 | |
| 10 Year Euro-Bund Futures | | Short | | 468 | | March 2021 | | € | (46,800 | ) | | | (101,563 | ) | | | (438 | ) |
| 10 Year U.S. Treasury Note Futures | | Short | | 953 | | March 2021 | | $ | (95,300 | ) | | | (131,588 | ) | | | (140 | ) |
| 10 Year Ultra U.S. Treasury Note Futures | | Short | | 4,048 | | March 2021 | | | (404,800 | ) | | | (632,943 | ) | | | 809 | |
| 30 Year Euro-Buxl Futures | | Long | | 245 | | March 2021 | | € | 24,500 | | | | 67,415 | | | | 1,008 | |
| 30 Year Ultra U.S. Treasury Bond Futures | | Short | | 84 | | March 2021 | | $ | (8,400 | ) | | | (17,939 | ) | | | (35 | ) |
| | | | | | | | | | | | | | | | | $ | 6,807 | |
Forward currency contracts
| Contract amount | | | | | | | Unrealized
(depreciation)
appreciation | |
Purchases
(000) | | | Sales
(000) | | | Counterparty | | Settlement
date | | at 12/31/2020
(000) | |
| | USD13,934 | | | | JPY1,445,000 | | | UBS AG | | 1/6/2021 | | $ | (62 | ) |
| | USD55,331 | | | | EUR46,000 | | | Bank of New York Mellon | | 1/8/2021 | | | (877 | ) |
| | USD37,932 | | | | MXN755,000 | | | Morgan Stanley | | 1/12/2021 | | | 46 | |
| American Funds Insurance Series | 177 |
Bond Fund (continued)
Forward currency contracts (continued)
| Contract amount | | | | | | | Unrealized
(depreciation)
appreciation | |
Purchases
(000) | | | Sales
(000) | | | Counterparty | | Settlement
date | | at 12/31/2020
(000) | |
| | USD132,884 | | | | EUR109,250 | | | HSBC Bank | | 1/12/2021 | | $ | (624 | ) |
| | USD102,847 | | | | JPY10,730,000 | | | HSBC Bank | | 1/14/2021 | | | (1,090 | ) |
| | | | | | | | | | | | | $ | (2,607 | ) |
Swap contracts
Interest rate swaps
| Receive | | Pay | | Expiration
date | | Notional
(000) | | | Value at
12/31/2020
(000 | ) | | Upfront
premium
paid
(000) | | | Unrealized
(depreciation)
appreciation
at 12/31/2020
(000) | |
| 3-month USD-LIBOR | | 2.18075% | | 3/29/2024 | | $ | 31,600 | | | $ | (1,973 | ) | | $ | — | | | $ | (1,973 | ) |
| 3-month USD-LIBOR | | 2.194% | | 3/29/2024 | | | 31,900 | | | | (2,005 | ) | | | — | | | | (2,005 | ) |
| 3-month USD-LIBOR | | 2.21875% | | 3/29/2024 | | | 33,500 | | | | (2,133 | ) | | | — | | | | (2,133 | ) |
| 3-month USD-LIBOR | | 2.3105% | | 5/3/2024 | | | 275,590 | | | | (18,844 | ) | | | — | | | | (18,844 | ) |
| 6-month EURIBOR | | 0.9852% | | 10/17/2024 | | € | 25,000 | | | | (1,733 | ) | | | — | | | | (1,733 | ) |
| U.S. EFFR | | 0.10875% | | 7/6/2025 | | $ | 121,300 | | | | 595 | | | | — | | | | 595 | |
| U.S. EFFR | | 0.0995% | | 7/9/2025 | | | 60,700 | | | | 325 | | | | — | | | | 325 | |
| U.S. EFFR | | 0.105% | | 7/9/2025 | | | 60,600 | | | | 310 | | | | — | | | | 310 | |
| U.S. EFFR | | 0.099% | | 7/10/2025 | | | 149,000 | | | | 804 | | | | — | | | | 804 | |
| 6-month JPY-LIBOR | | 0.0875% | | 3/10/2026 | | ¥ | 11,100,000 | | | | (698 | ) | | | — | | | | (698 | ) |
| 6-month JPY-LIBOR | | 0.58295% | | 3/23/2046 | | | 2,000,000 | | | | (1,131 | ) | | | — | | | | (1,131 | ) |
| 0.64355% | | 6-month JPY-LIBOR | | 4/27/2046 | | | 2,000,000 | | | | 1,422 | | | | — | | | | 1,422 | |
| | | | | | | | | | | | | | | $ | — | | | $ | (25,061 | ) |
Investments in affiliates11
| | | Value of
affiliate at
1/1/2020
(000) | | | Additions
(000) | | | Reductions
(000) | | | Net
realized
gain
(000) | | | Net
unrealized
depreciation
(000) | | | Value of
affiliate at
12/31/2020
(000) | | | Dividend
income
(000) | |
| Short-term securities 23.58% | | | | | | | | | | | | | | | | | | | | | | | | | | | | |
| Money market investments 23.58% | | | | | | | | | | | | | | | | | | | | | | | | | | | | |
| Capital Group Central Cash Fund 0.12%10 | | $ | 602,451 | | | $ | 5,522,355 | | | $ | 3,435,554 | | | $ | 885 | | | $ | (92 | ) | | $ | 2,690,045 | | | $ | 5,601 | |
| 1 | Step bond; coupon rate may change at a later date. |
| 2 | Acquired in a transaction exempt from registration under Rule 144A of the Securities Act of 1933. May be resold in the U.S. in transactions exempt from registration, normally to qualified institutional buyers. The total value of all such securities was $1,081,328,000, which represented 9.48% of the net assets of the fund. |
| 3 | Payment in kind; the issuer has the option of paying additional securities in lieu of cash. Most recent payment was 100% cash unless otherwise noted. |
| 4 | Coupon rate may change periodically. Reference rate and spread are as of the most recent information available. Some coupon rates are determined by the issuer or agent based on current market conditions; therefore, the reference rate and spread are not available. |
| 5 | Principal payments may be made periodically. Therefore, the effective maturity date may be earlier than the stated maturity date. |
| 6 | Amount less than one thousand. |
| 7 | Purchased on a TBA basis. |
| 8 | All or a portion of this security was pledged as collateral. The total value of pledged collateral was $28,008,000, which represented .25% of the net assets of the fund. |
| 9 | Index-linked bond whose principal amount moves with a government price index. |
| 10 | Rate represents the seven-day yield at 12/31/2020. |
| 11 | Part of the same group of investment companies as the fund as defined under the Investment Company Act of 1940. |
| 12 | Notional amount is calculated based on the number of contracts and notional contract size. |
| 13 | Value is calculated based on the notional amount and current market price. |
| 178 | American Funds Insurance Series |
Bond Fund (continued)
Key to abbreviations and symbols
CLO = Collateralized Loan Obligations
EFFR = Effective Federal Funds Rate
EUR/€ = Euros
EURIBOR = Euro Interbank Offered Rate
G.O. = General Obligation
ICE = Intercontinental Exchange, Inc.
JPY/¥ = Japanese yen
LIBOR = London Interbank Offered Rate
MXN = Mexican pesos
Ref. = Refunding
Rev. = Revenue
SOFR = Secured Overnight Financing Rate
TBA = To-be-announced
USD/$ = U.S. dollars
See notes to financial statements.
| American Funds Insurance Series | 179 |
Capital World Bond Fund (formerly Global Bond Fund)
Investment portfolio December 31, 2020
| Bonds, notes & other debt instruments 93.64% | | Principal amount
(000) | | | Value
(000) | |
| Euros 17.23% | | | | | | | | |
| Allianz SE 4.75% 2049 (3-month EUR-EURIBOR + 3.60% on 10/24/2023)1 | | € | 4,200 | | | $ | 5,748 | |
| Altria Group, Inc. 1.00% 2023 | | | 1,020 | | | | 1,272 | |
| Altria Group, Inc. 1.70% 2025 | | | 1,600 | | | | 2,071 | |
| Altria Group, Inc. 2.20% 2027 | | | 2,900 | | | | 3,870 | |
| American Honda Finance Corp. 1.60% 2022 | | | 620 | | | | 775 | |
| American Honda Finance Corp. 1.95% 2024 | | | 560 | | | | 736 | |
| AT&T Inc. 1.60% 2028 | | | 2,350 | | | | 3,136 | |
| Bank of America Corp. 3.648% 2029 (3-month EUR-EURIBOR + 3.67% on3/31/2028)1,2 | | | 5,000 | | | | 7,602 | |
| Barclays Bank PLC 6.00% 2021 | | | 1,000 | | | | 1,223 | |
| Barclays Bank PLC 6.625% 2022 | | | 1,070 | | | | 1,416 | |
| CaixaBank, SA 3.50% 2027 (5-year EUR Mid-Swap + 3.35% on 2/15/2022)1 | | | 1,500 | | | | 1,890 | |
| CaixaBank, SA 2.25% 2030 (EUR Annual (vs. 6-month EUR-EURIBOR) 5-year + 1.68% on4/17/2025)1 | | | 2,400 | | | | 3,071 | |
| Comcast Corp. 0.25% 2027 | | | 1,250 | | | | 1,552 | |
| Cote d’Ivoire (Republic of) 5.25% 2030 | | | 900 | | | | 1,182 | |
| Cote d’Ivoire (Republic of) 5.875% 2031 | | | 840 | | | | 1,137 | |
| Deutsche Telekom International Finance BV 7.50% 2033 | | | 200 | | | | 446 | |
| Dow Chemical Co. 0.50% 2027 | | | 1,110 | | | | 1,371 | |
| Dow Chemical Co. 1.125% 2032 | | | 1,010 | | | | 1,284 | |
| Egypt (Arab Republic of) 5.625% 2030 | | | 745 | | | | 954 | |
| European Financial Stability Facility 0.40% 2025 | | | 6,000 | | | | 7,637 | |
| European Union 0% 2035 | | | 220 | | | | 276 | |
| French Republic O.A.T. 0% 2030 | | | 17,930 | | | | 22,663 | |
| Germany (Federal Republic of) 0.50% 2027 | | | 2,510 | | | | 3,319 | |
| Germany (Federal Republic of) 0% 2030 | | | 21,090 | | | | 27,221 | |
| Germany (Federal Republic of) 0% 2050 | | | 3,540 | | | | 4,540 | |
| Goldman Sachs Group, Inc. 3.375% 20252 | | | 5,000 | | | | 6,961 | |
| Greece (Hellenic Republic of) 3.375% 2025 | | | 21,435 | | | | 29,726 | |
| Greece (Hellenic Republic of) 3.75% 2028 | | | 4,964 | | | | 7,468 | |
| Greece (Hellenic Republic of) 3.875% 2029 | | | 6,884 | | | | 10,666 | |
| Greece (Hellenic Republic of) 1.50% 2030 | | | 5,160 | | | | 6,812 | |
| Groupe BPCE SA 4.625% 2023 | | | 1,200 | | | | 1,637 | |
| Groupe BPCE SA 1.00% 2025 | | | 2,900 | | | | 3,687 | |
| Honeywell International Inc. 0.75% 2032 | | | 370 | | | | 471 | |
| Intesa Sanpaolo SpA 6.625% 2023 | | | 510 | | | | 712 | |
| Ireland (Republic of) 0.20% 2030 | | | 900 | | | | 1,155 | |
| Israel (State of) 2.875% 2024 | | | 1,180 | | | | 1,577 | |
| Israel (State of) 1.50% 2027 | | | 775 | | | | 1,031 | |
| Israel (State of) 1.50% 2029 | | | 725 | | | | 982 | |
| Italy (Republic of) 0.10% 20233 | | | 8,578 | | | | 10,711 | |
| Italy (Republic of) 1.85% 2025 | | | 21,390 | | | | 28,444 | |
| Italy (Republic of) 0.95% 2027 | | | 7,270 | | | | 9,326 | |
| Italy (Republic of) 2.80% 2028 | | | 5,828 | | | | 8,505 | |
| Italy (Republic of) 1.35% 2030 | | | 1,657 | | | | 2,192 | |
| Italy (Republic of) 1.65% 2030 | | | 7,400 | | | | 10,033 | |
| JPMorgan Chase & Co. 0.389% 2028 (3-month EUR-EURIBOR + 0.65% on2/24/2027)1,2 | | | 3,208 | | | | 3,988 | |
| Lloyds Banking Group PLC 1.75% 2028 (5-year EUR-EURIBOR + 1.30% on9/7/2023)1 | | | 2,400 | | | | 3,020 | |
| Morocco (Kingdom of) 3.50% 2024 | | | 1,400 | | | | 1,867 | |
| Morocco (Kingdom of) 1.375% 2026 | | | 1,130 | | | | 1,394 | |
| Morocco (Kingdom of) 2.00% 2030 | | | 1,285 | | | | 1,595 | |
| Morocco (Kingdom of) 1.50% 2031 | | | 4,100 | | | | 4,895 | |
| Morocco (Kingdom of) 1.50% 2031 | | | 1,700 | | | | 2,030 | |
| Netherlands (Kingdom of the) 0% 2027 | | | 10,320 | | | | 13,104 | |
| Philippines (Republic of) 0.70% 2029 | | | 940 | | | | 1,156 | |
| Portuguese Republic 0.475% 2030 | | | 1,610 | | | | 2,053 | |
| Rabobank Nederland 2.50% 2026 (5-year EUR Mid-Swap + 1.40% on 5/26/2021)1 | | | 2,400 | | | | 2,962 | |
| Rolls-Royce PLC 4.625% 2026 | | | 100 | | | | 133 | |
| Romania 3.624% 2030 | | | 6,530 | | | | 9,538 | |
| Romania 2.00% 2032 | | | 2,665 | | | | 3,424 | |
| Romania 3.50% 2034 | | | 835 | | | | 1,217 | |
| Romania 3.875% 2035 | | | 2,810 | | | | 4,213 | |
| Romania 3.375% 2038 | | | 4,170 | | | | 5,877 | |
| | | | | | | | | |
| 180 | American Funds Insurance Series |
Capital World Bond Fund (formerly Global Bond Fund) (continued)
| Bonds, notes & other debt instruments (continued) | | Principal amount
(000) | | | Value
(000) | |
| Euros (continued) | | | | | | | | |
| Romania 4.625% 2049 | | € | 5,795 | | | $ | 9,586 | |
| Russian Federation 2.875% 2025 | | | 4,500 | | | | 6,082 | |
| Serbia (Republic of) 3.125% 2027 | | | 15,747 | | | | 21,665 | |
| Serbia (Republic of) 1.50% 2029 | | | 4,943 | | | | 6,260 | |
| Spain (Kingdom of) 0.80% 2027 | | | 2,280 | | | | 2,983 | |
| Spain (Kingdom of) 1.45% 2029 | | | 1,890 | | | | 2,610 | |
| Spain (Kingdom of) 1.25% 2030 | | | 13,840 | | | | 18,906 | |
| Spain (Kingdom of) 2.70% 2048 | | | 850 | | | | 1,528 | |
| State Grid Europe Development (2014) PLC 1.50% 2022 | | | 194 | | | | 241 | |
| State Grid Overseas Investment Ltd. 1.25% 2022 | | | 765 | | | | 948 | |
| State Grid Overseas Investment Ltd. 1.375% 2025 | | | 441 | | | | 562 | |
| State Grid Overseas Investment Ltd. 2.125% 2030 | | | 200 | | | | 273 | |
| Stryker Corp. 0.25% 2024 | | | 480 | | | | 594 | |
| Stryker Corp. 0.75% 2029 | | | 980 | | | | 1,246 | |
| Stryker Corp. 1.00% 2031 | | | 450 | | | | 576 | |
| Takeda Pharmaceutical Company, Ltd. 2.25% 2026 | | | 2,275 | | | | 3,128 | |
| Tunisia (Republic of) 6.75% 2023 | | | 1,250 | | | | 1,460 | |
| Tunisia (Republic of) 6.375% 2026 | | | 3,800 | | | | 4,273 | |
| Ukraine 6.75% 2026 | | | 4,344 | | | | 5,862 | |
| Ukraine 4.375% 2030 | | | 2,705 | | | | 3,169 | |
| | | | | | | | 402,906 | |
| | | | | | | | | |
| Japanese yen 9.28% | | | | | | | | |
| Export-Import Bank of India 0.59% 2022 | | ¥ | 400,000 | | | | 3,860 | |
| Goldman Sachs Group, Inc. 1.00% 20212 | | | 28,000 | | | | 272 | |
| Goldman Sachs Group, Inc. 2.80% 20222 | | | 100,000 | | | | 996 | |
| Groupe BPCE SA 0.64% 2022 | | | 400,000 | | | | 3,886 | |
| Indonesia (Republic of) 0.67% 2021 | | | 200,000 | | | | 1,937 | |
| Indonesia (Republic of) 0.54% 2022 | | | 100,000 | | | | 967 | |
| Intesa Sanpaolo SpA 1.36% 2022 | | | 600,000 | | | | 5,851 | |
| Japan, Series 19, 0.10% 20243 | | | 1,839,110 | | | | 17,847 | |
| Japan, Series 18, 0.10% 20243 | | | 1,021,233 | | | | 9,910 | |
| Japan, Series 20, 0.10% 20253 | | | 678,710 | | | | 6,586 | |
| Japan, Series 21, 0.10% 20263 | | | 986,778 | | | | 9,595 | |
| Japan, Series 346, 0.10% 2027 | | | 875,700 | | | | 8,587 | |
| Japan, Series 23, 0.10% 20283 | | | 1,988,280 | | | | 19,316 | |
| Japan, Series 356, 0.10% 2029 | | | 3,529,000 | | | | 34,576 | |
| Japan, Series 24, 0.10% 20293 | | | 1,604,510 | | | | 15,619 | |
| Japan, Series 116, 2.20% 2030 | | | 576,100 | | | | 6,715 | |
| Japan, Series 145, 1.70% 2033 | | | 2,210,000 | | | | 25,534 | |
| Japan, Series 152, 1.20% 2035 | | | 966,000 | | | | 10,656 | |
| Japan, Series 21, 2.30% 2035 | | | 720,000 | | | | 9,085 | |
| Japan, Series 173, 0.40% 2040 | | | 492,000 | | | | 4,773 | |
| Japan, Series 42, 1.70% 2044 | | | 641,900 | | | | 7,888 | |
| Japan, Series 59, 0.70% 2048 | | | 260,500 | | | | 2,597 | |
| Japan, Series 12, 0.50% 2059 | | | 138,850 | | | | 1,266 | |
| KT Corp. 0.38% 2021 | | | 200,000 | | | | 1,938 | |
| United Mexican States 0.70% 2021 | | | 600,000 | | | | 5,810 | |
| United Mexican States 0.62% 2022 | | | 100,000 | | | | 965 | |
| | | | | | | | 217,032 | |
| | | | | | | | | |
| Chinese yuan renminbi 6.03% | | | | | | | | |
| Agricultural Development Bank of China 3.75% 2029 | | CNY | 9,850 | | | | 1,518 | |
| Agricultural Development Bank of China 2.96% 2030 | | | 90,980 | | | | 13,176 | |
| China (People’s Republic of), Series 1916, 3.12% 2026 | | | 50,200 | | | | 7,677 | |
| China (People’s Republic of), Series 1906, 3.29% 2029 | | | 73,800 | | | | 11,343 | |
| China (People’s Republic of), Series 1910, 3.86% 2049 | | | 259,860 | | | | 40,357 | |
| China Development Bank Corp., Series 1814, 4.15% 2025 | | | 20,900 | | | | 3,325 | |
| China Development Bank Corp., Series 1909, 3.50% 2026 | | | 10,400 | | | | 1,599 | |
| China Development Bank Corp., Series 2004, 3.43% 2027 | | | 150,100 | | | | 22,961 | |
| | | | | | | | | |
| American Funds Insurance Series | 181 |
Capital World Bond Fund (formerly Global Bond Fund) (continued)
| Bonds, notes & other debt instruments (continued) | | Principal amount
(000) | | | Value
(000) | |
| Chinese yuan renminbi (continued) | | | | | | | | |
| China Development Bank Corp., Series 1805, 4.04% 2028 | | CNY | 51,800 | | | $ | 8,174 | |
| China Development Bank Corp., Series 1905, 3.48% 2029 | | | 128,200 | | | | 19,425 | |
| China Development Bank Corp., Series 2005, 3.07% 2030 | | | 78,250 | | | | 11,451 | |
| | | | | | | | 141,006 | |
| | | | | | | | | |
| British pounds 3.90% | | | | | | | | |
| American Honda Finance Corp. 0.75% 2026 | | £ | 1,420 | | | | 1,952 | |
| France Télécom 5.375% 2050 | | | 300 | | | | 741 | |
| Lloyds Banking Group PLC 7.625% 2025 | | | 655 | | | | 1,138 | |
| Rolls-Royce PLC 5.75% 2027 | | | 200 | | | | 304 | |
| United Kingdom 2.75% 2024 | | | 1,210 | | | | 1,828 | |
| United Kingdom 1.25% 2027 | | | 570 | | | | 842 | |
| United Kingdom 4.25% 2027 | | | 2,800 | | | | 4,954 | |
| United Kingdom 1.625% 2028 | | | 2,215 | | | | 3,400 | |
| United Kingdom 0.375% 2030 | | | 4,970 | | | | 6,905 | |
| United Kingdom 4.75% 2030 | | | 14,360 | | | | 28,430 | |
| United Kingdom 4.25% 2032 | | | 3,414 | | | | 6,742 | |
| United Kingdom 4.50% 2034 | | | 2,210 | | | | 4,672 | |
| United Kingdom 0.625% 2035 | | | 8,262 | | | | 11,473 | |
| United Kingdom 3.25% 2044 | | | 4,440 | | | | 9,347 | |
| United Kingdom 0.625% 2050 | | | 6,330 | | | | 8,387 | |
| | | | | | | | 91,115 | |
| | | | | | | | | |
| Danish kroner 2.55% | | | | | | | | |
| Nordea Kredit 0.50% 20404 | | DKr | 19,969 | | | | 3,295 | |
| Nykredit Realkredit AS, Series 01E, 1.50% 20374 | | | 27,851 | | | | 4,768 | |
| Nykredit Realkredit AS, Series 01E, 2.00% 20374 | | | 8,278 | | | | 1,423 | |
| Nykredit Realkredit AS, Series 01E, 0.50% 20404 | | | 210,985 | | | | 34,839 | |
| Nykredit Realkredit AS, Series 01E, 1.50% 20404 | | | 87,271 | | | | 14,876 | |
| Nykredit Realkredit AS, Series 01E, 2.50% 20474 | | | 2,934 | | | | 509 | |
| | | | | | | | 59,710 | |
| | | | | | | | | |
| Canadian dollars 2.06% | | | | | | | | |
| Canada 1.00% 2022 | | C$ | 1,050 | | | | 837 | |
| Canada 2.25% 2025 | | | 15,900 | | | | 13,528 | |
| Canada 2.25% 2029 | | | 26,105 | | | | 23,312 | |
| Canada 2.75% 2048 | | | 3,500 | | | | 3,774 | |
| Quebec (Province of) 1.90% 2030 | | | 8,200 | | | | 6,807 | |
| | | | | | | | 48,258 | |
| | | | | | | | | |
| Mexican pesos 2.00% | | | | | | | | |
| Petróleos Mexicanos 7.19% 2024 | | MXN | 27,473 | | | | 1,252 | |
| Petróleos Mexicanos 7.47% 2026 | | | 95,267 | | | | 3,999 | |
| United Mexican States, Series M20, 10.00% 2024 | | | 54,000 | | | | 3,248 | |
| United Mexican States, Series M, 7.50% 2027 | | | 341,420 | | | | 19,539 | |
| United Mexican States, Series M20, 8.50% 2029 | | | 140,400 | | | | 8,607 | |
| United Mexican States, Series M30, 8.50% 2038 | | | 21,100 | | | | 1,316 | |
| United Mexican States, Series M, 8.00% 2047 | | | 147,500 | | | | 8,755 | |
| | | | | | | | 46,716 | |
| | | | | | | | | |
| Malaysian ringgits 1.79% | | | | | | | | |
| Malaysia (Federation of), Series 0417, 3.899% 2027 | | MYR | 19,152 | | | | 5,226 | |
| Malaysia (Federation of), Series 0310, 4.498% 2030 | | | 8,420 | | | | 2,406 | |
| Malaysia (Federation of), Series 0418, 4.893% 2038 | | | 60,780 | | | | 17,838 | |
| Malaysia (Federation of), Series 0219, 4.467% 2039 | | | 9,167 | | | | 2,569 | |
| Malaysia (Federation of), Series 0519, 3.757% 2040 | | | 40,283 | | | | 10,526 | |
| Malaysia (Federation of), Series 0216, 4.736% 2046 | | | 7,559 | | | | 2,149 | |
| Malaysia (Federation of), Series 0518, 4.921% 2048 | | | 2,773 | | | | 815 | |
| Malaysia (Federation of), Series 0519, 4.638% 2049 | | | 560 | | | | 157 | |
| Malaysia (Federation of), Series 0120, 4.065% 2050 | | | 1,110 | | | | 287 | |
| | | | | | | | 41,973 | |
| | | | | | | | | |
| 182 | American Funds Insurance Series |
Capital World Bond Fund (formerly Global Bond Fund) (continued)
| Bonds, notes & other debt instruments (continued) | | Principal amount
(000) | | | Value
(000) | |
| Australian dollars 1.34% | | | | | | | | |
| Australia (Commonwealth of), Series 152, 2.75% 2028 | | A$ | 3,690 | | | $ | 3,284 | |
| Australia (Commonwealth of), Series 163, 1.00% 2031 | | | 32,100 | | | | 24,628 | |
| Australia (Commonwealth of), Series 162, 1.75% 2051 | | | 4,620 | | | | 3,393 | |
| | | | | | | | 31,305 | |
| | | | | | | | | |
| Russian rubles 1.16% | | | | | | | | |
| Russian Federation 7.00% 2023 | | RUB | 430,300 | | | | 6,137 | |
| Russian Federation 6.90% 2029 | | | 403,750 | | | | 5,871 | |
| Russian Federation 7.65% 2030 | | | 485,000 | | | | 7,408 | |
| Russian Federation 8.50% 2031 | | | 82,440 | | | | 1,339 | |
| Russian Federation 7.70% 2033 | | | 295,840 | | | | 4,509 | |
| Russian Federation 7.25% 2034 | | | 121,920 | | | | 1,795 | |
| | | | | | | | 27,059 | |
| | | | | | | | | |
| Israeli shekels 1.09% | | | | | | | | |
| Israel (State of) 2.00% 2027 | | ILS | 42,900 | | | | 14,658 | |
| Israel (State of) 5.50% 2042 | | | 20,200 | | | | 10,768 | |
| | | | | | | | 25,426 | |
| | | | | | | | | |
| South Korean won 0.89% | | | | | | | | |
| South Korea (Republic of), Series 2503, 1.50% 2025 | | KRW | 13,411,000 | | | | 12,465 | |
| South Korea (Republic of), Series 2712, 2.375% 2027 | | | 8,658,930 | | | | 8,427 | |
| | | | | | | | 20,892 | |
| | | | | | | | | |
| Indonesian rupiah 0.67% | | | | | | | | |
| Indonesia (Republic of), Series 84, 7.25% 2026 | | IDR | 22,733,000 | | | | 1,751 | |
| Indonesia (Republic of), Series 56, 8.375% 2026 | | | 6,725,000 | | | | 549 | |
| Indonesia (Republic of), Series 59, 7.00% 2027 | | | 11,000,000 | | | | 845 | |
| Indonesia (Republic of), Series 78, 8.25% 2029 | | | 30,605,000 | | | | 2,514 | |
| Indonesia (Republic of), Series 82, 7.00% 2030 | | | 59,605,000 | | | | 4,601 | |
| Indonesia (Republic of), Series 87, 6.50% 2031 | | | 17,649,000 | | | | 1,316 | |
| Indonesia (Republic of), Series 74, 7.50% 2032 | | | 7,073,000 | | | | 549 | |
| Indonesia (Republic of), Series 65, 6.625% 2033 | | | 17,683,000 | | | | 1,295 | |
| Indonesia (Republic of), Series 68, 8.375% 2034 | | | 27,353,000 | | | | 2,274 | |
| | | | | | | | 15,694 | |
| | | | | | | | | |
| Colombian pesos 0.64% | | | | | | | | |
| Colombia (Republic of) 5.75% 2027 | | COP | 16,661,900 | | | | 5,171 | |
| Colombia (Republic of) 7.25% 2050 | | | 31,167,000 | | | | 9,836 | |
| | | | | | | | 15,007 | |
| | | | | | | | | |
| Brazilian reais 0.47% | | | | | | | | |
| Brazil (Federative Republic of) 6.00% 20243 | | BRL | 34,215 | | | | 7,606 | |
| Brazil (Federative Republic of) 10.00% 2027 | | | 15,000 | | | | 3,417 | |
| | | | | | | | 11,023 | |
| | | | | | | | | |
| New Zealand dollars 0.41% | | | | | | | | |
| New Zealand 1.75% 2041 | | NZ$ | 13,580 | | | | 9,638 | |
| | | | | | | | | |
| Thai baht 0.40% | | | | | | | | |
| Thailand (Kingdom of) 2.125% 2026 | | THB | 257,750 | | | | 9,308 | |
| | | | | | | | | |
| Chilean pesos 0.36% | | | | | | | | |
| Chile (Republic of) 4.50% 2026 | | CLP | 5,205,000 | | | | 8,404 | |
| | | | | | | | | |
| South African rand 0.34% | | | | | | | | |
| South Africa (Republic of), Series R-2048, 8.75% 2048 | | ZAR | 140,650 | | | | 7,886 | |
| | | | | | | | | |
| American Funds Insurance Series | 183 |
Capital World Bond Fund (formerly Global Bond Fund) (continued)
| Bonds, notes & other debt instruments (continued) | | Principal amount
(000) | | | Value
(000) | |
| Ukrainian hryvnia 0.31% | | | | | | | | |
| Ukraine 16.06% 2022 | | UAH | 86,536 | | | $ | 3,268 | |
| Ukraine 17.00% 2022 | | | 60,180 | | | | 2,279 | |
| Ukraine 17.25% 2022 | | | 47,384 | | | | 1,775 | |
| | | | | | | | 7,322 | |
| | | | | | | | | |
| Singapore dollars 0.27% | | | | | | | | |
| Singapore (Republic of) 2.625% 2028 | | S$ | 3,307 | | | | 2,834 | |
| Singapore (Republic of) 2.875% 2029 | | | 1,906 | | | | 1,688 | |
| Singapore (Republic of) 2.875% 2030 | | | 2,037 | | | | 1,832 | |
| | | | | | | | 6,354 | |
| | | | | | | | | |
| Norwegian kroner 0.26% | | | | | | | | |
| Norway (Kingdom of) 1.75% 2025 | | NKr | 48,880 | | | | 5,980 | |
| | | | | | | | | |
| Peruvian nuevos soles 0.24% | | | | | | | | |
| Peru (Republic of) 6.15% 2032 | | PEN | 16,770 | | | | 5,639 | |
| | | | | | | | | |
| Indian rupees 0.16% | | | | | | | | |
| National Highways Authority of India 7.17% 2021 | | INR | 220,000 | | | | 3,112 | |
| National Highways Authority of India 7.27% 2022 | | | 50,000 | | | | 717 | |
| | | | | | | | 3,829 | |
| | | | | | | | | |
| Dominican pesos 0.13% | | | | | | | | |
| Dominican Republic 9.75% 2026 | | DOP | 158,600 | | | | 2,938 | |
| | | | | | | | | |
| Polish zloty 0.06% | | | | | | | | |
| Poland (Republic of), Series 1029, 2.75% 2029 | | PLN | 4,900 | | | | 1,500 | |
| | | | | | | | | |
| Romanian leu 0.06% | | | | | | | | |
| Romania 4.75% 2025 | | RON | 5,000 | | | | 1,361 | |
| | | | | | | | | |
| U.S. dollars 39.54% | | | | | | | | |
| 99 Escrow Issuer, Inc. 7.50% 20262 | | $ | 70 | | | | 70 | |
| Abbott Laboratories 3.40% 2023 | | | 137 | | | | 149 | |
| Abbott Laboratories 3.75% 2026 | | | 793 | | | | 929 | |
| AbbVie Inc. 2.90% 2022 | | | 1,170 | | | | 1,224 | |
| AbbVie Inc. 3.20% 2022 | | | 200 | | | | 209 | |
| Abu Dhabi (Emirate of) 0.75% 20232 | | | 5,460 | | | | 5,477 | |
| Abu Dhabi (Emirate of) 2.50% 20252 | | | 2,195 | | | | 2,349 | |
| ACE INA Holdings Inc. 2.875% 2022 | | | 195 | | | | 203 | |
| ACE INA Holdings Inc. 3.35% 2026 | | | 195 | | | | 220 | |
| ACE INA Holdings Inc. 4.35% 2045 | | | 425 | | | | 576 | |
| Adobe Inc. 2.15% 2027 | | | 1,062 | | | | 1,140 | |
| Advisor Group Holdings, LLC 6.25% 20282 | | | 425 | | | | 431 | |
| Aetna Inc. 2.80% 2023 | | | 340 | | | | 358 | |
| Affinity Gaming 6.875% 20272 | | | 205 | | | | 215 | |
| AG Merger Sub II, Inc. 10.75% 20272 | | | 311 | | | | 345 | |
| Albertsons Companies, Inc. 3.50% 20292 | | | 65 | | | | 66 | |
| Alexandria Real Estate Equities, Inc. 1.875% 2033 | | | 2,047 | | | | 2,048 | |
| Alliant Holdings Intermediate, LLC 6.75% 20272 | | | 410 | | | | 439 | |
| Allied Universal Holdco LLC 9.75% 20272 | | | 200 | | | | 218 | |
| Allison Transmission Holdings, Inc. 3.75% 20312 | | | 100 | | | | 102 | |
| Allstate Corp. 0.75% 2025 | | | 1,563 | | | | 1,572 | |
| Almonde Inc., Term Loan, (3-month USD-LIBOR + 7.25%) 8.25% 20255,6 | | | 650 | | | | 654 | |
| Altice NV 7.50% 20262 | | | 50 | | | | 53 | |
| Altria Group, Inc. 5.95% 2049 | | | 131 | | | | 184 | |
| | | | | | | | | |
| 184 | American Funds Insurance Series |
Capital World Bond Fund (formerly Global Bond Fund) (continued)
| Bonds, notes & other debt instruments (continued) | | Principal amount
(000) | | | Value
(000) | |
| U.S. dollars (continued) | | | | | | | | |
| Amazon.com, Inc. 1.50% 2030 | | $ | 2,040 | | | $ | 2,073 | |
| Amazon.com, Inc. 2.50% 2050 | | | 2,500 | | | | 2,594 | |
| American Campus Communities, Inc. 3.75% 2023 | | | 1,810 | | | | 1,914 | |
| American Campus Communities, Inc. 4.125% 2024 | | | 1,195 | | | | 1,305 | |
| American Campus Communities, Inc. 3.875% 2031 | | | 514 | | | | 583 | |
| American Electric Power Company, Inc. 1.00% 2025 | | | 250 | | | | 253 | |
| American Energy-Permian Basin, LLC / AEPB Finance Corp. 12.00% 20242,7 | | | 355 | | | | 3 | |
| American Honda Finance Corp. 1.20% 2025 | | | 3,202 | | | | 3,278 | |
| Amgen Inc. 1.90% 2025 | | | 580 | | | | 611 | |
| Amgen Inc. 2.20% 2027 | | | 445 | | | | 477 | |
| Amipeace Ltd. 2.50% 2024 | | | 4,100 | | | | 4,275 | |
| Anglo American Capital PLC 3.95% 20502 | | | 521 | | | | 586 | |
| Angola (Republic of) 9.50% 2025 | | | 2,400 | | | | 2,500 | |
| Angola (Republic of) 8.25% 2028 | | | 2,200 | | | | 2,116 | |
| Anheuser-Busch Co. / InBev Worldwide 4.70% 2036 | | | 1,780 | | | | 2,260 | |
| Anheuser-Busch InBev NV 4.15% 2025 | | | 2,230 | | | | 2,540 | |
| Anheuser-Busch InBev NV 4.00% 2028 | | | 1,050 | | | | 1,238 | |
| Anheuser-Busch InBev NV 4.75% 2029 | | | 2,535 | | | | 3,128 | |
| Anheuser-Busch InBev NV 4.50% 2050 | | | 2,250 | | | | 2,836 | |
| Apache Corp. 4.625% 2025 | | | 100 | | | | 105 | |
| Apache Corp. 4.875% 2027 | | | 305 | | | | 324 | |
| Apache Corp. 4.375% 2028 | | | 171 | | | | 178 | |
| Apache Corp. 5.10% 2040 | | | 100 | | | | 107 | |
| Apple Inc. 3.35% 2027 | | | 1,075 | | | | 1,227 | |
| Apple Inc. 2.40% 2050 | | | 1,100 | | | | 1,128 | |
| Ardagh Group SA 6.50% 20272,8 | | | 210 | | | | 224 | |
| Argentine Republic 1.00% 2029 | | | 427 | | | | 185 | |
| Argentine Republic 0.125% 2030 (0.50% on 7/9/2021)1 | | | 4,221 | | | | 1,718 | |
| Argentine Republic 0.125% 2035 (1.125% on 7/9/2021)1 | | | 3,025 | | | | 1,110 | |
| Ascent Resources - Utica LLC 8.25% 20282 | | | 230 | | | | 230 | |
| Associated Materials, LLC 9.00% 20252 | | | 400 | | | | 425 | |
| AssuredPartners, Inc. 7.00% 20252 | | | 200 | | | | 208 | |
| AssuredPartners, Inc. 5.625% 20292 | | | 230 | | | | 240 | |
| AstraZeneca PLC 3.50% 2023 | | | 2,700 | | | | 2,911 | |
| AT&T Inc. 1.65% 2028 | | | 1,575 | | | | 1,608 | |
| AT&T Inc. 2.55% 20332 | | | 4,414 | | | | 4,549 | |
| AT&T Inc. 3.30% 2052 | | | 2,080 | | | | 2,062 | |
| ATS Automation Tooling Systems Inc. 4.125% 20282 | | | 230 | | | | 235 | |
| Austin BidCo Inc. 7.125% 20282 | | | 120 | | | | 125 | |
| Austin BidCo Inc., Term Loan B, (3-month USD-LIBOR + 4.50%) 4.732% 20275,6 | | | 25 | | | | 25 | |
| Autoridad del Canal de Panama 4.95% 20352 | | | 1,000 | | | | 1,267 | |
| Avis Budget Car Rental, LLC 5.75% 20272 | | | 220 | | | | 225 | |
| Avis Budget Group, Inc. 5.25% 20252 | | | 350 | | | | 352 | |
| Avis Budget Group, Inc. 10.50% 20252 | | | 202 | | | | 239 | |
| Axiata SPV2 Bhd. 2.163% 2030 | | | 651 | | | | 659 | |
| B&G Foods, Inc. 5.25% 2025 | | | 100 | | | | 103 | |
| B&G Foods, Inc. 5.25% 2027 | | | 210 | | | | 223 | |
| Baidu Inc. 3.425% 2030 | | | 675 | | | | 748 | |
| Baker Hughes, a GE Co. 4.486% 2030 | | | 68 | | | | 82 | |
| Banff Merger Sub Inc. 9.75% 20262 | | | 210 | | | | 227 | |
| Bank of America Corp. 2.456% 2025 (3-month USD-LIBOR + 0.87% on 10/22/2024)1 | | | 847 | | | | 903 | |
| Bank of America Corp. 1.197% 2026 (USD-SOFR + 1.01% on 10/24/2025)1 | | | 7,710 | | | | 7,815 | |
| Bausch Health Companies Inc. 9.25% 20262 | | | 795 | | | | 887 | |
| Bausch Health Companies Inc. 5.00% 20282 | | | 315 | | | | 325 | |
| Bausch Health Companies Inc. 5.00% 20292 | | | 225 | | | | 232 | |
| Bausch Health Companies Inc. 5.25% 20312 | | | 85 | | | | 89 | |
| Bayer AG 3.375% 20242 | | | 840 | | | | 918 | |
| Bayer US Finance II LLC 3.875% 20232 | | | 900 | | | | 981 | |
| Bayer US Finance II LLC 4.25% 20252 | | | 203 | | | | 232 | |
| Bayerische Motoren Werke AG 2.95% 20222 | | | 3,675 | | | | 3,801 | |
| Bayerische Motoren Werke AG 3.15% 20242 | | | 5,000 | | | | 5,393 | |
| Bayerische Motoren Werke AG 3.90% 20252 | | | 900 | | | | 1,014 | |
| | | | | | | | | |
| American Funds Insurance Series | 185 |
Capital World Bond Fund (formerly Global Bond Fund) (continued)
| Bonds, notes & other debt instruments (continued) | | Principal amount
(000) | | | Value
(000) | |
| U.S. dollars (continued) | | | | | | | | |
| Bayerische Motoren Werke AG 4.15% 20302 | | $ | 900 | | | $ | 1,089 | |
| Becton, Dickinson and Company 3.70% 2027 | | | 933 | | | | 1,071 | |
| Becton, Dickinson and Company 2.823% 2030 | | | 3,312 | | | | 3,643 | |
| Berkshire Hathaway Energy Company 2.85% 20512 | | | 300 | | | | 309 | |
| Bermuda 2.375% 20302 | | | 760 | | | | 799 | |
| Black Knight Inc. 3.625% 20282 | | | 335 | | | | 343 | |
| Blue Racer Midstream LLC and Blue Racer Finance Corp. 7.625% 20252 | | | 225 | | | | 240 | |
| BMC Software, Inc. 7.125% 20252 | | | 70 | | | | 76 | |
| BMC Software, Inc. 9.125% 20262 | | | 150 | | | | 162 | |
| Boeing Company 5.15% 2030 | | | 4,000 | | | | 4,848 | |
| Bombardier Inc. 8.75% 20212 | | | 50 | | | | 52 | |
| Bombardier Inc. 5.75% 20222 | | | 100 | | | | 102 | |
| Bombardier Inc. 6.125% 20232 | | | 245 | | | | 240 | |
| Bombardier Inc. 7.50% 20242 | | | 10 | | | | 10 | |
| Bombardier Inc. 7.875% 20272 | | | 125 | | | | 115 | |
| Boyd Gaming Corp. 4.75% 2027 | | | 220 | | | | 229 | |
| BP Capital Markets America Inc. 2.939% 2051 | | | 2,280 | | | | 2,328 | |
| Brandywine Operating Partnership, LP 3.95% 2023 | | | 190 | | | | 198 | |
| Brasil Foods SA 5.75% 20502 | | | 220 | | | | 245 | |
| Braskem SA 4.50% 20302 | | | 745 | | | | 766 | |
| Brightstar Escrow Corp. 9.75% 20252 | | | 180 | | | | 193 | |
| British Airways, Series 2020-1, Class B, 8.375% 20282 | | | 100 | | | | 111 | |
| British Airways, Series 2020-1, Class A, 4.25% 20322 | | | 100 | | | | 107 | |
| British American Tobacco PLC 2.789% 2024 | | | 1,150 | | | | 1,230 | |
| British American Tobacco PLC 3.215% 2026 | | | 955 | | | | 1,053 | |
| British American Tobacco PLC 3.557% 2027 | | | 1,545 | | | | 1,721 | |
| British American Tobacco PLC 3.462% 2029 | | | 1,150 | | | | 1,256 | |
| British American Tobacco PLC 4.758% 2049 | | | 894 | | | | 1,038 | |
| Broadcom Inc. 3.15% 2025 | | | 910 | | | | 994 | |
| Broadcom Inc. 4.15% 2030 | | | 1,450 | | | | 1,680 | |
| Brookfield Property REIT Inc. 5.75% 20262 | | | 760 | | | | 751 | |
| Brookfield Residential Properties Inc. 4.875% 20302 | | | 85 | | | | 88 | |
| Cablevision Systems Corp. 6.75% 2021 | | | 950 | | | | 995 | |
| Caesars Entertainment, Inc. 6.25% 20252 | | | 445 | | | | 474 | |
| Canadian Natural Resources Ltd. 2.95% 2030 | | | 2,343 | | | | 2,509 | |
| Carnival Corp. 11.50% 20232 | | | 2,630 | | | | 3,045 | |
| Carrier Global Corp. 2.242% 2025 | | | 530 | | | | 562 | |
| Carrier Global Corp. 2.493% 2027 | | | 438 | | | | 473 | |
| Cars.com Inc. 6.375% 20282 | | | 220 | | | | 234 | |
| CCCI Treasure Ltd. 3.425% (UST Yield Curve Rate T Note Constant Maturity 5-year + 1.998% on 2/21/2025)1 | | | 2,680 | | | | 2,648 | |
| CCCI Treasure Ltd. 3.65% (UST Yield Curve Rate T Note Constant Maturity 5-year + 3.00% on 2/21/2027)1 | | | 510 | | | | 502 | |
| CCO Holdings LLC and CCO Holdings Capital Corp. 5.75% 20262 | | | 475 | | | | 491 | |
| CCO Holdings LLC and CCO Holdings Capital Corp. 3.75% 2028 | | | 2,650 | | | | 2,975 | |
| CCO Holdings LLC and CCO Holdings Capital Corp. 4.50% 20302 | | | 1,045 | | | | 1,110 | |
| CCO Holdings LLC and CCO Holdings Capital Corp. 4.75% 20302 | | | 275 | | | | 297 | |
| CCO Holdings LLC and CCO Holdings Capital Corp. 4.25% 20312 | | | 375 | | | | 396 | |
| CCO Holdings LLC and CCO Holdings Capital Corp. 4.50% 20322 | | | 210 | | | | 224 | |
| Cenovus Energy Inc. 5.375% 2025 | | | 175 | | | | 197 | |
| Cenovus Energy Inc. 6.75% 2039 | | | 50 | | | | 66 | |
| Centene Corp. 4.75% 2025 | | | 350 | | | | 360 | |
| Centene Corp. 4.625% 2029 | | | 405 | | | | 450 | |
| Central Garden & Pet Co. 4.125% 2030 | | | 99 | | | | 103 | |
| Cheniere Energy Partners, LP 5.625% 2026 | | | 210 | | | | 219 | |
| Cheniere Energy Partners, LP 4.50% 2029 | | | 210 | | | | 222 | |
| Cheniere Energy, Inc. 4.625% 20282 | | | 405 | | | | 426 | |
| Chesapeake Energy Corp. 4.875% 20227 | | | 915 | | | | 46 | |
| Chesapeake Energy Corp. 11.50% 20252,7 | | | 636 | | | | 112 | |
| Chesapeake Energy Corp., Term Loan, (3-month USD-LIBOR + 8.00%) 8.223% 20245,6,7 | | | 756 | | | | 620 | |
| China Construction Bank Corp. (Hong Kong Branch) 1.00% 2023 | | | 6,000 | | | | 6,016 | |
| | | | | | | | | |
| 186 | American Funds Insurance Series |
Capital World Bond Fund (formerly Global Bond Fund) (continued)
| Bonds, notes & other debt instruments (continued) | | Principal amount
(000) | | | Value
(000) | |
| U.S. dollars (continued) | | | | | | | | |
| Cigna Corp. 3.40% 2021 | | $ | 750 | | | $ | 766 | |
| Cigna Corp. 4.125% 2025 | | | 830 | | | | 956 | |
| Cirsa Gaming Corp. SA 7.875% 20232 | | | 200 | | | | 202 | |
| Citigroup Inc. 2.35% 2021 | | | 1,500 | | | | 1,518 | |
| Citigroup Inc. 3.106% 2026 (USD-SOFR + 2.842% on 3/8/2026)1 | | | 4,500 | | | | 4,922 | |
| Citigroup Inc. 2.976% 2030 (USD-SOFR + 1.422% on 11/5/2029)1 | | | 425 | | | | 468 | |
| Cleveland-Cliffs Inc. 9.875% 20252 | | | 425 | | | | 500 | |
| Cleveland-Cliffs Inc. 6.75% 20262 | | | 315 | | | | 341 | |
| Cleveland-Cliffs Inc. 5.875% 2027 | | | 100 | | | | 102 | |
| CMS Energy Corp. 3.875% 2024 | | | 100 | | | | 109 | |
| CMS Energy Corp. 3.00% 2026 | | | 1,200 | | | | 1,324 | |
| CNX Resources Corp. 7.25% 20272 | | | 210 | | | | 225 | |
| CNX Resources Corp. 6.00% 20292 | | | 225 | | | | 231 | |
| Colombia (Republic of) 3.875% 2027 | | | 350 | | | | 391 | |
| Colombia (Republic of) 4.50% 2029 | | | 1,165 | | | | 1,351 | |
| Comcast Corp. 3.95% 2025 | | | 2,610 | | | | 3,000 | |
| Community Health Systems Inc. 5.625% 20272 | | | 90 | | | | 97 | |
| Community Health Systems Inc. 6.00% 20292 | | | 230 | | | | 249 | |
| Compass Diversified Holdings 8.00% 20262 | | | 475 | | | | 500 | |
| Comstock Resources, Inc. 9.75% 2026 | | | 295 | | | | 317 | |
| Conagra Brands, Inc. 4.30% 2024 | | | 2,380 | | | | 2,664 | |
| Constellation Oil Services Holding SA 10.00% 2024 (100% PIK)2,8 | | | 2,741 | | | | 781 | |
| Consumers Energy Co. 3.375% 2023 | | | 345 | | | | 370 | |
| Continental Airlines, Inc., Series 2000-2, Class A1, 7.707% 2022 | | | 4 | | | | 4 | |
| Convey Park Energy LLC 7.50% 20252 | | | 125 | | | | 127 | |
| Costa Rica (Republic of) 6.125% 20312 | | | 640 | | | | 599 | |
| CP Atlas Buyer, Inc. 7.00% 20282 | | | 50 | | | | 52 | |
| Crédit Agricole SA 4.375% 20252 | | | 1,100 | | | | 1,236 | |
| Crédit Agricole SA 1.907% 2026 (USD-SOFR + 1.676% on 6/16/2025)1,2 | | | 2,675 | | | | 2,777 | |
| Credit Suisse AG (New York Branch) 2.95% 2025 | | | 875 | | | | 960 | |
| CSX Corp. 3.80% 2050 | | | 75 | | | | 93 | |
| CSX Corp. 2.50% 2051 | | | 1,075 | | | | 1,068 | |
| CVR Partners, LP 9.25% 20232 | | | 230 | | | | 231 | |
| CVS Health Corp. 3.35% 2021 | | | 277 | | | | 279 | |
| CVS Health Corp. 3.50% 2022 | | | 430 | | | | 449 | |
| CVS Health Corp. 3.70% 2023 | | | 97 | | | | 104 | |
| DaimlerChrysler North America Holding Corp. 2.00% 20212 | | | 2,100 | | | | 2,117 | |
| DaimlerChrysler North America Holding Corp. 2.875% 20212 | | | 2,275 | | | | 2,285 | |
| DaimlerChrysler North America Holding Corp. 3.00% 20212 | | | 6,425 | | | | 6,446 | |
| Dana Inc. 5.625% 2028 | | | 410 | | | | 442 | |
| Danske Bank AS 2.70% 20222 | | | 1,400 | | | | 1,436 | |
| Danske Bank AS 3.875% 20232 | | | 1,675 | | | | 1,806 | |
| Darling Ingredients Inc. 5.25% 20272 | | | 210 | | | | 224 | |
| Dave & Buster’s, Inc. 7.625% 20252 | | | 220 | | | | 232 | |
| DCP Midstream LP 7.375% 2049 (3-month USD-LIBOR + 5.148% on 12/15/2022)1 | | | 50 | | | | 42 | |
| Deutsche Bank AG 2.129% 2026 (USD-SOFR + 1.87% on 11/24/2025)1 | | | 850 | | | | 870 | |
| Deutsche Bank AG 3.547% 2031 (USD-SOFR + 3.043% on 9/18/2030)1 | | | 1,500 | | | | 1,630 | |
| Deutsche Telekom International Finance BV 1.95% 20212 | | | 575 | | | | 580 | |
| Deutsche Telekom International Finance BV 2.82% 20222 | | | 1,675 | | | | 1,712 | |
| Deutsche Telekom International Finance BV 4.375% 20282 | | | 890 | | | | 1,052 | |
| Deutsche Telekom International Finance BV 9.25% 2032 | | | 930 | | | | 1,567 | |
| Diamond Offshore Drilling, Inc. 4.875% 20437 | | | 825 | | | | 105 | |
| Diamond Sports Group LLC 6.625% 20272 | | | 385 | | | | 233 | |
| Diebold Nixdorf AG, Term Loan B, (3-month USD-LIBOR + 2.75%) 3.004% 20235,6 | | | 108 | | | | 106 | |
| Diebold Nixdorf, Inc. 9.375% 20252 | | | 630 | | | | 707 | |
| Diebold, Inc. 8.50% 2024 | | | 150 | | | | 152 | |
| Discovery Communications, Inc. 3.625% 2030 | | | 468 | | | | 536 | |
| Dominican Republic 5.50% 20252 | | | 1,375 | | | | 1,552 | |
| Dominican Republic 5.95% 2027 | | | 624 | | | | 736 | |
| Dominican Republic 8.625% 20272 | | | 225 | | | | 287 | |
| Dominican Republic 4.50% 20302 | | | 1,400 | | | | 1,524 | |
| Dominican Republic 6.40% 20492 | | | 1,613 | | | | 1,899 | |
| | |
| American Funds Insurance Series | 187 |
Capital World Bond Fund (formerly Global Bond Fund) (continued)
| Bonds, notes & other debt instruments (continued) | | Principal amount
(000) | | | Value
(000) | |
| U.S. dollars (continued) | | | | | | | | |
| Dominican Republic 5.875% 20602 | | $ | 1,075 | | | $ | 1,188 | |
| DP World Crescent 4.848% 20282 | | | 550 | | | | 641 | |
| DPL Inc. 4.125% 20252 | | | 95 | | | | 103 | |
| Duke Energy Corp. 3.75% 2024 | | | 550 | | | | 606 | |
| Duke Energy Progress, LLC 3.70% 2028 | | | 1,225 | | | | 1,435 | |
| Dun & Bradstreet Corp. 6.875% 20262 | | | 123 | | | | 132 | |
| Edison International 5.75% 2027 | | | 370 | | | | 443 | |
| Edison International 4.125% 2028 | | | 2,390 | | | | 2,665 | |
| Egypt (Arab Republic of) 7.50% 20272 | | | 2,200 | | | | 2,550 | |
| Electricité de France SA 4.875% 20382 | | | 795 | | | | 993 | |
| Embarq Corp. 7.995% 2036 | | | 530 | | | | 655 | |
| EMD Finance LLC 2.95% 20222 | | | 225 | | | | 231 | |
| EMD Finance LLC 3.25% 20252 | | | 2,924 | | | | 3,206 | |
| Empire Communities Corp. 7.00% 20252 | | | 100 | | | | 106 | |
| Empresas Publicas de Medellin ESP 4.25% 20292 | | | 1,030 | | | | 1,109 | |
| Enbridge Inc. 4.00% 2023 | | | 600 | | | | 653 | |
| Enbridge Inc. 2.50% 2025 | | | 900 | | | | 965 | |
| Enbridge Inc. 4.25% 2026 | | | 655 | | | | 767 | |
| Enbridge Inc. 3.70% 2027 | | | 754 | | | | 860 | |
| Encompass Health Corp. 4.50% 2028 | | | 100 | | | | 105 | |
| Encompass Health Corp. 4.75% 2030 | | | 200 | | | | 215 | |
| Endo Dac / Endo Finance LLC / Endo Finco 9.50% 20272 | | | 551 | | | | 616 | |
| Endo Dac / Endo Finance LLC / Endo Finco 6.00% 20282 | | | 292 | | | | 248 | |
| Enel Finance International SA 2.75% 20232 | | | 5,000 | | | | 5,235 | |
| Enel Finance International SA 3.625% 20272 | | | 2,375 | | | | 2,698 | |
| Enel Finance International SA 3.50% 20282 | | | 1,800 | | | | 2,052 | |
| Energizer Holdings, Inc. 4.375% 20292 | | | 210 | | | | 218 | |
| Energy Transfer Operating, LP 5.00% 2050 | | | 3,337 | | | | 3,617 | |
| Energy Transfer Partners, LP 4.20% 2027 | | | 110 | | | | 121 | |
| Energy Transfer Partners, LP 6.00% 2048 | | | 70 | | | | 83 | |
| Energy Transfer Partners, LP 6.25% 2049 | | | 910 | | | | 1,101 | |
| Engie Energia Chile SA 3.40% 20302 | | | 547 | | | | 593 | |
| EnLink Midstream Partners, LLC 5.625% 20282 | | | 135 | | | | 138 | |
| ENN Energy Holdings Ltd. 2.625% 20302 | | | 2,982 | | | | 3,001 | |
| Entergy Corp. 0.90% 2025 | | | 750 | | | | 750 | |
| Entergy Texas, Inc. 1.75% 2031 | | | 525 | | | | 527 | |
| Enterprise Products Operating LLC 2.80% 2030 | | | 377 | | | | 409 | |
| EQM Midstream Partners, LP 6.50% 20272 | | | 340 | | | | 383 | |
| EQT Corp. 8.75% 2030 | | | 105 | | | | 128 | |
| Equinix, Inc. 1.80% 2027 | | | 1,145 | | | | 1,180 | |
| Equinix, Inc. 2.15% 2030 | | | 9,390 | | | | 9,566 | |
| Equinor ASA 1.75% 2026 | | | 462 | | | | 485 | |
| Equinor ASA 2.375% 2030 | | | 928 | | | | 994 | |
| Equinor ASA 3.70% 2050 | | | 1,441 | | | | 1,740 | |
| Essex Portfolio LP 3.50% 2025 | | | 2,835 | | | | 3,143 | |
| Essex Portfolio LP 3.375% 2026 | | | 885 | | | | 994 | |
| European Investment Bank 2.25% 2022 | | | 700 | | | | 717 | |
| Exelon Corp. 3.40% 2026 | | | 1,465 | | | | 1,651 | |
| Exelon Corp., junior subordinated, 3.497% 20221 | | | 525 | | | | 546 | |
| Export-Import Bank of India 3.25% 2030 | | | 3,489 | | | | 3,741 | |
| Extraction Oil & Gas, Inc. 5.625% 20262,7 | | | 425 | | | | 78 | |
| Exxon Mobil Corp. 3.482% 2030 | | | 4,170 | | | | 4,860 | |
| Fannie Mae, Series 2012-M17, Class A2, Multi Family, 2.184% 20224 | | | 1,159 | | | | 1,188 | |
| Fannie Mae Pool #MA2754 3.00% 20264 | | | 155 | | | | 163 | |
| Fannie Mae Pool #AB4281 3.00% 20274 | | | 23 | | | | 24 | |
| Fannie Mae Pool #MA4228 1.50% 20364 | | | 6,429 | | | | 6,618 | |
| Fannie Mae Pool #AP7888 3.50% 20424 | | | 527 | | | | 576 | |
| Fannie Mae Pool #AO4151 3.50% 20424 | | | 205 | | | | 222 | |
| Fannie Mae Pool #AQ0770 3.50% 20424 | | | 177 | | | | 195 | |
| FEL Energy VI SARL 5.75% 20402 | | | 200 | | | | 213 | |
| First Quantum Minerals Ltd. 7.25% 20232 | | | 665 | | | | 686 | |
| First Quantum Minerals Ltd. 7.50% 20252 | | | 895 | | | | 933 | |
| | | | | | | | | |
| 188 | American Funds Insurance Series |
Capital World Bond Fund (formerly Global Bond Fund) (continued)
| Bonds, notes & other debt instruments (continued) | | Principal amount
(000) | | | Value
(000) | |
| U.S. dollars (continued) | | | | | | | | |
| First Quantum Minerals Ltd. 6.875% 20262 | | $ | 325 | | | $ | 339 | |
| First Quantum Minerals Ltd. 6.875% 20272 | | | 440 | | | | 478 | |
| FirstEnergy Corp. 3.90% 2027 (4.40% on 1/16/2021)1 | | | 1,800 | | | | 1,986 | |
| FirstEnergy Corp. 3.40% 2050 | | | 240 | | | | 231 | |
| Ford Motor Credit Co. 3.81% 2024 | | | 800 | | | | 821 | |
| Ford Motor Credit Co. 5.125% 2025 | | | 1,035 | | | | 1,127 | |
| Ford Motor Credit Co. 4.00% 2030 | | | 125 | | | | 132 | |
| France Télécom 9.00% 20311 | | | 2,434 | | | | 4,005 | |
| Freddie Mac Pool #ZS8588 3.00% 20304 | | | 93 | | | | 97 | |
| Freddie Mac, Series 3213, Class OG, principal only, 0% 20364 | | | 8 | | | | 7 | |
| Freddie Mac Pool #SB8083 1.50% 20364 | | | 252 | | | | 260 | |
| Freddie Mac, Series 3292, Class BO, principal only, 0% 20374 | | | 33 | | | | 31 | |
| Freddie Mac Pool #SI2002 4.00% 20484 | | | 3,151 | | | | 3,373 | |
| Freddie Mac Pool #2B7343 3.711% 20494,6 | | | 2,053 | | | | 2,146 | |
| Freedom Mortgage Corp. 7.625% 20262 | | | 225 | | | | 238 | |
| Freeport-McMoRan Inc. 3.875% 2023 | | | 75 | | | | 78 | |
| Freeport-McMoRan Inc. 4.25% 2030 | | | 275 | | | | 297 | |
| Fresnillo PLC 4.25% 20502 | | | 973 | | | | 1,070 | |
| Frontier Communications Corp. 11.00% 20257 | | | 1,515 | | | | 798 | |
| Frontier Communications Corp. 5.875% 20272 | | | 125 | | | | 135 | |
| Frontier Communications Corp. 5.00% 20282 | | | 125 | | | | 131 | |
| Frontier Communications Corp. 6.75% 20292 | | | 125 | | | | 134 | |
| FS Energy and Power Fund 7.50% 20232 | | | 525 | | | | 505 | |
| FXI Holdings, Inc. 7.875% 20242 | | | 246 | | | | 248 | |
| FXI Holdings, Inc. 12.25% 20262 | | | 652 | | | | 744 | |
| General Mills, Inc. 3.20% 2021 | | | 455 | | | | 459 | |
| General Motors Company 6.125% 2025 | | | 117 | | | | 142 | |
| General Motors Financial Co. 5.20% 2023 | | | 1,190 | | | | 1,305 | |
| Genesis Energy, LP 8.00% 2027 | | | 205 | | | | 204 | |
| Global Payments Inc. 2.90% 2030 | | | 683 | | | | 743 | |
| Gogo Inc. 9.875% 20242 | | | 985 | | | | 1,057 | |
| Goldman Sachs Group, Inc. 2.905% 2023 (3-month USD-LIBOR + 0.99% on 7/24/2022)1 | | | 1,200 | | | | 1,247 | |
| Goldman Sachs Group, Inc. 3.50% 2025 | | | 5,111 | | | | 5,688 | |
| GPC Merger Sub Inc. 7.125% 20282 | | | 210 | | | | 232 | |
| GrafTech Finance Inc. 4.625% 20282 | | | 25 | | | | 25 | |
| Groupe BPCE SA 5.70% 20232 | | | 1,800 | | | | 2,038 | |
| Grupo Energia Bogota SA ESP 4.875% 20302 | | | 660 | | | | 778 | |
| H.J. Heinz Co. 3.875% 20272 | | | 300 | | | | 324 | |
| Halliburton Company 3.80% 2025 | | | 54 | | | | 61 | |
| Hanesbrands Inc. 4.625% 20242 | | | 85 | | | | 89 | |
| Hanesbrands Inc. 5.375% 20252 | | | 86 | | | | 91 | |
| Hanesbrands Inc. 4.875% 20262 | | | 350 | | | | 381 | |
| Harsco Corp. 5.75% 20272 | | | 210 | | | | 222 | |
| Harvest Midstream I, LP 7.50% 20282 | | | 100 | | | | 107 | |
| HCA Inc. 5.875% 2023 | | | 145 | | | | 160 | |
| HCA Inc. 5.375% 2025 | | | 55 | | | | 62 | |
| HCA Inc. 5.625% 2028 | | | 190 | | | | 225 | |
| HCA Inc. 3.50% 2030 | | | 100 | | | | 106 | |
| HCA Inc. 5.25% 2049 | | | 170 | | | | 225 | |
| Hess Midstream Partners LP 5.125% 20282 | | | 140 | | | | 146 | |
| Hexion Inc. 7.875% 20272 | | | 370 | | | | 397 | |
| Hilton Worldwide Holdings Inc. 4.00% 20312 | | | 130 | | | | 137 | |
| Howard Hughes Corp. 5.375% 20282 | | | 435 | | | | 469 | |
| Howmet Aerospace Inc. 6.875% 2025 | | | 190 | | | | 224 | |
| HSBC Holdings PLC 3.033% 2023 (3-month USD-LIBOR + 0.923% on 11/12/2022)1 | | | 430 | | | | 452 | |
| HSBC Holdings PLC 2.633% 2025 (3-month USD-LIBOR + 1.14% on 11/7/2024)1 | | | 305 | | | | 325 | |
| HSBC Holdings PLC 4.292% 2026 (3-month USD-LIBOR + 1.348% on 9/12/2025)1 | | | 4,172 | | | | 4,759 | |
| HSBC Holdings PLC 2.357% 2031 (USD-SOFR + 1.947% on 8/18/2030)1 | | | 1,032 | | | | 1,068 | |
| HSBC Holdings PLC 2.848% 2031 (USD-SOFR + 2.387% on 6/4/2030)1 | | | 6,000 | | | | 6,453 | |
| Humana Inc. 3.85% 2024 | | | 1,000 | | | | 1,108 | |
| Hyundai Capital America 3.25% 20222 | | | 250 | | | | 260 | |
| Hyundai Capital America 2.375% 20272 | | | 1,284 | | | | 1,348 | |
| | | | | | | | | |
| American Funds Insurance Series | 189 |
Capital World Bond Fund (formerly Global Bond Fund) (continued)
| Bonds, notes & other debt instruments (continued) | | Principal amount
(000) | | | Value
(000) | |
| U.S. dollars (continued) | | | | | | | | |
| Hyundai Capital Services Inc. 3.75% 20232 | | $ | 2,450 | | | $ | 2,606 | |
| Imperial Tobacco Finance PLC 3.50% 20232 | | | 2,000 | | | | 2,095 | |
| Indonesia (Republic of) 3.75% 2022 | | | 1,110 | | | | 1,157 | |
| Indonesia (Republic of) 4.75% 2026 | | | 3,500 | | | | 4,100 | |
| Indonesia (Republic of) 3.85% 2030 | | | 315 | | | | 367 | |
| International Game Technology PLC 6.50% 20252 | | | 500 | | | | 560 | |
| International Game Technology PLC 5.25% 20292 | | | 200 | | | | 216 | |
| International Paper Co. 7.30% 2039 | | | 600 | | | | 963 | |
| Interstate Power and Light Co. 2.30% 2030 | | | 1,275 | | | | 1,350 | |
| Intesa Sanpaolo SpA 5.017% 20242 | | | 3,270 | | | | 3,579 | |
| Intuit Inc. 1.35% 2027 | | | 700 | | | | 717 | |
| Iraq (Republic of) 6.752% 20232 | | | 545 | | | | 534 | |
| Iron Mountain Inc. 5.25% 20302 | | | 290 | | | | 314 | |
| Iron Mountain Inc. 4.50% 20312 | | | 280 | | | | 294 | |
| Israel (State of) 2.50% 2030 | | | 3,850 | | | | 4,176 | |
| Israel (State of) 2.75% 2030 | | | 1,135 | | | | 1,253 | |
| Israel (State of) 3.375% 2050 | | | 1,470 | | | | 1,631 | |
| Israel (State of) 3.875% 2050 | | | 1,265 | | | | 1,524 | |
| J2 Global, Inc. 4.625% 20302 | | | 220 | | | | 233 | |
| Jaguar Land Rover PLC 7.75% 20252 | | | 225 | | | | 243 | |
| Jaguar Land Rover PLC 5.875% 20282 | | | 150 | | | | 152 | |
| Jordan (Hashemite Kingdom of) 5.75% 20272 | | | 1,035 | | | | 1,144 | |
| Joseph T. Ryerson & Son, Inc. 8.50% 20282 | | | 157 | | | | 178 | |
| JPMorgan Chase & Co. 1.045% 2026 (USD-SOFR + 0.80% on 11/19/2025)1 | | | 6,710 | | | | 6,787 | |
| KB Home 6.875% 2027 | | | 370 | | | | 435 | |
| Keurig Dr Pepper Inc. 4.597% 2028 | | | 2,740 | | | | 3,339 | |
| Keurig Dr Pepper Inc. 3.20% 2030 | | | 146 | | | | 165 | |
| Keurig Dr Pepper Inc. 5.085% 2048 | | | 1,075 | | | | 1,521 | |
| Kimberly-Clark Corp. 1.05% 2027 | | | 770 | | | | 781 | |
| Kimberly-Clark Corp. 3.10% 2030 | | | 110 | | | | 127 | |
| Kraft Heinz Company 3.95% 2025 | | | 235 | | | | 259 | |
| Kraft Heinz Company 4.375% 2046 | | | 825 | | | | 893 | |
| Kronos Acquisition Holdings Inc. 5.00% 20262 | | | 95 | | | | 99 | |
| Kronos Acquisition Holdings Inc. 7.00% 20272 | | | 45 | | | | 47 | |
| Kuwait (State of) 2.75% 20222 | | | 3,550 | | | | 3,655 | |
| L3Harris Technologies, Inc. 1.80% 2031 | | | 950 | | | | 968 | |
| Lamar Media Corp. 3.75% 2028 | | | 210 | | | | 216 | |
| LBM Acquisition LLC 6.25% 20292 | | | 50 | | | | 52 | |
| LD Holdings Group LLC 6.50% 20252 | | | 220 | | | | 232 | |
| Liberty Global PLC 5.50% 20282 | | | 250 | | | | 264 | |
| Ligado Networks LLC 15.50% 20232,8 | | | 225 | | | | 219 | |
| Lima Metro Line 2 Finance Ltd. 5.875% 20342 | | | 1,052 | | | | 1,273 | |
| Lima Metro Line 2 Finance Ltd. 5.875% 2034 | | | 721 | | | | 872 | |
| Lima Metro Line 2 Finance Ltd. 4.35% 20362 | | | 630 | | | | 700 | |
| Live Nation Entertainment, Inc. 3.75% 20282 | | | 50 | | | | 51 | |
| Lloyds Banking Group PLC 1.326% 2023 (UST Yield Curve Rate T Note Constant Maturity 1-year on 6/15/2022)1 | | | 1,825 | | | | 1,846 | |
| LPL Financial Holdings Inc. 4.625% 20272 | | | 395 | | | | 410 | |
| LSB Industries, Inc. 9.625% 20232 | | | 760 | | | | 786 | |
| LYB International Finance III, LLC 1.25% 2025 | | | 1,452 | | | | 1,478 | |
| Magna International Inc. 2.45% 2030 | | | 725 | | | | 780 | |
| Mallinckrodt PLC 10.00% 20252 | | | 1,190 | | | | 1,294 | |
| MasTec, Inc. 4.50% 20282 | | | 100 | | | | 105 | |
| Mattel, Inc. 6.75% 20252 | | | 210 | | | | 222 | |
| MDC Partners Inc. 6.50% 20242 | | | 470 | | | | 477 | |
| Medical Properties Trust, Inc. 3.50% 2031 | | | 450 | | | | 465 | |
| Medtronic, Inc. 3.50% 2025 | | | 1,091 | | | | 1,225 | |
| Methanex Corp. 5.125% 2027 | | | 350 | | | | 381 | |
| Methanex Corp. 5.65% 2044 | | | 240 | | | | 258 | |
| Mexico City Airport Trust 5.50% 2047 | | | 432 | | | | 456 | |
| MGM Growth Properties LLC 3.875% 20292 | | | 100 | | | | 102 | |
| MGM Resorts International 7.75% 2022 | | | 200 | | | | 213 | |
| | | | | | | | | |
| 190 | American Funds Insurance Series |
Capital World Bond Fund (formerly Global Bond Fund) (continued)
| Bonds, notes & other debt instruments (continued) | | Principal amount
(000) | | | Value
(000) | |
| U.S. dollars (continued) | | | | | | | | |
| Microsoft Corp. 2.40% 2026 | | $ | 2,688 | | | $ | 2,933 | |
| Molina Healthcare, Inc. 5.375% 2022 | | | 1,200 | | | | 1,273 | |
| Molina Healthcare, Inc. 3.875% 20302 | | | 75 | | | | 81 | |
| Morgan Stanley 0.985% 2026 (USD-SOFR + 0.72% on 12/10/2025)1 | | | 5,730 | | | | 5,775 | |
| Morgan Stanley 2.699% 2031 (USD-SOFR + 1.143% on 1/22/2030)1 | | | 1,510 | | | | 1,640 | |
| Morocco (Kingdom of) 5.50% 2042 | | | 3,100 | | | | 3,881 | |
| MPLX LP 2.65% 2030 | | | 837 | | | | 878 | |
| MPLX LP 5.50% 2049 | | | 1,900 | | | | 2,502 | |
| MSCI Inc. 3.875% 20312 | | | 410 | | | | 434 | |
| National CineMedia, LLC 5.875% 20282 | | | 100 | | | | 85 | |
| National Financial Partners Corp. 6.875% 20282 | | | 210 | | | | 224 | |
| Nationstar Mortgage Holdings Inc. 5.125% 20302 | | | 230 | | | | 241 | |
| Navient Corp. 5.50% 2023 | | | 440 | | | | 461 | |
| Navient Corp. 5.875% 2024 | | | 600 | | | | 639 | |
| Navient Corp. 6.125% 2024 | | | 100 | | | | 107 | |
| NCL Corp. Ltd. 3.625% 20242 | | | 345 | | | | 328 | |
| NCL Corp. Ltd. 5.875% 20262 | | | 115 | | | | 121 | |
| Neon Holdings, Inc. 10.125% 20262 | | | 200 | | | | 219 | |
| Nestlé Holdings, Inc. 0.625% 20262 | | | 5,550 | | | | 5,525 | |
| Netflix, Inc. 4.875% 20302 | | | 190 | | | | 219 | |
| New Fortress Energy Inc. 6.75% 20252 | | | 103 | | | | 109 | |
| New York Life Global Funding 1.20% 20302 | | | 2,725 | | | | 2,645 | |
| New York Life Insurance Company 3.75% 20502 | | | 413 | | | | 495 | |
| Newcrest Finance Pty Ltd. 3.25% 20302 | | | 909 | | | | 1,005 | |
| Newell Rubbermaid Inc. 4.70% 2026 | | | 100 | | | | 110 | |
| Newell Rubbermaid Inc. 5.875% 20361 | | | 100 | | | | 122 | |
| Nexstar Broadcasting, Inc. 4.75% 20282 | | | 215 | | | | 225 | |
| NGL Energy Partners LP 7.50% 2023 | | | 175 | | | | 124 | |
| Niagara Mohawk Power Corp. 3.508% 20242 | | | 180 | | | | 198 | |
| Nielsen Finance LLC and Nielsen Finance Co. 5.00% 20252 | | | 225 | | | | 231 | |
| Nielsen Finance LLC and Nielsen Finance Co. 5.625% 20282 | | | 210 | | | | 229 | |
| NIKE, Inc. 3.375% 2050 | | | 602 | | | | 741 | |
| Nissan Motor Co., Ltd. 3.043% 20232 | | | 1,543 | | | | 1,614 | |
| Nissan Motor Co., Ltd. 3.522% 20252 | | | 2,260 | | | | 2,425 | |
| Northriver Midstream Finance LP 5.625% 20262 | | | 220 | | | | 228 | |
| Nouryon Holding BV 8.00% 20262 | | | 210 | | | | 224 | |
| Nova Chemicals Corp. 5.25% 20272 | | | 120 | | | | 128 | |
| Novartis Capital Corp. 1.75% 2025 | | | 460 | | | | 483 | |
| Novartis Capital Corp. 2.00% 2027 | | | 501 | | | | 535 | |
| Novartis Capital Corp. 2.20% 2030 | | | 1,060 | | | | 1,139 | |
| NRG Energy, Inc. 3.375% 20292 | | | 225 | | | | 231 | |
| NRG Energy, Inc. 3.625% 20312 | | | 225 | | | | 232 | |
| Occidental Petroleum Corp. 2.70% 2023 | | | 230 | | | | 230 | |
| Occidental Petroleum Corp. 5.875% 2025 | | | 240 | | | | 256 | |
| Occidental Petroleum Corp. 6.375% 2028 | | | 234 | | | | 248 | |
| Occidental Petroleum Corp. 6.125% 2031 | | | 155 | | | | 166 | |
| State of Ohio, Turnpike and Infrastructure Commission, Turnpike Rev. Ref. Bonds (Infrastructure Projects), Series 2020-A, 3.216% 2048 | | | 1,410 | | | | 1,438 | |
| ONEOK, Inc. 6.35% 2031 | | | 31 | | | | 40 | |
| ONEOK, Inc. 4.95% 2047 | | | 111 | | | | 124 | |
| ONEOK, Inc. 5.20% 2048 | | | 1,378 | | | | 1,608 | |
| ONEOK, Inc. 7.15% 2051 | | | 355 | | | | 492 | |
| Oracle Corp. 2.65% 2026 | | | 2,327 | | | | 2,560 | |
| Oracle Corp. 3.25% 2027 | | | 1,880 | | | | 2,144 | |
| Oracle Corp. 3.60% 2050 | | | 980 | | | | 1,145 | |
| OSW Structured Asset Trust, Series 2020-RPL1, Class A1, 3.072% 20602,4,6 | | | 621 | | | | 636 | |
| Oversea-Chinese Banking Corp. Ltd. 1.832% 2030 (UST Yield Curve Rate T Note Constant Maturity 5-year + 1.58% on 9/10/2025)1,2 | | | 1,416 | | | | 1,440 | |
| Owens & Minor, Inc. 4.375% 2024 | | | 425 | | | | 437 | |
| Owens & Minor, Inc., Term Loan B, (3-month USD-LIBOR + 4.50%) 4.655% 20255,6 | | | 352 | | | | 352 | |
| Pacific Gas and Electric Co. 2.95% 2026 | | | 590 | | | | 624 | |
| Pacific Gas and Electric Co. 2.10% 2027 | | | 9,935 | | | | 10,097 | |
| | | | | | | | | |
| American Funds Insurance Series | 191 |
Capital World Bond Fund (formerly Global Bond Fund) (continued)
| Bonds, notes & other debt instruments (continued) | | Principal amount
(000) | | | Value
(000) | |
| U.S. dollars (continued) | | | | | | | | |
| Pacific Gas and Electric Co. 3.30% 2027 | | $ | 659 | | | $ | 706 | |
| Pacific Gas and Electric Co. 4.65% 2028 | | | 542 | | | | 620 | |
| Pacific Gas and Electric Co. 4.55% 2030 | | | 783 | | | | 893 | |
| Pacific Gas and Electric Co. 3.30% 2040 | | | 6,850 | | | | 6,845 | |
| Pacific Gas and Electric Co. 3.50% 2050 | | | 931 | | | | 927 | |
| Pakistan (Islamic Republic of) 5.50% 20212 | | | 3,535 | | | | 3,588 | |
| Panama (Republic of) 3.75% 20262 | | | 1,440 | | | | 1,579 | |
| Panama (Republic of) 3.16% 2030 | | | 3,730 | | | | 4,138 | |
| Panama (Republic of) 4.50% 2050 | | | 1,230 | | | | 1,587 | |
| Panama (Republic of) 4.50% 2056 | | | 1,465 | | | | 1,893 | |
| Panther BF Aggregator 2, LP 6.25% 20262 | | | 55 | | | | 59 | |
| Panther BF Aggregator 2, LP 8.50% 20272 | | | 200 | | | | 218 | |
| Par Pharmaceutical Inc. 7.50% 20272 | | | 206 | | | | 224 | |
| Paraguay (Republic of) 4.625% 2023 | | | 947 | | | | 1,020 | |
| Paraguay (Republic of) 5.00% 2026 | | | 235 | | | | 276 | |
| Paraguay (Republic of) 4.70% 20272 | | | 350 | | | | 410 | |
| Paraguay (Republic of) 5.60% 20482 | | | 2,340 | | | | 3,019 | |
| Paraguay (Republic of) 5.40% 20502 | | | 1,510 | | | | 1,918 | |
| PayPal Holdings, Inc. 2.30% 2030 | | | 541 | | | | 580 | |
| Peabody Energy Corp. 6.00% 20222 | | | 225 | | | | 165 | |
| PennyMac Financial Services, Inc. 5.375% 20252 | | | 210 | | | | 222 | |
| Peru (Republic of) 2.392% 2026 | | | 500 | | | | 534 | |
| Petrobras Global Finance Co. 6.75% 2050 | | | 1,370 | | | | 1,704 | |
| Petróleos Mexicanos 6.875% 20252 | | | 1,340 | | | | 1,471 | |
| Petróleos Mexicanos 6.49% 2027 | | | 100 | | | | 106 | |
| Petróleos Mexicanos 6.35% 2048 | | | 723 | | | | 657 | |
| Petróleos Mexicanos 7.69% 2050 | | | 250 | | | | 252 | |
| Petróleos Mexicanos 6.95% 2060 | | | 201 | | | | 189 | |
| PETRONAS Capital Ltd. 3.50% 20302 | | | 605 | | | | 697 | |
| PetSmart, Inc. 5.875% 20252 | | | 790 | | | | 813 | |
| PetSmart, Inc. 8.875% 20252 | | | 1,035 | | | | 1,064 | |
| PG&E Corp. 5.00% 2028 | | | 220 | | | | 235 | |
| PG&E Corp. 5.25% 2030 | | | 125 | | | | 138 | |
| Philip Morris International Inc. 2.10% 2030 | | | 634 | | | | 662 | |
| Philippines (Republic of) 1.648% 2031 | | | 1,637 | | | | 1,662 | |
| Pioneer Natural Resources Company 1.90% 2030 | | | 1,078 | | | | 1,069 | |
| Plains All American Pipeline, LP 3.80% 2030 | | | 352 | | | | 379 | |
| Poland (Republic of) 3.25% 2026 | | | 3,090 | | | | 3,491 | |
| Post Holdings, Inc. 4.625% 20302 | | | 579 | | | | 610 | |
| PowerTeam Services, LLC 9.033% 20252 | | | 100 | | | | 111 | |
| Prime Healthcare Services, Inc. 7.25% 20252 | | | 140 | | | | 149 | |
| Prime Security Services Borrower, LLC 3.375% 20272 | | | 160 | | | | 159 | |
| Procter & Gamble Company 3.00% 2030 | | | 338 | | | | 390 | |
| Progress Energy, Inc. 7.75% 2031 | | | 150 | | | | 224 | |
| PT Indonesia Asahan Aluminium Tbk 5.23% 20212 | | | 555 | | | | 577 | |
| PT Indonesia Asahan Aluminium Tbk 5.45% 20302 | | | 500 | | | | 602 | |
| PTT Exploration and Production PCL 2.587% 20272 | | | 200 | | | | 209 | |
| Public Service Electric and Gas Co. 2.05% 2050 | | | 415 | | | | 391 | |
| Puget Energy, Inc. 6.00% 2021 | | | 1,023 | | | | 1,059 | |
| Puget Energy, Inc. 5.625% 2022 | | | 480 | | | | 508 | |
| Qatar (State of) 3.875% 20232 | | | 475 | | | | 511 | |
| Qatar (State of) 3.40% 20252 | | | 4,805 | | | | 5,306 | |
| Qatar (State of) 4.50% 20282 | | | 3,205 | | | | 3,889 | |
| Qatar (State of) 5.103% 20482 | | | 530 | | | | 747 | |
| Rabobank Nederland 4.625% 2023 | | | 2,180 | | | | 2,431 | |
| Radiology Partners, Inc. 9.25% 20282 | | | 410 | | | | 462 | |
| Radiology Partners, Inc., Term Loan, (3-month USD-LIBOR + 4.25%) 4.476% 20255,6 | | | 325 | | | | 321 | |
| Rattler Midstream Partners LP 5.625% 20252 | | | 220 | | | | 233 | |
| Rayonier A.M. Products Inc. 7.625% 20262 | | | 40 | | | | 42 | |
| Regeneron Pharmaceuticals, Inc. 1.75% 2030 | | | 1,014 | | | | 1,000 | |
| Reynolds American Inc. 4.45% 2025 | | | 2,115 | | | | 2,409 | |
| Rolls-Royce PLC 5.75% 20272 | | | 220 | | | | 244 | |
| | |
| 192 | American Funds Insurance Series |
Capital World Bond Fund (formerly Global Bond Fund) (continued)
| Bonds, notes & other debt instruments (continued) | | Principal amount
(000) | | | Value
(000) | |
| U.S. dollars (continued) | | | | | | | | |
| Roper Technologies, Inc. 1.00% 2025 | | $ | 2,210 | | | $ | 2,238 | |
| Royal Caribbean Cruises Ltd. 11.50% 20252 | | | 95 | | | | 111 | |
| RP Escrow Issuer, LLC 5.25% 20252 | | | 75 | | | | 79 | |
| Russian Federation 4.25% 2027 | | | 1,400 | | | | 1,600 | |
| Sabine Pass Liquefaction, LLC 4.50% 20302 | | | 88 | | | | 104 | |
| Sabre GLBL Inc. 7.375% 20252 | | | 210 | | | | 228 | |
| Sabre Holdings Corp. 5.25% 20232 | | | 50 | | | | 51 | |
| Sabre Holdings Corp. 9.25% 20252 | | | 125 | | | | 149 | |
| Sally Holdings LLC and Sally Capital Inc. 5.625% 2025 | | | 640 | | | | 659 | |
| Sally Holdings LLC and Sally Capital Inc. 8.75% 20252 | | | 283 | | | | 315 | |
| Santander Holdings USA, Inc. 3.244% 2026 | | | 3,750 | | | | 4,095 | |
| Saudi Arabia (Kingdom of) 2.894% 20222 | | | 1,900 | | | | 1,959 | |
| Saudi Arabia (Kingdom of) 2.90% 2025 | | | 2,000 | | | | 2,158 | |
| Saudi Arabia (Kingdom of) 3.628% 20272 | | | 1,900 | | | | 2,137 | |
| Saudi Arabia (Kingdom of) 3.625% 20282 | | | 3,840 | | | | 4,310 | |
| Saudi Arabian Oil Co. 1.625% 20252 | | | 430 | | | | 441 | |
| Scentre Group 3.50% 20252 | | | 210 | | | | 225 | |
| Scentre Group 3.75% 20272 | | | 110 | | | | 119 | |
| Schlumberger BV 4.00% 20252 | | | 935 | | | | 1,064 | |
| Scientific Games Corp. 5.00% 20252 | | | 539 | | | | 557 | |
| Scientific Games Corp. 8.25% 20262 | | | 615 | | | | 664 | |
| Scientific Games Corp. 7.00% 20282 | | | 100 | | | | 108 | |
| Scientific Games Corp. 7.25% 20292 | | | 160 | | | | 176 | |
| Scripps Escrow II, Inc. 3.875% 20292 | | | 50 | | | | 52 | |
| Service Properties Trust 5.50% 2027 | | | 85 | | | | 93 | |
| ServiceNow, Inc. 1.40% 2030 | | | 1,830 | | | | 1,787 | |
| Shell International Finance BV 3.25% 2050 | | | 1,000 | | | | 1,135 | |
| Shire PLC 2.40% 2021 | | | 1,072 | | | | 1,086 | |
| Sinclair Television Group, Inc. 5.125% 20272 | | | 155 | | | | 158 | |
| Sinclair Television Group, Inc. 4.125% 20302 | | | 230 | | | | 236 | |
| Six Flags Entertainment Corp. 4.875% 20242 | | | 230 | | | | 231 | |
| Sizzling Platter LLC 8.50% 20252 | | | 200 | | | | 209 | |
| Skandinaviska Enskilda Banken AB 2.625% 2021 | | | 2,250 | | | | 2,261 | |
| Skandinaviska Enskilda Banken AB 2.80% 2022 | | | 2,100 | | | | 2,162 | |
| SkyMiles IP Ltd. 4.75% 20282 | | | 210 | | | | 229 | |
| Sotera Health Holdings LLC, Term Loan, (3-months USD-LIBOR + 4.50%) 5.50% 20265,6 | | | 184 | | | | 185 | |
| Southern California Edison Co. 2.85% 2029 | | | 200 | | | | 218 | |
| Southwestern Energy Co. 6.45% 20251 | | | 200 | | | | 208 | |
| Southwestern Energy Co. 8.375% 2028 | | | 60 | | | | 65 | |
| Springleaf Finance Corp. 6.125% 2024 | | | 650 | | | | 711 | |
| Sprint Corp. 7.625% 2026 | | | 180 | | | | 224 | |
| Sprint Corp. 6.875% 2028 | | | 725 | | | | 957 | |
| Sri Lanka (Democratic Socialist Republic of) 6.25% 2021 | | | 7,010 | | | | 6,101 | |
| Sri Lanka (Democratic Socialist Republic of) 5.75% 2022 | | | 3,700 | | | | 2,902 | |
| Sri Lanka (Democratic Socialist Republic of) 5.75% 2023 | | | 2,890 | | | | 1,863 | |
| State Grid Overseas Investment Ltd. 3.50% 20272 | | | 5,600 | | | | 6,232 | |
| Statoil ASA 3.70% 2024 | | | 1,950 | | | | 2,145 | |
| Statoil ASA 4.25% 2041 | | | 1,000 | | | | 1,257 | |
| Stericycle, Inc. 3.875% 20292 | | | 65 | | | | 67 | |
| Summit Materials, Inc. 6.50% 20272 | | | 210 | | | | 224 | |
| Sunoco Logistics Operating Partners, LP 4.00% 2027 | | | 1,490 | | | | 1,631 | |
| Sunoco LP 5.50% 2026 | | | 210 | | | | 216 | |
| Sunoco LP 4.50% 20292 | | | 220 | | | | 229 | |
| Surgery Center Holdings 10.00% 20272 | | | 210 | | | | 232 | |
| Swiss Re Finance (Luxembourg) SA 5.00% 2049 (UST Yield Curve Rate T Note Constant Maturity 5-year + 3.582% on 4/2/2029)1,2 | | | 800 | | | | 935 | |
| Syneos Health, Inc. 3.625% 20292 | | | 45 | | | | 45 | |
| Talen Energy Corp. 10.50% 20262 | | | 105 | | | | 94 | |
| Talen Energy Corp. 7.25% 20272 | | | 510 | | | | 544 | |
| Talen Energy Supply, LLC 7.625% 20282 | | | 70 | | | | 76 | |
| Targa Resources Partners LP 5.875% 2026 | | | 125 | | | | 133 | |
| Targa Resources Partners LP 5.50% 2030 | | | 230 | | | | 250 | |
| | | | | | | | | |
| American Funds Insurance Series | 193 |
Capital World Bond Fund (formerly Global Bond Fund) (continued)
| Bonds, notes & other debt instruments (continued) | | Principal amount
(000) | | | Value
(000) | |
| U.S. dollars (continued) | | | | | | | | |
| Targa Resources Partners LP 4.875% 20312 | | $ | 90 | | | $ | 98 | |
| Teekay Offshore Partners LP 8.50% 20232 | | | 550 | | | | 469 | |
| TEGNA Inc. 4.75% 20262 | | | 100 | | | | 107 | |
| Tencent Holdings Ltd. 3.24% 20502 | | | 7,950 | | | | 8,245 | |
| Tencent Music Entertainment Group 2.00% 2030 | | | 610 | | | | 607 | |
| Tenet Healthcare Corp. 4.875% 20262 | | | 865 | | | | 906 | |
| Teva Pharmaceutical Finance Co. BV 2.20% 2021 | | | 71 | | | | 71 | |
| Teva Pharmaceutical Finance Co. BV 2.80% 2023 | | | 4,361 | | | | 4,325 | |
| Teva Pharmaceutical Finance Co. BV 6.00% 2024 | | | 4,600 | | | | 4,887 | |
| Teva Pharmaceutical Finance Co. BV 7.125% 2025 | | | 3,910 | | | | 4,329 | |
| Teva Pharmaceutical Finance Co. BV 3.15% 2026 | | | 2,900 | | | | 2,793 | |
| State of Texas, Grand Parkway Transportation Corp., Grand Parkway System Toll Rev. Ref. Bonds, Series 2020-B, 3.236% 2052 | | | 1,780 | | | | 1,863 | |
| The Home Company Inc. 7.25% 20252 | | | 290 | | | | 299 | |
| Thermo Fisher Scientific Inc. 4.133% 2025 | | | 1,170 | | | | 1,331 | |
| T-Mobile US, Inc. 3.875% 20302 | | | 2,925 | | | | 3,391 | |
| T-Mobile US, Inc. 2.55% 20312 | | | 9,390 | | | | 9,872 | |
| Toronto-Dominion Bank 1.15% 2025 | | | 7,000 | | | | 7,151 | |
| Total Capital International 3.127% 2050 | | | 3,283 | | | | 3,562 | |
| Total Play Telecomunicaciones, SA de CV 7.50% 20252 | | | 230 | | | | 230 | |
| Toyota Motor Credit Corp. 2.90% 2023 | | | 1,360 | | | | 1,439 | |
| Toyota Motor Credit Corp. 1.80% 2025 | | | 8,000 | | | | 8,392 | |
| Toyota Motor Credit Corp. 3.00% 2025 | | | 1,360 | | | | 1,496 | |
| Toyota Motor Credit Corp. 3.375% 2030 | | | 453 | | | | 530 | |
| TransCanada PipeLines Ltd. 4.10% 2030 | | | 1,342 | | | | 1,587 | |
| TransDigm Inc. 6.50% 2024 | | | 25 | | | | 25 | |
| TransDigm Inc. 6.25% 20262 | | | 204 | | | | 218 | |
| TransDigm Inc. 5.50% 2027 | | | 220 | | | | 232 | |
| Transocean Guardian Ltd. 5.875% 20242 | | | 43 | | | | 36 | |
| Transocean Inc. 6.125% 20252 | | | 94 | | | | 89 | |
| Transocean Poseidon Ltd. 6.875% 20272 | | | 130 | | | | 119 | |
| Travelport Finance Luxembourg SARL, Term Loan, (3-month USD-LIBOR + 5.00%) 5.254% 20265,6 | | | 73 | | | | 51 | |
| TreeHouse Foods, Inc. 4.00% 2028 | | | 50 | | | | 52 | |
| Trilogy International Partners, LLC 8.875% 20222 | | | 1,585 | | | | 1,533 | |
| Trivium Packaging BV 8.50% 20272 | | | 200 | | | | 219 | |
| Tronox Ltd. 6.50% 20262 | | | 375 | | | | 391 | |
| Turkey (Republic of) 6.25% 2022 | | | 1,880 | | | | 1,971 | |
| Turkey (Republic of) 5.75% 2024 | | | 2,500 | | | | 2,638 | |
| Turkey (Republic of) 6.35% 2024 | | | 2,220 | | | | 2,388 | |
| U.S. Treasury 0.125% 2022 | | | 12,340 | | | | 12,341 | |
| U.S. Treasury 2.625% 2023 | | | 6,900 | | | | 7,270 | |
| U.S. Treasury 1.875% 2024 | | | 4,515 | | | | 4,787 | |
| U.S. Treasury 2.75% 2025 | | | 10,140 | | | | 11,245 | |
| U.S. Treasury 2.875% 2025 | | | 5,400 | | | | 6,063 | |
| U.S. Treasury 0.625% 2030 | | | 11,600 | | | | 11,338 | |
| U.S. Treasury 1.125% 2040 | | | 9,170 | | | | 8,704 | |
| U.S. Treasury 2.75% 20479 | | | 1,625 | | | | 2,040 | |
| U.S. Treasury 3.00% 2048 | | | 5,045 | | | | 6,637 | |
| U.S. Treasury 1.25% 20509 | | | 12,900 | | | | 11,700 | |
| U.S. Treasury 2.00% 20509 | | | 8,100 | | | | 8,796 | |
| U.S. Treasury Inflation-Protected Security 0.125% 20213 | | | 3,340 | | | | 3,352 | |
| U.S. Treasury Inflation-Protected Security 1.125% 20213 | | | 3,321 | | | | 3,322 | |
| U.S. Treasury Inflation-Protected Security 0.125% 20303,9 | | | 14,594 | | | | 16,279 | |
| U.S. Treasury Inflation-Protected Security 0.75% 20423 | | | 720 | | | | 918 | |
| U.S. Treasury Inflation-Protected Security 0.625% 20433 | | | 1,359 | | | | 1,697 | |
| U.S. Treasury Inflation-Protected Security 1.375% 20443 | | | 5,921 | | | | 8,540 | |
| U.S. Treasury Inflation-Protected Security 1.00% 20493,9 | | | 5,381 | | | | 7,588 | |
| U.S. Treasury Inflation-Protected Security 0.25% 20503,9 | | | 5,672 | | | | 6,756 | |
| Uber Technologies, Inc. 8.00% 20262 | | | 300 | | | | 327 | |
| UBS Group AG 1.008% 2024 (UST Yield Curve Rate T Note Constant Maturity 5-year + 0.83% on 7/30/2023)1,2 | | | 1,950 | | | | 1,970 | |
| | | | | | | | | |
| 194 | American Funds Insurance Series |
Capital World Bond Fund (formerly Global Bond Fund) (continued)
| Bonds, notes & other debt instruments (continued) | | Principal amount
(000) | | | Value
(000) | |
| U.S. dollars (continued) | | | | | | | | |
| Ultimate Software Group Inc., Term Loan, (3-month USD-LIBOR + 4.00%) 4.75% 20265,6 | | $ | 319 | | | $ | 321 | |
| UniCredit SpA 3.75% 20222 | | | 1,750 | | | | 1,814 | |
| UniCredit SpA 4.625% 20272 | | | 6,805 | | | | 7,749 | |
| Uniform Mortgage-Backed Security 1.50% 20364,10 | | | 19,656 | | | | 20,196 | |
| Uniform Mortgage-Backed Security 2.00% 20514,10 | | | 5,652 | | | | 5,851 | |
| Uniform Mortgage-Backed Security 2.00% 20514,10 | | | 4,350 | | | | 4,510 | |
| Unisys Corp. 6.875% 20272 | | | 50 | | | | 55 | |
| United Airlines Holdings, Inc. 6.50% 20272 | | | 290 | | | | 312 | |
| United Mexican States 3.90% 2025 | | | 1,080 | | | | 1,213 | |
| United Mexican States 3.25% 2030 | | | 2,685 | | | | 2,906 | |
| United Mexican States 2.659% 2031 | | | 1,822 | | | | 1,869 | |
| United Mexican States 4.75% 2032 | | | 950 | | | | 1,146 | |
| United Mexican States 5.00% 2051 | | | 890 | | | | 1,111 | |
| United Natural Foods, Inc. 6.75% 20282 | | | 175 | | | | 183 | |
| United Rentals, Inc. 3.875% 2031 | | | 50 | | | | 53 | |
| United Technologies Corp. 4.125% 2028 | | | 1,900 | | | | 2,266 | |
| Univision Communications Inc. 6.625% 20272 | | | 220 | | | | 237 | |
| Upjohn Inc. 2.30% 20272 | | | 794 | | | | 846 | |
| Upjohn Inc. 3.85% 20402 | | | 970 | | | | 1,095 | |
| Uruguay (Oriental Republic of) 4.375% 2031 | | | 600 | | | | 737 | |
| Vale Overseas Ltd. 3.75% 2030 | | | 1,873 | | | | 2,086 | |
| Valeant Pharmaceuticals International, Inc. 6.125% 20252 | | | 800 | | | | 825 | |
| Valvoline Inc. 4.375% 2025 | | | 90 | | | | 93 | |
| Valvoline Inc. 3.625% 20312 | | | 210 | | | | 216 | |
| Venator Materials Corp. 5.75% 20252 | | | 620 | | | | 581 | |
| Venator Materials Corp. 9.50% 20252 | | | 420 | | | | 460 | |
| Veritas Holdings Ltd. 7.50% 20232 | | | 440 | | | | 442 | |
| Veritas Holdings Ltd. 10.50% 20242 | | | 200 | | | | 204 | |
| Veritas Holdings Ltd. 7.50% 20252 | | | 285 | | | | 293 | |
| Verizon Communications Inc. 0.85% 2025 | | | 4,480 | | | | 4,516 | |
| Verizon Communications Inc. 3.15% 2030 | | | 575 | | | | 645 | |
| Vertical U.S. Newco Inc. 5.25% 20272 | | | 225 | | | | 239 | |
| VICI Properties LP 4.25% 20262 | | | 175 | | | | 182 | |
| VICI Properties LP 4.625% 20292 | | | 45 | | | | 48 | |
| VICI Properties LP / VICI Note Co. Inc. 3.50% 20252 | | | 110 | | | | 113 | |
| VICI Properties LP / VICI Note Co. Inc. 4.125% 20302 | | | 250 | | | | 264 | |
| Vine Oil & Gas LP 8.75% 20232 | | | 175 | | | | 140 | |
| Virgin Media O2 4.25% 20312 | | | 275 | | | | 282 | |
| Volkswagen Group of America Finance, LLC 4.00% 20212 | | | 1,900 | | | | 1,959 | |
| Volkswagen Group of America Finance, LLC 4.625% 20252 | | | 1,280 | | | | 1,493 | |
| Walt Disney Company 2.65% 2031 | | | 5,520 | | | | 6,053 | |
| Warner Music Group 3.875% 20302 | | | 210 | | | | 224 | |
| WEA Finance LLC 3.75% 20242 | | | 535 | | | | 565 | |
| Wells Fargo & Company 2.393% 2028 (USD-SOFR + 2.10% on 6/2/2027)1 | | | 11,775 | | | | 12,542 | |
| WESCO Distribution, Inc. 7.125% 20252 | | | 195 | | | | 215 | |
| WESCO Distribution, Inc. 7.25% 20282 | | | 215 | | | | 245 | |
| Western Gas Partners LP 4.50% 2028 | | | 230 | | | | 239 | |
| Western Global Airlines LLC 10.375% 20252 | | | 80 | | | | 89 | |
| Western Midstream Operating, LP 4.10% 20251 | | | 155 | | | | 160 | |
| Western Midstream Operating, LP 4.75% 2028 | | | 70 | | | | 73 | |
| Westfield Corp. Ltd. 3.15% 20222 | | | 245 | | | | 249 | |
| Westpac Banking Corp. 2.894% 2030 | | | | | | | | |
| (UST Yield Curve Rate T Note Constant Maturity 5-year + 1.35% on 2/4/2025)1 | | | 2,900 | | | | 3,041 | |
| Williams Companies, Inc. 3.50% 2030 | | | 1,024 | | | | 1,161 | |
| Williams Partners LP 4.30% 2024 | | | 820 | | | | 905 | |
| Wyndham Worldwide Corp. 4.375% 20282 | | | 230 | | | | 239 | |
| Wynn Las Vegas, LLC and Wynn Capital Corp. 4.25% 20232 | | | 228 | | | | 232 | |
| Wynn Macau, Ltd. 5.625% 20282 | | | 200 | | | | 210 | |
| Wynn Resorts Ltd. 7.75% 20252 | | | 180 | | | | 195 | |
| Xcel Energy Inc. 3.35% 2026 | | | 2,581 | | | | 2,914 | |
| Xerox Corp. 5.50% 20282 | | | 450 | | | | 478 | |
| Ziggo Bond Co. BV 5.125% 20302 | | | 200 | | | | 211 | |
| | |
| American Funds Insurance Series | 195 |
Capital World Bond Fund (formerly Global Bond Fund) (continued)
| Bonds, notes & other debt instruments (continued) | | Principal amount
(000) | | | Value
(000) | |
| U.S. dollars (continued) | | | | | | | | |
| Ziggo Bond Finance BV 5.50% 20272 | | $ | 412 | | | $ | 431 | |
| Ziggo Bond Finance BV 4.875% 20302 | | | 100 | | | | 105 | |
| Zimmer Holdings, Inc. 3.15% 2022 | | | 790 | | | | 813 | |
| | | | | | | | 924,718 | |
| | | | | | | | | |
| Total bonds, notes & other debt instruments (cost: $2,015,926,000) | | | | | | | 2,189,999 | |
| | | | | | | | | |
| Common stocks 0.08% | | Shares | | | | | |
| U.S. dollars 0.08% | | | | | | | | |
| Associated Materials Group Inc.11,12,13 | | | 174,911 | | | | 1,098 | |
| Oasis Petroleum Inc.13 | | | 8,735 | | | | 324 | |
| Weatherford International13 | | | 29,931 | | | | 180 | |
| Tribune Resources, LLC11,12,13 | | | 158,988 | | | | 145 | |
| ACR III LSC Holdings LLC11,12,13 | | | 49 | | | | 74 | |
| Advanz Pharma Corp. Ltd.13,14 | | | 9,130 | | | | 40 | |
| Advanz Pharma Corp. Ltd.13 | | | 6,028 | | | | 27 | |
| McDermott International, Inc.13 | | | 4,287 | | | | 3 | |
| Jonah Energy Parent LLC11,12,13 | | | 130 | | | | 2 | |
| Sable Permian Resources, LLC, units11,12,13 | | | 2,905,980 | | | | — | 15 |
| | | | | | | | | |
| Total common stocks (cost: $4,556,000) | | | | | | | 1,893 | |
| | | | | | | | | |
| Rights & warrants 0.00% | | | | | | | | |
| U.S. dollars 0.00% | | | | | | | | |
| Tribune Resources, LLC, Class A, warrants, expire 202311,12,13 | | | 53,128 | | | | — | 15 |
| Tribune Resources, LLC, Class B, warrants, expire 202311,12,13 | | | 41,322 | | | | — | 15 |
| Tribune Resources, LLC, Class C, warrants, expire 202311,12,13 | | | 39,060 | | | | — | 15 |
| | | | | | | | | |
| Total rights & warrants (cost: $8,000) | | | | | | | — | 15 |
| | | | | | | | | |
| Short-term securities 6.44% | | | | | | | | |
| Money market investments 6.28% | | | | | | | | |
| Capital Group Central Cash Fund 0.12%16,17 | | | 1,470,026 | | | | 147,017 | |
| | | | | | | | | |
| | | Principal amount
(000) | | | | | |
| Bills & notes of governments outside the U.S. 0.16% | | | | | | | | |
| Greek Treasury Bill 0.13% due 1/4/2021 | | € | 3,000 | | | | 3,665 | |
| | | | | | | | | |
| Total short-term securities (cost: $150,388,000) | | | | | | | 150,682 | |
| Total investment securities 100.16% (cost: $2,170,878,000) | | | | | | | 2,342,574 | |
| Other assets less liabilities (0.16)% | | | | | | | (3,829 | ) |
| | | | | | | | | |
| Net assets 100.00% | | | | | | $ | 2,338,745 | |
Futures contracts
| Contracts | | Type | | Number of
contracts | | Expiration | | Notional
amount
(000) | 18
| | Value at
12/31/2020
(000) | 19
| | Unrealized
appreciation
(depreciation)
at 12/31/2020
(000) | |
| 5 Year U.S. Treasury Note Futures | | Long | | 53 | | April 2021 | | $ | 5,300 | | | $ | 6,687 | | | | $ | 14 | |
| 10 Year Japanese Government Bond Futures | | Long | | 1 | | March 2021 | | ¥ | 100,000 | | | | 1,471 | | | | | (1 | ) |
| 10 Year Ultra U.S. Treasury Note Futures | | Short | | 256 | | March 2021 | | $ | (25,600 | ) | | | (40,028 | ) | | | | 88 | |
| | | | | | | | | | | | | | | | | | | | |
| 196 | American Funds Insurance Series |
Capital World Bond Fund (formerly Global Bond Fund) (continued)
Futures contracts (continued)
| Contracts | | Type | | Number of
contracts | | Expiration | | Notional
amount
(000) | 18
| | Value at
12/31/2020
(000) | 19
| | Unrealized
appreciation
(depreciation)
at 12/31/2020
(000) | |
| 10 Year U.S. Treasury Note Futures | | Short | | 363 | | March 2021 | | | (36,300 | ) | | $ | (50,122 | ) | | | $ | (53 | ) |
| 30 Year Euro-Buxl Futures | | Long | | 50 | | March 2021 | | € | 5,000 | | | | 13,758 | | | | | 206 | |
| 30 Year Ultra U.S. Treasury Bond Futures | | Long | | 75 | | March 2021 | | $ | 7,500 | | | | 16,017 | | | | | (101 | ) |
| | | | | | | | | | | | | | | | | | $ | 153 | |
Forward currency contracts
| Contract amount | | | | | | Unrealized
appreciation
(depreciation) | |
Purchases
(000) | | Sales
(000) | | Counterparty | | Settlement
date | | at 12/31/2020
(000) | |
| AUD1,830 | | USD1,338 | | Bank of New York Mellon | | 1/6/2021 | | | $ | 73 | |
| USD1,384 | | AUD1,830 | | HSBC Bank | | 1/6/2021 | | | | (27 | ) |
| USD7,916 | | NZD11,400 | | Bank of America | | 1/6/2021 | | | | (287 | ) |
| EUR5,320 | | USD6,419 | | Bank of America | | 1/7/2021 | | | | 81 | |
| EUR2,080 | | USD2,519 | | HSBC Bank | | 1/7/2021 | | | | 23 | |
| USD4,624 | | EUR3,790 | | Citibank | | 1/7/2021 | | | | (7 | ) |
| JPY11,212,630 | | USD107,405 | | Goldman Sachs | | 1/8/2021 | | | | 1,198 | |
| EUR74,298 | | USD89,863 | | JPMorgan Chase | | 1/8/2021 | | | | 924 | |
| CAD16,330 | | USD12,628 | | Standard Chartered Bank | | 1/8/2021 | | | | 202 | |
| SEK23,400 | | USD2,746 | | Bank of America | | 1/8/2021 | | | | 99 | |
| MXN220,660 | | USD10,980 | | HSBC Bank | | 1/8/2021 | | | | 98 | |
| AUD1,260 | | USD928 | | HSBC Bank | | 1/8/2021 | | | | 44 | |
| NOK10,500 | | USD1,188 | | Bank of New York Mellon | | 1/8/2021 | | | | 36 | |
| CHF800 | | USD894 | | Bank of America | | 1/8/2021 | | | | 10 | |
| CZK181,540 | | EUR6,914 | | HSBC Bank | | 1/8/2021 | | | | 5 | |
| EUR10,116 | | DKK75,300 | | Bank of New York Mellon | | 1/8/2021 | | | | (2 | ) |
| USD2,299 | | EUR1,890 | | Citibank | | 1/8/2021 | | | | (11 | ) |
| PLN12,600 | | USD3,397 | | Citibank | | 1/8/2021 | | | | (24 | ) |
| USD2,283 | | MXN46,000 | | Goldman Sachs | | 1/8/2021 | | | | (26 | ) |
| USD1,861 | | AUD2,460 | | HSBC Bank | | 1/8/2021 | | | | (36 | ) |
| USD984 | | ZAR15,210 | | Bank of America | | 1/8/2021 | | | | (49 | ) |
| USD2,623 | | GBP1,970 | | Citibank | | 1/8/2021 | | | | (71 | ) |
| USD6,270 | | CZK136,930 | | Citibank | | 1/8/2021 | | | | (106 | ) |
| USD12,699 | | CAD16,330 | | Goldman Sachs | | 1/8/2021 | | | | (130 | ) |
| USD17,096 | | ILS56,300 | | Citibank | | 1/8/2021 | | | | (427 | ) |
| USD15,021 | | AUD20,170 | | UBS AG | | 1/8/2021 | | | | (531 | ) |
| CNH137,510 | | USD21,027 | | UBS AG | | 1/12/2021 | | | | 102 | |
| USD2,914 | | THB88,000 | | Citibank | | 1/12/2021 | | | | (24 | ) |
| JPY1,485,880 | | USD14,244 | | HSBC Bank | | 1/14/2021 | | | | 149 | |
| COP4,735,500 | | USD1,368 | | Citibank | | 1/14/2021 | | | | 19 | |
| KRW28,454,610 | | USD26,193 | | Citibank | | 1/14/2021 | | | | 7 | |
| USD2,244 | | IDR31,688,220 | | Standard Chartered Bank | | 1/14/2021 | | | | (8 | ) |
| USD3,313 | | INR244,900 | | HSBC Bank | | 1/14/2021 | | | | (34 | ) |
| USD1,765 | | CLP1,302,100 | | Citibank | | 1/14/2021 | | | | (67 | ) |
| USD6,914 | | KRW7,636,890 | | Citibank | | 1/14/2021 | | | | (117 | ) |
| USD5,644 | | DKK34,570 | | Goldman Sachs | | 1/19/2021 | | | | (34 | ) |
| USD10,438 | | NZD14,740 | | Goldman Sachs | | 1/21/2021 | | | | (169 | ) |
| CAD13,240 | | USD10,150 | | Citibank | | 1/29/2021 | | | | 253 | |
| CAD13,190 | | USD10,114 | | Bank of America | | 1/29/2021 | | | | 249 | |
| MXN76,040 | | USD3,645 | | Goldman Sachs | | 1/29/2021 | | | | 163 | |
| USD2,093 | | ZAR30,700 | | UBS AG | | 1/29/2021 | | | | 13 | |
| EUR5,779 | | DKK43,000 | | Citibank | | 1/29/2021 | | | | 2 | |
| EUR722 | | DKK5,372 | | Goldman Sachs | | 1/29/2021 | | | | — | 15 |
| | | | | | | | | | | | |
| American Funds Insurance Series | 197 |
Capital World Bond Fund (formerly Global Bond Fund) (continued)
Forward currency contracts (continued)
| Contract amount | | | | | | Unrealized
appreciation
(depreciation) | |
Purchases
(000) | | Sales
(000) | | Counterparty | | Settlement
date | | at 12/31/2020
(000) | |
| EUR722 | | DKK5,372 | | Citibank | | 1/29/2021 | | | $ | — | 15 |
| EUR14,020 | | DKK104,345 | | Citibank | | 1/29/2021 | | | | — | 15 |
| USD1,769 | | ZAR29,280 | | Bank of America | | 1/29/2021 | | | | (215 | ) |
| USD7,227 | | MXN155,490 | | Morgan Stanley | | 1/29/2021 | | | | (560 | ) |
| USD19,929 | | CAD26,430 | | Citibank | | 1/29/2021 | | | | (837 | ) |
| CAD17,000 | | USD13,128 | | UBS AG | | 2/10/2021 | | | | 230 | |
| RUB422,320 | | USD5,511 | | Goldman Sachs | | 2/10/2021 | | | | 175 | |
| | | | | | | | | | $ | 356 | |
Swap contracts
Interest rate swaps
| Receive | | Pay | | Expiration
date | | Notional
(000) | | | Value at
12/31/2020
(000) | | Upfront
premium
paid
(000) | | Unrealized
depreciation
at 12/31/2020
(000) | |
| 0.0079% | | 6-month JPY-LIBOR | | 4/8/2030 | | ¥ | 1,620,000 | | | $ | (32 | ) | | $ | 32 | | | $ | (64 | ) |
Credit default swaps
Centrally cleared credit default swaps on credit indices — buy protection
| Receive | | Pay/
Payment frequency | | Expiration
date | | Notional
(000) | | | Value at
12/31/2020
(000) | | Upfront
premium
paid
(000) | | Unrealized
depreciation
at 12/31/2020
(000) | |
| CDX.EM.34 | | 1.00%/Quarterly | | 12/20/2025 | | $ | 25,000 | | | $ | 602 | | | $ | 1,300 | | | $ | (698 | ) |
Centrally cleared credit default swaps on credit indices — sell protection
Receive/
Payment frequency | | Pay | | Expiration
date | | Notional
(000) | | | Value at
12/31/2020
(000) | | Upfront
premium
paid
(000) | | Unrealized
appreciation
at 12/31/2020
(000) | |
| 1.00%/Quarterly | | CDX.NA.IG.35 | | 12/20/2025 | | $ | 13,090 | | | $ | 321 | | | $ | 290 | | | $ | 31 | |
Investments in affiliates17
| | | Value of
affiliate at
1/1/2020
(000) | | | Additions
(000) | | | Reductions
(000) | | | Net
realized
gain
(000) | | | Net
unrealized
depreciation
(000) | | | Value of
affiliate at
12/31/2020
(000) | | | Dividend
income
(000) | |
| Short-term securities 6.29% | | | | | | | | | | | | | | | | | | | | | | | | | | | | |
| Money market investments 6.29% | | | | | | | | | | | | | | | | | | | | | | | | | | | | |
| Capital Group Central Cash Fund 0.12%16 | | $ | 77,745 | | | $ | 900,757 | | | $ | 831,352 | | | $ | 35 | | | $ | (168 | ) | | $ | 147,017 | | | $ | 477 | |
| | |
| 198 | American Funds Insurance Series |
Capital World Bond Fund (formerly Global Bond Fund) (continued)
| 1 | Step bond; coupon rate may change at a later date. |
| 2 | Acquired in a transaction exempt from registration under Rule 144A of the Securities Act of 1933. May be resold in the U.S. in transactions exempt from registration, normally to qualified institutional buyers. The total value of all such securities was $282,947,000, which represented 12.10% of the net assets of the fund. |
| 3 | Index-linked bond whose principal amount moves with a government price index. |
| 4 | Principal payments may be made periodically. Therefore, the effective maturity date may be earlier than the stated maturity date. |
| 5 | Loan participations and assignments; may be subject to legal or contractual restrictions on resale. The total value of all such loans was $2,635,000, which represented .11% of the net assets of the fund. |
| 6 | Coupon rate may change periodically. Reference rate and spread are as of the most recent information available. Some coupon rates are determined by the issuer or agent based on current market conditions; therefore, the reference rate and spread are not available. |
| 7 | Scheduled interest and/or principal payment was not received. |
| 8 | Payment in kind; the issuer has the option of paying additional securities in lieu of cash. Most recent payment was 100% cash unless otherwise noted. |
| 9 | All or a portion of this security was pledged as collateral. The total value of pledged collateral was $4,515,000, which represented .19% of the net assets of the fund. |
| 10 | Purchased on a TBA basis. |
| 11 | Valued under fair value procedures adopted by authority of the board of trustees. The total value of all such securities was $1,319,000, which represented .06% of the net assets of the fund. |
| 12 | Value determined using significant unobservable inputs. |
| 13 | Security did not produce income during the last 12 months. |
| 14 | Acquired through a private placement transaction exempt from registration under the Securities Act of 1933. May be subject to legal or contractual restrictions on resale. Further details on this holding appear below. |
| 15 | Amount less than one thousand. |
| 16 | Rate represents the seven-day yield at 12/31/2020. |
| 17 | Part of the same group of investment companies as the fund as defined under the Investment Company Act of 1940. |
| 18 | Notional amount is calculated based on the number of contracts and notional contract size. |
| 19 | Value is calculated based on the notional amount and current market price. |
| | |
| Private placement security | | Acquisition
date | | | Cost
(000) | | | Value
(000) | | | Percent
of net
assets | |
| Advanz Pharma Corp. Ltd. | | | 8/31/2018 | | | $ | 116 | | | $ | 40 | | | | .00 | % |
Key to abbreviations and symbols
AUD/A$ = Australian dollars
BRL = Brazilian reais
CAD/C$ = Canadian dollars
CHF = Swiss francs
CLP = Chilean pesos
CNH/CNY = Chinese yuan renminbi
COP = Colombian pesos
CZK = Czech korunas
DKK/DKr = Danish kroner
DOP = Dominican pesos
EUR/€ = Euros
EURIBOR = Euro Interbank Offered Rate
GBP/£ = British pounds
IDR = Indonesian rupiah
ILS = Israeli shekels
INR = Indian rupees
JPY/¥ = Japanese yen
KRW = South Korean won
LIBOR = London Interbank Offered Rate
MXN = Mexican pesos
MYR = Malaysian ringgits
NOK/NKr = Norwegian kroner
NZD/NZ$ = New Zealand dollars
PEN = Peruvian nuevos soles
PLN = Polish zloty
Ref. = Refunding
Rev. = Revenue
RON = Romanian leu
RUB = Russian rubles
S$ = Singapore dollars
SEK = Swedish kronor
SOFR = Secured Overnight Financing Rate
TBA = To-be-announced
THB = Thai baht
UAH = Ukrainian hryvnia
USD/$ = U.S. dollars
ZAR = South African rand
See notes to financial statements.
| American Funds Insurance Series | 199 |
High-Income Bond Fund
Investment portfolio December 31, 2020
| Bonds, notes & other debt instruments 89.34% | | Principal amount
(000) | | | Value
(000) | |
| Corporate bonds, notes & loans 89.33% | | | | | | | | |
| Communication services 13.43% | | | | | | | | |
| Brightstar Escrow Corp. 9.75% 20251 | | $ | 575 | | | $ | 616 | |
| Cars.com Inc. 6.375% 20281 | | | 625 | | | | 665 | |
| CCO Holdings LLC and CCO Holdings Capital Corp. 4.00% 20231 | | | 1,155 | | | | 1,164 | |
| CCO Holdings LLC and CCO Holdings Capital Corp. 5.50% 20261 | | | 263 | | | | 273 | |
| CCO Holdings LLC and CCO Holdings Capital Corp. 5.75% 20261 | | | 3,182 | | | | 3,287 | |
| CCO Holdings LLC and CCO Holdings Capital Corp. 5.00% 20281 | | | 96 | | | | 102 | |
| CCO Holdings LLC and CCO Holdings Capital Corp. 5.375% 20291 | | | 24 | | | | 26 | |
| CCO Holdings LLC and CCO Holdings Capital Corp. 4.50% 20301 | | | 304 | | | | 323 | |
| CCO Holdings LLC and CCO Holdings Capital Corp. 4.75% 20301 | | | 787 | | | | 850 | |
| CCO Holdings LLC and CCO Holdings Capital Corp. 4.25% 20311 | | | 4,535 | | | | 4,785 | |
| CCO Holdings LLC and CCO Holdings Capital Corp. 4.50% 20321 | | | 2,549 | | | | 2,725 | |
| CenturyLink, Inc. 6.75% 2023 | | | 2,235 | | | | 2,493 | |
| CenturyLink, Inc. 7.50% 2024 | | | 583 | | | | 661 | |
| CenturyLink, Inc. 5.125% 20261 | | | 2,069 | | | | 2,188 | |
| CenturyLink, Inc. 4.00% 20271 | | | 134 | | | | 139 | |
| Clear Channel Worldwide Holdings, Inc. 9.25% 2024 | | | 561 | | | | 569 | |
| Diamond Sports Group LLC 5.375% 20261 | | | 993 | | | | 809 | |
| Diamond Sports Group LLC 6.625% 20271 | | | 1,155 | | | | 700 | |
| Discovery Communications, Inc. 4.65% 2050 | | | 442 | | | | 553 | |
| Embarq Corp. 7.995% 2036 | | | 927 | | | | 1,145 | |
| Epicor Software Corp., Term Loan, (3-month USD-LIBOR + 4.25%) 5.25% 20272,3 | | | 75 | | | | 75 | |
| Epicor Software Corp., Term Loan, (3-month USD-LIBOR + 7.75%) 8.75% 20282,3 | | | 525 | | | | 549 | |
| Front Range BidCo, Inc. 6.125% 20281 | | | 1,089 | | | | 1,153 | |
| Frontier Communications Corp. 10.50% 20224 | | | 4,500 | | | | 2,356 | |
| Frontier Communications Corp. 5.875% 20271 | | | 1,550 | | | | 1,679 | |
| Frontier Communications Corp. 5.00% 20281 | | | 3,500 | | | | 3,655 | |
| Frontier Communications Corp. 6.75% 20291 | | | 1,675 | | | | 1,795 | |
| Gogo Inc. 9.875% 20241 | | | 10,414 | | | | 11,170 | |
| Gray Television, Inc. 7.00% 20271 | | | 808 | | | | 886 | |
| iHeartCommunications, Inc. 5.25% 20271 | | | 1,235 | | | | 1,296 | |
| Inmarsat PLC 6.75% 20261 | | | 1,475 | | | | 1,591 | |
| Intelsat Jackson Holding Co. 8.00% 20241 | | | 1,675 | | | | 1,718 | |
| Intelsat Jackson Holding Co. 8.50% 20241,4 | | | 3,175 | | | | 2,278 | |
| Intelsat Jackson Holding Co., Term Loan, (3-month USD-LIBOR + 5.50%) 6.50% 20212,3 | | | 1,212 | | | | 1,241 | |
| Intelsat Jackson Holding Co., Term Loan, 6.625% 20242 | | | 3,900 | | | | 3,976 | |
| Lamar Media Corp. 3.75% 2028 | | | 61 | | | | 63 | |
| Lamar Media Corp. 4.875% 2029 | | | 300 | | | | 320 | |
| Lamar Media Corp. 4.00% 2030 | | | 260 | | | | 270 | |
| Liberty Global PLC 5.50% 20281 | | | 656 | | | | 693 | |
| Ligado Networks LLC 15.50% 20231,5 | | | 1,750 | | | | 1,706 | |
| Live Nation Entertainment, Inc. 3.75% 20281 | | | 450 | | | | 456 | |
| Match Group, Inc. 4.625% 20281 | | | 1,100 | | | | 1,155 | |
| MDC Partners Inc. 6.50% 20241 | | | 5,170 | | | | 5,249 | |
| Meredith Corp. 6.875% 2026 | | | 2,239 | | | | 2,187 | |
| National CineMedia, LLC 5.875% 20281 | | | 250 | | | | 213 | |
| Netflix, Inc. 5.375% 2021 | | | 1,300 | | | | 1,307 | |
| Netflix, Inc. 4.875% 2028 | | | 360 | | | | 407 | |
| Netflix, Inc. 4.875% 20301 | | | 174 | | | | 200 | |
| Nexstar Broadcasting, Inc. 4.75% 20281 | | | 2,500 | | | | 2,620 | |
| Nexstar Escrow Corp. 5.625% 20271 | | | 289 | | | | 310 | |
| Numericable Group SA 7.375% 20261 | | | 1,049 | | | | 1,105 | |
| Qwest Capital Funding, Inc. 6.875% 2028 | | | 660 | | | | 705 | |
| Scripps Escrow II, Inc. 3.875% 20291 | | | 1,125 | | | | 1,175 | |
| Sinclair Television Group, Inc. 5.125% 20271 | | | 345 | | | | 352 | |
| Sinclair Television Group, Inc. 4.125% 20301 | | | 1,800 | | | | 1,847 | |
| Sirius XM Radio Inc. 4.625% 20241 | | | 74 | | | | 77 | |
| Sirius XM Radio Inc. 4.125% 20301 | | | 345 | | | | 368 | |
| Sprint Corp. 11.50% 2021 | | | 987 | | | | 1,073 | |
| Sprint Corp. 7.625% 2026 | | | 2,000 | | | | 2,485 | |
| Sprint Corp. 6.875% 2028 | | | 3,671 | | | | 4,847 | |
| Sprint Corp. 8.75% 2032 | | | 2,440 | | | | 3,866 | |
| 200 | American Funds Insurance Series |
High-Income Bond Fund (continued)
| Bonds, notes & other debt instruments (continued) | | Principal amount
(000) | | | Value
(000) | |
| Corporate bonds, notes & loans (continued) | | | | | | | | |
| Communication services (continued) | | | | | | | | |
| TEGNA Inc. 4.75% 20261 | | $ | 850 | | | $ | 909 | |
| TEGNA Inc. 4.625% 20281 | | | 635 | | | | 650 | |
| TEGNA Inc. 5.00% 2029 | | | 716 | | | | 757 | |
| T-Mobile US, Inc. 3.875% 20301 | | | 292 | | | | 339 | |
| T-Mobile US, Inc. 4.50% 20501 | | | 379 | | | | 468 | |
| Total Play Telecomunicaciones, SA de CV 7.50% 20251 | | | 725 | | | | 725 | |
| Trilogy International Partners, LLC 8.875% 20221 | | | 4,500 | | | | 4,353 | |
| Uniti Group LP / Uniti Fiber Holdings Inc. / CSL Capital LLC 7.875% 20251 | | | 75 | | | | 81 | |
| Univision Communications Inc. 5.125% 20251 | | | 3,195 | | | | 3,225 | |
| Univision Communications Inc. 6.625% 20271 | | | 3,050 | | | | 3,281 | |
| Virgin Media O2 4.25% 20311 | | | 1,925 | | | | 1,971 | |
| Virgin Media Secured Finance PLC 4.50% 20301 | | | 790 | | | | 826 | |
| Vodafone Group PLC 7.00% 2079 (5-year USD Swap + 4.873% on 4/4/2029)6 | | | 105 | | | | 131 | |
| Warner Music Group 5.50% 20261 | | | 228 | | | | 236 | |
| Warner Music Group 3.875% 20301 | | | 850 | | | | 905 | |
| Ziggo Bond Co. BV 5.125% 20301 | | | 419 | | | | 443 | |
| Ziggo Bond Finance BV 5.50% 20271 | | | 1,491 | | | | 1,559 | |
| Ziggo Bond Finance BV 4.875% 20301 | | | 1,075 | | | | 1,132 | |
| | | | | | | | 116,538 | |
| | | | | | | | | |
| Energy 12.44% | | | | | | | | |
| American Energy-Permian Basin, LLC / AEPB Finance Corp. 12.00% 20241,4 | | | 1,934 | | | | 14 | |
| Antero Resources Corp. 5.375% 2024 | | | 875 | | | | 855 | |
| Antero Resources Corp. 7.875% 20261 | | | 92 | | | | 95 | |
| Apache Corp. 4.625% 2025 | | | 770 | | | | 809 | |
| Apache Corp. 4.875% 2027 | | | 1,360 | | | | 1,444 | |
| Apache Corp. 4.375% 2028 | | | 791 | | | | 825 | |
| Apache Corp. 6.00% 2037 | | | 165 | | | | 183 | |
| Apache Corp. 5.10% 2040 | | | 795 | | | | 854 | |
| Apache Corp. 4.75% 2043 | | | 295 | | | | 306 | |
| Ascent Resources - Utica LLC 7.00% 20261 | | | 765 | | | | 734 | |
| Ascent Resources - Utica LLC 9.00% 20271 | | | 120 | | | | 134 | |
| Ascent Resources - Utica LLC 8.25% 20281 | | | 271 | | | | 271 | |
| Ascent Resources - Utica LLC, Term Loan, (3-month USD-LIBOR + 9.00%) 9.233% 20251,2,3 | | | 228 | | | | 249 | |
| Blue Racer Midstream LLC and Blue Racer Finance Corp. 6.125% 20221 | | | 1,300 | | | | 1,303 | |
| Blue Racer Midstream LLC and Blue Racer Finance Corp. 7.625% 20251 | | | 871 | | | | 930 | |
| Carrizo Oil & Gas Inc. 6.25% 2023 | | | 750 | | | | 478 | |
| Cenovus Energy Inc. 5.375% 2025 | | | 755 | | | | 852 | |
| Cenovus Energy Inc. 6.75% 2039 | | | 125 | | | | 165 | |
| Cenovus Energy Inc. 5.40% 2047 | | | 400 | | | | 470 | |
| Centennial Resource Production, LLC 6.875% 20271 | | | 465 | | | | 335 | |
| Cheniere Energy Partners, LP 5.625% 2026 | | | 1,146 | | | | 1,197 | |
| Cheniere Energy Partners, LP 4.50% 2029 | | | 583 | | | | 618 | |
| Cheniere Energy, Inc. 7.00% 2024 | | | 319 | | | | 373 | |
| Cheniere Energy, Inc. 5.875% 2025 | | | 495 | | | | 576 | |
| Cheniere Energy, Inc. 4.625% 20281 | | | 5,055 | | | | 5,314 | |
| Chesapeake Energy Corp. 4.875% 20224 | | | 4,300 | | | | 215 | |
| Chesapeake Energy Corp. 11.50% 20251,4 | | | 2,824 | | | | 498 | |
| Chesapeake Energy Corp., Term Loan, (3-month USD-LIBOR + 8.00%) 8.223% 20242,3,4 | | | 2,627 | | | | 2,154 | |
| CITGO Petroleum Corp. 7.00% 20251 | | | 500 | | | | 500 | |
| CNX Resources Corp. 7.25% 20271 | | | 935 | | | | 1,002 | |
| CNX Resources Corp. 6.00% 20291 | | | 1,345 | | | | 1,380 | |
| Comstock Resources, Inc. 9.75% 2026 | | | 1,363 | | | | 1,464 | |
| Constellation Oil Services Holding SA 10.00% 2024 (100% PIK)1,5 | | | 7,784 | | | | 2,219 | |
| Continental Resources Inc. 5.75% 20311 | | | 655 | | | | 728 | |
| Convey Park Energy LLC 7.50% 20251 | | | 417 | | | | 423 | |
| DCP Midstream LP 7.375% 2049 (3-month USD-LIBOR + 5.148% on 12/15/2022)6 | | | 270 | | | | 225 | |
| DCP Midstream Operating LP 4.95% 2022 | | | 1,072 | | | | 1,108 | |
| American Funds Insurance Series | 201 |
High-Income Bond Fund (continued)
| Bonds, notes & other debt instruments (continued) | | Principal amount
(000) | | | Value
(000) | |
| Corporate bonds, notes & loans (continued) | | | | | | | | |
| Energy (continued) | | | | | | | | |
| Diamond Offshore Drilling, Inc. 7.875% 20254 | | $ | 508 | | | $ | 65 | |
| Diamond Offshore Drilling, Inc. 4.875% 20434 | | | 1,362 | | | | 173 | |
| Endeavor Energy Resources, LP 6.625% 20251 | | | 850 | | | | 911 | |
| Energy Transfer Operating, LP 5.00% 2050 | | | 2,051 | | | | 2,223 | |
| EnLink Midstream Partners, LLC 5.625% 20281 | | | 660 | | | | 676 | |
| EnLink Midstream Partners, LP 4.15% 2025 | | | 400 | | | | 393 | |
| EQM Midstream Partners, LP 4.75% 2023 | | | 400 | | | | 421 | |
| EQM Midstream Partners, LP 4.125% 2026 | | | 127 | | | | 128 | |
| EQM Midstream Partners, LP 6.50% 20271 | | | 2,365 | | | | 2,666 | |
| EQM Midstream Partners, LP 5.50% 2028 | | | 1,231 | | | | 1,348 | |
| EQT Corp. 7.875% 2025 | | | 630 | | | | 718 | |
| EQT Corp. 3.90% 2027 | | | 125 | | | | 124 | |
| EQT Corp. 5.00% 2029 | | | 480 | | | | 507 | |
| EQT Corp. 8.75% 2030 | | | 400 | | | | 489 | |
| Extraction Oil & Gas, Inc. 5.625% 20261,4 | | | 1,575 | | | | 289 | |
| Genesis Energy, LP 5.625% 2024 | | | 150 | | | | 146 | |
| Genesis Energy, LP 6.50% 2025 | | | 2,235 | | | | 2,178 | |
| Genesis Energy, LP 8.00% 2027 | | | 1,528 | | | | 1,524 | |
| Harvest Midstream I, LP 7.50% 20281 | | | 1,325 | | | | 1,413 | |
| Hess Midstream Partners LP 5.125% 20281 | | | 687 | | | | 719 | |
| Hilcorp Energy I, LP 5.75% 20251 | | | 775 | | | | 787 | |
| Lealand Finance Company BV, Term Loan, (3-month USD-LIBOR + 3.00%) 3.146% 20242,3,7 | | | 12 | | | | 10 | |
| Lealand Finance Company BV, Term Loan, (3-month USD-LIBOR + 4.00%) 4.146% 20252,3,5 | | | 146 | | | | 100 | |
| MPLX LP 5.50% 2049 | | | 417 | | | | 549 | |
| Murphy Oil Corp. 6.875% 2024 | | | 1,000 | | | | 1,019 | |
| Nabors Industries Inc. 5.75% 2025 | | | 355 | | | | 186 | |
| New Fortress Energy Inc. 6.75% 20251 | | | 1,034 | | | | 1,097 | |
| NGL Energy Partners LP 7.50% 2023 | | | 767 | | | | 545 | |
| NGL Energy Partners LP 6.125% 2025 | | | 3,179 | | | | 2,023 | |
| Northriver Midstream Finance LP 5.625% 20261 | | | 625 | | | | 647 | |
| NuStar Logistics, LP 6.75% 20211 | | | 15 | | | | 15 | |
| NuStar Logistics, LP 6.00% 2026 | | | 686 | | | | 743 | |
| Occidental Petroleum Corp. 2.70% 2023 | | | 275 | | | | 275 | |
| Occidental Petroleum Corp. 2.90% 2024 | | | 2,093 | | | | 2,018 | |
| Occidental Petroleum Corp. 5.50% 2025 | | | 755 | | | | 789 | |
| Occidental Petroleum Corp. 5.875% 2025 | | | 710 | | | | 757 | |
| Occidental Petroleum Corp. 8.00% 2025 | | | 1,475 | | | | 1,683 | |
| Occidental Petroleum Corp. 3.40% 2026 | | | 600 | | | | 573 | |
| Occidental Petroleum Corp. 6.375% 2028 | | | 575 | | | | 609 | |
| Occidental Petroleum Corp. 3.50% 2029 | | | 210 | | | | 192 | |
| Occidental Petroleum Corp. 6.625% 2030 | | | 885 | | | | 962 | |
| Occidental Petroleum Corp. 8.875% 2030 | | | 375 | | | | 441 | |
| Occidental Petroleum Corp. 6.125% 2031 | | | 845 | | | | 906 | |
| Occidental Petroleum Corp. 4.20% 2048 | | | 165 | | | | 134 | |
| ONEOK, Inc. 5.85% 2026 | | | 273 | | | | 327 | |
| ONEOK, Inc. 4.95% 2047 | | | 23 | | | | 26 | |
| ONEOK, Inc. 5.20% 2048 | | | 282 | | | | 329 | |
| ONEOK, Inc. 7.15% 2051 | | | 83 | | | | 115 | |
| Ovintiv Inc. 6.50% 2034 | | | 550 | | | | 637 | |
| Parsley Energy, Inc. 5.25% 20251 | | | 150 | | | | 157 | |
| PBF Holding Company LLC 9.25% 20251 | | | 235 | | | | 231 | |
| PDC Energy Inc. 5.75% 2026 | | | 1,100 | | | | 1,138 | |
| Peabody Energy Corp. 6.00% 20221 | | | 1,738 | | | | 1,272 | |
| Peabody Energy Corp. 6.375% 20251 | | | 100 | | | | 55 | |
| Petrobras Global Finance Co. 5.60% 2031 | | | 250 | | | | 288 | |
| Petrobras Global Finance Co. 6.90% 2049 | | | 375 | | | | 476 | |
| Petrobras Global Finance Co. 6.75% 2050 | | | 850 | | | | 1,057 | |
| Petróleos Mexicanos 6.875% 20251 | | | 350 | | | | 384 | |
| Petróleos Mexicanos 6.49% 2027 | | | 495 | | | | 523 | |
| 202 | American Funds Insurance Series |
High-Income Bond Fund (continued)
| Bonds, notes & other debt instruments (continued) | | Principal amount
(000) | | | Value
(000) | |
| Corporate bonds, notes & loans (continued) | | | | | | | | |
| Energy (continued) | | | | | | | | |
| Petróleos Mexicanos 5.35% 2028 | | $ | 449 | | | $ | 444 | |
| Petróleos Mexicanos 6.375% 2045 | | | 210 | | | | 193 | |
| Petróleos Mexicanos 6.35% 2048 | | | 108 | | | | 98 | |
| Petróleos Mexicanos 7.69% 2050 | | | 651 | | | | 657 | |
| PowerTeam Services, LLC 9.033% 20251 | | | 560 | | | | 624 | |
| QEP Resources, Inc. 5.625% 2026 | | | 435 | | | | 478 | |
| Range Resources Corp. 4.875% 2025 | | | 472 | | | | 447 | |
| Rattler Midstream Partners LP 5.625% 20251 | | | 1,105 | | | | 1,169 | |
| Rockies Express Pipeline LLC 4.95% 20291 | | | 1,000 | | | | 1,042 | |
| Sabine Pass Liquefaction, LLC 4.50% 20301 | | | 256 | | | | 304 | |
| Sanchez Energy Corp. 7.25% 20231,4 | | | 739 | | | | 7 | |
| SM Energy Co. 5.625% 2025 | | | 247 | | | | 201 | |
| SM Energy Co. 6.625% 2027 | | | 290 | | | | 233 | |
| Southwestern Energy Co. 6.45% 20256 | | | 935 | | | | 972 | |
| Southwestern Energy Co. 7.50% 2026 | | | 1,224 | | | | 1,286 | |
| Southwestern Energy Co. 7.75% 2027 | | | 72 | | | | 78 | |
| Southwestern Energy Co. 8.375% 2028 | | | 865 | | | | 940 | |
| Sunoco LP 5.50% 2026 | | | 513 | | | | 528 | |
| Sunoco LP 6.00% 2027 | | | 147 | | | | 156 | |
| Sunoco LP 4.50% 20291 | | | 1,205 | | | | 1,255 | |
| Tallgrass Energy Partners, LP 5.50% 20241 | | | 1,000 | | | | 1,020 | |
| Tallgrass Energy Partners, LP 7.50% 20251 | | | 585 | | | | 633 | |
| Tapstone Energy, Term Loan, (3-month USD-LIBOR + 4.00%) 4.741% 20242,3,7,8 | | | 11 | | | | 6 | |
| Targa Resources Partners LP 5.875% 2026 | | | 321 | | | | 341 | |
| Targa Resources Partners LP 6.50% 2027 | | | 133 | | | | 145 | |
| Targa Resources Partners LP 6.875% 2029 | | | 332 | | | | 374 | |
| Targa Resources Partners LP 5.50% 2030 | | | 477 | | | | 518 | |
| Targa Resources Partners LP 4.875% 20311 | | | 2,000 | | | | 2,173 | |
| Teekay Corp. 9.25% 20221 | | | 3,108 | | | | 3,178 | |
| Teekay Offshore Partners LP 8.50% 20231 | | | 2,009 | | | | 1,712 | |
| Transocean Guardian Ltd. 5.875% 20241 | | | 862 | | | | 726 | |
| Transocean Inc. 6.125% 20251 | | | 1,876 | | | | 1,788 | |
| Transocean Poseidon Ltd. 6.875% 20271 | | | 655 | | | | 598 | |
| USA Compression Partners, LP 6.875% 2026 | | | 264 | | | | 276 | |
| USA Compression Partners, LP 6.875% 2027 | | | 247 | | | | 264 | |
| Vine Oil & Gas LP 8.75% 20231 | | | 1,767 | | | | 1,414 | |
| Weatherford International PLC 8.75% 20241 | | | 1,346 | | | | 1,351 | |
| Weatherford International PLC 11.00% 20241 | | | 4,211 | | | | 3,295 | |
| Western Gas Partners LP 4.50% 2028 | | | 1,368 | | | | 1,423 | |
| Western Gas Partners LP 5.45% 2044 | | | 55 | | | | 56 | |
| Western Midstream Operating, LP 4.10% 20256 | | | 369 | | | | 381 | |
| Western Midstream Operating, LP 4.75% 2028 | | | 160 | | | | 167 | |
| Western Midstream Operating, LP 5.25% 2050 | | | 500 | | | | 551 | |
| WPX Energy, Inc. 5.75% 2026 | | | 297 | | | | 313 | |
| WPX Energy, Inc. 5.25% 2027 | | | 160 | | | | 170 | |
| WPX Energy, Inc. 5.875% 2028 | | | 620 | | | | 677 | |
| WPX Energy, Inc. 4.50% 2030 | | | 759 | | | | 806 | |
| | | | | | | | 107,954 | |
| | | | | | | | | |
| Consumer discretionary 12.17% | | | | | | | | |
| 99 Escrow Issuer, Inc. 7.50% 20261 | | | 405 | | | | 403 | |
| Adient US LLC 9.00% 20251 | | | 205 | | | | 229 | |
| Affinity Gaming 6.875% 20271 | | | 1,125 | | | | 1,180 | |
| Allied Universal Holdco LLC 6.625% 20261 | | | 858 | | | | 916 | |
| Allied Universal Holdco LLC 9.75% 20271 | | | 826 | | | | 902 | |
| At Home Holding III Inc. 8.75% 20251 | | | 300 | | | | 325 | |
| Boyd Gaming Corp. 8.625% 20251 | | | 120 | | | | 134 | |
| Boyd Gaming Corp. 4.75% 2027 | | | 861 | | | | 896 | |
| Brookfield Residential Properties Inc. 4.875% 20301 | | | 325 | | | | 336 | |
| Caesars Entertainment, Inc. 6.25% 20251 | | | 1,195 | | | | 1,274 | |
| American Funds Insurance Series | 203 |
High-Income Bond Fund (continued)
| Bonds, notes & other debt instruments (continued) | | Principal amount
(000) | | | Value
(000) | |
| Corporate bonds, notes & loans (continued) | | | | | | | | |
| Consumer discretionary (continued) | | | | | | | | |
| Caesars Resort Collection, LLC 5.75% 20251 | | $ | 345 | | | $ | 366 | |
| Carnival Corp. 11.50% 20231 | | | 1,812 | | | | 2,098 | |
| Carnival Corp. 7.625% 20261 | | | 175 | | | | 191 | |
| Carnival Corp. 10.50% 20261 | | | 275 | | | | 321 | |
| Cedar Fair, LP 5.25% 2029 | | | 271 | | | | 279 | |
| Churchill Downs Inc. 4.75% 20281 | | | 430 | | | | 454 | |
| Cirsa Gaming Corp. SA 7.875% 20231 | | | 2,277 | | | | 2,300 | |
| Clarios Global LP 6.75% 20251 | | | 375 | | | | 405 | |
| Dana Inc. 5.625% 2028 | | | 675 | | | | 728 | |
| Dave & Buster’s, Inc. 7.625% 20251 | | | 375 | | | | 396 | |
| Empire Communities Corp. 7.00% 20251 | | | 525 | | | | 555 | |
| Fertitta Entertainment, Inc. 6.75% 20241 | | | 371 | | | | 369 | |
| Ford Motor Co. 8.50% 2023 | | | 1,787 | | | | 2,018 | |
| Ford Motor Co. 9.00% 2025 | | | 684 | | | | 841 | |
| Ford Motor Co. 9.625% 2030 | | | 250 | | | | 353 | |
| Ford Motor Co. 7.45% 2031 | | | 275 | | | | 353 | |
| Ford Motor Credit Co. 3.087% 2023 | | | 400 | | | | 408 | |
| Ford Motor Credit Co. 3.664% 2024 | | | 500 | | | | 514 | |
| Ford Motor Credit Co. 3.81% 2024 | | | 887 | | | | 910 | |
| Ford Motor Credit Co. 5.584% 2024 | | | 350 | | | | 378 | |
| Ford Motor Credit Co. 5.125% 2025 | | | 6,285 | | | | 6,842 | |
| Ford Motor Credit Co. 4.542% 2026 | | | 510 | | | | 545 | |
| Ford Motor Credit Co. 3.815% 2027 | | | 275 | | | | 283 | |
| Ford Motor Credit Co. 4.125% 2027 | | | 835 | | | | 876 | |
| Ford Motor Credit Co. 4.271% 2027 | | | 525 | | | | 551 | |
| Ford Motor Credit Co. 5.113% 2029 | | | 200 | | | | 223 | |
| Ford Motor Credit Co. 4.00% 2030 | | | 1,820 | | | | 1,917 | |
| Hanesbrands Inc. 4.625% 20241 | | | 445 | | | | 467 | |
| Hanesbrands Inc. 5.375% 20251 | | | 432 | | | | 458 | |
| Hanesbrands Inc. 4.875% 20261 | | | 274 | | | | 298 | |
| Hilton Worldwide Holdings Inc. 5.125% 2026 | | | 700 | | | | 724 | |
| Hilton Worldwide Holdings Inc. 4.875% 2030 | | | 508 | | | | 556 | |
| Hilton Worldwide Holdings Inc. 4.00% 20311 | | | 870 | | | | 920 | |
| International Game Technology PLC 6.25% 20221 | | | 403 | | | | 417 | |
| International Game Technology PLC 6.50% 20251 | | | 1,383 | | | | 1,550 | |
| International Game Technology PLC 5.25% 20291 | | | 1,455 | | | | 1,570 | |
| Jaguar Land Rover PLC 7.75% 20251 | | | 450 | | | | 486 | |
| Jaguar Land Rover PLC 5.875% 20281 | | | 550 | | | | 556 | |
| KB Home 6.875% 2027 | | | 330 | | | | 388 | |
| Landry’s Finance Acquisition Co., Term Loan, (3-month USD-LIBOR + 12.00%) 13.00% 20232,3,7 | | | 17 | | | | 20 | |
| Landry’s Finance Acquisition Co., Term Loan B, (3-month USD-LIBOR + 12.00%) 13.00% 20232,3 | | | —9 | | | | —9 | |
| Lennar Corp. 4.50% 2024 | | | 40 | | | | 44 | |
| Levi Strauss & Co. 5.00% 2025 | | | 452 | | | | 464 | |
| Limited Brands, Inc. 6.875% 20251 | | | 245 | | | | 266 | |
| Limited Brands, Inc. 6.625% 20301 | | | 380 | | | | 423 | |
| Limited Brands, Inc. 6.875% 2035 | | | 346 | | | | 389 | |
| Limited Brands, Inc. 6.75% 2036 | | | 495 | | | | 552 | |
| Lithia Motors, Inc. 4.375% 20311 | | | 475 | | | | 510 | |
| M.D.C. Holdings, Inc. 6.00% 2043 | | | 823 | | | | 1,105 | |
| Macy’s, Inc. 8.375% 20251 | | | 145 | | | | 161 | |
| Mattel, Inc. 6.75% 20251 | | | 904 | | | | 955 | |
| McGraw-Hill Global Education Holdings, LLC, Term Loan B, (3-month USD-LIBOR + 4.00%) 5.00% 20222,3 | | | 1,224 | | | | 1,196 | |
| Melco International Development Ltd. 5.75% 20281 | | | 2,000 | | | | 2,133 | |
| Merlin Entertainment 5.75% 20261 | | | 792 | | | | 834 | |
| MGM Growth Properties LLC 5.625% 2024 | | | 307 | | | | 334 | |
| MGM Growth Properties LLC 4.625% 20251 | | | 900 | | | | 965 | |
| MGM Growth Properties LLC 3.875% 20291 | | | 1,490 | | | | 1,526 | |
| MGM Resorts International 7.75% 2022 | | | 740 | | | | 789 | |
| 204 | American Funds Insurance Series |
High-Income Bond Fund (continued)
| Bonds, notes & other debt instruments (continued) | | Principal amount
(000) | | | Value
(000) | |
| Corporate bonds, notes & loans (continued) | | | | | | | | |
| Consumer discretionary (continued) | | | | | | | | |
| MGM Resorts International 6.00% 2023 | | $ | 541 | | | $ | 582 | |
| MGM Resorts International 5.50% 2027 | | | 541 | | | | 604 | |
| MYT Holding LLC 7.50% 20251,5 | | | 1,712 | | | | 1,725 | |
| NCL Corp. Ltd. 3.625% 20241 | | | 650 | | | | 619 | |
| NCL Corp. Ltd. 12.25% 20241 | | | 175 | | | | 210 | |
| NCL Corp. Ltd. 5.875% 20261 | | | 475 | | | | 501 | |
| Neiman Marcus Group Ltd. LLC, Term Loan, (3-month USD-LIBOR + 12.00%) 13.00% 20252,3 | | | 1,497 | | | | 1,601 | |
| Newell Rubbermaid Inc. 4.875% 2025 | | | 445 | | | | 490 | |
| Newell Rubbermaid Inc. 5.875% 20366 | | | 30 | | | | 37 | |
| Nissan Motor Co., Ltd. 4.81% 20301 | | | 425 | | | | 480 | |
| Norwegian Cruise Line Holdings Ltd. 10.25% 20261 | | | 275 | | | | 322 | |
| Panther BF Aggregator 2, LP 6.25% 20261 | | | 155 | | | | 166 | |
| Panther BF Aggregator 2, LP 8.50% 20271 | | | 990 | | | | 1,077 | |
| Party City Holdings Inc. 6.625% 20261 | | | 500 | | | | 376 | |
| PetSmart, Inc. 7.125% 20231 | | | 6,489 | | | | 6,495 | |
| PetSmart, Inc. 5.875% 20251 | | | 3,342 | | | | 3,440 | |
| PetSmart, Inc. 8.875% 20251 | | | 1,846 | | | | 1,898 | |
| PetSmart, Inc., Term Loan, (3-month USD-LIBOR + 3.00%) 4.00% 20222,3 | | | 2,555 | | | | 2,535 | |
| Royal Caribbean Cruises Ltd. 10.875% 20231 | | | 325 | | | | 370 | |
| Royal Caribbean Cruises Ltd. 11.50% 20251 | | | 775 | | | | 907 | |
| Sally Holdings LLC and Sally Capital Inc. 5.50% 2023 | | | 57 | | | | 57 | |
| Sally Holdings LLC and Sally Capital Inc. 5.625% 2025 | | | 2,825 | | | | 2,907 | |
| Sally Holdings LLC and Sally Capital Inc. 8.75% 20251 | | | 1,244 | | | | 1,386 | |
| Scientific Games Corp. 5.00% 20251 | | | 301 | | | | 311 | |
| Scientific Games Corp. 8.625% 20251 | | | 2,170 | | | | 2,379 | |
| Scientific Games Corp. 8.25% 20261 | | | 3,644 | | | | 3,933 | |
| Scientific Games Corp. 7.00% 20281 | | | 85 | | | | 92 | |
| Scientific Games Corp. 7.25% 20291 | | | 845 | | | | 929 | |
| Six Flags Entertainment Corp. 4.875% 20241 | | | 1,277 | | | | 1,283 | |
| Six Flags Theme Parks Inc. 7.00% 20251 | | | 140 | | | | 151 | |
| Sizzling Platter LLC 8.50% 20251 | | | 450 | | | | 469 | |
| Staples, Inc. 7.50% 20261 | | | 1,366 | | | | 1,429 | |
| Stars Group Holdings BV 7.00% 20261 | | | 525 | | | | 554 | |
| The Home Company Inc. 7.25% 20251 | | | 725 | | | | 746 | |
| Vail Resorts, Inc. 6.25% 20251 | | | 315 | | | | 337 | |
| VICI Properties LP 4.25% 20261 | | | 962 | | | | 999 | |
| VICI Properties LP 4.625% 20291 | | | 135 | | | | 145 | |
| VICI Properties LP / VICI Note Co. Inc. 3.50% 20251 | | | 851 | | | | 872 | |
| VICI Properties LP / VICI Note Co. Inc. 3.75% 20271 | | | 379 | | | | 388 | |
| VICI Properties LP / VICI Note Co. Inc. 4.125% 20301 | | | 1,774 | | | | 1,875 | |
| Viking Cruises Ltd. 6.25% 20251 | | | 140 | | | | 138 | |
| Viking Cruises Ltd. 13.00% 20251 | | | 430 | | | | 515 | |
| Viking Cruises Ltd. 5.875% 20271 | | | 185 | | | | 181 | |
| Wyndham Destinations, Inc. 6.625% 20261 | | | 525 | | | | 602 | |
| Wyndham Worldwide Corp. 5.375% 20261 | | | 860 | | | | 892 | |
| Wyndham Worldwide Corp. 4.375% 20281 | | | 1,380 | | | | 1,436 | |
| Wynn Las Vegas, LLC and Wynn Capital Corp. 4.25% 20231 | | | 1,171 | | | | 1,190 | |
| Wynn Las Vegas, LLC and Wynn Capital Corp. 5.25% 20271 | | | 373 | | | | 385 | |
| Wynn Macau, Ltd. 5.125% 20291 | | | 200 | | | | 205 | |
| Wynn Resorts Ltd. 7.75% 20251 | | | 820 | | | | 890 | |
| Wynn Resorts Ltd. 5.125% 20291 | | | 342 | | | | 359 | |
| | | | | | | | 105,595 | |
| | | | | | | | | |
| Materials 11.58% | | | | | | | | |
| Alcoa Netherlands Holding BV 5.50% 20271 | | | 510 | | | | 559 | |
| Anglo American Capital PLC 5.625% 20301 | | | 310 | | | | 395 | |
| Arconic Corp. 6.00% 20251 | | | 810 | | | | 866 | |
| Ardagh Group SA 6.50% 20271,5 | | | 622 | | | | 665 | |
| Ardagh Packaging Finance 5.25% 20251 | | | 495 | | | | 523 | |
| American Funds Insurance Series | 205 |
High-Income Bond Fund (continued)
| Bonds, notes & other debt instruments (continued) | | Principal amount
(000) | | | Value
(000) | |
| Corporate bonds, notes & loans (continued) | | | | | | | | |
| Materials (continued) | | | | | | | | |
| Ardagh Packaging Finance 6.00% 20251 | | $ | 533 | | | $ | 553 | |
| Ardagh Packaging Finance 5.25% 20271 | | | 425 | | | | 447 | |
| Axalta Coating Systems LLC 4.75% 20271 | | | 460 | | | | 490 | |
| Blue Cube Spinco Inc. 10.00% 2025 | | | 660 | | | | 700 | |
| BWAY Parent Co., Inc. 5.50% 20241 | | | 1,619 | | | | 1,653 | |
| CANPACK SA and Eastern PA Land Investment Holding LLC 3.125% 20251 | | | 425 | | | | 428 | |
| Carlyle Group LP 8.75% 20231,5 | | | 215 | | | | 217 | |
| Cascades Inc. 5.125% 20261 | | | 495 | | | | 524 | |
| Cascades Inc. 5.375% 20281 | | | 340 | | | | 362 | |
| Cleveland-Cliffs Inc. 4.875% 20241 | | | 2,245 | | | | 2,291 | |
| Cleveland-Cliffs Inc. 5.75% 2025 | | | 2,739 | | | | 2,785 | |
| Cleveland-Cliffs Inc. 9.875% 20251 | | | 309 | | | | 364 | |
| Cleveland-Cliffs Inc. 6.75% 20261 | | | 1,167 | | | | 1,262 | |
| Cleveland-Cliffs Inc. 5.875% 2027 | | | 4,675 | | | | 4,773 | |
| Cleveland-Cliffs Inc. 7.00% 20271 | | | 297 | | | | 288 | |
| Consolidated Energy Finance SA 6.50% 20261 | | | 1,250 | | | | 1,253 | |
| CVR Partners, LP 9.25% 20231 | | | 2,248 | | | | 2,253 | |
| Element Solutions Inc. 3.875% 20281 | | | 620 | | | | 639 | |
| First Quantum Minerals Ltd. 7.25% 20231 | | | 2,073 | | | | 2,140 | |
| First Quantum Minerals Ltd. 6.50% 20241 | | | 411 | | | | 423 | |
| First Quantum Minerals Ltd. 7.50% 20251 | | | 7,943 | | | | 8,281 | |
| First Quantum Minerals Ltd. 6.875% 20261 | | | 3,076 | | | | 3,213 | |
| First Quantum Minerals Ltd. 6.875% 20271 | | | 5,790 | | | | 6,289 | |
| Freeport-McMoRan Inc. 3.875% 2023 | | | 189 | | | | 198 | |
| Freeport-McMoRan Inc. 4.25% 2030 | | | 925 | | | | 998 | |
| Freeport-McMoRan Inc. 5.40% 2034 | | | 300 | | | | 376 | |
| FXI Holdings, Inc. 7.875% 20241 | | | 3,425 | | | | 3,459 | |
| FXI Holdings, Inc. 12.25% 20261 | | | 4,575 | | | | 5,223 | |
| GPC Merger Sub Inc. 7.125% 20281 | | | 434 | | | | 480 | |
| GrafTech Finance Inc. 4.625% 20281 | | | 425 | | | | 431 | |
| Hexion Inc. 7.875% 20271 | | | 2,304 | | | | 2,470 | |
| INEOS Group Holdings SA 5.625% 20241 | | | 772 | | | | 785 | |
| Joseph T. Ryerson & Son, Inc. 8.50% 20281 | | | 1,260 | | | | 1,429 | |
| LSB Industries, Inc. 9.625% 20231 | | | 3,363 | | | | 3,476 | |
| LYB International Finance III, LLC 3.80% 2060 | | | 213 | | | | 230 | |
| Methanex Corp. 5.125% 2027 | | | 4,075 | | | | 4,434 | |
| Methanex Corp. 5.25% 2029 | | | 450 | | | | 489 | |
| Methanex Corp. 5.65% 2044 | | | 475 | | | | 510 | |
| Neon Holdings, Inc. 10.125% 20261 | | | 2,500 | | | | 2,744 | |
| Newcrest Finance Pty Ltd. 4.20% 20501 | | | 550 | | | | 674 | |
| Nouryon Holding BV 8.00% 20261 | | | 931 | | | | 991 | |
| Nova Chemicals Corp. 4.875% 20241 | | | 495 | | | | 516 | |
| Nova Chemicals Corp. 5.25% 20271 | | | 1,036 | | | | 1,105 | |
| Novelis Corp. 5.875% 20261 | | | 950 | | | | 994 | |
| Novelis Corp. 4.75% 20301 | | | 990 | | | | 1,068 | |
| OCI NV 5.25% 20241 | | | 278 | | | | 289 | |
| Olin Corp. 9.50% 20251 | | | 490 | | | | 613 | |
| Olin Corp. 5.00% 2030 | | | 280 | | | | 299 | |
| Owens-Illinois, Inc. 5.875% 20231 | | | 1,670 | | | | 1,792 | |
| Owens-Illinois, Inc. 6.375% 20251 | | | 265 | | | | 294 | |
| Plastipak Holdings, Inc. 6.25% 20251 | | | 200 | | | | 206 | |
| Rayonier A.M. Products Inc. 7.625% 20261 | | | 745 | | | | 778 | |
| Scotts Miracle-Gro Co. 4.50% 2029 | | | 639 | | | | 691 | |
| Sealed Air Corp. 4.875% 20221 | | | 660 | | | | 693 | |
| Sealed Air Corp. 5.25% 20231 | | | 267 | | | | 285 | |
| Sealed Air Corp. 4.00% 20271 | | | 316 | | | | 338 | |
| Silgan Holdings Inc. 4.125% 2028 | | | 377 | | | | 393 | |
| Summit Materials, Inc. 6.50% 20271 | | | 360 | | | | 384 | |
| Summit Materials, Inc. 5.25% 20291 | | | 1,275 | | | | 1,340 | |
| Trivium Packaging BV 5.50% 20261 | | | 530 | | | | 561 | |
| Trivium Packaging BV 8.50% 20271 | | | 403 | | | | 442 | |
| 206 | American Funds Insurance Series |
High-Income Bond Fund (continued)
| Bonds, notes & other debt instruments (continued) | | Principal amount
(000) | | | Value
(000) | |
| Corporate bonds, notes & loans (continued) | | | | | | | | |
| Materials (continued) | | | | | | | | |
| Tronox Ltd. 5.75% 20251 | | $ | 700 | | | $ | 728 | |
| Tronox Ltd. 6.50% 20261 | | | 775 | | | | 808 | |
| Valvoline Inc. 4.375% 2025 | | | 555 | | | | 573 | |
| Valvoline Inc. 4.25% 20301 | | | 353 | | | | 375 | |
| Valvoline Inc. 3.625% 20311 | | | 620 | | | | 638 | |
| Venator Materials Corp. 5.75% 20251 | | | 5,956 | | | | 5,580 | |
| Venator Materials Corp. 9.50% 20251 | | | 2,175 | | | | 2,382 | |
| W. R. Grace & Co. 4.875% 20271 | | | 790 | | | | 839 | |
| Warrior Met Coal, Inc. 8.00% 20241 | | | 1,400 | | | | 1,433 | |
| | | | | | | | 100,470 | |
| | | | | | | | | |
| Health care 11.31% | | | | | | | | |
| Auris Luxembourg III SARL, Term Loan, (3-month USD-LIBOR + 3.75%) 3.897% 20262,3 | | | 845 | | | | 817 | |
| Avantor Funding, Inc. 4.625% 20281 | | | 1,510 | | | | 1,599 | |
| Bausch Health Companies Inc. 9.25% 20261 | | | 2,644 | | | | 2,952 | |
| Bausch Health Companies Inc. 5.00% 20281 | | | 587 | | | | 606 | |
| Bausch Health Companies Inc. 7.00% 20281 | | | 1,153 | | | | 1,269 | |
| Bausch Health Companies Inc. 5.00% 20291 | | | 891 | | | | 918 | |
| Bausch Health Companies Inc. 6.25% 20291 | | | 815 | | | | 886 | |
| Bausch Health Companies Inc. 5.25% 20301 | | | 852 | | | | 893 | |
| Bausch Health Companies Inc. 5.25% 20311 | | | 3,055 | | | | 3,197 | |
| Catalent Pharma Solutions Inc. 5.00% 20271 | | | 53 | | | | 56 | |
| Centene Corp. 4.75% 2025 | | | 1,000 | | | | 1,027 | |
| Centene Corp. 5.375% 20261 | | | 850 | | | | 898 | |
| Centene Corp. 5.375% 20261 | | | 330 | | | | 349 | |
| Centene Corp. 4.25% 2027 | | | 634 | | | | 674 | |
| Centene Corp. 4.625% 2029 | | | 2,505 | | | | 2,784 | |
| Centene Corp. 3.00% 2030 | | | 2,805 | | | | 2,977 | |
| Centene Corp. 3.375% 2030 | | | 132 | | | | 139 | |
| Charles River Laboratories International, Inc. 5.50% 20261 | | | 584 | | | | 613 | |
| Charles River Laboratories International, Inc. 4.25% 20281 | | | 241 | | | | 253 | |
| Community Health Systems Inc. 5.625% 20271 | | | 730 | | | | 786 | |
| Community Health Systems Inc. 6.00% 20291 | | | 653 | | | | 706 | |
| Concordia International Corp. 8.00% 2024 | | | 34 | | | | 35 | |
| Concordia International Corp., Term Loan, (3-month USD-LIBOR + 5.50%) 6.50% 20242,3 | | | 59 | | | | 58 | |
| Encompass Health Corp. 4.50% 2028 | | | 496 | | | | 519 | |
| Encompass Health Corp. 4.75% 2030 | | | 635 | | | | 681 | |
| Endo Dac / Endo Finance LLC / Endo Finco 9.50% 20271 | | | 1,644 | | | | 1,838 | |
| Endo Dac / Endo Finance LLC / Endo Finco 6.00% 20281 | | | 1,185 | | | | 1,008 | |
| Endo International PLC 5.75% 20221 | | | 2,937 | | | | 2,853 | |
| Endo International PLC 5.875% 20241 | | | 1,300 | | | | 1,320 | |
| HCA Inc. 5.875% 2023 | | | 604 | | | | 665 | |
| HCA Inc. 5.375% 2025 | | | 175 | | | | 197 | |
| HCA Inc. 5.875% 2026 | | | 321 | | | | 370 | |
| HCA Inc. 4.50% 2027 | | | 173 | | | | 201 | |
| HCA Inc. 5.625% 2028 | | | 1,315 | | | | 1,556 | |
| HCA Inc. 3.50% 2030 | | | 1,325 | | | | 1,408 | |
| HCA Inc. 5.50% 2047 | | | 128 | | | | 171 | |
| HCA Inc. 5.25% 2049 | | | 475 | | | | 627 | |
| HealthSouth Corp. 5.75% 2025 | | | 942 | | | | 975 | |
| IMS Health Holdings, Inc. 5.00% 20261 | | | 823 | | | | 864 | |
| Jaguar Holding Co. II 4.625% 20251 | | | 350 | | | | 370 | |
| Jaguar Holding Co. II 5.00% 20281 | | | 375 | | | | 401 | |
| Mallinckrodt International Finance SA 5.50% 20251,4 | | | 1,118 | | | | 391 | |
| Mallinckrodt PLC 5.75% 20221 | | | 420 | | | | 147 | |
| Mallinckrodt PLC 10.00% 20251 | | | 4,358 | | | | 4,739 | |
| Molina Healthcare, Inc. 5.375% 2022 | | | 4,589 | | | | 4,867 | |
| Molina Healthcare, Inc. 4.375% 20281 | | | 920 | | | | 969 | |
| Molina Healthcare, Inc. 3.875% 20301 | | | 1,420 | | | | 1,527 | |
| Owens & Minor, Inc. 4.375% 2024 | | | 1,440 | | | | 1,481 | |
| American Funds Insurance Series | 207 |
High-Income Bond Fund (continued)
| Bonds, notes & other debt instruments (continued) | | Principal amount
(000) | | | Value
(000) | |
| Corporate bonds, notes & loans (continued) | | | | | | | | |
| Health care (continued) | | | | | | | | |
| Owens & Minor, Inc., Term Loan B, (3-month USD-LIBOR + 4.50%) 4.655% 20252,3 | | $ | 1,460 | | | $ | 1,458 | |
| Par Pharmaceutical Inc. 7.50% 20271 | | | 4,612 | | | | 5,010 | |
| PAREXEL International Corp. 6.375% 20251 | | | 685 | | | | 703 | |
| Prime Healthcare Services, Inc. 7.25% 20251 | | | 600 | | | | 639 | |
| Radiology Partners, Inc. 9.25% 20281 | | | 1,293 | | | | 1,458 | |
| Radiology Partners, Inc., Term Loan, (3-month USD-LIBOR + 4.25%) 4.476% 20252,3 | | | 575 | | | | 567 | |
| Rotech Healthcare Inc., Term Loan, (3-month USD-LIBOR + 11.00%) 13.00% 2023 (100% PIK)2,3,5,7,8 | | | 3,850 | | | | 3,850 | |
| RP Escrow Issuer, LLC 5.25% 20251 | | | 655 | | | | 686 | |
| Select Medical Holdings Corp. 6.25% 20261 | | | 554 | | | | 597 | |
| Sotera Health Holdings LLC, Term Loan, (3-months USD-LIBOR + 4.50%) 5.50% 20262,3 | | | 570 | | | | 573 | |
| Surgery Center Holdings 10.00% 20271 | | | 416 | | | | 460 | |
| Syneos Health, Inc. 3.625% 20291 | | | 630 | | | | 633 | |
| Team Health Holdings, Inc. 6.375% 20251 | | | 3,171 | | | | 2,743 | |
| Team Health Holdings, Inc., Term Loan B, 3.75% 20242,3 | | | 917 | | | | 826 | |
| Tenet Healthcare Corp. 4.625% 2024 | | | 559 | | | | 574 | |
| Tenet Healthcare Corp. 4.875% 20261 | | | 6,080 | | | | 6,368 | |
| Tenet Healthcare Corp. 5.125% 20271 | | | 710 | | | | 753 | |
| Tenet Healthcare Corp. 6.125% 20281 | | | 275 | | | | 288 | |
| Teva Pharmaceutical Finance Co. BV 2.20% 2021 | | | 75 | | | | 75 | |
| Teva Pharmaceutical Finance Co. BV 2.80% 2023 | | | 1,908 | | | | 1,892 | |
| Teva Pharmaceutical Finance Co. BV 6.00% 2024 | | | 4,779 | | | | 5,077 | |
| Teva Pharmaceutical Finance Co. BV 7.125% 2025 | | | 1,309 | | | | 1,449 | |
| Teva Pharmaceutical Finance Co. BV 3.15% 2026 | | | 1,684 | | | | 1,622 | |
| Teva Pharmaceutical Finance Co. BV 6.75% 2028 | | | 1,188 | | | | 1,346 | |
| Teva Pharmaceutical Finance Co. BV 4.10% 2046 | | | 525 | | | | 469 | |
| U.S. Renal Care, Inc. 10.625% 20271 | | | 359 | | | | 398 | |
| Valeant Pharmaceuticals International, Inc. 6.125% 20251 | | | 1,584 | | | | 1,634 | |
| Valeant Pharmaceuticals International, Inc. 9.00% 20251 | | | 581 | | | | 644 | |
| Valeant Pharmaceuticals International, Inc. 8.50% 20271 | | | 608 | | | | 677 | |
| | | | | | | | 98,106 | |
| | | | | | | | | |
| Industrials 9.51% | | | | | | | | |
| ADT Corp. 3.50% 2022 | | | 1,221 | | | | 1,255 | |
| Aircastle Ltd. 5.25% 20251 | | | 650 | | | | 716 | |
| Alaska Air Group, Inc. 4.80% 20271 | | | 575 | | | | 635 | |
| Allison Transmission Holdings, Inc. 3.75% 20311 | | | 1,950 | | | | 1,999 | |
| ASGN Inc. 4.625% 20281 | | | 330 | | | | 344 | |
| Ashtead Group PLC 4.25% 20291 | | | 488 | | | | 536 | |
| Associated Materials, LLC 9.00% 20251 | | | 2,156 | | | | 2,291 | |
| ATS Automation Tooling Systems Inc. 4.125% 20281 | | | 275 | | | | 281 | |
| Aviation Capital Group LLC 5.50% 20241 | | | 500 | | | | 554 | |
| Avis Budget Car Rental, LLC 5.75% 20271 | | | 1,375 | | | | 1,407 | |
| Avis Budget Group, Inc. 6.375% 20241 | | | 1,710 | | | | 1,747 | |
| Avis Budget Group, Inc. 5.25% 20251 | | | 437 | | | | 440 | |
| Avis Budget Group, Inc. 10.50% 20251 | | | 800 | | | | 946 | |
| Avolon Holdings Funding Ltd. 5.25% 20241 | | | 660 | | | | 718 | |
| Avolon Holdings Funding Ltd. 4.25% 20261 | | | 218 | | | | 235 | |
| Boeing Company 3.625% 2031 | | | 1,400 | | | | 1,536 | |
| Boeing Company 3.50% 2039 | | | 70 | | | | 71 | |
| Boeing Company 3.75% 2050 | | | 400 | | | | 421 | |
| Boeing Company 5.93% 2060 | | | 700 | | | | 993 | |
| Bohai Financial Investment Holding Co., Ltd. 5.25% 20221 | | | 1,600 | | | | 1,680 | |
| Bohai Financial Investment Holding Co., Ltd. 4.50% 20231 | | | 1,072 | | | | 1,124 | |
| Bohai Financial Investment Holding Co., Ltd. 5.125% 20231 | | | 660 | | | | 707 | |
| Bohai Financial Investment Holding Co., Ltd. 5.50% 20241 | | | 600 | | | | 655 | |
| Bombardier Inc. 8.75% 20211 | | | 445 | | | | 464 | |
| Bombardier Inc. 5.75% 20221 | | | 255 | | | | 260 | |
| Bombardier Inc. 6.125% 20231 | | | 338 | | | | 331 | |
| Bombardier Inc. 7.50% 20241 | | | 140 | | | | 135 | |
| 208 | American Funds Insurance Series |
High-Income Bond Fund (continued)
| Bonds, notes & other debt instruments (continued) | | Principal amount
(000) | | | Value
(000) | |
| Corporate bonds, notes & loans (continued) | | | | | | | | |
| Industrials (continued) | | | | | | | | |
| Bombardier Inc. 7.50% 20251 | | $ | 1,191 | | | $ | 1,106 | |
| Bombardier Inc. 7.875% 20271 | | | 1,598 | | | | 1,472 | |
| British Airways, Series 2020-1, Class B, 8.375% 20281 | | | 185 | | | | 205 | |
| British Airways, Series 2020-1, Class A, 4.25% 20321 | | | 370 | | | | 397 | |
| BWX Technologies, Inc. 4.125% 20281 | | | 615 | | | | 642 | |
| Clean Harbors, Inc. 4.875% 20271 | | | 766 | | | | 800 | |
| Covanta Holding Corp. 5.875% 2025 | | | 858 | | | | 895 | |
| Covanta Holding Corp. 5.00% 2030 | | | 1,000 | | | | 1,071 | |
| CP Atlas Buyer, Inc. 7.00% 20281 | | | 450 | | | | 468 | |
| Dun & Bradstreet Corp. 6.875% 20261 | | | 203 | | | | 219 | |
| Dun & Bradstreet Corp. 10.25% 20271 | | | 2,098 | | | | 2,370 | |
| F-Brasile SpA 7.375% 20261 | | | 1,338 | | | | 1,301 | |
| Fortress Transportation and Infrastructure Investors LLC 6.50% 20251 | | | 480 | | | | 503 | |
| Fortress Transportation and Infrastructure Investors LLC 9.75% 20271 | | | 445 | | | | 511 | |
| Harsco Corp. 5.75% 20271 | | | 650 | | | | 689 | |
| Howmet Aerospace Inc. 6.875% 2025 | | | 1,662 | | | | 1,963 | |
| Icahn Enterprises Finance Corp. 4.75% 2024 | | | 1,080 | | | | 1,124 | |
| JELD-WEN Holding, Inc. 4.875% 20271 | | | 1,033 | | | | 1,095 | |
| JetBlue Airways Corp., Pass Through Trust Certificates, Series 2019-1, Class B, 8.00% 2027 | | | 158 | | | | 171 | |
| JetBlue Airways Corp., Pass Through Trust Certificates, Series 2020-1, Class A, 7.75% 2028 | | | 350 | | | | 382 | |
| Kratos Defense & Security Solutions, Inc. 6.50% 20251 | | | 1,710 | | | | 1,785 | |
| LABL Escrow Issuer, LLC 10.50% 20271 | | | 690 | | | | 778 | |
| LBM Acquisition LLC 6.25% 20291 | | | 400 | | | | 417 | |
| LSC Communications, Inc. 8.75% 20231,4,7,8 | | | 8,744 | | | | 482 | |
| LSC Communications, Inc., Term Loan B, (3-month USD-LIBOR + 5.50%) 6.25% 20222,3,4,7,8 | | | 195 | | | | 16 | |
| MasTec, Inc. 4.50% 20281 | | | 1,250 | | | | 1,314 | |
| Meritor, Inc. 4.50% 20281 | | | 325 | | | | 334 | |
| Moog Inc. 4.25% 20271 | | | 125 | | | | 130 | |
| Nielsen Finance LLC and Nielsen Finance Co. 5.00% 20251 | | | 750 | | | | 771 | |
| Nielsen Finance LLC and Nielsen Finance Co. 5.625% 20281 | | | 250 | | | | 272 | |
| Nielsen Finance LLC and Nielsen Finance Co. 5.875% 20301 | | | 1,400 | | | | 1,586 | |
| Prime Security Services Borrower, LLC 3.375% 20271 | | | 925 | | | | 919 | |
| Prime Security Services Borrower, LLC 6.25% 20281 | | | 627 | | | | 674 | |
| R.R. Donnelley & Sons Co. 6.50% 2023 | | | 1,100 | | | | 1,137 | |
| R.R. Donnelley & Sons Co., Term Loan B, (3-month USD-LIBOR + 5.00%) 5.254% 20242,3 | | | 1,323 | | | | 1,290 | |
| Rexnord Corp. 4.875% 20251 | | | 848 | | | | 867 | |
| Rolls-Royce PLC 4.625% 2026 | | € | 300 | | | | 398 | |
| Rolls-Royce PLC 5.75% 20271 | | $ | 1,060 | | | | 1,175 | |
| Rolls-Royce PLC 5.75% 2027 | | £ | 275 | | | | 417 | |
| Sensata Technologies, Inc. 3.75% 20311 | | $ | 500 | | | | 519 | |
| Signature Aviation PLC 4.00% 20281 | | | 185 | | | | 187 | |
| SkyMiles IP Ltd. 4.50% 20251 | | | 275 | | | | 294 | |
| SkyMiles IP Ltd. 4.75% 20281 | | | 2,285 | | | | 2,496 | |
| SkyMiles IP Ltd., Term Loan, (3-month USD-LIBOR + 3.75%) 4.75% 20272,3 | | | 525 | | | | 545 | |
| Specialty Building Products Holdings LLC 6.375% 20261 | | | 450 | | | | 477 | |
| Spirit AeroSystems, Inc. (3-month USD-LIBOR + 0.80%) 1.017% 20213 | | | 120 | | | | 118 | |
| Stericycle, Inc. 5.375% 20241 | | | 1,135 | | | | 1,186 | |
| Stericycle, Inc. 3.875% 20291 | | | 500 | | | | 514 | |
| The Brink’s Co. 4.625% 20271 | | | 719 | | | | 753 | |
| TransDigm Inc. 6.50% 2024 | | | 529 | | | | 539 | |
| TransDigm Inc. 8.00% 20251 | | | 658 | | | | 729 | |
| TransDigm Inc. 6.25% 20261 | | | 513 | | | | 547 | |
| TransDigm Inc. 5.50% 2027 | | | 855 | | | | 900 | |
| Triumph Group, Inc. 5.25% 2022 | | | 240 | | | | 229 | |
| Triumph Group, Inc. 6.25% 20241 | | | 310 | | | | 308 | |
| Triumph Group, Inc. 8.875% 20241 | | | 445 | | | | 489 | |
| Triumph Group, Inc. 7.75% 20251 | | | 270 | | | | 248 | |
| Uber Technologies, Inc. 8.00% 20261 | | | 498 | | | | 543 | |
| American Funds Insurance Series | 209 |
High-Income Bond Fund (continued)
| Bonds, notes & other debt instruments (continued) | | Principal amount
(000) | | | Value
(000) | |
| Corporate bonds, notes & loans (continued) | | | | | | | | |
| Industrials (continued) | | | | | | | | |
| United Airlines Holdings, Inc. 6.50% 20271 | | $ | 4,625 | | | $ | 4,981 | |
| United Parcel Service, Inc. 3.125% 2021 | | | 200 | | | | 200 | |
| United Rentals, Inc. 5.875% 2026 | | | 53 | | | | 56 | |
| United Rentals, Inc. 3.875% 2031 | | | 650 | | | | 683 | |
| Vertical Holdco GMBH 7.625% 20281 | | | 975 | | | | 1,065 | |
| Vertical U.S. Newco Inc. 5.25% 20271 | | | 2,375 | | | | 2,522 | |
| Virgin Australia Holdings Ltd. 7.875% 20211,4 | | | 800 | | | | 66 | |
| Wesco Aircraft Holdings, Inc. 8.50% 20241 | | | 233 | | | | 223 | |
| Wesco Aircraft Holdings, Inc. 9.00% 20261 | | | 939 | | | | 891 | |
| WESCO Distribution, Inc. 7.125% 20251 | | | 1,865 | | | | 2,054 | |
| WESCO Distribution, Inc. 7.25% 20281 | | | 1,770 | | | | 2,016 | |
| Western Global Airlines LLC 10.375% 20251 | | | 385 | | | | 430 | |
| XPO Logistics, Inc. 6.75% 20241 | | | 198 | | | | 211 | |
| XPO Logistics, Inc. 6.25% 20251 | | | 800 | | | | 862 | |
| | | | | | | | 82,508 | |
| | | | | | | | | |
| Financials 6.63% | | | | | | | | |
| Advisor Group Holdings, LLC 6.25% 20281 | | | 1,551 | | | | 1,572 | |
| AG Merger Sub II, Inc. 10.75% 20271 | | | 1,862 | | | | 2,063 | |
| Alliant Holdings Intermediate, LLC 6.75% 20271 | | | 1,036 | | | | 1,110 | |
| Ally Financial Inc. 8.00% 2031 | | | 403 | | | | 592 | |
| Ally Financial Inc. 8.00% 2031 | | | 63 | | | | 90 | |
| American International Group, Inc. 4.375% 2050 | | | 245 | | | | 321 | |
| AssuredPartners, Inc. 7.00% 20251 | | | 373 | | | | 388 | |
| AssuredPartners, Inc. 8.00% 20271 | | | 603 | | | | 656 | |
| AssuredPartners, Inc. 5.625% 20291 | | | 365 | | | | 381 | |
| CIT Group Inc. 4.125% 2021 | | | 950 | | | | 953 | |
| Compass Diversified Holdings 8.00% 20261 | | | 3,214 | | | | 3,386 | |
| Credit Acceptance Corp. 5.125% 20241 | | | 765 | | | | 798 | |
| Fairstone Financial Inc. 7.875% 20241 | | | 1,258 | | | | 1,337 | |
| Ford Motor Credit Co. 3.375% 2025 | | | 1,875 | | | | 1,923 | |
| Freedom Mortgage Corp. 7.625% 20261 | | | 625 | | | | 662 | |
| FS Energy and Power Fund 7.50% 20231 | | | 3,999 | | | | 3,850 | |
| HUB International Ltd. 7.00% 20261 | | | 1,950 | | | | 2,041 | |
| Icahn Enterprises Finance Corp. 6.25% 2022 | | | 2,334 | | | | 2,345 | |
| Icahn Enterprises Finance Corp. 5.25% 2027 | | | 377 | | | | 405 | |
| Iris Merger Sub 2019 Inc. 9.375% 20281 | | | 349 | | | | 383 | |
| Ladder Capital Corp. 5.25% 20221 | | | 150 | | | | 151 | |
| Ladder Capital Corp. 4.25% 20271 | | | 1,239 | | | | 1,220 | |
| LD Holdings Group LLC 6.50% 20251 | | | 625 | | | | 659 | |
| LPL Financial Holdings Inc. 4.625% 20271 | | | 1,209 | | | | 1,255 | |
| MGIC Investment Corp. 5.25% 2028 | | | 525 | | | | 563 | |
| MSCI Inc. 5.375% 20271 | | | 320 | | | | 342 | |
| MSCI Inc. 3.625% 20301 | | | 66 | | | | 69 | |
| MSCI Inc. 3.875% 20311 | | | 2,150 | | | | 2,276 | |
| National Financial Partners Corp. 6.875% 20281 | | | 1,094 | | | | 1,169 | |
| Nationstar Mortgage Holdings Inc. 5.50% 20281 | | | 425 | | | | 448 | |
| Nationstar Mortgage Holdings Inc. 5.125% 20301 | | | 650 | | | | 680 | |
| Navient Corp. 6.50% 2022 | | | 3,533 | | | | 3,748 | |
| Navient Corp. 5.50% 2023 | | | 3,086 | | | | 3,235 | |
| Navient Corp. 5.875% 2024 | | | 1,020 | | | | 1,086 | |
| Navient Corp. 6.125% 2024 | | | 417 | | | | 447 | |
| Navient Corp. 5.00% 2027 | | | 2,483 | | | | 2,508 | |
| Navient Corp. 5.625% 2033 | | | 978 | | | | 941 | |
| New Residential Investment Corp. 6.25% 20251 | | | 275 | | | | 277 | |
| NMI Holdings, Inc. 7.375% 20251 | | | 290 | | | | 325 | |
| OneMain Holdings, Inc. 7.125% 2026 | | | 685 | | | | 811 | |
| Owl Rock Capital Corp. 4.625% 20241 | | | 750 | | | | 769 | |
| Owl Rock Capital Corp. 3.75% 2025 | | | 900 | | | | 935 | |
| Owl Rock Capital Corp. 3.375% 2026 | | | 390 | | | | 396 | |
| 210 | American Funds Insurance Series |
High-Income Bond Fund (continued)
| Bonds, notes & other debt instruments (continued) | | Principal amount
(000) | | | Value
(000) | |
| Corporate bonds, notes & loans (continued) | | | | | | | | |
| Financials (continued) | | | | | | | | |
| PennyMac Financial Services, Inc. 5.375% 20251 | | $ | 525 | | | $ | 556 | |
| Quicken Loans, LLC 3.625% 20291 | | | 455 | | | | 465 | |
| Springleaf Finance Corp. 6.125% 2024 | | | 1,517 | | | | 1,659 | |
| Springleaf Finance Corp. 6.625% 2028 | | | 190 | | | | 226 | |
| Springleaf Finance Corp. 5.375% 2029 | | | 183 | | | | 206 | |
| Starwood Property Trust, Inc. 5.00% 2021 | | | 2,371 | | | | 2,417 | |
| Starwood Property Trust, Inc. 5.50% 20231 | | | 465 | | | | 487 | |
| Travelport Finance Luxembourg SARL, Term Loan, (3-month USD-LIBOR + 8.00%) 1.06% 2025 (72.22% PIK)2,3,5 | | | 895 | | | | 886 | |
| Travelport Finance Luxembourg SARL, Term Loan, (3-month USD-LIBOR + 5.00%) 5.254% 20262,3 | | | 1,483 | | | | 1,028 | |
| | | | | | | | 57,496 | |
| | | | | | | | | |
| Information technology 3.94% | | | | | | | | |
| Almonde Inc., Term Loan, (3-month USD-LIBOR + 7.25%) 8.25% 20252,3 | | | 3,324 | | | | 3,342 | |
| Applied Systems, Inc., Term Loan, (3-month USD-LIBOR + 7.00%) 8.00% 20252,3 | | | 822 | | | | 829 | |
| Austin BidCo Inc. 7.125% 20281 | | | 940 | | | | 983 | |
| Austin BidCo Inc., Term Loan B, (3-month USD-LIBOR + 4.50%) 4.732% 20272,3 | | | 125 | | | | 125 | |
| Avaya Inc. 6.125% 20281 | | | 490 | | | | 524 | |
| Banff Merger Sub Inc. 9.75% 20261 | | | 723 | | | | 782 | |
| Black Knight Inc. 3.625% 20281 | | | 815 | | | | 835 | |
| BMC Software, Inc. 7.125% 20251 | | | 225 | | | | 245 | |
| BMC Software, Inc. 9.125% 20261 | | | 240 | | | | 259 | |
| BMC Software, Inc., Term Loan, (3-month USD-LIBOR + 4.25%) 4.504% 20252,3 | | | 372 | | | | 371 | |
| CommScope Finance LLC 6.00% 20261 | | | 833 | | | | 879 | |
| Diebold Nixdorf AG, Term Loan B, (3-month USD-LIBOR + 2.75%) 3.004% 20232,3 | | | 647 | | | | 632 | |
| Diebold Nixdorf, Inc. 9.375% 20251 | | | 4,850 | | | | 5,441 | |
| Diebold, Inc. 8.50% 2024 | | | 1,534 | | | | 1,555 | |
| Gartner, Inc. 4.50% 20281 | | | 1,475 | | | | 1,558 | |
| Internet Brands, Inc., Term Loan, (3-month USD-LIBOR + 7.50%) 7.647% 20252,3 | | | 448 | | | | 450 | |
| Logan Merger Sub, Inc. 5.50% 20271 | | | 725 | | | | 760 | |
| McAfee, LLC, Term Loan, (3-month USD-LIBOR + 3.75%) 4.004% 20242,3 | | | 1,035 | | | | 1,036 | |
| MoneyGram International Inc., Term Loan B, (3-month USD-LIBOR + 6.00%) 7.00% 20232,3 | | | 1,216 | | | | 1,223 | |
| Sabre GLBL Inc. 7.375% 20251 | | | 600 | | | | 652 | |
| Sabre Holdings Corp. 5.25% 20231 | | | 83 | | | | 84 | |
| Sabre Holdings Corp. 9.25% 20251 | | | 546 | | | | 651 | |
| Solera Holdings, Inc. 10.50% 20241 | | | 726 | | | | 753 | |
| Ultimate Software Group Inc., Term Loan, (3-month USD-LIBOR + 6.75%) 7.50% 20272,3 | | | 1,325 | | | | 1,366 | |
| Unisys Corp. 6.875% 20271 | | | 1,725 | | | | 1,889 | |
| VeriSign, Inc. 4.625% 2023 | | | 429 | | | | 434 | |
| VeriSign, Inc. 5.25% 2025 | | | 132 | | | | 150 | |
| Veritas Holdings Ltd. 7.50% 20231 | | | 852 | | | | 856 | |
| Veritas Holdings Ltd. 10.50% 20241 | | | 625 | | | | 638 | |
| Veritas Holdings Ltd. 7.50% 20251 | | | 2,140 | | | | 2,199 | |
| ViaSat, Inc. 5.625% 20271 | | | 175 | | | | 184 | |
| Xerox Corp. 4.125% 2023 | | | 314 | | | | 330 | |
| Xerox Corp. 5.50% 20281 | | | 2,035 | | | | 2,163 | |
| | | | | | | | 34,178 | |
| | | | | | | | | |
| Utilities 2.98% | | | | | | | | |
| AES Corp. 3.95% 20301 | | | 675 | | | | 764 | |
| AES Panama Generation Holdings SRL 4.375% 20301 | | | 200 | | | | 217 | |
| AmeriGas Partners, LP 5.75% 2027 | | | 297 | | | | 339 | |
| Calpine Corp. 5.25% 20261 | | | 96 | | | | 99 | |
| Calpine Corp. 4.50% 20281 | | | 500 | | | | 521 | |
| Calpine Corp. 5.125% 20281 | | | 518 | | | | 546 | |
| Calpine Corp. 5.00% 20311 | | | 1,000 | | | | 1,046 | |
| DPL Inc. 4.125% 20251 | | | 765 | | | | 827 | |
| DPL Inc. 4.35% 2029 | | | 575 | | | | 646 | |
| American Funds Insurance Series | 211 |
High-Income Bond Fund (continued)
| Bonds, notes & other debt instruments (continued) | | Principal amount
(000) | | | Value
(000) | |
| Corporate bonds, notes & loans (continued) | | | | | | | | |
| Utilities (continued) | | | | | | | | |
| Emera Inc. 6.75% 2076 (3-month USD-LIBOR + 5.44% on 6/15/2026)6 | | $ | 1,155 | | | $ | 1,352 | |
| Enel Società per Azioni 8.75% 2073 (USD Semi Annual 30/360 (vs. 3-month USD-LIBOR) + 5.88% on 9/24/2023)1,6 | | | 1,050 | | | | 1,229 | |
| FEL Energy VI SARL 5.75% 20401 | | | 550 | | | | 586 | |
| FirstEnergy Corp. 7.375% 2031 | | | 364 | | | | 519 | |
| FirstEnergy Corp. 4.85% 2047 (5.10% on 1/15/2021)6 | | | 550 | | | | 685 | |
| FirstEnergy Corp. 3.40% 2050 | | | 1,430 | | | | 1,375 | |
| NextEra Energy Partners, LP 4.25% 20241 | | | 122 | | | | 131 | |
| NextEra Energy Partners, LP 3.875% 20261 | | | 92 | | | | 98 | |
| NGL Energy Partners LP 7.50% 2026 | | | 1,492 | | | | 928 | |
| NRG Energy, Inc. 7.25% 2026 | | | 328 | | | | 347 | |
| NRG Energy, Inc. 3.375% 20291 | | | 630 | | | | 646 | |
| NRG Energy, Inc. 3.625% 20311 | | | 630 | | | | 649 | |
| Pacific Gas and Electric Co. 3.75% 2028 | | | 203 | | | | 221 | |
| Pacific Gas and Electric Co. 4.55% 2030 | | | 473 | | | | 539 | |
| Pacific Gas and Electric Co. 4.95% 2050 | | | 600 | | | | 716 | |
| PG&E Corp. 5.00% 2028 | | | 1,655 | | | | 1,765 | |
| PG&E Corp. 5.25% 2030 | | | 675 | | | | 743 | |
| PG&E Corp., Term Loan, (3-month USD-LIBOR + 4.50%) 5.50% 20252,3 | | | 254 | | | | 257 | |
| Talen Energy Corp. 10.50% 20261 | | | 3,248 | | | | 2,897 | |
| Talen Energy Corp. 7.25% 20271 | | | 2,773 | | | | 2,958 | |
| Talen Energy Supply, LLC 7.625% 20281 | | | 1,590 | | | | 1,716 | |
| UEP Penonome II SA 6.50% 20381 | | | 250 | | | | 261 | |
| Vistra Operations Co. LLC 3.55% 20241 | | | 231 | | | | 250 | |
| | | | | | | | 25,873 | |
| | | | | | | | | |
| Consumer staples 2.72% | | | | | | | | |
| Albertsons Companies, Inc. 3.50% 20291 | | | 585 | | | | 592 | |
| Albertsons Companies, Inc. 4.875% 20301 | | | 335 | | | | 370 | |
| B&G Foods, Inc. 5.25% 2025 | | | 612 | | | | 633 | |
| B&G Foods, Inc. 5.25% 2027 | | | 228 | | | | 243 | |
| Brasil Foods SA 5.75% 20501 | | | 370 | | | | 412 | |
| C&S Wholsesale Grocers Inc. 5.00% 20281 | | | 650 | | | | 649 | |
| Central Garden & Pet Co. 4.125% 2030 | | | 420 | | | | 439 | |
| Darling Ingredients Inc. 5.25% 20271 | | | 579 | | | | 617 | |
| Edgewell Personal Care Co. 5.50% 20281 | | | 275 | | | | 296 | |
| Energizer Holdings, Inc. 7.75% 20271 | | | 227 | | | | 253 | |
| Energizer Holdings, Inc. 4.375% 20291 | | | 545 | | | | 565 | |
| H.J. Heinz Co. 3.875% 20271 | | | 725 | | | | 782 | |
| H.J. Heinz Co. 4.25% 20311 | | | 713 | | | | 795 | |
| H.J. Heinz Co. 4.625% 20391 | | | 165 | | | | 185 | |
| H.J. Heinz Co. 5.50% 20501 | | | 1,341 | | | | 1,694 | |
| Kraft Heinz Company 3.95% 2025 | | | 580 | | | | 639 | |
| Kraft Heinz Company 5.20% 2045 | | | 330 | | | | 392 | |
| Kraft Heinz Company 4.375% 2046 | | | 1,466 | | | | 1,586 | |
| Kraft Heinz Company 4.875% 20491 | | | 985 | | | | 1,149 | |
| Kronos Acquisition Holdings Inc. 5.00% 20261 | | | 385 | | | | 402 | |
| Kronos Acquisition Holdings Inc. 7.00% 20271 | | | 485 | | | | 509 | |
| Lamb Weston Holdings, Inc. 4.625% 20241 | | | 561 | | | | 586 | |
| Nestle Skin Health SA, Term Loan B1, (3-month USD-LIBOR + 4.00%) 4.254% 20262,3 | | | 1,806 | | | | 1,813 | |
| Post Holdings, Inc. 5.00% 20261 | | | 1,958 | | | | 2,025 | |
| Post Holdings, Inc. 5.625% 20281 | | | 569 | | | | 607 | |
| Post Holdings, Inc. 5.50% 20291 | | | 166 | | | | 181 | |
| Post Holdings, Inc. 4.625% 20301 | | | 1,905 | | | | 2,006 | |
| Prestige Brands International Inc. 6.375% 20241 | | | 260 | | | | 266 | |
| Prestige Brands International Inc. 5.125% 20281 | | | 103 | | | | 110 | |
| Spectrum Brands Inc. 5.75% 2025 | | | 528 | | | | 546 | |
| 212 | American Funds Insurance Series |
High-Income Bond Fund (continued)
| Bonds, notes & other debt instruments (continued) | | Principal amount
(000) | | | Value
(000) | |
| Corporate bonds, notes & loans (continued) | | | | | | | | |
| Consumer staples (continued) | | | | | | | | |
| TreeHouse Foods, Inc. 6.00% 20241 | | $ | 1,188 | | | $ | 1,213 | |
| TreeHouse Foods, Inc. 4.00% 2028 | | | 145 | | | | 150 | |
| United Natural Foods, Inc. 6.75% 20281 | | | 865 | | | | 906 | |
| | | | | | | | 23,611 | |
| | | | | | | | | |
| Real estate 2.62% | | | | | | | | |
| Brookfield Property REIT Inc. 5.75% 20261 | | | 2,839 | | | | 2,806 | |
| Diversified Healthcare Trust 4.75% 2024 | | | 275 | | | | 283 | |
| Diversified Healthcare Trust 9.75% 2025 | | | 650 | | | | 739 | |
| Hospitality Properties Trust 7.50% 2025 | | | 238 | | | | 274 | |
| Howard Hughes Corp. 5.375% 20251 | | | 2,568 | | | | 2,655 | |
| Howard Hughes Corp. 5.375% 20281 | | | 1,950 | | | | 2,101 | |
| Iron Mountain Inc. 4.875% 20271 | | | 1,266 | | | | 1,327 | |
| Iron Mountain Inc. 5.00% 20281 | | | 617 | | | | 656 | |
| Iron Mountain Inc. 5.25% 20281 | | | 1,214 | | | | 1,283 | |
| Iron Mountain Inc. 5.25% 20301 | | | 2,450 | | | | 2,649 | |
| Iron Mountain Inc. 4.50% 20311 | | | 1,960 | | | | 2,056 | |
| Ladder Capital Corp. 5.25% 20251 | | | 140 | | | | 140 | |
| Medical Properties Trust, Inc. 5.00% 2027 | | | 1,333 | | | | 1,420 | |
| Medical Properties Trust, Inc. 3.50% 2031 | | | 1,369 | | | | 1,416 | |
| Park Hotels & Resorts Inc. 7.50% 20251 | | | 425 | | | | 460 | |
| QTS Realty Trust, Inc. 3.875% 20281 | | | 625 | | | | 638 | |
| Realogy Corp. 9.375% 20271 | | | 740 | | | | 821 | |
| Realogy Group LLC 7.625% 20251 | | | 260 | | | | 283 | |
| Service Properties Trust 5.50% 2027 | | | 335 | | | | 366 | |
| Xenia Hotels & Resorts, Inc. 6.375% 20251 | | | 300 | | | | 317 | |
| | | | | | | | 22,690 | |
| | | | | | | | | |
| Total corporate bonds, notes & loans | | | | | | | 775,019 | |
| | | | | | | | | |
| Asset-backed obligations 0.01% | | | | | | | | |
| CF Hippolyta LLC, Series 2020-1, Class B2, 2.60% 20601,10 | | | 95 | | | | 97 | |
| | | | | | | | | |
| Municipals 0.00% | | | | | | | | |
| Puerto Rico 0.00% | | | | | | | | |
| Aqueduct and Sewer Auth., Rev. Bonds, Series 2012-B, 5.35% 2027 | | | 5 | | | | 5 | |
| | | | | | | | | |
| Total bonds, notes & other debt instruments (cost: $755,326,000) | | | | | | | 775,121 | |
| | | | | | | | | |
| | | | | | | | | |
| Convertible bonds & notes 0.61% | | | | | | | | |
| Communication services 0.27% | | | | | | | | |
| Cinemark USA, Inc., convertible notes, 4.50% 20251 | | | 190 | | | | 278 | |
| DISH DBS Corp., convertible notes, 3.375% 2026 | | | 635 | | | | 607 | |
| Liberty Broadband Corp., convertible notes, 2.75% 20501 | | | 321 | | | | 344 | |
| Live Nation Entertainment, Inc., convertible notes, 2.125% 20251 | | | 430 | | | | 459 | |
| Match Group Financeco 2 Inc., convertible notes, 0.875% 20261 | | | 175 | | | | 321 | |
| Zillow Group, Inc., convertible notes, 1.50% 2023 | | | 180 | | | | 307 | |
| | | | | | | | 2,316 | |
| | | | | | | | | |
| Information technology 0.15% | | | | | | | | |
| LivePerson, Inc., convertible notes, 0% 20261 | | | 219 | | | | 240 | |
| Sabre Holdings Corp., convertible notes, 4.00% 20251 | | | 390 | | | | 702 | |
| Shift4 Payments, Inc., convertible notes, 0% 20251 | | | 267 | | | | 327 | |
| | | | | | | | 1,269 | |
| | | | | | | | | |
| Industrials 0.12% | | | | | | | | |
| American Airlines Group Inc., convertible notes, 6.50% 2025 | | | 183 | | | | 230 | |
| Southwest Airlines Co., convertible notes, 1.25% 2025 | | | 403 | | | | 587 | |
| Uber Technologies, Inc., convertible notes, 0% 20251 | | | 270 | | | | 278 | |
| | | | | | | | 1,095 | |
| American Funds Insurance Series | 213 |
High-Income Bond Fund (continued)
| Convertible bonds & notes (continued) | | Principal amount
(000) | | | Value
(000) | |
| Consumer discretionary 0.06% | | | | | | | | |
| NCL Corp. Ltd., convertible notes, 5.375% 20251 | | $ | 155 | | | $ | 263 | |
| Royal Caribbean Cruises Ltd., convertible notes, 4.25% 20231 | | | 200 | | | | 267 | |
| | | | | | | | 530 | |
| | | | | | | | | |
| Energy 0.01% | | | | | | | | |
| Mesquite Energy Inc., convertible notes, 15.04% 2023 (100% PIK)1,5,7,8 | | | 65 | | | | 65 | |
| | | | | | | | | |
| Total convertible bonds & notes (cost: $4,324,000) | | | | | | | 5,275 | |
| | | | | | | | | |
| Convertible stocks 0.38% | | | Shares | | | | | |
| Utilities 0.14% | | | | | | | | |
| PG&E Corp., convertible preferred units, 5.50% 202311 | | | 3,350 | | | | 411 | |
| American Electric Power Company, Inc., convertible preferred shares, 6.125% 2022 | | | 8,000 | | | | 401 | |
| NextEra Energy, Inc., convertible preferred units, 5.279% 2023 | | | 4,300 | | | | 219 | |
| Essential Utilities, Inc., convertible preferred units, 6.00% 2022 | | | 2,600 | | | | 161 | |
| | | | | | | | 1,192 | |
| | | | | | | | | |
| Financials 0.10% | | | | | | | | |
| 2020 Cash Mandatory Exchangeable Trust, convertible preferred shares, 5.25% 20231 | | | 411 | | | | 494 | |
| KKR & Co. Inc., Series C, convertible preferred shares, 6.00% | | | 6,980 | | | | 421 | |
| | | | | | | | 915 | |
| | | | | | | | | |
| Information technology 0.07% | | | | | | | | |
| Broadcom Inc., Series A, cumulative convertible preferred shares, 8.00% 2022 | | | 450 | | | | 640 | |
| | | | | | | | | |
| Health care 0.07% | | | | | | | | |
| Danaher Corp., Series B, cumulative convertible preferred shares, 5.00% 2023 | | | 291 | | | | 379 | |
| Boston Scientific Corp., Series A, convertible preferred shares, 5.50% 2023 | | | 1,935 | | | | 212 | |
| | | | | | | | 591 | |
| | | | | | | | | |
| Total convertible stocks (cost: $2,799,000) | | | | | | | 3,338 | |
| | | | | | | | | |
| Preferred securities 0.33% | | | | | | | | |
| Consumer discretionary 0.33% | | | | | | | | |
| MYT Holding LLC, Series A, preferred shares7,11 | | | 2,470,906 | | | | 2,841 | |
| | | | | | | | | |
| Total preferred securities (cost: $2,212,000) | | | | | | | 2,841 | |
| | | | | | | | | |
| Common stocks 4.07% | | | | | | | | |
| Health care 1.71% | | | | | | | | |
| Rotech Healthcare Inc.7,8,11,12 | | | 201,793 | | | | 14,327 | |
| Advanz Pharma Corp. Ltd.11,12 | | | 80,350 | | | | 354 | |
| Advanz Pharma Corp. Ltd.11 | | | 29,584 | | | | 131 | |
| | | | | | | | 14,812 | |
| | | | | | | | | |
| Energy 0.84% | | | | | | | | |
| Denbury Inc.11 | | | 63,840 | | | | 1,640 | |
| Oasis Petroleum Inc.11 | | | 43,838 | | | | 1,625 | |
| Ascent Resources - Utica, LLC, Class A7,8,11,12 | | | 6,297,894 | | | | 1,385 | |
| Weatherford International11 | | | 156,870 | | | | 941 | |
| Tribune Resources, LLC7,8,11 | | | 1,006,339 | | | | 916 | |
| California Resources Corp.11 | | | 17,202 | | | | 406 | |
| Whiting Petroleum Corp.11 | | | 12,063 | | | | 302 | |
| McDermott International, Inc.11 | | | 107,875 | | | | 87 | |
| 214 | American Funds Insurance Series |
High-Income Bond Fund (continued)
| Common stocks (continued) | | Shares | | | Value
(000) | |
| Energy (continued) | | | | | | | | |
| Mesquite Energy, Inc.7,8,11 | | | 3,557 | | | $ | 21 | |
| Tapstone Energy, LLC1,7,8,11 | | | 14,603 | | | | — | 9 |
| Sable Permian Resources, LLC, units7,8,11 | | | 15,816,020 | | | | — | 9 |
| | | | | | | | 7,323 | |
| | | | | | | | | |
| Industrials 0.81% | | | | | | | | |
| Associated Materials Group Inc.7,8,11 | | | 949,277 | | | | 5,961 | |
| ACR III LSC Holdings LLC7,8,11 | | | 1,061 | | | | 1,098 | |
| | | | | | | | 7,059 | |
| | | | | | | | | |
| Consumer discretionary 0.37% | | | | | | | | |
| MYT Holding Co., Class B7,11 | | | 608,846 | | | | 1,644 | |
| NMG Parent LLC7,11 | | | 14,350 | | | | 947 | |
| NMG Parent LLC1,7,8,11 | | | 1,615 | | | | 75 | |
| Chewy, Inc., Class A11 | | | 3,070 | | | | 276 | |
| Scientific Games Corp.11 | | | 6,000 | | | | 249 | |
| | | | | | | | 3,191 | |
| | | | | | | | | |
| Materials 0.12% | | | | | | | | |
| Hexion Holdings Corp., Class B11 | | | 81,939 | | | | 1,004 | |
| | | | | | | | | |
| | | | | | | | | |
| Information technology 0.10% | | | | | | | | |
| Snowflake Inc., Class A11 | | | 1,200 | | | | 338 | |
| MoneyGram International, Inc.11 | | | 50,000 | | | | 273 | |
| C3.ai, Inc., Class A11 | | | 1,800 | | | | 250 | |
| | | | | | | | 861 | |
| | | | | | | | | |
| Financials 0.09% | | | | | | | | |
| Jonah Energy Parent LLC7,8,11 | | | 38,716 | | | | 581 | |
| Navient Corp. | | | 20,000 | | | | 196 | |
| | | | | | | | 777 | |
| | | | | | | | | |
| Communication services 0.03% | | | | | | | | |
| iHeartMedia, Inc., Class A11 | | | 22,639 | | | | 294 | |
| | | | | | | | | |
| Total common stocks (cost: $41,154,000) | | | | | | | 35,321 | |
| | | | | | | | | |
| | | | | | | | | |
| Rights & warrants 0.01% | | | | | | | | |
| Consumer discretionary 0.01% | | | | | | | | |
| NMG Parent LLC, warrants, expire 20277,11 | | | 27,111 | | | | 76 | |
| | | | | | | | | |
| Energy 0.00% | | | | | | | | |
| Tribune Resources, LLC, Class A, warrants, expire 20237,8,11 | | | 336,564 | | | | — | 9 |
| Tribune Resources, LLC, Class B, warrants, expire 20237,8,11 | | | 261,772 | | | | — | 9 |
| Tribune Resources, LLC, Class C, warrants, expire 20237,8,11 | | | 247,225 | | | | — | 9 |
| | | | | | | | — | 9 |
| | | | | | | | | |
| Total rights & warrants (cost: $215,000) | | | | | | | 76 | |
| American Funds Insurance Series | 215 |
High-Income Bond Fund (continued)
| Short-term securities 3.86% | | Shares | | | Value
(000) | |
| Money market investments 3.86% | | | | | | |
| Capital Group Central Cash Fund 0.12%13,14 | | | 334,899 | | | $ | 33,493 | |
| | | | | | | | | |
| Total short-term securities (cost: $33,489,000) | | | | | | | 33,493 | |
| Total investment securities 98.60% (cost: $839,519,000) | | | | | | | 855,465 | |
| Other assets less liabilities 1.40% | | | | | | | 12,114 | |
| | | | | | | | | |
| Net assets 100.00% | | | | | | $ | 867,579 | |
| Futures contracts | | | | | | | | | | | | | | | | | |
| | | | | | | | | | | | | | | | | | |
| Contracts | | Type | | Number of
contracts | | Expiration | | | Notional
amount15
(000) | | | Value at
12/31/202016
(000) | | Unrealized
appreciation
(depreciation)
at 12/31/2020
(000) | |
| 10 Year Ultra U.S. Treasury Note Futures | | Short | | 24 | | March 2021 | | | $ | (2,400 | ) | | $ | (3,753 | ) | | $ | 8 | |
| 10 Year U.S. Treasury Note Futures | | Short | | 82 | | March 2021 | | | (8,200 | ) | | (11,322 | ) | | | (27 | ) |
| | | | | | | | | | | | | | | | $ | (19 | ) |
| Swap contracts | | | | | | | | | | | |
| | | | | | | | | | | | |
| Credit default swaps | | | | | | | | | | | |
| | | | | | | | | | | | |
| Centrally cleared credit default swaps on credit indices — buy protection | |
| | | | | | | |
| Receive | | Pay/
Payment frequency | | Expiration
date | | Notional
(000) | | | Value at
12/31/2020
(000) | | | Upfront
premium
received
(000) | | | Unrealized
appreciation
(depreciation)
at 12/31/2020
(000) | |
| CDX.NA.IG.35 | | 1.00%/Quarterly | | 12/20/2025 | | $ | 15,200 | | | $ | (372 | ) | | $ | (379 | ) | | | $ | 7 | |
| CDX.NA.HY.35 | | 5.00%/Quarterly | | 12/20/2025 | | | 20,525 | | | | (1,911 | ) | | | (1,183 | ) | | | | (728 | ) |
| | | | | | | | | | | | | | | $ | (1,562 | ) | | | $ | (721 | ) |
| Investments in affiliates14 | | | | | | | | | | | |
| | | | | | | | | | | | | | | | | | | | | | |
| | | Value of
affiliate at
1/1/2020
(000) | | | Additions
(000) | | | Reductions
(000) | | | Net
realized
gain
(000) | | | Net
unrealized
depreciation
(000) | | | Value of
affiliate at
12/31/2020
(000) | | | Dividend
income
(000) | |
| Short-term securities 3.86% | | | | | | | | | | | | | |
| Money market investments 3.86% | | | | | | | | | | | | | | | | | | |
| Capital Group Central Cash Fund 0.12%13 | | $ | 39,112 | | | $ | 330,467 | | | $ | 336,030 | | | $ | 73 | | | $ | (129 | ) | | $ | 33,493 | | | $ | 227 | |
| 216 | American Funds Insurance Series |
High-Income Bond Fund (continued)
| 1 | Acquired in a transaction exempt from registration under Rule 144A of the Securities Act of 1933. May be resold in the U.S. in transactions exempt from registration, normally to qualified institutional buyers. The total value of all such securities was $517,886,000, which represented 59.69% of the net assets of the fund. |
| 2 | Loan participations and assignments; may be subject to legal or contractual restrictions on resale. The total value of all such loans was $37,070,000, which represented 4.27% of the net assets of the fund. |
| 3 | Coupon rate may change periodically. Reference rate and spread are as of the most recent information available. Some coupon rates are determined by the issuer or agent based on current market conditions; therefore, the reference rate and spread are not available. |
| 4 | Scheduled interest and/or principal payment was not received. |
| 5 | Payment in kind; the issuer has the option of paying additional securities in lieu of cash. Most recent payment was 100% cash unless otherwise noted. |
| 6 | Step bond; coupon rate may change at a later date. |
| 7 | Valued under fair value procedures adopted by authority of the board of trustees. The total value of all such securities was $34,321,000, which represented 3.96% of the net assets of the fund. |
| 8 | Value determined using significant unobservable inputs. |
| 9 | Amount less than one thousand. |
| 10 | Principal payments may be made periodically. Therefore, the effective maturity date may be earlier than the stated maturity date. |
| 11 | Security did not produce income during the last 12 months. |
| 12 | Acquired through a private placement transaction exempt from registration under the Securities Act of 1933. May be subject to legal or contractual restrictions on resale. Further details on these holdings appear on the following page. |
| 13 | Rate represents the seven-day yield at 12/31/2020. |
| 14 | Part of the same group of investment companies as the fund as defined under the Investment Company Act of 1940. |
| 15 | Notional amount is calculated based on the number of contracts and notional contract size. |
| 16 | Value is calculated based on the notional amount and current market price. |
| Private placement securities | | Acquisition
date | | Cost
(000) | | | Value
(000) | | | Percent
of net
assets | |
| Rotech Healthcare Inc. | | 9/26/2013 | | $ | 4,331 | | | $ | 14,327 | | | | 1.65 | % |
| Ascent Resources - Utica, LLC, Class A | | 11/15/2016 | | | 302 | | | | 1,385 | | | | .16 | |
| Advanz Pharma Corp. Ltd. | | 8/31/2018 | | | 1,017 | | | | 354 | | | | .04 | |
| Total private placement securities | | | | $ | 5,650 | | | $ | 16,066 | | | | 1.85 | % |
Key to abbreviations and symbols
Auth. = Authority
£ = British pounds
€ = Euros
LIBOR = London Interbank Offered Rate
Rev. = Revenue
USD/$ = U.S. dollars
See notes to financial statements.
| American Funds Insurance Series | 217 |
American Funds Mortgage Fund (formerly Mortgage Fund)
Investment portfolio December 31, 2020
| Bonds, notes & other debt instruments 78.54% | | Principal amount
(000) | | | Value
(000) | |
| Mortgage-backed obligations 68.70% | | | | | | |
| Federal agency mortgage-backed obligations 64.32% | | | | | | | | |
| Fannie Mae Pool #AS7638 2.50% 20311 | | $ | 1,073 | | | $ | 1,120 | |
| Fannie Mae Pool #695412 5.00% 20331 | | | — | 2 | | | — | 2 |
| Fannie Mae Pool #AD3566 5.00% 20351 | | | 2 | | | | 2 | |
| Fannie Mae Pool #MA4228 1.50% 20361 | | | 80 | | | | 82 | |
| Fannie Mae Pool #256583 5.00% 20361,3 | | | 35 | | | | 37 | |
| Fannie Mae Pool #889101 2.125% 20381,4 | | | 35 | | | | 36 | |
| Fannie Mae Pool #964279 2.633% 20381,4 | | | 32 | | | | 32 | |
| Fannie Mae Pool #964708 2.765% 20381,4 | | | 4 | | | | 4 | |
| Fannie Mae Pool #AC0794 5.00% 20391 | | | 10 | | | | 11 | |
| Fannie Mae Pool #931768 5.00% 20391 | | | 2 | | | | 2 | |
| Fannie Mae Pool #AL9335 2.604% 20401,4 | | | 1,327 | | | | 1,389 | |
| Fannie Mae Pool #932606 5.00% 20401 | | | 5 | | | | 6 | |
| Fannie Mae Pool #AL9327 3.122% 20411,4 | | | 1,241 | | | | 1,302 | |
| Fannie Mae Pool #AL9326 3.302% 20411,4 | | | 1,704 | | | | 1,788 | |
| Fannie Mae Pool #AJ1873 4.00% 20411 | | | 7 | | | | 8 | |
| Fannie Mae Pool #AE1248 5.00% 20411 | | | 11 | | | | 13 | |
| Fannie Mae Pool #AE1274 5.00% 20411 | | | 9 | | | | 10 | |
| Fannie Mae Pool #AE1277 5.00% 20411 | | | 5 | | | | 6 | |
| Fannie Mae Pool #AE1283 5.00% 20411 | | | 3 | | | | 4 | |
| Fannie Mae Pool #AP7553 3.00% 20421 | | | 402 | | | | 430 | |
| Fannie Mae Pool #AE1290 5.00% 20421 | | | 6 | | | | 7 | |
| Fannie Mae Pool #AL3829 3.50% 20431 | | | 64 | | | | 70 | |
| Fannie Mae Pool #AT7161 3.50% 20431 | | | 29 | | | | 31 | |
| Fannie Mae Pool #AR1512 3.50% 20431 | | | 14 | | | | 15 | |
| Fannie Mae Pool #AT0412 3.50% 20431 | | | 7 | | | | 8 | |
| Fannie Mae Pool #AT3954 3.50% 20431 | | | 4 | | | | 4 | |
| Fannie Mae Pool #AT0300 3.50% 20431 | | | 3 | | | | 3 | |
| Fannie Mae Pool #AY1829 3.50% 20441 | | | 5 | | | | 6 | |
| Fannie Mae Pool #AW8240 3.50% 20441 | | | 1 | | | | 1 | |
| Fannie Mae Pool #BE5017 3.50% 20451 | | | 36 | | | | 39 | |
| Fannie Mae Pool #BE5009 3.50% 20451 | | | 29 | | | | 31 | |
| Fannie Mae Pool #BE8740 3.50% 20471 | | | 33 | | | | 36 | |
| Fannie Mae Pool #BE8742 3.50% 20471 | | | 10 | | | | 11 | |
| Fannie Mae Pool #BH2848 3.50% 20471 | | | 5 | | | | 5 | |
| Fannie Mae Pool #BH2847 3.50% 20471 | | | 3 | | | | 4 | |
| Fannie Mae Pool #BH2846 3.50% 20471 | | | 4 | | | | 4 | |
| Fannie Mae Pool #BJ5015 4.00% 20471 | | | 79 | | | | 87 | |
| Fannie Mae Pool #BH3122 4.00% 20471 | | | 3 | | | | 3 | |
| Fannie Mae Pool #BM4488 3.398% 20481,4 | | | 892 | | | | 928 | |
| Fannie Mae Pool #BJ4901 3.50% 20481 | | | 23 | | | | 25 | |
| Fannie Mae Pool #CA2850 4.00% 20481 | | | 91 | | | | 102 | |
| Fannie Mae Pool #BK6840 4.00% 20481 | | | 51 | | | | 55 | |
| Fannie Mae Pool #BK5232 4.00% 20481 | | | 40 | | | | 44 | |
| Fannie Mae Pool #BK9743 4.00% 20481 | | | 14 | | | | 15 | |
| Fannie Mae Pool #BK7665 4.50% 20481 | | | 336 | | | | 373 | |
| Fannie Mae Pool #BK0951 4.50% 20481 | | | 257 | | | | 288 | |
| Fannie Mae Pool #CA2205 4.50% 20481 | | | 67 | | | | 72 | |
| Fannie Mae Pool #BK9761 4.50% 20481 | | | 14 | | | | 15 | |
| Fannie Mae Pool #CA4867 3.00% 20491,3 | | | 4,614 | | | | 5,010 | |
| Fannie Mae Pool #CA4151 3.50% 20491 | | | 318 | | | | 350 | |
| Fannie Mae Pool #BJ8411 3.50% 20491 | | | 67 | | | | 73 | |
| Fannie Mae Pool #BJ8402 3.53% 20491,4 | | | 178 | | | | 185 | |
| Fannie Mae Pool #CA5496 3.00% 20501 | | | 9,365 | | | | 10,214 | |
| Fannie Mae Pool #MA4256 2.50% 20511 | | | 7 | | | | 7 | |
| Freddie Mac Pool #A18781 5.00% 20341,3 | | | 907 | | | | 1,049 | |
| Freddie Mac Pool #SB8083 1.50% 20361 | | | 1,256 | | | | 1,293 | |
| Freddie Mac Pool #C91883 4.00% 20361 | | | 3,471 | | | | 3,792 | |
| Freddie Mac Pool #840222 2.803% 20401,4 | | | 363 | | | | 382 | |
| Freddie Mac Pool #Q18236 3.50% 20431 | | | 29 | | | | 31 | |
| Freddie Mac Pool #Q19133 3.50% 20431 | | | 18 | | | | 20 | |
| Freddie Mac Pool #Q17696 3.50% 20431 | | | 16 | | | | 18 | |
| 218 | American Funds Insurance Series |
American Funds Mortgage Fund (formerly Mortgage Fund) (continued)
| Bonds, notes & other debt instruments (continued) | | Principal amount
(000) | | | Value
(000) | |
| Mortgage-backed obligations (continued) | | | | | | |
| Federal agency mortgage-backed obligations (continued) | | | | | | | | |
| Freddie Mac Pool #Q15874 4.00% 20431 | | $ | 2 | | | $ | 2 | |
| Freddie Mac Pool #760012 3.097% 20451,4 | | | 83 | | | | 86 | |
| Freddie Mac Pool #760014 3.116% 20451,4 | | | 788 | | | | 823 | |
| Freddie Mac Pool #760013 3.162% 20451,4 | | | 46 | | | | 48 | |
| Freddie Mac Pool #760015 2.849% 20471,4 | | | 140 | | | | 145 | |
| Freddie Mac Pool #Q52069 3.50% 20471 | | | 48 | | | | 52 | |
| Freddie Mac Pool #Q47615 3.50% 20471 | | | 33 | | | | 36 | |
| Freddie Mac Pool #Q55056 3.50% 20481 | | | 60 | | | | 65 | |
| Freddie Mac Pool #Q54709 3.50% 20481 | | | 36 | | | | 39 | |
| Freddie Mac Pool #Q54701 3.50% 20481 | | | 34 | | | | 37 | |
| Freddie Mac Pool #Q54782 3.50% 20481 | | | 30 | | | | 32 | |
| Freddie Mac Pool #Q54781 3.50% 20481 | | | 27 | | | | 30 | |
| Freddie Mac Pool #Q54700 3.50% 20481 | | | 26 | | | | 29 | |
| Freddie Mac Pool #Q55060 3.50% 20481 | | | 19 | | | | 20 | |
| Freddie Mac Pool #Q56591 3.50% 20481 | | | 18 | | | | 19 | |
| Freddie Mac Pool #Q56590 3.50% 20481 | | | 17 | | | | 18 | |
| Freddie Mac Pool #Q56589 3.50% 20481 | | | 16 | | | | 17 | |
| Freddie Mac Pool #Q54698 3.50% 20481 | | | 14 | | | | 15 | |
| Freddie Mac Pool #Q54699 3.50% 20481 | | | 13 | | | | 14 | |
| Freddie Mac Pool #Q54831 3.50% 20481 | | | 9 | | | | 10 | |
| Freddie Mac Pool #G67711 4.00% 20481 | | | 440 | | | | 486 | |
| Freddie Mac Pool #Q56599 4.00% 20481 | | | 57 | | | | 63 | |
| Freddie Mac Pool #Q56175 4.00% 20481 | | | 43 | | | | 47 | |
| Freddie Mac Pool #Q55971 4.00% 20481 | | | 38 | | | | 42 | |
| Freddie Mac Pool #Q55970 4.00% 20481 | | | 19 | | | | 21 | |
| Freddie Mac Pool #Q58411 4.50% 20481 | | | 116 | | | | 129 | |
| Freddie Mac Pool #Q58436 4.50% 20481 | | | 52 | | | | 59 | |
| Freddie Mac Pool #Q58378 4.50% 20481 | | | 43 | | | | 48 | |
| Freddie Mac Pool #Q57242 4.50% 20481 | | | 31 | | | | 34 | |
| Freddie Mac Pool #RA1339 3.00% 20491 | | | 3,063 | | | | 3,282 | |
| Freddie Mac Pool #RA1463 3.50% 20491 | | | 216 | | | | 238 | |
| Freddie Mac Pool #QA2748 3.50% 20491 | | | 29 | | | | 32 | |
| Freddie Mac Pool #SD7514 3.50% 20501,3 | | | 10,578 | | | | 11,378 | |
| Freddie Mac, Series K030, Class A2, Multi Family, 3.25% 20231 | | | 1,746 | | | | 1,850 | |
| Freddie Mac, Series K031, Class A2, Multi Family, 3.30% 20231 | | | 4,722 | | | | 5,026 | |
| Freddie Mac, Series K083, Class A2, Multi Family, 4.05% 20281,4 | | | 900 | | | | 1,096 | |
| Freddie Mac Seasoned Credit Risk Transfer Trust, Series 2017-2, Class MA, 3.00% 20561 | | | 1,257 | | | | 1,348 | |
| Freddie Mac Seasoned Credit Risk Transfer Trust, Series 2017-2, Class HA, 3.00% 20561,4 | | | 1,260 | | | | 1,324 | |
| Freddie Mac Seasoned Credit Risk Transfer Trust, Series 2017-1, Class HA, 3.00% 20561,4 | | | 1,032 | | | | 1,084 | |
| Freddie Mac Seasoned Credit Risk Transfer Trust, Series 2017-3, Class HT, 3.25% 20561 | | | 136 | | | | 149 | |
| Freddie Mac Seasoned Credit Risk Transfer Trust, Series 2018-1, Class HT, 3.00% 20571 | | | 722 | | | | 783 | |
| Freddie Mac Seasoned Credit Risk Transfer Trust, Series 2017-4, Class HT, 3.25% 20571,4 | | | 4,576 | | | | 4,990 | |
| Freddie Mac Seasoned Credit Risk Transfer Trust, Series 2018-3, Class MA, 3.50% 20571 | | | 2,640 | | | | 2,861 | |
| Freddie Mac Seasoned Credit Risk Transfer Trust, Series 2017-4, Class MT, 3.50% 20571 | | | 2,020 | | | | 2,205 | |
| Freddie Mac Seasoned Credit Risk Transfer Trust, Series 2018-2, Class MT, 3.50% 20571 | | | 1,097 | | | | 1,198 | |
| Freddie Mac Seasoned Credit Risk Transfer Trust, Series 2019-2, Class MT, 3.50% 20581 | | | 42 | | | | 46 | |
| Freddie Mac Seasoned Credit Risk Transfer Trust, Series 2019-3, Class MT, 3.50% 20581 | | | 27 | | | | 30 | |
| Freddie Mac Seasoned Loan Structured Transaction Trust, Series 2018-2, Class A1, 3.50% 20281 | | | 5,765 | | | | 6,099 | |
| Freddie Mac Seasoned Loan Structured Transaction Trust, Series 2018-1, Class A1, 3.50% 20281 | | | 1,608 | | | | 1,692 | |
| Government National Mortgage Assn. 2.00% 20511,5 | | | 18,325 | | | | 19,101 | |
| Government National Mortgage Assn. 2.50% 20511,5 | | | 4,750 | | | | 5,009 | |
| Government National Mortgage Assn. 3.00% 20511,5 | | | 150 | | | | 157 | |
| Government National Mortgage Assn. 3.50% 20511,5 | | | 19 | | | | 20 | |
| Government National Mortgage Assn. 3.50% 20511,5 | | | 18 | | | | 20 | |
| Government National Mortgage Assn. Pool #AH5894 3.75% 20341 | | | 988 | | | | 1,062 | |
| Government National Mortgage Assn. Pool #AD0028 3.75% 20381 | | | 663 | | | | 714 | |
| Government National Mortgage Assn. Pool #AH5897 3.75% 20391 | | | 624 | | | | 671 | |
| Government National Mortgage Assn. Pool #004410 4.00% 20391 | | | 60 | | | | 62 | |
| Government National Mortgage Assn. Pool #783690 6.00% 20391 | | | 134 | | | | 155 | |
| American Funds Insurance Series | 219 |
American Funds Mortgage Fund (formerly Mortgage Fund) (continued)
| Bonds, notes & other debt instruments (continued) | | Principal amount
(000) | | | Value
(000) | |
| Mortgage-backed obligations (continued) | | | | | | | | |
| Federal agency mortgage-backed obligations (continued) | | | | | | | | |
| Government National Mortgage Assn. Pool #004823 4.00% 20401 | | $ | 141 | | | $ | 146 | |
| Government National Mortgage Assn. Pool #005142 4.50% 20411 | | | 29 | | | | 31 | |
| Government National Mortgage Assn. Pool #005104 5.00% 20411 | | | 553 | | | | 608 | |
| Government National Mortgage Assn. Pool #005165 6.50% 20411 | | | 145 | | | | 167 | |
| Government National Mortgage Assn. Pool #AA5326 3.50% 20421 | | | 243 | | | | 252 | |
| Government National Mortgage Assn. Pool #MA0366 3.50% 20421 | | | 210 | | | | 217 | |
| Government National Mortgage Assn. Pool #AA5526 3.50% 20421 | | | 143 | | | | 151 | |
| Government National Mortgage Assn. Pool #AA7301 3.50% 20431 | | | 1,338 | | | | 1,493 | |
| Government National Mortgage Assn. Pool #AD7278 3.50% 20431,3 | | | 1,043 | | | | 1,120 | |
| Government National Mortgage Assn. Pool #AF0140 3.50% 20431 | | | 237 | | | | 251 | |
| Government National Mortgage Assn. Pool #AD4360 3.50% 20431 | | | 96 | | | | 102 | |
| Government National Mortgage Assn. Pool #AH5882 3.75% 20441 | | | 532 | | | | 587 | |
| Government National Mortgage Assn. Pool #AH5884 4.25% 20441 | | | 1,444 | | | | 1,631 | |
| Government National Mortgage Assn. Pool #MA3727 4.00% 20461 | | | 463 | | | | 487 | |
| Government National Mortgage Assn. Pool #MA5877 4.50% 20491 | | | 783 | | | | 847 | |
| Government National Mortgage Assn. Pool #MA6092 4.50% 20491 | | | 336 | | | | 362 | |
| Government National Mortgage Assn. Pool #AO0409 4.55% 20651 | | | 218 | | | | 237 | |
| Government National Mortgage Assn. Pool #AO0461 4.562% 20651 | | | 118 | | | | 128 | |
| Government National Mortgage Assn. Pool #AN1825 4.573% 20651 | | | 375 | | | | 407 | |
| Government National Mortgage Assn. Pool #AO0385 4.502% 20661 | | | 836 | | | | 920 | |
| Government National Mortgage Assn. Pool #725897 5.20% 20661 | | | 4 | | | | 4 | |
| Uniform Mortgage-Backed Security 1.50% 20361,5 | | | 23,863 | | | | 24,519 | |
| Uniform Mortgage-Backed Security 1.50% 20361,5 | | | 12,400 | | | | 12,735 | |
| Uniform Mortgage-Backed Security 2.00% 20361,5 | | | 10,700 | | | | 11,175 | |
| Uniform Mortgage-Backed Security 2.00% 20511,5 | | | 12,555 | | | | 12,997 | |
| Uniform Mortgage-Backed Security 2.00% 20511,5 | | | 9,663 | | | | 10,019 | |
| Uniform Mortgage-Backed Security 2.50% 20511,5 | | | 280 | | | | 295 | |
| Uniform Mortgage-Backed Security 2.50% 20511,5 | | | 211 | | | | 221 | |
| Uniform Mortgage-Backed Security 3.00% 20511,5 | | | 3,656 | | | | 3,833 | |
| Uniform Mortgage-Backed Security 3.50% 20511,5 | | | 5,206 | | | | 5,511 | |
| Uniform Mortgage-Backed Security 4.00% 20511,5 | | | 77 | | | | 82 | |
| Uniform Mortgage-Backed Security 4.50% 20511,5 | | | 6,348 | | | | 6,889 | |
| | | | | | | | 205,560 | |
| | | | | | | | | |
| Collateralized mortgage-backed obligations (privately originated) 3.68% | | | | | | |
| Arroyo Mortgage Trust, Series 2018-1, Class A1, 3.763% 20481,4,6 | | | 464 | | | | 472 | |
| Cascade Funding Mortgage Trust, Series 2019-HB1, Class A, 2.386% 20291,4,6 | | | 221 | | | | 223 | |
| Cascade Funding Mortgage Trust, Series 2020-HB4, Class A, 0.946% 20301,4,6 | | | 726 | | | | 727 | |
| Cascade Funding Mortgage Trust, Series 2020-HB3, Class A, 2.812% 20301,4,6 | | | 921 | | | | 930 | |
| Cascade Funding Mortgage Trust, Series 2020-HBA, Class A, 3.405% 20301,4,6 | | | 217 | | | | 220 | |
| Finance of America HECM Buyout, Series 2020-HB1, Class A, 2.012% 20301,4,6 | | | 449 | | | | 453 | |
| JPMorgan Mortgage Trust, Series 2019-INV3, Class A3, 3.50% 20501,4,6 | | | 534 | | | | 557 | |
| Mello Warehouse Securitization Trust, Series 2019-2, Class A, (1-month USD-LIBOR + 0.75%) 0.898% 20521,4,6 | | | 750 | | | | 751 | |
| Mello Warehouse Securitization Trust, Series 2020-2, Class A, (1-month USD-LIBOR + 0.80%) 0.996% 20531,4,6 | | | 583 | | | | 584 | |
| Mello Warehouse Securitization Trust, Series 2020-1, Class A, (1-month USD-LIBOR + 0.90%) 1.048% 20531,4,6 | | | 809 | | | | 811 | |
| Mortgage Repurchase Agreement Financing Trust, Series 2020-1, Class A1, (1-month USD-LIBOR + 2.00%) 2.149% 20221,4,6 | | | 500 | | | | 501 | |
| Mortgage Repurchase Agreement Financing Trust, Series 2020-5, Class A1, (1-month USD-LIBOR + 1.00%) 1.149% 20231,4,6 | | | 750 | | | | 756 | |
| Nationstar HECM Loan Trust, Series 2019-2A, Class A, 2.272% 20291,4,6 | | | 268 | | | | 269 | |
| Nationstar HECM Loan Trust, Series 2019-1A, Class A, 2.651% 20291,4,6 | | | 347 | | | | 347 | |
| Onslow Bay Financial LLC, Series 2020-INV1, Class A5, 3.50% 20491,4,6 | | | 314 | | | | 324 | |
| RMF Proprietary Issuance Trust, Series 2019-1, Class A, 2.75% 20631,4,6 | | | 806 | | | | 811 | |
| Starwood Mortgage Residential Trust, Series 2020-2, Class A1, 2.718% 20601,4,6 | | | 395 | | | | 403 | |
| Station Place Securitization Trust, Series 2020-WL1, Class A, (1-month USD-LIBOR + 1.15%) 1.298% 20511,4,6 | | | 750 | | | | 751 | |
| Towd Point Mortgage Trust, Series 2016-5, Class A1, 2.50% 20561,4,6 | | | 435 | | | | 444 | |
| 220 | American Funds Insurance Series |
American Funds Mortgage Fund (formerly Mortgage Fund) (continued)
| Bonds, notes & other debt instruments (continued) | | Principal amount
(000) | | | Value
(000) | |
| Mortgage-backed obligations (continued) | | | | | | |
| Collateralized mortgage-backed obligations (privately originated) (continued) | | | | | | | | |
| Towd Point Mortgage Trust, Series 2017-5, Class A1, 0.748% 20571,4,6 | | $ | 32 | | | $ | 32 | |
| Towd Point Mortgage Trust, Series 2017-4, Class A1, 2.75% 20571,4,6 | | | 118 | | | | 122 | |
| Towd Point Mortgage Trust, Series 2017-3, Class A1, 2.75% 20571,4,6 | | | 87 | | | | 90 | |
| Towd Point Mortgage Trust, Series 2017-6, Class A1, 2.75% 20571,4,6 | | | 72 | | | | 74 | |
| Towd Point Mortgage Trust, Series 2015-2, Class 2A11, 3.00% 20571,4,6 | | | 78 | | | | 78 | |
| Towd Point Mortgage Trust, Series 2018-2, Class A1, 3.25% 20581,4,6 | | | 185 | | | | 194 | |
| Towd Point Mortgage Trust, Series 2020-4, Class A1, 1.75% 20601,6 | | | 721 | | | | 739 | |
| Vendee Mortgage Trust, Series 2010-1, Class DA, 4.25% 20351 | | | 93 | | | | 94 | |
| | | | | | | | 11,757 | |
| | | | | | | | | |
| Commercial mortgage-backed securities 0.70% | | | | | | | | |
| MRA Issuance Trust, Series 2020-10, Class A, (1-month USD-LIBOR + 1.75%) 2.25% 20211,4,6,7 | | | 2,250 | | | | 2,250 | |
| | | | | | | | | |
| Total mortgage-backed obligations | | | | | | | 219,567 | |
| | | | | | | | | |
| U.S. Treasury bonds & notes 8.02% | | | | | | | | |
| U.S. Treasury 6.74% | | | | | | | | |
| U.S. Treasury 0.375% 2025 | | | 200 | | | | 200 | |
| U.S. Treasury 0.625% 2030 | | | 2,000 | | | | 1,949 | |
| U.S. Treasury 1.25% 2050 | | | 6,655 | | | | 6,036 | |
| U.S. Treasury 1.375% 2050 | | | 6,150 | | | | 5,755 | |
| U.S. Treasury 1.625% 2050 | | | 7,640 | | | | 7,604 | |
| | | | | | | | 21,544 | |
| | | | | | | | | |
| U.S. Treasury inflation-protected securities 1.28% | | | | | | | | |
| U.S. Treasury Inflation-Protected Security 2.125% 20418 | | | 131 | | | | 205 | |
| U.S. Treasury Inflation-Protected Security 0.75% 20423,8 | | | 1,640 | | | | 2,091 | |
| U.S. Treasury Inflation-Protected Security 1.00% 20498 | | | 1,268 | | | | 1,788 | |
| | | | | | | | 4,084 | |
| | | | | | | | | |
| Total U.S. Treasury bonds & notes | | | | | | | 25,628 | |
| | | | | | | | | |
| Asset-backed obligations 1.73% | | | | | | | | |
| American Express Credit Account Master Trust, Series 2018-3, Class A, 0.479% 20251,4 | | | 210 | | | | 211 | |
| CF Hippolyta LLC, Series 2020-1, Class A1, 1.69% 20601,6 | | | 635 | | | | 648 | |
| CF Hippolyta LLC, Series 2020-1, Class A2, 1.99% 20601,6 | | | 105 | | | | 106 | |
| Drivetime Auto Owner Trust, Series 2019-3, Class A, 2.55% 20221,6 | | | 30 | | | | 30 | |
| Dryden Senior Loan Fund, Series 2014-33A, Class AR3, CLO, (3-month USD-LIBOR + 1.00%) 1.237% 20291,4,6 | | | 250 | | | | 250 | |
| Exeter Automobile Receivables Trust, Series 2019-3A, Class C, 2.79% 20241,6 | | | 1,000 | | | | 1,022 | |
| FirstKey Homes Trust, Series 2020-SFR2, Class A, 1.266% 20371,6 | | | 879 | | | | 885 | |
| Ford Credit Floorplan Master Owner Trust, Series 2019-3, Class A1, 2.23% 20241 | | | 1,000 | | | | 1,032 | |
| GM Financial Consumer Automobile Receivables Trust, Series 2020-2, Class A2B, 1.203% 20231,4 | | | 116 | | | | 117 | |
| GM Financial Consumer Automobile Receivables Trust, Series 2020-2, Class A3, 1.49% 20241 | | | 74 | | | | 76 | |
| OSW Structured Asset Trust, Series 2020-RPL1, Class A1, 3.072% 20601,4,6 | | | 128 | | | | 131 | |
| Palmer Square Loan Funding, CLO, Series 2019-2, Class A1, (3-month USD-LIBOR + 0.97%) 1.188% 20271,4,6 | | | 587 | | | | 586 | |
| Palmer Square Ltd., Series 2015-1A, Class A1R3, (3-month USD-LIBOR + 1.00%) 1.245% 20291,4,6 | | | 330 | | | | 330 | |
| Symphony Ltd., CLO, Series 2013-12A, Class AR, (3-month USD-LIBOR + 1.03%) 1.267% 20251,4,6 | | | 122 | | | | 122 | |
| | | | | | | | 5,546 | |
| American Funds Insurance Series | 221 |
American Funds Mortgage Fund (formerly Mortgage Fund) (continued)
| Bonds, notes & other debt instruments (continued) | | Principal amount
(000) | | | Value
(000) | |
| Federal agency bonds & notes 0.09% | | | | | | | | |
| Fannie Mae 0.875% 2030 | | $ | 300 | | | $ | 294 | |
| | | | | | | | | |
| Total bonds, notes & other debt instruments (cost: $246,328,000) | | | | | | | 251,035 | |
| | | | | | | | | |
| Short-term securities 44.24% | | | | | | | | |
| Commercial paper 27.57% | | | | | | | | |
| Army and Air Force Exchange Service 0.11% due 1/7/20216 | | | 8,300 | | | | 8,299 | |
| Atlantic Asset Securitization LLC 0.16% due 1/11/20216 | | | 6,600 | | | | 6,600 | |
| Chariot Funding, LLC 0.16% due 1/11/20216 | | | 5,000 | | | | 5,000 | |
| CHARTA, LLC 0.17% due 1/19/20216 | | | 8,000 | | | | 7,999 | |
| Chevron Corp. 0.11% due 2/1/20216 | | | 8,000 | | | | 7,999 | |
| Emerson Electric Co. 0.11%–0.12% due 1/22/2021–2/22/20216 | | | 7,804 | | | | 7,803 | |
| ExxonMobil Corp. 0.10%–0.13% due 1/27/2021–2/22/2021 | | | 9,000 | | | | 8,999 | |
| Johnson & Johnson 0% due 6/1/20216 | | | 4,000 | | | | 3,998 | |
| Kaiser Foundation Hospitals 0% due 5/4/2021 | | | 8,027 | | | | 8,019 | |
| National Rural Utilities Cooperative Finance Corp. 0.12% due 2/4/2021 | | | 5,000 | | | | 4,999 | |
| Old Line Funding, LLC 0.15% due 1/7/20216 | | | 7,900 | | | | 7,900 | |
| Paccar Financial Corp. 0.11%–0.12% due 1/11/2021–2/9/2021 | | | 9,000 | | | | 8,999 | |
| Regents of the University of California 0.17% due 2/18/2021 | | | 1,500 | | | | 1,500 | |
| | | | | | | | 88,114 | |
| | | | | | | | | |
| Federal agency bills & notes 16.67% | | | | | | | | |
| Federal Farm Credit Banks 0.07%–0.10% due 1/20/2021–5/12/2021 | | | 23,100 | | | | 23,092 | |
| Federal Home Loan Bank 0.07%–0.09% due 1/4/2021–3/5/2021 | | | 30,200 | | | | 30,198 | |
| | | | | | | | 53,290 | |
| Total short-term securities (cost: $141,410,000) | | | | | | | 141,404 | |
| Total investment securities 122.78% (cost: $387,738,000) | | | | | | | 392,439 | |
| Other assets less liabilities (22.78)% | | | | | | | (72,820 | ) |
| | | | | | | | | |
| Net assets 100.00% | | | | | | $ | 319,619 | |
Futures contracts
| Contracts | | Type | | Number of
contracts | | | Expiration | | Notional
amount
(000) | 9
| | Value at
12/31/2020
(000) | 10
| | Unrealized
(depreciation)
appreciation
at 12/31/2020
(000) | |
| 90 Day Euro Dollar Futures | | Short | | | 123 | | | | March 2021 | | $ | (30,750 | ) | | $ | (30,698 | ) | | $ | (15 | ) |
| 5 Year U.S. Treasury Note Futures | | Long | | | 7 | | | | April 2021 | | | 700 | | | | 883 | | | | 1 | |
| 10 Year U.S. Treasury Note Futures | | Long | | | 23 | | | | March 2021 | | | 2,300 | | | | 3,176 | | | | 5 | |
| 10 Year Ultra U.S. Treasury Note Futures | | Short | | | 122 | | | | March 2021 | | | (12,200 | ) | | | (19,076 | ) | | | 44 | |
| 20 Year U.S. Treasury Bond Futures | | Long | | | 4 | | | | March 2021 | | | 400 | | | | 693 | | | | (6 | ) |
| 30 Year Ultra U.S. Treasury Bond Futures | | Short | | | 3 | | | | March 2021 | | | (300 | ) | | | (640 | ) | | | 4 | |
| | | | | | | | | | | | | | | | | | | | $ | 33 | |
| 222 | American Funds Insurance Series |
American Funds Mortgage Fund (formerly Mortgage Fund) (continued)
Swap contracts
Interest rate swaps
| Receive | | Pay | | Expiration
date | | Notional
(000) | | | Value at
12/31/2020
(000) | | | Upfront
premium
paid
(000) | | | Unrealized
(depreciation)
appreciation
at 12/31/2020
(000) | |
| 3-month USD-LIBOR | | 0.243% | | 5/2/2024 | | $ | 33,400 | | | $ | 18 | | | | | $ | 22 | | | | $ | (4 | ) |
| U.S. EFFR | | 0.11% | | 5/18/2024 | | | 9,400 | | | | 11 | | | | | | — | | | | | 11 | |
| U.S. EFFR | | 0.1275% | | 6/25/2025 | | | 4,400 | | | | 17 | | | | | | — | | | | | 17 | |
| U.S. EFFR | | 0.105% | | 6/30/2025 | | | 4,300 | | | | 22 | | | | | | — | | | | | 22 | |
| U.S. EFFR | | 0.0975% | | 6/30/2025 | | | 2,387 | | | | 13 | | | | | | — | | | | | 13 | |
| U.S. EFFR | | 0.106% | | 6/30/2025 | | | 1,913 | | | | 9 | | | | | | — | | | | | 9 | |
| 3-month USD-LIBOR | | 0.32% | | 9/23/2025 | | | 3,600 | | | | 13 | | | | | | — | | | | | 13 | |
| 3-month USD-LIBOR | | 0.81% | | 7/28/2045 | | | 5,700 | | | | 696 | | | | | | 16 | | | | | 680 | |
| 3-month USD-LIBOR | | 0.811% | | 7/27/2050 | | | 3,000 | | | | 453 | | | | | | — | | | | | 453 | |
| | | | | | | | | | | | | | | | | $ | 38 | | | | $ | 1,214 | |
The following footnotes apply to either the individual securities noted or one or more of the securities aggregated and listed as a single line item.
| 1 | Principal payments may be made periodically. Therefore, the effective maturity date may be earlier than the stated maturity date. |
| 2 | Amount less than one thousand. |
| 3 | All or a portion of this security was pledged as collateral. The total value of pledged collateral was $2,200,000, which represented .69% of the net assets of the fund. |
| 4 | Coupon rate may change periodically. Reference rate and spread are as of the most recent information available. Some coupon rates are determined by the issuer or agent based on current market conditions; therefore, the reference rate and spread are not available. |
| 5 | Purchased on a TBA basis. |
| 6 | Acquired in a transaction exempt from registration under Rule 144A or Section 4(2) of the Securities Act of 1933. May be resold in the U.S. in transactions exempt from registration, normally to qualified institutional buyers. The total value of all such securities was $73,621,000, which represented 23.03% of the net assets of the fund. |
| 7 | Valued under fair value procedures adopted by authority of the board of trustees. The total value of the security was $2,250,000, which represented .70% of the net assets of the fund. |
| 8 | Index-linked bond whose principal amount moves with a government price index. |
| 9 | Notional amount is calculated based on the number of contracts and notional contract size. |
| 10 | Value is calculated based on the notional amount and current market price. |
Key to abbreviations and symbol
CLO = Collateralized Loan Obligations
EFFR = Effective Federal Funds Rate
LIBOR = London Interbank Offered Rate
TBA = To-be-announced
USD/$ = U.S. dollars
See notes to financial statements.
| American Funds Insurance Series | 223 |
Ultra-Short Bond Fund
Investment portfolio December 31, 2020
| Short-term securities 99.10% | | Principal amount
(000) | | | Value
(000) | |
| Commercial paper 71.47% | | | | | | |
| Alberta (Province of) 0.16% due 1/15/20211 | | $ | 3,000 | | | $ | 3,000 | |
| Alberta (Province of) 0.16% due 2/8/20211 | | | 6,700 | | | | 6,699 | |
| Apple Inc. 0.12% due 1/8/20211 | | | 10,000 | | | | 10,000 | |
| Army and Air Force Exchange Service 0.10% due 1/8/20211 | | | 10,000 | | | | 9,999 | |
| Bank of Nova Scotia 0.20% due 1/26/20211 | | | 8,000 | | | | 7,999 | |
| British Columbia (Province of) 0.10% due 1/7/2021 | | | 8,600 | | | | 8,600 | |
| Caisse d’Amortissement de la Dette Sociale 0.17% due 1/20/2021 | | | 10,000 | | | | 9,999 | |
| Canadian Imperial Bank of Commerce 0.17% due 1/13/20211 | | | 8,300 | | | | 8,300 | |
| Chariot Funding, LLC 0.16% due 1/6/20211 | | | 10,000 | | | | 10,000 | |
| CHARTA, LLC 0.16% due 1/6/20211 | | | 10,000 | | | | 10,000 | |
| DBS Bank Ltd. 0.19% due 1/4/20211 | | | 10,000 | | | | 10,000 | |
| Denmark (Kingdom of) 0.13% due 1/25/2021 | | | 10,000 | | | | 9,999 | |
| Emerson Electric Co. 0.11% due 2/2/20211 | | | 7,000 | | | | 6,999 | |
| Equinor ASA 0.17% due 2/23/20211 | | | 7,500 | | | | 7,498 | |
| European Investment Bank 0.14% due 1/21/2021 | | | 9,500 | | | | 9,499 | |
| ExxonMobil Corp. 0.09% due 1/22/2021 | | | 4,100 | | | | 4,100 | |
| Fairway Finance Company, LLC 0.15% due 1/21/20211 | | | 3,700 | | | | 3,700 | |
| FMS Wertmanagement 0.21% due 3/10/20211 | | | 8,000 | | | | 7,997 | |
| L’Oréal USA, Inc. 0.08% due 1/19/20211 | | | 2,800 | | | | 2,800 | |
| LVMH Moët Hennessy Louis Vuitton Inc. 0.21% due 3/22/20211 | | | 9,500 | | | | 9,496 | |
| Merck & Co. Inc. 0.09% due 2/9/20211 | | | 10,000 | | | | 9,999 | |
| National Rural Utilities Cooperative Finance Corp. 0.11% due 1/7/2021 | | | 9,000 | | | | 9,000 | |
| NRW.Bank 0.15% due 1/6/20211 | | | 5,000 | | | | 5,000 | |
| OMERS Finance Trust 0.13% due 1/5/2021 | | | 9,000 | | | | 9,000 | |
| Paccar Financial Corp. 0.10% due 1/13/2021 | | | 3,500 | | | | 3,500 | |
| Paccar Financial Corp. 0.11% due 1/14/2021 | | | 2,500 | | | | 2,500 | |
| Shell International Finance BV 0.20% due 5/25/20211 | | | 7,000 | | | | 6,994 | |
| Siemens Capital Co. LLC 0.11% due 1/5/20211 | | | 4,000 | | | | 4,000 | |
| Sumitomo Mitsui Banking Corp. 0.21% due 2/23/20211 | | | 7,500 | | | | 7,498 | |
| Thunder Bay Funding, LLC 0.17% due 1/25/20211 | | | 10,000 | | | | 9,999 | |
| Toronto-Dominion Bank 0.21% due 1/28/20211 | | | 10,000 | | | | 9,999 | |
| Total Capital Canada Ltd. 0.19% due 2/17/20211 | | | 5,700 | | | | 5,699 | |
| Total Capital Canada Ltd. 0.19% due 2/23/20211 | | | 4,000 | | | | 3,999 | |
| Toyota Industries Commercial Finance, Inc. 0.16% due 1/15/20211 | | | 9,698 | | | | 9,698 | |
| Unilever Capital Corp. 0.12% due 1/26/20211 | | | 5,000 | | | | 5,000 | |
| Victory Receivables Corp. 0.19% due 2/22/20211 | | | 10,000 | | | | 9,997 | |
| | | | | | | | 268,566 | |
| | | | | | | | | |
| Federal agency bills & notes 16.21% | | | | | | | | |
| Federal Farm Credit Banks 0.07% due 1/20/2021 | | | 5,000 | | | | 5,000 | |
| Federal Farm Credit Banks 0.08% due 5/14/2021 | | | 5,000 | | | | 4,998 | |
| Federal Home Loan Bank 0.09% due 1/6/2021 | | | 6,700 | | | | 6,700 | |
| Federal Home Loan Bank 0.07% due 1/22/2021 | | | 8,000 | | | | 8,000 | |
| Federal Home Loan Bank 0.10% due 1/27/2021 | | | 10,000 | | | | 9,999 | |
| Federal Home Loan Bank 0.08% due 2/5/2021 | | | 5,000 | | | | 5,000 | |
| Federal Home Loan Bank 0.08% due 2/8/2021 | | | 9,700 | | | | 9,699 | |
| Federal Home Loan Bank 0.08% due 2/10/2021 | | | 11,500 | | | | 11,499 | |
| | | | | | | | 60,895 | |
| 224 | American Funds Insurance Series |
Ultra-Short Bond Fund (continued)
| Short-term securities (continued) | | Principal amount
(000) | | | Value
(000) | |
| U.S. Treasury bills 11.42% | | | | | | |
| U.S. Treasury 0.09% due 1/5/2021 | | $ | 6,600 | | | $ | 6,600 | |
| U.S. Treasury 0.09% due 2/4/2021 | | | 11,600 | | | | 11,599 | |
| U.S. Treasury 0.09% due 2/16/2021 | | | 8,000 | | | | 8,000 | |
| U.S. Treasury 0.09% due 3/4/2021 | | | 2,800 | | | | 2,799 | |
| U.S. Treasury 0.09% due 3/9/2021 | | | 3,800 | | | | 3,800 | |
| U.S. Treasury 0.10% due 4/13/2021 | | | 10,100 | | | | 10,098 | |
| | | | | | | | 42,896 | |
| Total short-term securities (cost: $372,351,000) | | | | | | | 372,357 | |
| Total investment securities 99.10% (cost: $372,351,000) | | | | | | | 372,357 | |
| Other assets less liabilities 0.90% | | | | | | | 3,392 | |
| | | | | | | | | |
| Net assets 100.00% | | | | | | $ | 375,749 | |
| 1 | Acquired in a transaction exempt from registration under Rule 144A or Section 4(2) of the Securities Act of 1933. May be resold in the U.S. in transactions exempt from registration, normally to qualified institutional buyers. The total value of all such securities was $202,368,000, which represented 53.86% of the net assets of the fund. |
See notes to financial statements.
| American Funds Insurance Series | 225 |
U.S. Government/AAA-Rated Securities Fund
Investment portfolio December 31, 2020
| Bonds, notes & other debt instruments 81.82% | | Principal amount
(000) | | | Value
(000) | |
| Mortgage-backed obligations 35.15% | | | | | | |
| Federal agency mortgage-backed obligations 35.10% | | | | | | | | |
| Fannie Mae Pool #257104 6.50% 20281 | | $ | 97 | | | $ | 108 | |
| Fannie Mae Pool #695412 5.00% 20331 | | | 1 | | | | 1 | |
| Fannie Mae Pool #AD3566 5.00% 20351 | | | 8 | | | | 9 | |
| Fannie Mae Pool #MA4228 1.50% 20361 | | | 24,617 | | | | 25,343 | |
| Fannie Mae Pool #MA4229 2.00% 20361 | | | 1,731 | | | | 1,811 | |
| Fannie Mae Pool #MA2746 4.00% 20361 | | | 2,283 | | | | 2,487 | |
| Fannie Mae Pool #MA2588 4.00% 20361 | | | 1,234 | | | | 1,344 | |
| Fannie Mae Pool #256860 6.50% 20371 | | | 20 | | | | 23 | |
| Fannie Mae Pool #888698 7.00% 20371 | | | 44 | | | | 51 | |
| Fannie Mae Pool #256828 7.00% 20371 | | | 4 | | | | 5 | |
| Fannie Mae Pool #970343 6.00% 20381 | | | 15 | | | | 16 | |
| Fannie Mae Pool #AC0794 5.00% 20391 | | | 38 | | | | 44 | |
| Fannie Mae Pool #931768 5.00% 20391 | | | 6 | | | | 8 | |
| Fannie Mae Pool #932606 5.00% 20401 | | | 20 | | | | 23 | |
| Fannie Mae Pool #AJ1873 4.00% 20411 | | | 29 | | | | 33 | |
| Fannie Mae Pool #AI1862 5.00% 20411 | | | 613 | | | | 713 | |
| Fannie Mae Pool #AI3510 5.00% 20411 | | | 361 | | | | 419 | |
| Fannie Mae Pool #AJ0704 5.00% 20411 | | | 327 | | | | 380 | |
| Fannie Mae Pool #AJ5391 5.00% 20411 | | | 187 | | | | 216 | |
| Fannie Mae Pool #AE1248 5.00% 20411 | | | 45 | | | | 52 | |
| Fannie Mae Pool #AE1274 5.00% 20411 | | | 36 | | | | 42 | |
| Fannie Mae Pool #AE1277 5.00% 20411 | | | 21 | | | | 24 | |
| Fannie Mae Pool #AE1283 5.00% 20411 | | | 13 | | | | 14 | |
| Fannie Mae Pool #AP7553 3.00% 20421 | | | 3,453 | | | | 3,695 | |
| Fannie Mae Pool #AE1290 5.00% 20421 | | | 25 | | | | 29 | |
| Fannie Mae Pool #AL3829 3.50% 20431 | | | 257 | | | | 281 | |
| Fannie Mae Pool #AT7161 3.50% 20431 | | | 114 | | | | 124 | |
| Fannie Mae Pool #AR1512 3.50% 20431 | | | 55 | | | | 60 | |
| Fannie Mae Pool #AT0412 3.50% 20431 | | | 28 | | | | 30 | |
| Fannie Mae Pool #AT3954 3.50% 20431 | | | 15 | | | | 16 | |
| Fannie Mae Pool #AT0300 3.50% 20431 | | | 12 | | | | 12 | |
| Fannie Mae Pool #BM6240 2.754% 20441,2 | | | 810 | | | | 846 | |
| Fannie Mae Pool #AY1829 3.50% 20441 | | | 20 | | | | 22 | |
| Fannie Mae Pool #AW8240 3.50% 20441 | | | 4 | | | | 4 | |
| Fannie Mae Pool #BE5017 3.50% 20451 | | | 142 | | | | 155 | |
| Fannie Mae Pool #BE5009 3.50% 20451 | | | 115 | | | | 124 | |
| Fannie Mae Pool #MA3120 3.50% 20471 | | | 5,723 | | | | 6,075 | |
| Fannie Mae Pool #BE8740 3.50% 20471 | | | 132 | | | | 144 | |
| Fannie Mae Pool #BE8742 3.50% 20471 | | | 39 | | | | 43 | |
| Fannie Mae Pool #BH2848 3.50% 20471 | | | 20 | | | | 22 | |
| Fannie Mae Pool #BH2846 3.50% 20471 | | | 16 | | | | 17 | |
| Fannie Mae Pool #BH2847 3.50% 20471 | | | 13 | | | | 14 | |
| Fannie Mae Pool #BJ5015 4.00% 20471 | | | 315 | | | | 347 | |
| Fannie Mae Pool #BH2597 4.00% 20471 | | | 10 | | | | 11 | |
| Fannie Mae Pool #BH3122 4.00% 20471 | | | 10 | | | | 11 | |
| Fannie Mae Pool #BM3788 3.50% 20481 | | | 8,392 | | | | 9,169 | |
| Fannie Mae Pool #FM3164 3.50% 20481 | | | 4,066 | | | | 4,291 | |
| Fannie Mae Pool #BJ4901 3.50% 20481 | | | 91 | | | | 99 | |
| Fannie Mae Pool #CA2850 4.00% 20481 | | | 363 | | | | 406 | |
| Fannie Mae Pool #BK6840 4.00% 20481 | | | 202 | | | | 222 | |
| Fannie Mae Pool #BK5232 4.00% 20481 | | | 162 | | | | 178 | |
| Fannie Mae Pool #BK9743 4.00% 20481 | | | 56 | | | | 61 | |
| Fannie Mae Pool #MA3416 4.50% 20481 | | | 4,016 | | | | 4,361 | |
| Fannie Mae Pool #BK7665 4.50% 20481 | | | 1,345 | | | | 1,493 | |
| Fannie Mae Pool #BK0951 4.50% 20481 | | | 1,027 | | | | 1,150 | |
| Fannie Mae Pool #BK9761 4.50% 20481 | | | 54 | | | | 60 | |
| Fannie Mae Pool #CA1909 4.50% 20481 | | | 49 | | | | 53 | |
| Fannie Mae Pool #CA4151 3.50% 20491 | | | 1,271 | | | | 1,401 | |
| Fannie Mae Pool #FM1062 3.50% 20491 | | | 774 | | | | 853 | |
| Fannie Mae Pool #FM1443 3.50% 20491 | | | 646 | | | | 709 | |
| Fannie Mae Pool #BJ8411 3.50% 20491 | | | 267 | | | | 293 | |
| 226 | American Funds Insurance Series |
U.S. Government/AAA-Rated Securities Fund (continued)
| Bonds, notes & other debt instruments (continued) | | Principal amount
(000) | | | Value
(000) | |
| Mortgage-backed obligations (continued) | | | | | | | | |
| Federal agency mortgage-backed obligations (continued) | | | | | | | | |
| Fannie Mae Pool #CA5229 3.00% 20501 | | $ | 27,582 | | | $ | 29,859 | |
| Fannie Mae Pool #FM2179 3.00% 20501 | | | 10,829 | | | | 11,643 | |
| Fannie Mae Pool #FM3834 4.50% 20501 | | | 2,462 | | | | 2,660 | |
| Fannie Mae Pool #MA4256 2.50% 20511 | | | 11 | | | | 12 | |
| Fannie Mae, Series 2001-4, Class NA, 9.011% 20251,2 | | | — | 3 | | | — | 3 |
| Fannie Mae, Series 2001-4, Class GA, 9.081% 20251,2 | | | — | 3 | | | — | 3 |
| Fannie Mae, Series 2012-M2, Class A2, Multi Family, 2.717% 20221 | | | 444 | | | | 452 | |
| Fannie Mae, Series 2012-M3, Class 1A2, Multi Family, 3.044% 20221 | | | 460 | | | | 470 | |
| Fannie Mae, Series 2014-M1, Class A2, Multi Family, 3.128% 20231,2 | | | 625 | | | | 660 | |
| Fannie Mae, Series 2014-M3, Class A2, Multi Family, 3.501% 20241,2 | | | 1,292 | | | | 1,397 | |
| Freddie Mac Pool #SB8083 1.50% 20361 | | | 2,805 | | | | 2,887 | |
| Freddie Mac Pool #SB8084 2.00% 20361 | | | 996 | | | | 1,042 | |
| Freddie Mac Pool #1H1354 2.442% 20361,2 | | | 137 | | | | 145 | |
| Freddie Mac Pool #C03518 5.00% 20401 | | | 590 | | | | 686 | |
| Freddie Mac Pool #G06459 5.00% 20411 | | | 1,175 | | | | 1,367 | |
| Freddie Mac Pool #Q18236 3.50% 20431 | | | 115 | | | | 125 | |
| Freddie Mac Pool #Q19133 3.50% 20431 | | | 73 | | | | 79 | |
| Freddie Mac Pool #Q17696 3.50% 20431 | | | 64 | | | | 70 | |
| Freddie Mac Pool #841039 3.54% 20431,2 | | | 832 | | | | 861 | |
| Freddie Mac Pool #Q23190 4.00% 20431 | | | 277 | | | | 308 | |
| Freddie Mac Pool #Q15874 4.00% 20431 | | | 7 | | | | 7 | |
| Freddie Mac Pool #Q28558 3.50% 20441 | | | 345 | | | | 378 | |
| Freddie Mac Pool #760014 3.116% 20451,2 | | | 630 | | | | 658 | |
| Freddie Mac Pool #Q52069 3.50% 20471 | | | 192 | | | | 209 | |
| Freddie Mac Pool #Q47615 3.50% 20471 | | | 90 | | | | 99 | |
| Freddie Mac Pool #ZM4352 3.50% 20471 | | | 17 | | | | 18 | |
| Freddie Mac Pool #Q55056 3.50% 20481 | | | 239 | | | | 259 | |
| Freddie Mac Pool #Q54709 3.50% 20481 | | | 144 | | | | 156 | |
| Freddie Mac Pool #Q54701 3.50% 20481 | | | 135 | | | | 147 | |
| Freddie Mac Pool #Q54782 3.50% 20481 | | | 118 | | | | 129 | |
| Freddie Mac Pool #Q54781 3.50% 20481 | | | 110 | | | | 120 | |
| Freddie Mac Pool #Q54700 3.50% 20481 | | | 105 | | | | 115 | |
| Freddie Mac Pool #Q55060 3.50% 20481 | | | 74 | | | | 80 | |
| Freddie Mac Pool #Q56591 3.50% 20481 | | | 70 | | | | 75 | |
| Freddie Mac Pool #Q56590 3.50% 20481 | | | 67 | | | | 73 | |
| Freddie Mac Pool #Q56589 3.50% 20481 | | | 64 | | | | 70 | |
| Freddie Mac Pool #Q54698 3.50% 20481 | | | 55 | | | | 61 | |
| Freddie Mac Pool #Q54699 3.50% 20481 | | | 51 | | | | 56 | |
| Freddie Mac Pool #Q54831 3.50% 20481 | | | 38 | | | | 42 | |
| Freddie Mac Pool #G67711 4.00% 20481 | | | 2,642 | | | | 2,914 | |
| Freddie Mac Pool #Q56599 4.00% 20481 | | | 228 | | | | 250 | |
| Freddie Mac Pool #Q56175 4.00% 20481 | | | 171 | | | | 188 | |
| Freddie Mac Pool #Q55971 4.00% 20481 | | | 152 | | | | 168 | |
| Freddie Mac Pool #Q56576 4.00% 20481 | | | 118 | | | | 126 | |
| Freddie Mac Pool #Q55970 4.00% 20481 | | | 75 | | | | 83 | |
| Freddie Mac Pool #Q58411 4.50% 20481 | | | 464 | | | | 516 | |
| Freddie Mac Pool #Q58436 4.50% 20481 | | | 209 | | | | 234 | |
| Freddie Mac Pool #Q58378 4.50% 20481 | | | 174 | | | | 191 | |
| Freddie Mac Pool #Q57242 4.50% 20481 | | | 122 | | | | 134 | |
| Freddie Mac Pool #ZT0522 4.50% 20481 | | | 61 | | | | 66 | |
| Freddie Mac Pool #ZS4774 4.50% 20481 | | | 56 | | | | 61 | |
| Freddie Mac Pool #RA1463 3.50% 20491 | | | 864 | | | | 953 | |
| Freddie Mac Pool #QA0284 3.50% 20491 | | | 372 | | | | 408 | |
| Freddie Mac Pool #RA1580 3.50% 20491 | | | 299 | | | | 332 | |
| Freddie Mac Pool #QA2748 3.50% 20491 | | | 115 | | | | 127 | |
| Freddie Mac Pool #RA2236 4.50% 20491 | | | 733 | | | | 796 | |
| Freddie Mac Pool #QA4453 4.50% 20491 | | | 47 | | | | 51 | |
| Freddie Mac Pool #QA8801 3.00% 20501 | | | 16,922 | | | | 18,221 | |
| Freddie Mac, Series 1567, Class A, (1-month USD-LIBOR + 0.40%) 0.559% 20231,2 | | | 6 | | | | 6 | |
| Freddie Mac, Series K031, Class A1, Multi Family, 2.778% 20221 | | | 202 | | | | 206 | |
| Freddie Mac, Series KS01, Class A2, Multi Family, 2.522% 20231 | | | 788 | | | | 811 | |
| American Funds Insurance Series | 227 |
U.S. Government/AAA-Rated Securities Fund (continued)
| Bonds, notes & other debt instruments (continued) | | Principal amount
(000) | | | Value
(000) | |
| Mortgage-backed obligations (continued) | | | | | | |
| Federal agency mortgage-backed obligations (continued) | | | | | | | | |
| Freddie Mac, Series K029, Class A2, Multi Family, 3.32% 20231 | | $ | 200 | | | $ | 212 | |
| Freddie Mac, Series K035, Class A2, Multi Family, 3.458% 20231,2 | | | 2,565 | | | | 2,757 | |
| Freddie Mac, Series K034, Class A2, Multi Family, 3.531% 20231 | | | 2,745 | | | | 2,955 | |
| Freddie Mac, Series K040, Class A2, Multi Family, 3.241% 20241 | | | 2,000 | | | | 2,197 | |
| Freddie Mac, Series K038, Class A2, Multi Family, 3.389% 20241 | | | 6,895 | | | | 7,513 | |
| Freddie Mac, Series K063, Class A2, Multi Family, 3.43% 20271 | | | 1,080 | | | | 1,243 | |
| Freddie Mac, Series K095, Class A1, Multi Family, 2.631% 20281 | | | 518 | | | | 566 | |
| Freddie Mac, Series K081, Class A2, Multi Family, 3.90% 20281,2 | | | 4,200 | | | | 5,055 | |
| Freddie Mac, Series K082, Class A2, Multi Family, 3.92% 20281,2 | | | 3,300 | | | | 3,985 | |
| Freddie Mac, Series K083, Class A2, Multi Family, 4.05% 20281,2 | | | 3,500 | | | | 4,261 | |
| Freddie Mac Seasoned Credit Risk Transfer Trust, Series 2017-2, Class MA, 3.00% 20561 | | | 8,362 | | | | 8,970 | |
| Freddie Mac Seasoned Credit Risk Transfer Trust, Series 2017-1, Class HA, 3.00% 20561,2 | | | 7,932 | | | | 8,337 | |
| Freddie Mac Seasoned Credit Risk Transfer Trust, Series 2017-2, Class HA, 3.00% 20561,2 | | | 7,589 | | | | 7,975 | |
| Freddie Mac Seasoned Credit Risk Transfer Trust, Series 2017-3, Class MT, 3.00% 20561 | | | 2,298 | | | | 2,466 | |
| Freddie Mac Seasoned Credit Risk Transfer Trust, Series 2017-3, Class HT, 3.25% 20561 | | | 447 | | | | 491 | |
| Freddie Mac Seasoned Credit Risk Transfer Trust, Series 2018-1, Class HT, 3.00% 20571 | | | 2,367 | | | | 2,567 | |
| Freddie Mac Seasoned Credit Risk Transfer Trust, Series 2017-4, Class HT, 3.25% 20571,2 | | | 4,382 | | | | 4,778 | |
| Freddie Mac Seasoned Credit Risk Transfer Trust, Series 2018-2, Class MT, 3.50% 20571 | | | 7,399 | | | | 8,080 | |
| Freddie Mac Seasoned Credit Risk Transfer Trust, Series 2018-3, Class MA, 3.50% 20571 | | | 5,672 | | | | 6,145 | |
| Freddie Mac Seasoned Credit Risk Transfer Trust, Series 2017-4, Class MT, 3.50% 20571 | | | 2,723 | | | | 2,973 | |
| Freddie Mac Seasoned Credit Risk Transfer Trust, Series 2018-2, Class MA, 3.50% 20571 | | | 1,183 | | | | 1,279 | |
| Freddie Mac Seasoned Credit Risk Transfer Trust, Series 2019-2, Class MA, 3.50% 20581 | | | 4,700 | | | | 5,122 | |
| Freddie Mac Seasoned Credit Risk Transfer Trust, Series 2019-1, Class MT, 3.50% 20581 | | | 2,695 | | | | 2,943 | |
| Freddie Mac Seasoned Credit Risk Transfer Trust, Series 2019-1, Class MA, 3.50% 20581 | | | 1,400 | | | | 1,522 | |
| Freddie Mac Seasoned Credit Risk Transfer Trust, Series 2019-2, Class MT, 3.50% 20581 | | | 1,005 | | | | 1,097 | |
| Freddie Mac Seasoned Credit Risk Transfer Trust, Series 2019-3, Class MT, 3.50% 20581 | | | 589 | | | | 648 | |
| Freddie Mac Seasoned Credit Risk Transfer Trust, Series 2019-4, Class MA, 3.00% 20591 | | | 5,350 | | | | 5,708 | |
| Freddie Mac Seasoned Loan Structured Transaction Trust, Series 2018-2, Class A1, 3.50% 20281 | | | 33,151 | | | | 35,072 | |
| Freddie Mac Seasoned Loan Structured Transaction Trust, Series 2018-1, Class A1, 3.50% 20281 | | | 7,871 | | | | 8,284 | |
| Freddie Mac Seasoned Loan Structured Transaction Trust, Series 2019-3, Class A1C, 2.75% 20291 | | | 9,710 | | | | 10,277 | |
| Freddie Mac Seasoned Loan Structured Transaction Trust, Series 2020-1, Class A1D, 2.00% 20301 | | | 3,111 | | | | 3,210 | |
| Freddie Mac Seasoned Loan Structured Transaction Trust, Series 2020-1, Class A2D, 2.00% 20301 | | | 535 | | | | 555 | |
| Government National Mortgage Assn. 5.50% 20381 | | | 162 | | | | 185 | |
| Government National Mortgage Assn. 5.50% 20381 | | | 46 | | | | 51 | |
| Government National Mortgage Assn. 2.00% 20511,4 | | | 11,627 | | | | 12,139 | |
| Government National Mortgage Assn. 2.00% 20511,4 | | | 9,780 | | | | 10,194 | |
| Government National Mortgage Assn. 2.50% 20511,4 | | | 460 | | | | 485 | |
| Government National Mortgage Assn. 3.00% 20511,4 | | | 800 | | | | 837 | |
| Government National Mortgage Assn. 3.50% 20511,4 | | | 22,750 | | | | 24,105 | |
| Government National Mortgage Assn. 3.50% 20511,4 | | | 22,662 | | | | 23,998 | |
| Government National Mortgage Assn. Pool #699537 5.50% 20381 | | | 94 | | | | 105 | |
| Government National Mortgage Assn. Pool #700778 5.50% 20381 | | | 25 | | | | 29 | |
| Government National Mortgage Assn. Pool #782365 6.00% 20381 | | | 149 | | | | 179 | |
| Government National Mortgage Assn. Pool #004269 6.50% 20381 | | | 260 | | | | 305 | |
| Government National Mortgage Assn. Pool #698406 5.00% 20391 | | | 317 | | | | 359 | |
| Government National Mortgage Assn. Pool #783690 6.00% 20391 | | | 134 | | | | 155 | |
| Government National Mortgage Assn. Pool #783689 5.50% 20401 | | | 3,959 | | | | 4,560 | |
| Government National Mortgage Assn. Pool #783687 4.50% 20411 | | | 880 | | | | 952 | |
| Government National Mortgage Assn. Pool #783688 5.00% 20411 | | | 1,546 | | | | 1,743 | |
| Government National Mortgage Assn. Pool #MA0533 3.00% 20421 | | | 32 | | | | 35 | |
| Government National Mortgage Assn. Pool #MA1012 3.50% 20431 | | | 1,119 | | | | 1,223 | |
| Government National Mortgage Assn. Pool #MA5764 4.50% 20491 | | | 10,111 | | | | 10,944 | |
| Government National Mortgage Assn. Pool #MA5877 4.50% 20491 | | | 4,528 | | | | 4,898 | |
| Government National Mortgage Assn. Pool #MA6092 4.50% 20491 | | | 769 | | | | 829 | |
| Government National Mortgage Assn. Pool #MA7052 2.50% 20501 | | | 6,040 | | | | 6,400 | |
| Uniform Mortgage-Backed Security 1.50% 20361,4 | | | 119,476 | | | | 122,702 | |
| 228 | American Funds Insurance Series |
U.S. Government/AAA-Rated Securities Fund (continued)
| Bonds, notes & other debt instruments (continued) | | Principal amount
(000) | | | Value
(000) | |
| Mortgage-backed obligations (continued) | | | | | | |
| Federal agency mortgage-backed obligations (continued) | | | | | | |
| Uniform Mortgage-Backed Security 1.50% 20361,4 | | $ | 89,298 | | | $ | 91,755 | |
| Uniform Mortgage-Backed Security 2.00% 20361,4 | | | 70,158 | | | | 73,272 | |
| Uniform Mortgage-Backed Security 2.00% 20511,4 | | | 16,809 | | | | 17,401 | |
| Uniform Mortgage-Backed Security 2.00% 20511,4 | | | 9,414 | | | | 9,761 | |
| Uniform Mortgage-Backed Security 2.50% 20511,4 | | | 451 | | | | 474 | |
| Uniform Mortgage-Backed Security 2.50% 20511,4 | | | 339 | | | | 357 | |
| Uniform Mortgage-Backed Security 3.00% 20511,4 | | | 2 | | | | 2 | |
| Uniform Mortgage-Backed Security 3.50% 20511,4 | | | 20,663 | | | | 21,871 | |
| | | | | | | | 755,912 | |
| | | | | | | | | |
| Collateralized mortgage-backed obligations 0.05% | | | | | | | | |
| Vendee Mortgage Trust, Series 2010-1, Class DA, 4.25% 20351 | | | 1,050 | | | | 1,063 | |
| | | | | | | | | |
| Total mortgage-backed obligations | | | | | | | 756,975 | |
| | | | | | | | | |
| U.S. Treasury bonds & notes 30.83% | | | | | | | | |
| U.S. Treasury 24.25% | | | | | | | | |
| U.S. Treasury 1.375% 2022 | | | 3,100 | | | | 3,142 | |
| U.S. Treasury 1.75% 2022 | | | 32,093 | | | | 32,831 | |
| U.S. Treasury 2.125% 2023 | | | — | 3 | | | — | 3 |
| U.S. Treasury 2.875% 2023 | | | 5,000 | | | | 5,394 | |
| U.S. Treasury 0.25% 2025 | | | 65,000 | | | | 64,801 | |
| U.S. Treasury 0.25% 2025 | | | 4,000 | | | | 3,984 | |
| U.S. Treasury 0.375% 2025 | | | 10,000 | | | | 10,013 | |
| U.S. Treasury 1.625% 2026 | | | 10,000 | | | | 10,665 | |
| U.S. Treasury 0.50% 2027 | | | 5,314 | | | | 5,280 | |
| U.S. Treasury 0.625% 2030 | | | 1,175 | | | | 1,145 | |
| U.S. Treasury 1.125% 2040 | | | 10,750 | | | | 10,176 | |
| U.S. Treasury 1.125% 2040 | | | 7,000 | | | | 6,644 | |
| U.S. Treasury 2.50% 2046 | | | 5,400 | | | | 6,453 | |
| U.S. Treasury 2.50% 2046 | | | 3,900 | | | | 4,659 | |
| U.S. Treasury 2.875% 2046 | | | 2,700 | | | | 3,450 | |
| U.S. Treasury 2.25% 20495 | | | 25,700 | | | | 29,416 | |
| U.S. Treasury 2.375% 2049 | | | 13,000 | | | | 15,271 | |
| U.S. Treasury 2.875% 20495 | | | 26,000 | | | | 33,565 | |
| U.S. Treasury 3.00% 20495 | | | 22,500 | | | | 29,670 | |
| U.S. Treasury 1.25% 20505 | | | 46,500 | | | | 42,173 | |
| U.S. Treasury 1.375% 20505 | | | 100,000 | | | | 93,575 | |
| U.S. Treasury 1.625% 20505 | | | 110,500 | | | | 109,973 | |
| | | | | | | | 522,280 | |
| | | | | | | | | |
| U.S. Treasury inflation-protected securities 6.58% | | | | | | | | |
| U.S. Treasury Inflation-Protected Security 0.125% 20216 | | | 65,918 | | | | 66,164 | |
| U.S. Treasury Inflation-Protected Security 0.125% 20226 | | | 6,097 | | | | 6,209 | |
| U.S. Treasury Inflation-Protected Security 0.125% 20306 | | | 27,420 | | | | 30,761 | |
| U.S. Treasury Inflation-Protected Security 0.125% 20306 | | | 6,222 | | | | 6,940 | |
| U.S. Treasury Inflation-Protected Security 2.125% 20416 | | | 369 | | | | 579 | |
| U.S. Treasury Inflation-Protected Security 0.75% 20425,6 | | | 15,199 | | | | 19,375 | |
| U.S. Treasury Inflation-Protected Security 1.00% 20496 | | | 8,278 | | | | 11,674 | |
| | | | | | | | 141,702 | |
| | | | | | | | | |
| Total U.S. Treasury bonds & notes | | | | | | | 663,982 | |
| | | | | | | | | |
| Federal agency bonds & notes 15.84% | | | | | | | | |
| Export-Import Bank of the United States-Guaranteed, Ethiopian Leasing 2012 LLC 2.646% 2026 | | | 483 | | | | 508 | |
| Fannie Mae 1.25% 2021 | | | 2,900 | | | | 2,921 | |
| Fannie Mae 2.875% 2023 | | | 36,000 | | | | 38,605 | |
| Fannie Mae 0.625% 2025 | | | 10,000 | | | | 10,116 | |
| American Funds Insurance Series | 229 |
U.S. Government/AAA-Rated Securities Fund (continued)
| Bonds, notes & other debt instruments (continued) | | Principal amount
(000) | | | Value
(000) | |
| Federal agency bonds & notes (continued) | | | | | | | | |
| Fannie Mae 0.75% 2027 | | $ | 2,900 | | | $ | 2,916 | |
| Fannie Mae 0.875% 2030 | | | 8,600 | | | | 8,438 | |
| Fannie Mae 7.125% 2030 | | | 2,000 | | | | 3,059 | |
| Federal Farm Credit Banks 0.375% 2022 | | | 1,500 | | | | 1,505 | |
| Federal Home Loan Bank 3.375% 2023 | | | 16,715 | | | | 18,125 | |
| Federal Home Loan Bank 3.25% 2028 | | | 6,500 | | | | 7,745 | |
| Federal Home Loan Bank 5.50% 2036 | | | 300 | | | | 464 | |
| Freddie Mac 2.375% 2021 | | | 40,000 | | | | 40,108 | |
| Private Export Funding Corp. 3.266% 20217 | | | 34,000 | | | | 34,886 | |
| Private Export Funding Corp. 3.55% 2024 | | | 3,190 | | | | 3,500 | |
| Small Business Administration, Series 2001-20F, 6.44% 2021 | | | 7 | | | | 7 | |
| Tennessee Valley Authority, Series A, 3.875% 2021 | | | 32,975 | | | | 33,117 | |
| Tennessee Valley Authority 0.75% 2025 | | | 1,800 | | | | 1,828 | |
| Tennessee Valley Authority 2.875% 2027 | | | 5,000 | | | | 5,639 | |
| Tennessee Valley Authority 4.65% 2035 | | | 1,780 | | | | 2,472 | |
| Tennessee Valley Authority 5.88% 2036 | | | 875 | | | | 1,340 | |
| Tennessee Valley Authority, Series A, 4.625% 2060 | | | 250 | | | | 391 | |
| TVA Southaven 3.846% 2033 | | | 1,112 | | | | 1,214 | |
| U.S. Agency for International Development, Iraq (State of) 2.149% 2022 | | | 3,370 | | | | 3,439 | |
| U.S. Agency for International Development, Jordan (Kingdom of) 2.578% 2022 | | | 41,500 | | | | 42,998 | |
| U.S. Agency for International Development, Jordan (Kingdom of) 3.00% 2025 | | | 14,779 | | | | 16,354 | |
| U.S. Agency for International Development, Morocco (Kingdom of) 7.55% 2026 | | | 2,669 | | | | 3,168 | |
| U.S. Agency for International Development, Tunisia (Kingdom of) 1.416% 2021 | | | 1,500 | | | | 1,513 | |
| U.S. Agency for International Development, Ukraine 1.471% 2021 | | | 2,210 | | | | 2,234 | |
| U.S. Department of Housing and Urban Development, Series 2015-A-7, 2.35% 2021 | | | 3,750 | | | | 3,799 | |
| U.S. Department of Housing and Urban Development, Series 2015-A-8, 2.45% 2022 | | | 6,000 | | | | 6,212 | |
| U.S. Department of Housing and Urban Development, Series 2015-A-9, 2.80% 2023 | | | 1,500 | | | | 1,599 | |
| U.S. Department of Housing and Urban Development, Series 2015-A-10, 2.85% 2024 | | | 2,250 | | | | 2,455 | |
| U.S. Department of Housing and Urban Development, Series 2015-A-11, 2.95% 2025 | | | 2,640 | | | | 2,892 | |
| U.S. Department of Housing and Urban Development, Series 2015-A-12, 3.10% 2026 | | | 2,625 | | | | 2,889 | |
| U.S. Department of Housing and Urban Development, Series 2015-A-13, 3.15% 2027 | | | 11,482 | | | | 12,649 | |
| U.S. Department of Housing and Urban Development, Series 2015-A-14, 3.25% 2028 | | | 3,856 | | | | 4,259 | |
| U.S. Department of Housing and Urban Development, Series 2015-A-15, 3.35% 2029 | | | 2,650 | | | | 2,934 | |
| U.S. Department of Housing and Urban Development, Series 2015-A-16, 3.50% 2030 | | | 2,482 | | | | 2,729 | |
| U.S. Department of Housing and Urban Development, Series 2015-A-17, 3.55% 2031 | | | 2,475 | | | | 2,726 | |
| U.S. Department of Housing and Urban Development, Series 2015-A-18, 3.60% 2032 | | | 2,377 | | | | 2,621 | |
| U.S. Department of Housing and Urban Development, Series 2015-A-19, 3.65% 2033 | | | 2,059 | | | | 2,275 | |
| U.S. Department of Housing and Urban Development, Series 2015-A-20, 3.70% 2034 | | | 651 | | | | 720 | |
| U.S. Government-Guaranteed Certificates of Participation, Overseas Private Investment Corp. 3.82% 2032 | | | 833 | | | | 994 | |
| U.S. Government-Guaranteed Certificates of Participation, Overseas Private Investment Corp. 3.938% 2032 | | | 681 | | | | 792 | |
| | | | | | | | 341,155 | |
| | | | | | | | | |
| Total bonds, notes & other debt instruments (cost: $1,717,324,000) | | | | | | | 1,762,112 | |
| | | | | | | | | |
| | | | | | | | | |
| Short-term securities 33.97% | | | | | | | | |
| Commercial paper 25.22% | | | | | | | | |
| Amazon.com, Inc. 0.08% due 1/25/20217 | | | 15,000 | | | | 14,999 | |
| Apple Inc. 0.10%–0.11% due 1/21/2021–1/29/20217 | | | 40,700 | | | | 40,698 | |
| Army and Air Force Exchange Service 0.11% due 1/7/20217 | | | 11,700 | | | | 11,699 | |
| Atlantic Asset Securitization LLC 0.16% due 1/11/20217 | | | 12,000 | | | | 11,999 | |
| CAFCO, LLC 0.16% due 1/4/20217 | | | 25,000 | | | | 25,000 | |
| Chariot Funding, LLC 0.16%–0.20% due 1/11/2021–2/12/20217 | | | 46,000 | | | | 45,992 | |
| Chevron Corp. 0.08%–0.12% due 1/7/2021–2/26/20217 | | | 46,800 | | | | 46,794 | |
| CRC Funding, LLC 0.16%–0.17% due 1/4/2021–1/22/20217 | | | 35,000 | | | | 34,997 | |
| Emerson Electric Co. 0.12%–0.13% due 1/14/2021–1/26/20217 | | | 52,650 | | | | 52,647 | |
| ExxonMobil Corp. 0.12%–0.15% due 1/5/2021–2/17/2021 | | | 45,000 | | | | 44,996 | |
| 230 | American Funds Insurance Series |
U.S. Government/AAA-Rated Securities Fund (continued)
| Short-term securities (continued) | | Principal amount
(000) | | | Value
(000) | |
| Commercial paper (continued) | | | | | | |
| Johnson & Johnson 0.11% due 6/1/20217 | | $ | 26,000 | | | $ | 25,985 | |
| Kaiser Foundation Hospitals 0.18% due 5/4/2021 | | | 17,000 | | | | 16,983 | |
| Merck & Co. Inc. 0.09%–0.12% due 1/22/2021–2/19/20217 | | | 46,000 | | | | 45,995 | |
| National Rural Utilities Cooperative Finance Corp. 0.12% due 2/4/2021 | | | 10,000 | | | | 9,999 | |
| Paccar Financial Corp. 0.11%–0.12% due 1/19/2021–2/3/2021 | | | 33,500 | | | | 33,498 | |
| PepsiCo Inc. 0.15% due 3/1/20217 | | | 3,000 | | | | 2,999 | |
| Pfizer Inc. 0.10% due 1/7/20217 | | | 28,800 | | | | 28,800 | |
| Regents of the University of California 0.17% due 2/18/2021 | | | 18,500 | | | | 18,496 | |
| Sumitomo Mitsui Banking Corp. 0.15% due 2/3/20217 | | | 30,500 | | | | 30,496 | |
| | | | | | | | 543,072 | |
| | | | | | | | | |
| Federal agency bills & notes 8.29% | | | | | | | | |
| Federal Farm Credit Banks 0.07%–0.10% due 1/7/2021–5/5/2021 | | | 83,300 | | | | 83,289 | |
| Federal Home Loan Bank 0.07%–0.09% due 1/4/2021–2/9/2021 | | | 95,200 | | | | 95,195 | |
| | | | | | | | 178,484 | |
| | | | | | | | | |
| U.S. Treasury bills 0.46% | | | | | | | | |
| U.S. Treasury 0.09% due 1/14/2021 | | | 10,000 | | | | 10,000 | |
| | | | | | | | | |
| Total short-term securities (cost: $731,564,000) | | | | | | | 731,556 | |
| Total investment securities 115.79% (cost: $2,448,888,000) | | | | | | | 2,493,668 | |
| Other assets less liabilities (15.79)% | | | | | | | (340,011 | ) |
| | | | | | | | | |
| Net assets 100.00% | | | | | | $ | 2,153,657 | |
Futures contracts
| Contracts | | Type | | Number of
contracts | | Expiration | | Notional
amount8
(000) | | Value at
12/31/20209
(000) | | Unrealized
appreciation
(depreciation)
at 12/31/2020
(000) | |
| 30 Day Federal Funds Futures | | Short | | 759 | | January 2021 | | $ | (316,275 | ) | | $ | (316,022 | ) | | $ | 173 | |
| 90 Day Euro Dollar Futures | | Short | | 1,703 | | March 2021 | | | (425,750 | ) | | | (425,026 | ) | | | (173 | ) |
| 2 Year U.S. Treasury Note Futures | | Short | | 195 | | April 2021 | | | (39,000 | ) | | | (43,090 | ) | | | (41 | ) |
| 5 Year U.S. Treasury Note Futures | | Long | | 1,142 | | April 2021 | | | 114,200 | | | | 144,079 | | | | 307 | |
| 10 Year U.S. Treasury Note Futures | | Short | | 1,087 | | March 2021 | | | (108,700 | ) | | | (150,091 | ) | | | (178 | ) |
| 10 Year Ultra U.S. Treasury Note Futures | | Short | | 2,164 | | March 2021 | | | (216,400 | ) | | | (338,362 | ) | | | 755 | |
| 20 Year U.S. Treasury Bond Futures | | Long | | 214 | | March 2021 | | | 21,400 | | | | 37,062 | | | | (336 | ) |
| 30 Year Ultra U.S. Treasury Bond Futures | | Long | | 695 | | March 2021 | | | 69,500 | | | | 148,426 | | | | (547 | ) |
| | | | | | | | | | | | | | | | | $ | (40 | ) |
| American Funds Insurance Series | 231 |
U.S. Government/AAA-Rated Securities Fund (continued)
Swap contracts
Interest rate swaps
| Receive | | Pay | | Expiration
date | | Notional
(000) | | | Value at
12/31/2020
(000) | | | Upfront
premium
paid (received)
(000) | | | Unrealized
appreciation
(depreciation)
at 12/31/2020
(000) | |
| 2.5775% | | U.S. EFFR | | 7/16/2022 | | $ | 181,639 | | | $ | 4,629 | | | $ | — | | | $ | 4,629 | |
| 1.2525% | | U.S. EFFR | | 2/14/2023 | | | 156,941 | | | | 3,951 | | | | — | | | | 3,951 | |
| U.S. EFFR | | 0.11% | | 5/18/2024 | | | 163,600 | | | | 187 | | | | — | | | | 187 | |
| U.S. EFFR | | 0.1275% | | 6/25/2025 | | | 48,600 | | | | 188 | | | | — | | | | 188 | |
| U.S. EFFR | | 0.126% | | 6/25/2025 | | | 20,100 | | | | 79 | | | | — | | | | 79 | |
| U.S. EFFR | | 0.106% | | 6/30/2025 | | | 35,063 | | | | 173 | | | | — | | | | 173 | |
| U.S. EFFR | | 0.105% | | 6/30/2025 | | | 28,500 | | | | 142 | | | | — | | | | 142 | |
| U.S. EFFR | | 0.0975% | | 6/30/2025 | | | 15,429 | | | | 82 | | | | — | | | | 82 | |
| 3-month USD-LIBOR | | 1.867% | | 7/11/2025 | | | 49,400 | | | | (2,059 | ) | | | — | | | | (2,059 | ) |
| 2.91% | | 3-month USD-LIBOR | | 2/1/2028 | | | 16,000 | | | | 1,613 | | | | — | | | | 1,613 | |
| 2.908% | | 3-month USD-LIBOR | | 2/1/2028 | | | 16,000 | | | | 1,611 | | | | — | | | | 1,611 | |
| 2.925% | | 3-month USD-LIBOR | | 2/1/2028 | | | 12,800 | | | | 1,300 | | | | — | | | | 1,300 | |
| 2.92% | | 3-month USD-LIBOR | | 2/2/2028 | | | 12,200 | | | | 1,236 | | | | — | | | | 1,236 | |
| U.S. EFFR | | 0.5385% | | 3/26/2030 | | | 49,000 | | | | 658 | | | | — | | | | 658 | |
| 0.913% | | 3-month USD-LIBOR | | 6/9/2030 | | | 31,000 | | | | 93 | | | | — | | | | 93 | |
| U.S. EFFR | | 0.666% | | 11/19/2030 | | | 15,500 | | | | 107 | | | | — | | | | 107 | |
| 3-month USD-LIBOR | | 2.986% | | 2/1/2038 | | | 7,800 | | | | (892 | ) | | | — | | | | (892 | ) |
| 3-month USD-LIBOR | | 2.9625% | | 2/1/2038 | | | 9,800 | | | | (1,100 | ) | | | — | | | | (1,100 | ) |
| 3-month USD-LIBOR | | 2.963% | | 2/1/2038 | | | 9,800 | | | | (1,100 | ) | | | — | | | | (1,100 | ) |
| 0.833% | | 3-month USD-LIBOR | | 4/3/2040 | | | 15,800 | | | | (1,319 | ) | | | — | | | | (1,319 | ) |
| 3-month USD-LIBOR | | 0.81% | | 7/28/2045 | | | 87,600 | | | | 10,704 | | | | (52 | ) | | | 10,756 | |
| 0.8235% | | 3-month USD-LIBOR | | 4/24/2050 | | | 5,300 | | | | (776 | ) | | | — | | | | (776 | ) |
| 3-month USD-LIBOR | | 0.811% | | 7/27/2050 | | | 52,500 | | | | 7,921 | | | | — | | | | 7,921 | |
| | | | | | | | | | | | | | | $ | (52 | ) | | $ | 27,480 | |
The following footnotes apply to either the individual securities noted or one or more of the securities aggregated and listed as a single line item.
| 1 | Principal payments may be made periodically. Therefore, the effective maturity date may be earlier than the stated maturity date. |
| 2 | Coupon rate may change periodically. Reference rate and spread are as of the most recent information available. Some coupon rates are determined by the issuer or agent based on current market conditions; therefore, the reference rate and spread are not available. |
| 3 | Amount less than one thousand. |
| 4 | Purchased on a TBA basis. |
| 5 | All or a portion of this security was pledged as collateral. The total value of pledged collateral was $22,183,000, which represented 1.03% of the net assets of the fund. |
| 6 | Index-linked bond whose principal amount moves with a government price index. |
| 7 | Acquired in a transaction exempt from registration under Rule 144A or Section 4(2) of the Securities Act of 1933. May be resold in the U.S. in transactions exempt from registration, normally to qualified institutional buyers. The total value of all such securities was $453,986,000, which represented 21.08% of the net assets of the fund. |
| 8 | Notional amount is calculated based on the number of contracts and notional contract size. |
| 9 | Value is calculated based on the notional amount and current market price. |
Key to abbreviations and symbol
EFFR = Effective Federal Funds Rate
LIBOR = London Interbank Offered Rate
TBA = To-be-announced
USD/$ = U.S. dollars
See notes to financial statements.
| 232 | American Funds Insurance Series |
Managed Risk Growth Fund
Investment portfolio December 31, 2020
| Growth funds 80.18% | | Shares | | | Value
(000) | |
| American Funds Insurance Series – Growth Fund, Class 1 | | | 3,764,738 | | | $ | 452,559 | |
| | | | | | | | | |
| Total growth funds (cost: $296,745,000) | | | | | | | 452,559 | |
| | | | | | | | | |
| Fixed income funds 15.04% | | | | | | | | |
| American Funds Insurance Series – Bond Fund, Class 1 | | | 7,142,308 | | | | 84,922 | |
| | | | | | | | | |
| Total fixed income funds (cost: $84,212,000) | | | | | | | 84,922 | |
| | | | | | | | | |
| Short-term securities 4.84% | | | | | | | | |
| State Street Institutional U.S. Government Money Market Fund, Premier Class 0.03%1 | | | 27,316,055 | | | | 27,316 | |
| | | | | | | | | |
| Total short-term securities (cost: $27,316,000) | | | | | | | 27,316 | |
| Total investment securities 100.06% (cost: $408,273,000) | | | | | | | 564,797 | |
| Other assets less liabilities (0.06)% | | | | | | | (351 | ) |
| | | | | | | | | |
| Net assets 100.00% | | | | | | $ | 564,446 | |
Futures contracts
| Contracts | | Type | | Number of
contracts | | Expiration | | Notional
amount
(000) | 2
| | Value at
12/31/2020
(000) | 3
| Unrealized
appreciation
at 12/31/2020
(000) | |
| 5 Year U.S. Treasury Note Futures | | Long | | 242 | | March 2021 | | $ | 24,200 | | | $ | 30,532 | | | | $69 | |
Investments in affiliates4
| | | Value of
affiliates at
1/1/2020
(000) | | | Additions
(000) | | | Reductions
(000) | | | Net
realized
gain
(000) | | | Net
unrealized
appreciation
(depreciation)
(000) | | | Value of
affiliates at
12/31/2020
(000) | | | Dividend
income
(000) | | | Capital gain
distributions
received
(000) | |
| Growth funds 80.18% | | | | | | | | | | | | | | | | | | | | | | | | | | | |
| American Funds Insurance Series – Growth Fund, Class 1 | | $ | 358,426 | | | $ | 260,676 | | | $ | 327,558 | | | $ | 49,300 | | | $ | 111,715 | | | $ | 452,559 | | | $ | 2,083 | | | $ | 9,098 | |
| Fixed income funds 15.04% | | | | | | | | | | | | | | | | | | | | | | | | |
| American Funds Insurance Series – Bond Fund, Class 1 | | | 66,685 | | | | 100,237 | | | | 84,848 | | | | 4,035 | | | | (1,187 | ) | | | 84,922 | | | | 1,784 | | | | 580 | |
| Total 95.22% | | | | | | | | | | | | | | $ | 53,335 | | | $ | 110,528 | | | $ | 537,481 | | | $ | 3,867 | | | $ | 9,678 | |
| 1 | Rate represents the seven-day yield at 12/31/2020. |
| 2 | Notional amount is calculated based on the number of contracts and notional contract size. |
| 3 | Value is calculated based on the notional amount and current market price. |
| 4 | Part of the same group of investment companies as the fund as defined under the Investment Company Act of 1940. |
See notes to financial statements.
| American Funds Insurance Series | 233 |
Managed Risk International Fund
Investment portfolio December 31, 2020
| Growth funds 80.05% | | Shares | | | Value
(000) | |
| American Funds Insurance Series – International Fund, Class 1 | | | 5,742,124 | | | $ | 135,744 | |
| | | | | | | | | |
| Total growth funds (cost: $102,112,000) | | | | | | | 135,744 | |
| | | | | | | | | |
| Fixed income funds 15.02% | | | | | | | | |
| American Funds Insurance Series – Bond Fund, Class 1 | | | 2,142,314 | | | | 25,472 | |
| | | | | | | | | |
| Total fixed income funds (cost: $25,280,000) | | | | | | | 25,472 | |
| | | | | | | | | |
| Short-term securities 4.73% | | | | | | | | |
| State Street Institutional U.S. Government Money Market Fund, Premier Class 0.03%1 | | | 8,021,459 | | | | 8,021 | |
| | | | | | | | | |
| Total short-term securities (cost: $8,021,000) | | | | | | | 8,021 | |
| Total investment securities 99.80% (cost: $135,413,000) | | | | | | | 169,237 | |
| Other assets less liabilities 0.20% | | | | | | | 332 | |
| | | | | | | | | |
| Net assets 100.00% | | | | | | $ | 169,569 | |
Futures contracts
| Contracts | | Type | | Number of
contracts | | Expiration | | Notional
amount
(000) | 2 | | Value at
12/31/2020
(000) | 3 | Unrealized
appreciation
at 12/31/2020
(000) | |
| 5 Year U.S. Treasury Note Futures | | Long | | 72 | | March 2021 | | $ | 7,200 | | | $ | 9,084 | | | | $21 | |
Investments in affiliates4
| | | Value of
affiliates at
1/1/2020
(000) | | | Additions
(000) | | | Reductions
(000) | | | Net
realized
(loss) gain
(000) | | | Net
unrealized
appreciation
(depreciation)
(000) | | | Value of
affiliates at
12/31/2020
(000) | | | Dividend
income
(000) | | | Capital gain
distributions
received
(000) | |
| Growth funds 80.05% | | | | | | | | | | | | | | | | | | | | | | | | | | | | |
| American Funds Insurance Series – International Fund, Class 1 | | $ | 133,862 | | | $ | 72,083 | | | $ | 88,432 | | | $ | (1,268 | ) | | $ | 19,499 | | | $ | 135,744 | | | $ | 1,092 | | | $ | — | |
| Fixed income funds 15.02% | | | | | | | | | | | | | | | | | | | | | | | | | | | |
| American Funds Insurance Series – Bond Fund, Class 1 | | | 24,465 | | | | 30,573 | | | | 30,185 | | | | 1,103 | | | | (484 | ) | | | 25,472 | | | | 529 | | | | 159 | |
| Total 95.07% | | | | | | | | | | | | | | $ | (165 | ) | | $ | 19,015 | | | $ | 161,216 | | | $ | 1,621 | | | $ | 159 | |
| 1 | Rate represents the seven-day yield at 12/31/2020. |
| 2 | Notional amount is calculated based on the number of contracts and notional contract size. |
| 3 | Value is calculated based on the notional amount and current market price. |
| 4 | Part of the same group of investment companies as the fund as defined under the Investment Company Act of 1940. |
See notes to financial statements.
| 234 | American Funds Insurance Series |
Managed Risk Blue Chip Income and Growth Fund
Investment portfolio December 31, 2020
| Growth-and-income funds 80.10% | | Shares | | | Value
(000) | |
| American Funds Insurance Series – Blue Chip Income and Growth Fund, Class 1 | | | 19,891,981 | | | $ | 285,450 | |
| | | | | | | | | |
| Total growth-and-income funds (cost: $223,384,000) | | | | | | | 285,450 | |
| | | | | | | | | |
| Fixed income funds 15.03% | | | | | | | | |
| American Funds Insurance Series – U.S. Government/AAA-Rated Securities Fund, Class 1 | | | 4,107,687 | | | | 53,565 | |
| | | | | | | | | |
| Total fixed income funds (cost: $54,284,000) | | | | | | | 53,565 | |
| | | | | | | | | |
| Short-term securities 4.92% | | | | | | | | |
| State Street Institutional U.S. Government Money Market Fund, Premier Class 0.03%1 | | | 17,540,474 | | | | 17,540 | |
| | | | | | | | | |
| Total short-term securities (cost: $17,540,000) | | | | | | | 17,540 | |
| Total investment securities 100.05% (cost: $295,208,000) | | | | | | | 356,555 | |
| Other assets less liabilities (0.05)% | | | | | | | (195 | ) |
| | | | | | | | | |
| Net assets 100.00% | | | | | | $ | 356,360 | |
Futures contracts
| Contracts | | Type | | Number of
contracts | | Expiration | | Notional
amount
(000) | 2 | | Value at
12/31/2020
(000) | 3 | Unrealized
appreciation
at 12/31/2020
(000) | |
| 5 Year U.S. Treasury Note Futures | | Long | | 167 | | March 2021 | | $ | 16,700 | | | $ | 21,069 | | | | $38 | |
Investments in affiliates4
| | | | Value of
affiliates at
1/1/2020
(000) | | | | Additions
(000) | | | | Reductions
(000) | | | | Net
realized
(loss) gain
(000) | | | | Net
unrealized
appreciation
(depreciation)
(000) | | | | Value of
affiliates at
12/31/2020
(000) | | | | Dividend
income
(000) | | | | Capital gain
distributions
received
(000) | |
| Growth-and-income funds 80.10% | | | | | | | | | | | | | | | | | | | | | | | | | | | | |
| American Funds Insurance Series – Blue Chip Income and Growth Fund, Class 1 | | $ | 299,536 | | | $ | 237,327 | | | $ | 269,536 | | | $ | (40,214 | ) | | $ | 58,337 | | | $ | 285,450 | | | $ | 5,176 | | | $ | 3,353 | |
| Fixed income funds 15.03% | | | | | | | | | | | | | | | | | | | | | | | | | | | | |
| American Funds Insurance Series – U.S. Government/AAA-Rated Securities Fund, Class 1 | | | 53,524 | | | | 87,643 | | | | 90,377 | | | | 4,226 | | | | (1,451 | ) | | | 53,565 | | | | 1,038 | | | | 976 | |
| Total 95.13% | | | | | | | | | | | | | | $ | (35,988 | ) | | $ | 56,886 | | | $ | 339,015 | | | $ | 6,214 | | | $ | 4,329 | |
| 1 | Rate represents the seven-day yield at 12/31/2020. |
| 2 | Notional amount is calculated based on the number of contracts and notional contract size. |
| 3 | Value is calculated based on the notional amount and current market price. |
| 4 | Part of the same group of investment companies as the fund as defined under the Investment Company Act of 1940. |
See notes to financial statements.
| American Funds Insurance Series | 235 |
Managed Risk Growth-Income Fund
Investment portfolio December 31, 2020
| Growth-and-income funds 79.61% | | Shares | | | Value
(000) | |
| American Funds Insurance Series – Growth-Income Fund, Class 1 | | | 34,999,287 | | | $ | 1,938,260 | |
| | | | | | | | | |
| Total growth-and-income funds (cost: $1,602,958,000) | | | | | | | 1,938,260 | |
| | | | | | | | | |
| Fixed income funds 14.94% | | | | | | | | |
| American Funds Insurance Series – Bond Fund, Class 1 | | | 30,589,705 | | | | 363,712 | |
| | | | | | | | | |
| Total fixed income funds (cost: $350,930,000) | | | | | | | 363,712 | |
| | | | | | | | | |
| Short-term securities 4.72% | | | | | | | | |
| State Street Institutional U.S. Government Money Market Fund, Premier Class 0.03%1 | | | 114,850,821 | | | | 114,851 | |
| | | | | | | | | |
| Total short-term securities (cost: $114,851,000) | | | | | | | 114,851 | |
| | | | | | | | | |
| Options purchased 0.49% | | | | | | | | |
| Options purchased* | | | | | | | 12,028 | |
| | | | | | | | | |
| Total options purchased (cost: $44,381,000) | | | | | | | 12,028 | |
| Total investment securities 99.76% (cost: $2,113,120,000) | | | | | | | 2,428,851 | |
| Other assets less liabilities 0.24% | | | | | | | 5,765 | |
| | | | | | | | | |
| Net assets 100.00% | | | | | | $ | 2,434,616 | |
*Options purchased
Put
| Description | | Number of
contracts | | | Notional
amount
(000) | | | Exercise
price | | | Expiration
date | Value at
12/31/2020
(000) | |
| S&P 500 Index | | | 460 | | | $ | 1,728 | | | $ | 2,025.00 | | | 3/19/2021 | | $ | 122 | |
| S&P 500 Index | | | 965 | | | | 3,625 | | | | 2,050.00 | | | 3/19/2021 | | | 251 | |
| S&P 500 Index | | | 9,680 | | | | 36,359 | | | | 2,075.00 | | | 3/19/2021 | | | 2,759 | |
| S&P 500 Index | | | 750 | | | | 2,817 | | | | 2,100.00 | | | 3/19/2021 | | | 225 | |
| S&P 500 Index | | | 120 | | | | 451 | | | | 2,175.00 | | | 3/19/2021 | | | 41 | |
| S&P 500 Index | | | 200 | | | | 751 | | | | 2,325.00 | | | 6/18/2021 | | | 312 | |
| S&P 500 Index | | | 275 | | | | 1,033 | | | | 2,350.00 | | | 6/18/2021 | | | 483 | |
| S&P 500 Index | | | 625 | | | | 2,347 | | | | 2,375.00 | | | 6/18/2021 | | | 1,147 | |
| S&P 500 Index | | | 1,980 | | | | 7,437 | | | | 2,400.00 | | | 6/18/2021 | | | 3,514 | |
| S&P 500 Index | | | 1,285 | | | | 4,826 | | | | 2,425.00 | | | 6/18/2021 | | | 2,397 | |
| S&P 500 Index | | | 55 | | | | 207 | | | | 2,475.00 | | | 6/18/2021 | | | 113 | |
| S&P 500 Index | | | 130 | | | | 488 | | | | 2,325.00 | | | 9/17/2021 | | | 367 | |
| S&P 500 Index | | | 100 | | | | 376 | | | | 2,350.00 | | | 9/17/2021 | | | 297 | |
| | | | | | | | | | | | | | | | | $ | 12,028 | |
Futures contracts
| Contracts | | Type | | Number of
contracts | | Expiration | | Notional
amount
(000) | 2 | | Value at
12/31/2020
(000) | 3 | Unrealized
appreciation
at 12/31/2020
(000) | |
| 5 Year U.S. Treasury Note Futures | | Long | | 1,167 | | March 2021 | | $ | 116,700 | | | $ | 147,234 | | | $ | 341 | |
| S&P 500 E-mini Index Contracts | | Long | | 601 | | March 2021 | | | 30 | | | | 112,651 | | | | 2,637 | |
| | | | | | | | | | | | | | | | | $ | 2,978 | |
| 236 | American Funds Insurance Series |
Managed Risk Growth-Income Fund (continued)
Investments in affiliates4
| | | | Value of
affiliates at
1/1/2020
(000) | | | Additions
(000) | | | Reductions
(000) | | | Net
realized
gain
(000) | | | Net
unrealized
appreciation
(depreciation)
(000) | | | Value of
affiliates at
12/31/2020
(000) | | | Dividend
income
(000) | | | Capital gain
distributions
received
(000) | |
| Growth-and-income funds 79.61% | | | | | | | | | | | | | | | | | | | | | | | | |
| American Funds Insurance Series – Growth-Income Fund, Class 1 | | $ | 1,841,827 | | | $ | 536,730 | | | $ | 621,211 | | | $ | 8,083 | | | $ | 172,831 | | | $ | 1,938,260 | | | $ | 27,764 | | | $ | 46,619 | |
| Fixed income funds 14.94% | | | | | | | | | | | | | | | | | | | | | | | | | | | |
| American Funds Insurance Series – Bond Fund, Class 1 | | | 337,186 | | | | 271,155 | | | | 261,381 | | | | 23,965 | | | | (7,213 | ) | | | 363,712 | | | | 7,976 | | | | 3,178 | |
| Total 94.55% | | | | | | | | | | | | | | $ | 32,048 | | | $ | 165,618 | | | $ | 2,301,972 | | | $ | 35,740 | | | $ | 49,797 | |
| 1 | Rate represents the seven-day yield at 12/31/2020. |
| 2 | Notional amount is calculated based on the number of contracts and notional contract size. |
| 3 | Value is calculated based on the notional amount and current market price. |
| 4 | Part of the same group of investment companies as the fund as defined under the Investment Company Act of 1940. |
See notes to financial statements.
| American Funds Insurance Series | 237 |
Managed Risk Asset Allocation Fund
Investment portfolio December 31, 2020
| Asset allocation funds 95.25% | | Shares | | | Value
(000) | |
| American Funds Insurance Series – Asset Allocation Fund, Class 1 | | | 99,876,172 | | | $ | 2,646,718 | |
| | | | | | | | | |
| Total asset allocation funds (cost: $2,242,813,000) | | | | | | | 2,646,718 | |
| | | | | | | | | |
| Short-term securities 4.82% | | | | | | | | |
| State Street Institutional U.S. Government Money Market Fund, Premier Class 0.03%1 | | | 133,963,576 | | | | 133,964 | |
| | | | | | | | | |
| Total short-term securities (cost: $133,964,000) | | | | | | | 133,964 | |
| Total investment securities 100.07% (cost: $2,376,777,000) | | | | | | | 2,780,682 | |
| Other assets less liabilities (0.07)% | | | | | | | (1,911 | ) |
| | | | | | | | | |
| Net assets 100.00% | | | | | | $ | 2,778,771 | |
Futures contracts
| Contracts | | Type | | Number of
contracts | | Expiration | | Notional
amount
(000) | 2 | | Value at
12/31/2020
(000) | 3 | Unrealized
appreciation
at 12/31/2020
(000) | |
| 5 Year U.S. Treasury Note Futures | | Long | | 1,187 | | March 2021 | | $ | 118,700 | | | $ | 149,757 | | | | $358 | |
Investments in affiliates4
| | | Value of
affiliate at
1/1/2020
(000) | | | Additions
(000) | | | Reductions
(000) | | | Net
realized
gain
(000) | | | Net
unrealized
appreciation
(000) | | | Value of
affiliate at
12/31/2020
(000) | | | Dividend
income
(000) | | | Capital gain
distributions
received
(000) | |
| Asset allocation funds 95.25% | | | | | | | | | | | | | | | | | | | | | | | |
| American Funds Insurance Series – Asset Allocation Fund, Class 1 | | $ | 2,704,731 | | | $ | 748,623 | | | $ | 1,032,662 | | | $ | 65,756 | | | $ | 160,270 | | | $ | 2,646,718 | | | $ | 46,786 | | | $ | 11,668 | |
| 1 | Rate represents the seven-day yield at 12/31/2020. |
| 2 | Notional amount is calculated based on the number of contracts and notional contract size. |
| 3 | Value is calculated based on the notional amount and current market price. |
| 4 | Part of the same group of investment companies as the fund as defined under the Investment Company Act of 1940. |
See notes to financial statements.
| 238 | American Funds Insurance Series |
| Financial statements | |
Statements of assets and liabilities
at December 31, 2020 | (dollars in thousands) | |
| | | Global
Growth
Fund | | | Global
Small
Capitalization
Fund | | | Growth
Fund | | | International
Fund | | | New
World
Fund | |
| Assets: | | | | | | | | | | | | | | | | | | | | |
| Investment securities, at value: | | | | | | | | | | | | | | | | | | | | |
| Unaffiliated issuers | | $ | 8,155,602 | | | $ | 5,335,230 | | | $ | 37,254,039 | | | $ | 10,135,728 | | | $ | 3,998,276 | |
| Affiliated issuers | | | 125,696 | | | | 60,433 | | | | 1,623,691 | | | | 523,844 | | | | 224,497 | |
| Cash | | | 50 | | | | 3,005 | | | | 210 | | | | 41 | | | | 2,018 | |
| Cash collateral received for securities on loan | | | 2,031 | | | | 7,971 | | | | 756 | | | | 1,553 | | | | 1,558 | |
| Cash collateral pledged for futures contracts | | | — | | | | — | | | | — | | | | — | | | | 85 | |
| Cash denominated in currencies other than U.S. dollars | | | 2,207 | | | | 97 | | | | 3,164 | | | | 2,778 | | | | 304 | |
| Unrealized appreciation on open forward currency contracts | | | — | | | | — | | | | — | | | | 309 | | | | — | |
| Receivables for: | | | | | | | | | | | | | | | | | | | | |
| Sales of investments | | | — | | | | 238 | | | | 150,761 | | | | 3,290 | | | | 10,960 | |
| Sales of fund’s shares | | | 1,566 | | | | 2,116 | | | | 16,007 | | | | 1,802 | | | | 37,379 | |
| Dividends and interest | | | 10,576 | | | | 1,569 | | | | 18,278 | | | | 9,735 | | | | 3,890 | |
| Variation margin on futures contracts | | | — | | | | — | | | | — | | | | — | | | | 8 | |
| Securities lending income | | | 22 | | | | 278 | | | | 4 | | | | 19 | | | | 24 | |
| Other | | | 494 | | | | — | | | | 81 | | | | 141 | | | | 1,813 | |
| | | | 8,298,244 | | | | 5,410,937 | | | | 39,066,991 | | | | 10,679,240 | | | | 4,280,812 | |
| Liabilities: | | | | | | | | | | | | | | | | | | | | |
| Collateral for securities on loan | | | 20,305 | | | | 79,709 | | | | 7,559 | | | | 15,528 | | | | 15,578 | |
| Unrealized depreciation on open forward currency contracts | | | — | | | | — | | | | — | | | | 395 | | | | 54 | |
| Payables for: | | | | | | | | | | | | | | | | | | | | |
| Purchases of investments | | | 24 | | | | 1,561 | | | | 1,824 | | | | 1,556 | | | | 215 | |
| Repurchases of fund’s shares | | | 23,218 | | | | 6,758 | | | | 114,829 | | | | 37,500 | | | | 3,100 | |
| Investment advisory services | | | 3,454 | | | | 3,020 | | | | 10,027 | | | | 4,312 | | | | 1,758 | |
| Insurance administrative fees | | | 311 | | | | 150 | | | | 1,347 | | | | 249 | | | | 468 | |
| Services provided by related parties | | | 1,221 | | | | 734 | | | | 5,719 | | | | 1,278 | | | | 487 | |
| Trustees’ deferred compensation | | | 88 | | | | 59 | | | | 528 | | | | 205 | | | | 42 | |
| Variation margin on futures contracts | | | — | | | | — | | | | — | | | | — | | | | 2 | |
| Non-U.S. taxes | | | 8,523 | | | | 6,043 | | | | 1,032 | | | | 27,099 | | | | 15,804 | |
| Other | | | 130 | | | | 162 | | | | 82 | | | | 260 | | | | 151 | |
| | | | 57,274 | | | | 98,196 | | | | 142,947 | | | | 88,382 | | | | 37,659 | |
| Net assets at December 31, 2020 | | $ | 8,240,970 | | | $ | 5,312,741 | | | $ | 38,924,044 | | | $ | 10,590,858 | | | $ | 4,243,153 | |
| | | | | | | | | | | | | | | | | | | | | |
| Net assets consist of: | | | | | | | | | | | | | | | | | | | | |
| Capital paid in on shares of beneficial interest | | $ | 3,464,639 | | | $ | 2,848,920 | | | $ | 12,646,186 | | | $ | 7,030,548 | | | $ | 2,476,998 | |
| Total distributable earnings | | | 4,776,331 | | | | 2,463,821 | | | | 26,277,858 | | | | 3,560,310 | | | | 1,766,155 | |
| Net assets at December 31, 2020 | | $ | 8,240,970 | | | $ | 5,312,741 | | | $ | 38,924,044 | | | $ | 10,590,858 | | | $ | 4,243,153 | |
| | | | | | | | | | | | | | | | | | | | | |
| Investment securities on loan, at value | | $ | 21,446 | | | $ | 77,648 | | | $ | 7,302 | | | $ | 83,899 | | | $ | 18,411 | |
| Investment securities, at cost | | | | | | | | | | | | | | | | | | | | |
| Unaffiliated issuers | | | 3,818,393 | | | | 3,019,323 | | | | 16,290,045 | | | | 6,395,222 | | | | 2,355,089 | |
| Affiliated issuers | | | 125,680 | | | | 29,938 | | | | 1,623,585 | | | | 523,780 | | | | 224,489 | |
| Cash denominated in currencies other than U.S. dollars, at cost | | | 2,119 | | | | 96 | | | | 3,115 | | | | 2,761 | | | | 304 | |
See end of statements of assets and liabilities for footnote.
See notes to financial statements.
| American Funds Insurance Series | 239 |
Statements of assets and liabilities
at December 31, 2020 (continued) | (dollars in thousands) |
| | | Blue Chip
Income and
Growth
Fund | | | Global
Growth
and Income
Fund | | | Growth-
Income
Fund | | | International
Growth
and Income
Fund | | | Capital
Income
Builder | |
| Assets: | | | | | | | | | | | | | | | | | | | | |
| Investment securities, at value: | | | | | | | | | | | | | | | | | | | | |
| Unaffiliated issuers | | $ | 9,398,174 | | | $ | 2,103,845 | | | $ | 37,608,591 | | | $ | 1,425,923 | | | $ | 1,047,478 | |
| Affiliated issuers | | | 178,532 | | | | 66,489 | | | | 1,005,764 | | | | 31,755 | | | | 56,762 | |
| Cash | | | 795 | | | | 192 | | | | 1,475 | | | | 50 | | | | 208 | |
| Cash collateral received for securities on loan | | | 359 | | | | 716 | | | | 19,384 | | | | 710 | | | | 131 | |
| Cash denominated in currencies other than U.S. dollars | | | — | | | | 529 | | | | 8,131 | | | | 1,847 | | | | 1,180 | |
| Unrealized appreciation on open forward currency contracts | | | — | | | | — | | | | — | | | | — | | | | 34 | |
| Receivables for: | | | | | | | | | | | | | | | | | | | | |
| Sales of investments | | | — | | | | 12,647 | | | | 1,628 | | | | 824 | | | | 40,739 | |
| Sales of fund’s shares | | | 1,354 | | | | 1,765 | | | | 25,220 | | | | 180 | | | | 1,808 | |
| Dividends and interest | | | 14,453 | | | | 3,886 | | | | 50,590 | | | | 3,015 | | | | 4,041 | |
| Variation margin on futures contracts | | | — | | | | — | | | | — | | | | — | | | | 44 | |
| Variation margin on swap contracts | | | — | | | | — | | | | — | | | | — | | | | 4 | |
| Securities lending income | | | 5 | | | | 6 | | | | 268 | | | | 1 | | | | 3 | |
| Other | | | 4 | | | | 427 | | | | 592 | | | | 184 | | | | 63 | |
| | | | 9,593,676 | | | | 2,190,502 | | | | 38,721,643 | | | | 1,464,489 | | | | 1,152,495 | |
| Liabilities: | | | | | | | | | | | | | | | | | | | | |
| Collateral for securities on loan | | | 3,589 | | | | 7,156 | | | | 193,847 | | | | 7,095 | | | | 1,316 | |
| Unrealized depreciation on open forward currency contracts | | | — | | | | — | | | | — | | | | — | | | | 56 | |
| Payables for: | | | | | | | | | | | | | | | | | | | | |
| Purchases of investments | | | 76 | | | | 8 | | | | 2,168 | | | | 4 | | | | 50,258 | |
| Repurchases of fund’s shares | | | 6,089 | | | | 3,403 | | | | 18,913 | | | | 455 | | | | 3,045 | |
| Investment advisory services | | | 3,113 | | | | 1,074 | | | | 8,083 | | | | 738 | | | | 197 | |
| Insurance administrative fees | | | 471 | | | | 96 | | | | 829 | | | | 65 | | | | 280 | |
| Services provided by related parties | | | 1,047 | | | | 371 | | | | 4,183 | | | | 106 | | | | 124 | |
| Trustees’ deferred compensation | | | 105 | | | | 27 | | | | 603 | | | | 14 | | | | 7 | |
| Variation margin on futures contracts | | | — | | | | — | | | | — | | | | — | | | | 9 | |
| Variation margin on swap contracts | | | — | | | | — | | | | — | | | | — | | | | 36 | |
| Non-U.S. taxes | | | — | | | | 3,879 | | | | 1,398 | | | | 81 | | | | 205 | |
| Other | | | 120 | | | | 38 | | | | 84 | | | | 48 | | | | 10 | |
| | | | 14,610 | | | | 16,052 | | | | 230,108 | | | | 8,606 | | | | 55,543 | |
| Net assets at December 31, 2020 | | $ | 9,579,066 | | | $ | 2,174,450 | | | $ | 38,491,535 | | | $ | 1,455,883 | | | $ | 1,096,952 | |
| | | | | | | | | | | | | | | | | | | | | |
| Net assets consist of: | | | | | | | | | | | | | | | | | | | | |
| Capital paid in on shares of beneficial interest | | $ | 6,782,313 | | | $ | 1,372,114 | | | $ | 23,517,537 | | | $ | 1,145,069 | | | $ | 1,004,823 | |
| Total distributable earnings | | | 2,796,753 | | | | 802,336 | | | | 14,973,998 | | | | 310,814 | | | | 92,129 | |
| Net assets at December 31, 2020 | | $ | 9,579,066 | | | $ | 2,174,450 | | | $ | 38,491,535 | | | $ | 1,455,883 | | | $ | 1,096,952 | |
| | | | | | | | | | | | | | | | | | | | | |
| Investment securities on loan, at value | | $ | 3,447 | | | $ | 6,890 | | | $ | 188,806 | | | $ | 6,820 | | | $ | 5,528 | |
| Investment securities, at cost | | | | | | | | | | | | | | | | | | | | |
| Unaffiliated issuers | | | 6,564,106 | | | | 1,352,326 | | | | 23,117,506 | | | | 1,039,465 | | | | 892,022 | |
| Affiliated issuers | | | 178,499 | | | | 66,481 | | | | 1,005,560 | | | | 31,748 | | | | 56,762 | |
| Cash denominated in currencies other than U.S. dollars, at cost | | | — | | | | 524 | | | | 8,047 | | | | 1,847 | | | | 1,175 | |
See end of statements of assets and liabilities for footnote.
See notes to financial statements.
| 240 | American Funds Insurance Series |
Statements of assets and liabilities
at December 31, 2020 (continued) | (dollars in thousands) |
| | | Asset
Allocation
Fund | | | Global
Balanced
Fund | | | Bond
Fund | | | Capital
World Bond
Fund
(formerly Global
Bond Fund) | | | High-
Income
Bond
Fund | |
| Assets: | | | | | | | | | | | | | | | | | | | | |
| Investment securities, at value: | | | | | | | | | | | | | | | | | | | | |
| Unaffiliated issuers | | $ | 28,437,125 | | | $ | 429,245 | | | $ | 11,032,012 | | | $ | 2,195,557 | | | $ | 821,972 | |
| Affiliated issuers | | | 2,437,130 | | | | 24,329 | | | | 2,690,045 | | | | 147,017 | | | | 33,493 | |
| Cash | | | 1,502 | | | | 60 | | | | 1,931 | | | | 234 | | | | 13 | |
| Cash collateral received for securities on loan | | | 1,405 | | | | — | | | | — | | | | — | | | | — | |
| Cash collateral pledged for futures contracts | | | — | | | | — | | | | — | | | | — | | | | 180 | |
| Cash collateral pledged for swap contracts | | | — | | | | — | | | | — | | | | — | | | | 1,527 | |
| Cash denominated in currencies other than U.S. dollars | | | 1,043 | | | | 243 | | | | 8 | | | | 1,536 | | | | — | * |
| Unrealized appreciation on open forward currency contracts | | | — | | | | 257 | | | | 46 | | | | 4,155 | | | | — | |
| Receivables for: | | | | | | | | | | | | | | | | | | | | |
| Sales of investments | | | 2,211,415 | | | | 2,039 | | | | 4,259,301 | | | | 37,036 | | | | 2,195 | |
| Sales of fund’s shares | | | 18,047 | | | | 120 | | | | 16,175 | | | | 2,630 | | | | 10 | |
| Dividends and interest | | | 82,937 | | | | 1,399 | | | | 56,775 | | | | 18,981 | | | | 12,591 | |
| Variation margin on futures contracts | | | 854 | | | | — | | | | 1,067 | | | | 60 | | | | — | |
| Variation margin on swap contracts | | | — | | | | 2 | | | | 3 | | | | 4 | | | | — | |
| Securities lending income | | | 35 | | | | — | | | | — | | | | — | | | | — | |
| Unrealized appreciation on unfunded commitments | | | 740 | | | | — | | | | — | | | | — | | | | 323 | |
| Other | | | 317 | | | | 60 | | | | 208 | | | | 457 | | | | 4 | |
| | | | 33,192,550 | | | | 457,754 | | | | 18,057,571 | | | | 2,407,667 | | | | 872,308 | |
| Liabilities: | | | | | | | | | | | | | | | | | | | | |
| Collateral for securities on loan | | | 14,048 | | | | — | | | | — | | | | — | | | | — | |
| Unrealized depreciation on open forward currency contracts | | | — | | | | 259 | | | | 2,653 | | | | 3,799 | | | | — | |
| Payables for: | | | | | | | | | | | | | | | | | | | | |
| Purchases of investments | | | 3,495,044 | | | | 1,762 | | | | 6,637,389 | | | | 63,377 | | | | 3,274 | |
| Repurchases of fund’s shares | | | 6,458 | | | | 154 | | | | 3,405 | | | | 217 | | | | 789 | |
| Investment advisory services | | | 6,508 | | | | 250 | | | | 3,453 | | | | 841 | | | | 355 | |
| Insurance administrative fees | | | 3,028 | | | | 63 | | | | 426 | | | | 35 | | | | 39 | |
| Services provided by related parties | | | 2,894 | | | | 75 | | | | 1,237 | | | | 293 | | | | 177 | |
| Trustees’ deferred compensation | | | 326 | | | | 4 | | | | 137 | | | | 29 | | | | 41 | |
| Variation margin on futures contracts | | | 716 | | | | 4 | | | | 1,143 | | | | 114 | | | | 14 | |
| Variation margin on swap contracts | | | 66 | | | | — | | | | 295 | | | | 18 | | | | 39 | |
| Non-U.S. taxes | | | 5,162 | | | | 43 | | | | — | | | | 89 | | | | — | |
| Other | | | 649 | | | | 8 | | | | 14 | | | | 110 | | | | 1 | |
| | | | 3,534,899 | | | | 2,622 | | | | 6,650,152 | | | | 68,922 | | | | 4,729 | |
| Net assets at December 31, 2020 | | $ | 29,657,651 | | | $ | 455,132 | | | $ | 11,407,419 | | | $ | 2,338,745 | | | $ | 867,579 | |
| | | | | | | | | | | | | | | | | | | | | |
| Net assets consist of: | | | | | | | | | | | | | | | | | | | | |
| Capital paid in on shares of beneficial interest | | $ | 20,079,887 | | | $ | 352,482 | | | $ | 10,340,097 | | | $ | 2,109,516 | | | $ | 1,110,844 | |
| Total distributable earnings (accumulated loss) | | | 9,577,764 | | | | 102,650 | | | | 1,067,322 | | | | 229,229 | | | | (243,265 | ) |
| Net assets at December 31, 2020 | | $ | 29,657,651 | | | $ | 455,132 | | | $ | 11,407,419 | | | $ | 2,338,745 | | | $ | 867,579 | |
| | | | | | | | | | | | | | | | | | | | | |
| Investment securities on loan, at value | | $ | 13,741 | | | $ | — | | | $ | — | | | $ | — | | | $ | — | |
| Investment securities, at cost | | | | | | | | | | | | | | | | | | | | |
| Unaffiliated issuers | | | 19,781,571 | | | | 328,521 | | | | 10,403,219 | | | | 2,023,861 | | | | 806,030 | |
| Affiliated issuers | | | 2,391,012 | | | | 24,327 | | | | 2,690,027 | | | | 147,017 | | | | 33,489 | |
| Cash denominated in currencies other than U.S. dollars, at cost | | | 1,010 | | | | 243 | | | | 8 | | | | 1,529 | | | | — | * |
See end of statements of assets and liabilities for footnote.
See notes to financial statements.
| American Funds Insurance Series | 241 |
Statements of assets and liabilities
at December 31, 2020 (continued) | (dollars in thousands) |
| | | American
Funds
Mortgage
Fund
(formerly
Mortgage Fund) | | | Ultra-Short
Bond Fund | | | U.S.
Government/
AAA-Rated
Securities
Fund | | | Managed
Risk
Growth
Fund | | | Managed
Risk
International
Fund | |
| Assets: | | | | | | | | | | | | | | | | | | | | |
| Investment securities, at value: | | | | | | | | | | | | | | | | | | | | |
| Unaffiliated issuers | | $ | 392,439 | | | $ | 372,357 | | | $ | 2,493,668 | | | $ | 27,316 | | | $ | 8,021 | |
| Affiliated issuers | | | — | | | | — | | | | — | | | | 537,481 | | | | 161,216 | |
| Cash | | | 388 | | | | 98 | | | | 231 | | | | — | | | | — | |
| Cash collateral pledged for futures contracts | | | — | | | | — | | | | — | | | | 139 | | | | 42 | |
| Receivables for: | | | | | | | | | | | | | | | | | | | | |
| Sales of investments | | | 179,573 | | | | — | | | | 1,028,854 | | | | 706 | | | | 854 | |
| Sales of fund’s shares | | | 429 | | | | 3,527 | | | | 4,197 | | | | 191 | | | | — | |
| Dividends and interest | | | 460 | | | | — | | | | 5,801 | | | | 1 | | | | — | * |
| Variation margin on futures contracts | | | 4 | | | | — | | | | 648 | | | | 11 | | | | 3 | |
| Variation margin on swap contracts | | | — | | | | — | | | | 160 | | | | — | | | | — | |
| Other | | | 1 | | | | — | | | | — | | | | — | | | | — | |
| | | | 573,294 | | | | 375,982 | | | | 3,533,559 | | | | 565,845 | | | | 170,136 | |
| Liabilities: | | | | | | | | | | | | | | | | | | | | |
| Payables for: | | | | | | | | | | | | | | | | | | | | |
| Purchases of investments | | | 253,353 | | | | — | | | | 1,376,273 | | | | 482 | | | | 175 | |
| Repurchases of fund’s shares | | | 123 | | | | 11 | | | | 946 | | | | 427 | | | | 241 | |
| Investment advisory services | | | 65 | | | | 102 | | | | 641 | | | | 47 | | | | 14 | |
| Insurance administrative fees | | | 23 | | | | 25 | | | | 174 | | | | 328 | | | | 101 | |
| Services provided by related parties | | | 28 | | | | 80 | | | | 415 | | | | 112 | | | | 35 | |
| Trustees’ deferred compensation | | | 3 | | | | 15 | | | | 54 | | | | 3 | | | | 1 | |
| Variation margin on futures contracts | | | 29 | | | | — | | | | 613 | | | | — | | | | — | |
| Variation margin on swap contracts | | | 51 | | | | — | | | | 785 | | | | — | | | | — | |
| Other | | | — | | | | — | | | | 1 | | | | — | | | | — | |
| | | | 253,675 | | | | 233 | | | | 1,379,902 | | | | 1,399 | | | | 567 | |
| Net assets at December 31, 2020 | | $ | 319,619 | | | $ | 375,749 | | | $ | 2,153,657 | | | $ | 564,446 | | | $ | 169,569 | |
| | | | | | | | | | | | | | | | | | | | | |
| Net assets consist of: | | | | | | | | | | | | | | | | | | | | |
| Capital paid in on shares of beneficial interest | | $ | 302,094 | | | $ | 375,759 | | | $ | 1,908,506 | | | $ | 386,634 | | | $ | 155,543 | |
| Total distributable earnings (accumulated loss) | | | 17,525 | | | | (10 | ) | | | 245,151 | | | | 177,812 | | | | 14,026 | |
| Net assets at December 31, 2020 | | $ | 319,619 | | | $ | 375,749 | | | $ | 2,153,657 | | | $ | 564,446 | | | $ | 169,569 | |
| | | | | | | | | | | | | | | | | | | | | |
| Investment securities, at cost | | | | | | | | | | | | | | | | | | | | |
| Unaffiliated issuers | | $ | 387,738 | | | $ | 372,351 | | | $ | 2,448,888 | | | $ | 27,316 | | | $ | 8,021 | |
| Affiliated issuers | | | — | | | | — | | | | — | | | | 380,957 | | | | 127,392 | |
See end of statements of assets and liabilities for footnote.
See notes to financial statements.
| 242 | American Funds Insurance Series |
Statements of assets and liabilities
at December 31, 2020 (continued) | (dollars in thousands) |
| | | Managed
Risk Blue
Chip Income
and Growth
Fund | | | Managed
Risk
Growth-
Income
Fund | | | Managed
Risk
Asset
Allocation
Fund | |
| Assets: | | | | | | | | | | | | |
| Investment securities, at value: | | | | | | | | | | | | |
| Unaffiliated issuers | | $ | 17,540 | | | $ | 126,879 | | | $ | 133,964 | |
| Affiliated issuers | | | 339,015 | | | | 2,301,972 | | | | 2,646,718 | |
| Cash collateral pledged for futures contracts | | | 132 | | | | 6,144 | | | | 683 | |
| Receivables for: | | | | | | | | | | | | |
| Sales of investments | | | 702 | | | | — | | | | 2,195 | |
| Sales of fund’s shares | | | 2 | | | | 16,998 | | | | 149 | |
| Dividends and interest | | | — | * | | | 3 | | | | 3 | |
| Variation margin on futures contracts | | | 8 | | | | 794 | | | | 56 | |
| | | | 357,399 | | | | 2,452,790 | | | | 2,783,768 | |
| Liabilities: | | | | | | | | | | | | |
| Payables for: | | | | | | | | | | | | |
| Purchases of investments | | | 489 | | | | 16,441 | | | | — | |
| Repurchases of fund’s shares | | | 226 | | | | 6 | | | | 2,460 | |
| Investment advisory services | | | 30 | | | | 202 | | | | 234 | |
| Insurance administrative fees | | | 218 | | | | 1,449 | | | | 1,697 | |
| Services provided by related parties | | | 73 | | | | 64 | | | | 575 | |
| Trustees’ deferred compensation | | | 3 | | | | 12 | | | | 31 | |
| | | | 1,039 | | | | 18,174 | | | | 4,997 | |
| Net assets at December 31, 2020 | | $ | 356,360 | | | $ | 2,434,616 | | | $ | 2,778,771 | |
| | | | | | | | | | | | | |
| Net assets consist of: | | | | | | | | | | | | |
| Capital paid in on shares of beneficial interest | | $ | 357,836 | | | $ | 2,054,184 | | | $ | 2,392,464 | |
| Total (accumulated loss) distributable earnings | | | (1,476 | ) | | | 380,432 | | | | 386,307 | |
| Net assets at December 31, 2020 | | $ | 356,360 | | | $ | 2,434,616 | | | $ | 2,778,771 | |
| | | | | | | | | | | | | |
| Investment securities, at cost | | | | | | | | | | | | |
| Unaffiliated issuers | | $ | 17,540 | | | $ | 159,232 | | | $ | 133,964 | |
| Affiliated issuers | | | 277,668 | | | | 1,953,888 | | | | 2,242,813 | |
| * | Amount less than one thousand. |
See notes to financial statements.
| American Funds Insurance Series | 243 |
Statements of assets and liabilities
at December 31, 2020 (continued) | (dollars and shares in thousands, except per-share amounts) |
| | | | | Global
Growth
Fund | | | Global
Small
Capitalization
Fund | | | Growth
Fund | | | International
Fund | | | New
World
Fund | |
Shares of beneficial interest issued and outstanding
(no stated par value) — unlimited shares authorized | | | | | | | | | | | | | | | | | | | | |
| | | | | | | | | | | | | | | | | | | | | | | |
| Class 1: | | Net assets | | $ | 3,309,395 | | | $ | 2,390,834 | | | $ | 15,644,155 | | | $ | 5,652,007 | | | $ | 2,308,973 | |
| | | Shares outstanding | | | 80,401 | | | | 73,257 | | | | 130,131 | | | | 239,107 | | | | 73,091 | |
| | | Net asset value per share | | $ | 41.16 | | | $ | 32.64 | | | $ | 120.22 | | | $ | 23.64 | | | $ | 31.59 | |
| Class 1A: | | Net assets | | $ | 11,706 | | | $ | 1,226 | | | $ | 60,452 | | | $ | 9,847 | | | $ | 17,803 | |
| | | Shares outstanding | | | 285 | | | | 38 | | | | 505 | | | | 418 | | | | 566 | |
| | | Net asset value per share | | $ | 41.02 | | | $ | 32.49 | | | $ | 119.59 | | | $ | 23.55 | | | $ | 31.43 | |
| Class 2: | | Net assets | | $ | 4,386,644 | | | $ | 2,652,518 | | | $ | 20,593,851 | | | $ | 4,480,961 | | | $ | 1,108,860 | |
| | | Shares outstanding | | | 107,734 | | | | 84,047 | | | | 172,799 | | | | 190,374 | | | | 35,483 | |
| | | Net asset value per share | | $ | 40.72 | | | $ | 31.56 | | | $ | 119.18 | | | $ | 23.54 | | | $ | 31.25 | |
| Class 3: | | Net assets | | | | | | | | | | $ | 278,776 | | | $ | 24,720 | | | | | |
| | | Shares outstanding | | | Not applicable | | | | Not applicable | | | | 2,301 | | | | 1,043 | | | | Not applicable | |
| | | Net asset value per share | | | | | | | | | | $ | 121.13 | | | $ | 23.69 | | | | | |
| Class 4: | | Net assets | | $ | 533,225 | | | $ | 268,163 | | | $ | 2,346,810 | | | $ | 423,323 | | | $ | 807,517 | |
| | | Shares outstanding | | | 13,182 | | | | 8,469 | | | | 20,017 | | | | 18,209 | | | | 26,016 | |
| | | Net asset value per share | | $ | 40.45 | | | $ | 31.67 | | | $ | 117.24 | | | $ | 23.25 | | | $ | 31.04 | |
| | | | | | | | | | | | | | | | | | | | | | | |
| | | | | Blue Chip
Income and
Growth
Fund | | | | Global
Growth
and Income
Fund | | | | Growth-
Income
Fund | | | | International
Growth
and Income
Fund | | | | Capital
Income
Builder | |
Shares of beneficial interest issued and outstanding
(no stated par value) — unlimited shares authorized | | | | | | | | | | | | | | | | | | | | |
| | | | | | | | | | | | | | | | | | | | | | | |
| Class 1: | | Net assets | | $ | 5,684,371 | | | $ | 657,344 | | | $ | 22,902,591 | | | $ | 1,119,711 | | | $ | 620,828 | |
| | | Shares outstanding | | | 396,056 | | | | 39,436 | | | | 413,533 | | | | 58,897 | | | | 57,099 | |
| | | Net asset value per share | | $ | 14.35 | | | $ | 16.67 | | | $ | 55.38 | | | $ | 19.01 | | | $ | 10.87 | |
| Class 1A: | | Net assets | | $ | 24,659 | | | $ | 2,375 | | | $ | 15,908 | | | $ | 2,967 | | | $ | 6,465 | |
| | | Shares outstanding | | | 1,727 | | | | 143 | | | | 288 | | | | 156 | | | | 595 | |
| | | Net asset value per share | | $ | 14.28 | | | $ | 16.62 | | | $ | 55.16 | | | $ | 18.97 | | | $ | 10.86 | |
| Class 2: | | Net assets | | $ | 3,081,893 | | | $ | 1,348,612 | | | $ | 14,012,328 | | | $ | 221,049 | | | $ | 7,705 | |
| | | Shares outstanding | | | 217,731 | | | | 81,086 | | | | 256,372 | | | | 11,666 | | | | 709 | |
| | | Net asset value per share | | $ | 14.15 | | | $ | 16.63 | | | $ | 54.66 | | | $ | 18.95 | | | $ | 10.87 | |
| Class 3: | | Net assets | | | | | | | | | | $ | 153,750 | | | | | | | | | |
| | | Shares outstanding | | Not applicable | | | Not applicable | | | | 2,771 | | | Not applicable | | | Not applicable | |
| | | Net asset value per share | | | | | | | | | | $ | 55.49 | | | | | | | | | |
| Class 4: | | Net assets | | $ | 788,143 | | | $ | 166,119 | | | $ | 1,406,958 | | | $ | 112,156 | | | $ | 461,954 | |
| | | Shares outstanding | | | 56,038 | | | | 10,162 | | | | 26,061 | | | | 5,961 | | | | 42,571 | |
| | | Net asset value per share | | $ | 14.06 | | | $ | 16.35 | | | $ | 53.99 | | | $ | 18.82 | | | $ | 10.85 | |
See notes to financial statements.
| 244 | American Funds Insurance Series |
Statements of assets and liabilities
at December 31, 2020 (continued) | (dollars and shares in thousands, except per-share amounts) |
| | | | | Asset
Allocation
Fund | | | Global
Balanced
Fund | | | Bond
Fund | | | Capital
World Bond
Fund
(formerly Global
Bond Fund) | | | High-
Income
Bond
Fund | |
Shares of beneficial interest issued and outstanding
(no stated par value) — unlimited shares authorized | | | | | | | | | | | | | | | | | |
| | | | | | | | | | | | | | | | | | | | | | | |
| Class 1: | | Net assets | | $ | 19,237,782 | | | $ | 139,461 | | | $ | 6,844,251 | | | $ | 1,218,619 | | | $ | 122,902 | |
| | | Shares outstanding | | | 725,940 | | | | 9,827 | | | | 575,693 | | | | 94,166 | | | | 12,541 | |
| | | Net asset value per share | | $ | 26.50 | | | $ | 14.19 | | | $ | 11.89 | | | $ | 12.94 | | | $ | 9.80 | |
| Class 1A: | | Net assets | | $ | 14,543 | | | $ | 2,724 | | | $ | 9,495 | | | $ | 703 | | | $ | 997 | |
| | | Shares outstanding | | | 550 | | | | 192 | | | | 802 | | | | 54 | | | | 102 | |
| | | Net asset value per share | | $ | 26.42 | | | $ | 14.16 | | | $ | 11.84 | | | $ | 12.91 | | | $ | 9.78 | |
| Class 2: | | Net assets | | $ | 5,241,950 | | | $ | 207,779 | | | $ | 3,839,814 | | | $ | 1,058,224 | | | $ | 664,940 | |
| | | Shares outstanding | | | 200,022 | | | | 14,669 | | | | 327,353 | | | | 82,417 | | | | 69,210 | |
| | | Net asset value per share | | $ | 26.21 | | | $ | 14.16 | | | $ | 11.73 | | | $ | 12.84 | | | $ | 9.61 | |
| Class 3: | | Net assets | | $ | 32,685 | | | | | | | | | | | | | | | $ | 9,938 | |
| | | Shares outstanding | | | 1,232 | | | Not applicable | | | Not applicable | | | Not applicable | | | | 1,010 | |
| | | Net asset value per share | | $ | 26.53 | | | | | | | | | | | | | | | $ | 9.84 | |
| Class 4: | | Net assets | | $ | 5,130,691 | | | $ | 105,168 | | | $ | 713,859 | | | $ | 61,199 | | | $ | 68,802 | |
| | | Shares outstanding | | | 196,868 | | | | 7,501 | | | | 61,047 | | | | 4,815 | | | | 6,530 | |
| | | Net asset value per share | | $ | 26.06 | | | $ | 14.02 | | | $ | 11.69 | | | $ | 12.71 | | | $ | 10.54 | |
| | | | | | | | | | | | | | | | | | | | | | | |
| | | | | American
Funds
Mortgage
Fund
(formerly
Mortgage Fund) | | | | Ultra-Short
Bond Fund | | | | U.S.
Government/
AAA-Rated
Securities
Fund | | | | Managed
Risk
Growth
Fund | | | | Managed
Risk
International
Fund | |
Shares of beneficial interest issued and outstanding
(no stated par value) — unlimited shares authorized | | | | | | | | | | | | | | | | | |
| | | | | | | | | | | | | | | | | | | | | | | |
| Class 1: | | Net assets | | $ | 223,554 | | | $ | 43,579 | | | $ | 428,683 | | | | | | | | | |
| | | Shares outstanding | | | 20,121 | | | | 3,855 | | | | 32,878 | | | | Not applicable | | | | Not applicable | |
| | | Net asset value per share | | $ | 11.11 | | | $ | 11.31 | | | $ | 13.04 | | | | | | | | | |
| Class 1A: | | Net assets | | $ | 1,161 | | | $ | 10 | | | $ | 3,585 | | | | | | | | | |
| | | Shares outstanding | | | 105 | | | | 1 | | | | 276 | | | | Not applicable | | | | Not applicable | |
| | | Net asset value per share | | $ | 11.08 | | | $ | 11.31 | | | $ | 13.00 | | | | | | | | | |
| Class 2: | | Net assets | | $ | 57,906 | | | $ | 287,757 | | | $ | 1,439,405 | | | | | | | | | |
| | | Shares outstanding | | | 5,222 | | | | 26,184 | | | | 111,630 | | | | Not applicable | | | | Not applicable | |
| | | Net asset value per share | | $ | 11.09 | | | $ | 10.99 | | | $ | 12.89 | | | | | | | | | |
| Class 3: | | Net assets | | | | | | $ | 4,301 | | | $ | 10,295 | | | | | | | | | |
| | | Shares outstanding | | | Not applicable | | | | 387 | | | | 788 | | | | Not applicable | | | | Not applicable | |
| | | Net asset value per share | | | | | | $ | 11.12 | | | $ | 13.07 | | | | | | | | | |
| Class 4: | | Net assets | | $ | 36,998 | | | $ | 40,102 | | | $ | 271,689 | | | | | | | | | |
| | | Shares outstanding | | | 3,371 | | | | 3,618 | | | | 21,091 | | | | Not applicable | | | | Not applicable | |
| | | Net asset value per share | | $ | 10.97 | | | $ | 11.08 | | | $ | 12.88 | | | | | | | | | |
| Class P1: | | Net assets | | | | | | | | | | | | | | $ | 10,705 | | | $ | 1,538 | |
| | | Shares outstanding | | | Not applicable | | | | Not applicable | | | | Not applicable | | | | 621 | | | | 139 | |
| | | Net asset value per share | | | | | | | | | | | | | | $ | 17.25 | | | $ | 11.07 | |
| Class P2: | | Net assets | | | | | | | | | | | | | | $ | 553,741 | | | $ | 168,031 | |
| | | Shares outstanding | | | Not applicable | | | | Not applicable | | | | Not applicable | | | | 32,357 | | | | 15,286 | |
| | | Net asset value per share | | | | | | | | | | | | | | $ | 17.11 | | | $ | 10.99 | |
See notes to financial statements.
| American Funds Insurance Series | 245 |
Statements of assets and liabilities
at December 31, 2020 (continued) | (dollars and shares in thousands, except per-share amounts) |
| | | | | Managed
Risk Blue
Chip Income
and Growth
Fund | | | Managed
Risk
Growth-
Income
Fund | | | Managed
Risk
Asset
Allocation
Fund | |
Shares of beneficial interest issued and outstanding
(no stated par value) — unlimited shares authorized | | | | | | | | | | | | |
| | | | | | | | | | | | | | | |
| Class P1: | | Net assets | | $ | 1,525 | | | $ | 2,119,963 | | | $ | 5,317 | |
| | | Shares outstanding | | | 136 | | | | 151,361 | | | | 384 | |
| | | Net asset value per share | | $ | 11.24 | | | $ | 14.01 | | | $ | 13.84 | |
| Class P2: | | Net assets | | $ | 354,835 | | | $ | 314,653 | | | $ | 2,773,454 | |
| | | Shares outstanding | | | 31,732 | | | | 22,583 | | | | 206,250 | |
| | | Net asset value per share | | $ | 11.18 | | | $ | 13.93 | | | $ | 13.45 | |
See notes to financial statements.
| 246 | American Funds Insurance Series |
Financial statements (continued)
Statements of operations
for the year ended December 31, 2020 | (dollars in thousands) |
| | | Global
Growth
Fund | | | Global
Small
Capitalization
Fund | | | Growth
Fund | | | International
Fund | | | New
World
Fund | |
| Investment income: | | | | | | | | | | | | | | | | | | | | |
| Income (net of non-U.S. taxes1): | | | | | | | | | | | | | | | | | | | | |
| Dividends: | | | | | | | | | | | | | | | | | | | | |
| Unaffiliated issuers | | $ | 78,231 | | | $ | 25,305 | | | $ | 243,220 | | | $ | 108,464 | | | $ | 35,320 | |
| Affiliated issuers | | | 973 | | | | 1,310 | | | | 6,391 | | | | 3,029 | | | | 1,220 | |
| | | | 79,204 | | | | 26,615 | | | | 249,611 | | | | 111,493 | | | | 36,540 | |
| Interest from unaffiliated issuers | | | 18 | | | | 3 | | | | 2,485 | | | | 4,177 | | | | 6,645 | |
| Securities lending income (net of fees) | | | 176 | | | | 3,888 | | | | 37 | | | | 175 | | | | 133 | |
| | | | 79,398 | | | | 30,506 | | | | 252,133 | | | | 115,845 | | | | 43,318 | |
| Fees and expenses1: | | | | | | | | | | | | | | | | | | | | |
| Investment advisory services | | | 35,225 | | | | 30,652 | | | | 98,281 | | | | 45,293 | | | | 24,693 | |
| Distribution services | | | 10,622 | | | | 6,084 | | | | 47,087 | | | | 10,718 | | | | 3,931 | |
| Insurance administrative services | | | 1,063 | | | | 518 | | | | 4,484 | | | | 905 | | | | 1,653 | |
| Transfer agent services | | | 1 | | | | 1 | | | | 4 | | | | 1 | | | | — | 2 |
| Administrative services | | | 2,068 | | | | 1,324 | | | | 9,318 | | | | 2,752 | | | | 1,062 | |
| Reports to shareholders | | | 143 | | | | 91 | | | | 634 | | | | 199 | | | | 85 | |
| Registration statement and prospectus | | | 44 | | | | 75 | | | | 231 | | | | 94 | | | | 31 | |
| Trustees’ compensation | | | 36 | | | | 23 | | | | 162 | | | | 47 | | | | 18 | |
| Auditing and legal | | | 67 | | | | 85 | | | | 75 | | | | 83 | | | | 116 | |
| Custodian | | | 905 | | | | 710 | | | | 527 | | | | 1,874 | | | | 975 | |
| Other | | | 5 | | | | 72 | | | | 16 | | | | 7 | | | | 58 | |
| Total fees and expenses before waivers/reimbursements | | | 50,179 | | | | 39,635 | | | | 160,819 | | | | 61,973 | | | | 32,622 | |
| Less waivers/reimbursements of fees and expenses: | | | | | | | | | | | | | | | | | | | | |
| Investment advisory services waivers | | | 1 | | | | — | | | | — | | | | — | | | | 4,382 | |
| Miscellaneous fee reimbursements | | | — | | | | — | | | | — | | | | — | | | | — | |
| Total waivers/reimbursements of fees and expenses | | | 1 | | | | — | | | | — | | | | — | | | | 4,382 | |
| Total fees and expenses after waivers/reimbursements | | | 50,178 | | | | 39,635 | | | | 160,819 | | | | 61,973 | | | | 28,240 | |
| Net investment income (loss) | | | 29,220 | | | | (9,129 | ) | | | 91,314 | | | | 53,872 | | | | 15,078 | |
| Net realized gain (loss) and unrealized appreciation (depreciation): | | | | | | | | | | | | | | | | | | | | |
| Net realized gain (loss) on: | | | | | | | | | | | | | | | | | | | | |
| Investments in: | | | | | | | | | | | | | | | | | | | | |
| Unaffiliated issuers | | | 460,355 | | | | 114,077 | | | | 5,288,250 | | | | 41,340 | | | | 134,422 | |
| Affiliated issuers | | | 170 | | | | 68 | | | | 602 | | | | 36 | | | | 40 | |
| Futures contracts | | | — | | | | — | | | | — | | | | — | | | | 140 | |
| Forward currency contracts | | | — | | | | — | | | | — | | | | 182 | | | | (245 | ) |
| Currency transactions | | | (1,374 | ) | | | (445 | ) | | | 176 | | | | (1,536 | ) | | | (1,712 | ) |
| | | | 459,151 | | | | 113,700 | | | | 5,289,028 | | | | 40,022 | | | | 132,645 | |
| Net unrealized appreciation (depreciation) on: | | | | | | | | | | | | | | | | | | | | |
| Investments in: | | | | | | | | | | | | | | | | | | | | |
| Unaffiliated issuers | | | 1,448,079 | | | | 1,153,033 | | | | 8,444,104 | | | | 1,257,109 | | | | 658,964 | |
| Affiliated issuers | | | (246 | ) | | | 26,897 | | | | (3 | ) | | | (187 | ) | | | (122 | ) |
| Futures contracts | | | — | | | | — | | | | — | | | | — | | | | (10 | ) |
| Forward currency contracts | | | — | | | | — | | | | — | | | | 45 | | | | (54 | ) |
| Currency translations | | | 113 | | | | (297 | ) | | | 77 | | | | 45 | | | | (150 | ) |
| | | | 1,447,946 | | | | 1,179,633 | | | | 8,444,178 | | | | 1,257,012 | | | | 658,628 | |
| Net realized gain (loss) and unrealized appreciation (depreciation) | | | 1,907,097 | | | | 1,293,333 | | | | 13,733,206 | | | | 1,297,034 | | | | 791,273 | |
| Net increase (decrease) in net assets resulting from operations | | $ | 1,936,317 | | | $ | 1,284,204 | | | $ | 13,824,520 | | | $ | 1,350,906 | | | $ | 806,351 | |
See end of statements of operations for footnotes.
See notes to financial statements.
| American Funds Insurance Series | 247 |
Statements of operations
for the year ended December 31, 2020 (continued) | (dollars in thousands) |
| | | Blue Chip
Income and
Growth
Fund | | | Global
Growth
and Income
Fund | | | Growth-
Income
Fund | | | International
Growth
and Income
Fund | | | Capital
Income
Builder | |
| Investment income: | | | | | | | | | | | | | | | | | | | | |
| Income (net of non-U.S. taxes1): | | | | | | | | | | | | | | | | | | | | |
| Dividends: | | | | | | | | | | | | | | | | | | | | |
| Unaffiliated issuers | | $ | 206,845 | | | $ | 38,168 | | | $ | 607,278 | | | $ | 30,125 | | | $ | 28,587 | |
| Affiliated issuers | | | 2,015 | | | | 578 | | | | 12,925 | | | | 543 | | | | 436 | |
| | | | 208,860 | | | | 38,746 | | | | 620,203 | | | | 30,668 | | | | 29,023 | |
| Interest from unaffiliated issuers | | | 66 | | | | 2,960 | | | | 3,327 | | | | 810 | | | | 4,459 | |
| Securities lending income (net of fees) | | | 5 | | | | 34 | | | | 620 | | | | 13 | | | | 39 | |
| | | | 208,931 | | | | 41,740 | | | | 624,150 | | | | 31,491 | | | | 33,521 | |
| Fees and expenses1: | | | | | | | | | | | | | | | | | | | | |
| Investment advisory services | | | 33,547 | | | | 11,651 | | | | 87,809 | | | | 8,128 | | | | 4,711 | |
| Distribution services | | | 8,654 | | | | 3,375 | | | | 35,109 | | | | 727 | | | | 1,084 | |
| Insurance administrative services | | | 1,660 | | | | 348 | | | | 3,054 | | | | 239 | | | | 1,083 | |
| Transfer agent services | | | 1 | | | | — | 2 | | | 4 | | | | — | 2 | | | — | 2 |
| Administrative services | | | 2,579 | | | | 585 | | | | 10,328 | | | | 398 | | | | 294 | |
| Reports to shareholders | | | 137 | | | | 32 | | | | 761 | | | | 15 | | | | 10 | |
| Registration statement and prospectus | | | 112 | | | | 20 | | | | 241 | | | | 7 | | | | 33 | |
| Trustees’ compensation | | | 44 | | | | 10 | | | | 177 | | | | 7 | | | | 5 | |
| Auditing and legal | | | 47 | | | | 71 | | | | 89 | | | | 69 | | | | 49 | |
| Custodian | | | 120 | | | | 413 | | | | 571 | | | | 395 | | | | 91 | |
| Other | | | 5 | | | | 2 | | | | 20 | | | | 2 | | | | 2 | |
| Total fees and expenses before waivers/reimbursements | | | 46,906 | | | | 16,507 | | | | 138,163 | | | | 9,987 | | | | 7,362 | |
| Less waivers/reimbursements of fees and expenses: | | | | | | | | | | | | | | | | | | | | |
| Investment advisory services waivers | | | — | | | | — | | | | — | | | | — | | | | 1,735 | |
| Miscellaneous fee reimbursements | | | — | | | | — | | | | — | | | | — | | | | — | |
| Total waivers/reimbursements of fees and expenses | | | — | | | | — | | | | — | | | | — | | | | 1,735 | |
| Total fees and expenses after waivers/reimbursements | | | 46,906 | | | | 16,507 | | | | 138,163 | | | | 9,987 | | | | 5,627 | |
| Net investment income (loss) | | | 162,025 | | | | 25,233 | | | | 485,987 | | | | 21,504 | | | | 27,894 | |
| Net realized gain (loss) and unrealized appreciation (depreciation): | | | | | | | | | | | | | | | | | | | | |
| Net realized gain (loss) on: | | | | | | | | | | | | | | | | | | | | |
| Investments in: | | | | | | | | | | | | | | | | | | | | |
| Unaffiliated issuers | | | (75,549 | ) | | | 51,131 | | | | 377,029 | | | | (43,978 | ) | | | (48,491 | ) |
| Affiliated issuers | | | 414 | | | | 51 | | | | (18,361 | ) | | | 29 | | | | 52 | |
| Futures contracts | | | — | | | | — | | | | — | | | | — | | | | 3,606 | |
| Forward currency contracts | | | — | | | | (521 | ) | | | — | | | | 18 | | | | 38 | |
| Swap contracts | | | — | | | | — | | | | — | | | | — | | | | 2,686 | |
| Currency transactions | | | 2 | | | | (974 | ) | | | 470 | | | | 714 | | | | 54 | |
| | | | (75,133 | ) | | | 49,687 | | | | 359,138 | | | | (43,217 | ) | | | (42,055 | ) |
| Net unrealized appreciation (depreciation) on: | | | | | | | | | | | | | | | | | | | | |
| Investments in: | | | | | | | | | | | | | | | | | | | | |
| Unaffiliated issuers | | | 717,525 | | | | 113,105 | | | | 3,860,050 | | | | 123,508 | | | | 60,596 | |
| Affiliated issuers | | | 3 | | | | (64 | ) | | | (10,984 | ) | | | (39 | ) | | | (127 | ) |
| Futures contracts | | | — | | | | — | | | | — | | | | — | | | | 281 | |
| Forward currency contracts | | | — | | | | 137 | | | | — | | | | 12 | | | | (22 | ) |
| Swap contracts | | | — | | | | — | | | | — | | | | — | | | | (108 | ) |
| Currency translations | | | (6 | ) | | | 38 | | | | 282 | | | | 144 | | | | 46 | |
| | | | 717,522 | | | | 113,216 | | | | 3,849,348 | | | | 123,625 | | | | 60,666 | |
| Net realized gain (loss) and unrealized appreciation (depreciation) | | | 642,389 | | | | 162,903 | | | | 4,208,486 | | | | 80,408 | | | | 18,611 | |
| Net increase (decrease) in net assets resulting from operations | | $ | 804,414 | | | $ | 188,136 | | | $ | 4,694,473 | | | $ | 101,912 | | | $ | 46,505 | |
See end of statements of operations for footnotes.
See notes to financial statements.
| 248 | American Funds Insurance Series |
Statements of operations
for the year ended December 31, 2020 (continued) | (dollars in thousands) |
| | | Asset
Allocation
Fund | | | Global
Balanced
Fund | | | Bond
Fund | | | Capital
World Bond
Fund3 | | | High-
Income
Bond Fund | |
| Investment income: | | | | | | | | | | | | | | | | | | | | |
| Income (net of non-U.S. taxes1): | | | | | | | | | | | | | | | | | | | | |
| Dividends: | | | | | | | | | | | | | | | | | | | | |
| Unaffiliated issuers | | $ | 331,247 | | | $ | 5,802 | | | $ | — | | | $ | — | | | $ | 161 | |
| Affiliated issuers | | | 16,268 | | | | 103 | | | | 5,601 | | | | 477 | | | | 227 | |
| | | | 347,515 | | | | 5,905 | | | | 5,601 | | | | 477 | | | | 388 | |
| Interest from unaffiliated issuers | | | 216,938 | | | | 2,516 | | | | 251,927 | | | | 55,130 | | | | 62,664 | |
| Securities lending income (net of fees) | | | 690 | | | | — | | | | — | | | | — | | | | — | |
| | | | 565,143 | | | | 8,421 | | | | 257,528 | | | | 55,607 | | | | 63,052 | |
| Fees and expenses1: | | | | | | | | | | | | | | | | | | | | |
| Investment advisory services | | | 71,046 | | | | 2,767 | | | | 38,894 | | | | 11,401 | | | | 4,534 | |
| Distribution services | | | 23,649 | | | | 721 | | | | 10,588 | | | | 2,609 | | | | 1,726 | |
| Insurance administrative services | | | 11,402 | | | | 239 | | | | 1,504 | | | | 131 | | | | 140 | |
| Transfer agent services | | | 3 | | | | — | 2 | | | 1 | | | | — | 2 | | | — | 2 |
| Administrative services | | | 8,053 | | | | 126 | | | | 3,223 | | | | 642 | | | | 281 | |
| Reports to shareholders | | | 481 | | | | 5 | | | | 227 | | | | 35 | | | | 22 | |
| Registration statement and prospectus | | | 330 | | | | 5 | | | | 80 | | | | 22 | | | | 7 | |
| Trustees’ compensation | | | 135 | | | | 2 | | | | 51 | | | | 11 | | | | 4 | |
| Auditing and legal | | | 72 | | | | 53 | | | | 54 | | | | 48 | | | | 47 | |
| Custodian | | | 753 | | | | 76 | | | | 147 | | | | 389 | | | | 16 | |
| Other | | | 14 | | | | 2 | | | | 7 | | | | 9 | | | | 17 | |
| Total fees and expenses before waivers/reimbursements | | | 115,938 | | | | 3,996 | | | | 54,776 | | | | 15,297 | | | | 6,794 | |
| Less waivers/reimbursements of fees and expenses: | | | | | | | | | | | | | | | | | | | | |
| Investment advisory services waivers | | | — | | | | — | | | | — | | | | 1,458 | | | | — | |
| Miscellaneous fee reimbursements | | | — | | | | — | | | | — | | | | — | | | | — | |
| Total waivers/reimbursements of fees and expenses | | | — | | | | — | | | | — | | | | 1,458 | | | | — | |
| Total fees and expenses after waivers/reimbursements | | | 115,938 | | | | 3,996 | | | | 54,776 | | | | 13,839 | | | | 6,794 | |
| Net investment income (loss) | | | 449,205 | | | | 4,425 | | | | 202,752 | | | | 41,768 | | | | 56,258 | |
| Net realized gain (loss) and unrealized appreciation (depreciation): | | | | | | | | | | | | | | | | | | | | |
| Net realized gain (loss) on: | | | | | | | | | | | | | | | | | | | | |
| Investments in: | | | | | | | | | | | | | | | | | | | | |
| Unaffiliated issuers | | | 767,904 | | | | 17,369 | | | | 406,202 | | | | 33,450 | | | | (55,642 | ) |
| Affiliated issuers | | | 14,845 | | | | 3 | | | | 885 | | | | 35 | | | | 73 | |
| Futures contracts | | | 36,747 | | | | 442 | | | | 89,071 | | | | (180 | ) | | | (166 | ) |
| Forward currency contracts | | | — | | | | 801 | | | | (15,906 | ) | | | 16,206 | | | | — | |
| Swap contracts | | | (10,831 | ) | | | (123 | ) | | | 44 | | | | (2,905 | ) | | | 3,842 | |
| Currency transactions | | | (271 | ) | | | (237 | ) | | | (14 | ) | | | (766 | ) | | | 6 | |
| | | | 808,394 | | | | 18,255 | | | | 480,282 | | | | 45,840 | | | | (51,887 | ) |
| Net unrealized appreciation (depreciation) on: | | | | | | | | | | | | | | | | | | | | |
| Investments in: | | | | | | | | | | | | | | | | | | | | |
| Unaffiliated issuers | | | 1,914,198 | | | | 18,521 | | | | 308,933 | | | | 114,258 | | | | 18,771 | |
| Affiliated issuers | | | 84,442 | | | | (5 | ) | | | (92 | ) | | | (168 | ) | | | (129 | ) |
| Futures contracts | | | 2,190 | | | | 19 | | | | 10,886 | | | | 958 | | | | (178 | ) |
| Forward currency contracts | | | — | | | | 97 | | | | (1,417 | ) | | | 2,566 | | | | — | |
| Swap contracts | | | 4,608 | | | | 23 | | | | (18,955 | ) | | | (923 | ) | | | 857 | |
| Currency translations | | | 190 | | | | 28 | | | | 132 | | | | 301 | | | | 2 | |
| | | | 2,005,628 | | | | 18,683 | | | | 299,487 | | | | 116,992 | | | | 19,323 | |
| Net realized gain (loss) and unrealized appreciation (depreciation) | | | 2,814,022 | | | | 36,938 | | | | 779,769 | | | | 162,832 | | | | (32,564 | ) |
| Net increase (decrease) in net assets resulting from operations | | $ | 3,263,227 | | | $ | 41,363 | | | $ | 982,521 | | | $ | 204,600 | | | $ | 23,694 | |
See end of statements of operations for footnotes.
See notes to financial statements.
| American Funds Insurance Series | 249 |
Statements of operations
for the year ended December 31, 2020 (continued) | (dollars in thousands) |
| | | American
Funds
Mortgage
Fund4 | | | Ultra-Short
Bond Fund | | | U.S.
Government/
AAA-Rated
Securities
Fund | | | Managed
Risk
Growth
Fund | | | Managed
Risk
International
Fund | |
| Investment income: | | | | | | | | | | | | | | | | | | | | |
| Income (net of non-U.S. taxes1): | | | | | | | | | | | | | | | | | | | | |
| Dividends: | | | | | | | | | | | | | | | | | | | | |
| Unaffiliated issuers | | $ | — | | | $ | — | | | $ | — | | | $ | — | | | $ | — | |
| Affiliated issuers | | | — | | | | — | | | | — | | | | 3,867 | | | | 1,621 | |
| | | | — | | | | — | | | | — | | | | 3,867 | | | | 1,621 | |
| Interest from unaffiliated issuers | | | 3,819 | | | | 1,927 | | | | 34,038 | | | | 56 | | | | 26 | |
| | | | 3,819 | | | | 1,927 | | | | 34,038 | | | | 3,923 | | | | 1,647 | |
| Fees and expenses1: | | | | | | | | | | | | | | | | | | | | |
| Investment advisory services | | | 1,248 | | | | 1,098 | | | | 8,276 | | | | 719 | | | | 235 | |
| Distribution services | | | 230 | | | | 754 | | | | 4,056 | | | | 1,177 | | | | 389 | |
| Insurance administrative services | | | 90 | | | | 85 | | | | 587 | | | | 1,198 | | | | 392 | |
| Transfer agent services | | | — | 2 | | | — | 2 | | | — | 2 | | | — | 2 | | | — | 2 |
| Administrative services | | | 89 | | | | 103 | | | | 712 | | | | — | | | | — | |
| Accounting and administrative services | | | — | | | | — | | | | — | | | | 61 | | | | 54 | |
| Reports to shareholders | | | 4 | | | | 6 | | | | 83 | | | | 6 | | | | 4 | |
| Registration statement and prospectus | | | 3 | | | | 4 | | | | 14 | | | | 8 | | | | 1 | |
| Trustees’ compensation | | | 1 | | | | 2 | | | | 9 | | | | 3 | | | | 1 | |
| Auditing and legal | | | 44 | | | | 45 | | | | 46 | | | | 16 | | | | 16 | |
| Custodian | | | 24 | | | | 1 | | | | 37 | | | | 11 | | | | 11 | |
| Other | | | — | 2 | | | — | 2 | | | 2 | | | | 2 | | | | 2 | |
| Total fees and expenses before waivers/reimbursements | | | 1,733 | | | | 2,098 | | | | 13,822 | | | | 3,201 | | | | 1,105 | |
| Less waivers/reimbursements of fees and expenses: | | | | | | | | | | | | | | | | | | | | |
| Investment advisory services waivers | | | 360 | | | | — | | | | — | | | | 240 | | | | 79 | |
| Miscellaneous fee reimbursements | | | — | | | | — | | | | — | | | | — | | | | 41 | |
| Total waivers/reimbursements of fees and expenses | | | 360 | | | | — | | | | — | | | | 240 | | | | 120 | |
| Total fees and expenses after waivers/reimbursements | | | 1,373 | | | | 2,098 | | | | 13,822 | | | | 2,961 | | | | 985 | |
| Net investment income (loss) | | | 2,446 | | | | (171 | ) | | | 20,216 | | | | 962 | | | | 662 | |
| Net realized gain (loss) and unrealized appreciation (depreciation): | | | | | | | | | | | | | | | | | | | | |
| Net realized gain (loss) on: | | | | | | | | | | | | | | | | | | | | |
| Investments in: | | | | | | | | | | | | | | | | | | | | |
| Unaffiliated issuers | | | 11,818 | | | | — | | | | 145,064 | | | | — | | | | — | |
| Affiliated issuers | | | — | | | | — | | | | — | | | | 53,335 | | | | (165 | ) |
| Futures contracts | | | 8,696 | | | | — | | | | 89,336 | | | | (35,338 | ) | | | (14,051 | ) |
| Swap contracts | | | (8,505 | ) | | | — | | | | (46,704 | ) | | | — | | | | — | |
| Currency transactions | | | — | | | | — | | | | — | | | | 77 | | | | 178 | |
| Capital gain distributions received from affiliated issuers | | | — | | | | — | | | | — | | | | 9,678 | | | | 159 | |
| | | | 12,009 | | | | — | | | | 187,696 | | | | 27,752 | | | | (13,879 | ) |
| Net unrealized appreciation (depreciation) on: | | | | | | | | | | | | | | | | | | | | |
| Investments in: | | | | | | | | | | | | | | | | | | | | |
| Unaffiliated issuers | | | 239 | | | | (1 | ) | | | 6,199 | | | | — | | | | — | |
| Affiliated issuers | | | — | | | | — | | | | — | | | | 110,528 | | | | 19,015 | |
| Futures contracts | | | 779 | | | | — | | | | 7,908 | | | | 130 | | | | 51 | |
| Swap contracts | | | 4,046 | | | | — | | | | 47,782 | | | | — | | | | — | |
| | | | 5,064 | | | | (1 | ) | | | 61,889 | | | | 110,658 | | | | 19,066 | |
| Net realized gain (loss) and unrealized appreciation (depreciation) | | | 17,073 | | | | (1 | ) | | | 249,585 | | | | 138,410 | | | | 5,187 | |
| Net increase (decrease) in net assets resulting from operations | | $ | 19,519 | | | $ | (172 | ) | | $ | 269,801 | | | $ | 139,372 | | | $ | 5,849 | |
See end of statements of operations for footnotes.
See notes to financial statements.
| 250 | American Funds Insurance Series |
Statements of operations
for the year ended December 31, 2020 (continued) | (dollars in thousands) |
| |
| |
| | | Managed
Risk Blue
Chip Income
and Growth
Fund | | | Managed
Risk
Growth-
Income
Fund | | | Managed
Risk
Asset
Allocation
Fund | |
| Investment income: | | | | | | | | | | | | |
| Income (net of non-U.S. taxes1): | | | | | | | | | | | | |
| Dividends: | | | | | | | | | | | | |
| Unaffiliated issuers | | $ | — | | | $ | — | | | $ | — | |
| Affiliated issuers | | | 6,214 | | | | 35,740 | | | | 46,786 | |
| | | | 6,214 | | | | 35,740 | | | | 46,786 | |
| Interest from unaffiliated issuers | | | 45 | | | | 297 | | | | 433 | |
| | | | 6,259 | | | | 36,037 | | | | 47,219 | |
| Fees and expenses1: | | | | | | | | | | | | |
| Investment advisory services | | | 518 | | | | 3,378 | | | | 4,028 | |
| Distribution services | | | 861 | | | | 718 | | | | 6,703 | |
| Insurance administrative services | | | 864 | | | | 5,630 | | | | 6,712 | |
| Transfer agent services | | | — | 2 | | | — | 2 | | | — | 2 |
| Accounting and administrative services | | | 58 | | | | 100 | | | | 102 | |
| Reports to shareholders | | | 5 | | | | 21 | | | | 44 | |
| Registration statement and prospectus | | | 3 | | | | 14 | | | | 11 | |
| Trustees’ compensation | | | 2 | | | | 11 | | | | 13 | |
| Auditing and legal | | | 16 | | | | 18 | | | | 19 | |
| Custodian | | | 11 | | | | 11 | | | | 11 | |
| Other | | | 2 | | | | 3 | | | | 3 | |
| Total fees and expenses before waivers/reimbursements | | | 2,340 | | | | 9,904 | | | | 17,646 | |
| Less waivers/reimbursements of fees and expenses: | | | | | | | | | | | | |
| Investment advisory services waivers | | | 173 | | | | 1,126 | | | | 1,342 | |
| Miscellaneous fee reimbursements | | | — | | | | — | | | | — | |
| Total waivers/reimbursements of fees and expenses | | | 173 | | | | 1,126 | | | | 1,342 | |
| Total fees and expenses after waivers/reimbursements | | | 2,167 | | | | 8,778 | | | | 16,304 | |
| Net investment income (loss) | | | 4,092 | | | | 27,259 | | | | 30,915 | |
| Net realized gain (loss) and unrealized appreciation (depreciation): | | | | | | | | | | | | |
| Net realized gain (loss) on: | | | | | | | | | | | | |
| Investments in: | | | | | | | | | | | | |
| Unaffiliated issuers | | | — | | | | (22,888 | ) | | | — | |
| Affiliated issuers | | | (35,988 | ) | | | 32,048 | | | | 65,756 | |
| Futures contracts | | | (32,684 | ) | | | (20,595 | ) | | | (119,251 | ) |
| Currency transactions | | | 15 | | | | 307 | | | | 140 | |
| Capital gain distributions received from affiliated issuers | | | 4,329 | | | | 49,797 | | | | 11,668 | |
| | | | (64,328 | ) | | | 38,669 | | | | (41,687 | ) |
| Net unrealized appreciation (depreciation) on: | | | | | | | | | | | | |
| Investments in: | | | | | | | | | | | | |
| Unaffiliated issuers | | | — | | | | (22,232 | ) | | | — | |
| Affiliated issuers | | | 56,886 | | | | 165,618 | | | | 160,270 | |
| Futures contracts | | | 90 | | | | 2,308 | | | | 883 | |
| | | | 56,976 | | | | 145,694 | | | | 161,153 | |
| Net realized gain (loss) and unrealized appreciation (depreciation) | | | (7,352 | ) | | | 184,363 | | | | 119,466 | |
| Net increase (decrease) in net assets resulting from operations | | $ | (3,260 | ) | | $ | 211,622 | | | $ | 150,381 | |
| 1 | Additional information related to non-U.S. taxes and class-specific fees and expenses is included in the notes to financial statements. |
| 2 | Amount less than one thousand. |
| 3 | Formerly Global Bond Fund. |
| 4 | Formerly Mortgage Fund. |
See notes to financial statements.
| American Funds Insurance Series | 251 |
| Financial statements (continued) | | |
| | |
| Statements of changes in net assets | (dollars in thousands) |
| | | Global Growth Fund | | | Global Small
Capitalization Fund | | | Growth Fund | |
| | | Year ended December 31, | | | Year ended December 31, | | | Year ended December 31, | |
| | | 2020 | | | 2019 | | | 2020 | | | 2019 | | | 2020 | | | 2019 | |
| Operations: | | | | | | | | | | | | | | | | | | | | | | | | |
| Net investment income (loss) | | $ | 29,220 | | | $ | 56,332 | | | $ | (9,129 | ) | | $ | 13,730 | | | $ | 91,314 | | | $ | 241,310 | |
| Net realized gain (loss) | | | 459,151 | | | | 193,918 | | | | 113,700 | | | | 251,270 | | | | 5,289,028 | | | | 745,536 | |
| Net unrealized appreciation (depreciation) | | | 1,447,946 | | | | 1,619,747 | | | | 1,179,633 | | | | 882,559 | | | | 8,444,178 | | | | 6,038,232 | |
| Net increase (decrease) in net assets resulting from operations | | | 1,936,317 | | | | 1,869,997 | | | | 1,284,204 | | | | 1,147,559 | | | | 13,824,520 | | | | 7,025,078 | |
| Distributions paid to shareholders | | | (224,589 | ) | | | (417,934 | ) | | | (284,490 | ) | | | (284,752 | ) | | | (865,145 | ) | | | (2,978,202 | ) |
| | | | | | | | | | | | | | | | | | | | | | | | | |
| Net capital share transactions | | | (271,205 | ) | | | (153,769 | ) | | | (307,246 | ) | | | 102,952 | | | | (2,504,990 | ) | | | 974,922 | |
| | | | | | | | | | | | | | | | | | | | | | | | | |
| Total increase (decrease) in net assets | | | 1,440,523 | | | | 1,298,294 | | | | 692,468 | | | | 965,759 | | | | 10,454,385 | | | | 5,021,798 | |
| | | | | | | | | | | | | | | | | | | | | | | | | |
| Net assets: | | | | | | | | | | | | | | | | | | | | | | | | |
| Beginning of year | | | 6,800,447 | | | | 5,502,153 | | | | 4,620,273 | | | | 3,654,514 | | | | 28,469,659 | | | | 23,447,861 | |
| End of year | | $ | 8,240,970 | | | $ | 6,800,447 | | | $ | 5,312,741 | | | $ | 4,620,273 | | | $ | 38,924,044 | | | $ | 28,469,659 | |
| | | | | | | | | | | | | | | | | | | | | | | | | |
| | | International Fund | | | New World Fund | | | Blue Chip Income
and Growth Fund | |
| | | Year ended December 31, | | | Year ended December 31, | | | Year ended December 31, | |
| | | 2020 | | | 2019 | | | 2020 | | | 2019 | | | 2020 | | | 2019 | |
| Operations: | | | | | | | | | | | | | | | | | | | | | | | | |
| Net investment income (loss) | | $ | 53,872 | | | $ | 136,307 | | | $ | 15,078 | | | $ | 34,732 | | | $ | 162,025 | | | $ | 189,701 | |
| Net realized gain (loss) | | | 40,022 | | | | (127,992 | ) | | | 132,645 | | | | 32,951 | | | | (75,133 | ) | | | 85,829 | |
| Net unrealized appreciation (depreciation) | | | 1,257,012 | | | | 1,988,427 | | | | 658,628 | | | | 791,400 | | | | 717,522 | | | | 1,423,960 | |
| Net increase (decrease) in net assets resulting from operations | | | 1,350,906 | | | | 1,996,742 | | | | 806,351 | | | | 859,083 | | | | 804,414 | | | | 1,699,490 | |
| Distributions paid to shareholders | | | (71,715 | ) | | | (394,620 | ) | | | (43,949 | ) | | | (164,192 | ) | | | (265,213 | ) | | | (878,225 | ) |
| | | | | | | | | | | | | | | | | | | | | | | | | |
| Net capital share transactions | | | (763,764 | ) | | | (536,801 | ) | | | (279,660 | ) | | | 54,641 | | | | (242,496 | ) | | | 429,824 | |
| | | | | | | | | | | | | | | | | | | | | | | | | |
| Total increase (decrease) in net assets | | | 515,427 | | | | 1,065,321 | | | | 482,742 | | | | 749,532 | | | | 296,705 | | | | 1,251,089 | |
| | | | | | | | | | | | | | | | | | | | | | | | | |
| Net assets: | | | | | | | | | | | | | | | | | | | | | | | | |
| Beginning of year | | | 10,075,431 | | | | 9,010,110 | | | | 3,760,411 | | | | 3,010,879 | | | | 9,282,361 | | | | 8,031,272 | |
| End of year | | $ | 10,590,858 | | | $ | 10,075,431 | | | $ | 4,243,153 | | | $ | 3,760,411 | | | $ | 9,579,066 | | | $ | 9,282,361 | |
See notes to financial statements.
| 252 | American Funds Insurance Series |
| Statements of changes in net assets (continued) | (dollars in thousands) |
| | | Global Growth
and Income Fund | | | Growth-Income Fund | | | International Growth
and Income Fund | |
| | | Year ended December 31, | | | Year ended December 31, | | | Year ended December 31, | |
| | | 2020 | | | 2019 | | | 2020 | | | 2019 | | | 2020 | | | 2019 | |
| Operations: | | | | | | | | | | | | | | | | | | | | | | | | |
| Net investment income (loss) | | $ | 25,233 | | | $ | 38,039 | | | $ | 485,987 | | | $ | 648,555 | | | $ | 21,504 | | | $ | 37,530 | |
| Net realized gain (loss) | | | 49,687 | | | | 51,837 | | | | 359,138 | | | | 902,476 | | | | (43,217 | ) | | | (37,024 | ) |
| Net unrealized appreciation (depreciation) | | | 113,216 | | | | 449,868 | | | | 3,849,348 | | | | 6,175,985 | | | | 123,625 | | | | 293,939 | |
| Net increase (decrease) in net assets resulting from operations | | | 188,136 | | | | 539,744 | | | | 4,694,473 | | | | 7,727,016 | | | | 101,912 | | | | 294,445 | |
| Distributions paid to shareholders | | | (77,584 | ) | | | (140,198 | ) | | | (1,429,478 | ) | | | (3,957,175 | ) | | | (21,467 | ) | | | (53,548 | ) |
| | | | | | | | | | | | | | | | | | | | | | | | | |
| Net capital share transactions | | | (74,585 | ) | | | (76,937 | ) | | | (799,726 | ) | | | 2,392,290 | | | | (124,648 | ) | | | (78,069 | ) |
| | | | | | | | | | | | | | | | | | | | | | | | | |
| Total increase (decrease) in net assets | | | 35,967 | | | | 322,609 | | | | 2,465,269 | | | | 6,162,131 | | | | (44,203 | ) | | | 162,828 | |
| | | | | | | | | | | | | | | | | | | | | | | | | |
| Net assets: | | | | | | | | | | | | | | | | | | | | | | | | |
| Beginning of year | | | 2,138,483 | | | | 1,815,874 | | | | 36,026,266 | | | | 29,864,135 | | | | 1,500,086 | | | | 1,337,258 | |
| End of year | | $ | 2,174,450 | | | $ | 2,138,483 | | | $ | 38,491,535 | | | $ | 36,026,266 | | | $ | 1,455,883 | | | $ | 1,500,086 | |
| | | | | | | | | | | | | | | | | | | |
| | | Capital Income Builder | | | Asset Allocation Fund | | | Global Balanced Fund | |
| | | Year ended December 31, | | | Year ended December 31, | | | Year ended December 31, | |
| | | 2020 | | | 2019 | | | 2020 | | | 2019 | | | 2020 | | | 2019 | |
| Operations: | | | | | | | | | | | | | | | | | | | | | | | | |
| Net investment income (loss) | | $ | 27,894 | | | $ | 24,376 | | | $ | 449,205 | | | $ | 527,540 | | | $ | 4,425 | | | $ | 6,777 | |
| Net realized gain (loss) | | | (42,055 | ) | | | (6,878 | ) | | | 808,394 | | | | 20,909 | | | | 18,255 | | | | 9,826 | |
| Net unrealized appreciation (depreciation) | | | 60,666 | | | | 117,343 | | | | 2,005,628 | | | | 4,312,978 | | | | 18,683 | | | | 58,663 | |
| Net increase (decrease) in net assets resulting from operations | | | 46,505 | | | | 134,841 | | | | 3,263,227 | | | | 4,861,427 | | | | 41,363 | | | | 75,266 | |
| Distributions paid to shareholders | | | (28,997 | ) | | | (24,614 | ) | | | (606,436 | ) | | | (1,801,337 | ) | | | (21,373 | ) | | | (16,934 | ) |
| | | | | | | | | | | | | | | | | | | | | | | | | |
| Net capital share transactions | | | 80,728 | | | | 213,209 | | | | (418,795 | ) | | | 1,434,114 | | | | (1,808 | ) | | | 12,429 | |
| | | | | | | | | | | | | | | | | | | | | | | | | |
| Total increase (decrease) in net assets | | | 98,236 | | | | 323,436 | | | | 2,237,996 | | | | 4,494,204 | | | | 18,182 | | | | 70,761 | |
| | | | | | | | | | | | | | | | | | | | | | | | | |
| Net assets: | | | | | | | | | | | | | | | | | | | | | | | | |
| Beginning of year | | | 998,716 | | | | 675,280 | | | | 27,419,655 | | | | 22,925,451 | | | | 436,950 | | | | 366,189 | |
| End of year | | $ | 1,096,952 | | | $ | 998,716 | | | $ | 29,657,651 | | | $ | 27,419,655 | | | $ | 455,132 | | | $ | 436,950 | |
See notes to financial statements.
| American Funds Insurance Series | 253 |
| Statements of changes in net assets (continued) | (dollars in thousands) |
| | | | | | | | | Capital World Bond Fund | | | | | | | |
| | | Bond Fund | | | (formerly Global Bond Fund) | | | High-Income Bond Fund | |
| | | Year ended December 31, | | | Year ended December 31, | | | Year ended December 31, | |
| | | 2020 | | | 2019 | | | 2020 | | | 2019 | | | 2020 | | | 2019 | |
| Operations: | | | | | | | | | | | | | | | | | | | | | | | | |
| Net investment income (loss) | | $ | 202,752 | | | $ | 272,023 | | | $ | 41,768 | | | $ | 52,158 | | | $ | 56,258 | | | $ | 82,861 | |
| Net realized gain (loss) | | | 480,282 | | | | 243,332 | | | | 45,840 | | | | 21,665 | | | | (51,887 | ) | | | (19,893 | ) |
| Net unrealized appreciation (depreciation) | | | 299,487 | | | | 411,625 | | | | 116,992 | | | | 87,557 | | | | 19,323 | | | | 86,931 | |
| Net increase (decrease) in net assets resulting from operations | | | 982,521 | | | | 926,980 | | | | 204,600 | | | | 161,380 | | | | 23,694 | | | | 149,899 | |
| Distributions paid to shareholders | | | (339,511 | ) | | | (280,200 | ) | | | (64,860 | ) | | | (35,756 | ) | | | (69,840 | ) | | | (79,066 | ) |
| | | | | | | | | | | | | | | | | | | | | | | | | |
| Net capital share transactions | | | 213,249 | | | | 49,693 | | | | 70,361 | | | | (84,997 | ) | | | (352,568 | ) | | | (8,439 | ) |
| | | | | | | | | | | | | | | | | | | | | | | | | |
| Total increase (decrease) in net assets | | | 856,259 | | | | 696,473 | | | | 210,101 | | | | 40,627 | | | | (398,714 | ) | | | 62,394 | |
| | | | | | | | | | | | | | | | | | | | | | | | | |
| Net assets: | | | | | | | | | | | | | | | | | | | | | | | | |
| Beginning of year | | | 10,551,160 | | | | 9,854,687 | | | | 2,128,644 | | | | 2,088,017 | | | | 1,266,293 | | | | 1,203,899 | |
| End of year | | $ | 11,407,419 | | | $ | 10,551,160 | | | $ | 2,338,745 | | | $ | 2,128,644 | | | $ | 867,579 | | | $ | 1,266,293 | |
| | | | | | | | | | | | | | | | | | | | | | | | | |
| | | American Funds
Mortgage Fund
(formerly Mortgage Fund) | | | Ultra-Short Bond Fund | | | U.S. Government/
AAA-Rated Securities Fund | |
| | | Year ended December 31, | | | Year ended December 31, | | | Year ended December 31, | |
| | | 2020 | | | 2019 | | | 2020 | | | 2019 | | | 2020 | | | 2019 | |
| Operations: | | | | | | | | | | | | | | | | | | | | | | | | |
| Net investment income (loss) | | $ | 2,446 | | | $ | 6,346 | | | $ | (171 | ) | | $ | 4,833 | | | $ | 20,216 | | | $ | 55,852 | |
| Net realized gain (loss) | | | 12,009 | | | | 9,940 | | | | — | | | | (1 | ) | | | 187,696 | | | | 122,154 | |
| Net unrealized appreciation (depreciation) | | | 5,064 | | | | (1,209 | ) | | | (1 | ) | | | 15 | | | | 61,889 | | | | (22,336 | ) |
| Net increase (decrease) in net assets resulting from operations | | | 19,519 | | | | 15,077 | | | | (172 | ) | | | 4,847 | | | | 269,801 | | | | 155,670 | |
| Distributions paid to shareholders | | | (4,820 | ) | | | (7,525 | ) | | | (737 | ) | | | (5,093 | ) | | | (77,781 | ) | | | (60,961 | ) |
| | | | | | | | | | | | | | | | | | | | | | | | | |
| Net capital share transactions | | | 10,410 | | | | (4,217 | ) | | | 92,028 | | | | (21,528 | ) | | | (934,697 | ) | | | (67,678 | ) |
| | | | | | | | | | | | | | | | | | | | | | | | | |
| Total increase (decrease) in net assets | | | 25,109 | | | | 3,335 | | | | 91,119 | | | | (21,774 | ) | | | (742,677 | ) | | | 27,031 | |
| | | | | | | | | | | | | | | | | | | | | | | | | |
| Net assets: | | | | | | | | | | | | | | | | | | | | | | | | |
| Beginning of year | | | 294,510 | | | | 291,175 | | | | 284,630 | | | | 306,404 | | | | 2,896,334 | | | | 2,869,303 | |
| End of year | | $ | 319,619 | | | $ | 294,510 | | | $ | 375,749 | | | $ | 284,630 | | | $ | 2,153,657 | | | $ | 2,896,334 | |
See notes to financial statements.
| 254 | American Funds Insurance Series |
| Statements of changes in net assets (continued) | (dollars in thousands) |
| | | Managed Risk
Growth Fund | | | Managed Risk
International Fund | | | Managed Risk Blue Chip
Income and Growth Fund | |
| | | Year ended December 31, | | | Year ended December 31, | | | Year ended December 31, | |
| | | 2020 | | | 2019 | | | 2020 | | | 2019 | | | 2020 | | | 2019 | |
| Operations: | | | | | | | | | | | | | | | | | | | | | | | | |
| Net investment income (loss) | | $ | 962 | | | $ | 2,886 | | | $ | 662 | | | $ | 1,940 | | | $ | 4,092 | | | $ | 5,680 | |
| Net realized gain (loss) | | | 27,752 | | | | 30,629 | | | | (13,879 | ) | | | 2,677 | | | | (64,328 | ) | | | 16,823 | |
| Net unrealized appreciation (depreciation) | | | 110,658 | | | | 43,736 | | | | 19,066 | | | | 21,114 | | | | 56,976 | | | | 23,125 | |
| Net increase (decrease) in net assets resulting from operations | | | 139,372 | | | | 77,251 | | | | 5,849 | | | | 25,731 | | | | (3,260 | ) | | | 45,628 | |
| Distributions paid to shareholders | | | (25,274 | ) | | | (30,222 | ) | | | (3,247 | ) | | | (7,796 | ) | | | (16,900 | ) | | | (23,415 | ) |
| | | | | | | | | | | | | | | | | | | | | | | | | |
| Net capital share transactions | | | 10,698 | | | | 49,348 | | | | 1,198 | | | | (3,125 | ) | | | 11,085 | | | | 6,553 | |
| | | | | | | | | | | | | | | | | | | | | | | | | |
| Total increase (decrease) in net assets | | | 124,796 | | | | 96,377 | | | | 3,800 | | | | 14,810 | | | | (9,075 | ) | | | 28,766 | |
| | | | | | | | | | | | | | | | | | | | | | | | | |
| Net assets: | | | | | | | | | | | | | | | | | | | | | | | | |
| Beginning of year | | | 439,650 | | | | 343,273 | | | | 165,769 | | | | 150,959 | | | | 365,435 | | | | 336,669 | |
| End of year | | $ | 564,446 | | | $ | 439,650 | | | $ | 169,569 | | | $ | 165,769 | | | $ | 356,360 | | | $ | 365,435 | |
| | | | | | | | | | | | | | | | | | | | | | | | | |
| | | Managed Risk
Growth-Income Fund | | | Managed Risk
Asset Allocation Fund | | | | | | | | | |
| | | Year ended December 31, | | | Year ended December 31, | | | | | | | | | |
| | | | 2020 | | | | 2019 | | | | 2020 | | | | 2019 | | | | | | | | | |
| Operations: | | | | | | | | | | | | | | | | | | | | | | | | |
| Net investment income (loss) | | $ | 27,259 | | | $ | 35,433 | | | $ | 30,915 | | | $ | 40,653 | | | | | | | | | |
| Net realized gain (loss) | | | 38,669 | | | | 149,567 | | | | (41,687 | ) | | | 131,826 | | | | | | | | | |
| Net unrealized appreciation (depreciation) | | | 145,694 | | | | 180,419 | | | | 161,153 | | | | 271,610 | | | | | | | | | |
| Net increase (decrease) in net assets resulting from operations | | | 211,622 | | | | 365,419 | | | | 150,381 | | | | 444,089 | | | | | | | | | |
| Distributions paid to shareholders | | | (160,767 | ) | | | (32,440 | ) | | | (146,678 | ) | | | (177,811 | ) | | | | | | | | |
| | | | | | | | | | | | | | | | | | | | | | | | | |
| Net capital share transactions | | | 114,037 | | | | 44,643 | | | | (57,436 | ) | | | 23,729 | | | | | | | | | |
| | | | | | | | | | | | | | | | | | | | | | | | | |
| Total increase (decrease) in net assets | | | 164,892 | | | | 377,622 | | | | (53,733 | ) | | | 290,007 | | | | | | | | | |
| | | | | | | | | | | | | | | | | | | | | | | | | |
| Net assets: | | | | | | | | | | | | | | | | | | | | | | | | |
| Beginning of year | | | 2,269,724 | | | | 1,892,102 | | | | 2,832,504 | | | | 2,542,497 | | | | | | | | | |
| End of year | | $ | 2,434,616 | | | $ | 2,269,724 | | | $ | 2,778,771 | | | $ | 2,832,504 | | | | | | | | | |
See notes to financial statements.
| American Funds Insurance Series | 255 |
Notes to financial statements
1. Organization
American Funds Insurance Series (the “series”) is registered under the Investment Company Act of 1940 as an open-end, diversified management investment company with 34 different funds (“the funds”), including 23 funds in the series covered in this report. The other 11 funds in the series are covered in separate reports. Six funds in the series are covered in the American Funds Insurance Series -Target Date Series report and five funds in the series are covered in the American Funds Insurance Series - Portfolio Series report. The assets of each fund are segregated, with each fund accounted for separately. Capital Research and Management Company (“CRMC”) is the series’ investment adviser. Milliman Financial Risk Management LLC (“Milliman FRM”) is the subadviser for the risk management strategy for eight of the funds (the “managed risk funds”), five of which are covered in this report.
The managed risk funds covered in this report are Managed Risk Growth Fund, Managed Risk International Fund, Managed Risk Blue Chip Income and Growth Fund, Managed Risk Growth-Income Fund and Managed Risk Asset Allocation Fund. The managed risk funds invest in other funds within the series (the “underlying funds”) and employ Milliman FRM to implement the risk management strategy, which consists of using hedging instruments — primarily short positions on exchange-traded futures contracts — to attempt to stabilize the volatility of the funds around target volatility levels and reduce the downside exposure of the funds during periods of significant market declines.
Shareholders approved a proposal to reorganize the series from a Massachusetts business trust to a Delaware statutory trust. The series reserved the right to delay implementing the reorganization and has elected to do so.
The investment objective(s) for each fund covered in this report are as follows:
Global Growth Fund — To provide long-term growth of capital.
Global Small Capitalization Fund — To provide long-term growth of capital.
Growth Fund — To provide growth of capital.
International Fund — To provide long-term growth of capital.
New World Fund — To provide long-term capital appreciation.
Blue Chip Income and Growth Fund — To produce income exceeding the average yield on U.S. stocks generally and to provide an opportunity for growth of principal consistent with sound common stock investing.
Global Growth and Income Fund — To provide long-term growth of capital while providing current income.
Growth-Income Fund — To achieve long-term growth of capital and income.
International Growth and Income Fund — To provide long-term growth of capital while providing current income.
Capital Income Builder — The two primary objectives are (1) to provide a level of current income that exceeds the average yield on U.S. stocks generally and (2) to provide a growing stream of income over the years. The secondary objective is to provide growth of capital.
Asset Allocation Fund — To provide high total return (including income and capital gains) consistent with preservation of capital over the long term.
Global Balanced Fund — Seeks the balanced accomplishment of three objectives: long-term growth of capital, conservation of principal and current income.
Bond Fund — To provide as high a level of current income as is consistent with the preservation of capital.
Capital World Bond Fund (formerly Global Bond Fund) — To provide, over the long term, a high level of total return consistent with prudent investment management.
| 256 | American Funds Insurance Series |
High-Income Bond Fund — The primary objective is to provide a high level of current income. The secondary objective is capital appreciation.
American Funds Mortgage Fund (formerly Mortgage Fund) — To provide current income and preservation of capital.
Ultra-Short Bond Fund — To provide current income, consistent with the maturity and quality standards applicable to the fund, and preservation of capital and liquidity.
U.S. Government/AAA-Rated Securities Fund — To provide a high level of current income consistent with preservation of capital.
Managed Risk Growth Fund — To provide growth of capital while seeking to manage volatility and provide downside protection.
Managed Risk International Fund — To provide long-term growth of capital while seeking to manage volatility and provide downside protection.
Managed Risk Blue Chip Income and Growth Fund — To produce income exceeding the average yield on U.S. stocks generally and to provide an opportunity for growth of principal consistent with sound common stock investing, in each case while seeking to manage volatility and provide downside protection.
Managed Risk Growth-Income Fund — To achieve long-term growth of capital and income while seeking to manage volatility and provide downside protection.
Managed Risk Asset Allocation Fund — To provide high total return (including income and capital gains) consistent with preservation of capital over the long term while seeking to manage volatility and provide downside protection.
Each fund in the series, except the managed risk funds, offers either four or five share classes (Classes 1, 1A, 2, 3 or 4); the managed risk funds offer two share classes (Classes P1 and P2). Holders of all share classes of each fund have equal pro rata rights to assets, dividends and liquidation proceeds of each fund held. Each share class of each fund has identical voting rights, except for the exclusive right to vote on matters affecting only its class. Share classes have different fees and expenses (“class-specific fees and expenses”), primarily due to different arrangements for certain distribution expenses. Differences in class-specific fees and expenses will result in differences in net investment income and, therefore, the payment of different per-share dividends by each class of each fund.
2. Significant accounting policies
Each fund is an investment company that applies the accounting and reporting guidance issued in Topic 946 by the U.S. Financial Accounting Standards Board. Each fund’s financial statements have been prepared to comply with U.S. generally accepted accounting principles (“U.S. GAAP”). These principles require the series’ investment adviser to make estimates and assumptions that affect reported amounts and disclosures. Actual results could differ from those estimates. Subsequent events, if any, have been evaluated through the date of issuance in the preparation of the financial statements. The funds follow the significant accounting policies described in this section, as well as the valuation policies described in the next section on valuation.
Security transactions and related investment income — Security transactions are recorded by the funds as of the date the trades are executed with brokers. Realized gains and losses from security transactions are determined based on the specific identified cost of the securities. In the event a security is purchased with a delayed payment date, the funds will segregate liquid assets sufficient to meet their payment obligations. Dividend income is recognized on the ex-dividend date and interest income is recognized on an accrual basis. Market discounts, premiums and original issue discounts on fixed-income securities are amortized daily over the expected life of the security.
Fees and expenses — The fees and expenses of the underlying funds held by the managed risk funds are not included in the fees and expenses reported for each of the managed risk funds; however, they are indirectly reflected in the valuation of each of the underlying funds. These fees are included in the net effective expense ratios that are provided as additional information in the financial highlights tables.
| American Funds Insurance Series | 257 |
Class allocations — Income, fees and expenses (other than class-specific fees and expenses), realized gains and losses and unrealized appreciation and depreciation are allocated daily among the various share classes of each fund based on their relative net assets. Class-specific fees and expenses, such as distribution expenses, are accrued daily and charged directly to the respective share class of each fund.
Distributions paid to shareholders — Income dividends and capital gain distributions are recorded on each fund’s ex-dividend date.
Currency translation — Assets and liabilities, including investment securities, denominated in currencies other than U.S. dollars are translated into U.S. dollars at the exchange rates supplied by one or more pricing vendors on the valuation date. Purchases and sales of investment securities and income and expenses are translated into U.S. dollars at the exchange rates on the dates of such transactions. The effects of changes in exchange rates on investment securities are included with the net realized gain or loss and net unrealized appreciation or depreciation on investments in the funds’ statements of operations. The realized gain or loss and unrealized appreciation or depreciation resulting from all other transactions denominated in currencies other than U.S. dollars are disclosed separately.
3. Valuation
CRMC, the series’ investment adviser, values the funds’ investments at fair value as defined by U.S. GAAP. The net asset value per share is calculated once daily as of the close of regular trading on the New York Stock Exchange, normally 4 p.m. New York time, each day the New York Stock Exchange is open.
Methods and inputs — The series’ investment adviser uses the following methods and inputs to establish the fair value of each fund’s assets and liabilities. Use of particular methods and inputs may vary over time based on availability and relevance as market and economic conditions evolve.
Equity securities are generally valued at the official closing price of, or the last reported sale price on, the exchange or market on which such securities are traded, as of the close of business on the day the securities are being valued or, lacking any sales, at the last available bid price. Prices for each security are taken from the principal exchange or market on which the security trades. The value of an underlying fund is based on its reported net asset value.
Fixed-income securities, including short-term securities, are generally valued at prices obtained from one or more pricing vendors. Vendors value such securities based on one or more of the inputs described in the following table. The table provides examples of inputs that are commonly relevant for valuing particular classes of fixed-income securities in which the funds are authorized to invest. However, these classifications are not exclusive and any of the inputs may be used to value any other class of fixed-income security.
| Fixed-income class | Examples of standard inputs |
| All | Benchmark yields, transactions, bids, offers, quotations from dealers and trading systems, new issues, spreads and other relationships observed in the markets among comparable securities; and proprietary pricing models such as yield measures calculated using factors such as cash flows, financial or collateral performance and other reference data (collectively referred to as “standard inputs”) |
| Corporate bonds, notes & loans; convertible securities | Standard inputs and underlying equity of the issuer |
| Bonds & notes of governments & government agencies | Standard inputs and interest rate volatilities |
| Mortgage-backed; asset-backed obligations | Standard inputs and cash flows, prepayment information, default rates, delinquency and loss assumptions, collateral characteristics, credit enhancements and specific deal information |
| Municipal securities | Standard inputs and, for certain distressed securities, cash flows or liquidation values using a net present value calculation based on inputs that include, but are not limited to, financial statements and debt contracts |
When the series’ investment adviser deems it appropriate to do so (such as when vendor prices are unavailable or not deemed to be representative), fixed-income securities will be valued in good faith at the mean quoted bid and ask prices that are reasonably and timely available (or bid prices, if ask prices are not available) or at prices for securities of comparable maturity, quality and type.
| 258 | American Funds Insurance Series |
Securities with both fixed-income and equity characteristics, or equity securities traded principally among fixed-income dealers, are generally valued in the manner described for either equity or fixed-income securities, depending on which method is deemed most appropriate by the series’ investment adviser. The Capital Group Central Cash Fund (“CCF”), a fund within the Capital Group Central Fund Series (“Central Funds”), is valued based upon a floating net asset value, which fluctuates with changes in the value of CCF’s portfolio securities. The underlying securities are valued based on the policies and procedures in CCF’s statement of additional information. The State Street Institutional U.S. Government Money Market Fund held by the managed risk funds is managed to maintain a $1.00 net asset value per share. The net asset value of each share class of each managed risk fund is calculated based on the reported net asset values of the underlying funds in which each fund invests.
Exchange-traded options and futures are generally valued at the official closing price for options and official settlement price for futures of the exchange or market on which such instruments are traded, as of the close of business on the day such instruments are being valued. Forward currency contracts are valued based on the spot and forward exchange rates obtained from one or more pricing vendors. Interest rate swaps and credit default swaps are generally valued by pricing vendors based on market inputs that include the index and term of index, reset frequency, payer/receiver, currency and pay frequency.
Securities and other assets for which representative market quotations are not readily available or are considered unreliable by the series’ investment adviser are fair valued as determined in good faith under fair value guidelines adopted by authority of the series’ board of trustees as further described. The investment adviser follows fair valuation guidelines, consistent with U.S. Securities and Exchange Commission rules and guidance, to consider relevant principles and factors when making fair value determinations. The investment adviser considers relevant indications of value that are reasonably and timely available to it in determining the fair value to be assigned to a particular security, such as the type and cost of the security; contractual or legal restrictions on resale of the security; relevant financial or business developments of the issuer; actively traded similar or related securities; conversion or exchange rights on the security; related corporate actions; significant events occurring after the close of trading in the security; and changes in overall market conditions. In addition, the closing prices of equity securities and futures that trade in markets outside U.S. time zones may be adjusted to reflect significant events that occur after the close of local trading but before the net asset value of each share class of each fund is determined. Fair valuations and valuations of investments and futures that are not actively trading involve judgment and may differ materially from valuations that would have been used had greater market activity occurred.
Processes and structure — The series’ board of trustees has delegated authority to the series’ investment adviser to make fair value determinations, subject to board oversight. The investment adviser has established a Joint Fair Valuation Committee (the “Fair Valuation Committee”) to administer, implement and oversee the fair valuation process, and to make fair value decisions. The Fair Valuation Committee regularly reviews its own fair value decisions, as well as decisions made under its standing instructions to the investment adviser’s valuation teams. The Fair Valuation Committee reviews changes in fair value measurements from period to period and may, as deemed appropriate, update the fair valuation guidelines to better reflect the results of back testing and address new or evolving issues. The Fair Valuation Committee reports any changes to the fair valuation guidelines to the board of trustees. The series’ board and audit committee also regularly review reports that describe fair value determinations and methods.
The series’ investment adviser has also established a Fixed-Income Pricing Review Group to administer and oversee the fixed-income valuation process, including the use of fixed-income pricing vendors. This group regularly reviews pricing vendor information and market data. Pricing decisions, processes and controls over security valuation are also subject to additional internal reviews, including an annual control self-evaluation program facilitated by the investment adviser’s compliance group.
Classifications — The series’ investment adviser classifies the funds’ assets and liabilities into three levels based on the inputs used to value the assets or liabilities. Level 1 values are based on quoted prices in active markets for identical securities. Level 2 values are based on significant observable market inputs, such as quoted prices for similar securities and quoted prices in inactive markets. Certain securities trading outside the U.S. may transfer between Level 1 and Level 2 due to valuation adjustments resulting from significant market movements following the close of local trading. Level 3 values are based on significant unobservable inputs that reflect the investment adviser’s determination of assumptions that market participants might reasonably use in valuing the securities.
The valuation levels are not necessarily an indication of the risk or liquidity associated with the underlying investment. For example, U.S. government securities are reflected as Level 2 because the inputs used to determine fair value may not always be quoted prices in an active market. The following tables present the funds’ valuation levels as of December 31, 2020 (dollars in thousands):
| American Funds Insurance Series | 259 |
Global Growth Fund
| | | Investment securities | |
| | | Level 1 | | | Level 2 | | | Level 3 | | | Total | |
| Assets: | | | | | | | | | | | | | | | | |
| Common stocks: | | | | | | | | | | | | | | | | |
| Information technology | | $ | 1,529,558 | | | $ | 1,083,751 | | | $ | — | | | $ | 2,613,309 | |
| Consumer discretionary | | | 888,809 | | | | 797,513 | | | | — | | | | 1,686,322 | |
| Health care | | | 703,000 | | | | 232,172 | | | | — | | | | 935,172 | |
| Financials | | | 360,183 | | | | 447,703 | | | | — | | | | 807,886 | |
| Communication services | | | 448,473 | | | | 148,180 | | | | — | | | | 596,653 | |
| Consumer staples | | | 232,624 | | | | 267,945 | | | | — | | | | 500,569 | |
| Industrials | | | 24,589 | | | | 264,798 | | | | — | | | | 289,387 | |
| Materials | | | 113,103 | | | | 38,439 | | | | — | | | | 151,542 | |
| Energy | | | — | | | | 90,882 | | | | — | | | | 90,882 | |
| Real estate | | | — | | | | 33,356 | | | | — | | | | 33,356 | |
| Utilities | | | — | | | | 18,663 | | | | — | | | | 18,663 | |
| Preferred securities | | | — | | | | 238,600 | | | | — | | | | 238,600 | |
| Short-term securities | | | 143,970 | | | | 174,987 | | | | — | | | | 318,957 | |
| Total | | $ | 4,444,309 | | | $ | 3,836,989 | | | $ | — | | | $ | 8,281,298 | |
Global Small Capitalization Fund
| | | Investment securities | |
| | | Level 1 | | | Level 2 | | | Level 3 | | | Total | |
| Assets: | | | | | | | | | | | | | | | | |
| Common stocks: | | | | | | | | | | | | | | | | |
| Information technology | | $ | 869,090 | | | $ | 566,908 | | | $ | — | | | $ | 1,435,998 | |
| Health care | | | 901,274 | | | | 317,375 | | | | 3 | | | | 1,218,652 | |
| Consumer discretionary | | | 449,210 | | | | 327,676 | | | | 2,409 | | | | 779,295 | |
| Industrials | | | 171,236 | | | | 530,019 | | | | — | | | | 701,255 | |
| Financials | | | 298,192 | | | | 98,457 | | | | — | | | | 396,649 | |
| Materials | | | 31,914 | | | | 91,606 | | | | — | | | | 123,520 | |
| Real estate | | | 72,261 | | | | 37,896 | | | | — | | | | 110,157 | |
| Communication services | | | 34,538 | | | | 71,794 | | | | — | | | | 106,332 | |
| Consumer staples | | | 79,614 | | | | 19,249 | | | | — | | | | 98,863 | |
| Utilities | | | 5,859 | | | | 59,096 | | | | — | | | | 64,955 | |
| Energy | | | 13,972 | | | | — | | | | 10,434 | | | | 24,406 | |
| Preferred securities | | | 19,092 | | | | — | | | | 77,191 | | | | 96,283 | |
| Rights & warrants | | | — | | | | 1,580 | | | | — | | | | 1,580 | |
| Convertible stocks | | | — | | | | — | | | | 13,854 | | | | 13,854 | |
| Short-term securities | | | 86,874 | | | | 136,990 | | | | — | | | | 223,864 | |
| Total | | $ | 3,033,126 | | | $ | 2,258,646 | | | $ | 103,891 | | | $ | 5,395,663 | |
The following table reconciles the valuation of the fund’s Level 3 investment securities and related transactions for the year ended December 31, 2020 (dollars in thousands):
| | | Beginning
value at
1/1/2020 | | | Transfers
into
Level 3* | | | Purchases | | | Sales | | | Net
realized
loss† | | | Unrealized
appreciation† | | | Transfers
out of
Level 3* | | | Ending
value at
12/31/2020 | |
| Investment securities | | $ | 44,058 | | | $ | 914 | | | $ | 52,617 | | | $ | (10,017 | ) | | $ | (4,877 | ) | | $ | 21,196 | | | $ | — | | | $ | 103,891 | |
| | | | | | | | | | | | | | | | | | | | | | | | | | | | | | | | | |
| Net unrealized appreciation during the period on Level 3 investment securities held at December 31, 2020 | | | $ | 21,196 | |
| * | Transfers into or out of Level 3 are based on the beginning market value of the quarter in which they occurred. These transfers are the result of changes in the availability of pricing sources and/or in the observability of significant inputs used in valuing the securities. |
| † | Net realized loss and unrealized appreciation are included in the related amounts on investments in the statement of operations. |
| 260 | American Funds Insurance Series |
Unobservable inputs — Valuation of the fund’s Level 3 securities is based on significant unobservable inputs that reflect the investment adviser’s determination of assumptions that market participants might reasonably use in valuing the securities. The following table provides additional information used by the fund’s investment adviser to fair value the fund’s Level 3 securities (dollars in thousands):
| | | Value at
12/31/2020 | | | Valuation
techniques | | Unobservable
inputs | | Range
(if applicable) | | Weighted
average* | | Impact to
valuation from
an increase in
input† |
| | | | | | | Liquidation value | | N/A | | N/A | | N/A | | N/A |
| | | | | | | | | Price/Cash flow multiple | | 8.8x | | 8.8x | | Increase |
| Common stocks | | $ | 12,846 | | | Market comparable | | DLOM | | 25% | | 25% | | Decrease |
| | | | | | | companies | | $ per one billion Btu | | $2.25 | | $2.25 | | Increase |
| | | | | | | | | MMTPA | | 10 MMTPA | | 10 MMTPA | | Increase |
| | | | | | | Transaction price | | N/A | | N/A | | N/A | | N/A |
| Preferred securities | | | 77,191 | | | Transaction price | | N/A | | N/A | | N/A | | N/A |
| Convertible stocks | | | 13,854 | | | Transaction price | | N/A | | N/A | | N/A | | N/A |
| | | $ | 103,891 | | | | | | | | | | | |
| * | Weighted average is by relative fair value. |
| † | This column represents the directional change in fair value of the Level 3 securities that would result in an increase from the corresponding input. A decrease to the unobservable input would have the opposite effect. Significant increases and decreases in these inputs in isolation could result in significantly higher or lower fair value measurements. |
Key to abbreviations
Btu = British thermal unit
DLOM = Discount for lack of marketability
MMTPA = Million metric tonnes per annum
Growth Fund
| | | Investment securities | |
| | | Level 1 | | | Level 2 | | | Level 3 | | | Total | |
| Assets: | | | | | | | | | | | | |
| Common stocks: | | | | | | | | | | | | |
| Information technology | | $ | 7,806,427 | | | $ | 988,629 | | | $ | — | | | $ | 8,795,056 | |
| Consumer discretionary | | | 6,912,136 | | | | 416,283 | | | | — | | | | 7,328,419 | |
| Communication services | | | 7,012,728 | | | | — | | | | — | | | | 7,012,728 | |
| Health care | | | 4,816,461 | | | | 77,537 | | | | 59,453 | | | | 4,953,451 | |
| Industrials | | | 2,820,844 | | | | 464,847 | | | | — | | | | 3,285,691 | |
| Financials | | | 2,051,508 | | | | 62,053 | | | | — | | | | 2,113,561 | |
| Consumer staples | | | 1,046,415 | | | | 205,883 | | | | — | | | | 1,252,298 | |
| Materials | | | 1,167,722 | | | | 33,980 | | | | — | | | | 1,201,702 | |
| Energy | | | 644,723 | | | | — | | | | — | | | | 644,723 | |
| Real estate | | | 369,502 | | | | — | | | | — | | | | 369,502 | |
| Utilities | | | 190,565 | | | | 25,624 | | | | — | | | | 216,189 | |
| Preferred securities | | | — | | | | 44,452 | | | | — | | | | 44,452 | |
| Convertible bonds & notes | | | — | | | | — | | | | 29,464 | | | | 29,464 | |
| Short-term securities | | | 1,630,494 | | | | — | | | | — | | | | 1,630,494 | |
| Total | | $ | 36,469,525 | | | $ | 2,319,288 | | | $ | 88,917 | | | $ | 38,877,730 | |
| American Funds Insurance Series | 261 |
| International Fund | | | | | | | | | | | | |
| | | Investment securities | |
| | | Level 1 | | | Level 2 | | | Level 3 | | | Total | |
| Assets: | | | | | | | | | | | | | | | | |
| Common stocks: | | | | | | | | | | | | | | | | |
| Financials | | $ | 160,866 | | | $ | 1,645,671 | | | $ | — | | | $ | 1,806,537 | |
| Consumer discretionary | | | 421,417 | | | | 1,154,375 | | | | — | | | | 1,575,792 | |
| Health care | | | 131,197 | | | | 1,414,294 | | | | 6 | | | | 1,545,497 | |
| Industrials | | | 95,045 | | | | 1,127,312 | | | | — | | | | 1,222,357 | |
| Information technology | | | 358,778 | | | | 504,666 | | | | — | | | | 863,444 | |
| Communication services | | | 98,771 | | | | 715,574 | | | | — | | | | 814,345 | |
| Energy | | | 98,446 | | | | 562,531 | | | | — | | | | 660,977 | |
| Materials | | | 375,154 | | | | 181,706 | | | | — | | | | 556,860 | |
| Consumer staples | | | 8,249 | | | | 449,366 | | | | — | | | | 457,615 | |
| Utilities | | | — | | | | 347,713 | | | | — | | | | 347,713 | |
| Real estate | | | — | | | | 83,229 | | | | — | | | | 83,229 | |
| Preferred securities | | | 70,086 | | | | 56,376 | | | | — | | | | 126,462 | |
| Rights & warrants | | | 236 | | | | 41,615 | | | | — | | | | 41,851 | |
| Convertible bonds & notes | | | — | | | | 1,260 | | | | — | | | | 1,260 | |
| Bonds, notes & other debt instruments | | | — | | | | 17,814 | | | | — | | | | 17,814 | |
| Short-term securities | | | 537,819 | | | | — | | | | — | | | | 537,819 | |
| Total | | $ | 2,356,064 | | | $ | 8,303,502 | | | $ | 6 | | | $ | 10,659,572 | |
| | | | | | | | | | | | | | | | | |
| | | Other investments* |
| | | | Level 1 | | | | Level 2 | | | | Level 3 | | | | Total | |
| Assets: | | | | | | | | | | | | | | | | |
| Unrealized appreciation on open forward currency contracts | | $ | — | | | $ | 309 | | | $ | — | | | $ | 309 | |
| Liabilities: | | | | | | | | | | | | | | | | |
| Unrealized depreciation on open forward currency contracts | | | — | | | | (395 | ) | | | — | | | | (395 | ) |
| Total | | $ | — | | | $ | (86 | ) | | $ | — | | | $ | (86 | ) |
| * | Forward currency contracts are not included in the investment portfolio. |
| New World Fund | | | | | | | | | | | | | | | | |
| | | | | | | | | | | | | | | | | |
| | | Investment securities | |
| | | | Level 1 | | | | Level 2 | | | | Level 3 | | | | Total | |
| Assets: | | | | | | | | | | | | | | | | |
| Common stocks: | | | | | | | | | | | | | | | | |
| Information technology | | $ | 540,290 | | | $ | 265,260 | | | $ | — | | | $ | 805,550 | |
| Consumer discretionary | | | 184,433 | | | | 426,480 | | | | — | | | | 610,913 | |
| Health care | | | 220,288 | | | | 303,860 | | | | 1 | | | | 524,149 | |
| Financials | | | 98,824 | | | | 367,872 | | | | — | | | | 466,696 | |
| Communication services | | | 242,323 | | | | 108,859 | | | | — | | | | 351,182 | |
| Materials | | | 126,066 | | | | 126,416 | | | | — | | | | 252,482 | |
| Industrials | | | 57,626 | | | | 193,144 | | | | — | | | | 250,770 | |
| Consumer staples | | | 32,600 | | | | 209,655 | | | | — | | | | 242,255 | |
| Energy | | | 55,068 | | | | 104,845 | | | | — | | | | 159,913 | |
| Real estate | | | 21,814 | | | | 49,427 | | | | — | | | | 71,241 | |
| Utilities | | | 8,127 | | | | 61,070 | | | | — | | | | 69,197 | |
| Preferred securities | | | 31,214 | | | | 17,203 | | | | — | * | | | 48,417 | |
| Rights & warrants | | | 37 | | | | 11,204 | | | | — | | | | 11,241 | |
| Convertible bonds & notes | | | — | | | | 120 | | | | — | | | | 120 | |
| Bonds, notes & other debt instruments | | | — | | | | 120,130 | | | | — | | | | 120,130 | |
| Short-term securities | | | 238,517 | | | | — | | | | — | | | | 238,517 | |
| Total | | $ | 1,857,227 | | | $ | 2,365,545 | | | $ | 1 | | | $ | 4,222,773 | |
| 262 | American Funds Insurance Series |
| | | Other investments† | |
| | | Level 1 | | | Level 2 | | | Level 3 | | | Total | |
| Assets: | | | | | | | | | | | | | | | | |
| Unrealized appreciation on futures contracts | | $ | 3 | | | $ | — | | | $ | — | | | $ | 3 | |
| Liabilities: | | | | | | | | | | | | | | | | |
| Unrealized depreciation on futures contracts | | | (13 | ) | | | — | | | | — | | | | (13 | ) |
| Unrealized depreciation on open forward currency contracts | | | — | | | | (54 | ) | | | — | | | | (54 | ) |
| Total | | $ | (10 | ) | | $ | (54 | ) | | $ | — | | | $ | (64 | ) |
| * | Amount less than one thousand. |
| † | Futures contracts and forward currency contracts are not included in the investment portfolio. |
| Blue Chip Income and Growth Fund | | | | | | | | | | | | | | | | |
| | | | | | | | | | | | | | | | | |
| | | Investment securities | |
| | | | Level 1 | | | | Level 2 | | | | Level 3 | | | | Total | |
| Assets: | | | | | | | | | | | | | | | | |
| Common stocks: | | | | | | | | | | | | | | | | |
| Health care | | $ | 1,660,102 | | | $ | — | | | $ | — | | | $ | 1,660,102 | |
| Information technology | | | 1,639,123 | | | | — | | | | — | | | | 1,639,123 | |
| Industrials | | | 1,299,142 | | | | — | | | | — | | | | 1,299,142 | |
| Communication services | | | 907,314 | | | | — | | | | — | | | | 907,314 | |
| Energy | | | 866,464 | | | | — | | | | — | | | | 866,464 | |
| Consumer staples | | | 782,008 | | | | — | | | | — | | | | 782,008 | |
| Consumer discretionary | | | 730,730 | | | | — | | | | — | | | | 730,730 | |
| Financials | | | 668,246 | | | | — | | | | — | | | | 668,246 | |
| Utilities | | | 327,959 | | | | — | | | | — | | | | 327,959 | |
| Materials | | | 246,839 | | | | — | | | | — | | | | 246,839 | |
| Real estate | | | 167,648 | | | | — | | | | — | | | | 167,648 | |
| Rights & warrants | | | 138 | | | | — | | | | — | | | | 138 | |
| Convertible stocks | | | 85,580 | | | | — | | | | — | | | | 85,580 | |
| Convertible bonds & notes | | | — | | | | 13,651 | | | | — | | | | 13,651 | |
| Short-term securities | | | 181,762 | | | | — | | | | — | | | | 181,762 | |
| Total | | $ | 9,563,055 | | | $ | 13,651 | | | $ | — | | | $ | 9,576,706 | |
| | | | | | | | | | | | | | | | | |
| Global Growth and Income Fund | | | | | | | | | | | | | | | | |
| | | | | | | | | | | | | | | | | |
| | | Investment securities | |
| | | | Level 1 | | | | Level 2 | | | | Level 3 | | | | Total | |
| Assets: | | | | | | | | | | | | | | | | |
| Common stocks: | | | | | | | | | | | | | | | | |
| Information technology | | $ | 221,121 | | | $ | 181,276 | | | $ | — | | | $ | 402,397 | |
| Financials | | | 141,374 | | | | 202,553 | | | | — | | | | 343,927 | |
| Industrials | | | 126,976 | | | | 119,227 | | | | — | | | | 246,203 | |
| Health care | | | 128,044 | | | | 70,127 | | | | — | | | | 198,171 | |
| Consumer discretionary | | | 85,765 | | | | 111,886 | | | | — | | | | 197,651 | |
| Communication services | | | 145,542 | | | | 20,262 | | | | — | | | | 165,804 | |
| Utilities | | | 27,113 | | | | 104,117 | | | | — | | | | 131,230 | |
| Materials | | | 42,123 | | | | 83,017 | | | | — | | | | 125,140 | |
| Energy | | | 39,179 | | | | 61,420 | | | | — | | | | 100,599 | |
| Consumer staples | | | 32,426 | | | | 64,723 | | | | — | | | | 97,149 | |
| Real estate | | | 28,798 | | | | 25,958 | | | | — | | | | 54,756 | |
| Bonds, notes & other debt instruments | | | — | | | | 34,378 | | | | — | | | | 34,378 | |
| Short-term securities | | | 72,929 | | | | — | | | | — | | | | 72,929 | |
| Total | | $ | 1,091,390 | | | $ | 1,078,944 | | | $ | — | | | $ | 2,170,334 | |
| American Funds Insurance Series | 263 |
| Growth-Income Fund | | | | | | | | | | | | |
| | | | | | | | | | | | | |
| | | Investment securities | |
| | | Level 1 | | | Level 2 | | | Level 3 | | | Total | |
| Assets: | | | | | | | | | | | | | | | | |
| Common stocks: | | | | | | | | | | | | | | | | |
| Information technology | | $ | 7,314,726 | | | $ | 372,663 | | | $ | — | | | $ | 7,687,389 | |
| Communication services | | | 5,831,851 | | | | 127,572 | | | | — | | | | 5,959,423 | |
| Health care | | | 4,693,629 | | | | 779,632 | | | | — | | | | 5,473,261 | |
| Financials | | | 3,867,153 | | | | 71,057 | | | | — | | | | 3,938,210 | |
| Industrials | | | 3,235,391 | | | | 420,599 | | | | — | | | | 3,655,990 | |
| Consumer discretionary | | | 2,997,262 | | | | 125,349 | | | | — | | | | 3,122,611 | |
| Consumer staples | | | 1,207,072 | | | | 739,995 | | | | — | | | | 1,947,067 | |
| Materials | | | 1,780,708 | | | | 100,975 | | | | — | | | | 1,881,683 | |
| Energy | | | 1,316,148 | | | | 1,473 | | | | — | | | | 1,317,621 | |
| Utilities | | | 900,859 | | | | 210,300 | | | | — | | | | 1,111,159 | |
| Real estate | | | 983,845 | | | | — | | | | — | | | | 983,845 | |
| Convertible stocks | | | 311,050 | | | | — | | | | — | | | | 311,050 | |
| Bonds, notes & other debt instruments | | | — | | | | 44,819 | | | | — | | | | 44,819 | |
| Short-term securities | | | 1,180,227 | | | | — | | | | — | | | | 1,180,227 | |
| Total | | $ | 35,619,921 | | | $ | 2,994,434 | | | $ | — | | | $ | 38,614,355 | |
| | | | | | | | | | | | | | | | | |
| International Growth and Income Fund | | | | | | | | | | | | | | | | |
| | | | | | | | | | | | | | | | | |
| | | Investment securities | |
| | | | Level 1 | | | | Level 2 | | | | Level 3 | | | | Total | |
| Assets: | | | | | | | | | | | | | | | | |
| Common stocks: | | | | | | | | | | | | | | | | |
| Financials | | $ | 21,452 | | | $ | 238,557 | | | $ | — | | | $ | 260,009 | |
| Industrials | | | 19,686 | | | | 168,699 | | | | — | | | | 188,385 | |
| Communication services | | | 38,634 | | | | 137,544 | | | | — | | | | 176,178 | |
| Consumer discretionary | | | — | | | | 173,323 | | | | — | | | | 173,323 | |
| Health care | | | 6,388 | | | | 133,573 | | | | 4 | | | | 139,965 | |
| Materials | | | 49,909 | | | | 51,472 | | | | — | | | | 101,381 | |
| Consumer staples | | | 11,591 | | | | 86,293 | | | | — | | | | 97,884 | |
| Information technology | | | 20,812 | | | | 57,262 | | | | — | | | | 78,074 | |
| Utilities | | | — | | | | 75,755 | | | | — | | | | 75,755 | |
| Energy | | | 14,453 | | | | 26,884 | | | | — | | | | 41,337 | |
| Real estate | | | — | | | | 38,742 | | | | — | | | | 38,742 | |
| Preferred securities | | | 24,328 | | | | — | | | | — | | | | 24,328 | |
| Rights & warrants | | | — | | | | 15,297 | | | | — | | | | 15,297 | |
| Bonds, notes & other debt instruments | | | — | | | | 8,880 | | | | — | | | | 8,880 | |
| Short-term securities | | | 38,140 | | | | — | | | | — | | | | 38,140 | |
| Total | | $ | 245,393 | | | $ | 1,212,281 | | | $ | 4 | | | $ | 1,457,678 | |
| 264 | American Funds Insurance Series |
| Capital Income Builder | | | | | | | | | | | | |
| | | | | | | | | | | | | |
| | | Investment securities | |
| | | Level 1 | | | Level 2 | | | Level 3 | | | Total | |
| Assets: | | | | | | | | | | | | | | | | |
| Common stocks: | | | | | | | | | | | | | | | | |
| Financials | | $ | 82,959 | | | $ | 60,554 | | | $ | — | | | $ | 143,513 | |
| Information technology | | | 78,576 | | | | 21,313 | | | | — | | | | 99,889 | |
| Consumer staples | | | 53,173 | | | | 45,939 | | | | — | | | | 99,112 | |
| Health care | | | 64,546 | | | | 33,275 | | | | — | | | | 97,821 | |
| Utilities | | | 35,050 | | | | 55,511 | | | | — | | | | 90,561 | |
| Real estate | | | 43,561 | | | | 18,295 | | | | — | | | | 61,856 | |
| Communication services | | | 29,639 | | | | 26,431 | | | | — | | | | 56,070 | |
| Energy | | | 40,675 | | | | 9,228 | | | | — | | | | 49,903 | |
| Industrials | | | 26,773 | | | | 20,099 | | | | — | | | | 46,872 | |
| Materials | | | 19,808 | | | | 22,725 | | | | — | | | | 42,533 | |
| Consumer discretionary | | | 6,747 | | | | 6,761 | | | | — | | | | 13,508 | |
| Preferred securities | | | — | | | | 1,987 | | | | — | | | | 1,987 | |
| Rights & warrants | | | 2 | | | | — | | | | — | | | | 2 | |
| Convertible stocks | | | 13,837 | | | | — | | | | — | | | | 13,837 | |
| Convertible bonds & notes | | | — | | | | 784 | | | | — | | | | 784 | |
| Bonds, notes & other debt instruments: | | | | | | | | | | | | | | | | |
| U.S. Treasury bonds & notes | | | — | | | | 100,873 | | | | — | | | | 100,873 | |
| Corporate bonds, notes & loans | | | — | | | | 65,564 | | | | — | | | | 65,564 | |
| Mortgage-backed obligations | | | — | | | | 55,671 | | | | — | | | | 55,671 | |
| Asset-backed obligations | | | — | | | | 3,801 | | | | — | | | | 3,801 | |
| Bonds & notes of governments & government agencies outside the U.S. | | | — | | | | 1,465 | | | | — | | | | 1,465 | |
| Municipals | | | — | | | | 671 | | | | — | | | | 671 | |
| Short-term securities | | | 57,947 | | | | — | | | | — | | | | 57,947 | |
| Total | | $ | 553,293 | | | $ | 550,947 | | | $ | — | | | $ | 1,104,240 | |
| | | | | | | | | | | | | | | | | |
| | | Other investments* | |
| | | | Level 1 | | | | Level 2 | | | | Level 3 | | | | Total | |
| Assets: | | | | | | | | | | | | | | | | |
| Unrealized appreciation on futures contracts | | $ | 39 | | | $ | — | | | $ | — | | | $ | 39 | |
| Unrealized appreciation on open forward currency contracts | | | — | | | | 34 | | | | — | | | | 34 | |
| Unrealized appreciation on interest rate swaps | | | — | | | | 569 | | | | — | | | | 569 | |
| Unrealized appreciation on credit default swaps | | | — | | | | 152 | | | | — | | | | 152 | |
| Liabilities: | | | | | | | | | | | | | | | | |
| Unrealized depreciation on futures contracts | | | (89 | ) | | | — | | | | — | | | | (89 | ) |
| Unrealized depreciation on open forward currency contracts | | | — | | | | (56 | ) | | | — | | | | (56 | ) |
| Total | | $ | (50 | ) | | $ | 699 | | | $ | — | | | $ | 649 | |
| * | Futures contracts, forward currency contracts, interest rate swaps and credit default swaps are not included in the investment portfolio. |
| American Funds Insurance Series | 265 |
| Asset Allocation Fund | | | | | | | | | | | | |
| | | | | | | | | | | | | |
| | | Investment securities | |
| | | Level 1 | | | Level 2 | | | Level 3 | | | Total | |
| Assets: | | | | | | | | | | | | | | | | |
| Common stocks: | | | | | | | | | | | | | | | | |
| Information technology | | $ | 4,856,907 | | | $ | 33,828 | | | $ | — | | | $ | 4,890,735 | |
| Health care | | | 3,027,835 | | | | 132,799 | | | | 13,074 | | | | 3,173,708 | |
| Financials | | | 2,855,589 | | | | 215,356 | | | | 482 | | | | 3,071,427 | |
| Consumer discretionary | | | 1,813,842 | | | | 160,516 | | | | — | | | | 1,974,358 | |
| Consumer staples | | | 1,182,011 | | | | 393,999 | | | | — | | | | 1,576,010 | |
| Communication services | | | 1,415,480 | | | | 70,510 | | | | — | | | | 1,485,990 | |
| Industrials | | | 1,133,507 | | | | 126,186 | | | | 10,677 | | | | 1,270,370 | |
| Materials | | | 842,103 | | | | 93,530 | | | | — | | | | 935,633 | |
| Energy | | | 430,949 | | | | 21,035 | | | | 843 | | | | 452,827 | |
| Real estate | | | 380,620 | | | | — | | | | — | | | | 380,620 | |
| Utilities | | | 54,107 | | | | 242,361 | | | | — | | | | 296,468 | |
| Rights & warrants | | | — | | | | — | | | | — | * | | | — | * |
| Convertible stocks | | | 102,652 | | | | 45,378 | | | | — | | | | 148,030 | |
| Bonds, notes & other debt instruments: | | | | | | | | | | | | | | | | |
| Corporate bonds, notes & loans | | | — | | | | 3,849,701 | | | | 4,079 | | | | 3,853,780 | |
| U.S. Treasury bonds & notes | | | — | | | | 2,511,880 | | | | — | | | | 2,511,880 | |
| Mortgage-backed obligations | | | — | | | | 2,198,957 | | | | — | | | | 2,198,957 | |
| Asset-backed obligations | | | — | | | | 235,287 | | | | — | | | | 235,287 | |
| Bonds & notes of governments & government agencies outside the U.S. | | | — | | | | 60,892 | | | | — | | | | 60,892 | |
| Federal agency bonds & notes | | | — | | | | 37,568 | | | | — | | | | 37,568 | |
| Municipals | | | — | | | | 33,381 | | | | — | | | | 33,381 | |
| Short-term securities | | | 2,286,334 | | | | — | | | | — | | | | 2,286,334 | |
| Total | | $ | 20,381,936 | | | $ | 10,463,164 | | | $ | 29,155 | | | $ | 30,874,255 | |
| | | | | | | | | | | | | | | | | |
| | | Other investments† | |
| | | | Level 1 | | | | Level 2 | | | | Level 3 | | | | Total | |
| Assets: | | | | | | | | | | | | | | | | |
| Unrealized appreciation on futures contracts | | $ | 1,610 | | | $ | — | | | $ | — | | | $ | 1,610 | |
| Unrealized appreciation on interest rate swaps | | | — | | | | 796 | | | | — | | | | 796 | |
| Unrealized appreciation on credit default swaps | | | — | | | | — | * | | | — | | | | — | * |
| Liabilities: | | | | | | | | | | | | | | | | |
| Unrealized depreciation on futures contracts | | | (2,382 | ) | | | — | | | | — | | | | (2,382 | ) |
| Total | | $ | (772 | ) | | $ | 796 | | | $ | — | | | $ | 24 | |
| * | Amount less than one thousand. |
| † | Futures contracts, interest rate swaps and credit default swaps are not included in the investment portfolio. |
| 266 | American Funds Insurance Series |
| Global Balanced Fund | | | | | | | | | | | | |
| | | | | | | | | | | | | |
| | | Investment securities | |
| | | Level 1 | | | Level 2 | | | Level 3 | | | Total | |
| Assets: | | | | | | | | | | | | | | | | |
| Common stocks: | | | | | | | | | | | | | | | | |
| Information technology | | $ | 31,289 | | | $ | 35,492 | | | $ | — | | | $ | 66,781 | |
| Health care | | | 23,553 | | | | 16,623 | | | | — | | | | 40,176 | |
| Financials | | | 17,316 | | | | 15,833 | | | | — | | | | 33,149 | |
| Consumer staples | | | 14,677 | | | | 14,073 | | | | — | | | | 28,750 | |
| Consumer discretionary | | | 12,713 | | | | 11,275 | | | | — | | | | 23,988 | |
| Industrials | | | 9,037 | | | | 13,659 | | | | — | | | | 22,696 | |
| Communication services | | | 6,435 | | | | 6,573 | | | | — | | | | 13,008 | |
| Materials | | | 3,927 | | | | 9,077 | | | | — | | | | 13,004 | |
| Real estate | | | 8,992 | | | | 3,272 | | | | — | | | | 12,264 | |
| Energy | | | 5,708 | | | | — | | | | — | | | | 5,708 | |
| Utilities | | | 852 | | | | 3,696 | | | | — | | | | 4,548 | |
| Preferred securities | | | — | | | | 2,055 | | | | — | | | | 2,055 | |
| Bonds, notes & other debt instruments: | | | | | | | | | | | | | | | | |
| Bonds & notes of governments & government agencies outside the U.S. | | | — | | | | 67,135 | | | | — | | | | 67,135 | |
| U.S. Treasury bonds & notes | | | — | | | | 49,388 | | | | — | | | | 49,388 | |
| Corporate bonds, notes & loans | | | — | | | | 21,861 | | | | — | | | | 21,861 | |
| Mortgage-backed obligations | | | — | | | | 6,454 | | | | — | | | | 6,454 | |
| Municipals | | | — | | | | 186 | | | | — | | | | 186 | |
| Asset-backed obligations | | | — | | | | 95 | | | | — | | | | 95 | |
| Short-term securities | | | 24,329 | | | | 17,999 | | | | — | | | | 42,328 | |
| Total | | $ | 158,828 | | | $ | 294,746 | | | $ | — | | | $ | 453,574 | |
| | | | | | | | | | | | | | | | | |
| | | Other investments* | |
| | | | Level 1 | | | | Level 2 | | | | Level 3 | | | | Total | |
| Assets: | | | | | | | | | | | | | | | | |
| Unrealized appreciation on futures contracts | | $ | 3 | | | $ | — | | | $ | — | | | $ | 3 | |
| Unrealized appreciation on open forward currency contracts | | | — | | | | 257 | | | | — | | | | 257 | |
| Unrealized appreciation on interest rate swaps | | | — | | | | 21 | | | | — | | | | 21 | |
| Liabilities: | | | | | | | | | | | | | | | | |
| Unrealized depreciation on open forward currency contracts | | | — | | | | (259 | ) | | | — | | | | (259 | ) |
| Unrealized depreciation on credit default swaps | | | — | | | | — | † | | | — | | | | — | † |
| Total | | $ | 3 | | | $ | 19 | | | $ | — | | | $ | 22 | |
| * | Futures contracts, forward currency contracts, interest rate swaps and credit default swaps are not included in the investment portfolio. |
| † | Amount less than one thousand. |
| Bond Fund | | | | | | | | | | | | |
| | | | | | | | | | | | | |
| | | Investment securities | |
| | | | Level 1 | | | | Level 2 | | | | Level 3 | | | | Total | |
| Assets: | | | | | | | | | | | | | | | | |
| Bonds, notes & other debt instruments: | | | | | | | | | | | | | | | | |
| Corporate bonds, notes & loans | | $ | — | | | $ | 3,792,833 | | | $ | — | | | $ | 3,792,833 | |
| Mortgage-backed obligations | | | — | | | | 3,617,725 | | | | — | | | | 3,617,725 | |
| U.S. Treasury bonds & notes | | | — | | | | 2,783,804 | | | | — | | | | 2,783,804 | |
| Bonds & notes of governments & government agencies outside the U.S. | | | — | | | | 348,736 | | | | — | | | | 348,736 | |
| Asset-backed obligations | | | — | | | | 249,668 | | | | — | | | | 249,668 | |
| Municipals | | | — | | | | 226,267 | | | | — | | | | 226,267 | |
| Federal agency bonds & notes | | | — | | | | 12,979 | | | | — | | | | 12,979 | |
| Short-term securities | | | 2,690,045 | | | | — | | | | — | | | | 2,690,045 | |
| Total | | $ | 2,690,045 | | | $ | 11,032,012 | | | $ | — | | | $ | 13,722,057 | |
| American Funds Insurance Series | 267 |
| | | Other investments* | |
| | | Level 1 | | | Level 2 | | | Level 3 | | | Total | |
| Assets: | | | | | | | | | | | | |
| Unrealized appreciation on futures contracts | | $ | 7,631 | | | $ | — | | | $ | — | | | $ | 7,631 | |
| Unrealized appreciation on open forward currency contracts | | | — | | | | 46 | | | | — | | | | 46 | |
| Unrealized appreciation on interest rate swaps | | | — | | | | 3,456 | | | | — | | | | 3,456 | |
| Liabilities: | | | | | | | | | | | | | | | | |
| Unrealized depreciation on futures contracts | | | (824 | ) | | | — | | | | — | | | | (824 | ) |
| Unrealized depreciation on open forward currency contracts | | | — | | | | (2,653 | ) | | | — | | | | (2,653 | ) |
| Unrealized depreciation on interest rate swaps | | | — | | | | (28,517 | ) | | | — | | | | (28,517 | ) |
| Total | | $ | 6,807 | | | $ | (27,668 | ) | | $ | — | | | $ | (20,861 | ) |
| * | Futures contracts, forward currency contracts and interest rate swaps are not included in the investment portfolio. |
| Capital World Bond Fund | | | | | | | | | | | | | | | | |
| | | | | | | | | | | | | | | | | |
| | | Investment securities | |
| | | | Level 1 | | | | Level 2 | | | | Level 3 | | | | Total | |
| Assets: | | | | | | | | | | | | | | | | |
| Bonds, notes & other debt instruments: | | | | | | | | | | | | | | | | |
| Euros | | $ | — | | | $ | 402,906 | | | $ | — | | | $ | 402,906 | |
| Japanese yen | | | — | | | | 217,032 | | | | — | | | | 217,032 | |
| Chinese yuan renminbi | | | — | | | | 141,006 | | | | — | | | | 141,006 | |
| British pounds | | | — | | | | 91,115 | | | | — | | | | 91,115 | |
| Danish kroner | | | — | | | | 59,710 | | | | — | | | | 59,710 | |
| Canadian dollars | | | — | | | | 48,258 | | | | — | | | | 48,258 | |
| Mexican pesos | | | — | | | | 46,716 | | | | — | | | | 46,716 | |
| Malaysian ringgits | | | — | | | | 41,973 | | | | — | | | | 41,973 | |
| Australian dollars | | | — | | | | 31,305 | | | | — | | | | 31,305 | |
| Russian rubles | | | — | | | | 27,059 | | | | — | | | | 27,059 | |
| Israeli shekels | | | — | | | | 25,426 | | | | — | | | | 25,426 | |
| South Korean won | | | — | | | | 20,892 | | | | — | | | | 20,892 | |
| Indonesian rupiah | | | — | | | | 15,694 | | | | — | | | | 15,694 | |
| Colombian pesos | | | — | | | | 15,007 | | | | — | | | | 15,007 | |
| Brazilian reais | | | — | | | | 11,023 | | | | — | | | | 11,023 | |
| New Zealand dollars | | | — | | | | 9,638 | | | | — | | | | 9,638 | |
| Thai baht | | | — | | | | 9,308 | | | | — | | | | 9,308 | |
| Chilean pesos | | | — | | | | 8,404 | | | | — | | | | 8,404 | |
| South African rand | | | — | | | | 7,886 | | | | — | | | | 7,886 | |
| Ukrainian hryvnia | | | — | | | | 7,322 | | | | — | | | | 7,322 | |
| Singapore dollars | | | — | | | | 6,354 | | | | — | | | | 6,354 | |
| Norwegian kroner | | | — | | | | 5,980 | | | | — | | | | 5,980 | |
| Peruvian nuevos soles | | | — | | | | 5,639 | | | | — | | | | 5,639 | |
| Indian rupees | | | — | | | | 3,829 | | | | — | | | | 3,829 | |
| Dominican pesos | | | — | | | | 2,938 | | | | — | | | | 2,938 | |
| Polish zloty | | | — | | | | 1,500 | | | | — | | | | 1,500 | |
| Romanian leu | | | — | | | | 1,361 | | | | — | | | | 1,361 | |
| U.S. dollars | | | — | | | | 924,718 | | | | — | | | | 924,718 | |
| Common stocks | | | 574 | | | | — | | | | 1,319 | | | | 1,893 | |
| Rights & warrants | | | — | | | | — | | | | — | * | | | — | * |
| Short-term securities | | | 147,017 | | | | 3,665 | | | | — | | | | 150,682 | |
| Total | | $ | 147,591 | | | $ | 2,193,664 | | | $ | 1,319 | | | $ | 2,342,574 | |
| 268 | American Funds Insurance Series |
| | | Other investments† | |
| | | Level 1 | | | Level 2 | | | Level 3 | | | Total | |
| Assets: | | | | | | | | | | | | | | | | |
| Unrealized appreciation on futures contracts | | $ | 308 | | | $ | — | | | $ | — | | | $ | 308 | |
| Unrealized appreciation on open forward currency contracts | | | — | | | | 4,155 | | | | — | | | | 4,155 | |
| Unrealized appreciation on credit default swaps | | | — | | | | 31 | | | | — | | | | 31 | |
| Liabilities: | | | | | | | | | | | | | | | | |
| Unrealized depreciation on futures contracts | | | (155 | ) | | | — | | | | — | | | | (155 | ) |
| Unrealized depreciation on open forward currency contracts | | | — | | | | (3,799 | ) | | | — | | | | (3,799 | ) |
| Unrealized depreciation on interest rate swaps | | | — | | | | (64 | ) | | | — | | | | (64 | ) |
| Unrealized depreciation on credit default swaps | | | — | | | | (698 | ) | | | — | | | | (698 | ) |
| Total | | $ | 153 | | | $ | (375 | ) | | $ | — | | | $ | (222 | ) |
| * | Amount less than one thousand. |
| † | Futures contracts, forward currency contracts, interest rate swaps and credit default swaps are not included in the investment portfolio. |
| High-Income Bond Fund | | | | | | | | | | | | |
| | | | | | | | | | | | | |
| | | Investment securities | |
| | | Level 1 | | | Level 2 | | | Level 3 | | | Total | |
| Assets: | | | | | | | | | | | | | | | | |
| Bonds, notes & other debt instruments: | | | | | | | | | | | | | | | | |
| Corporate bonds, notes & loans | | $ | — | | | $ | 770,665 | | | $ | 4,354 | | | $ | 775,019 | |
| Asset-backed obligations | | | — | | | | 97 | | | | — | | | | 97 | |
| Municipals | | | — | | | | 5 | | | | — | | | | 5 | |
| Convertible bonds & notes | | | — | | | | 5,210 | | | | 65 | | | | 5,275 | |
| Convertible stocks | | | 2,844 | | | | 494 | | | | — | | | | 3,338 | |
| Preferred securities | | | — | | | | 2,841 | | | | — | | | | 2,841 | |
| Common stocks | | | 8,366 | | | | 2,591 | | | | 24,364 | | | | 35,321 | |
| Rights & warrants | | | — | | | | 76 | | | | — | 1 | | | 76 | |
| Short-term securities | | | 33,493 | | | | — | | | | — | | | | 33,493 | |
| Total | | $ | 44,703 | | | $ | 781,979 | | | $ | 28,783 | | | $ | 855,465 | |
| | | | | | | | | | | | | | | | | |
| | | Other investments2 | |
| | | | Level 1 | | | | Level 2 | | | | Level 3 | | | | Total | |
| Assets: | | | | | | | | | | | | | | | | |
| Unrealized appreciation on futures contracts | | $ | 8 | | | $ | — | | | $ | — | | | $ | 8 | |
| Unrealized appreciation on credit default swaps | | | — | | | | 7 | | | | — | | | | 7 | |
| Liabilities: | | | | | | | | | | | | | | | | |
| Unrealized depreciation on futures contracts | | | (27 | ) | | | — | | | | — | | | | (27 | ) |
| Unrealized depreciation on credit default swaps | | | — | | | | (728 | ) | | | — | | | | (728 | ) |
| Total | | $ | (19 | ) | | $ | (721 | ) | | $ | — | | | $ | (740 | ) |
| 1 | Amount less than one thousand. |
| 2 | Futures contracts and credit default swaps are not included in the investment portfolio. |
The following table reconciles the valuation of the fund’s Level 3 investment securities and related transactions for the year ended December 31, 2020 (dollars in thousands):
| | | Beginning value at 1/1/2020 | | | Transfers
into Level 33 | | | Purchases | | | Sales | | | Net realized loss4 | | | Unrealized appreciation4 | | | Transfers out of Level 33 | | | Ending value at 12/31/2020 | |
| Investment securities | | $ | 19,675 | | | $ | 5,892 | | | $ | 12,692 | | | $ | (8,614 | ) | | $ | (4,424 | ) | | $ | 8,405 | | | $ | (4,843 | ) | | $ | 28,783 | |
| Net unrealized appreciation during the period on Level 3 investment securities held at December 31, 2020 | $ | 7,603 | |
| 3 | Transfers into or out of Level 3 are based on the beginning market value of the quarter in which they occurred. These transfers are the result of changes in the availability of pricing sources and/or in the observability of significant inputs used in valuing the securities. |
| 4 | Net realized loss and unrealized appreciation are included in the related amounts on investments in the statement of operations. |
| American Funds Insurance Series | 269 |
Unobservable inputs — Valuation of the fund’s Level 3 securities is based on significant unobservable inputs that reflect the investment adviser’s determination of assumptions that market participants might reasonably use in valuing the securities. The following table provides additional information used by the fund’s investment adviser to fair value the fund’s Level 3 securities (dollars in thousands):
| | | Value at
12/31/2020 | | | Valuation
techniques | | Unobservable
inputs | | Range
(if applicable) | | Weighted
average1 | | Impact to
valuation from
an increase in
input2 |
Bonds, notes & other
debt instruments | | $ | 4,354 | | | Estimated recovery
value | | Exchange terms | | N/A | | N/A | | N/A |
| | | | | Vendor price | | N/A | | N/A | | N/A |
| | | | | Par value | | N/A | | N/A | | N/A |
| | | | Yield analysis | | YTM risk premium | | 200 bps | | 200 bps | | Decrease |
| Convertible bonds & notes | | | 65 | | | Transaction price | | N/A | | N/A | | N/A | | N/A |
| Common stocks | | | 24,364 | | | Estimated recovery
value | | N/A | | N/A | | N/A | | N/A |
| | | | | | Exchange terms | | N/A | | N/A | | N/A |
| | | | | | Vendor price | | N/A | | N/A | | N/A |
| | | | | | Risk discount | | 90% | | 90% | | Decrease |
| | | | | | Par value | | N/A | | N/A | | N/A |
| | | | | | Adjustment based on market decline | | 20% | | 20% | | Decrease |
| | | | | Market comparable
companies | | EV/EBITDA multiple | | 7.5x | | 7.5x | | Increase |
| | | | | | EV/EBITDA less CapEx multiple | | 10.2x - 23.0x | | 19.2x | | Increase |
| | | | | | Discount to EV/EBITDA less CapEx multiple | | 50% | | 50% | | Decrease |
| | | | | | DLOM | | 17% - 22% | | 19% | | Decrease |
| | | | | Inputs to market comparables and discounted cash flow | | Weight ascribed to market comparables | | 50% | | N/A | | N/A |
| | | | | | Weight ascribed to discounted cash flow | | 50% | | N/A | | N/A |
| | | | | Discounted cash flow | | Proved reserves | | $53.7 million | | $53.7 million | | Increase |
| | | | | | Discount rate | | 9% | | 9% | | Decrease |
| | | | | Recent market information | | Quoted price | | N/A | | N/A | | N/A |
| | | | | | DLOM | | 30% | | 30% | | Decrease |
| | | | | Transaction price | | N/A | | N/A | | N/A | | N/A |
| Rights & warrants | | | — | 3 | | Black-Scholes | | Implied volatility | | 30% | | 30% | | Increase |
| | | | | Underlying share price | | N/A | | N/A | | N/A |
| | | $ | 28,783 | | | | | | | | | | | |
| 1 | Weighted average is by relative fair value. |
| 2 | This column represents the directional change in fair value of the Level 3 securities that would result in an increase from the corresponding input. A decrease to the unobservable input would have the opposite effect. Significant increases and decreases in these inputs in isolation could result in significantly higher or lower fair value measurements. |
| 3 | Amount less than one thousand. |
Key to abbreviations
CapEx = Capital expenditure
DLOM = Discount for lack of marketability
EBITDA = Earnings before income taxes, depreciation and amortization
EV = Enterprise value
YTM = Yield to maturity
| 270 | American Funds Insurance Series |
| American Funds Mortgage Fund | | | | | | | | | | | | |
| | | | | | | | | | | | | |
| | | Investment securities | |
| | | | | | | | | | | | | |
| | | Level 1 | | | Level 2 | | | Level 3 | | | Total | |
| Assets: | | | | | | | | | | | | | | | | |
| Bonds, notes & other debt instruments: | | | | | | | | | | | | | | | | |
| Mortgage-backed obligations | | $ | — | | | $ | 219,567 | | | $ | — | | | $ | 219,567 | |
| U.S. Treasury bonds & notes | | | — | | | | 25,628 | | | | — | | | | 25,628 | |
| Asset-backed obligations | | | — | | | | 5,546 | | | | — | | | | 5,546 | |
| Federal agency bonds & notes | | | — | | | | 294 | | | | — | | | | 294 | |
| Short-term securities | | | — | | | | 141,404 | | | | — | | | | 141,404 | |
| Total | | $ | — | | | $ | 392,439 | | | $ | — | | | $ | 392,439 | |
| | | | | | | | | | | | | | | | | |
| | | Other investments* | |
| | | Level 1 | | | Level 2 | | | Level 3 | | | Total | |
| Assets: | | | | | | | | | | | | | | | | |
| Unrealized appreciation on futures contracts | | $ | 54 | | | $ | — | | | $ | — | | | $ | 54 | |
| Unrealized appreciation on interest rate swaps | | | — | | | | 1,218 | | | | — | | | | 1,218 | |
| Liabilities: | | | | | | | | | | | | | | | | |
| Unrealized depreciation on futures contracts | | | (21 | ) | | | — | | | | — | | | | (21 | ) |
| Unrealized depreciation on interest rate swaps | | | — | | | | (4 | ) | | | — | | | | (4 | ) |
| Total | | $ | 33 | | | $ | 1,214 | | | $ | — | | | $ | 1,247 | |
| * | Futures contracts and interest rate swaps are not included in the investment portfolio. |
Ultra-Short Bond Fund
At December 31, 2020, all of the fund’s investment securities were classified as Level 2.
U.S. Government/AAA-Rated Securities Fund
| | | Investment securities | |
| | | Level 1 | | | Level 2 | | | Level 3 | | | Total | |
| Assets: | | | | | | | | | | | | | | | | |
| Bonds, notes & other debt instruments: | | | | | | | | | | | | | | | | |
| Mortgage-backed obligations | | $ | — | | | $ | 756,975 | | | $ | — | | | $ | 756,975 | |
| U.S. Treasury bonds & notes | | | — | | | | 663,982 | | | | — | | | | 663,982 | |
| Federal agency bonds & notes | | | — | | | | 341,155 | | | | — | | | | 341,155 | |
| Short-term securities | | | — | | | | 731,556 | | | | — | | | | 731,556 | |
| Total | | $ | — | | | $ | 2,493,668 | | | $ | — | | | $ | 2,493,668 | |
| | | | | | | | | | | | | | | | | |
| | | Other investments* | |
| | | Level 1 | | | Level 2 | | | Level 3 | | | Total | |
| Assets: | | | | | | | | | | | | | | | | |
| Unrealized appreciation on futures contracts | | $ | 1,235 | | | $ | — | | | $ | — | | | $ | 1,235 | |
| Unrealized appreciation on interest rate swaps | | | — | | | | 34,726 | | | | — | | | | 34,726 | |
| Liabilities: | | | | | | | | | | | | | | | | |
| Unrealized depreciation on futures contracts | | | (1,275 | ) | | | — | | | | — | | | | (1,275 | ) |
| Unrealized depreciation on interest rate swaps | | | — | | | | (7,246 | ) | | | — | | | | (7,246 | ) |
| Total | | $ | (40 | ) | | $ | 27,480 | | | $ | — | | | $ | 27,440 | |
| * | Futures contracts and interest rate swaps are not included in the investment portfolio. |
Managed Risk Growth Fund
At December 31, 2020, all of the fund’s investments were classified as Level 1.
Managed Risk International Fund
At December 31, 2020, all of the fund’s investments were classified as Level 1.
| American Funds Insurance Series | 271 |
Managed Risk Blue Chip Income and Growth Fund
At December 31, 2020, all of the fund’s investments were classified as Level 1.
Managed Risk Growth-Income Fund
At December 31, 2020, all of the fund’s investments were classified as Level 1.
Managed Risk Asset Allocation Fund
At December 31, 2020, all of the fund’s investments were classified as Level 1.
4. Risk factors
Investing in the funds may involve certain risks including, but not limited to, those described below.
Market conditions — The prices of, and the income generated by, the common stocks, bonds and other securities held by a fund may decline — sometimes rapidly or unpredictably — due to various factors, including events or conditions affecting the general economy or particular industries; overall market changes; local, regional or global political, social or economic instability; governmental, governmental agency or central bank responses to economic conditions; and currency exchange rate, interest rate and commodity price fluctuations.
Economies and financial markets throughout the world are highly interconnected. Economic, financial or political events, trading and tariff arrangements, wars, terrorism, cybersecurity events, natural disasters, public health emergencies (such as the spread of infectious disease) and other circumstances in one country or region, including actions taken by governmental or quasi-governmental authorities in response to any of the foregoing, could have impacts on global economies or markets. As a result, whether or not a fund invests in securities of issuers located in or with significant exposure to the countries affected, the value and liquidity of a fund’s investments may be negatively affected by developments in other countries and regions.
Issuer risks — The prices of, and the income generated by, securities held by a fund may decline in response to various factors directly related to the issuers of such securities, including reduced demand for an issuer’s goods or services, poor management performance, major litigation, investigations or other controversies related to the issuer, changes in government regulations affecting the issuer or its competitive environment and strategic initiatives such as mergers, acquisitions or dispositions and the market response to any such initiatives.
Investing in income-oriented stocks — The value of a fund’s securities and income provided by a fund may be reduced by changes in the dividend policies of, and the capital resources available for dividend payments at, the companies in which the fund invests.
Investing in growth-oriented stocks — Growth-oriented common stocks and other equity-type securities (such as preferred stocks, convertible preferred stocks and convertible bonds) may involve larger price swings and greater potential for loss than other types of investments. These risks may be even greater in the case of smaller capitalization stocks.
Investing in small companies — Investing in smaller companies may pose additional risks. For example, it is often more difficult to value or dispose of small company stocks and more difficult to obtain information about smaller companies than about larger companies. Furthermore, smaller companies often have limited product lines, operating histories, markets and/or financial resources, may be dependent on one or a few key persons for management, and can be more susceptible to losses. Moreover, the prices of their stocks may be more volatile than stocks of larger, more established companies, particularly during times of market turmoil.
Investing outside the U.S. — Securities of issuers domiciled outside the U.S., or with significant operations or revenues outside the U.S., may lose value because of adverse political, social, economic or market developments (including social instability, regional conflicts, terrorism and war) in the countries or regions in which the issuers operate or generate revenue. These securities may also lose value due to changes in foreign currency exchange rates against the U.S. dollar and/or currencies of other countries. Issuers of these securities may be more susceptible to actions of foreign governments, such as nationalization, currency blockage or the imposition of price controls or punitive taxes, each of which could adversely impact the value of these securities. Securities markets in certain countries may be more volatile and/or less liquid than those in the U.S. Investments outside the U.S. may also be subject to different accounting practices and different regulatory, legal and reporting standards and practices, and may be more difficult to value, than those in the U.S. In addition, the value of investments outside the U.S. may be reduced by foreign taxes, including foreign withholding
| 272 | American Funds Insurance Series |
taxes on interest and dividends. Further, there may be increased risks of delayed settlement of securities purchased or sold by the fund. The risks of investing outside the U.S. may be heightened in connection with investments in emerging markets.
Investing in developing countries — Investing in countries with developing economies and/or markets may involve risks in addition to and greater than those generally associated with investing in developed countries. For instance, emerging market countries may have less developed legal and accounting systems than those in developed countries. The governments of these countries may be less stable and more likely to impose capital controls, nationalize a company or industry, place restrictions on foreign ownership and on withdrawing sale proceeds of securities from the country, and/or impose punitive taxes that could adversely affect the prices of securities. In addition, the economies of these countries may be dependent on relatively few industries that are more susceptible to local and global changes. Securities markets in these countries can also be relatively small and have substantially lower trading volumes. As a result, securities issued in these countries may be more volatile and less liquid, and may be more difficult to value, than securities issued in countries with more developed economies and/or markets. Less certainty with respect to security valuations may lead to additional challenges and risks in calculating a fund’s net asset value. Additionally, emerging markets are more likely to experience problems with the clearing and settling of trades and the holding of securities by banks, agents and depositories that are less established than those in developed countries.
Investing in emerging markets — Investing in emerging markets may involve risks in addition to and greater than those generally associated with investing in the securities markets of developed countries. For instance, emerging market countries may have less developed legal and accounting systems than those in developed countries. The governments of these countries may be less stable and more likely to impose capital controls, nationalize a company or industry, place restrictions on foreign ownership and on withdrawing sale proceeds of securities from the country, and/or impose punitive taxes that could adversely affect the prices of securities. In addition, the economies of these countries may be dependent on relatively few industries that are more susceptible to local and global changes. Securities markets in these countries can also be relatively small and have substantially lower trading volumes. As a result, securities issued in these countries may be more volatile and less liquid, and may be more difficult to value, than securities issued in countries with more developed economies and/or markets. Less certainty with respect to security valuations may lead to additional challenges and risks in calculating a fund’s net asset value. Additionally, emerging markets are more likely to experience problems with the clearing and settling of trades and the holding of securities by banks, agents and depositories that are less established than those in developed countries.
Investing in debt instruments — The prices of, and the income generated by, bonds and other debt securities held by a fund may be affected by factors such as the interest rates, maturities and credit ratings of these securities.
Rising interest rates will generally cause the prices of bonds and other debt securities to fall. A general rise in interest rates may cause investors to sell debt securities on a large scale, which could also adversely affect the price and liquidity of debt securities and could also result in increased redemptions from a fund. Falling interest rates may cause an issuer to redeem, call or refinance a debt security before its stated maturity, which may result in a fund failing to recoup the full amount of its initial investment and having to reinvest the proceeds in lower yielding securities. Longer maturity debt securities generally have greater sensitivity to changes in interest rates and may be subject to greater price fluctuations than shorter maturity debt securities.
Bonds and other debt securities are also subject to credit risk, which is the possibility that the credit strength of an issuer or guarantor will weaken or be perceived to be weaker, and/or an issuer of a debt security will fail to make timely payments of principal or interest and the security will go into default. A downgrade or default affecting any of a fund’s securities could cause the value of a fund’s shares to decrease. Lower quality debt securities generally have higher rates of interest and may be subject to greater price fluctuations than higher quality debt securities. Credit risk is gauged, in part, by the credit ratings of the debt securities in which a fund invests. However, ratings are only the opinions of the rating agencies issuing them and are not guarantees as to credit quality or an evaluation of market risk. The fund’s investment adviser relies on its own credit analysts to research issuers and issues in seeking to assess credit and default risks.
Investing in lower rated debt instruments — Lower rated bonds and other lower rated debt securities generally have higher rates of interest and involve greater risk of default or price declines due to changes in the issuer’s creditworthiness than those of higher quality debt securities. The market prices of these securities may fluctuate more than the prices of higher quality debt securities and may decline significantly in periods of general economic difficulty. These risks may be increased with respect to investments in junk bonds.
Investing in derivatives — The use of derivatives involves a variety of risks, which may be different from, or greater than, the risks associated with investing in traditional securities, such as stocks and bonds. Changes in the value of a derivative may not correlate perfectly with, and may be more sensitive to market events than, the underlying asset, rate or index, and a derivative instrument may
| American Funds Insurance Series | 273 |
expose a fund to losses in excess of its initial investment. Derivatives may be difficult to value, difficult for a fund to buy or sell at an opportune time or price and difficult, or even impossible, to terminate or otherwise offset. A fund’s use of derivatives may result in losses to the fund, and investing in derivatives may reduce a fund’s returns and increase a fund’s price volatility. A fund’s counterparty to a derivative transaction (including, if applicable, the fund’s clearing broker, the derivatives exchange or the clearinghouse) may be unable or unwilling to honor its financial obligations in respect of the transaction. In certain cases, the fund may be hindered or delayed in exercising remedies against or closing out derivative instruments with a counterparty, which may result in additional losses.
Currency — The prices of, and the income generated by, many debt securities held by a fund may also be affected by changes in relative currency values. If the U.S. dollar appreciates against foreign currencies, the value in U.S. dollars of a fund’s securities denominated in such currencies would generally fall and vice versa. U.S. dollar-denominated securities of foreign issuers may also be affected by changes in relative currency values.
Investing in mortgage-related and other asset-backed securities — Mortgage-related securities, such as mortgage-backed securities, and other asset-backed securities, include debt obligations that represent interests in pools of mortgages or other income-bearing assets, such as consumer loans or receivables. While such securities are subject to the risks associated with investments in debt instruments generally (for example, credit, extension and interest rate risks), they are also subject to other and different risks. Mortgage-backed and other asset-backed securities are subject to changes in the payment patterns of borrowers of the underlying debt, potentially increasing the volatility of the securities and a fund’s net asset value. When interest rates fall, borrowers are more likely to refinance or prepay their debt before its stated maturity. This may result in a fund having to reinvest the proceeds in lower yielding securities, effectively reducing a fund’s income. Conversely, if interest rates rise and borrowers repay their debt more slowly than expected, the time in which the mortgage-backed and other asset-backed securities are paid off could be extended, reducing a fund’s cash available for reinvestment in higher yielding securities. Mortgage-backed securities are also subject to the risk that underlying borrowers will be unable to meet their obligations and the value of property that secures the mortgages may decline in value and be insufficient, upon foreclosure, to repay the associated loans. Investments in asset-backed securities are subject to similar risks.
Investing in future delivery contracts — A fund may enter into contracts, such as to-be-announced contracts and mortgage dollar rolls, that involve a fund selling mortgage-related securities and simultaneously contracting to repurchase similar securities for delivery at a future date at a predetermined price. This can increase a fund’s market exposure, and the market price of the securities that the fund contracts to repurchase could drop below their purchase price. While a fund can preserve and generate capital through the use of such contracts by, for example, realizing the difference between the sale price and the future purchase price, the income generated by the fund may be reduced by engaging in such transactions. In addition, these transactions increase the turnover rate of a fund.
Investing in inflation-linked bonds — The values of inflation-linked bonds generally fluctuate in response to changes in real interest rates — i.e., rates of interest after factoring in inflation. A rise in real interest rates may cause the prices of inflation-linked securities to fall, while a decline in real interest rates may cause the prices to increase. Inflation-linked bonds may experience greater losses than other debt securities with similar durations when real interest rates rise faster than nominal interest rates. There can be no assurance that the value of an inflation-linked security will be directly correlated to changes in interest rates; for example, if interest rates rise for reasons other than inflation, the increase may not be reflected in the security’s inflation measure.
Investing in inflation-linked bonds may also reduce a fund’s distributable income during periods of deflation. If prices for goods and services decline throughout the economy, the principal and income on inflation-linked securities may decline and result in losses to a fund.
Investing in securities backed by the U.S. government — Securities backed by the U.S. Treasury or the full faith and credit of the U.S. government are guaranteed only as to the timely payment of interest and principal when held to maturity. Accordingly, the current market values for these securities will fluctuate with changes in interest rates and the credit rating of the U.S. government. Securities issued by government-sponsored entities and federal agencies and instrumentalities that are not backed by the full faith and credit of the U.S. government are neither issued nor guaranteed by the U.S. government.
Investing in repurchase agreements — Upon entering into a repurchase agreement, a fund purchases a security from a bank or broker-dealer, which simultaneously commits to repurchase the security within a specified time at the fund’s cost with interest. The security purchased by the fund constitutes collateral for the seller’s repurchase obligation. If the party agreeing to repurchase should default, the fund may seek to sell the security it holds as collateral. The fund may incur a loss if the value of the collateral securing the repurchase obligation falls below the repurchase price. The fund may also incur disposition costs and encounter procedural delays in connection with liquidating the collateral.
| 274 | American Funds Insurance Series |
Interest rate risk — The values and liquidity of the securities held by a fund may be affected by changing interest rates. For example, the values of these securities may decline when interest rates rise and increase when interest rates fall. Longer maturity debt securities generally have greater sensitivity to changes in interest rates and may be subject to greater price fluctuations than shorter maturity debt securities. A fund may invest in variable and floating rate securities. When a fund holds variable or floating rate securities, a decrease in market interest rates will adversely affect the income received from such securities and the net asset value of a fund’s shares. Although the values of such securities are generally less sensitive to interest rate changes than those of other debt securities, the value of variable and floating rate securities may decline if their interest rates do not rise as quickly, or as much, as market interest rates. Conversely, floating rate securities will not generally increase in value if interest rates decline. During periods of extremely low short-term interest rates, a fund may not be able to maintain a positive yield and, given the current low interest rate environment, risks associated with rising rates are currently heightened.
Credit and liquidity support — Changes in the credit quality of banks and financial institutions providing credit and liquidity support features with respect to securities held by a fund could cause the values of these securities to decline.
Asset allocation — A fund’s percentage allocation to equity securities, debt securities and money market instruments could cause the fund to underperform relative to relevant benchmarks and other funds with similar investment objectives.
Nondiversification risk— As nondiversified funds, certain funds have the ability to invest a larger percentage of their assets in the securities of a smaller number of issuers than diversified funds. Although the funds do not intend to limit their investments to the securities of a small number of issuers, if they were to do so, poor performance by a single large holding could adversely impact the funds’ investment results more than if the funds were invested in a larger number of issuers.
Liquidity risk — Certain fund holdings may be or may become difficult or impossible to sell, particularly during times of market turmoil. Liquidity may be impacted by the lack of an active market for a holding, legal or contractual restrictions on resale, or the reduced number and capacity of market participants to make a market in such holding. Market prices for less liquid or illiquid holdings may be volatile, and reduced liquidity may have an adverse impact on the market price of such holdings. Additionally, the sale of less liquid or illiquid holdings may involve substantial delays (including delays in settlement) and additional costs and the fund may be unable to sell such holdings when necessary to meet its liquidity needs or may be forced to sell at a loss.
Management — The investment adviser to the funds actively manages the funds’ investments. Consequently, the funds are subject to the risk that the methods and analyses, including models, tools and data, employed by the investment adviser in this process may be flawed or incorrect and may not produce the desired results. This could cause the funds to lose value or their investment results to lag relevant benchmarks or other funds with similar objectives.
Investing in the managed risk funds may involve additional risks including, but not limited to, those described below.
Fund structure — The managed risk funds invest in underlying funds and incur expenses related to those underlying funds. In addition, investors in the managed risk funds will incur fees to pay for certain expenses related to the operations of the managed risk funds. An investor holding the underlying fund directly would incur lower overall expenses but would not receive the benefit of the managed risk strategy. Additionally, in accordance with an exemption under the Investment Company Act of 1940, as amended, the investment adviser considers only proprietary funds when selecting underlying investment options and allocations. This means that the fund’s investment adviser did not, nor does it expect to, consider any unaffiliated funds as underlying investment options for the fund. This strategy could raise certain conflicts of interest when choosing underlying investments for the fund, including the selection of funds that result in greater compensation to the adviser or funds with relatively lower historical investment results. The investment adviser has policies and procedures designed to mitigate material conflicts of interest that may arise in connection with its management of the fund.
Management — The managed risk funds are subject to the risk that the managed risk strategy or the methods employed by the subadviser in implementing the managed risk strategy may not produce the desired results. This could cause the managed risk funds to lose value or their investment results to lag relevant benchmarks or other funds with similar objectives.
Underlying fund risks — Because the managed risk funds’ investments consist of investments in underlying funds, the managed risk funds’ risks are directly related to the risks of the respective underlying fund in which each managed risk fund invests. For this reason, it is important to understand the risks associated with investing both in the managed risk fund and in each of the underlying funds.
| American Funds Insurance Series | 275 |
Investing in options and futures contracts — In addition to the risks generally associated with investing in derivative instruments, options and futures contracts are subject to the creditworthiness of the clearing organizations, exchanges and, in the case of futures, futures commission merchants with which a fund transacts. Additionally, although futures require only a small initial investment in the form of a deposit of initial margin, the amount of a potential loss on a futures contract could greatly exceed the initial amount invested. While both options and futures contracts are generally liquid instruments, under certain market conditions, options and futures may be deemed to be illiquid. For example, a fund may be temporarily prohibited from closing out its position in an options or futures contract if intraday price change limits or limits on trading volume imposed by the applicable exchange are triggered. If a fund is unable to close out a position on an options or futures contract, the fund would remain subject to the risk of adverse price movements until the fund is able to close out the position in question. The ability of a fund to successfully utilize options and futures contracts may depend in part upon the ability of the fund’s investment adviser or subadviser to accurately forecast interest rates and other economic factors and to assess and predict the impact of such economic factors on the options and futures in which the fund invests. If the investment adviser or subadviser incorrectly forecasts economic developments or incorrectly predicts the impact of such developments on the options and futures in which it invests, a fund could be exposed to the risk of loss. Whereas the risk of loss on a put option purchased by the fund is limited to the initial cost of the option, the amount of a potential loss on a futures contract could greatly exceed the relatively small initial amount invested in entering the futures position.
Hedging — There may be imperfect or even negative correlation between the prices of the options and futures contracts in which a fund invests and the prices of the underlying securities or indexes which the fund seeks to hedge. For example, options and futures contracts may not provide an effective hedge because changes in options and futures contract prices may not track those of the underlying securities or indexes they are intended to hedge. In addition, there are significant differences between the securities market, on the one hand, and the options and futures markets, on the other, that could result in an imperfect correlation between the markets, causing a given hedge not to achieve its objectives. The degree of imperfection of correlation depends on circumstances such as variations in speculative market demand for options and futures, including technical influences in options and futures trading, and differences between the financial instruments being hedged and the instruments underlying the standard contracts available for trading. A decision as to whether, when and how to hedge involves the exercise of skill and judgment, and even a well-conceived hedge may be unsuccessful to some degree because of market behavior or unexpected interest rate trends. In addition, the fund’s investment in exchange-traded options and futures and their resulting costs could limit the fund’s gains in rising markets relative to those of the underlying funds, or to those of unhedged funds in general.
Short positions — Losses from short positions in futures contracts occur when the underlying index increases in value. As the underlying index increases in value, the holder of the short position in the corresponding futures contract is required to pay the difference in value of the futures contract resulting from the increase in the index on a daily basis. Losses from a short position in an index futures contract could potentially be very large if the value of the underlying index rises dramatically in a short period of time.
5. Certain investment techniques
Securities lending — Some of the funds have entered into securities lending transactions in which the funds earn income by lending investment securities to brokers, dealers or other institutions. Each transaction involves three parties: the fund, acting as the lender of the securities, a borrower, and a lending agent that acts as an intermediary.
Securities lending transactions are entered into by the fund under the securities lending agreement with the lending agent. The lending agent facilitates the exchange of securities between the lender and the borrower, generally provides protection from borrower default, marks to market the value of collateral daily, secures additional collateral from the borrower if it falls below preset terms, and may reinvest the collateral on behalf of the fund according to agreed parameters. The lending agent has indemnified the fund against losses resulting from borrower default. Although risk is mitigated by the collateral and indemnification, the fund could experience a delay in recovering its securities and a potential loss of income or value if the borrower fails to return the securities, collateral investments decline in value or the lending agent fails to perform.
The borrower is required to post highly liquid assets, such as cash or U.S. government securities, as collateral for the loan in an amount at least equal to the value of the securities loaned. Investments made with cash collateral are recognized as assets in the fund’s investment portfolio. The same amount is recorded as a liability in the fund’s statement of assets and liabilities. While securities are on loan, the fund will continue to receive the equivalent of the interest, dividends or other distributions paid by the issuer, as well as a portion of the interest on the investment of the collateral. Additionally, although the fund does not have the right to vote on securities while they are on loan, the fund has a right to consent on corporate actions and a right to recall loaned securities to vote on proposals
| 276 | American Funds Insurance Series |
affecting them. The borrower is obligated to return the loaned security at the conclusion of the loan or, during the pendency of the loan, on demand from the fund.
The following table presents the value of the securities on loan, the type and value of collateral received and the value of the investment securities purchased, if any, from the cash collateral received by each fund (dollars in thousands):
| | | | | | Collateral type | | | | |
| | | | | | | | | | | | Value of | |
| | | Values of | | | | | | | | | investment | |
| | | securities | | | | | | U.S. government | | | securities | |
| Funds | | loan | | | Cash | | | securities | | | purchased | |
| Global Growth Fund | | $ | 21,446 | | | $ | 20,305 | | | $ | 1,985 | | | $ | 18,274 | |
| Global Small Capitalization Fund | | | 77,648 | | | | 79,709 | | | | 66 | | | | 71,738 | |
| Growth Fund | | | 7,302 | | | | 7,559 | | | | — | | | | 6,803 | |
| International Fund | | | 83,899 | | | | 15,528 | | | | 72,363 | | | | 13,975 | |
| New World Fund | | | 18,411 | | | | 15,578 | | | | 3,469 | | | | 14,020 | |
| Blue Chip Income and Growth Fund | | | 3,447 | | | | 3,589 | | | | — | | | | 3,230 | |
| Global Growth and Income Fund | | | 6,890 | | | | 7,156 | | | | — | * | | | 6,440 | |
| Growth-Income Fund | | | 188,806 | | | | 193,847 | | | | — | | | | 174,463 | |
| International Growth and Income Fund | | | 6,820 | | | | 7,095 | | | | 14 | | | | 6,385 | |
| Capital Income Builder | | | 5,528 | | | | 1,316 | | | | 4,462 | | | | 1,185 | |
| Asset Allocation Fund | | | 13,741 | | | | 14,048 | | | | — | | | | 12,643 | |
| * | Amount less than one thousand. | |
Investment securities purchased from cash collateral are disclosed in the investment portfolio as short-term securities. Securities received as collateral, if any, are not recognized as fund assets. The contractual maturity of collateral received under the securities lending agreement is classified as overnight and continuous.
Index-linked bonds — Some of the funds have invested in index-linked bonds, which are fixed-income securities whose principal value is periodically adjusted to a government price index. Over the life of an index-linked bond, interest is paid on the adjusted principal value. Increases or decreases in the principal value of index-linked bonds are recorded as interest income in the fund’s statement of operations.
Mortgage dollar rolls — Some of the funds have entered into mortgage dollar roll transactions in which the fund sells a mortgage-backed security to a counterparty and simultaneously enters into an agreement with the same counterparty to buy back a similar security on a specific future date at a predetermined price. Mortgage dollar rolls are accounted for as purchase and sale transactions, which may increase the funds’ portfolio turnover rates.
Loan transactions — Some of the funds have entered into loan transactions in which the fund acquires a loan either through an agent, by assignment from another holder, or as a participation interest in another holder’s portion of a loan. The loan is often administered by a financial institution that acts as agent for the holders of the loan, and the fund may be required to receive approval from the agent and/or borrower prior to the sale of the investment. The loan’s interest rate and maturity date may change based on the terms of the loan, including potential early payments of principal.
Short-term securities — The managed risk funds hold shares of State Street Institutional U.S. Government Money Market Fund, a cash management vehicle offered and managed by State Street Bank and Trust Company.
Unfunded commitments — Asset Allocation Fund and High-Income Bond Fund have participated in transactions that involve unfunded commitments, which may obligate each fund to purchase new or additional bonds and/or purchase additional shares of the applicable issuer if certain contingencies are met. As of December 31, 2020, the maximum exposure from these unfunded commitments for Asset Allocation Fund and High-Income Bond Fund was $3,543,000 and $1,481,000, respectively, which would represent 0.01% and 0.17%, respectively, of the net assets of each fund should such commitments become due. Unrealized appreciation on these unfunded commitments for Asset Allocation Fund and High-Income Bond Fund was $740,000 and $323,000, respectively, which is disclosed as a receivable for unrealized appreciation on unfunded commitments in each fund’s statement of assets and liabilities and is included in net unrealized appreciation on investments in unaffiliated issuers in each fund’s statement of operations.
| American Funds Insurance Series | 277 |
Options contracts — The Managed Risk Growth-Income Fund has entered into options contracts, which give the holder of the option, in return for a premium payment, the right to buy from (in the case of a call) or sell to (in the case of a put) the writer of the option, the security underlying the option (or the cash value of the index underlying the option) at a specified price. As part of its managed risk strategy, the Managed Risk Growth-Income Fund will at times purchase put options on equity indexes in standardized contracts traded on foreign or domestic securities exchanges, boards of trade, or similar entities. By purchasing a put option on an equity index, the fund obtains the right (but not the obligation) to sell the cash value of the index underlying the option at a specified exercise price, and in return for this right, the fund pays the current market price, or the option premium, for the option.
The fund may terminate its position in a put option by allowing the option to expire or by exercising the option. If the option is allowed to expire, the fund will lose the entire premium. If the option is exercised, the fund completes the sale of the underlying instrument (or delivers the cash value of the index underlying the option) at the exercise price. The fund may also terminate a put option position by entering into opposing close-out transactions in advance of the option expiration date.
Premiums paid on options purchased, as well as the daily fluctuation in market value, are included in investment securities from unaffiliated issuers in the fund’s statement of assets and liabilities. Realized gains or losses are recorded at the time the option contract is closed or expires. Net realized gains or losses and net unrealized appreciation or depreciation from options contracts are recorded in investments in unaffiliated issuers in the fund’s statement of operations.
Futures contracts — Some of the funds have entered into futures contracts, which provide for the future sale by one party and purchase by another party of a specified amount of a specific financial instrument for a specified price, date, time and place designated at the time the contract is made. Futures contracts are used to strategically manage the fund’s interest rate sensitivity by increasing or decreasing the duration of the fund or a portion of the fund’s portfolio. For the managed risk funds, futures contracts are used to strategically manage portfolio volatility and downside equity risk.
Upon entering into futures contracts, and to maintain the fund’s open positions in futures contracts, the fund is required to deposit with a futures broker, known as a futures commission merchant (“FCM”), in a segregated account in the name of the FCM an amount of cash, U.S. government securities or other liquid securities, known as initial margin. The margin required for a particular futures contract is set by the exchange on which the contract is traded to serve as collateral, and may be significantly modified from time to time by the exchange during the term of the contract.
On a daily basis, each fund pays or receives variation margin based on the increase or decrease in the value of the futures contracts and records variation margin on futures contracts in each fund’s statement of assets and liabilities. In addition, each fund segregates liquid assets equivalent to the fund’s outstanding obligations under the contract in excess of the initial margin and variation margin, if any. Futures contracts may involve a risk of loss in excess of the variation margin shown on each fund’s statement of assets and liabilities. Each fund records realized gains or losses at the time the futures contract is closed or expires. Net realized gains or losses and net unrealized appreciation or depreciation from futures contracts are recorded in each fund’s statement of operations.
Forward currency contracts — Some of the funds have entered into forward currency contracts, which represent agreements to exchange currencies on specific future dates at predetermined rates. The series’ investment adviser uses forward currency contracts to manage the fund’s exposure to changes in exchange rates. Upon entering into these contracts, risks may arise from the potential inability of counterparties to meet the terms of their contracts and from possible movements in exchange rates.
On a daily basis, the series’ investment adviser values forward currency contracts based on the applicable exchange rates and records unrealized appreciation or depreciation for open forward currency contracts in each fund’s statement of assets and liabilities. Realized gains or losses are recorded at the time the forward contract is closed or offset by another contract with the same broker for the same settlement date and currency. Closed forward currency contracts that have not reached their settlement date are included in the respective receivables or payables for closed forward currency contracts in each fund’s statement of assets and liabilities. Net realized gains or losses from closed forward currency contracts and net unrealized appreciation or depreciation from open forward currency contracts are recorded in each fund’s statement of operations.
Interest rate swaps — Some of the funds have entered into interest rate swaps, which are agreements to exchange one stream of future interest payments for another based on a specified notional amount. Typically, interest rate swaps exchange a fixed interest rate for a payment that floats relative to a benchmark or vice versa. The series’ investment adviser uses interest rate swaps to manage the interest rate sensitivity of the fund by increasing or decreasing the duration of the fund or a portion of the fund’s portfolio. Risks may arise as a result of the series’ investment adviser incorrectly anticipating changes in interest rates, increased volatility, reduced liquidity and the potential inability of counterparties to meet the terms of their agreements.
| 278 | American Funds Insurance Series |
Upon entering into an interest rate swap contract, the fund is required to deposit cash, U.S. government securities or other liquid securities, which is known as initial margin. Generally, the initial margin required for a particular interest rate swap is set and held as collateral by the clearinghouse on which the contract is cleared. The amount of initial margin required may be significantly modified from time to time by the clearinghouse during the term of the contract.
On a daily basis, the series’ investment adviser records daily interest accruals related to the exchange of future payments as a receivable and payable in each fund’s statement of assets and liabilities. Each fund also pays or receives a variation margin based on the increase or decrease in the value of the interest rate swaps, including accrued interest, and records variation margin on interest rate swaps in each fund’s statement of assets and liabilities. Each fund records realized gains and losses on both the net accrued interest and any gain or loss recognized at the time the interest rate swap is closed or expires. Net realized gains or losses, as well as any net unrealized appreciation or depreciation, from interest rate swaps are recorded in each fund’s statement of operations.
Credit default swap indices — Some of the funds have entered into centrally cleared credit default swap agreements on credit indices (“CDSI”) that involve one party (the protection buyer) making a stream of payments to another party (the protection seller) in exchange for the right to receive a specified return upon the occurrence of a credit event, such as a default or restructuring, with respect to any of the underlying issuers (reference obligations) in the referenced index. The series’ investment adviser uses credit default swaps to assume exposure to a diversified portfolio of credits or to hedge against existing credit risks.
CDSI are portfolios of credit instruments or exposures designed to be representative of some part of the credit market, such as the high-yield or investment-grade credit market. CDSI are generally traded using standardized terms, including a fixed spread and standard maturity dates, and reference all the names in the index. If there is a credit event, it is settled based on that name’s weight in the index. The composition of the underlying issuers or obligations within a particular index may change periodically, usually every six months. A specified credit event may affect all or individual underlying reference obligations included in the index, and will be settled based upon the relative weighting of the affected obligation(s) within the index. The value of each CDSI can be used as a measure of the current payment/performance risk of the CDSI and represents the likelihood of an expected liability or profit should the notional amount of the CDSI be closed or sold as of the period end. An increasing value, as compared to the notional amount of the CDSI, represents a deterioration of the referenced indices’ credit soundness and a greater likelihood of risk of default or other credit event occurring as defined under the terms of the agreement. When a fund provides sell protection, its maximum exposure is the notional amount of the credit default swap agreement.
Upon entering into a centrally cleared CDSI contract, the fund is required to deposit with a derivatives clearing member (“DCM”) in a segregated account in the name of the DCM an amount of cash, U.S. government securities or other liquid securities, which is known as initial margin. Generally, the initial margin required for a particular credit default swap is set and held as collateral by the clearinghouse on which the contract is cleared. The amount of initial margin required may be significantly modified from time to time by the clearinghouse during the term of the contract. Securities deposited as initial margin are designated on the investment portfolio.
On a daily basis, interest accruals related to the exchange of future payments are recorded as a receivable and payable in each fund’s statement of assets and liabilities. Each fund also pays or receives a variation margin based on the increase or decrease in the value of the centrally cleared swaps, and records variation margin in each fund’s statement of assets and liabilities. Each fund records realized gains and losses on both the net accrued interest and any gain or loss recognized at the time the swap is closed or expires. Net realized gains or losses, as well as any net unrealized appreciation or depreciation, from credit default swaps are recorded in each fund’s statement of operations.
| American Funds Insurance Series | 279 |
The following table presents the average month-end notional amounts of options contracts purchased, futures contracts, forward currency contracts, interest rate swaps and credit default swaps while held for each fund (dollars in thousands):
| | | Options
contracts
purchased | | Futures
contracts | | Forward
currency
contracts | | | Interest
rate
swaps | | Credit
default
swaps | |
| International Fund | | Not applicable | | Not applicable | | $41,887 | | | Not applicable | | Not applicable | |
| New World Fund | | Not applicable | | $ 1,829 | | 5,742 | | | Not applicable | | Not applicable | |
| Global Growth and Income Fund | | Not applicable | | Not applicable | | 6,973 | * | | Not applicable | | Not applicable | |
| International Growth and Income Fund | | Not applicable | | Not applicable | | 3,200 | * | | Not applicable | | Not applicable | |
| Capital Income Builder | | Not applicable | | 71,475 | | 965 | | | $ 112,369 | | $3,389 | |
| Asset Allocation Fund | | Not applicable | | 1,175,025 | | Not applicable | | | 227,086 | | 46,073 | |
| Global Balanced Fund | | Not applicable | | 4,858 | | 30,295 | | | 7,507 | | 3,800 | |
| Bond Fund | | Not applicable | | 3,685,113 | | 491,051 | | | 823,870 | | 173,850 | * |
| Capital World Bond Fund | | Not applicable | | 139,493 | | 657,769 | | | 121,529 | | 80,050 | |
| High-Income Bond Fund | | Not applicable | | 10,600 | | Not applicable | | | Not applicable | | 31,310 | |
| Mortgage Fund | | Not applicable | | 88,917 | | Not applicable | | | 268,075 | | Not applicable | |
| U.S. Government/AAA-Rated Securities Fund | | Not applicable | | 1,922,908 | | Not applicable | | | 3,696,916 | | Not applicable | |
| Managed Risk Growth Fund | | Not applicable | | 178,037 | | Not applicable | | | Not applicable | | Not applicable | |
| Managed Risk International Fund | | Not applicable | | 716,661 | | Not applicable | | | Not applicable | | Not applicable | |
| Managed Risk Blue Chip Income and Growth Fund | | Not applicable | | 119,174 | | Not applicable | | | Not applicable | | Not applicable | |
| Managed Risk Growth-Income Fund | | $36,373 | | 741,450 | | Not applicable | | | Not applicable | | Not applicable | |
| Managed Risk Asset Allocation Fund | | Not applicable | | 735,724 | | Not applicable | | | Not applicable | | Not applicable | |
| * | No contracts were held at the end of the reporting period; amount represents the average month-end notional amount of contracts while they were held. |
The following tables identify the location and fair value amounts on the funds’ statements of assets and liabilities and the effect on the funds’ statements of operations resulting from the funds’ use of options, futures contracts, forward currency contracts, interest rate swaps and/or credit default swaps as of, or for the year ended, December 31, 2020 (dollars in thousands):
International Fund
| | | | | Assets | | | Liabilities | |
| | | | | Location on statement of | | | | Location on statement of | | |
| Contracts | | Risk type | | assets and liabilities | | Value | | | assets and liabilities | | Value | |
| Forward currency | | Currency | | Unrealized appreciation on open forward currency contracts | | $ | 309 | | | Unrealized depreciation on open forward currency contracts | | $ | 395 | |
| | | | | | | | | | | | | |
| | | | | Net realized gain | | | Net unrealized appreciation | |
| | | | | Location on statement of | | | | Location on statement of | | |
| Contracts | | Risk type | | operations | | Value | | operations | | Value | |
| Forward currency | | Currency | | Net realized gain on forward currency contracts | | $ | 182 | | | Net unrealized appreciation on forward currency contracts | | $ | 45 | |
| | | | | | | | | | | | | | | |
| New World Fund |
| | | | | | | | | | | |
| | | | | Assets | | | Liabilities | |
| | | | | Location on statement of | | | | Location on statement of | | |
| Contracts | | Risk type | | assets and liabilities | | Value | | | assets and liabilities | | Value | |
| Futures | | Interest | | Unrealized appreciation1 | | $ | 3 | | | Unrealized depreciation1 | | $ | 13 | |
| Forward currency | | Currency | | Unrealized appreciation on open forward currency contracts | | | — | | | Unrealized depreciation on open forward currency contracts | | | 54 | |
| | | | | | | $ | 3 | | | | | $ | 67 | |
See end of tables for footnotes.
| 280 | American Funds Insurance Series |
| | | | | Net realized gain (loss) | | | Net unrealized depreciation | |
| | | | | Location on statement of | | | | | | Location on statement of | | | | |
| Contracts | | Risk type | | operations | | Value | | | operations | | Value | |
| Futures | | Interest | | Net realized gain on futures contracts | | $ | 140 | | | Net unrealized depreciation on futures contracts | | $ | (10 | ) |
| Forward currency | | Currency | | Net realized loss on forward currency contracts | | | (245 | ) | | Net unrealized depreciation on forward currency contracts | | | (54 | ) |
| | | | | | | $ | (105 | ) | | | | $ | (64 | ) |
| | | | | | | | | | | | | | | |
| Global Growth and Income Fund |
| | | | | | | | | | | | | |
| | | | | Net realized loss | | | Net unrealized appreciation | |
| | | | | Location on statement of | | | | | Location on statement of | | | |
| Contracts | | Risk type | | operations | | Value | | | operations | | Value | |
| Forward currency | | Currency | | Net realized loss on forward currency contracts | | $ | (521 | ) | | Net unrealized appreciation on forward currency contracts | | $ | 137 | |
| | | | | | | | | | | | | | | |
| International Growth and Income Fund |
| | | | | | | | | | | | | |
| | | | | Net realized gain | | | Net unrealized appreciation | |
| | | | | Location on statement of | | | | | Location on statement of | | | |
| Contracts | | Risk type | | operations | | Value | | | operations | | Value | |
| Forward currency | | Currency | | Net realized gain on forward currency contracts | | $ | 18 | | | Net unrealized appreciation on forward currency contracts | | $ | 12 | |
| | | | | | | | | | | | | | | |
| Capital Income Builder |
| | | | | | | | | | | | | |
| | | | | Assets | | | Liabilities | |
| | | | | Location on statement of | | | | | Location on statement of | | | |
| Contracts | | Risk type | | assets and liabilities | | Value | | | assets and liabilities | | Value | |
| Futures | | Interest | | Unrealized appreciation1 | | $ | 39 | | | Unrealized depreciation1 | | $ | 89 | |
| Forward currency | | Currency | | Unrealized appreciation on open forward currency contracts | | | 34 | | | Unrealized depreciation on open forward currency contracts | | | 56 | |
| Swap | | Interest | | Unrealized appreciation1 | | | 569 | | | Unrealized depreciation1 | | | — | |
| Swap | | Credit | | Unrealized appreciation1 | | | 152 | | | Unrealized depreciation1 | | | — | |
| | | | | | | $ | 794 | | | | | $ | 145 | |
| | | | | | | | | | | | | | | |
| | | | | Net realized gain | | | Net unrealized appreciation (depreciation) | |
| | | | | Location on statement of | | | | | Location on statement of | | | |
| Contracts | | Risk type | | operations | | Value | | | operations | | Value | |
| Futures | | Interest | | Net realized gain on futures contracts | | $ | 3,606 | | | Net unrealized appreciation on futures contracts | | $ | 281 | |
| Forward currency | | Currency | | Net realized gain on forward currency contracts | | | 38 | | | Net unrealized depreciation on forward currency contracts | | | (22 | ) |
| Swap | | Interest | | Net realized gain on swap contracts | | | 2,280 | | | Net unrealized depreciation on swap contracts | | | (260 | ) |
| Swap | | Credit | | Net realized gain on swap contracts | | | 406 | | | Net unrealized appreciation on swap contracts | | | 152 | |
| | | | | | | | | | | | | | | |
| | | | | | | $ | 6,330 | | | | | $ | 151 | |
See end of tables for footnotes.
| American Funds Insurance Series | 281 |
| Asset Allocation Fund |
| | | | | | | | | | | | | |
| | | | | Assets | | | Liabilities | |
| | | | | Location on statement of | | | | | Location on statement of | | | |
| Contracts | | Risk type | | assets and liabilities | | Value | | | assets and liabilities | | Value | |
| Futures | | Interest | | Unrealized appreciation1 | | $ | 1,610 | | | Unrealized depreciation1 | | $ | 2,382 | |
| Swap | | Interest | | Unrealized appreciation1 | | | 796 | | | Unrealized depreciation1 | | | — | |
| Swap | | Credit | | Unrealized appreciation1 | | | — | 2 | | Unrealized depreciation1 | | | — | |
| | | | | | | $ | 2,406 | | | | | $ | 2,382 | |
| | | | | | | | | | | | | | | |
| | | | | Net realized gain (loss) | | | Net unrealized appreciation | |
| | | | | Location on statement of | | | | | | Location on statement of | | | | |
| Contracts | | Risk type | | operations | | Value | | | operations | | Value | |
| Futures | | Interest | | Net realized gain on futures contracts | | $ | 36,747 | | | Net unrealized appreciation on futures contracts | | $ | 2,190 | |
| Swap | | Interest | | Net realized loss on swap contracts | | | (13,556 | ) | | Net unrealized appreciation on swap contracts | | | 4,608 | |
| Swap | | Credit | | Net realized gain on swap contracts | | | 2,725 | | | Net unrealized appreciation on swap contracts | | | — | 2 |
| | | | | | | $ | 25,916 | | | | | $ | 6,798 | |
| | | | | | | | | | | | | | | |
| Global Balanced Fund |
| | | | | | | | | | | | | | | |
| | | | | Assets | | | Liabilities | |
| | | | | Location on statement of | | | | | | Location on statement of | | | | |
| Contracts | | Risk type | | assets and liabilities | | Value | | | assets and liabilities | | Value | |
| Futures | | Interest | | Unrealized appreciation1 | | $ | 3 | | | Unrealized depreciation1 | | $ | — | |
| Forward currency | | Currency | | Unrealized appreciation on open forward currency contracts | | | 257 | | | Unrealized depreciation on open forward currency contracts | | | 259 | |
| Swap | | Interest | | Unrealized appreciation1 | | | 21 | | | Unrealized depreciation1 | | | — | |
| Swap | | Credit | | Unrealized appreciation1 | | | — | | | Unrealized depreciation1 | | | — | 2 |
| | | | | | | $ | 281 | | | | | $ | 259 | |
| | | | | | | | | | | | | | | |
| | | | | Net realized gain (loss) | | | Net unrealized appreciation (depreciation) | |
| | | | | Location on statement of | | | | | | Location on statement of | | | | |
| Contracts | | Risk type | | operations | | Value | | | operations | | Value | |
| Futures | | Interest | | Net realized gain on futures contracts | | $ | 442 | | | Net unrealized appreciation on futures contracts | | $ | 19 | |
| Forward currency | | Currency | | Net realized gain on forward currency contracts | | | 801 | | | Net unrealized appreciation on forward currency contracts | | | 97 | |
| Swap | | Interest | | Net realized loss on swap contracts | | | (126 | ) | | Net unrealized appreciation on swap contracts | | | 23 | |
| Swap | | Credit | | Net realized gain on swap contracts | | | 3 | | | Net unrealized depreciation on swap contracts | | | — | 2 |
| | | | | | | $ | 1,120 | | | | | $ | 139 | |
See end of tables for footnotes.
| 282 | American Funds Insurance Series |
| Bond Fund |
| | | | | | | | | | | | | |
| | | | | Assets | | | Liabilities | |
| | | | | Location on statement of | | | | | Location on statement of | | | |
| Contracts | | Risk type | | assets and liabilities | | Value | | | assets and liabilities | | Value | |
| Futures | | Interest | | Unrealized appreciation1 | | $ | 7,631 | | | Unrealized depreciation1 | | $ | 824 | |
| Forward currency | | Currency | | Unrealized appreciation on open forward currency contracts | | | 46 | | | Unrealized depreciation on open forward currency contracts | | | 2,653 | |
| Swap | | Interest | | Unrealized appreciation1 | | | 3,456 | | | Unrealized depreciation1 | | | 28,517 | |
| | | | | | | $ | 11,133 | | | | | $ | 31,994 | |
| | | | | | | | | | | | | | | |
| | | | | Net realized gain (loss) | | | Net unrealized appreciation (depreciation) | |
| | | | | Location on statement of | | | | | | Location on statement of | | | | |
| Contracts | | Risk type | | operations | | Value | | | operations | | Value | |
| Futures | | Interest | | Net realized gain on futures contracts | | $ | 89,071 | | | Net unrealized appreciation on futures contracts | | $ | 10,886 | |
| Forward currency | | Currency | | Net realized loss on forward currency contracts | | | (15,906 | ) | | Net unrealized depreciation on forward currency contracts | | | (1,417 | ) |
| Swap | | Interest | | Net realized loss on swap contracts | | | (22,499 | ) | | Net unrealized depreciation on swap contracts | | | (18,955 | ) |
| Swap | | Credit | | Net realized gain on swap contracts | | | 22,543 | | | Net unrealized appreciation on swap contracts | | | — | |
| | | | | | | $ | 73,209 | | | | | $ | (9,486 | ) |
| | | | | | | | | | | | | | | |
| Capital World Bond Fund |
| | | | | | | | | | | | | | | |
| | | | | Assets | | | Liabilities | |
| | | | | Location on statement of | | | | | | Location on statement of | | | | |
| Contracts | | Risk type | | assets and liabilities | | Value | | | assets and liabilities | | Value | |
| Futures | | Interest | | Unrealized appreciation1 | | $ | 308 | | | Unrealized depreciation1 | | $ | 155 | |
| Forward currency | | Currency | | Unrealized appreciation on open forward currency contracts | | | 4,155 | | | Unrealized depreciation on open forward currency contracts | | | 3,799 | |
| Swap | | Interest | | Unrealized appreciation1 | | | — | | | Unrealized depreciation1 | | | 64 | |
| Swap | | Credit | | Unrealized appreciation1 | | | 31 | | | Unrealized depreciation1 | | | 698 | |
| | | | | | | $ | 4,494 | | | | | $ | 4,716 | |
| | | | | | | | | | | | | | | |
| | | | | Net realized (loss) gain | | | Net unrealized appreciation (depreciation) | |
| | | | | Location on statement of | | | | | | Location on statement of | | | | |
| Contracts | | Risk type | | operations | | Value | | | operations | | Value | |
| Futures | | Interest | | Net realized loss on futures contracts | | $ | (180 | ) | | Net unrealized appreciation on futures contracts | | $ | 958 | |
| Forward currency | | Currency | | Net realized gain on forward currency contracts | | | 16,206 | | | Net unrealized appreciation on forward currency contracts | | | 2,566 | |
| Swap | | Interest | | Net realized loss on swap contracts | | | (2,548 | ) | | Net unrealized appreciation on swap contracts | | | 475 | |
| Swap | | Credit | | Net realized loss on swap contracts | | | (357 | ) | | Net unrealized depreciation on swap contracts | | | (1,398 | ) |
| | | | | | | $ | 13,121 | | | | | $ | 2,601 | |
See end of tables for footnotes.
| American Funds Insurance Series | 283 |
| High-Income Bond Fund |
| | | | | | | | | | | | | |
| | | | | Assets | | | Liabilities | |
| | | | | Location on statement of | | | | | Location on statement of | | | |
| Contracts | | Risk type | | assets and liabilities | | Value | | | assets and liabilities | | Value | |
| Futures | | Interest | | Unrealized appreciation1 | | $ | 8 | | | Unrealized depreciation1 | | $ | 27 | |
| Swap | | Credit | | Unrealized appreciation1 | | | 7 | | | Unrealized depreciation1 | | | 728 | |
| | | | | | | $ | 15 | | | | | $ | 755 | |
| | | | | | | | | | | | | | | |
| | | | | Net realized (loss) gain | | | Net unrealized (depreciation) appreciation | |
| | | | | Location on statement of | | | | | | Location on statement of | | | | |
| Contracts | | Risk type | | operations | | Value | | | operations | | Value | |
| Futures | | Interest | | Net realized loss on futures contracts | | $ | (166 | ) | | Net unrealized depreciation on futures contracts | | $ | (178 | ) |
| Swap | | Interest | | Net realized gain on swap contracts | | | 1 | | | Net unrealized appreciation on swap contracts | | | — | |
| Swap | | Credit | | Net realized gain on swap contracts | | | 3,841 | | | Net unrealized appreciation on swap contracts | | | 857 | |
| | | | | | | $ | 3,676 | | | | | $ | 679 | |
| | | | | | | | | | | | | | | |
| American Funds Mortgage Fund |
| | | | | | | | | | | | | | | |
| | | | | Assets | | | Liabilities | |
| | | | | Location on statement of | | | | | | Location on statement of | | | | |
| Contracts | | Risk type | | assets and liabilities | | Value | | | assets and liabilities | | Value | |
| Futures | | Interest | | Unrealized appreciation1 | | $ | 54 | | | Unrealized depreciation1 | | $ | 21 | |
| Swap | | Interest | | Unrealized appreciation1 | | | 1,218 | | | Unrealized depreciation1 | | | 4 | |
| | | | | | | $ | 1,272 | | | | | $ | 25 | |
| | | | | | | | | | | | | | | |
| | | | | Net realized gain (loss) | | | Net unrealized appreciation | |
| | | | | Location on statement of | | | | | | Location on statement of | | | | |
| Contracts | | Risk type | | operations | | Value | | | operations | | Value | |
| Futures | | Interest | | Net realized gain on futures contracts | | $ | 8,696 | | | Net unrealized appreciation on futures contracts | | $ | 779 | |
| Swap | | Interest | | Net realized loss on swap contracts | | | (8,505 | ) | | Net unrealized appreciation on swap contracts | | | 4,046 | |
| | | | | | | $ | 191 | | | | | $ | 4,825 | |
| | | | | | | | | | | | | | | |
| U.S. Government/AAA-Rated Securities Fund |
| | | | | | | | | | | | | | | |
| | | | | Assets | | | Liabilities | |
| | | | | Location on statement of | | | | | | Location on statement of | | | | |
| Contracts | | Risk type | | assets and liabilities | | Value | | | assets and liabilities | | Value | |
| Futures | | Interest | | Unrealized appreciation1 | | $ | 1,235 | | | Unrealized depreciation1 | | $ | 1,275 | |
| Swap | | Interest | | Unrealized appreciation1 | | | 34,726 | | | Unrealized depreciation1 | | | 7,246 | |
| | | | | | | $ | 35,961 | | | | | $ | 8,521 | |
See end of tables for footnotes.
| 284 | American Funds Insurance Series |
| | | | | Net realized gain (loss) | | | Net unrealized appreciation | |
| | | | | Location on statement of | | | | | Location on statement of | | | |
| Contracts | | Risk type | | operations | | Value | | | operations | | Value | |
| Futures | | Interest | | Net realized gain on futures contracts | | $ | 89,336 | | | Net unrealized appreciation on futures contracts | | $ | 7,908 | |
| Swap | | Interest | | Net realized loss on swap contracts | | | (46,704 | ) | | Net unrealized appreciation on swap contracts | | | 47,782 | |
| | | | | | | $ | 42,632 | | | | | $ | 55,690 | |
| | | | | | | | | | | | | | | |
| Managed Risk Growth Fund |
| | | | | | | | | | | | | |
| | | | | Assets | | | Liabilities | |
| | | | | Location on statement of | | | | | Location on statement of | | | |
| Contracts | | Risk type | | assets and liabilities | | Value | | | assets and liabilities | | Value | |
| Futures | | Interest | | Unrealized appreciation1 | | $ | 69 | | | Unrealized depreciation1 | | $ | — | |
| | | | | | | | | | | | | | | |
| | | | | Net realized (loss) gain | | | Net unrealized appreciation | |
| | | | | Location on statement of | | | | | Location on statement of | | | |
| Contracts | | Risk type | | operations | | Value | | | operations | | Value | |
| Futures | | Currency | | Net realized loss on futures contracts | | $ | (323 | ) | | Net unrealized appreciation on futures contracts | | $ | — | |
| Futures | | Equity | | Net realized loss on futures contracts | | | (40,633 | ) | | Net unrealized appreciation on futures contracts | | | — | |
| Futures | | Interest | | Net realized gain on futures contracts | | | 5,618 | | | Net unrealized appreciation on futures contracts | | | 130 | |
| | | | | | | $ | (35,338 | ) | | | | $ | 130 | |
| | | | | | | | | | | | | |
| Managed Risk International Fund |
| | | | | | | | | | | | | |
| | | | | Assets | | | Liabilities | |
| | | | | Location on statement of | | | | | | Location on statement of | | | | |
| Contracts | | Risk type | | assets and liabilities | | Value | | | assets and liabilities | | Value | |
| Futures | | Interest | | Unrealized appreciation1 | | $ | 21 | | | Unrealized depreciation1 | | $ | — | |
| | | | | | | | | | | | | | | |
| | | | | Net realized (loss) gain | | | Net unrealized appreciation | |
| | | | | Location on statement of | | | | | Location on statement of | | | |
| Contracts | | Risk type | | operations | | Value | | | operations | | Value | |
| Futures | | Currency | | Net realized loss on futures contracts | | $ | (689 | ) | | Net unrealized appreciation on futures contracts | | $ | — | |
| Futures | | Equity | | Net realized loss on futures contracts | | | (14,445 | ) | | Net unrealized appreciation on futures contracts | | | — | |
| Futures | | Interest | | Net realized gain on futures contracts | | | 1,083 | | | Net unrealized appreciation on futures contracts | | | 51 | |
| | | | | | | $ | (14,051 | ) | | | | $ | 51 | |
See end of tables for footnotes.
| American Funds Insurance Series | 285 |
Managed Risk Blue Chip Income and Growth Fund
| | | | | Assets | | | Liabilities | |
| | | | | Location on statement of | | | | | Location on statement of | | | |
| Contracts | | Risk type | | assets and liabilities | | Value | | | assets and liabilities | | Value | |
| Futures | | Interest | | Unrealized appreciation1 | | $ | 38 | | | Unrealized depreciation1 | | $ | — | |
| | | | | | | | | | | | | | | |
| | | | | Net realized (loss) gain | | | Net unrealized appreciation | |
| | | | | Location on statement of | | | | | | Location on statement of | | | | |
| Contracts | | Risk type | | operations | | Value | | | operations | | Value | |
| Futures | | Currency | | Net realized loss on futures contracts | | $ | (112 | ) | | Net unrealized appreciation on futures contracts | | $ | — | |
| Futures | | Equity | | Net realized loss on futures contracts | | | (36,178 | ) | | Net unrealized appreciation on futures contracts | | | — | |
| Futures | | Interest | | Net realized gain on futures contracts | | | 3,606 | | | Net unrealized appreciation on futures contracts | | | 90 | |
| | | | | | | $ | (32,684 | ) | | | | $ | 90 | |
| | | | | | | | | |
| Managed Risk Growth-Income Fund |
| | | | | | | | | |
| | | | | Assets | | | Liabilities | |
| | | | | Location on statement of | | | | | Location on statement of | | | |
| Contracts | | Risk type | | assets and liabilities | | Value | | | assets and liabilities | | Value | |
| Options purchased | | Equity | | Investment securities from unaffiliated issuers3 | | $ | 12,028 | | | Investment securities from unaffiliated issuers | | $ | — | |
| Futures | | Equity | | Unrealized appreciation1 | | | 2,637 | | | Unrealized depreciation1 | | | — | |
| Futures | | Interest | | Unrealized appreciation1 | | | 341 | | | Unrealized depreciation1 | | | — | |
| | | | | | | $ | 15,006 | | | | | $ | — | |
| | | | | | | | | | | | | | | |
| | | | | Net realized (loss) gain | | | Net unrealized appreciation | |
| | | | | Location on statement of | | | | | | Location on statement of | | | | |
| Contracts | | Risk type | | operations | | Value | | | operations | | Value | |
| Options purchased | | Equity | | Net realized loss on options purchased contracts4 | | $ | (22,888 | ) | | Net unrealized appreciation on options purchased contracts5 | | $ | — | |
| Futures | | Currency | | Net realized loss on futures contracts | | | (563 | ) | | Net unrealized appreciation on futures contracts | | | — | |
| Futures | | Equity | | Net realized loss on futures contracts | | | (44,738 | ) | | Net unrealized appreciation on futures contracts | | | 1,592 | |
| Futures | | Interest | | Net realized gain on futures contracts | | | 24,706 | | | Net unrealized appreciation on futures contracts | | | 716 | |
| | | | | | | $ | (43,483 | ) | | | | $ | 2,308 | |
See end of tables for footnotes.
| 286 | American Funds Insurance Series |
Managed Risk Asset Allocation Fund
| | | | | Assets | | | Liabilities | |
| | | | | Location on statement of | | | | | Location on statement of | | | |
| Contracts | | Risk type | | assets and liabilities | | Value | | | assets and liabilities | | Value | |
| Futures | | Interest | | Unrealized appreciation1 | | $ | 358 | | | Unrealized depreciation1 | | $ | — | |
| | | | | | | | | | | | | | | |
| | | | | Net realized (loss) gain | | | Net unrealized appreciation | |
| | | | | Location on statement of | | | | | | Location on statement of | | | | |
| Contracts | | Risk type | | operations | | | Value | | | operations | | Value | |
| Futures | | Currency | | Net realized loss on futures contracts | | $ | (82 | ) | | Net unrealized appreciation on futures contracts | | $ | — | |
| Futures | | Equity | | Net realized loss on futures contracts | | | (141,847 | ) | | Net unrealized appreciation on futures contracts | | �� | — | |
| Futures | | Interest | | Net realized gain on futures contracts | | | 22,678 | | | Net unrealized appreciation on futures contracts | | | 883 | |
| | | | | | | $ | (119,251 | ) | | | | $ | 883 | |
| 1 | Includes cumulative appreciation/depreciation on futures contracts, interest rate swaps and/or credit default swaps as reported in the applicable table following each fund’s investment portfolio. Only current day’s variation margin is reported within each fund’s statement of assets and liabilities. |
| 2 | Amount less than one thousand. |
| 3 | Includes options purchased as reported in the fund’s investment portfolio. |
| 4 | Options purchased are included in net realized gain (loss) on investments in unaffiliated issuers. |
| 5 | Options purchased are included in net unrealized appreciation (depreciation) on investments in unaffiliated issuers. |
Collateral — Some funds participate in a collateral program that calls for the funds to either receive or pledge highly liquid assets, such as cash or U.S. government securities, as collateral due to securities lending and/or their use of futures contracts, forward currency contracts, interest rate swaps, credit default swaps and/or future delivery contracts. For securities lending, each participating fund receives collateral in exchange for lending investment securities. The lending agent may reinvest collateral from securities lending transactions according to agreed parameters. For futures contracts, interest rate swaps and credit default swaps, the program calls for each participating fund to pledge collateral for initial and variation margin by contract. For forward currency contracts, the program calls for each participating fund to either receive or pledge collateral based on the net gain or loss on unsettled forward currency contracts by counterparty. For future delivery contracts, the program calls for each participating fund to either receive or pledge collateral based on the net gain or loss on unsettled contracts by certain counterparties. The purpose of the collateral is to cover potential losses that could occur in the event that either party cannot meet its contractual obligation. Non-cash collateral pledged by each participating fund, if any, is disclosed in each fund’s investment portfolio, and cash collateral pledged by each participating fund, if any, is held in a segregated account with the fund’s custodian, which is reflected as pledged cash collateral in each fund’s statement of assets and liabilities.
Rights of offset — Funds that hold forward currency contracts have enforceable master netting agreements with certain counterparties, where amounts payable by each party to the other in the same currency (with the same settlement date and with the same counterparty) are settled net of each party’s payment obligation. If an early termination date occurs under these agreements following an event of default or termination event, all obligations of each party to its counterparty are settled net through a single payment in a single currency (“close-out netting”). For financial reporting purposes, the funds do not offset financial assets and financial liabilities that are subject to these master netting arrangements in the statements of assets and liabilities.
The following tables present each fund’s forward currency contracts by counterparty that are subject to master netting agreements but that are not offset in the funds’ statements of assets and liabilities. The net amount column shows the impact of offsetting on the funds’ statement of assets and liabilities as of December 31, 2020, if close-out netting was exercised (dollars in thousands):
| American Funds Insurance Series | 287 |
| International Fund | | | | | | | | | | | | | | | |
| | | | | | | | | | | | | | | | |
| | | Gross amounts
recognized in the | | | Gross amounts not offset in the
statement of assets and liabilities and
subject to a master netting agreement | | | | |
| Counterparty | | | statement of assets
and liabilities | | | | Available
to offset | | | | Non-cash
collateral* | | | | Cash
collateral* | | | | Net
amount | |
| Assets: | | | | | | | | | | | | | | | | | | | | |
| Citibank | | $ | 309 | | | $ | (309 | ) | | $ | — | | | $ | — | | | $ | — | |
| Liabilities: | | | | | | | | | | | | | | | | | | | | |
| Citibank | | $ | 395 | | | $ | (309 | ) | | $ | — | | | $ | — | | | $ | 86 | |
| | | | | | | | | | | | | | | | | | | | | |
| New World Fund |
| | | | Gross amounts
recognized in the | | | | Gross amounts not offset in the
statement of assets and liabilities and
subject to a master netting agreement | | | | | |
| Counterparty | | | statement of assets
and liabilities | | | | Available
to offset | | | | Non-cash
collateral* | | | | Cash
collateral* | | | | Net
amount | |
| Liabilities: | | | | | | | | | | | | | | | | | | | | |
| Bank of New York Mellon | | $ | 54 | | | $ | — | | | $ | — | | | $ | — | | | $ | 54 | |
| | | | | | | | | | | | | | | | | | | | | |
| Capital Income Builder |
| | | | | | | | | | | | | | | | | | | | | |
| | | Gross amounts
recognized in the | | | Gross amounts not offset in the
statement of assets and liabilities and
subject to a master netting agreement | | | | |
| Counterparty | | statement of assets
and liabilities | | | Available
to offset | | | Non-cash
collateral* | | | Cash
collateral* | | | Net
amount | |
| Assets: | | | | | | | | | | | | | | | | | | | | |
| Bank of New York Mellon | | $ | 29 | | | $ | (4 | ) | | $ | — | | | $ | — | | | $ | 25 | |
| Goldman Sachs | | | 4 | | | | — | | | | — | | | | — | | | | 4 | |
| HSBC Bank | | | 1 | | | | — | | | | — | | | | — | | | | 1 | |
| Total | | $ | 34 | | | $ | (4 | ) | | $ | — | | | $ | — | | | $ | 30 | |
| Liabilities: | | | | | | | | | | | | | | | | | | | | |
| Bank of New York Mellon | | $ | 4 | | | $ | (4 | ) | | $ | — | | | $ | — | | | $ | — | |
| Standard Chartered Bank | | | 52 | | | | — | | | | — | | | | — | | | | 52 | |
| Total | | $ | 56 | | | $ | (4 | ) | | $ | — | | | $ | — | | | $ | 52 | |
See end of tables for footnote.
| 288 | American Funds Insurance Series |
Global Balanced Fund
| | | Gross amounts
recognized in the | | | Gross amounts not offset in the
statement of assets and liabilities and
subject to a master netting agreement | | | | |
| Counterparty | | statement of assets
and liabilities | | | Available
to offset | | | Non-cash
collateral* | | | Cash
collateral* | | | Net
amount | |
| Assets: | | | | | | | | | | | | | | | | | | | | |
| Bank of New York Mellon | | $ | 14 | | | $ | — | | | $ | — | | | $ | — | | | $ | 14 | |
| Barclays Bank PLC | | | 21 | | | | (1 | ) | | | — | | | | — | | | | 20 | |
| Citibank | | | 61 | | | | (61 | ) | | | — | | | | — | | | | — | |
| Goldman Sachs | | | 44 | | | | (14 | ) | | | — | | | | — | | | | 30 | |
| HSBC Bank | | | 38 | | | | (19 | ) | | | — | | | | — | | | | 19 | |
| JPMorgan Chase | | | 12 | | | | (11 | ) | | | — | | | | — | | | | 1 | |
| Morgan Stanley | | | 54 | | | | (48 | ) | | | — | | | | — | | | | 6 | |
| Standard Chartered Bank | | | 11 | | | | (11 | ) | | | — | | | | — | | | | — | |
| UBS AG | | | 2 | | | | — | | | | — | | | | — | | | | 2 | |
| Total | | $ | 257 | | | $ | (165 | ) | | $ | — | | | $ | — | | | $ | 92 | |
| Liabilities: | | | | | | | | | | | | | | | | | | | | |
| Bank of America | | $ | 21 | | | $ | — | | | $ | — | | | $ | — | | | $ | 21 | |
| Barclays Bank PLC | | | 1 | | | | (1 | ) | | | — | | | | — | | | | — | |
| Citibank | | | 115 | | | | (61 | ) | | | — | | | | — | | | | 54 | |
| Goldman Sachs | | | 14 | | | | (14 | ) | | | — | | | | — | | | | — | |
| HSBC Bank | | | 19 | | | | (19 | ) | | | — | | | | — | | | | — | |
| JPMorgan Chase | | | 11 | | | | (11 | ) | | | — | | | | — | | | | — | |
| Morgan Stanley | | | 48 | | | | (48 | ) | | | — | | | | — | | | | — | |
| Standard Chartered Bank | | | 30 | | | | (11 | ) | | | — | | | | — | | | | 19 | |
| Total | | $ | 259 | | | $ | (165 | ) | | $ | — | | | $ | — | | | $ | 94 | |
| | | | | | | | | | | | | | | | | | | | | |
| Bond Fund |
| | | | | | | | | | | | | | | | | | | | | |
| | | | Gross amounts
recognized in the | | | | Gross amounts not offset in the
statement of assets and liabilities and
subject to a master netting agreement | | | | | |
| Counterparty | | | statement of assets
and liabilities | | | | Available
to offset | | | | Non-cash
collateral* | | | | Cash
collateral* | | | | Net
amount | |
| Assets: | | | | | | | | | | | | | | | | | | | | |
| Morgan Stanley | | $ | 46 | | | $ | — | | | $ | — | | | $ | (46 | ) | | $ | — | |
| Liabilities: | | | | | | | | | | | | | | | | | | | | |
| Bank of New York Mellon | | $ | 877 | | | $ | — | | | $ | (877 | ) | | $ | — | | | $ | — | |
| HSBC Bank | | | 1,714 | | | | — | | | | (1,714 | ) | | | — | | | | — | |
| UBS AG | | | 62 | | | | — | | | | — | | | | — | | | | 62 | |
| Total | | $ | 2,653 | | | $ | — | | | $ | (2,591 | ) | | $ | — | | | $ | 62 | |
See end of tables for footnote.
| American Funds Insurance Series | 289 |
| Capital World Bond Fund |
| |
| | | | | | Gross amounts not offset in the | | | | |
| | | Gross amounts | | | statement of assets and liabilities and | | | | |
| | | recognized in the | | | subject to a master netting agreement | | | | |
| | | statement of assets | | | Available | | | Non-cash | | | Cash | | | Net | |
| Counterparty | | and liabilities | | | to offset | | | collateral* | | | collateral* | | | amount | |
| Assets: | | | | | | | | | | | | | | | | | | | | |
| Bank of America | | $ | 439 | | | $ | (439 | ) | | $ | — | | | $ | — | | | $ | — | |
| Bank of New York Mellon | | | 109 | | | | (2 | ) | | | — | | | | — | | | | 107 | |
| Citibank | | | 281 | | | | (281 | ) | | | — | | | | — | | | | — | |
| Goldman Sachs | | | 1,536 | | | | (359 | ) | | | — | | | | (1,110 | ) | | | 67 | |
| HSBC Bank | | | 319 | | | | (97 | ) | | | (108 | ) | | | — | | | | 114 | |
| JPMorgan Chase | | | 924 | | | | — | | | | (924 | ) | | | — | | | | — | |
| Standard Chartered Bank | | | 202 | | | | (8 | ) | | | (194 | ) | | | — | | | | — | |
| UBS AG | | | 345 | | | | (345 | ) | | | — | | | | — | | | | — | |
| Total | | $ | 4,155 | | | $ | (1,531 | ) | | $ | (1,226 | ) | | $ | (1,110 | ) | | $ | 288 | |
| Liabilities: | | | | | | | | | | | | | | | | | | | | |
| Bank of America | | $ | 551 | | | $ | (439 | ) | | $ | (63 | ) | | $ | — | | | $ | 49 | |
| Bank of New York Mellon | | | 2 | | | | (2 | ) | | | — | | | | — | | | | — | |
| Citibank | | | 1,691 | | | | (281 | ) | | | (1,312 | ) | | | — | | | | 98 | |
| Goldman Sachs | | | 359 | | | | (359 | ) | | | — | | | | — | | | | — | |
| HSBC Bank | | | 97 | | | | (97 | ) | | | — | | | | — | | | | — | |
| Morgan Stanley | | | 560 | | | | — | | | | (466 | ) | | | — | | | | 94 | |
| Standard Chartered Bank | | | 8 | | | | (8 | ) | | | — | | | | — | | | | — | |
| UBS AG | | | 531 | | | | (345 | ) | | | — | | | | — | | | | 186 | |
| Total | | $ | 3,799 | | | $ | (1,531 | ) | | $ | (1,841 | ) | | $ | — | | | $ | 427 | |
| * | Collateral is shown on a settlement basis. |
6. Taxation and distributions
Federal income taxation — Each fund complies with the requirements under Subchapter M of the Internal Revenue Code applicable to mutual funds and intends to distribute substantially all of its net taxable income and net capital gains each year. The funds are not subject to income taxes to the extent such distributions are made. Therefore, no federal income tax provision is required.
As of and during the period ended December 31, 2020, none of the funds had a liability for any unrecognized tax benefits. Each fund recognizes interest and penalties, if any, related to unrecognized tax benefits as income tax expense in their respective statements of operations. During the period, none of the funds incurred any significant interest or penalties.
Each fund’s tax returns are not subject to examination by federal, state and, if applicable, non-U.S. tax authorities after the expiration of each jurisdiction’s statute of limitations, which is generally three years after the date of filing but can be extended in certain jurisdictions.
Non-U.S. taxation — Dividend and interest income, if any, are recorded net of non-U.S. taxes paid. The funds may file withholding tax reclaims in certain jurisdictions to recover a portion of amounts previously withheld. As a result of rulings from European courts, the funds filed for additional reclaims related to prior years. These reclaims are recorded when the amount is known and there are no significant uncertainties on collectability. Gains realized by the funds on the sale of securities in certain countries, if any, may be subject to non-U.S. taxes. If applicable, the funds record an estimated deferred tax liability based on unrealized gains to provide for potential non-U.S. taxes payable upon the sale of these securities.
Distributions — Distributions paid to shareholders are based on each fund’s net investment income and net realized gains determined on a tax basis, which may differ from net investment income and net realized gains for financial reporting purposes. These differences are due primarily to different treatment for items such as currency gains and losses; short-term capital gains and losses; capital losses related to sales of certain securities within 30 days of purchase; unrealized appreciation of certain investments in securities outside the U.S.; deferred expenses; cost of investments sold; paydowns on fixed-income securities; net capital losses; net operating losses; non-U.S. taxes on capital gains; amortization of premiums and discounts and income on certain investments. The fiscal year in which amounts are distributed may differ from the year in which the net investment income and net realized gains are recorded by the funds for financial reporting purposes.
| 290 | American Funds Insurance Series |
Additional tax basis disclosures for each fund as of December 31, 2020, were as follows (dollars in thousands):
| | | Global
Growth
Fund | | | Global
Small
Capitalization
Fund | | | Growth
Fund | | | International
Fund | | | New
World
Fund | | | Blue Chip
Income and
Growth
Fund | |
| Undistributed ordinary income | | $ | 23,610 | | | $ | — | | | $ | 276,979 | | | $ | 4,878 | | | $ | 10,741 | | | $ | 38,218 | |
| Undistributed long-term capital gains | | | 445,512 | | | | 123,145 | | | | 5,068,501 | | | | — | | | | 143,589 | | | | — | |
| Capital loss carryforward* | | | — | | | | — | | | | — | | | | (136,440 | ) | | | — | | | | (63,496 | ) |
| Capital loss carryforward utilized | | | — | | | | — | | | | — | | | | 13,382 | | | | — | | | | — | |
| Gross unrealized appreciation on investments | | | 4,449,917 | | | | 2,433,892 | | | | 21,167,676 | | | | 4,059,818 | | | | 1,659,058 | | | | 3,361,319 | |
| Gross unrealized depreciation on investments | | | (135,394 | ) | | | (86,045 | ) | | | (234,902 | ) | | | (340,845 | ) | | | (33,325 | ) | | | (539,186 | ) |
| Net unrealized appreciation (depreciation) on investments | | | 4,314,523 | | | | 2,347,847 | | | | 20,932,774 | | | | 3,718,973 | | | | 1,625,733 | | | | 2,822,133 | |
| Cost of investments | | | 3,966,775 | | | | 3,047,816 | | | | 17,944,956 | | | | 6,940,513 | | | | 2,596,976 | | | | 6,754,573 | |
| Reclassification from (to) total distributable earnings/accumulated loss to (from) capital paid in on shares of beneficial interest | | | — | | | | (13,829 | ) | | | 6 | | | | — | | | | (1 | ) | | | — | |
| | | | | | | | | | | | | | | | | | | |
| | | Global
Growth
and Income
Fund | | | Growth-
Income
Fund | | | International
Growth
and Income
Fund | | | Capital
Income
Builder | | | Asset
Allocation
Fund | | | Global
Balanced
Fund | |
| Undistributed ordinary income | | $ | 4,517 | | | $ | 161,308 | | | $ | 5,778 | | | $ | 3,530 | | | $ | 248,732 | | | $ | 646 | |
| Undistributed long-term capital gains | | | 51,479 | | | | 403,490 | | | | — | | | | — | | | | 899,471 | | | | 1,975 | |
| Capital loss carryforward* | | | — | | | | — | | | | (76,870 | ) | | | (62,945 | ) | | | — | | | | — | |
| Gross unrealized appreciation on investments | | | 784,941 | | | | 15,269,066 | | | | 428,729 | | | | 168,138 | | | | 8,710,090 | | | | 103,417 | |
| Gross unrealized depreciation on investments | | | (35,268 | ) | | | (859,941 | ) | | | (46,994 | ) | | | (16,334 | ) | | | (257,151 | ) | | | (3,408 | ) |
| Net unrealized appreciation (depreciation) on investments | | | 749,673 | | | | 14,409,125 | | | | 381,735 | | | | 151,804 | | | | 8,452,939 | | | | 100,009 | |
| Cost of investments | | | 1,420,661 | | | | 24,205,230 | | | | 1,075,943 | | | | 952,928 | | | | 22,421,338 | | | | 353,494 | |
| Reclassification from (to) total distributable earnings/accumulated loss to (from) capital paid in on shares of beneficial interest | | | — | | | | (822 | ) | | | (1 | ) | | | 1 | | | | 18 | | | | 2 | |
See end of tables for footnote.
| American Funds Insurance Series | 291 |
| | | Bond
Fund | | | Capital
World
Bond
Fund | | | High-
Income
Bond
Fund | | | American
Funds
Mortgage
Fund | | | Ultra-Short
Bond
Fund | | | U.S.
Government/
AAA-Rated
Securities
Fund | |
| Undistributed ordinary income | | $ | 293,413 | | | $ | 42,838 | | | $ | 6,554 | | | $ | 7,215 | | | $ | — | | | $ | 133,505 | |
| Undistributed long-term capital gains | | | 218,389 | | | | 21,745 | | | | — | | | | 4,438 | | | | — | | | | 51,890 | |
| Capital loss carryforward* | | | — | | | | — | | | | (247,718 | ) | | | — | | | | (1 | ) | | | — | |
| Gross unrealized appreciation on investments | | | 648,591 | | | | 188,721 | | | | 54,124 | | | | 6,536 | | | | 8 | | | | 88,168 | |
| Gross unrealized depreciation on investments | | | (47,722 | ) | | | (20,385 | ) | | | (55,153 | ) | | | (625 | ) | | | (2 | ) | | | (16,204 | ) |
| Net unrealized appreciation (depreciation) on investments | | | 600,869 | | | | 168,336 | | | | (1,029 | ) | | | 5,911 | | | | 6 | | | | 71,964 | |
| Cost of investments | | | 13,100,327 | | | | 2,172,394 | | | | 857,316 | | | | 387,737 | | | | 372,351 | | | | 2,449,196 | |
| Reclassification from (to) total distributable earnings/accumulated loss to (from) capital paid in on shares of beneficial interest | | | 1 | | | | — | | | | 7,377 | | | | — | | | | (172 | ) | | | — | |
| | | | | | | | | | | | | | | | | | | | | | | | | |
| | | Managed
Risk
Growth
Fund | | | Managed
Risk
International
Fund | | | Managed
Risk Blue
Chip Income
and Growth
Fund | | | Managed
Risk
Growth-
Income
Fund | | | Managed
Risk
Asset
Allocation
Fund | | | | | |
| Undistributed ordinary income | | $ | 1,371 | | | $ | 929 | | | $ | 4,349 | | | $ | 25,029 | | | $ | 31,041 | | | | | |
| Undistributed long-term capital gains | | | 24,118 | | | | — | | | | — | | | | 33,730 | | | | — | | | | | |
| Capital loss carryforward* | | | — | | | | (11,769 | ) | | | (22,483 | ) | | | — | | | | (31,551 | ) | | | | |
| Gross unrealized appreciation on investments | | | 156,525 | | | | 33,827 | | | | 62,066 | | | | 380,437 | | | | 403,906 | | | | | |
| Gross unrealized depreciation on investments | | | (4,202 | ) | | | (8,961 | ) | | | (45,409 | ) | | | (58,764 | ) | | | (17,089 | ) | | | | |
| Net unrealized appreciation (depreciation) on investments | | | 152,323 | | | | 24,866 | | | | 16,657 | | | | 321,673 | | | | 386,817 | | | | | |
| Cost of investments | | | 412,543 | | | | 144,392 | | | | 339,936 | | | | 2,110,156 | | | | 2,394,223 | | | | | |
| * | Capital loss carryforwards will be used to offset any capital gains realized by the funds in future years. The funds will not make distributions from capital gains while a capital loss carryforward remains. |
Distributions paid by each fund were characterized for tax purposes as follows (dollars in thousands):
Global Growth Fund
| | | Year ended December 31, 2020 | | | Year ended December 31, 2019 | |
| Share class | | Ordinary
income | | | Long-term
capital gains | | | Total
distributions
paid | | | Ordinary
income | | | Long-term
capital gains | | | Total
distributions
paid | |
| Class 1 | | $ | 16,383 | | | $ | 73,033 | | | $ | 89,416 | | | $ | 31,022 | | | $ | 121,251 | | | $ | 152,273 | |
| Class 1A | | | 29 | | | | 205 | | | | 234 | | | | 82 | | | | 367 | | | | 449 | |
| Class 2 | | | 13,463 | | | | 109,286 | | | | 122,749 | | | | 40,119 | | | | 204,481 | | | | 244,600 | |
| Class 4 | | | 653 | | | | 11,537 | | | | 12,190 | | | | 3,204 | | | | 17,408 | | | | 20,612 | |
| Total | | $ | 30,528 | | | $ | 194,061 | | | $ | 224,589 | | | $ | 74,427 | | | $ | 343,507 | | | $ | 417,934 | |
See end of tables for footnote.
| 292 | American Funds Insurance Series |
Global Small Capitalization Fund
| | | Year ended December 31, 2020 | | | Year ended December 31, 2019 | |
| Share class | | Ordinary
income | | | Long-term
capital gains | | | Total
distributions
paid | | | Ordinary
income | | | Long-term
capital gains | | | Total
distributions
paid | |
| Class 1 | | $ | 5,414 | | | $ | 120,074 | | | $ | 125,488 | | | $ | 28,009 | | | $ | 97,912 | | | $ | 125,921 | |
| Class 1A | | | 2 | | | | 42 | | | | 44 | | | | 6 | | | | 23 | | | | 29 | |
| Class 2 | | | 5,373 | | | | 140,495 | | | | 145,868 | | | | 28,406 | | | | 119,280 | | | | 147,686 | |
| Class 4 | | | 408 | | | | 12,682 | | | | 13,090 | | | | 1,932 | | | | 9,184 | | | | 11,116 | |
| Total | | $ | 11,197 | | | $ | 273,293 | | | $ | 284,490 | | | $ | 58,353 | | | $ | 226,399 | | | $ | 284,752 | |
Growth Fund
| | | Year ended December 31, 2020 | | | Year ended December 31, 2019 | |
| Share class | | Ordinary
income | | | Long-term
capital gains | | | Total
distributions
paid | | | Ordinary
income | | | Long-term
capital gains | | | Total
distributions
paid | |
| Class 1 | | $ | 68,600 | | | $ | 285,315 | | | $ | 353,915 | | | $ | 150,838 | | | $ | 964,757 | | | $ | 1,115,595 | |
| Class 1A | | | 141 | | | | 547 | | | | 688 | | | | 193 | | | | 1,290 | | | | 1,483 | |
| Class 2 | | | 53,722 | | | | 404,657 | | | | 458,379 | | | | 192,058 | | | | 1,500,212 | | | | 1,692,270 | |
| Class 3 | | | 860 | | | | 5,433 | | | | 6,293 | | | | 2,713 | | | | 20,442 | | | | 23,155 | |
| Class 4 | | | 3,629 | | | | 42,241 | | | | 45,870 | | | | 14,770 | | | | 130,929 | | | | 145,699 | |
| Total | | $ | 126,952 | | | $ | 738,193 | | | $ | 865,145 | | | $ | 360,572 | | | $ | 2,617,630 | | | $ | 2,978,202 | |
International Fund
| | | Year ended December 31, 2020 | | | Year ended December 31, 2019 | |
| Share class | | Ordinary
income | | | Long-term
capital gains | | | Total
distributions
paid | | | Ordinary
income | | | Long-term
capital gains | | | Total
distributions
paid | |
| Class 1 | | $ | 44,223 | | | $ | — | | | $ | 44,223 | | | $ | 85,943 | | | $ | 130,060 | | | $ | 216,003 | |
| Class 1A | | | 56 | | | | — | | | | 56 | | | | 95 | | | | 141 | | | | 236 | |
| Class 2 | | | 25,688 | | | | — | | | | 25,688 | | | | 59,246 | | | | 104,778 | | | | 164,024 | |
| Class 3 | | | 157 | | | | — | | | | 157 | | | | 354 | | | | 637 | | | | 991 | |
| Class 4 | | | 1,591 | | | | — | | | | 1,591 | | | | 4,496 | | | | 8,870 | | | | 13,366 | |
| Total | | $ | 71,715 | | | $ | — | | | $ | 71,715 | | | $ | 150,134 | | | $ | 244,486 | | | $ | 394,620 | |
New World Fund
| | | Year ended December 31, 2020 | | | Year ended December 31, 2019 | |
| Share class | | Ordinary
income | | | Long-term
capital gains | | | Total
distributions
paid | | | Ordinary
income | | | Long-term
capital gains | | | Total
distributions
paid | |
| Class 1 | | $ | 16,847 | | | $ | 8,752 | | | $ | 25,599 | | | $ | 23,315 | | | $ | 71,500 | | | $ | 94,815 | |
| Class 1A | | | 48 | | | | 26 | | | | 74 | | | | 39 | | | | 132 | | | | 171 | |
| Class 2 | | | 6,570 | | | | 4,233 | | | | 10,803 | | | | 8,693 | | | | 34,958 | | | | 43,651 | |
| Class 4 | | | 4,454 | | | | 3,019 | | | | 7,473 | | | | 4,452 | | | | 21,103 | | | | 25,555 | |
| Total | | $ | 27,919 | | | $ | 16,030 | | | $ | 43,949 | | | $ | 36,499 | | | $ | 127,693 | | | $ | 164,192 | |
See end of tables for footnote.
| American Funds Insurance Series | 293 |
Blue Chip Income and Growth Fund
| | | Year ended December 31, 2020 | | | Year ended December 31, 2019 | |
| Share class | | Ordinary
income | | | Long-term
capital gains | | | Total
distributions
paid | | | Ordinary
income | | | Long-term
capital gains | | | Total
distributions
paid | |
| Class 1 | | $ | 100,756 | | | $ | 61,517 | | | $ | 162,273 | | | $ | 118,657 | | | $ | 410,713 | | | $ | 529,370 | |
| Class 1A | | | 350 | | | | 134 | | | | 484 | | | | 163 | | | | 435 | | | | 598 | |
| Class 2 | | | 48,936 | | | | 34,662 | | | | 83,598 | | | | 60,118 | | | | 238,793 | | | | 298,911 | |
| Class 4 | | | 10,866 | | | | 7,992 | | | | 18,858 | | | | 10,646 | | | | 38,700 | | | | 49,346 | |
| Total | | $ | 160,908 | | | $ | 104,305 | | | $ | 265,213 | | | $ | 189,584 | | | $ | 688,641 | | | $ | 878,225 | |
Global Growth and Income Fund
| | | Year ended December 31, 2020 | | | Year ended December 31, 2019 | |
| Share class | | Ordinary
income | | | Long-term
capital gains | | | Total
distributions
paid | | | Ordinary
income | | | Long-term
capital gains | | | Total
distributions
paid | |
| Class 1 | | $ | 8,987 | | | $ | 15,679 | | | $ | 24,666 | | | $ | 12,475 | | | $ | 27,971 | | | $ | 40,446 | |
| Class 1A | | | 28 | | | | 53 | | | | 81 | | | | 33 | | | | 66 | | | | 99 | |
| Class 2 | | | 15,537 | | | | 32,112 | | | | 47,649 | | | | 24,591 | | | | 66,794 | | | | 91,385 | |
| Class 4 | | | 1,576 | | | | 3,612 | | | | 5,188 | | | | 2,298 | | | | 5,970 | | | | 8,268 | |
| Total | | $ | 26,128 | | | $ | 51,456 | | | $ | 77,584 | | | $ | 39,397 | | | $ | 100,801 | | | $ | 140,198 | |
Growth-Income Fund
| | | Year ended December 31, 2020 | | | Year ended December 31, 2019 | |
| Share class | | Ordinary
income | | | Long-term
capital gains | | | Total
distributions
paid | | | Ordinary
income | | | Long-term
capital gains | | | Total
distributions
paid | |
| Class 1 | | $ | 381,174 | | | $ | 482,142 | | | $ | 863,316 | | | $ | 455,391 | | | $ | 1,825,184 | | | $ | 2,280,575 | |
| Class 1A | | | 211 | | | | 265 | | | | 476 | | | | 206 | | | | 825 | | | | 1,031 | |
| Class 2 | | | 207,651 | | | | 305,445 | | | | 513,096 | | | | 272,097 | | | | 1,260,360 | | | | 1,532,457 | |
| Class 3 | | | 2,378 | | | | 3,413 | | | | 5,791 | | | | 3,204 | | | | 14,500 | | | | 17,704 | |
| Class 4 | | | 17,727 | | | | 29,072 | | | | 46,799 | | | | 21,474 | | | | 103,934 | | | | 125,408 | |
| Total | | $ | 609,141 | | | $ | 820,337 | | | $ | 1,429,478 | | | $ | 752,372 | | | $ | 3,204,803 | | | $ | 3,957,175 | |
International Growth and Income Fund
| | | Year ended December 31, 2020 | | | Year ended December 31, 2019 | |
| Share class | | Ordinary
income | | | Long-term
capital gains | | | Total
distributions
paid | | | Ordinary
income | | | Long-term
capital gains | | | Total
distributions
paid | |
| Class 1 | | $ | 17,264 | | | $ | — | | | $ | 17,264 | | | $ | 41,626 | | | $ | — | | | $ | 41,626 | |
| Class 1A | | | 38 | | | | — | | | | 38 | | | | 84 | | | | — | | | | 84 | |
| Class 2 | | | 2,910 | | | | — | | | | 2,910 | | | | 8,726 | | | | — | | | | 8,726 | |
| Class 4 | | | 1,255 | | | | — | | | | 1,255 | | | | 3,112 | | | | — | | | | 3,112 | |
| Total | | $ | 21,467 | | | $ | — | | | $ | 21,467 | | | $ | 53,548 | | | $ | — | | | $ | 53,548 | |
See end of tables for footnote.
| 294 | American Funds Insurance Series |
Capital Income Builder
| | | Year ended December 31, 2020 | | | Year ended December 31, 2019 | |
| Share class | | Ordinary
income | | | Long-term
capital gains | | | Total
distributions
paid | | | Ordinary
income | | | Long-term
capital gains | | | Total
distributions
paid | |
| Class 1 | | $ | 17,286 | | | $ | — | | | $ | 17,286 | | | $ | 13,476 | | | $ | — | | | $ | 13,476 | |
| Class 1A | | | 161 | | | | — | | | | 161 | | | | 126 | | | | — | | | | 126 | |
| Class 2 | | | 181 | | | | — | | | | 181 | | | | 137 | | | | — | | | | 137 | |
| Class 4 | | | 11,369 | | | | — | | | | 11,369 | | | | 10,875 | | | | — | | | | 10,875 | |
| Total | | $ | 28,997 | | | $ | — | | | $ | 28,997 | | | $ | 24,614 | | | $ | — | | | $ | 24,614 | |
Asset Allocation Fund
| | | Year ended December 31, 2020 | | | Year ended December 31, 2019 | |
| Share class | | Ordinary
income | | | Long-term
capital gains | | | Total
distributions
paid | | | Ordinary
income | | | Long-term
capital gains | | | Total
distributions
paid | |
| Class 1 | | $ | 333,238 | | | $ | 79,610 | | | $ | 412,848 | | | $ | 356,589 | | | $ | 816,841 | | | $ | 1,173,430 | |
| Class 1A | | | 213 | | | | 51 | | | | 264 | | | | 189 | | | | 416 | | | | 605 | |
| Class 2 | | | 80,906 | | | | 22,747 | | | | 103,653 | | | | 94,178 | | | | 253,101 | | | | 347,279 | |
| Class 3 | | | 520 | | | | 141 | | | | 661 | | | | 608 | | | | 1,581 | | | | 2,189 | |
| Class 4 | | | 67,789 | | | | 21,221 | | | | 89,010 | | | | 71,682 | | | | 206,152 | | | | 277,834 | |
| Total | | $ | 482,666 | | | $ | 123,770 | | | $ | 606,436 | | | $ | 523,246 | | | $ | 1,278,091 | | | $ | 1,801,337 | |
Global Balanced Fund
| | | Year ended December 31, 2020 | | | Year ended December 31, 2019 | |
| Share class | | Ordinary
income | | | Long-term
capital gains | | | Total
distributions
paid | | | Ordinary
income | | | Long-term
capital gains | | | Total
distributions
paid | |
| Class 1 | | $ | 1,746 | | | $ | 5,085 | | | $ | 6,831 | | | $ | 1,912 | | | $ | 3,479 | | | $ | 5,391 | |
| Class 1A | | | 29 | | | | 99 | | | | 128 | | | | 28 | | | | 61 | | | | 89 | |
| Class 2 | | | 2,128 | | | | 7,631 | | | | 9,759 | | | | 2,521 | | | | 5,487 | | | | 8,008 | |
| Class 4 | | | 844 | | | | 3,811 | | | | 4,655 | | | | 954 | | | | 2,492 | | | | 3,446 | |
| Total | | $ | 4,747 | | | $ | 16,626 | | | $ | 21,373 | | | $ | 5,415 | | | $ | 11,519 | | | $ | 16,934 | |
Bond Fund
| | | Year ended December 31, 2020 | | | Year ended December 31, 2019 | |
| Share class | | Ordinary
income | | | Long-term
capital gains | | | Total
distributions
paid | | | Ordinary
income | | | Long-term
capital gains | | | Total
distributions
paid | |
| Class 1 | | $ | 185,412 | | | $ | 25,238 | | | $ | 210,650 | | | $ | 177,855 | | | $ | — | | | $ | 177,855 | |
| Class 1A | | | 224 | | | | 31 | | | | 255 | | | | 165 | | | | — | | | | 165 | |
| Class 2 | | | 96,166 | | | | 14,478 | | | | 110,644 | | | | 90,796 | | | | — | | | | 90,796 | |
| Class 4 | | | 15,659 | | | | 2,303 | | | | 17,962 | | | | 11,384 | | | | — | | | | 11,384 | |
| Total | | $ | 297,461 | | | $ | 42,050 | | | $ | 339,511 | | | $ | 280,200 | | | $ | — | | | $ | 280,200 | |
See end of tables for footnote.
| American Funds Insurance Series | 295 |
Capital World Bond Fund
| | | Year ended December 31, 2020 | | | Year ended December 31, 2019 | |
| | | | | | | | | Total | | | | | | | | | Total | |
| | | Ordinary | | | Long-term | | | distributions | | | Ordinary | | | Long-term | | | distributions | |
| Share class | | income | | | capital gains | | | paid | | | income | | | capital gains | | | paid | |
| Class 1 | | $ | 30,575 | | | $ | 4,335 | | | $ | 34,910 | | | $ | 19,173 | | | $ | — | | | $ | 19,173 | |
| Class 1A | | | 16 | | | | 3 | | | | 19 | | | | 7 | | | | — | | | | 7 | |
| Class 2 | | | 24,602 | | | | 3,871 | | | | 28,473 | | | | 15,927 | | | | — | | | | 15,927 | |
| Class 4 | | | 1,252 | | | | 206 | | | | 1,458 | | | | 649 | | | | — | | | | 649 | |
| Total | | $ | 56,445 | | | $ | 8,415 | | | $ | 64,860 | | | $ | 35,756 | | | $ | — | | | $ | 35,756 | |
High-Income Bond Fund
| | | Year ended December 31, 2020 | | | Year ended December 31, 2019 | |
| | | | | | | | | Total | | | | | | | | | Total | |
| | | Ordinary | | | Long-term | | | distributions | | | Ordinary | | | Long-term | | | distributions | |
| Share class | | income | | | capital gains | | | paid | | | income | | | capital gains | | | paid | |
| Class 1 | | $ | 10,071 | | | $ | — | | | $ | 10,071 | | | $ | 33,304 | | | $ | — | | | $ | 33,304 | |
| Class 1A | | | 78 | | | | — | | | | 78 | | | | 45 | | | | — | | | | 45 | |
| Class 2 | | | 54,086 | | | | — | | | | 54,086 | | | | 41,753 | | | | — | | | | 41,753 | |
| Class 3 | | | 799 | | | | — | | | | 799 | | | | 611 | | | | — | | | | 611 | |
| Class 4 | | | 4,806 | | | | — | | | | 4,806 | | | | 3,353 | | | | — | | | | 3,353 | |
| Total | | $ | 69,840 | | | $ | — | | | $ | 69,840 | | | $ | 79,066 | | | $ | — | | | $ | 79,066 | |
American Funds Mortgage Fund
| | | Year ended December 31, 2020 | | | Year ended December 31, 2019 | |
| | | | | | | | | Total | | | | | | | | | Total | |
| | | Ordinary | | | Long-term | | | distributions | | | Ordinary | | | Long-term | | | distributions | |
| Share class | | income | | | capital gains | | | paid | | | income | | | capital gains | | | paid | |
| Class 1 | | $ | 3,288 | | | $ | 263 | | | $ | 3,551 | | | $ | 5,573 | | | $ | — | | | $ | 5,573 | |
| Class 1A | | | 13 | | | | 1 | | | | 14 | | | | 12 | | | | — | | | | 12 | |
| Class 2 | | | 722 | | | | 75 | | | | 797 | | | | 1,355 | | | | — | | | | 1,355 | |
| Class 4 | | | 406 | | | | 52 | | | | 458 | | | | 585 | | | | — | | | | 585 | |
| Total | | $ | 4,429 | | | $ | 391 | | | $ | 4,820 | | | $ | 7,525 | | | $ | — | | | $ | 7,525 | |
Ultra-Short Bond Fund
| | | Year ended December 31, 2020 | | | Year ended December 31, 2019 | |
| | | | | | | | | Total | | | | | | | | | Total | |
| | | Ordinary | | | Long-term | | | distributions | | | Ordinary | | | Long-term | | | distributions | |
| Share class | | income | | | capital gains | | | paid | | | income | | | capital gains | | | paid | |
| Class 1 | | $ | 104 | | | $ | — | | | $ | 104 | | | $ | 604 | | | $ | — | | | $ | 604 | |
| Class 1A | | | — | * | | | — | | | | — | * | | | — | * | | | — | | | | — | * |
| Class 2 | | | 558 | | | | — | | | | 558 | | | | 4,088 | | | | — | | | | 4,088 | |
| Class 3 | | | 8 | | | | — | | | | 8 | | | | 59 | | | | — | | | | 59 | |
| Class 4 | | | 67 | | | | — | | | | 67 | | | | 342 | | | | — | | | | 342 | |
| Total | | $ | 737 | | | $ | — | | | $ | 737 | | | $ | 5,093 | | | $ | — | | | $ | 5,093 | |
See end of tables for footnote.
| 296 | American Funds Insurance Series |
U.S. Government/AAA-Rated Securities Fund
| | | Year ended December 31, 2020 | | | Year ended December 31, 2019 | |
| | | | | | | | | Total | | | | | | | | | Total | |
| | | Ordinary | | | Long-term | | | distributions | | | Ordinary | | | Long-term | | | distributions | |
| Share class | | income | | | capital gains | | | paid | | | income | | | capital gains | | | paid | |
| Class 1 | | $ | 12,901 | | | $ | 3,231 | | | $ | 16,132 | | | $ | 31,700 | | | $ | — | | | $ | 31,700 | |
| Class 1A | | | 107 | | | | 29 | | | | 136 | | | | 50 | | | | — | | | | 50 | |
| Class 2 | | | 40,852 | | | | 11,067 | | | | 51,919 | | | | 26,790 | | | | — | | | | 26,790 | |
| Class 3 | | | 318 | | | | 89 | | | | 407 | | | | 180 | | | | — | | | | 180 | |
| Class 4 | | | 7,195 | | | | 1,992 | | | | 9,187 | | | | 2,241 | | | | — | | | | 2,241 | |
| Total | | $ | 61,373 | | | $ | 16,408 | | | $ | 77,781 | | | $ | 60,961 | | | $ | — | | | $ | 60,961 | |
Managed Risk Growth Fund
| | | Year ended December 31, 2020 | | | Year ended December 31, 2019 | |
| | | | | | | | | Total | | | | | | | | | Total | |
| | | Ordinary | | | Long-term | | | distributions | | | Ordinary | | | Long-term | | | distributions | |
| Share class | | income | | | capital gains | | | paid | | | income | | | capital gains | | | paid | |
| Class P1 | | $ | 64 | | | $ | 374 | | | $ | 438 | | | $ | 61 | | | $ | 256 | | | $ | 317 | |
| Class P2 | | | 3,441 | | | | 21,395 | | | | 24,836 | | | | 3,581 | | | | 26,324 | | | | 29,905 | |
| Total | | $ | 3,505 | | | $ | 21,769 | | | $ | 25,274 | | | $ | 3,642 | | | $ | 26,580 | | | $ | 30,222 | |
Managed Risk International Fund
| | | Year ended December 31, 2020 | | | Year ended December 31, 2019 | |
| | | | | | | | | Total | | | | | | | | | Total | |
| | | Ordinary | | | Long-term | | | distributions | | | Ordinary | | | Long-term | | | distributions | |
| Share class | | income | | | capital gains | | | paid | | | income | | | capital gains | | | paid | |
| Class P1 | | $ | 21 | | | $ | 10 | | | $ | 31 | | | $ | 11 | | | $ | 16 | | | $ | 27 | |
| Class P2 | | | 1,913 | | | | 1,303 | | | | 3,216 | | | | 2,974 | | | | 4,795 | | | | 7,769 | |
| Total | | $ | 1,934 | | | $ | 1,313 | | | $ | 3,247 | | | $ | 2,985 | | | $ | 4,811 | | | $ | 7,796 | |
Managed Risk Blue Chip Income and Growth Fund
| | | Year ended December 31, 2020 | | | Year ended December 31, 2019 | |
| | | | | | | | | Total | | | | | | | | | Total | |
| | | Ordinary | | | Long-term | | | distributions | | | Ordinary | | | Long-term | | | distributions | |
| Share class | | income | | | capital gains | | | paid | | | income | | | capital gains | | | paid | |
| Class P1 | | $ | 29 | | | $ | 37 | | | $ | 66 | | | $ | 13 | | | $ | 40 | | | $ | 53 | |
| Class P2 | | | 6,006 | | | | 10,828 | | | | 16,834 | | | | 5,566 | | | | 17,796 | | | | 23,362 | |
| Total | | $ | 6,035 | | | $ | 10,865 | | | $ | 16,900 | | | $ | 5,579 | | | $ | 17,836 | | | $ | 23,415 | |
Managed Risk Growth-Income Fund
| | | Year ended December 31, 2020 | | | Year ended December 31, 2019 | |
| | | | | | | | | Total | | | | | | | | | Total | |
| | | Ordinary | | | Long-term | | | distributions | | | Ordinary | | | Long-term | | | distributions | |
| Share class | | income | | | capital gains | | | paid | | | income | | | capital gains | | | paid | |
| Class P1 | | $ | 37,519 | | | $ | 103,175 | | | $ | 140,694 | | | $ | 14,564 | | | $ | 14,505 | | | $ | 29,069 | |
| Class P2 | | | 4,874 | | | | 15,199 | | | | 20,073 | | | | 1,352 | | | | 2,019 | | | | 3,371 | |
| Total | | $ | 42,393 | | | $ | 118,374 | | | $ | 160,767 | | | $ | 15,916 | | | $ | 16,524 | | | $ | 32,440 | |
See end of tables for footnote.
| American Funds Insurance Series | 297 |
Managed Risk Asset Allocation Fund
| | | Year ended December 31, 2020 | | | Year ended December 31, 2019 | |
| | | | | | | | | Total | | | | | | | | | Total | |
| | | Ordinary | | | Long-term | | | distributions | | | Ordinary | | | Long-term | | | distributions | |
| Share class | | income | | | capital gains | | | paid | | | income | | | capital gains | | | paid | |
| Class P1 | | $ | 58 | | | $ | 146 | | | $ | 204 | | | $ | 5 | | | $ | 65 | | | $ | 70 | |
| Class P2 | | | 40,641 | | | | 105,833 | | | | 146,474 | | | | 62,691 | | | | 115,050 | | | | 177,741 | |
| Total | | $ | 40,699 | | | $ | 105,979 | | | $ | 146,678 | | | $ | 62,696 | | | $ | 115,115 | | | $ | 177,811 | |
| * | Amount less than one thousand. |
7. Fees and transactions
CRMC, the series’ investment adviser, is the parent company of American Funds Distributors®, Inc. (“AFD”), the distributor of the series’ shares, and American Funds Service Company® (“AFS”), the series’ transfer agent. CRMC, AFD and AFS are considered related parties to the series.
Investment advisory services — The series has an investment advisory and service agreement with CRMC that provides for monthly fees accrued daily. These fees are based on annual rates that generally decrease as net asset levels increase. CRMC receives investment advisory fees from the underlying funds held by the managed risk funds. These fees are included in the net effective expense ratios that are provided as additional information in the financial highlights tables. Subadvisory fees for the managed risk funds are paid by CRMC to Milliman FRM. The managed risk funds are not responsible for paying any subadvisory fees.
Investment advisory services waivers — CRMC is waiving a portion of its investment advisory services fees for some of the funds. During the year ended December 31, 2020, CRMC voluntarily waived to proposed rates for Global Growth in advance of the next investment advisory and service agreement that will become effective May 1, 2021. In addition, CRMC waived a portion of its investment advisory services fees at the rate of 0.05% of the daily net assets of each of the managed risk funds. The waiver for each of the managed risk funds will be in effect through at least May 1, 2021, and may only be modified or terminated with the approval of the series’ board.
Effective May 1, 2020, CRMC began to waive a portion of its investment advisory fees at the rates of 0.18%, 0.26%, 0.10% and 0.18% of the daily net assets of New World Fund, Capital Income Builder, Capital World Bond Fund and American Funds Mortgage Fund, respectively. These waivers will be in effect through at least May 1, 2021, and may only be modified or terminated with the approval of the series’ board.
Investment advisory services fees are presented in each fund’s statement of operations gross of the waivers from CRMC. CRMC does not intend to recoup these waivers. For the year ended December 31, 2020, total investment advisory services fees waived by CRMC were $10,896,000.
| 298 | American Funds Insurance Series |
The range of rates, net asset levels and the current annualized rates of average daily net assets for each fund before and after any investment advisory services waivers (if applicable), are as follows:
| | | | | | | | | | | | | | | For the | | | For the | |
| | | | | | | | | Net asset level | | | year ended | | | year ended | |
| | | Rates | | | (in billions) | | | December 31, | | | December 31, | |
| | | Beginning | | | Ending | | | | | | In excess | | | 2020, | | | 2020, | |
| Fund | | with | | | with | | | Up to | | | of | | | before waiver | | | after waiver | |
| Global Growth Fund | | | .690 | % | | | .460 | % | | $ | .6 | | | $ | 5.0 | | | | .511 | % | | | .511 | % |
| Global Small Capitalization Fund | | | .800 | | | | .635 | | | | .6 | | | | 5.0 | | | | .694 | | | | .694 | |
| Growth Fund | | | .500 | | | | .280 | | | | .6 | | | | 34.0 | | | | .316 | | | | .316 | |
| International Fund | | | .690 | | | | .430 | | | | .5 | | | | 21.0 | | | | .494 | | | | .494 | |
| New World Fund | | | .850 | | | | .580 | | | | .5 | | | | 4.0 | | | | .698 | | | | .574 | |
| Blue Chip Income and Growth Fund | | | .500 | | | | .350 | | | | .6 | | | | 10.5 | | | | .390 | | | | .390 | |
| Global Growth and Income Fund | | | .690 | | | | .480 | | | | .6 | | | | 3.0 | | | | .597 | | | | .597 | |
| Growth-Income Fund | | | .500 | | | | .219 | | | | .6 | | | | 34.0 | | | | .255 | | | | .255 | |
| International Growth and Income Fund | | | .690 | | | | .500 | | | | .5 | | | | 1.5 | | | | .613 | | | | .613 | |
| Capital Income Builder | | | .500 | | | | .410 | | | | .6 | | | | 1.0 | | | | .480 | | | | .303 | |
| Asset Allocation Fund | | | .500 | | | | .240 | | | | .6 | | | | 21.0 | | | | .265 | | | | .265 | |
| Global Balanced Fund | | | .660 | | | | .510 | | | | .5 | | | | 1.0 | | | | .660 | | | | .660 | |
| Bond Fund | | | .480 | | | | .320 | | | | .6 | | | | 13.0 | | | | .362 | | | | .362 | |
| Capital World Bond Fund | | | .570 | | | | .450 | | | | 1.0 | | | | 3.0 | | | | .533 | | | | .465 | |
| High-Income Bond Fund | | | .500 | | | | .420 | | | | .6 | | | | 2.0 | | | | .484 | | | | .484 | |
| American Funds Mortgage Fund | | | .420 | | | | .290 | | | | .6 | | | | 3.0 | | | | .420 | | | | .299 | |
| Ultra-Short Bond Fund | | | .320 | | | | .270 | | | | 1.0 | | | | 2.0 | | | | .320 | | | | .320 | |
| U.S. Government/AAA-Rated Securities Fund | | | .420 | | | | .290 | | | | .6 | | | | 3.0 | | | | .349 | | | | .349 | |
| Managed Risk Growth Fund | | | .150 | | | | | | | | all | | | | | | | | .150 | | | | .100 | |
| Managed Risk International Fund | | | .150 | | | | | | | | all | | | | | | | | .150 | | | | .100 | |
| Managed Risk Blue Chip Income and Growth Fund | | | .150 | | | | | | | | all | | | | | | | | .150 | | | | .100 | |
| Managed Risk Growth-Income Fund | | | .150 | | | | | | | | all | | | | | | | | .150 | | | | .100 | |
| Managed Risk Asset Allocation Fund | | | .150 | | | | | | | | all | | | | | | | | .150 | | | | .100 | |
Class-specific fees and expenses —Expenses that are specific to individual share classes are accrued directly to the respective share class. The principal class-specific fees and expenses are further described below:
Distribution services — The series has plans of distribution for all share classes except Class 1. Under the plans, the board of trustees approves certain categories of expenses that are used to finance activities primarily intended to sell fund shares. The plans provide for payments to pay service fees to firms that have entered into agreements with the series. These payments, based on an annualized percentage of average daily net assets, range from 0.18% to 0.50% as noted in the table below. In some cases, the board of trustees has limited the amounts that may be paid to less than the maximum allowed by the plans.
| Share class | | Currently approved limits | | Plan limits |
| Class 1A | | | 0.00 | % | | | 0.25 | % |
| Class 2 | | | 0.25 | | | | 0.25 | |
| Class 3 | | | 0.18 | | | | 0.18 | |
| Class 4 | | | 0.25 | | | | 0.25 | |
| Class P1 | | | 0.00 | | | | 0.25 | |
| Class P2 | | | 0.25 | | | | 0.50 | |
Insurance administrative services — The series has an insurance administrative services plan for Class 1A, 4, P1 and P2 shares. Under the plan, these share classes pay 0.25% of each insurance company’s respective average daily net assets in each share class to compensate the insurance companies for services provided to their separate accounts and contractholders for which the shares of the fund are beneficially owned as underlying investments of such contractholders’ annuities. These services include, but are not limited to, maintenance, shareholder communications and transactional services. The insurance companies are not related parties to the series.
Transfer agent services — The series has a shareholder services agreement with AFS under which the funds compensate AFS for providing transfer agent services to all of the funds’ share classes. These services include recordkeeping, shareholder communications and transaction processing. In addition, the managed risk funds reimburse AFS for amounts paid to third parties for performing transfer agent services on behalf of fund shareholders.
| American Funds Insurance Series | 299 |
Administrative services — The series has an administrative services agreement with CRMC under which each fund compensates CRMC for providing administrative services to all of the funds’ share classes except Class P1 and P2 shares. Administrative services are provided by CRMC and its affiliates to help assist third parties providing non-distribution services to fund shareholders. These services include providing in-depth information on each fund and market developments that impact fund investments. Administrative services also include, but are not limited to, coordinating, monitoring and overseeing third parties that provide services to fund shareholders. The agreement provides each fund, other than the managed risk funds, the ability to charge an administrative services fee at the annual rate of 0.05% of average daily net assets attributable to each share class. Currently each fund, other than the managed-risk funds, pays CRMC an administrative services fee at the annual rate of 0.03% of average daily net assets of each share class for CRMC’s provision of administrative services. For the managed risk funds, CRMC receives administrative services fees at an annual rate of 0.03% of average daily net assets from Class 1 shares of the underlying funds for administrative services provided to the series.
Accounting and administrative services — The managed risk funds have a subadministration agreement with Bank of New York Mellon (“BNY Mellon”) under which the fund compensates BNY Mellon for providing accounting and administrative services to each of the managed risk funds’ share classes. These services include, but are not limited to, fund accounting (including calculation of net asset value), financial reporting and tax services. BNY Mellon is not a related party to the managed risk funds.
Class-specific expenses under the agreements described above were as follows (dollars in thousands):
Global Growth Fund
| | | | | | Insurance | | | | |
| | | Distribution | | | administrative | | | Administrative | |
| Share class | | services | | | services | | | services | |
| Class 1 | | Not applicable | | | Not applicable | | | $ | 791 | |
| Class 1A | | $ | — | | | $ | 19 | | | | 2 | |
| Class 2 | | | 9,578 | | | Not applicable | | | | 1,150 | |
| Class 4 | | | 1,044 | | | | 1,044 | | | | 125 | |
| Total class-specific expenses | | $ | 10,622 | | | $ | 1,063 | | | $ | 2,068 | |
Global Small Capitalization Fund
| | | | | | Insurance | | | | |
| | | Distribution | | | administrative | | | Administrative | |
| Share class | | services | | | services | | | services | |
| Class 1 | | Not applicable | | | Not applicable | | | $ | 594 | |
| Class 1A | | $ | — | | | $ | 2 | | | | — | * |
| Class 2 | | | 5,567 | | | Not applicable | | | | 668 | |
| Class 4 | | | 517 | | | | 516 | | | | 62 | |
| Total class-specific expenses | | $ | 6,084 | | | $ | 518 | | | $ | 1,324 | |
Growth Fund
| | | | | | Insurance | | | | |
| | | Distribution | | | administrative | | | Administrative | |
| Share class | | services | | | services | | | services | |
| Class 1 | | Not applicable | | | Not applicable | | | $ | 3,640 | |
| Class 1A | | $ | — | | | $ | 74 | | | | 9 | |
| Class 2 | | | 42,263 | | | Not applicable | | | | 5,071 | |
| Class 3 | | | 414 | | | Not applicable | | | | 69 | |
| Class 4 | | | 4,410 | | | | 4,410 | | | | 529 | |
| Total class-specific expenses | | $ | 47,087 | | | $ | 4,484 | | | $ | 9,318 | |
International Fund
| | | | | | Insurance | | | | |
| | | Distribution | | | administrative | | | Administrative | |
| Share class | | services | | | services | | | services | |
| Class 1 | | Not applicable | | | Not applicable | | | $ | 1,462 | |
| Class 1A | | $ | — | | | $ | 19 | | | | 2 | |
| Class 2 | | | 9,793 | | | Not applicable | | | | 1,175 | |
| Class 3 | | | 39 | | | Not applicable | | | | 7 | |
| Class 4 | | | 886 | | | | 886 | | | | 106 | |
| Total class-specific expenses | | $ | 10,718 | | | $ | 905 | | | $ | 2,752 | |
New World Fund
| | | | | | Insurance | | | | |
| | | Distribution | | | administrative | | | Administrative | |
| Share class | | services | | | services | | | services | |
| Class 1 | | Not applicable | | | Not applicable | | | $ | 588 | |
| Class 1A | | $ | — | | | $ | 20 | | | | 2 | |
| Class 2 | | | 2,298 | | | Not applicable | | | | 276 | |
| Class 4 | | | 1,633 | | | | 1,633 | | | | 196 | |
| Total class-specific expenses | | $ | 3,931 | | | $ | 1,653 | | | $ | 1,062 | |
Blue Chip Income and Growth Fund
| | | | | | Insurance | | | | |
| | | Distribution | | | administrative | | | Administrative | |
| Share class | | services | | | services | | | services | |
| Class 1 | | Not applicable | | | Not applicable | | | $ | 1,537 | |
| Class 1A | | $ | — | | | $ | 34 | | | | 4 | |
| Class 2 | | | 7,027 | | | Not applicable | | | | 843 | |
| Class 4 | | | 1,627 | | | | 1,626 | | | | 195 | |
| Total class-specific expenses | | $ | 8,654 | | | $ | 1,660 | | | $ | 2,579 | |
See end of tables for footnote.
| 300 | American Funds Insurance Series |
Global Growth and Income Fund
| | | | | | Insurance | | | | |
| | | Distribution | | | administrative | | | Administrative | |
| Share class | | services | | | services | | | services | |
| Class 1 | | Not applicable | | | Not applicable | | | $ | 180 | |
| Class 1A | | $ | — | | | $ | 5 | | | | — | * |
| Class 2 | | | 3,032 | | | Not applicable | | | | 364 | |
| Class 4 | | | 343 | | | | 343 | | | | 41 | |
| Total class-specific expenses | | $ | 3,375 | | | $ | 348 | | | $ | 585 | |
Growth-Income Fund
| | | | | | Insurance | | | | |
| | | Distribution | | | administrative | | | Administrative | |
| Share class | | services | | | services | | | services | |
| Class 1 | | Not applicable | | | Not applicable | | | $ | 6,099 | |
| Class 1A | | $ | — | | | $ | 29 | | | | 4 | |
| Class 2 | | | 31,824 | | | Not applicable | | | | 3,819 | |
| Class 3 | | | 260 | | | Not applicable | | | | 43 | |
| Class 4 | | | 3,025 | | | | 3,025 | | | | 363 | |
| Total class-specific expenses | | $ | 35,109 | | | $ | 3,054 | | | $ | 10,328 | |
International Growth and Income Fund
| | | | | | Insurance | | | | |
| | | Distribution | | | administrative | | | Administrative | |
| Share class | | services | | | services | | | services | |
| Class 1 | | Not applicable | | | Not applicable | | | $ | 310 | |
| Class 1A | | $ | — | | | $ | 6 | | | | 1 | |
| Class 2 | | | 494 | | | Not applicable | | | | 59 | |
| Class 4 | | | 233 | | | | 233 | | | | 28 | |
| Total class-specific expenses | | $ | 727 | | | $ | 239 | | | $ | 398 | |
Capital Income Builder
| | | | | | Insurance | | | | |
| | | Distribution | | | administrative | | | Administrative | |
| Share class | | services | | | services | | | services | |
| Class 1 | | Not applicable | | | Not applicable | | | $ | 163 | |
| Class 1A | | $ | — | | | $ | 14 | | | | 1 | |
| Class 2 | | | 15 | | | Not applicable | | | | 2 | |
| Class 4 | | | 1,069 | | | | 1,069 | | | | 128 | |
| Total class-specific expenses | | $ | 1,084 | | | $ | 1,083 | | | $ | 294 | |
Asset Allocation Fund
| | | | | | Insurance | | | | |
| | | Distribution | | | administrative | | | Administrative | |
| Share class | | services | | | services | | | services | |
| Class 1 | | Not applicable | | | Not applicable | | | $ | 5,209 | |
| Class 1A | | $ | — | | | $ | 29 | | | | 4 | |
| Class 2 | | | 12,220 | | | Not applicable | | | | 1,466 | |
| Class 3 | | | 56 | | | Not applicable | | | | 9 | |
| Class 4 | | | 11,373 | | | | 11,373 | | | | 1,365 | |
| Total class-specific expenses | | $ | 23,649 | | | $ | 11,402 | | | $ | 8,053 | |
Global Balanced Fund
| | | | | | Insurance | | | | |
| | | Distribution | | | administrative | | | Administrative | |
| Share class | | services | | | services | | | services | |
| Class 1 | | Not applicable | | | Not applicable | | | $ | 39 | |
| Class 1A | | $ | — | | | $ | 5 | | | | 1 | |
| Class 2 | | | 487 | | | Not applicable | | | | 58 | |
| Class 4 | | | 234 | | | | 234 | | | | 28 | |
| Total class-specific expenses | | $ | 721 | | | $ | 239 | | | $ | 126 | |
Bond Fund
| | | | | | Insurance | | | | |
| | | Distribution | | | administrative | | | Administrative | |
| Share class | | services | | | services | | | services | |
| Class 1 | | Not applicable | | | Not applicable | | | $ | 1,950 | |
| Class 1A | | $ | — | | | $ | 20 | | | | 2 | |
| Class 2 | | | 9,104 | | | Not applicable | | | | 1,093 | |
| Class 4 | | | 1,484 | | | | 1,484 | | | | 178 | |
| Total class-specific expenses | | $ | 10,588 | | | $ | 1,504 | | | $ | 3,223 | |
Capital World Bond Fund
| | | | | | Insurance | | | | |
| | | Distribution | | | administrative | | | Administrative | |
| Share class | | services | | | services | | | services | |
| Class 1 | | Not applicable | | | Not applicable | | | $ | 329 | |
| Class 1A | | $ | — | | | $ | 1 | | | | — | * |
| Class 2 | | | 2,480 | | | Not applicable | | | | 298 | |
| Class 4 | | | 129 | | | | 130 | | | | 15 | |
| Total class-specific expenses | | $ | 2,609 | | | $ | 131 | | | $ | 642 | |
See end of tables for footnote.
| American Funds Insurance Series | 301 |
High-Income Bond Fund
| | | | | | Insurance | | | | |
| | | Distribution | | | administrative | | | Administrative | |
| Share class | | services | | | services | | | services | |
| Class 1 | | Not applicable | | | Not applicable | | | $ | 73 | |
| Class 1A | | $ | — | | | $ | 2 | | | | — | * |
| Class 2 | | | 1,571 | | | Not applicable | | | | 188 | |
| Class 3 | | | 17 | | | Not applicable | | | | 3 | |
| Class 4 | | | 138 | | | | 138 | | | | 17 | |
| Total class-specific expenses | | $ | 1,726 | | | $ | 140 | | | $ | 281 | |
American Funds Mortgage Fund
| | | | | | Insurance | | | | |
| | | Distribution | | | administrative | | | Administrative | |
| Share class | | services | | | services | | | services | |
| Class 1 | | Not applicable | | | Not applicable | | | $ | 61 | |
| Class 1A | | $ | — | | | $ | 2 | | | | — | * |
| Class 2 | | | 142 | | | Not applicable | | | | 17 | |
| Class 4 | | | 88 | | | | 88 | | | | 11 | |
| Total class-specific expenses | | $ | 230 | | | $ | 90 | | | $ | 89 | |
Ultra-Short Bond Fund
| | | | | | Insurance | | | | |
| | | Distribution | | | administrative | | | Administrative | |
| Share class | | services | | | services | | | services | |
| Class 1 | | Not applicable | | | Not applicable | | | $ | 12 | |
| Class 1A | | $ | — | | | $ | — | * | | | — | * |
| Class 2 | | | 662 | | | Not applicable | | | | 80 | |
| Class 3 | | | 7 | | | Not applicable | | | | 1 | |
| Class 4 | | | 85 | | | | 85 | | | | 10 | |
| Total class-specific expenses | | $ | 754 | | | $ | 85 | | | $ | 103 | |
U.S. Government/AAA-Rated Securities Fund
| | | | | | Insurance | | | | |
| | | Distribution | | | administrative | | | Administrative | |
| Share class | | services | | | services | | | services | |
| Class 1 | | Not applicable | | | Not applicable | | | $ | 223 | |
| Class 1A | | $ | — | | | $ | 9 | | | | 1 | |
| Class 2 | | | 3,460 | | | Not applicable | | | | 415 | |
| Class 3 | | | 18 | | | Not applicable | | | | 3 | |
| Class 4 | | | 578 | | | | 578 | | | | 70 | |
| Total class-specific expenses | | $ | 4,056 | | | $ | 587 | | | $ | 712 | |
Managed Risk Growth Fund
| | | | | | Insurance | | | | | |
| | | Distribution | | | administrative | | | | | |
| Share class | | services | | | services | | | | | |
| Class P1 | | Not applicable | | | $ | 21 | | | | | |
| Class P2 | | $ | 1,177 | | | | 1,177 | | | | | |
| Total class-specific expenses | | $ | 1,177 | | | $ | 1,198 | | | | | |
Managed Risk International Fund
| | | | | | Insurance | | | | | |
| | | Distribution | | | administrative | | | | | |
| Share class | | services | | | services | | | | | |
| Class P1 | | Not applicable | | | $ | 3 | | | | | |
| Class P2 | | $ | 389 | | | | 389 | | | | | |
| Total class-specific expenses | | $ | 389 | | | $ | 392 | | | | | |
Managed Risk Blue Chip Income and Growth Fund
| | | | | | Insurance | | | | | |
| | | Distribution | | | administrative | | | | | |
| Share class | | services | | | services | | | | | |
| Class P1 | | Not applicable | | | $ | 3 | | | | | |
| Class P2 | | $ | 861 | | | | 861 | | | | | |
| Total class-specific expenses | | $ | 861 | | | $ | 864 | | | | | |
Managed Risk Growth-Income Fund
| | | | | | Insurance | | | | | |
| | | Distribution | | | administrative | | | | | |
| Share class | | services | | | services | | | | | |
| Class P1 | | Not applicable | | | $ | 4,911 | | | | | |
| Class P2 | | $ | 718 | | | | 719 | | | | | |
| Total class-specific expenses | | $ | 718 | | | $ | 5,630 | | | | | |
Managed Risk Asset Allocation Fund
| | | | | | Insurance | | | | | |
| | | Distribution | | | administrative | | | | | |
| Share class | | services | | | services | | | | | |
| Class P1 | | Not applicable | | | $ | 9 | | | | | |
| Class P2 | | $ | 6,703 | | | | 6,703 | | | | | |
| Total class-specific expenses | | $ | 6,703 | | | $ | 6,712 | | | | | |
| * | Amount less than one thousand. |
| 302 | American Funds Insurance Series |
Miscellaneous fee reimbursements — CRMC has agreed to reimburse a portion of miscellaneous fees and expenses for Managed Risk International Fund. Miscellaneous expenses exclude investment advisory services fees and distribution services fees. This reimbursement may be adjusted or discontinued by CRMC, subject to any restrictions in the series’ prospectus. For the year ended December 31, 2020, total fees and expenses reimbursed by CRMC were $41,000. CRMC does not intend to recoup this reimbursement. Fees and expenses in the fund’s statement of operations are presented gross of any reimbursements from CRMC.
Trustees’ deferred compensation — Trustees who are unaffiliated with CRMC may elect to defer the cash payment of part or all of their compensation. These deferred amounts, which remain as liabilities of the funds, are treated as if invested in one or more of the American Funds. These amounts represent general, unsecured liabilities of the funds and vary according to the total returns of the selected funds. Trustees’ compensation, shown on the accompanying financial statements, reflects current fees (either paid in cash or deferred) and a net decrease in the value of the deferred amounts as follows (dollars in thousands):
| Fund | Current fees | | Increase in value of
deferred amounts | | Total trustees’
compensation | |
| Global Growth Fund | | $ | 22 | | | $ | 14 | | | $ | 36 | |
| Global Small Capitalization Fund | | | 14 | | | | 9 | | | | 23 | |
| Growth Fund | | | 96 | | | | 66 | | | | 162 | |
| International Fund | | | 30 | | | | 17 | | | | 47 | |
| New World Fund | | | 11 | | | | 7 | | | | 18 | |
| Blue Chip Income and Growth Fund | | | 27 | | | | 17 | | | | 44 | |
| Global Growth and Income Fund | | | 6 | | | | 4 | | | | 10 | |
| Growth-Income Fund | | | 111 | | | | 66 | | | | 177 | |
| International Growth and Income Fund | | | 4 | | | | 3 | | | | 7 | |
| Capital Income Builder | | | 3 | | | | 2 | | | | 5 | |
| Asset Allocation Fund | | | 86 | | | | 49 | | | | 135 | |
| Global Balanced Fund | | | 1 | | | | 1 | | | | 2 | |
| Bond Fund | | | 34 | | | | 17 | | | | 51 | |
| Capital World Bond Fund | | | 7 | | | | 4 | | | | 11 | |
| High-Income Bond Fund | | | 3 | | | | 1 | | | | 4 | |
| American Funds Mortgage Fund | | | 1 | | | | — | * | | | 1 | |
| Ultra-Short Bond Fund | | | 1 | | | | 1 | | | | 2 | |
| U.S. Government/AAA-Rated Securities Fund | | | 8 | | | | 1 | | | | 9 | |
| Managed Risk Growth Fund | | | 2 | | | | 1 | | | | 3 | |
| Managed Risk International Fund | | | 1 | | | | — | * | | | 1 | |
| Managed Risk Blue Chip Income and Growth Fund | | | 1 | | | | 1 | | | | 2 | |
| Managed Risk Growth-Income Fund | | | 7 | | | | 4 | | | | 11 | |
| Managed Risk Asset Allocation Fund | | | 8 | | | | 5 | | | | 13 | |
| * | Amount less than one thousand. |
Affiliated officers and trustees — Officers and certain trustees of the series are or may be considered to be affiliated with CRMC, AFD and AFS. No affiliated officers or trustees received any compensation directly from any fund in the series.
Investment in CCF — Some of the funds hold shares of CCF, an institutional prime money market fund managed by CRMC. CCF invests in high-quality, short-term money market instruments. CCF is used as the primary investment vehicle for each fund’s short-term investments. CCF shares are only available for purchase by CRMC, its affiliates, and other funds managed by CRMC. CCF shares are not available to the public. CRMC does not receive an investment advisory services fee from CCF.
Security transactions with related funds — The funds may purchase from, or sell securities to, other CRMC-managed funds (or funds managed by certain affiliates of CRMC) under procedures adopted by the fund’s board of trustees. The funds involved in such transactions are considered related by virtue of having a common investment adviser (or affiliated investment advisers), common trustees and/or common officers. When such transactions occur, each transaction is executed at the current market price of the security and no brokerage commissions or fees are paid in accordance with Rule 17a-7 of the 1940 Act.
| American Funds Insurance Series | 303 |
The following table presents purchase and sale transactions between each fund and related funds, and net realized gain or loss from such sales, if any, as of December 31, 2020 (dollars in thousands):
| Fund | | Purchases | | | Sales | | | Net
realized
gain (loss) | |
| Global Growth Fund | | $ | 139,989 | | | $ | 85,866 | | | $ | 21,004 | |
| Global Small Capitalization Fund | | | 56,497 | | | | 146,865 | | | | 24,912 | |
| Growth Fund | | | 569,889 | | | | 816,449 | | | | 267,011 | |
| International Fund | | | 118,996 | | | | 128,534 | | | | 14,532 | |
| New World Fund | | | 53,097 | | | | 61,321 | | | | 2,932 | |
| Blue Chip Income and Growth Fund | | | 150,238 | | | | 75,751 | | | | 590 | |
| Global Growth and Income Fund | | | 24,156 | | | | 52,461 | | | | (6,576 | ) |
| Growth-Income Fund | | | 471,004 | | | | 714,281 | | | | 60,282 | |
| International Growth and Income Fund | | | 16,646 | | | | 26,076 | | | | 874 | |
| Capital Income Builder | | | 82,136 | | | | 47,478 | | | | (9,672 | ) |
| Asset Allocation Fund | | | 262,721 | | | | 379,296 | | | | 62,547 | |
| Bond Fund | | | 88,459 | | | | 33,704 | | | | 2,473 | |
| Capital World Bond Fund | | | 11,945 | | | | 12,762 | | | | (51 | ) |
| High-Income Bond Fund | | | 6,251 | | | | 371,551 | | | | (18,424 | ) |
| U.S. Government/AAA-Rated Securities Fund | | | — | | | | 444,556 | | | | 22,675 | |
8. Committed line of credit
Global Small Capitalization Fund, New World Fund and High-Income Bond Fund participate with other funds managed by CRMC in a $1.5 billion credit facility (the “line of credit”) to be utilized for temporary purposes to fund shareholder redemptions. Each fund has agreed to pay commitment fees on its pro-rata portion of the line of credit, which are reflected in other expenses in each fund’s statement of operations. None of the funds borrowed on this line of credit at any time during the year ended December 31, 2020.
9. Capital share transactions
Capital share transactions in the funds were as follows (dollars and shares in thousands):
Global Growth Fund
| | | Sales* | | | Reinvestments of
distributions | | | Repurchases* | | | Net increase
(decrease) | |
| Share class | | Amount | | | Shares | | | Amount | | | Shares | | | Amount | | | Shares | | | Amount | | | Shares | |
| | | | | | | | | | | | | | | | | | | | | | | | | |
| Year ended December 31, 2020 | | | | | | | | | | | | | | | | | | | |
| | | | | | | | | | | | | | | | | | | | | | | | | |
| Class 1 | | $ | 402,110 | | | | 11,550 | | | $ | 89,416 | | | | 2,661 | | | $ | (365,952 | ) | | | (11,056 | ) | | $ | 125,574 | | | | 3,155 | |
| Class 1A | | | 4,330 | | | | 121 | | | | 234 | | | | 7 | | | | (2,564 | ) | | | (87 | ) | | | 2,000 | | | | 41 | |
| Class 2 | | | 46,502 | | | | 1,410 | | | | 122,749 | | | | 3,738 | | | | (613,644 | ) | | | (18,242 | ) | | | (444,393 | ) | | | (13,094 | ) |
| Class 4 | | | 96,748 | | | | 2,812 | | | | 12,190 | | | | 377 | | | | (63,324 | ) | | | (1,924 | ) | | | 45,614 | | | | 1,265 | |
| Total net increase (decrease) | | $ | 549,690 | | | | 15,893 | | | $ | 224,589 | | | | 6,783 | | | $ | (1,045,484 | ) | | | (31,309 | ) | | $ | (271,205 | ) | | | (8,633 | ) |
| | | | | | | | | | | | | | | | | | | | | | | | | | | | | | | | | |
| Year ended December 31, 2019 | | | | | | | | | | | | | | | | | | | | | | | | | |
| | | | | | | | | | | | | | | | | | | | | | | | | | |
| Class 1 | | $ | 230,089 | | | | 7,777 | | | $ | 152,273 | | | | 5,192 | | | $ | (333,318 | ) | | | (11,180 | ) | | $ | 49,044 | | | | 1,789 | |
| Class 1A | | | 1,744 | | | | 62 | | | | 449 | | | | 15 | | | | (572 | ) | | | (19 | ) | | | 1,621 | | | | 58 | |
| Class 2 | | | 44,842 | | | | 1,552 | | | | 244,600 | | | | 8,453 | | | | (555,704 | ) | | | (18,803 | ) | | | (266,262 | ) | | | (8,798 | ) |
| Class 4 | | | 70,615 | | | | 2,415 | | | | 20,612 | | | | 716 | | | | (29,399 | ) | | | (1,009 | ) | | | 61,828 | | | | 2,122 | |
| Total net increase (decrease) | | $ | 347,290 | | | | 11,806 | | | $ | 417,934 | | | | 14,376 | | | $ | (918,993 | ) | | | (31,011 | ) | | $ | (153,769 | ) | | | (4,829 | ) |
See end of tables for footnotes.
| 304 | American Funds Insurance Series |
| Global Small Capitalization Fund | | | | | | | | | | | | | | | | |
| | | | | | | | | | | | | | | | | |
| | | Sales* | | | Reinvestments
of distributions | | | Repurchases* | | | Net (decrease)
increase | |
| Share class | | Amount | | | Shares | | | Amount | | | Shares | | | Amount | | | Shares | | | Amount | | | Shares | |
| | | | | | | | | | | | | | | | | | | | | | | | | |
| Year ended December 31, 2020 | | | | | | | | | | | | | | | | |
| | | | | | | | | | | | | | | | | |
| Class 1 | | $ | 223,000 | | | | 10,191 | | | $ | 125,091 | | | | 5,146 | | | $ | (466,963 | ) | | | (18,580 | ) | | $ | (118,872 | ) | | | (3,243 | ) |
| Class 1A | | | 627 | | | | 24 | | | | 43 | | | | 2 | | | | (268 | ) | | | (10 | ) | | | 402 | | | | 16 | |
| Class 2 | | | 60,922 | | | | 2,877 | | | | 145,869 | | | | 6,194 | | | | (409,129 | ) | | | (15,839 | ) | | | (202,338 | ) | | | (6,768 | ) |
| Class 4 | | | 35,430 | | | | 1,424 | | | | 13,089 | | | | 554 | | | | (34,957 | ) | | | (1,396 | ) | | | 13,562 | | | | 582 | |
| Total net increase (decrease) | | $ | 319,979 | | | | 14,516 | | | $ | 284,092 | | | | 11,896 | | | $ | (911,317 | ) | | | (35,825 | ) | | $ | (307,246 | ) | | | (9,413 | ) |
| | | | | | | | | | | | | | | | | | | | | | | | | | | | | | | | | |
| Year ended December 31, 2019 | | | | | | | | | | | | | | | | | | | | | | | | |
| | | | | | | | | | | | | | | | | | | | | | | | | |
| Class 1 | | $ | 337,817 | | | | 13,612 | | | $ | 125,498 | | | | 5,216 | | | $ | (226,381 | ) | | | (9,119 | ) | | $ | 236,934 | | | | 9,709 | |
| Class 1A | | | 196 | | | | 8 | | | | 28 | | | | 2 | | | | (96 | ) | | | (4 | ) | | | 128 | | | | 6 | |
| Class 2 | | | 21,553 | | | | 917 | | | | 147,687 | | | | 6,340 | | | | (327,909 | ) | | | (13,596 | ) | | | (158,669 | ) | | | (6,339 | ) |
| Class 4 | | | 35,449 | | | | 1,468 | | | | 11,115 | | | | 475 | | | | (22,005 | ) | | | (911 | ) | | | 24,559 | | | | 1,032 | |
| Total net increase (decrease) | | $ | 395,015 | | | | 16,005 | | | $ | 284,328 | | | | 12,033 | | | $ | (576,391 | ) | | | (23,630 | ) | | $ | 102,952 | | | | 4,408 | |
| | | | | | | | | | | | | | | | | | | | | | | | | | | | | | | | | |
| Growth Fund | | | | | | | | | | | | | | | | | | | | | | | | | | | | | | | | |
| | | | | | | | | | | | | | | | | | | | | | | | | | | | | | | | | |
| | | Sales* | | | Reinvestments
of distributions | | | Repurchases* | | | Net (decrease)
increase | |
| Share class | | Amount | | | Shares | | | Amount | | | Shares | | | Amount | | | Shares | | | Amount | | | Shares | |
| | | | | | | | | | | | | | | | | | | | | | | | | | | | | | | | | |
| Year ended December 31, 2020 | | | | | | | | | | | | | | | | | | | | | | | | |
| | | | | | | | | | | | | | | | | | | | | | | | | |
| Class 1 | | $ | 2,322,779 | | | | 26,334 | | | $ | 353,232 | | | | 3,917 | | | $ | (2,999,100 | ) | | | (33,591 | ) | | $ | (323,089 | ) | | | (3,340 | ) |
| Class 1A | | | 33,301 | | | | 338 | | | | 688 | | | | 8 | | | | (5,835 | ) | | | (64 | ) | | | 28,154 | | | | 282 | |
| Class 2 | | | 437,349 | | | | 4,937 | | | | 458,379 | | | | 5,218 | | | | (3,162,923 | ) | | | (34,505 | ) | | | (2,267,195 | ) | | | (24,350 | ) |
| Class 3 | | | 1,333 | | | | 17 | | | | 6,293 | | | | 70 | | | | (37,446 | ) | | | (395 | ) | | | (29,820 | ) | | | (308 | ) |
| Class 4 | | | 325,002 | | | | 3,612 | | | | 45,870 | | | | 534 | | | | (283,912 | ) | | | (3,180 | ) | | | 86,960 | | | | 966 | |
| Total net increase (decrease) | | $ | 3,119,764 | | | | 35,238 | | | $ | 864,462 | | | | 9,747 | | | $ | (6,489,216 | ) | | | (71,735 | ) | | $ | (2,504,990 | ) | | | (26,750 | ) |
| | | | | | | | | | | | | | | | | | | | | | | | | | | | | | | | | |
| Year ended December 31, 2019 | | | | | | | | | | | | | | | | | | | | | | | | |
| | | | | | | | | | | | | | | | | | | | | | | | | |
| Class 1 | | $ | 896,700 | | | | 11,839 | | | $ | 1,112,851 | | | | 15,532 | | | $ | (1,155,174 | ) | | | (15,026 | ) | | $ | 854,377 | | | | 12,345 | |
| Class 1A | | | 6,106 | | | | 81 | | | | 1,482 | | | | 21 | | | | (1,574 | ) | | | (20 | ) | | | 6,014 | | | | 82 | |
| Class 2 | | | 294,401 | | | | 3,907 | | | | 1,692,272 | | | | 23,866 | | | | (2,108,133 | ) | | | (27,828 | ) | | | (121,460 | ) | | | (55 | ) |
| Class 3 | | | 1,763 | | | | 23 | | | | 23,154 | | | | 321 | | | | (29,706 | ) | | | (390 | ) | | | (4,789 | ) | | | (46 | ) |
| Class 4 | | | 227,023 | | | | 3,055 | | | | 145,699 | | | | 2,087 | | | | (131,942 | ) | | | (1,767 | ) | | | 240,780 | | | | 3,375 | |
| Total net increase (decrease) | | $ | 1,425,993 | | | | 18,905 | | | $ | 2,975,458 | | | | 41,827 | | | $ | (3,426,529 | ) | | | (45,031 | ) | | $ | 974,922 | | | | 15,701 | |
See end of tables for footnotes.
| American Funds Insurance Series | 305 |
| International Fund | | | | | | | | | | | | | | | | |
| | | | | | | | | | | | | | | | | | | | | | | | | |
| | | Sales* | | | Reinvestments of
distributions | | | Repurchases* | | | Net (decrease)
increase | |
| Share class | | Amount | | | Shares | | | Amount | | | Shares | | | Amount | | | Shares | | | Amount | | | Shares | |
| | | | | | | | | | | | | | | | | | | | | | | | | |
| Year ended December 31, 2020 | | | | | | | | | | | | | | | | |
| | | | | | | | | | | | | | | | | | | | | | | | | | | | | | | | | |
| Class 1 | | $ | 535,603 | | | | 30,721 | | | $ | 44,223 | | | | 2,049 | | | $ | (963,355 | ) | | | (50,229 | ) | | $ | (383,529 | ) | | | (17,459 | ) |
| Class 1A | | | 2,754 | | | | 147 | | | | 56 | | | | 2 | | | | (1,389 | ) | | | (70 | ) | | | 1,421 | | | | 79 | |
| Class 2 | | | 271,356 | | | | 15,425 | | | | 25,688 | | | | 1,204 | | | | (667,572 | ) | | | (33,696 | ) | | | (370,528 | ) | | | (17,067 | ) |
| Class 3 | | | 226 | | | | 12 | | | | 157 | | | | 7 | | | | (3,148 | ) | | | (157 | ) | | | (2,765 | ) | | | (138 | ) |
| Class 4 | | | 52,233 | | | | 2,881 | | | | 1,591 | | | | 76 | | | | (62,187 | ) | | | (3,226 | ) | | | (8,363 | ) | | | (269 | ) |
| Total net increase (decrease) | | $ | 862,172 | | | | 49,186 | | | $ | 71,715 | | | | 3,338 | | | $ | (1,697,651 | ) | | | (87,378 | ) | | $ | (763,764 | ) | | | (34,854 | ) |
| | | | | | | | | | | | | | | | | | | | | | | | | | | | | | | | | |
| Year ended December 31, 2019 | | | | | | | | | | | | | | | | | | | | | | | | |
| | | | | | | | | | | | | | | | | | | | | | | | | | | | | | | | | |
| Class 1 | | $ | 171,233 | | | | 8,812 | | | $ | 215,640 | | | | 10,988 | | | $ | (699,395 | ) | | | (35,642 | ) | | $ | (312,522 | ) | | | (15,842 | ) |
| Class 1A | | | 2,060 | | | | 106 | | | | 236 | | | | 12 | | | | (1,174 | ) | | | (59 | ) | | | 1,122 | | | | 59 | |
| Class 2 | | | 175,514 | | | | 9,064 | | | | 164,024 | | | | 8,407 | | | | (591,706 | ) | | | (30,261 | ) | | | (252,168 | ) | | | (12,790 | ) |
| Class 3 | | | 238 | | | | 13 | | | | 991 | | | | 50 | | | | (4,348 | ) | | | (224 | ) | | | (3,119 | ) | | | (161 | ) |
| Class 4 | | | 60,129 | | | | 3,112 | | | | 13,366 | | | | 694 | | | | (43,609 | ) | | | (2,263 | ) | | | 29,886 | | | | 1,543 | |
| Total net increase (decrease) | | $ | 409,174 | | | | 21,107 | | | $ | 394,257 | | | | 20,151 | | | $ | (1,340,232 | ) | | | (68,449 | ) | | $ | (536,801 | ) | | | (27,191 | ) |
| | | | | | | | | | | | | | | | | | | | | | | | | | | | | | | | | |
| New World Fund | | | | | | | | | | | | | | | | | | | | | | | | |
| | | | | | | | | | | | | | | | | | | | | | | | | | | | | | | | | |
| | | Sales* | | | Reinvestments of
distributions | | | Repurchases* | | | Net (decrease)
increase | |
| Share class | | Amount | | | Shares | | | Amount | | | Shares | | | Amount | | | Shares | | | Amount | | | Shares | |
| | | | | | | | | | | | | | | | | | | | | | | | | | | | | | | | | |
| Year ended December 31, 2020 | | | | | | | | | | | | | | | | | | | | | | | | |
| | | | | | | | | | | | | | | | | | | | | | | | | | | | | | | | | |
| Class 1 | | $ | 80,299 | | | | 3,402 | | | $ | 25,570 | | | | 1,027 | | | $ | (337,036 | ) | | | (13,731 | ) | | $ | (231,167 | ) | | | (9,302 | ) |
| Class 1A | | | 12,129 | | | | 461 | | | | 73 | | | | 3 | | | | (1,703 | ) | | | (71 | ) | | | 10,499 | | | | 393 | |
| Class 2 | | | 102,697 | | | | 3,915 | | | | 10,803 | | | | 447 | | | | (184,643 | ) | | | (7,218 | ) | | | (71,143 | ) | | | (2,856 | ) |
| Class 4 | | | 89,140 | | | | 3,662 | | | | 7,473 | | | | 310 | | | | (84,462 | ) | | | (3,316 | ) | | | 12,151 | | | | 656 | |
| Total net increase (decrease) | | $ | 284,265 | | | | 11,440 | | | $ | 43,919 | | | | 1,787 | | | $ | (607,844 | ) | | | (24,336 | ) | | $ | (279,660 | ) | | | (11,109 | ) |
| | | | | | | | | | | | | | | | | | | | | | | | | | | | | | | | | |
| Year ended December 31, 2019 | | | | | | | | | | | | | | | | | | | | | | | | |
| | | | | | | | | | | | | | | | | | | | | | | | | | | | | | | | | |
| Class 1 | | $ | 149,338 | | | | 6,057 | | | $ | 94,601 | | | | 3,981 | | | $ | (207,841 | ) | | | (8,743 | ) | | $ | 36,098 | | | | 1,295 | |
| Class 1A | | | 1,685 | | | | 70 | | | | 171 | | | | 7 | | | | (408 | ) | | | (17 | ) | | | 1,448 | | | | 60 | |
| Class 2 | | | 68,793 | | | | 2,911 | | | | 43,651 | | | | 1,861 | | | | (165,106 | ) | | | (6,991 | ) | | | (52,662 | ) | | | (2,219 | ) |
| Class 4 | | | 83,946 | | | | 3,576 | | | | 25,555 | | | | 1,096 | | | | (39,744 | ) | | | (1,687 | ) | | | 69,757 | | | | 2,985 | |
| Total net increase (decrease) | | $ | 303,762 | | | | 12,614 | | | $ | 163,978 | | | | 6,945 | | | $ | (413,099 | ) | | | (17,438 | ) | | $ | 54,641 | | | | 2,121 | |
See end of tables for footnotes.
| 306 | American Funds Insurance Series |
| Blue Chip Income and Growth Fund | | | | | | | | | | | | | | | | |
| | | | | | | | | | | | | | | | | |
| | | Sales* | | | Reinvestments of
distributions | | | Repurchases* | | | Net (decrease)
increase | |
| Share class | | Amount | | | Shares | | | Amount | | | Shares | | | Amount | | | Shares | | | Amount | | | Shares | |
| | | | | | | | | | | | | | | | | | | | | | | | | |
| Year ended December 31, 2020 | | | | | | | | | | | | | | | | |
| | | | | | | | | | | | | | | | | |
| Class 1 | | $ | 474,186 | | | | 41,847 | | | $ | 161,061 | | | | 11,902 | | | $ | (825,919 | ) | | | (67,505 | ) | | $ | (190,672 | ) | | | (13,756 | ) |
| Class 1A | | | 15,517 | | | | 1,215 | | | | 484 | | | | 35 | | | | (2,556 | ) | | | (194 | ) | | | 13,445 | | | | 1,056 | |
| Class 2 | | | 75,893 | | | | 6,771 | | | | 83,599 | | | | 6,287 | | | | (337,510 | ) | | | (26,379 | ) | | | (178,018 | ) | | | (13,321 | ) |
| Class 4 | | | 148,645 | | | | 12,358 | | | | 18,858 | | | | 1,428 | | | | (54,754 | ) | | | (4,444 | ) | | | 112,749 | | | | 9,342 | |
| Total net increase (decrease) | | $ | 714,241 | | | | 62,191 | | | $ | 264,002 | | | | 19,652 | | | $ | (1,220,739 | ) | | | (98,522 | ) | | $ | (242,496 | ) | | | (16,679 | ) |
| | | | | | | | | | | | | | | | | | | | | | | | | | | | | | | | | |
| Year ended December 31, 2019 | | | | | | | | | | | | | | | | | | | | | | | | |
| | | | | | | | | | | | | | | | | | | | | | | | | |
| Class 1 | | $ | 213,624 | | | | 16,737 | | | $ | 525,212 | | | | 41,913 | | | $ | (484,978 | ) | | | (37,271 | ) | | $ | 253,858 | | | | 21,379 | |
| Class 1A | | | 5,177 | | | | 403 | | | | 598 | | | | 47 | | | | (451 | ) | | | (35 | ) | | | 5,324 | | | | 415 | |
| Class 2 | | | 28,815 | | | | 2,244 | | | | 298,911 | | | | 24,211 | | | | (366,595 | ) | | | (28,328 | ) | | | (38,869 | ) | | | (1,873 | ) |
| Class 4 | | | 198,327 | | | | 15,485 | | | | 49,345 | | | | 4,013 | | | | (38,161 | ) | | | (2,979 | ) | | | 209,511 | | | | 16,519 | |
| Total net increase (decrease) | | $ | 445,943 | | | | 34,869 | | | $ | 874,066 | | | | 70,184 | | | $ | (890,185 | ) | | | (68,613 | ) | | $ | 429,824 | | | | 36,440 | |
| | | | | | | | | | | | | | | | | | | | | | | | | | | | | | | | | |
| Global Growth and Income Fund | | | | | | | | | | | | | | | | | | | | | | | | |
| | | | | | | | | | | | | | | | | | | | | | | | | |
| | | Sales* | | | Reinvestments of
distributions | | | Repurchases* | | | Net (decrease)
increase | |
| Share class | | Amount | | | Shares | | | Amount | | | Shares | | | Amount | | | Shares | | | Amount | | | Shares | |
| | | | | | | | | | | | | | | | | | | | | | | | | | | | | | | | | |
| Year ended December 31, 2020 | | | | | | | | | | | | | | | | | | | | | | | | |
| | | | | | | | | | | | | | | | | | | | | | | | | |
| Class 1 | | $ | 274,643 | | | | 21,210 | | | $ | 23,674 | | | | 1,607 | | | $ | (306,092 | ) | | | (22,650 | ) | | $ | (7,775 | ) | | | 167 | |
| Class 1A | | | 474 | | | | 35 | | | | 81 | | | | 6 | | | | (266 | ) | | | (18 | ) | | | 289 | | | | 23 | |
| Class 2 | | | 48,178 | | | | 3,670 | | | | 47,647 | | | | 3,258 | | | | (175,562 | ) | | | (11,876 | ) | | | (79,737 | ) | | | (4,948 | ) |
| Class 4 | | | 26,989 | | | | 1,950 | | | | 5,189 | | | | 362 | | | | (19,540 | ) | | | (1,418 | ) | | | 12,638 | | | | 894 | |
| Total net increase (decrease) | | $ | 350,284 | | | | 26,865 | | | $ | 76,591 | | | | 5,233 | | | $ | (501,460 | ) | | | (35,962 | ) | | $ | (74,585 | ) | | | (3,864 | ) |
| | | | | | | | | | | | | | | | | | | | | | | | | | | | | | | | | |
| Year ended December 31, 2019 | | | | | | | | | | | | | | | | | | | | | | | | |
| | | | | | | | | | | | | | | | | | | | | | | | | |
| Class 1 | | $ | 43,801 | | | | 2,986 | | | $ | 38,762 | | | | 2,639 | | | $ | (61,157 | ) | | | (4,174 | ) | | $ | 21,406 | | | | 1,451 | |
| Class 1A | | | 809 | | | | 55 | | | | 100 | | | | 7 | | | | (205 | ) | | | (14 | ) | | | 704 | | | | 48 | |
| Class 2 | | | 15,277 | | | | 1,057 | | | | 91,385 | | | | 6,251 | | | | (232,647 | ) | | | (15,758 | ) | | | (125,985 | ) | | | (8,450 | ) |
| Class 4 | | | 34,845 | | | | 2,405 | | | | 8,268 | | | | 574 | | | | (16,175 | ) | | | (1,116 | ) | | | 26,938 | | | | 1,863 | |
| Total net increase (decrease) | | $ | 94,732 | | | | 6,503 | | | $ | 138,515 | | | | 9,471 | | | $ | (310,184 | ) | | | (21,062 | ) | | $ | (76,937 | ) | | | (5,088 | ) |
See end of tables for footnotes.
| American Funds Insurance Series | 307 |
| Growth-Income Fund | | | | | | | | | | | | | | | | |
| | | | | | | | | | | | | | | | | | | | | | | | | |
| | | Sales* | | | Reinvestments of
distributions | | | Repurchases* | | | Net (decrease)
increase | |
| Share class | | Amount | | | Shares | | | Amount | | | Shares | | | Amount | | | Shares | | | Amount | | | Shares | |
| | | | | | | | | | | | | | | | | | | | | | | | | |
| Year ended December 31, 2020 | | | | | | | | | | | | | | | | |
| | | | | | | | | | | | | | | | | |
| Class 1 | | $ | 1,892,111 | | | | 42,172 | | | $ | 862,018 | | | | 17,198 | | | $ | (2,883,447 | ) | | | (61,087 | ) | | $ | (129,318 | ) | | | (1,717 | ) |
| Class 1A | | | 4,637 | | | | 94 | | | | 476 | | | | 9 | | | | (1,475 | ) | | | (30 | ) | | | 3,638 | | | | 73 | |
| Class 2 | | | 252,743 | | | | 5,452 | | | | 513,097 | | | | 10,416 | | | | (1,497,209 | ) | | | (30,770 | ) | | | (731,369 | ) | | | (14,902 | ) |
| Class 3 | | | 2,002 | | | | 41 | | | | 5,790 | | | | 116 | | | | (23,231 | ) | | | (465 | ) | | | (15,439 | ) | | | (308 | ) |
| Class 4 | | | 174,576 | | | | 3,682 | | | | 46,799 | | | | 965 | | | | (148,613 | ) | | | (3,153 | ) | | | 72,762 | | | | 1,494 | |
| Total net increase (decrease) | | $ | 2,326,069 | | | | 51,441 | | | $ | 1,428,180 | | | | 28,704 | | | $ | (4,553,975 | ) | | | (95,505 | ) | | $ | (799,726 | ) | | | (15,360 | ) |
| | | | | | | | | | | | | | | | | | | | | | | | | | | | | | | | | |
| Year ended December 31, 2019 | | | | | | | | | | | | | | | | | | | | | | | | |
| | | | | | | | | | | | | | | | | | | | | | | | | |
| Class 1 | | $ | 1,061,581 | | | | 21,810 | | | $ | 2,276,758 | | | | 48,690 | | | $ | (1,229,398 | ) | | | (25,018 | ) | | $ | 2,108,941 | | | | 45,482 | |
| Class 1A | | | 3,121 | | | | 63 | | | | 1,031 | | | | 22 | | | | (929 | ) | | | (19 | ) | | | 3,223 | | | | 66 | |
| Class 2 | | | 173,237 | | | | 3,593 | | | | 1,532,457 | | | | 33,240 | | | | (1,626,668 | ) | | | (33,632 | ) | | | 79,026 | | | | 3,201 | |
| Class 3 | | | 2,080 | | | | 42 | | | | 17,705 | | | | 379 | | | | (21,190 | ) | | | (431 | ) | | | (1,405 | ) | | | (10 | ) |
| Class 4 | | | 180,857 | | | | 3,787 | | | | 125,407 | | | | 2,752 | | | | (103,759 | ) | | | (2,175 | ) | | | 202,505 | | | | 4,364 | |
| Total net increase (decrease) | | $ | 1,420,876 | | | | 29,295 | | | $ | 3,953,358 | | | | 85,083 | | | $ | (2,981,944 | ) | | | (61,275 | ) | | $ | 2,392,290 | | | | 53,103 | |
| | | | | | | | | | | | | | | | | | | | | | | | | | | | | | | | | |
| International Growth and Income Fund | | | | | | | | | | | | | | | | | | | | |
| | | | | | | | | | | | | | | | | | | | | |
| | | Sales* | | | Reinvestments of
distributions | | | Repurchases* | | | Net (decrease)
increase | |
| Share class | | Amount | | | Shares | | | Amount | | | Shares | | | Amount | | | Shares | | | Amount | | | Shares | |
| | | | | | | | | | | | | | | | | | | | | | | | | | | | | | | | | |
| Year ended December 31, 2020 | | | | | | | | | | | | | | | | | | | | | | | | |
| | | | | | | | | | | | | | | | | | | | | | | | | |
| Class 1 | | $ | 78,373 | | | | 5,478 | | | $ | 17,128 | | | | 948 | | | $ | (179,914 | ) | | | (10,267 | ) | | $ | (84,413 | ) | | | (3,841 | ) |
| Class 1A | | | 977 | | | | 66 | | | | 38 | | | | 2 | | | | (791 | ) | | | (49 | ) | | | 224 | | | | 19 | |
| Class 2 | | | 13,943 | | | | 970 | | | | 2,909 | | | | 161 | | | | (63,267 | ) | | | (3,635 | ) | | | (46,415 | ) | | | (2,504 | ) |
| Class 4 | | | 17,701 | | | | 1,130 | | | | 1,255 | | | | 70 | | | | (13,000 | ) | | | (825 | ) | | | 5,956 | | | | 375 | |
| Total net increase (decrease) | | $ | 110,994 | | | | 7,644 | | | $ | 21,330 | | | | 1,181 | | | $ | (256,972 | ) | | | (14,776 | ) | | $ | (124,648 | ) | | | (5,951 | ) |
| | | | | | | | | | | | | | | | | | | | | | | | | | | | | | | | | |
| Year ended December 31, 2019 | | | | | | | | | | | | | | | | | | | | | | | | |
| | | | | | | | | | | | | | | | | | | | | | | | | |
| Class 1 | | $ | 9,331 | | | | 555 | | | $ | 41,626 | | | | 2,406 | | | $ | (130,370 | ) | | | (7,620 | ) | | $ | (79,413 | ) | | | (4,659 | ) |
| Class 1A | | | 364 | | | | 22 | | | | 83 | | | | 5 | | | | (75 | ) | | | (4 | ) | | | 372 | | | | 23 | |
| Class 2 | | | 14,448 | | | | 831 | | | | 8,726 | | | | 507 | | | | (37,612 | ) | | | (2,202 | ) | | | (14,438 | ) | | | (864 | ) |
| Class 4 | | | 20,154 | | | | 1,195 | | | | 3,113 | | | | 182 | | | | (7,857 | ) | | | (466 | ) | | | 15,410 | | | | 911 | |
| Total net increase (decrease) | | $ | 44,297 | | | | 2,603 | | | $ | 53,548 | | | | 3,100 | | | $ | (175,914 | ) | | | (10,292 | ) | | $ | (78,069 | ) | | | (4,589 | ) |
See end of tables for footnotes.
| 308 | American Funds Insurance Series |
| Capital Income Builder | | | | | | | | | | | | | | | | |
| | | | | | | | | | | | | | | | | | | | | | | | | |
| | | Sales* | | | Reinvestments of
distributions | | | Repurchases* | | | Net increase | |
| Share class | | Amount | | | Shares | | | Amount | | | Shares | | | Amount | | | Shares | | | Amount | | | Shares | |
| | | | | | | | | | | | | | | | | | | | | | | | | |
| Year ended December 31, 2020 | | | | | | | | | | | | | | | | |
| | | | | | | | | | | | | | | | | | | | | | | | | |
| Class 1 | | $ | 237,195 | | | | 24,206 | | | $ | 17,285 | | | | 1,757 | | | $ | (178,753 | ) | | | (18,572 | ) | | $ | 75,727 | | | | 7,391 | |
| Class 1A | | | 809 | | | | 80 | | | | 161 | | | | 16 | | | | (340 | ) | | | (34 | ) | | | 630 | | | | 62 | |
| Class 2 | | | 2,017 | | | | 200 | | | | 181 | | | | 18 | | | | (286 | ) | | | (28 | ) | | | 1,912 | | | | 190 | |
| Class 4 | | | 49,099 | | | | 4,860 | | | | 11,369 | | | | 1,158 | | | | (58,009 | ) | | | (5,855 | ) | | | 2,459 | | | | 163 | |
| Total net increase (decrease) | | $ | 289,120 | | | | 29,346 | | | $ | 28,996 | | | | 2,949 | | | $ | (237,388 | ) | | | (24,489 | ) | | $ | 80,728 | | | | 7,806 | |
| | | | | | | | | | | | | | | | | | | | | | | | | | | | | | | | | |
| Year ended December 31, 2019 | | | | | | | | | | | | | | | | | | | | | | | | |
| | | | | | | | | | | | | | | | | | | | | | | | | | | | | | | | | |
| Class 1 | | $ | 160,592 | | | | 15,806 | | | $ | 13,476 | | | | 1,322 | | | $ | (12,510 | ) | | | (1,240 | ) | | $ | 161,558 | | | | 15,888 | |
| Class 1A | | | 2,709 | | | | 268 | | | | 126 | | | | 12 | | | | (345 | ) | | | (34 | ) | | | 2,490 | | | | 246 | |
| Class 2 | | | 1,661 | | | | 165 | | | | 137 | | | | 13 | | | | (567 | ) | | | (56 | ) | | | 1,231 | | | | 122 | |
| Class 4 | | | 66,462 | | | | 6,575 | | | | 10,875 | | | | 1,070 | | | | (29,407 | ) | | | (2,903 | ) | | | 47,930 | | | | 4,742 | |
| Total net increase (decrease) | | $ | 231,424 | | | | 22,814 | | | $ | 24,614 | | | | 2,417 | | | $ | (42,829 | ) | | | (4,233 | ) | | $ | 213,209 | | | | 20,998 | |
| | | | | | | | | | | | | | | | | | | | | | | | | | | | | | | | | |
| Asset Allocation Fund | | | | | | | | | | | | | | | | | | | | | | | | |
| | | | | | | | | | | | | | | | | | | | | | | | | | | | | | | | | |
| | | Sales* | | | Reinvestments of
distributions | | | Repurchases* | | | Net (decrease)
increase | |
| Share class | | Amount | | | Shares | | | Amount | | | Shares | | | Amount | | | Shares | | | Amount | | | Shares | |
| | | | | | | | | | | | | | | | | | | | | | | | | | | | | | | | | |
| Year ended December 31, 2020 | | | | | | | | | | | | | | | | | | | | | | | | |
| | | | | | | | | | | | | | | | | | | | | | | | | | | | | | | | | |
| Class 1 | | $ | 1,817,230 | | | | 79,909 | | | $ | 412,849 | | | | 16,378 | | | $ | (2,437,918 | ) | | | (107,604 | ) | | $ | (207,839 | ) | | | (11,317 | ) |
| Class 1A | | | 4,177 | | | | 174 | | | | 264 | | | | 10 | | | | (1,862 | ) | | | (81 | ) | | | 2,579 | | | | 103 | |
| Class 2 | | | 109,553 | | | | 4,668 | | | | 103,653 | | | | 4,169 | | | | (595,244 | ) | | | (25,445 | ) | | | (382,038 | ) | | | (16,608 | ) |
| Class 3 | | | 914 | | | | 38 | | | | 661 | | | | 26 | | | | (4,390 | ) | | | (184 | ) | | | (2,815 | ) | | | (120 | ) |
| Class 4 | | | 410,135 | | | | 17,490 | | | | 89,009 | | | | 3,606 | | | | (327,826 | ) | | | (14,043 | ) | | | 171,318 | | | | 7,053 | |
| Total net increase (decrease) | | $ | 2,342,009 | | | | 102,279 | | | $ | 606,436 | | | | 24,189 | | | $ | (3,367,240 | ) | | | (147,357 | ) | | $ | (418,795 | ) | | | (20,889 | ) |
| | | | | | | | | | | | | | | | | | | | | | | | | | | | | | | | | |
| Year ended December 31, 2019 | | | | | | | | | | | | | | | | | | | | | | | | |
| | | | | | | | | | | | | | | | | | | | | | | | | | | | | | | | | |
| Class 1 | | $ | 1,081,611 | | | | 47,062 | | | $ | 1,173,430 | | | | 52,076 | | | $ | (1,121,605 | ) | | | (48,857 | ) | | $ | 1,133,436 | | | | 50,281 | |
| Class 1A | | | 2,765 | | | | 122 | | | | 605 | | | | 27 | | | | (689 | ) | | | (30 | ) | | | 2,681 | | | | 119 | |
| Class 2 | | | 111,154 | | | | 4,871 | | | | 347,279 | | | | 15,613 | | | | (575,603 | ) | | | (25,266 | ) | | | (117,170 | ) | | | (4,782 | ) |
| Class 3 | | | 991 | | | | 43 | | | | 2,189 | | | | 97 | | | | (4,150 | ) | | | (180 | ) | | | (970 | ) | | | (40 | ) |
| Class 4 | | | 356,681 | | | | 15,732 | | | | 277,834 | | | | 12,559 | | | | (218,378 | ) | | | (9,706 | ) | | | 416,137 | | | | 18,585 | |
| Total net increase (decrease) | | $ | 1,553,202 | | | | 67,830 | | | $ | 1,801,337 | | | | 80,372 | | | $ | (1,920,425 | ) | | | (84,039 | ) | | $ | 1,434,114 | | | | 64,163 | |
See end of tables for footnotes.
| American Funds Insurance Series | 309 |
| Global Balanced Fund | | | | | | | | | | | | | | | | |
| | | | | | | | | | | | | | | | | | | | | | | | | |
| | | Sales* | | | Reinvestments of
distributions | | | Repurchases* | | | Net increase
(decrease) | |
| Share class | | Amount | | | Shares | | | Amount | | | Shares | | | Amount | | | Shares | | | Amount | | | Shares | |
| | | | | | | | | | | | | | | | | | | | | | | | | |
| Year ended December 31, 2020 | | | | | | | | | | | | | | | | |
| | | | | | | | | | | | | | | | | | | | | | | | | |
| Class 1 | | $ | 29,379 | | | | 2,319 | | | $ | 6,831 | | | | 491 | | | $ | (35,963 | ) | | | (2,860 | ) | | $ | 247 | | | | (50 | ) |
| Class 1A | | | 379 | | | | 27 | | | | 127 | | | | 9 | | | | (183 | ) | | | (13 | ) | | | 323 | | | | 23 | |
| Class 2 | | | 10,289 | | | | 792 | | | | 9,760 | | | | 704 | | | | (28,821 | ) | | | (2,185 | ) | | | (8,772 | ) | | | (689 | ) |
| Class 4 | | | 11,783 | | | | 881 | | | | 4,655 | | | | 339 | | | | (10,044 | ) | | | (767 | ) | | | 6,394 | | | | 453 | |
| Total net increase (decrease) | | $ | 51,830 | | | | 4,019 | | | $ | 21,373 | | | | 1,543 | | | $ | (75,011 | ) | | | (5,825 | ) | | $ | (1,808 | ) | | | (263 | ) |
| | | | | | | | | | | | | | | | | | | | | | | | | | | | | | | | | |
| Year ended December 31, 2019 | | | | | | | | | | | | | | | | | | | | | | | | |
| | | | | | | | | | | | | | | | | | | | | | | | | | | | | | | | | |
| Class 1 | | $ | 10,073 | | | | 777 | | | $ | 5,390 | | | | 408 | | | $ | (9,768 | ) | | | (718 | ) | | $ | 5,695 | | | | 467 | |
| Class 1A | | | 111 | | | | 9 | | | | 89 | | | | 7 | | | | (237 | ) | | | (19 | ) | | | (37 | ) | | | (3 | ) |
| Class 2 | | | 7,858 | | | | 607 | | | | 8,009 | | | | 608 | | | | (22,255 | ) | | | (1,722 | ) | | | (6,388 | ) | | | (507 | ) |
| Class 4 | | | 15,727 | | | | 1,225 | | | | 3,446 | | | | 264 | | | | (6,014 | ) | | | (470 | ) | | | 13,159 | | | | 1,019 | |
| Total net increase (decrease) | | $ | 33,769 | | | | 2,618 | | | $ | 16,934 | | | | 1,287 | | | $ | (38,274 | ) | | | (2,929 | ) | | $ | 12,429 | | | | 976 | |
| | | | | | | | | | | | | | | | | | | | | | | | | | | | | | | | | |
| Bond Fund | | | | | | | | | | | | | | | | | | | | | | | | |
| | | Sales* | | | Reinvestments of
distributions | | | Repurchases* | | | Net (decrease)
increase | |
| Share class | | Amount | | | Shares | | | Amount | | | Shares | | | Amount | | | Shares | | | Amount | | | Shares | |
| | | | | | | | | | | | | | | | | | | | | | | | | | | | | | | | | |
| Year ended December 31, 2020 | | | | | | | | | | | | | | | | | | | | | | | | |
| | | | | | | | | | | | | | | | | | | | | | | | | | | | | | | | | |
| Class 1 | | $ | 1,499,439 | | | | 128,201 | | | $ | 208,932 | | | | 17,767 | | | $ | (1,735,112 | ) | | | (150,736 | ) | | $ | (26,741 | ) | | | (4,768 | ) |
| Class 1A | | | 3,563 | | | | 306 | | | | 255 | | | | 22 | | | | (1,431 | ) | | | (124 | ) | | | 2,387 | | | | 204 | |
| Class 2 | | | 397,055 | | | | 34,256 | | | | 110,645 | | | | 9,541 | | | | (449,029 | ) | | | (39,506 | ) | | | 58,671 | | | | 4,291 | |
| Class 4 | | | 242,089 | | | | 20,999 | | | | 17,962 | | | | 1,553 | | | | (81,119 | ) | | | (7,132 | ) | | | 178,932 | | | | 15,420 | |
| Total net increase (decrease) | | $ | 2,142,146 | | | | 183,762 | | | $ | 337,794 | | | | 28,883 | | | $ | (2,266,691 | ) | | | (197,498 | ) | | $ | 213,249 | | | | 15,147 | |
| | | | | | | | | | | | | | | | | | | | | | | | | | | | | | | | | |
| Year ended December 31, 2019 | | | | | | | | | | | | | | | | | | | | | | | | |
| | | | | | | | | | | | | | | | | | | | | | | | | | | | | | | | | |
| Class 1 | | $ | 562,508 | | | | 51,468 | | | $ | 176,372 | | | | 15,842 | | | $ | (614,303 | ) | | | (56,025 | ) | | $ | 124,577 | | | | 11,285 | |
| Class 1A | | | 3,719 | | | | 336 | | | | 165 | | | | 15 | | | | (744 | ) | | | (67 | ) | | | 3,140 | | | | 284 | |
| Class 2 | | | 133,036 | | | | 12,239 | | | | 90,797 | | | | 8,262 | | | | (413,489 | ) | | | (38,133 | ) | | | (189,656 | ) | | | (17,632 | ) |
| Class 4 | | | 149,767 | | | | 13,753 | | | | 11,384 | | | | 1,037 | | | | (49,519 | ) | | | (4,574 | ) | | | 111,632 | | | | 10,216 | |
| Total net increase (decrease) | | $ | 849,030 | | | | 77,796 | | | $ | 278,718 | | | | 25,156 | | | $ | (1,078,055 | ) | | | (98,799 | ) | | $ | 49,693 | | | | 4,153 | |
| | | | | | | | | | | | | | | | | | | | | | | | | | | | | | | | | |
| Capital World Bond Fund | | | | | | | | | | | | | | | | | | | | | | | | |
| | | | | | | | | | | | | | | | | | | | | | | | | | | | | | | | | |
| | | Sales* | | | Reinvestments of
distributions | | | Repurchases* | | | Net increase
(decrease) | |
| Share class | | Amount | | | Shares | | | Amount | | | Shares | | | Amount | | | Shares | | | Amount | | | Shares | |
| | | | | | | | | | | | | | | | | | | | | | | | | | | | | | | | | |
| Year ended December 31, 2020 | | | | | | | | | | | | | | | | | | | | | | | | |
| | | | | | | | | | | | | | | | | | | | | | | | | | | | | | | | | |
| Class 1 | | $ | 279,297 | | | | 22,900 | | | $ | 34,711 | | | | 2,801 | | | $ | (244,497 | ) | | | (20,428 | ) | | $ | 69,511 | | | | 5,273 | |
| Class 1A | | | 323 | | | | 26 | | | | 18 | | | | 1 | | | | (135 | ) | | | (11 | ) | | | 206 | | | | 16 | |
| Class 2 | | | 104,127 | | | | 8,595 | | | | 28,474 | | | | 2,321 | | | | (140,860 | ) | | | (11,802 | ) | | | (8,259 | ) | | | (886 | ) |
| Class 4 | | | 21,389 | | | | 1,754 | | | | 1,457 | | | | 120 | | | | (13,943 | ) | | | (1,171 | ) | | | 8,903 | | | | 703 | |
| Total net increase (decrease) | | $ | 405,136 | | | | 33,275 | | | $ | 64,660 | | | | 5,243 | | | $ | (399,435 | ) | | | (33,412 | ) | | $ | 70,361 | | | | 5,106 | |
| | | | | | | | | | | | | | | | | | | | | | | | | | | | | | | | | |
| Year ended December 31, 2019 | | | | | | | | | | | | | | | | | | | | | | | | |
| | | | | | | | | | | | | | | | | | | | | | | | | | | | | | | | | |
| Class 1 | | $ | 94,035 | | | | 7,945 | | | $ | 19,056 | | | | 1,588 | | | $ | (113,011 | ) | | | (9,529 | ) | | $ | 80 | | | | 4 | |
| Class 1A | | | 84 | | | | 7 | | | | 7 | | | | 1 | | | | (59 | ) | | | (5 | ) | | | 32 | | | | 3 | |
| Class 2 | | | 33,181 | | | | 2,816 | | | | 15,927 | | | | 1,338 | | | | (140,715 | ) | | | (11,911 | ) | | | (91,607 | ) | | | (7,757 | ) |
| Class 4 | | | 13,230 | | | | 1,132 | | | | 649 | | | | 55 | | | | (7,381 | ) | | | (629 | ) | | | 6,498 | | | | 558 | |
| Total net increase (decrease) | | $ | 140,530 | | | | 11,900 | | | $ | 35,639 | | | | 2,982 | | | $ | (261,166 | ) | | | (22,074 | ) | | $ | (84,997 | ) | | | (7,192 | ) |
See end of tables for footnotes.
| 310 | American Funds Insurance Series |
| High-Income Bond Fund | | | | | | | | | | | | | | | | |
| | | | | | | | | | | | | | | | | | | | | | | | | |
| | | Sales* | | | Reinvestments of
distributions | | | Repurchases* | | | Net (decrease)
increase | |
| Share class | | Amount | | | Shares | | | Amount | | | Shares | | | Amount | | | Shares | | | Amount | | | Shares | |
| | | | | | | | | | | | | | | | | | | | | | | | | |
| Year ended December 31, 2020 | | | | | | | | | | | | | | | | |
| | | | | | | | | | | | | | | | | | | | | | | | | |
| Class 1 | | $ | 18,985 | | | | 2,117 | | | $ | 9,529 | | | | 992 | | | $ | (390,999 | ) | | | (43,725 | ) | | $ | (362,485 | ) | | | (40,616 | ) |
| Class 1A | | | 408 | | | | 43 | | | | 78 | | | | 8 | | | | (220 | ) | | | (23 | ) | | | 266 | | | | 28 | |
| Class 2 | | | 18,520 | | | | 1,972 | | | | 54,086 | | | | 5,739 | | | | (68,277 | ) | | | (7,320 | ) | | | 4,329 | | | | 391 | |
| Class 3 | | | 733 | | | | 76 | | | | 799 | | | | 83 | | | | (1,434 | ) | | | (151 | ) | | | 98 | | | | 8 | |
| Class 4 | | | 103,183 | | | | 9,989 | | | | 4,806 | | | | 465 | | | | (102,765 | ) | | | (9,921 | ) | | | 5,224 | | | | 533 | |
| Total net increase (decrease) | | $ | 141,829 | | | | 14,197 | | | $ | 69,298 | | | | 7,287 | | | $ | (563,695 | ) | | | (61,140 | ) | | $ | (352,568 | ) | | | (39,656 | ) |
| | | | | | | | | | | | | | | | | | | | | | | | | | | | | | | | | |
| Year ended December 31, 2019 | | | | | | | | | | | | | | | | | | | | | | | | |
| | | | | | | | | | | | | | | | | | | | | | | | | | | | | | | | | |
| Class 1 | | $ | 9,412 | | | | 933 | | | $ | 33,027 | | | | 3,374 | | | $ | (48,250 | ) | | | (4,826 | ) | | $ | (5,811 | ) | | | (519 | ) |
| Class 1A | | | 353 | | | | 35 | | | | 45 | | | | 5 | | | | (350 | ) | | | (35 | ) | | | 48 | | | | 5 | |
| Class 2 | | | 10,165 | | | | 1,039 | | | | 41,753 | | | | 4,340 | | | | (84,344 | ) | | | (8,552 | ) | | | (32,426 | ) | | | (3,173 | ) |
| Class 3 | | | 613 | | | | 61 | | | | 611 | | | | 62 | | | | (1,328 | ) | | | (132 | ) | | | (104 | ) | | | (9 | ) |
| Class 4 | | | 64,302 | | | | 6,070 | | | | 3,353 | | | | 321 | | | | (37,801 | ) | | | (3,523 | ) | | | 29,854 | | | | 2,868 | |
| Total net increase (decrease) | | $ | 84,845 | | | | 8,138 | | | $ | 78,789 | | | | 8,102 | | | $ | (172,073 | ) | | | (17,068 | ) | | $ | (8,439 | ) | | | (828 | ) |
| | | | | | | | | | | | | | | | | | | | | | | | | | | | | | | | | |
| Mortgage Fund | | | | | | | | | | | | | | | | | | | | | | | | |
| | | | | | | | | | | | | | | | | | | | | | | | | | | | | | | | | |
| | | Sales* | | | Reinvestments of
distributions | | | Repurchases* | | | Net increase
(decrease) | |
| Share class | | Amount | | | Shares | | | Amount | | | Shares | | | Amount | | | Shares | | | Amount | | | Shares | |
| | | | | | | | | | | | | | | | | | | | | | | | | | | | | | | | | |
| Year ended December 31, 2020 | | | | | | | | | | | | | | | | | | | | | | | | |
| | | | | | | | | | | | | | | | | | | | | | | | | | | | | | | | | |
| Class 1 | | $ | 68,523 | | | | 6,189 | | | $ | 3,551 | | | | 321 | | | $ | (68,907 | ) | | | (6,295 | ) | | $ | 3,167 | | | | 215 | |
| Class 1A | | | 899 | | | | 81 | | | | 14 | | | | 1 | | | | (274 | ) | | | (24 | ) | | | 639 | | | | 58 | |
| Class 2 | | | 7,728 | | | | 703 | | | | 797 | | | | 72 | | | | (9,799 | ) | | | (891 | ) | | | (1,274 | ) | | | (116 | ) |
| Class 4 | | | 24,189 | | | | 2,227 | | | | 458 | | | | 42 | | | | (16,769 | ) | | | (1,535 | ) | | | 7,878 | | | | 734 | |
| Total net increase (decrease) | | $ | 101,339 | | | | 9,200 | | | $ | 4,820 | | | | 436 | | | $ | (95,749 | ) | | | (8,745 | ) | | $ | 10,410 | | | | 891 | |
| | | | | | | | | | | | | | | | | | | | | | | | | | | | | | | | | |
| Year ended December 31, 2019 | | | | | | | | | | | | | | | | | | | | | | | | |
| | | | | | | | | | | | | | | | | | | | | | | | | | | | | | | | | |
| Class 1 | | $ | 31,595 | | | | 3,007 | | | $ | 5,573 | | | | 528 | | | $ | (41,843 | ) | | | (3,959 | ) | | $ | (4,675 | ) | | | (424 | ) |
| Class 1A | | | 166 | | | | 16 | | | | 12 | | | | 1 | | | | (444 | ) | | | (42 | ) | | | (266 | ) | | | (25 | ) |
| Class 2 | | | 4,351 | | | | 413 | | | | 1,355 | | | | 129 | | | | (7,802 | ) | | | (738 | ) | | | (2,096 | ) | | | (196 | ) |
| Class 4 | | | 11,996 | | | | 1,146 | | | | 585 | | | | 56 | | | | (9,761 | ) | | | (944 | ) | | | 2,820 | | | | 258 | |
| Total net increase (decrease) | | $ | 48,108 | | | | 4,582 | | | $ | 7,525 | | | | 714 | | | $ | (59,850 | ) | | | (5,683 | ) | | $ | (4,217 | ) | | | (387 | ) |
See end of tables for footnotes.
| American Funds Insurance Series | 311 |
| Ultra-Short Bond Fund | | | | | | | | | | | | | | | | |
| | | | | | | | | | | | | | | | | |
| | | Sales* | | | Reinvestments of
distributions | | | Repurchases* | | | Net increase
(decrease) | |
| Share class | | Amount | | | Shares | | | Amount | | | Shares | | | Amount | | | Shares | | | Amount | | | Shares | |
| | | | | | | | | | | | | | | | | | | | | | | | | |
| Year ended December 31, 2020 | | | | | | | | | | | | | | | | |
| | | | | | | | | | | | | | | | | |
| Class 1 | | $ | 32,173 | | | | 2,840 | | | $ | 104 | | | | 9 | | | $ | (17,960 | ) | | | (1,586 | ) | | $ | 14,317 | | | | 1,263 | |
| Class 1A | | | — | | | | — | | | | — | † | | | — | † | | | — | | | | — | | | | — | † | | | — | † |
| Class 2 | | | 162,780 | | | | 14,772 | | | | 558 | | | | 50 | | | | (104,954 | ) | | | (9,527 | ) | | | 58,384 | | | | 5,295 | |
| Class 3 | | | 2,553 | | | | 229 | | | | 8 | | | | 1 | | | | (1,439 | ) | | | (129 | ) | | | 1,122 | | | | 101 | |
| Class 4 | | | 51,028 | | | | 4,586 | | | | 67 | | | | 6 | | | | (32,890 | ) | | | (2,958 | ) | | | 18,205 | | | | 1,634 | |
| Total net increase (decrease) | | $ | 248,534 | | | | 22,427 | | | $ | 737 | | | | 66 | | | $ | (157,243 | ) | | | (14,200 | ) | | $ | 92,028 | | | | 8,293 | |
| | | | | | | | | | | | | | | | | | | | | | | | | | | | | | | | | |
| Year ended December 31, 2019 | | | | | | | | | | | | | | | | | | | | |
| | | | | | | | | | | | | | | | | | | | | |
| Class 1 | | $ | 9,753 | | | | 856 | | | $ | 604 | | | | 53 | | | $ | (17,930 | ) | | | (1,576 | ) | | $ | (7,573 | ) | | | (667 | ) |
| Class 1A | | | — | | | | — | | | | — | † | | | — | † | | | — | | | | — | | | | — | † | | | — | † |
| Class 2 | | | 85,259 | | | | 7,676 | | | | 4,088 | | | | 371 | | | | (106,127 | ) | | | (9,561 | ) | | | (16,780 | ) | | | (1,514 | ) |
| Class 3 | | | 714 | | | | 64 | | | | 59 | | | | 5 | | | | (2,101 | ) | | | (188 | ) | | | (1,328 | ) | | | (119 | ) |
| Class 4 | | | 21,513 | | | | 1,920 | | | | 342 | | | | 31 | | | | (17,702 | ) | | | (1,580 | ) | | | 4,153 | | | | 371 | |
| Total net increase (decrease) | | $ | 117,239 | | | | 10,516 | | | $ | 5,093 | | | | 460 | | | $ | (143,860 | ) | | | (12,905 | ) | | $ | (21,528 | ) | | | (1,929 | ) |
| | | | | | | | | | | | | | | | | | | | | | | | | | | | | | | | | |
| U.S. Government/AAA-Rated Securities Fund | | | | | | | | | | | | | | | | |
| | | | | | | | | | | | | | | | | |
| | | Sales* | | | Reinvestments of
distributions | | | Repurchases* | | | Net (decrease)
increase | |
| Share class | | Amount | | | Shares | | | Amount | | | Shares | | | Amount | | | Shares | | | Amount | | | Shares | |
| | | | | | | | | | | | | | | | | | | | | | | | | | | | | | | | | |
| Year ended December 31, 2020 | | | | | | | | | | | | | | | | | | | | |
| | | | | | | | | | | | | | | | | | | | | |
| Class 1 | | $ | 194,142 | | | | 14,793 | | | $ | 15,787 | | | | 1,214 | | | $ | (1,305,241 | ) | | | (98,066 | ) | | $ | (1,095,312 | ) | | | (82,059 | ) |
| Class 1A | | | 3,400 | | | | 259 | | | | 136 | | | | 11 | | | | (2,557 | ) | | | (195 | ) | | | 979 | | | | 75 | |
| Class 2 | | | 211,715 | | | | 16,419 | | | | 51,919 | | | | 4,038 | | | | (245,761 | ) | | | (18,789 | ) | | | 17,873 | | | | 1,668 | |
| Class 3 | | | 2,382 | | | | 183 | | | | 407 | | | | 31 | | | | (1,812 | ) | | | (139 | ) | | | 977 | | | | 75 | |
| Class 4 | | | 301,535 | | | | 23,299 | | | | 9,187 | | | | 715 | | | | (169,936 | ) | | | (13,051 | ) | | | 140,786 | | | | 10,963 | |
| Total net increase (decrease) | | $ | 713,174 | | | | 54,953 | | | $ | 77,436 | | | | 6,009 | | | $ | (1,725,307 | ) | | | (130,240 | ) | | $ | (934,697 | ) | | | (69,278 | ) |
| | | | | | | | | | | | | | | | | | | | | | | | | | | | | | | | | |
| Year ended December 31, 2019 | | | | | | | | | | | | | | | | | | | | |
| | | | | | | | | | | | | | | | | | | | | |
| Class 1 | | $ | 63,401 | | | | 5,184 | | | $ | 31,462 | | | | 2,550 | | | $ | (170,411 | ) | | | (13,819 | ) | | $ | (75,548 | ) | | | (6,085 | ) |
| Class 1A | | | 1,348 | | | | 110 | | | | 50 | | | | 4 | | | | (488 | ) | | | (40 | ) | | | 910 | | | | 74 | |
| Class 2 | | | 105,457 | | | | 8,638 | | | | 26,789 | | | | 2,193 | | | | (155,177 | ) | | | (12,760 | ) | | | (22,931 | ) | | | (1,929 | ) |
| Class 3 | | | 975 | | | | 79 | | | | 180 | | | | 15 | | | | (1,521 | ) | | | (124 | ) | | | (366 | ) | | | (30 | ) |
| Class 4 | | | 69,032 | | | | 5,652 | | | | 2,241 | | | | 183 | | | | (41,016 | ) | | | (3,366 | ) | | | 30,257 | | | | 2,469 | |
| Total net increase (decrease) | | $ | 240,213 | | | | 19,663 | | | $ | 60,722 | | | | 4,945 | | | $ | (368,613 | ) | | | (30,109 | ) | | $ | (67,678 | ) | | | (5,501 | ) |
| | | | | | | | | | | | | | | | | | | | | | | | | | | | | | | | | |
| Managed Risk Growth Fund | | | | | | | | | | | | | | | | | | | | | | | | |
| | | | | | | | | | | | | | | | | | | | | | | | | |
| | | Sales* | | | Reinvestments of
distributions | | | Repurchases* | | | Net increase | |
| Share class | | Amount | | | Shares | | | Amount | | | Shares | | | Amount | | | Shares | | | Amount | | | Shares | |
| | | | | | | | | | | | | | | | | | | | | | | | | | | | | | | | | |
| Year ended December 31, 2020 | | | | | | | | | | | | | | | | | | | | |
| | | | | | | | | | | | | | | | | | | | | |
| Class P1 | | $ | 3,987 | | | | 282 | | | $ | 438 | | | | 32 | | | $ | (1,595 | ) | | | (110 | ) | | $ | 2,830 | | | | 204 | |
| Class P2 | | | 54,142 | | | | 3,714 | | | | 24,836 | | | | 1,828 | | | | (71,110 | ) | | | (4,841 | ) | | | 7,868 | | | | 701 | |
| Total net increase (decrease) | | $ | 58,129 | | | | 3,996 | | | $ | 25,274 | | | | 1,860 | | | $ | (72,705 | ) | | | (4,951 | ) | | $ | 10,698 | | | | 905 | |
| | | | | | | | | | | | | | | | | | | | | | | | | | | | | | | | | |
| | | | | | | | | | | | | | | | | | | | | | | | | | | | | | | | | |
| Year ended December 31, 2019 | | | | | | | | | | | | | | | | | | | | |
| | | | | | | | | | | | | | | | | | | | | |
| Class P1 | | $ | 2,619 | | | | 201 | | | $ | 317 | | | | 25 | | | $ | (523 | ) | | | (41 | ) | | $ | 2,413 | | | | 185 | |
| Class P2 | | | 47,485 | | | | 3,690 | | | | 29,905 | | | | 2,419 | | | | (30,455 | ) | | | (2,336 | ) | | | 46,935 | | | | 3,773 | |
| Total net increase (decrease) | | $ | 50,104 | | | | 3,891 | | | $ | 30,222 | | | | 2,444 | | | $ | (30,978 | ) | | | (2,377 | ) | | $ | 49,348 | | | | 3,958 | |
See end of tables for footnotes.
| 312 | American Funds Insurance Series |
| Managed Risk International Fund | | | | | | | | | | | | | | | | |
| | | | | | | | | | | | | | | | | | | | | | | | | |
| | | Sales* | | | Reinvestments of
distributions | | | Repurchases* | | | Net increase
(decrease) | |
| Share class | | Amount | | | Shares | | | Amount | | | Shares | | | Amount | | | Shares | | | Amount | | | Shares | |
| | | | | | | | | | | | | | | | | | | | | | | | | |
| Year ended December 31, 2020 | | | | | | | | | | | | | | | | |
| | | | | | | | | | | | | | | | | | | | | | | | | |
| Class P1 | | $ | 1,063 | | | | 104 | | | $ | 31 | | | | 3 | | | $ | (311 | ) | | | (30 | ) | | $ | 783 | | | | 77 | |
| Class P2 | | | 14,905 | | | | 1,575 | | | | 3,216 | | | | 348 | | | | (17,706 | ) | | | (1,759 | ) | | | 415 | | | | 164 | |
| Total net increase (decrease) | | $ | 15,968 | | | | 1,679 | | | $ | 3,247 | | | | 351 | | | $ | (18,017 | ) | | | (1,789 | ) | | $ | 1,198 | | | | 241 | |
| | | | | | | | | | | | | | | | | | | | | | | | | | | | | | | | | |
| Year ended December 31, 2019 | | | | | | | | | | | | | | | | | | | | | | | | |
| | | | | | | | | | | | | | | | | | | | | | | | | | | | | | | | | |
| Class P1 | | $ | 357 | | | | 34 | | | $ | 27 | | | | 3 | | | $ | (140 | ) | | | (14 | ) | | $ | 244 | | | | 23 | |
| Class P2 | | | 7,251 | | | | 702 | | | | 7,769 | | | | 772 | | | | (18,389 | ) | | | (1,773 | ) | | | (3,369 | ) | | | (299 | ) |
| Total net increase (decrease) | | $ | 7,608 | | | | 736 | | | $ | 7,796 | | | | 775 | | | $ | (18,529 | ) | | | (1,787 | ) | | $ | (3,125 | ) | | | (276 | ) |
| | | | | | | | | | | | | | | | | | | | | | | | | | | | | | | | | |
| Managed Risk Blue Chip Income and Growth Fund | | | | | | | | | | | | | | | | |
| | | | | | | | | | | | | | | | | | | | | | | | | | | | | | | | | |
| | | Sales* | | | Reinvestments of
distributions | | | Repurchases* | | | Net increase | |
| Share class | | Amount | | | Shares | | | Amount | | | Shares | | | Amount | | | Shares | | | Amount | | | Shares | |
| | | | | | | | | | | | | | | | | | | | | | | | | | | | | | | | | |
| Year ended December 31, 2020 | | | | | | | | | | | | | | | | | | | | | | | | |
| | | | | | | | | | | | | | | | | | | | | | | | | | | | | | | | | |
| Class P1 | | $ | 947 | | | | 85 | | | $ | 66 | | | | 7 | | | $ | (241 | ) | | | (23 | ) | | $ | 772 | | | | 69 | |
| Class P2 | | | 24,832 | | | | 2,333 | | | | 16,834 | | | | 1,640 | | | | (31,353 | ) | | | (2,866 | ) | | | 10,313 | | | | 1,107 | |
| Total net increase (decrease) | | $ | 25,779 | | | | 2,418 | | | $ | 16,900 | | | | 1,647 | | | $ | (31,594 | ) | | | (2,889 | ) | | $ | 11,085 | | | | 1,176 | |
| | | | | | | | | | | | | | | | | | | | | | | | | | | | | | | | | |
| Year ended December 31, 2019 | | | | | | | | | | | | | | | | | | | | | | | | |
| | | | | | | | | | | | | | | | | | | | | | | | | | | | | | | | | |
| Class P1 | | $ | 547 | | | | 46 | | | $ | 53 | | | | 5 | | | $ | (313 | ) | | | (28 | ) | | $ | 287 | | | | 23 | |
| Class P2 | | | 16,518 | | | | 1,448 | | | | 23,362 | | | | 2,128 | | | | (33,614 | ) | | | (2,932 | ) | | | 6,266 | | | | 644 | |
| Total net increase (decrease) | | $ | 17,065 | | | | 1,494 | | | $ | 23,415 | | | | 2,133 | | | $ | (33,927 | ) | | | (2,960 | ) | | $ | 6,553 | | | | 667 | |
| | | | | | | | | | | | | | | | | | | | | | | | | | | | | | | | | |
| Managed Risk Growth-Income Fund | | | | | | | | | | | | | | | | |
| | | | | | | | | | | | | | | | | | | | | | | | | | | | | | | | | |
| | | Sales* | | | Reinvestments of
distributions | | | Repurchases* | | | Net increase | |
| Share class | | Amount | | | Shares | | | Amount | | | Shares | | | Amount | | | Shares | | | Amount | | | Shares | |
| | | | | | | | | | | | | | | | | | | | | | | | | | | | | | | | | |
| Year ended December 31, 2020 | | | | | | | | | | | | | | | | | | | | | | | | |
| | | | | | | | | | | | | | | | | | | | | | | | | | | | | | | | | |
| Class P1 | | $ | 92,644 | | | | 6,852 | | | $ | 140,694 | | | | 11,020 | | | $ | (143,917 | ) | | | (10,953 | ) | | $ | 89,421 | | | | 6,919 | |
| Class P2 | | | 24,533 | | | | 1,843 | | | | 20,073 | | | | 1,584 | | | | (19,990 | ) | | | (1,489 | ) | | | 24,616 | | | | 1,938 | |
| Total net increase (decrease) | | $ | 117,177 | | | | 8,695 | | | $ | 160,767 | | | | 12,604 | | | $ | (163,907 | ) | | | (12,442 | ) | | $ | 114,037 | | | | 8,857 | |
| | | | | | | | | | | | | | | | | | | | | | | | | | | | | | | | | |
| Year ended December 31, 2019 | | | | | | | | | | | | | | | | | | | | | | | | |
| | | | | | | | | | | | | | | | | | | | | | | | | | | | | | | | | |
| Class P1 | | $ | 86,511 | | | | 6,809 | | | $ | 29,069 | | | | 2,244 | | | $ | (82,465 | ) | | | (6,312 | ) | | $ | 33,115 | | | | 2,741 | |
| Class P2 | | | 28,190 | | | | 2,218 | | | | 3,371 | | | | 263 | | | | (20,033 | ) | | | (1,562 | ) | | | 11,528 | | | | 919 | |
| Total net increase (decrease) | | $ | 114,701 | | | | 9,027 | | | $ | 32,440 | | | | 2,507 | | | $ | (102,498 | ) | | | (7,874 | ) | | $ | 44,643 | | | | 3,660 | |
See end of tables for footnotes.
| American Funds Insurance Series | 313 |
| Managed Risk Asset Allocation Fund | | | | | | | | | | | | | | | | |
| | | | | | | | | | | | | | | | | | | | | | | | | |
| | | Sales* | | | Reinvestments of
distributions | | | Repurchases* | | | Net increase
(decrease) | |
| Share class | | Amount | | | Shares | | | Amount | | | Shares | | | Amount | | | Shares | | | Amount | | | Shares | |
| | | | | | | | | | | | | | | | | | | | | | | | | |
| Year ended December 31, 2020 | | | | | | | | | | | | | | | | |
| | | | | | | | | | | | | | | | | | | | | | | | | |
| Class P1 | | $ | 3,275 | | | | 256 | | | $ | 204 | | | | 16 | | | $ | (622 | ) | | | (45 | ) | | $ | 2,857 | | | | 227 | |
| Class P2 | | | 73,918 | | | | 5,805 | | | | 146,474 | | | | 12,155 | | | | (280,685 | ) | | | (21,952 | ) | | | (60,293 | ) | | | (3,992 | ) |
| Total net increase (decrease) | | $ | 77,193 | | | | 6,061 | | | $ | 146,678 | | | | 12,171 | | | $ | (281,307 | ) | | | (21,997 | ) | | $ | (57,436 | ) | | | (3,765 | ) |
| | | | | | | | | | | | | | | | | | | | | | | | | | | | | | | | | |
| Year ended December 31, 2019 | | | | | | | | | | | | | | | | | | | | | | | | |
| | | | | | | | | | | | | | | | | | | | | | | | | | | | | | | | | |
| Class P1 | | $ | 626 | | | | 47 | | | $ | 70 | | | | 5 | | | $ | (334 | ) | | | (25 | ) | | $ | 362 | | | | 27 | |
| Class P2 | | | 106,039 | | | | 8,229 | | | | 177,741 | | | | 14,380 | | | | (260,413 | ) | | | (20,223 | ) | | | 23,367 | | | | 2,386 | |
| Total net increase (decrease) | | $ | 106,665 | | | | 8,276 | | | $ | 177,811 | | | | 14,385 | | | $ | (260,747 | ) | | | (20,248 | ) | | $ | 23,729 | | | | 2,413 | |
| * | Includes exchanges between share classes of the fund. |
| † | Amount less than one thousand. |
10. Ownership concentration
At December 31, 2020, Managed Risk Growth and Income Portfolio held 31% and 13% of the outstanding shares of American Funds Insurance Series - Capital Income Builder and American Funds Insurance Series - Global Growth and Income Fund, respectively. In addition, Managed Risk Global Allocation Portfolio held 23% of the outstanding shares of American Funds Insurance Series - Global Balanced Fund.
| 314 | American Funds Insurance Series |
11. Investment transactions and other disclosures
The following tables present additional information for each of the funds for the year ended December 31, 2020 (dollars in thousands):
| | | Global
Growth
Fund | | | Global
Small
Capitalization
Fund | | | Growth
Fund | | | International
Fund | | | New
World
Fund | | | Blue Chip
Income and
Growth
Fund | |
| Purchases of investment securities* | | $ | 1,120,770 | | | $ | 1,594,529 | | | $ | 9,567,139 | | | $ | 3,388,922 | | | $ | 2,260,974 | | | $ | 3,267,025 | |
| Sales of investment securities* | | | 1,767,373 | | | | 2,143,797 | | | | 13,469,567 | | | | 4,123,935 | | | | 2,596,083 | | | | 3,472,007 | |
| Non-U.S. taxes paid on dividend income | | | 5,330 | | | | 2,026 | | | | 6,921 | | | | 10,822 | | | | 2,631 | | | | 477 | |
| Non-U.S. taxes paid on interest income | | | — | | | | 11 | | | | — | | | | — | | | | 4 | | | | — | |
| Non-U.S. taxes paid on realized gains | | | — | | | | — | | | | — | | | | — | | | | 1,590 | | | | — | |
| Non-U.S. taxes provided on unrealized appreciation | | | 7,807 | | | | 7,041 | | | | — | | | | 26,706 | | | | 15,681 | | | | — | |
| | | | | | | | | | | | | | | | | | | | | | | | | |
| | | Global
Growth
and Income
Fund | | | Growth-
Income
Fund | | | International
Growth
and Income
Fund | | | Capital
Income
Builder | | | Asset
Allocation
Fund | | | Global
Balanced
Fund | |
| Purchases of investment securities* | | $ | 649,244 | | | $ | 10,784,043 | | | $ | 686,636 | | | $ | 1,656,908 | | | $ | 33,575,749 | | | $ | 245,807 | |
| Sales of investment securities* | | | 827,330 | | | | 11,639,765 | | | | 721,131 | | | | 1,524,398 | | | | 32,845,643 | | | | 287,182 | |
| Non-U.S. taxes paid on dividend income | | | 2,597 | | | | 10,403 | | | | 2,725 | | | | 831 | | | | 7,494 | | | | 278 | |
| Non-U.S. taxes paid on interest income | | | — | | | | — | | | | — | | | | 2 | | | | — | | | | 15 | |
| Non-U.S. taxes paid on realized gains | | | 179 | | | | 165 | | | | — | | | | 1 | | | | 27 | | | | 3 | |
| Non-U.S. taxes provided on unrealized appreciation | | | 3,738 | | | | — | | | | — | | | | 101 | | | | 5,162 | | | | 20 | |
| | | | | | | | | | | | | | | | | | | | | | | | | |
| | | Bond
Fund | | | Capital
World Bond
Fund | | | High-
Income
Bond
Fund | | | American
Funds
Mortgage
Fund | | | Ultra-Short
Bond
Fund | | | U.S.
Government/
AAA-Rated
Securities
Fund | |
| Purchases of investment securities* | | $ | 44,831,898 | | | $ | 2,806,381 | | | $ | 706,463 | | | $ | 2,995,459 | | | $ | — | | | $ | 18,179,150 | |
| Sales of investment securities* | | | 44,287,472 | | | | 2,562,406 | | | | 1,079,778 | | | | 2,991,216 | | | | — | | | | 18,466,598 | |
| Non-U.S. taxes paid on interest income | | | — | | | | 215 | | | | — | | | | — | | | | — | | | | — | |
| Non-U.S. taxes paid on realized gains | | | — | | | | 72 | | | | — | | | | — | | | | — | | | | — | |
| Non-U.S. taxes provided on unrealized appreciation | | | — | | | | 63 | | | | — | | | | — | | | | — | | | | — | |
| | | | | | | | | | | | | | | | | | | | | | | | | |
| | | Managed
Risk
Growth
Fund | | | Managed
Risk
International
Fund | | | Managed
Risk Blue
Chip Income
and Growth
Fund | | | Managed
Risk
Growth-
Income
Fund | | | Managed
Risk
Asset
Allocation
Fund | | | | | |
| Purchases of investment securities* | | $ | 360,912 | | | $ | 102,655 | | | $ | 324,969 | | | $ | 807,885 | | | $ | 748,623 | | | | | |
| Sales of investment securities* | | | 412,406 | | | | 118,616 | | | | 359,913 | | | | 882,591 | | | | 1,032,662 | | | | | |
| * | Excludes short-term securities and U.S. government obligations, if any. |
| American Funds Insurance Series | 315 |
Financial highlights
| | | | | | Income (loss) from
investment operations1 | | | Dividends and distributions | | | | | | | | | | | | | | | | |
| Period ended | | Net asset
value,
beginning
of period | | | Net
investment
income
(loss) | | | Net gains
(losses) on
securities
(both
realized and
unrealized) | | | Total from
investment
operations | | | Dividends
(from net
investment
income) | | | Distributions
(from capital
gains) | | | Total
dividends
and
distributions | | | Net asset
value,
end
of period | | | Total
return | | | Net assets,
end of period
(in millions) | | | Ratio of
expenses
to average
net assets2 | | | Ratio of
net income
(loss)
to average
net assets | |
| | | | | | | | | | | | | | | | | | | | | | | | | | | | | | | | | | | | | |
| Global Growth Fund |
| |
| Class 1: | | | | | | | | | | | | | | | | | | | | | | | | | | | | | | | | | | | | | | | | | | | | | | | | |
| 12/31/2020 | | $ | 32.57 | | | $ | .20 | | | $ | 9.56 | | | $ | 9.76 | | | $ | (.21 | ) | | $ | (.96 | ) | | $ | (1.17 | ) | | $ | 41.16 | | | | 30.79 | % | | $ | 3,309 | | | | .56 | % | | | .59 | % |
| 12/31/2019 | | | 25.74 | | | | .32 | | | | 8.60 | | | | 8.92 | | | | (.41 | ) | | | (1.68 | ) | | | (2.09 | ) | | | 32.57 | | | | 35.61 | | | | 2,515 | | | | .56 | | | | 1.07 | |
| 12/31/2018 | | | 30.51 | | | | .29 | | | | (2.65 | ) | | | (2.36 | ) | | | (.28 | ) | | | (2.13 | ) | | | (2.41 | ) | | | 25.74 | | | | (8.81 | ) | | | 1,942 | | | | .55 | | | | .98 | |
| 12/31/2017 | | | 24.05 | | | | .26 | | | | 7.30 | | | | 7.56 | | | | (.26 | ) | | | (.84 | ) | | | (1.10 | ) | | | 30.51 | | | | 31.80 | | | | 2,010 | | | | .55 | | | | .94 | |
| 12/31/2016 | | | 26.39 | | | | .25 | | | | (.14 | ) | | | .11 | | | | (.29 | ) | | | (2.16 | ) | | | (2.45 | ) | | | 24.05 | | | | .87 | | | | 1,630 | | | | .56 | | | | 1.00 | |
| Class 1A: | | | | | | | | | | | | | | | | | | | | | | | | | | | | | | | | | | | | | | | | | | | | | | | | |
| 12/31/2020 | | | 32.47 | | | | .12 | | | | 9.52 | | | | 9.64 | | | | (.13 | ) | | | (.96 | ) | | | (1.09 | ) | | | 41.02 | | | | 30.49 | | | | 12 | | | | .81 | | | | .34 | |
| 12/31/2019 | | | 25.69 | | | | .25 | | | | 8.55 | | | | 8.80 | | | | (.34 | ) | | | (1.68 | ) | | | (2.02 | ) | | | 32.47 | | | | 35.22 | | | | 8 | | | | .81 | | | | .83 | |
| 12/31/2018 | | | 30.46 | | | | .23 | | | | (2.66 | ) | | | (2.43 | ) | | | (.21 | ) | | | (2.13 | ) | | | (2.34 | ) | | | 25.69 | | | | (9.02 | ) | | | 5 | | | | .80 | | | | .77 | |
| 12/31/20173,4 | | | 24.50 | | | | .11 | | | | 6.94 | | | | 7.05 | | | | (.25 | ) | | | (.84 | ) | | | (1.09 | ) | | | 30.46 | | | | 29.13 | 5 | | | 2 | | | | .80 | 6 | | | .39 | 6 |
| Class 2: | | | | | | | | | | | | | | | | | | | | | | | | | | | | | | | | | | | | | | | | | | | | | | | | |
| 12/31/2020 | | | 32.24 | | | | .12 | | | | 9.44 | | | | 9.56 | | | | (.12 | ) | | | (.96 | ) | | | (1.08 | ) | | | 40.72 | | | | 30.47 | | | | 4,387 | | | | .81 | | | | .34 | |
| 12/31/2019 | | | 25.50 | | | | .24 | | | | 8.51 | | | | 8.75 | | | | (.33 | ) | | | (1.68 | ) | | | (2.01 | ) | | | 32.24 | | | | 35.28 | | | | 3,895 | | | | .81 | | | | .83 | |
| 12/31/2018 | | | 30.24 | | | | .22 | | | | (2.63 | ) | | | (2.41 | ) | | | (.20 | ) | | | (2.13 | ) | | | (2.33 | ) | | | 25.50 | | | | (9.04 | ) | | | 3,306 | | | | .80 | | | | .73 | |
| 12/31/2017 | | | 23.85 | | | | .19 | | | | 7.23 | | | | 7.42 | | | | (.19 | ) | | | (.84 | ) | | | (1.03 | ) | | | 30.24 | | | | 31.47 | | | | 4,012 | | | | .80 | | | | .69 | |
| 12/31/2016 | | | 26.19 | | | | .18 | | | | (.14 | ) | | | .04 | | | | (.22 | ) | | | (2.16 | ) | | | (2.38 | ) | | | 23.85 | | | | .62 | | | | 3,483 | | | | .81 | | | | .76 | |
| Class 4: | | | | | | | | | | | | | | | | | | | | | | | | | | | | | | | | | | | | | | | | | | | | | | | | |
| 12/31/2020 | | | 32.05 | | | | .03 | | | | 9.38 | | | | 9.41 | | | | (.05 | ) | | | (.96 | ) | | | (1.01 | ) | | | 40.45 | | | | 30.17 | | | | 533 | | | | 1.06 | | | | .09 | |
| 12/31/2019 | | | 25.39 | | | | .17 | | | | 8.45 | | | | 8.62 | | | | (.28 | ) | | | (1.68 | ) | | | (1.96 | ) | | | 32.05 | | | | 34.87 | | | | 382 | | | | 1.06 | | | | .57 | |
| 12/31/2018 | | | 30.13 | | | | .14 | | | | (2.60 | ) | | | (2.46 | ) | | | (.15 | ) | | | (2.13 | ) | | | (2.28 | ) | | | 25.39 | | | | (9.24 | ) | | | 249 | | | | 1.05 | | | | .47 | |
| 12/31/2017 | | | 23.81 | | | | .10 | | | | 7.22 | | | | 7.32 | | | | (.16 | ) | | | (.84 | ) | | | (1.00 | ) | | | 30.13 | | | | 31.11 | | | | 211 | | | | 1.05 | | | | .37 | |
| 12/31/2016 | | | 26.16 | | | | .12 | | | | (.14 | ) | | | (.02 | ) | | | (.17 | ) | | | (2.16 | ) | | | (2.33 | ) | | | 23.81 | | | | .37 | | | | 94 | | | | 1.06 | | | | .50 | |
| | | | | | | | | | | | | | | | | | | | | | | | | | | | | | | | | | | | | | | | | | | | | | | | | |
| Global Small Capitalization Fund |
| | | | | | | | | | | | | | | | | | | | | | | | | | | | | | | | | | | | | | | | | | | | | | | | | |
| Class 1: | | | | | | | | | | | | | | | | | | | | | | | | | | | | | | | | | | | | | | | | | | | | | | | | |
| 12/31/2020 | | $ | 26.80 | | | $ | (.01 | ) | | $ | 7.49 | | | $ | 7.48 | | | $ | (.05 | ) | | $ | (1.59 | ) | | $ | (1.64 | ) | | $ | 32.64 | | | | 30.04 | % | | $ | 2,391 | | | | .75 | % | | | (.06 | )% |
| 12/31/2019 | | | 21.75 | | | | .12 | | | | 6.61 | | | | 6.73 | | | | (.10 | ) | | | (1.58 | ) | | | (1.68 | ) | | | 26.80 | | | | 31.84 | | | | 2,050 | | | | .75 | | | | .48 | |
| 12/31/2018 | | | 25.38 | | | | .11 | | | | (2.51 | ) | | | (2.40 | ) | | | (.09 | ) | | | (1.14 | ) | | | (1.23 | ) | | | 21.75 | | | | (10.31 | ) | | | 1,453 | | | | .73 | | | | .42 | |
| 12/31/2017 | | | 20.24 | | | | .12 | | | | 5.17 | | | | 5.29 | | | | (.15 | ) | | | — | | | | (.15 | ) | | | 25.38 | | | | 26.22 | | | | 1,639 | | | | .73 | | | | .54 | |
| 12/31/2016 | | | 24.41 | | | | .12 | | | | .17 | | | | .29 | | | | (.11 | ) | | | (4.35 | ) | | | (4.46 | ) | | | 20.24 | | | | 2.35 | | | | 1,532 | | | | .74 | | | | .57 | |
| Class 1A: | | | | | | | | | | | | | | | | | | | | | | | | | | | | | | | | | | | | | | | | | | | | | | | | |
| 12/31/2020 | | | 26.74 | | | | (.09 | ) | | | 7.48 | | | | 7.39 | | | | (.05 | ) | | | (1.59 | ) | | | (1.64 | ) | | | 32.49 | | | | 29.72 | | | | 1 | | | | .99 | | | | (.33 | ) |
| 12/31/2019 | | | 21.71 | | | | .05 | | | | 6.61 | | | | 6.66 | | | | (.05 | ) | | | (1.58 | ) | | | (1.63 | ) | | | 26.74 | | | | 31.56 | | | | 1 | | | | .99 | | | | .22 | |
| 12/31/2018 | | | 25.36 | | | | .05 | | | | (2.52 | ) | | | (2.47 | ) | | | (.04 | ) | | | (1.14 | ) | | | (1.18 | ) | | | 21.71 | | | | (10.56 | ) | | | — | 7 | | | .98 | | | | .21 | |
| 12/31/20173,4 | | | 20.70 | | | | .08 | | | | 4.71 | | | | 4.79 | | | | (.13 | ) | | | — | | | | (.13 | ) | | | 25.36 | | | | 23.19 | 5 | | | — | 7 | | | .96 | 6 | | | .35 | 6 |
| Class 2: | | | | | | | | | | | | | | | | | | | | | | | | | | | | | | | | | | | | | | | | | | | | | | | | |
| 12/31/2020 | | | 26.02 | | | | (.08 | ) | | | 7.25 | | | | 7.17 | | | | (.04 | ) | | | (1.59 | ) | | | (1.63 | ) | | | 31.56 | | | | 29.72 | | | | 2,653 | | | | 1.00 | | | | (.31 | ) |
| 12/31/2019 | | | 21.16 | | | | .05 | | | | 6.43 | | | | 6.48 | | | | (.04 | ) | | | (1.58 | ) | | | (1.62 | ) | | | 26.02 | | | | 31.52 | | | | 2,363 | | | | 1.00 | | | | .22 | |
| 12/31/2018 | | | 24.72 | | | | .04 | | | | (2.44 | ) | | | (2.40 | ) | | | (.02 | ) | | | (1.14 | ) | | | (1.16 | ) | | | 21.16 | | | | (10.55 | ) | | | 2,056 | | | | .98 | | | | .17 | |
| 12/31/2017 | | | 19.72 | | | | .06 | | | | 5.04 | | | | 5.10 | | | | (.10 | ) | | | — | | | | (.10 | ) | | | 24.72 | | | | 25.89 | | | | 2,551 | | | | .98 | | | | .27 | |
| 12/31/2016 | | | 23.90 | | | | .07 | | | | .15 | | | | .22 | | | | (.05 | ) | | | (4.35 | ) | | | (4.40 | ) | | | 19.72 | | | | 2.10 | | | | 2,303 | | | | .99 | | | | .31 | |
| Class 4: | | | | | | | | | | | | | | | | | | | | | | | | | | | | | | | | | | | | | | | | | | | | | | | | |
| 12/31/2020 | | | 26.16 | | | | (.14 | ) | | | 7.27 | | | | 7.13 | | | | (.03 | ) | | | (1.59 | ) | | | (1.62 | ) | | | 31.67 | | | | 29.39 | | | | 268 | | | | 1.25 | | | | (.56 | ) |
| 12/31/2019 | | | 21.28 | | | | (.01 | ) | | | 6.47 | | | | 6.46 | | | | — | 8 | | | (1.58 | ) | | | (1.58 | ) | | | 26.16 | | | | 31.24 | | | | 206 | | | | 1.25 | | | | (.04 | ) |
| 12/31/2018 | | | 24.91 | | | | (.02 | ) | | | (2.46 | ) | | | (2.48 | ) | | | (.01 | ) | | | (1.14 | ) | | | (1.15 | ) | | | 21.28 | | | | (10.80 | ) | | | 146 | | | | 1.24 | | | | (.08 | ) |
| 12/31/2017 | | | 19.91 | | | | — | 8 | | | 5.09 | | | | 5.09 | | | | (.09 | ) | | | — | | | | (.09 | ) | | | 24.91 | | | | 25.62 | | | | 125 | | | | 1.23 | | | | — | 9 |
| 12/31/2016 | | | 24.11 | | | | .01 | | | | .16 | | | | .17 | | | | (.02 | ) | | | (4.35 | ) | | | (4.37 | ) | | | 19.91 | | | | 1.85 | | | | 42 | | | | 1.24 | | | | .03 | |
See end of tables for footnotes.
| 316 | American Funds Insurance Series |
Financial highlights (continued)
| | | | | | Income (loss) from
investment operations1 | | | Dividends and distributions | | | | | | | | | | | | | | | | |
| Period ended | | Net asset
value,
beginning
of period | | | Net
investment
income
(loss) | | | Net gains
(losses) on
securities
(both
realized and
unrealized) | | | Total from
investment
operations | | | Dividends
(from net
investment
income) | | | Distributions
(from capital
gains) | | | Total
dividends
and
distributions | | | Net asset
value,
end
of period | | | Total
return | | | Net assets,
end of period
(in millions) | | | Ratio of
expenses
to average
net assets2 | | | Ratio of
net income
(loss)
to average
net assets | |
| | | | | | | | | | | | | | | | | | | | | | | | | | | | | | | | | | | | | |
| Growth Fund |
| |
| Class 1: | | | | | | | | | | | | | | | | | | | | | | | | | | | | | | | | | | | | | | | | | | | | | | | | |
| 12/31/2020 | | $ | 81.22 | | | $ | .43 | | | $ | 41.28 | | | $ | 41.71 | | | $ | (.53 | ) | | $ | (2.18 | ) | | $ | (2.71 | ) | | $ | 120.22 | | | | 52.45 | % | | $ | 15,644 | | | | .35 | % | | | .46 | % |
| 12/31/2019 | | | 69.96 | | | | .83 | | | | 19.63 | | | | 20.46 | | | | (.76 | ) | | | (8.44 | ) | | | (9.20 | ) | | | 81.22 | | | | 31.11 | | | | 10,841 | | | | .35 | | | | 1.09 | |
| 12/31/2018 | | | 77.85 | | | | .64 | | | | .25 | | | | .89 | | | | (.54 | ) | | | (8.24 | ) | | | (8.78 | ) | | | 69.96 | | | | (.01 | ) | | | 8,474 | | | | .34 | | | | .81 | |
| 12/31/2017 | | | 67.29 | | | | .55 | | | | 17.89 | | | | 18.44 | | | | (.55 | ) | | | (7.33 | ) | | | (7.88 | ) | | | 77.85 | | | | 28.62 | | | | 8,100 | | | | .35 | | | | .75 | |
| 12/31/2016 | | | 68.02 | | | | .67 | | | | 5.40 | | | | 6.07 | | | | (.67 | ) | | | (6.13 | ) | | | (6.80 | ) | | | 67.29 | | | | 9.77 | | | | 6,931 | | | | .35 | | | | 1.03 | |
|
| Class 1A: | | | | | | | | | | | | | | | | | | | | | | | | | | | | | | | | | | | | | | | | | | | | | | | | |
| 12/31/2020 | | | 80.92 | | | | .20 | | | | 41.05 | | | | 41.25 | | | | (.40 | ) | | | (2.18 | ) | | | (2.58 | ) | | | 119.59 | | | | 52.07 | | | | 60 | | | | .60 | | | | .21 | |
| 12/31/2019 | | | 69.77 | | | | .65 | | | | 19.55 | | | | 20.20 | | | | (.61 | ) | | | (8.44 | ) | | | (9.05 | ) | | | 80.92 | | | | 30.79 | | | | 18 | | | | .60 | | | | .85 | |
| 12/31/2018 | | | 77.74 | | | | .47 | | | | .24 | | | | .71 | | | | (.44 | ) | | | (8.24 | ) | | | (8.68 | ) | | | 69.77 | | | | (.26 | ) | | | 10 | | | | .59 | | | | .60 | |
| 12/31/20173,4 | | | 68.84 | | | | .35 | | | | 16.38 | | | | 16.73 | | | | (.50 | ) | | | (7.33 | ) | | | (7.83 | ) | | | 77.74 | | | | 25.47 | 5 | | | 3 | | | | .59 | 6 | | | .47 | 6 |
|
| Class 2: | | | | | | | | | | | | | | | | | | | | | | | | | | | | | | | | | | | | | | | | | | | | | | | | |
| 12/31/2020 | | | 80.57 | | | | .19 | | | | 40.89 | | | | 41.08 | | | | (.29 | ) | | | (2.18 | ) | | | (2.47 | ) | | | 119.18 | | | | 52.10 | | | | 20,594 | | | | .60 | | | | .21 | |
| 12/31/2019 | | | 69.48 | | | | .63 | | | | 19.47 | | | | 20.10 | | | | (.57 | ) | | | (8.44 | ) | | | (9.01 | ) | | | 80.57 | | | | 30.77 | | | | 15,885 | | | | .60 | | | | .83 | |
| 12/31/2018 | | | 77.35 | | | | .44 | | | | .27 | | | | .71 | | | | (.34 | ) | | | (8.24 | ) | | | (8.58 | ) | | | 69.48 | | | | (.25 | ) | | | 13,701 | | | | .59 | | | | .55 | |
| 12/31/2017 | | | 66.92 | | | | .37 | | | | 17.76 | | | | 18.13 | | | | (.37 | ) | | | (7.33 | ) | | | (7.70 | ) | | | 77.35 | | | | 28.28 | | | | 15,716 | | | | .60 | | | | .50 | |
| 12/31/2016 | | | 67.69 | | | | .51 | | | | 5.36 | | | | 5.87 | | | | (.51 | ) | | | (6.13 | ) | | | (6.64 | ) | | | 66.92 | | | | 9.49 | | | | 13,978 | | | | .60 | | | | .78 | |
|
| Class 3: | | | | | | | | | | | | | | | | | | | | | | | | | | | | | | | | | | | | | | | | | | | | | | | | |
| 12/31/2020 | | | 81.84 | | | | .26 | | | | 41.56 | | | | 41.82 | | | | (.35 | ) | | | (2.18 | ) | | | (2.53 | ) | | | 121.13 | | | | 52.20 | | | | 279 | | | | .53 | | | | .28 | |
| 12/31/2019 | | | 70.44 | | | | .69 | | | | 19.77 | | | | 20.46 | | | | (.62 | ) | | | (8.44 | ) | | | (9.06 | ) | | | 81.84 | | | | 30.86 | | | | 213 | | | | .53 | | | | .90 | |
| 12/31/2018 | | | 78.32 | | | | .50 | | | | .26 | | | | .76 | | | | (.40 | ) | | | (8.24 | ) | | | (8.64 | ) | | | 70.44 | | | | (.18 | ) | | | 187 | | | | .52 | | | | .62 | |
| 12/31/2017 | | | 67.67 | | | | .42 | | | | 17.98 | | | | 18.40 | | | | (.42 | ) | | | (7.33 | ) | | | (7.75 | ) | | | 78.32 | | | | 28.39 | | | | 212 | | | | .53 | | | | .57 | |
| 12/31/2016 | | | 68.37 | | | | .56 | | | | 5.42 | | | | 5.98 | | | | (.55 | ) | | | (6.13 | ) | | | (6.68 | ) | | | 67.67 | | | | 9.56 | | | | 183 | | | | .53 | | | | .85 | |
|
| Class 4: | | | | | | | | | | | | | | | | | | | | | | | | | | | | | | | | | | | | | | | | | | | | | | | | |
| 12/31/2020 | | | 79.41 | | | | (.04 | ) | | | 40.24 | | | | 40.20 | | | | (.19 | ) | | | (2.18 | ) | | | (2.37 | ) | | | 117.24 | | | | 51.71 | | | | 2,347 | | | | .85 | | | | (.04 | ) |
| 12/31/2019 | | | 68.64 | | | | .44 | | | | 19.19 | | | | 19.63 | | | | (.42 | ) | | | (8.44 | ) | | | (8.86 | ) | | | 79.41 | | | | 30.44 | | | | 1,513 | | | | .85 | | | | .59 | |
| 12/31/2018 | | | 76.56 | | | | .24 | | | | .28 | | | | .52 | | | | (.20 | ) | | | (8.24 | ) | | | (8.44 | ) | | | 68.64 | | | | (.50 | ) | | | 1,076 | | | | .84 | | | | .31 | |
| 12/31/2017 | | | 66.41 | | | | .18 | | | | 17.61 | | | | 17.79 | | | | (.31 | ) | | | (7.33 | ) | | | (7.64 | ) | | | 76.56 | | | | 27.99 | | | | 954 | | | | .85 | | | | .25 | |
| 12/31/2016 | | | 67.26 | | | | .34 | | | | 5.32 | | | | 5.66 | | | | (.38 | ) | | | (6.13 | ) | | | (6.51 | ) | | | 66.41 | | | | 9.22 | | | | 458 | | | | .85 | | | | .53 | |
See end of tables for footnotes.
| American Funds Insurance Series | 317 |
Financial highlights (continued)
| | | | | | Income (loss) from
investment operations1 | | | Dividends and distributions | | | | | | | | | | | | | | | | |
| Period ended | | Net asset
value,
beginning
of period | | | Net
investment
income
(loss) | | | Net gains
(losses) on
securities
(both
realized and
unrealized) | | | Total from
investment
operations | | | Dividends
(from net
investment
income) | | | Distributions
(from capital
gains) | | | Total
dividends
and
distributions | | | Net asset
value,
end
of period | | | Total
return | | | Net assets,
end of period
(in millions) | | | Ratio of
expenses
to average
net assets2 | | | Ratio of
net income
(loss)
to average
net assets | |
| | | | | | | | | | | | | | | | | | | | | | | | | | | | | | | | | | | | | |
| International Fund |
| |
| Class 1: | | | | | | | | | | | | | | | | | | | | | | | | | | | | | | | | | | | | | | | | | | | | | | | | |
| 12/31/2020 | | $ | 20.86 | | | $ | .14 | | | $ | 2.82 | | | $ | 2.96 | | | $ | (.18 | ) | | $ | — | | | $ | (.18 | ) | | $ | 23.64 | | | | 14.28 | % | | $ | 5,652 | | | | .55 | % | | | .71 | % |
| 12/31/2019 | | | 17.66 | | | | .30 | | | | 3.74 | | | | 4.04 | | | | (.34 | ) | | | (.50 | ) | | | (.84 | ) | | | 20.86 | | | | 23.21 | | | | 5,353 | | | | .54 | | | | 1.54 | |
| 12/31/2018 | | | 21.71 | | | | .34 | | | | (2.97 | ) | | | (2.63 | ) | | | (.40 | ) | | | (1.02 | ) | | | (1.42 | ) | | | 17.66 | | | | (12.94 | ) | | | 4,811 | | | | .53 | | | | 1.62 | |
| 12/31/2017 | | | 16.82 | | | | .26 | | | | 5.16 | | | | 5.42 | | | | (.30 | ) | | | (.23 | ) | | | (.53 | ) | | | 21.71 | | | | 32.46 | | | | 5,014 | | | | .53 | | | | 1.33 | |
| 12/31/2016 | | | 18.08 | | | | .27 | | | | .30 | | | | .57 | | | | (.28 | ) | | | (1.55 | ) | | | (1.83 | ) | | | 16.82 | | | | 3.78 | | | | 3,652 | | | | .54 | | | | 1.57 | |
| Class 1A: | | | | | | | | | | | | | | | | | | | | | | | | | | | | | | | | | | | | | | | | | | | | | | | | |
| 12/31/2020 | | | 20.80 | | | | .08 | | | | 2.81 | | | | 2.89 | | | | (.14 | ) | | | — | | | | (.14 | ) | | | 23.55 | | | | 13.96 | | | | 10 | | | | .80 | | | | .43 | |
| 12/31/2019 | | | 17.62 | | | | .25 | | | | 3.72 | | | | 3.97 | | | | (.29 | ) | | | (.50 | ) | | | (.79 | ) | | | 20.80 | | | | 22.90 | | | | 7 | | | | .79 | | | | 1.27 | |
| 12/31/2018 | | | 21.67 | | | | .27 | | | | (2.93 | ) | | | (2.66 | ) | | | (.37 | ) | | | (1.02 | ) | | | (1.39 | ) | | | 17.62 | | | | (13.11 | ) | | | 5 | | | | .78 | | | | 1.32 | |
| 12/31/20173,4 | | | 17.17 | | | | .09 | | | | 4.93 | | | | 5.02 | | | | (.29 | ) | | | (.23 | ) | | | (.52 | ) | | | 21.67 | | | | 29.46 | 5 | | | 2 | | | | .77 | 6 | | | .43 | 6 |
| Class 2: | | | | | | | | | | | | | | | | | | | | | | | | | | | | | | | | | | | | | | | | | | | | | | | | |
| 12/31/2020 | | | 20.78 | | | | .09 | | | | 2.80 | | | | 2.89 | | | | (.13 | ) | | | — | | | | (.13 | ) | | | 23.54 | | | | 13.97 | | | | 4,481 | | | | .80 | | | | .46 | |
| 12/31/2019 | | | 17.60 | | | | .25 | | | | 3.72 | | | | 3.97 | | | | (.29 | ) | | | (.50 | ) | | | (.79 | ) | | | 20.78 | | | | 22.88 | | | | 4,311 | | | | .79 | | | | 1.29 | |
| 12/31/2018 | | | 21.63 | | | | .29 | | | | (2.95 | ) | | | (2.66 | ) | | | (.35 | ) | | | (1.02 | ) | | | (1.37 | ) | | | 17.60 | | | | (13.13 | ) | | | 3,875 | | | | .78 | | | | 1.40 | |
| 12/31/2017 | | | 16.76 | | | | .22 | | | | 5.13 | | | | 5.35 | | | | (.25 | ) | | | (.23 | ) | | | (.48 | ) | | | 21.63 | | | | 32.14 | | | | 4,422 | | | | .78 | | | | 1.10 | |
| 12/31/2016 | | | 18.02 | | | | .23 | | | | .30 | | | | .53 | | | | (.24 | ) | | | (1.55 | ) | | | (1.79 | ) | | | 16.76 | | | | 3.53 | | | | 3,710 | | | | .79 | | | | 1.35 | |
| Class 3: | | | | | | | | | | | | | | | | | | | | | | | | | | | | | | | | | | | | | | | | | | | | | | | | |
| 12/31/2020 | | | 20.92 | | | | .10 | | | | 2.81 | | | | 2.91 | | | | (.14 | ) | | | — | | | | (.14 | ) | | | 23.69 | | | | 14.00 | | | | 25 | | | | .73 | | | | .53 | |
| 12/31/2019 | | | 17.70 | | | | .27 | | | | 3.75 | | | | 4.02 | | | | (.30 | ) | | | (.50 | ) | | | (.80 | ) | | | 20.92 | | | | 23.05 | | | | 25 | | | | .72 | | | | 1.37 | |
| 12/31/2018 | | | 21.75 | | | | .31 | | | | (2.98 | ) | | | (2.67 | ) | | | (.36 | ) | | | (1.02 | ) | | | (1.38 | ) | | | 17.70 | | | | (13.10 | ) | | | 24 | | | | .71 | | | | 1.48 | |
| 12/31/2017 | | | 16.85 | | | | .23 | | | | 5.17 | | | | 5.40 | | | | (.27 | ) | | | (.23 | ) | | | (.50 | ) | | | 21.75 | | | | 32.23 | | | | 31 | | | | .71 | | | | 1.17 | |
| 12/31/2016 | | | 18.11 | | | | .24 | | | | .30 | | | | .54 | | | | (.25 | ) | | | (1.55 | ) | | | (1.80 | ) | | | 16.85 | | | | 3.57 | | | | 27 | | | | .72 | | | | 1.42 | |
| Class 4: | | | | | | | | | | | | | | | | | | | | | | | | | | | | | | | | | | | | | | | | | | | | | | | | |
| 12/31/2020 | | | 20.54 | | | | .04 | | | | 2.76 | | | | 2.80 | | | | (.09 | ) | | | — | | | | (.09 | ) | | | 23.25 | | | | 13.66 | | | | 423 | | | | 1.05 | | | | .21 | |
| 12/31/2019 | | | 17.40 | | | | .20 | | | | 3.69 | | | | 3.89 | | | | (.25 | ) | | | (.50 | ) | | | (.75 | ) | | | 20.54 | | | | 22.67 | | | | 379 | | | | 1.04 | | | | 1.03 | |
| 12/31/2018 | | | 21.42 | | | | .23 | | | | (2.93 | ) | | | (2.70 | ) | | | (.30 | ) | | | (1.02 | ) | | | (1.32 | ) | | | 17.40 | | | | (13.41 | ) | | | 295 | | | | 1.03 | | | | 1.13 | |
| 12/31/2017 | | | 16.64 | | | | .11 | | | | 5.16 | | | | 5.27 | | | | (.26 | ) | | | (.23 | ) | | | (.49 | ) | | | 21.42 | | | | 31.89 | | | | 289 | | | | 1.03 | | | | .55 | |
| 12/31/2016 | | | 17.93 | | | | .18 | | | | .29 | | | | .47 | | | | (.21 | ) | | | (1.55 | ) | | | (1.76 | ) | | | 16.64 | | | | 3.21 | | | | 66 | | | | 1.04 | | | | 1.03 | |
See end of tables for footnotes.
| 318 | American Funds Insurance Series |
Financial highlights (continued)
| | | | | | Income (loss) from
investment operations1 | | | Dividends and distributions | | | | | | | | | | | | | | | | | | | |
| Period ended | | Net asset
value,
beginning
of period | | | Net
investment
income
(loss) | | | Net gains
(losses) on
securities
(both
realized and
unrealized) | | | Total from
investment
operations | | | Dividends
(from net
investment
income) | | | Distributions
(from capital
gains) | | | Total
dividends
and
distributions | | | Net asset
value,
end
of period | | | Total
return10 | | | Net assets,
end of period
(in millions) | | | Ratio of
expenses to
average net
assets before
waivers2 | | | Ratio of
expenses to
average net
assets after
waivers2,10 | | | Ratio of
net income
(loss)
to average
net assets10 | |
| | | | | | | | | | | | | | | | | | | | | | | | | | | | | | | | | | | | | | | | |
| New World Fund |
| |
| Class 1: | | | | | | | | | | | | | | | | | | | | | | | | | | | | | | | | | | | | | | | | | | | | | | | | | | | | |
| 12/31/2020 | | $ | 25.84 | | | $ | .15 | | | $ | 5.93 | | | $ | 6.08 | | | $ | (.06 | ) | | $ | (.27 | ) | | $ | (.33 | ) | | $ | 31.59 | | | | 23.89 | % | | $ | 2,309 | | | | .76 | % | | | .64 | % | | | .58 | % |
| 12/31/2019 | | | 20.98 | | | | .28 | | | | 5.79 | | | | 6.07 | | | | (.29 | ) | | | (.92 | ) | | | (1.21 | ) | | | 25.84 | | | | 29.47 | | | | 2,129 | | | | .76 | | | | .76 | | | | 1.18 | |
| 12/31/2018 | | | 25.30 | | | | .27 | | | | (3.65 | ) | | | (3.38 | ) | | | (.27 | ) | | | (.67 | ) | | | (.94 | ) | | | 20.98 | | | | (13.83 | ) | | | 1,702 | | | | .77 | | | | .77 | | | | 1.11 | |
| 12/31/2017 | | | 19.72 | | | | .26 | | | | 5.59 | | | | 5.85 | | | | (.27 | ) | | | — | | | | (.27 | ) | | | 25.30 | | | | 29.73 | | | | 2,050 | | | | .77 | | | | .77 | | | | 1.14 | |
| 12/31/2016 | | | 18.87 | | | | .24 | | | | .81 | | | | 1.05 | | | | (.20 | ) | | | — | | | | (.20 | ) | | | 19.72 | | | | 5.59 | | | | 1,743 | | | | .78 | | | | .78 | | | | 1.25 | |
| Class 1A: | | | | | | | | | | | | | | | | | | | | | | | | | | | | | | | | | | | | | | | | | | | | | | | | | | | | |
| 12/31/2020 | | | 25.74 | | | | .07 | | | | 5.92 | | | | 5.99 | | | | (.03 | ) | | | (.27 | ) | | | (.30 | ) | | | 31.43 | | | | 23.63 | | | | 18 | | | | 1.01 | | | | .87 | | | | .26 | |
| 12/31/2019 | | | 20.92 | | | | .22 | | | | 5.76 | | | | 5.98 | | | | (.24 | ) | | | (.92 | ) | | | (1.16 | ) | | | 25.74 | | | | 29.11 | | | | 4 | | | | 1.01 | | | | 1.01 | | | | .92 | |
| 12/31/2018 | | | 25.25 | | | | .21 | | | | (3.64 | ) | | | (3.43 | ) | | | (.23 | ) | | | (.67 | ) | | | (.90 | ) | | | 20.92 | | | | (14.02 | ) | | | 2 | | | | 1.02 | | | | 1.02 | | | | .91 | |
| 12/31/20173,4 | | | 20.14 | | | | .13 | | | | 5.24 | | | | 5.37 | | | | (.26 | ) | | | — | | | | (.26 | ) | | | 25.25 | | | | 26.72 | 5 | | | 1 | | | | 1.00 | 6 | | | 1.00 | 6 | | | .53 | 6 |
| Class 2: | | | | | | | | | | | | | | | | | | | | | | | | | | | | | | | | | | | | | | | | | | | | | | | | | | | | |
| 12/31/2020 | | | 25.59 | | | | .08 | | | | 5.87 | | | | 5.95 | | | | (.02 | ) | | | (.27 | ) | | | (.29 | ) | | | 31.25 | | | | 23.58 | | | | 1,109 | | | | 1.01 | | | | .89 | | | | .34 | |
| 12/31/2019 | | | 20.79 | | | | .22 | | | | 5.73 | | | | 5.95 | | | | (.23 | ) | | | (.92 | ) | | | (1.15 | ) | | | 25.59 | | | | 29.15 | | | | 981 | | | | 1.01 | | | | 1.01 | | | | .93 | |
| 12/31/2018 | | | 25.07 | | | | .20 | | | | (3.61 | ) | | | (3.41 | ) | | | (.20 | ) | | | (.67 | ) | | | (.87 | ) | | | 20.79 | | | | (14.04 | ) | | | 843 | | | | 1.02 | | | | 1.02 | | | | .85 | |
| 12/31/2017 | | | 19.54 | | | | .20 | | | | 5.55 | | | | 5.75 | | | | (.22 | ) | | | — | | | | (.22 | ) | | | 25.07 | | | | 29.44 | | | | 1,055 | | | | 1.02 | | | | 1.02 | | | | .89 | |
| 12/31/2016 | | | 18.71 | | | | .19 | | | | .79 | | | | .98 | | | | (.15 | ) | | | — | | | | (.15 | ) | | | 19.54 | | | | 5.26 | | | | 911 | | | | 1.03 | | | | 1.03 | | | | 1.00 | |
| Class 4: | | | | | | | | | | | | | | | | | | | | | | | | | | | | | | | | | | | | | | | | | | | | | | | | | | | | |
| 12/31/2020 | | | 25.47 | | | | .02 | | | | 5.83 | | | | 5.85 | | | | (.01 | ) | | | (.27 | ) | | | (.28 | ) | | | 31.04 | | | | 23.29 | | | | 807 | | | | 1.26 | | | | 1.14 | | | | .08 | |
| 12/31/2019 | | | 20.71 | | | | .16 | | | | 5.70 | | | | 5.86 | | | | (.18 | ) | | | (.92 | ) | | | (1.10 | ) | | | 25.47 | | | | 28.82 | | | | 646 | | | | 1.26 | | | | 1.26 | | | | .67 | |
| 12/31/2018 | | | 24.99 | | | | .14 | | | | (3.59 | ) | | | (3.45 | ) | | | (.16 | ) | | | (.67 | ) | | | (.83 | ) | | | 20.71 | | | | (14.25 | ) | | | 464 | | | | 1.27 | | | | 1.27 | | | | .61 | |
| 12/31/2017 | | | 19.51 | | | | .14 | | | | 5.52 | | | | 5.66 | | | | (.18 | ) | | | — | | | | (.18 | ) | | | 24.99 | | | | 29.06 | | | | 427 | | | | 1.27 | | | | 1.27 | | | | .61 | |
| 12/31/2016 | | | 18.69 | | | | .14 | | | | .80 | | | | .94 | | | | (.12 | ) | | | — | | | | (.12 | ) | | | 19.51 | | | | 5.04 | | | | 240 | | | | 1.28 | | | | 1.28 | | | | .75 | |
See end of tables for footnotes.
| American Funds Insurance Series | 319 |
Financial highlights (continued)
| | | | | | Income (loss) from
investment operations1 | | | Dividends and distributions | | | | | | | | | | | | | | | | |
| Period ended | | Net asset
value,
beginning
of period | | | Net
investment
income
(loss) | | | Net gains
(losses) on
securities
(both
realized and
unrealized) | | | Total from
investment
operations | | | Dividends
(from net
investment
income) | | | Distributions
(from capital
gains) | | | Total
dividends
and
distributions | | | Net asset
value,
end
of period | | | Total
return | | | Net assets,
end of period
(in millions) | | | Ratio of
expenses
to average
net assets2 | | | Ratio of
net income
(loss)
to average
net assets | |
| | | | | | | | | | | | | | | | | | | | | | | | | | | | | | | | | | | | | |
| Blue Chip Income and Growth Fund |
| | | | | | | | | | | | | | | | | | | | | | | | | | | | | | | | | | | | | | | | | | | | | | | | | |
| Class 1: | | | | | | | | | | | | | | | | | | | | | | | | | | | | | | | | | | | | | | | | | | | | | | | | |
| 12/31/2020 | | $ | 13.56 | | | $ | .25 | | | $ | .95 | | | $ | 1.20 | | | $ | (.26 | ) | | $ | (.15 | ) | | $ | (.41 | ) | | $ | 14.35 | | | | 9.04 | % | | $ | 5,684 | | | | .43 | % | | | 2.00 | % |
| 12/31/2019 | | | 12.38 | | | | .30 | | | | 2.25 | | | | 2.55 | | | | (.30 | ) | | | (1.07 | ) | | | (1.37 | ) | | | 13.56 | | | | 21.66 | | | | 5,559 | | | | .42 | | | | 2.28 | |
| 12/31/2018 | | | 14.96 | | | | .31 | | | | (1.44 | ) | | | (1.13 | ) | | | (.31 | ) | | | (1.14 | ) | | | (1.45 | ) | | | 12.38 | | | | (8.45 | ) | | | 4,810 | | | | .41 | | | | 2.13 | |
| 12/31/2017 | | | 13.53 | | | | .32 | | | | 1.96 | | | | 2.28 | | | | (.32 | ) | | | (.53 | ) | | | (.85 | ) | | | 14.96 | | | | 17.30 | | | | 5,581 | | | | .41 | | | | 2.27 | |
| 12/31/2016 | | | 12.62 | | | | .31 | | | | 1.97 | | | | 2.28 | | | | (.29 | ) | | | (1.08 | ) | | | (1.37 | ) | | | 13.53 | | | | 19.06 | | | | 5,099 | | | | .41 | | | | 2.39 | |
| Class 1A: | | | | | | | | | | | | | | | | | | | | | | | | | | | | | | | | | | | | | | | | | | | | | | | | |
| 12/31/2020 | | | 13.51 | | | | .23 | | | | .93 | | | | 1.16 | | | | (.24 | ) | | | (.15 | ) | | | (.39 | ) | | | 14.28 | | | | 8.79 | | | | 25 | | | | .67 | | | | 1.78 | |
| 12/31/2019 | | | 12.35 | | | | .26 | | | | 2.24 | | | | 2.50 | | | | (.27 | ) | | | (1.07 | ) | | | (1.34 | ) | | | 13.51 | | | | 21.35 | | | | 9 | | | | .67 | | | | 2.03 | |
| 12/31/2018 | | | 14.94 | | | | .26 | | | | (1.42 | ) | | | (1.16 | ) | | | (.29 | ) | | | (1.14 | ) | | | (1.43 | ) | | | 12.35 | | | | (8.67 | ) | | | 3 | | | | .66 | | | | 1.84 | |
| 12/31/20173,4 | | | 13.75 | | | | .28 | | | | 1.75 | | | | 2.03 | | | | (.31 | ) | | | (.53 | ) | | | (.84 | ) | | | 14.94 | | | | 15.21 | 5 | | | 1 | | | | .65 | 6 | | | 2.01 | 6 |
| Class 2: | | | | | | | | | | | | | | | | | | | | | | | | | | | | | | | | | | | | | | | | | | | | | | | | |
| 12/31/2020 | | | 13.39 | | | | .22 | | | | .91 | | | | 1.13 | | | | (.22 | ) | | | (.15 | ) | | | (.37 | ) | | | 14.15 | | | | 8.68 | | | | 3,082 | | | | .68 | | | | 1.75 | |
| 12/31/2019 | | | 12.24 | | | | .26 | | | | 2.22 | | | | 2.48 | | | | (.26 | ) | | | (1.07 | ) | | | (1.33 | ) | | | 13.39 | | | | 21.38 | | | | 3,093 | | | | .67 | | | | 2.03 | |
| 12/31/2018 | | | 14.80 | | | | .27 | | | | (1.42 | ) | | | (1.15 | ) | | | (.27 | ) | | | (1.14 | ) | | | (1.41 | ) | | | 12.24 | | | | (8.66 | ) | | | 2,850 | | | | .66 | | | | 1.88 | |
| 12/31/2017 | | | 13.39 | | | | .28 | | | | 1.94 | | | | 2.22 | | | | (.28 | ) | | | (.53 | ) | | | (.81 | ) | | | 14.80 | | | | 17.04 | | | | 3,551 | | | | .66 | | | | 2.02 | |
| 12/31/2016 | | | 12.51 | | | | .28 | | | | 1.94 | | | | 2.22 | | | | (.26 | ) | | | (1.08 | ) | | | (1.34 | ) | | | 13.39 | | | | 18.70 | | | | 3,412 | | | | .66 | | | | 2.16 | |
| Class 4: | | | | | | | | | | | | | | | | | | | | | | | | | | | | | | | | | | | | | | | | | | | | | | | | |
| 12/31/2020 | | | 13.31 | | | | .19 | | | | .91 | | | | 1.10 | | | | (.20 | ) | | | (.15 | ) | | | (.35 | ) | | | 14.06 | | | | 8.47 | | | | 788 | | | | .93 | | | | 1.51 | |
| 12/31/2019 | | | 12.19 | | | | .23 | | | | 2.20 | | | | 2.43 | | | | (.24 | ) | | | (1.07 | ) | | | (1.31 | ) | | | 13.31 | | | | 21.03 | | | | 621 | | | | .92 | | | | 1.78 | |
| 12/31/2018 | | | 14.77 | | | | .23 | | | | (1.42 | ) | | | (1.19 | ) | | | (.25 | ) | | | (1.14 | ) | | | (1.39 | ) | | | 12.19 | | | | (8.92 | ) | | | 368 | | | | .91 | | | | 1.62 | |
| 12/31/2017 | | | 13.39 | | | | .25 | | | | 1.93 | | | | 2.18 | | | | (.27 | ) | | | (.53 | ) | | | (.80 | ) | | | 14.77 | | | | 16.70 | | | | 247 | | | | .91 | | | | 1.76 | |
| 12/31/2016 | | | 12.53 | | | | .24 | | | | 1.96 | | | | 2.20 | | | | (.26 | ) | | | (1.08 | ) | | | (1.34 | ) | | | 13.39 | | | | 18.49 | | | | 132 | | | | .91 | | | | 1.81 | |
| |
| Global Growth and Income Fund | | | | |
| |
| Class 1: | | | | | | | | | | | | | | | | | | | | | | | | | | | | | | | | | | | | | | | | | | | | | | | | |
| 12/31/2020 | | $ | 15.92 | | | $ | .22 | | | $ | 1.14 | | | $ | 1.36 | | | $ | (.23 | ) | | $ | (.38 | ) | | $ | (.61 | ) | | $ | 16.67 | | | | 9.03 | % | | $ | 657 | | | | .66 | % | | | 1.49 | % |
| 12/31/2019 | | | 13.02 | | | | .31 | | | | 3.67 | | | | 3.98 | | | | (.32 | ) | | | (.76 | ) | | | (1.08 | ) | | | 15.92 | | | | 31.39 | | | | 625 | | | | .65 | | | | 2.08 | |
| 12/31/2018 | | | 15.81 | | | | .29 | | | | (1.62 | ) | | | (1.33 | ) | | | (.28 | ) | | | (1.18 | ) | | | (1.46 | ) | | | 13.02 | | | | (9.36 | ) | | | 492 | | | | .63 | | | | 1.94 | |
| 12/31/2017 | | | 13.02 | | | | .35 | | | | 3.06 | | | | 3.41 | | | | (.36 | ) | | | (.26 | ) | | | (.62 | ) | | | 15.81 | | | | 26.40 | | | | 485 | | | | .63 | | | | 2.43 | |
| 12/31/2016 | | | 12.35 | | | | .28 | | | | .66 | | | | .94 | | | | (.27 | ) | | | — | | | | (.27 | ) | | | 13.02 | | | | 7.61 | | | | 571 | | | | .63 | | | | 2.18 | |
| Class 1A: | | | | | | | | | | | | | | | | | | | | | | | | | | | | | | | | | | | | | | | | | | | | | | | | |
| 12/31/2020 | | | 15.88 | | | | .18 | | | | 1.13 | | | | 1.31 | | | | (.19 | ) | | | (.38 | ) | | | (.57 | ) | | | 16.62 | | | | 8.78 | | | | 2 | | | | .90 | | | | 1.23 | |
| 12/31/2019 | | | 13.00 | | | | .26 | | | | 3.68 | | | | 3.94 | | | | (.30 | ) | | | (.76 | ) | | | (1.06 | ) | | | 15.88 | | | | 31.04 | | | | 2 | | | | .90 | | | | 1.77 | |
| 12/31/2018 | | | 15.81 | | | | .26 | | | | (1.63 | ) | | | (1.37 | ) | | | (.26 | ) | | | (1.18 | ) | | | (1.44 | ) | | | 13.00 | | | | (9.62 | ) | | | 1 | | | | .88 | | | | 1.74 | |
| 12/31/20173,4 | | | 13.21 | | | | .18 | | | | 3.03 | | | | 3.21 | | | | (.35 | ) | | | (.26 | ) | | | (.61 | ) | | | 15.81 | | | | 24.54 | 5 | | | — | 7 | | | .84 | 6 | | | 1.20 | 6 |
| Class 2: | | | | | | | | | | | | | | | | | | | | | | | | | | | | | | | | | | | | | | | | | | | | | | | | |
| 12/31/2020 | | | 15.89 | | | | .18 | | | | 1.13 | | | | 1.31 | | | | (.19 | ) | | | (.38 | ) | | | (.57 | ) | | | 16.63 | | | | 8.73 | | | | 1,349 | | | | .91 | | | | 1.23 | |
| 12/31/2019 | | | 12.99 | | | | .27 | | | | 3.68 | | | | 3.95 | | | | (.29 | ) | | | (.76 | ) | | | (1.05 | ) | | | 15.89 | | | | 31.14 | | | | 1,366 | | | | .90 | | | | 1.84 | |
| 12/31/2018 | | | 15.78 | | | | .26 | | | | (1.63 | ) | | | (1.37 | ) | | | (.24 | ) | | | (1.18 | ) | | | (1.42 | ) | | | 12.99 | | | | (9.63 | ) | | | 1,228 | | | | .88 | | | | 1.70 | |
| 12/31/2017 | | | 13.00 | | | | .31 | | | | 3.05 | | | | 3.36 | | | | (.32 | ) | | | (.26 | ) | | | (.58 | ) | | | 15.78 | | | | 26.06 | | | | 1,538 | | | | .88 | | | | 2.11 | |
| 12/31/2016 | | | 12.33 | | | | .25 | | | | .65 | | | | .90 | | | | (.23 | ) | | | — | | | | (.23 | ) | | | 13.00 | | | | 7.34 | | | | 1,405 | | | | .88 | | | | 1.98 | |
| Class 4: | | | | | | | | | | | | | | | | | | | | | | | | | | | | | | | | | | | | | | | | | | | | | | | | |
| 12/31/2020 | | | 15.63 | | | | .14 | | | | 1.12 | | | | 1.26 | | | | (.16 | ) | | | (.38 | ) | | | (.54 | ) | | | 16.35 | | | | 8.55 | | | | 166 | | | | 1.16 | | | | .97 | |
| 12/31/2019 | | | 12.81 | | | | .23 | | | | 3.61 | | | | 3.84 | | | | (.26 | ) | | | (.76 | ) | | | (1.02 | ) | | | 15.63 | | | | 30.73 | | | | 145 | | | | 1.15 | | | | 1.56 | |
| 12/31/2018 | | | 15.60 | | | | .21 | | | | (1.60 | ) | | | (1.39 | ) | | | (.22 | ) | | | (1.18 | ) | | | (1.40 | ) | | | 12.81 | | | | (9.89 | ) | | | 95 | | | | 1.13 | | | | 1.43 | |
| 12/31/2017 | | | 12.89 | | | | .22 | | | | 3.08 | | | | 3.30 | | | | (.33 | ) | | | (.26 | ) | | | (.59 | ) | | | 15.60 | | | | 25.83 | | | | 79 | | | | 1.14 | | | | 1.49 | |
| 12/31/2016 | | | 12.26 | | | | .21 | | | | .65 | | | | .86 | | | | (.23 | ) | | | — | | | | (.23 | ) | | | 12.89 | | | | 7.04 | | | | 16 | | | | 1.13 | | | | 1.63 | |
See end of tables for footnotes.
| 320 | American Funds Insurance Series |
Financial highlights (continued)
| | | | | | Income (loss) from
investment operations1 | | | Dividends and distributions | | | | | | | | | | | | | | | | |
| Period ended | | Net asset
value,
beginning
of period | | | Net
investment
income
(loss) | | | Net gains
(losses) on
securities
(both
realized and
unrealized) | | | Total from
investment
operations | | | Dividends
(from net
investment
income) | | | Distributions
(from capital
gains) | | | Total
dividends
and
distributions | | | Net asset
value,
end
of period | | | Total
return | | | Net assets,
end of period
(in millions) | | | Ratio of
expenses
to average
net assets2 | | | Ratio of
net income
(loss)
to average
net assets | |
| | | | | | | | | | | | | | | | | | | | | | | | | | | | | | | | | | | | | |
| Growth-Income Fund |
| |
| Class 1: | | | | | | | | | | | | | | | | | | | | | | | | | | | | | | | | | | | | | | | | | | | | | | | | |
| 12/31/2020 | | $ | 50.71 | | | $ | .75 | | | $ | 6.02 | | | $ | 6.77 | | | $ | (.80 | ) | | $ | (1.30 | ) | | $ | (2.10 | ) | | $ | 55.38 | | | | 13.81 | % | | $ | 22,903 | | | | .29 | % | | | 1.52 | % |
| 12/31/2019 | | | 45.39 | | | | 1.00 | | | | 10.40 | | | | 11.40 | | | | (.92 | ) | | | (5.16 | ) | | | (6.08 | ) | | | 50.71 | | | | 26.46 | | | | 21,057 | | | | .29 | | | | 2.05 | |
| 12/31/2018 | | | 50.22 | | | | .84 | | | | (1.25 | ) | | | (.41 | ) | | | (.84 | ) | | | (3.58 | ) | | | (4.42 | ) | | | 45.39 | | | | (1.55 | ) | | | 16,783 | | | | .28 | | | | 1.65 | |
| 12/31/2017 | | | 44.41 | | | | .81 | | | | 8.89 | | | | 9.70 | | | | (.78 | ) | | | (3.11 | ) | | | (3.89 | ) | | | 50.22 | | | | 22.68 | | | | 15,765 | | | | .28 | | | | 1.69 | |
| 12/31/2016 | | | 45.40 | | | | .79 | | | | 4.09 | | | | 4.88 | | | | (.75 | ) | | | (5.12 | ) | | | (5.87 | ) | | | 44.41 | | | | 11.80 | | | | 12,588 | | | | .29 | | | | 1.79 | |
| Class 1A: | | | | | | | | | | | | | | | | | | | | | | | | | | | | | | | | | | | | | | | | | | | | | | | | |
| 12/31/2020 | | | 50.54 | | | | .63 | | | | 5.99 | | | | 6.62 | | | | (.70 | ) | | | (1.30 | ) | | | (2.00 | ) | | | 55.16 | | | | 13.55 | | | | 16 | | | | .54 | | | | 1.28 | |
| 12/31/2019 | | | 45.28 | | | | .89 | | | | 10.36 | | | | 11.25 | | | | (.83 | ) | | | (5.16 | ) | | | (5.99 | ) | | | 50.54 | | | | 26.14 | | | | 11 | | | | .54 | | | | 1.82 | |
| 12/31/2018 | | | 50.15 | | | | .72 | | | | (1.25 | ) | | | (.53 | ) | | | (.76 | ) | | | (3.58 | ) | | | (4.34 | ) | | | 45.28 | | | | (1.78 | ) | | | 7 | | | | .53 | | | | 1.43 | |
| 12/31/20173,4 | | | 45.39 | | | | .67 | | | | 7.96 | | | | 8.63 | | | | (.76 | ) | | | (3.11 | ) | | | (3.87 | ) | | | 50.15 | | | | 19.83 | 5 | | | 2 | | | | .52 | 6 | | | 1.41 | 6 |
| Class 2: | | | | | | | | | | | | | | | | | | | | | | | | | | | | | | | | | | | | | | | | | | | | | | | | |
| 12/31/2020 | | | 50.08 | | | | .62 | | | | 5.93 | | | | 6.55 | | | | (.67 | ) | | | (1.30 | ) | | | (1.97 | ) | | | 54.66 | | | | 13.54 | | | | 14,012 | | | | .54 | | | | 1.27 | |
| 12/31/2019 | | | 44.90 | | | | .87 | | | | 10.27 | | | | 11.14 | | | | (.80 | ) | | | (5.16 | ) | | | (5.96 | ) | | | 50.08 | | | | 26.14 | | | | 13,586 | | | | .53 | | | | 1.80 | |
| 12/31/2018 | | | 49.71 | | | | .71 | | | | (1.23 | ) | | | (.52 | ) | | | (.71 | ) | | | (3.58 | ) | | | (4.29 | ) | | | 44.90 | | | | (1.79 | ) | | | 12,035 | | | | .53 | | | | 1.40 | |
| 12/31/2017 | | | 44.00 | | | | .68 | | | | 8.80 | | | | 9.48 | | | | (.66 | ) | | | (3.11 | ) | | | (3.77 | ) | | | 49.71 | | | | 22.38 | | | | 13,930 | | | | .53 | | | | 1.45 | |
| 12/31/2016 | | | 45.04 | | | | .67 | | | | 4.05 | | | | 4.72 | | | | (.64 | ) | | | (5.12 | ) | | | (5.76 | ) | | | 44.00 | | | | 11.51 | | | | 12,854 | | | | .54 | | | | 1.54 | |
| Class 3: | | | | | | | | | | | | | | | | | | | | | | | | | | | | | | | | | | | | | | | | | | | | | | | | |
| 12/31/2020 | | | 50.81 | | | | .66 | | | | 6.02 | | | | 6.68 | | | | (.70 | ) | | | (1.30 | ) | | | (2.00 | ) | | | 55.49 | | | | 13.60 | | | | 154 | | | | .47 | | | | 1.34 | |
| 12/31/2019 | | | 45.47 | | | | .91 | | | | 10.43 | | | | 11.34 | | | | (.84 | ) | | | (5.16 | ) | | | (6.00 | ) | | | 50.81 | | | | 26.24 | | | | 156 | | | | .46 | | | | 1.87 | |
| 12/31/2018 | | | 50.29 | | | | .75 | | | | (1.25 | ) | | | (.50 | ) | | | (.74 | ) | | | (3.58 | ) | | | (4.32 | ) | | | 45.47 | | | | (1.72 | ) | | | 140 | | | | .46 | | | | 1.47 | |
| 12/31/2017 | | | 44.47 | | | | .72 | | | | 8.90 | | | | 9.62 | | | | (.69 | ) | | | (3.11 | ) | | | (3.80 | ) | | | 50.29 | | | | 22.47 | | | | 168 | | | | .46 | | | | 1.52 | |
| 12/31/2016 | | | 45.46 | | | | .71 | | | | 4.09 | | | | 4.80 | | | | (.67 | ) | | | (5.12 | ) | | | (5.79 | ) | | | 44.47 | | | | 11.59 | | | | 156 | | | | .47 | | | | 1.61 | |
| Class 4: | | | | | | | | | | | | | | | | | | | | | | | | | | | | | | | | | | | | | | | | | | | | | | | | |
| 12/31/2020 | | | 49.52 | | | | .49 | | | | 5.85 | | | | 6.34 | | | | (.57 | ) | | | (1.30 | ) | | | (1.87 | ) | | | 53.99 | | | | 13.25 | | | | 1,407 | | | | .79 | | | | 1.02 | |
| 12/31/2019 | | | 44.47 | | | | .74 | | | | 10.18 | | | | 10.92 | | | | (.71 | ) | | | (5.16 | ) | | | (5.87 | ) | | | 49.52 | | | | 25.86 | | | | 1,216 | | | | .79 | | | | 1.56 | |
| 12/31/2018 | | | 49.31 | | | | .58 | | | | (1.23 | ) | | | (.65 | ) | | | (.61 | ) | | | (3.58 | ) | | | (4.19 | ) | | | 44.47 | | | | (2.05 | ) | | | 899 | | | | .78 | | | | 1.15 | |
| 12/31/2017 | | | 43.73 | | | | .56 | | | | 8.73 | | | | 9.29 | | | | (.60 | ) | | | (3.11 | ) | | | (3.71 | ) | | | 49.31 | | | | 22.08 | | | | 827 | | | | .78 | | | | 1.19 | |
| 12/31/2016 | | | 44.82 | | | | .56 | | | | 4.02 | | | | 4.58 | | | | (.55 | ) | | | (5.12 | ) | | | (5.67 | ) | | | 43.73 | | | | 11.25 | | | | 495 | | | | .79 | | | | 1.29 | |
See end of tables for footnotes.
| American Funds Insurance Series | 321 |
Financial highlights (continued)
| | | | | | Income (loss) from
investment operations1 | | | Dividends and distributions | | | | | | | | | | | | | | | | |
| Period ended | | Net asset
value,
beginning
of period | | | Net
investment
income
(loss) | | | Net gains
(losses) on
securities
(both
realized and
unrealized) | | | Total from
investment
operations | | | Dividends
(from net
investment
income) | | | Distributions
(from capital
gains) | | | Total
dividends
and
distributions | | | Net asset
value,
end
of period | | | Total
return | | | Net assets,
end of period
(in millions) | | | Ratio of
expenses
to average
net assets2 | | | Ratio of
net income
(loss)
to average
net assets | |
| | | | | | | | | | | | | | | | | | | | | | | | | | | | | | | | | | | | | |
| International Growth and Income Fund |
| | | | | | | | | | | | | | | | | | | | | | | | | | | | | | | | | | | | | | | | | | | | | | | | | |
| Class 1: | | | | | | | | | | | | | | | | | | | | | | | | | | | | | | | | | | | | | | | | | | | | | | | | |
| 12/31/2020 | | $ | 18.18 | | | $ | .27 | | | $ | .85 | | | $ | 1.12 | | | $ | (.29 | ) | | $ | — | | | $ | (.29 | ) | | $ | 19.01 | | | | 6.24 | % | | $ | 1,120 | | | | .68 | % | | | 1.70 | % |
| 12/31/2019 | | | 15.35 | | | | .46 | | | | 3.03 | | | | 3.49 | | | | (.47 | ) | | | (.19 | ) | | | (.66 | ) | | | 18.18 | | | | 23.06 | | | | 1,140 | | | | .66 | | | | 2.73 | |
| 12/31/2018 | | | 17.72 | | | | .45 | | | | (2.39 | ) | | | (1.94 | ) | | | (.43 | ) | | | — | | | | (.43 | ) | | | 15.35 | | | | (11.00 | ) | | | 1,034 | | | | .65 | | | | 2.62 | |
| 12/31/2017 | | | 14.48 | | | | .46 | | | | 3.20 | | | | 3.66 | | | | (.42 | ) | | | — | | | | (.42 | ) | | | 17.72 | | | | 25.31 | | | | 1,121 | | | | .66 | | | | 2.75 | |
| 12/31/2016 | | | 14.72 | | | | .43 | | | | (.19 | ) | | | .24 | | | | (.42 | ) | | | (.06 | ) | | | (.48 | ) | | | 14.48 | | | | 1.71 | | | | 820 | | | | .68 | | | | 2.93 | |
| Class 1A: | | | | | | | | | | | | | | | | | | | | | | | | | | | | | | | | | | | | | | | | | | | | | | | | |
| 12/31/2020 | | | 18.15 | | | | .22 | | | | .85 | | | | 1.07 | | | | (.25 | ) | | | — | | | | (.25 | ) | | | 18.97 | | | | 5.98 | | | | 3 | | | | .93 | | | | 1.38 | |
| 12/31/2019 | | | 15.33 | | | | .41 | | | | 3.04 | | | | 3.45 | | | | (.44 | ) | | | (.19 | ) | | | (.63 | ) | | | 18.15 | | | | 22.76 | | | | 2 | | | | .91 | | | | 2.41 | |
| 12/31/2018 | | | 17.70 | | | | .41 | | | | (2.39 | ) | | | (1.98 | ) | | | (.39 | ) | | | — | | | | (.39 | ) | | | 15.33 | | | | (11.24 | ) | | | 2 | | | | .90 | | | | 2.35 | |
| 12/31/20173,4 | | | 14.69 | | | | .34 | | | | 3.08 | | | | 3.42 | | | | (.41 | ) | | | — | | | | (.41 | ) | | | 17.70 | | | | 23.36 | 5 | | | 2 | | | | .91 | 6 | | | 1.99 | 6 |
| Class 2: | | | | | | | | | | | | | | | | | | | | | | | | | | | | | | | | | | | | | | | | | | | | | | | | |
| 12/31/2020 | | | 18.12 | | | | .23 | | | | .85 | | | | 1.08 | | | | (.25 | ) | | | — | | | | (.25 | ) | | | 18.95 | | | | 6.01 | | | | 221 | | | | .93 | | | | 1.43 | |
| 12/31/2019 | | | 15.30 | | | | .42 | | | | 3.02 | | | | 3.44 | | | | (.43 | ) | | | (.19 | ) | | | (.62 | ) | | | 18.12 | | | | 22.76 | | | | 257 | | | | .91 | | | | 2.49 | |
| 12/31/2018 | | | 17.66 | | | | .41 | | | | (2.38 | ) | | | (1.97 | ) | | | (.39 | ) | | | — | | | | (.39 | ) | | | 15.30 | | | | (11.23 | ) | | | 230 | | | | .90 | | | | 2.38 | |
| 12/31/2017 | | | 14.43 | | | | .43 | | | | 3.17 | | | | 3.60 | | | | (.37 | ) | | | — | | | | (.37 | ) | | | 17.66 | | | | 25.03 | | | | 276 | | | | .91 | | | | 2.60 | |
| 12/31/2016 | | | 14.68 | | | | .40 | | | | (.21 | ) | | | .19 | | | | (.38 | ) | | | (.06 | ) | | | (.44 | ) | | | 14.43 | | | | 1.44 | | | | 244 | | | | .93 | | | | 2.72 | |
| Class 4: | | | | | | | | | | | | | | | | | | | | | | | | | | | | | | | | | | | | | | | | | | | | | | | | |
| 12/31/2020 | | | 18.01 | | | | .19 | | | | .83 | | | | 1.02 | | | | (.21 | ) | | | — | | | | (.21 | ) | | | 18.82 | | | | 5.73 | | | | 112 | | | | 1.18 | | | | 1.19 | |
| 12/31/2019 | | | 15.22 | | | | .37 | | | | 3.01 | | | | 3.38 | | | | (.40 | ) | | | (.19 | ) | | | (.59 | ) | | | 18.01 | | | | 22.47 | | | | 101 | | | | 1.16 | | | | 2.18 | |
| 12/31/2018 | | | 17.58 | | | | .36 | | | | (2.36 | ) | | | (2.00 | ) | | | (.36 | ) | | | — | | | | (.36 | ) | | | 15.22 | | | | (11.46 | ) | | | 71 | | | | 1.15 | | | | 2.10 | |
| 12/31/2017 | | | 14.38 | | | | .37 | | | | 3.18 | | | | 3.55 | | | | (.35 | ) | | | — | | | | (.35 | ) | | | 17.58 | | | | 24.72 | | | | 63 | | | | 1.16 | | | | 2.24 | |
| 12/31/2016 | | | 14.63 | | | | .36 | | | | (.19 | ) | | | .17 | | | | (.36 | ) | | | (.06 | ) | | | (.42 | ) | | | 14.38 | | | | 1.18 | | | | 37 | | | | 1.18 | | | | 2.43 | |
See end of tables for footnotes.
| 322 | American Funds Insurance Series |
Financial highlights (continued)
| | | | | | Income (loss) from
investment operations1 | | | Dividends and distributions | | | | | | | | | | | | | | | | | | | |
| Period ended | | Net asset
value,
beginning
of period | | | Net
investment
income
(loss) | | | Net gains
(losses) on
securities
(both
realized and
unrealized) | | | Total from
investment
operations | | | Dividends
(from net
investment
income) | | | Distributions
(from capital
gains) | | | Total
dividends
and
distributions | | | Net asset
value,
end
of period | | | Total
return10 | | | Net assets,
end of period
(in millions) | | | Ratio of
expenses to
average net
assets before
waivers2 | | | Ratio of
expenses to
average net
assets after
waivers2,10 | | | Ratio of
net income
(loss)
to average
net assets10 | |
| | | | | | | | | | | | | | | | | | | | | | | | | | | | | | | | | | | | | | | | |
| Capital Income Builder |
| |
| Class 1: | | | | | | | | | | | | | | | | | | | | | | | | | | | | | | | | | | | | | | | | | | | | | | | | | | | | |
| 12/31/2020 | | $ | 10.73 | | | $ | .31 | | | $ | .15 | | | $ | .46 | | | $ | (.32 | ) | | $ | — | | | $ | (.32 | ) | | $ | 10.87 | | | | 4.64 | % | | $ | 621 | | | | .53 | % | | | .35 | % | | | 3.07 | % |
| 12/31/2019 | | | 9.37 | | | | .32 | | | | 1.36 | | | | 1.68 | | | | (.32 | ) | | | — | | | | (.32 | ) | | | 10.73 | | | | 18.16 | | | | 533 | | | | .53 | | | | .53 | | | | 3.17 | |
| 12/31/2018 | | | 10.40 | | | | .31 | | | | (1.00 | ) | | | (.69 | ) | | | (.32 | ) | | | (.02 | ) | | | (.34 | ) | | | 9.37 | | | | (6.77 | ) | | | 317 | | | | .54 | | | | .54 | | | | 3.08 | |
| 12/31/2017 | | | 9.46 | | | | .32 | | | | .93 | | | | 1.25 | | | | (.31 | ) | | | — | | | | (.31 | ) | | | 10.40 | | | | 13.29 | | | | 254 | | | | .54 | | | | .54 | | | | 3.21 | |
| 12/31/2016 | | | 9.40 | | | | .32 | | | | .07 | | | | .39 | | | | (.33 | ) | | | — | | | | (.33 | ) | | | 9.46 | | | | 4.17 | | | | 156 | | | | .54 | | | | .54 | | | | 3.39 | |
|
| Class 1A: | | | | | | | | | | | | | | | | | | | | | | | | | | | | | | | | | | | | | | | | | | | | | | | | | | | | |
| 12/31/2020 | | | 10.72 | | | | .28 | | | | .16 | | | | .44 | | | | (.30 | ) | | | — | | | | (.30 | ) | | | 10.86 | | | | 4.38 | | | | 6 | | | | .78 | | | | .60 | | | | 2.81 | |
| 12/31/2019 | | | 9.36 | | | | .29 | | | | 1.37 | | | | 1.66 | | | | (.30 | ) | | | — | | | | (.30 | ) | | | 10.72 | | | | 17.90 | | | | 6 | | | | .78 | | | | .78 | | | | 2.84 | |
| 12/31/2018 | | | 10.39 | | | | .28 | | | | (.99 | ) | | | (.71 | ) | | | (.30 | ) | | | (.02 | ) | | | (.32 | ) | | | 9.36 | | | | (7.01 | ) | | | 2 | | | | .79 | | | | .79 | | | | 2.82 | |
| 12/31/20173,4 | | | 9.57 | | | | .27 | | | | .84 | | | | 1.11 | | | | (.29 | ) | | | — | | | | (.29 | ) | | | 10.39 | | | | 11.72 | 5 | | | 1 | | | | .79 | 6 | | | .79 | 6 | | | 2.63 | 6 |
| Class 2: | | | | | | | | | | | | | | | | | | | | | | | | | | | | | | | | | | | | | | | | | | | | | | | | | | | | |
| 12/31/2020 | | | 10.72 | | | | .29 | | | | .16 | | | | .45 | | | | (.30 | ) | | | — | | | | (.30 | ) | | | 10.87 | | | | 4.48 | | | | 8 | | | | .78 | | | | .60 | | | | 2.83 | |
| 12/31/2019 | | | 9.36 | | | | .30 | | | | 1.35 | | | | 1.65 | | | | (.29 | ) | | | — | | | | (.29 | ) | | | 10.72 | | | | 17.89 | | | | 6 | | | | .78 | | | | .78 | | | | 2.91 | |
| 12/31/2018 | | | 10.40 | | | | .28 | | | | (1.00 | ) | | | (.72 | ) | | | (.30 | ) | | | (.02 | ) | | | (.32 | ) | | | 9.36 | | | | (7.08 | ) | | | 4 | | | | .79 | | | | .79 | | | | 2.83 | |
| 12/31/2017 | | | 9.46 | | | | .29 | | | | .93 | | | | 1.22 | | | | (.28 | ) | | | — | | | | (.28 | ) | | | 10.40 | | | | 13.04 | | | | 1 | | | | .79 | | | | .79 | | | | 2.82 | |
| 12/31/2016 | | | 9.40 | | | | .27 | | | | .11 | | | | .38 | | | | (.32 | ) | | | — | | | | (.32 | ) | | | 9.46 | | | | 4.08 | | | | — | 7 | | | .80 | | | | .80 | | | | 2.82 | |
| Class 4: | | | | | | | | | | | | | | | | | | | | | | | | | | | | | | | | | | | | | | | | | | | | | | | | | | | | |
| 12/31/2020 | | | 10.71 | | | | .26 | | | | .15 | | | | .41 | | | | (.27 | ) | | | — | | | | (.27 | ) | | | 10.85 | | | | 4.11 | | | | 462 | | | | 1.03 | | | | .85 | | | | 2.55 | |
| 12/31/2019 | | | 9.35 | | | | .27 | | | | 1.36 | | | | 1.63 | | | | (.27 | ) | | | — | | | | (.27 | ) | | | 10.71 | | | | 17.62 | | | | 454 | | | | 1.03 | | | | 1.03 | | | | 2.68 | |
| 12/31/2018 | | | 10.38 | | | | .26 | | | | (1.00 | ) | | | (.74 | ) | | | (.27 | ) | | | (.02 | ) | | | (.29 | ) | | | 9.35 | | | | (7.25 | ) | | | 352 | | | | 1.04 | | | | 1.04 | | | | 2.58 | |
| 12/31/2017 | | | 9.45 | | | | .27 | | | | .92 | | | | 1.19 | | | | (.26 | ) | | | — | | | | (.26 | ) | | | 10.38 | | | | 12.65 | | | | 338 | | | | 1.04 | | | | 1.04 | | | | 2.72 | |
| 12/31/2016 | | | 9.38 | | | | .27 | | | | .08 | | | | .35 | | | | (.28 | ) | | | — | | | | (.28 | ) | | | 9.45 | | | | 3.78 | | | | 256 | | | | 1.04 | | | | 1.04 | | | | 2.88 | |
See end of tables for footnotes.
| American Funds Insurance Series | 323 |
Financial highlights (continued)
| | | | | | Income (loss) from
investment operations1 | | | Dividends and distributions | | | | | | | | | | | | | | | | |
| Period ended | | Net asset
value,
beginning
of period | | | Net
investment
income
(loss) | | | Net gains
(losses) on
securities
(both
realized and
unrealized) | | | Total from
investment
operations | | | Dividends
(from net
investment
income) | | | Distributions
(from capital
gains) | | | Total
dividends
and
distributions | | | Net asset
value,
end
of period | | | Total
return | | | Net assets,
end of period
(in millions) | | | Ratio of
expenses
to average
net assets2 | | | Ratio of
net income
(loss)
to average
net assets | |
| | | | | | | | | | | | | | | | | | | | | | | | | | | | | | | | | | | | | |
| Asset Allocation Fund |
| |
| Class 1: | | | | | | | | | | | | | | | | | | | | | | | | | | | | | | | | | | | | | | | | | | | | | | | | |
| 12/31/2020 | | $ | 24.05 | | | $ | .43 | | | $ | 2.59 | | | $ | 3.02 | | | $ | (.46 | ) | | $ | (.11 | ) | | $ | (.57 | ) | | $ | 26.50 | | | | 12.71 | % | | $ | 19,238 | | | | .30 | % | | | 1.80 | % |
| 12/31/2019 | | | 21.29 | | | | .51 | | | | 3.94 | | | | 4.45 | | | | (.50 | ) | | | (1.19 | ) | | | (1.69 | ) | | | 24.05 | | | | 21.54 | | | | 17,730 | | | | .29 | | | | 2.21 | |
| 12/31/2018 | | | 23.71 | | | | .48 | | | | (1.43 | ) | | | (.95 | ) | | | (.44 | ) | | | (1.03 | ) | | | (1.47 | ) | | | 21.29 | | | | (4.35 | ) | | | 14,627 | | | | .28 | | | | 2.04 | |
| 12/31/2017 | | | 21.68 | | | | .44 | | | | 3.06 | | | | 3.50 | | | | (.41 | ) | | | (1.06 | ) | | | (1.47 | ) | | | 23.71 | | | | 16.51 | | | | 16,556 | | | | .29 | | | | 1.90 | |
| 12/31/2016 | | | 20.62 | | | | .42 | | | | 1.54 | | | | 1.96 | | | | (.39 | ) | | | (.51 | ) | | | (.90 | ) | | | 21.68 | | | | 9.69 | | | | 13,008 | | | | .29 | | | | 1.97 | |
| Class 1A: | | | | | | | | | | | | | | | | | | | | | | | | | | | | | | | | | | | | | | | | | | | | | | | | |
| 12/31/2020 | | | 23.99 | | | | .37 | | | | 2.58 | | | | 2.95 | | | | (.41 | ) | | | (.11 | ) | | | (.52 | ) | | | 26.42 | | | | 12.43 | | | | 14 | | | | .55 | | | | 1.56 | |
| 12/31/2019 | | | 21.26 | | | | .45 | | | | 3.92 | | | | 4.37 | | | | (.45 | ) | | | (1.19 | ) | | | (1.64 | ) | | | 23.99 | | | | 21.19 | | | | 11 | | | | .54 | | | | 1.95 | |
| 12/31/2018 | | | 23.69 | | | | .42 | | | | (1.42 | ) | | | (1.00 | ) | | | (.40 | ) | | | (1.03 | ) | | | (1.43 | ) | | | 21.26 | | | | (4.58 | ) | | | 7 | | | | .53 | | | | 1.82 | |
| 12/31/20173,4 | | | 21.97 | | | | .39 | | | | 2.78 | | | | 3.17 | | | | (.39 | ) | | | (1.06 | ) | | | (1.45 | ) | | | 23.69 | | | | 14.78 | 5 | | | 4 | | | | .53 | 6 | | | 1.69 | 6 |
| Class 2: | | | | | | | | | | | | | | | | | | | | | | | | | | | | | | | | | | | | | | | | | | | | | | | | |
| 12/31/2020 | | | 23.79 | | | | .37 | | | | 2.56 | | | | 2.93 | | | | (.40 | ) | | | (.11 | ) | | | (.51 | ) | | | 26.21 | | | | 12.46 | | | | 5,242 | | | | .55 | | | | 1.55 | |
| 12/31/2019 | | | 21.08 | | | | .45 | | | | 3.89 | | | | 4.34 | | | | (.44 | ) | | | (1.19 | ) | | | (1.63 | ) | | | 23.79 | | | | 21.23 | | | | 5,154 | | | | .54 | | | | 1.96 | |
| 12/31/2018 | | | 23.49 | | | | .41 | | | | (1.41 | ) | | | (1.00 | ) | | | (.38 | ) | | | (1.03 | ) | | | (1.41 | ) | | | 21.08 | | | | (4.60 | ) | | | 4,668 | | | | .53 | | | | 1.78 | |
| 12/31/2017 | | | 21.49 | | | | .37 | | | | 3.04 | | | | 3.41 | | | | (.35 | ) | | | (1.06 | ) | | | (1.41 | ) | | | 23.49 | | | | 16.23 | | | | 5,480 | | | | .54 | | | | 1.64 | |
| 12/31/2016 | | | 20.45 | | | | .36 | | | | 1.53 | | | | 1.89 | | | | (.34 | ) | | | (.51 | ) | | | (.85 | ) | | | 21.49 | | | | 9.41 | | | | 5,144 | | | | .54 | | | | 1.72 | |
| Class 3: | | | | | | | | | | | | | | | | | | | | | | | | | | | | | | | | | | | | | | | | | | | | | | | | |
| 12/31/2020 | | | 24.08 | | | | .39 | | | | 2.59 | | | | 2.98 | | | | (.42 | ) | | | (.11 | ) | | | (.53 | ) | | | 26.53 | | | | 12.50 | | | | 33 | | | | .48 | | | | 1.62 | |
| 12/31/2019 | | | 21.32 | | | | .47 | | | | 3.93 | | | | 4.40 | | | | (.45 | ) | | | (1.19 | ) | | | (1.64 | ) | | | 24.08 | | | | 21.30 | | | | 32 | | | | .47 | | | | 2.02 | |
| 12/31/2018 | | | 23.73 | | | | .43 | | | | (1.41 | ) | | | (.98 | ) | | | (.40 | ) | | | (1.03 | ) | | | (1.43 | ) | | | 21.32 | | | | (4.49 | ) | | | 29 | | | | .46 | | | | 1.85 | |
| 12/31/2017 | | | 21.70 | | | | .39 | | | | 3.07 | | | | 3.46 | | | | (.37 | ) | | | (1.06 | ) | | | (1.43 | ) | | | 23.73 | | | | 16.29 | | | | 38 | | | | .47 | | | | 1.72 | |
| 12/31/2016 | | | 20.64 | | | | .38 | | | | 1.54 | | | | 1.92 | | | | (.35 | ) | | | (.51 | ) | | | (.86 | ) | | | 21.70 | | | | 9.49 | | | | 35 | | | | .47 | | | | 1.79 | |
| Class 4: | | | | | | | | | | | | | | | | | | | | | | | | | | | | | | | | | | | | | | | | | | | | | | | | |
| 12/31/2020 | | | 23.67 | | | | .31 | | | | 2.54 | | | | 2.85 | | | | (.35 | ) | | | (.11 | ) | | | (.46 | ) | | | 26.06 | | | | 12.16 | | | | 5,131 | | | | .80 | | | | 1.30 | |
| 12/31/2019 | | | 20.99 | | | | .39 | | | | 3.87 | | | | 4.26 | | | | (.39 | ) | | | (1.19 | ) | | | (1.58 | ) | | | 23.67 | | | | 20.92 | | | | 4,493 | | | | .79 | | | | 1.71 | |
| 12/31/2018 | | | 23.40 | | | | .35 | | | | (1.40 | ) | | | (1.05 | ) | | | (.33 | ) | | | (1.03 | ) | | | (1.36 | ) | | | 20.99 | | | | (4.83 | ) | | | 3,594 | | | | .78 | | | | 1.54 | |
| 12/31/2017 | | | 21.43 | | | | .32 | | | | 3.02 | | | | 3.34 | | | | (.31 | ) | | | (1.06 | ) | | | (1.37 | ) | | | 23.40 | | | | 15.91 | | | | 3,582 | | | | .79 | | | | 1.40 | |
| 12/31/2016 | | | 20.40 | | | | .31 | | | | 1.53 | | | | 1.84 | | | | (.30 | ) | | | (.51 | ) | | | (.81 | ) | | | 21.43 | | | | 9.16 | | | | 2,861 | | | | .79 | | | | 1.47 | |
See end of tables for footnotes.
| 324 | American Funds Insurance Series |
Financial highlights (continued)
| | | | | | Income (loss) from
investment operations1 | | | Dividends and distributions | | | | | | | | | | | | | | | | |
| Period ended | | Net asset
value,
beginning
of period | | | Net
investment
income
(loss) | | | Net gains
(losses) on
securities
(both
realized and
unrealized) | | | Total from
investment
operations | | | Dividends
(from net
investment
income) | | | Distributions
(from capital
gains) | | | Total
dividends
and
distributions | | | Net asset
value,
end
of period | | | Total
return | | | Net assets,
end of period
(in millions) | | | Ratio of
expenses
to average
net assets2 | | | Ratio of
net income
(loss)
to average
net assets | |
| | | | | | | | | | | | | | | | | | | | | | | | | | | | | | | | | | | | | | | | | | | | | | | | | |
| Global Balanced Fund | | | | | | | | | | | | | | | | | | | | | | | | | | | | |
| |
| Class 1: | | | | | | | | | | | | | | | | | | | | | | | | | | | | | | | | | | | | | | | | | | | | | | | | |
| 12/31/2020 | | $ | 13.51 | | | $ | .17 | | | $ | 1.24 | | | $ | 1.41 | | | $ | (.19 | ) | | $ | (.54 | ) | | $ | (.73 | ) | | $ | 14.19 | | | | 10.53 | % | | $ | 139 | | | | .72 | % | | | 1.29 | % |
| 12/31/2019 | | | 11.67 | | | | .24 | | | | 2.17 | | | | 2.41 | | | | (.20 | ) | | | (.37 | ) | | | (.57 | ) | | | 13.51 | | | | 20.79 | | | | 134 | | | | .72 | | | | 1.88 | |
| 12/31/2018 | | | 12.75 | | | | .23 | | | | (.96 | ) | | | (.73 | ) | | | (.20 | ) | | | (.15 | ) | | | (.35 | ) | | | 11.67 | | | | (5.81 | ) | | | 110 | | | | .72 | | | | 1.82 | |
| 12/31/2017 | | | 11.08 | | | | .21 | | | | 1.99 | | | | 2.20 | | | | (.15 | ) | | | (.38 | ) | | | (.53 | ) | | | 12.75 | | | | 19.91 | | | | 93 | | | | .72 | | | | 1.68 | |
| 12/31/2016 | | | 10.74 | | | | .19 | | | | .32 | | | | .51 | | | | (.17 | ) | | | — | | | | (.17 | ) | | | 11.08 | | | | 4.73 | | | | 64 | | | | .72 | | | | 1.73 | |
| Class 1A: | | | | | | | | | | | | | | | | | | | | | | | | | | | | | | | | | | | | | | | | | | | | | | | | |
| 12/31/2020 | | | 13.49 | | | | .14 | | | | 1.23 | | | | 1.37 | | | | (.16 | ) | | | (.54 | ) | | | (.70 | ) | | | 14.16 | | | | 10.25 | | | | 3 | | | | .97 | | | | 1.03 | |
| 12/31/2019 | | | 11.65 | | | | .21 | | | | 2.17 | | | | 2.38 | | | | (.17 | ) | | | (.37 | ) | | | (.54 | ) | | | 13.49 | | | | 20.54 | | | | 2 | | | | .97 | | | | 1.63 | |
| 12/31/2018 | | | 12.74 | | | | .18 | | | | (.94 | ) | | | (.76 | ) | | | (.18 | ) | | | (.15 | ) | | | (.33 | ) | | | 11.65 | | | | (6.03 | ) | | | 2 | | | | .98 | | | | 1.44 | |
| 12/31/20173,4 | | | 11.18 | | | | .16 | | | | 1.92 | | | | 2.08 | | | | (.14 | ) | | | (.38 | ) | | | (.52 | ) | | | 12.74 | | | | 18.71 | 5 | | | — | 7 | | | .94 | 6 | | | 1.27 | 6 |
| Class 2: | | | | | | | | | | | | | | | | | | | | | | | | | | | | | | | | | | | | | | | | | | | | | | | | |
| 12/31/2020 | | | 13.48 | | | | .14 | | | | 1.23 | | | | 1.37 | | | | (.15 | ) | | | (.54 | ) | | | (.69 | ) | | | 14.16 | | | | 10.30 | | | | 208 | | | | .97 | | | | 1.03 | |
| 12/31/2019 | | | 11.65 | | | | .21 | | | | 2.16 | | | | 2.37 | | | | (.17 | ) | | | (.37 | ) | | | (.54 | ) | | | 13.48 | | | | 20.44 | | | | 207 | | | | .97 | | | | 1.64 | |
| 12/31/2018 | | | 12.72 | | | | .20 | | | | (.96 | ) | | | (.76 | ) | | | (.16 | ) | | | (.15 | ) | | | (.31 | ) | | | 11.65 | | | | (6.01 | ) | | | 185 | | | | .97 | | | | 1.57 | |
| 12/31/2017 | | | 11.06 | | | | .18 | | | | 1.98 | | | | 2.16 | | | | (.12 | ) | | | (.38 | ) | | | (.50 | ) | | | 12.72 | | | | 19.57 | | | | 210 | | | | .96 | | | | 1.43 | |
| 12/31/2016 | | | 10.72 | | | | .16 | | | | .32 | | | | .48 | | | | (.14 | ) | | | — | | | | (.14 | ) | | | 11.06 | | | | 4.48 | | | | 178 | | | | .97 | | | | 1.48 | |
| Class 4: | | | | | | | | | | | | | | | | | | | | | | | | | | | | | | | | | | | | | | | | | | | | | | | | |
| 12/31/2020 | | | 13.36 | | | | .10 | | | | 1.22 | | | | 1.32 | | | | (.12 | ) | | | (.54 | ) | | | (.66 | ) | | | 14.02 | | | | 10.00 | | | | 105 | | | | 1.22 | | | | .78 | |
| 12/31/2019 | | | 11.55 | | | | .18 | | | | 2.14 | | | | 2.32 | | | | (.14 | ) | | | (.37 | ) | | | (.51 | ) | | | 13.36 | | | | 20.21 | | | | 94 | | | | 1.22 | | | | 1.37 | |
| 12/31/2018 | | | 12.63 | | | | .17 | | | | (.96 | ) | | | (.79 | ) | | | (.14 | ) | | | (.15 | ) | | | (.29 | ) | | | 11.55 | | | | (6.31 | ) | | | 69 | | | | 1.22 | | | | 1.34 | |
| 12/31/2017 | | | 11.00 | | | | .13 | | | | 1.99 | | | | 2.12 | | | | (.11 | ) | | | (.38 | ) | | | (.49 | ) | | | 12.63 | | | | 19.38 | | | | 51 | | | | 1.22 | | | | 1.07 | |
| 12/31/2016 | | | 10.69 | | | | .12 | | | | .33 | | | | .45 | | | | (.14 | ) | | | — | | | | (.14 | ) | | | 11.00 | | | | 4.21 | | | | 10 | | | | 1.24 | | | | 1.12 | |
| |
| Bond Fund | | | | | | | | | | | | | | | | | | | | | | | | | | | | | | | | | | | | | | | | | | | | | | | | |
| |
| Class 1: | | | | | | | | | | | | | | | | | | | | | | | | | | | | | | | | | | | | | | | | | | | | | | | | |
| 12/31/2020 | | $ | 11.17 | | | $ | .23 | | | $ | .87 | | | $ | 1.10 | | | $ | (.27 | ) | | $ | (.11 | ) | | $ | (.38 | ) | | $ | 11.89 | | | | 9.96 | % | | $ | 6,844 | | | | .40 | % | | | 2.00 | % |
| 12/31/2019 | | | 10.47 | | | | .30 | | | | .71 | | | | 1.01 | | | | (.31 | ) | | | — | | | | (.31 | ) | | | 11.17 | | | | 9.70 | | | | 6,481 | | | | .39 | | | | 2.76 | |
| 12/31/2018 | | | 10.82 | | | | .29 | | | | (.35 | ) | | | (.06 | ) | | | (.28 | ) | | | (.01 | ) | | | (.29 | ) | | | 10.47 | | | | (.45 | ) | | | 5,962 | | | | .38 | | | | 2.70 | |
| 12/31/2017 | | | 10.80 | | | | .24 | | | | .18 | | | | .42 | | | | (.24 | ) | | | (.16 | ) | | | (.40 | ) | | | 10.82 | | | | 3.88 | | | | 6,434 | | | | .38 | | | | 2.19 | |
| 12/31/2016 | | | 10.70 | | | | .21 | | | | .14 | | | | .35 | | | | (.21 | ) | | | (.04 | ) | | | (.25 | ) | | | 10.80 | | | | 3.27 | | | | 6,829 | | | | .38 | | | | 1.91 | |
| Class 1A: | | | | | | | | | | | | | | | | | | | | | | | | | | | | | | | | | | | | | | | | | | | | | | | | |
| 12/31/2020 | | | 11.13 | | | | .20 | | | | .87 | | | | 1.07 | | | | (.25 | ) | | | (.11 | ) | | | (.36 | ) | | | 11.84 | | | | 9.68 | | | | 9 | | | | .65 | | | | 1.74 | |
| 12/31/2019 | | | 10.45 | | | | .27 | | | | .71 | | | | .98 | | | | (.30 | ) | | | — | | | | (.30 | ) | | | 11.13 | | | | 9.36 | | | | 7 | | | | .64 | | | | 2.48 | |
| 12/31/2018 | | | 10.80 | | | | .26 | | | | (.33 | ) | | | (.07 | ) | | | (.27 | ) | | | (.01 | ) | | | (.28 | ) | | | 10.45 | | | | (.60 | ) | | | 3 | | | | .63 | | | | 2.50 | |
| 12/31/20173,4 | | | 10.82 | | | | .22 | | | | .15 | | | | .37 | | | | (.23 | ) | | | (.16 | ) | | | (.39 | ) | | | 10.80 | | | | 3.46 | 5 | | | 1 | | | | .62 | 6 | | | 2.01 | 6 |
| Class 2: | | | | | | | | | | | | | | | | | | | | | | | | | | | | | | | | | | | | | | | | | | | | | | | | |
| 12/31/2020 | | | 11.02 | | | | .20 | | | | .86 | | | | 1.06 | | | | (.24 | ) | | | (.11 | ) | | | (.35 | ) | | | 11.73 | | | | 9.73 | | | | 3,840 | | | | .65 | | | | 1.75 | |
| 12/31/2019 | | | 10.34 | | | | .27 | | | | .70 | | | | .97 | | | | (.29 | ) | | | — | | | | (.29 | ) | | | 11.02 | | | | 9.36 | | | | 3,561 | | | | .64 | | | | 2.51 | |
| 12/31/2018 | | | 10.69 | | | | .26 | | | | (.34 | ) | | | (.08 | ) | | | (.26 | ) | | | (.01 | ) | | | (.27 | ) | | | 10.34 | | | | (.71 | ) | | | 3,524 | | | | .63 | | | | 2.45 | |
| 12/31/2017 | | | 10.67 | | | | .21 | | | | .18 | | | | .39 | | | | (.21 | ) | | | (.16 | ) | | | (.37 | ) | | | 10.69 | | | | 3.67 | | | | 3,966 | | | | .63 | | | | 1.94 | |
| 12/31/2016 | | | 10.58 | | | | .18 | | | | .13 | | | | .31 | | | | (.18 | ) | | | (.04 | ) | | | (.22 | ) | | | 10.67 | | | | 2.95 | | | | 3,959 | | | | .63 | | | | 1.65 | |
| Class 4: | | | | | | | | | | | | | | | | | | | | | | | | | | | | | | | | | | | | | | | | | | | | | | | | |
| 12/31/2020 | | | 11.00 | | | | .17 | | | | .85 | | | | 1.02 | | | | (.22 | ) | | | (.11 | ) | | | (.33 | ) | | | 11.69 | | | | 9.38 | | | | 714 | | | | .90 | | | | 1.48 | |
| 12/31/2019 | | | 10.33 | | | | .24 | | | | .70 | | | | .94 | | | | (.27 | ) | | | — | | | | (.27 | ) | | | 11.00 | | | | 9.08 | | | | 502 | | | | .89 | | | | 2.25 | |
| 12/31/2018 | | | 10.68 | | | | .23 | | | | (.33 | ) | | | (.10 | ) | | | (.24 | ) | | | (.01 | ) | | | (.25 | ) | | | 10.33 | | | | (.89 | ) | | | 366 | | | | .88 | | | | 2.22 | |
| 12/31/2017 | | | 10.70 | | | | .19 | | | | .16 | | | | .35 | | | | (.21 | ) | | | (.16 | ) | | | (.37 | ) | | | 10.68 | | | | 3.29 | | | | 297 | | | | .88 | | | | 1.72 | |
| 12/31/2016 | | | 10.61 | | | | .15 | | | | .15 | | | | .30 | | | | (.17 | ) | | | (.04 | ) | | | (.21 | ) | | | 10.70 | | | | 2.80 | | | | 102 | | | | .88 | | | | 1.41 | |
See end of tables for footnotes.
| American Funds Insurance Series | 325 |
Financial highlights (continued)
| | | | | | Income (loss) from
investment operations1 | | | Dividends and distributions | | | | | | | | | | | | | | | | | | | |
| Period ended | | Net asset
value,
beginning
of period | | | Net
investment
income
(loss) | | | Net gains
(losses) on
securities
(both
realized and
unrealized) | | | Total from
investment
operations | | | Dividends
(from net
investment
income) | | | Distributions
(from capital
gains) | | | Total
dividends
and
distributions | | | Net asset
value,
end
of period | | | Total
return10 | | | Net assets,
end of period
(in millions) | | | Ratio of
expenses to
average net
assets before
waivers2 | | | Ratio of
expenses to
average net
assets after
waivers2,10 | | | Ratio of
net income
(loss)
to average
net assets10 | |
| | | | | | | | | | | | | | | | | | | | | | | | | | | | | | | | | | |
| Capital World Bond Fund | | | | | | | | | | | | | | | | | | | | | | | | | | | | | | | | |
| |
| Class 1: | | | | | | | | | | | | | | | | | | | | | | | | | | | | | | | | | | | | | | | | | | | | | | | | | | | | |
| 12/31/2020 | | $ | 12.12 | | | $ | .26 | | | $ | .95 | | | $ | 1.21 | | | $ | (.18 | ) | | $ | (.21 | ) | | $ | (.39 | ) | | $ | 12.94 | | | | 10.17 | % | | $ | 1,219 | | | | .59 | % | | | .52 | % | | | 2.08 | % |
| 12/31/2019 | | | 11.42 | | | | .31 | | | | .61 | | | | .92 | | | | (.22 | ) | | | — | | | | (.22 | ) | | | 12.12 | | | | 8.08 | | | | 1,077 | | | | .58 | | | | .58 | | | | 2.60 | |
| 12/31/2018 | | | 11.88 | | | | .30 | | | | (.44 | ) | | | (.14 | ) | | | (.28 | ) | | | (.04 | ) | | | (.32 | ) | | | 11.42 | | | | (1.14 | ) | | | 1,015 | | | | .57 | | | | .57 | | | | 2.56 | |
| 12/31/2017 | | | 11.22 | | | | .28 | | | | .52 | | | | .80 | | | | (.07 | ) | | | (.07 | ) | | | (.14 | ) | | | 11.88 | | | | 7.11 | | | | 1,273 | | | | .56 | | | | .56 | | | | 2.37 | |
| 12/31/2016 | | | 11.01 | | | | .26 | | | | .06 | | | | .32 | | | | (.09 | ) | | | (.02 | ) | | | (.11 | ) | | | 11.22 | | | | 2.92 | | | | 1,115 | | | | .57 | | | | .57 | | | | 2.26 | |
| Class 1A: | | | | | | | | | | | | | | | | | | | | | | | | | | | | | | | | | | | | | | | | | | | | | | | | | | | | |
| 12/31/2020 | | | 12.10 | | | | .23 | | | | .95 | | | | 1.18 | | | | (.16 | ) | | | (.21 | ) | | | (.37 | ) | | | 12.91 | | | | 9.89 | | | | 1 | | | | .83 | | | | .76 | | | | 1.83 | |
| 12/31/2019 | | | 11.41 | | | | .28 | | | | .60 | | | | .88 | | | | (.19 | ) | | | — | | | | (.19 | ) | | | 12.10 | | | | 7.75 | | | | 1 | | | | .83 | | | | .83 | | | | 2.35 | |
| 12/31/2018 | | | 11.87 | | | | .27 | | | | (.43 | ) | | | (.16 | ) | | | (.26 | ) | | | (.04 | ) | | | (.30 | ) | | | 11.41 | | | | (1.29 | ) | | | 1 | | | | .82 | | | | .82 | | | | 2.36 | |
| 12/31/20173,4 | | | 11.22 | | | | .26 | | | | .52 | | | | .78 | | | | (.06 | ) | | | (.07 | ) | | | (.13 | ) | | | 11.87 | | | | 7.00 | 5 | | | — | 7 | | | .72 | 6 | | | .72 | 6 | | | 2.27 | 6 |
| Class 2: | | | | | | | | | | | | | | | | | | | | | | | | | | | | | | | | | | | | | | | | | | | | | | | | | | | | |
| 12/31/2020 | | | 12.03 | | | | .22 | | | | .95 | | | | 1.17 | | | | (.15 | ) | | | (.21 | ) | | | (.36 | ) | | | 12.84 | | | | 9.90 | | | | 1,058 | | | | .84 | | | | .77 | | | | 1.83 | |
| 12/31/2019 | | | 11.34 | | | | .28 | | | | .60 | | | | .88 | | | | (.19 | ) | | | — | | | | (.19 | ) | | | 12.03 | | | | 7.77 | | | | 1,002 | | | | .83 | | | | .83 | | | | 2.35 | |
| 12/31/2018 | | | 11.79 | | | | .27 | | | | (.43 | ) | | | (.16 | ) | | | (.25 | ) | | | (.04 | ) | | | (.29 | ) | | | 11.34 | | | | (1.33 | ) | | | 1,032 | | | | .82 | | | | .82 | | | | 2.32 | |
| 12/31/2017 | | | 11.14 | | | | .25 | | | | .51 | | | | .76 | | | | (.04 | ) | | | (.07 | ) | | | (.11 | ) | | | 11.79 | | | | 6.86 | | | | 1,164 | | | | .81 | | | | .81 | | | | 2.12 | |
| 12/31/2016 | | | 10.93 | | | | .23 | | | | .07 | | | | .30 | | | | (.07 | ) | | | (.02 | ) | | | (.09 | ) | | | 11.14 | | | | 2.71 | | | | 1,121 | | | | .82 | | | | .82 | | | | 2.01 | |
| Class 4: | | | | | | | | | | | | | | | | | | | | | | | | | | | | | | | | | | | | | | | | | | | | | | | | | | | | |
| 12/31/2020 | | | 11.92 | | | | .19 | | | | .94 | | | | 1.13 | | | | (.13 | ) | | | (.21 | ) | | | (.34 | ) | | | 12.71 | | | | 9.62 | | | | 61 | | | | 1.09 | | | | 1.02 | | | | 1.58 | |
| 12/31/2019 | | | 11.24 | | | | .24 | | | | .60 | | | | .84 | | | | (.16 | ) | | | — | | | | (.16 | ) | | | 11.92 | | | | 7.54 | | | | 49 | | | | 1.08 | | | | 1.08 | | | | 2.09 | |
| 12/31/2018 | | | 11.70 | | | | .24 | | | | (.43 | ) | | | (.19 | ) | | | (.23 | ) | | | (.04 | ) | | | (.27 | ) | | | 11.24 | | | | (1.61 | ) | | | 40 | | | | 1.07 | | | | 1.07 | | | | 2.09 | |
| 12/31/2017 | | | 11.08 | | | | .22 | | | | .51 | | | | .73 | | | | (.04 | ) | | | (.07 | ) | | | (.11 | ) | | | 11.70 | | | | 6.63 | | | | 31 | | | | 1.06 | | | | 1.06 | | | | 1.89 | |
| 12/31/2016 | | | 10.89 | | | | .20 | | | | .06 | | | | .26 | | | | (.05 | ) | | | (.02 | ) | | | (.07 | ) | | | 11.08 | | | | 2.42 | | | | 12 | | | | 1.07 | | | | 1.07 | | | | 1.76 | |
See end of tables for footnotes.
| 326 | American Funds Insurance Series |
Financial highlights (continued)
| | | | | | Income (loss) from
investment operations1 | | | Dividends and distributions | | | | | | | | | | | | | | | | |
| Period ended | | Net asset
value,
beginning
of period | | | Net
investment
income
(loss) | | | Net gains
(losses) on
securities
(both
realized and
unrealized) | | | Total from
investment
operations | | | Dividends
(from net
investment
income) | | | Distributions
(from capital
gains) | | | Total
dividends
and
distributions | | | Net asset
value,
end
of period | | | Total
return | | | Net assets,
end of period
(in millions) | | | Ratio of
expenses
to average
net assets2 | | | Ratio of
net income
(loss)
to average
net assets | |
| | | | | | | | | | | | | | | | | | | | | | | | | | | | | | | | | | | | | | | | | | | | | | | | | |
| High-Income Bond Fund | | | | | | | | | | | | | | | | | | | | | | | | | | | | |
| |
| Class 1: | | | | | | | | | | | | | | | | | | | | | | | | | | | | | | | | | | | | | | | | | | | | | | | | |
| 12/31/2020 | | $ | 9.87 | | | $ | .61 | | | $ | .17 | | | $ | .78 | | | $ | (.85 | ) | | $ | — | | | $ | (.85 | ) | | $ | 9.80 | | | | 8.21 | % | | $ | 123 | | | | .52 | % | | | 6.46 | % |
| 12/31/2019 | | | 9.34 | | | | .67 | | | | .52 | | | | 1.19 | | | | (.66 | ) | | | — | | | | (.66 | ) | | | 9.87 | | | | 12.85 | | | | 525 | | | | .51 | | | | 6.71 | |
| 12/31/2018 | | | 10.19 | | | | .64 | | | | (.84 | ) | | | (.20 | ) | | | (.65 | ) | | | — | | | | (.65 | ) | | | 9.34 | | | | (2.15 | ) | | | 501 | | | | .50 | | | | 6.32 | |
| 12/31/2017 | | | 10.18 | | | | .63 | | | | .10 | | | | .73 | | | | (.72 | ) | | | — | | | | (.72 | ) | | | 10.19 | | | | 7.25 | | | | 632 | | | | .49 | | | | 5.98 | |
| 12/31/2016 | | | 9.19 | | | | .61 | | | | 1.02 | | | | 1.63 | | | | (.64 | ) | | | — | | | | (.64 | ) | | | 10.18 | | | | 17.83 | | | | 949 | | | | .49 | | | | 6.18 | |
|
| Class 1A: | | | | | | | | | | | | | | | | | | | | | | | | | | | | | | | | | | | | | | | | | | | | | | | | |
| 12/31/2020 | | | 9.86 | | | | .56 | | | | .20 | | | | .76 | | | | (.84 | ) | | | — | | | | (.84 | ) | | | 9.78 | | | | 7.94 | | | | 1 | | | | .78 | | | | 5.85 | |
| 12/31/2019 | | | 9.33 | | | | .65 | | | | .51 | | | | 1.16 | | | | (.63 | ) | | | — | | | | (.63 | ) | | | 9.86 | | | | 12.61 | | | | 1 | | | | .75 | | | | 6.47 | |
| 12/31/2018 | | | 10.18 | | | | .62 | | | | (.84 | ) | | | (.22 | ) | | | (.63 | ) | | | — | | | | (.63 | ) | | | 9.33 | | | | (2.35 | ) | | | 1 | | | | .75 | | | | 6.11 | |
| 12/31/20173,4 | | | 10.28 | | | | .60 | | | | .02 | | | | .62 | | | | (.72 | ) | | | — | | | | (.72 | ) | | | 10.18 | | | | 6.02 | 5 | | | — | 7 | | | .72 | 6 | | | 5.74 | 6 |
|
| Class 2: | | | | | | | | | | | | | | | | | | | | | | | | | | | | | | | | | | | | | | | | | | | | | | | | |
| 12/31/2020 | | | 9.70 | | | | .55 | | | | .19 | | | | .74 | | | | (.83 | ) | | | — | | | | (.83 | ) | | | 9.61 | | | | 7.94 | | | | 665 | | | | .78 | | | | 5.88 | |
| 12/31/2019 | | | 9.19 | | | | .64 | | | | .50 | | | | 1.14 | | | | (.63 | ) | | | — | | | | (.63 | ) | | | 9.70 | | | | 12.55 | | | | 667 | | | | .76 | | | | 6.45 | |
| 12/31/2018 | | | 10.03 | | | | .61 | | | | (.83 | ) | | | (.22 | ) | | | (.62 | ) | | | — | | | | (.62 | ) | | | 9.19 | | | | (2.34 | ) | | | 661 | | | | .75 | | | | 6.07 | |
| 12/31/2017 | | | 10.04 | | | | .59 | | | | .10 | | | | .69 | | | | (.70 | ) | | | — | | | | (.70 | ) | | | 10.03 | | | | 6.89 | | | | 776 | | | | .74 | | | | 5.72 | |
| 12/31/2016 | | | 9.06 | | | | .58 | | | | 1.01 | | | | 1.59 | | | | (.61 | ) | | | — | | | | (.61 | ) | | | 10.04 | | | | 17.69 | | | | 799 | | | | .74 | | | | 5.92 | |
|
| Class 3: | | | | | | | | | | | | | | | | | | | | | | | | | | | | | | | | | | | | | | | | | | | | | | | | |
| 12/31/2020 | | | 9.92 | | | | .57 | | | | .19 | | | | .76 | | | | (.84 | ) | | | — | | | | (.84 | ) | | | 9.84 | | | | 7.93 | | | | 10 | | | | .71 | | | | 5.94 | |
| 12/31/2019 | | | 9.38 | | | | .66 | | | | .52 | | | | 1.18 | | | | (.64 | ) | | | — | | | | (.64 | ) | | | 9.92 | | | | 12.70 | | | | 10 | | | | .69 | | | | 6.52 | |
| 12/31/2018 | | | 10.23 | | | | .63 | | | | (.85 | ) | | | (.22 | ) | | | (.63 | ) | | | — | | | | (.63 | ) | | | 9.38 | | | | (2.33 | ) | | | 10 | | | | .68 | | | | 6.14 | |
| 12/31/2017 | | | 10.22 | | | | .61 | | | | .10 | | | | .71 | | | | (.70 | ) | | | — | | | | (.70 | ) | | | 10.23 | | | | 7.02 | | | | 12 | | | | .67 | | | | 5.79 | |
| 12/31/2016 | | | 9.22 | | | | .59 | | | | 1.03 | | | | 1.62 | | | | (.62 | ) | | | — | | | | (.62 | ) | | | 10.22 | | | | 17.68 | | | | 13 | | | | .67 | | | | 5.99 | |
|
| Class 4: | | | | | | | | | | | | | | | | | | | | | | | | | | | | | | | | | | | | | | | | | | | | | | | | |
| 12/31/2020 | | | 10.56 | | | | .57 | | | | .22 | | | | .79 | | | | (.81 | ) | | | — | | | | (.81 | ) | | | 10.54 | | | | 7.74 | | | | 69 | | | | 1.03 | | | | 5.58 | |
| 12/31/2019 | | | 9.96 | | | | .67 | | | | .54 | | | | 1.21 | | | | (.61 | ) | | | — | | | | (.61 | ) | | | 10.56 | | | | 12.27 | | | | 63 | | | | 1.01 | | | | 6.21 | |
| 12/31/2018 | | | 10.82 | | | | .63 | | | | (.90 | ) | | | (.27 | ) | | | (.59 | ) | | | — | | | | (.59 | ) | | | 9.96 | | | | (2.64 | ) | | | 31 | | | | 1.00 | | | | 5.83 | |
| 12/31/2017 | | | 10.79 | | | | .61 | | | | .10 | | | | .71 | | | | (.68 | ) | | | — | | | | (.68 | ) | | | 10.82 | | | | 6.63 | | | | 34 | | | | .99 | | | | 5.46 | |
| 12/31/2016 | | | 9.73 | | | | .60 | | | | 1.07 | | | | 1.67 | | | | (.61 | ) | | | — | | | | (.61 | ) | | | 10.79 | | | | 17.29 | | | | 21 | | | | .99 | | | | 5.55 | |
See end of tables for footnotes.
| American Funds Insurance Series | 327 |
Financial highlights (continued)
| | | | | | Income (loss) from
investment operations1 | | | Dividends and distributions | | | | | | | | | | | | | | | | | | | |
| Period ended | | Net asset
value,
beginning
of period | | | Net
investment
income
(loss) | | | Net gains
(losses) on
securities
(both
realized and
unrealized) | | | Total from
investment
operations | | | Dividends
(from net
investment
income) | | | Distributions
(from capital
gains) | | | Total
dividends
and
distributions | | | Net asset
value,
end
of period | | | Total
return10 | | | Net assets,
end of period
(in millions) | | | Ratio of
expenses to
average net
assets before
waivers2 | | | Ratio of
expenses to
average net
assets after
waivers2,10 | | | Ratio of
net income
(loss)
to average
net assets10 | |
| | | | | | | | | | | | | | | | | | | | | | | | | | | | | | | | | | |
| American Funds Mortgage Fund | | | | | | | | | | | | | | | | | | | | | | | | | | | | | | | | | |
| |
| Class 1: | | | | | | | | | | | | | | | | | | | | | | | | | | | | | | | | | | | | | | | | | | | | | | | | | | | | |
| 12/31/2020 | | $ | 10.56 | | | $ | .10 | | | $ | .64 | | | $ | .74 | | | $ | (.17 | ) | | $ | (.02 | ) | | $ | (.19 | ) | | $ | 11.11 | | | | 6.98 | % | | $ | 224 | | | | .48 | % | | | .36 | % | | | .93 | % |
| 12/31/2019 | | | 10.30 | | | | .24 | | | | .30 | | | | .54 | | | | (.28 | ) | | | — | | | | (.28 | ) | | | 10.56 | | | | 5.30 | | | | 210 | | | | .47 | | | | .47 | | | | 2.26 | |
| 12/31/2018 | | | 10.47 | | | | .20 | | | | (.14 | ) | | | .06 | | | | (.23 | ) | | | — | | | | (.23 | ) | | | 10.30 | | | | .58 | | | | 209 | | | | .48 | | | | .48 | | | | 1.97 | |
| 12/31/2017 | | | 10.56 | | | | .16 | | | | — | 8 | | | .16 | | | | (.18 | ) | | | (.07 | ) | | | (.25 | ) | | | 10.47 | | | | 1.47 | | | | 265 | | | | .47 | | | | .47 | | | | 1.52 | |
| 12/31/2016 | | | 10.61 | | | | .15 | | | | .11 | | | | .26 | | | | (.20 | ) | | | (.11 | ) | | | (.31 | ) | | | 10.56 | | | | 2.50 | | | | 269 | | | | .46 | | | | .46 | | | | 1.39 | |
|
| Class 1A: | | | | | | | | | | | | | | | | | | | | | | | | | | | | | | | | | | | | | | | | | | | | | | | | | | | | |
| 12/31/2020 | | | 10.55 | | | | .07 | | | | .63 | | | | .70 | | | | (.15 | ) | | | (.02 | ) | | | (.17 | ) | | | 11.08 | | | | 6.63 | | | | 1 | | | | .73 | | | | .59 | | | | .61 | |
| 12/31/2019 | | | 10.28 | | | | .22 | | | | .30 | | | | .52 | | | | (.25 | ) | | | — | | | | (.25 | ) | | | 10.55 | | | | 5.09 | | | | 1 | | | | .71 | | | | .71 | | | | 2.04 | |
| 12/31/2018 | | | 10.46 | | | | .18 | | | | (.14 | ) | | | .04 | | | | (.22 | ) | | | — | | | | (.22 | ) | | | 10.28 | | | | .36 | | | | 1 | | | | .73 | | | | .73 | | | | 1.77 | |
| 12/31/20173,4 | | | 10.55 | | | | .14 | | | | — | 8 | | | .14 | | | | (.16 | ) | | | (.07 | ) | | | (.23 | ) | | | 10.46 | | | | 1.31 | 5 | | | — | 7 | | | .70 | 6 | | | .70 | 6 | | | 1.38 | 6 |
|
| Class 2: | | | | | | | | | | | | | | | | | | | | | | | | | | | | | | | | | | | | | | | | | | | | | | | | | | | | |
| 12/31/2020 | | | 10.54 | | | | .08 | | | | .63 | | | | .71 | | | | (.14 | ) | | | (.02 | ) | | | (.16 | ) | | | 11.09 | | | | 6.72 | | | | 58 | | | | .73 | | | | .60 | | | | .68 | |
| 12/31/2019 | | | 10.28 | | | | .21 | | | | .31 | | | | .52 | | | | (.26 | ) | | | — | | | | (.26 | ) | | | 10.54 | | | | 5.04 | | | | 56 | | | | .72 | | | | .72 | | | | 2.01 | |
| 12/31/2018 | | | 10.45 | | | | .18 | | | | (.15 | ) | | | .03 | | | | (.20 | ) | | | — | | | | (.20 | ) | | | 10.28 | | | | .32 | | | | 57 | | | | .73 | | | | .73 | | | | 1.72 | |
| 12/31/2017 | | | 10.54 | | | | .14 | | | | (.01 | ) | | | .13 | | | | (.15 | ) | | | (.07 | ) | | | (.22 | ) | | | 10.45 | | | | 1.22 | | | | 63 | | | | .72 | | | | .72 | | | | 1.27 | |
| 12/31/2016 | | | 10.59 | | | | .12 | | | | .12 | | | | .24 | | | | (.18 | ) | | | (.11 | ) | | | (.29 | ) | | | 10.54 | | | | 2.25 | | | | 63 | | | | .71 | | | | .71 | | | | 1.14 | |
|
| Class 4: | | | | | | | | | | | | | | | | | | | | | | | | | | | | | | | | | | | | | | | | | | | | | | | | | | | | |
| 12/31/2020 | | | 10.44 | | | | .04 | | | | .63 | | | | .67 | | | | (.12 | ) | | | (.02 | ) | | | (.14 | ) | | | 10.97 | | | | 6.38 | | | | 37 | | | | .98 | | | | .85 | | | | .41 | |
| 12/31/2019 | | | 10.19 | | | | .18 | | | | .31 | | | | .49 | | | | (.24 | ) | | | — | | | | (.24 | ) | | | 10.44 | | | | 4.80 | | | | 28 | | | | .97 | | | | .97 | | | | 1.71 | |
| 12/31/2018 | | | 10.38 | | | | .15 | | | | (.15 | ) | | | — | 8 | | | (.19 | ) | | | — | | | | (.19 | ) | | | 10.19 | | | | .07 | | | | 24 | | | | .98 | | | | .98 | | | | 1.49 | |
| 12/31/2017 | | | 10.48 | | | | .11 | | | | — | 8 | | | .11 | | | | (.14 | ) | | | (.07 | ) | | | (.21 | ) | | | 10.38 | | | | .97 | | | | 12 | | | | .97 | | | | .97 | | | | 1.03 | |
| 12/31/2016 | | | 10.52 | | | | .09 | | | | .12 | | | | .21 | | | | (.14 | ) | | | (.11 | ) | | | (.25 | ) | | | 10.48 | | | | 2.01 | | | | 8 | | | | .96 | | | | .96 | | | | .86 | |
See end of tables for footnotes.
| 328 | American Funds Insurance Series |
Financial highlights (continued)
| | | | | | Income (loss) from
investment operations1 | | | Dividends and distributions | | | | | | | | | | | | | | | | |
| Period ended | | Net asset
value,
beginning
of period | | | Net
investment
income
(loss) | | | Net gains
(losses) on
securities
(both
realized and
unrealized) | | | Total from
investment
operations | | | Dividends
(from net
investment
income) | | | Distributions
(from capital
gains) | | | Total
dividends
and
distributions | | | Net asset
value,
end
of period | | | Total
return | | | Net assets,
end of period
(in millions) | | | Ratio of
expenses
to average
net assets | | | Ratio of
net income
(loss)
to average
net assets | |
| | | | | | | | | | | | | | | | | | | | | | | | | | | | | | | | | | | | | | | | | | | | | | | | | |
| Ultra-Short Bond Fund | | | | | | | | | | | | | | | | | | | | | | | | | | | | |
| |
| Class 1: | | | | | | | | | | | | | | | | | | | | | | | | | | | | | | | | | | | | | | | | | | | | | | | | |
| 12/31/2020 | | $ | 11.30 | | | $ | .02 | | | $ | .02 | | | $ | .04 | | | $ | (.03 | ) | | | $— | | | $ | (.03 | ) | | $ | 11.31 | | | | .34 | % | | $ | 44 | | | | .37 | % | | | .16 | % |
| 12/31/2019 | | | 11.31 | | | | .22 | | | | — | 8 | | | .22 | | | | (.23 | ) | | | — | | | | (.23 | ) | | | 11.30 | | | | 1.92 | | | | 30 | | | | .36 | | | | 1.92 | |
| 12/31/2018 | | | 11.29 | | | | .18 | | | | — | 8 | | | .18 | | | | (.16 | ) | | | — | | | | (.16 | ) | | | 11.31 | | | | 1.58 | | | | 37 | | | | .35 | | | | 1.60 | |
| 12/31/2017 | | | 11.27 | | | | .08 | | | | (.01 | ) | | | .07 | | | | (.05 | ) | | | — | | | | (.05 | ) | | | 11.29 | | | | .66 | | | | 37 | | | | .35 | | | | .68 | |
| 12/31/201611 | | | 11.26 | | | | .01 | | | | — | 8 | | | .01 | | | | — | | | | — | | | | — | | | | 11.27 | | | | .09 | | | | 37 | | | | .35 | | | | .11 | |
| Class 1A: | | | | | | | | | | | | | | | | | | | | | | | | | | | | | | | | | | | | | | | | | | | | | | | | |
| 12/31/2020 | | | 11.30 | | | | .03 | | | | .01 | | | | .04 | | | | (.03 | ) | | | — | | | | (.03 | ) | | | 11.31 | | | | .32 | 12 | | | — | 7 | | | .35 | 12 | | | .26 | 12 |
| 12/31/2019 | | | 11.31 | | | | .22 | | | | — | 8 | | | .22 | | | | (.23 | ) | | | — | | | | (.23 | ) | | | 11.30 | | | | 1.92 | 12 | | | — | 7 | | | .37 | 12 | | | 1.90 | 12 |
| 12/31/2018 | | | 11.29 | | | | .18 | | | | — | 8 | | | .18 | | | | (.16 | ) | | | — | | | | (.16 | ) | | | 11.31 | | | | 1.58 | 12 | | | — | 7 | | | .35 | 12 | | | 1.60 | 12 |
| 12/31/20173,4 | | | 11.27 | | | | .08 | | | | — | 8 | | | .08 | | | | (.06 | ) | | | — | | | | (.06 | ) | | | 11.29 | | | | .67 | 5,12 | | | — | 7 | | | .34 | 6,12 | | | .69 | 6,12 |
| Class 2: | | | | | | | | | | | | | | | | | | | | | | | | | | | | | | | | | | | | | | | | | | | | | | | | |
| 12/31/2020 | | | 11.01 | | | | — | 8 | | | — | 8 | | | — | 8 | | | (.02 | ) | | | — | | | | (.02 | ) | | | 10.99 | | | | .03 | | | | 288 | | | | .62 | | | | (.05 | ) |
| 12/31/2019 | | | 11.03 | | | | .18 | | | | — | 8 | | | .18 | | | | (.20 | ) | | | — | | | | (.20 | ) | | | 11.01 | | | | 1.62 | | | | 230 | | | | .61 | | | | 1.66 | |
| 12/31/2018 | | | 11.01 | | | | .15 | | | | — | 8 | | | .15 | | | | (.13 | ) | | | — | | | | (.13 | ) | | | 11.03 | | | | 1.36 | | | | 247 | | | | .60 | | | | 1.34 | |
| 12/31/2017 | | | 10.99 | | | | .05 | | | | — | 8 | | | .05 | | | | (.03 | ) | | | — | | | | (.03 | ) | | | 11.01 | | | | .46 | | | | 249 | | | | .60 | | | | .42 | |
| 12/31/201611 | | | 11.01 | | | | (.02 | ) | | | — | 8 | | | (.02 | ) | | | — | | | | — | | | | — | | | | 10.99 | | | | (.18 | ) | | | 297 | | | | .60 | | | | (.14 | ) |
| Class 3: | | | | | | | | | | | | | | | | | | | | | | | | | | | | | | | | | | | | | | | | | | | | | | | | |
| 12/31/2020 | | | 11.13 | | | | — | 8 | | | .02 | | | | .02 | | | | (.03 | ) | | | — | | | | (.03 | ) | | | 11.12 | | | | .13 | | | | 4 | | | | .55 | | | | .03 | |
| 12/31/2019 | | | 11.14 | | | | .20 | | | | — | 8 | | | .20 | | | | (.21 | ) | | | — | | | | (.21 | ) | | | 11.13 | | | | 1.76 | | | | 3 | | | | .54 | | | | 1.74 | |
| 12/31/2018 | | | 11.12 | | | | .16 | | | | (.01 | ) | | | .15 | | | | (.13 | ) | | | — | | | | (.13 | ) | | | 11.14 | | | | 1.38 | | | | 4 | | | | .53 | | | | 1.42 | |
| 12/31/2017 | | | 11.10 | | | | .06 | | | | — | 8 | | | .06 | | | | (.04 | ) | | | — | | | | (.04 | ) | | | 11.12 | | | | .54 | | | | 4 | | | | .53 | | | | .50 | |
| 12/31/201611 | | | 11.11 | | | | (.01 | ) | | | — | 8 | | | (.01 | ) | | | — | | | | — | | | | — | | | | 11.10 | | | | (.09 | ) | | | 4 | | | | .53 | | | | (.08 | ) |
| Class 4: | | | | | | | | | | | | | | | | | | | | | | | | | | | | | | | | | | | | | | | | | | | | | | | | |
| 12/31/2020 | | | 11.13 | | | | (.04 | ) | | | .01 | | | | (.03 | ) | | | (.02 | ) | | | — | | | | (.02 | ) | | | 11.08 | | | | (.25 | ) | | | 40 | | | | .87 | | | | (.35 | ) |
| 12/31/2019 | | | 11.15 | | | | .16 | | | | — | 8 | | | .16 | | | | (.18 | ) | | | — | | | | (.18 | ) | | | 11.13 | | | | 1.40 | | | | 22 | | | | .86 | | | | 1.40 | |
| 12/31/2018 | | | 11.13 | | | | .12 | | | | .01 | | | | .13 | | | | (.11 | ) | | | — | | | | (.11 | ) | | | 11.15 | | | | 1.14 | | | | 18 | | | | .86 | | | | 1.11 | |
| 12/31/2017 | | | 11.12 | | | | .02 | | | | — | 8 | | | .02 | | | | (.01 | ) | | | — | | | | (.01 | ) | | | 11.13 | | | | .16 | | | | 15 | | | | .85 | | | | .19 | |
| 12/31/201611 | | | 11.17 | | | | (.04 | ) | | | (.01 | ) | | | (.05 | ) | | | — | | | | — | | | | — | | | | 11.12 | | | | (.45 | ) | | | 13 | | | | .85 | | | | (.40 | ) |
See end of tables for footnotes.
| American Funds Insurance Series | 329 |
Financial highlights (continued)
| | | | | | Income (loss) from
investment operations1 | | | Dividends and distributions | | | | | | | | | | | | | | | | |
| Period ended | | Net asset
value,
beginning
of period | | | Net
investment
income
(loss) | | | Net gains
(losses) on
securities
(both
realized and
unrealized) | | | Total from
investment
operations | | | Dividends
(from net
investment
income) | | | Distributions
(from capital
gains) | | | Total
dividends
and
distributions | | | Net asset
value,
end
of period | | | Total
return | | | Net assets,
end of period
(in millions) | | | Ratio of
expenses
to average
net assets | | | Ratio of
net income
(loss)
to average
net assets | |
| | | | | | | | | | | | | | | | | | | | | | | | | | | | | | | | | | | | | | | | | | | | | | | | | |
| U.S. Government/AAA-Rated Securities Fund | | | | | | | | | | | | | | | | | | | | | | | | | | | | |
| |
| Class 1: | | | | | | | | | | | | | | | | | | | | | | | | | | | | | | | | | | | | | | | | | | | | | | | | |
| 12/31/2020 | | $ | 12.34 | | | $ | .16 | | | $ | 1.07 | | | $ | 1.23 | | | $ | (.26 | ) | | $ | (.27 | ) | | $ | (.53 | ) | | $ | 13.04 | | | | 10.09 | % | | $ | 429 | | | | .38 | % | | | 1.21 | % |
| 12/31/2019 | | | 11.94 | | | | .25 | | | | .43 | | | | .68 | | | | (.28 | ) | | | — | | | | (.28 | ) | | | 12.34 | | | | 5.69 | | | | 1,418 | | | | .37 | | | | 2.07 | |
| 12/31/2018 | | | 12.08 | | | | .24 | | | | (.13 | ) | | | .11 | | | | (.25 | ) | | | — | | | | (.25 | ) | | | 11.94 | | | | .91 | | | | 1,445 | | | | .36 | | | | 2.02 | |
| 12/31/2017 | | | 12.05 | | | | .21 | | | | .01 | | | | .22 | | | | (.19 | ) | | | — | | | | (.19 | ) | | | 12.08 | | | | 1.83 | | | | 1,558 | | | | .36 | | | | 1.68 | |
| 12/31/2016 | | | 12.31 | | | | .16 | | | | .03 | | | | .19 | | | | (.20 | ) | | | (.25 | ) | | | (.45 | ) | | | 12.05 | | | | 1.44 | | | | 1,467 | | | | .36 | | | | 1.31 | |
| Class 1A: | | | | | | | | | | | | | | | | | | | | | | | | | | | | | | | | | | | | | | | | | | | | | | | | |
| 12/31/2020 | | | 12.32 | | | | .09 | | | | 1.10 | | | | 1.19 | | | | (.24 | ) | | | (.27 | ) | | | (.51 | ) | | | 13.00 | | | | 9.75 | | | | 4 | | | | .64 | | | | .69 | |
| 12/31/2019 | | | 11.93 | | | | .22 | | | | .43 | | | | .65 | | | | (.26 | ) | | | — | | | | (.26 | ) | | | 12.32 | | | | 5.42 | | | | 2 | | | | .62 | | | | 1.82 | |
| 12/31/2018 | | | 12.08 | | | | .22 | | | | (.14 | ) | | | .08 | | | | (.23 | ) | | | — | | | | (.23 | ) | | | 11.93 | | | | .70 | | | | 1 | | | | .61 | | | | 1.82 | |
| 12/31/20173,4 | | | 12.05 | | | | .18 | | | | .03 | | | | .21 | | | | (.18 | ) | | | — | | | | (.18 | ) | | | 12.08 | | | | 1.73 | 5 | | | — | 7 | | | .58 | 6 | | | 1.53 | 6 |
| Class 2: | | | | | | | | | | | | | | | | | | | | | | | | | | | | | | | | | | | | | | | | | | | | | | | | |
| 12/31/2020 | | | 12.21 | | | | .09 | | | | 1.10 | | | | 1.19 | | | | (.24 | ) | | | (.27 | ) | | | (.51 | ) | | | 12.89 | | | | 9.80 | | | | 1,439 | | | | .64 | | | | .73 | |
| 12/31/2019 | | | 11.82 | | | | .22 | | | | .42 | | | | .64 | | | | (.25 | ) | | | — | | | | (.25 | ) | | | 12.21 | | | | 5.31 | | | | 1,343 | | | | .62 | | | | 1.82 | |
| 12/31/2018 | | | 11.96 | | | | .21 | | | | (.14 | ) | | | .07 | | | | (.21 | ) | | | — | | | | (.21 | ) | | | 11.82 | | | | .73 | | | | 1,323 | | | | .61 | | | | 1.77 | |
| 12/31/2017 | | | 11.93 | | | | .17 | | | | .02 | | | | .19 | | | | (.16 | ) | | | — | | | | (.16 | ) | | | 11.96 | | | | 1.59 | | | | 1,473 | | | | .61 | | | | 1.43 | |
| 12/31/2016 | | | 12.20 | | | | .13 | | | | .02 | | | | .15 | | | | (.17 | ) | | | (.25 | ) | | | (.42 | ) | | | 11.93 | | | | 1.19 | | | | 1,503 | | | | .61 | | | | 1.05 | |
| Class 3: | | | | | | | | | | | | | | | | | | | | | | | | | | | | | | | | | | | | | | | | | | | | | | | | |
| 12/31/2020 | | | 12.37 | | | | .10 | | | | 1.12 | | | | 1.22 | | | | (.25 | ) | | | (.27 | ) | | | (.52 | ) | | | 13.07 | | | | 9.91 | | | | 10 | | | | .57 | | | | .78 | |
| 12/31/2019 | | | 11.97 | | | | .23 | | | | .43 | | | | .66 | | | | (.26 | ) | | | — | | | | (.26 | ) | | | 12.37 | | | | 5.49 | | | | 9 | | | | .55 | | | | 1.88 | |
| 12/31/2018 | | | 12.11 | | | | .22 | | | | (.14 | ) | | | .08 | | | | (.22 | ) | | | — | | | | (.22 | ) | | | 11.97 | | | | .71 | | | | 9 | | | | .54 | | | | 1.84 | |
| 12/31/2017 | | | 12.07 | | | | .18 | | | | .03 | | | | .21 | | | | (.17 | ) | | | — | | | | (.17 | ) | | | 12.11 | | | | 1.72 | | | | 10 | | | | .54 | | | | 1.50 | |
| 12/31/2016 | | | 12.34 | | | | .14 | | | | .02 | | | | .16 | | | | (.18 | ) | | | (.25 | ) | | | (.43 | ) | | | 12.07 | | | | 1.24 | | | | 11 | | | | .54 | | | | 1.12 | |
| Class 4: | | | | | | | | | | | | | | | | | | | | | | | | | | | | | | | | | | | | | | | | | | | | | | | | |
| 12/31/2020 | | | 12.22 | | | | .05 | | | | 1.10 | | | | 1.15 | | | | (.22 | ) | | | (.27 | ) | | | (.49 | ) | | | 12.88 | | | | 9.48 | | | | 272 | | | | .89 | | | | .42 | |
| 12/31/2019 | | | 11.84 | | | | .19 | | | | .42 | | | | .61 | | | | (.23 | ) | | | — | | | | (.23 | ) | | | 12.22 | | | | 5.14 | | | | 124 | | | | .87 | | | | 1.56 | |
| 12/31/2018 | | | 11.98 | | | | .18 | | | | (.12 | ) | | | .06 | | | | (.20 | ) | | | — | | | | (.20 | ) | | | 11.84 | | | | .50 | | | | 91 | | | | .86 | | | | 1.53 | |
| 12/31/2017 | | | 11.96 | | | | .14 | | | | .01 | | | | .15 | | | | (.13 | ) | | | — | | | | (.13 | ) | | | 11.98 | | | | 1.28 | | | | 62 | | | | .86 | | | | 1.18 | |
| 12/31/2016 | | | 12.22 | | | | .10 | | | | .03 | | | | .13 | | | | (.14 | ) | | | (.25 | ) | | | (.39 | ) | | | 11.96 | | | | .99 | | | | 57 | | | | .86 | | | | .82 | |
See end of tables for footnotes.
| 330 | American Funds Insurance Series |
Financial highlights (continued)
| | | | | | Income (loss) from investment operations1 | | | Dividends and distributions | | | | | | | | | | | | Ratio of
expenses | | | Ratio of
expenses | | | | | | | |
| Period ended | | Net asset
value,
beginning
of period | | | Net
investment
income
(loss) | | | Net gains
(losses) on
securities
(both
realized and
unrealized) | | | Total from
investment
operations | | | Dividends
(from net
investment
income) | | | Distribu-
tions
(from capital
gains) | | | Total
dividends
and
distribu-
tions | | | Net asset
value, end
of period | | | Total return10 | | | Net assets,
end of
period
(in millions) | | | to average
net assets
before
waivers/
reimburse-
ments13 | | | to average
net assets
after
waivers/
reimburse-
ments10,13 | | | Net
effective
expense
ratio10,14 | | | Ratio of
net income
(loss)
to average
net assets10 | |
| | | | | | | | | | | | | | | | | | | | | | | | | | | | | | | | | | | | | | | | | | | | | | | | | | | | | | | | | |
| Managed Risk Growth Fund | | | | | | | | | | | | | | | | | | | | | | | | | | | | | | | | | | | | |
| | | | | | | | | | | | | | | | | | | | | | | | | | | | | | | | | | | | | | | | | | | | | | | | | | | | | | | | | |
| Class P1: | | | | | | | | | | | | | | | | | | | | | | | | | | | | | | | | | | | | | | | | | | | | | | | | | | | | | | | | |
| 12/31/2020 | | $ | 13.78 | | | $ | .07 | | | $ | 4.20 | | | $ | 4.27 | | | $ | (.12 | ) | | $ | (.68 | ) | | $ | (.80 | ) | | $ | 17.25 | | | | 32.45 | % | | $ | 11 | | | | .42 | % | | | .37 | % | | | .72 | % | | | .49 | % |
| 12/31/2019 | | | 12.30 | | | | .15 | | | | 2.44 | | | | 2.59 | | | | (.19 | ) | | | (.92 | ) | | | (1.11 | ) | | | 13.78 | | | | 22.01 | | | | 6 | | | | .42 | | | | .37 | | | | .73 | | | | 1.19 | |
| 12/31/2018 | | | 13.22 | | | | .11 | | | | (.04 | ) | | | .07 | | | | (.10 | ) | | | (.89 | ) | | | (.99 | ) | | | 12.30 | | | | (.04 | )12 | | | 3 | | | | .42 | 12 | | | .37 | 12 | | | .71 | 12 | | | .82 | 12 |
| 12/31/2017 | | | 10.71 | | | | .08 | | | | 2.70 | | | | 2.78 | | | | (.07 | ) | | | (.20 | ) | | | (.27 | ) | | | 13.22 | | | | 26.23 | 12 | | | 2 | | | | .42 | 12 | | | .36 | 12 | | | .70 | 12 | | | .69 | 12 |
| 12/31/2016 | | | 11.49 | | | | .08 | | | | .20 | | | | .28 | | | | (.05 | ) | | | (1.01 | ) | | | (1.06 | ) | | | 10.71 | | | | 2.89 | 12 | | | 1 | | | | .50 | 12 | | | .34 | 12 | | | .68 | 12 | | | .79 | 12 |
| Class P2: | | | | | | | | | | | | | | | | | | | | | | | | | | | | | | | | | | | | | | | | | | | | | | | | | | | | | | | | |
| 12/31/2020 | | | 13.71 | | | | .03 | | | | 4.16 | | | | 4.19 | | | | (.11 | ) | | | (.68 | ) | | | (.79 | ) | | | 17.11 | | | | 32.03 | | | | 554 | | | | .67 | | | | .62 | | | | .97 | | | | .20 | |
| 12/31/2019 | | | 12.21 | | | | .09 | | | | 2.45 | | | | 2.54 | | | | (.12 | ) | | | (.92 | ) | | | (1.04 | ) | | | 13.71 | | | | 21.74 | | | | 434 | | | | .68 | | | | .63 | | | | .99 | | | | .73 | |
| 12/31/2018 | | | 13.14 | | | | .06 | | | | (.04 | ) | | | .02 | | | | (.06 | ) | | | (.89 | ) | | | (.95 | ) | | | 12.21 | | | | (.37 | ) | | | 340 | | | | .68 | | | | .63 | | | | .97 | | | | .46 | |
| 12/31/2017 | | | 10.64 | | | | .04 | | | | 2.70 | | | | 2.74 | | | | (.04 | ) | | | (.20 | ) | | | (.24 | ) | | | 13.14 | | | | 25.99 | | | | 286 | | | | .69 | | | | .63 | | | | .97 | | | | .34 | |
| 12/31/2016 | | | 11.43 | | | | .05 | | | | .19 | | | | .24 | | | | (.02 | ) | | | (1.01 | ) | | | (1.03 | ) | | | 10.64 | | | | 2.52 | | | | 200 | | | | .79 | | | | .63 | | | | .97 | | | | .43 | |
| | | | | | | | | | | | | | | | | | | | | | | | | | | | | | | | | | | | | | | | | | | | | | | | | | | | | | | | | |
| Managed Risk International Fund | | | | | | | | | | | | | | | | | | | | | | | | | | | | | | | | | | | | |
| |
| Class P1: | | | | | | | | | | | | | | | | | | | | | | | | | | | | | | | | | | | | | | | | | | | | | | | | | | | | | | | | |
| 12/31/2020 | | $ | 11.01 | | | $ | .08 | | | $ | .22 | | | $ | .30 | | | $ | (.16 | ) | | $ | (.08 | ) | | $ | (.24 | ) | | $ | 11.07 | | | | 3.13 | %12 | | $ | 2 | | | | .43 | %12 | | | .35 | %12 | | | .86 | %12 | | | .82 | %12 |
| 12/31/2019 | | | 9.82 | | | | .17 | | | | 1.54 | | | | 1.71 | | | | (.20 | ) | | | (.32 | ) | | | (.52 | ) | | | 11.01 | | | | 17.91 | 12 | | | 1 | | | | .41 | 12 | | | .33 | 12 | | | .84 | 12 | | | 1.64 | 12 |
| 12/31/2018 | | | 11.25 | | | | .32 | | | | (1.44 | ) | | | (1.12 | ) | | | (.26 | ) | | | (.05 | ) | | | (.31 | ) | | | 9.82 | | | | (10.11 | )12 | | | — | 7 | | | .33 | 12 | | | .28 | 12 | | | .77 | 12 | | | 3.02 | 12 |
| 12/31/2017 | | | 8.89 | | | | .11 | | | | 2.47 | | | | 2.58 | | | | (.10 | ) | | | (.12 | ) | | | (.22 | ) | | | 11.25 | | | | 29.28 | 12 | | | — | 7 | | | .28 | 12 | | | .20 | 12 | | | .69 | 12 | | | 1.13 | 12 |
| 12/31/2016 | | | 9.48 | | | | .10 | | | | (.35 | ) | | | (.25 | ) | | | (.12 | ) | | | (.22 | ) | | | (.34 | ) | | | 8.89 | | | | (2.59 | )12 | | | — | 7 | | | .39 | 12 | | | .23 | 12 | | | .74 | 12 | | | 1.15 | 12 |
| Class P2: | | | | | | | | | | | | | | | | | | | | | | | | | | | | | | | | | | | | | | | | | | | | | | | | | | | | | | | | |
| 12/31/2020 | | | 10.92 | | | | .04 | | | | .23 | | | | .27 | | | | (.12 | ) | | | (.08 | ) | | | (.20 | ) | | | 10.99 | | | | 2.80 | | | | 168 | | | | .71 | | | | .63 | | | | 1.14 | | | | .42 | |
| 12/31/2019 | | | 9.76 | | | | .13 | | | | 1.55 | | | | 1.68 | | | | (.20 | ) | | | (.32 | ) | | | (.52 | ) | | | 10.92 | | | | 17.64 | | | | 165 | | | | .71 | | | | .63 | | | | 1.14 | | | | 1.21 | |
| 12/31/2018 | | | 11.15 | | | | .16 | | | | (1.32 | ) | | | (1.16 | ) | | | (.18 | ) | | | (.05 | ) | | | (.23 | ) | | | 9.76 | | | | (10.50 | ) | | | 151 | | | | .69 | | | | .64 | | | | 1.13 | | | | 1.49 | |
| 12/31/2017 | | | 8.83 | | | | .11 | | | | 2.41 | | | | 2.52 | | | | (.08 | ) | | | (.12 | ) | | | (.20 | ) | | | 11.15 | | | | 28.69 | | | | 148 | | | | .71 | | | | .63 | | | | 1.12 | | | | 1.03 | |
| 12/31/2016 | | | 9.43 | | | | .09 | | | | (.38 | ) | | | (.29 | ) | | | (.09 | ) | | | (.22 | ) | | | (.31 | ) | | | 8.83 | | | | (3.05 | ) | | | 97 | | | | .79 | | | | .63 | | | | 1.14 | | | | .97 | |
| |
| Managed Risk Blue Chip Income and Growth Fund | | | | | | | | | | | | | | | | | | | | | | | | | | | | | | | | | | | | |
| | | | | | | | | | | | | | | | | | | | | | | | | | | | | | | | | | | | | | | | | | | | | | | | | | | | | | | | | |
| Class P1: | | | | | | | | | | | | | | | | | | | | | | | | | | | | | | | | | | | | | | | | | | | | | | | | | | | | | | | | |
| 12/31/2020 | | $ | 12.01 | | | $ | .18 | | | $ | (.35 | ) | | $ | (.17 | ) | | $ | (.26 | ) | | $ | (.34 | ) | | $ | (.60 | ) | | $ | 11.24 | | | | (.93 | )%12 | | $ | 2 | | | | .40 | %12 | | | .35 | %12 | | | .76 | %12 | | | 1.66 | %12 |
| 12/31/2019 | | | 11.28 | | | | .25 | | | | 1.28 | | | | 1.53 | | | | (.20 | ) | | | (.60 | ) | | | (.80 | ) | | | 12.01 | | | | 14.14 | 12 | | | 1 | | | | .38 | 12 | | | .33 | 12 | | | .74 | 12 | | | 2.14 | 12 |
| 12/31/2018 | | | 13.04 | | | | .40 | | | | (1.27 | ) | | | (.87 | ) | | | (.45 | ) | | | (.44 | ) | | | (.89 | ) | | | 11.28 | | | | (6.99 | )12 | | | — | 7 | | | .33 | 12 | | | .28 | 12 | | | .67 | 12 | | | 3.21 | 12 |
| 12/31/2017 | | | 11.67 | | | | .19 | | | | 1.59 | | | | 1.78 | | | | (.22 | ) | | | (.19 | ) | | | (.41 | ) | | | 13.04 | | | | 15.48 | 12 | | | — | 7 | | | .30 | 12 | | | .25 | 12 | | | .64 | 12 | | | 1.59 | 12 |
| 12/31/2016 | | | 10.80 | | | | .20 | | | | 1.25 | | | | 1.45 | | | | (.21 | ) | | | (.37 | ) | | | (.58 | ) | | | 11.67 | | | | 13.77 | 12 | | | — | 7 | | | .43 | 12 | | | .27 | 12 | | | .67 | 12 | | | 1.83 | 12 |
| Class P2: | | | | | | | | | | | | | | | | | | | | | | | | | | | | | | | | | | | | | | | | | | | | | | | | | | | | | | | | |
| 12/31/2020 | | | 11.91 | | | | .13 | | | | (.33 | ) | | | (.20 | ) | | | (.19 | ) | | | (.34 | ) | | | (.53 | ) | | | 11.18 | | | | (1.25 | ) | | | 355 | | | | .68 | | | | .63 | | | | 1.04 | | | | 1.18 | |
| 12/31/2019 | | | 11.21 | | | | .18 | | | | 1.31 | | | | 1.49 | | | | (.19 | ) | | | (.60 | ) | | | (.79 | ) | | | 11.91 | | | | 13.88 | | | | 365 | | | | .68 | | | | .63 | | | | 1.04 | | | | 1.62 | |
| 12/31/2018 | | | 12.96 | | | | .19 | | | | (1.10 | ) | | | (.91 | ) | | | (.40 | ) | | | (.44 | ) | | | (.84 | ) | | | 11.21 | | | | (7.38 | ) | | | 336 | | | | .68 | | | | .63 | | | | 1.02 | | | | 1.49 | |
| 12/31/2017 | | | 11.61 | | | | .17 | | | | 1.55 | | | | 1.72 | | | | (.18 | ) | | | (.19 | ) | | | (.37 | ) | | | 12.96 | | | | 15.03 | | | | 367 | | | | .68 | | | | .63 | | | | 1.02 | | | | 1.43 | |
| 12/31/2016 | | | 10.76 | | | | .23 | | | | 1.18 | | | | 1.41 | | | | (.19 | ) | | | (.37 | ) | | | (.56 | ) | | | 11.61 | | | | 13.39 | | | | 291 | | | | .79 | | | | .63 | | | | 1.03 | | | | 2.04 | |
See end of tables for footnotes.
| American Funds Insurance Series | 331 |
Financial highlights (continued)
| | | | | | Income (loss) from investment operations1 | | | Dividends and distributions | | | | | | | | | | | | Ratio of
expenses | | | Ratio of
expenses | | | | | | | |
| Period ended | | Net asset
value,
beginning
of period | | | Net
investment
income
(loss) | | | Net gains
(losses) on
securities
(both
realized and
unrealized) | | | Total from
investment
operations | | | Dividends
(from net
investment
income) | | | Distribu-
tions
(from capital
gains) | | | Total
dividends
and
distribu-
tions | | | Net asset
value, end
of period | | | Total return10 | | | Net assets,
end of
period
(in millions) | | | to average
net assets
before
waivers/
reimburse-
ments13 | | | to average
net assets
after
waivers/
reimburse-
ments10,13 | | | Net
effective
expense
ratio10,14 | | | Ratio of
net income
(loss)
to average
net assets10 | |
| | | | | | | | | | | | | | | | | | | | | | | | | | | | | | | | | | | | | | | | | | | | | | | | | | | | | | | | | |
| Managed Risk Growth-Income Fund | | | | | | | | | | | | | | | | | | | | | | | | | | | | | | | | | | | | |
| |
| Class P1: | | | | | | | | | | | | | | | | | | | | | | | | | | | | | | | | | | | | | | | | | | | | | | | | | | | | | | | | |
| 12/31/2020 | | $ | 13.76 | | | $ | .17 | | | $ | 1.08 | | | $ | 1.25 | | | $ | (.26 | ) | | $ | (.74 | ) | | $ | (1.00 | ) | | $ | 14.01 | | | | 9.85 | % | | $ | 2,120 | | | | .41 | % | | | .36 | % | | | .66 | % | | | 1.24 | % |
| 12/31/2019 | | | 11.73 | | | | .22 | | | | 2.01 | | | | 2.23 | | | | (.10 | ) | | | (.10 | ) | | | (.20 | ) | | | 13.76 | | | | 19.14 | | | | 1,987 | | | | .42 | | | | .37 | | | | .67 | | | | 1.71 | |
| 12/31/2018 | | | 12.66 | | | | (.02 | ) | | | (.15 | ) | | | (.17 | ) | | | (.19 | ) | | | (.57 | ) | | | (.76 | ) | | | 11.73 | | | | (1.66 | ) | | | 1,662 | | | | .40 | | | | .35 | | | | .64 | | | | (.20 | ) |
| 12/31/2017 | | | 11.07 | | | | .19 | | | | 2.03 | | | | 2.22 | | | | (.13 | ) | | | (.50 | ) | | | (.63 | ) | | | 12.66 | | | | 20.64 | 12 | | | 2 | | | | .44 | 12 | | | .37 | 12 | | | .66 | 12 | | | 1.61 | 12 |
| 12/31/2016 | | | 11.25 | | | | .16 | | | | .52 | | | | .68 | | | | (.16 | ) | | | (.70 | ) | | | (.86 | ) | | | 11.07 | | | | 6.49 | 12 | | | 1 | | | | .52 | 12 | | | .36 | 12 | | | .64 | 12 | | | 1.46 | 12 |
| Class P2: | | | | | | | | | | | | | | | | | | | | | | | | | | | | | | | | | | | | | | | | | | | | | | | | | | | | | | | | |
| 12/31/2020 | | | 13.69 | | | | .14 | | | | 1.07 | | | | 1.21 | | | | (.23 | ) | | | (.74 | ) | | | (.97 | ) | | | 13.93 | | | | 9.58 | | | | 315 | | | | .66 | | | | .61 | | | | .91 | | | | 1.02 | |
| 12/31/2019 | | | 11.67 | | | | .19 | | | | 2.00 | | | | 2.19 | | | | (.07 | ) | | | (.10 | ) | | | (.17 | ) | | | 13.69 | | | | 18.84 | | | | 283 | | | | .67 | | | | .62 | | | | .92 | | | | 1.47 | |
| 12/31/2018 | | | 12.58 | | | | .16 | | | | (.36 | ) | | | (.20 | ) | | | (.14 | ) | | | (.57 | ) | | | (.71 | ) | | | 11.67 | | | | (1.97 | ) | | | 230 | | | | .69 | | | | .64 | | | | .93 | | | | 1.25 | |
| 12/31/2017 | | | 11.02 | | | | .13 | | | | 2.05 | | | | 2.18 | | | | (.12 | ) | | | (.50 | ) | | | (.62 | ) | | | 12.58 | | | | 20.40 | | | | 206 | | | | .70 | | | | .63 | | | | .92 | | | | 1.08 | |
| 12/31/2016 | | | 11.22 | | | | .12 | | | | .52 | | | | .64 | | | | (.14 | ) | | | (.70 | ) | | | (.84 | ) | | | 11.02 | | | | 6.08 | | | | 160 | | | | .79 | | | | .63 | | | | .91 | | | | 1.13 | |
|
| | | | | | | | | | | | | | | | | | | | | | | | | | | | | | | | | | | | | | | | | | | | | | | | | | | | | | | | | |
| Managed Risk Asset Allocation Fund | | | | | | | | | | | | | | | | | | | | | | | | | | | | | | | | | | | | |
| |
| Class P1: | | | | | | | | | | | | | | | | | | | | | | | | | | | | | | | | | | | | | | | | | | | | | | | | | | | | | | | | |
| 12/31/2020 | | $ | 13.81 | | | $ | .25 | | | $ | .51 | | | $ | .76 | | | $ | (.21 | ) | | $ | (.52 | ) | | $ | (.73 | ) | | $ | 13.84 | | | | 6.10 | % | | $ | 5 | | | | .41 | % | | | .36 | % | | | .66 | % | | | 1.91 | % |
| 12/31/2019 | | | 12.23 | | | | .26 | | | | 1.92 | | | | 2.18 | | | | (.03 | ) | | | (.57 | ) | | | (.60 | ) | | | 13.81 | | | | 18.25 | | | | 2 | | | | .41 | | | | .36 | | | | .65 | | | | 2.01 | |
| 12/31/2018 | | | 13.59 | | | | .22 | | | | (.80 | ) | | | (.58 | ) | | | (.25 | ) | | | (.53 | ) | | | (.78 | ) | | | 12.23 | | | | (4.63 | ) | | | 2 | | | | .37 | | | | .32 | | | | .59 | | | | 1.67 | |
| 12/31/2017 | | | 12.02 | | | | .19 | | | | 1.60 | | | | 1.79 | | | | (.10 | ) | | | (.12 | ) | | | (.22 | ) | | | 13.59 | | | | 15.06 | | | | 1,656 | | | | .43 | | | | .38 | | | | .66 | | | | 1.45 | |
| 12/31/2016 | | | 11.72 | | | | .19 | | | | .67 | | | | .86 | | | | (.19 | ) | | | (.37 | ) | | | (.56 | ) | | | 12.02 | | | | 7.57 | | | | 1,217 | | | | .43 | | | | .38 | | | | .66 | | | | 1.65 | |
| Class P2: | | | | | | | | | | | | | | | | | | | | | | | | | | | | | | | | | | | | | | | | | | | | | | | | | | | | | | | | |
| 12/31/2020 | | | 13.46 | | | | .15 | | | | .56 | | | | .71 | | | | (.20 | ) | | | (.52 | ) | | | (.72 | ) | | | 13.45 | | | | 5.88 | | | | 2,773 | | | | .66 | | | | .61 | | | | .91 | | | | 1.15 | |
| 12/31/2019 | | | 12.22 | | | | .19 | | | | 1.93 | | | | 2.12 | | | | (.31 | ) | | | (.57 | ) | | | (.88 | ) | | | 13.46 | | | | 17.98 | | | | 2,830 | | | | .66 | | | | .61 | | | | .90 | | | | 1.51 | |
| 12/31/2018 | | | 13.55 | | | | .17 | | | | (.79 | ) | | | (.62 | ) | | | (.18 | ) | | | (.53 | ) | | | (.71 | ) | | | 12.22 | | | | (4.89 | ) | | | 2,541 | | | | .62 | | | | .57 | | | | .84 | | | | 1.27 | |
| 12/31/2017 | | | 12.01 | | | | .15 | | | | 1.61 | | | | 1.76 | | | | (.10 | ) | | | (.12 | ) | | | (.22 | ) | | | 13.55 | | | | 14.80 | | | | 2,798 | | | | .68 | | | | .63 | | | | .91 | | | | 1.13 | |
| 12/31/2016 | | | 11.71 | | | | .14 | | | | .69 | | | | .83 | | | | (.16 | ) | | | (.37 | ) | | | (.53 | ) | | | 12.01 | | | | 7.27 | | | | 2,342 | | | | .68 | | | | .63 | | | | .91 | | | | 1.20 | |
See end of tables for footnotes.
| 332 | American Funds Insurance Series |
Financial highlights (continued)
| Portfolio turnover rate for all share classes | | Year ended December 31, | |
| excluding mortgage dollar roll transactions15,16 | | 2020 | | | 2019 | | | 2018 | | | 2017 | | | 2016 | |
| Capital Income Builder | | | 110 | % | | | 44 | % | | | 42 | % | | | 59 | % | | | 41 | % |
| Asset Allocation Fund | | | 49 | | | | 47 | | | | 34 | | | | 39 | | | | 43 | |
| Global Balanced Fund | | | 68 | | | | 60 | | | | 30 | | | | 28 | | | | 43 | |
| Bond Fund | | | 72 | | | | 146 | | | | 98 | | | | 153 | | | | 108 | |
| Capital World Bond Fund | | | 88 | | | | 110 | | | | 78 | | | | 74 | | | | 70 | |
| American Funds Mortgage Fund | | | 123 | | | | 84 | | | | 60 | | | | 98 | | | | 113 | |
| U.S. Government/AAA-Rated Securities Fund | | | 112 | | | | 103 | | | | 76 | | | | 120 | | | | 273 | |
| | | | | | | | | | | | | | | | | | | | | |
| Portfolio turnover rate for all share classes | | Year ended December 31, | |
| including mortgage dollar roll15,16 | | 2020 | | | 2019 | | | 2018 | | | 2017 | | | 2016 | |
| Global Growth Fund | | | 17 | % | | | 14 | % | | | 25 | % | | | 31 | % | | | 27 | % |
| Global Small Capitalization Fund | | | 38 | | | | 50 | | | | 43 | | | | 33 | | | | 40 | |
| Growth Fund | | | 32 | | | | 21 | | | | 35 | | | | 24 | | | | 26 | |
| International Fund | | | 40 | | | | 32 | | | | 29 | | | | 29 | | | | 31 | |
| New World Fund | | | 70 | | | | 38 | | | | 58 | | | | 56 | | | | 32 | |
| Blue Chip Income and Growth Fund | | | 40 | | | | 37 | | | | 49 | | | | 34 | | | | 30 | |
| Global Growth and Income Fund | | | 36 | | | | 29 | | | | 49 | | | | 41 | | | | 57 | |
| Growth-Income Fund | | | 33 | | | | 27 | | | | 39 | | | | 27 | | | | 27 | |
| International Growth and Income Fund | | | 56 | | | | 28 | | | | 38 | | | | 51 | | | | 32 | |
| Capital Income Builder Fund | | | 184 | | | | 72 | | | | 98 | | | | 88 | | | | 53 | |
| Asset Allocation Fund | | | 145 | | | | 79 | | | | 86 | | | | 85 | | | | 83 | |
| Global Balanced Fund | | | 86 | | | | 74 | | | | 51 | | | | 41 | | | | 65 | |
| Bond Fund | | | 461 | | | | 373 | | | | 514 | | | | 502 | | | | 375 | |
| Capital World Bond Fund | | | 145 | | | | 159 | | | | 125 | | | | 105 | | | | 154 | |
| High-Income Bond Fund | | | 78 | | | | 58 | | | | 67 | | | | 78 | | | | 89 | |
| American Funds Mortgage Fund | | | 1143 | | | | 350 | | | | 811 | | | | 680 | | | | 713 | |
| U.S. Government/AAA-Rated Securities Fund | | | 867 | | | | 277 | | | | 446 | | | | 551 | | | | 539 | |
| Ultra-Short Bond Fund | | | — | 17 | | | — | 17 | | | — | 17 | | | — | 17 | | | — | 11,17 |
| Managed Risk Growth Fund | | | 80 | | | | 10 | | | | 7 | | | | 25 | | | | 15 | |
| Managed Risk International Fund | | | 71 | | | | 8 | | | | 8 | | | | 25 | | | | 26 | |
| Managed Risk Blue Chip Income and Growth Fund | | | 101 | | | | 13 | | | | 11 | | | | 32 | | | | 9 | |
| Managed Risk Growth-Income Fund | | | 38 | | | | 6 | | | | 14 | | | | 26 | | | | 14 | |
| Managed Risk Asset Allocation Fund | | | 30 | | | | 8 | | | | 12 | | | | 1 | | | | 3 | |
| 1 | Based on average shares outstanding. |
| 2 | Ratios do not include expenses of any Central Funds. The fund indirectly bears its proportionate share of the expenses of any Central Funds, if applicable. |
| 3 | Based on operations for a period that is less than a full year. |
| 4 | Class 1A shares began investment operations on January 6, 2017. |
| 5 | Not annualized. |
| 6 | Annualized. |
| 7 | Amount less than $1 million. |
| 8 | Amount less than $.01. |
| 9 | Amount less than .01%. |
| 10 | This column reflects the impact of certain waivers/reimbursements from CRMC. During some of the periods shown, CRMC waived a portion of investment advisory services fees on some funds, including each of the managed risk funds. In addition, during some of the periods shown, CRMC reimbursed a portion of miscellaneous fees and expenses for some of the managed risk funds. |
| 11 | On May 1, 2016, the fund converted from a cash fund to an ultra-short-term bond fund and changed its name from Cash Management Fund to Ultra-Short Bond Fund. |
| 12 | All or a significant portion of assets in this class consisted of seed capital invested by CRMC and/or its affiliates. Certain fees (including, where applicable, fees for distribution services) are not charged or accrued on these seed capital assets. If such fees were paid by the fund on seed capital assets, fund expenses would have been higher and net income and total return would have been lower. |
| 13 | This column does not include expenses of the underlying funds in which each fund invests. |
| 14 | This column reflects the net effective expense ratios for each fund and class, which are unaudited. These ratios include each class’s expense ratio combined with the weighted average net expense ratio of the underlying funds for the years presented. See expense example for further information regarding fees and expenses. |
| 15 | Refer to Note 5 for further information on mortgage dollar rolls. |
| 16 | Rates do not include the fund’s portfolio activity with respect to any Central Funds, if applicable. |
| 17 | Amount is either less than 1% or there is no turnover. |
See notes to financial statements.
| American Funds Insurance Series | 333 |
Report of Independent Registered Public Accounting Firm
To the Board of Trustees of American Funds Insurance Series and Shareholders of Global Growth Fund, Global Small Capitalization Fund, Growth Fund, International Fund, New World Fund®, Blue Chip Income and Growth Fund, Global Growth and Income Fund, Growth-Income Fund, International Growth and Income Fund, Capital Income Builder®, Asset Allocation Fund, Global Balanced Fund, Bond Fund, Capital World Bond Fund®, High-Income Bond Fund, American Funds Mortgage Fund®, Ultra-Short Bond Fund, U.S. Government/AAA-Rated Securities Fund, Managed Risk Growth Fund, Managed Risk International Fund, Managed Risk Blue Chip Income and Growth Fund, Managed Risk Growth-Income Fund and Managed Risk Asset Allocation Fund
Opinions on the Financial Statements
We have audited the accompanying statements of assets and liabilities, including the investment portfolios, of Global Growth Fund, Global Small Capitalization Fund, Growth Fund, International Fund, New World Fund®, Blue Chip Income and Growth Fund, Global Growth and Income Fund, Growth-Income Fund, International Growth and Income Fund, Capital Income Builder®, Asset Allocation Fund, Global Balanced Fund, Bond Fund, Capital World Bond Fund® (formerly Global Bond Fund), High-Income Bond Fund, American Funds Mortgage Fund® (formerly Mortgage Fund), Ultra-Short Bond Fund, U.S. Government/AAA-Rated Securities Fund, Managed Risk Growth Fund, Managed Risk International Fund, Managed Risk Blue Chip Income and Growth Fund, Managed Risk Growth-Income Fund and Managed Risk Asset Allocation Fund (twenty-three of the funds constituting American Funds Insurance Series, hereafter collectively referred to as the “Funds”) as of December 31, 2020, the related statements of operations for the year ended December 31, 2020, the statements of changes in net assets for each of the two years in the period ended December 31, 2020, including the related notes, and the financial highlights for each of the periods indicated therein (collectively referred to as the “financial statements”). In our opinion, the financial statements present fairly, in all material respects, the financial position of each of the Funds as of December 31, 2020, the results of each of their operations for the year then ended, the changes in each of their net assets for each of the two years in the period ended December 31, 2020 and each of the financial highlights for each of the periods indicated therein in conformity with accounting principles generally accepted in the United States of America.
Basis for Opinions
These financial statements are the responsibility of the Funds’ management. Our responsibility is to express an opinion on the Funds’ financial statements based on our audits. We are a public accounting firm registered with the Public Company Accounting Oversight Board (United States) (PCAOB) and are required to be independent with respect to the Funds in accordance with the U.S. federal securities laws and the applicable rules and regulations of the Securities and Exchange Commission and the PCAOB.
We conducted our audits of these financial statements in accordance with the standards of the PCAOB. Those standards require that we plan and perform the audit to obtain reasonable assurance about whether the financial statements are free of material misstatement, whether due to error or fraud.
Our audits included performing procedures to assess the risks of material misstatement of the financial statements, whether due to error or fraud, and performing procedures that respond to those risks. Such procedures included examining, on a test basis, evidence regarding the amounts and disclosures in the financial statements. Our audits also included evaluating the accounting principles used and significant estimates made by management, as well as evaluating the overall presentation of the financial statements. Our procedures included confirmation of securities owned as of December 31, 2020 by correspondence with the custodians, transfer agent and brokers; when replies were not received from brokers, we performed other auditing procedures. We believe that our audits provide a reasonable basis for our opinions.
/s/PricewaterhouseCoopers LLP
Los Angeles, California
February 12, 2021
We have served as the auditor of one or more investment companies in The Capital Group Companies Investment Company Complex since 1934.
| 334 | American Funds Insurance Series |
The funds in American Funds Insurance Series serve as the underlying investment vehicle for various insurance products. As an owner of an insurance contract that invests in one of the funds in the series, you incur two types of costs: (1) transaction costs, such as initial sales charges on purchase payments and contingent deferred sales charges on redemptions (loads), and (2) ongoing costs, including management fees, distribution and service (12b-1) fees, and other expenses. Additional fees are charged by the insurance companies related to the various benefits they provide. This example is intended to help you understand your ongoing costs (in dollars) of investing in the underlying funds so you can compare these costs with the ongoing costs of investing in other mutual funds that serve a similar function in other annuity products. The example is based on an investment of $1,000 invested at the beginning of the period and held for the entire six-month period (July 1, 2020, through December 31, 2020).
Actual expenses:
The first line of each share class in the tables on the following pages provides information about actual account values and actual expenses. You may use the information in this line, together with the amount you invested, to estimate the expenses that you paid over the period. Simply divide your account value by $1,000 (for example, an $8,600 account value divided by $1,000 = 8.6), then multiply the result by the number in the first line under the heading titled “Expenses paid during period” to estimate the expenses you paid on your account during this period.
Hypothetical example for comparison purposes:
The second line of each share class in the tables on the following pages provides information about hypothetical account values and hypothetical expenses based on the actual expense ratio for the share class and an assumed rate of return of 5.00% per year before expenses, which is not the actual return of the share class. The hypothetical account values and expenses may not be used to estimate the actual ending account balance or expenses you paid for the period. You may use this information to compare the ongoing costs of investing in the fund and other funds. To do so, compare this 5.00% hypothetical example with the 5.00% hypothetical examples that appear in the shareholder reports of the other funds.
Notes:
Additional fees are charged by the insurance companies related to the various benefits they provide. You can estimate the impact of these fees by adding the amount of the fees to the total estimated expenses you paid on your account during the period as calculated above. In addition, your ending account value would be lower by the amount of these fees.
Note that the expenses shown in the tables on the following pages are meant to highlight your ongoing costs only and do not reflect any transactional costs. Therefore, the second line of each share class in the tables is useful in comparing ongoing costs only and will not help you determine the relative total costs of owning different funds. In addition, if these transactional costs were included, your costs would have been higher.
| American Funds Insurance Series | 335 |
Expense example (continued)
| | | Beginning
account value
7/1/2020 | | | Ending
account value
12/31/2020 | | | Expenses
paid during
period1 | | | Annualized
expense
ratio | |
| Global Growth Fund | | | | | | | | | | | | | | | | |
| Class 1 – actual return | | $ | 1,000.00 | | | $ | 1,254.84 | | | $ | 3.13 | | | | .55 | % |
| Class 1 – assumed 5% return | | | 1,000.00 | | | | 1,022.43 | | | | 2.80 | | | | .55 | |
| Class 1A – actual return | | | 1,000.00 | | | | 1,253.16 | | | | 4.54 | | | | .80 | |
| Class 1A – assumed 5% return | | | 1,000.00 | | | | 1,021.17 | | | | 4.08 | | | | .80 | |
| Class 2 – actual return | | | 1,000.00 | | | | 1,253.28 | | | | 4.54 | | | | .80 | |
| Class 2 – assumed 5% return | | | 1,000.00 | | | | 1,021.17 | | | | 4.08 | | | | .80 | |
| Class 4 – actual return | | | 1,000.00 | | | | 1,251.73 | | | | 5.96 | | | | 1.05 | |
| Class 4 – assumed 5% return | | | 1,000.00 | | | | 1,019.91 | | | | 5.35 | | | | 1.05 | |
| Global Small Capitalization Fund | | | | | | | | | | | | | | | | |
| Class 1 – actual return | | $ | 1,000.00 | | | $ | 1,343.20 | | | $ | 4.37 | | | | .74 | % |
| Class 1 – assumed 5% return | | | 1,000.00 | | | | 1,021.48 | | | | 3.77 | | | | .74 | |
| Class 1A – actual return | | | 1,000.00 | | | | 1,341.45 | | | | 5.84 | | | | .99 | |
| Class 1A – assumed 5% return | | | 1,000.00 | | | | 1,020.21 | | | | 5.04 | | | | .99 | |
| Class 2 – actual return | | | 1,000.00 | | | | 1,341.27 | | | | 5.84 | | | | .99 | |
| Class 2 – assumed 5% return | | | 1,000.00 | | | | 1,020.21 | | | | 5.04 | | | | .99 | |
| Class 4 – actual return | | | 1,000.00 | | | | 1,340.24 | | | | 7.31 | | | | 1.24 | |
| Class 4 – assumed 5% return | | | 1,000.00 | | | | 1,018.95 | | | | 6.31 | | | | 1.24 | |
| Growth Fund | | | | | | | | | | | | | | | | |
| Class 1 – actual return | | $ | 1,000.00 | | | $ | 1,360.06 | | | $ | 2.08 | | | | .35 | % |
| Class 1 – assumed 5% return | | | 1,000.00 | | | | 1,023.44 | | | | 1.79 | | | | .35 | |
| Class 1A – actual return | | | 1,000.00 | | | | 1,358.42 | | | | 3.57 | | | | .60 | |
| Class 1A – assumed 5% return | | | 1,000.00 | | | | 1,022.18 | | | | 3.06 | | | | .60 | |
| Class 2 – actual return | | | 1,000.00 | | | | 1,358.42 | | | | 3.57 | | | | .60 | |
| Class 2 – assumed 5% return | | | 1,000.00 | | | | 1,022.18 | | | | 3.06 | | | | .60 | |
| Class 3 – actual return | | | 1,000.00 | | | | 1,358.84 | | | | 3.15 | | | | .53 | |
| Class 3 – assumed 5% return | | | 1,000.00 | | | | 1,022.53 | | | | 2.70 | | | | .53 | |
| Class 4 – actual return | | | 1,000.00 | | | | 1,356.82 | | | | 5.05 | | | | .85 | |
| Class 4 – assumed 5% return | | | 1,000.00 | | | | 1,020.92 | | | | 4.33 | | | | .85 | |
| International Fund | | | | | | | | | | | | | | | | |
| Class 1 – actual return | | $ | 1,000.00 | | | $ | 1,286.94 | | | $ | 3.17 | | | | .55 | % |
| Class 1 – assumed 5% return | | | 1,000.00 | | | | 1,022.43 | | | | 2.80 | | | | .55 | |
| Class 1A – actual return | | | 1,000.00 | | | | 1,284.98 | | | | 4.61 | | | | .80 | |
| Class 1A – assumed 5% return | | | 1,000.00 | | | | 1,021.17 | | | | 4.08 | | | | .80 | |
| Class 2 – actual return | | | 1,000.00 | | | | 1,285.43 | | | | 4.61 | | | | .80 | |
| Class 2 – assumed 5% return | | | 1,000.00 | | | | 1,021.17 | | | | 4.08 | | | | .80 | |
| Class 3 – actual return | | | 1,000.00 | | | | 1,285.16 | | | | 4.20 | | | | .73 | |
| Class 3 – assumed 5% return | | | 1,000.00 | | | | 1,021.53 | | | | 3.72 | | | | .73 | |
| Class 4 – actual return | | | 1,000.00 | | | | 1,283.63 | | | | 6.04 | | | | 1.05 | |
| Class 4 – assumed 5% return | | | 1,000.00 | | | | 1,019.91 | | | | 5.35 | | | | 1.05 | |
| New World Fund | | | | | | | | | | | | | | | | |
| Class 1 – actual return | | $ | 1,000.00 | | | $ | 1,291.34 | | | $ | 3.35 | | | | .58 | % |
| Class 1 – assumed 5% return | | | 1,000.00 | | | | 1,022.28 | | | | 2.96 | | | | .58 | |
| Class 1A – actual return | | | 1,000.00 | | | | 1,290.17 | | | | 4.79 | | | | .83 | |
| Class 1A – assumed 5% return | | | 1,000.00 | | | | 1,021.02 | | | | 4.23 | | | | .83 | |
| Class 2 – actual return | | | 1,000.00 | | | | 1,289.72 | | | | 4.79 | | | | .83 | |
| Class 2 – assumed 5% return | | | 1,000.00 | | | | 1,021.02 | | | | 4.23 | | | | .83 | |
| Class 4 – actual return | | | 1,000.00 | | | | 1,288.50 | | | | 6.23 | | | | 1.08 | |
| Class 4 – assumed 5% return | | | 1,000.00 | | | | 1,019.76 | | | | 5.50 | | | | 1.08 | |
See end of tables for footnotes.
| 336 | American Funds Insurance Series |
Expense example (continued)
| | | Beginning
account value
7/1/2020 | | | Ending
account value
12/31/2020 | | | Expenses
paid during
period1 | | | Annualized
expense
ratio | |
| Blue Chip Income and Growth Fund | | | | | | | | | | | | | | | | |
| Class 1 – actual return | | $ | 1,000.00 | | | $ | 1,188.67 | | | $ | 2.32 | | | | .42 | % |
| Class 1 – assumed 5% return | | | 1,000.00 | | | | 1,023.09 | | | | 2.14 | | | | .42 | |
| Class 1A – actual return | | | 1,000.00 | | | | 1,187.68 | | | | 3.69 | | | | .67 | |
| Class 1A – assumed 5% return | | | 1,000.00 | | | | 1,021.83 | | | | 3.41 | | | | .67 | |
| Class 2 – actual return | | | 1,000.00 | | | | 1,186.62 | | | | 3.69 | | | | .67 | |
| Class 2 – assumed 5% return | | | 1,000.00 | | | | 1,021.83 | | | | 3.41 | | | | .67 | |
| Class 4 – actual return | | | 1,000.00 | | | | 1,185.33 | | | | 5.07 | | | | .92 | |
| Class 4 – assumed 5% return | | | 1,000.00 | | | | 1,020.57 | | | | 4.69 | | | | .92 | |
| Global Growth and Income Fund | | | | | | | | | | | | | | | | |
| Class 1 – actual return | | $ | 1,000.00 | | | $ | 1,226.11 | | | $ | 3.70 | | | | .66 | % |
| Class 1 – assumed 5% return | | | 1,000.00 | | | | 1,021.88 | | | | 3.36 | | | | .66 | |
| Class 1A – actual return | | | 1,000.00 | | | | 1,224.98 | | | | 5.10 | | | | .91 | |
| Class 1A – assumed 5% return | | | 1,000.00 | | | | 1,020.62 | | | | 4.63 | | | | .91 | |
| Class 2 – actual return | | | 1,000.00 | | | | 1,224.48 | | | | 5.10 | | | | .91 | |
| Class 2 – assumed 5% return | | | 1,000.00 | | | | 1,020.62 | | | | 4.63 | | | | .91 | |
| Class 4 – actual return | | | 1,000.00 | | | | 1,223.67 | | | | 6.50 | | | | 1.16 | |
| Class 4 – assumed 5% return | | | 1,000.00 | | | | 1,019.36 | | | | 5.90 | | | | 1.16 | |
| Growth-Income Fund | | | | | | | | | | | | | | | | |
| Class 1 – actual return | | $ | 1,000.00 | | | $ | 1,180.81 | | | $ | 1.59 | | | | .29 | % |
| Class 1 – assumed 5% return | | | 1,000.00 | | | | 1,023.74 | | | | 1.48 | | | | .29 | |
| Class 1A – actual return | | | 1,000.00 | | | | 1,179.38 | | | | 2.97 | | | | .54 | |
| Class 1A – assumed 5% return | | | 1,000.00 | | | | 1,022.48 | | | | 2.75 | | | | .54 | |
| Class 2 – actual return | | | 1,000.00 | | | | 1,179.40 | | | | 2.97 | | | | .54 | |
| Class 2 – assumed 5% return | | | 1,000.00 | | | | 1,022.48 | | | | 2.75 | | | | .54 | |
| Class 3 – actual return | | | 1,000.00 | | | | 1,179.77 | | | | 2.58 | | | | .47 | |
| Class 3 – assumed 5% return | | | 1,000.00 | | | | 1,022.84 | | | | 2.40 | | | | .47 | |
| Class 4 – actual return | | | 1,000.00 | | | | 1,177.95 | | | | 4.34 | | | | .79 | |
| Class 4 – assumed 5% return | | | 1,000.00 | | | | 1,021.22 | | | | 4.02 | | | | .79 | |
| International Growth and Income Fund | | | | | | | | | | | | | | | | |
| Class 1 – actual return | | $ | 1,000.00 | | | $ | 1,250.95 | | | $ | 3.86 | | | | .68 | % |
| Class 1 – assumed 5% return | | | 1,000.00 | | | | 1,021.78 | | | | 3.47 | | | | .68 | |
| Class 1A – actual return | | | 1,000.00 | | | | 1,249.71 | | | | 5.27 | | | | .93 | |
| Class 1A – assumed 5% return | | | 1,000.00 | | | | 1,020.52 | | | | 4.74 | | | | .93 | |
| Class 2 – actual return | | | 1,000.00 | | | | 1,249.64 | | | | 5.27 | | | | .93 | |
| Class 2 – assumed 5% return | | | 1,000.00 | | | | 1,020.52 | | | | 4.74 | | | | .93 | |
| Class 4 – actual return | | | 1,000.00 | | | | 1,248.18 | | | | 6.69 | | | | 1.18 | |
| Class 4 – assumed 5% return | | | 1,000.00 | | | | 1,019.26 | | | | 6.01 | | | | 1.18 | |
| Capital Income Builder | | | | | | | | | | | | | | | | |
| Class 1 – actual return | | $ | 1,000.00 | | | $ | 1,115.95 | | | $ | 1.44 | | | | .27 | % |
| Class 1 – assumed 5% return | | | 1,000.00 | | | | 1,023.84 | | | | 1.38 | | | | .27 | |
| Class 1A – actual return | | | 1,000.00 | | | | 1,114.72 | | | | 2.77 | | | | .52 | |
| Class 1A – assumed 5% return | | | 1,000.00 | | | | 1,022.58 | | | | 2.65 | | | | .52 | |
| Class 2 – actual return | | | 1,000.00 | | | | 1,115.75 | | | | 2.77 | | | | .52 | |
| Class 2 – assumed 5% return | | | 1,000.00 | | | | 1,022.58 | | | | 2.65 | | | | .52 | |
| Class 4 – actual return | | | 1,000.00 | | | | 1,113.43 | | | | 4.10 | | | | .77 | |
| Class 4 – assumed 5% return | | | 1,000.00 | | | | 1,021.32 | | | | 3.92 | | | | .77 | |
See end of tables for footnotes.
| American Funds Insurance Series | 337 |
Expense example (continued)
| | | Beginning
account value
7/1/2020 | | | Ending
account value
12/31/2020 | | | Expenses
paid during
period1 | | | Annualized
expense
ratio | |
| Asset Allocation Fund | | | | | | | | | | | | | | | | |
| Class 1 – actual return | | $ | 1,000.00 | | | $ | 1,143.93 | | | $ | 1.62 | | | | .30 | % |
| Class 1 – assumed 5% return | | | 1,000.00 | | | | 1,023.69 | | | | 1.53 | | | | .30 | |
| Class 1A – actual return | | | 1,000.00 | | | | 1,142.08 | | | | 2.97 | | | | .55 | |
| Class 1A – assumed 5% return | | | 1,000.00 | | | | 1,022.43 | | | | 2.80 | | | | .55 | |
| Class 2 – actual return | | | 1,000.00 | | | | 1,142.52 | | | | 2.97 | | | | .55 | |
| Class 2 – assumed 5% return | | | 1,000.00 | | | | 1,022.43 | | | | 2.80 | | | | .55 | |
| Class 3 – actual return | | | 1,000.00 | | | | 1,142.59 | | | | 2.59 | | | | .48 | |
| Class 3 – assumed 5% return | | | 1,000.00 | | | | 1,022.79 | | | | 2.45 | | | | .48 | |
| Class 4 – actual return | | | 1,000.00 | | | | 1,140.96 | | | | 4.32 | | | | .80 | |
| Class 4 – assumed 5% return | | | 1,000.00 | | | | 1,021.17 | | | | 4.08 | | | | .80 | |
| Global Balanced Fund | | | | | | | | | | | | | | | | |
| Class 1 – actual return | | $ | 1,000.00 | | | $ | 1,137.75 | | | $ | 3.93 | | | | .73 | % |
| Class 1 – assumed 5% return | | | 1,000.00 | | | | 1,021.53 | | | | 3.72 | | | | .73 | |
| Class 1A – actual return | | | 1,000.00 | | | | 1,136.55 | | | | 5.28 | | | | .98 | |
| Class 1A – assumed 5% return | | | 1,000.00 | | | | 1,020.27 | | | | 4.99 | | | | .98 | |
| Class 2 – actual return | | | 1,000.00 | | | | 1,136.23 | | | | 5.28 | | | | .98 | |
| Class 2 – assumed 5% return | | | 1,000.00 | | | | 1,020.27 | | | | 4.99 | | | | .98 | |
| Class 4 – actual return | | | 1,000.00 | | | | 1,135.20 | | | | 6.62 | | | | 1.23 | |
| Class 4 – assumed 5% return | | | 1,000.00 | | | | 1,019.00 | | | | 6.26 | | | | 1.23 | |
| Bond Fund | | | | | | | | | | | | | | | | |
| Class 1 – actual return | | $ | 1,000.00 | | | $ | 1,031.42 | | | $ | 2.05 | | | | .40 | % |
| Class 1 – assumed 5% return | | | 1,000.00 | | | | 1,023.19 | | | | 2.04 | | | | .40 | |
| Class 1A – actual return | | | 1,000.00 | | | | 1,029.77 | | | | 3.27 | | | | .64 | |
| Class 1A – assumed 5% return | | | 1,000.00 | | | | 1,021.98 | | | | 3.26 | | | | .64 | |
| Class 2 – actual return | | | 1,000.00 | | | | 1,029.81 | | | | 3.27 | | | | .64 | |
| Class 2 – assumed 5% return | | | 1,000.00 | | | | 1,021.98 | | | | 3.26 | | | | .64 | |
| Class 4 – actual return | | | 1,000.00 | | | | 1,028.42 | | | | 4.55 | | | | .89 | |
| Class 4 – assumed 5% return | | | 1,000.00 | | | | 1,020.72 | | | | 4.53 | | | | .89 | |
| Capital World Bond Fund | | | | | | | | | | | | | | | | |
| Class 1 – actual return | | $ | 1,000.00 | | | $ | 1,078.63 | | | $ | 2.57 | | | | .49 | % |
| Class 1 – assumed 5% return | | | 1,000.00 | | | | 1,022.74 | | | | 2.50 | | | | .49 | |
| Class 1A – actual return | | | 1,000.00 | | | | 1,077.00 | | | | 3.82 | | | | .73 | |
| Class 1A – assumed 5% return | | | 1,000.00 | | | | 1,021.53 | | | | 3.72 | | | | .73 | |
| Class 2 – actual return | | | 1,000.00 | | | | 1,077.13 | | | | 3.87 | | | | .74 | |
| Class 2 – assumed 5% return | | | 1,000.00 | | | | 1,021.48 | | | | 3.77 | | | | .74 | |
| Class 4 – actual return | | | 1,000.00 | | | | 1,075.46 | | | | 5.13 | | | | .98 | |
| Class 4 – assumed 5% return | | | 1,000.00 | | | | 1,020.27 | | | | 4.99 | | | | .98 | |
| High-Income Bond Fund | | | | | | | | | | | | | | | | |
| Class 1 – actual return | | $ | 1,000.00 | | | $ | 1,135.96 | | | $ | 2.85 | | | | .53 | % |
| Class 1 – assumed 5% return | | | 1,000.00 | | | | 1,022.53 | | | | 2.70 | | | | .53 | |
| Class 1A – actual return | | | 1,000.00 | | | | 1,134.62 | | | | 4.20 | | | | .78 | |
| Class 1A – assumed 5% return | | | 1,000.00 | | | | 1,021.27 | | | | 3.97 | | | | .78 | |
| Class 2 – actual return | | | 1,000.00 | | | | 1,134.44 | | | | 4.20 | | | | .78 | |
| Class 2 – assumed 5% return | | | 1,000.00 | | | | 1,021.27 | | | | 3.97 | | | | .78 | |
| Class 3 ��� actual return | | | 1,000.00 | | | | 1,134.15 | | | | 3.82 | | | | .71 | |
| Class 3 – assumed 5% return | | | 1,000.00 | | | | 1,021.63 | | | | 3.62 | | | | .71 | |
| Class 4 – actual return | | | 1,000.00 | | | | 1,132.72 | | | | 5.54 | | | | 1.03 | |
| Class 4 – assumed 5% return | | | 1,000.00 | | | | 1,020.01 | | | | 5.24 | | | | 1.03 | |
See end of tables for footnotes.
| 338 | American Funds Insurance Series |
Expense example (continued)
| | | Beginning
account value
7/1/2020 | | | Ending
account value
12/31/2020 | | | Expenses
paid during
period1 | | | Annualized
expense
ratio | |
| American Funds Mortgage Fund | | | | | | | | | | | | | | | | |
| Class 1 – actual return | | $ | 1,000.00 | | | $ | 1,011.01 | | | $ | 1.57 | | | | .31 | % |
| Class 1 – assumed 5% return | | | 1,000.00 | | | | 1,023.64 | | | | 1.58 | | | | .31 | |
| Class 1A – actual return | | | 1,000.00 | | | | 1,009.84 | | | | 2.84 | | | | .56 | |
| Class 1A – assumed 5% return | | | 1,000.00 | | | | 1,022.38 | | | | 2.85 | | | | .56 | |
| Class 2 – actual return | | | 1,000.00 | | | | 1,009.83 | | | | 2.84 | | | | .56 | |
| Class 2 – assumed 5% return | | | 1,000.00 | | | | 1,022.38 | | | | 2.85 | | | | .56 | |
| Class 4 – actual return | | | 1,000.00 | | | | 1,008.07 | | | | 4.10 | | | | .81 | |
| Class 4 – assumed 5% return | | | 1,000.00 | | | | 1,021.12 | | | | 4.13 | | | | .81 | |
| Ultra-Short Bond Fund | | | | | | | | | | | | | | | | |
| Class 1 – actual return | | $ | 1,000.00 | | | $ | 999.11 | | | $ | 1.91 | | | | .38 | % |
| Class 1 – assumed 5% return | | | 1,000.00 | | | | 1,023.29 | | | | 1.94 | | | | .38 | |
| Class 1A – actual return | | | 1,000.00 | | | | 999.11 | | | | 1.86 | | | | .37 | |
| Class 1A – assumed 5% return | | | 1,000.00 | | | | 1,023.34 | | | | 1.89 | | | | .37 | |
| Class 2 – actual return | | | 1,000.00 | | | | 997.28 | | | | 3.12 | | | | .62 | |
| Class 2 – assumed 5% return | | | 1,000.00 | | | | 1,022.08 | | | | 3.16 | | | | .62 | |
| Class 3 – actual return | | | 1,000.00 | | | | 998.21 | | | | 2.77 | | | | .55 | |
| Class 3 – assumed 5% return | | | 1,000.00 | | | | 1,022.43 | | | | 2.80 | | | | .55 | |
| Class 4 – actual return | | | 1,000.00 | | | | 996.40 | | | | 4.38 | | | | .87 | |
| Class 4 – assumed 5% return | | | 1,000.00 | | | | 1,020.82 | | | | 4.43 | | | | .87 | |
| U.S. Government/AAA-Rated Securities Fund | | | | | | | | | | | | |
| Class 1 – actual return | | $ | 1,000.00 | | | $ | 1,011.80 | | | $ | 1.98 | | | | .39 | % |
| Class 1 – assumed 5% return | | | 1,000.00 | | | | 1,023.24 | | | | 1.99 | | | | .39 | |
| Class 1A – actual return | | | 1,000.00 | | | | 1,010.17 | | | | 3.24 | | | | .64 | |
| Class 1A – assumed 5% return | | | 1,000.00 | | | | 1,021.98 | | | | 3.26 | | | | .64 | |
| Class 2 – actual return | | | 1,000.00 | | | | 1,010.14 | | | | 3.24 | | | | .64 | |
| Class 2 – assumed 5% return | | | 1,000.00 | | | | 1,021.98 | | | | 3.26 | | | | .64 | |
| Class 3 – actual return | | | 1,000.00 | | | | 1,010.51 | | | | 2.89 | | | | .57 | |
| Class 3 – assumed 5% return | | | 1,000.00 | | | | 1,022.33 | | | | 2.91 | | | | .57 | |
| Class 4 – actual return | | | 1,000.00 | | | | 1,008.75 | | | | 4.51 | | | | .89 | |
| Class 4 – assumed 5% return | | | 1,000.00 | | | | 1,020.72 | | | | 4.53 | | | | .89 | |
See end of tables for footnotes.
| American Funds Insurance Series | 339 |
Expense example (continued)
| | | Beginning
account value
7/1/2020 | | | Ending
account value
12/31/2020 | | | Expenses
paid during
period1,2 | | | Annualized
expense ratio2 | | | Effective
expenses paid
during period3 | | | Effective
annualized
expense ratio4 | |
| Managed Risk Growth Fund | | | | | | | | | | | | | | | | | | | | |
| Class P1 – actual return | | $ | 1,000.00 | | | $ | 1,219.94 | | | $ | 2.01 | | | | .36 | % | | $ | 4.02 | | | | .72 | % |
| Class P1 – assumed 5% return | | | 1,000.00 | | | | 1,023.33 | | | | 1.83 | | | | .36 | | | | 3.66 | | | | .72 | |
| Class P2 – actual return | | | 1,000.00 | | | | 1,217.79 | | | | 3.46 | | | | .62 | | | | 5.41 | | | | .97 | |
| Class P2 – assumed 5% return | | | 1,000.00 | | | | 1,022.02 | | | | 3.15 | | | | .62 | | | | 4.93 | | | | .97 | |
| Managed Risk International Fund | | | | | | | | | | | | | | | | |
| Class P1 – actual return | | $ | 1,000.00 | | | $ | 1,176.41 | | | $ | 1.81 | | | | .33 | % | | $ | 4.70 | | | | .86 | % |
| Class P1 – assumed 5% return | | | 1,000.00 | | | | 1,023.48 | | | | 1.68 | | | | .33 | | | | 4.37 | | | | .86 | |
| Class P2 – actual return | | | 1,000.00 | | | | 1,174.15 | | | | 3.28 | | | | .60 | | | | 6.23 | | | | 1.14 | |
| Class P2 – assumed 5% return | | | 1,000.00 | | | | 1,022.12 | | | | 3.05 | | | | .60 | | | | 5.79 | | | | 1.14 | |
| Managed Risk Blue Chip Income and Growth Fund | | | | | | | | | | | | |
| Class P1 – actual return | | $ | 1,000.00 | | | $ | 1,080.32 | | | $ | 1.83 | | | | .35 | % | | $ | 3.97 | | | | .76 | % |
| Class P1 – assumed 5% return | | | 1,000.00 | | | | 1,023.38 | | | | 1.78 | | | | .35 | | | | 3.86 | | | | .76 | |
| Class P2 – actual return | | | 1,000.00 | | | | 1,079.10 | | | | 3.24 | | | | .62 | | | | 5.44 | | | | 1.04 | |
| Class P2 – assumed 5% return | | | 1,000.00 | | | | 1,022.02 | | | | 3.15 | | | | .62 | | | | 5.28 | | | | 1.04 | |
| Managed Risk Growth-Income Fund | | | | | | | | | | | | | | | | |
| Class P1 – actual return | | $ | 1,000.00 | | | $ | 1,091.34 | | | $ | 1.89 | | | | .36 | % | | $ | 3.47 | | | | .66 | % |
| Class P1 – assumed 5% return | | | 1,000.00 | | | | 1,023.33 | | | | 1.83 | | | | .36 | | | | 3.35 | | | | .66 | |
| Class P2 – actual return | | | 1,000.00 | | | | 1,089.02 | | | | 3.20 | | | | .61 | | | | 4.78 | | | | .91 | |
| Class P2 – assumed 5% return | | | 1,000.00 | | | | 1,022.07 | | | | 3.10 | | | | .61 | | | | 4.62 | | | | .91 | |
| Managed Risk Asset Allocation Fund | | | | | | | | | | | | | | | | |
| Class P1 – actual return | | $ | 1,000.00 | | | $ | 1,101.91 | | | $ | 1.90 | | | | .36 | % | | $ | 3.49 | | | | .66 | % |
| Class P1 – assumed 5% return | | | 1,000.00 | | | | 1,023.33 | | | | 1.83 | | | | .36 | | | | 3.35 | | | | .66 | |
| Class P2 – actual return | | | 1,000.00 | | | | 1,100.65 | | | | 3.22 | | | | .61 | | | | 4.81 | | | | .91 | |
| Class P2 – assumed 5% return | | | 1,000.00 | | | | 1,022.07 | | | | 3.10 | | | | .61 | | | | 4.62 | | | | .91 | |
| 1 | The “expenses paid during period” are equal to the “annualized expense ratio,” multiplied by the average account value over the period, multiplied by the number of days in the period, and divided by 365 (to reflect the one-half year period). |
| 2 | The “expenses paid during period” and “annualized expense ratio” do not include the expenses of the underlying funds in which each fund invests. |
| 3 | The “effective expenses paid during period” are equal to the “effective annualized expense ratio,” multiplied by the average account value over the period, multiplied by the number of days in the period, and divided by 365 (to reflect the period). |
| 4 | The “effective annualized expense ratio” reflects the net annualized expense ratio of the class plus the class’s pro-rata share of the weighted average expense ratio of the underlying funds in which it invests. |
| 340 | American Funds Insurance Series |
Liquidity Risk Management Program
The series has adopted a liquidity risk management program (the “program”). The series’ board has designated Capital Research and Management Company (“CRMC”) as the administrator of the program. Personnel of CRMC or its affiliates conduct the day-to-day operation of the program pursuant to policies and procedures administered by the Capital Group Liquidity Risk Management Committee.
Under the program, CRMC manages each fund’s liquidity risk, which is the risk that the fund could not meet shareholder redemption requests without significant dilution of remaining shareholders’ interests in the fund. This risk is managed by monitoring the degree of liquidity of each fund’s investments, limiting the amount of each fund’s illiquid investments, and utilizing various risk management tools and facilities available to each fund for meeting shareholder redemptions, among other means. CRMC’s process of determining the degree of liquidity of each fund’s investments is supported by one or more third-party liquidity assessment vendors.
The series’ board reviewed a report prepared by CRMC regarding the operation and effectiveness of the program for the period October 1, 2019, through September 30, 2020. No significant liquidity events impacting any of the funds were noted in the report. In addition, CRMC provided its assessment that the program had been effective in managing each fund’s liquidity risk.
| American Funds Insurance Series | 341 |
Board of trustees and other officers
Independent trustees1
| Name and year of birth | | Year first
elected
a trustee
of the series2 | | Principal occupation(s) during past five years | | Number of
portfolios in fund
complex overseen
by trustee | | Other directorships3
held by trustee |
| William H. Baribault, 1945 | | 2009 | | Chairman of the Board and CEO, Oakwood Advisors (private investment and consulting); former CEO and President, Richard Nixon Foundation | | 89 | | General Finance Corporation |
| James G. Ellis, 1947 | | 2010 | | Professor of Marketing and former Dean, Marshall School of Business, University of Southern California | | 99 | | Mercury General Corporation |
| Nariman Farvardin, 1956 | | 2018 | | President, Stevens Institute of Technology | | 87 | | None |
| Mary Davis Holt, 1950 | | 2015–2016;
2017 | | Principal, Mary Davis Holt Enterprises, LLC (leadership development consulting); former Partner, Flynn Heath Holt Leadership, LLC (leadership consulting); former COO, Time Life Inc. (1993–2003) | | 87 | | None |
| R. Clark Hooper, 1946 | | 2010 | | Private investor | | 90 | | None |
| Merit E. Janow, 1958 | | 2007 | | Dean and Professor, Columbia University, School of International and Public Affairs | | 89 | | Mastercard Incorporated; Trimble Inc. |
Margaret Spellings, 1957
Chairman of the Board (Independent and Non-Executive) | | 2010 | | President and CEO, Texas 2036; former President, Margaret Spellings & Company (public policy and strategic consulting); former President, The University of North Carolina; former President, George W. Bush Foundation | | 91 | | None |
| Alexandra Trower, 1964 | | 2018 | | Executive Vice President, Global Communications and Corporate Officer, The Estée Lauder Companies | | 86 | | None |
| Paul S. Williams, 1959 | | 2020 | | Former Partner/Managing Director, Major, Lindsey & Africa (executive recruiting firm) | | 86 | | Compass Minerals, Inc. (producer of salt and specialty fertilizers); Public Storage, Inc. |
Interested trustees4,5
Name, year of birth and
position with series | | Year first
elected
a trustee
or officer
of the series2 | | Principal occupation(s) during past five years
and positions held with affiliated entities or
the principal underwriter of the series | | Number of
portfolios in fund
complex overseen
by trustee | | Other directorships3
held by trustee |
Donald D. O’Neal, 1960
Co-President | | 1998 | | Partner — Capital International Investors, Capital Research and Management Company; Partner — Capital International Investors, Capital Bank and Trust Company6 | | 35 | | None |
| Michael C. Gitlin, 1970 | | 2019 | | Vice Chairman and Director, Capital Research and Management Company; Partner — Capital Fixed Income Investors, Capital Research and Management Company; Director, The Capital Group Companies, Inc.6; served as Head of Fixed Income at a large investment management firm prior to joining Capital Research and Management Company in 2015 | | 86 | | None |
The series statement of additional information includes further details about the series trustees and is available without charge upon request by calling American Funds Service Company at (800) 421-4225 or by visiting the Capital Group website at capitalgroup.com. The address for all trustees and officers of the series is 333 South Hope Street, Los Angeles, CA 90071. Attention: Secretary.
| 342 | American Funds Insurance Series |
Other officers5
Name, year of birth and
position with series | | Year first
elected
an officer
of the series2 | | Principal occupation(s) during past five years and positions held with affiliated entities
or the principal underwriter of the series |
Alan N. Berro, 1960
Co-President | | 1998 | | Partner — Capital World Investors, Capital Research and Management Company; Partner — Capital World Investors, Capital Bank and Trust Company6; Director, The Capital Group Companies, Inc.6 |
Maria Manotok, 1974
Executive Vice President | | 2012 | | Senior Vice President and Senior Counsel — Fund Business Management Group, Capital Research and Management Company; Senior Vice President, Senior Counsel and Director, Capital International, Inc.6; Director, Capital Group Investment Management Limited6 |
Martin Jacobs, 1962
Vice President | | 2016 | | Partner — Capital Research Global Investors, Capital Research and Management Company |
Carl M. Kawaja, 1964
Vice President | | 2008 | | Partner — Capital World Investors, Capital Research and Management Company; Chairman and Director, Capital Research and Management Company; Partner — Capital World Investors, Capital Bank and Trust Company6 |
Sung Lee, 1966
Vice President | | 2008 | | Partner — Capital Research Global Investors, Capital International, Inc.6; Director, The Capital Group Companies, Inc.6 |
Keiko McKibben, 1969
Vice President | | 2010 | | Partner — Capital Research Global Investors, Capital Research and Management Company |
Renaud H. Samyn, 1974
Vice President | | 2010 | | Partner — Capital Research Global Investors, Capital International, Inc.6 |
Steven I. Koszalka, 1964
Secretary | | 2003 | | Vice President — Fund Business Management Group, Capital Research and Management Company |
Gregory F. Niland, 1971
Treasurer | | 2008 | | Vice President — Investment Operations, Capital Research and Management Company |
Susan K. Countess, 1966
Assistant Secretary | | 2014 | | Associate — Fund Business Management Group, Capital Research and Management Company |
Sandra Chuon, 1972
Assistant Treasurer | | 2019 | | Assistant Vice President — Investment Operations, Capital Research and Management Company |
Brian C. Janssen, 1972
Assistant Treasurer | | 2015 | | Vice President — Investment Operations, Capital Research and Management Company |
| 1 | The term independent trustee refers to a trustee who is not an “interested person” of the series within the meaning of the Investment Company Act of 1940. |
| 2 | Trustees and officers of the series serve until their resignation, removal or retirement. |
| 3 | This includes all directorships/trusteeships (other than those in the American Funds or other funds managed by Capital Research and Management Company or its affiliates) that are held by each trustee as a trustee or director of a public company or a registered investment company. |
| 4 | The term interested trustee refers to a trustee who is an “interested person” within the meaning of the Investment Company Act of 1940, on the basis of their affiliation with the series investment adviser, Capital Research and Management Company, or affiliated entities (including the series principal underwriter). |
| 5 | All of the trustees and/or officers listed, with the exception of Martin Jacobs and Keiko McKibben, are officers and/or directors/trustees of one or more of the other funds for which Capital Research and Management Company serves as investment adviser. |
| 6 | Company affiliated with Capital Research and Management Company. |
| American Funds Insurance Series | 343 |
Office of the series
333 South Hope Street
Los Angeles, CA 90071-1406
Investment adviser
Capital Research and Management Company
333 South Hope Street
Los Angeles, CA 90071-1406
Investment subadviser
Milliman Financial Risk Management LLC
(Managed Risk Funds only)
71 South Wacker Drive, 31st Floor
Chicago, IL 60606
Custodian of assets
State Street Bank and Trust Company
One Lincoln Street
Boston, MA 02111
Counsel
Morgan, Lewis & Bockius LLP
One Federal Street
Boston, MA 02110-1726
Independent registered public accounting firm
PricewaterhouseCoopers LLP
601 South Figueroa Street
Los Angeles, CA 90017-3874
| 344 | American Funds Insurance Series |
Investors should carefully consider investment objectives, risks, charges and expenses. This and other important information is contained in the series prospectuses and summary prospectuses, which can be obtained from your financial professional and should be read carefully before investing. You may also call American Funds Service Company (AFS) at (800) 421-4225 or visit the Capital Group website at capitalgroup.com.
“American Funds Proxy Voting Procedures and Principles” — which describes how we vote proxies relating to portfolio securities — is available on the Capital Group website or upon request by calling AFS. The series files its proxy voting record with the U.S. Securities and Exchange Commission (SEC) for the 12 months ended June 30 by August 31. The proxy voting record is available free of charge on the SEC website at sec.gov and on the Capital Group website.
American Funds Insurance Series files a complete list of its portfolio holdings with the SEC for the first and third quarters of each fiscal year on Form NPORT-P. This filing is available free of charge on the SEC website and our website.
This report is for the information of American Funds Insurance Series investors, but it also may be used as sales literature when preceded or accompanied by the current prospectuses or summary prospectuses for American Funds Insurance Series and the prospectus for the applicable insurance contract, which give details about charges, expenses, investment objectives and operating policies of the series. If used as sales material after March 31, 2021, this report must be accompanied by a statistical update for the most recently completed calendar quarter.
Fund attribution data was produced using FactSet, a third-party software system, based on daily portfolios. Securities in their initial period of acquisition may not be included in this analysis. The analysis includes equity investments only and excludes forward contracts and fixed income investments, if applicable. It does not account for buy-and-sell transactions that might have occurred intraday. As a result, average portfolio weight percentages are approximate, and the actual average portfolio weight percentages might be higher or lower. Data elements, such as pricing, income, market cap, etc., were provided by FactSet. The indexes provided for attribution are based on FactSet’s methodology. The indexes are broad-based market benchmarks and may not be used by Capital Group® as the sole comparative index for the funds. Capital Group believes the software and information from FactSet to be reliable. However, Capital Group cannot be responsible for inaccuracies, incomplete information or updating of information by FactSet.
Futures may not provide an effective hedge of the underlying securities because changes in the prices of futures may not track those of the securities they are intended to hedge. In addition, the managed risk strategy may not effectively protect the fund from market declines and will limit the fund’s participation in market gains. The use of the managed risk strategy could cause the fund’s return to lag that of the underlying fund in certain market conditions.
Bloomberg® is a trademark and service mark of Bloomberg Finance L.P. (collectively with its affiliates, “Bloomberg”). Barclays® is a trademark and service mark of Barclays Bank Plc (collectively with its affiliates, “Barclays”), used under license. Bloomberg or Bloomberg’s licensors, including Barclays, own all proprietary rights in the Bloomberg Barclays Indices. Neither Bloomberg nor Barclays approve or endorse this material, or guarantees the accuracy or completeness of any information herein, or makes any warranty, express or implied, as to the results to be obtained therefrom and, to the maximum extent allowed by law, neither shall have any liability or responsibility for injury or damages arising in connection therewith. This report, and any product, index or fund referred to herein, is not sponsored, endorsed or promoted in any way by J.P. Morgan or any of its affiliates who provide no warranties whatsoever, express or implied, and shall have no liability to any prospective investor in connection with this report. J.P. Morgan disclaimer: http://www.jpmorgan.com/pages/jpmorgan/ib/girg. MSCI has not approved, reviewed or produced this report, makes no express or implied warranties or representations and is not liable whatsoever for any data in the report. You may not redistribute the MSCI data or use it as a basis for other indices or investment products. The S&P 500 is a product of S&P Dow Jones Indices LLC and/or its affiliates and has been licensed for use by Capital Group. Copyright © 2020 S&P Dow Jones Indices LLC, a division of S&P Global, and/or its affiliates. All rights reserved. Redistribution or reproduction in whole or in part is prohibited without written permission of S&P Dow Jones Indices LLC.
American Funds Distributors, Inc., member FINRA.
The Capital Advantage®
Since 1931, Capital Group, home of American Funds, has helped investors pursue long-term investment success. Our consistent approach — in combination with The Capital SystemSM — has resulted in superior outcomes.
| | Aligned with investor success |
| | We base our decisions on a long-term perspective, which we believe aligns our goals with the interests of our clients. American Funds Insurance Series portfolio managers average 28 years of investment experience, including 23 years at our company, reflecting a career commitment to our long-term approach.1 |
| | |
| | The Capital System |
| | The Capital System combines individual accountability with teamwork. Funds using The Capital System are divided into portions that are managed independently by investment professionals with diverse backgrounds, ages and investment approaches. An extensive global research effort is the backbone of our system. |
| | |
| | American Funds Insurance Series superior outcomes |
| | American Funds Insurance Series equity funds have beaten their comparable Lipper indexes in 90% of 10-year periods and 100% of 20-year periods.2 Our fixed income funds have helped investors achieve diversification through attention to correlation between bonds and equities.3 We strive to keep management fees competitive. Over the past 20 years, most funds’ fees have been below industry averages.4 |
| | 1 | Portfolio manager experience as of the American Funds Insurance Series prospectus dated May 1, 2020. |
| | 2 | Based on Class 1 share results for rolling periods through December 31, 2019. Periods covered are the shorter of the fund’s lifetime or since the inception date of the comparable Lipper index or average. The comparable Lipper indexes are: Global Funds Index (Global Growth Fund, Global Growth and Income Fund), Growth Funds Index (Growth Fund), International Funds Index (International Fund), Emerging Markets Funds Index (New World Fund), Growth & Income Funds Index (Blue Chip Income and Growth Fund, Growth-Income Fund) and Balanced Funds Index (Asset Allocation Fund). The Lipper Global Small-/Mid-Cap Funds Average was used for Global Small Capitalization Fund. Lipper source: Refinitiv Lipper. There have been periods when the fund has lagged the index. |
| | 3 | Based on Class 1 share results as of December 31, 2019. Four of our five fixed income funds showed a three-year correlation below 0.1. Standard & Poor’s 500 |
| | | Composite Index was used as an equity market proxy. Correlation based on monthly total returns. Correlation is a statistical measure of how two securities move in relation to each other. A correlation ranges from –1 to 1. A positive correlation close to 1 implies that as one security moves, either up or down, the other security will move in “lockstep,” in the same direction. A negative correlation close to –1 indicates that the securities have moved in the opposite direction. |
| | 4 | Based on management fees for the 20-year period ended December 31, 2019, versus comparable Lipper categories, excluding funds of funds. |
| | | |
| All Capital Group trademarks mentioned are owned by The Capital Group Companies, Inc., an affiliated company or fund. All other company and product names mentioned are the property of their respective companies. |

Item 2. Code of Ethics.
As of December 31, 2020, the Registrant adopted a Code of Ethics that applies to the Principal Executive Officer, Principal Financial Officer, and other senior financial officers pursuant to the Sarbanes-Oxley Act of 2002. For the year ended December 31, 2020, there were no reportable amendments to any provisions of the Code of Ethics and the Registrant did not grant any waivers, including implicit waivers, from any provisions of the Code of Ethics. A copy of its Code of Ethics is filed with this Form N-CSR under Item 13(a)(1).
Item 3. Audit Committee Financial Expert.
The Registrant’s Board of Trustees has determined that Susan B. Sweeney and Nabil N. El-Hage, both members of the Audit Committee, are audit committee financial experts as defined by the Securities and Exchange Commission (the “SEC”). Ms. Sweeney and Mr. El-Hage are both “independent” as defined by the SEC for purposes of audit committee financial expert determinations.
Item 4. Principal Accountant Fees and Services.
References below to Deloitte & Touche LLP include its affiliates where applicable.
| (a) | AUDIT FEES: The aggregate fees billed to the Registrant for professional services rendered by its independent auditors, Deloitte & Touche LLP, for the audit of the Registrant’s annual financial statements for the fiscal years ended 2020 and 2019 were $1,336,204 and $859,881, respectively. |
| (b) | AUDIT RELATED FEES: No such fees were billed to the Registrant by Deloitte & Touche LLP for the fiscal years ended 2020 and 2019. No such fees were billed to the Registrant’s adviser and any entity controlling, controlled by, or under common control with the adviser that provides ongoing services to the Registrant by Deloitte & Touche LLP* for the fiscal years ended 2020 and 2019. |
| (c) | TAX FEES: The aggregate fees billed to the Registrant for professional services rendered by Deloitte & Touche LLP for the review of Form 1120-RIC, Form 8613, excise distribution projections, distribution calculation and reasonable out of pocket expenses for the fiscal years ended 2020 and 2019 were $67,374 and $137,186, respectively. No such fees were billed to the Registrant’s adviser and any entity controlling, controlled by, or under common control with the adviser that provides ongoing services to the Registrant by Deloitte & Touche LLP* for the fiscal years ended 2020 and 2019. |
| (d) | ALL OTHER FEES: No such fees were billed to the Registrant by Deloitte & Touche LLP for the fiscal years ended 2020 and 2019. No such fees were billed to the Registrant’s adviser and any entity controlling, controlled by, or under common control with the adviser that provides ongoing services to the Registrant by Deloitte & Touche LLP* for the fiscal years ended 2020 and 2019. |
| (e) | (1) AUDIT COMMITTEE PRE-APPOVAL POLICY: All services to be performed for the Registrant by Deloitte & Touche LLP must be pre-approved by the audit committee. All services performed during the fiscal years ended 2020 and 2019 were pre-approved by the committee. |
(2) Not applicable.
| (g) | The aggregate non-audit fees billed by Deloitte & Touche LLP for services rendered to the Registrant, the Registrant’s adviser and any entity controlling, controlled by, or under common control with the adviser that provides ongoing services to the Registrant, for the fiscal years ended 2020 and 2019 were $79,176 and $1,559,071, respectively. |
| (h) | The audit committee considers whether the provision of non-audit services by Deloitte & Touche LLP to the Registrant's adviser and any entity controlling, controlled by, or under common control with the adviser that provides ongoing services to the Registrant that were not pre-approved pursuant to paragraph (c)(7)(ii) of Rule 2-01 of Regulation S-X is compatible with maintaining Deloitte & Touche LLP's independence. |
| * | Refers to fees that were required to be approved by the audit committee for services that relate directly to the operations and financial reporting of the Registrant. |
Item 5. Audit Committee of Listed Registrants.
Not applicable to this filing.
Item 6. Investments.
Please see portfolio of investments contained in the Reports to Stockholders included under Item 1 of this form N-CSR.
Item 7. Disclosure of Proxy Voting Policies and Procedures for Closed-End Management Investment Companies.
Not applicable to this filing.
Item 8. Portfolio Managers of Closed-End Management Investment Companies.
Not applicable to this filing.
Item 9. Purchases of Equity Securities by Closed-End Management Investment Company and Affiliated Purchasers.
Not applicable to this filing.
Item 10. Submission of Matters to a Vote of Security Holders.
Not applicable to this filing.
Item 11. Controls and Procedures.
(a) The Registrant’s Principal Executive Officer and Principal Financial Officer have concluded that the Registrant’s disclosure controls and procedures (as defined in Rule 30a-3(c) under the Investment Company Act of 1940, as amended (the “1940 Act”) (17 CFR 270.30a-3(c))) are effective, as of a date within 90 days of the filing date of this Form N-CSR, to provide reasonable assurance that the information required to be disclosed by the Registrant on Form N-CSR is recorded, processed, summarized, and reported within the time periods specified in the SEC’s rules and forms, based on their evaluation of these disclosure controls and procedures required by Rule 30a-3(b) under the 1940 Act (17 CFR 270.30a-3(b)) and Rules 13a-15(b) or 15d-15(b) under the Securities Exchange Act of 1934 (17 CFR 240.13a-15(b) or 240.15d-15(b)).
(b) There were no changes in the Registrant’s internal control over financial reporting (as defined in Rule 30a-3(d) under the 1940 Act (17 CFR 270.30a-3(d))) that occurred during the period covered by this report that has materially affected, or is reasonably likely to materially affect, the Registrant’s internal control over financial reporting.
Item 12. Disclosure of Securities Lending Activities for Closed-End Management Investment Companies
Not applicable to this filing.
Item 13. Exhibits.
(a)(1) Code of Ethics (Item 2) is attached.
(a)(2) Certifications of the Principal Executive Officer and Principal Financial Officer of the Registrant as required by Rule 30a-2(a) under the 1940 Act (17 CFR 270.30a-2(a)) are attached hereto as Exhibit 99CERT.
(a)(3) Not applicable to this filing.
(a)(4) Not applicable to this filing.
(b)(1) Certifications pursuant to Section 906 of the Sarbanes-Oxley Act of 2002 as required by Rule 30a-2(b), under the 1940 Act (17 CFR 270.30a-2(b)), Rule 15d-14(b) under the Securities Exchange Act of 1934 (17 CFR 240.15d-14(b)) and Section 1350 of Chapter 63 of Title 18 of the United States Code (18 U.S.C. 1350) are attached hereto as Exhibit 99.906CERT.
(b)(2) Certifications pursuant to Sections 302 and 906 of the Sarbanes-Oxley Act of 2002 as required by Rule 30a-2, under the 1940 Act (17 CFR 270.30a-2), and, as applicable, Rule 15d-14(b) under the Securities Exchange Act of 1934 (17 CFR 240.15d-14(b)) and Section 1350 of Chapter 63 of Title 18 of the United States Code (18 U.S.C. 1350) are attached hereto as Exhibit 99.906CERT.
SIGNATURES
Pursuant to the requirements of the Securities Exchange Act of 1934 and the Investment Company Act of 1940, the registrant has duly caused this report to be signed on its behalf by the undersigned, thereunto duly authorized.
| (Registrant) | MML Series Investment Fund |
| By (Signature and Title) | /s/Paul LaPiana |
| | Paul LaPiana, President and Principal Executive Officer |
Pursuant to the requirements of the Securities Exchange Act of 1934 and the Investment Company Act of 1940, this report has been signed below by the following persons on behalf of the registrant and in the capacities and on the dates indicated.
| By (Signature and Title) | /s/Paul LaPiana |
| | Paul LaPiana, President and Principal Executive Officer |
| By (Signature and Title) | /s/Renee Hitchcock |
| | Renee Hitchcock, Treasurer and Principal Financial Officer |