UNITED STATES
SECURITIES AND EXCHANGE COMMISSION
Washington, D.C. 20549
FORM N-CSR
CERTIFIED SHAREHOLDER REPORT OF REGISTERED
MANAGEMENT INVESTMENT COMPANIES
| Investment Company Act file number | 811-02224 |
| |
| MML Series Investment Fund |
| (Exact name of registrant as specified in charter) |
| | |
| 1295 State Street, Springfield, MA 01111 | |
| (Address of principal executive offices) | (Zip code) |
| Paul LaPiana |
| 1295 State Street, Springfield, MA 01111 | |
| (Name and address of agent for service) |
| | | |
| Registrant's telephone number, including area code: | (413) 744-1000 | |
| | | |
| Date of fiscal year end: | 12/31/2022 | |
| | | |
| Date of reporting period: | 6/30/2022 | |
| | | | | | | | | |
Item 1. Reports to Stockholders.
| (a) | The Reports to Stockholders are attached herewith. |

This material must be preceded or accompanied by a current prospectus (or summary prospectus, if available) for the MML Series Investment Fund. Investors should consider a Fund’s investment objective, risks, and charges and expenses carefully before investing. This and other information about the investment company is available in the prospectus (or summary prospectus, if available). Read it carefully before investing.
[THIS PAGE INTENTIONALLY LEFT BLANK]
MML Series Investment Fund – President’s Letter to Shareholders (Unaudited) |
To Our Shareholders

Paul LaPiana
“As always, we recommend that you work with a personal financial professional, who can help you define an investment strategy that aligns with your comfort level with respect to market volatility, how long you have to save and invest, and your specific financial goals.”
June 30, 2022
Welcome to the MML Series Investment Fund Semiannual Report, covering the six months ended June 30, 2022.
Market Highlights
● | For the reporting period from January 1, 2022 through June 30, 2022, U.S. stock prices declined significantly, with investors worrying less about COVID-19 and more about other issues, including high inflation, tighter monetary policy, rising interest rates, the war between Russia and Ukraine, and the increasing odds of a global recession. |
● | In the first quarter of 2022 investors in both stocks and bonds were challenged by the unexpected invasion of Ukraine by Russia, a stalled economic stimulus plan in the U.S., and the U.S. Federal Reserve Board (the “Fed”) raising interest rates for the first time since 2018. |
● | The second quarter of 2022 was another difficult quarter as investor concerns over high inflation and the risk of a global recession dominated the narrative. |
● | Foreign stocks in both developed markets and emerging markets experienced significant losses in the reporting period, hindered by the unexpected economic impact of the Russian-Ukraine war, slowing economic activity in China due to massive COVID-19 lockdowns, and the strengthening of the U.S. dollar. |
● | U.S. bond investors experienced negative returns as the reversal of accommodative monetary policy drove yields higher while concerns over increased default risk due to a global recession further drove corporate bond prices lower. |
Market Commentary
For the six months beginning on January 1, 2022, global stock investors experienced significant losses. In response, U.S. stocks fell sharply in the period, with the S&P 500 Index®1 having its worst first half of the year since 1970, down nearly 20%. Investors sought safety from high inflation, rising interest rates, and the increasing possibility of a recession. Consumer sentiment fell sharply, down 17.3% in the period2, as high inflation driven by rising energy, food, and housing costs overwhelmed low unemployment and strong wage growth. As of May 2022, 58% of Americans were living paycheck to paycheck3, up from 54% a year ago.
1 The S&P 500 Index measures the performance of 500 widely held stocks in the U.S. equity market. Standard and Poor’s chooses member companies for the index based on market size, liquidity, and industry group representation. Included are the stocks of industrial, financial, utility, and transportation companies. Since mid-1989, this composition has been more flexible and the number of issues in each sector has varied. It is market capitalization-weighted. The Index does not reflect any deduction for fees, expenses, or taxes and cannot be purchased directly by investors.
2 June 24, 2022, University of Michigan: Consumer Sentiment (UMCSENT), retrieved from FRED, Federal Reserve Bank of St. Louis; https://fred.stlouisfed.org/series/UMCSENT
3 June/July 2022 edition, New Reality Check: The paycheck-to Paycheck Report, https://www.pymnts.com/wp-content/uploads/2022/06/PYMNTS-New-Reality-Check-Report-June-July-2022.pdf
1
MML Series Investment Fund – President’s Letter to Shareholders (Unaudited) (Continued) |
As a result, the broad market S&P 500® Index fell 19.96% for the period. The technology-heavy NASDAQ Composite® Index4 performed even worse, dropping 29.23% for the period. The more economically sensitive Dow Jones Industrial Average5 was down 14.44% for the period. During this period, small-cap stocks underperformed their larger cap peers, while value stocks outperformed their growth peers.
This environment of high inflation, rising interest rates, and increasing recession fears affected sectors differently. The consumer discretionary, communication services, and information technology sectors significantly underperformed other sectors. The energy and utility sectors fared the best for this six-month period, as energy prices pushed significantly higher. West Texas Intermediate (WTI) crude oil prices ended the period at $105.76 per barrel, up 40% for the six-month period.
Developed international stock markets, as measured by the MSCI EAFE® Index6, also performed poorly, falling 19.57% for the six-month period, hindered by recession fears and a strengthening U.S. dollar. Emerging-market stock markets, as measured by the MSCI Emerging Markets® Index7, were also down significantly, falling 17.63% for the period. An increase in Chinese government stimulus helped the Chinese stock market deliver positive performance in the second quarter. The Fed continued to assert its influence on markets by raising the benchmark federal-funds rate by 0.25% in March, 0.50% in May, and 0.75% in June, with investors expecting another 1.75% in rate hikes by year-end.
Investors entered the period in the midst of a global recovery that was being fueled by monetary stimulus, expectations for more fiscal stimulus, and a vaccination-fueled economic and corporate earnings recovery. However, this recovery was soon disrupted by the invasion of Ukraine by Russia, China’s broad lockdowns to stem the spread of COVID-19, increasing inflation, and more aggressive monetary tightening by the Fed. In this environment, bond yields rose, with the 10-year U.S. Treasury bond reaching a high of 3.49% in June before ending the period at 2.98%. Since rising yields generally drive bond prices down, the Bloomberg U.S. Aggregate Bond Index8 ended the period down 10.35%. Investment-grade bond prices fared worse as concerns of defaults increased. The Bloomberg U.S. Corporate Bond Index9, which tracks investment-grade corporate bonds, ended the period down 14.39%. Below investment grade bonds, as represented by the Bloomberg U.S. Corporate High-Yield Bond Index10, also performed poorly, ending the period down 14.19%, aided by investor concern that debt defaults could increase should the global recession scenario play out.
4 The NASDAQ Composite Index measures the performance of all domestic and international based common type stocks listed on the NASDAQ Stock Market. It includes common stocks, ordinary shares, ADRs, shares of beneficial interest or limited partnership interests and tracking stocks. The index is market capitalization-weighted. The Index does not reflect any deduction for fees, expenses, or taxes and cannot be purchased directly by investors.
5 The DJ Industrial Average Index measures the performance of stocks of 30 U.S. blue-chip companies covering all industries with the exception of transportation and utilities. It is price-weighted. The Index does not reflect any deduction for fees or expenses and cannot be purchased directly by investors.
6 The MSCI EAFE Index measures the performance of the large- and mid-cap segments of developed markets, excluding the U.S. and Canada equity securities. It is free float-adjusted market-capitalization weighted. The Index does not reflect any deduction for fees or expenses and cannot be purchased directly by investors
7 The MSCI Emerging Markets Index measures the performance of the large- and mid-cap segments of emerging market equity securities. It is free float-adjusted market-capitalization weighted. The Index does not reflect any deduction for fees or expenses and cannot be purchased directly by investors.
8 The Bloomberg U.S. Aggregate Bond Index measures the performance of investment grade, U.S. dollar-denominated, fixed-rate taxable bond market securities, including Treasuries, government-related and corporate securities, mortgage-backed securities (MBS) (agency fixed-rate and hybrid ARM pass-throughs), asset-backed securities (ABS), and commercial mortgage-backed securities (CMBS). It rolls up into other Bloomberg flagship indexes, such as the multi-currency Global Aggregate Index and the U.S. Universal Index, which includes high yield and emerging markets debt. The Index does not reflect any deduction for fees, expenses, or taxes and cannot be purchased directly by investors.
9 The Bloomberg U.S. Corporate Bond Index measures the performance of the investment grade, U.S. dollar-denominated, fixed-rate, taxable corporate bond market. It includes U.S. dollar-denominated securities publicly issued by U.S. and non-U.S. industrial, utility, and financial issuers that meet specified maturity, liquidity, and quality requirements. The Index does not reflect any deduction for fees, expenses, or taxes and cannot be purchased directly by investors.
10 The Bloomberg U.S. Corporate High-Yield Bond Index measures the performance of U.S. dollar-denominated, non-investment grade, fixed-rate, taxable corporate bonds, including corporate bonds, fixed-rate bullet, putable, and callable bonds, SEC Rule 144A securities, original issue zeros, pay-in-kind bonds, fixed-rate and fixed-to-floating capital securities. The Index does not reflect any deduction for fees, expenses, or taxes and cannot be purchased directly by investors.
2
MML Series Investment Fund – President’s Letter to Shareholders (Unaudited) (Continued) |
Review and maintain your strategy
MassMutual is committed to helping people secure their long-term future and protect the ones they love. While the return of volatility and the reality of market sell-offs can test an investor’s mettle, we’d like to remind you as a retirement investor that it’s important to maintain perspective and have realistic expectations about the future performance of your investment accounts. As described in this report, financial markets can reverse suddenly with little or no notice. Our multi-managed and sub-advised mutual funds tap into the deep expertise of seasoned asset managers who are committed to helping long-term investors prepare for retirement – in all market conditions. As always, we recommend that you work with a personal financial professional, who can help you define an investment strategy that aligns with your comfort level with respect to market volatility, how long you have to save and invest, and your specific financial goals. Thank you for your confidence in MassMutual.
Sincerely,

Paul LaPiana
President
MML Series Investment Fund
MML Investment Advisers, LLC
© 2022 Massachusetts Mutual Life Insurance Company (MassMutual®), Springfield, MA 01111-0001. All rights reserved. www.MassMutual.com Underwriter: MML Distributors, LLC. (MMLD) Member FINRA and SIPC (www.FINRA.org and www.SIPC.org), 1295 State Street, Springfield, MA 01111-0001. MMLD is a wholly-owned subsidiary of MassMutual. Investment advisory services provided to the Funds by MML Investment Advisers, LLC (MML Advisers), a wholly-owned subsidiary of MassMutual.
The information provided is the opinion of MML Advisers as of 7/1/2022 and is subject to change without notice. It is not to be construed as tax, legal, or investment advice. Of course, past performance does not guarantee future results.
MM202307-302267
3
MML Allocation Series – Portfolio Summaries (Unaudited) |
What are the investment approaches of the Funds that constitute the MML Allocation Series (the “Series”), and who is the Series’ investment adviser?
The MML Allocation Series comprises five Funds – each of which has a “fund of funds” structure. The five Funds in the Series are MML Conservative Allocation Fund, MML Balanced Allocation Fund, MML Moderate Allocation Fund, MML Growth Allocation Fund, and MML Aggressive Allocation Fund. Each Fund seeks to achieve as high a total return over time as is considered consistent with prudent investment risk, preservation of capital, and recognition of the Fund’s stated asset allocation. Each Fund invests in a combination of U.S. domestic and international mutual funds (“MML Underlying Funds”) using an asset allocation strategy. MML Underlying Funds will include a combination of series of the MML Series Investment Fund and MML Series Investment Fund II (advised by MML Investment Advisers, LLC (“MML Advisers”), a wholly-owned subsidiary of Massachusetts Mutual Life Insurance Company (MassMutual), and may also include other, non-affiliated mutual funds. The MML Underlying Funds may invest in various asset classes, including equity securities, fixed income securities, and money market instruments. The Series’ investment adviser is MML Advisers. Each Fund will normally invest most of its assets in MML Underlying Funds advised by MML Advisers; each Fund will normally invest no more than 10% of its assets in mutual funds not advised by MML Advisers (referred to here as “non-affiliated” funds). Each Fund’s assets are allocated to its MML Underlying Funds according to an asset allocation strategy stated below
● | MML Conservative Allocation Fund: Approximately 35% to 45% in equity funds and 55% to 65% in fixed income funds, including money market funds. |
● | MML Balanced Allocation Fund: Approximately 45% to 55% in equity funds and 45% to 55% in fixed income funds, including money market funds. |
● | MML Moderate Allocation Fund: Approximately 55% to 65% in equity funds and 35% to 45% in fixed income funds, including money market funds. |
● | MML Growth Allocation Fund: Approximately 70% to 80% in equity funds and 20% to 30% in fixed income funds, including money market funds. |
● | MML Aggressive Allocation Fund: Approximately 85% to 95% in equity funds and 5% to 15% in fixed income funds, including money market funds. |
4
MML Allocation Series – Portfolio Summaries (Unaudited) (Continued) |
MML Conservative Allocation Fund
Asset Allocation
(% of Net Assets) on 6/30/22 |
Fixed Income Funds | 59.9% |
Equity Funds | 40.2% |
Total Long-Term Investments | 100.1% |
Other Assets & Liabilities | (0.1)% |
Net Assets | 100.0% |
| | |
MML Moderate Allocation Fund
Asset Allocation
(% of Net Assets) on 6/30/22 |
Equity Funds | 60.2% |
Fixed Income Funds | 39.9% |
Total Long-Term Investments | 100.1% |
Other Assets & Liabilities | (0.1)% |
Net Assets | 100.0% |
| | |
MML Balanced Allocation Fund
Asset Allocation
(% of Net Assets) on 6/30/22 |
Fixed Income Funds | 53.3% |
Equity Funds | 46.8% |
Total Long-Term Investments | 100.1% |
Other Assets & Liabilities | (0.1)% |
Net Assets | 100.0% |
| | |
MML Growth Allocation Fund
Asset Allocation
(% of Net Assets) on 6/30/22 |
Equity Funds | 73.7% |
Fixed Income Funds | 26.4% |
Total Long-Term Investments | 100.1% |
Other Assets & Liabilities | (0.1)% |
Net Assets | 100.0% |
| | |
MML Aggressive Allocation Fund
Asset Allocation
(% of Net Assets) on 6/30/22 |
Equity Funds | 89.3% |
Fixed Income Funds | 10.8% |
Total Long-Term Investments | 100.1% |
Other Assets & Liabilities | (0.1)% |
Net Assets | 100.0% |
| | |
5
MML American Funds Growth Fund – Portfolio Summaries (Unaudited) |
What is the investment approach of MML American Funds Growth Fund, and who is the Fund’s investment adviser?
The Fund seeks to provide investors with growth of capital through a “master feeder” relationship. (See page 176 of this report for information about the “master feeder” relationship.) The Fund invests all of its assets in Class 1 shares of the American Funds Insurance Series – Growth Fund (the “Master Growth Fund”), a series of the American Funds Insurance Series, a registered open-end investment company, managed by Capital Research and Management Company (Capital Research) with substantially the same investment objective. The Master Growth Fund invests primarily in common stocks and seeks to invest in companies that appear to offer superior opportunities for growth of capital. The Master Growth Fund may invest up to 25% of its assets in common stocks and other securities of issuers domiciled outside the United States. The Master Growth Fund may hold a portion of its assets in cash or cash equivalents. The Fund’s investment adviser is MML Investment Advisers, LLC (MML Advisers).
MML American Funds Growth Fund
Asset Allocation
(% of Net Assets) on 6/30/22 |
Equity Funds | 100.1% |
Total Long-Term Investments | 100.1% |
Other Assets & Liabilities | (0.1)% |
Net Assets | 100.0% |
| | |
6
MML American Funds International Fund – Portfolio Summaries (Unaudited) |
What is the investment approach of MML American Funds International Fund, and who is the Fund’s investment adviser?
The Fund seeks long-term capital growth of assets through a “master-feeder” relationship. (See page 176 of this report for information about the “master feeder” relationship.) The Fund invests all of its assets in Class 1 shares of the American Funds Insurance Series – International Fund (the “Master International Fund”), a series of the American Funds Insurance Series, a registered open-end investment company managed by Capital Research and Management Company (Capital Research) with substantially the same investment objective. The Master International Fund invests primarily in common stocks of companies domiciled outside the United States, including companies domiciled in emerging markets, that Capital Research believes have the potential for growth. The Master International Fund may hold a portion of its assets in cash or cash equivalents. The Fund’s investment adviser is MML Investment Advisers, LLC (MML Advisers).
MML American Funds International Fund
Asset Allocation
(% of Net Assets) on 6/30/22 |
Mutual Funds | 100.2% |
Total Long-Term Investments | 100.2% |
Other Assets and Liabilities | (0.2)% |
Net Assets | 100.0% |
| | |
7
MML American Funds Core Allocation Fund – Portfolio Summaries (Unaudited) |
What is the investment approach of MML American Funds Core Allocation Fund, and who is the Fund’s investment adviser?
The Fund seeks to achieve as high a total return over time as is considered consistent with prudent investment risk, preservation of capital and recognition of the Fund’s stated asset allocation. The Fund is a “fund of funds” that seeks to achieve its investment objective by principally investing in a combination of series of the American Funds Insurance Series (the “American Underlying Funds”), managed by Capital Research and Management Company (Capital Research), using a flexible asset allocation approach. The Fund’s investment adviser invests the Fund’s assets in a combination of U.S. domestic and international American Underlying Funds. As of the date of this report, it is expected that the American Underlying Funds will include Class 1 shares of the American Funds Insurance Series - The Bond Fund of America, the American Funds Insurance Series - Washington Mutual Investors Fund, the American Funds Insurance Series - Growth-Income Fund, and the American Funds Insurance Series - International Fund. The Fund’s investment adviser allocates the Fund’s assets among a variety of different asset classes through investing in American Underlying Funds in response to changing market, economic, and investment conditions. The Fund’s investment adviser is MML Investment Advisers, LLC (MML Advisers).
MML American Funds Core Allocation Fund
Asset Allocation
(% of Net Assets) on 6/30/22 |
Equity Funds | 64.4% |
Fixed Income Funds | 35.7% |
Total Long-Term Investments | 100.1% |
Other Assets & Liabilities | (0.1)% |
Net Assets | 100.0% |
| | |
8
MML Blue Chip Growth Fund – Portfolio Summaries (Unaudited) |
What is the investment approach of MML Blue Chip Growth Fund, and who is the Fund’s subadviser?
The Fund seeks long-term capital growth. Income is a secondary objective. Under normal circumstances, the Fund invests at least 80% of net assets (plus the amount of any borrowings for investment purposes) in the common stocks of large- and medium-sized blue chip growth companies. The Fund’s subadviser currently defines blue chip growth companies to mean firms that, in its view, are well-established in their industries and have the potential for above-average earnings growth. The Fund’s subadviser is T. Rowe Price Associates, Inc. (T. Rowe Price). Effective July 1, 2022, the Fund is non-diversified, which means that it may hold larger positions in a smaller number of issuers than a diversified fund.
MML Blue Chip Growth Fund
Largest Holdings
(% of Net Assets) on 6/30/22 |
Amazon.com, Inc. | 9.4% |
Alphabet, Inc. Class C | 8.4% |
Microsoft Corp. | 7.7% |
Apple, Inc. | 7.3% |
UnitedHealth Group, Inc. | 5.0% |
Tesla, Inc. | 4.6% |
Visa, Inc. Class A | 3.7% |
Meta Platforms, Inc. Class A | 3.2% |
ServiceNow, Inc. | 3.0% |
NVIDIA Corp. | 3.0% |
| | 55.3% |
| | |
MML Blue Chip Growth Fund
Sector Table
(% of Net Assets) on 6/30/22 |
Technology | 33.3% |
Communications | 28.4% |
Consumer, Non-cyclical | 17.1% |
Consumer, Cyclical | 9.7% |
Financial | 9.5% |
Basic Materials | 0.9% |
Industrial | 0.5% |
Mutual Funds | 0.3% |
Total Long-Term Investments | 99.7% |
Short-Term Investments and Other Assets and Liabilities | 0.3% |
Net Assets | 100.0% |
| | |
9
MML Equity Income Fund – Portfolio Summaries (Unaudited) |
What is the investment approach of MML Equity Income Fund, and who is the Fund’s subadviser?
The Fund seeks dividend income and long-term capital growth by investing primarily in common stocks, with an emphasis on large-capitalization companies that have a strong track record of paying dividends or that the Fund’s subadviser believes to be undervalued. Under normal circumstances, the Fund invests at least 80% of its net assets (plus the amount of any borrowings for investment purposes) in common stocks. The Fund’s subadviser is T. Rowe Price Associates, Inc. (T. Rowe Price).
MML Equity Income Fund
Largest Holdings
(% of Net Assets) on 6/30/22 |
Wells Fargo & Co. | 3.1% |
The Southern Co. | 2.9% |
United Parcel Service, Inc. Class B | 2.5% |
QUALCOMM, Inc. | 2.4% |
Elevance Health, Inc. | 2.3% |
General Electric Co. | 2.2% |
AbbVie, Inc. | 2.2% |
American International Group, Inc. | 2.2% |
TotalEnergies SE | 2.2% |
Sempra Energy | 2.1% |
| | 24.1% |
| | |
MML Equity Income Fund
Sector Table
(% of Net Assets) on 6/30/22 |
Consumer, Non-cyclical | 24.9% |
Financial | 24.5% |
Utilities | 10.3% |
Industrial | 9.3% |
Energy | 7.6% |
Technology | 7.0% |
Communications | 5.5% |
Basic Materials | 5.3% |
Consumer, Cyclical | 5.1% |
Mutual Funds | 0.4% |
Total Long-Term Investments | 99.9% |
Short-Term Investments and Other Assets and Liabilities | 0.1% |
Net Assets | 100.0% |
| | |
10
MML Equity Index Fund – Portfolio Summaries (Unaudited) |
What is the investment approach of MML Equity Index Fund, and who is the Fund’s subadviser?
The Fund’s investment objective is to provide investment results that correspond to the price and yield performance of publicly traded common stocks in the aggregate as represented by the S&P 500® Index* (the “Index”). Under normal circumstances, the Fund invests at least 80% (and, typically, substantially all) of its net assets (plus the amount of any borrowings for investment purposes) in the equity securities of companies included within the Index. The Fund’s subadviser is Northern Trust Investments, Inc. (NTI).
MML Equity Index Fund
Largest Holdings
(% of Net Assets) on 6/30/22 |
Apple, Inc. | 6.5% |
Microsoft Corp. | 6.0% |
Amazon.com, Inc. | 2.9% |
Alphabet, Inc. Class A | 2.0% |
Alphabet, Inc. Class C | 1.9% |
Tesla, Inc. | 1.8% |
Berkshire Hathaway, Inc. Class B | 1.5% |
UnitedHealth Group, Inc. | 1.5% |
Johnson & Johnson | 1.5% |
NVIDIA Corp. | 1.2% |
| | 26.8% |
| | |
MML Equity Index Fund
Sector Table
(% of Net Assets) on 6/30/22 |
Technology | 23.0% |
Consumer, Non-cyclical | 22.3% |
Financial | 14.8% |
Communications | 12.7% |
Consumer, Cyclical | 9.0% |
Industrial | 7.7% |
Energy | 4.5% |
Utilities | 3.1% |
Basic Materials | 2.1% |
Total Long-Term Investments | 99.2% |
Short-Term Investments and Other Assets and Liabilities | 0.8% |
Net Assets | 100.0% |
| | |
* | The “S&P 500 Index” is a product of S&P Dow Jones Indices LLC or its affiliates (“SPDJI”), and has been licensed for use by MassMutual. Standard & Poor’s® and S&P® are registered trademarks of Standard & Poor’s Financial Services LLC (“S&P”); Dow Jones® is a registered trademark of Dow Jones Trademark Holdings LLC (“Dow Jones”); and these trademarks have been licensed for use by SPDJI and sublicensed for certain purposes by MassMutual. The Fund is not sponsored, endorsed, sold or promoted by SPDJI, Dow Jones, S&P, or their respective affiliates, and none of such parties make any representation regarding the advisability of investing in such product(s) nor do they have any liability for any errors, omissions, or interruptions of the S&P 500 Index. |
11
MML Focused Equity Fund – Portfolio Summaries (Unaudited) |
What is the investment approach of MML Focused Equity Fund, and who is the Fund’s subadviser?
The Fund seeks growth of capital over the long-term by investing primarily in equity securities of U.S. companies that the Fund’s subadviser believes are financially sound, valued conservatively by the market, and have improving prospects. Under normal circumstances, the Fund invests at least 80% of its net assets (plus the amount of any borrowings for investment purposes) in equity securities. The Fund’s subadviser is Wellington Management Company LLP (Wellington Management).
MML Focused Equity Fund
Largest Holdings
(% of Net Assets) on 6/30/22 |
UnitedHealth Group, Inc. | 5.5% |
The TJX Cos., Inc. | 5.1% |
PepsiCo, Inc. | 5.0% |
Northrop Grumman Corp. | 5.0% |
Colgate-Palmolive Co. | 4.8% |
Visa, Inc. Class A | 4.8% |
Marsh & McLennan Cos., Inc. | 4.8% |
Honeywell International, Inc. | 4.7% |
Johnson & Johnson | 4.6% |
Chubb Ltd. | 4.6% |
| | 48.9% |
| | |
MML Focused Equity Fund
Sector Table
(% of Net Assets) on 6/30/22 |
Consumer, Non-cyclical | 39.6% |
Financial | 19.1% |
Industrial | 13.7% |
Consumer, Cyclical | 13.4% |
Basic Materials | 7.2% |
Technology | 6.1% |
Total Long-Term Investments | 99.1% |
Short-Term Investments and Other Assets and Liabilities | 0.9% |
Net Assets | 100.0% |
| | |
12
MML Foreign Fund – Portfolio Summaries (Unaudited) |
What is the investment approach of MML Foreign Fund, and who is the Fund’s subadviser?
The Fund seeks long-term total return by investing primarily in common stocks of companies listed on foreign securities exchanges. Under normal circumstances, the Fund invests at least 80% of its net assets (plus the amount of any borrowings for investment purposes) in investments of issuers located outside of the U.S., including those in emerging markets. Under normal market conditions, the Fund invests in equity securities of foreign companies representing at least three countries other than the United States. Although the Fund may invest in companies of any size as measured by assets, sales, or market capitalization, the Fund will tend to focus on larger, more seasoned or established companies. The Fund’s subadviser is Thompson, Siegel & Walmsley LLC (TSW).
MML Foreign Fund
Largest Holdings
(% of Net Assets) on 6/30/22 |
Sony Group Corp. | 2.5% |
UBS Group AG Registered | 1.9% |
Sanofi | 1.9% |
Engie SA | 1.9% |
Novartis AG Registered | 1.8% |
CK Hutchison Holdings Ltd. | 1.8% |
Roche Holding AG | 1.8% |
Seven & i Holdings Co. Ltd. | 1.7% |
Samsung Electronics Co. Ltd. | 1.7% |
Unilever PLC | 1.7% |
| | 18.7% |
| | |
MML Foreign Fund
Sector Table
(% of Net Assets) on 6/30/22 |
Consumer, Non-cyclical | 26.4% |
Financial | 19.7% |
Industrial | 13.2% |
Consumer, Cyclical | 11.0% |
Technology | 10.6% |
Basic Materials | 6.2% |
Energy | 5.0% |
Utilities | 3.4% |
Communications | 2.5% |
Diversified | 1.8% |
Mutual Funds | 0.0% |
Total Long-Term Investments | 99.8% |
Short-Term Investments and Other Assets and Liabilities | 0.2% |
Net Assets | 100.0% |
| | |
13
MML Fundamental Equity Fund – Portfolio Summaries (Unaudited) |
What is the investment approach of MML Fundamental Equity Fund, formerly known as MML Fundamental Growth Fund, and who is the Fund’s subadviser?
The Fund seeks a high total return by investing primarily in common stocks of U.S. companies of different capitalization ranges. The Fund’s subadviser currently focuses on “large capitalization” issuers, which are considered to be companies with market capitalizations at the time of purchase within the market capitalization range of companies included within the Russell 1000® Index, although it may purchase stocks of companies with any market capitalization. Under normal circumstances, the Fund invests at least 80% of its net assets (plus the amount of any borrowings for investment purposes) in equity securities. The Fund’s subadviser is Invesco Advisers, Inc. (Invesco).
MML Fundamental Equity Fund
Largest Holdings
(% of Net Assets) on 6/30/22 |
Microsoft Corp. | 7.1% |
Apple, Inc. | 5.1% |
UnitedHealth Group, Inc. | 3.3% |
Eli Lilly & Co. | 3.2% |
Verizon Communications, Inc. | 3.1% |
Amazon.com, Inc. | 3.0% |
Alphabet, Inc. Class A | 3.0% |
The Procter & Gamble Co. | 2.8% |
United Parcel Service, Inc. Class B | 2.7% |
Prologis, Inc. | 2.7% |
| | 36.0% |
| | |
MML Fundamental Equity Fund
Sector Table
(% of Net Assets) on 6/30/22 |
Technology | 26.0% |
Consumer, Non-cyclical | 24.6% |
Financial | 12.8% |
Communications | 12.2% |
Industrial | 12.1% |
Energy | 4.5% |
Consumer, Cyclical | 4.3% |
Utilities | 2.4% |
Basic Materials | 0.8% |
Total Long-Term Investments | 99.7% |
Short-Term Investments and Other Assets and Liabilities | 0.3% |
Net Assets | 100.0% |
| | |
14
MML Fundamental Value Fund – Portfolio Summaries (Unaudited) |
What is the investment approach of MML Fundamental Value Fund, and who is the Fund’s subadviser?
The Fund seeks long-term total return by investing primarily in equity securities of issuers that the Fund’s subadviser believes are undervalued. Under normal circumstances, the Fund invests at least 80% of its net assets (plus the amount of any borrowings for investment purposes) in equity securities. Although the Fund may invest in companies of any size, the Fund will tend to focus on companies with large market capitalizations (which the subadviser believes are generally above $1 billion). The Fund’s subadviser is Boston Partners Global Investors, Inc. (Boston Partners).
MML Fundamental Value Fund
Largest Holdings
(% of Net Assets) on 6/30/22 |
Johnson & Johnson | 4.2% |
ConocoPhillips | 3.0% |
Berkshire Hathaway, Inc. Class B | 3.0% |
AutoZone, Inc. | 2.9% |
UnitedHealth Group, Inc. | 2.7% |
Alphabet, Inc. Class A | 2.6% |
JP Morgan Chase & Co. | 2.5% |
Cigna Corp. | 2.4% |
The Procter & Gamble Co. | 2.3% |
Sanofi ADR | 2.1% |
| | 27.7% |
| | |
MML Fundamental Value Fund
Sector Table
(% of Net Assets) on 6/30/22 |
Consumer, Non-cyclical | 31.8% |
Financial | 14.8% |
Energy | 11.7% |
Technology | 11.2% |
Industrial | 11.0% |
Communications | 7.3% |
Consumer, Cyclical | 5.1% |
Basic Materials | 2.6% |
Utilities | 2.2% |
Total Long-Term Investments | 97.7% |
Short-Term Investments and Other Assets and Liabilities | 2.3% |
Net Assets | 100.0% |
| | |
15
MML Global Fund – Portfolio Summaries (Unaudited) |
What is the investment approach of MML Global Fund, and who is the Fund’s subadviser?
The Fund seeks long-term capital appreciation by investing primarily in the equity securities of U.S. and foreign companies, including companies in developed and emerging markets. The Fund’s subadviser normally invests the Fund’s assets across different industries, sectors, countries, and regions, but the Fund’s subadviser may invest a significant percentage of the Fund’s assets in issuers in a single industry, sector, country, or region. The Fund’s subadviser is Massachusetts Financial Services Company (MFS).
MML Global Fund
Largest Holdings
(% of Net Assets) on 6/30/22 |
Thermo Fisher Scientific, Inc. | 3.3% |
Visa, Inc. Class A | 3.1% |
Roche Holding AG | 2.8% |
Comcast Corp. Class A | 2.7% |
Medtronic PLC | 2.6% |
Schneider Electric SE | 2.6% |
Accenture PLC Class A | 2.6% |
Nestle SA Registered | 2.5% |
LVMH Moet Hennessy Louis Vuitton SE | 2.3% |
Diageo PLC | 2.2% |
| | 26.7% |
| | |
MML Global Fund
Sector Table
(% of Net Assets) on 6/30/22 |
Consumer, Non-cyclical | 35.6% |
Industrial | 17.2% |
Financial | 13.7% |
Technology | 10.4% |
Communications | 8.3% |
Basic Materials | 6.9% |
Consumer, Cyclical | 6.7% |
Total Long-Term Investments | 98.8% |
Short-Term Investments and Other Assets and Liabilities | 1.2% |
Net Assets | 100.0% |
| | |
16
MML Income & Growth Fund – Portfolio Summaries (Unaudited) |
What is the investment approach of MML Income & Growth Fund, and who is the Fund’s subadviser?
The Fund seeks long-term total return and current income by investing primarily in equity securities of issuers that the Fund’s subadviser believes are undervalued. Although the Fund may invest in companies of any size, the Fund will tend to focus on companies with large market capitalizations (which the Fund’s subadviser believes are generally above $2 billion). The Fund’s subadviser is Barrow, Hanley, Mewhinney & Strauss, LLC (Barrow Hanley).
MML Income & Growth Fund
Largest Holdings
(% of Net Assets) on 6/30/22 |
Merck & Co., Inc. | 3.6% |
UnitedHealth Group, Inc. | 3.1% |
Raytheon Technologies Corp. | 2.8% |
Philip Morris International, Inc. | 2.8% |
Phillips 66 | 2.6% |
Air Products & Chemicals, Inc. | 2.6% |
Coca-Cola Europacific Partners PLC | 2.5% |
Chubb Ltd. | 2.5% |
International Flavors & Fragrances, Inc. | 2.5% |
Hess Corp. | 2.4% |
| | 27.4% |
| | |
MML Income & Growth Fund
Sector Table
(% of Net Assets) on 6/30/22 |
Consumer, Non-cyclical | 29.1% |
Financial | 19.1% |
Industrial | 12.2% |
Energy | 8.6% |
Basic Materials | 8.0% |
Consumer, Cyclical | 6.6% |
Technology | 6.5% |
Utilities | 5.2% |
Communications | 3.1% |
Total Long-Term Investments | 98.4% |
Short-Term Investments and Other Assets and Liabilities | 1.6% |
Net Assets | 100.0% |
| | |
17
MML International Equity Fund – Portfolio Summaries (Unaudited) |
What is the investment approach of MML International Equity Fund, and who is the Fund’s subadviser?
The Fund seeks long-term capital growth by investing, under normal circumstances, at least 80% of its net assets (plus the amount of any borrowings for investment purposes) in equity securities of foreign companies, including companies located in Europe, Latin America, and Asia. The Fund may invest up to 25% of its total assets in equity securities of issuers in emerging markets. Equity securities may include common stocks, preferred stocks, securities convertible into common or preferred stocks, depositary receipts, rights, and warrants of issuers of any size. As of June 30, 2022, the Fund’s two subadvisers are Harris Associates L.P. (Harris), which managed approximately 34% of the Fund’s portfolio; and Massachusetts Financial Services Company (MFS), which managed approximately 66% of the Fund’s portfolio.
MML International Equity Fund
Largest Holdings
(% of Net Assets) on 6/30/22 |
Nestle SA Registered | 2.8% |
Roche Holding AG | 2.5% |
Bayer AG Registered | 2.1% |
Air Liquide SA | 1.9% |
AIA Group Ltd. | 1.8% |
Schneider Electric SE | 1.8% |
SAP SE | 1.8% |
Novo Nordisk A/S Class B | 1.8% |
Intesa Sanpaolo SpA | 1.8% |
Capgemini SE | 1.7% |
| | 20.0% |
| | |
MML International Equity Fund
Sector Table
(% of Net Assets) on 6/30/22 |
Consumer, Non-cyclical | 31.1% |
Financial | 18.0% |
Consumer, Cyclical | 15.0% |
Industrial | 14.0% |
Technology | 7.1% |
Communications | 6.0% |
Basic Materials | 5.0% |
Energy | 1.6% |
Utilities | 0.7% |
Mutual Funds | 0.0% |
Total Long-Term Investments | 98.5% |
Short-Term Investments and Other Assets and Liabilities | 1.5% |
Net Assets | 100.0% |
| | |
18
MML Large Cap Growth Fund – Portfolio Summaries (Unaudited) |
What is the investment approach of MML Large Cap Growth Fund, and who is the Fund’s subadviser?
The Fund seeks long-term capital appreciation by investing primarily in large-capitalization companies that the Fund’s subadviser believes offer the potential for long-term growth. Under normal circumstances, the Fund invests at least 80% of its net assets (plus the amount of any borrowings for investment purposes) in the common stocks of companies whose market capitalizations at the time of purchase are within the market capitalization range of companies included in the Russell 1000® Growth Index (as of February 28, 2022, between $257.54 million to $2.96 trillion). The Fund’s subadviser is Loomis, Sayles & Company, L.P. (Loomis Sayles).
MML Large Cap Growth Fund
Largest Holdings
(% of Net Assets) on 6/30/22 |
Visa, Inc. Class A | 6.4% |
Microsoft Corp. | 5.4% |
Amazon.com, Inc. | 5.0% |
NVIDIA Corp. | 4.9% |
The Boeing Co. | 4.9% |
Meta Platforms, Inc. Class A | 4.3% |
Oracle Corp. | 4.2% |
Monster Beverage Corp. | 4.1% |
Alphabet, Inc. Class A | 3.6% |
Alphabet, Inc. Class C | 3.5% |
| | 46.3% |
| | |
MML Large Cap Growth Fund
Sector Table
(% of Net Assets) on 6/30/22 |
Communications | 27.1% |
Technology | 24.6% |
Consumer, Non-cyclical | 23.3% |
Industrial | 8.2% |
Financial | 8.0% |
Consumer, Cyclical | 7.4% |
Total Long-Term Investments | 98.6% |
Short-Term Investments and Other Assets and Liabilities | 1.4% |
Net Assets | 100.0% |
| | |
19
MML Managed Volatility Fund – Portfolio Summaries (Unaudited) |
What is the investment approach of MML Managed Volatility Fund and who is the Fund’s subadviser?
The Fund seeks to capture the majority of the returns associated with equity market investments, while exposing investors to less risk than other equity investments. Under normal circumstances, the Fund invests in a broadly diversified portfolio of common stocks, while also selling index call options and purchasing index put options. The Fund’s stock portfolio will have approximately 500 stocks, and seeks to duplicate the investment composition and return of the S&P 500® Index* (the “Index”) by holding each stock included in the Index in approximately the same proportion as each stock’s relative weighting in the Index. The Fund’s subadviser is Gateway Investment Advisers, LLC (Gateway).
MML Managed Volatility Fund
Largest Holdings
(% of Net Assets) on 6/30/22 |
Apple, Inc. | 6.6% |
Microsoft Corp. | 6.0% |
Amazon.com, Inc. | 2.9% |
Alphabet, Inc. Class A | 2.1% |
Alphabet, Inc. Class C | 1.9% |
Tesla, Inc. | 1.8% |
Berkshire Hathaway, Inc. Class B | 1.5% |
UnitedHealth Group, Inc. | 1.5% |
Johnson & Johnson | 1.5% |
NVIDIA Corp. | 1.2% |
| | 27.0% |
| | |
MML Managed Volatility Fund
Sector Table
(% of Net Assets) on 6/30/22 |
Technology | 23.2% |
Consumer, Non-cyclical | 22.6% |
Financial | 15.0% |
Communications | 12.8% |
Consumer, Cyclical | 9.1% |
Industrial | 7.8% |
Energy | 4.5% |
Utilities | 3.1% |
Basic Materials | 2.1% |
Purchased Options | 1.7% |
Total Long-Term Investments | 101.9% |
Short-Term Investments and Other Assets and Liabilities | (1.9)% |
Net Assets | 100.0% |
| | |
* | The “S&P 500 Index” is a product of S&P Dow Jones Indices LLC or its affiliates (“SPDJI”), and has been licensed for use by MassMutual. Standard & Poor’s® and S&P® are registered trademarks of Standard & Poor’s Financial Services LLC (“S&P”); Dow Jones® is a registered trademark of Dow Jones Trademark Holdings LLC (“Dow Jones”); and these trademarks have been licensed for use by SPDJI and sublicensed for certain purposes by MassMutual. The Fund is not sponsored, endorsed, sold or promoted by SPDJI, Dow Jones, S&P, or their respective affiliates, and none of such parties make any representation regarding the advisability of investing in such product(s) nor do they have any liability for any errors, omissions, or interruptions of the S&P 500 Index. |
20
MML Mid Cap Growth Fund – Portfolio Summaries (Unaudited) |
What is the investment approach of MML Mid Cap Growth Fund, and who are the Fund’s subadvisers?
The Fund seeks long-term capital appreciation by investing primarily in equity securities of mid-capitalization companies that the Fund’s subadvisers believe offer the potential for above-average earnings growth. Under normal circumstances, the Fund invests at least 80% of its net assets (plus the amount of any borrowings for investment purposes) in a broadly diversified portfolio of common stocks of mid-cap companies whose earnings the Fund’s subadvisers expect to grow at a faster rate than the average company. The Fund’s two subadvisers are T. Rowe Price Associates, Inc. (“T. Rowe Price”), which managed approximately 77% of the Fund’s portfolio; and Wellington Management Company LLP (Wellington Management), which managed approximately 23% of the Fund’s portfolio, as of June 30, 2022. Effective March 7, 2022, T. Rowe Price Investment Management was added as sub-subadviser for the portion of the portfolio subadvised by T. Rowe Price.
MML Mid Cap Growth Fund
Largest Holdings
(% of Net Assets) on 6/30/22 |
Hologic, Inc. | 2.3% |
Catalent, Inc. | 2.1% |
TransUnion | 2.0% |
Textron, Inc. | 2.0% |
Microchip Technology, Inc. | 1.8% |
Hilton Worldwide Holdings, Inc. | 1.8% |
Ball Corp. | 1.7% |
Ingersoll Rand, Inc. | 1.6% |
Agilent Technologies, Inc. | 1.6% |
Teleflex, Inc. | 1.6% |
| | 18.5% |
| | |
MML Mid Cap Growth Fund
Sector Table
(% of Net Assets) on 6/30/22 |
Consumer, Non-cyclical | 33.1% |
Technology | 18.6% |
Industrial | 17.4% |
Consumer, Cyclical | 13.1% |
Financial | 6.1% |
Communications | 5.3% |
Energy | 1.6% |
Basic Materials | 0.5% |
Mutual Funds | 0.4% |
Total Long-Term Investments | 96.1% |
Short-Term Investments and Other Assets and Liabilities | 3.9% |
Net Assets | 100.0% |
| | |
21
MML Mid Cap Value Fund – Portfolio Summaries (Unaudited) |
What is the investment approach of MML Mid Cap Value Fund, and who is the Fund’s subadviser?
The Fund seeks long-term capital growth. Income is a secondary objective. The Fund invests primarily in equity securities of mid-capitalization companies that the Fund’s subadviser believes offer prospects for long-term capital growth. Under normal circumstances, the Fund invests at least 80% of its net assets (plus the amount of any borrowings for investment purposes) in equity securities of medium-size companies. The Fund’s subadviser is American Century Investment Management, Inc. (American Century).
MML Mid Cap Value Fund
Largest Holdings
(% of Net Assets) on 6/30/22 |
Zimmer Biomet Holdings, Inc. | 3.2% |
Northern Trust Corp. | 2.6% |
The Bank of New York Mellon Corp. | 2.5% |
Conagra Brands, Inc. | 2.2% |
The Allstate Corp. | 2.2% |
Edison International | 2.1% |
Emerson Electric Co. | 2.1% |
Quest Diagnostics, Inc. | 2.0% |
Reinsurance Group of America, Inc. | 1.9% |
Koninklijke Ahold Delhaize NV | 1.9% |
| | 22.7% |
| | |
MML Mid Cap Value Fund
Sector Table
(% of Net Assets) on 6/30/22 |
Financial | 29.1% |
Consumer, Non-cyclical | 21.5% |
Industrial | 14.2% |
Consumer, Cyclical | 13.4% |
Utilities | 7.5% |
Energy | 5.0% |
Technology | 3.2% |
Communications | 2.8% |
Basic Materials | 2.3% |
Total Long-Term Investments | 99.0% |
Short-Term Investments and Other Assets and Liabilities | 1.0% |
Net Assets | 100.0% |
| | |
22
MML Small Cap Growth Equity Fund – Portfolio Summaries (Unaudited) |
What is the investment approach of MML Small Cap Growth Equity Fund, and who is the Fund’s subadviser?
The Fund seeks long-term capital appreciation by investing primarily in equity securities of smaller companies that the Fund’s subadviser believes offer potential for long-term growth. Under normal circumstances, the Fund invests at least 80% of its net assets (plus the amount of any borrowings for investment purposes) in the equity securities of companies whose market capitalizations at the time of purchase are within the market capitalization range of companies included in the Russell 2000® Index or the S&P SmallCap 600 Index (as of February 28, 2022, between $18.59 million and $11.74 billion). The Fund’s subadviser is Wellington Management Company LLP (Wellington Management).
MML Small Cap Growth Equity Fund
Largest Holdings
(% of Net Assets) on 6/30/22 |
iShares Russell 2000 Growth ETF | 2.3% |
Fluor Corp. | 1.5% |
Cabot Corp. | 1.4% |
Calix, Inc. | 1.4% |
Perficient, Inc. | 1.4% |
Jamf Holding Corp. | 1.3% |
Phillips Edison & Co., Inc. | 1.3% |
Hannon Armstrong Sustainable Infrastructure Capital, Inc. | 1.2% |
Owens & Minor, Inc. | 1.2% |
Rapid7, Inc. | 1.2% |
| 14.2% |
| | |
MML Small Cap Growth Equity Fund
Sector Table
(% of Net Assets) on 6/30/22 |
Consumer, Non-cyclical | 23.9% |
Industrial | 17.6% |
Financial | 16.7% |
Technology | 10.9% |
Consumer, Cyclical | 10.3% |
Energy | 5.9% |
Communications | 5.6% |
Mutual Funds | 4.7% |
Basic Materials | 2.2% |
Utilities | 1.2% |
Total Long-Term Investments | 99.0% |
Short-Term Investments and Other Assets and Liabilities | 1.0% |
Net Assets | 100.0% |
| | |
23
MML Small Company Value Fund – Portfolio Summaries (Unaudited) |
What is the investment approach of MML Small Company Value Fund, and who is the Fund’s subadviser?
The Fund seeks long-term capital appreciation by investing primarily in equity securities that the Fund’s subadviser believes are undervalued. Under normal circumstances, the Fund invests at least 80% of its net assets (plus the amount of any borrowings for investment purposes) in the securities of companies whose market capitalizations at the time of purchase are within the market capitalization range of companies included in the Russell 2000® Index or the S&P SmallCap 600 Index (as of February 28, 2022, between $18.59 million and $11.74 billion). The Fund’s subadviser is American Century Investment Management, Inc. (American Century).
MML Small Company Value Fund
Largest Holdings
(% of Net Assets) on 6/30/22 |
Spectrum Brands Holdings, Inc. | 2.8% |
II-VI, Inc. | 2.4% |
The Timken Co. | 2.3% |
EVERTEC, Inc. | 2.2% |
SouthState Corp. | 2.1% |
UMB Financial Corp. | 2.0% |
Teradata Corp. | 2.0% |
The Brink’s Co. | 2.0% |
Axis Capital Holdings Ltd. | 1.9% |
Tapestry, Inc. | 1.9% |
| | 21.6% |
| | |
MML Small Company Value Fund
Sector Table
(% of Net Assets) on 6/30/22 |
Financial | 34.2% |
Industrial | 19.4% |
Consumer, Cyclical | 17.8% |
Consumer, Non-cyclical | 16.7% |
Technology | 5.9% |
Energy | 2.0% |
Utilities | 1.3% |
Basic Materials | 1.1% |
Communications | 1.0% |
Mutual Funds | 0.9% |
Total Long-Term Investments | 100.3% |
Short-Term Investments and Other Assets and Liabilities | (0.3)% |
Net Assets | 100.0% |
| | |
24
MML Small/Mid Cap Value Fund – Portfolio Summaries (Unaudited) |
What is the investment approach of MML Small/Mid Cap Value Fund, and who is the Fund’s subadviser?
The Fund seeks long-term total return by investing primarily in securities that the Fund’s subadviser believes to be undervalued. Under normal circumstances, the Fund invests at least 80% of its net assets (plus the amount of any borrowings for investment purposes) in securities of small- and mid-cap companies. The Fund’s subadviser is AllianceBernstein L.P. (AllianceBernstein).
MML Small/Mid Cap Value Fund
Largest Holdings
(% of Net Assets) on 6/30/22 |
IDACORP, Inc. | 1.7% |
Physicians Realty Trust | 1.7% |
Berry Global Group, Inc. | 1.7% |
First Citizens BancShares, Inc. Class A | 1.7% |
Acadia Healthcare Co., Inc. | 1.6% |
Change Healthcare, Inc. | 1.6% |
Comerica, Inc. | 1.5% |
Camden Property Trust | 1.5% |
Syneos Health, Inc. | 1.5% |
Dycom Industries, Inc. | 1.5% |
| | 16.0% |
| | |
MML Small/Mid Cap Value Fund
Sector Table
(% of Net Assets) on 6/30/22 |
Financial | 27.4% |
Industrial | 21.4% |
Consumer, Cyclical | 15.4% |
Consumer, Non-cyclical | 14.6% |
Technology | 7.7% |
Basic Materials | 5.2% |
Energy | 3.7% |
Utilities | 2.9% |
Communications | 1.1% |
Total Long-Term Investments | 99.4% |
Short-Term Investments and Other Assets and Liabilities | 0.6% |
Net Assets | 100.0% |
| | |
25
MML Sustainable Equity Fund – Portfolio Summaries (Unaudited) |
What is the investment approach of MML Sustainable Equity Fund, formerly known as MML Growth & Income Fund, and who is the Fund’s subadviser?
The Fund seeks capital appreciation and income by investing, under normal circumstances, at least 80% of its net assets (plus the amount of any borrowings for investment purposes) in sustainable equity securities. Equity securities may include common stock, preferred stock, securities convertible into common or preferred stock, rights, and warrants. The Fund’s subadviser currently considers sustainable securities to be those to which the subadviser’s proprietary model assigns an ESG score that is in the top three quartiles of the environmental, social, and governance (“ESG”) scores the model assigns to all of the securities in the Fund’s benchmark, the S&P 500® Index. The Fund’s subadviser is American Century Investment Management, Inc. (“American Century”). Effective April 29, 2022, American Century replaced Massachusetts Financial Services Company (MFS) as subadviser of the Fund.
MML Sustainable Equity Fund
Largest Holdings
(% of Net Assets) on 6/30/22 |
Microsoft Corp. | 8.2% |
Alphabet, Inc. Class A | 5.2% |
Apple, Inc. | 4.6% |
Amazon.com, Inc. | 2.9% |
Prologis, Inc. | 2.2% |
NextEra Energy, Inc. | 2.1% |
ConocoPhillips | 2.1% |
Schlumberger NV | 2.0% |
UnitedHealth Group, Inc. | 2.0% |
Visa, Inc. Class A | 1.9% |
| | 33.2% |
| | |
MML Sustainable Equity Fund
Sector Table
(% of Net Assets) on 6/30/22 |
Consumer, Non-cyclical | 21.4% |
Technology | 20.9% |
Financial | 14.8% |
Communications | 14.5% |
Industrial | 11.5% |
Consumer, Cyclical | 8.0% |
Energy | 4.1% |
Basic Materials | 2.5% |
Utilities | 2.1% |
Mutual Funds | 0.1% |
Total Long-Term Investments | 99.9% |
Short-Term Investments and Other Assets and Liabilities | 0.1% |
Net Assets | 100.0% |
| | |
26
MML Total Return Bond Fund – Portfolio Summaries (Unaudited) |
What is the investment approach of MML Total Return Bond Fund, and who is the Fund’s subadviser?
The Fund seeks maximum total return, consistent with preservation of capital and prudent investment management, by investing, under normal circumstances, at least 80% of its net assets (plus the amount of any borrowings for investment purposes) in a diversified portfolio of investment grade fixed income securities (rated Baa3 or higher by Moody’s, BBB- or higher by Standard & Poor’s, BBB- or higher by Fitch, or A-2 by S&P, P-2 by Moody’s, or F-2 by Fitch for short-term debt obligations, or, if unrated, determined by the Fund’s subadviser to be of comparable quality). The Fund’s subadviser is Metropolitan West Asset Management, LLC (MetWest).
MML Total Return Bond Fund
Portfolio Characteristics
(% of Net Assets) on 6/30/22 |
U.S. Government Agency Obligations and Instrumentalities* | 34.4% |
U.S. Treasury Obligations | 29.9% |
Corporate Debt | 29.1% |
Non-U.S. Government Agency Obligations | 15.4% |
Mutual Funds | 4.9% |
Bank Loans | 1.9% |
Sovereign Debt Obligations | 1.2% |
Municipal Obligations | 1.0% |
Common Stock | 0.1% |
Purchased Options | 0.0% |
Rights | 0.0% |
Total Long-Term Investments | 117.9% |
Short-Term Investments and Other Assets and Liabilities | (17.9)% |
Net Assets | 100.0% |
| | |
* | May contain securities that are issued by a U.S. Government Agency, but are unsecured and are not guaranteed by a U.S. Government Agency. |
27
MML Conservative Allocation Fund – Portfolio of Investments |
June 30, 2022 (Unaudited) |
| | | Number of
Shares | | | Value | |
MUTUAL FUNDS — 100.1% |
Equity Funds — 40.2% |
MML Blue Chip Growth Fund, Initial Class (a) | | | 936,583 | | | $ | 13,112,158 | |
MML Equity Income Fund, Initial Class (a) | | | 1,064,863 | | | | 12,064,894 | |
MML Focused Equity Fund, Class II (a) | | | 2,856,364 | | | | 21,137,097 | |
MML Foreign Fund, Initial Class (a) | | | 647,889 | | | | 5,811,568 | |
MML Fundamental Equity Fund, Class II (a) | | | 1,091,153 | | | | 10,704,209 | |
MML Fundamental Value Fund, Class II (a) | | | 759,344 | | | | 10,053,717 | |
MML Global Fund, Class I (a) | | | 407,423 | | | | 4,774,993 | |
MML Income & Growth Fund, Initial Class (a) | | | 875,066 | | | | 9,993,252 | |
MML International Equity Fund, Class II (a) | | | 1,380,593 | | | | 12,328,692 | |
MML Large Cap Growth Fund, Initial Class (a) | | | 672,683 | | | | 7,211,157 | |
MML Mid Cap Growth Fund, Initial Class (a) | | | 594,779 | | | | 7,083,823 | |
MML Mid Cap Value Fund, Initial Class (a) | | | 554,176 | | | | 6,411,821 | |
MML Small Cap Growth Equity Fund, Initial Class (a) | | | 58,044 | | | | 653,802 | |
MML Small Company Value Fund, Class II (a) | | | 225,124 | | | | 3,363,355 | |
MML Small/Mid Cap Value Fund, Initial Class (a) | | | 141,669 | | | | 1,673,112 | |
MML Strategic Emerging Markets Fund, Class II (a) | | | 444,039 | | | | 3,419,100 | |
| | | | | | | | 129,796,750 | |
Fixed Income Funds — 59.9% |
Invesco V.I. Global Strategic Income Fund, Series I | | | 2,248,402 | | | | 8,566,413 | |
MML Dynamic Bond Fund, Class II (a) | | | 4,311,247 | | | | 38,671,888 | |
MML High Yield Fund, Class II (a) | | | 298,774 | | | | 2,572,443 | |
MML Inflation-Protected and Income Fund, Initial Class (a) | | | 1,124,909 | | | | 11,282,840 | |
MML Managed Bond Fund, Initial Class (a) | | | 6,122,289 | | | | 70,147,460 | |
MML Short-Duration Bond Fund, Class II (a) | | | 1,954,904 | | | | 17,476,846 | |
| | | Number of
Shares | | | Value | |
MML Total Return Bond Fund, Class II (a) | | | 4,783,821 | | | $ | 44,346,023 | |
| | | | | | | | 193,063,913 | |
| | | | | | | | | |
TOTAL MUTUAL FUNDS (Cost $354,722,635) | | | | | | | 322,860,663 | |
| | | | | | | | | |
TOTAL LONG-TERM INVESTMENTS (Cost $354,722,635) | | | | | | | 322,860,663 | |
| | | | | | | | | |
TOTAL INVESTMENTS — 100.1% (Cost $354,722,635) (b) | | | | | | | 322,860,663 | |
| | | | | | | | | |
Other Assets/(Liabilities) — (0.1)% | | | | | | | (278,761 | ) |
| | | | | | | | | |
NET ASSETS — 100.0% | | | | | | $ | 322,581,902 | |
Notes to Portfolio of Investments
Percentages are stated as a percent of net assets.
(a) | Affiliated issuer. See Note 7 for a summary of transactions in the investments of affiliated issuers. |
(b) | See Note 6 for aggregate cost for federal tax purposes. |
The accompanying notes are an integral part of the financial statements.
28
MML Balanced Allocation Fund – Portfolio of Investments |
June 30, 2022 (Unaudited) |
| | | Number of
Shares | | | Value | |
MUTUAL FUNDS — 100.1% |
Equity Funds — 46.8% |
MML Blue Chip Growth Fund, Initial Class (a) | | | 1,173,288 | | | $ | 16,426,029 | |
MML Equity Income Fund, Initial Class (a) | | | 1,430,721 | | | | 16,210,066 | |
MML Focused Equity Fund, Class II (a) | | | 3,655,565 | | | | 27,051,179 | |
MML Foreign Fund, Initial Class (a) | | | 888,821 | | | | 7,972,724 | |
MML Fundamental Equity Fund, Class II (a) | | | 1,479,923 | | | | 14,518,049 | |
MML Fundamental Value Fund, Class II (a) | | | 968,815 | | | | 12,827,105 | |
MML Global Fund, Class I (a) | | | 827,356 | | | | 9,696,610 | |
MML Income & Growth Fund, Initial Class (a) | | | 1,156,688 | | | | 13,209,373 | |
MML International Equity Fund, Class II (a) | | | 2,037,566 | | | | 18,195,468 | |
MML Large Cap Growth Fund, Initial Class (a) | | | 956,374 | | | | 10,252,334 | |
MML Mid Cap Growth Fund, Initial Class (a) | | | 761,214 | | | | 9,066,060 | |
MML Mid Cap Value Fund, Initial Class (a) | | | 820,304 | | | | 9,490,916 | |
MML Small Cap Growth Equity Fund, Initial Class (a) | | | 93,332 | | | | 1,051,294 | |
MML Small Company Value Fund, Class II (a) | | | 275,403 | | | | 4,114,525 | |
MML Small/Mid Cap Value Fund, Initial Class (a) | | | 196,046 | | | | 2,315,302 | |
MML Strategic Emerging Markets Fund, Class II (a) | | | 391,537 | | | | 3,014,834 | |
| | | | | | | | 175,411,868 | |
Fixed Income Funds — 53.3% |
Invesco V.I. Global Strategic Income Fund, Series I | | | 2,101,186 | | | | 8,005,518 | |
MML Dynamic Bond Fund, Class II (a) | | | 4,433,996 | | | | 39,772,942 | |
MML High Yield Fund, Class II (a) | | | 321,891 | | | | 2,771,479 | |
MML Inflation-Protected and Income Fund, Initial Class (a) | | | 1,338,374 | | | | 13,423,887 | |
MML Managed Bond Fund, Initial Class (a) | | | 6,180,446 | | | | 70,813,808 | |
MML Short-Duration Bond Fund, Class II (a) | | | 2,040,113 | | | | 18,238,612 | |
| | | Number of
Shares | | | Value | |
MML Total Return Bond Fund, Class II (a) | | | 5,069,412 | | | $ | 46,993,445 | |
| | | | | | | | 200,019,691 | |
| | | | | | | | | |
TOTAL MUTUAL FUNDS (Cost $403,213,896) | | | | | | | 375,431,559 | |
| | | | | | | | | |
TOTAL LONG-TERM INVESTMENTS (Cost $403,213,896) | | | | | | | 375,431,559 | |
| | | | | | | | | |
TOTAL INVESTMENTS — 100.1% (Cost $403,213,896) (b) | | | | | | | 375,431,559 | |
| | | | | | | | | |
Other Assets/(Liabilities) — (0.1)% | | | | | | | (318,994 | ) |
| | | | | | | | | |
NET ASSETS — 100.0% | | | | | | $ | 375,112,565 | |
Notes to Portfolio of Investments
Percentages are stated as a percent of net assets.
(a) | Affiliated issuer. See Note 7 for a summary of transactions in the investments of affiliated issuers. |
(b) | See Note 6 for aggregate cost for federal tax purposes. |
The accompanying notes are an integral part of the financial statements.
29
MML Moderate Allocation Fund – Portfolio of Investments |
June 30, 2022 (Unaudited) |
| | | Number of
Shares | | | Value | |
MUTUAL FUNDS — 100.1% |
Equity Funds — 60.2% |
MML Blue Chip Growth Fund, Initial Class (a) | | | 5,528,631 | | | $ | 77,400,840 | |
MML Equity Income Fund, Initial Class (a) | | | 6,381,053 | | | | 72,297,329 | |
MML Focused Equity Fund, Class II (a) | | | 17,254,492 | | | | 127,683,241 | |
MML Foreign Fund, Initial Class (a) | | | 3,841,134 | | | | 34,454,973 | |
MML Fundamental Equity Fund, Class II (a) | | | 6,737,605 | | | | 66,095,907 | |
MML Fundamental Value Fund, Class II (a) | | | 4,615,547 | | | | 61,109,840 | |
MML Global Fund, Class I (a) | | | 3,788,027 | | | | 44,395,671 | |
MML Income & Growth Fund, Initial Class (a) | | | 5,251,228 | | | | 59,969,029 | |
MML International Equity Fund, Class II (a) | | | 9,609,162 | | | | 85,809,817 | |
MML Large Cap Growth Fund, Initial Class (a) | | | 4,103,337 | | | | 43,987,774 | |
MML Mid Cap Growth Fund, Initial Class (a) | | | 3,326,587 | | | | 39,619,652 | |
MML Mid Cap Value Fund, Initial Class (a) | | | 3,568,027 | | | | 41,282,075 | |
MML Small Cap Growth Equity Fund, Initial Class (a) | | | 628,033 | | | | 7,074,145 | |
MML Small Company Value Fund, Class II (a) | | | 1,377,577 | | | | 20,581,004 | |
MML Small/Mid Cap Value Fund, Initial Class (a) | | | 964,272 | | | | 11,388,055 | |
MML Strategic Emerging Markets Fund, Class II (a) | | | 2,226,535 | | | | 17,144,320 | |
| | | | | | | | 810,293,672 | |
Fixed Income Funds — 39.9% |
Invesco V.I. Global Strategic Income Fund, Series I | | | 3,906,816 | | | | 14,884,970 | |
MML Dynamic Bond Fund, Class II (a) | | | 12,401,750 | | | | 111,243,694 | |
MML High Yield Fund, Class II (a) | | | 1,129,637 | | | | 9,726,171 | |
MML Inflation-Protected and Income Fund, Initial Class (a) | | | 3,184,019 | | | | 31,935,706 | |
MML Managed Bond Fund, Initial Class (a) | | | 17,278,650 | | | | 197,973,899 | |
MML Short-Duration Bond Fund, Class II (a) | | | 5,742,184 | | | | 51,335,125 | |
| | | Number of
Shares | | | Value | |
MML Total Return Bond Fund, Class II (a) | | | 13,043,775 | | | $ | 120,915,798 | |
| | | | | | | | 538,015,363 | |
| | | | | | | | | |
TOTAL MUTUAL FUNDS (Cost $1,452,345,494) | | | | | | | 1,348,309,035 | |
| | | | | | | | | |
TOTAL LONG-TERM INVESTMENTS (Cost $1,452,345,494) | | | | | | | 1,348,309,035 | |
| | | | | | | | | |
TOTAL INVESTMENTS — 100.1% (Cost $1,452,345,494) (b) | | | | | | | 1,348,309,035 | |
| | | | | | | | | |
Other Assets/(Liabilities) — (0.1)% | | | | | | | (1,129,693 | ) |
| | | | | | | | | |
NET ASSETS — 100.0% | | | | | | $ | 1,347,179,342 | |
Notes to Portfolio of Investments
Percentages are stated as a percent of net assets.
(a) | Affiliated issuer. See Note 7 for a summary of transactions in the investments of affiliated issuers. |
(b) | See Note 6 for aggregate cost for federal tax purposes. |
The accompanying notes are an integral part of the financial statements.
30
MML Growth Allocation Fund – Portfolio of Investments |
June 30, 2022 (Unaudited) |
| | | Number of
Shares | | | Value | |
MUTUAL FUNDS — 100.1% |
Equity Funds — 73.7% |
MML Blue Chip Growth Fund, Initial Class (a) | | | 4,844,679 | | | $ | 67,825,509 | |
MML Equity Income Fund, Initial Class (a) | | | 5,510,305 | | | | 62,431,751 | |
MML Focused Equity Fund, Class II (a) | | | 13,557,995 | | | | 100,329,165 | |
MML Foreign Fund, Initial Class (a) | | | 3,296,943 | | | | 29,573,579 | |
MML Fundamental Equity Fund, Class II (a) | | | 6,070,613 | | | | 59,552,715 | |
MML Fundamental Value Fund, Class II (a) | | | 3,962,051 | | | | 52,457,553 | |
MML Global Fund, Class I (a) | | | 3,141,957 | | | | 36,823,736 | |
MML Income & Growth Fund, Initial Class (a) | | | 4,621,916 | | | | 52,782,284 | |
MML International Equity Fund, Class II (a) | | | 7,890,311 | | | | 70,460,480 | |
MML Large Cap Growth Fund, Initial Class (a) | | | 4,081,615 | | | | 43,754,908 | |
MML Mid Cap Growth Fund, Initial Class (a) | | | 2,917,319 | | | | 34,745,269 | |
MML Mid Cap Value Fund, Initial Class (a) | | | 3,036,468 | | | | 35,131,936 | |
MML Small Cap Growth Equity Fund, Initial Class (a) | | | 728,847 | | | | 8,209,716 | |
MML Small Company Value Fund, Class II (a) | | | 1,427,435 | | | | 21,325,883 | |
MML Small/Mid Cap Value Fund, Initial Class (a) | | | 774,068 | | | | 9,141,745 | |
MML Strategic Emerging Markets Fund, Class II (a) | | | 1,605,949 | | | | 12,365,805 | |
| | | | | | | | 696,912,034 | |
Fixed Income Funds — 26.4% |
Invesco V.I. Global Strategic Income Fund, Series I | | | 2,840,248 | | | | 10,821,346 | |
MML Dynamic Bond Fund, Class II (a) | | | 5,795,833 | | | | 51,988,620 | |
MML High Yield Fund, Class II (a) | | | 439,251 | | | | 3,781,948 | |
MML Inflation-Protected and Income Fund, Initial Class (a) | | | 1,446,998 | | | | 14,513,392 | |
MML Managed Bond Fund, Initial Class (a) | | | 7,486,036 | | | | 85,772,894 | |
MML Short-Duration Bond Fund, Class II (a) | | | 2,760,625 | | | | 24,679,985 | |
| | | Number of
Shares | | | Value | |
MML Total Return Bond Fund, Class II (a) | | | 6,294,498 | | | $ | 58,349,995 | |
| | | | | | | | 249,908,180 | |
| | | | | | | | | |
TOTAL MUTUAL FUNDS (Cost $1,010,902,293) | | | | | | | 946,820,214 | |
| | | | | | | | | |
TOTAL LONG-TERM INVESTMENTS (Cost $1,010,902,293) | | | | | | | 946,820,214 | |
| | | | | | | | | |
TOTAL INVESTMENTS — 100.1% (Cost $1,010,902,293) (b) | | | | | | | 946,820,214 | |
| | | | | | | | | |
Other Assets/(Liabilities) — (0.1)% | | | | | | | (685,251 | ) |
| | | | | | | | | |
NET ASSETS — 100.0% | | | | | | $ | 946,134,963 | |
Notes to Portfolio of Investments
Percentages are stated as a percent of net assets.
(a) | Affiliated issuer. See Note 7 for a summary of transactions in the investments of affiliated issuers. |
(b) | See Note 6 for aggregate cost for federal tax purposes. |
The accompanying notes are an integral part of the financial statements.
31
MML Aggressive Allocation Fund – Portfolio of Investments |
June 30, 2022 (Unaudited) |
| | | Number of
Shares | | | Value | |
MUTUAL FUNDS — 100.1% |
Equity Funds — 89.3% |
MML Blue Chip Growth Fund, Initial Class (a) | | | 839,355 | | | $ | 11,750,964 | |
MML Equity Income Fund, Initial Class (a) | | | 883,604 | | | | 10,011,235 | |
MML Focused Equity Fund, Class II (a) | | | 2,459,315 | | | | 18,198,928 | |
MML Foreign Fund, Initial Class (a) | | | 529,441 | | | | 4,749,089 | |
MML Fundamental Equity Fund, Class II (a) | | | 963,940 | | | | 9,456,254 | |
MML Fundamental Value Fund, Class II (a) | | | 664,640 | | | | 8,799,832 | |
MML Global Fund, Class I (a) | | | 221,565 | | | | 2,596,742 | |
MML Income & Growth Fund, Initial Class (a) | | | 767,475 | | | | 8,764,562 | |
MML International Equity Fund, Class II (a) | | | 1,316,371 | | | | 11,755,193 | |
MML Large Cap Growth Fund, Initial Class (a) | | | 735,306 | | | | 7,882,476 | |
MML Mid Cap Growth Fund, Initial Class (a) | | | 607,048 | | | | 7,229,943 | |
MML Mid Cap Value Fund, Initial Class (a) | | | 512,717 | | | | 5,932,140 | |
MML Small Cap Growth Equity Fund, Initial Class (a) | | | 143,373 | | | | 1,614,953 | |
MML Small Company Value Fund, Class II (a) | | | 225,940 | | | | 3,375,545 | |
MML Small/Mid Cap Value Fund, Initial Class (a) | | | 122,382 | | | | 1,445,326 | |
MML Strategic Emerging Markets Fund, Class II (a) | | | 276,281 | | | | 2,127,360 | |
| | | | | | | | 115,690,542 | |
Fixed Income Funds — 10.8% |
Invesco V.I. Global Strategic Income Fund, Series I | | | 265,756 | | | | 1,012,530 | |
MML Dynamic Bond Fund, Class II (a) | | | 297,331 | | | | 2,667,058 | |
MML High Yield Fund, Class II (a) | | | 62,744 | | | | 540,226 | |
MML Inflation-Protected and Income Fund, Initial Class (a) | | | 31,114 | | | | 312,072 | |
MML Managed Bond Fund, Initial Class (a) | | | 419,959 | | | | 4,811,767 | |
MML Short-Duration Bond Fund, Class II (a) | | | 249,326 | | | | 2,228,978 | |
| | | Number of
Shares | | | Value | |
MML Total Return Bond Fund, Class II (a) | | | 255,120 | | | $ | 2,364,967 | |
| | | | | | | | 13,937,598 | |
| | | | | | | | | |
TOTAL MUTUAL FUNDS (Cost $142,135,411) | | | | | | | 129,628,140 | |
| | | | | | | | | |
TOTAL LONG-TERM INVESTMENTS (Cost $142,135,411) | | | | | | | 129,628,140 | |
| | | | | | | | | |
TOTAL INVESTMENTS — 100.1% (Cost $142,135,411) (b) | | | | | | | 129,628,140 | |
| | | | | | | | | |
Other Assets/(Liabilities) — (0.1)% | | | | | | | (111,326 | ) |
| | | | | | | | | |
NET ASSETS — 100.0% | | | | | | $ | 129,516,814 | |
Notes to Portfolio of Investments
Percentages are stated as a percent of net assets.
(a) | Affiliated issuer. See Note 7 for a summary of transactions in the investments of affiliated issuers. |
(b) | See Note 6 for aggregate cost for federal tax purposes. |
The accompanying notes are an integral part of the financial statements.
32
MML American Funds Growth Fund – Portfolio of Investments |
June 30, 2022 (Unaudited) |
| | | Number of
Shares | | | Value | |
MUTUAL FUNDS — 100.1% |
Equity Funds — 100.1% |
American Funds Insurance Series Growth Fund, Class 1 | | | 2,656,691 | | | $ | 203,529,115 | |
| | | | | | | | | |
TOTAL MUTUAL FUNDS (Cost $221,399,001) | | | | | | | 203,529,115 | |
| | | | | | | | | |
TOTAL INVESTMENTS — 100.1% (Cost $221,399,001) (a) | | | | | | | 203,529,115 | |
| | | | | | | | | |
Other Assets/(Liabilities) — (0.1)% | | | | | | | (255,577 | ) |
| | | | | | | | | |
NET ASSETS — 100.0% | | | | | | $ | 203,273,538 | |
Notes to Portfolio of Investments
Percentages are stated as a percent of net assets.
(a) | See Note 6 for aggregate cost for federal tax purposes. |
The accompanying notes are an integral part of the financial statements.
33
MML American Funds International Fund – Portfolio of Investments |
June 30, 2022 (Unaudited) |
| | | Number of
Shares | | | Value | |
MUTUAL FUNDS — 100.2% |
Equity Funds — 100.2% |
American Funds Insurance Series® International Fund, Class 1 | | | 2,980,969 | | | $ | 45,221,293 | |
| | | | | | | | | |
TOTAL MUTUAL FUNDS (Cost $56,687,013) | | | | | | | 45,221,293 | |
| | | | | | | | | |
TOTAL INVESTMENTS — 100.2% (Cost $56,687,013) (a) | | | | | | | 45,221,293 | |
| | | | | | | | | |
Other Assets/(Liabilities) — (0.2)% | | | | | | | (80,234 | ) |
| | | | | | | | | |
NET ASSETS — 100.0% | | | | | | $ | 45,141,059 | |
Notes to Portfolio of Investments
Percentages are stated as a percent of net assets.
(a) | See Note 6 for aggregate cost for federal tax purposes. |
The accompanying notes are an integral part of the financial statements.
34
MML American Funds Core Allocation Fund – Portfolio of Investments |
June 30, 2022 (Unaudited) |
| | | Number of
Shares | | | Value | |
MUTUAL FUNDS — 100.1% |
Equity Funds — 64.4% |
American Funds Insurance Series® Growth-Income Fund, Class 1 | | | 3,842,065 | | | $ | 187,454,364 | |
American Funds Insurance Series® International Fund, Class 1 | | | 5,419,907 | | | | 82,219,989 | |
American Funds Insurance Series® Washington Mutual Investors Fund, Class 1 | | | 16,865,189 | | | | 206,767,213 | |
| | | | | | | | 476,441,566 | |
Fixed Income Funds — 35.7% |
American Funds Insurance Series® The Bond Fund Of America, Class 1 | | | 26,598,196 | | | | 263,854,099 | |
| | | | | | | | | |
TOTAL MUTUAL FUNDS (Cost $806,483,397) | | | | | | | 740,295,665 | |
| | | | | | | | | |
TOTAL LONG-TERM INVESTMENTS (Cost $806,483,397) | | | | | | | 740,295,665 | |
| | | | | | | | | |
TOTAL INVESTMENTS — 100.1% (Cost $806,483,397) (a) | | | | | | | 740,295,665 | |
| | | | | | | | | |
Other Assets/(Liabilities) — (0.1)% | | | | | | | (835,649 | ) |
| | | | | | | | | |
NET ASSETS — 100.0% | | | | | | $ | 739,460,016 | |
Notes to Portfolio of Investments
Percentages are stated as a percent of net assets.
(a) | See Note 6 for aggregate cost for federal tax purposes. |
The accompanying notes are an integral part of the financial statements.
35
MML Blue Chip Growth Fund – Portfolio of Investments |
June 30, 2022 (Unaudited) |
| | | Number of
Shares | | | Value | |
EQUITIES — 99.2% |
COMMON STOCK — 99.0% |
Basic Materials — 0.9% |
Chemicals — 0.9% |
Linde PLC | | | 7,492 | | | $ | 2,154,175 | |
The Sherwin-Williams Co. | | | 6,837 | | | | 1,530,872 | |
| | | | | | | | 3,685,047 | |
| | | | | | | | 3,685,047 | |
Communications — 28.4% |
Internet — 27.6% |
Alphabet, Inc. Class A (a) | | | 3,545 | | | | 7,725,477 | |
Alphabet, Inc. Class C (a) | | | 15,552 | | | | 34,019,222 | |
Amazon.com, Inc. (a) | | | 359,540 | | | | 38,186,743 | |
Booking Holdings, Inc. (a) | | | 1,439 | | | | 2,516,797 | |
DoorDash, Inc., Class A (a) | | | 35,473 | | | | 2,276,303 | |
Meta Platforms, Inc. Class A (a) | | | 79,580 | | | | 12,832,275 | |
Netflix, Inc. (a) | | | 10,229 | | | | 1,788,745 | |
Opendoor Technologies, Inc. (a) (b) | | | 95,590 | | | | 450,229 | |
Pinterest, Inc. Class A (a) | | | 47,319 | | | | 859,313 | |
Sea Ltd. ADR (a) | | | 53,976 | | | | 3,608,835 | |
Shopify, Inc. Class A (a) | | | 54,960 | | | | 1,716,950 | |
Snap, Inc. Class A (a) | | | 190,666 | | | | 2,503,445 | |
Spotify Technology SA (a) | | | 9,282 | | | | 870,930 | |
Tencent Holdings Ltd. | | | 50,800 | | | | 2,307,006 | |
| | | | | | | | 111,662,270 | |
Media — 0.4% |
The Walt Disney Co. (a) | | | 16,050 | | | | 1,515,120 | |
Telecommunications — 0.4% |
T-Mobile US, Inc. (a) | | | 11,153 | | | | 1,500,524 | |
| | | | | | | | 114,677,914 | |
Consumer, Cyclical — 9.5% |
Apparel — 0.9% |
NIKE, Inc. Class B | | | 34,620 | | | | 3,538,164 | |
Auto Manufacturers — 4.5% |
Tesla, Inc. (a) | | | 27,405 | | | | 18,455,075 | |
Retail — 4.1% |
Carvana Co. (a) (b) | | | 39,634 | | | | 894,936 | |
Chipotle Mexican Grill, Inc. (a) | | | 3,022 | | | | 3,950,540 | |
Dollar General Corp. | | | 19,890 | | | | 4,881,801 | |
Lululemon Athletica, Inc. (a) | | | 10,115 | | | | 2,757,450 | |
Ross Stores, Inc. | | | 44,814 | | | | 3,147,287 | |
The TJX Cos., Inc. | | | 16,156 | | | | 902,313 | |
| | | | | | | | 16,534,327 | |
| | | | | | | | 38,527,566 | |
Consumer, Non-cyclical — 17.1% |
Commercial Services — 2.1% |
Adyen NV (a) | | | 39,903 | | | | 582,983 | |
| | | Number of
Shares | | | Value | |
Affirm Holdings, Inc. (a) (b) | | | 21,876 | | | $ | 395,081 | |
Ant International Co. Ltd., Class C (Acquired 6/07/18, Cost $775,038) (c) (d) (e) | | | 203,348 | | | | 400,596 | |
Block, Inc. (a) | | | 24,779 | | | | 1,522,917 | |
Cintas Corp. | | | 1,936 | | | | 723,154 | |
PayPal Holdings, Inc. (a) | | | 15,617 | | | | 1,090,691 | |
S&P Global, Inc. | | | 8,953 | | | | 3,017,698 | |
TransUnion | | | 10,740 | | | | 859,093 | |
| | | | | | | | 8,592,213 | |
Health Care – Products — 5.5% |
Align Technology, Inc. (a) | | | 2,774 | | | | 656,522 | |
Danaher Corp. | | | 25,204 | | | | 6,389,718 | |
Intuitive Surgical, Inc. (a) | | | 32,592 | | | | 6,541,540 | |
Stryker Corp. | | | 18,704 | | | | 3,720,787 | |
Teleflex, Inc. | | | 4,916 | | | | 1,208,599 | |
Thermo Fisher Scientific, Inc. | | | 6,842 | | | | 3,717,122 | |
| | | | | | | | 22,234,288 | |
Health Care – Services — 6.0% |
Humana, Inc. | | | 8,404 | | | | 3,933,660 | |
UnitedHealth Group, Inc. | | | 39,204 | | | | 20,136,351 | |
| | | | | | | | 24,070,011 | |
Pharmaceuticals — 3.5% |
AstraZeneca PLC Sponsored ADR | | | 25,228 | | | | 1,666,814 | |
Eli Lilly & Co. | | | 28,481 | | | | 9,234,395 | |
Zoetis, Inc. | | | 19,068 | | | | 3,277,598 | |
| | | | | | | | 14,178,807 | |
| | | | | | | | 69,075,319 | |
Financial — 9.5% |
Banks — 1.3% |
The Goldman Sachs Group, Inc. | | | 17,391 | | | | 5,165,475 | |
Diversified Financial Services — 7.2% |
The Charles Schwab Corp. | | | 43,858 | | | | 2,770,949 | |
Mastercard, Inc. Class A | | | 35,848 | | | | 11,309,327 | |
Visa, Inc. Class A | | | 76,106 | | | | 14,984,510 | |
| | | | | | | | 29,064,786 | |
Insurance — 1.0% |
Chubb Ltd. | | | 10,293 | | | | 2,023,398 | |
Marsh & McLennan Cos., Inc. | | | 12,668 | | | | 1,966,707 | |
| | | | | | | | 3,990,105 | |
| | | | | | | | 38,220,366 | |
INDUSTRIAL — 0.5% |
Electronics — 0.2% |
TE Connectivity Ltd. | | | 7,686 | | | | 869,671 | |
Miscellaneous - Manufacturing — 0.3% |
General Electric Co. | | | 20,380 | | | | 1,297,595 | |
| | | | | | | | 2,167,266 | |
The accompanying notes are an integral part of the financial statements.
36
MML Blue Chip Growth Fund – Portfolio of Investments (Continued) |
| | | Number of
Shares | | | Value | |
Technology — 33.1% |
Computers — 8.3% |
Apple, Inc. | | | 214,987 | | | $ | 29,393,022 | |
Crowdstrike Holdings, Inc. Class A (a) | | | 3,172 | | | | 534,673 | |
Fortinet, Inc. (a) | | | 62,640 | | | | 3,544,171 | |
| | | | | | | | 33,471,866 | |
Semiconductors — 6.9% |
Advanced Micro Devices, Inc. (a) | | | 62,344 | | | | 4,767,446 | |
ASML Holding NV | | | 7,755 | | | | 3,690,449 | |
Marvell Technology, Inc. | | | 39,810 | | | | 1,732,929 | |
Monolithic Power Systems, Inc. | | | 5,031 | | | | 1,932,105 | |
NVIDIA Corp. | | | 78,783 | | | | 11,942,715 | |
Taiwan Semiconductor Manufacturing Co. Ltd. Sponsored ADR | | | 19,145 | | | | 1,565,104 | |
Texas Instruments, Inc. | | | 16,141 | | | | 2,480,065 | |
| | | | | | | | 28,110,813 | |
Software — 17.9% |
Atlassian Corp. PLC Class A (a) | | | 13,294 | | | | 2,491,296 | |
Bill.com Holdings, Inc. (a) | | | 17,872 | | | | 1,964,848 | |
Canva, Inc. (Acquired 8/16/21, Cost $582,930) (c) (d) (e) | | | 342 | | | | 326,593 | |
Confluent, Inc. Class A (a) | | | 21,787 | | | | 506,330 | |
Datadog, Inc. Class A (a) | | | 10,623 | | | | 1,011,735 | |
Gusto, Inc. (Acquired 10/04/21, Cost $193,055) (c) (d) (e) | | | 6,706 | | | | 192,813 | |
HashiCorp, Inc. Class A (a) (b) | | | 4,850 | | | | 142,784 | |
Intuit, Inc. | | | 20,695 | | | | 7,976,681 | |
Microsoft Corp. | | | 120,955 | | | | 31,064,873 | |
MongoDB, Inc. (a) | | | 9,314 | | | | 2,416,983 | |
MSCI, Inc. | | | 1,430 | | | | 589,374 | |
Paycom Software, Inc. (a) | | | 1,360 | | | | 380,963 | |
Roper Technologies, Inc. | | | 6,896 | | | | 2,721,506 | |
Salesforce, Inc. (a) | | | — | | | | — | |
ServiceNow, Inc. (a) | | | 25,149 | | | | 11,958,852 | |
Snowflake, Inc. Class A (a) | | | 6,690 | | | | 930,311 | |
Synopsys, Inc. (a) | | | 20,007 | | | | 6,076,126 | |
Veeva Systems, Inc. Class A (a) | | | 7,482 | | | | 1,481,735 | |
| | | | | | | | 72,233,803 | |
| | | | | | | | 133,816,482 | |
| | | | | | | | | |
TOTAL COMMON STOCK (Cost $348,451,759) | | | | | | | 400,169,960 | |
| | | | | | | | | |
| | | Number of
Shares | | | Value | |
PREFERRED STOCK — 0.2% |
Technology — 0.2% |
Software — 0.2% |
Canva, Inc., Series A (Acquired 11/04/21 - 12/17/21, Cost $37,502) (c) (d) (e) | | | 22 | | | $ | 21,009 | |
Canva, Inc., Series A-3 (Acquired 12/17/21, Cost $3,408) (c) (d) (e) | | | 2 | | | | 1,910 | |
Databricks, Inc., Series G (Acquired 2/01/21, Cost $172,224) (c) (d) (e) | | | 971 | | | | 161,069 | |
Databricks, Inc., Series H (Acquired 8/31/21, Cost $542,974) (c) (d) (e) | | | 2,463 | | | | 408,562 | |
Gusto, Inc., Series E (Acquired 7/13/21, Cost $254,865) (c) (d) (e) | | | 8,385 | | | | 254,865 | |
| | | | | | | | 847,415 | |
| | | | | | | | | |
TOTAL PREFERRED STOCK (Cost $1,010,973) | | | | | | | 847,415 | |
| | | | | | | | | |
TOTAL EQUITIES (Cost $349,462,732) | | | | | | | 401,017,375 | |
| | | | | | | | | |
| | | Principal
Amount | | | | | |
BONDS & NOTES — 0.2% |
CORPORATE DEBT — 0.2% |
Retail — 0.2% |
Carvana Co. 10.250% 5/01/30 (f) | | $ | 1,040,000 | | | | 838,115 | |
| | | | | | | | | |
TOTAL CORPORATE DEBT (Cost $1,040,000) | | | | | | | 838,115 | |
| | | | | | | | | |
TOTAL BONDS & NOTES (Cost $1,040,000) | | | | | | | 838,115 | |
| | | | | | | | | |
MUTUAL FUNDS — 0.3% |
Diversified Financial Services — 0.3% |
State Street Navigator Securities Lending Government Money Market Portfolio (g) | | | 1,057,491 | | | | 1,057,491 | |
| | | | | | | | | |
TOTAL MUTUAL FUNDS (Cost $1,057,491) | | | | | | | 1,057,491 | |
| | | | | | | | | |
TOTAL LONG-TERM INVESTMENTS (Cost $351,560,223) | | | | | | | 402,912,981 | |
| | | | | | | | | |
The accompanying notes are an integral part of the financial statements.
37
MML Blue Chip Growth Fund – Portfolio of Investments (Continued) |
| | | Number of
Shares | | | Value | |
SHORT-TERM INVESTMENTS — 0.7% |
Mutual Fund — 0.0% |
T. Rowe Price Government Reserve Investment Fund | | | 100 | | | $ | 100 | |
| | | Principal
Amount | | | | | |
Repurchase Agreement — 0.7% |
Fixed Income Clearing Corp., Repurchase Agreement, dated 6/30/22, 0.240%, due 7/01/22 (h) | | $ | 2,730,797 | | | | 2,730,797 | |
| | | | | | | | | |
TOTAL SHORT-TERM INVESTMENTS (Cost $2,730,897) | | | | | | | 2,730,897 | |
| | | | | | | | | |
TOTAL INVESTMENTS — 100.4% (Cost $354,291,120) (i) | | | | | | | 405,643,878 | |
| | | | | | | | | |
Other Assets/(Liabilities) — (0.4)% | | | | | | | (1,500,855 | ) |
| | | | | | | | | |
NET ASSETS — 100.0% | | | | | | $ | 404,143,023 | |
Abbreviation Legend
ADR | American Depositary Receipt |
Notes to Portfolio of Investments
Percentages are stated as a percent of net assets.
(a) | Non-income producing security. |
(b) | Denotes all or a portion of security on loan. The total value of securities on loan as of June 30, 2022, was $1,891,580 or 0.47% of net assets. Total securities on loan may be less than the amounts identified in the Portfolio of Investments. The Fund received $885,335 of non-cash collateral (U.S. Treasury and/or Agency obligations) related to securities lending activity. This amount is not reflected on either the Portfolio of Investments or the Statement of Assets and Liabilities. (Note 2). |
(c) | Investment was valued using significant unobservable inputs. |
(d) | Restricted security. Certain securities are restricted as to resale. At June 30, 2022, these securities amounted to a value of $1,767,417 or 0.44% of net assets. The Fund generally bears the costs, if any, associated with the disposition of restricted securities. |
(e) | This security is fair valued in good faith in accordance with procedures approved by the Board of Trustees. At June 30, 2022, these securities amounted to a value of $1,767,417 or 0.44% of net assets. |
(f) | Security is exempt from registration under Regulation S or Rule 144A of the Securities Act of 1933. These securities are considered restricted and may be resold in transactions exempt from registration. At June 30, 2022, the aggregate market value of these securities amounted to $838,115 or 0.21% of net assets. |
(g) | Represents investment of security lending cash collateral. (Note 2). |
(h) | Maturity value of $2,730,815. Collateralized by U.S. Government Agency obligations with a rate of 2.250%, maturity date of 11/15/24, and an aggregate market value, including accrued interest, of $2,785,476. |
(i) | See Note 6 for aggregate cost for federal tax purposes. |
The accompanying notes are an integral part of the financial statements.
38
MML Equity Income Fund – Portfolio of Investments |
June 30, 2022 (Unaudited) |
| | | Number of
Shares | | | Value | |
EQUITIES — 99.5% |
COMMON STOCK — 97.9% |
Basic Materials — 5.3% |
Chemicals — 3.6% |
Akzo Nobel NV | | | 15,896 | | | $ | 1,050,227 | |
CF Industries Holdings, Inc. | | | 87,699 | | | | 7,518,435 | |
DuPont de Nemours, Inc. | | | 3,976 | | | | 220,986 | |
International Flavors & Fragrances, Inc. | | | 34,563 | | | | 4,117,145 | |
RPM International, Inc. | | | 10,566 | | | | 831,756 | |
| | | | | | | | 13,738,549 | |
Forest Products & Paper — 1.7% |
International Paper Co. | | | 161,658 | | | | 6,762,154 | |
| | | | | | | | 20,500,703 | |
Communications — 5.5% |
Internet — 0.6% |
Meta Platforms, Inc. Class A (a) | | | 14,900 | | | | 2,402,625 | |
Media — 4.0% |
Comcast Corp. Class A | | | 125,609 | | | | 4,928,897 | |
Fox Corp. Class B | | | 40,926 | | | | 1,215,502 | |
News Corp. Class A | | | 311,169 | | | | 4,848,013 | |
The Walt Disney Co. (a) | | | 45,569 | | | | 4,301,714 | |
Warner Bros Discovery, Inc. (a) | | | 18,076 | | | | 242,580 | |
| | | | | | | | 15,536,706 | |
Telecommunications — 0.9% |
AT&T, Inc. | | | 54,055 | | | | 1,132,993 | |
Cisco Systems, Inc. | | | 37,868 | | | | 1,614,692 | |
Verizon Communications, Inc. | | | 11,774 | | | | 597,530 | |
| | | | | | | | 3,345,215 | |
| | | | | | | | 21,284,546 | |
Consumer, Cyclical — 5.1% |
Airlines — 0.2% |
Southwest Airlines Co. (a) | | | 27,804 | | | | 1,004,280 | |
Auto Manufacturers — 1.4% |
Cummins, Inc. | | | 3,600 | | | | 696,708 | |
PACCAR, Inc. | | | 17,590 | | | | 1,448,361 | |
Volkswagen AG ADR | | | 241,473 | | | | 3,199,517 | |
| | | | | | | | 5,344,586 | |
Lodging — 0.7% |
Las Vegas Sands Corp. (a) | | | 80,040 | | | | 2,688,544 | |
Retail — 2.0% |
Best Buy Co., Inc. | | | 6,800 | | | | 443,292 | |
Kohl’s Corp. | | | 56,311 | | | | 2,009,739 | |
The TJX Cos., Inc. | | | 47,594 | | | | 2,658,125 | |
Walmart, Inc. | | | 21,108 | | | | 2,566,311 | |
| | | | | | | | 7,677,467 | |
| | | Number of
Shares | | | Value | |
Toys, Games & Hobbies — 0.8% |
Mattel, Inc. (a) | | | 133,944 | | | $ | 2,990,970 | |
| | | | | | | | 19,705,847 | |
Consumer, Non-cyclical — 24.5% |
Agriculture — 1.5% |
Philip Morris International, Inc. | | | 58,279 | | | | 5,754,468 | |
Beverages — 0.3% |
The Coca-Cola Co. | | | 19,421 | | | | 1,221,775 | |
Biotechnology — 0.3% |
Biogen, Inc. (a) | | | 4,200 | | | | 856,548 | |
Gilead Sciences, Inc. | | | 4,536 | | | | 280,370 | |
| | | | | | | | 1,136,918 | |
Commercial Services — 0.1% |
Nielsen Holdings PLC | | | 16,448 | | | | 381,923 | |
Food — 2.9% |
Conagra Brands, Inc. | | | 178,084 | | | | 6,097,596 | |
Mondelez International, Inc. Class A | | | 6,800 | | | | 422,212 | |
Tyson Foods, Inc. Class A | | | 54,856 | | | | 4,720,908 | |
| | | | | | | | 11,240,716 | |
Health Care – Products — 2.0% |
Medtronic PLC | | | 52,734 | | | | 4,732,876 | |
Zimmer Biomet Holdings, Inc. | | | 26,764 | | | | 2,811,826 | |
| | | | | | | | 7,544,702 | |
Health Care – Services — 3.0% |
Centene Corp. (a) | | | 34,373 | | | | 2,908,300 | |
Elevance Health, Inc. | | | 18,249 | | | | 8,806,602 | |
| | | | | | | | 11,714,902 | |
Household Products & Wares — 1.7% |
Kimberly-Clark Corp. | | | 48,512 | | | | 6,556,397 | |
Pharmaceuticals — 12.7% |
AbbVie, Inc. | | | 56,275 | | | | 8,619,079 | |
AstraZeneca PLC Sponsored ADR | | | 34,313 | | | | 2,267,060 | |
Becton Dickinson and Co. | | | 28,294 | | | | 6,975,320 | |
Cardinal Health, Inc. | | | 37,937 | | | | 1,982,967 | |
Cigna Corp. | | | 14,963 | | | | 3,943,050 | |
CVS Health Corp. | | | 56,325 | | | | 5,219,074 | |
GSK PLC | | | 20,469 | | | | 440,133 | |
Johnson & Johnson | | | 34,714 | | | | 6,162,082 | |
Merck & Co., Inc. | | | 40,928 | | | | 3,731,406 | |
Pfizer, Inc. | | | 98,465 | | | | 5,162,520 | |
Sanofi | | | 26,969 | | | | 2,727,258 | |
Sanofi ADR | | | 32,068 | | | | 1,604,362 | |
| | | | | | | | 48,834,311 | |
| | | | | | | | 94,386,112 | |
The accompanying notes are an integral part of the financial statements.
39
MML Equity Income Fund – Portfolio of Investments (Continued) |
| | | Number of
Shares | | | Value | |
Energy — 7.6% |
Oil & Gas — 6.1% |
Chevron Corp. | | | 5,386 | | | $ | 779,785 | |
EOG Resources, Inc. | | | 37,261 | | | | 4,115,105 | |
Exxon Mobil Corp. | | | 55,526 | | | | 4,755,247 | |
Hess Corp. | | | 20,300 | | | | 2,150,582 | |
Occidental Petroleum Corp. | | | 16,727 | | | | 984,886 | |
TotalEnergies SE | | | 158,337 | | | | 8,346,256 | |
TotalEnergies SE Sponsored ADR | | | 47,515 | | | | 2,501,189 | |
| | | | | | | | 23,633,050 | |
Pipelines — 1.5% |
Enbridge, Inc. | | | 24,800 | | | | 1,048,048 | |
Targa Resources Corp. | | | 3,026 | | | | 180,562 | |
TC Energy Corp. | | | 87,620 | | | | 4,539,592 | |
| | | | | | | | 5,768,202 | |
| | | | | | | | 29,401,252 | |
Financial — 24.5% |
Banks — 10.2% |
Bank of America Corp. | | | 56,861 | | | | 1,770,083 | |
The Bank of New York Mellon Corp. | | | 9,097 | | | | 379,436 | |
Citigroup, Inc. | | | 44,440 | | | | 2,043,796 | |
Fifth Third Bancorp | | | 112,137 | | | | 3,767,803 | |
The Goldman Sachs Group, Inc. | | | 17,048 | | | | 5,063,597 | |
Huntington Bancshares, Inc. | | | 367,992 | | | | 4,426,944 | |
JP Morgan Chase & Co. | | | 18,915 | | | | 2,130,018 | |
Morgan Stanley | | | 37,411 | | | | 2,845,481 | |
The PNC Financial Services Group, Inc. | | | 7,730 | | | | 1,219,562 | |
State Street Corp. | | | 60,133 | | | | 3,707,199 | |
Wells Fargo & Co. | | | 305,262 | | | | 11,957,112 | |
| | | | | | | | 39,311,031 | |
Diversified Financial Services — 0.8% |
Apollo Global Management, Inc. | | | 11,400 | | | | 552,672 | |
The Charles Schwab Corp. | | | 31,005 | | | | 1,958,896 | |
Franklin Resources, Inc. | | | 13,702 | | | | 319,394 | |
Raymond James Financial, Inc. | | | 2,937 | | | | 262,597 | |
| | | | | | | | 3,093,559 | |
Insurance — 9.0% |
American International Group, Inc. | | | 165,605 | | | | 8,467,384 | |
Chubb Ltd. | | | 37,907 | | | | 7,451,758 | |
Equitable Holdings, Inc. | | | 215,830 | | | | 5,626,688 | |
The Hartford Financial Services Group, Inc. | | | 29,669 | | | | 1,941,243 | |
Loews Corp. | | | 93,033 | | | | 5,513,135 | |
Marsh & McLennan Cos., Inc. | | | 2,807 | | | | 435,787 | |
MetLife, Inc. | | | 86,180 | | | | 5,411,242 | |
| | | | | | | | 34,847,237 | |
| | | Number of
Shares | | | Value | |
Real Estate Investment Trusts (REITS) — 4.5% |
Equity Residential | | | 83,808 | | | $ | 6,052,614 | |
Rayonier, Inc. | | | 86,664 | | | | 3,239,500 | |
Vornado Realty Trust | | | 13,024 | | | | 372,356 | |
Welltower, Inc. | | | 14,801 | | | | 1,218,862 | |
Weyerhaeuser Co. | | | 190,712 | | | | 6,316,382 | |
| | | | | | | | 17,199,714 | |
| | | | | | | | 94,451,541 | |
Industrial — 9.3% |
Aerospace & Defense — 2.5% |
The Boeing Co. (a) | | | 19,747 | | | | 2,699,810 | |
L3 Harris Technologies, Inc. | | | 29,630 | | | | 7,161,571 | |
| | | | | | | | 9,861,381 | |
Electronics — 0.3% |
TE Connectivity Ltd. | | | 9,177 | | | | 1,038,377 | |
Environmental Controls — 0.7% |
Stericycle, Inc. (a) | | | 63,366 | | | | 2,778,599 | |
Hand & Machine Tools — 0.1% |
Stanley Black & Decker, Inc. | | | 3,900 | | | | 408,954 | |
Machinery – Diversified — 0.1% |
Flowserve Corp. | | | 12,573 | | | | 359,965 | |
Miscellaneous - Manufacturing — 3.1% |
3M Co. | | | 5,087 | | | | 658,309 | |
General Electric Co. | | | 135,632 | | | | 8,635,689 | |
Siemens AG Sponsored ADR | | | 50,004 | | | | 2,554,204 | |
| | | | | | | | 11,848,202 | |
Transportation — 2.5% |
United Parcel Service, Inc. Class B | | | 53,190 | | | | 9,709,303 | |
| | | | | | | | 36,004,781 | |
Technology — 7.0% |
Semiconductors — 4.3% |
Applied Materials, Inc. | | | 29,517 | | | | 2,685,457 | |
NXP Semiconductor NV | | | 5,381 | | | | 796,549 | |
QUALCOMM, Inc. | | | 72,215 | | | | 9,224,744 | |
Texas Instruments, Inc. | | | 25,471 | | | | 3,913,619 | |
| | | | | | | | 16,620,369 | |
Software — 2.7% |
Citrix Systems, Inc. | | | 22,571 | | | | 2,193,224 | |
Fiserv, Inc. (a) | | | 29,794 | | | | 2,650,772 | |
Microsoft Corp. | | | 20,784 | | | | 5,337,955 | |
| | | | | | | | 10,181,951 | |
| | | | | | | | 26,802,320 | |
Utilities — 9.1% |
Electric — 8.0% |
Ameren Corp. | | | 31,426 | | | | 2,839,653 | |
Dominion Energy, Inc. | | | 58,498 | | | | 4,668,726 | |
The accompanying notes are an integral part of the financial statements.
40
MML Equity Income Fund – Portfolio of Investments (Continued) |
| | | Number of
Shares | | | Value | |
NextEra Energy, Inc. | | | 27,261 | | | $ | 2,111,637 | |
PG&E Corp. (a) | | | 21,700 | | | | 216,566 | |
Sempra Energy | | | 54,922 | | | | 8,253,129 | |
The Southern Co. | | | 155,320 | | | | 11,075,869 | |
Xcel Energy, Inc. | | | 26,900 | | | | 1,903,444 | |
| | | | | | | | 31,069,024 | |
Gas — 1.1% |
NiSource, Inc. | | | 139,099 | | | | 4,102,029 | |
| | | | | | | | 35,171,053 | |
| | | | | | | | | |
TOTAL COMMON STOCK (Cost $312,173,925) | | | | | | | 377,708,155 | |
| | | | | | | | | |
PREFERRED STOCK — 1.6% |
Consumer, Non-cyclical — 0.4% |
Pharmaceuticals — 0.4% |
Becton Dickinson and Co. Convertible 6.000% (b) | | | 31,874 | | | | 1,576,488 | |
Utilities — 1.2% |
Electric — 0.8% |
NextEra Energy, Inc. Convertible 5.279% | | | 26,869 | | | | 1,334,046 | |
The Southern Co. Convertible 6.750% | | | 35,696 | | | | 1,891,174 | |
| | | | | | | | 3,225,220 | |
Gas — 0.4% |
NiSource, Inc. 7.750% (b) | | | 13,065 | | | | 1,485,752 | |
| | | | | | | | 4,710,972 | |
| | | | | | | | | |
TOTAL PREFERRED STOCK (Cost $5,995,682) | | | | | | | 6,287,460 | |
| | | | | | | | | |
TOTAL EQUITIES (Cost $318,169,607) | | | | | | | 383,995,615 | |
| | | | | | | | | |
MUTUAL FUNDS — 0.4% |
Diversified Financial Services — 0.4% |
State Street Navigator Securities Lending Government Money Market Portfolio (c) | | | 1,618,767 | | | | 1,618,767 | |
| | | | | | | | | |
TOTAL MUTUAL FUNDS (Cost $1,618,767) | | | | | | | 1,618,767 | |
| | | | | | | | | |
TOTAL LONG-TERM INVESTMENTS (Cost $319,788,374) | | | | | | | 385,614,382 | |
| | | | | | | | | |
| | | Number of
Shares | | | Value | |
SHORT-TERM INVESTMENTS — 0.9% |
Mutual Fund — 0.0% |
T. Rowe Price Government Reserve Investment Fund | | | 1,077 | | | $ | 1,077 | |
| | | Principal
Amount | | | | | |
Repurchase Agreement — 0.9% |
Fixed Income Clearing Corp., Repurchase Agreement, dated 6/30/22, 0.240%, due 7/01/22 (d) | | $ | 3,370,058 | | | | 3,370,058 | |
| | | | | | | | | |
TOTAL SHORT-TERM INVESTMENTS (Cost $3,371,135) | | | | | | | 3,371,135 | |
| | | | | | | | | |
TOTAL INVESTMENTS — 100.8% (Cost $323,159,509) (e) | | | | | | | 388,985,517 | |
| | | | | | | | | |
Other Assets/(Liabilities) — (0.8)% | | | | | | | (3,261,205 | ) |
| | | | | | | | | |
NET ASSETS — 100.0% | | | | | | $ | 385,724,312 | |
Abbreviation Legend
ADR | American Depositary Receipt |
Notes to Portfolio of Investments
Percentages are stated as a percent of net assets.
(a) | Non-income producing security. |
(b) | Denotes all or a portion of security on loan. The total value of securities on loan as of June 30, 2022, was $1,586,838 or 0.41% of net assets. Total securities on loan may be less than the amounts identified in the Portfolio of Investments. This amount is not reflected on either the Portfolio of Investments or the Statement of Assets and Liabilities. (Note 2). |
(c) | Represents investment of security lending cash collateral. (Note 2). |
(d) | Maturity value of $3,370,081. Collateralized by U.S. Government Agency obligations with a rate of 3.000%, maturity date of 6/30/24, and an aggregate market value, including accrued interest, of $3,437,535. |
(e) | See Note 6 for aggregate cost for federal tax purposes. |
The accompanying notes are an integral part of the financial statements.
41
MML Equity Index Fund – Portfolio of Investments |
June 30, 2022 (Unaudited) |
| | | Number of
Shares | | | Value | |
EQUITIES — 99.2% |
COMMON STOCK — 99.2% |
Basic Materials — 2.1% |
Chemicals — 1.7% |
Air Products & Chemicals, Inc. | | | 4,158 | | | $ | 999,916 | |
Albemarle Corp. | | | 2,182 | | | | 455,994 | |
Celanese Corp. | | | 2,013 | | | | 236,749 | |
CF Industries Holdings, Inc. | | | 3,891 | | | | 333,575 | |
Dow, Inc. | | | 13,594 | | | | 701,586 | |
DuPont de Nemours, Inc. | | | 9,562 | | | | 531,456 | |
Eastman Chemical Co. | | | 2,401 | | | | 215,538 | |
Ecolab, Inc. | | | 4,650 | | | | 714,984 | |
FMC Corp. | | | 2,361 | | | | 252,651 | |
International Flavors & Fragrances, Inc. | | | 4,747 | | | | 565,463 | |
Linde PLC | | | 9,425 | | | | 2,709,970 | |
LyondellBasell Industries NV Class A | | | 4,825 | | | | 421,994 | |
The Mosaic Co. | | | 6,740 | | | | 318,330 | |
PPG Industries, Inc. | | | 4,427 | | | | 506,183 | |
The Sherwin-Williams Co. | | | 4,471 | | | | 1,001,102 | |
| | | | | | | | 9,965,491 | |
Forest Products & Paper — 0.0% |
International Paper Co. | | | 6,978 | | | | 291,890 | |
Iron & Steel — 0.1% |
Nucor Corp. | | | 4,981 | | | | 520,066 | |
Mining — 0.3% |
Freeport-McMoRan, Inc. | | | 27,108 | | | | 793,180 | |
Newmont Corp. | | | 14,874 | | | | 887,532 | |
| | | | | | | | 1,680,712 | |
| | | | | | | | 12,458,159 | |
Communications — 12.7% |
Advertising — 0.1% |
The Interpublic Group of Cos., Inc. | | | 7,314 | | | | 201,354 | |
Omnicom Group, Inc. | | | 3,893 | | | | 247,634 | |
| | | | | | | | 448,988 | |
Internet — 8.9% |
Alphabet, Inc. Class A (a) | | | 5,629 | | | | 12,267,054 | |
Alphabet, Inc. Class C (a) | | | 5,161 | | | | 11,289,429 | |
Amazon.com, Inc. (a) | | | 163,743 | | | | 17,391,144 | |
Booking Holdings, Inc. (a) | | | 760 | | | | 1,329,232 | |
CDW Corp. | | | 2,532 | | | | 398,942 | |
eBay, Inc. | | | 10,499 | | | | 437,493 | |
Etsy, Inc. (a) | | | 2,386 | | | | 174,679 | |
Expedia Group, Inc. (a) | | | 2,854 | | | | 270,645 | |
F5, Inc. (a) | | | 1,143 | | | | 174,925 | |
Match Group, Inc. (a) | | | 5,369 | | | | 374,166 | |
Meta Platforms, Inc. Class A (a) | | | 42,927 | | | | 6,921,979 | |
| | | Number of
Shares | | | Value | |
Netflix, Inc. (a) | | | 8,325 | | | $ | 1,455,793 | |
NortonLifeLock, Inc. | | | 10,830 | | | | 237,827 | |
Twitter, Inc. (a) | | | 14,275 | | | | 533,742 | |
VeriSign, Inc. (a) | | | 1,802 | | | | 301,529 | |
| | | | | | | | 53,558,579 | |
Media — 1.5% |
Charter Communications, Inc. Class A (a) | | | 2,169 | | | | 1,016,241 | |
Comcast Corp. Class A | | | 83,665 | | | | 3,283,014 | |
DISH Network Corp. Class A (a) | | | 4,700 | | | | 84,271 | |
FactSet Research Systems, Inc. | | | 703 | | | | 270,353 | |
Fox Corp. Class A | | | 5,854 | | | | 188,265 | |
Fox Corp. Class B | | | 2,744 | | | | 81,497 | |
News Corp. Class A | | | 7,186 | | | | 111,958 | |
News Corp. Class B | | | 2,302 | | | | 36,579 | |
Paramount Global Class B | | | 11,312 | | | | 279,180 | |
The Walt Disney Co. (a) | | | 34,102 | | | | 3,219,229 | |
Warner Bros Discovery, Inc. (a) | | | 41,232 | | | | 553,333 | |
| | | | | | | | 9,123,920 | |
Telecommunications — 2.2% |
Arista Networks, Inc. (a) | | | 4,181 | | | | 391,927 | |
AT&T, Inc. | | | 133,960 | | | | 2,807,802 | |
Cisco Systems, Inc. | | | 77,774 | | | | 3,316,283 | |
Corning, Inc. | | | 14,268 | | | | 449,585 | |
Juniper Networks, Inc. | | | 6,121 | | | | 174,449 | |
Lumen Technologies, Inc. | | | 17,346 | | | | 189,245 | |
Motorola Solutions, Inc. | | | 3,122 | | | | 654,371 | |
T-Mobile US, Inc. (a) | | | 11,030 | | | | 1,483,976 | |
Verizon Communications, Inc. | | | 78,559 | | | | 3,986,869 | |
| | | | | | | | 13,454,507 | |
| | | | | | | | 76,585,994 | |
Consumer, Cyclical — 9.0% |
Airlines — 0.2% |
Alaska Air Group, Inc. (a) | | | 2,370 | | | | 94,918 | |
American Airlines Group, Inc. (a) | | | 12,064 | | | | 152,972 | |
Delta Air Lines, Inc. (a) | | | 11,920 | | | | 345,322 | |
Southwest Airlines Co. (a) | | | 11,043 | | | | 398,873 | |
United Airlines Holdings, Inc. (a) | | | 6,164 | | | | 218,329 | |
| | | | | | | | 1,210,414 | |
Apparel — 0.5% |
NIKE, Inc. Class B | | | 23,729 | | | | 2,425,104 | |
PVH Corp. | | | 1,234 | | | | 70,215 | |
Ralph Lauren Corp. | | | 881 | | | | 78,982 | |
Tapestry, Inc. | | | 4,656 | | | | 142,101 | |
VF Corp. | | | 5,996 | | | | 264,843 | |
| | | | | | | | 2,981,245 | |
The accompanying notes are an integral part of the financial statements.
42
MML Equity Index Fund – Portfolio of Investments (Continued) |
| | | Number of
Shares | | | Value | |
Auto Manufacturers — 2.2% |
Cummins, Inc. | | | 2,655 | | | $ | 513,822 | |
Ford Motor Co. | | | 74,055 | | | | 824,232 | |
General Motors Co. (a) | | | 27,341 | | | | 868,350 | |
PACCAR, Inc. | | | 6,476 | | | | 533,234 | |
Tesla, Inc. (a) | | | 15,702 | | | | 10,574,041 | |
| | | | | | | | 13,313,679 | |
Auto Parts & Equipment — 0.1% |
Aptiv PLC (a) | | | 5,043 | | | | 449,180 | |
BorgWarner, Inc. | | | 4,513 | | | | 150,599 | |
| | | | | | | | 599,779 | |
Distribution & Wholesale — 0.3% |
Copart, Inc. (a) | | | 3,980 | | | | 432,467 | |
Fastenal Co. | | | 10,735 | | | | 535,891 | |
LKQ Corp. | | | 4,832 | | | | 237,203 | |
Pool Corp. | | | 747 | | | | 262,369 | |
W.W. Grainger, Inc. | | | 807 | | | | 366,725 | |
| | | | | | | | 1,834,655 | |
Entertainment — 0.1% |
Caesars Entertainment, Inc. (a) | | | 3,977 | | | | 152,319 | |
Live Nation Entertainment, Inc. (a) | | | 2,584 | | | | 213,387 | |
Penn National Gaming, Inc. (a) | | | 3,127 | | | | 95,123 | |
| | | | | | | | 460,829 | |
Home Builders — 0.2% |
D.R. Horton, Inc. | | | 6,001 | | | | 397,206 | |
Lennar Corp. Class A | | | 4,856 | | | | 342,688 | |
NVR, Inc. (a) | | | 58 | | | | 232,240 | |
PulteGroup, Inc. | | | 4,427 | | | | 175,442 | |
| | | | | | | | 1,147,576 | |
Home Furnishing — 0.0% |
Whirlpool Corp. | | | 1,047 | | | | 162,149 | |
Housewares — 0.0% |
Newell Brands, Inc. | | | 6,788 | | | | 129,244 | |
Leisure Time — 0.1% |
Carnival Corp. (a) (b) | | | 15,225 | | | | 131,696 | |
Norwegian Cruise Line Holdings Ltd. (a) | | | 7,740 | | | | 86,069 | |
Royal Caribbean Cruises Ltd. (a) | | | 4,167 | | | | 145,470 | |
| | | | | | | | 363,235 | |
Lodging — 0.3% |
Hilton Worldwide Holdings, Inc. | | | 5,198 | | | | 579,265 | |
Las Vegas Sands Corp. (a) | | | 6,386 | | | | 214,506 | |
Marriott International, Inc. Class A | | | 5,157 | | | | 701,403 | |
MGM Resorts International | | | 6,668 | | | | 193,039 | |
Wynn Resorts Ltd. (a) | | | 1,981 | | | | 112,877 | |
| | | | | | | | 1,801,090 | |
| | | Number of
Shares | | | Value | |
Retail — 5.0% |
Advance Auto Parts, Inc. | | | 1,158 | | | $ | 200,438 | |
AutoZone, Inc. (a) | | | 371 | | | | 797,324 | |
Bath & Body Works, Inc. | | | 4,491 | | | | 120,898 | |
Best Buy Co., Inc. | | | 3,806 | | | | 248,113 | |
CarMax, Inc. (a) | | | 3,013 | | | | 272,616 | |
Chipotle Mexican Grill, Inc. (a) | | | 525 | | | | 686,312 | |
Costco Wholesale Corp. | | | 8,294 | | | | 3,975,148 | |
Darden Restaurants, Inc. | | | 2,319 | | | | 262,325 | |
Dollar General Corp. | | | 4,279 | | | | 1,050,238 | |
Dollar Tree, Inc. (a) | | | 4,196 | | | | 653,947 | |
Domino’s Pizza, Inc. | | | 678 | | | | 264,223 | |
Genuine Parts Co. | | | 2,654 | | | | 352,982 | |
The Home Depot, Inc. | | | 19,339 | | | | 5,304,108 | |
Lowe’s Cos., Inc. | | | 12,375 | | | | 2,161,541 | |
McDonald’s Corp. | | | 13,848 | | | | 3,418,794 | |
O’Reilly Automotive, Inc. (a) | | | 1,231 | | | | 777,697 | |
Ross Stores, Inc. | | | 6,585 | | | | 462,465 | |
Starbucks Corp. | | | 21,450 | | | | 1,638,565 | |
Target Corp. | | | 8,659 | | | | 1,222,911 | |
The TJX Cos., Inc. | | | 21,977 | | | | 1,227,415 | |
Tractor Supply Co. | | | 2,084 | | | | 403,983 | |
Ulta Beauty, Inc. (a) | | | 979 | | | | 377,385 | |
Walgreens Boots Alliance, Inc. | | | 13,356 | | | | 506,192 | |
Walmart, Inc. | | | 26,283 | | | | 3,195,487 | |
Yum! Brands, Inc. | | | 5,320 | | | | 603,873 | |
| | | | | | | | 30,184,980 | |
Toys, Games & Hobbies — 0.0% |
Hasbro, Inc. | | | 2,476 | | | | 202,735 | |
| | | | | | | | 54,391,610 | |
Consumer, Non-cyclical — 22.3% |
Agriculture — 0.8% |
Altria Group, Inc. | | | 33,844 | | | | 1,413,664 | |
Archer-Daniels-Midland Co. | | | 10,554 | | | | 818,991 | |
Philip Morris International, Inc. | | | 29,014 | | | | 2,864,842 | |
| | | | | | | | 5,097,497 | |
Beverages — 1.9% |
Brown-Forman Corp. Class B | | | 3,394 | | | | 238,123 | |
The Coca-Cola Co. | | | 73,038 | | | | 4,594,821 | |
Constellation Brands, Inc. Class A | | | 3,038 | | | | 708,036 | |
Keurig Dr Pepper, Inc. | | | 13,820 | | | | 489,090 | |
Molson Coors Beverage Co. Class B | | | 3,546 | | | | 193,292 | |
Monster Beverage Corp. (a) | | | 7,005 | | | | 649,364 | |
PepsiCo, Inc. | | | 25,888 | | | | 4,314,494 | |
| | | | | | | | 11,187,220 | |
Biotechnology — 1.6% |
Amgen, Inc. | | | 10,001 | | | | 2,433,243 | |
Bio-Rad Laboratories, Inc. Class A (a) | | | 402 | | | | 198,990 | |
The accompanying notes are an integral part of the financial statements.
43
MML Equity Index Fund – Portfolio of Investments (Continued) |
| | | Number of
Shares | | | Value | |
Biogen, Inc. (a) | | | 2,739 | | | $ | 558,592 | |
Corteva, Inc. | | | 13,560 | | | | 734,139 | |
Gilead Sciences, Inc. | | | 23,506 | | | | 1,452,906 | |
Illumina, Inc. (a) | | | 2,950 | | | | 543,862 | |
Incyte Corp. (a) | | | 3,501 | | | | 265,971 | |
Moderna, Inc. (a) | | | 6,479 | | | | 925,525 | |
Regeneron Pharmaceuticals, Inc. (a) | | | 2,024 | | | | 1,196,447 | |
Vertex Pharmaceuticals, Inc. (a) | | | 4,789 | | | | 1,349,492 | |
| | | | | | | | 9,659,167 | |
Commercial Services — 1.7% |
Automatic Data Processing, Inc. | | | 7,809 | | | | 1,640,202 | |
Cintas Corp. | | | 1,623 | | | | 606,239 | |
Equifax, Inc. | | | 2,275 | | | | 415,825 | |
FleetCor Technologies, Inc. (a) | | | 1,455 | | | | 305,710 | |
Gartner, Inc. (a) | | | 1,499 | | | | 362,503 | |
Global Payments, Inc. | | | 5,253 | | | | 581,192 | |
MarketAxess Holdings, Inc. | | | 716 | | | | 183,303 | |
Moody’s Corp. | | | 2,997 | | | | 815,094 | |
Nielsen Holdings PLC | | | 6,754 | | | | 156,828 | |
PayPal Holdings, Inc. (a) | | | 21,648 | | | | 1,511,896 | |
Quanta Services, Inc. | | | 2,704 | | | | 338,919 | |
Robert Half International, Inc. | | | 2,061 | | | | 154,348 | |
Rollins, Inc. | | | 4,204 | | | | 146,804 | |
S&P Global, Inc. | | | 6,495 | | | | 2,189,205 | |
United Rentals, Inc. (a) | | | 1,350 | | | | 327,929 | |
Verisk Analytics, Inc. | | | 2,944 | | | | 509,577 | |
| | | | | | | | 10,245,574 | |
Cosmetics & Personal Care — 1.5% |
Colgate-Palmolive Co. | | | 15,724 | | | | 1,260,121 | |
The Estee Lauder Cos., Inc. Class A | | | 4,335 | | | | 1,103,995 | |
The Procter & Gamble Co. | | | 44,905 | | | | 6,456,890 | |
| | | | | | | | 8,821,006 | |
Food — 1.2% |
Campbell Soup Co. | | | 3,806 | | | | 182,878 | |
Conagra Brands, Inc. | | | 8,934 | | | | 305,900 | |
General Mills, Inc. | | | 11,249 | | | | 848,737 | |
The Hershey Co. | | | 2,741 | | | | 589,754 | |
Hormel Foods Corp. | | | 5,249 | | | | 248,593 | |
The J.M. Smucker Co. | | | 2,016 | | | | 258,068 | |
Kellogg Co. | | | 4,771 | | | | 340,363 | |
The Kraft Heinz Co. | | | 13,235 | | | | 504,783 | |
The Kroger Co. | | | 12,270 | | | | 580,739 | |
Lamb Weston Holdings, Inc. | | | 2,733 | | | | 195,300 | |
McCormick & Co., Inc. | | | 4,657 | | | | 387,695 | |
Mondelez International, Inc. Class A | | | 25,896 | | | | 1,607,883 | |
Sysco Corp. | | | 9,558 | | | | 809,658 | |
Tyson Foods, Inc. Class A | | | 5,448 | | | | 468,855 | |
| | | | | | | | 7,329,206 | |
| | | Number of
Shares | | | Value | |
Health Care – Products — 3.8% |
Abbott Laboratories | | | 32,772 | | | $ | 3,560,678 | |
ABIOMED, Inc. (a) | | | 845 | | | | 209,146 | |
Align Technology, Inc. (a) | | | 1,367 | | | | 323,528 | |
Baxter International, Inc. | | | 9,451 | | | | 607,038 | |
Bio-Techne Corp. | | | 732 | | | | 253,741 | |
Boston Scientific Corp. (a) | | | 26,806 | | | | 999,060 | |
The Cooper Cos., Inc. | | | 918 | | | | 287,444 | |
Danaher Corp. | | | 12,109 | | | | 3,069,874 | |
Dentsply Sirona, Inc. | | | 4,115 | | | | 147,029 | |
Edwards Lifesciences Corp. (a) | | | 11,644 | | | | 1,107,228 | |
Henry Schein, Inc. (a) | | | 2,610 | | | | 200,291 | |
Hologic, Inc. (a) | | | 4,661 | | | | 323,007 | |
IDEXX Laboratories, Inc. (a) | | | 1,581 | | | | 554,504 | |
Intuitive Surgical, Inc. (a) | | | 6,727 | | | | 1,350,176 | |
Medtronic PLC | | | 25,076 | | | | 2,250,571 | |
PerkinElmer, Inc. | | | 2,353 | | | | 334,644 | |
ResMed, Inc. | | | 2,727 | | | | 571,661 | |
Steris PLC | | | 1,868 | | | | 385,088 | |
Stryker Corp. | | | 6,308 | | | | 1,254,850 | |
Teleflex, Inc. | | | 871 | | | | 214,135 | |
Thermo Fisher Scientific, Inc. | | | 7,326 | | | | 3,980,069 | |
Waters Corp. (a) | | | 1,122 | | | | 371,360 | |
West Pharmaceutical Services, Inc. | | | 1,381 | | | | 417,573 | |
Zimmer Biomet Holdings, Inc. | | | 3,940 | | | | 413,936 | |
| | | | | | | | 23,186,631 | |
Health Care – Services — 2.7% |
Catalent, Inc. (a) | | | 3,340 | | | | 358,348 | |
Centene Corp. (a) | | | 10,970 | | | | 928,172 | |
Charles River Laboratories International, Inc. (a) | | | 960 | | | | 205,411 | |
DaVita, Inc. (a) | | | 1,142 | | | | 91,314 | |
Elevance Health, Inc. | | | 4,508 | | | | 2,175,471 | |
HCA Healthcare, Inc. | | | 4,262 | | | | 716,272 | |
Humana, Inc. | | | 2,368 | | | | 1,108,390 | |
IQVIA Holdings, Inc. (a) | | | 3,533 | | | | 766,626 | |
Laboratory Corp. of America Holdings | | | 1,735 | | | | 406,614 | |
Molina Healthcare, Inc. (a) | | | 1,088 | | | | 304,216 | |
Quest Diagnostics, Inc. | | | 2,218 | | | | 294,950 | |
UnitedHealth Group, Inc. | | | 17,554 | | | | 9,016,261 | |
Universal Health Services, Inc. Class B | | | 1,274 | | | | 128,304 | |
| | | | | | | | 16,500,349 | |
Household Products & Wares — 0.3% |
Avery Dennison Corp. | | | 1,545 | | | | 250,089 | |
Church & Dwight Co., Inc. | | | 4,513 | | | | 418,175 | |
The Clorox Co. | | | 2,294 | | | | 323,408 | |
The accompanying notes are an integral part of the financial statements.
44
MML Equity Index Fund – Portfolio of Investments (Continued) |
| | | Number of
Shares | | | Value | |
Kimberly-Clark Corp. | | | 6,321 | | | $ | 854,283 | |
| | | | | | | | 1,845,955 | |
Pharmaceuticals — 6.8% |
AbbVie, Inc. | | | 33,070 | | | | 5,065,001 | |
AmerisourceBergen Corp. | | | 2,808 | | | | 397,276 | |
Becton Dickinson and Co. | | | 5,343 | | | | 1,317,210 | |
Bristol-Myers Squibb Co. | | | 39,845 | | | | 3,068,065 | |
Cardinal Health, Inc. | | | 5,161 | | | | 269,765 | |
Cigna Corp. | | | 5,942 | | | | 1,565,836 | |
CVS Health Corp. | | | 24,562 | | | | 2,275,915 | |
DexCom, Inc. (a) | | | 7,368 | | | | 549,137 | |
Eli Lilly & Co. | | | 14,759 | | | | 4,785,311 | |
Johnson & Johnson | | | 49,255 | | | | 8,743,255 | |
McKesson Corp. | | | 2,719 | | | | 886,965 | |
Merck & Co., Inc. | | | 47,333 | | | | 4,315,350 | |
Organon & Co. | | | 4,773 | | | | 161,089 | |
Pfizer, Inc. | | | 105,010 | | | | 5,505,674 | |
Viatris, Inc. | | | 22,516 | | | | 235,742 | |
Zoetis, Inc. | | | 8,824 | | | | 1,516,757 | |
| | | | | | | | 40,658,348 | |
| | | | | | | | 134,530,953 | |
Energy — 4.5% |
Energy – Alternate Sources — 0.2% |
Enphase Energy, Inc. (a) | | | 2,537 | | | | 495,324 | |
SolarEdge Technologies, Inc. (a) | | | 1,036 | | | | 283,532 | |
| | | | | | | | 778,856 | |
Oil & Gas — 3.7% |
APA Corp. | | | 6,324 | | | | 220,708 | |
Chevron Corp. | | | 36,768 | | | | 5,323,271 | |
ConocoPhillips | | | 24,190 | | | | 2,172,504 | |
Coterra Energy, Inc. | | | 15,176 | | | | 391,389 | |
Devon Energy Corp. | | | 11,480 | | | | 632,663 | |
Diamondback Energy, Inc. | | | 3,110 | | | | 376,777 | |
EOG Resources, Inc. | | | 10,976 | | | | 1,212,189 | |
Exxon Mobil Corp. | | | 78,819 | | | | 6,750,059 | |
Hess Corp. | | | 5,200 | | | | 550,888 | |
Marathon Oil Corp. | | | 13,234 | | | | 297,500 | |
Marathon Petroleum Corp. | | | 10,120 | | | | 831,965 | |
Occidental Petroleum Corp. | | | 16,693 | | | | 982,884 | |
Phillips 66 | | | 9,002 | | | | 738,074 | |
Pioneer Natural Resources Co. | | | 4,204 | | | | 937,828 | |
Valero Energy Corp. | | | 7,625 | | | | 810,385 | |
| | | | | | | | 22,229,084 | |
Oil & Gas Services — 0.3% |
Baker Hughes Co. | | | 17,512 | | | | 505,572 | |
Halliburton Co. | | | 16,933 | | | | 531,019 | |
| | | Number of
Shares | | | Value | |
Schlumberger NV | | | 26,449 | | | $ | 945,816 | |
| | | | | | | | 1,982,407 | |
Pipelines — 0.3% |
Kinder Morgan, Inc. | | | 36,353 | | | | 609,276 | |
ONEOK, Inc. | | | 8,310 | | | | 461,205 | |
The Williams Cos., Inc. | | | 22,854 | | | | 713,274 | |
| | | | | | | | 1,783,755 | |
| | | | | | | | 26,774,102 | |
Financial — 14.8% |
Banks — 4.5% |
Bank of America Corp. | | | 132,749 | | | | 4,132,476 | |
The Bank of New York Mellon Corp. | | | 13,953 | | | | 581,980 | |
Citigroup, Inc. | | | 36,339 | | | | 1,671,231 | |
Citizens Financial Group, Inc. | | | 9,200 | | | | 328,348 | |
Comerica, Inc. | | | 2,460 | | | | 180,515 | |
Fifth Third Bancorp | | | 12,894 | | | | 433,238 | |
First Republic Bank | | | 3,344 | | | | 482,205 | |
The Goldman Sachs Group, Inc. | | | 6,428 | | | | 1,909,244 | |
Huntington Bancshares, Inc. | | | 26,791 | | | | 322,296 | |
JP Morgan Chase & Co. | | | 54,951 | | | | 6,188,032 | |
KeyCorp. | | | 17,295 | | | | 297,993 | |
M&T Bank Corp. | | | 3,343 | | | | 532,841 | |
Morgan Stanley | | | 26,181 | | | | 1,991,327 | |
Northern Trust Corp. | | | 3,874 | | | | 373,763 | |
The PNC Financial Services Group, Inc. | | | 7,728 | | | | 1,219,247 | |
Regions Financial Corp. | | | 17,555 | | | | 329,156 | |
Signature Bank | | | 1,167 | | | | 209,138 | |
State Street Corp. | | | 6,900 | | | | 425,385 | |
SVB Financial Group (a) | | | 1,096 | | | | 432,909 | |
Truist Financial Corp. | | | 24,884 | | | | 1,180,248 | |
US Bancorp | | | 25,343 | | | | 1,166,285 | |
Wells Fargo & Co. | | | 70,938 | | | | 2,778,641 | |
Zions Bancorp NA | | | 2,824 | | | | 143,742 | |
| | | | | | | | 27,310,240 | |
Diversified Financial Services — 3.7% |
American Express Co. | | | 11,405 | | | | 1,580,961 | |
Ameriprise Financial, Inc. | | | 2,069 | | | | 491,760 | |
BlackRock, Inc. | | | 2,668 | | | | 1,624,919 | |
Capital One Financial Corp. | | | 7,366 | | | | 767,464 | |
Cboe Global Markets, Inc. | | | 1,980 | | | | 224,116 | |
The Charles Schwab Corp. | | | 28,220 | | | | 1,782,940 | |
CME Group, Inc. | | | 6,736 | | | | 1,378,859 | |
Discover Financial Services | | | 5,261 | | | | 497,585 | |
Franklin Resources, Inc. | | | 5,293 | | | | 123,380 | |
Intercontinental Exchange, Inc. | | | 10,480 | | | | 985,539 | |
Invesco Ltd. | | | 6,424 | | | | 103,619 | |
Mastercard, Inc. Class A | | | 16,067 | | | | 5,068,817 | |
The accompanying notes are an integral part of the financial statements.
45
MML Equity Index Fund – Portfolio of Investments (Continued) |
| | | Number of
Shares | | | Value | |
Nasdaq, Inc. | | | 2,145 | | | $ | 327,198 | |
Raymond James Financial, Inc. | | | 3,659 | | | | 327,151 | |
Synchrony Financial | | | 9,385 | | | | 259,214 | |
T. Rowe Price Group, Inc. | | | 4,272 | | | | 485,342 | |
Visa, Inc. Class A | | | 30,808 | | | | 6,065,787 | |
| | | | | | | | 22,094,651 | |
Insurance — 3.7% |
Aflac, Inc. | | | 11,057 | | | | 611,784 | |
The Allstate Corp. | | | 5,150 | | | | 652,659 | |
American International Group, Inc. | | | 14,861 | | | | 759,843 | |
Aon PLC Class A | | | 3,967 | | | | 1,069,821 | |
Arthur J Gallagher & Co. | | | 3,944 | | | | 643,030 | |
Assurant, Inc. | | | 1,015 | | | | 175,443 | |
Berkshire Hathaway, Inc. Class B (a) | | | 33,855 | | | | 9,243,092 | |
Brown & Brown, Inc. | | | 4,362 | | | | 254,479 | |
Chubb Ltd. | | | 7,931 | | | | 1,559,076 | |
Cincinnati Financial Corp. | | | 2,794 | | | | 332,430 | |
Everest Re Group Ltd. | | | 741 | | | | 207,687 | |
Globe Life, Inc. | | | 1,678 | | | | 163,555 | |
The Hartford Financial Services Group, Inc. | | | 6,127 | | | | 400,890 | |
Lincoln National Corp. | | | 2,987 | | | | 139,702 | |
Loews Corp. | | | 3,636 | | | | 215,469 | |
Marsh & McLennan Cos., Inc. | | | 9,381 | | | | 1,456,400 | |
MetLife, Inc. | | | 12,908 | | | | 810,493 | |
Principal Financial Group, Inc. | | | 4,369 | | | | 291,805 | |
The Progressive Corp. | | | 10,962 | | | | 1,274,552 | |
Prudential Financial, Inc. | | | 7,038 | | | | 673,396 | |
The Travelers Cos., Inc. | | | 4,497 | | | | 760,578 | |
W.R. Berkley Corp. | | | 3,901 | | | | 266,282 | |
Willis Towers Watson PLC | | | 2,094 | | | | 413,335 | |
| | | | | | | | 22,375,801 | |
Real Estate — 0.1% |
CBRE Group, Inc. Class A (a) | | | 6,101 | | | | 449,095 | |
Real Estate Investment Trusts (REITS) — 2.8% |
Alexandria Real Estate Equities, Inc. | | | 2,788 | | | | 404,344 | |
American Tower Corp. | | | 8,705 | | | | 2,224,911 | |
AvalonBay Communities, Inc. | | | 2,606 | | | | 506,215 | |
Boston Properties, Inc. | | | 2,648 | | | | 235,619 | |
Camden Property Trust | | | 1,981 | | | | 266,405 | |
Crown Castle International Corp. | | | 8,116 | | | | 1,366,572 | |
Digital Realty Trust, Inc. | | | 5,342 | | | | 693,552 | |
Duke Realty Corp. | | | 7,230 | | | | 397,288 | |
Equinix, Inc. | | | 1,701 | | | | 1,117,591 | |
Equity Residential | | | 6,374 | | | | 460,330 | |
Essex Property Trust, Inc. | | | 1,216 | | | | 317,996 | |
Extra Space Storage, Inc. | | | 2,498 | | | | 424,960 | |
Federal Realty OP LP | | | 1,315 | | | | 125,898 | |
| | | Number of
Shares | | | Value | |
Healthpeak Properties, Inc. | | | 10,044 | | | $ | 260,240 | |
Host Hotels & Resorts, Inc. | | | 13,294 | | | | 208,450 | |
Iron Mountain, Inc. | | | 5,394 | | | | 262,634 | |
Kimco Realty Corp. | | | 11,477 | | | | 226,900 | |
Mid-America Apartment Communities, Inc. | | | 2,152 | | | | 375,890 | |
Prologis, Inc. | | | 13,870 | | | | 1,631,805 | |
Public Storage | | | 2,864 | | | | 895,487 | |
Realty Income Corp. | | | 11,230 | | | | 766,560 | |
Regency Centers Corp. | | | 2,901 | | | | 172,058 | |
SBA Communications Corp. | | | 2,012 | | | | 643,941 | |
Simon Property Group, Inc. | | | 6,127 | | | | 581,575 | |
UDR, Inc. | | | 5,566 | | | | 256,259 | |
Ventas, Inc. | | | 7,442 | | | | 382,742 | |
VICI Properties, Inc. | | | 17,959 | | | | 534,999 | |
Vornado Realty Trust | | | 2,993 | | | | 85,570 | |
Welltower, Inc. | | | 8,480 | | | | 698,328 | |
Weyerhaeuser Co. | | | 13,937 | | | | 461,593 | |
| | | | | | | | 16,986,712 | |
| | | | | | | | 89,216,499 | |
Industrial — 7.7% |
Aerospace & Defense — 1.7% |
The Boeing Co. (a) | | | 10,405 | | | | 1,422,572 | |
General Dynamics Corp. | | | 4,322 | | | | 956,242 | |
Howmet Aerospace, Inc. | | | 7,060 | | | | 222,037 | |
L3 Harris Technologies, Inc. | | | 3,605 | | | | 871,328 | |
Lockheed Martin Corp. | | | 4,430 | | | | 1,904,723 | |
Northrop Grumman Corp. | | | 2,737 | | | | 1,309,846 | |
Raytheon Technologies Corp. | | | 27,833 | | | | 2,675,030 | |
Teledyne Technologies, Inc. (a) | | | 869 | | | | 325,971 | |
TransDigm Group, Inc. (a) | | | 967 | | | | 518,960 | |
| | | | | | | | 10,206,709 | |
Building Materials — 0.4% |
Carrier Global Corp. | | | 15,954 | | | | 568,920 | |
Fortune Brands Home & Security, Inc. | | | 2,418 | | | | 144,790 | |
Johnson Controls International PLC | | | 12,982 | | | | 621,578 | |
Martin Marietta Materials, Inc. | | | 1,164 | | | | 348,315 | |
Masco Corp. | | | 4,462 | | | | 225,777 | |
Mohawk Industries, Inc. (a) | | | 953 | | | | 118,258 | |
Vulcan Materials Co. | | | 2,476 | | | | 351,839 | |
| | | | | | | | 2,379,477 | |
Electrical Components & Equipment — 0.3% |
AMETEK, Inc. | | | 4,314 | | | | 474,065 | |
Emerson Electric Co. | | | 11,138 | | | | 885,917 | |
Generac Holdings, Inc. (a) | | | 1,202 | | | | 253,117 | |
| | | | | | | | 1,613,099 | |
Electronics — 1.0% |
Agilent Technologies, Inc. | | | 5,603 | | | | 665,468 | |
The accompanying notes are an integral part of the financial statements.
46
MML Equity Index Fund – Portfolio of Investments (Continued) |
| | | Number of
Shares | | | Value | |
Allegion PLC | | | 1,625 | | | $ | 159,087 | |
Amphenol Corp. Class A | | | 11,169 | | | | 719,060 | |
Fortive Corp. | | | 6,686 | | | | 363,585 | |
Garmin Ltd. | | | 2,875 | | | | 282,469 | |
Honeywell International, Inc. | | | 12,738 | | | | 2,213,992 | |
Keysight Technologies, Inc. (a) | | | 3,413 | | | | 470,482 | |
Mettler-Toledo International, Inc. (a) | | | 423 | | | | 485,930 | |
TE Connectivity Ltd. | | | 6,014 | | | | 680,484 | |
Trimble, Inc. (a) | | | 4,677 | | | | 272,342 | |
| | | | | | | | 6,312,899 | |
Engineering & Construction — 0.1% |
Jacobs Engineering Group, Inc. | | | 2,410 | | | | 306,383 | |
Environmental Controls — 0.3% |
Pentair PLC | | | 3,115 | | | | 142,574 | |
Republic Services, Inc. | | | 3,898 | | | | 510,131 | |
Waste Management, Inc. | | | 7,136 | | | | 1,091,665 | |
| | | | | | | | 1,744,370 | |
Hand & Machine Tools — 0.1% |
Snap-on, Inc. | | | 996 | | | | 196,242 | |
Stanley Black & Decker, Inc. | | | 2,843 | | | | 298,117 | |
| | | | | | | | 494,359 | |
Machinery – Construction & Mining — 0.3% |
Caterpillar, Inc. | | | 9,988 | | | | 1,785,455 | |
Machinery – Diversified — 0.7% |
Deere & Co. | | | 5,231 | | | | 1,566,528 | |
Dover Corp. | | | 2,683 | | | | 325,501 | |
IDEX Corp. | | | 1,415 | | | | 257,006 | |
Ingersoll Rand, Inc. | | | 7,600 | | | | 319,808 | |
Nordson Corp. | | | 1,009 | | | | 204,262 | |
Otis Worldwide Corp. | | | 7,928 | | | | 560,272 | |
Rockwell Automation, Inc. | | | 2,166 | | | | 431,705 | |
Westinghouse Air Brake Technologies Corp. | | | 3,397 | | | | 278,826 | |
Xylem, Inc. | | | 3,360 | | | | 262,685 | |
| | | | | | | | 4,206,593 | |
Miscellaneous - Manufacturing — 1.0% |
3M Co. | | | 10,649 | | | | 1,378,087 | |
A.O. Smith Corp. | | | 2,474 | | | | 135,278 | |
Eaton Corp. PLC | | | 7,481 | | | | 942,531 | |
General Electric Co. | | | 20,626 | | | | 1,313,257 | |
Illinois Tool Works, Inc. | | | 5,294 | | | | 964,832 | |
Parker-Hannifin Corp. | | | 2,395 | | | | 589,290 | |
Textron, Inc. | | | 3,995 | | | | 243,975 | |
Trane Technologies PLC | | | 4,355 | | | | 565,584 | |
| | | | | | | | 6,132,834 | |
| | | Number of
Shares | | | Value | |
Packaging & Containers — 0.2% |
Amcor PLC | | | 28,262 | | | $ | 351,297 | |
Ball Corp. | | | 5,957 | | | | 409,663 | |
Packaging Corp. of America | | | 1,769 | | | | 243,237 | |
Sealed Air Corp. | | | 2,749 | | | | 158,672 | |
WestRock Co. | | | 4,727 | | | | 188,324 | |
| | | | | | | | 1,351,193 | |
Shipbuilding — 0.0% |
Huntington Ingalls Industries, Inc. | | | 754 | | | | 164,236 | |
Transportation — 1.6% |
C.H. Robinson Worldwide, Inc. | | | 2,364 | | | | 239,639 | |
CSX Corp. | | | 40,754 | | | | 1,184,311 | |
Expeditors International of Washington, Inc. | | | 3,159 | | | | 307,876 | |
FedEx Corp. | | | 4,467 | | | | 1,012,714 | |
J.B. Hunt Transport Services, Inc. | | | 1,567 | | | | 246,756 | |
Norfolk Southern Corp. | | | 4,472 | | | | 1,016,441 | |
Old Dominion Freight Line, Inc. | | | 1,711 | | | | 438,495 | |
Union Pacific Corp. | | | 11,762 | | | | 2,508,599 | |
United Parcel Service, Inc. Class B | | | 13,756 | | | | 2,511,020 | |
| | | | | | | | 9,465,851 | |
| | | | | | | | 46,163,458 | |
Technology — 23.0% |
Computers — 8.1% |
Accenture PLC Class A | | | 11,861 | | | | 3,293,207 | |
Apple, Inc. | | | 287,769 | | | | 39,343,778 | |
Cognizant Technology Solutions Corp. Class A | | | 9,796 | | | | 661,132 | |
DXC Technology Co. (a) | | | 4,555 | | | | 138,062 | |
EPAM Systems, Inc. (a) | | | 1,076 | | | | 317,183 | |
Fortinet, Inc. (a) | | | 12,475 | | | | 705,836 | |
Hewlett Packard Enterprise Co. | | | 24,464 | | | | 324,393 | |
HP, Inc. | | | 19,740 | | | | 647,077 | |
International Business Machines Corp. | | | 16,834 | | | | 2,376,792 | |
Leidos Holdings, Inc. | | | 2,539 | | | | 255,703 | |
NetApp, Inc. | | | 4,143 | | | | 270,289 | |
Seagate Technology Holdings PLC | | | 3,675 | | | | 262,542 | |
Western Digital Corp. (a) | | | 5,834 | | | | 261,538 | |
| | | | | | | | 48,857,532 | |
Office & Business Equipment — 0.1% |
Zebra Technologies Corp. Class A (a) | | | 989 | | | | 290,716 | |
Semiconductors — 5.0% |
Advanced Micro Devices, Inc. (a) | | | 30,335 | | | | 2,319,717 | |
Analog Devices, Inc. | | | 9,800 | | | | 1,431,682 | |
Applied Materials, Inc. | | | 16,563 | | | | 1,506,902 | |
Broadcom, Inc. | | | 7,643 | | | | 3,713,046 | |
Intel Corp. | | | 76,573 | | | | 2,864,596 | |
KLA Corp. | | | 2,787 | | | | 889,276 | |
The accompanying notes are an integral part of the financial statements.
47
MML Equity Index Fund – Portfolio of Investments (Continued) |
| | | Number of
Shares | | | Value | |
Lam Research Corp. | | | 2,602 | | | $ | 1,108,842 | |
Microchip Technology, Inc. | | | 10,370 | | | | 602,290 | |
Micron Technology, Inc. | | | 20,884 | | | | 1,154,468 | |
Monolithic Power Systems, Inc. | | | 825 | | | | 316,833 | |
NVIDIA Corp. | | | 46,868 | | | | 7,104,720 | |
NXP Semiconductor NV | | | 4,903 | | | | 725,791 | |
ON Semiconductor Corp. (a) | | | 8,138 | | | | 409,423 | |
Qorvo, Inc. (a) | | | 2,014 | | | | 189,960 | |
QUALCOMM, Inc. | | | 20,947 | | | | 2,675,770 | |
Skyworks Solutions, Inc. | | | 2,992 | | | | 277,179 | |
Teradyne, Inc. | | | 2,978 | | | | 266,680 | |
Texas Instruments, Inc. | | | 17,270 | | | | 2,653,535 | |
| | | | | | | | 30,210,710 | |
Software — 9.8% |
Activision Blizzard, Inc. | | | 14,658 | | | | 1,141,272 | |
Adobe, Inc. (a) | | | 8,845 | | | | 3,237,801 | |
Akamai Technologies, Inc. (a) | | | 3,028 | | | | 276,547 | |
ANSYS, Inc. (a) | | | 1,627 | | | | 389,325 | |
Autodesk, Inc. (a) | | | 4,061 | | | | 698,330 | |
Broadridge Financial Solutions, Inc. | | | 2,177 | | | | 310,331 | |
Cadence Design Systems, Inc. (a) | | | 5,170 | | | | 775,655 | |
Ceridian HCM Holding, Inc. (a) | | | 2,569 | | | | 120,949 | |
Citrix Systems, Inc. | | | 2,318 | | | | 225,240 | |
Electronic Arts, Inc. | | | 5,246 | | | | 638,176 | |
Fidelity National Information Services, Inc. | | | 11,450 | | | | 1,049,622 | |
Fiserv, Inc. (a) | | | 10,904 | | | | 970,129 | |
Intuit, Inc. | | | 5,298 | | | | 2,042,061 | |
Jack Henry & Associates, Inc. | | | 1,355 | | | | 243,927 | |
Microsoft Corp. | | | 139,969 | | | | 35,948,238 | |
MSCI, Inc. | | | 1,516 | | | | 624,819 | |
Oracle Corp. | | | 29,488 | | | | 2,060,327 | |
Paychex, Inc. | | | 5,990 | | | | 682,081 | |
Paycom Software, Inc. (a) | | | 895 | | | | 250,707 | |
PTC, Inc. (a) | | | 1,955 | | | | 207,895 | |
Roper Technologies, Inc. | | | 1,987 | | | | 784,170 | |
Salesforce, Inc. (a) | | | 18,593 | | | | 3,068,589 | |
ServiceNow, Inc. (a) | | | 3,752 | | | | 1,784,151 | |
Synopsys, Inc. (a) | | | 2,862 | | | | 869,189 | |
Take-Two Interactive Software, Inc. (a) | | | 2,948 | | | | 361,218 | |
Tyler Technologies, Inc. (a) | | | 782 | | | | 259,999 | |
| | | | | | | | 59,020,748 | |
| | | | | | | | 138,379,706 | |
| | | Number of
Shares | | | Value | |
Utilities — 3.1% |
Electric — 2.9% |
AES Corp. | | | 12,413 | | | $ | 260,797 | |
Alliant Energy Corp. | | | 4,666 | | | | 273,474 | |
Ameren Corp. | | | 4,806 | | | | 434,270 | |
American Electric Power Co., Inc. | | | 9,591 | | | | 920,161 | |
CenterPoint Energy, Inc. | | | 11,723 | | | | 346,766 | |
CMS Energy Corp. | | | 5,406 | | | | 364,905 | |
Consolidated Edison, Inc. | | | 6,652 | | | | 632,605 | |
Constellation Energy Corp. | | | 6,087 | | | | 348,542 | |
Dominion Energy, Inc. | | | 15,208 | | | | 1,213,751 | |
DTE Energy Co. | | | 3,611 | | | | 457,694 | |
Duke Energy Corp. | | | 14,427 | | | | 1,546,719 | |
Edison International | | | 7,165 | | | | 453,115 | |
Entergy Corp. | | | 3,823 | | | | 430,623 | |
Evergy, Inc. | | | 4,269 | | | | 278,552 | |
Eversource Energy | | | 6,477 | | | | 547,112 | |
Exelon Corp. | | | 18,389 | | | | 833,389 | |
FirstEnergy Corp. | | | 10,630 | | | | 408,086 | |
NextEra Energy, Inc. | | | 36,743 | | | | 2,846,113 | |
NRG Energy, Inc. | | | 4,393 | | | | 167,681 | |
Pinnacle West Capital Corp. | | | 2,120 | | | | 155,014 | |
PPL Corp. | | | 13,702 | | | | 371,735 | |
Public Service Enterprise Group, Inc. | | | 9,313 | | | | 589,327 | |
Sempra Energy | | | 5,878 | | | | 883,287 | |
The Southern Co. | | | 19,913 | | | | 1,419,996 | |
WEC Energy Group, Inc. | | | 5,886 | | | | 592,367 | |
Xcel Energy, Inc. | | | 10,203 | | | | 721,964 | |
| | | | | | | | 17,498,045 | |
Gas — 0.1% |
Atmos Energy Corp. | | | 2,617 | | | | 293,366 | |
NiSource, Inc. | | | 7,657 | | | | 225,805 | |
| | | | | | | | 519,171 | |
Water — 0.1% |
American Water Works Co., Inc. | | | 3,386 | | | | 503,735 | |
| | | | | | | | 18,520,951 | |
| | | | | | | | | |
TOTAL COMMON STOCK (Cost $350,799,173) | | | | | | | 597,021,432 | |
| | | | | | | | | |
TOTAL EQUITIES (Cost $350,799,173) | | | | | | | 597,021,432 | |
| | | | | | | | | |
TOTAL LONG-TERM INVESTMENTS (Cost $350,799,173) | | | | | | | 597,021,432 | |
| | | | | | | | | |
The accompanying notes are an integral part of the financial statements.
48
MML Equity Index Fund – Portfolio of Investments (Continued) |
| | | Principal
Amount | | | Value | |
SHORT-TERM INVESTMENTS — 0.7% |
Repurchase Agreement — 0.6% |
Fixed Income Clearing Corp., Repurchase Agreement, dated 6/30/22, 0.240%, due 7/01/22 (c) | | $ | 3,572,534 | | | $ | 3,572,534 | |
U.S. Treasury Bill — 0.1% |
U.S. Treasury Bill | | | | | | | | |
1.859% 11/25/22 (d) | | | 860,000 | | | | 852,880 | |
| | | | | | | | | |
TOTAL SHORT-TERM INVESTMENTS (Cost $4,426,142) | | | | | | | 4,425,414 | |
| | | | | | | | | |
TOTAL INVESTMENTS — 99.9% (Cost $355,225,315) (e) | | | | | | | 601,446,846 | |
| | | | | | | | | |
Other Assets/(Liabilities) — 0.1% | | | | | | | 589,518 | |
| | | | | | | | | |
NET ASSETS — 100.0% | | | | | | $ | 602,036,364 | |
Notes to Portfolio of Investments
Percentages are stated as a percent of net assets.
(a) | Non-income producing security. |
(b) | Denotes all or a portion of security on loan. The total value of securities on loan as of June 30, 2022, was $133,689 or 0.02% of net assets. Total securities on loan may be less than the amounts identified in the Portfolio of Investments. The Fund received $136,836 of non-cash collateral (U.S. Treasury and/or Agency obligations) related to securities lending activity. This amount is not reflected on either the Portfolio of Investments or the Statement of Assets and Liabilities. (Note 2). |
(c) | Maturity value of $3,572,557. Collateralized by U.S. Government Agency obligations with a rate of 3.000%, maturity date of 6/30/24, and an aggregate market value, including accrued interest, of $3,644,009. |
(d) | The rate shown represents yield-to-maturity. |
(e) | See Note 6 for aggregate cost for federal tax purposes. |
Futures contracts
| | Expiration
Date | | | Number of
Contracts | | | Notional
Amount | | | Value/ Net
Unrealized
Appreciation/
(Depreciation) | |
Long | | | | | | | | | | | | | | | | |
S&P 500 E Mini Index | | | 9/16/22 | | | | 24 | | | $ | 4,670,462 | | | $ | (123,062 | ) |
The accompanying notes are an integral part of the financial statements.
49
MML Focused Equity Fund – Portfolio of Investments |
June 30, 2022 (Unaudited) |
| | | Number of
Shares | | | Value | |
Real Estate Investment Trusts (REITS) — 2.0% |
American Tower Corp. | | | 24,411 | | | $ | 6,239,207 | |
| | | | | | | | 60,125,232 | |
Industrial — 13.7% |
Aerospace & Defense — 6.0% |
Lockheed Martin Corp. | | | 7,387 | | | | 3,176,114 | |
Northrop Grumman Corp. | | | 32,808 | | | | 15,700,925 | |
| | | | | | | | 18,877,039 | |
Electronics — 4.7% |
Honeywell International, Inc. | | | 84,378 | | | | 14,665,740 | |
Transportation — 3.0% |
Union Pacific Corp. | | | 44,796 | | | | 9,554,091 | |
| | | | | | | | 43,096,870 | |
Technology — 6.1% |
Computers — 3.2% |
Accenture PLC Class A | | | 35,812 | | | | 9,943,202 | |
Software — 2.9% |
Microsoft Corp. | | | 36,028 | | | | 9,253,071 | |
| | | | | | | | 19,196,273 | |
| | | | | | | | | |
TOTAL COMMON STOCK (Cost $287,898,912) | | | | | | | 311,790,041 | |
| | | | | | | | | |
TOTAL EQUITIES (Cost $287,898,912) | | | | | | | 311,790,041 | |
| | | | | | | | | |
TOTAL LONG-TERM INVESTMENTS (Cost $287,898,912) | | | | | | | 311,790,041 | |
| | | Principal
Amount | | | | | |
SHORT-TERM INVESTMENTS — 1.0% |
Repurchase Agreement — 1.0% |
Fixed Income Clearing Corp., Repurchase Agreement, dated 6/30/22, 0.240%, due 7/01/22 (a) | | $ | 3,122,339 | | | | 3,122,339 | |
| | | | | | | | | |
TOTAL SHORT-TERM INVESTMENTS (Cost $3,122,339) | | | | | | | 3,122,339 | |
| | | | | | | | | |
TOTAL INVESTMENTS — 100.1% (Cost $291,021,251) (b) | | | | | | | 314,912,380 | |
| | | | | | | | | |
Other Assets/(Liabilities) — (0.1)% | | | | | | | (182,348 | ) |
| | | | | | | | | |
NET ASSETS — 100.0% | | | | | | $ | 314,730,032 | |
| | | Number of
Shares | | | Value | |
EQUITIES — 99.1% |
COMMON STOCK — 99.1% |
Basic Materials — 7.2% |
Chemicals — 7.2% |
Ecolab, Inc. | | | 81,012 | | | $ | 12,456,406 | |
Linde PLC | | | 34,925 | | | | 10,041,985 | |
| | | | | | | | 22,498,391 | |
Consumer, Cyclical — 13.4% |
Apparel — 4.2% |
NIKE, Inc. Class B | | | 130,349 | | | | 13,321,668 | |
Retail — 9.2% |
McDonald’s Corp. | | | 52,651 | | | | 12,998,479 | |
The TJX Cos., Inc. | | | 286,221 | | | | 15,985,442 | |
| | | | | | | | 28,983,921 | |
| | | | | | | | 42,305,589 | |
Consumer, Non-cyclical — 39.6% |
Beverages — 7.3% |
The Coca-Cola Co. | | | 114,440 | | | | 7,199,420 | |
PepsiCo, Inc. | | | 95,256 | | | | 15,875,365 | |
| | | | | | | | 23,074,785 | |
Cosmetics & Personal Care — 9.0% |
Colgate-Palmolive Co. | | | 189,921 | | | | 15,220,269 | |
The Procter & Gamble Co. | | | 90,282 | | | | 12,981,649 | |
| | | | | | | | 28,201,918 | |
Health Care – Products — 13.1% |
Baxter International, Inc. | | | 132,132 | | | | 8,486,838 | |
Danaher Corp. | | | 52,790 | | | | 13,383,321 | |
Medtronic PLC | | | 116,873 | | | | 10,489,352 | |
Stryker Corp. | | | 44,954 | | | | 8,942,699 | |
| | | | | | | | 41,302,210 | |
Health Care – Services — 5.6% |
UnitedHealth Group, Inc. | | | 34,006 | | | | 17,466,502 | |
Pharmaceuticals — 4.6% |
Johnson & Johnson | | | 81,811 | | | | 14,522,271 | |
| | | | | | | | 124,567,686 | |
Financial — 19.1% |
Diversified Financial Services — 7.8% |
American Express Co. | | | 68,310 | | | | 9,469,132 | |
Visa, Inc. Class A | | | 76,406 | | | | 15,043,578 | |
| | | | | | | | 24,512,710 | |
Insurance — 9.3% |
Chubb Ltd. | | | 73,129 | | | | 14,375,699 | |
Marsh & McLennan Cos., Inc. | | | 96,603 | | | | 14,997,616 | |
| | | | | | | | 29,373,315 | |
The accompanying notes are an integral part of the financial statements.
50
MML Focused Equity Fund – Portfolio of Investments (Continued) |
Notes to Portfolio of Investments
Percentages are stated as a percent of net assets.
(a) | Maturity value of $3,122,360. Collateralized by U.S. Government Agency obligations with a rate of 3.000%, maturity date of 6/30/24, and an aggregate market value, including accrued interest, of $3,184,812. |
(b) | See Note 6 for aggregate cost for federal tax purposes. |
Country weightings, as a percentage of net assets, is as follows:
United States | | | 84.8 | % |
Ireland | | | 9.7 | % |
Switzerland | | | 4.6 | % |
Total Long-Term Investments | | | 99.1 | % |
Short-Term Investments and Other Assets and Liabilities | | | 0.9 | % |
Net Assets | | | 100.0 | % |
The accompanying notes are an integral part of the financial statements.
51
MML Foreign Fund – Portfolio of Investments |
June 30, 2022 (Unaudited) |
| | | Number of
Shares | | | Value | |
EQUITIES — 99.8% |
COMMON STOCK — 99.8% |
Australia — 3.7% |
BHP Group Ltd. Sponsored ADR (a) | | | 10,700 | | | $ | 601,126 | |
BHP Group Ltd. | | | 22,900 | | | | 659,581 | |
Lendlease Corp Ltd. | | | 165,200 | | | | 1,039,422 | |
Macquarie Group Ltd. | | | 16,700 | | | | 1,898,014 | |
Santos Ltd. | | | 417,300 | | | | 2,127,372 | |
Woodside Energy Group Ltd. | | | 20,204 | | | | 442,448 | |
| | | | | | | | 6,767,963 | |
Austria — 0.2% |
ams-OSRAM AG (b) | | | 44,600 | | | | 402,312 | |
Belgium — 2.9% |
Anheuser-Busch InBev SA | | | 49,700 | | | | 2,680,943 | |
Groupe Bruxelles Lambert SA | | | 14,900 | | | | 1,244,762 | |
KBC Group NV | | | 23,000 | | | | 1,292,009 | |
| | | | | | | | 5,217,714 | |
Canada — 0.5% |
TFI International, Inc. | | | 12,200 | | | | 979,355 | |
Cayman Islands — 3.1% |
CK Asset Holdings Ltd. | | | 346,000 | | | | 2,450,822 | |
CK Hutchison Holdings Ltd. | | | 481,600 | | | | 3,275,263 | |
| | | | | | | | 5,726,085 | |
Finland — 0.6% |
Nokia OYJ | | | 245,100 | | | | 1,141,720 | |
France — 10.4% |
Amundi SA (a) (c) | | | 21,400 | | | | 1,184,618 | |
Capgemini SE | | | 11,000 | | | | 1,902,220 | |
Cie de Saint-Gobain | | | 20,000 | | | | 868,769 | |
Dassault Aviation SA | | | 6,200 | | | | 967,875 | |
Engie SA | | | 295,200 | | | | 3,426,214 | |
Rexel SA | | | 38,100 | | | | 586,651 | |
Sanofi | | | 34,100 | | | | 3,448,386 | |
TotalEnergies SE | | | 52,200 | | | | 2,751,565 | |
Ubisoft Entertainment SA (b) | | | 23,900 | | | | 1,055,700 | |
Veolia Environnement SA | | | 113,512 | | | | 2,808,276 | |
| | | | | | | | 19,000,274 | |
Germany — 11.3% |
Allianz SE Registered | | | 6,900 | | | | 1,317,169 | |
BASF SE | | | 47,300 | | | | 2,058,313 | |
Bayer AG Registered | | | 10,700 | | | | 635,725 | |
Deutsche Boerse AG | | | 13,300 | | | | 2,224,483 | |
Deutsche Post AG Registered | | | 48,900 | | | | 1,832,055 | |
Fresenius SE & Co. KGaA | | | 71,000 | | | | 2,151,316 | |
HeidelbergCement AG | | | 43,100 | | | | 2,070,439 | |
Infineon Technologies AG | | | 65,900 | | | | 1,594,467 | |
SAP SE | | | 26,000 | | | | 2,368,669 | |
| | | Number of
Shares | | | Value | |
Siemens AG Registered | | | 22,700 | | | $ | 2,310,352 | |
Siemens Energy AG (b) | | | 87,700 | | | | 1,286,147 | |
Talanx AG (b) | | | 20,700 | | | | 787,656 | |
| | | | | | | | 20,636,791 | |
Ireland — 4.1% |
AIB Group PLC | | | 572,500 | | | | 1,305,720 | |
DCC PLC | | | 31,000 | | | | 1,937,031 | |
Linde PLC | | | 6,700 | | | | 1,926,451 | |
Smurfit Kappa Group PLC | | | 65,900 | | | | 2,223,769 | |
| | | | | | | | 7,392,971 | |
Israel — 1.1% |
Check Point Software Technologies Ltd. (b) | | | 15,800 | | | | 1,924,124 | |
Italy — 0.2% |
Prysmian SpA | | | 16,100 | | | | 444,312 | |
Japan — 21.4% |
Astellas Pharma, Inc. | | | 161,600 | | | | 2,517,833 | |
Denka Co. Ltd. | | | 38,500 | | | | 932,806 | |
FANUC Corp. | | | 12,200 | | | | 1,912,263 | |
Fujitsu Ltd. | | | 12,300 | | | | 1,539,617 | |
Hitachi Ltd. | | | 50,400 | | | | 2,388,014 | |
Kirin Holdings Co. Ltd. | | | 93,300 | | | | 1,470,430 | |
Kyocera Corp. | | | 40,000 | | | | 2,141,057 | |
Nintendo Co. Ltd. | | | 6,600 | | | | 2,852,470 | |
Olympus Corp. | | | 78,300 | | | | 1,574,673 | |
ORIX Corp. | | | 134,200 | | | | 2,252,839 | |
Rakuten Group, Inc. | | | 269,600 | | | | 1,217,332 | |
SBI Holdings, Inc. | | | 79,200 | | | | 1,551,029 | |
Sega Sammy Holdings, Inc. | | | 52,800 | | | | 848,110 | |
Seven & i Holdings Co. Ltd. | | | 81,900 | | | | 3,174,813 | |
Sony Group Corp. | | | 56,100 | | | | 4,584,706 | |
Square Enix Holdings Co. Ltd. | | | 27,000 | | | | 1,196,741 | |
Sumitomo Mitsui Financial Group, Inc. | | | 78,100 | | | | 2,319,492 | |
Toshiba Corp. | | | 40,500 | | | | 1,647,201 | |
Toyota Industries Corp. | | | 45,500 | | | | 2,820,322 | |
| | | | | | | | 38,941,748 | |
Luxembourg — 0.8% |
ArcelorMittal SA | | | 60,200 | | | | 1,366,933 | |
Netherlands — 5.7% |
AerCap Holdings NV (b) | | | 35,400 | | | | 1,449,276 | |
ASML Holding NV | | | 4,000 | | | | 1,930,512 | |
CNH Industrial NV | | | 134,000 | | | | 1,555,255 | |
EXOR NV | | | 10,400 | | | | 652,728 | |
Heineken Holding NV | | | 35,400 | | | | 2,589,283 | |
Koninklijke Philips NV | | | 35,779 | | | | 776,313 | |
NXP Semiconductor NV | | | 10,300 | | | | 1,524,709 | |
| | | | | | | | 10,478,076 | |
The accompanying notes are an integral part of the financial statements.
52
MML Foreign Fund – Portfolio of Investments (Continued) |
| | | Number of
Shares | | | Value | |
Norway — 0.8% |
Mowi ASA | | | 63,900 | | | $ | 1,457,859 | |
Republic of Korea — 1.7% |
Samsung Electronics Co. Ltd. | | | 70,700 | | | | 3,096,989 | |
Singapore — 1.4% |
DBS Group Holdings, Ltd. | | | 116,200 | | | | 2,487,191 | |
Sweden — 3.0% |
Essity AB Class B | | | 49,700 | | | | 1,297,607 | |
Husqvarna AB Class B | | | 44,900 | | | | 330,420 | |
Investor AB Class B | | | 77,000 | | | | 1,267,256 | |
Lundin Energy MergerCo AB (a) (d) (e) | | | 29,100 | | | | 1,186,973 | |
Volvo AB Class B | | | 84,298 | | | | 1,306,673 | |
| | | | | | | | 5,388,929 | |
Switzerland — 9.8% |
ABB Ltd. Registered | | | 84,000 | | | | 2,244,988 | |
Alcon, Inc. | | | 8,300 | | | | 579,791 | |
Cie Financiere Richemont SA Registered | | | 17,800 | | | | 1,895,630 | |
Nestle SA Registered | | | 26,200 | | | | 3,073,815 | |
Novartis AG Registered | | | 39,700 | | | | 3,358,298 | |
Roche Holding AG | | | 9,800 | | | | 3,271,511 | |
UBS Group AG Registered | | | 216,400 | | | | 3,493,160 | |
| | | | | | | | 17,917,193 | |
United Kingdom — 17.1% |
Ashtead Group PLC | | | 31,800 | | | | 1,334,026 | |
Aviva PLC | | | 210,976 | | | | 1,030,718 | |
Barratt Developments PLC | | | 135,100 | | | | 753,067 | |
BP PLC | | | 394,800 | | | | 1,859,464 | |
The British Land Co. PLC | | | 95,883 | | | | 522,324 | |
Bunzl PLC | | | 39,900 | | | | 1,321,321 | |
Burberry Group PLC | | | 24,300 | | | | 486,124 | |
Entain PLC (b) | | | 40,700 | | | | 617,589 | |
Glencore PLC | | | 295,400 | | | | 1,600,734 | |
GSK PLC | | | 97,000 | | | | 2,085,734 | |
Imperial Brands PLC | | | 32,700 | | | | 730,877 | |
Inchcape PLC | | | 101,900 | | | | 863,717 | |
Informa PLC (b) | | | 215,300 | | | | 1,387,500 | |
Kingfisher PLC | | | 179,400 | | | | 533,560 | |
Liberty Global PLC Class C (b) | | | 35,500 | | | | 784,195 | |
Lloyds Banking Group PLC | | | 4,554,600 | | | | 2,349,321 | |
Melrose Industries PLC | | | 858,290 | | | | 1,567,194 | |
Persimmon PLC | | | 61,100 | | | | 1,386,963 | |
Reckitt Benckiser Group PLC | | | 34,900 | | | | 2,621,375 | |
Smith & Nephew PLC | | | 144,800 | | | | 2,024,466 | |
Tesco PLC | | | 710,805 | | | | 2,210,851 | |
Unilever PLC | | | 68,000 | | | | 3,094,963 | |
| | | | | | | | 31,166,083 | |
| | | Number of
Shares | | | Value | |
| | | | | | | | | |
TOTAL COMMON STOCK (Cost $201,344,733) | | | | | | $ | 181,934,622 | |
| | | | | | | | | |
TOTAL EQUITIES (Cost $201,344,733) | | | | | | | 181,934,622 | |
| | | | | | | | | |
MUTUAL FUNDS — 0.0% |
United States — 0.0% |
State Street Navigator Securities Lending Government Money Market Portfolio (f) | | | 21,389 | | | | 21,389 | |
| | | | | | | | | |
TOTAL MUTUAL FUNDS (Cost $21,389) | | | | | | | 21,389 | |
| | | | | | | | | |
TOTAL LONG-TERM INVESTMENTS (Cost $201,366,122) | | | | | | | 181,956,011 | |
| | | Principal
Amount | | | | | |
SHORT-TERM INVESTMENTS — 0.2% |
Repurchase Agreement — 0.2% |
Fixed Income Clearing Corp., Repurchase Agreement, dated 6/30/22, 0.240%, due 7/01/22 (g) | | $ | 442,616 | | | | 442,616 | |
| | | | | | | | | |
TOTAL SHORT-TERM INVESTMENTS (Cost $442,616) | | | | | | | 442,616 | |
| | | | | | | | | |
TOTAL INVESTMENTS — 100.0% (Cost $201,808,738) (h) | | | | | | | 182,398,627 | |
| | | | | | | | | |
Other Assets/(Liabilities) — (0.0)% | | | | | | | (31,334 | ) |
| | | | | | | | | |
NET ASSETS — 100.0% | | | | | | $ | 182,367,293 | |
Abbreviation Legend
ADR | American Depositary Receipt |
The accompanying notes are an integral part of the financial statements.
53
MML Foreign Fund – Portfolio of Investments (Continued) |
Notes to Portfolio of Investments
Percentages are stated as a percent of net assets.
(a) | Denotes all or a portion of security on loan. The total value of securities on loan as of June 30, 2022, was $799,911 or 0.44% of net assets. Total securities on loan may be less than the amounts identified in the Portfolio of Investments. The Fund received $812,392 of non-cash collateral (U.S. Treasury and/or Agency obligations) related to securities lending activity. This amount is not reflected on either the Portfolio of Investments or the Statement of Assets and Liabilities. (Note 2). |
(b) | Non-income producing security. |
(c) | Security is exempt from registration under Regulation S or Rule 144A of the Securities Act of 1933. These securities are considered restricted and may be resold in transactions exempt from registration. At June 30, 2022, the aggregate market value of these securities amounted to $1,184,618 or 0.65% of net assets. |
(d) | This security is fair valued in good faith in accordance with procedures approved by the Board of Trustees. At June 30, 2022, these securities amounted to a value of $1,186,973 or 0.65% of net assets. |
(e) | Investment was valued using significant unobservable inputs. |
(f) | Represents investment of security lending cash collateral. (Note 2). |
(g) | Maturity value of $442,619. Collateralized by U.S. Government Agency obligations with a rate of 3.000%, maturity date of 6/30/24, and an aggregate market value, including accrued interest, of $451,506. |
(h) | See Note 6 for aggregate cost for federal tax purposes. |
Sector weightings, as a percentage of net assets, is as follows:
Consumer, Non-cyclical | | | 26.4 | % |
Financial | | | 19.7 | % |
Industrial | | | 13.2 | % |
Consumer, Cyclical | | | 11.0 | % |
Technology | | | 10.6 | % |
Basic Materials | | | 6.2 | % |
Energy | | | 5.0 | % |
Utilities | | | 3.4 | % |
Communications | | | 2.5 | % |
Diversified | | | 1.8 | % |
Mutual Funds | | | 0.0 | % |
Total Long-Term Investments | | | 99.8 | % |
Short-Term Investments and Other Assets and Liabilities | | | 0.2 | % |
Net Assets | | | 100.0 | % |
The accompanying notes are an integral part of the financial statements.
54
MML Fundamental Equity Fund – Portfolio of Investments |
June 30, 2022 (Unaudited) |
| | | Number of
Shares | | | Value | |
EQUITIES — 99.7% |
COMMON STOCK — 99.7% |
Basic Materials — 0.8% |
Chemicals — 0.8% |
Valvoline, Inc. | | | 50,877 | | | $ | 1,466,784 | |
Communications — 12.2% |
Internet — 7.0% |
Airbnb, Inc. Class A (a) | | | 20,551 | | | | 1,830,683 | |
Alphabet, Inc. Class A (a) | | | 2,503 | | | | 5,454,688 | |
Amazon.com, Inc. (a) | | | 51,474 | | | | 5,467,054 | |
| | | | | | | | 12,752,425 | |
Media — 1.1% |
Comcast Corp. Class A | | | 49,658 | | | | 1,948,580 | |
Telecommunications — 4.1% |
Motorola Solutions, Inc. | | | 8,726 | | | | 1,828,969 | |
Verizon Communications, Inc. | | | 110,385 | | | | 5,602,039 | |
| | | | | | | | 7,431,008 | |
| | | | | | | | 22,132,013 | |
Consumer, Cyclical — 4.3% |
Auto Manufacturers — 1.6% |
General Motors Co. (a) | | | 52,154 | | | | 1,656,411 | |
Tesla, Inc. (a) | | | 1,934 | | | | 1,302,394 | |
| | | | | | | | 2,958,805 | |
Home Builders — 0.8% |
D.R. Horton, Inc. | | | 21,365 | | | | 1,414,150 | |
Retail — 1.9% |
O’Reilly Automotive, Inc. (a) | | | 4,277 | | | | 2,702,037 | |
Target Corp. | | | 5,029 | | | | 710,246 | |
| | | | | | | | 3,412,283 | |
| | | | | | | | 7,785,238 | |
Consumer, Non-cyclical — 24.6% |
Beverages — 2.5% |
The Coca-Cola Co. | | | 51,981 | | | | 3,270,125 | |
Constellation Brands, Inc. Class A | | | 5,669 | | | | 1,321,217 | |
| | | | | | | | 4,591,342 | |
Biotechnology — 1.0% |
Seagen, Inc. (a) | | | 10,053 | | | | 1,778,778 | |
Commercial Services — 0.1% |
TransUnion | | | 2,533 | | | | 202,615 | |
Cosmetics & Personal Care — 3.0% |
Coty, Inc. Class A (a) | | | 46,450 | | | | 372,064 | |
The Procter & Gamble Co. | | | 35,433 | | | | 5,094,911 | |
| | | | | | | | 5,466,975 | |
| | | Number of
Shares | | | Value | |
Food — 2.1% |
Mondelez International, Inc. Class A | | | 28,954 | | | $ | 1,797,754 | |
Sysco Corp. | | | 22,625 | | | | 1,916,564 | |
| | | | | | | | 3,714,318 | |
Health Care – Products — 1.2% |
Avantor, Inc. (a) | | | 18,720 | | | | 582,192 | |
The Cooper Cos., Inc. | | | 5,061 | | | | 1,584,700 | |
| | | | | | | | 2,166,892 | |
Health Care – Services — 5.1% |
HCA Healthcare, Inc. | | | 13,644 | | | | 2,293,011 | |
Tenet Healthcare Corp. (a) | | | 19,011 | | | | 999,218 | |
UnitedHealth Group, Inc. | | | 11,532 | | | | 5,923,181 | |
| | | | | | | | 9,215,410 | |
Pharmaceuticals — 9.6% |
AstraZeneca PLC Sponsored ADR | | | 53,014 | | | | 3,502,635 | |
Bayer AG Registered | | | 24,556 | | | | 1,458,958 | |
CVS Health Corp. | | | 38,785 | | | | 3,593,818 | |
Eli Lilly & Co. | | | 17,674 | | | | 5,730,441 | |
Johnson & Johnson | | | 17,632 | | | | 3,129,856 | |
| | | | | | | | 17,415,708 | |
| | | | | | | | 44,552,038 | |
Energy — 4.5% |
Oil & Gas — 3.1% |
APA Corp. | | | 41,155 | | | | 1,436,310 | |
Exxon Mobil Corp. | | | 48,150 | | | | 4,123,566 | |
| | | | | | | | 5,559,876 | |
Pipelines — 1.4% |
Cheniere Energy, Inc. | | | 11,731 | | | | 1,560,575 | |
Magellan Midstream Partners LP (b) | | | 21,266 | | | | 1,015,664 | |
| | | | | | | | 2,576,239 | |
| | | | | | | | 8,136,115 | |
Financial — 12.8% |
Banks — 3.2% |
First Citizens BancShares, Inc. Class A | | | 2,834 | | | | 1,852,812 | |
JP Morgan Chase & Co. | | | 32,257 | | | | 3,632,461 | |
SVB Financial Group (a) | | | 693 | | | | 273,728 | |
| | | | | | | | 5,759,001 | |
Diversified Financial Services — 3.5% |
American Express Co. | | | 19,960 | | | | 2,766,855 | |
The Charles Schwab Corp. | | | 14,752 | | | | 932,031 | |
Intercontinental Exchange, Inc. | | | 19,890 | | | | 1,870,456 | |
Rocket Cos., Inc. Class A | | | 102,916 | | | | 757,462 | |
| | | | | | | | 6,326,804 | |
Insurance — 3.3% |
The Allstate Corp. | | | 21,668 | | | | 2,745,986 | |
The accompanying notes are an integral part of the financial statements.
55
MML Fundamental Equity Fund – Portfolio of Investments (Continued) |
| | | Number of
Shares | | | Value | |
Equitable Holdings, Inc. | | | 125,976 | | | $ | 3,284,194 | |
| | | | | | | | 6,030,180 | |
Real Estate Investment Trusts (REITS) — 2.8% |
Duke Realty Corp. | | | 4,303 | | | | 236,450 | |
Prologis, Inc. | | | 41,484 | | | | 4,880,593 | |
| | | | | | | | 5,117,043 | |
| | | | | | | | 23,233,028 | |
Industrial — 12.1% |
Aerospace & Defense — 2.3% |
Raytheon Technologies Corp. | | | 43,520 | | | | 4,182,707 | |
Building Materials — 1.2% |
Vulcan Materials Co. | | | 15,207 | | | | 2,160,915 | |
Electronics — 0.7% |
Honeywell International, Inc. | | | 7,519 | | | | 1,306,877 | |
Environmental Controls — 0.7% |
Waste Connections, Inc. | | | 10,381 | | | | 1,286,829 | |
Machinery – Diversified — 2.9% |
Deere & Co. | | | 7,843 | | | | 2,348,743 | |
Otis Worldwide Corp. | | | 40,519 | | | | 2,863,478 | |
| | | | | | | | 5,212,221 | |
Transportation — 4.3% |
FedEx Corp. | | | 3,892 | | | | 882,355 | |
Union Pacific Corp. | | | 9,271 | | | | 1,977,319 | |
United Parcel Service, Inc. Class B | | | 26,785 | | | | 4,889,334 | |
| | | | | | | | 7,749,008 | |
| | | | | | | | 21,898,557 | |
Technology — 26.0% |
Computers — 7.2% |
Accenture PLC Class A | | | 7,652 | | | | 2,124,578 | |
Amdocs Ltd. | | | 11,046 | | | | 920,242 | |
Apple, Inc. | | | 67,781 | | | | 9,267,018 | |
Crowdstrike Holdings, Inc. Class A (a) | | | 3,433 | | | | 578,667 | |
| | | | | | | | 12,890,505 | |
Semiconductors — 3.7% |
Advanced Micro Devices, Inc. (a) | | | 25,068 | | | | 1,916,950 | |
Applied Materials, Inc. | | | 22,071 | | | | 2,008,019 | |
QUALCOMM, Inc. | | | 21,962 | | | | 2,805,426 | |
| | | | | | | | 6,730,395 | |
Software — 15.1% |
Electronic Arts, Inc. | | | 16,101 | | | | 1,958,687 | |
Fiserv, Inc. (a) | | | 25,005 | | | | 2,224,695 | |
Manhattan Associates, Inc. (a) | | | 4,728 | | | | 541,829 | |
Microsoft Corp. | | | 50,293 | | | | 12,916,751 | |
Salesforce, Inc. (a) | | | 12,634 | | | | 2,085,115 | |
ServiceNow, Inc. (a) | | | 3,448 | | | | 1,639,593 | |
| | | Number of
Shares | | | Value | |
Synopsys, Inc. (a) | | | 4,315 | | | $ | 1,310,465 | |
VMware, Inc. Class A | | | 41,122 | | | | 4,687,086 | |
| | | | | | | | 27,364,221 | |
| | | | | | | | 46,985,121 | |
Utilities — 2.4% |
Electric — 2.4% |
FirstEnergy Corp. | | | 98,181 | | | | 3,769,168 | |
The Southern Co. | | | 7,722 | | | | 550,656 | |
| | | | | | | | 4,319,824 | |
| | | | | | | | | |
TOTAL COMMON STOCK (Cost $183,182,645) | | | | | | | 180,508,718 | |
| | | | | | | | | |
TOTAL EQUITIES (Cost $183,182,645) | | | | | | | 180,508,718 | |
| | | | | | | | | |
TOTAL LONG-TERM INVESTMENTS (Cost $183,182,645) | | | | | | | 180,508,718 | |
| | | Principal
Amount | | | | | |
SHORT-TERM INVESTMENTS — 0.5% |
Repurchase Agreement — 0.5% |
Fixed Income Clearing Corp., Repurchase Agreement, dated 6/30/22, 0.240%, due 7/01/22 (c) | | $ | 816,582 | | | | 816,582 | |
| | | | | | | | | |
TOTAL SHORT-TERM INVESTMENTS (Cost $816,582) | | | | | | | 816,582 | |
| | | | | | | | | |
TOTAL INVESTMENTS — 100.2% (Cost $183,999,227) (d) | | | | | | | 181,325,300 | |
| | | | | | | | | |
Other Assets/(Liabilities) — (0.2)% | | | | | | | (307,303 | ) |
| | | | | | | | | |
NET ASSETS — 100.0% | | | | | | $ | 181,017,997 | |
Abbreviation Legend
ADR | American Depositary Receipt |
Notes to Portfolio of Investments
Percentages are stated as a percent of net assets.
(a) | Non-income producing security. |
(b) | Security is a Master Limited Partnership. |
(c) | Maturity value of $816,587. Collateralized by U.S. Government Agency obligations with a rate of 3.000%, maturity date of 6/30/24, and an aggregate market value, including accrued interest, of $832,988. |
(d) | See Note 6 for aggregate cost for federal tax purposes. |
The accompanying notes are an integral part of the financial statements.
56
MML Fundamental Value Fund – Portfolio of Investments |
June 30, 2022 (Unaudited) |
| | | Number of
Shares | | | Value | |
EQUITIES — 97.7% |
COMMON STOCK — 97.7% |
Basic Materials — 2.6% |
Chemicals — 2.6% |
Axalta Coating Systems Ltd. (a) | | | 52,439 | | | $ | 1,159,426 | |
DuPont de Nemours, Inc. | | | 42,632 | | | | 2,369,487 | |
Olin Corp. | | | 17,455 | | | | 807,817 | |
| | | | | | | | 4,336,730 | |
| | | | | | | | 4,336,730 | |
Communications — 7.3% |
Internet — 3.8% |
Alphabet, Inc. Class A (a) | | | 1,962 | | | | 4,275,708 | |
Meta Platforms, Inc. Class A (a) | | | 12,798 | | | | 2,063,678 | |
| | | | | | | | 6,339,386 | |
Telecommunications — 3.5% |
Cisco Systems, Inc. | | | 73,460 | | | | 3,132,334 | |
T-Mobile US, Inc. (a) | | | 20,289 | | | | 2,729,682 | |
| | | | | | | | 5,862,016 | |
| | | | | | | | 12,201,402 | |
Consumer, Cyclical — 5.1% |
Distribution & Wholesale — 0.7% |
LKQ Corp. | | | 25,095 | | | | 1,231,914 | |
Home Furnishing — 0.6% |
Sony Group Corp. Sponsored ADR | | | 11,203 | | | | 916,069 | |
Retail — 3.8% |
AutoZone, Inc. (a) | | | 2,225 | | | | 4,781,792 | |
Restaurant Brands International, Inc. | | | 11,856 | | | | 594,579 | |
The TJX Cos., Inc. | | | 16,585 | | | | 926,272 | |
| | | | | | | | 6,302,643 | |
| | | | | | | | 8,450,626 | |
Consumer, Non-cyclical — 31.8% |
Beverages — 2.9% |
Coca-Cola Europacific Partners PLC | | | 32,975 | | | | 1,701,840 | |
Keurig Dr Pepper, Inc. | | | 87,374 | | | | 3,092,166 | |
| | | | | | | | 4,794,006 | |
Commercial Services — 2.7% |
FleetCor Technologies, Inc. (a) | | | 7,002 | | | | 1,471,190 | |
Global Payments, Inc. | | | 13,441 | | | | 1,487,112 | |
United Rentals, Inc. (a) | | | 5,982 | | | | 1,453,088 | |
| | | | | | | | 4,411,390 | |
Cosmetics & Personal Care — 2.3% |
The Procter & Gamble Co. | | | 26,963 | | | | 3,877,010 | |
Food — 0.7% |
US Foods Holding Corp. (a) | | | 40,264 | | | | 1,235,299 | |
Health Care – Products — 1.1% |
Avantor, Inc. (a) | | | 61,238 | | | | 1,904,502 | |
| | | Number of
Shares | | | Value | |
Health Care – Services — 5.7% |
Centene Corp. (a) | | | 37,983 | | | $ | 3,213,742 | |
ICON PLC (a) | | | 8,188 | | | | 1,774,339 | |
UnitedHealth Group, Inc. | | | 8,656 | | | | 4,445,981 | |
| | | | | | | | 9,434,062 | |
Pharmaceuticals — 16.4% |
AbbVie, Inc. | | | 19,859 | | | | 3,041,604 | |
AmerisourceBergen Corp. | | | 10,965 | | | | 1,551,328 | |
Bristol-Myers Squibb Co. | | | 32,035 | | | | 2,466,695 | |
Cigna Corp. | | | 15,047 | | | | 3,965,185 | |
CVS Health Corp. | | | 32,567 | | | | 3,017,658 | |
Johnson & Johnson | | | 39,476 | | | | 7,007,385 | |
McKesson Corp. | | | 3,307 | | | | 1,078,777 | |
Novartis AG Sponsored ADR | | | 19,683 | | | | 1,663,804 | |
Sanofi ADR | | | 69,255 | | | | 3,464,828 | |
| | | | | | | | 27,257,264 | |
| | | | | | | | 52,913,533 | |
Energy — 11.7% |
Oil & Gas — 10.5% |
Canadian Natural Resources Ltd. | | | 43,322 | | | | 2,325,525 | |
Cenovus Energy, Inc. | | | 84,096 | | | | 1,598,665 | |
ConocoPhillips | | | 55,662 | | | | 4,999,004 | |
Devon Energy Corp. | | | 28,403 | | | | 1,565,289 | |
EOG Resources, Inc. | | | 12,195 | | | | 1,346,816 | |
Marathon Petroleum Corp. | | | 33,111 | | | | 2,722,055 | |
Pioneer Natural Resources Co. | | | 13,035 | | | | 2,907,848 | |
| | | | | | | | 17,465,202 | |
Oil & Gas Services — 1.2% |
Schlumberger NV | | | 55,239 | | | | 1,975,347 | |
| | | | | | | | 19,440,549 | |
Financial — 14.8% |
Banks — 7.9% |
Bank of America Corp. | | | 69,036 | | | | 2,149,091 | |
The Goldman Sachs Group, Inc. | | | 6,365 | | | | 1,890,533 | |
JP Morgan Chase & Co. | | | 37,220 | | | | 4,191,344 | |
Truist Financial Corp. | | | 34,496 | | | | 1,636,145 | |
Wells Fargo & Co. | | | 83,624 | | | | 3,275,552 | |
| | | | | | | | 13,142,665 | |
Diversified Financial Services — 1.9% |
Capital One Financial Corp. | | | 9,212 | | | | 959,798 | |
The Charles Schwab Corp. | | | 34,712 | | | | 2,193,104 | |
| | | | | | | | 3,152,902 | |
Insurance — 5.0% |
Berkshire Hathaway, Inc. Class B (a) | | | 18,053 | | | | 4,928,830 | |
Chubb Ltd. | | | 10,047 | | | | 1,975,039 | |
The accompanying notes are an integral part of the financial statements.
57
MML Fundamental Value Fund – Portfolio of Investments (Continued) |
| | | Number of
Shares | | | Value | |
Everest Re Group Ltd. | | | 5,041 | | | $ | 1,412,892 | |
| | | | | | | | 8,316,761 | |
| | | | | | | | 24,612,328 | |
Industrial — 11.0% |
Aerospace & Defense — 2.4% |
General Dynamics Corp. | | | 9,410 | | | | 2,081,962 | |
Howmet Aerospace, Inc. | | | 58,593 | | | | 1,842,750 | |
| | | | | | | | 3,924,712 | |
Building Materials — 1.5% |
CRH PLC Sponsored ADR (b) | | | 34,686 | | | | 1,207,767 | |
Mohawk Industries, Inc. (a) | | | 10,901 | | | | 1,352,705 | |
| | | | | | | | 2,560,472 | |
Electronics — 0.8% |
Allegion PLC | | | 7,614 | | | | 745,410 | |
Fortive Corp. | | | 10,999 | | | | 598,126 | |
| | | | | | | | 1,343,536 | |
Machinery – Construction & Mining — 0.7% |
Caterpillar, Inc. | | | 6,929 | | | | 1,238,628 | |
Machinery – Diversified — 3.6% |
Deere & Co. | | | 6,980 | | | | 2,090,301 | |
Dover Corp. | | | 6,456 | | | | 783,242 | |
The Middleby Corp. (a) | | | 4,312 | | | | 540,552 | |
Otis Worldwide Corp. | | | 22,720 | | | | 1,605,622 | |
Westinghouse Air Brake Technologies Corp. | | | 11,444 | | | | 939,324 | |
| | | | | | | | 5,959,041 | |
Miscellaneous - Manufacturing — 1.1% |
Eaton Corp. PLC | | | 14,833 | | | | 1,868,810 | |
Transportation — 0.9% |
Union Pacific Corp. | | | 7,045 | | | | 1,502,557 | |
| | | | | | | | 18,397,756 | |
Technology — 11.2% |
Computers — 1.7% |
Cognizant Technology Solutions Corp. Class A | | | 20,362 | | | | 1,374,232 | |
Leidos Holdings, Inc. | | | 14,637 | | | | 1,474,092 | |
| | | | | | | | 2,848,324 | |
Semiconductors — 6.4% |
Applied Materials, Inc. | | | 15,329 | | | | 1,394,632 | |
KLA Corp. | | | 2,983 | | | | 951,816 | |
Lam Research Corp. | | | 1,749 | | | | 745,336 | |
Microchip Technology, Inc. | | | 17,071 | | | | 991,484 | |
Micron Technology, Inc. | | | 31,545 | | | | 1,743,808 | |
NXP Semiconductor NV | | | 5,444 | | | | 805,875 | |
| | | Number of
Shares | | | Value | |
Qorvo, Inc. (a) | | | 11,897 | | | $ | 1,122,125 | |
QUALCOMM, Inc. | | | 23,202 | | | | 2,963,824 | |
| | | | | | | | 10,718,900 | |
Software — 3.1% |
Activision Blizzard, Inc. | | | 18,596 | | | | 1,447,884 | |
Fidelity National Information Services, Inc. | | | 25,588 | | | | 2,345,652 | |
SS&C Technologies Holdings, Inc | | | 22,371 | | | | 1,299,084 | |
| | | | | | | | 5,092,620 | |
| | | | | | | | 18,659,844 | |
Utilities — 2.2% |
Electric — 2.2% |
CenterPoint Energy, Inc. | | | 59,700 | | | | 1,765,926 | |
Dominion Energy, Inc. | | | 23,765 | | | | 1,896,685 | |
| | | | | | | | 3,662,611 | |
| | | | | | | | 3,662,611 | |
| | | | | | | | | |
TOTAL COMMON STOCK (Cost $140,664,404) | | | | | | | 162,675,379 | |
| | | | | | | | | |
TOTAL EQUITIES (Cost $140,664,404) | | | | | | | 162,675,379 | |
| | | | | | | | | |
TOTAL LONG-TERM INVESTMENTS (Cost $140,664,404) | | | | | | | 162,675,379 | |
| | | Principal
Amount | | | | | |
SHORT-TERM INVESTMENTS — 2.3% |
Repurchase Agreement — 2.3% |
Fixed Income Clearing Corp., Repurchase Agreement, dated 6/30/22, 0.240%, due 7/01/22 (c) | | $ | 3,752,529 | | | | 3,752,529 | |
| | | | | | | | | |
TOTAL SHORT-TERM INVESTMENTS (Cost $3,752,529) | | | | | | | 3,752,529 | |
| | | | | | | | | |
TOTAL INVESTMENTS — 100.0% (Cost $144,416,933) (d) | | | | | | | 166,427,908 | |
| | | | | | | | | |
Other Assets/(Liabilities) — 0.0% | | | | | | | 42,520 | |
| | | | | | | | | |
NET ASSETS — 100.0% | | | | | | $ | 166,470,428 | |
Abbreviation Legend
ADR | American Depositary Receipt |
The accompanying notes are an integral part of the financial statements.
58
MML Fundamental Value Fund – Portfolio of Investments (Continued) |
Notes to Portfolio of Investments
Percentages are stated as a percent of net assets.
(a) | Non-income producing security. |
(b) | Denotes all or a portion of security on loan. The total value of securities on loan as of June 30, 2022, was $1,185,726 or 0.71% of net assets. Total securities on loan may be less than the amounts identified in the Portfolio of Investments. The Fund received $1,213,636 of non-cash collateral (U.S. Treasury and/or Agency obligations) related to securities lending activity. This amount is not reflected on either the Portfolio of Investments or the Statement of Assets and Liabilities. (Note 2). |
(c) | Maturity value of $3,752,554. Collateralized by U.S. Government Agency obligations with a rate of 3.000%, maturity date of 6/30/24, and an aggregate market value, including accrued interest, of $3,827,608. |
(d) | See Note 6 for aggregate cost for federal tax purposes. |
The accompanying notes are an integral part of the financial statements.
59
MML Global Fund – Portfolio of Investments |
June 30, 2022 (Unaudited) |
| | | Number of
Shares | | | Value | |
EQUITIES — 98.7% |
COMMON STOCK — 98.7% |
Austria — 0.3% |
Erste Group Bank AG | | | 14,424 | | | $ | 366,390 | |
Canada — 3.9% |
Canadian National Railway Co. | | | 20,999 | | | | 2,361,757 | |
Canadian Pacific Railway Ltd. | | | 39,771 | | | | 2,777,607 | |
| | | | | | | | 5,139,364 | |
Denmark — 0.5% |
Carlsberg A/S Class B | | | 5,520 | | | | 704,135 | |
France — 10.7% |
Air Liquide SA | | | 8,688 | | | | 1,174,286 | |
Danone SA | | | 39,978 | | | | 2,246,719 | |
EssilorLuxottica SA | | | 3,364 | | | | 508,832 | |
Hermes International | | | 385 | | | | 434,945 | |
Legrand SA | | | 19,146 | | | | 1,424,931 | |
LVMH Moet Hennessy Louis Vuitton SE | | | 4,855 | | | | 2,996,181 | |
Pernod Ricard SA | | | 10,516 | | | | 1,947,939 | |
Schneider Electric SE | | | 28,800 | | | | 3,411,884 | |
| | | | | | | | 14,145,717 | |
Germany — 4.1% |
Bayer AG Registered | | | 28,381 | | | | 1,686,215 | |
Brenntag SE | | | 8,969 | | | | 583,741 | |
Deutsche Boerse AG | | | 4,384 | | | | 733,243 | |
Merck KGaA | | | 10,757 | | | | 1,815,554 | |
MTU Aero Engines AG | | | 3,038 | | | | 553,014 | |
| | | | | | | | 5,371,767 | |
Ireland — 10.6% |
Accenture PLC Class A | | | 12,260 | | | | 3,403,989 | |
Aon PLC Class A | | | 6,666 | | | | 1,797,687 | |
Linde PLC (a) | | | 9,568 | | | | 2,746,841 | |
Linde PLC | | | 2,102 | | | | 604,388 | |
Medtronic PLC | | | 38,917 | | | | 3,492,801 | |
Willis Towers Watson PLC | | | 9,868 | | | | 1,947,844 | |
| | | | | | | | 13,993,550 | |
Israel — 1.0% |
Check Point Software Technologies Ltd. (a) | | | 10,817 | | | | 1,317,294 | |
Japan — 1.8% |
Hoya Corp. | | | 5,700 | | | | 487,264 | |
Kubota Corp. | | | 89,800 | | | | 1,343,081 | |
Olympus Corp. | | | 25,200 | | | | 506,791 | |
| | | | | | | | 2,337,136 | |
Mexico — 0.2% |
Grupo Financiero Banorte SAB de CV Class O | | | 54,200 | | | | 302,945 | |
| | | Number of
Shares | | | Value | |
Netherlands — 2.5% |
Akzo Nobel NV | | | 17,211 | | | $ | 1,137,108 | |
Heineken NV | | | 21,824 | | | | 1,998,678 | |
Wolters Kluwer NV | | | 2,490 | | | | 242,231 | |
| | | | | | | | 3,378,017 | |
Republic of Korea — 0.8% |
Samsung Electronics Co. Ltd. | | | 24,104 | | | | 1,055,867 | |
Spain — 0.8% |
Aena SME SA (a) (b) | | | 8,170 | | | | 1,039,070 | |
Sweden — 1.6% |
Essity AB Class B | | | 81,401 | | | | 2,125,282 | |
Switzerland — 8.8% |
Adecco Group AG Registered | | | 9,705 | | | | 330,127 | |
Cie Financiere Richemont SA Registered | | | 18,114 | | | | 1,929,070 | |
Julius Baer Group Ltd. | | | 10,318 | | | | 476,693 | |
Nestle SA Registered | | | 28,386 | | | | 3,330,279 | |
Roche Holding AG | | | 11,130 | | | | 3,715,502 | |
Sonova Holding AG Registered | | | 1,417 | | | | 451,275 | |
UBS Group AG Registered | | | 90,890 | | | | 1,467,159 | |
| | | | | | | | 11,700,105 | |
United Kingdom — 7.5% |
Aptiv PLC (a) | | | 5,440 | | | | 484,541 | |
Burberry Group PLC | | | 42,030 | | | | 840,815 | |
Compass Group PLC | | | 42,187 | | | | 863,688 | |
Diageo PLC | | | 66,847 | | | | 2,883,901 | |
London Stock Exchange Group PLC | | | 9,419 | | | | 875,582 | |
Reckitt Benckiser Group PLC | | | 26,709 | | | | 2,006,141 | |
Rolls-Royce Holdings PLC (a) (c) | | | 571,329 | | | | 577,794 | |
Whitbread PLC | | | 16,867 | | | | 509,567 | |
WPP PLC | | | 88,607 | | | | 890,433 | |
| | | | | | | | 9,932,462 | |
United States — 43.6% |
3M Co. | | | 11,564 | | | | 1,496,497 | |
Abbott Laboratories | | | 19,423 | | | | 2,110,309 | |
Alphabet, Inc. Class A (a) | | | 492 | | | | 1,072,196 | |
American Express Co. | | | 11,584 | | | | 1,605,774 | |
Amphenol Corp. Class A | | | 12,849 | | | | 827,219 | |
Boston Scientific Corp. (a) | | | 54,250 | | | | 2,021,898 | |
Carrier Global Corp. | | | 8,788 | | | | 313,380 | |
The Charles Schwab Corp. | | | 32,731 | | | | 2,067,945 | |
Cognizant Technology Solutions Corp. Class A | | | 22,090 | | | | 1,490,854 | |
Colgate-Palmolive Co. | | | 14,973 | | | | 1,199,936 | |
Comcast Corp. Class A | | | 90,365 | | | | 3,545,923 | |
The Cooper Cos., Inc. | | | 3,810 | | | | 1,192,987 | |
eBay, Inc. | | | 23,192 | | | | 966,411 | |
Equifax, Inc. | | | 8,551 | | | | 1,562,952 | |
The accompanying notes are an integral part of the financial statements.
60
MML Global Fund – Portfolio of Investments (Continued) |
| | | Number of
Shares | | | Value | |
Fidelity National Information Services, Inc. | | | 19,814 | | | $ | 1,816,349 | |
Fiserv, Inc. (a) | | | 21,648 | | | | 1,926,023 | |
The Goldman Sachs Group, Inc. | | | 8,176 | | | | 2,428,436 | |
Honeywell International, Inc. | | | 15,522 | | | | 2,697,879 | |
International Flavors & Fragrances, Inc. | | | 12,395 | | | | 1,476,492 | |
Liberty Broadband Corp. Class C (a) | | | 19,549 | | | | 2,260,646 | |
Marriott International, Inc. Class A | | | 5,747 | | | | 781,649 | |
Microchip Technology, Inc. | | | 10,502 | | | | 609,956 | |
Omnicom Group, Inc. | | | 4,956 | | | | 315,251 | |
Oracle Corp. | | | 30,506 | | | | 2,131,454 | |
Otis Worldwide Corp. | | | 10,174 | | | | 718,997 | |
PayPal Holdings, Inc. (a) | | | 7,185 | | | | 501,800 | |
PPG Industries, Inc. | | | 12,563 | | | | 1,436,453 | |
Stryker Corp. | | | 10,467 | | | | 2,082,200 | |
Thermo Fisher Scientific, Inc. | | | 8,066 | | | | 4,382,097 | |
Union Pacific Corp. | | | 6,104 | | | | 1,301,861 | |
United Parcel Service, Inc. Class B | | | 8,167 | | | | 1,490,804 | |
Visa, Inc. Class A | | | 20,612 | | | | 4,058,297 | |
The Walt Disney Co. (a) | | | 18,428 | | | | 1,739,603 | |
Waters Corp. (a) | | | 3,766 | | | | 1,246,471 | |
Zimmer Biomet Holdings, Inc. | | | 8,198 | | | | 861,282 | |
| | | | | | | | 57,738,281 | |
| | | | | | | | | |
TOTAL COMMON STOCK (Cost $119,740,085) | | | | | | | 130,647,382 | |
| | | | | | | | | |
TOTAL EQUITIES (Cost $119,740,085) | | | | | | | 130,647,382 | |
| | | | | | | | | |
WARRANTS — 0.1% |
Switzerland — 0.1% |
Cie Financiere Richemont SA, Expires 11/22/23, Strike 67.00 (a) | | | 105,484 | | | | 57,458 | |
| | | | | | | | | |
TOTAL WARRANTS (Cost $0) | | | | | | | 57,458 | |
| | | | | | | | | |
TOTAL LONG-TERM INVESTMENTS (Cost $119,740,085) | | | | | | | 130,704,840 | |
| | | Principal
Amount | | | Value | |
SHORT-TERM INVESTMENTS — 0.7% |
Repurchase Agreement — 0.7% |
Fixed Income Clearing Corp., Repurchase Agreement, dated 6/30/22, 0.240%, due 7/01/22 (d) | | $ | 949,537 | | | $ | 949,537 | |
| | | | | | | | | |
TOTAL SHORT-TERM INVESTMENTS (Cost $949,537) | | | | | | | 949,537 | |
| | | | | | | | | |
TOTAL INVESTMENTS — 99.5% (Cost $120,689,622) (e) | | | | | | | 131,654,377 | |
| | | | | | | | | |
Other Assets/(Liabilities) — 0.5% | | | | | | | 656,356 | |
| | | | | | | | | |
NET ASSETS — 100.0% | | | | | | $ | 132,310,733 | |
Notes to Portfolio of Investments
Percentages are stated as a percent of net assets.
(a) | Non-income producing security. |
(b) | Security is exempt from registration under Regulation S or Rule 144A of the Securities Act of 1933. These securities are considered restricted and may be resold in transactions exempt from registration. At June 30, 2022, the aggregate market value of these securities amounted to $1,039,070 or 0.79% of net assets. |
(c) | Denotes all or a portion of security on loan. The total value of securities on loan as of June 30, 2022, was $571,311 or 0.43% of net assets. Total securities on loan may be less than the amounts identified in the Portfolio of Investments. The Fund received $644,484 of non-cash collateral (U.S. Treasury and/or Agency obligations) related to securities lending activity. This amount is not reflected on either the Portfolio of Investments or the Statement of Assets and Liabilities. (Note 2). |
(d) | Maturity value of $949,544. Collateralized by U.S. Government Agency obligations with a rate of 3.000%, maturity date of 6/30/24, and an aggregate market value, including accrued interest, of $968,539. |
(e) | See Note 6 for aggregate cost for federal tax purposes. |
Sector weightings, as a percentage of net assets, is as follows:
Consumer, Non-cyclical | | | 35.6 | % |
Industrial | | | 17.2 | % |
Financial | | | 13.7 | % |
Technology | | | 10.4 | % |
Communications | | | 8.3 | % |
Basic Materials | | | 6.9 | % |
Consumer, Cyclical | | | 6.7 | % |
Total Long-Term Investments | | | 98.8 | % |
Short-Term Investments and Other Assets and Liabilities | | | 1.2 | % |
Net Assets | | | 100.0 | % |
The accompanying notes are an integral part of the financial statements.
61
MML Income & Growth Fund – Portfolio of Investments |
June 30, 2022 (Unaudited) |
| | | Number of
Shares | | | Value | |
EQUITIES — 98.4% |
COMMON STOCK — 98.4% |
Basic Materials — 8.0% |
Chemicals — 8.0% |
Air Products & Chemicals, Inc. | | | 23,981 | | | $ | 5,766,951 | |
Axalta Coating Systems Ltd. (a) | | | 70,959 | | | | 1,568,904 | |
DuPont de Nemours, Inc. | | | 59,624 | | | | 3,313,902 | |
Element Solutions, Inc. | | | 81,548 | | | | 1,451,554 | |
International Flavors & Fragrances, Inc. | | | 45,427 | | | | 5,411,264 | |
| | | | | | | | 17,512,575 | |
| | | | | | | | 17,512,575 | |
Communications — 3.1% |
Media — 2.2% |
Altice USA, Inc. Class A (a) | | | 63,416 | | | | 586,598 | |
Comcast Corp. Class A | | | 110,108 | | | | 4,320,638 | |
| | | | | | | | 4,907,236 | |
Telecommunications — 0.9% |
T-Mobile US, Inc. (a) | | | 14,853 | | | | 1,998,323 | |
| | | | | | | | 6,905,559 | |
Consumer, Cyclical — 6.6% |
Entertainment — 1.0% |
Marriott Vacations Worldwide Corp. | | | 8,665 | | | | 1,006,873 | |
SeaWorld Entertainment, Inc. (a) | | | 27,262 | | | | 1,204,435 | |
| | | | | | | | 2,211,308 | |
Food Services — 0.7% |
Aramark | | | 49,197 | | | | 1,506,904 | |
Lodging — 1.1% |
Las Vegas Sands Corp. (a) | | | 47,965 | | | | 1,611,144 | |
MGM Resorts International | | | 30,689 | | | | 888,447 | |
| | | | | | | | 2,499,591 | |
Retail — 3.8% |
Advance Auto Parts, Inc. | | | 18,373 | | | | 3,180,183 | |
Dollar General Corp. | | | 8,412 | | | | 2,064,641 | |
Lithia Motors, Inc. | | | 3,979 | | | | 1,093,469 | |
Lowe’s Cos., Inc. | | | 11,485 | | | | 2,006,085 | |
| | | | | | | | 8,344,378 | |
| | | | | | | | 14,562,181 | |
Consumer, Non-cyclical — 29.1% |
Agriculture — 2.8% |
Philip Morris International, Inc. | | | 61,719 | | | | 6,094,134 | |
Beverages — 3.5% |
Coca-Cola Europacific Partners PLC | | | 107,474 | | | | 5,546,733 | |
Molson Coors Beverage Co. Class B | | | 38,157 | | | | 2,079,938 | |
| | | | | | | | 7,626,671 | |
| | | Number of
Shares | | | Value | |
Biotechnology — 0.4% |
Corteva, Inc. | | | 14,887 | | | $ | 805,982 | |
Commercial Services — 0.1% |
PROG Holdings, Inc. (a) | | | 18,875 | | | | 311,438 | |
Cosmetics & Personal Care — 1.0% |
The Procter & Gamble Co. | | | 14,977 | | | | 2,153,543 | |
Health Care – Products — 3.8% |
Envista Holdings Corp. (a) | | | 32,845 | | | | 1,265,846 | |
Hologic, Inc. (a) | | | 19,143 | | | | 1,326,610 | |
LivaNova PLC (a) | | | 18,323 | | | | 1,144,638 | |
Medtronic PLC | | | 52,137 | | | | 4,679,296 | |
| | | | | | | | 8,416,390 | |
Health Care – Services — 5.6% |
Elevance Health, Inc. | | | 5,022 | | | | 2,423,517 | |
Humana, Inc. | | | 6,904 | | | | 3,231,555 | |
UnitedHealth Group, Inc. | | | 13,199 | | | | 6,779,402 | |
| | | | | | | | 12,434,474 | |
Pharmaceuticals — 11.9% |
Becton Dickinson and Co. | | | 10,014 | | | | 2,468,751 | |
Cigna Corp. | | | 19,598 | | | | 5,164,465 | |
CVS Health Corp. | | | 54,237 | | | | 5,025,601 | |
Johnson & Johnson | | | 10,921 | | | | 1,938,587 | |
Merck & Co., Inc. | | | 88,042 | | | | 8,026,789 | |
Perrigo Co. PLC | | | 87,223 | | | | 3,538,637 | |
| | | | | | | | 26,162,830 | |
| | | | | | | | 64,005,462 | |
Energy — 8.6% |
Oil & Gas — 6.7% |
Hess Corp. | | | 50,533 | | | | 5,353,466 | |
Phillips 66 | | | 71,155 | | | | 5,833,998 | |
Pioneer Natural Resources Co. | | | 9,860 | | | | 2,199,569 | |
Valero Energy Corp. | | | 12,007 | | | | 1,276,104 | |
| | | | | | | | 14,663,137 | |
Oil & Gas Services — 0.4% |
Halliburton Co. | | | 27,456 | | | | 861,020 | |
Pipelines — 1.5% |
Enbridge, Inc. (b) | | | 80,685 | | | | 3,409,748 | |
| | | | | | | | 18,933,905 | |
Financial — 19.1% |
Banks — 8.1% |
JP Morgan Chase & Co. | | | 29,315 | | | | 3,301,162 | |
M&T Bank Corp. | | | 12,282 | | | | 1,957,628 | |
Northern Trust Corp. | | | 38,593 | | | | 3,723,453 | |
US Bancorp | | | 84,095 | | | | 3,870,052 | |
Wells Fargo & Co. | | | 124,885 | | | | 4,891,745 | |
| | | | | | | | 17,744,040 | |
The accompanying notes are an integral part of the financial statements.
62
MML Income & Growth Fund – Portfolio of Investments (Continued) |
| | | Number of
Shares | | | Value | |
Diversified Financial Services — 0.8% |
AerCap Holdings NV (a) | | | 22,633 | | | $ | 926,595 | |
American Express Co. | | | 6,828 | | | | 946,497 | |
| | | | | | | | 1,873,092 | |
Insurance — 6.7% |
The Allstate Corp. | | | 36,821 | | | | 4,666,325 | |
American International Group, Inc. | | | 31,718 | | | | 1,621,741 | |
Axis Capital Holdings Ltd. | | | 21,910 | | | | 1,250,842 | |
Chubb Ltd. | | | 27,939 | | | | 5,492,249 | |
Willis Towers Watson PLC | | | 8,336 | | | | 1,645,443 | |
| | | | | | | | 14,676,600 | |
Real Estate — 0.4% |
The Howard Hughes Corp. (a) | | | 12,518 | | | | 851,850 | |
Real Estate Investment Trusts (REITS) — 3.1% |
American Campus Communities, Inc. | | | 24,621 | | | | 1,587,316 | |
Corporate Office Properties Trust | | | 111,577 | | | | 2,922,202 | |
VICI Properties, Inc. | | | 81,423 | | | | 2,425,591 | |
| | | | | | | | 6,935,109 | |
| | | | | | | | 42,080,691 | |
Industrial — 12.2% |
Aerospace & Defense — 4.0% |
General Dynamics Corp. | | | 12,271 | | | | 2,714,959 | |
Raytheon Technologies Corp. | | | 64,005 | | | | 6,151,520 | |
| | | | | | | | 8,866,479 | |
Building Materials — 0.8% |
MDU Resources Group, Inc. | | | 68,868 | | | | 1,858,747 | |
Engineering & Construction — 1.3% |
AECOM | | | 24,367 | | | | 1,589,216 | |
Jacobs Engineering Group, Inc. | | | 9,419 | | | | 1,197,437 | |
| | | | | | | | 2,786,653 | |
Hand & Machine Tools — 1.8% |
Stanley Black & Decker, Inc. | | | 37,444 | | | | 3,926,378 | |
Machinery – Construction & Mining — 1.4% |
BWX Technologies, Inc. | | | 31,517 | | | | 1,736,272 | |
Vertiv Holdings Co. | | | 154,763 | | | | 1,272,152 | |
| | | | | | | | 3,008,424 | |
Machinery – Diversified — 2.1% |
Deere & Co. | | | 15,258 | | | | 4,569,313 | |
Transportation — 0.8% |
J.B. Hunt Transport Services, Inc. | | | 11,274 | | | | 1,775,317 | |
| | | | | | | | 26,791,311 | |
Technology — 6.5% |
Computers — 1.3% |
Cognizant Technology Solutions Corp. Class A | | | 42,764 | | | | 2,886,142 | |
| | | Number of
Shares | | | Value | |
Semiconductors — 1.8% |
Broadcom, Inc. | | | 3,132 | | | $ | 1,521,557 | |
Microchip Technology, Inc. | | | 18,424 | | | | 1,070,066 | |
QUALCOMM, Inc. | | | 11,839 | | | | 1,512,314 | |
| | | | | | | | 4,103,937 | |
Software — 3.4% |
Electronic Arts, Inc. | | | 14,865 | | | | 1,808,327 | |
Fidelity National Information Services, Inc. | | | 18,651 | | | | 1,709,737 | |
Oracle Corp. | | | 55,721 | | | | 3,893,227 | |
| | | | | | | | 7,411,291 | |
| | | | | | | | 14,401,370 | |
Utilities — 5.2% |
Electric — 5.2% |
CenterPoint Energy, Inc. | | | 56,764 | | | | 1,679,079 | |
Entergy Corp. | | | 39,014 | | | | 4,394,537 | |
Exelon Corp. | | | 36,653 | | | | 1,661,114 | |
Pinnacle West Capital Corp. | | | 51,058 | | | | 3,733,361 | |
| | | | | | | | 11,468,091 | |
| | | | | | | | | |
TOTAL COMMON STOCK (Cost $188,804,492) | | | | | | | 216,661,145 | |
| | | | | | | | | |
TOTAL EQUITIES (Cost $188,804,492) | | | | | | | 216,661,145 | |
| | | | | | | | | |
TOTAL LONG-TERM INVESTMENTS (Cost $188,804,492) | | | | | | | 216,661,145 | |
| | | Principal
Amount | | | | | |
SHORT-TERM INVESTMENTS — 1.4% |
Repurchase Agreement — 1.4% |
Fixed Income Clearing Corp., Repurchase Agreement, dated 6/30/22, 0.240%, due 7/01/22 (c) | | $ | 3,148,640 | | | | 3,148,640 | |
| | | | | | | | | |
TOTAL SHORT-TERM INVESTMENTS (Cost $3,148,640) | | | | | | | 3,148,640 | |
| | | | | | | | | |
TOTAL INVESTMENTS — 99.8% (Cost $191,953,132) (d) | | | | | | | 219,809,785 | |
| | | | | | | | | |
Other Assets/(Liabilities) — 0.2% | | | | | | | 343,167 | |
| | | | | | | | | |
NET ASSETS — 100.0% | | | | | | $ | 220,152,952 | |
The accompanying notes are an integral part of the financial statements.
63
MML Income & Growth Fund – Portfolio of Investments (Continued) |
Notes to Portfolio of Investments
Percentages are stated as a percent of net assets.
(a) | Non-income producing security. |
(b) | Denotes all or a portion of security on loan. The total value of securities on loan as of June 30, 2022, was $147,734 or 0.07% of net assets. Total securities on loan may be less than the amounts identified in the Portfolio of Investments. The Fund received $151,902 of non-cash collateral (U.S. Treasury and/or Agency obligations) related to securities lending activity. This amount is not reflected on either the Portfolio of Investments or the Statement of Assets and Liabilities. (Note 2). |
(c) | Maturity value of $3,148,661. Collateralized by U.S. Government Agency obligations with rates ranging from 2.250% - 3.000%, maturity dates ranging from 6/30/24 - 11/15/24, and an aggregate market value, including accrued interest, of $3,211,747. |
(d) | See Note 6 for aggregate cost for federal tax purposes. |
The accompanying notes are an integral part of the financial statements.
64
MML International Equity Fund – Portfolio of Investments |
June 30, 2022 (Unaudited) |
| | | Number of
Shares | | | Value | |
EQUITIES — 98.5% |
COMMON STOCK — 98.1% |
Australia — 0.6% |
Brambles Ltd. | | | 78,500 | | | $ | 579,868 | |
Orica Ltd. | | | 58,386 | | | | 634,371 | |
| | | | | | | | 1,214,239 | |
Belgium — 1.1% |
Anheuser-Busch InBev SA | | | 23,500 | | | | 1,267,649 | |
KBC Group NV | | | 15,959 | | | | 896,486 | |
| | | | | | | | 2,164,135 | |
Canada — 3.9% |
Canadian National Railway Co. | | | 21,732 | | | | 2,444,198 | |
Intact Financial Corp. | | | 7,959 | | | | 1,122,619 | |
Open Text Corp. | | | 25,400 | | | | 960,788 | |
Restaurant Brands International, Inc. | | | 12,500 | | | | 626,875 | |
Suncor Energy, Inc. | | | 39,701 | | | | 1,392,866 | |
The Toronto-Dominion Bank | | | 23,261 | | | | 1,525,374 | |
| | | | | | | | 8,072,720 | |
Cayman Islands — 2.6% |
Alibaba Group Holding Ltd. (a) | | | 121,940 | | | | 1,739,439 | |
JD.com, Inc. Class A | | | 1,350 | | | | 43,651 | |
NetEase, Inc. | | | 43,800 | | | | 819,716 | |
Tencent Holdings Ltd. | | | 34,600 | | | | 1,571,307 | |
Trip.com Group Ltd. (a) | | | 14,700 | | | | 410,119 | |
Vipshop Holdings Ltd. ADR (a) | | | 83,664 | | | | 827,437 | |
| | | | | | | | 5,411,669 | |
Denmark — 2.4% |
Carlsberg A/S Class B | | | 9,851 | | | | 1,256,601 | |
Novo Nordisk A/S Class B | | | 32,652 | | | | 3,624,090 | |
| | | | | | | | 4,880,691 | |
Finland — 0.2% |
UPM-Kymmene OYJ | | | 14,700 | | | | 449,656 | |
France — 16.9% |
Accor SA (a) | | | 44,100 | | | | 1,211,157 | |
Air Liquide SA | | | 28,148 | | | | 3,804,536 | |
BNP Paribas SA | | | 43,076 | | | | 2,050,975 | |
Capgemini SE | | | 20,766 | | | | 3,591,045 | |
Cie de Saint-Gobain | | | 23,189 | | | | 1,007,294 | |
Cie Generale des Etablissements Michelin SCA | | | 35,620 | | | | 979,449 | |
Danone SA | | | 16,000 | | | | 899,182 | |
Dassault Systemes SE | | | 22,606 | | | | 837,627 | |
Edenred | | | 12,400 | | | | 587,580 | |
Engie SA | | | 131,084 | | | | 1,521,415 | |
EssilorLuxottica SA | | | 13,725 | | | | 2,076,016 | |
Kering SA | | | 1,275 | | | | 662,437 | |
L’Oreal SA | | | 3,799 | | | | 1,312,583 | |
| | | Number of
Shares | | | Value | |
Legrand SA | | | 16,272 | | | $ | 1,211,035 | |
LVMH Moet Hennessy Louis Vuitton SE | | | 5,332 | | | | 3,290,554 | |
Pernod Ricard SA | | | 13,495 | | | | 2,499,756 | |
Publicis Groupe SA | | | 23,051 | | | | 1,137,996 | |
Schneider Electric SE | | | 31,966 | | | | 3,786,954 | |
Valeo | | | 46,110 | | | | 902,505 | |
Worldline SA (a) (b) | | | 36,400 | | | | 1,346,540 | |
| | | | | | | | 34,716,636 | |
Germany — 15.2% |
adidas AG | | | 6,410 | | | | 1,133,681 | |
Allianz SE Registered | | | 9,595 | | | | 1,831,629 | |
Bayer AG Registered | | | 71,642 | | | | 4,256,503 | |
Bayerische Motoren Werke AG | | | 24,175 | | | | 1,861,163 | |
Beiersdorf AG | | | 25,250 | | | | 2,579,274 | |
Continental AG | | | 25,220 | | | | 1,757,505 | |
Daimler Truck Holding AG (a) | | | 42,549 | | | | 1,110,481 | |
Deutsche Boerse AG | | | 16,322 | | | | 2,729,925 | |
Fresenius Medical Care AG & Co. KGaA | | | 20,000 | | | | 998,882 | |
Fresenius SE & Co. KGaA | | | 40,000 | | | | 1,212,009 | |
Henkel AG & Co. KGaA | | | 16,500 | | | | 1,009,771 | |
Mercedes-Benz Group AG | | | 30,398 | | | | 1,759,129 | |
Merck KGaA | | | 15,507 | | | | 2,617,253 | |
MTU Aero Engines AG | | | 4,307 | | | | 784,013 | |
SAP SE | | | 40,519 | | | | 3,691,389 | |
Siemens AG Registered | | | 9,685 | | | | 985,716 | |
thyssenkrupp AG (a) | | | 141,374 | | | | 802,084 | |
| | | | | | | | 31,120,407 | |
Hong Kong — 1.8% |
AIA Group Ltd. | | | 344,800 | | | | 3,787,335 | |
India — 0.6% |
Axis Bank Ltd. (a) | | | 77,942 | | | | 628,154 | |
HDFC Bank Ltd. ADR | | | 11,494 | | | | 631,710 | |
| | | | | | | | 1,259,864 | |
Ireland — 1.9% |
Linde PLC (a) | | | 6,349 | | | | 1,822,710 | |
Ryanair Holdings PLC Sponsored ADR (a) | | | 31,902 | | | | 2,145,410 | |
| | | | | | | | 3,968,120 | |
Israel — 0.9% |
Check Point Software Technologies Ltd. (a) | | | 14,957 | | | | 1,821,463 | |
Italy — 2.2% |
Eni SpA | | | 74,144 | | | | 880,815 | |
Intesa Sanpaolo SpA | | | 1,927,447 | | | | 3,623,968 | |
Intesa Sanpaolo SpA | | | 12,000 | | | | 22,344 | |
| | | | | | | | 4,527,127 | |
The accompanying notes are an integral part of the financial statements.
65
MML International Equity Fund – Portfolio of Investments (Continued) |
| | | Number of
Shares | | | Value | |
Japan — 10.4% |
Daikin Industries Ltd. | | | 14,800 | | | $ | 2,375,336 | |
Denso Corp. | | | 19,200 | | | | 1,021,284 | |
Hitachi Ltd. | | | 62,700 | | | | 2,970,803 | |
Hoya Corp. | | | 17,800 | | | | 1,521,631 | |
Koito Manufacturing Co. Ltd. | | | 23,400 | | | | 743,363 | |
Komatsu Ltd. | | | 22,700 | | | | 505,324 | |
Kose Corp. (c) | | | 10,600 | | | | 965,170 | |
Kubota Corp. (c) | | | 112,500 | | | | 1,682,590 | |
Kyocera Corp. | | | 28,600 | | | | 1,530,856 | |
Olympus Corp. | | | 103,700 | | | | 2,085,487 | |
Shin-Etsu Chemical Co. Ltd. | | | 6,300 | | | | 711,204 | |
SMC Corp. | | | 2,800 | | | | 1,249,462 | |
Sony Group Corp. | | | 20,600 | | | | 1,683,511 | |
Terumo Corp. | | | 58,400 | | | | 1,761,059 | |
Toyota Motor Corp. | | | 33,500 | | | | 515,923 | |
| | | | | | | | 21,323,003 | |
Mexico — 0.3% |
Grupo Televisa SAB Sponsored ADR | | | 80,200 | | | | 656,036 | |
Netherlands — 5.3% |
CNH Industrial NV | | | 106,224 | | | | 1,232,876 | |
EXOR NV | | | 20,920 | | | | 1,312,988 | |
ING Groep NV | | | 132,106 | | | | 1,311,090 | |
Koninklijke Philips NV | | | 83,521 | | | | 1,812,192 | |
Prosus NV (a) | | | 39,473 | | | | 2,608,704 | |
QIAGEN NV (a) | | | 29,825 | | | | 1,400,666 | |
Randstad NV | | | 23,501 | | | | 1,146,072 | |
| | | | | | | | 10,824,588 | |
Portugal — 0.5% |
Galp Energia SGPS SA | | | 90,702 | | | | 1,063,213 | |
Republic of Korea — 0.4% |
NAVER Corp. | | | 4,705 | | | | 872,911 | |
Singapore — 0.8% |
DBS Group Holdings, Ltd. | | | 81,200 | | | | 1,738,037 | |
Spain — 1.0% |
Amadeus IT Group SA (a) | | | 37,201 | | | | 2,090,113 | |
Sweden — 1.5% |
Hennes & Mauritz AB Class B (c) | | | 98,964 | | | | 1,183,178 | |
SKF AB Class B | | | 69,800 | | | | 1,028,373 | |
Volvo AB Class B | | | 52,170 | | | | 808,668 | |
| | | | | | | | 3,020,219 | |
| | | Number of
Shares | | | Value | |
Switzerland — 13.4% |
Cie Financiere Richemont SA Registered | | | 25,798 | | | $ | 2,747,386 | |
Credit Suisse Group AG Registered (a) | | | 273,919 | | | | 1,559,699 | |
Holcim AG (a) | | | 31,759 | | | | 1,360,326 | |
Julius Baer Group Ltd. (a) | | | 20,350 | | | | 940,174 | |
Nestle SA Registered | | | 48,355 | | | | 5,673,065 | |
Novartis AG Registered | | | 39,552 | | | | 3,345,778 | |
Roche Holding AG | | | 15,221 | | | | 5,081,191 | |
Sika AG Registered | | | 4,773 | | | | 1,101,108 | |
The Swatch Group AG | | | 2,415 | | | | 573,053 | |
UBS Group AG Registered | | | 177,446 | | | | 2,864,359 | |
Zurich Insurance Group AG | | | 5,068 | | | | 2,205,867 | |
| | | | | | | | 27,452,006 | |
Taiwan — 1.0% |
Taiwan Semiconductor Manufacturing Co. Ltd. Sponsored ADR | | | 24,190 | | | | 1,977,533 | |
United Kingdom — 12.6% |
Compass Group PLC | | | 146,648 | | | | 3,002,303 | |
Diageo PLC | | | 54,021 | | | | 2,330,564 | |
Experian PLC | | | 70,745 | | | | 2,073,895 | |
Glencore PLC | | | 262,344 | | | | 1,421,608 | |
Informa PLC (a) | | | 96,300 | | | | 620,605 | |
Liberty Global PLC Class A (a) | | | 49,500 | | | | 1,041,975 | |
Lloyds Banking Group PLC | | | 4,154,984 | | | | 2,143,194 | |
London Stock Exchange Group PLC | | | 14,101 | | | | 1,310,817 | |
Natwest Group PLC | | | 197,700 | | | | 525,914 | |
Prudential PLC | | | 81,900 | | | | 1,018,753 | |
Reckitt Benckiser Group PLC | | | 29,019 | | | | 2,179,647 | |
RELX PLC | | | 85,911 | | | | 2,319,938 | |
Rio Tinto PLC | | | 22,399 | | | | 1,339,350 | |
Rolls-Royce Holdings PLC (a) | | | 857,319 | | | | 867,020 | |
Schroders PLC | | | 33,600 | | | | 1,094,071 | |
Smiths Group PLC | | | 22,300 | | | | 380,285 | |
Tesco PLC | | | 452,748 | | | | 1,408,204 | |
WPP PLC | | | 70,592 | | | | 709,396 | |
| | | | | | | | 25,787,539 | |
United States — 0.6% |
Yum China Holdings, Inc. | | | 23,869 | | | | 1,157,647 | |
| | | | | | | | | |
TOTAL COMMON STOCK (Cost $241,516,458) | | | | | | | 201,356,907 | |
| | | | | | | | | |
The accompanying notes are an integral part of the financial statements.
66
MML International Equity Fund – Portfolio of Investments (Continued) |
| | | Number of
Shares | | | Value | |
PREFERRED STOCK — 0.4% |
Republic of Korea — 0.4% |
Samsung Electronics Co. Ltd. 1.760% | | | 21,900 | | | $ | 878,668 | |
| | | | | | | | | |
TOTAL PREFERRED STOCK (Cost $1,246,434) | | | | | | | 878,668 | |
| | | | | | | | | |
TOTAL EQUITIES (Cost $242,762,892) | | | | | | | 202,235,575 | |
| | | | | | | | | |
MUTUAL FUNDS — 0.0% |
United States — 0.0% |
State Street Navigator Securities Lending Government Money Market Portfolio (d) | | | 8,019 | | | | 8,019 | |
| | | | | | | | | |
TOTAL MUTUAL FUNDS (Cost $8,019) | | | | | | | 8,019 | |
| | | | | | | | | |
TOTAL LONG-TERM INVESTMENTS (Cost $242,770,911) | | | | | | | 202,243,594 | |
| | | Principal
Amount | | | | | |
SHORT-TERM INVESTMENTS — 1.0% |
Repurchase Agreement — 1.0% |
Fixed Income Clearing Corp., Repurchase Agreement, dated 6/30/22, 0.240%, due 7/01/22 (e) | | $ | 2,138,053 | | | | 2,138,053 | |
| | | | | | | | | |
TOTAL SHORT-TERM INVESTMENTS (Cost $2,138,053) | | | | | | | 2,138,053 | |
| | | | | | | | | |
TOTAL INVESTMENTS — 99.5% (Cost $244,908,964) (f) | | | | | | | 204,381,647 | |
| | | | | | | | | |
Other Assets/(Liabilities) — 0.5% | | | | | | | 923,908 | |
| | | | | | | | | |
NET ASSETS — 100.0% | | | | | | $ | 205,305,555 | |
Abbreviation Legend
ADR | American Depositary Receipt |
Notes to Portfolio of Investments
Percentages are stated as a percent of net assets.
(a) | Non-income producing security. |
(b) | Security is exempt from registration under Regulation S or Rule 144A of the Securities Act of 1933. These securities are considered restricted and may be resold in transactions exempt from registration. At June 30, 2022, the aggregate market value of these securities amounted to $1,346,540 or 0.66% of net assets. |
(c) | Denotes all or a portion of security on loan. The total value of securities on loan as of June 30, 2022, was $2,559,682 or 1.25% of net assets. Total securities on loan may be less than the amounts identified in the Portfolio of Investments. The Fund received $2,848,625 of non-cash collateral (U.S. Treasury and/or Agency obligations) related to securities lending activity. This amount is not reflected on either the Portfolio of Investments or the Statement of Assets and Liabilities. (Note 2). |
(d) | Represents investment of security lending cash collateral. (Note 2). |
(e) | Maturity value of $2,138,067. Collateralized by U.S. Government Agency obligations with a rate of 3.000%, maturity date of 6/30/24, and an aggregate market value, including accrued interest, of $2,180,911. |
(f) | See Note 6 for aggregate cost for federal tax purposes. |
Sector weightings, as a percentage of net assets, is as follows:
Consumer, Non-cyclical | | | 31.1 | % |
Financial | | | 18.0 | % |
Consumer, Cyclical | | | 15.0 | % |
Industrial | | | 14.0 | % |
Technology | | | 7.1 | % |
Communications | | | 6.0 | % |
Basic Materials | | | 5.0 | % |
Energy | | | 1.6 | % |
Utilities | | | 0.7 | % |
Mutual Funds | | | 0.0 | % |
Total Long-Term Investments | | | 98.5 | % |
Short-Term Investments and Other Assets and Liabilities | | | 1.5 | % |
Net Assets | | | 100.0 | % |
The accompanying notes are an integral part of the financial statements.
67
MML Large Cap Growth Fund – Portfolio of Investments |
June 30, 2022 (Unaudited) |
| | | Number of
Shares | | | Value | |
EQUITIES — 98.6% |
COMMON STOCK — 98.6% |
Communications — 27.1% |
Internet — 22.2% |
Alibaba Group Holding Ltd. Sponsored ADR (a) | | | 26,509 | | | $ | 3,013,543 | |
Alphabet, Inc. Class A (a) | | | 2,620 | | | | 5,709,661 | |
Alphabet, Inc. Class C (a) | | | 2,529 | | | | 5,532,061 | |
Amazon.com, Inc. (a) | | | 74,460 | | | | 7,908,397 | |
Meta Platforms, Inc. Class A (a) | | | 41,381 | | | | 6,672,686 | |
Netflix, Inc. (a) | | | 22,577 | | | | 3,948,040 | |
Shopify, Inc. Class A (a) | | | 62,860 | | | | 1,963,747 | |
| | | | | | | | 34,748,135 | |
Media — 4.9% |
FactSet Research Systems, Inc. | | | 8,135 | | | | 3,128,477 | |
The Walt Disney Co. (a) | | | 48,443 | | | | 4,573,019 | |
| | | | | | | | 7,701,496 | |
| | | | | | | | 42,449,631 | |
Consumer, Cyclical — 7.4% |
Auto Manufacturers — 2.8% |
Tesla, Inc. (a) | | | 6,635 | | | | 4,468,142 | |
Retail — 4.6% |
Starbucks Corp. | | | 43,542 | | | | 3,326,173 | |
Yum China Holdings, Inc. | | | 28,695 | | | | 1,391,708 | |
Yum! Brands, Inc. | | | 21,343 | | | | 2,422,644 | |
| | | | | | | | 7,140,525 | |
| | | | | | | | 11,608,667 | |
Consumer, Non-cyclical — 23.3% |
Beverages — 4.1% |
Monster Beverage Corp. (a) | | | 69,400 | | | | 6,433,380 | |
Biotechnology — 8.1% |
Illumina, Inc. (a) | | | 15,804 | | | | 2,913,626 | |
Regeneron Pharmaceuticals, Inc. (a) | | | 7,377 | | | | 4,360,766 | |
Vertex Pharmaceuticals, Inc. (a) | | | 19,365 | | | | 5,456,863 | |
| | | | | | | | 12,731,255 | |
Commercial Services — 2.5% |
Block, Inc. (a) | | | 29,240 | | | | 1,797,090 | |
PayPal Holdings, Inc. (a) | | | 29,657 | | | | 2,071,245 | |
| | | | | | | | 3,868,335 | |
Health Care – Products — 1.1% |
Intuitive Surgical, Inc. (a) | | | 8,570 | | | | 1,720,085 | |
Pharmaceuticals — 7.5% |
Novartis AG Sponsored ADR | | | 63,515 | | | | 5,368,923 | |
Novo Nordisk A/S Sponsored ADR | | | 23,182 | | | | 2,583,170 | |
| | | Number of
Shares | | | Value | |
Roche Holding AG Sponsored ADR | | | 92,555 | | | $ | 3,860,469 | |
| | | | | | | | 11,812,562 | |
| | | | | | | | 36,565,617 | |
Financial — 8.0% |
Diversified Financial Services — 8.0% |
SEI Investments Co. | | | 46,285 | | | | 2,500,315 | |
Visa, Inc. Class A | | | 51,257 | | | | 10,091,991 | |
| | | | | | | | 12,592,306 | |
Industrial — 8.2% |
Aerospace & Defense — 4.9% |
The Boeing Co. (a) | | | 55,640 | | | | 7,607,101 | |
Machinery – Diversified — 1.6% |
Deere & Co. | | | 8,201 | | | | 2,455,954 | |
Transportation — 1.7% |
Expeditors International of Washington, Inc. | | | 27,818 | | | | 2,711,142 | |
| | | | | | | | 12,774,197 | |
Technology — 24.6% |
Semiconductors — 7.3% |
NVIDIA Corp. | | | 50,313 | | | | 7,626,948 | |
QUALCOMM, Inc. | | | 29,857 | | | | 3,813,933 | |
| | | | | | | | 11,440,881 | |
Software — 17.3% |
Autodesk, Inc. (a) | | | 31,104 | | | | 5,348,644 | |
Microsoft Corp. | | | 32,701 | | | | 8,398,598 | |
Oracle Corp. | | | 93,546 | | | | 6,536,059 | |
Salesforce, Inc. (a) | | | 32,685 | | | | 5,394,332 | |
Workday, Inc. Class A (a) | | | 10,839 | | | | 1,512,907 | |
| | | | | | | | 27,190,540 | |
| | | | | | | | 38,631,421 | |
| | | | | | | | | |
TOTAL COMMON STOCK (Cost $159,961,497) | | | | | | | 154,621,839 | |
| | | | | | | | | |
TOTAL EQUITIES (Cost $159,961,497) | | | | | | | 154,621,839 | |
| | | | | | | | | |
TOTAL LONG-TERM INVESTMENTS (Cost $159,961,497) | | | | | | | 154,621,839 | |
The accompanying notes are an integral part of the financial statements.
68
MML Large Cap Growth Fund – Portfolio of Investments (Continued) |
| | | Principal
Amount | | | Value | |
SHORT-TERM INVESTMENTS — 1.4% |
Repurchase Agreement — 1.4% |
Fixed Income Clearing Corp., Repurchase Agreement, dated 6/30/22, 0.240%, due 7/01/22 (b) | | $ | 2,180,094 | | | $ | 2,180,094 | |
| | | | | | | | | |
TOTAL SHORT-TERM INVESTMENTS (Cost $2,180,094) | | | | | | | 2,180,094 | |
| | | | | | | | | |
TOTAL INVESTMENTS — 100.0% (Cost $162,141,591) (c) | | | | | | | 156,801,933 | |
| | | | | | | | | |
Other Assets/(Liabilities) — (0.0)% | | | | | | | (24,852 | ) |
| | | | | | | | | |
NET ASSETS — 100.0% | | | | | | $ | 156,777,081 | |
Abbreviation Legend
ADR | American Depositary Receipt |
Notes to Portfolio of Investments
Percentages are stated as a percent of net assets.
(a) | Non-income producing security. |
(b) | Maturity value of $2,180,109. Collateralized by U.S. Government Agency obligations with a rate of 3.000%, maturity date of 6/30/24, and an aggregate market value, including accrued interest, of $2,223,765. |
(c) | See Note 6 for aggregate cost for federal tax purposes. |
Country weightings, as a percentage of net assets, is as follows:
United States | | | 87.9 | % |
Switzerland | | | 5.9 | % |
Cayman Islands | | | 1.9 | % |
Denmark | | | 1.6 | % |
Canada | | | 1.3 | % |
Total Long-Term Investments | | | 98.6 | % |
Short-Term Investments and Other Assets and Liabilities | | | 1.4 | % |
Net Assets | | | 100.0 | % |
The accompanying notes are an integral part of the financial statements.
69
MML Managed Volatility Fund – Portfolio of Investments |
June 30, 2022 (Unaudited) |
| | | Number of
Shares | | | Value | |
EQUITIES — 100.2% |
COMMON STOCK — 100.2% |
Basic Materials — 2.1% |
Chemicals — 1.6% |
Air Products & Chemicals, Inc. (a) | | | 760 | | | $ | 182,765 | |
Albemarle Corp. (a) | | | 411 | | | | 85,891 | |
Celanese Corp. (a) | | | 388 | | | | 45,633 | |
CF Industries Holdings, Inc. (a) | | | 717 | | | | 61,469 | |
Dow, Inc. (a) | | | 2,490 | | | | 128,509 | |
DuPont de Nemours, Inc. (a) | | | 1,754 | | | | 97,487 | |
Eastman Chemical Co. (a) | | | 421 | | | | 37,793 | |
Ecolab, Inc. (a) | | | 845 | | | | 129,927 | |
FMC Corp. (a) | | | 432 | | | | 46,228 | |
International Flavors & Fragrances, Inc. (a) | | | 858 | | | | 102,205 | |
Linde PLC (a) | | | 1,742 | | | | 500,877 | |
LyondellBasell Industries NV Class A (a) | | | 870 | | | | 76,090 | |
The Mosaic Co. (a) | | | 1,258 | | | | 59,415 | |
PPG Industries, Inc. (a) | | | 852 | | | | 97,418 | |
The Sherwin-Williams Co. (a) | | | 817 | | | | 182,935 | |
| | | | | | | | 1,834,642 | |
Forest Products & Paper — 0.1% |
International Paper Co. (a) | | | 1,364 | | | | 57,056 | |
Iron & Steel — 0.1% |
Nucor Corp. (a) | | | 927 | | | | 96,788 | |
Mining — 0.3% |
Freeport-McMoRan, Inc. (a) | | | 5,003 | | | | 146,388 | |
Newmont Corp. (a) | | | 2,713 | | | | 161,884 | |
| | | | | | | | 308,272 | |
| | | | | | | | 2,296,758 | |
Communications — 12.8% |
Advertising — 0.1% |
The Interpublic Group of Cos., Inc. (a) | | | 1,250 | | | | 34,413 | |
Omnicom Group, Inc. (a) | | | 699 | | | | 44,463 | |
| | | | | | | | 78,876 | |
Internet — 9.0% |
Alphabet, Inc. Class A (a) (b) | | | 1,052 | | | | 2,292,581 | |
Alphabet, Inc. Class C (a) (b) | | | 943 | | | | 2,062,765 | |
Amazon.com, Inc. (a) (b) | | | 30,291 | | | | 3,217,207 | |
Booking Holdings, Inc. (a) (b) | | | 140 | | | | 244,859 | |
CDW Corp. (a) | | | 445 | | | | 70,114 | |
eBay, Inc. (a) | | | 1,955 | | | | 81,465 | |
Etsy, Inc. (a) (b) | | | 430 | | | | 31,480 | |
Expedia Group, Inc. (a) (b) | | | 508 | | | | 48,174 | |
F5, Inc. (a) (b) | | | 212 | | | | 32,444 | |
Match Group, Inc. (a) (b) | | | 1,004 | | | | 69,969 | |
| | | Number of
Shares | | | Value | |
Meta Platforms, Inc. Class A (a) (b) | | | 7,943 | | | $ | 1,280,809 | |
Netflix, Inc. (a) (b) | | | 1,546 | | | | 270,349 | |
NortonLifeLock, Inc. (a) | | | 1,956 | | | | 42,954 | |
Twitter, Inc. (a) (b) | | | 2,707 | | | | 101,215 | |
VeriSign, Inc. (a) (b) | | | 313 | | | | 52,374 | |
| | | | | | | | 9,898,759 | |
Media — 1.5% |
Charter Communications, Inc. Class A (a) (b) | | | 403 | | | | 188,818 | |
Comcast Corp. Class A (a) | | | 15,353 | | | | 602,452 | |
DISH Network Corp. Class A (a) (b) | | | 884 | | | | 15,850 | |
FactSet Research Systems, Inc. (a) | | | 130 | | | | 49,994 | |
Fox Corp. Class A (a) | | | 778 | | | | 25,020 | |
Fox Corp. Class B (a) | | | 818 | | | | 24,295 | |
News Corp. Class A (a) | | | 837 | | | | 13,040 | |
News Corp. Class B (a) | | | 1,083 | | | | 17,209 | |
Paramount Global Class B (a) | | | 2,050 | | | | 50,594 | |
The Walt Disney Co. (a) (b) | | | 6,338 | | | | 598,307 | |
Warner Bros Discovery, Inc. (a) (b) | | | 7,756 | | | | 104,086 | |
| | | | | | | | 1,689,665 | |
Telecommunications — 2.2% |
Arista Networks, Inc. (a) (b) | | | 760 | | | | 71,242 | |
AT&T, Inc. (a) | | | 24,884 | | | | 521,569 | |
Cisco Systems, Inc. (a) | | | 14,345 | | | | 611,671 | |
Corning, Inc. (a) | | | 2,701 | | | | 85,109 | |
Juniper Networks, Inc. (a) | | | 1,049 | | | | 29,897 | |
Lumen Technologies, Inc. (a) | | | 3,054 | | | | 33,319 | |
Motorola Solutions, Inc. (a) | | | 599 | | | | 125,550 | |
T-Mobile US, Inc. (a) (b) | | | 2,008 | | | | 270,156 | |
Verizon Communications, Inc. (a) | | | 14,594 | | | | 740,645 | |
| | | | | | | | 2,489,158 | |
| | | | | | | | 14,156,458 | |
Consumer, Cyclical — 9.1% |
Airlines — 0.2% |
Alaska Air Group, Inc. (a) (b) | | | 399 | | | | 15,980 | |
American Airlines Group, Inc. (a) (b) | | | 2,059 | | | | 26,108 | |
Delta Air Lines, Inc. (a) (b) | | | 2,283 | | | | 66,139 | |
Southwest Airlines Co. (a) (b) | | | 2,149 | | | | 77,622 | |
United Airlines Holdings, Inc. (a) (b) | | | 1,174 | | | | 41,583 | |
| | | | | | | | 227,432 | |
Apparel — 0.5% |
NIKE, Inc. Class B (a) | | | 4,394 | | | | 449,067 | |
PVH Corp. (a) | | | 214 | | | | 12,177 | |
Ralph Lauren Corp. (a) | | | 181 | | | | 16,227 | |
Tapestry, Inc. (a) | | | 845 | | | | 25,789 | |
VF Corp. (a) | | | 1,144 | | | | 50,530 | |
| | | | | | | | 553,790 | |
The accompanying notes are an integral part of the financial statements.
70
MML Managed Volatility Fund – Portfolio of Investments (Continued) |
| | | Number of
Shares | | | Value | |
Auto Manufacturers — 2.2% |
Cummins, Inc. (a) | | | 492 | | | $ | 95,217 | |
Ford Motor Co. (a) | | | 13,447 | | | | 149,665 | |
General Motors Co. (a) (b) | | | 5,093 | | | | 161,754 | |
PACCAR, Inc. (a) | | | 1,241 | | | | 102,184 | |
Tesla, Inc. (a) (b) | | | 2,906 | | | | 1,956,958 | |
| | | | | | | | 2,465,778 | |
Auto Parts & Equipment — 0.1% |
Aptiv PLC (a) (b) | | | 966 | | | | 86,042 | |
BorgWarner, Inc. (a) | | | 879 | | | | 29,332 | |
| | | | | | | | 115,374 | |
Distribution & Wholesale — 0.3% |
Copart, Inc. (a) (b) | | | 724 | | | | 78,670 | |
Fastenal Co. (a) | | | 2,007 | | | | 100,189 | |
LKQ Corp. (a) | | | 976 | | | | 47,912 | |
Pool Corp. (a) | | | 138 | | | | 48,470 | |
W.W. Grainger, Inc. (a) | | | 145 | | | | 65,892 | |
| | | | | | | | 341,133 | |
Entertainment — 0.1% |
Caesars Entertainment, Inc. (a) (b) | | | 688 | | | | 26,350 | |
Live Nation Entertainment, Inc. (a) (b) | | | 465 | | | | 38,400 | |
Penn National Gaming, Inc. (a) (b) | | | 582 | | | | 17,705 | |
| | | | | | | | 82,455 | |
Home Builders — 0.2% |
D.R. Horton, Inc. (a) | | | 1,071 | | | | 70,889 | |
Lennar Corp. Class A (a) | | | 945 | | | | 66,689 | |
NVR, Inc. (a) (b) | | | 11 | | | | 44,045 | |
PulteGroup, Inc. (a) | | | 882 | | | | 34,954 | |
| | | | | | | | 216,577 | |
Home Furnishing — 0.0% |
Whirlpool Corp. (a) | | | 190 | | | | 29,425 | |
Housewares — 0.0% |
Newell Brands, Inc. (a) | | | 1,346 | | | | 25,628 | |
Leisure Time — 0.1% |
Carnival Corp. (a) (b) | | | 2,613 | | | | 22,602 | |
Norwegian Cruise Line Holdings Ltd. (a) (b) | | | 1,582 | | | | 17,592 | |
Royal Caribbean Cruises Ltd. (a) (b) | | | 724 | | | | 25,275 | |
| | | | | | | | 65,469 | |
Lodging — 0.3% |
Hilton Worldwide Holdings, Inc. (a) | | | 949 | | | | 105,757 | |
Las Vegas Sands Corp. (a) (b) | | | 1,118 | | | | 37,554 | |
Marriott International, Inc. Class A (a) | | | 932 | | | | 126,761 | |
MGM Resorts International (a) | | | 1,335 | | | | 38,648 | |
Wynn Resorts Ltd. (a) (b) | | | 383 | | | | 21,823 | |
| | | | | | | | 330,543 | |
| | | Number of
Shares | | | Value | |
Retail — 5.1% |
Advance Auto Parts, Inc. (a) | | | 220 | | | $ | 38,080 | |
AutoZone, Inc. (a) (b) | | | 70 | | | | 150,438 | |
Bath & Body Works, Inc. (a) | | | 820 | | | | 22,074 | |
Best Buy Co., Inc. (a) | | | 729 | | | | 47,524 | |
CarMax, Inc. (a) (b) | | | 543 | | | | 49,131 | |
Chipotle Mexican Grill, Inc. (a) (b) | | | 97 | | | | 126,804 | |
Costco Wholesale Corp. (a) | | | 1,538 | | | | 737,133 | |
Darden Restaurants, Inc. (a) | | | 447 | | | | 50,565 | |
Dollar General Corp. (a) | | | 785 | | | | 192,670 | |
Dollar Tree, Inc. (a) (b) | | | 763 | | | | 118,914 | |
Domino’s Pizza, Inc. (a) | | | 127 | | | | 49,493 | |
Genuine Parts Co. (a) | | | 460 | | | | 61,180 | |
The Home Depot, Inc. (a) | | | 3,571 | | | | 979,418 | |
Lowe’s Cos., Inc. (a) | | | 2,288 | | | | 399,645 | |
McDonald’s Corp. (a) | | | 2,563 | | | | 632,753 | |
O’Reilly Automotive, Inc. (a) (b) | | | 228 | | | | 144,041 | |
Ross Stores, Inc. (a) | | | 1,228 | | | | 86,242 | |
Starbucks Corp. (a) | | | 3,987 | | | | 304,567 | |
Target Corp. (a) | | | 1,629 | | | | 230,064 | |
The TJX Cos., Inc. (a) | | | 4,075 | | | | 227,589 | |
Tractor Supply Co. (a) | | | 381 | | | | 73,857 | |
Ulta Beauty, Inc. (a) (b) | | | 182 | | | | 70,157 | |
Walgreens Boots Alliance, Inc. (a) | | | 2,526 | | | | 95,735 | |
Walmart, Inc. (a) | | | 4,874 | | | | 592,581 | |
Yum! Brands, Inc. (a) | | | 986 | | | | 111,921 | |
| | | | | | | | 5,592,576 | |
Toys, Games & Hobbies — 0.0% |
Hasbro, Inc. (a) | | | 432 | | | | 35,372 | |
| | | | | | | | 10,081,552 | |
Consumer, Non-cyclical — 22.6% |
Agriculture — 0.9% |
Altria Group, Inc. (a) | | | 6,164 | | | | 257,470 | |
Archer-Daniels-Midland Co. (a) | | | 1,971 | | | | 152,950 | |
Philip Morris International, Inc. (a) | | | 5,400 | | | | 533,196 | |
| | | | | | | | 943,616 | |
Beverages — 1.9% |
Brown-Forman Corp. Class B (a) | | | 604 | | | | 42,377 | |
The Coca-Cola Co. (a) | | | 13,527 | | | | 850,984 | |
Constellation Brands, Inc. Class A (a) | | | 575 | | | | 134,009 | |
Keurig Dr Pepper, Inc. (a) | | | 2,626 | | | | 92,934 | |
Molson Coors Beverage Co. Class B (a) | | | 613 | | | | 33,415 | |
Monster Beverage Corp. (a) (b) | | | 1,265 | | | | 117,265 | |
PepsiCo, Inc. (a) | | | 4,798 | | | | 799,635 | |
| | | | | | | | 2,070,619 | |
The accompanying notes are an integral part of the financial statements.
71
MML Managed Volatility Fund – Portfolio of Investments (Continued) |
| | | Number of
Shares | | | Value | |
Biotechnology — 1.6% |
Amgen, Inc. (a) | | | 1,853 | | | $ | 450,835 | |
Bio-Rad Laboratories, Inc. Class A (a) (b) | | | 72 | | | | 35,640 | |
Biogen, Inc. (a) (b) | | | 517 | | | | 105,437 | |
Corteva, Inc. (a) | | | 2,466 | | | | 133,509 | |
Gilead Sciences, Inc. (a) | | | 4,364 | | | | 269,739 | |
Illumina, Inc. (a) (b) | | | 530 | | | | 97,711 | |
Incyte Corp. (a) (b) | | | 626 | | | | 47,557 | |
Moderna, Inc. (a) (b) | | | 1,173 | | | | 167,563 | |
Regeneron Pharmaceuticals, Inc. (a) (b) | | | 375 | | | | 221,674 | |
Vertex Pharmaceuticals, Inc. (a) (b) | | | 889 | | | | 250,511 | |
| | | | | | | | 1,780,176 | |
Commercial Services — 1.7% |
Automatic Data Processing, Inc. (a) | | | 1,434 | | | | 301,197 | |
Cintas Corp. (a) | | | 309 | | | | 115,421 | |
Equifax, Inc. (a) | | | 407 | | | | 74,391 | |
FleetCor Technologies, Inc. (a) (b) | | | 267 | | | | 56,099 | |
Gartner, Inc. (a) (b) | | | 277 | | | | 66,987 | |
Global Payments, Inc. (a) | | | 962 | | | | 106,436 | |
MarketAxess Holdings, Inc. (a) | | | 123 | | | | 31,489 | |
Moody’s Corp. (a) | | | 566 | | | | 153,935 | |
Nielsen Holdings PLC (a) | | | 1,135 | | | | 26,355 | |
PayPal Holdings, Inc. (a) (b) | | | 3,976 | | | | 277,684 | |
Quanta Services, Inc. (a) | | | 518 | | | | 64,926 | |
Robert Half International, Inc. (a) | | | 357 | | | | 26,736 | |
Rollins, Inc. (a) | | | 750 | | | | 26,190 | |
S&P Global, Inc. (a) | | | 1,205 | | | | 406,157 | |
United Rentals, Inc. (a) (b) | | | 243 | | | | 59,027 | |
Verisk Analytics, Inc. (a) | | | 563 | | | | 97,450 | |
| | | | | | | | 1,890,480 | |
Cosmetics & Personal Care — 1.5% |
Colgate-Palmolive Co. (a) | | | 2,914 | | | | 233,528 | |
The Estee Lauder Cos., Inc. Class A (a) | | | 797 | | | | 202,972 | |
The Procter & Gamble Co. (a) | | | 8,313 | | | | 1,195,326 | |
| | | | | | | | 1,631,826 | |
Food — 1.2% |
Campbell Soup Co. (a) | | | 671 | | | | 32,242 | |
Conagra Brands, Inc. (a) | | | 1,779 | | | | 60,913 | |
General Mills, Inc. (a) | | | 2,066 | | | | 155,880 | |
The Hershey Co. (a) | | | 487 | | | | 104,783 | |
Hormel Foods Corp. (a) | | | 937 | | | | 44,376 | |
The J.M. Smucker Co. (a) | | | 391 | | | | 50,052 | |
Kellogg Co. (a) | | | 909 | | | | 64,848 | |
The Kraft Heinz Co. (a) | | | 2,390 | | | | 91,155 | |
The Kroger Co. (a) | | | 2,262 | | | | 107,060 | |
| | | Number of
Shares | | | Value | |
Lamb Weston Holdings, Inc. (a) | | | 473 | | | $ | 33,801 | |
McCormick & Co., Inc. (a) | | | 913 | | | | 76,007 | |
Mondelez International, Inc. Class A (a) | | | 4,703 | | | | 292,009 | |
Sysco Corp. (a) | | | 1,743 | | | | 147,649 | |
Tyson Foods, Inc. Class A (a) | | | 984 | | | | 84,683 | |
| | | | | | | | 1,345,458 | |
Health Care – Products — 3.9% |
Abbott Laboratories (a) | | | 6,080 | | | | 660,592 | |
ABIOMED, Inc. (a) (b) | | | 157 | | | | 38,859 | |
Align Technology, Inc. (a) (b) | | | 249 | | | | 58,931 | |
Baxter International, Inc. (a) | | | 1,721 | | | | 110,540 | |
Bio-Techne Corp. (a) | | | 130 | | | | 45,063 | |
Boston Scientific Corp. (a) (b) | | | 4,885 | | | | 182,064 | |
The Cooper Cos., Inc. (a) | | | 180 | | | | 56,362 | |
Danaher Corp. (a) | | | 2,248 | | | | 569,913 | |
Dentsply Sirona, Inc. (a) | | | 744 | | | | 26,583 | |
Edwards Lifesciences Corp. (a) (b) | | | 2,185 | | | | 207,772 | |
Henry Schein, Inc. (a) (b) | | | 480 | | | | 36,835 | |
Hologic, Inc. (a) (b) | | | 865 | | | | 59,944 | |
IDEXX Laboratories, Inc. (a) (b) | | | 286 | | | | 100,309 | |
Intuitive Surgical, Inc. (a) (b) | | | 1,254 | | | | 251,690 | |
Medtronic PLC (a) | | | 4,662 | | | | 418,414 | |
PerkinElmer, Inc. (a) | | | 421 | | | | 59,875 | |
ResMed, Inc. (a) | | | 518 | | | | 108,588 | |
Steris PLC (a) | | | 346 | | | | 71,328 | |
Stryker Corp. (a) | | | 1,146 | | | | 227,974 | |
Teleflex, Inc. (a) | | | 159 | | | | 39,090 | |
Thermo Fisher Scientific, Inc. (a) | | | 1,358 | | | | 737,774 | |
Waters Corp. (a) (b) | | | 213 | | | | 70,499 | |
West Pharmaceutical Services, Inc. (a) | | | 254 | | | | 76,802 | |
Zimmer Biomet Holdings, Inc. (a) | | | 698 | | | | 73,332 | |
| | | | | | | | 4,289,133 | |
Health Care – Services — 2.8% |
Catalent, Inc. (a) (b) | | | 611 | | | | 65,554 | |
Centene Corp. (a) (b) | | | 2,003 | | | | 169,474 | |
Charles River Laboratories International, Inc. (a) (b) | | | 173 | | | | 37,017 | |
DaVita, Inc. (a) (b) | | | 189 | | | | 15,112 | |
Elevance Health, Inc. (a) | | | 827 | | | | 399,094 | |
HCA Healthcare, Inc. (a) | | | 812 | | | | 136,465 | |
Humana, Inc. (a) | | | 436 | | | | 204,078 | |
IQVIA Holdings, Inc. (a) (b) | | | 657 | | | | 142,562 | |
Laboratory Corp. of America Holdings (a) | | | 313 | | | | 73,355 | |
Molina Healthcare, Inc. (a) (b) | | | 203 | | | | 56,761 | |
Quest Diagnostics, Inc. (a) | | | 422 | | | | 56,118 | |
UnitedHealth Group, Inc. (a) | | | 3,254 | | | | 1,671,352 | |
The accompanying notes are an integral part of the financial statements.
72
MML Managed Volatility Fund – Portfolio of Investments (Continued) |
| | | Number of
Shares | | | Value | |
Universal Health Services, Inc. Class B (a) | | | 225 | | | $ | 22,660 | |
| | | | | | | | 3,049,602 | |
Household Products & Wares — 0.3% |
Avery Dennison Corp. (a) | | | 274 | | | | 44,352 | |
Church & Dwight Co., Inc. (a) | | | 863 | | | | 79,966 | |
The Clorox Co. (a) | | | 440 | | | | 62,031 | |
Kimberly-Clark Corp. (a) | | | 1,174 | | | | 158,666 | |
| | | | | | | | 345,015 | |
Pharmaceuticals — 6.8% |
AbbVie, Inc. (a) | | | 6,120 | | | | 937,339 | |
AmerisourceBergen Corp. (a) | | | 501 | | | | 70,882 | |
Becton Dickinson and Co. (a) | | | 995 | | | | 245,297 | |
Bristol-Myers Squibb Co. (a) | | | 7,389 | | | | 568,953 | |
Cardinal Health, Inc. (a) | | | 912 | | | | 47,670 | |
Cigna Corp. (a) | | | 1,103 | | | | 290,663 | |
CVS Health Corp. (a) | | | 4,566 | | | | 423,086 | |
DexCom, Inc. (a) (b) | | | 1,377 | | | | 102,628 | |
Eli Lilly & Co. (a) | | | 2,734 | | | | 886,445 | |
Johnson & Johnson (a) | | | 9,120 | | | | 1,618,891 | |
McKesson Corp. (a) | | | 509 | | | | 166,041 | |
Merck & Co., Inc. (a) | | | 8,766 | | | | 799,196 | |
Organon & Co. (a) | | | 877 | | | | 29,599 | |
Pfizer, Inc. (a) | | | 19,449 | | | | 1,019,711 | |
Viatris, Inc. (a) | | | 4,019 | | | | 42,079 | |
Zoetis, Inc. (a) | | | 1,614 | | | | 277,430 | |
| | | | | | | | 7,525,910 | |
| | | | | | | | 24,871,835 | |
Energy — 4.5% |
Energy – Alternate Sources — 0.1% |
Enphase Energy, Inc. (a) (b) | | | 458 | | | | 89,420 | |
SolarEdge Technologies, Inc. (a) (b) | | | 194 | | | | 53,094 | |
| | | | | | | | 142,514 | |
Oil & Gas — 3.7% |
APA Corp. (a) | | | 1,210 | | | | 42,229 | |
Chevron Corp. (a) | | | 6,805 | | | | 985,228 | |
ConocoPhillips (a) | | | 4,493 | | | | 403,516 | |
Coterra Energy, Inc. (a) | | | 2,739 | | | | 70,639 | |
Devon Energy Corp. (a) | | | 2,147 | | | | 118,321 | |
Diamondback Energy, Inc. (a) | | | 572 | | | | 69,298 | |
EOG Resources, Inc. (a) | | | 1,996 | | | | 220,438 | |
Exxon Mobil Corp. (a) | | | 14,590 | | | | 1,249,487 | |
Hess Corp. (a) | | | 973 | | | | 103,080 | |
Marathon Oil Corp. (a) | | | 2,698 | | | | 60,651 | |
Marathon Petroleum Corp. (a) | | | 1,885 | | | | 154,966 | |
Occidental Petroleum Corp. (a) | | | 3,090 | | | | 181,939 | |
Phillips 66 (a) | | | 1,684 | | | | 138,071 | |
Pioneer Natural Resources Co. (a) | | | 774 | | | | 172,664 | |
| | | Number of
Shares | | | Value | |
Valero Energy Corp. (a) | | | 1,388 | | | $ | 147,517 | |
| | | | | | | | 4,118,044 | |
Oil & Gas Services — 0.4% |
Baker Hughes Co. (a) | | | 3,271 | | | | 94,434 | |
Halliburton Co. (a) | | | 3,145 | | | | 98,627 | |
Schlumberger NV (a) | | | 4,936 | | | | 176,511 | |
| | | | | | | | 369,572 | |
Pipelines — 0.3% |
Kinder Morgan, Inc. (a) | | | 6,673 | | | | 111,839 | |
ONEOK, Inc. (a) | | | 1,477 | | | | 81,974 | |
The Williams Cos., Inc. (a) | | | 4,151 | | | | 129,553 | |
| | | | | | | | 323,366 | |
| | | | | | | | 4,953,496 | |
Financial — 15.0% |
Banks — 4.6% |
Bank of America Corp. (a) | | | 24,645 | | | | 767,199 | |
The Bank of New York Mellon Corp. (a) | | | 2,485 | | | | 103,649 | |
Citigroup, Inc. (a) | | | 6,725 | | | | 309,283 | |
Citizens Financial Group, Inc. (a) | | | 1,803 | | | | 64,349 | |
Comerica, Inc. (a) | | | 420 | | | | 30,820 | |
Fifth Third Bancorp (a) | | | 2,460 | | | | 82,656 | |
First Republic Bank (a) | | | 651 | | | | 93,874 | |
The Goldman Sachs Group, Inc. (a) | | | 1,192 | | | | 354,048 | |
Huntington Bancshares, Inc. (a) | | | 4,977 | | | | 59,873 | |
JP Morgan Chase & Co. (a) | | | 10,191 | | | | 1,147,608 | |
KeyCorp. (a) | | | 3,164 | | | | 54,516 | |
M&T Bank Corp. (a) | | | 630 | | | | 100,416 | |
Morgan Stanley (a) | | | 4,826 | | | | 367,065 | |
Northern Trust Corp. (a) | | | 747 | | | | 72,071 | |
The PNC Financial Services Group, Inc. (a) | | | 1,422 | | | | 224,349 | |
Regions Financial Corp. (a) | | | 3,148 | | | | 59,025 | |
Signature Bank (a) | | | 210 | | | | 37,634 | |
State Street Corp. (a) | | | 1,228 | | | | 75,706 | |
SVB Financial Group (a) (b) | | | 198 | | | | 78,208 | |
Truist Financial Corp. (a) | | | 4,502 | | | | 213,530 | |
US Bancorp (a) | | | 4,604 | | | | 211,876 | |
Wells Fargo & Co. (a) | | | 13,192 | | | | 516,731 | |
Zions Bancorp NA (a) | | | 473 | | | | 24,076 | |
| | | | | | | | 5,048,562 | |
Diversified Financial Services — 3.7% |
American Express Co. (a) | | | 2,091 | | | | 289,854 | |
Ameriprise Financial, Inc. (a) | | | 369 | | | | 87,704 | |
BlackRock, Inc. (a) | | | 499 | | | | 303,911 | |
Capital One Financial Corp. (a) | | | 1,397 | | | | 145,553 | |
Cboe Global Markets, Inc. (a) | | | 369 | | | | 41,767 | |
The Charles Schwab Corp. (a) | | | 5,239 | | | | 331,000 | |
The accompanying notes are an integral part of the financial statements.
73
MML Managed Volatility Fund – Portfolio of Investments (Continued) |
| | | Number of
Shares | | | Value | |
CME Group, Inc. (a) | | | 1,228 | | | $ | 251,372 | |
Discover Financial Services (a) | | | 965 | | | | 91,270 | |
Franklin Resources, Inc. (a) | | | 962 | | | | 22,424 | |
Intercontinental Exchange, Inc. (a) | | | 1,947 | | | | 183,096 | |
Invesco Ltd. (a) | | | 1,134 | | | | 18,291 | |
Mastercard, Inc. Class A (a) | | | 2,975 | | | | 938,553 | |
Nasdaq, Inc. (a) | | | 416 | | | | 63,457 | |
Raymond James Financial, Inc. (a) | | | 703 | | | | 62,855 | |
Synchrony Financial (a) | | | 1,845 | | | | 50,959 | |
T. Rowe Price Group, Inc. (a) | | | 754 | | | | 85,662 | |
Visa, Inc. Class A (a) | | | 5,702 | | | | 1,122,667 | |
| | | | | | | | 4,090,395 | |
Insurance — 3.8% |
Aflac, Inc. (a) | | | 2,002 | | | | 110,771 | |
The Allstate Corp. (a) | | | 960 | | | | 121,661 | |
American International Group, Inc. (a) | | | 2,814 | | | | 143,880 | |
Aon PLC Class A (a) | | | 728 | | | | 196,327 | |
Arthur J Gallagher & Co. (a) | | | 714 | | | | 116,411 | |
Assurant, Inc. (a) | | | 169 | | | | 29,212 | |
Berkshire Hathaway, Inc. Class B (a) (b) | | | 6,259 | | | | 1,708,832 | |
Brown & Brown, Inc. (a) | | | 866 | | | | 50,522 | |
Chubb Ltd. (a) | | | 1,468 | | | | 288,579 | |
Cincinnati Financial Corp. (a) | | | 499 | | | | 59,371 | |
Everest Re Group Ltd. (a) | | | 134 | | | | 37,558 | |
Globe Life, Inc. (a) | | | 335 | | | | 32,652 | |
The Hartford Financial Services Group, Inc. (a) | | | 1,171 | | | | 76,619 | |
Lincoln National Corp. (a) | | | 583 | | | | 27,267 | |
Loews Corp. (a) | | | 650 | | | | 38,519 | |
Marsh & McLennan Cos., Inc. (a) | | | 1,722 | | | | 267,340 | |
MetLife, Inc. (a) | | | 2,353 | | | | 147,745 | |
Principal Financial Group, Inc. (a) | | | 892 | | | | 59,577 | |
The Progressive Corp. (a) | | | 1,985 | | | | 230,796 | |
Prudential Financial, Inc. (a) | | | 1,318 | | | | 126,106 | |
The Travelers Cos., Inc. (a) | | | 811 | | | | 137,164 | |
W.R. Berkley Corp. (a) | | | 767 | | | | 52,355 | |
Willis Towers Watson PLC (a) | | | 409 | | | | 80,733 | |
| | | | | | | | 4,139,997 | |
Real Estate — 0.1% |
CBRE Group, Inc. Class A (a) (b) | | | 1,145 | | | | 84,283 | |
Real Estate Investment Trusts (REITS) — 2.8% |
Alexandria Real Estate Equities, Inc. (a) | | | 504 | | | | 73,095 | |
American Tower Corp. (a) | | | 1,615 | | | | 412,778 | |
AvalonBay Communities, Inc. (a) | | | 468 | | | | 90,909 | |
Boston Properties, Inc. (a) | | | 462 | | | | 41,109 | |
Camden Property Trust (a) | | | 340 | | | | 45,723 | |
| | | Number of
Shares | | | Value | |
Crown Castle International Corp. (a) | | | 1,484 | | | $ | 249,876 | |
Digital Realty Trust, Inc. (a) | | | 1,006 | | | | 130,609 | |
Duke Realty Corp. (a) | | | 1,292 | | | | 70,995 | |
Equinix, Inc. (a) | | | 319 | | | | 209,589 | |
Equity Residential (a) | | | 1,236 | | | | 89,264 | |
Essex Property Trust, Inc. (a) | | | 247 | | | | 64,593 | |
Extra Space Storage, Inc. (a) | | | 445 | | | | 75,703 | |
Federal Realty OP LP (a) | | | 250 | | | | 23,935 | |
Healthpeak Properties, Inc. (a) | | | 2,011 | | | | 52,105 | |
Host Hotels & Resorts, Inc. (a) | | | 2,321 | | | | 36,393 | |
Iron Mountain, Inc. (a) | | | 951 | | | | 46,304 | |
Kimco Realty Corp. (a) | | | 2,138 | | | | 42,268 | |
Mid-America Apartment Communities, Inc. (a) | | | 432 | | | | 75,458 | |
Prologis, Inc. (a) | | | 2,523 | | | | 296,831 | |
Public Storage (a) | | | 516 | | | | 161,338 | |
Realty Income Corp. (a) | | | 2,125 | | | | 145,053 | |
Regency Centers Corp. (a) | | | 572 | | | | 33,925 | |
SBA Communications Corp. (a) | | | 372 | | | | 119,059 | |
Simon Property Group, Inc. (a) | | | 1,105 | | | | 104,887 | |
UDR, Inc. (a) | | | 1,150 | | | | 52,946 | |
Ventas, Inc. (a) | | | 1,322 | | | | 67,991 | |
VICI Properties, Inc. (a) | | | 3,389 | | | | 100,958 | |
Vornado Realty Trust (a) | | | 587 | | | | 16,782 | |
Welltower, Inc. (a) | | | 1,606 | | | | 132,254 | |
Weyerhaeuser Co. (a) | | | 2,519 | | | | 83,429 | |
| | | | | | | | 3,146,159 | |
| | | | | | | | 16,509,396 | |
Industrial — 7.8% |
Aerospace & Defense — 1.7% |
The Boeing Co. (a) (b) | | | 1,935 | | | | 264,553 | |
General Dynamics Corp. (a) | | | 780 | | | | 172,575 | |
Howmet Aerospace, Inc. (a) | | | 1,237 | | | | 38,904 | |
L3 Harris Technologies, Inc. (a) | | | 665 | | | | 160,731 | |
Lockheed Martin Corp. (a) | | | 825 | | | | 354,717 | |
Northrop Grumman Corp. (a) | | | 502 | | | | 240,242 | |
Raytheon Technologies Corp. (a) | | | 5,191 | | | | 498,907 | |
Teledyne Technologies, Inc. (a) (b) | | | 161 | | | | 60,393 | |
TransDigm Group, Inc. (a) (b) | | | 184 | | | | 98,747 | |
| | | | | | | | 1,889,769 | |
Building Materials — 0.4% |
Carrier Global Corp. (a) | | | 2,885 | | | | 102,879 | |
Fortune Brands Home & Security, Inc. (a) | | | 421 | | | | 25,210 | |
Johnson Controls International PLC (a) | | | 2,376 | | | | 113,763 | |
Martin Marietta Materials, Inc. (a) | | | 213 | | | | 63,738 | |
Masco Corp. (a) | | | 845 | | | | 42,757 | |
The accompanying notes are an integral part of the financial statements.
74
MML Managed Volatility Fund – Portfolio of Investments (Continued) |
| | | Number of
Shares | | | Value | |
Mohawk Industries, Inc. (a) (b) | | | 180 | | | $ | 22,336 | |
Vulcan Materials Co. (a) | | | 494 | | | | 70,197 | |
| | | | | | | | 440,880 | |
Electrical Components & Equipment — 0.3% |
AMETEK, Inc. (a) | | | 768 | | | | 84,396 | |
Emerson Electric Co. (a) | | | 2,047 | | | | 162,818 | |
Generac Holdings, Inc. (a) (b) | | | 227 | | | | 47,802 | |
| | | | | | | | 295,016 | |
Electronics — 1.1% |
Agilent Technologies, Inc. (a) | | | 1,067 | | | | 126,728 | |
Allegion PLC (a) | | | 341 | | | | 33,384 | |
Amphenol Corp. Class A (a) | | | 2,111 | | | | 135,906 | |
Fortive Corp. (a) | | | 1,197 | | | | 65,093 | |
Garmin Ltd. (a) | | | 508 | | | | 49,911 | |
Honeywell International, Inc. (a) | | | 2,345 | | | | 407,584 | |
Keysight Technologies, Inc. (a) (b) | | | 659 | | | | 90,843 | |
Mettler-Toledo International, Inc. (a) (b) | | | 79 | | | | 90,753 | |
TE Connectivity Ltd. (a) | | | 1,088 | | | | 123,107 | |
Trimble, Inc. (a) (b) | | | 824 | | | | 47,982 | |
| | | | | | | | 1,171,291 | |
Engineering & Construction — 0.1% |
Jacobs Engineering Group, Inc. (a) | | | 464 | | | | 58,988 | |
Environmental Controls — 0.3% |
Pentair PLC (a) | | | 591 | | | | 27,050 | |
Republic Services, Inc. (a) | | | 721 | | | | 94,357 | |
Waste Management, Inc. (a) | | | 1,345 | | | | 205,758 | |
| | | | | | | | 327,165 | |
Hand & Machine Tools — 0.1% |
Snap-on, Inc. (a) | | | 193 | | | | 38,027 | |
Stanley Black & Decker, Inc. (a) | | | 552 | | | | 57,883 | |
| | | | | | | | 95,910 | |
Machinery – Construction & Mining — 0.3% |
Caterpillar, Inc. (a) | | | 1,838 | | | | 328,561 | |
Machinery – Diversified — 0.7% |
Deere & Co. (a) | | | 969 | | | | 290,186 | |
Dover Corp. (a) | | | 534 | | | | 64,785 | |
IDEX Corp. (a) | | | 245 | | | | 44,499 | |
Ingersoll Rand, Inc. (a) | | | 1,477 | | | | 62,152 | |
Nordson Corp. (a) | | | 188 | | | | 38,059 | |
Otis Worldwide Corp. (a) | | | 1,431 | | | | 101,129 | |
Rockwell Automation, Inc. (a) | | | 397 | | | | 79,126 | |
Westinghouse Air Brake Technologies Corp. (a) | | | 619 | | | | 50,808 | |
Xylem, Inc. (a) | | | 596 | | | | 46,595 | |
| | | | | | | | 777,339 | |
| | | Number of
Shares | | | Value | |
Miscellaneous - Manufacturing — 1.0% |
3M Co. (a) | | | 2,022 | | | $ | 261,667 | |
A.O. Smith Corp. (a) | | | 389 | | | | 21,271 | |
Eaton Corp. PLC (a) | | | 1,415 | | | | 178,276 | |
General Electric Co. (a) | | | 3,760 | | | | 239,399 | |
Illinois Tool Works, Inc. (a) | | | 963 | | | | 175,507 | |
Parker-Hannifin Corp. (a) | | | 450 | | | | 110,722 | |
Textron, Inc. (a) | | | 723 | | | | 44,154 | |
Trane Technologies PLC (a) | | | 783 | | | | 101,688 | |
| | | | | | | | 1,132,684 | |
Packaging & Containers — 0.2% |
Amcor PLC (a) | | | 5,218 | | | | 64,860 | |
Ball Corp. (a) | | | 1,092 | | | | 75,097 | |
Packaging Corp. of America (a) | | | 329 | | | | 45,237 | |
Sealed Air Corp. (a) | | | 527 | | | | 30,418 | |
WestRock Co. (a) | | | 853 | | | | 33,984 | |
| | | | | | | | 249,596 | |
Shipbuilding — 0.0% |
Huntington Ingalls Industries, Inc. (a) | | | 127 | | | | 27,663 | |
Transportation — 1.6% |
C.H. Robinson Worldwide, Inc. (a) | | | 422 | | | | 42,778 | |
CSX Corp. (a) | | | 7,552 | | | | 219,461 | |
Expeditors International of Washington, Inc. (a) | | | 585 | | | | 57,014 | |
FedEx Corp. (a) | | | 825 | | | | 187,036 | |
J.B. Hunt Transport Services, Inc. (a) | | | 307 | | | | 48,343 | |
Norfolk Southern Corp. (a) | | | 815 | | | | 185,241 | |
Old Dominion Freight Line, Inc. (a) | | | 319 | | | | 81,753 | |
Union Pacific Corp. (a) | | | 2,159 | | | | 460,472 | |
United Parcel Service, Inc. Class B (a) | | | 2,559 | | | | 467,120 | |
| | | | | | | | 1,749,218 | |
| | | | | | | | 8,544,080 | |
Technology — 23.2% |
Computers — 8.2% |
Accenture PLC Class A (a) | | | 2,199 | | | | 610,552 | |
Apple, Inc. (a) | | | 53,236 | | | | 7,278,426 | |
Cognizant Technology Solutions Corp. Class A (a) | | | 1,831 | | | | 123,574 | |
DXC Technology Co. (a) (b) | | | 867 | | | | 26,279 | |
EPAM Systems, Inc. (a) (b) | | | 200 | | | | 58,956 | |
Fortinet, Inc. (a) (b) | | | 2,300 | | | | 130,134 | |
Hewlett Packard Enterprise Co. (a) | | | 4,575 | | | | 60,665 | |
HP, Inc. (a) | | | 3,637 | | | | 119,221 | |
International Business Machines Corp. (a) | | | 3,118 | | | | 440,230 | |
Leidos Holdings, Inc. (a) | | | 465 | | | | 46,830 | |
The accompanying notes are an integral part of the financial statements.
75
MML Managed Volatility Fund – Portfolio of Investments (Continued) |
| | | Number of
Shares | | | Value | |
NetApp, Inc. (a) | | | 764 | | | $ | 49,843 | |
Seagate Technology Holdings PLC (a) | | | 674 | | | | 48,151 | |
Western Digital Corp. (a) (b) | | | 1,035 | | | | 46,399 | |
| | | | | | | | 9,039,260 | |
Office & Business Equipment — 0.0% |
Zebra Technologies Corp. Class A (a) (b) | | | 183 | | | | 53,793 | |
Semiconductors — 5.1% |
Advanced Micro Devices, Inc. (a) (b) | | | 5,618 | | | | 429,609 | |
Analog Devices, Inc. (a) | | | 1,831 | | | | 267,491 | |
Applied Materials, Inc. (a) | | | 3,033 | | | | 275,942 | |
Broadcom, Inc. (a) | | | 1,416 | | | | 687,907 | |
Intel Corp. (a) | | | 14,184 | | | | 530,624 | |
KLA Corp. (a) | | | 509 | | | | 162,412 | |
Lam Research Corp. (a) | | | 478 | | | | 203,700 | |
Microchip Technology, Inc. (a) | | | 1,867 | | | | 108,435 | |
Micron Technology, Inc. (a) | | | 3,811 | | | | 210,672 | |
Monolithic Power Systems, Inc. (a) | | | 156 | | | | 59,910 | |
NVIDIA Corp. (a) | | | 8,675 | | | | 1,315,043 | |
NXP Semiconductor NV (a) | | | 922 | | | | 136,484 | |
ON Semiconductor Corp. (a) (b) | | | 1,527 | | | | 76,823 | |
Qorvo, Inc. (a) (b) | | | 382 | | | | 36,030 | |
QUALCOMM, Inc. (a) | | | 3,887 | | | | 496,525 | |
Skyworks Solutions, Inc. (a) | | | 529 | | | | 49,007 | |
Teradyne, Inc. (a) | | | 566 | | | | 50,685 | |
Texas Instruments, Inc. (a) | | | 3,205 | | | | 492,448 | |
| | | | | | | | 5,589,747 | |
Software — 9.9% |
Activision Blizzard, Inc. (a) | | | 2,713 | | | | 211,234 | |
Adobe, Inc. (a) (b) | | | 1,639 | | | | 599,972 | |
Akamai Technologies, Inc. (a) (b) | | | 541 | | | | 49,410 | |
ANSYS, Inc. (a) (b) | | | 299 | | | | 71,548 | |
Autodesk, Inc. (a) (b) | | | 756 | | | | 130,002 | |
Broadridge Financial Solutions, Inc. (a) | | | 428 | | | | 61,011 | |
Cadence Design Systems, Inc. (a) (b) | | | 939 | | | | 140,878 | |
Ceridian HCM Holding, Inc. (a) (b) | | | 474 | | | | 22,316 | |
Citrix Systems, Inc. (a) | | | 439 | | | | 42,658 | |
Electronic Arts, Inc. (a) | | | 952 | | | | 115,811 | |
Fidelity National Information Services, Inc. (a) | | | 2,127 | | | | 194,982 | |
Fiserv, Inc. (a) (b) | | | 2,030 | | | | 180,609 | |
Intuit, Inc. (a) | | | 984 | | | | 379,273 | |
Jack Henry & Associates, Inc. (a) | | | 242 | | | | 43,565 | |
Microsoft Corp. (a) | | | 25,892 | | | | 6,649,842 | |
MSCI, Inc. (a) | | | 278 | | | | 114,578 | |
Oracle Corp. (a) | | | 5,462 | | | | 381,630 | |
Paychex, Inc. (a) | | | 1,101 | | | | 125,371 | |
| | | Number of
Shares | | | Value | |
Paycom Software, Inc. (a) (b) | | | 174 | | | $ | 48,741 | |
PTC, Inc. (a) (b) | | | 360 | | | | 38,282 | |
Roper Technologies, Inc. (a) | | | 360 | | | | 142,074 | |
Salesforce, Inc. (a) (b) | | | 3,446 | | | | 568,728 | |
ServiceNow, Inc. (a) (b) | | | 698 | | | | 331,913 | |
Synopsys, Inc. (a) (b) | | | 536 | | | | 162,783 | |
Take-Two Interactive Software, Inc. (a) (b) | | | 554 | | | | 67,882 | |
Tyler Technologies, Inc. (a) (b) | | | 142 | | | | 47,212 | |
| | | | | | | | 10,922,305 | |
| | | | | | | | 25,605,105 | |
Utilities — 3.1% |
Electric — 2.9% |
AES Corp. (a) | | | 2,230 | | | | 46,852 | |
Alliant Energy Corp. (a) | | | 987 | | | | 57,848 | |
Ameren Corp. (a) | | | 892 | | | | 80,601 | |
American Electric Power Co., Inc. (a) | | | 1,729 | | | | 165,880 | |
CenterPoint Energy, Inc. (a) | | | 2,278 | | | | 67,383 | |
CMS Energy Corp. (a) | | | 919 | | | | 62,032 | |
Consolidated Edison, Inc. (a) | | | 1,278 | | | | 121,538 | |
Constellation Energy Corp. (a) | | | 1,146 | | | | 65,620 | |
Dominion Energy, Inc. (a) | | | 2,764 | | | | 220,595 | |
DTE Energy Co. (a) | | | 631 | | | | 79,979 | |
Duke Energy Corp. (a) | | | 2,690 | | | | 288,395 | |
Edison International (a) | | | 1,290 | | | | 81,580 | |
Entergy Corp. (a) | | | 718 | | | | 80,875 | |
Evergy, Inc. (a) | | | 855 | | | | 55,789 | |
Eversource Energy (a) | | | 1,123 | | | | 94,860 | |
Exelon Corp. (a) | | | 3,437 | | | | 155,765 | |
FirstEnergy Corp. (a) | | | 2,007 | | | | 77,049 | |
NextEra Energy, Inc. (a) | | | 6,821 | | | | 528,355 | |
NRG Energy, Inc. (a) | | | 802 | | | | 30,612 | |
Pinnacle West Capital Corp. (a) | | | 364 | | | | 26,616 | |
PPL Corp. (a) | | | 2,650 | | | | 71,894 | |
Public Service Enterprise Group, Inc. (a) | | | 1,781 | | | | 112,702 | |
Sempra Energy (a) | | | 1,085 | | | | 163,043 | |
The Southern Co. (a) | | | 3,729 | | | | 265,915 | |
WEC Energy Group, Inc. (a) | | | 1,083 | | | | 108,993 | |
Xcel Energy, Inc. (a) | | | 1,797 | | | | 127,156 | |
| | | | | | | | 3,237,927 | |
Gas — 0.1% |
Atmos Energy Corp. (a) | | | 483 | | | | 54,144 | |
NiSource, Inc. (a) | | | 1,431 | | | | 42,200 | |
| | | | | | | | 96,344 | |
The accompanying notes are an integral part of the financial statements.
76
MML Managed Volatility Fund – Portfolio of Investments (Continued) |
| | | Number of
Shares | | | Value | |
Water — 0.1% |
American Water Works Co., Inc. (a) | | | 628 | | | $ | 93,428 | |
| | | | | | | | 3,427,699 | |
| | | | | | | | | |
TOTAL COMMON STOCK (Cost $73,361,929) | | | | | | | 110,446,379 | |
| | | | | | | | | |
TOTAL EQUITIES (Cost $73,361,929) | | | | | | | 110,446,379 | |
| | | Principal
Amount | | | | | |
BONDS & NOTES — 0.0% |
CORPORATE DEBT — 0.0% |
Forest Products & Paper — 0.0% |
Sino Forest Corp. 5.000% 8/01/49 (a) (c) (d) | | $ | 359,000 | | | | — | |
| | | | | | | | | |
TOTAL CORPORATE DEBT (Cost $0) | | | | | | | — | |
| | | | | | | | | |
TOTAL BONDS & NOTES (Cost $0) | | | | | | | — | |
| | | | | | | | | |
TOTAL PURCHASED OPTIONS (#) — 1.7% (Cost $1,691,613) | | | | | | | 1,915,377 | |
| | | | | | | | | |
TOTAL LONG-TERM INVESTMENTS (Cost $75,053,542) | | | | | | | 112,361,756 | |
| | | Principal
Amount | | | Value | |
| SHORT-TERM INVESTMENTS — 2.5% |
| Repurchase Agreement — 2.5% |
| Fixed Income Clearing Corp., Repurchase Agreement, dated 6/30/22, 0.240%, due 7/01/22 (e) | | $ | 2,791,292 | | | $ | 2,791,292 | |
| | | | | | | | | |
| TOTAL SHORT-TERM INVESTMENTS (Cost $2,791,292) | | | | | | | 2,791,292 | |
| | | | | | | | | |
| TOTAL INVESTMENTS — 104.4% (Cost $77,844,834) (f) | | | | | | | 115,153,048 | |
| | | | | | | | | |
| Other Assets/(Liabilities) — (4.4)% | | | | | | | (4,888,877 | ) |
| | | | | | | | | |
| NET ASSETS — 100.0% | | | | | | $ | 110,264,171 | |
Notes to Portfolio of Investments
Percentages are stated as a percent of net assets.
(a) | All or a portion of this security is pledged/held as collateral for open derivatives. (Note 2). |
(b) | Non-income producing security. |
(c) | Investment was valued using significant unobservable inputs. |
(d) | This security is fair valued in good faith in accordance with procedures approved by the Board of Trustees. At June 30, 2022, these securities amounted to a value of $0 or 0.00% of net assets. |
(e) | Maturity value of $2,791,311. Collateralized by U.S. Government Agency obligations with a rate of 3.000%, maturity date of 6/30/24, and an aggregate market value, including accrued interest, of $2,847,182. |
(f) | See Note 6 for aggregate cost for federal tax purposes. |
(#) Exchange-Traded Options Purchased
Description | | Expiration
Date | | | Exercise
Price | | | No. of
Contracts | | | Notional
Amount | | | Value | | | Premiums
Paid
(Received) | | | Unrealized
Appreciation/
(Depreciation) | |
Put | | | | | | | | | | | | | | | | | | | | | | | | | | | | | | | | |
S&P 500 Index | | | 9/16/22 | | | | 3,300.00 | | | | 41 | | | | USD | | | | 13,530,000 | | | $ | 204,877 | | | $ | 306,701 | | | $ | (101,824 | ) |
S&P 500 Index | | | 9/16/22 | | | | 3,400.00 | | | | 41 | | | | USD | | | | 13,940,000 | | | | 264,450 | | | | 364,141 | | | | (99,691 | ) |
S&P 500 Index | | | 9/16/22 | | | | 3,600.00 | | | | 41 | | | | USD | | | | 14,760,000 | | | | 457,560 | | | | 318,755 | | | | 138,805 | |
S&P 500 Index | | | 10/21/22 | | | | 3,325.00 | | | | 43 | | | | USD | | | | 14,297,500 | | | | 316,910 | | | | 292,077 | | | | 24,833 | |
S&P 500 Index | | | 11/18/22 | | | | 3,600.00 | | | | 41 | | | | USD | | | | 14,760,000 | | | | 671,580 | | | | 409,939 | | | | 261,641 | |
| | | | | | | | | | | | | | | | | | | | | | | $ | 1,915,377 | | | $ | 1,691,613 | | | $ | 223,764 | |
The accompanying notes are an integral part of the financial statements.
77
MML Managed Volatility Fund – Portfolio of Investments (Continued) |
Exchange-Traded Options Written
Description | | Expiration
Date | | | Exercise
Price | | | No. of
Contracts | | | Notional
Amount | | | Value | | | Premiums
Paid
(Received) | | | Unrealized
Appreciation/
(Depreciation) | |
Call | | | | | | | | | | | | | | | | | | | | | | | | | | | | | | | | |
S&P 500 Index | | | 7/15/22 | | | | 3,825.00 | | | | 32 | | | | USD | | | | 12,240,000 | | | $ | (175,040 | ) | | $ | (317,360 | ) | | $ | 142,320 | |
S&P 500 Index | | | 7/15/22 | | | | 3,850.00 | | | | 33 | | | | USD | | | | 12,705,000 | | | | (140,250 | ) | | | (350,965 | ) | | | 210,715 | |
S&P 500 Index | | | 7/15/22 | | | | 3,975.00 | | | | 32 | | | | USD | | | | 12,720,000 | | | | (40,000 | ) | | | (285,765 | ) | | | 245,765 | |
S&P 500 Index | | | 7/15/22 | | | | 4,100.00 | | | | 32 | | | | USD | | | | 13,120,000 | | | | (8,000 | ) | | | (297,209 | ) | | | 289,209 | |
S&P 500 Index | | | 7/15/22 | | | | 4,200.00 | | | | 32 | | | | USD | | | | 13,440,000 | | | | (2,720 | ) | | | (317,981 | ) | | | 315,261 | |
S&P 500 Index | | | 7/29/22 | | | | 3,725.00 | | | | 32 | | | | USD | | | | 11,920,000 | | | | (452,800 | ) | | | (360,273 | ) | | | (92,527 | ) |
S&P 500 Index | | | 7/29/22 | | | | 3,800.00 | | | | 33 | | | | USD | | | | 12,540,000 | | | | (323,961 | ) | | | (302,576 | ) | | | (21,385 | ) |
S&P 500 Index | | | 8/19/22 | | | | 3,975.00 | | | | 32 | | | | USD | | | | 12,720,000 | | | | (171,456 | ) | | | (219,120 | ) | | | 47,664 | |
S&P 500 Index | | | 8/19/22 | | | | 4,000.00 | | | | 32 | | | | USD | | | | 12,800,000 | | | | (146,048 | ) | | | (413,295 | ) | | | 267,247 | |
| | | | | | | | | | | | | | | | | | | | | | | $ | (1,460,275 | ) | | $ | (2,864,544 | ) | | $ | 1,404,269 | |
Currency Legend
The accompanying notes are an integral part of the financial statements.
78
MML Mid Cap Growth Fund – Portfolio of Investments |
June 30, 2022 (Unaudited) |
| | | Number of
Shares | | | Value | |
EQUITIES — 95.7% |
COMMON STOCK — 95.2% |
Basic Materials — 0.5% |
Chemicals — 0.5% |
RPM International, Inc. | | | 22,500 | | | $ | 1,771,200 | |
Communications — 5.3% |
Advertising — 0.6% |
The Trade Desk, Inc. Class A (a) | | | 46,600 | | | | 1,952,074 | |
Internet — 3.5% |
CDW Corp. | | | 22,304 | | | | 3,514,218 | |
DoorDash, Inc., Class A (a) | | | 9,900 | | | | 635,283 | |
Farfetch Ltd. Class A (a) | | | 27,124 | | | | 194,208 | |
Match Group, Inc. (a) | | | 40,904 | | | | 2,850,600 | |
Palo Alto Networks, Inc. (a) | | | 5,093 | | | | 2,515,636 | |
Spotify Technology SA (a) | | | 12,300 | | | | 1,154,109 | |
Vimeo, Inc. (a) | | | 29,429 | | | | 177,163 | |
| | | | | | | | 11,041,217 | |
Media — 0.8% |
Liberty Media Corp-Liberty Formula One Class C (a) | | | 39,100 | | | | 2,481,677 | |
Telecommunications — 0.4% |
Corning, Inc. | | | 40,500 | | | | 1,276,155 | |
| | | | | | | | 16,751,123 | |
Consumer, Cyclical — 13.0% |
Airlines — 0.8% |
Southwest Airlines Co. (a) | | | 73,000 | | | | 2,636,760 | |
Apparel — 0.3% |
Deckers Outdoor Corp. (a) | | | 3,300 | | | | 842,655 | |
Auto Manufacturers — 0.3% |
Rivian Automotive, Inc. Class A (a) (b) | | | 35,998 | | | | 926,588 | |
Entertainment — 0.6% |
DraftKings, Inc. Class A (a) (b) | | | 36,600 | | | | 427,122 | |
Vail Resorts, Inc. | | | 6,700 | | | | 1,460,935 | |
| | | | | | | | 1,888,057 | |
Lodging — 2.4% |
Hilton Worldwide Holdings, Inc. | | | 50,331 | | | | 5,608,887 | |
MGM Resorts International | | | 74,300 | | | | 2,150,985 | |
| | | | | | | | 7,759,872 | |
Retail — 8.6% |
Bath & Body Works, Inc. | | | 27,000 | | | | 726,840 | |
Burlington Stores, Inc. (a) | | | 22,500 | | | | 3,065,175 | |
Casey’s General Stores, Inc. | | | 14,000 | | | | 2,589,720 | |
Chipotle Mexican Grill, Inc. (a) | | | 2,050 | | | | 2,679,883 | |
Dollar General Corp. | | | 17,100 | | | | 4,197,024 | |
Dollar Tree, Inc. (a) | | | 11,200 | | | | 1,745,520 | |
Domino’s Pizza, Inc. | | | 5,000 | | | | 1,948,550 | |
| | | Number of
Shares | | | Value | |
Five Below, Inc. (a) | | | 7,200 | | | $ | 816,696 | |
Freshpet, Inc. (a) | | | 27,665 | | | | 1,435,537 | |
Lululemon Athletica, Inc. (a) | | | 8,692 | | | | 2,369,526 | |
O’Reilly Automotive, Inc. (a) | | | 3,200 | | | | 2,021,632 | |
Olaplex Holdings, Inc. (a) (b) | | | 22,548 | | | | 317,701 | |
Ross Stores, Inc. | | | 11,700 | | | | 821,691 | |
Warby Parker, Inc. Class A (a) | | | 8,143 | | | | 91,690 | |
Wingstop, Inc. | | | 33,532 | | | | 2,507,188 | |
| | | | | | | | 27,334,373 | |
| | | | | | | | 41,388,305 | |
Consumer, Non-cyclical — 33.0% |
Beverages — 0.3% |
The Boston Beer Co., Inc. Class A (a) (b) | | | 3,294 | | | | 997,983 | |
Biotechnology — 3.6% |
Alnylam Pharmaceuticals, Inc. (a) | | | 14,600 | | | | 2,129,410 | |
Apellis Pharmaceuticals, Inc. (a) | | | 6,782 | | | | 306,682 | |
Argenx SE ADR (a) (b) | | | 5,809 | | | | 2,200,914 | |
CRISPR Therapeutics AG (a) (b) | | | 3,628 | | | | 220,474 | |
Exelixis, Inc. (a) | | | 18,000 | | | | 374,760 | |
Ionis Pharmaceuticals, Inc. (a) | | | 38,500 | | | | 1,425,270 | |
Seagen, Inc. (a) | | | 24,414 | | | | 4,319,813 | |
Ultragenyx Pharmaceutical, Inc. (a) | | | 6,700 | | | | 399,722 | |
| | | | | | | | 11,377,045 | |
Commercial Services — 10.0% |
Bright Horizons Family Solutions, Inc. (a) | | | 15,300 | | | | 1,293,156 | |
Chegg, Inc. (a) | | | 72,945 | | | | 1,369,907 | |
Clarivate PLC (a) | | | 102,082 | | | | 1,414,857 | |
CoStar Group, Inc. (a) | | | 36,554 | | | | 2,208,227 | |
Equifax, Inc. | | | 13,500 | | | | 2,467,530 | |
FleetCor Technologies, Inc. (a) | | | 15,300 | | | | 3,214,683 | |
Gartner, Inc. (a) | | | 20,469 | | | | 4,950,018 | |
MarketAxess Holdings, Inc. | | | 4,200 | | | | 1,075,242 | |
Multiplan Corp. (a) (b) | | | 129,800 | | | | 712,602 | |
Paylocity Holding Corp. (a) | | | 6,100 | | | | 1,063,962 | |
Shift4 Payments, Inc. Class A (a) | | | 68,207 | | | | 2,254,923 | |
Terminix Global Holdings, Inc. (a) | | | 28,600 | | | | 1,162,590 | |
TransUnion | | | 79,486 | | | | 6,358,085 | |
Verisk Analytics, Inc. | | | 12,600 | | | | 2,180,934 | |
| | | | | | | | 31,726,716 | |
Food — 0.3% |
TreeHouse Foods, Inc. (a) | | | 24,907 | | | | 1,041,611 | |
Health Care – Products — 11.7% |
Alcon, Inc. | | | 27,900 | | | | 1,949,931 | |
Align Technology, Inc. (a) | | | 8,987 | | | | 2,126,953 | |
Avantor, Inc. (a) | | | 128,800 | | | | 4,005,680 | |
Bruker Corp. | | | 63,100 | | | | 3,960,156 | |
The accompanying notes are an integral part of the financial statements.
79
MML Mid Cap Growth Fund – Portfolio of Investments (Continued) |
| | | Number of
Shares | | | Value | |
The Cooper Cos., Inc. | | | 10,900 | | | $ | 3,413,008 | |
Dentsply Sirona, Inc. | | | 14,100 | | | | 503,793 | |
Exact Sciences Corp. (a) (b) | | | 12,800 | | | | 504,192 | |
Hologic, Inc. (a) | | | 105,900 | | | | 7,338,870 | |
ICU Medical, Inc. (a) | | | 8,000 | | | | 1,315,120 | |
Omnicell, Inc. (a) | | | 27,442 | | | | 3,121,528 | |
Quidelortho Corp. (a) | | | 21,033 | | | | 2,043,987 | |
Teleflex, Inc. | | | 20,240 | | | | 4,976,004 | |
West Pharmaceutical Services, Inc. | | | 7,235 | | | | 2,187,647 | |
| | | | | | | | 37,446,869 | |
Health Care – Services — 4.9% |
Acadia Healthcare Co., Inc. (a) | | | 45,700 | | | | 3,090,691 | |
agilon health, Inc. (a) (b) | | | 8,756 | | | | 191,143 | |
Catalent, Inc. (a) | | | 62,200 | | | | 6,673,438 | |
ICON PLC (a) | | | 20,860 | | | | 4,520,362 | |
Molina Healthcare, Inc. (a) | | | 4,500 | | | | 1,258,245 | |
| | | | | | | | 15,733,879 | |
Household Products & Wares — 1.2% |
Avery Dennison Corp. | | | 17,200 | | | | 2,784,164 | |
Reynolds Consumer Products, Inc. | | | 35,600 | | | | 970,812 | |
| | | | | | | | 3,754,976 | |
Pharmaceuticals — 1.0% |
Alkermes PLC (a) | | | 20,300 | | | | 604,737 | |
Elanco Animal Health, Inc. (a) | | | 27,000 | | | | 530,010 | |
Neurocrine Biosciences, Inc. (a) | | | 11,200 | | | | 1,091,776 | |
Perrigo Co. PLC | | | 20,300 | | | | 823,571 | |
| | | | | | | | 3,050,094 | |
| | | | | | | | 105,129,173 | |
Energy — 1.6% |
Energy – Alternate Sources — 0.1% |
Shoals Technologies Group, Inc. Class A (a) | | | 23,000 | | | | 379,040 | |
Oil & Gas — 1.1% |
Coterra Energy, Inc. | | | 31,500 | | | | 812,385 | |
Pioneer Natural Resources Co. | | | 6,800 | | | | 1,516,944 | |
Venture Global LNG, Inc., Series B (Acquired 3/08/18, Cost $63,420) (a) (c) (d) (e) | | | 21 | | | | 124,954 | |
Venture Global LNG, Inc., Series C (Acquired 10/16/17-3/08/18, Cost $530,257) (a) (c) (d) (e) | | | 144 | | | | 856,824 | |
| | | | | | | | 3,311,107 | |
Pipelines — 0.4% |
Cheniere Energy, Inc. | | | 9,900 | | | | 1,316,997 | |
| | | | | | | | 5,007,144 | |
Financial — 6.0% |
Diversified Financial Services — 2.7% |
Cboe Global Markets, Inc. | | | 15,800 | | | | 1,788,402 | |
| | | Number of
Shares | | | Value | |
Hamilton Lane, Inc. Class A | | | 48,409 | | | $ | 3,252,117 | |
Raymond James Financial, Inc. | | | 8,900 | | | | 795,749 | |
Tradeweb Markets, Inc. Class A | | | 40,500 | | | | 2,764,125 | |
| | | | | | | | 8,600,393 | |
Insurance — 1.7% |
Assurant, Inc. | | | 17,800 | | | | 3,076,730 | |
Axis Capital Holdings Ltd. | | | 32,500 | | | | 1,855,425 | |
Kemper Corp. | | | 10,200 | | | | 488,580 | |
| | | | | | | | 5,420,735 | |
Private Equity — 1.6% |
Ares Management Corp. Class A | | | 41,172 | | | | 2,341,040 | |
KKR & Co., Inc. | | | 58,900 | | | | 2,726,481 | |
| | | | | | | | 5,067,521 | |
| | | | | | | | 19,088,649 | |
Industrial — 17.3% |
Aerospace & Defense — 0.8% |
Hexcel Corp. | | | 49,725 | | | | 2,601,115 | |
Building Materials — 1.2% |
Fortune Brands Home & Security, Inc. | | | 22,789 | | | | 1,364,605 | |
Martin Marietta Materials, Inc. | | | 7,860 | | | | 2,352,027 | |
| | | | | | | | 3,716,632 | |
Electrical Components & Equipment — 0.1% |
Littelfuse, Inc. | | | 1,900 | | | | 482,676 | |
Electronics — 4.3% |
Agilent Technologies, Inc. | | | 42,300 | | | | 5,023,971 | |
Amphenol Corp. Class A | | | 24,100 | | | | 1,551,558 | |
Fortive Corp. | | | 45,000 | | | | 2,447,100 | |
Keysight Technologies, Inc. (a) | | | 23,400 | | | | 3,225,690 | |
National Instruments Corp. | | | 45,100 | | | | 1,408,473 | |
| | | | | | | | 13,656,792 | |
Environmental Controls — 0.3% |
Waste Connections, Inc. | | | 9,000 | | | | 1,115,640 | |
Machinery – Construction & Mining — 1.5% |
BWX Technologies, Inc. | | | 84,712 | | | | 4,666,784 | |
Machinery – Diversified — 3.4% |
Cognex Corp. | | | 20,300 | | | | 863,156 | |
Enovis Corp. (a) | | | 26,878 | | | | 1,478,290 | |
Esab Corp. | | | 26,878 | | | | 1,175,912 | |
IDEX Corp. | | | 11,300 | | | | 2,052,419 | |
Ingersoll Rand, Inc. | | | 123,800 | | | | 5,209,504 | |
| | | | | | | | 10,779,281 | |
Miscellaneous - Manufacturing — 2.0% |
Textron, Inc. | | | 104,000 | | | | 6,351,280 | |
The accompanying notes are an integral part of the financial statements.
80
MML Mid Cap Growth Fund – Portfolio of Investments (Continued) |
| | | Number of
Shares | | | Value | |
Packaging & Containers — 2.6% |
Ball Corp. | | | 77,947 | | | $ | 5,360,415 | |
Sealed Air Corp. | | | 48,100 | | | | 2,776,332 | |
| | | | | | | | 8,136,747 | |
Transportation — 1.1% |
J.B. Hunt Transport Services, Inc. | | | 23,100 | | | | 3,637,557 | |
| | | | | | | | 55,144,504 | |
Technology — 18.5% |
Computers — 3.0% |
Crowdstrike Holdings, Inc. Class A (a) | | | 10,400 | | | | 1,753,024 | |
Fortinet, Inc. (a) | | | 75,500 | | | | 4,271,790 | |
Leidos Holdings, Inc. | | | 9,600 | | | | 966,816 | |
Thoughtworks Holding, Inc. (a) | | | 9,956 | | | | 140,479 | |
Varonis Systems, Inc. (a) | | | 76,253 | | | | 2,235,738 | |
| | | | | | | | 9,367,847 | |
Semiconductors — 5.2% |
KLA Corp. | | | 12,200 | | | | 3,892,776 | |
Lattice Semiconductor Corp. (a) | | | 21,600 | | | | 1,047,600 | |
Marvell Technology, Inc. | | | 96,900 | | | | 4,218,057 | |
Microchip Technology, Inc. | | | 100,700 | | | | 5,848,656 | |
Synaptics, Inc. (a) | | | 11,309 | | | | 1,335,028 | |
Wolfspeed, Inc. (a) | | | 5,400 | | | | 342,630 | |
| | | | | | | | 16,684,747 | |
Software — 10.3% |
Atlassian Corp. PLC Class A (a) | | | 9,900 | | | | 1,855,260 | |
Avalara, Inc. (a) | | | 38,899 | | | | 2,746,269 | |
Bill.com Holdings, Inc. (a) | | | 6,600 | | | | 725,604 | |
Black Knight, Inc. (a) | | | 32,900 | | | | 2,151,331 | |
Broadridge Financial Solutions, Inc. | | | 5,000 | | | | 712,750 | |
CCC Intelligent Solutions Holdings, Inc. (a) | | | 126,172 | | | | 1,160,782 | |
Ceridian HCM Holding, Inc. (a) | | | 78,919 | | | | 3,715,507 | |
Clear Secure Inc. Class A (a) (b) | | | 5,493 | | | | 109,860 | |
DocuSign, Inc. (a) | | | 13,300 | | | | 763,154 | |
Doximity, Inc. Class A (a) (b) | | | 15,800 | | | | 550,156 | |
Electronic Arts, Inc. | | | 24,818 | | | | 3,019,110 | |
Fair Isaac Corp. (a) | | | 2,000 | | | | 801,800 | |
MongoDB, Inc. (a) | | | 8,680 | | | | 2,252,460 | |
nCino, Inc. (a) (b) | | | 6,900 | | | | 213,348 | |
Playtika Holding Corp. (a) | | | 23,537 | | | | 311,630 | |
PTC, Inc. (a) | | | 15,400 | | | | 1,637,636 | |
Roper Technologies, Inc. | | | 5,800 | | | | 2,288,970 | |
SentinelOne Inc. Class A (a) | | | 15,776 | | | | 368,054 | |
Synopsys, Inc. (a) | | | 8,100 | | | | 2,459,970 | |
Veeva Systems, Inc. Class A (a) | | | 16,900 | | | | 3,346,876 | |
| | | Number of
Shares | | | Value | |
ZoomInfo Technologies, Inc. (a) | | | 51,938 | | | $ | 1,726,419 | |
| | | | | | | | 32,916,946 | |
| | | | | | | | 58,969,540 | |
| | | | | | | | | |
TOTAL COMMON STOCK (Cost $290,082,248) | | | | | | | 303,249,638 | |
| | | | | | | | | |
PREFERRED STOCK — 0.5% |
Consumer, Cyclical — 0.1% |
Auto Manufacturers — 0.1% |
Nuro, Inc., Series D (Acquired 10/29/21, Cost $159,220) (a) (c) (d) (e) | | | 7,638 | | | | 159,220 | |
Consumer, Non-cyclical — 0.1% |
Commercial Services — 0.0% |
Redwood Materials, Inc., Series C (Acquired 5/28/21, Cost $200,090) (a) (c) (d) (e) | | | 4,221 | | | | 220,125 | |
Health Care – Services — 0.1% |
Caris Life Sciences, Inc., Series D (Acquired 5/11/21, Cost $271,366) (a) (c) (d) (e) | | | 33,502 | | | | 220,443 | |
| | | | | | | | 440,568 | |
Financial — 0.1% |
Investment Companies — 0.1% |
Maplebear, Inc., Series E (Acquired 11/19/21 - 12/01/21, Cost $528,790) (a) (c) (d) (e) | | | 4,398 | | | | 314,853 | |
Maplebear, Inc., Series I (Acquired 2/26/21, Cost $95,750) (a) (c) (d) (e) | | | 766 | | | | 54,838 | |
| | | | | | | | 369,691 | |
| | | | | | | | 369,691 | |
Industrial — 0.1% |
Electrical Components & Equipment — 0.1% |
Sila Nanotechnologies, Inc., Series F (Acquired 1/07/21, Cost $407,982) (a) (c) (d) (e) | | | 9,885 | | | | 308,115 | |
Technology — 0.1% |
Software — 0.1% |
Databricks, Inc., Series G (Acquired 2/01/21, Cost $133,381) (a) (c) (d) (e) | | | 752 | | | | 124,742 | |
The accompanying notes are an integral part of the financial statements.
81
MML Mid Cap Growth Fund – Portfolio of Investments (Continued) |
| | | Number of
Shares | | | Value | |
Databricks, Inc., Series H (Acquired 8/31/21, Cost $186,503) (a) (c) (d) (e) | | | 846 | | | $ | 140,334 | |
| | | | | | | | 265,076 | |
| | | | | | | | | |
TOTAL PREFERRED STOCK (Cost $1,983,082) | | | | | | | 1,542,670 | |
| | | | | | | | | |
TOTAL EQUITIES (Cost $292,065,330) | | | | | | | 304,792,308 | |
| | | | | | | | | |
MUTUAL FUNDS — 0.4% |
Diversified Financial Services — 0.4% |
State Street Navigator Securities Lending Government Money Market Portfolio (f) | | | 1,148,290 | | | | 1,148,290 | |
| | | | | | | | | |
TOTAL MUTUAL FUNDS (Cost $1,148,290) | | | | | | | 1,148,290 | |
| | | | | | | | | |
TOTAL LONG-TERM INVESTMENTS (Cost $293,213,620) | | | | | | | 305,940,598 | |
| | | | | | | | | |
SHORT-TERM INVESTMENTS — 3.8% |
Mutual Fund — 0.0% |
T. Rowe Price Treasury Reserve Fund | | | 102 | | | | 102 | |
| | | Principal
Amount | | | | | |
Repurchase Agreement — 3.8% |
Fixed Income Clearing Corp., Repurchase Agreement, dated 6/30/22, 0.240%, due 7/01/22 (g) | | $ | 12,245,321 | | | | 12,245,321 | |
| | | | | | | | | |
TOTAL SHORT-TERM INVESTMENTS (Cost $12,245,423) | | | | | | | 12,245,423 | |
| | | | | | | | | |
TOTAL INVESTMENTS — 99.9% (Cost $305,459,043) (h) | | | | | | | 318,186,021 | |
| | | | | | | | | |
Other Assets/(Liabilities) — 0.1% | | | | | | | 311,248 | |
| | | | | | | | | |
NET ASSETS — 100.0% | | | | | | $ | 318,497,269 | |
Abbreviation Legend
ADR | American Depositary Receipt |
Notes to Portfolio of Investments
Percentages are stated as a percent of net assets.
(a) | Non-income producing security. |
(b) | Denotes all or a portion of security on loan. The total value of securities on loan as of June 30, 2022, was $5,809,239 or 1.82% of net assets. Total securities on loan may be less than the amounts identified in the Portfolio of Investments. The Fund received $4,799,856 of non-cash collateral (U.S. Treasury and/or Agency obligations) related to securities lending activity. This amount is not reflected on either the Portfolio of Investments or the Statement of Assets and Liabilities. (Note 2). |
(c) | Investment was valued using significant unobservable inputs. |
(d) | This security is fair valued in good faith in accordance with procedures approved by the Board of Trustees. At June 30, 2022, these securities amounted to a value of $2,524,448 or 0.79% of net assets. |
(e) | Restricted security. Certain securities are restricted as to resale. At June 30, 2022, these securities amounted to a value of $2,524,448 or 0.79% of net assets. The Fund generally bears the costs, if any, associated with the disposition of restricted securities. |
(f) | Represents investment of security lending cash collateral. (Note 2). |
(g) | Maturity value of $12,245,403. Collateralized by U.S. Government Agency obligations with a rate of 3.000%, maturity date of 6/30/24, and an aggregate market value, including accrued interest, of $12,490,321. |
(h) | See Note 6 for aggregate cost for federal tax purposes. |
The accompanying notes are an integral part of the financial statements.
82
MML Mid Cap Value Fund – Portfolio of Investments |
June 30, 2022 (Unaudited) |
| | | Number of
Shares | | | Value | |
EQUITIES — 99.0% |
COMMON STOCK — 98.4% |
Basic Materials — 2.3% |
Chemicals — 1.6% |
Akzo Nobel NV | | | 34,519 | | | $ | 2,280,626 | |
Axalta Coating Systems Ltd. (a) | | | 105,710 | | | | 2,337,248 | |
| | | | | | | | 4,617,874 | |
Forest Products & Paper — 0.7% |
Mondi PLC | | | 123,081 | | | | 2,183,381 | |
| | | | | | | | 6,801,255 | |
Communications — 2.8% |
Internet — 1.0% |
F5, Inc. (a) | | | 19,975 | | | | 3,056,974 | |
Media — 1.4% |
Fox Corp. Class B | | | 142,070 | | | | 4,219,479 | |
Telecommunications — 0.4% |
Juniper Networks, Inc. | | | 35,071 | | | | 999,524 | |
| | | | | | | | 8,275,977 | |
Consumer, Cyclical — 13.4% |
Airlines — 1.8% |
Southwest Airlines Co. (a) | | | 147,122 | | | | 5,314,047 | |
Auto Manufacturers — 1.5% |
Cummins, Inc. | | | 15,628 | | | | 3,024,487 | |
PACCAR, Inc. | | | 16,459 | | | | 1,355,234 | |
| | | | | | | | 4,379,721 | |
Auto Parts & Equipment — 2.1% |
Aptiv PLC (a) | | | 11,693 | | | | 1,041,495 | |
BorgWarner, Inc. | | | 124,872 | | | | 4,166,979 | |
Bridgestone Corp. (b) | | | 25,100 | | | | 916,325 | |
| | | | | | | | 6,124,799 | |
Food Services — 1.0% |
Sodexo SA | | | 42,607 | | | | 3,023,345 | |
Leisure Time — 0.6% |
Polaris, Inc. | | | 18,783 | | | | 1,864,776 | |
Retail — 6.4% |
Advance Auto Parts, Inc. | | | 31,646 | | | | 5,477,606 | |
Beacon Roofing Supply, Inc. (a) | | | 37,067 | | | | 1,903,761 | |
Cracker Barrel Old Country Store, Inc. (b) | | | 13,164 | | | | 1,099,062 | |
Dollar Tree, Inc. (a) | | | 34,860 | | | | 5,432,931 | |
MSC Industrial Direct Co., Inc. Class A | | | 65,931 | | | | 4,952,078 | |
| | | | | | | | 18,865,438 | |
| | | | | | | | 39,572,126 | |
| | | Number of
Shares | | | Value | |
Consumer, Non-cyclical — 20.9% |
Food — 6.4% |
Conagra Brands, Inc. | | | 188,019 | | | $ | 6,437,771 | |
General Mills, Inc. | | | 13,871 | | | | 1,046,567 | |
The J.M. Smucker Co. | | | 22,951 | | | | 2,937,957 | |
Kellogg Co. | | | 14,366 | | | | 1,024,870 | |
Koninklijke Ahold Delhaize NV | | | 211,101 | | | | 5,501,657 | |
Orkla ASA | | | 243,206 | | | | 1,946,700 | |
| | | | | | | | 18,895,522 | |
Health Care – Products — 6.3% |
Baxter International, Inc. | | | 22,834 | | | | 1,466,628 | |
Dentsply Sirona, Inc. | | | 54,218 | | | | 1,937,209 | |
Henry Schein, Inc. (a) | | | 60,993 | | | | 4,680,603 | |
Koninklijke Philips NV | | | 60,846 | | | | 1,310,014 | |
Zimmer Biomet Holdings, Inc. | | | 88,604 | | | | 9,308,736 | |
| | | | | | | | 18,703,190 | |
Health Care – Services — 3.5% |
Quest Diagnostics, Inc. | | | 44,040 | | | | 5,856,439 | |
Universal Health Services, Inc. Class B | | | 45,081 | | | | 4,540,108 | |
| | | | | | | | 10,396,547 | |
Household Products & Wares — 1.7% |
Kimberly-Clark Corp. | | | 36,537 | | | | 4,937,976 | |
Pharmaceuticals — 3.0% |
AmerisourceBergen Corp. | | | 24,942 | | | | 3,528,794 | |
Becton Dickinson and Co. | | | 6,251 | | | | 1,541,059 | |
Cardinal Health, Inc. | | | 40,332 | | | | 2,108,154 | |
Embecta Corp. (a) | | | 70,461 | | | | 1,784,072 | |
| | | | | | | | 8,962,079 | |
| | | | | | | | 61,895,314 | |
Energy — 5.0% |
Oil & Gas — 2.9% |
Devon Energy Corp. | | | 50,174 | | | | 2,765,089 | |
Diamondback Energy, Inc. | | | 12,506 | | | | 1,515,102 | |
Phillips 66 | | | 29,472 | | | | 2,416,409 | |
Pioneer Natural Resources Co. | | | 8,648 | | | | 1,929,196 | |
| | | | | | | | 8,625,796 | |
Oil & Gas Services — 0.9% |
Baker Hughes Co. | | | 90,257 | | | | 2,605,719 | |
Pipelines — 1.2% |
Enterprise Products Partners LP | | | 144,837 | | | | 3,529,678 | |
| | | | | | | | 14,761,193 | |
Financial — 29.1% |
Banks — 10.9% |
The Bank of New York Mellon Corp. | | | 174,237 | | | | 7,267,425 | |
Commerce Bancshares, Inc. | | | 6,734 | | | | 442,087 | |
First Hawaiian, Inc. | | | 189,317 | | | | 4,299,389 | |
The accompanying notes are an integral part of the financial statements.
83
MML Mid Cap Value Fund – Portfolio of Investments (Continued) |
| | | Number of
Shares | | | Value | |
Northern Trust Corp. | | | 78,976 | | | $ | 7,619,605 | |
Prosperity Bancshares, Inc. | | | 67,414 | | | | 4,602,354 | |
State Street Corp. | | | 18,730 | | | | 1,154,705 | |
Truist Financial Corp. | | | 103,414 | | | | 4,904,926 | |
Westamerica Bancorp. | | | 34,626 | | | | 1,927,283 | |
| | | | | | | | 32,217,774 | |
Diversified Financial Services — 2.9% |
Ameriprise Financial, Inc. | | | 14,141 | | | | 3,361,033 | |
T. Rowe Price Group, Inc. | | | 44,644 | | | | 5,072,005 | |
| | | | | | | | 8,433,038 | |
Insurance — 6.6% |
Aflac, Inc. | | | 68,921 | | | | 3,813,399 | |
The Allstate Corp. | | | 50,317 | | | | 6,376,673 | |
Chubb Ltd. | | | 7,619 | | | | 1,497,743 | |
The Hanover Insurance Group, Inc. | | | 16,343 | | | | 2,390,164 | |
Reinsurance Group of America, Inc. | | | 47,080 | | | | 5,522,013 | |
| | | | | | | | 19,599,992 | |
Real Estate Investment Trusts (REITS) — 8.3% |
Equinix, Inc. | | | 6,064 | | | | 3,984,169 | |
Essex Property Trust, Inc. | | | 10,120 | | | | 2,646,481 | |
Healthcare Trust of America, Inc. Class A | | | 116,163 | | | | 3,242,109 | |
Healthpeak Properties, Inc. | | | 175,104 | | | | 4,536,945 | |
Realty Income Corp. | | | 37,118 | | | | 2,533,675 | |
Regency Centers Corp. | | | 62,547 | | | | 3,709,662 | |
VICI Properties, Inc. | | | 90,916 | | | | 2,708,388 | |
Weyerhaeuser Co. | | | 31,766 | | | | 1,052,090 | |
| | | | | | | | 24,413,519 | |
Savings & Loans — 0.4% |
Capitol Federal Financial, Inc. | | | 136,550 | | | | 1,253,529 | |
| | | | | | | | 85,917,852 | |
Industrial — 14.2% |
Building Materials — 0.9% |
Cie de Saint-Gobain | | | 59,133 | | | | 2,568,646 | |
Electrical Components & Equipment — 2.1% |
Emerson Electric Co. | | | 77,684 | | | | 6,178,985 | |
Electronics — 3.5% |
Atkore, Inc. (a) | | | 16,992 | | | | 1,410,506 | |
Hubbell, Inc. | | | 6,319 | | | | 1,128,447 | |
nVent Electric PLC | | | 152,279 | | | | 4,770,901 | |
TE Connectivity Ltd. | | | 27,291 | | | | 3,087,977 | |
| | | | | | | | 10,397,831 | |
Engineering & Construction — 0.6% |
Vinci SA | | | 18,483 | | | | 1,660,522 | |
Environmental Controls — 0.5% |
Republic Services, Inc. | | | 11,058 | | | | 1,447,160 | |
| | | Number of
Shares | | | Value | |
Hand & Machine Tools — 0.4% |
Stanley Black & Decker, Inc. | | | 11,754 | | | $ | 1,232,524 | |
Machinery – Construction & Mining — 1.5% |
Oshkosh Corp. | | | 55,676 | | | | 4,573,227 | |
Machinery – Diversified — 0.5% |
IMI PLC | | | 98,047 | | | | 1,400,118 | |
Packaging & Containers — 2.5% |
Amcor PLC | | | 74,567 | | | | 926,868 | |
Packaging Corp. of America | | | 23,708 | | | | 3,259,850 | |
Sonoco Products Co. | | | 54,205 | | | | 3,091,853 | |
| | | | | | | | 7,278,571 | |
Shipbuilding — 1.1% |
Huntington Ingalls Industries, Inc. | | | 14,879 | | | | 3,240,944 | |
Transportation — 0.6% |
Heartland Express, Inc. | | | 138,412 | | | | 1,925,311 | |
| | | | | | | | 41,903,839 | |
Technology — 3.2% |
Computers — 1.8% |
Amdocs Ltd. | | | 31,151 | | | | 2,595,190 | |
HP, Inc. | | | 86,334 | | | | 2,830,028 | |
| | | | | | | | 5,425,218 | |
Semiconductors — 0.4% |
Applied Materials, Inc. | | | 11,872 | | | | 1,080,115 | |
Software — 1.0% |
Open Text Corp. | | | 78,610 | | | | 2,974,602 | |
| | | | | | | | 9,479,935 | |
Utilities — 7.5% |
Electric — 5.5% |
Edison International | | | 99,282 | | | | 6,278,594 | |
Evergy, Inc. | | | 14,734 | | | | 961,393 | |
Eversource Energy | | | 14,521 | | | | 1,226,589 | |
NorthWestern Corp. (b) | | | 72,447 | | | | 4,269,302 | |
Pinnacle West Capital Corp. | | | 47,938 | | | | 3,505,226 | |
| | | | | | | | 16,241,104 | |
Gas — 2.0% |
Atmos Energy Corp. | | | 10,183 | | | | 1,141,514 | |
Spire, Inc. | | | 64,164 | | | | 4,771,877 | |
| | | | | | | | 5,913,391 | |
| | | | | | | | 22,154,495 | |
| | | | | | | | | |
TOTAL COMMON STOCK (Cost $299,474,358) | | | | | | | 290,761,986 | |
| | | | | | | | | |
The accompanying notes are an integral part of the financial statements.
84
MML Mid Cap Value Fund – Portfolio of Investments (Continued) |
| | | Number of
Shares | | | Value | |
PREFERRED STOCK — 0.6% |
Consumer, Non-cyclical — 0.6% |
Household Products & Wares — 0.6% |
Henkel AG & Co. KGaA | | | 26,454 | | | $ | 1,629,564 | |
| | | | | | | | | |
TOTAL PREFERRED STOCK (Cost $1,709,792) | | | | | | | 1,629,564 | |
| | | | | | | | | |
TOTAL EQUITIES (Cost $301,184,150) | | | | | | | 292,391,550 | |
| | | | | | | | | |
TOTAL LONG-TERM INVESTMENTS (Cost $301,184,150) | | | | | | | 292,391,550 | |
| | | Principal
Amount | | | Value | |
SHORT-TERM INVESTMENTS — 2.3% |
Repurchase Agreement — 2.3% |
Fixed Income Clearing Corp., Repurchase Agreement, dated 6/30/22, 0.240%, due 7/01/22 (c) | | $ | 6,915,027 | | | $ | 6,915,027 | |
| | | | | | | | | |
TOTAL SHORT-TERM INVESTMENTS (Cost $6,915,027) | | | | | | | 6,915,027 | |
| | | | | | | | | |
TOTAL INVESTMENTS — 101.3% (Cost $308,099,177) (d) | | | | | | | 299,306,577 | |
| | | | | | | | | |
Other Assets/(Liabilities) — (1.3)% | | | | | | | (3,958,475 | ) |
| | | | | | | | | |
NET ASSETS — 100.0% | | | | | | $ | 295,348,102 | |
Notes to Portfolio of Investments
Percentages are stated as a percent of net assets.
(a) | Non-income producing security. |
(b) | Denotes all or a portion of security on loan. The total value of securities on loan as of June 30, 2022, was $6,149,965 or 2.08% of net assets. Total securities on loan may be less than the amounts identified in the Portfolio of Investments. The Fund received $6,377,401 of non-cash collateral (U.S. Treasury and/or Agency obligations) related to securities lending activity. This amount is not reflected on either the Portfolio of Investments or the Statement of Assets and Liabilities. (Note 2). |
(c) | Maturity value of $6,915,073. Collateralized by U.S. Government Agency obligations with a rate of 3.000%, maturity date of 6/30/24, and an aggregate market value, including accrued interest, of $7,053,375. |
(d) | See Note 6 for aggregate cost for federal tax purposes. |
Forward contracts
Counterparty | | Settlement
Date | | | Currency Purchased | | | Currency Sold | | | Unrealized
Appreciation
(Depreciation) | |
Bank of America N.A.* | | | 9/30/22 | | | | GBP | | | | 86,095 | | | | USD | | | $ | 105,799 | | | $ | (819 | ) |
Bank of America N.A.* | | | 9/30/22 | | | | JPY | | | | 3,733,625 | | | | USD | | | | 27,640 | | | | 49 | |
Bank of America N.A.* | | | 9/30/22 | | | | USD | | | | 820,589 | | | | JPY | | | | 110,088,600 | | | | 4,148 | |
Bank of America N.A.* | | | 9/30/22 | | | | USD | | | | 3,329,652 | | | | GBP | | | | 2,711,579 | | | | 23,285 | |
JP Morgan Chase Bank N.A.* | | | 9/30/22 | | | | USD | | | | 15,490,184 | | | | EUR | | | | 14,648,497 | | | | 43,469 | |
UBS AG* | | | 9/30/22 | | | | USD | | | | 1,601,681 | | | | NOK | | | | 15,934,371 | | | | (19,211 | ) |
| | | | | | | | | | | | | | | | | | | | | | | $ | 50,921 | |
* Contracts are subject to a master netting agreement or similar agreement.
Currency Legend
The accompanying notes are an integral part of the financial statements.
85
MML Small Cap Growth Equity Fund – Portfolio of Investments |
June 30, 2022 (Unaudited) |
| | | Number of
Shares | | | Value | |
EQUITIES — 94.3% |
COMMON STOCK — 94.3% |
Basic Materials — 2.2% |
Chemicals — 1.9% |
Cabot Corp. | | | 32,155 | | | $ | 2,051,168 | |
Methanex Corp. (a) | | | 19,328 | | | | 738,909 | |
| | | | | | | | 2,790,077 | |
Mining — 0.3% |
Livent Corp. (b) | | | 16,126 | | | | 365,899 | |
| | | | | | | | 3,155,976 | |
Communications — 5.6% |
Internet — 3.2% |
Bumble, Inc. Class A (b) | | | 5,996 | | | | 168,787 | |
Cargurus, Inc. (b) | | | 66,668 | | | | 1,432,695 | |
Criteo SA Sponsored ADR (b) | | | 20,811 | | | | 507,789 | |
Perficient, Inc. (b) | | | 21,487 | | | | 1,970,143 | |
Revolve Group, Inc. (a) (b) | | | 20,565 | | | | 532,839 | |
| | | | | | | | 4,612,253 | |
Media — 0.4% |
The New York Times Co. Class A | | | 21,588 | | | | 602,305 | |
Telecommunications — 2.0% |
Calix, Inc. (b) | | | 59,524 | | | | 2,032,150 | |
Viavi Solutions, Inc. (b) | | | 56,744 | | | | 750,723 | |
| | | | | | | | 2,782,873 | |
| | | | | | | | 7,997,431 | |
Consumer, Cyclical — 10.3% |
Apparel — 1.8% |
Carter’s, Inc. (a) | | | 4,630 | | | | 326,322 | |
Crocs, Inc. (b) | | | 7,691 | | | | 374,321 | |
Deckers Outdoor Corp. (b) | | | 1,756 | | | | 448,395 | |
Steven Madden Ltd. | | | 46,390 | | | | 1,494,222 | |
| | | | | | | | 2,643,260 | |
Distribution & Wholesale — 0.6% |
WESCO International, Inc. (b) | | | 7,838 | | | | 839,450 | |
Entertainment — 0.4% |
Cinemark Holdings, Inc. (b) | | | 43,750 | | | | 657,125 | |
Food Services — 0.7% |
Sovos Brands, Inc. (b) | | | 60,606 | | | | 961,817 | |
Home Builders — 0.9% |
Skyline Champion Corp. (b) | | | 26,239 | | | | 1,244,253 | |
Leisure Time — 0.4% |
Acushnet Holdings Corp. | | | 13,225 | | | | 551,218 | |
Lodging — 0.5% |
Boyd Gaming Corp. | | | 14,582 | | | | 725,455 | |
Retail — 5.0% |
Denny’s Corp. (b) | | | 44,115 | | | | 382,918 | |
| | | Number of
Shares | | | Value | |
Five Below, Inc. (b) | | | 4,845 | | | $ | 549,568 | |
Freshpet, Inc. (b) | | | 7,043 | | | | 365,461 | |
National Vision Holdings, Inc. (b) | | | 22,292 | | | | 613,030 | |
Nu Skin Enterprises, Inc. Class A | | | 18,588 | | | | 804,860 | |
Patrick Industries, Inc. | | | 11,870 | | | | 615,341 | |
Rush Enterprises, Inc. Class A | | | 17,771 | | | | 856,562 | |
Texas Roadhouse, Inc. | | | 13,248 | | | | 969,754 | |
Victoria’s Secret & Co. (b) | | | 18,783 | | | | 525,361 | |
Wingstop, Inc. | | | 19,357 | | | | 1,447,323 | |
| | | | | | | | 7,130,178 | |
| | | | | | | | 14,752,756 | |
Consumer, Non-cyclical — 23.9% |
Beverages — 0.2% |
Celsius Holdings, Inc. (b) | | | 4,148 | | | | 270,699 | |
Biotechnology — 5.9% |
Akero Therapeutics, Inc. (b) | | | 11,782 | | | | 111,340 | |
Amicus Therapeutics, Inc. (b) | | | 63,164 | | | | 678,381 | |
Apellis Pharmaceuticals, Inc. (b) | | | 19,196 | | | | 868,043 | |
Blueprint Medicines Corp. (b) | | | 5,031 | | | | 254,116 | |
Celldex Therapeutics, Inc. (b) | | | 7,753 | | | | 209,021 | |
Crinetics Pharmaceuticals, Inc. (b) | | | 15,069 | | | | 281,037 | |
Fate Therapeutics, Inc. (a) (b) | | | 7,430 | | | | 184,116 | |
Halozyme Therapeutics, Inc. (b) | | | 8,232 | | | | 362,208 | |
Intellia Therapeutics, Inc. (b) | | | 7,512 | | | | 388,821 | |
Intra-Cellular Therapies, Inc. (b) | | | 9,503 | | | | 542,431 | |
Karuna Therapeutics, Inc. (b) | | | 1,423 | | | | 180,024 | |
Kymera Therapeutics, Inc. (b) | | | 38,181 | | | | 751,784 | |
Myriad Genetics, Inc. (b) | | | 29,377 | | | | 533,780 | |
PTC Therapeutics, Inc. (b) | | | 11,805 | | | | 472,908 | |
Relay Therapeutics, Inc. (b) | | | 16,715 | | | | 279,976 | |
Revolution Medicines, Inc. (b) | | | 29,881 | | | | 582,381 | |
Rocket Pharmaceuticals, Inc. (b) | | | 39,992 | | | | 550,290 | |
Sage Therapeutics, Inc. (b) | | | 5,387 | | | | 174,000 | |
Turning Point Therapeutics, Inc. (b) | | | 8,152 | | | | 613,438 | |
Veracyte, Inc. (b) | | | 23,041 | | | | 458,516 | |
| | | | | | | | 8,476,611 | |
Commercial Services — 4.1% |
H&R Block, Inc. | | | 16,834 | | | | 594,577 | |
HealthEquity, Inc. (b) | | | 7,771 | | | | 477,062 | |
Herc Holdings, Inc. | | | 600 | | | | 54,090 | |
LiveRamp Holdings, Inc. (b) | | | 14,943 | | | | 385,679 | |
Mister Car Wash, Inc. (b) | | | 51,220 | | | | 557,273 | |
R1 RCM, Inc. (b) | | | 62,305 | | | | 1,305,913 | |
Repay Holdings Corp. (a) (b) | | | 31,035 | | | | 398,800 | |
TriNet Group, Inc. (b) | | | 22,341 | | | | 1,734,108 | |
The accompanying notes are an integral part of the financial statements.
86
MML Small Cap Growth Equity Fund – Portfolio of Investments (Continued) |
| | | Number of
Shares | | | Value | |
WillScot Mobile Mini Holdings Corp. (b) | | | 12,200 | | | $ | 395,524 | |
| | | | | | | | 5,903,026 | |
Cosmetics & Personal Care — 1.0% |
elf Beauty, Inc. (b) | | | 44,080 | | | | 1,352,374 | |
Food — 0.7% |
Performance Food Group Co. (b) | | | 20,636 | | | | 948,843 | |
Health Care – Products — 5.3% |
Glaukos Corp. (b) | | | 14,458 | | | | 656,682 | |
Globus Medical, Inc. Class A (b) | | | 24,275 | | | | 1,362,799 | |
Haemonetics Corp. (b) | | | 24,785 | | | | 1,615,486 | |
ICU Medical, Inc. (b) | | | 4,052 | | | | 666,108 | |
Inari Medical, Inc. (b) | | | 8,347 | | | | 567,513 | |
Inspire Medical Systems, Inc. (b) | | | 4,399 | | | | 803,565 | |
Integra LifeSciences Holdings Corp. (b) | | | 17,652 | | | | 953,738 | |
Omnicell, Inc. (b) | | | 5,607 | | | | 637,796 | |
Tandem Diabetes Care, Inc. (b) | | | 6,375 | | | | 377,336 | |
| | | | | | | | 7,641,023 | |
Health Care – Services — 1.7% |
Acadia Healthcare Co., Inc. (b) | | | 12,065 | | | | 815,956 | |
Amedisys, Inc. (b) | | | 6,976 | | | | 733,317 | |
LHC Group, Inc. (b) | | | 5,756 | | | | 896,440 | |
| | | | | | | | 2,445,713 | |
Household Products & Wares — 0.5% |
Spectrum Brands Holdings, Inc. | | | 9,315 | | | | 764,016 | |
Pharmaceuticals — 4.5% |
Aclaris Therapeutics, Inc. (b) | | | 24,120 | | | | 336,715 | |
Alkermes PLC (b) | | | 9,199 | | | | 274,038 | |
Ascendis Pharma A/S ADR (b) | | | 2,726 | | | | 253,409 | |
BellRing Brands, Inc. (b) | | | 32,249 | | | | 802,678 | |
Covetrus, Inc. (b) | | | 56,109 | | | | 1,164,262 | |
Cytokinetics, Inc. (a) (b) | | | 23,015 | | | | 904,259 | |
Myovant Sciences Ltd. (a) (b) | | | 23,699 | | | | 294,578 | |
Owens & Minor, Inc. | | | 56,308 | | | | 1,770,887 | |
Pacira BioSciences, Inc. (b) | | | 6,764 | | | | 394,341 | |
Y-mAbs Therapeutics, Inc. (b) | | | 13,391 | | | | 202,606 | |
| | | | | | | | 6,397,773 | |
| | | | | | | | 34,200,078 | |
Energy — 5.9% |
Energy – Alternate Sources — 1.3% |
Atlantica Sustainable Infrastructure PLC | | | 26,971 | | | | 870,084 | |
First Solar, Inc. (b) | | | 9,205 | | | | 627,137 | |
Maxeon Solar Technologies Ltd. (a) (b) | | | 29,480 | | | | 391,789 | |
| | | | | | | | 1,889,010 | |
| | | Number of
Shares | | | Value | |
Oil & Gas — 4.4% |
Brigham Minerals, Inc. Class A | | | 46,403 | | | $ | 1,142,906 | |
Chesapeake Energy Corp. (a) | | | 12,469 | | | | 1,011,236 | |
Magnolia Oil & Gas Corp. Class A | | | 65,447 | | | | 1,373,732 | |
PDC Energy, Inc. | | | 6,560 | | | | 404,162 | |
SM Energy Co. | | | 7,700 | | | | 263,263 | |
Viper Energy Partners LP (c) | | | 46,378 | | | | 1,237,365 | |
Whiting Petroleum Corp. | | | 13,164 | | | | 895,547 | |
| | | | | | | | 6,328,211 | |
Oil & Gas Services — 0.2% |
Aris Water Solution, Inc. Class A | | | 17,038 | | | | 284,194 | |
| | | | | | | | 8,501,415 | |
Financial — 16.7% |
Banks — 4.6% |
Ameris Bancorp | | | 39,877 | | | | 1,602,258 | |
Atlantic Union Bankshares Corp. | | | 25,931 | | | | 879,579 | |
Cadence Bank | | | 31,225 | | | | 733,163 | |
First Interstate BancSystem, Inc. Class A | | | 24,597 | | | | 937,392 | |
National Bank Holdings Corp. Class A | | | 22,345 | | | | 855,143 | |
Seacoast Banking Corp. of Florida | | | 30,479 | | | | 1,007,026 | |
Synovus Financial Corp. | | | 15,019 | | | | 541,435 | |
| | | | | | | | 6,555,996 | |
Diversified Financial Services — 3.1% |
Air Lease Corp. | | | 26,265 | | | | 878,039 | |
Hannon Armstrong Sustainable Infrastructure Capital, Inc. (a) | | | 46,966 | | | | 1,778,133 | |
PRA Group, Inc. (b) | | | 25,431 | | | | 924,671 | |
StepStone Group, Inc. Class A | | | 29,650 | | | | 771,790 | |
| | | | | | | | 4,352,633 | |
Insurance — 2.4% |
Assured Guaranty Ltd. | | | 21,647 | | | | 1,207,686 | |
Kemper Corp. | | | 16,029 | | | | 767,789 | |
MGIC Investment Corp. | | | 31,826 | | | | 401,008 | |
Selective Insurance Group, Inc. | | | 12,367 | | | | 1,075,187 | |
| | | | | | | | 3,451,670 | |
Real Estate — 0.6% |
McGrath RentCorp | | | 11,132 | | | | 846,032 | |
Real Estate Investment Trusts (REITS) — 6.0% |
Centerspace | | | 9,496 | | | | 774,399 | |
Douglas Emmett, Inc. | | | 27,811 | | | | 622,410 | |
Essential Properties Realty Trust, Inc. | | | 72,947 | | | | 1,567,631 | |
Independence Realty Trust, Inc. | | | 42,640 | | | | 883,927 | |
National Storage Affiliates Trust | | | 14,038 | | | | 702,883 | |
Phillips Edison & Co., Inc. | | | 54,641 | | | | 1,825,556 | |
PotlatchDeltic Corp. | | | 17,722 | | | | 783,135 | |
Ryman Hospitality Properties, Inc. (b) | | | 11,189 | | | | 850,700 | |
The accompanying notes are an integral part of the financial statements.
87
MML Small Cap Growth Equity Fund – Portfolio of Investments (Continued) |
| | | Number of
Shares | | | Value | |
Xenia Hotels & Resorts, Inc. (b) | | | 43,835 | | | $ | 636,922 | |
| | | | | | | | 8,647,563 | |
Industrial — 17.6% |
Aerospace & Defense — 2.1% |
Curtiss-Wright Corp. | | | 9,038 | | | | 1,193,558 | |
Mercury Systems, Inc. (b) | | | 16,783 | | | | 1,079,651 | |
Spirit AeroSystems Holdings, Inc. Class A | | | 24,617 | | | | 721,278 | |
| | | | | | | | 2,994,487 | |
Building Materials — 0.4% |
Louisiana-Pacific Corp. | | | 10,816 | | | | 566,867 | |
Electrical Components & Equipment — 1.1% |
Acuity Brands, Inc. | | | 6,236 | | | | 960,593 | |
Novanta, Inc. (b) | | | 5,065 | | | | 614,233 | |
| | | | | | | | 1,574,826 | |
Electronics — 0.8% |
II-VI, Inc. (a) (b) | | | 23,276 | | | | 1,185,912 | |
Engineering & Construction — 1.5% |
Fluor Corp. (b) | | | 90,424 | | | | 2,200,920 | |
Environmental Controls — 0.6% |
Clean Harbors, Inc. (b) | | | 9,312 | | | | 816,383 | |
Hand & Machine Tools — 1.3% |
Enerpac Tool Group Corp. | | | 35,158 | | | | 668,705 | |
Kennametal, Inc. | | | 28,740 | | | | 667,630 | |
Regal Rexnord Corp. | | | 4,850 | | | | 550,572 | |
| | | | | | | | 1,886,907 | |
Machinery – Diversified — 6.6% |
Albany International Corp. Class A | | | 11,089 | | | | 873,702 | |
Applied Industrial Technologies, Inc. | | | 17,708 | | | | 1,702,978 | |
Cactus, Inc. Class A | | | 17,447 | | | | 702,591 | |
Chart Industries, Inc. (a) (b) | | | 8,879 | | | | 1,486,167 | |
Enovis Corp. (b) | | | 12,628 | | | | 694,540 | |
Esab Corp. | | | 16,716 | | | | 731,325 | |
Flowserve Corp. | | | 25,973 | | | | 743,607 | |
The Middleby Corp. (b) | | | 7,568 | | | | 948,725 | |
Zurn Water Solutions Corp. | | | 56,659 | | | | 1,543,391 | |
| | | | | | | | 9,427,026 | |
Metal Fabricate & Hardware — 1.0% |
Helios Technologies, Inc. | | | 22,363 | | | | 1,481,549 | |
Miscellaneous - Manufacturing — 0.4% |
John Bean Technologies Corp. | | | 4,619 | | | | 510,030 | |
| | | Number of
Shares | | | Value | |
Packaging & Containers — 0.7% |
Graphic Packaging Holding Co. | | | 49,851 | | | $ | 1,021,945 | |
Transportation — 0.6% |
Kirby Corp. (b) | | | 13,581 | | | | 826,268 | |
Trucking & Leasing — 0.5% |
GATX Corp. | | | 7,787 | | | | 733,224 | |
| | | | | | | | 25,226,344 | |
Technology — 10.9% |
Computers — 1.6% |
Rapid7, Inc. (b) | | | 26,482 | | | | 1,768,998 | |
Varonis Systems, Inc. (b) | | | 19,451 | | | | 570,303 | |
| | | | | | | | 2,339,301 | |
Semiconductors — 3.3% |
Cirrus Logic, Inc. (b) | | | 8,401 | | | | 609,408 | |
FormFactor, Inc. (b) | | | 19,092 | | | | 739,433 | |
MKS Instruments, Inc. | | | 4,825 | | | | 495,190 | |
Power Integrations, Inc. | | | 10,345 | | | | 775,978 | |
Synaptics, Inc. (b) | | | 9,772 | | | | 1,153,585 | |
Tower Semiconductor Ltd. (b) | | | 20,694 | | | | 955,649 | |
| | | | | | | | 4,729,243 | |
Software — 6.0% |
Avalara, Inc. (b) | | | 7,521 | | | | 530,983 | |
Concentrix Corp. | | | 2,078 | | | | 281,860 | |
DoubleVerify Holdings, Inc. (b) | | | 28,170 | | | | 638,614 | |
Five9, Inc. (b) | | | 10,444 | | | | 951,866 | |
Jamf Holding Corp. (a) (b) | | | 73,853 | | | | 1,829,339 | |
Manhattan Associates, Inc. (b) | | | 5,409 | | | | 619,871 | |
New Relic, Inc. (b) | | | 10,017 | | | | 501,351 | |
Olo, Inc. Class A (a) (b) | | | 16,122 | | | | 159,124 | |
RingCentral, Inc. Class A (b) | | | 13,875 | | | | 725,108 | |
Verra Mobility Corp. (b) | | | 95,313 | | | | 1,497,367 | |
Ziff Davis, Inc. (b) | | | 10,550 | | | | 786,291 | |
| | | | | | | | 8,521,774 | |
| | | | | | | | 15,590,318 | |
Utilities — 1.2% |
Electric — 0.7% |
Portland General Electric Co. | | | 20,746 | | | | 1,002,654 | |
Gas — 0.5% |
ONE Gas, Inc. | | | 9,661 | | | | 784,377 | |
| | | | | | | | 1,787,031 | |
| | | | | | | | | |
TOTAL COMMON STOCK (Cost $145,118,949) | | | | | | | 135,065,243 | |
| | | | | | | | | |
TOTAL EQUITIES (Cost $145,118,949) | | | | | | | 135,065,243 | |
The accompanying notes are an integral part of the financial statements.
88
MML Small Cap Growth Equity Fund – Portfolio of Investments (Continued) |
| | | Number of
Shares | | | Value | |
MUTUAL FUNDS — 4.7% |
Diversified Financial Services — 4.7% |
iShares Russell 2000 ETF (a) | | | 1,906 | | | $ | 322,801 | |
iShares Russell 2000 Growth ETF | | | 16,082 | | | | 3,317,877 | |
State Street Navigator Securities Lending Government Money Market Portfolio (d) | | | 3,141,719 | | | | 3,141,719 | |
| | | | | | | | 6,782,397 | |
| | | | | | | | | |
TOTAL MUTUAL FUNDS (Cost $7,057,908) | | | | | | | 6,782,397 | |
| | | | | | | | | |
TOTAL LONG-TERM INVESTMENTS (Cost $152,176,857) | | | | | | | 141,847,640 | |
| | | Principal
Amount | | | | | |
SHORT-TERM INVESTMENTS — 1.1% |
Repurchase Agreement — 1.1% |
Fixed Income Clearing Corp., Repurchase Agreement, dated 6/30/22, 0.240%, due 7/01/22 (e) | | $ | 1,557,535 | | | | 1,557,535 | |
| | | | | | | | | |
TOTAL SHORT-TERM INVESTMENTS (Cost $1,557,535) | | | | | | | 1,557,535 | |
| | | | | | | | | |
TOTAL INVESTMENTS — 100.1% (Cost $153,734,392) (f) | | | | | | | 143,405,175 | |
| | | | | | | | | |
Other Assets/(Liabilities) — (0.1)% | | | | | | | (128,507 | ) |
| | | | | | | | | |
NET ASSETS — 100.0% | | | | | | $ | 143,276,668 | |
Abbreviation Legend
ADR | American Depositary Receipt |
Notes to Portfolio of Investments
Percentages are stated as a percent of net assets.
(a) | Denotes all or a portion of security on loan. The total value of securities on loan as of June 30, 2022, was $10,225,545 or 7.14% of net assets. Total securities on loan may be less than the amounts identified in the Portfolio of Investments. The Fund received $7,331,280 of non-cash collateral (U.S. Treasury and/or Agency obligations) related to securities lending activity. This amount is not reflected on either the Portfolio of Investments or the Statement of Assets and Liabilities. (Note 2). |
(b) | Non-income producing security. |
(c) | Security is a Master Limited Partnership. |
(d) | Represents investment of security lending cash collateral. (Note 2). |
(e) | Maturity value of $1,557,545. Collateralized by U.S. Government Agency obligations with a rate of 3.000%, maturity date of 6/30/24, and an aggregate market value, including accrued interest, of $1,588,760. |
(f) | See Note 6 for aggregate cost for federal tax purposes. |
The accompanying notes are an integral part of the financial statements.
89
MML Small Company Value Fund – Portfolio of Investments |
June 30, 2022 (Unaudited) |
| | | Number of
Shares | | | Value | |
EQUITIES — 99.4% |
COMMON STOCK — 99.4% |
Basic Materials — 1.1% |
Chemicals — 1.1% |
Minerals Technologies, Inc. | | | 13,857 | | | $ | 849,988 | |
Communications — 1.0% |
Advertising — 0.7% |
Entravision Communications Corp. Class A | | | 114,020 | | | | 519,931 | |
Internet — 0.2% |
Solo Brands, Inc. Class A (a) (b) | | | 36,851 | | | | 149,615 | |
Media — 0.1% |
Townsquare Media, Inc. Class A (a) | | | 12,543 | | | | 102,727 | |
| | | | | | | | 772,273 | |
Consumer, Cyclical — 17.8% |
Apparel — 1.9% |
Tapestry, Inc. | | | 49,462 | | | | 1,509,580 | |
Distribution & Wholesale — 1.7% |
A-Mark Precious Metals, Inc. | | | 16,082 | | | | 518,645 | |
KAR Auction Services, Inc. (a) | | | 54,107 | | | | 799,160 | |
| | | | | | | | 1,317,805 | |
Entertainment — 1.2% |
Accel Entertainment, Inc. (a) | | | 57,888 | | | | 614,771 | |
Penn National Gaming, Inc. (a) | | | 10,174 | | | | 309,493 | |
| | | | | | | | 924,264 | |
Food Services — 0.4% |
Healthcare Services Group, Inc. | | | 19,969 | | | | 347,660 | |
Home Builders — 1.6% |
Skyline Champion Corp. (a) | | | 25,629 | | | | 1,215,327 | |
Leisure Time — 3.6% |
Brunswick Corp. | | | 20,228 | | | | 1,322,507 | |
Malibu Boats, Inc. Class A (a) | | | 14,958 | | | | 788,436 | |
OneWater Marine, Inc. Class A (a) (b) | | | 20,731 | | | | 685,159 | |
| | | | | | | | 2,796,102 | |
Lodging — 0.4% |
Boyd Gaming Corp. | | | 6,293 | | | | 313,077 | |
Retail — 6.6% |
Beacon Roofing Supply, Inc. (a) | | | 20,261 | | | | 1,040,605 | |
Dave & Buster’s Entertainment, Inc. (a) | | | 21,519 | | | | 705,393 | |
GMS, Inc. (a) | | | 20,145 | | | | 896,452 | |
MarineMax, Inc. (a) | | | 22,582 | | | | 815,662 | |
Penske Automotive Group, Inc. | | | 14,185 | | | | 1,485,028 | |
Red Robin Gourmet Burgers, Inc. (a) | | | 25,507 | | | | 204,821 | |
| | | | | | | | 5,147,961 | |
| | | Number of
Shares | | | Value | |
Textiles — 0.4% |
UniFirst Corp. | | | 1,832 | | | $ | 315,434 | |
| | | | | | | | 13,887,210 | |
Consumer, Non-cyclical — 16.7% |
Commercial Services — 9.1% |
AMN Healthcare Services, Inc. (a) | | | 4,230 | | | | 464,073 | |
Barrett Business Services, Inc. | | | 5,875 | | | | 428,111 | |
The Brink’s Co. | | | 26,041 | | | | 1,580,949 | |
Deluxe Corp. | | | 33,368 | | | | 723,085 | |
Euronet Worldwide, Inc. (a) | | | 2,844 | | | | 286,078 | |
EVERTEC, Inc. | | | 46,021 | | | | 1,697,255 | |
Korn Ferry | | | 23,920 | | | | 1,387,838 | |
Loomis AB | | | 24,112 | | | | 589,472 | |
| | | | | | | | 7,156,861 | |
Cosmetics & Personal Care — 1.7% |
Edgewell Personal Care Co. | | | 39,325 | | | | 1,357,499 | |
Health Care – Products — 2.2% |
Patterson Cos., Inc. | | | 34,379 | | | | 1,041,684 | |
Varex Imaging Corp. (a) | | | 21,217 | | | | 453,832 | |
Zimvie, Inc. (a) | | | 12,317 | | | | 197,195 | |
| | | | | | | | 1,692,711 | |
Health Care – Services — 0.2% |
National HealthCare Corp. | | | 2,551 | | | | 178,315 | |
Household Products & Wares — 2.8% |
Spectrum Brands Holdings, Inc. | | | 26,260 | | | | 2,153,845 | |
Pharmaceuticals — 0.7% |
Embecta Corp. (a) | | | 20,626 | | | | 522,250 | |
| | | | | | | | 13,061,481 | |
Energy — 2.0% |
Energy – Alternate Sources — 0.6% |
Enviva, Inc. (b) | | | 8,252 | | | | 472,180 | |
Oil & Gas — 0.2% |
Earthstone Energy, Inc. Class A (a) (b) | | | 12,526 | | | | 170,980 | |
Oil & Gas Services — 1.2% |
ChampionX Corp. | | | 46,880 | | | | 930,568 | |
NCS Multistage Holdings, Inc. (a) | | | 479 | | | | 14,657 | |
| | | | | | | | 945,225 | |
| | | | | | | | 1,588,385 | |
Financial — 34.2% |
Banks — 21.4% |
Ameris Bancorp | | | 24,844 | | | | 998,232 | |
BankUnited, Inc. | | | 27,985 | | | | 995,426 | |
ConnectOne Bancorp, Inc. | | | 15,977 | | | | 390,638 | |
F.N.B. Corp. | | | 125,900 | | | | 1,367,274 | |
First BanCorp | | | 116,229 | | | | 1,500,516 | |
First Hawaiian, Inc. | | | 8,560 | | | | 194,398 | |
The accompanying notes are an integral part of the financial statements.
90
MML Small Company Value Fund – Portfolio of Investments (Continued) |
| | | Number of
Shares | | | Value | |
First Interstate BancSystem, Inc. Class A | | | 11,682 | | | $ | 445,201 | |
First Merchants Corp. | | | 6,399 | | | | 227,932 | |
First Mid Bancshares, Inc. | | | 4,999 | | | | 178,314 | |
Home BancShares, Inc. | | | 49,354 | | | | 1,025,083 | |
Independent Bank Corp. | | | 5,980 | | | | 474,991 | |
Independent Bank Group, Inc. | | | 14,261 | | | | 968,465 | |
Old National Bancorp | | | 95,914 | | | | 1,418,568 | |
Origin Bancorp, Inc. | | | 10,135 | | | | 393,238 | |
Premier Financial Corp. | | | 11,149 | | | | 282,627 | |
QCR Holdings, Inc. | | | 5,926 | | | | 319,945 | |
SouthState Corp. | | | 21,032 | | | | 1,622,619 | |
Towne Bank | | | 14,699 | | | | 399,078 | |
UMB Financial Corp. | | | 18,622 | | | | 1,603,354 | |
Valley National Bancorp | | | 109,418 | | | | 1,139,041 | |
Veritex Holdings, Inc. | | | 27,318 | | | | 799,325 | |
| | | | | | | | 16,744,265 | |
Diversified Financial Services — 0.2% |
Enact Holdings, Inc. | | | 7,102 | | | | 152,551 | |
Insurance — 2.7% |
Axis Capital Holdings Ltd. | | | 26,500 | | | | 1,512,885 | |
James River Group Holdings Ltd. | | | 5,076 | | | | 125,783 | |
ProAssurance Corp. | | | 20,072 | | | | 474,302 | |
| | | | | | | | 2,112,970 | |
Investment Companies — 1.9% |
Compass Diversified Holdings (b) | | | 68,583 | | | | 1,469,048 | |
Private Equity — 0.3% |
Patria Investments Ltd. | | | 16,342 | | | | 216,041 | |
Real Estate Investment Trusts (REITS) — 6.0% |
Brandywine Realty Trust | | | 60,378 | | | | 582,044 | |
CareTrust REIT, Inc. | | | 27,361 | | | | 504,537 | |
Cousins Properties, Inc. | | | 9,967 | | | | 291,335 | |
Easterly Government Properties, Inc. | | | 16,277 | | | | 309,914 | |
Four Corners Property Trust, Inc. | | | 25,402 | | | | 675,439 | |
Getty Realty Corp. | | | 11,773 | | | | 311,985 | |
Healthcare Realty Trust, Inc. | | | 9,112 | | | | 247,846 | |
Highwoods Properties, Inc. | | | 8,129 | | | | 277,931 | |
Kite Realty Group Trust | | | 15,579 | | | | 269,361 | |
National Health Investors, Inc. | | | 8,684 | | | | 526,337 | |
Physicians Realty Trust | | | 15,073 | | | | 263,024 | |
Sabra Health Care REIT, Inc. | | | 16,138 | | | | 225,448 | |
Summit Hotel Properties, Inc. (a) | | | 36,159 | | | | 262,876 | |
| | | | | | | | 4,748,077 | |
Savings & Loans — 1.7% |
Pacific Premier Bancorp, Inc. | | | 32,382 | | | | 946,849 | |
| | | Number of
Shares | | | Value | |
Provident Financial Services, Inc. | | | 17,857 | | | $ | 397,497 | |
| | | | | | | | 1,344,346 | |
| | | | | | | | 26,787,298 | |
Industrial — 19.4% |
Building Materials — 2.1% |
Hayward Holdings, Inc. (a) (b) | | | 30,423 | | | | 437,787 | |
Mohawk Industries, Inc. (a) | | | 4,459 | | | | 553,317 | |
Tecnoglass, Inc. | | | 36,083 | | | | 633,257 | |
| | | | | | | | 1,624,361 | |
Electrical Components & Equipment — 1.2% |
Belden, Inc. | | | 16,453 | | | | 876,451 | |
Graham Corp. | | | 10,695 | | | | 74,010 | |
| | | | | | | | 950,461 | |
Electronics — 5.7% |
Advanced Energy Industries, Inc. | | | 4,517 | | | | 329,651 | |
Avnet, Inc. | | | 31,236 | | | | 1,339,400 | |
Coherent, Inc. (a) | | | 1,342 | | | | 357,267 | |
II-VI, Inc. (a) (b) | | | 36,370 | | | | 1,853,051 | |
Vontier Corp. | | | 26,349 | | | | 605,764 | |
| | | | | | | | 4,485,133 | |
Engineering & Construction — 1.3% |
Dycom Industries, Inc. (a) | | | 10,485 | | | | 975,524 | |
Environmental Controls — 0.4% |
CECO Environmental Corp. (a) | | | 26,748 | | | | 159,953 | |
Charah Solutions, Inc. (a) (b) | | | 32,498 | | | | 121,542 | |
| | | | | | | | 281,495 | |
Hand & Machine Tools — 0.2% |
Luxfer Holdings PLC | | | 11,432 | | | | 172,852 | |
Machinery – Diversified — 3.2% |
DXP Enterprises, Inc. (a) | | | 14,347 | | | | 439,449 | |
Enovis Corp. (a) | | | 12,608 | | | | 693,440 | |
Esab Corp. | | | 12,202 | | | | 533,837 | |
Gates Industrial Corp. PLC (a) | | | 79,005 | | | | 854,044 | |
| | | | | | | | 2,520,770 | |
Metal Fabricate & Hardware — 2.3% |
The Timken Co. | | | 34,296 | | | | 1,819,403 | |
Miscellaneous - Manufacturing — 0.1% |
DIRTT Environmental Solutions (a) (b) | | | 64,423 | | | | 68,933 | |
Packaging & Containers — 2.9% |
Graphic Packaging Holding Co. | | | 71,409 | | | | 1,463,884 | |
Karat Packaging, Inc. (a) | | | 5,817 | | | | 99,238 | |
Pactiv Evergreen, Inc. | | | 72,526 | | | | 722,359 | |
| | | | | | | | 2,285,481 | |
| | | | | | | | 15,184,413 | |
The accompanying notes are an integral part of the financial statements.
91
MML Small Company Value Fund – Portfolio of Investments (Continued) |
| | | Number of
Shares | | | Value | |
Technology — 5.9% |
Semiconductors — 2.4% |
Cohu, Inc. (a) | | | 20,980 | | | $ | 582,195 | |
Kulicke & Soffa Industries, Inc. | | | 29,916 | | | | 1,280,704 | |
| | | | | | | | 1,862,899 | |
Software — 3.5% |
Avaya Holdings Corp. (a) (b) | | | 73,790 | | | | 165,290 | |
Donnelley Financial Solutions, Inc. (a) | | | 26,239 | | | | 768,540 | |
IBEX Holdings Ltd. (a) (b) | | | 12,740 | | | | 214,924 | |
Teradata Corp. (a) | | | 42,820 | | | | 1,584,768 | |
| | | | | | | | 2,733,522 | |
| | | | | | | | 4,596,421 | |
Utilities — 1.3% |
Electric — 0.7% |
ALLETE, Inc. | | | 4,281 | | | | 251,637 | |
PNM Resources, Inc. | | | 6,291 | | | | 300,584 | |
| | | | | | | | 552,221 | |
Gas — 0.6% |
Northwest Natural Holding Co. | | | 2,957 | | | | 157,017 | |
Southwest Gas Holdings, Inc. | | | 3,647 | | | | 317,581 | |
| | | | | | | | 474,598 | |
| | | | | | | | 1,026,819 | |
| | | | | | | | | |
TOTAL COMMON STOCK (Cost $92,984,156) | | | | | | | 77,754,288 | |
| | | | | | | | | |
TOTAL EQUITIES (Cost $92,984,156) | | | | | | | 77,754,288 | |
| | | | | | | | | |
MUTUAL FUNDS — 0.9% |
Diversified Financial Services — 0.9% |
State Street Navigator Securities Lending Government Money Market Portfolio (c) | | | 718,563 | | | | 718,563 | |
| | | | | | | | | |
TOTAL MUTUAL FUNDS (Cost $718,563) | | | | | | | 718,563 | |
| | | | | | | | | |
TOTAL LONG-TERM INVESTMENTS (Cost $93,702,719) | | | | | | | 78,472,851 | |
| | | Principal
Amount | | | Value | |
| SHORT-TERM INVESTMENTS — 0.9% |
| Repurchase Agreement — 0.9% |
| Fixed Income Clearing Corp., Repurchase Agreement, dated 6/30/22, 0.240%, due 7/01/22 (d) | | $ | 713,729 | | | $ | 713,729 | |
| | | | | | | | | |
| TOTAL SHORT-TERM INVESTMENTS (Cost $713,729) | | | | | | | 713,729 | |
| | | | | | | | | |
| TOTAL INVESTMENTS — 101.2% (Cost $94,416,448) (e) | | | | | | | 79,186,580 | |
| | | | | | | | | |
| Other Assets/(Liabilities) — (1.2)% | | | | | | | (941,736 | ) |
| | | | | | | | | |
| NET ASSETS — 100.0% | | | | | | $ | 78,244,844 | |
Notes to Portfolio of Investments
Percentages are stated as a percent of net assets.
(a) | Non-income producing security. |
(b) | Denotes all or a portion of security on loan. The total value of securities on loan as of June 30, 2022, was $5,039,624 or 6.44% of net assets. Total securities on loan may be less than the amounts identified in the Portfolio of Investments. The Fund received $4,472,990 of non-cash collateral (U.S. Treasury and/or Agency obligations) related to securities lending activity. This amount is not reflected on either the Portfolio of Investments or the Statement of Assets and Liabilities. (Note 2). |
(c) | Represents investment of security lending cash collateral. (Note 2). |
(d) | Maturity value of $713,734. Collateralized by U.S. Government Agency obligations with a rate of 3.000%, maturity date of 6/30/24, and an aggregate market value, including accrued interest, of $728,103. |
(e) | See Note 6 for aggregate cost for federal tax purposes. |
The accompanying notes are an integral part of the financial statements.
92
MML Small Company Value Fund – Portfolio of Investments (Continued) |
Forward contracts
Counterparty | | Settlement
Date | | | Currency Purchased | | | Currency Sold | | | Unrealized
Appreciation
(Depreciation) | |
UBS AG* | | | 9/30/22 | | | | USD | | | | 499,080 | | | | SEK | | | | 5,066,413 | | | $ | 1,984 | |
* Contracts are subject to a master netting agreement or similar agreement.
Currency Legend
The accompanying notes are an integral part of the financial statements.
93
MML Small/Mid Cap Value Fund – Portfolio of Investments |
June 30, 2022 (Unaudited) |
| | | Number of
Shares | | | Value | |
EQUITIES — 99.4% |
COMMON STOCK — 99.4% |
Basic Materials — 5.2% |
Chemicals — 1.8% |
Huntsman Corp. | | | 49,190 | | | $ | 1,394,536 | |
Innospec, Inc. | | | 11,253 | | | | 1,077,925 | |
| | | | | | | | 2,472,461 | |
Iron & Steel — 2.5% |
Allegheny Technologies, Inc. (a) | | | 63,240 | | | | 1,436,180 | |
Carpenter Technology Corp. | | | 24,584 | | | | 686,140 | |
Reliance Steel & Aluminum Co. | | | 7,585 | | | | 1,288,388 | |
| | | | | | | | 3,410,708 | |
Mining — 0.9% |
Cameco Corp. | | | 58,000 | | | | 1,219,160 | |
| | | | | | | | 7,102,329 | |
Communications — 1.1% |
Internet — 1.1% |
Criteo SA Sponsored ADR (a) | | | 58,681 | | | | 1,431,817 | |
Consumer, Cyclical — 15.4% |
Airlines — 0.7% |
SkyWest, Inc. (a) | | | 42,347 | | | | 899,874 | |
Apparel — 3.2% |
Carter’s, Inc. | | | 21,280 | | | | 1,499,814 | |
Ralph Lauren Corp. | | | 15,400 | | | | 1,380,610 | |
Tapestry, Inc. | | | 47,400 | | | | 1,446,648 | |
| | | | | | | | 4,327,072 | |
Auto Parts & Equipment — 1.9% |
Dana, Inc. | | | 76,736 | | | | 1,079,676 | |
The Goodyear Tire & Rubber Co. (a) | | | 139,850 | | | | 1,497,793 | |
| | | | | | | | 2,577,469 | |
Entertainment — 0.7% |
Scientific Games Corp. Class A (a) | | | 19,820 | | | | 931,342 | |
Home Builders — 2.9% |
KB Home | | | 41,940 | | | | 1,193,613 | |
PulteGroup, Inc. | | | 47,040 | | | | 1,864,195 | |
Taylor Morrison Home Corp. (a) | | | 38,534 | | | | 900,154 | |
| | | | | | | | 3,957,962 | |
Home Furnishing — 1.0% |
MillerKnoll, Inc. | | | 49,590 | | | | 1,302,729 | |
Lodging — 0.8% |
Hilton Grand Vacations, Inc. (a) | | | 30,270 | | | | 1,081,547 | |
Retail — 4.2% |
Dine Brands Global, Inc. | | | 22,031 | | | | 1,433,778 | |
Papa John’s International, Inc. | | | 17,141 | | | | 1,431,616 | |
Sally Beauty Holdings, Inc. (a) | | | 99,230 | | | | 1,182,822 | |
| | | Number of
Shares | | | Value | |
Williams-Sonoma, Inc. | | | 15,011 | | | $ | 1,665,470 | |
| | | | | | | | 5,713,686 | |
| | | | | | | | 20,791,681 | |
Consumer, Non-cyclical — 14.6% |
Commercial Services — 4.8% |
ADT, Inc. | | | 188,580 | | | | 1,159,767 | |
Herc Holdings, Inc. | | | 15,510 | | | | 1,398,226 | |
Korn Ferry | | | 23,490 | | | | 1,362,890 | |
Robert Half International, Inc. | | | 14,478 | | | | 1,084,257 | |
WillScot Mobile Mini Holdings Corp. (a) | | | 44,480 | | | | 1,442,042 | |
| | | | | | | | 6,447,182 | |
Food — 2.5% |
The Hain Celestial Group, Inc. (a) | | | 62,325 | | | | 1,479,596 | |
Nomad Foods Ltd. (a) | | | 96,587 | | | | 1,930,774 | |
| | | | | | | | 3,410,370 | |
Health Care – Products — 2.7% |
Envista Holdings Corp. (a) | | | 47,570 | | | | 1,833,348 | |
Integra LifeSciences Holdings Corp. (a) | | | 33,550 | | | | 1,812,706 | |
| | | | | | | | 3,646,054 | |
Health Care – Services — 4.6% |
Acadia Healthcare Co., Inc. (a) | | | 32,130 | | | | 2,172,952 | |
MEDNAX, Inc. (a) | | | 93,620 | | | | 1,966,956 | |
Syneos Health, Inc. (a) | | | 28,320 | | | | 2,029,978 | |
| | | | | | | | 6,169,886 | |
| | | | | | | | 19,673,492 | |
Energy — 3.7% |
Oil & Gas — 3.7% |
Coterra Energy, Inc. | | | 30,731 | | | | 792,553 | |
Helmerich & Payne, Inc. | | | 34,500 | | | | 1,485,570 | |
HF Sinclair Corp. | | | 36,195 | | | | 1,634,566 | |
Magnolia Oil & Gas Corp. Class A | | | 51,760 | | | | 1,086,442 | |
| | | | | | | | 4,999,131 | |
| | | | | | | | 4,999,131 | |
Financial — 27.4% |
Banks — 13.2% |
BankUnited, Inc. | | | 45,600 | | | | 1,621,992 | |
Comerica, Inc. | | | 28,370 | | | | 2,081,791 | |
First BanCorp | | | 145,610 | | | | 1,879,825 | |
First Citizens BancShares, Inc. Class A | | | 3,419 | | | | 2,235,274 | |
First Hawaiian, Inc. | | | 72,120 | | | | 1,637,845 | |
Synovus Financial Corp. | | | 42,624 | | | | 1,536,595 | |
Texas Capital Bancshares, Inc. (a) | | | 31,658 | | | | 1,666,477 | |
Webster Financial Corp. | | | 35,919 | | | | 1,513,986 | |
Wintrust Financial Corp. | | | 23,800 | | | | 1,907,570 | |
The accompanying notes are an integral part of the financial statements.
94
MML Small/Mid Cap Value Fund – Portfolio of Investments (Continued) |
| | | Number of
Shares | | | Value | |
Zions Bancorp NA | | | 34,798 | | | $ | 1,771,218 | |
| | | | | | | | 17,852,573 | |
Diversified Financial Services — 2.1% |
Moelis & Co. Class A | | | 36,806 | | | | 1,448,316 | |
Stifel Financial Corp. | | | 23,670 | | | | 1,325,994 | |
| | | | | | | | 2,774,310 | |
Insurance — 4.6% |
American Financial Group, Inc. | | | 12,178 | | | | 1,690,428 | |
The Hanover Insurance Group, Inc. | | | 12,138 | | | | 1,775,182 | |
Kemper Corp. | | | 25,500 | | | | 1,221,450 | |
Selective Insurance Group, Inc. | | | 17,507 | | | | 1,522,059 | |
| | | | | | | | 6,209,119 | |
Real Estate Investment Trusts (REITS) — 7.5% |
American Campus Communities, Inc. | | | 10,102 | | | | 651,276 | |
Broadstone Net Lease, Inc. | | | 67,730 | | | | 1,389,142 | |
Camden Property Trust | | | 15,228 | | | | 2,047,862 | |
Cousins Properties, Inc. | | | 46,070 | | | | 1,346,626 | |
CubeSmart | | | 30,974 | | | | 1,323,209 | |
Physicians Realty Trust | | | 134,123 | | | | 2,340,447 | |
STAG Industrial, Inc. | | | 34,182 | | | | 1,055,540 | |
| | | | | | | | 10,154,102 | |
| | | | | | | | 36,990,104 | |
Industrial — 21.4% |
Aerospace & Defense — 1.1% |
Spirit AeroSystems Holdings, Inc. Class A | | | 53,210 | | | | 1,559,053 | |
Building Materials — 1.0% |
Masonite International Corp. (a) | | | 17,281 | | | | 1,327,699 | |
Electrical Components & Equipment — 0.9% |
Belden, Inc. | | | 23,414 | | | | 1,247,264 | |
Electronics — 2.3% |
Avnet, Inc. | | | 38,250 | | | | 1,640,160 | |
Sensata Technologies Holding PLC | | | 34,290 | | | | 1,416,520 | |
| | | | | | | | 3,056,680 | |
Engineering & Construction — 4.0% |
AECOM | | | 29,290 | | | | 1,910,294 | |
Arcosa, Inc. | | | 31,860 | | | | 1,479,260 | |
Dycom Industries, Inc. (a) | | | 21,568 | | | | 2,006,686 | |
| | | | | | | | 5,396,240 | |
Hand & Machine Tools — 1.0% |
Regal Rexnord Corp. | | | 11,982 | | | | 1,360,197 | |
Machinery – Construction & Mining — 1.9% |
Oshkosh Corp. | | | 15,981 | | | | 1,312,679 | |
Vertiv Holdings Co. | | | 150,090 | | | | 1,233,740 | |
| | | | | | | | 2,546,419 | |
| | | Number of
Shares | | | Value | |
Machinery – Diversified — 0.5% |
Cactus, Inc. Class A | | | 18,540 | | | $ | 746,606 | |
Metal Fabricate & Hardware — 0.9% |
The Timken Co. | | | 22,390 | | | | 1,187,789 | |
Packaging & Containers — 2.5% |
Berry Global Group, Inc. (a) | | | 42,330 | | | | 2,312,911 | |
Sealed Air Corp. | | | 18,060 | | | | 1,042,423 | |
| | | | | | | | 3,355,334 | |
Transportation — 5.0% |
Kirby Corp. (a) | | | 29,880 | | | | 1,817,899 | |
Knight-Swift Transportation Holdings, Inc. | | | 42,303 | | | | 1,958,206 | |
Star Bulk Carriers Corp. | | | 49,270 | | | | 1,231,257 | |
XPO Logistics, Inc. (a) | | | 36,110 | | | | 1,739,058 | |
| | | | | | | | 6,746,420 | |
Trucking & Leasing — 0.3% |
GATX Corp. | | | 3,997 | | | | 376,358 | |
| | | | | | | | 28,906,059 | |
Technology — 7.7% |
Computers — 2.1% |
Genpact Ltd. | | | 23,000 | | | | 974,280 | |
Lumentum Holdings, Inc. (a) | | | 23,140 | | | | 1,837,779 | |
| | | | | | | | 2,812,059 | |
Semiconductors — 1.6% |
Kulicke & Soffa Industries, Inc. | | | 18,722 | | | | 801,489 | |
ON Semiconductor Corp. (a) | | | 26,300 | | | | 1,323,153 | |
| | | | | | | | 2,124,642 | |
Software — 4.0% |
ACI Worldwide, Inc. (a) | | | 62,090 | | | | 1,607,510 | |
Change Healthcare, Inc. (a) | | | 92,380 | | | | 2,130,283 | |
CommVault Systems, Inc. (a) | | | 27,895 | | | | 1,754,595 | |
| | | | | | | | 5,492,388 | |
| | | | | | | | 10,429,089 | |
Utilities — 2.9% |
Electric — 1.7% |
IDACORP, Inc. | | | 22,311 | | | | 2,363,181 | |
Gas — 1.2% |
Southwest Gas Holdings, Inc. | | | 18,000 | | | | 1,567,440 | |
| | | | | | | | 3,930,621 | |
| | | | | | | | | |
TOTAL COMMON STOCK (Cost $139,570,109) | | | | | | | 134,254,323 | |
| | | | | | | | | |
TOTAL EQUITIES (Cost $139,570,109) | | | | | | | 134,254,323 | |
| | | | | | | | | |
The accompanying notes are an integral part of the financial statements.
95
MML Small/Mid Cap Value Fund – Portfolio of Investments (Continued) |
| | | Number of
Shares | | | Value | |
TOTAL LONG-TERM INVESTMENTS (Cost $139,570,109) | | | | | | $ | 134,254,323 | |
| | | Principal
Amount | | | | | |
SHORT-TERM INVESTMENTS — 1.4% |
Repurchase Agreement — 1.4% |
Fixed Income Clearing Corp., Repurchase Agreement, dated 6/30/22, 0.240%, due 7/01/22 (b) | | $ | 1,811,476 | | | | 1,811,476 | |
| | | | | | | | | |
TOTAL SHORT-TERM INVESTMENTS (Cost $1,811,476) | | | | | | | 1,811,476 | |
| | | | | | | | | |
TOTAL INVESTMENTS — 100.8% (Cost $141,381,585) (c) | | | | | | | 136,065,799 | |
| | | | | | | | | |
Other Assets/(Liabilities) — (0.8)% | | | | | | | (1,018,442 | ) |
| | | | | | | | | |
NET ASSETS — 100.0% | | | | | | $ | 135,047,357 | |
Abbreviation Legend
ADR | American Depositary Receipt |
Notes to Portfolio of Investments
Percentages are stated as a percent of net assets.
(a) | Non-income producing security. |
(b) | Maturity value of $1,811,488. Collateralized by U.S. Government Agency obligations with a rate of 3.000%, maturity date of 6/30/24, and an aggregate market value, including accrued interest, of $1,847,776. |
(c) | See Note 6 for aggregate cost for federal tax purposes. |
The accompanying notes are an integral part of the financial statements.
96
MML Sustainable Equity Fund – Portfolio of Investments |
June 30, 2022 (Unaudited) |
| | | Number of
Shares | | | Value | |
EQUITIES — 99.8% |
COMMON STOCK — 99.8% |
Basic Materials — 2.5% |
Chemicals — 2.5% |
Air Products & Chemicals, Inc. | | | 2,476 | | | $ | 595,428 | |
Ecolab, Inc. | | | 3,973 | | | | 610,889 | |
Linde PLC | | | 6,134 | | | | 1,763,709 | |
The Sherwin-Williams Co. | | | 1,498 | | | | 335,417 | |
| | | | | | | | 3,305,443 | |
| | | | | | | | 3,305,443 | |
Communications — 14.5% |
Internet — 9.9% |
Alphabet, Inc. Class A (a) | | | 3,150 | | | | 6,864,669 | |
Amazon.com, Inc. (a) | | | 35,680 | | | | 3,789,573 | |
Booking Holdings, Inc. (a) | | | 461 | | | | 806,284 | |
CDW Corp. | | | 7,703 | | | | 1,213,685 | |
Expedia Group, Inc. (a) | | | 3,714 | | | | 352,199 | |
Uber Technologies, Inc. (a) | | | 9,188 | | | | 187,986 | |
| | | | | | | | 13,214,396 | |
Media — 1.3% |
Comcast Corp. Class A | | | 14,855 | | | | 582,910 | |
The Walt Disney Co. (a) | | | 11,575 | | | | 1,092,680 | |
| | | | | | | | 1,675,590 | |
Telecommunications — 3.3% |
Cisco Systems, Inc. | | | 57,528 | | | | 2,452,994 | |
Verizon Communications, Inc. | | | 37,050 | | | | 1,880,288 | |
| | | | | | | | 4,333,282 | |
| | | | | | | | 19,223,268 | |
Consumer, Cyclical — 8.0% |
Apparel — 1.0% |
Deckers Outdoor Corp. (a) | | | 1,455 | | | | 371,534 | |
NIKE, Inc. Class B | | | 8,910 | | | | 910,602 | |
| | | | | | | | 1,282,136 | |
Auto Manufacturers — 2.2% |
Cummins, Inc. | | | 5,213 | | | | 1,008,872 | |
Tesla, Inc. (a) | | | 2,944 | | | | 1,982,549 | |
| | | | | | | | 2,991,421 | |
Auto Parts & Equipment — 0.7% |
Aptiv PLC (a) | | | 10,548 | | | | 939,510 | |
Retail — 4.1% |
Chipotle Mexican Grill, Inc. (a) | | | 218 | | | | 284,983 | |
Costco Wholesale Corp. | | | 1,900 | | | | 910,632 | |
The Home Depot, Inc. | | | 8,103 | | | | 2,222,410 | |
Target Corp. | | | 3,581 | | | | 505,745 | |
The TJX Cos., Inc. | | | 19,063 | | | | 1,064,668 | |
| | | Number of
Shares | | | Value | |
Tractor Supply Co. | | | 2,376 | | | $ | 460,587 | |
| | | | | | | | 5,449,025 | |
| | | | | | | | 10,662,092 | |
Consumer, Non-cyclical — 21.4% |
Agriculture — 0.0% |
Vital Farms, Inc. (a) | | | 5,603 | | | | 49,026 | |
Beverages — 1.8% |
PepsiCo, Inc. | | | 14,239 | | | | 2,373,072 | |
Biotechnology — 0.8% |
Amgen, Inc. | | | 2,322 | | | | 564,943 | |
Vertex Pharmaceuticals, Inc. (a) | | | 1,865 | | | | 525,538 | |
| | | | | | | | 1,090,481 | |
Commercial Services — 1.1% |
S&P Global, Inc. | | | 4,224 | | | | 1,423,741 | |
Cosmetics & Personal Care — 2.2% |
Colgate-Palmolive Co. | | | 8,512 | | | | 682,152 | |
The Estee Lauder Cos., Inc. Class A | | | 2,265 | | | | 576,827 | |
The Procter & Gamble Co. | | | 11,640 | | | | 1,673,716 | |
| | | | | | | | 2,932,695 | |
Food — 2.2% |
Mondelez International, Inc. Class A | | | 17,849 | | | | 1,108,245 | |
Sysco Corp. | | | 20,958 | | | | 1,775,352 | |
| | | | | | | | 2,883,597 | |
Health Care – Products — 2.6% |
Edwards Lifesciences Corp. (a) | | | 13,861 | | | | 1,318,042 | |
Medtronic PLC | | | 3,225 | | | | 289,444 | |
ResMed, Inc. | | | 1,386 | | | | 290,547 | |
Thermo Fisher Scientific, Inc. | | | 2,818 | | | | 1,530,963 | |
| | | | | | | | 3,428,996 | |
Health Care – Services — 2.5% |
Humana, Inc. | | | 1,537 | | | | 719,424 | |
UnitedHealth Group, Inc. | | | 5,076 | | | | 2,607,186 | |
| | | | | | | | 3,326,610 | |
Pharmaceuticals — 8.2% |
AbbVie, Inc. | | | 9,930 | | | | 1,520,879 | |
Bristol-Myers Squibb Co. | | | 25,287 | | | | 1,947,099 | |
Cigna Corp. | | | 7,898 | | | | 2,081,281 | |
CVS Health Corp. | | | 16,931 | | | | 1,568,826 | |
Merck & Co., Inc. | | | 16,811 | | | | 1,532,659 | |
Novo Nordisk A/S Class B | | | 8,206 | | | | 910,795 | |
Zoetis, Inc. | | | 7,317 | | | | 1,257,719 | |
| | | | | | | | 10,819,258 | |
| | | | | | | | 28,327,476 | |
Energy — 4.1% |
Oil & Gas — 2.1% |
ConocoPhillips | | | 31,096 | | | | 2,792,732 | |
The accompanying notes are an integral part of the financial statements.
97
MML Sustainable Equity Fund – Portfolio of Investments (Continued) |
| | | Number of
Shares | | | Value | |
Oil & Gas Services — 2.0% |
Schlumberger NV | | | 74,078 | | | $ | 2,649,029 | |
| | | | | | | | 5,441,761 | |
Financial — 14.8% |
Banks — 4.7% |
Bank of America Corp. | | | 20,271 | | | | 631,036 | |
JP Morgan Chase & Co. | | | 16,640 | | | | 1,873,830 | |
Morgan Stanley | | | 27,080 | | | | 2,059,705 | |
Regions Financial Corp. | | | 90,541 | | | | 1,697,644 | |
| | | | | | | | 6,262,215 | |
Diversified Financial Services — 5.7% |
American Express Co. | | | 6,783 | | | | 940,259 | |
Ameriprise Financial, Inc. | | | 3,498 | | | | 831,405 | |
BlackRock, Inc. | | | 2,013 | | | | 1,225,997 | |
Intercontinental Exchange, Inc. | | | 5,640 | | | | 530,386 | |
Mastercard, Inc. Class A | | | 5,118 | | | | 1,614,627 | |
Visa, Inc. Class A | | | 12,541 | | | | 2,469,197 | |
| | | | | | | | 7,611,871 | |
Insurance — 2.2% |
Marsh & McLennan Cos., Inc. | | | 5,991 | | | | 930,103 | |
Prudential Financial, Inc. | | | 10,556 | | | | 1,009,998 | |
The Travelers Cos., Inc. | | | 5,922 | | | | 1,001,588 | |
| | | | | | | | 2,941,689 | |
Real Estate Investment Trusts (REITS) — 2.2% |
Prologis, Inc. | | | 24,278 | | | | 2,856,307 | |
| | | | | | | | 19,672,082 | |
Industrial — 11.5% |
Aerospace & Defense — 1.3% |
Lockheed Martin Corp. | | | 3,892 | | | | 1,673,404 | |
Building Materials — 1.5% |
Johnson Controls International PLC | | | 27,353 | | | | 1,309,662 | |
Masco Corp. | | | 13,704 | | | | 693,422 | |
| | | | | | | | 2,003,084 | |
Electrical Components & Equipment — 0.3% |
Generac Holdings, Inc. (a) | | | 1,732 | | | | 364,725 | |
Electronics — 2.7% |
Agilent Technologies, Inc. | | | 10,815 | | | | 1,284,498 | |
Honeywell International, Inc. | | | 6,715 | | | | 1,167,134 | |
Keysight Technologies, Inc. (a) | | | 8,146 | | | | 1,122,926 | |
| | | | | | | | 3,574,558 | |
Machinery – Diversified — 1.4% |
Cognex Corp. | | | 8,774 | | | | 373,070 | |
Deere & Co. | | | 1,582 | | | | 473,762 | |
Rockwell Automation, Inc. | | | 2,148 | | | | 428,118 | |
Xylem, Inc. | | | 6,852 | | | | 535,689 | |
| | | | | | | | 1,810,639 | |
| | | Number of
Shares | | | Value | |
Miscellaneous - Manufacturing — 1.2% |
Eaton Corp. PLC | | | 7,137 | | | $ | 899,191 | |
Parker-Hannifin Corp. | | | 3,138 | | | | 772,105 | |
| | | | | | | | 1,671,296 | |
Packaging & Containers — 0.7% |
Ball Corp. | | | 14,037 | | | | 965,324 | |
Transportation — 2.4% |
Norfolk Southern Corp. | | | 3,611 | | | | 820,744 | |
Union Pacific Corp. | | | 3,380 | | | | 720,886 | |
United Parcel Service, Inc. Class B | | | 9,160 | | | | 1,672,067 | |
| | | | | | | | 3,213,697 | |
| | | | | | | | 15,276,727 | |
Technology — 20.9% |
Computers — 5.7% |
Accenture PLC Class A | | | 5,628 | | | | 1,562,614 | |
Apple, Inc. | | | 44,439 | | | | 6,075,700 | |
| | | | | | | | 7,638,314 | |
Semiconductors — 4.5% |
Advanced Micro Devices, Inc. (a) | | | 9,442 | | | | 722,030 | |
Analog Devices, Inc. | | | 9,890 | | | | 1,444,830 | |
Applied Materials, Inc. | | | 9,984 | | | | 908,344 | |
ASML Holding NV | | | 1,627 | | | | 785,236 | |
NVIDIA Corp. | | | 14,059 | | | | 2,131,204 | |
| | | | | | | | 5,991,644 | |
Software — 10.7% |
Adobe, Inc. (a) | | | 1,934 | | | | 707,960 | |
Cadence Design Systems, Inc. (a) | | | 2,733 | | | | 410,032 | |
Electronic Arts, Inc. | | | 4,735 | | | | 576,013 | |
Microsoft Corp. | | | 42,643 | | | | 10,952,002 | |
Salesforce, Inc. (a) | | | 5,447 | | | | 898,973 | |
ServiceNow, Inc. (a) | | | 793 | | | | 377,087 | |
Workday, Inc. Class A (a) | | | 1,671 | | | | 233,238 | |
| | | | | | | | 14,155,305 | |
| | | | | | | | 27,785,263 | |
Utilities — 2.1% |
Electric — 2.1% |
NextEra Energy, Inc. | | | 36,395 | | | | 2,819,157 | |
| | | | | | | | | |
TOTAL COMMON STOCK (Cost $120,583,807) | | | | | | | 132,513,269 | |
| | | | | | | | | |
TOTAL EQUITIES (Cost $120,583,807) | | | | | | | 132,513,269 | |
| | | | | | | | | |
The accompanying notes are an integral part of the financial statements.
98
MML Sustainable Equity Fund – Portfolio of Investments (Continued) |
| | | Number of
Shares | | | Value | |
MUTUAL FUNDS — 0.1% |
Diversified Financial Services — 0.1% |
SPDR S&P 500 ETF Trust | | | 197 | | | $ | 74,318 | |
| | | | | | | | | |
TOTAL MUTUAL FUNDS (Cost $83,275) | | | | | | | 74,318 | |
| | | | | | | | | |
TOTAL LONG-TERM INVESTMENTS (Cost $120,667,082) | | | | | | | 132,587,587 | |
| | | Principal
Amount | | | Value | |
| SHORT-TERM INVESTMENTS — 0.1% |
| Repurchase Agreement — 0.1% |
| Fixed Income Clearing Corp., Repurchase Agreement, dated 6/30/22, 0.240%, due 7/01/22 (b) | | $ | 175,656 | | | $ | 175,656 | |
| | | | | | | | | |
| TOTAL SHORT-TERM INVESTMENTS (Cost $175,656) | | | | | | | 175,656 | |
| | | | | | | | | |
| TOTAL INVESTMENTS — 100.0% (Cost $120,842,738) (c) | | | | | | | 132,763,243 | |
| | | | | | | | | |
| Other Assets/(Liabilities) — 0.0% | | | | | | | 21,153 | |
| | | | | | | | | |
| NET ASSETS — 100.0% | | | | | | $ | 132,784,396 | |
Notes to Portfolio of Investments
Percentages are stated as a percent of net assets.
(a) | Non-income producing security. |
(b) | Maturity value of $175,657. Collateralized by U.S. Government Agency obligations with a rate of 3.000%, maturity date of 6/30/24, and an aggregate market value, including accrued interest, of $179,204. |
(c) | See Note 6 for aggregate cost for federal tax purposes. |
Forward contracts
Counterparty | | Settlement
Date | | | Currency Purchased | | | Currency Sold | | | Unrealized
Appreciation
(Depreciation) | |
JP Morgan Chase Bank N.A.* | | | 9/30/22 | | | | EUR | | | | 187,214 | | | | USD | | | | 196,909 | | | $ | 507 | |
JP Morgan Chase Bank N.A.* | | | 9/30/22 | | | | USD | | | | 889,617 | | | | EUR | | | | 841,142 | | | | 2,640 | |
| | | | | | | | | | | | | | | | | | | | | | | $ | 3,147 | |
* Contracts are subject to a master netting agreement or similar agreement.
Currency Legend
The accompanying notes are an integral part of the financial statements.
99
MML Total Return Bond Fund – Portfolio of Investments |
June 30, 2022 (Unaudited) |
| | | Number of
Shares | | | Value | |
EQUITIES — 0.1% |
COMMON STOCK — 0.1% |
Communications — 0.1% |
Telecommunications — 0.1% |
Intelsat Emergence SA | | | 7,210 | | | $ | 196,473 | |
| | | | | | | | | |
TOTAL COMMON STOCK (Cost $676,994) | | | | | | | 196,473 | |
| | | | | | | | | |
| | | | | | | | | |
TOTAL EQUITIES (Cost $676,994) | | | | | | | 196,473 | |
| | | Principal
Amount | | | | | |
BONDS & NOTES — 112.9% |
BANK LOANS — 1.9% |
Aerospace & Defense — 0.0% |
TransDigm, Inc., 2020 Term Loan E, 1 mo. USD LIBOR + 2.250% | | | | | | | | |
3.916% VRN 5/30/25 | | $ | 48,875 | | | | 46,342 | |
Airlines — 0.0% |
American Airlines, Inc., 2017 1st Lien Term Loan, 1 mo. USD LIBOR + 1.750% | | | | | | | | |
3.402% VRN 1/29/27 | | | 34,152 | | | | 29,987 | |
United Airlines, Inc., 2021 Term Loan B, 1 mo. USD LIBOR + 3.750% | | | | | | | | |
5.392% VRN 4/21/28 | | | 22,540 | | | | 20,891 | |
| | | | | | | | 50,878 | |
Auto Parts & Equipment — 0.1% |
Clarios Global LP, 2021 USD Term Loan B, 1 mo. USD LIBOR + 3.250% | | | | | | | | |
4.916% VRN 4/30/26 | | | 194,908 | | | | 181,508 | |
Beverages — 0.0% |
Naked Juice LLC, Term Loan, SOFRTE + 3.250%, SOFRTE + 3.250% | | | | | | | | |
4.875% - 5.404% 1/24/29 | | | 142,088 | | | | 131,964 | |
Chemicals — 0.0% |
Zep, Inc., 2017 1st Lien Term Loan, 3 mo. USD LIBOR + 4.000% | | | | | | | | |
6.250% VRN 8/12/24 | | | 91,842 | | | | 79,903 | |
Commercial Services — 0.1% |
AI Aqua Merger Sub, Inc. . | | | | | | | | |
2022 Delayed Draw Term loan, | | | | | | | | |
0.000% 7/31/28 (a) | | | 7,713 | | | | 6,993 | |
| | | Principal
Amount | | | Value | |
| 2022 Term Loan B, | | | | | | | | |
| 0.000% FRN 7/31/28 (a) | | $ | 33,938 | | | $ | 30,771 | |
| Amentum Government Services Holdings LLC, Term Loan B | | | | | | | | |
| 0.000% FRN 1/29/27 | | | 15,828 | | | | 15,027 | |
| Prime Security Services Borrower, LLC, 2021 Term Loan | | | | | | | | |
| 0.000% FRN 9/23/26 (a) | | | 14,996 | | | | 13,968 | |
| Spin Holdco, Inc., 2021 Term Loan, 3 mo. USD LIBOR + 4.000% | | | | | | | | |
| 5.611% VRN 3/04/28 (a) | | | 99,000 | | | | 90,932 | |
| Trans Union, LLC, 2021 Term Loan B6 | | | | | | | | |
| 0.000% VRN 12/01/28 (a) | | | 52,556 | | | | 50,005 | |
| | | | | | | | 207,696 | |
| Cosmetics & Personal Care — 0.0% |
| Sunshine Luxembourg VII SARL, 2021 Term Loan B3, 3 mo. USD LIBOR + 3.750% | | | | | | | | |
| 6.000% VRN 10/01/26 | | | 48,891 | | | | 45,137 | |
| Diversified Financial Services — 0.1% |
| Deerfield Dakota Holding, LLC, 2020 USD Term Loan B, SOFR CME + 3.750% | | | | | | | | |
| 5.275%4/09/27 | | | 21,638 | | | | 20,204 | |
| Setanta Aircraft Leasing Designated Activity Company, Term Loan B, 3 mo. USD LIBOR + 2.000% | | | | | | | | |
| 4.250% VRN 11/05/28 | | | 175,000 | | | | 166,105 | |
| | | | | | | | 186,309 | |
| Food — 0.0% |
| Hostess Brands LLC, 2019 Term Loan, 1 mo. USD LIBOR + 2.250%, 3 mo. USD LIBOR + 2.250% | | | | | | | | |
| 3.489% - 3.916% VRN 8/03/25 | | | 126,742 | | | | 121,174 | |
| Health Care – Products — 0.1% |
| Avantor Funding, Inc., 2021 Term Loan B5, 1 mo. USD LIBOR + 2.250% | | | | | | | | |
| 3.916% VRN 11/08/27 | | | 136,389 | | | | 130,827 | |
| Medline Borrower LP, USD Term Loan B, 1 mo. USD LIBOR + 3.250% | | | | | | | | |
| 4.916% VRN 10/23/28 | | | 249,375 | | | | 230,866 | |
| | | | | | | | 361,693 | |
| Insurance — 0.2% |
| Acrisure, LLC, 2020 Term Loan B, 1 mo. USD LIBOR + 3.500% | | | | | | | | |
| 5.166% VRN 2/15/27 | | | 99,491 | | | | 91,035 | |
The accompanying notes are an integral part of the financial statements.
100
MML Total Return Bond Fund – Portfolio of Investments (Continued) |
| | | Principal
Amount | | | Value | |
| AmWINS Group, Inc., 2021 Term Loan B, 1 mo. USD LIBOR + 2.250% | | | | | | | | |
| 3.916% VRN 2/19/28 | | $ | 492,949 | | | $ | 464,811 | |
| | | | | | | | 555,846 | |
| Internet — 0.1% |
| NortonLifeLock, Inc., 2022 Term Loan B, | | | | | | | | |
| 0.000%1/28/29(a) | | | 250,000 | | | | 236,500 | |
| Lodging — 0.1% |
| Caesars Resort Collection, LLC, 2017 1st Lien Term Loan B, 1 mo. USD LIBOR + 2.750% | | | | | | | | |
| 4.416% VRN 12/23/24 | | | 98,437 | | | | 94,601 | |
| Fertitta Entertainment, LLC, 2022 Term Loan B, | | | | | | | | |
| 0.000% FRN 1/27/29 (a) | | | 125,000 | | | | 114,954 | |
| | | | | | | | 209,555 | |
| Media — 0.2% |
| Diamond Sports Group LLC, Term Loan, SOFRTE + 3.250% | | | | | | | | |
| 4.431%8/24/26 | | | 64,183 | | | | 14,976 | |
| DirecTV Financing, LLC, Term Loan, 1 mo. USD LIBOR + 5.000% | | | | | | | | |
| 6.666% VRN 8/02/27 | | | 158,525 | | | | 145,513 | |
| Sinclair Television Group, Inc., 2021 Term Loan B3, 1 mo. USD LIBOR + 3.000% | | | | | | | | |
| 4.670% VRN 4/01/28 | | | 148,500 | | | | 137,300 | |
| Virgin Media Bristol LLC, USD Term Loan N, 1 mo. USD LIBOR + 2.500% | | | | | | | | |
| 3.824% VRN 1/31/28 | | | 275,000 | | | | 256,971 | |
| | | | | | | | 554,760 | |
| Packaging & Containers — 0.1% |
| Berry Global, Inc., 2021 Term Loan Z, 1 mo. USD LIBOR + 1.750% | | | | | | | | |
| 3.005% VRN 7/01/26 | | | 151,015 | | | | 145,582 | |
| Pharmaceuticals — 0.4% |
| Change Healthcare Holdings LLC, 2017 Term Loan B, 1 mo. USD LIBOR + 2.500% | | | | | | | | |
| 4.166% VRN 3/01/24 | | | 37,231 | | | | 36,156 | |
| Elanco Animal Health, Inc., Term Loan B, 1 mo. USD LIBOR + 1.750% | | | | | | | | |
| 2.812% VRN 8/01/27 | | | 400,361 | | | | 377,340 | |
| | | Principal
Amount | | | Value | |
| Gainwell Acquisition Corp., Term Loan B, 3 mo. USD LIBOR + 4.000% | | | | | | | | |
| 6.250% VRN 10/01/27 | | $ | 99,747 | | | $ | 94,137 | |
| Grifols Worldwide Operations USA, Inc., USD 2019 Term Loan B, 1 mo. USD LIBOR + 2.000% | | | | | | | | |
| 3.666% VRN 11/15/27 | | | 280,004 | | | | 264,010 | |
| Horizon Therapeutics USA, Inc., 2021 Term Loan B2, 1 mo. USD LIBOR + 1.750% | | | | | | | | |
| 3.375% VRN 3/15/28 | | | 221,250 | | | | 213,161 | |
| ICON Luxembourg S.A.R.L., LUX Term Loan, | | | | | | | | |
| 0.000% VRN 7/03/28 (a) | | | 9,814 | | | | 9,468 | |
| Jazz Financing Lux S.A.R.L., USD Term Loan, 1 mo. USD LIBOR + 3.500% | | | | | | | | |
| 5.166% VRN 5/05/28 | | | 148,500 | | | | 141,376 | |
| Organon & Co, USD Term Loan, 3 mo. USD LIBOR + 3.000% | | | | | | | | |
| 4.625% VRN 6/02/28 | | | 159,436 | | | | 153,126 | |
| | | | | | | | 1,288,774 | |
| Pipelines — 0.0% |
| Lucid Energy Group II Borrower, LLC, 2021 Term Loan, | | | | | | | | |
| 0.000% FRN 11/24/28 (a) | | | 10,890 | | | | 10,731 | |
| Retail — 0.1% |
| Michaels Cos., Inc., 2021 Term Loan B, 3 mo. USD LIBOR + 4.250% | | | | | | | | |
| 6.500% VRN 4/15/28 | | | 237,600 | | | | 195,096 | |
| Whatabrands LLC, 2021 Term Loan B, | | | | | | | | |
| 0.000% VRN 8/03/28 (a) | | | 224,438 | | | | 209,849 | |
| | | | | | | | 404,945 | |
| Software — 0.1% |
| Athenahealth, Inc. | | | | | | | | |
| 2022 Delayed Draw Term Loan, | | | | | | | | |
| 0.000% FRN 2/15/29 (a) (b) | | | 36,232 | | | | 33,266 | |
| 2022 Term Loan B, SOFRTE + 3.500% | | | | | | | | |
| 5.009%2/15/29 | | | 213,768 | | | | 196,267 | |
| CDK Global, Inc. ., 2022 USD Term Loan B, | | | | | | | | |
| 0.000%7/06/29(a) | | | 123,833 | | | | 116,728 | |
| Sophia, L.P., 2021 Term Loan B, | | | | | | | | |
| 0.000% FRN 10/07/27 (a) | | | 65,975 | | | | 61,399 | |
| | | | | | | | 407,660 | |
The accompanying notes are an integral part of the financial statements.
101
MML Total Return Bond Fund – Portfolio of Investments (Continued) |
| | | Principal
Amount | | | Value | |
| Telecommunications — 0.2% |
| Level 3 Financing, Inc., 2019 Term Loan B, 1 mo. USD LIBOR + 1.750% | | | | | | | | |
| 3.416% VRN 3/01/27 | | $ | 600,000 | | | $ | 554,502 | |
| Zayo Group Holdings, Inc., 2022 USD Incremental Term Loan B, | | | | | | | | |
| 5.775%3/09/27 | | | 113,687 | | | | 105,824 | |
| | | | | | | | 660,326 | |
| Transportation — 0.0% |
| Genesee & Wyoming, Inc., Term Loan, 3 mo. USD LIBOR + 2.000% | | | | | | | | |
| 4.250% VRN 12/30/26 | | | 28,301 | | | | 27,123 | |
| | | | | | | | | |
| TOTAL BANK LOANS (Cost $6,288,807) | | | | | | | 5,914,406 | |
| | | | | | | | | |
| CORPORATE DEBT — 29.1% |
| Aerospace & Defense — 0.2% |
| The Boeing Co. | | | | | | | | |
| 1.167%2/04/23 | | | 660,000 | | | | 652,547 | |
| Agriculture — 0.8% |
| BAT Capital Corp. | | | | | | | | |
| 4.390%8/15/37 | | | 400,000 | | | | 318,468 | |
| 4.540%8/15/47 | | | 1,050,001 | | | | 774,045 | |
| 5.650%3/16/52 | | | 215,000 | | | | 186,545 | |
| Imperial Brands Finance PLC | | | | | | | | |
| 3.125%7/26/24(c) | | | 320,000 | | | | 310,134 | |
| 3.500%7/26/26(c) | | | 225,000 | | | | 211,084 | |
| Imperial Tobacco Finance PLC | | | | | | | | |
| 4.250%7/21/25(c) | | | 415,000 | | | | 411,136 | |
| Reynolds American, Inc. | | | | | | | | |
| 5.850%8/15/45 | | | 315,000 | | | | 265,467 | |
| | | | | | | | 2,476,879 | |
| Banks — 10.4% |
| Bank of America Corp. | | | | | | | | |
| SOFR + .910% 1.658% VRN 3/11/27 | | | 755,000 | | | | 677,437 | |
| SOFR + 1.370% 1.922% VRN 10/24/31 | | | 110,000 | | | | 87,788 | |
| SOFR + 1.060% 2.087% VRN 6/14/29 | | | 1,000,000 | | | | 857,484 | |
| SOFR + 1.220% 2.299% VRN 7/21/32 | | | 240,000 | | | | 194,483 | |
| SOFR + 1.210% 2.572% VRN 10/20/32 | | | 345,000 | | | | 285,362 | |
| SOFR + 2.150% 2.592% VRN 4/29/31 | | | 140,000 | | | | 119,067 | |
| SOFR + 1.320% 2.687% VRN 4/22/32 | | | 120,000 | | | | 101,012 | |
| | | Principal
Amount | | | Value | |
| 3 mo. USD LIBOR + .790% 3.004% VRN 12/20/23 | | $ | 1,180,000 | | | $ | 1,176,373 | |
| 3 mo. USD LIBOR + 1.040% 3.419% VRN 12/20/28 | | | 470,000 | | | | 438,400 | |
| 3 mo. USD LIBOR + .970% 3.458% VRN 3/15/25 | | | 415,000 | | | | 409,310 | |
| 3 mo. USD LIBOR + 1.070% 3.970% VRN 3/05/29 | | | 485,000 | | | | 463,234 | |
| Citigroup, Inc. | | | | | | | | |
| SOFR + .528% 1.281% VRN 11/03/25 | | | 135,000 | | | | 125,476 | |
| SOFR + .770% 1.462% VRN 6/09/27 | | | 725,000 | | | | 641,759 | |
| SOFR + .694% 2.014% VRN 1/25/26 | | | 210,000 | | | | 196,891 | |
| SOFR + 1.167% 2.561% VRN 5/01/32 | | | 495,000 | | | | 408,361 | |
| SOFR + 2.107% 2.572% VRN 6/03/31 | | | 255,000 | | | | 214,875 | |
| SOFR + 1.351% 3.057% VRN 1/25/33 | | | 505,000 | | | | 429,879 | |
| SOFR + 1.280% 3.070% VRN 2/24/28 | | | 190,000 | | | | 176,371 | |
| SOFR + 2.842% 3.106% VRN 4/08/26 | | | 335,000 | | | | 321,865 | |
| 3 mo. USD LIBOR + .897% 3.352% VRN 4/24/25 | | | 85,000 | | | | 83,389 | |
| Credit Suisse Group AG | | | | | | | | |
| SOFR + .980% 1.305% VRN 2/02/27 (c) | | | 495,000 | | | | 425,470 | |
| SOFR + 2.044% 2.193% VRN 6/05/26 (c) | | | 590,000 | | | | 535,238 | |
| SOFR + 1.560% 2.593% VRN 9/11/25 (c) | | | 420,000 | | | | 395,513 | |
| SOFR + 1.730% 3.091% VRN 5/14/32 (c) | | | 405,000 | | | | 323,139 | |
| 4.282%1/09/28(c) | | | 65,000 | | | | 60,778 | |
| DNB Bank ASA 1 year CMT + .680% | | | | | | | | |
| 1.605% VRN 3/30/28 (c) | | | 635,000 | | | | 551,836 | |
| The Goldman Sachs Group, Inc. | | | | | | | | |
| SOFR + .486% 0.925% VRN 10/21/24 | | | 530,000 | | | | 507,131 | |
| 1.217%12/06/23 | | | 1,030,000 | | | | 992,921 | |
| SOFR + .798% 1.431% VRN 3/09/27 | | | 500,000 | | | | 443,720 | |
| SOFR + .818% 1.542% VRN 9/10/27 | | | 1,450,000 | | | | 1,274,403 | |
| SOFR + .913% 1.948% VRN 10/21/27 | | | 125,000 | | | | 111,304 | |
| SOFR + 1.090% 1.992% VRN 1/27/32 | | | 140,000 | | | | 110,888 | |
| SOFR + 1.248% 2.383% VRN 7/21/32 | | | 415,000 | | | | 336,643 | |
The accompanying notes are an integral part of the financial statements.
102
MML Total Return Bond Fund – Portfolio of Investments (Continued) |
| | | Principal
Amount | | | Value | |
| SOFR + 1.264% 2.650% VRN 10/21/32 | | $ | 200,000 | | | $ | 165,200 | |
| 3.200%2/23/23 | | | 145,000 | | | | 145,060 | |
| 3 mo. USD LIBOR + 1.201% 3.272% VRN 9/29/25 | | | 325,000 | | | | 316,059 | |
| HSBC Holdings PLC | | | | | | | | |
| SOFR + .708% 0.976% VRN 5/24/25 | | | 505,000 | | | | 471,260 | |
| SOFR + 1.732% 2.013% VRN 9/22/28 | | | 1,080,000 | | | | 925,239 | |
| SOFR + 1.285% 2.206% VRN 8/17/29 | | | 610,000 | | | | 513,793 | |
| SOFR + 1.187% 2.804% VRN 5/24/32 | | | 365,000 | | | | 300,530 | |
| 3 mo. USD LIBOR + 1.211% 3.803% VRN 3/11/25 | | | 110,000 | | | | 108,503 | |
| JP Morgan Chase & Co. | | | | | | | | |
| SOFR + .580% 0.697% VRN 3/16/24 | | | 165,000 | | | | 161,443 | |
| 3 mo. TSFR + .580% 0.969% VRN 6/23/25 | | | 1,060,000 | | | | 991,200 | |
| SOFR + .885% 1.578% VRN 4/22/27 | | | 500,000 | | | | 445,490 | |
| SOFR + 1.015% 2.069% VRN 6/01/29 | | | 250,000 | | | | 215,240 | |
| SOFR + 1.160% 2.301% VRN 10/15/25 | | | 255,000 | | | | 243,049 | |
| SOFR + 1.180% 2.545% VRN 11/08/32 | | | 375,000 | | | | 311,305 | |
| SOFR + 1.250% 2.580% VRN 4/22/32 | | | 605,000 | | | | 509,183 | |
| SOFR + 1.170% 2.947% VRN 2/24/28 | | | 1,145,000 | | | | 1,062,326 | |
| Lloyds Banking Group PLC | | | | | | | | |
| 1 year CMT + .850% 1.627% VRN 5/11/27 | | | 515,000 | | | | 458,338 | |
| 3 mo. USD LIBOR + 1.205% 3.574% VRN 11/07/28 | | | 520,000 | | | | 487,317 | |
| 1 year CMT + 1.800% 3.750% VRN 3/18/28 | | | 200,000 | | | | 190,603 | |
| 1 year CMT + 3.500% 3.870% VRN 7/09/25 | | | 220,000 | | | | 217,422 | |
| Macquarie Group Ltd. | | | | | | | | |
| SOFR + 1.532% 2.871% VRN 1/14/33 (c) | | | 1,045,000 | | | | 854,818 | |
| SOFR + 2.405% 4.442% VRN 6/21/33 (c) | | | 240,000 | | | | 223,218 | |
| Morgan Stanley | | | | | | | | |
| SOFR + .509% 0.791% VRN 1/22/25 | | | 285,000 | | | | 269,585 | |
| SOFR + .560% 1.164% VRN 10/21/25 | | | 1,300,000 | | | | 1,205,531 | |
| | | Principal
Amount | | | Value | |
| SOFR + .879% 1.593% VRN 5/04/27 | | $ | 505,000 | | | $ | 448,808 | |
| SOFR + 1.020% 1.928% VRN 4/28/32 | | | 235,000 | | | | 186,863 | |
| SOFR + 1.178% 2.239% VRN 7/21/32 | | | 160,000 | | | | 130,079 | |
| SOFR + 1.200% 2.511% VRN 10/20/32 | | | 520,000 | | | | 430,794 | |
| SOFR + 2.620% 5.297% VRN 4/20/37 | | | 215,000 | | | | 208,756 | |
| Natwest Group PLC 3 mo. USD LIBOR + 1.762% | | | | | | | | |
| 4.269% VRN 3/22/25 | | | 775,000 | | | | 767,389 | |
| Santander UK Group Holdings PLC | | | | | | | | |
| SOFR + .787% 1.089% VRN 3/15/25 | | | 540,000 | | | | 504,548 | |
| 1 year CMT + 1.250% 1.532% VRN 8/21/26 | | | 710,000 | | | | 636,534 | |
| SOFR + .989% 1.673% VRN 6/14/27 | | | 120,000 | | | | 104,873 | |
| SOFR + 1.220% 2.469% VRN 1/11/28 | | | 200,000 | | | | 176,960 | |
| 3 mo. USD LIBOR + 1.080% 3.373% VRN 1/05/24 | | | 445,000 | | | | 443,026 | |
| Santander UK PLC | | | | | | | | |
| 5.000%11/07/23(c) | | | 435,000 | | | | 438,036 | |
| UBS Group AG Registered 1 year CMT + 1.550% | | | | | | | | |
| 4.488% VRN 5/12/26 (c) | | | 200,000 | | | | 199,566 | |
| Wells Fargo & Co. | | | | | | | | |
| 3 mo. USD LIBOR + .750% 2.164% VRN 2/11/26 | | | 335,000 | | | | 315,164 | |
| SOFR + 2.100% 2.393% VRN 6/02/28 | | | 1,400,000 | | | | 1,255,623 | |
| SOFR + 1.432% 2.879% VRN 10/30/30 | | | 490,000 | | | | 431,871 | |
| SOFR + 1.500% 3.350% VRN 3/02/33 | | | 1,285,000 | | | | 1,143,619 | |
| SOFR + 1.510% 3.526% VRN 3/24/28 | | | 320,000 | | | | 303,524 | |
| SOFR + 4.502% 5.013% VRN 4/04/51 | | | 150,000 | | | | 148,024 | |
| | | | | | | | 32,543,569 | |
| Beverages — 0.6% |
| Anheuser-Busch Cos. LLC/Anheuser-Busch InBev Worldwide, Inc. | | | | | | | | |
| 4.900%2/01/46 | | | 880,000 | | | | 831,768 | |
| Bacardi Ltd. | | | | | | | | |
| 4.450%5/15/25(c) | | | 700,000 | | | | 693,640 | |
The accompanying notes are an integral part of the financial statements.
103
MML Total Return Bond Fund – Portfolio of Investments (Continued) |
| | | Principal
Amount | | | Value | |
| Constellation Brands, Inc. | | | | | | | | |
| 4.750%5/09/32 | | $ | 330,000 | | | $ | 326,465 | |
| | | | | | | | 1,851,873 | |
| Biotechnology — 0.1% |
| Amgen, Inc. | | | | | | | | |
| 4.400%2/22/62 | | | 190,000 | | | | 166,552 | |
| Grifols Escrow Issuer SA | | | | | | | | |
| 4.750%10/15/28(c)(d) | | | 125,000 | | | | 108,438 | |
| | | | | | | | 274,990 | |
| Chemicals — 0.2% |
| International Flavors & Fragrances, Inc. | | | | | | | | |
| 5.000%9/26/48 | | | 380,000 | | | | 356,074 | |
| Valvoline, Inc. | | | | | | | | |
| 4.250%2/15/30(c) | | | 175,000 | | | | 146,125 | |
| | | | | | | | 502,199 | |
| Commercial Services — 0.1% |
| S&P Global, Inc. | | | | | | | | |
| 4.750%8/01/28(c) | | | 385,000 | | | | 391,820 | |
| Diversified Financial Services — 1.3% |
| AerCap Ireland Capital DAC / AerCap Global Aviation Trust | | | | | | | | |
| 3.500%1/15/25 | | | 1,000,000 | | | | 955,795 | |
| AerCap Ireland Capital DAC/AerCap Global Aviation Trust | | | | | | | | |
| 3.300%1/30/32 | | | 615,000 | | | | 491,480 | |
| American Express Co. | | | | | | | | |
| 2.550%3/04/27 | | | 385,000 | | | | 359,246 | |
| Avolon Holdings Funding Ltd. | | | | | | | | |
| 2.528%11/18/27(c) | | | 389,000 | | | | 318,270 | |
| 2.875%2/15/25(c) | | | 335,000 | | | | 308,392 | |
| 3.950%7/01/24(c) | | | 130,000 | | | | 124,569 | |
| Capital One Financial Corp. SOFR + 1.790% | | | | | | | | |
| 3.273% VRN 3/01/30 | | | 535,000 | | | | 474,364 | |
| Charles Schwab Corp. | | | | | | | | |
| 2.900%3/03/32 | | | 380,000 | | | | 335,493 | |
| Intercontinental Exchange, Inc. | | | | | | | | |
| 4.600%3/15/33 | | | 420,000 | | | | 418,738 | |
| Park Aerospace Holdings Ltd. | | | | | | | | |
| 4.500%3/15/23(c) | | | 320,000 | | | | 318,853 | |
| 5.500%2/15/24(c) | | | 82,000 | | | | 81,389 | |
| | | | | | | | 4,186,589 | |
| Electric — 1.3% |
| Duke Energy Carolinas LLC | | | | | | | | |
| 4.000%9/30/42 | | | 1,000,000 | | | | 892,390 | |
| Florida Power & Light Co. | | | | | | | | |
| 3.990%3/01/49 | | | 495,000 | | | | 453,986 | |
| | | Principal
Amount | | | Value | |
| Jersey Central Power & Light Co. | | | | | | | | |
| 4.700%4/01/24(c) | | $ | 800,000 | | | $ | 805,479 | |
| 6.400%5/15/36 | | | 425,000 | | | | 455,208 | |
| MidAmerican Energy Co. | | | | | | | | |
| 4.800%9/15/43 | | | 1,400,000 | | | | 1,394,658 | |
| | | | | | | | 4,001,721 | |
| Engineering & Construction — 0.0% |
| Artera Services LLC | | | | | | | | |
| 9.033%12/04/25(c) | | | 95,000 | | | | 76,551 | |
| Entertainment — 0.5% |
| Caesars Entertainment, Inc. | | | | | | | | |
| 8.125%7/01/27(c)(d) | | | 100,000 | | | | 96,625 | |
| Magallanes, Inc. | | | | | | | | |
| 4.279%3/15/32(c) | | | 190,000 | | | | 170,425 | |
| 5.050%3/15/42(c) | | | 905,000 | | | | 772,882 | |
| 5.141%3/15/52(c) | | | 640,000 | | | | 540,701 | |
| | | | | | | | 1,580,633 | |
| Environmental Controls — 0.1% |
| Waste Pro USA, Inc. | | | | | | | | |
| 5.500%2/15/26(c) | | | 175,000 | | | | 155,453 | |
| Food — 0.8% |
| JBS USA LUX SA / JBS USA Food Co. / JBS USA Finance, Inc. | | | | | | | | |
| 5.750%4/01/33(c) | | | 400,000 | | | | 380,916 | |
| 6.500%12/01/52(c) | | | 415,000 | | | | 392,237 | |
| JBS USA LUX SA/JBS USA Food Co./JBS USA Finance, Inc. | | | | | | | | |
| 4.375%2/02/52(c) | | | 135,000 | | | | 95,475 | |
| Kraft Heinz Foods Co. | | | | | | | | |
| 4.875%10/01/49 | | | 480,000 | | | | 426,462 | |
| 5.000%6/04/42 | | | 360,000 | | | | 329,823 | |
| Pilgrim’s Pride Corp. | | | | | | | | |
| 3.500%3/01/32(c) | | | 360,000 | | | | 281,250 | |
| 5.875%9/30/27(c) | | | 30,000 | | | | 28,725 | |
| Post Holdings, Inc. | | | | | | | | |
| 5.750%3/01/27(c) | | | 150,000 | | | | 145,312 | |
| Smithfield Foods, Inc. | | | | | | | | |
| 2.625%9/13/31(c) | | | 635,000 | | | | 502,799 | |
| | | | | | | | 2,582,999 | |
| Health Care – Products — 0.2% |
| PerkinElmer, Inc. | | | | | | | | |
| 2.250%9/15/31 | | | 800,000 | | | | 633,936 | |
| Health Care – Services — 1.8% |
| Aetna, Inc. | | | | | | | | |
| 2.800%6/15/23 | | | 485,000 | | | | 480,234 | |
| Centene Corp. | | | | | | | | |
| 2.450%7/15/28 | | | 488,000 | | | | 407,290 | |
| 3.000%10/15/30 | | | 453,000 | | | | 375,424 | |
The accompanying notes are an integral part of the financial statements.
104
MML Total Return Bond Fund – Portfolio of Investments (Continued) |
| | | Principal
Amount | | | Value | |
| 4.250%12/15/27 | | $ | 165,000 | | | $ | 153,557 | |
| CommonSpirit Health | | | | | | | | |
| 2.782%10/01/30 | | | 495,000 | | | | 428,871 | |
| 3.910%10/01/50 | | | 75,000 | | | | 60,589 | |
| Fresenius Medical Care US Finance III, Inc. | | | | | | | | |
| 1.875%12/01/26(c) | | | 340,000 | | | | 293,389 | |
| HCA, Inc. | | | | | | | | |
| 2.375%7/15/31 | | | 90,000 | | | | 70,416 | |
| 3.625%3/15/32(c) | | | 70,000 | | | | 59,216 | |
| 4.125%6/15/29 | | | 345,000 | | | | 315,147 | |
| 4.625%3/15/52(c)(d) | | | 332,000 | | | | 267,216 | |
| 5.000%3/15/24 | | | 287,000 | | | | 288,650 | |
| 5.250%6/15/49 | | | 775,000 | | | | 678,594 | |
| 5.500%6/15/47 | | | 360,000 | | | | 328,076 | |
| Humana, Inc. | | | | | | | | |
| 2.150%2/03/32 | | | 435,000 | | | | 353,275 | |
| ModivCare Escrow Issuer, Inc. | | | | | | | | |
| 5.000%10/01/29(c) | | | 175,000 | | | | 140,652 | |
| Molina Healthcare, Inc. | | | | | | | | |
| 3.875%11/15/30(c) | | | 90,000 | | | | 76,930 | |
| 3.875%5/15/32(c) | | | 190,000 | | | | 159,152 | |
| 4.375%6/15/28(c) | | | 300,000 | | | | 268,292 | |
| Universal Health Services, Inc. | | | | | | | | |
| 1.650%9/01/26(c) | | | 385,000 | | | | 334,328 | |
| | | | | | | | 5,539,298 | |
| Household Products & Wares — 0.0% |
| Central Garden & Pet Co. | | | | | | | | |
| 5.125%2/01/28 | | | 123,000 | | | | 110,258 | |
| Insurance — 1.0% |
| Aon Corp. / Aon Global Holdings PLC | | | | | | | | |
| 3.900%2/28/52 | | | 190,000 | | | | 156,443 | |
| Athene Global Funding | | | | | | | | |
| 1.985%8/19/28(c) | | | 555,000 | | | | 461,643 | |
| SOFR + .700% 1.992% FRN 5/24/24 (c) | | | 505,000 | | | | 490,334 | |
| 3.205%3/08/27(c) | | | 135,000 | | | | 122,874 | |
| Berkshire Hathaway Finance Corp. | | | | | | | | |
| 3.850%3/15/52 | | | 405,000 | | | | 349,290 | |
| Farmers Exchange Capital 3 mo. USD LIBOR + 3.454% | | | | | | | | |
| 5.454% VRN 10/15/54 (c) | | | 970,000 | | | | 958,892 | |
| Teachers Insurance & Annuity Association of America | | | | | | | | |
| 3.300%5/15/50(c) | | | 225,000 | | | | 172,822 | |
| 4.270%5/15/47(c) | | | 130,000 | | | | 116,414 | |
| Willis North America, Inc. | | | | | | | | |
| 2.950%9/15/29 | | | 290,000 | | | | 249,172 | |
| | | | | | | | 3,077,884 | |
| | | Principal
Amount | | | Value | |
| Internet — 0.1% |
| Netflix, Inc. | | | | | | | | |
| 4.625% 5/15/29 EUR (e) | | $ | 150,000 | | | $ | 147,954 | |
| Tencent Holdings Ltd. | | | | | | | | |
| 3.680%4/22/41(c) | | | 335,000 | | | | 270,736 | |
| | | | | | | | 418,690 | |
| Media — 0.8% |
| Charter Communications Operating LLC/Charter Communications Operating Capital | | | | | | | | |
| 3.750%2/15/28 | | | 92,000 | | | | 84,721 | |
| 4.800%3/01/50 | | | 330,000 | | | | 263,593 | |
| 4.908%7/23/25 | | | 205,000 | | | | 205,303 | |
| 5.250%4/01/53 | | | 265,000 | | | | 226,327 | |
| 5.375%5/01/47 | | | 95,000 | | | | 81,314 | |
| 5.750%4/01/48 | | | 280,000 | | | | 251,776 | |
| Cox Communications, Inc. | | | | | | | | |
| 2.600%6/15/31(c) | | | 385,000 | | | | 322,839 | |
| CSC Holdings LLC | | | | | | | | |
| 4.125%12/01/30(c)(d) | | | 200,000 | | | | 156,000 | |
| 5.375%2/01/28(c) | | | 280,000 | | | | 242,200 | |
| Diamond Sports Group LLC / Diamond Sports Finance Co. | | | | | | | | |
| 5.375%8/15/26(c) | | | 665,000 | | | | 166,250 | |
| Time Warner Cable, Inc. | | | | | | | | |
| 5.500%9/01/41 | | | 170,000 | | | | 149,017 | |
| 5.875%11/15/40 | | | 170,000 | | | | 156,402 | |
| The Walt Disney Co. | | | | | | | | |
| 3.600%1/13/51 | | | 320,000 | | | | 268,448 | |
| | | | | | | | 2,574,190 | |
| Mining — 0.1% |
| Indonesia Asahan Aluminium Persero PT | | | | | | | | |
| 6.530%11/15/28(c) | | | 200,000 | | | | 202,822 | |
| Miscellaneous - Manufacturing — 0.2% |
| GE Capital International Funding Co. Unlimited Co. | | | | | | | | |
| 4.418%11/15/35 | | | 380,000 | | | | 356,434 | |
| General Electric Co. | | | | | | | | |
| 6.750%3/15/32 | | | 162,000 | | | | 181,586 | |
| | | | | | | | 538,020 | |
| Oil & Gas — 0.5% |
| KazMunay Gas National Co. | | | | | | | | |
| 4.750%4/19/27(c) | | | 200,000 | | | | 177,152 | |
| Occidental Petroleum Corp. | | | | | | | | |
| 0.010%10/10/36 | | | 230,000 | | | | 113,931 | |
| Pertamina Persero PT | | | | | | | | |
| 3.100%8/27/30(c) | | | 200,000 | | | | 174,151 | |
The accompanying notes are an integral part of the financial statements.
105
MML Total Return Bond Fund – Portfolio of Investments (Continued) |
| | | Principal
Amount | | | Value | |
| Petroleos Mexicanos | | | | | | | | |
| 5.950%1/28/31 | | $ | 50,000 | | | $ | 36,569 | |
| 6.625%6/15/35 | | | 900,000 | | | | 614,367 | |
| 7.690%1/23/50 | | | 115,000 | | | | 77,912 | |
| Saudi Arabian Oil Co. | | | | | | | | |
| 1.625%11/24/25(c) | | | 200,000 | | | | 184,600 | |
| Shell International Finance BV | | | | | | | | |
| 3.750%9/12/46 | | | 25,000 | | | | 21,480 | |
| Transocean Guardian Ltd. | | | | | | | | |
| 5.875%1/15/24(c) | | | 92,172 | | | | 85,186 | |
| Transocean Poseidon Ltd. | | | | | | | | |
| 6.875%2/01/27(c) | | | 91,875 | | | | 81,769 | |
| | | | | | | | 1,567,117 | |
| Oil & Gas Services — 0.0% |
| Transocean Proteus Ltd. | | | | | | | | |
| 6.250%12/01/24(c) | | | 127,350 | | | | 119,709 | |
| USA Compression Partners LP/USA Compression Finance Corp. | | | | | | | | |
| 6.875%4/01/26 | | | 30,000 | | | | 27,286 | |
| | | | | | | | 146,995 | |
| Packaging & Containers — 0.6% |
| Amcor Finance USA, Inc. | | | | | | | | |
| 3.625%4/28/26 | | | 650,000 | | | | 626,181 | |
| Ardagh Packaging Finance PLC / Ardagh Holdings USA, Inc. | | | | | | | | |
| 5.250%8/15/27(c) | | | 190,000 | | | | 133,072 | |
| 5.250%8/15/27(c)(d) | | | 200,000 | | | | 140,076 | |
| Berry Global, Inc. | | | | | | | | |
| 1.570%1/15/26 | | | 410,000 | | | | 366,054 | |
| 4.875%7/15/26(c) | | | 330,000 | | | | 314,939 | |
| Mauser Packaging Solutions Holding Co. | | | | | | | | |
| 5.500%4/15/24(c) | | | 30,000 | | | | 28,650 | |
| Trivium Packaging Finance BV | | | | | | | | |
| 5.500%8/15/26(c) | | | 320,000 | | | | 301,015 | |
| | | | | | | | 1,909,987 | |
| Pharmaceuticals — 1.3% |
| AbbVie, Inc. | | | | | | | | |
| 4.450%5/14/46 | | | 400,000 | | | | 365,177 | |
| 4.500%5/14/35 | | | 390,000 | | | | 379,801 | |
| Bayer US Finance II LLC | | | | | | | | |
| 4.250%12/15/25(c) | | | 75,000 | | | | 74,099 | |
| 4.375%12/15/28(c) | | | 850,000 | | | | 829,183 | |
| 4.625%6/25/38(c) | | | 795,000 | | | | 721,674 | |
| 4.875%6/25/48(c) | | | 210,000 | | | | 189,851 | |
| Cigna Corp. | | | | | | | | |
| 3.400%3/15/51 | | | 250,000 | | | | 193,624 | |
| 4.125%11/15/25 | | | 60,000 | | | | 60,125 | |
| | | Principal
Amount | | | Value | |
| CVS Health Corp. | | | | | | | | |
| 5.050%3/25/48 | | $ | 1,090,000 | | | $ | 1,049,990 | |
| Embecta Corp. | | | | | | | | |
| 5.000%2/15/30(c) | | | 200,000 | | | | 167,887 | |
| Endo DAC / Endo Finance LLC / Endo Finco, Inc. | | | | | | | | |
| 6.000%6/30/28(c) | | | 463,000 | | | | 35,883 | |
| | | | | | | | 4,067,294 | |
| Pipelines — 1.1% |
| Energy Transfer LP | | | | | | | | |
| 4.950%6/15/28 | | | 300,000 | | | | 296,113 | |
| 5.000%5/15/50 | | | 380,000 | | | | 325,222 | |
| 5.150%3/15/45 | | | 400,000 | | | | 343,620 | |
| 5.350%5/15/45 | | | 50,000 | | | | 43,738 | |
| 5.400%10/01/47 | | | 394,000 | | | | 347,738 | |
| 5.500%6/01/27 | | | 254,000 | | | | 257,733 | |
| Galaxy Pipeline Assets Bidco Ltd. | | | | | | | | |
| 2.160%3/31/34(c) | | | 384,344 | | | | 326,549 | |
| Plains All American Pipeline LP/PAA Finance Corp. | | | | | | | | |
| 3.800%9/15/30 | | | 300,000 | | | | 265,816 | |
| Rockies Express Pipeline LLC | | | | | | | | |
| 4.800%5/15/30(c) | | | 250,000 | | | | 208,125 | |
| 4.950%7/15/29(c) | | | 200,000 | | | | 171,000 | |
| Ruby Pipeline LLC | | | | | | | | |
| 8.000% STEP 4/01/22 (c) | | | 431,818 | | | | 367,045 | |
| TransMontaigne Partners LP/TLP Finance Corp. | | | | | | | | |
| 6.125%2/15/26 | | | 81,000 | | | | 71,584 | |
| Venture Global Calcasieu Pass LLC | | | | | | | | |
| 3.875%8/15/29(c) | | | 365,000 | | | | 319,275 | |
| | | | | | | | 3,343,558 | |
| Real Estate Investment Trusts (REITS) — 1.6% |
| American Campus Communities Operating Partnership LP | | | | | | | | |
| 2.850%2/01/30 | | | 10,000 | | | | 9,514 | |
| 3.750%4/15/23 | | | 650,000 | | | | 650,759 | |
| GLP Capital LP/GLP Financing II, Inc. | | | | | | | | |
| 4.000%1/15/30 | | | 45,000 | | | | 39,405 | |
| 5.250%6/01/25 | | | 205,000 | | | | 201,041 | |
| 5.300%1/15/29 | | | 310,000 | | | | 296,084 | |
| 5.375%4/15/26 | | | 735,000 | | | | 719,286 | |
| Healthcare Trust of America Holdings LP | | | | | | | | |
| 2.000%3/15/31 | | | 240,000 | | | | 186,532 | |
| 3.100%2/15/30 | | | 145,000 | | | | 125,193 | |
| SL Green Operating Partnership LP | | | | | | | | |
| 3.250%10/15/22 | | | 500,000 | | | | 498,755 | |
The accompanying notes are an integral part of the financial statements.
106
MML Total Return Bond Fund – Portfolio of Investments (Continued) |
| | | Principal
Amount | | | Value | |
| Ventas Realty LP | | | | | | | | |
| 3.500%2/01/25 | | $ | 1,500,000 | | | $ | 1,464,430 | |
| VICI Properties LP | | | | | | | | |
| 3.750%2/15/27(c) | | | 20,000 | | | | 17,591 | |
| 3.875%2/15/29(c) | | | 185,000 | | | | 159,663 | |
| 4.500%9/01/26(c) | | | 100,000 | | | | 92,000 | |
| 4.500%1/15/28(c) | | | 50,000 | | | | 45,599 | |
| 4.625%6/15/25(c) | | | 25,000 | | | | 23,781 | |
| 4.950%2/15/30 | | | 20,000 | | | | 18,954 | |
| 5.125%5/15/32 | | | 330,000 | | | | 310,972 | |
| 5.625%5/15/52 | | | 164,000 | | | | 149,268 | |
| 5.750%2/01/27(c) | | | 120,000 | | | | 113,868 | |
| | | | | | | | 5,122,695 | |
| Retail — 0.1% |
| Michaels Cos., Inc. | | | | | | | | |
| 5.250%5/01/28(c)(d) | | | 170,000 | | | | 133,615 | |
| Starbucks Corp. | | | | | | | | |
| 3.000%2/14/32(d) | | | 385,000 | | | | 335,175 | |
| | | | | | | | 468,790 | |
| Savings & Loans — 0.3% |
| Nationwide Building Society | | | | | | | | |
| SOFR + 1.290% 2.972% VRN 2/16/28 (c) (d) | | | 340,000 | | | | 310,665 | |
| 3 mo. USD LIBOR + 1.064% 3.766% VRN 3/08/24 (c) | | | 525,000 | | | | 523,782 | |
| 3 mo. USD LIBOR + 1.392% 4.363% VRN 8/01/24 (c) | | | 190,000 | | | | 190,299 | |
| | | | | | | | 1,024,746 | |
| Semiconductors — 0.1% |
| Broadcom, Inc. | | | | | | | | |
| 4.300%11/15/32 | | | 360,000 | | | | 327,903 | |
| Software — 0.3% |
| Change Healthcare Holdings LLC/Change Healthcare Finance, Inc. | | | | | | | | |
| 5.750%3/01/25(c) | | | 133,000 | | | | 130,007 | |
| Oracle Corp. | | | | | | | | |
| 2.800%4/01/27 | | | 140,000 | | | | 128,128 | |
| 2.875%3/25/31 | | | 195,000 | | | | 161,085 | |
| 3.950%3/25/51 | | | 753,000 | | | | 556,528 | |
| | | | | | | | 975,748 | |
| Telecommunications — 2.6% |
| AT&T, Inc. | | | | | | | | |
| 3.800%12/01/57 | | | 1,692,000 | | | | 1,319,596 | |
| 4.750%5/15/46 | | | 710,000 | | | | 660,916 | |
| 5.250%3/01/37 | | | 270,000 | | | | 279,148 | |
| CommScope, Inc. | | | | | | | | |
| 4.750%9/01/29(c) | | | 274,000 | | | | 221,034 | |
| | | Principal
Amount | | | Value | |
| Jackson Holdings S.A. | | | | | | | | |
| 6.500%3/15/30(c) | | $ | 1,052,000 | | | $ | 867,900 | |
| Intelsat Jackson Holdings S.A., Escrow | | | | | | | | |
| 8.500%10/15/24(c)(f)(g)(h) | | | 171,000 | | | | — | |
| 9.750%7/15/25(c)(f)(g)(h) | | | 585,000 | | | | — | |
| Level 3 Financing, Inc. | | | | | | | | |
| 3.400%3/01/27(c) | | | 60,000 | | | | 51,659 | |
| 3.875%11/15/29(c) | | | 460,000 | | | | 379,879 | |
| Lumen Technologies, Inc. | | | | | | | | |
| 5.375%6/15/29(c) | | | 385,000 | | | | 304,833 | |
| Sprint Corp. | | | | | | | | |
| 7.875%9/15/23 | | | 33,000 | | | | 34,031 | |
| Sprint Spectrum Co. LLC/Sprint Spectrum Co. II LLC/Sprint Spectrum Co. III LLC | | | | | | | | |
| 4.738%3/20/25(c) | | | 969,377 | | | | 969,989 | |
| T-Mobile USA, Inc. | | | | | | | | |
| 2.550%2/15/31 | | | 900,000 | | | | 759,303 | |
| 3.750%4/15/27 | | | 375,000 | | | | 361,180 | |
| 3.875%4/15/30 | | | 345,000 | | | | 322,852 | |
| 4.375%4/15/40 | | | 290,000 | | | | 260,240 | |
| Verizon Communications, Inc. | | | | | | | | |
| 2.550%3/21/31 | | | 330,000 | | | | 282,908 | |
| Vodafone Group PLC | | | | | | | | |
| 4.875%6/19/49 | | | 452,000 | | | | 416,385 | |
| 5.250%5/30/48 | | | 600,000 | | | | 574,089 | |
| | | | | | | | 8,065,942 | |
| | | | | | | | | |
| TOTAL CORPORATE DEBT (Cost $103,273,561) | | | | | | | 91,393,696 | |
| | | | | | | | | |
| MUNICIPAL OBLIGATIONS — 1.0% |
| California State University | | | | | | | | |
| Revenue, 2.274% 11/01/34 | | | 180,000 | | | | 144,910 | |
| Revenue, 2.374% 11/01/35 | | | 20,000 | | | | 15,958 | |
| City of New York NY, General Obligation | | | | | | | | |
| 5.206%10/01/31 | | | 750,000 | | | | 801,119 | |
| Jersey City Municipal Utilities Authority, Revenue Bond | | | | | | | | |
| 5.470%5/15/27 | | | 635,000 | | | | 668,630 | |
| New York City Transitional Finance Authority Future Tax Secured Revenue, Revenue | | | | | | | | |
| 2.450%11/01/34 | | | 560,000 | | | | 458,278 | |
| New York State Dormitory Authority, Revenue Bond | | | | | | | | |
| 5.289%3/15/33 | | | 750,000 | | | | 799,737 | |
The accompanying notes are an integral part of the financial statements.
107
MML Total Return Bond Fund – Portfolio of Investments (Continued) |
| | | Principal
Amount | | | Value | |
| University of California, Revenue | | | | | | | | |
| 2.247%5/15/34 | | $ | 290,000 | | | $ | 238,056 | |
| University of Michigan, Revenue | | | | | | | | |
| 3.504%4/01/52 | | | 140,000 | | | | 123,826 | |
| | | | | | | | 3,250,514 | |
| | | | | | | | | |
| TOTAL MUNICIPAL OBLIGATIONS (Cost $3,712,919) | | | | | | | 3,250,514 | |
| | | | | | | | | |
| NON-U.S. GOVERNMENT AGENCY OBLIGATIONS — 15.4% |
| Commercial Mortgage-Backed Securities — 3.0% |
| BAMLL Commercial Mortgage Securities Trust, Series 2018-PARK, Class A, | | | | | | | | |
| 4.227% VRN 8/10/38 (c) (i) | | | 620,000 | | | | 592,148 | |
| BX Commercial Mortgage Trust | | | | | | | | |
| Series 2019-XL, Class A, 1 mo. USD LIBOR + .920% 2.244% FRN 10/15/36 (c) | | | 1,189,796 | | | | 1,169,064 | |
| 1 mo. TSFR + 2.115% 2.865% FRN 6/15/27 (c) | | | 692,000 | | | | 682,458 | |
| BX Trust, Series 2019-OC11, Class A | | | | | | | | |
| 3.202%12/09/41(c) | | | 180,000 | | | | 161,173 | |
| BXSC Commercial Mortgage Trust 2022-WSS, Series 2022-WSS, Class D, 1mo. TSFR + 3.188% | | | | | | | | |
| 4.467% FRN 3/15/35 (c) | | | 894,000 | | | | 858,169 | |
| CALI Mortgage Trust, Series 2019-101C, Class A | | | | | | | | |
| 3.957%3/10/39(c) | | | 415,000 | | | | 394,080 | |
| CPT Mortgage Trust, Series 2019-CPT, Class A | | | | | | | | |
| 2.865%11/13/39(c) | | | 355,000 | | | | 311,566 | |
| DC Office Trust, Series 2019-MTC, Class A | | | | | | | | |
| 2.965%9/15/45(c) | | | 375,000 | | | | 330,513 | |
| GS Mortgage Securities Corp. II, Series 2021-ARDN, Class A, 1 mo. USD LIBOR + 1.250% | | | | | | | | |
| 2.574% FRN 11/15/36 (c) | | | 1,570,000 | | | | 1,539,246 | |
| Hudson Yards Mortgage Trust | | | | | | | | |
| Series 2019-55HY, Class A, 3.041% VRN 12/10/41 (c) (i) | | | 375,000 | | | | 334,405 | |
| Series 2019-30HY, Class A, 3.228% 7/10/39 (c) | | | 385,000 | | | | 351,027 | |
| JP Morgan Chase Commercial Mortgage Securities Trust, Series 2019-OSB, Class A | | | | | | | | |
| 3.397%6/05/39(c) | | | 385,000 | | | | 353,479 | |
| | | Principal
Amount | | | Value | |
| MKT Mortgage Trust, Series 2020-525M, Class A | | | | | | | | |
| 2.694%2/12/40(c) | | $ | 255,000 | | | $ | 219,551 | |
| One Bryant Park Trust, Series 2019-OBP, Class A | | | | | | | | |
| 2.516%9/15/54(c) | | | 490,000 | | | | 423,909 | |
| RBS Commercial Funding, Inc. Trust, Series 2013-GSP, Class A, | | | | | | | | |
| 3.961% VRN 1/15/32 (c) (i) | | | 670,000 | | | | 656,043 | |
| SFAVE Commercial Mortgage Securities Trust, Series 2015-5AVE, Class A1, | | | | | | | | |
| 3.872% VRN 1/05/43 (c) (i) | | | 655,000 | | | | 552,255 | |
| Wells Fargo Commercial Mortgage Trust, Series 2019-JWDR, Class E, | | | | | | | | |
| 3.989% VRN 9/15/31 (c) (i) | | | 702,000 | | | | 615,534 | |
| | | | | | | | 9,544,620 | |
| Home Equity Asset-Backed Securities — 0.8% |
| Aegis Asset Backed Securities Trust Mortgage Pass-Through Ctfs, Series 2005-4, Class M2, 1 mo. USD LIBOR + .705% | | | | | | | | |
| 2.329% FRN 10/25/35 | | | 780,000 | | | | 746,781 | |
| Citigroup Mortgage Loan Trust, Series 2006-HE2, Class M1, 1 mo. USD LIBOR + .435% | | | | | | | | |
| 2.059% FRN 8/25/36 | | | 745,814 | | | | 741,540 | |
| Morgan Stanley Capital, Inc. Trust, Series 2006-HE1, Class A4, 1 mo. USD LIBOR + .580% | | | | | | | | |
| 2.204% FRN 1/25/36 | | | 1,000,145 | | | | 983,444 | |
| | | | | | | | 2,471,765 | |
| Other Asset-Backed Securities — 3.4% |
| Aimco CLO Ltd., Series 2020-11A, Class AR, 3 mo. USD LIBOR + 1.130% | | | | | | | | |
| 2.174% FRN 10/17/34 (c) | | | 750,000 | | | | 720,923 | |
| AIMCO CLO Series 2015-A, Series 2015-AA, Class BR2, 3 mo. USD LIBOR + 1.600% | | | | | | | | |
| 2.644% FRN 10/17/34 (c) | | | 1,100,000 | | | | 1,029,742 | |
| Allegro CLO XII Ltd., Series 2020-1A, Class A1, 3 mo. USD LIBOR + 1.250% | | | | | | | | |
| 2.348% FRN 1/21/32 (c) | | | 850,000 | | | | 831,974 | |
| Cedar Funding XIV CLO Ltd., Series 2021-14A, Class A, 3 mo. USD LIBOR + 1.100% | | | | | | | | |
| 2.144% FRN 7/15/33 (c) | | | 800,000 | | | | 776,917 | |
The accompanying notes are an integral part of the financial statements.
108
MML Total Return Bond Fund – Portfolio of Investments (Continued) |
| | | Principal
Amount | | | Value | |
| Dryden Senior Loan Fund, Series 2013-26A, Class AR, 3 mo. USD LIBOR + .900% | | | | | | | | |
| 1.944% FRN 4/15/29 (c) | | $ | 895,896 | | | $ | 882,759 | |
| Eaton Vance CLO 2020-1 Ltd., Series 2020-1A, Class AR, 3 mo. USD LIBOR + 1.170% | | | | | | | | |
| 2.214% FRN 10/15/34 (c) | | | 990,000 | | | | 959,439 | |
| Flatiron CLO Ltd., Series 2021-1A, Class B, 3 mo. USD LIBOR + 1.600% | | | | | | | | |
| 2.644% FRN 7/19/34 (c) | | | 850,000 | | | | 797,976 | |
| GSAMP Trust 2005-HE5, Series 2005-HE5, Class M3, 1 mo. USD LIBOR + .690% | | | | | | | | |
| 2.314% FRN 11/25/35 | | | 575,618 | | | | 569,824 | |
| Highbridge Loan Management ., Series 2021-16A, Class A1, 3 mo. USD LIBOR + 1.140% | | | | | | | | |
| 2.324% FRN 1/23/35 (c) | | | 1,000,000 | | | | 962,913 | |
| LCM LP, Series 21A, Class AR, 3 mo. USD LIBOR + .880% | | | | | | | | |
| 1.943% FRN 4/20/28 (c) | | | 258,096 | | | | 255,974 | |
| Magnetite Ltd., Series 2012-7A, Class A1R2, 3 mo. USD LIBOR + .800% | | | | | | | | |
| 1.844% FRN 1/15/28 (c) | | | 944,958 | | | | 929,890 | |
| Rockford Tower CLO Ltd., Series 2021-1A, Class A1, 3 mo. USD LIBOR + 1.170% | | | | | | | | |
| 2.233% FRN 7/20/34 (c) | | | 850,000 | | | | 826,711 | |
| Saxon Asset Securities Trust, Series 2007-2, Class A2C, 1 mo. USD LIBOR + .240% | | | | | | | | |
| 1.864% FRN 5/25/47 | | | 1,618,469 | | | | 1,193,909 | |
| | | | | | | | 10,738,951 | |
| Student Loans Asset-Backed Securities — 2.8% |
| Access Group, Inc., Series 2015-1, Class A, 1 mo. USD LIBOR + .700% | | | | | | | | |
| 2.324% FRN 7/25/56 (c) | | | 375,862 | | | | 364,578 | |
| Collegiate Funding Services Education Loan Trust, Series 2005-A, Class A4, 3 mo. USD LIBOR + .200% | | | | | | | | |
| 2.434% FRN 3/28/35 | | | 1,231,397 | | | | 1,215,462 | |
| Nelnet Student Loan Trust, Series 2015-1A, Class A, 1 mo. USD LIBOR + .590% | | | | | | | | |
| 2.214% FRN 4/25/46 (c) | | | 731,033 | | | | 718,072 | |
| | | Principal
Amount | | | Value | |
| SLM Student Loan Trust | | | | | | | | |
| Series 2007-7, Class A4, 3 mo. USD LIBOR + .330% 1.514% FRN 1/25/28 | | $ | 626,208 | | | $ | 614,193 | |
| Series 2012-2, Class A, 1 mo. USD LIBOR + .700% 1.706% FRN 1/25/29 | | | 788,016 | | | | 769,231 | |
| Series 2012-7, Class A3, 1 mo. USD LIBOR + .650% 2.274% FRN 5/26/26 | | | 673,530 | | | | 665,039 | |
| Series 2008-6, Class A4, 3 mo. USD LIBOR + 1.100% 2.284% FRN 7/25/23 | | | 941,814 | | | | 932,723 | |
| Series 2012-1, Class A3, 1 mo. USD LIBOR + .950% 2.574% FRN 9/25/28 | | | 664,578 | | | | 643,854 | |
| Series 2008-9, Class A, 3 mo. USD LIBOR + 1.500% 2.684% FRN 4/25/23 | | | 686,018 | | | | 685,747 | |
| Series 2008-5, Class B, 3 mo. USD LIBOR + 1.850% 3.034% FRN 7/25/73 | | | 700,000 | | | | 690,064 | |
| Series 2008-9, Class B, 3 mo. USD LIBOR + 2.250% 3.434% FRN 10/25/83 | | | 1,430,000 | | | | 1,424,837 | |
| | | | | | | | 8,723,800 | |
| Whole Loan Collateral Collateralized Mortgage Obligations — 5.4% |
| American Home Mortgage Investment Trust, Series 2005-1, Class 6A, 6 mo. USD LIBOR + 2.000% | | | | | | | | |
| 4.062% FRN 6/25/45 | | | 376,897 | | | | 366,532 | |
| Chase Mortgage Finance Trust, Series 2007-A1, Class 11A4, | | | | | | | | |
| 3.342% VRN 3/25/37 (i) | | | 239,388 | | | | 219,284 | |
| Citigroup Mortgage Loan Trust, Series 2005-11, Class A2A, 1 year CMT + 2.400% | | | | | | | | |
| 2.470% FRN 10/25/35 | | | 189,812 | | | | 185,378 | |
| COLT Mortgage Loan Trust, Series 2021-6, Class A1, | | | | | | | | |
| 1.907% VRN 12/25/66 (c) (i) | | | 834,213 | | | | 727,314 | |
| Countrywide Alternative Loan Trust | | | | | | | | |
| Series 2006-OA6, Class 1A2, 1 mo. USD LIBOR + .420% 2.044% FRN 7/25/46 | | | 878,672 | | | | 798,521 | |
| Series 2005-31, Class 2A1, 1 mo. USD LIBOR + .600% 2.224% FRN 8/25/35 | | | 866,012 | | | | 784,524 | |
| Credit Suisse Mortgage Trust, Series 2018-RPL9, Class A, | | | | | | | | |
| 3.850% VRN 9/25/57 (c) (i) | | | 871,298 | | | | 854,625 | |
The accompanying notes are an integral part of the financial statements.
109
MML Total Return Bond Fund – Portfolio of Investments (Continued) |
| | | Principal
Amount | | | Value | |
| Deutsche Alt-A Securities, Inc. Mortgage Loan Trust Series 2005-1, Series 2005-1, Class 1A3, 1 mo. USD LIBOR + .500% | | | | | | | | |
| 2.124% FRN 2/25/35 | | $ | 1,520,633 | | | $ | 1,427,578 | |
| First Horizon Mortgage Pass-Through Trust, Series 2005-AR5, Class 2A1, | | | | | | | | |
| 2.711% VRN 11/25/35 (i) | | | 245,233 | | | | 204,017 | |
| GS Mortgage-Backed Securities Trust, Series 2018-RPL1, Class A1A | | | | | | | | |
| 3.750%10/25/57(c) | | | 749,697 | | | | 735,942 | |
| HarborView Mortgage Loan Trust, Series 2006-10, Class 1A1A, 1 mo. USD LIBOR + .200% | | | | | | | | |
| 1.812% FRN 11/19/36 | | | 1,662,016 | | | | 1,397,226 | |
| Impac CMB Trust, Series 2005-1, Class 1A1, 1 mo. USD LIBOR + .520% | | | | | | | | |
| 2.144% FRN 4/25/35 | | | 497,296 | | | | 466,549 | |
| IndyMac Index Mortgage Loan Trust | | | | | | | | |
| Series 2006-AR27, Class 1A3, 1 mo. USD LIBOR + .540% 2.164% FRN 10/25/36 | | | 1,280,978 | | | | 619,581 | |
| Series 2005-AR19, Class A1, 2.766% VRN 10/25/35 (i) | | | 696,030 | | | | 591,856 | |
| JP Morgan Mortgage Trust, Series 2021-13, Class A3, | | | | | | | | |
| 2.500% VRN 4/25/52 (c) (i) | | | 1,782,383 | | | | 1,520,108 | |
| MASTR Adjustable Rate Mortgages Trust, Series 2007-1, Class I2A3, 12 mo. MTA + .740% | | | | | | | | |
| 1.216% FRN 1/25/47 | | | 1,423,712 | | | | 1,388,600 | |
| Nomura Asset Acceptance Corp. Alternative Loan Trust, Series 2005-AR1, Class M1, 1 mo. USD LIBOR + 1.070% | | | | | | | | |
| 2.694% FRN 2/25/35 | | | 642,546 | | | | 625,947 | |
| Opteum Mortgage Acceptance Corp., 1 mo. USD LIBOR + .750% | | | | | | | | |
| 2.374% FRN 11/25/35 | | | 1,450,000 | | | | 1,366,420 | |
| Washington Mutual Mortgage Pass-Through Certificates | | | | | | | | |
| Series 2005-AR15, Class A1A1, 1 mo. USD LIBOR + .520% 2.144% FRN 11/25/45 | | | 1,720,067 | | | | 1,592,538 | |
| Series 2005-AR13, Class A1A1, 1 mo. USD LIBOR + .580% 2.204% FRN 10/25/45 | | | 368,605 | | | | 346,134 | |
| Series 2005-AR2, Class 2A21, 1 mo. USD LIBOR + .660% 2.284% FRN 1/25/45 | | | 288,358 | | | | 280,372 | |
| | | Principal
Amount | | | Value | |
| Washington Mutual Mortgage Pass-Through Certificates Trust, Series 2006-1 Class 3A2 | | | | | | | | |
| 5.750%2/25/36 | | $ | 537,762 | | | $ | 484,283 | |
| | | | | | | | 16,983,329 | |
| | | | | | | | | |
| TOTAL NON-U.S. GOVERNMENT AGENCY OBLIGATIONS (Cost $50,589,198) | | | | | | | 48,462,465 | |
| | | | | | | | | |
| SOVEREIGN DEBT OBLIGATIONS — 1.2% |
| Abu Dhabi Government International Bond | | | | | | | | |
| 2.500%9/30/29(c) | | | 200,000 | | | | 183,658 | |
| Airport Authority | | | | | | | | |
| 3.250%1/12/52(c) | | | 405,000 | | | | 323,704 | |
| Brazilian Government International Bond | | | | | | | | |
| 2.875%6/06/25 | | | 200,000 | | | | 188,550 | |
| 3.875%6/12/30 | | | 200,000 | | | | 167,506 | |
| CBB International Sukuk Co. | | | | | | | | |
| 6.875%10/05/25(c) | | | 200,000 | | | | 208,072 | |
| Chile Government International Bond | | | | | | | | |
| 3.240%2/06/28 | | | 200,000 | | | | 188,065 | |
| Colombia Government International Bond | | | | | | | | |
| 4.500%1/28/26 | | | 200,000 | | | | 187,553 | |
| Dominican Republic International Bond | | | | | | | | |
| 4.500%1/30/30(c) | | | 200,000 | | | | 159,967 | |
| Hungary Government International Bond | | | | | | | | |
| 2.125%9/22/31(c) | | | 200,000 | | | | 154,306 | |
| Mexico Government International Bond | | | | | | | | |
| 2.659%5/24/31(d) | | | 288,000 | | | | 234,903 | |
| 3.750%1/11/28 | | | 300,000 | | | | 286,166 | |
| Oman Government International Bond | | | | | | | | |
| 5.625%1/17/28(c) | | | 200,000 | | | | 192,278 | |
| Panama Government International Bond | | | | | | | | |
| 2.252%9/29/32 | | | 200,000 | | | | 155,807 | |
| 3.160%1/23/30 | | | 200,000 | | | | 177,592 | |
| Peruvian Government International Bond | | | | | | | | |
| 2.844%6/20/30 | | | 80,000 | | | | 69,590 | |
| 4.125%8/25/27 | | | 200,000 | | | | 195,617 | |
| Qatar Government International Bond | | | | | | | | |
| 4.500%4/23/28(c) | | | 200,000 | | | | 207,250 | |
The accompanying notes are an integral part of the financial statements.
110
MML Total Return Bond Fund – Portfolio of Investments (Continued) |
| | | Principal
Amount | | | Value | |
| Republic of South Africa Government International Bond | | | | | | | | |
| 5.875%4/20/32 | | $ | 250,000 | | | $ | 213,200 | |
| Republic of Turkey International Bond | | | | | | | | |
| 3.250%3/23/23(d) | | | 200,000 | | | | 193,588 | |
| Romanian Government International Bond | | | | | | | | |
| 3.000%2/14/31(c) | | | 110,000 | | | | 84,551 | |
| | | | | | | | 3,771,923 | |
| | | | | | | | | |
| TOTAL SOVEREIGN DEBT OBLIGATIONS (Cost $4,440,845) | | | | | | | 3,771,923 | |
| | | | | | | | | |
| U.S. GOVERNMENT AGENCY OBLIGATIONS AND INSTRUMENTALITIES (j) — 34.4% |
| Collateralized Mortgage Obligations — 1.0% |
| Federal Home Loan Mortgage Corp. | | | | | | | | |
| Series 4818, Class CA, 3.000% 4/15/48 | | | 161,303 | | | | 154,353 | |
| Series 4639, Class HZ, 3.250% STEP 4/15/53 | | | 1,587,598 | | | | 1,405,646 | |
| Series 4846, Class PA, 4.000% 6/15/47 | | | 85,773 | | | | 86,215 | |
| Federal National Mortgage Association | | | | | | | | |
| Series 2018-43, Class CT, 3.000% 6/25/48 | | | 286,801 | | | | 277,349 | |
| Pool #BV8477 3.000% 5/01/52 | | | 623,103 | | | | 582,166 | |
| Series 2018-57, Class QA, 3.500% 5/25/46 | | | 120,074 | | | | 120,231 | |
| Series 2018-55, Class PA, 3.500% 1/25/47 | | | 98,905 | | | | 99,294 | |
| Government National Mortgage Association | | | | | | | | |
| Series 2018-124, Class NW, 3.500% 9/20/48 | | | 286,513 | | | | 280,110 | |
| Series 2019-15, Class GT, 3.500% 2/20/49 | | | 174,140 | | | | 170,431 | |
| | | | | | | | 3,175,795 | |
| Pass-Through Securities — 32.1% |
| Federal Home Loan Mortgage Corp. | | | | | | | | |
| Pool #QE0312 2.000% 4/01/52 | | | 1,235,425 | | | | 1,076,040 | |
| Pool #SD8205 2.500% 4/01/52 | | | 1,800,868 | | | | 1,624,184 | |
| Pool #G18592 3.000% 3/01/31 | | | 187,766 | | | | 186,376 | |
| Pool #G18627 3.000% 1/01/32 | | | 590,026 | | | | 585,841 | |
| Pool #G08710 3.000% 6/01/46 | | | 106,160 | | | | 101,051 | |
| Pool #ZM1779 3.000% 9/01/46 | | | 534,126 | | | | 507,464 | |
| Pool #G08726 3.000% 10/01/46 | | | 791,750 | | | | 752,159 | |
| Pool #G08732 3.000% 11/01/46 | | | 288,191 | | | | 273,780 | |
| Pool #G08741 3.000% 1/01/47 | | | 794,305 | | | | 753,841 | |
| Pool #G07848 3.500% 4/01/44 | | | 1,301,431 | | | | 1,282,854 | |
| | | Principal
Amount | | | Value | |
| Pool #G60023 3.500% 4/01/45 | | $ | 1,194,894 | | | $ | 1,179,332 | |
| Pool #G08711 3.500% 6/01/46 | | | 348,266 | | | | 341,553 | |
| Pool #G08716 3.500% 8/01/46 | | | 501,304 | | | | 491,642 | |
| Pool #G67700 3.500% 8/01/46 | | | 591,554 | | | | 581,077 | |
| Pool #G08722 3.500% 9/01/46 | | | 87,548 | | | | 85,860 | |
| Pool #G08742 3.500% 1/01/47 | | | 399,748 | | | | 391,793 | |
| Pool #G08757 3.500% 4/01/47 | | | 103,130 | | | | 101,046 | |
| Pool #G67703 3.500% 4/01/47 | | | 861,253 | | | | 845,729 | |
| Pool #G67706 3.500% 12/01/47 | | | 777,161 | | | | 762,425 | |
| Pool #ZA5103 3.500% 12/01/47 | | | 4,094 | | | | 4,002 | |
| Pool #G67707 3.500% 1/01/48 | | | 2,170,628 | | | | 2,132,861 | |
| Pool #G08800 3.500% 2/01/48 | | | 36,073 | | | | 35,287 | |
| Pool #G67708 3.500% 3/01/48 | | | 190,283 | | | | 186,912 | |
| Pool #G67710 3.500% 3/01/48 | | | 997,720 | | | | 976,619 | |
| Pool #G08816 3.500% 6/01/48 | | | 288,296 | | | | 281,839 | |
| Pool #G61556 3.500% 8/01/48 | | | 511,488 | | | | 500,511 | |
| Pool #G60344 4.000% 12/01/45 | | | 641,279 | | | | 646,879 | |
| Pool #G67711 4.000% 3/01/48 | | | 702,861 | | | | 706,803 | |
| Pool #G67713 4.000% 6/01/48 | | | 2,909 | | | | 2,923 | |
| Pool #G08843 4.500% 10/01/48 | | | 140,463 | | | | 143,150 | |
| Pool #G08833 5.000% 7/01/48 | | | 99,994 | | | | 103,554 | |
| Pool #G08844 5.000% 10/01/48 | | | 89,086 | | | | 92,146 | |
| Federal National Mortgage Association | | | | | | | | |
| Pool #MA4152 2.000% 10/01/40 | | | 847,787 | | | | 764,905 | |
| Pool #MA4176 2.000% 11/01/40 | | | 1,656,127 | | | | 1,491,115 | |
| Pool #MA4333 2.000% 5/01/41 | | | 200,368 | | | | 180,029 | |
| Pool #MA4492 2.000% 12/01/51 (k) | | | 1,818,362 | | | | 1,584,907 | |
| Pool #BQ6913 2.000% 12/01/51 | | | 2,367,792 | | | | 2,063,798 | |
| Pool #BQ7006 2.000% 1/01/52 | | | 3,674,959 | | | | 3,203,141 | |
| Pool #BL6060 2.455% 4/01/40 | | | 570,000 | | | | 445,283 | |
| Pool #MA4563 2.500% 3/01/52 | | | 1,739,971 | | | | 1,569,941 | |
| Pool #MA1607 3.000% 10/01/33 | | | 316,368 | | | | 307,891 | |
| Pool #MA3811 3.000% 10/01/49 | | | 217,678 | | | | 201,642 | |
| Pool #AB4262 3.500% 1/01/32 | | | 278,163 | | | | 277,776 | |
| Pool #MA1512 3.500% 7/01/33 | | | 136,314 | | | | 136,465 | |
| Pool #MA1148 3.500% 8/01/42 | | | 770,913 | | | | 757,795 | |
| Pool #CA0996 3.500% 1/01/48 | | | 137,418 | | | | 134,349 | |
| Pool #MA3305 3.500% 3/01/48 | | | 27,344 | | | | 26,717 | |
| Pool #BL1132 3.730% 1/01/29 | | | 920,000 | | | | 934,413 | |
| Pool #MA1146 4.000% 8/01/42 | | | 313,653 | | | | 315,916 | |
| Pool #AS9830 4.000% 6/01/47 | | | 144,079 | | | | 144,488 | |
| Pool #MA3027 4.000% 6/01/47 | | | 208,568 | | | | 209,161 | |
| Pool #AS9972 4.000% 7/01/47 | | | 130,817 | | | | 131,107 | |
| Pool #931504 4.500% 7/01/39 | | | 44,318 | | | | 45,885 | |
| Pool #CA1710 4.500% 5/01/48 | | | 488,051 | | | | 497,392 | |
| Pool #CA1711 4.500% 5/01/48 | | | 156,207 | | | | 159,197 | |
| Pool #CA2208 4.500% 8/01/48 | | | 279,515 | | | | 284,603 | |
The accompanying notes are an integral part of the financial statements.
111
MML Total Return Bond Fund – Portfolio of Investments (Continued) |
| | | Principal
Amount | | | Value | |
| Pool #AD6374 5.000% 5/01/40 | | $ | 9,297 | | | $ | 9,765 | |
| Pool #AI2733 5.000% 5/01/41 | | | 85,880 | | | | 90,464 | |
| Pool #977014 5.500% 5/01/38 | | | 9,662 | | | | 10,405 | |
| Pool #985524 5.500% 6/01/38 | | | 13,327 | | | | 14,370 | |
| Pool #988578 5.500% 8/01/38 | | | 107,203 | | | | 115,324 | |
| Pool #995482 5.500% 1/01/39 | | | 65,134 | | | | 70,158 | |
| Government National Mortgage Association II | | | | | | | | |
| Pool #MA4126 3.000% 12/20/46 | | | 644,000 | | | | 615,886 | |
| Pool #MA4718 3.000% 9/20/47 | | | 70,368 | | | | 67,274 | |
| Pool #MA4836 3.000% 11/20/47 | | | 247,002 | | | | 236,142 | |
| Pool #MA6209 3.000% 10/20/49 | | | 201,788 | | | | 188,312 | |
| Pool #MA3521 3.500% 3/20/46 | | | 253,155 | | | | 249,403 | |
| Pool #MA3597 3.500% 4/20/46 | | | 78,124 | | | | 76,893 | |
| Pool #MA3663 3.500% 5/20/46 | | | 114,754 | | | | 112,946 | |
| Pool #MA3937 3.500% 9/20/46 | | | 94,474 | | | | 92,986 | |
| Pool #MA4127 3.500% 12/20/46 | | | 342,871 | | | | 337,361 | |
| Pool #MA4262 3.500% 2/20/47 | | | 347,978 | | | | 342,278 | |
| Pool #MA4382 3.500% 4/20/47 | | | 89,528 | | | | 88,061 | |
| Pool #MA4719 3.500% 9/20/47 | | | 111,207 | | | | 109,351 | |
| Pool #MA4837 3.500% 11/20/47 | | | 229,415 | | | | 225,585 | |
| Pool #MA4900 3.500% 12/20/47 | | | 828,063 | | | | 814,240 | |
| Pool #MA4653 4.000% 8/20/47 | | | 43,704 | | | | 43,969 | |
| Pool #MA4838 4.000% 11/20/47 | | | 183,896 | | | | 185,012 | |
| Pool #MA4901 4.000% 12/20/47 | | | 79,609 | | | | 80,092 | |
| Pool #MA5078 4.000% 3/20/48 | | | 273,915 | | | | 275,405 | |
| Pool #MA5466 4.000% 9/20/48 | | | 303,329 | | | | 304,245 | |
| Pool #MA5399 4.500% 8/20/48 | | | 564,792 | | | | 578,163 | |
| Pool #MA3666 5.000% 5/20/46 | | | 89,163 | | | | 94,127 | |
| Pool #MA4199 5.000% 1/20/47 | | | 91,478 | | | | 95,720 | |
| Pool #MA4454 5.000% 5/20/47 | | | 148,576 | | | | 156,477 | |
| Pool #MA4722 5.000% 9/20/47 | | | 170,268 | | | | 178,897 | |
| Government National Mortgage Association II TBA 2.500% 7/21/52 (k) | | | 5,225,000 | | | | 4,789,039 | |
| Uniform Mortgage Backed Securities TBA | | | | | | | | |
| 2.000%7/14/52(k) | | | 4,700,000 | | | | 4,088,266 | |
| 2.000%8/11/52(k) | | | 14,100,000 | | | | 12,250,476 | |
| 2.500%7/14/52(k) | | | 6,075,000 | | | | 5,473,195 | |
| 2.500%8/11/52(k) | | | 14,500,000 | | | | 13,046,601 | |
| 3.000%7/14/52(k) | | | 10,850,000 | | | | 10,121,016 | |
| 3.000%8/11/52(k) | | | 1,100,000 | | | | 1,024,805 | |
| 3.500%7/14/52(k) | | | 2,500,000 | | | | 2,407,422 | |
| 3.500%8/11/52(k) | | | 1,350,000 | | | | 1,298,162 | |
| 4.000%7/14/52(k) | | | 3,650,000 | | | | 3,603,805 | |
| 4.500%7/14/52(k) | | | 3,125,000 | | | | 3,140,625 | |
| | | | | | | | 100,708,172 | |
| | | Principal
Amount | | | Value | |
| U.S. Agencies Notes — 1.3% |
| Federal Home Loan Banks 1.040% 6/14/24 | | $ | 4,110,000 | | | $ | 3,954,058 | |
| | | | | | | | | |
| TOTAL U.S. GOVERNMENT AGENCY OBLIGATIONS AND INSTRUMENTALITIES (Cost $109,813,435) | | | | | | | 107,838,025 | |
| | | | | | | | | |
| U.S. TREASURY OBLIGATIONS — 29.9% |
| U.S. Treasury Bonds & Notes — 29.9% |
| U.S. Treasury Bond | | | | | | | | |
| 2.000%11/15/41 | | | 17,332,000 | | | | 13,846,644 | |
| 2.375%2/15/42 | | | 6,330,000 | | | | 5,399,292 | |
| 2.875%5/15/52 | | | 5,010,000 | | | | 4,771,243 | |
| U.S. Treasury Inflation Index | | | | | | | | |
| 0.125%2/15/52 | | | 778,778 | | | | 618,560 | |
| U.S. Treasury Note | | | | | | | | |
| 2.500%4/30/24 | | | 2,725,000 | | | | 2,703,358 | |
| 2.500%5/31/24(d) | | | 5,375,000 | | | | 5,330,831 | |
| 2.625%5/31/27(d) | | | 8,585,000 | | | | 8,435,575 | |
| 2.750%4/30/27 | | | 10,995,000 | | | | 10,863,580 | |
| 2.875%6/15/25 | | | 17,780,000 | | | | 17,728,598 | |
| 2.875%5/15/32 | | | 1,689,000 | | | | 1,674,750 | |
| 3.000%6/30/24 | | | 5,325,000 | | | | 5,332,695 | |
| 3.250%6/30/27 | | | 16,885,000 | | | | 17,074,956 | |
| | | | | | | | 93,780,082 | |
| | | | | | | | | |
| TOTAL U.S. TREASURY OBLIGATIONS (Cost $96,090,885) | | | | | | | 93,780,082 | |
| | | | | | | | | |
| TOTAL BONDS & NOTES (Cost $374,209,650) | | | | | | | 354,411,111 | |
| | | | | | | | | |
| TOTAL PURCHASED OPTIONS (#) — 0.0% (Cost $87,254) | | | | | | | 5,300 | |
| | | | | | | | | |
| RIGHTS — 0.0% |
| Communications — 0.0% |
| Telecommunications — 0.0% |
| Intelsat Jackson Holdings S.A. 12/05/25 (f) (g) (h) | | | 755 | | | | — | |
| Intelsat Jackson Holdings S.A. 12/05/25 (f) (g) (h) | | | 755 | | | | — | |
| | | | | | | | — | |
| | | | | | | | | |
| TOTAL RIGHTS (Cost $0) | | | | | | | — | |
The accompanying notes are an integral part of the financial statements.
112
MML Total Return Bond Fund – Portfolio of Investments (Continued) |
| | | Number of
Shares | | | Value | |
| MUTUAL FUNDS — 4.9% |
| Diversified Financial Services — 4.9% |
| State Street Navigator Securities Lending Government Money Market Portfolio (l) | | | 15,507,583 | | | $ | 15,507,583 | |
| | | | | | | | | |
| TOTAL MUTUAL FUNDS (Cost $15,507,583) | | | | | | | 15,507,583 | |
| | | | | | | | | |
| TOTAL LONG-TERM INVESTMENTS (Cost $390,481,481) | | | | | | | 370,120,467 | |
| | | | Principal
Amount | | | | | |
| SHORT-TERM INVESTMENTS — 6.5% |
| Repurchase Agreement — 1.6% |
| Fixed Income Clearing Corp., Repurchase Agreement, dated 6/30/22, 0.240%, due 7/01/22 (m) | | $ | 4,863,045 | | | | 4,863,045 | |
| U.S. Treasury Bill — 4.9% |
| U.S. Treasury Bill | | | | | | | | |
| 1.277%10/20/22(n) | | | 2,770,000 | | | | 2,753,698 | |
| 1.445%11/03/22(n) | | | 2,910,000 | | | | 2,890,044 | |
| 1.494%11/17/22(n) | | | 3,550,000 | | | | 3,521,935 | |
| 1.537%9/15/22(n) | | | 5,365,000 | | | | 5,347,020 | |
| 2.279%12/15/22(n) | | | 830,000 | | | | 821,293 | |
| | | | | | | | 15,333,990 | |
| | | | | | | | | |
| TOTAL SHORT-TERM INVESTMENTS (Cost $20,217,324) | | | | | | | 20,197,035 | |
| | | | | | | | | |
| TOTAL INVESTMENTS — 124.4% (Cost $410,698,805) (o) | | | | | | | 390,317,502 | |
| | | | | | | | | |
| Less Unfunded Loan Commitments — 0.0% | | | | | | | (35,326 | ) |
| | | | | | | | | |
| NET INVESTMENTS — 124.4% (Cost $410,663,479) | | | | | | | 390,282,176 | |
| | | | | | | | | |
| Other Assets/(Liabilities) — (24.4)% | | | | | | | (76,591,656 | ) |
| | | | | | | | | |
| NET ASSETS — 100.0% | | | | | | $ | 313,690,520 | |
Abbreviation Legend
CLO | Collateralized Loan Obligation |
Notes to Portfolio of Investments
Percentages are stated as a percent of net assets.
(a) | All or a portion of the security represents unsettled loan commitments at June 30, 2022 where the rate will be determined at time of settlement. |
(b) | Unfunded or partially unfunded loan commitments. |
(c) | Security is exempt from registration under Regulation S or Rule 144A of the Securities Act of 1933. These securities are considered restricted and may be resold in transactions exempt from registration. At June 30, 2022, the aggregate market value of these securities amounted to $51,800,610 or 16.51% of net assets. |
(d) | Denotes all or a portion of security on loan. The total value of securities on loan as of June 30, 2022, was $15,759,754 or 5.02% of net assets. Total securities on loan may be less than the amounts identified in the Portfolio of Investments. The Fund received $585,139 of non-cash collateral (U.S. Treasury and/or Agency obligations) related to securities lending activity. This amount is not reflected on either the Portfolio of Investments or the Statement of Assets and Liabilities. (Note 2). |
(e) | The principal amount of the security is in foreign currency. The market value is in U.S. dollars. |
(f) | Investment was valued using significant unobservable inputs. |
(g) | This security is fair valued in good faith in accordance with procedures approved by the Board of Trustees. At June 30, 2022, these securities amounted to a value of $0 or 0.00% of net assets. |
(h) | Non-income producing security. |
(i) | Certain variable rate securities are not based on a published reference rate and spread but are determined by the issuer or agent and are based on current market conditions. These securities do not indicate a reference rate and spread in their description above. The rates shown are the current interest rates at June 30, 2022. |
(j) | May contain securities that are issued by a U.S. Government Agency, but are unsecured and are not guaranteed by a U.S. Government Agency. |
(k) | A portion of this security is purchased on a when-issued, delayed-delivery or forward commitment basis. (Note 2). |
(l) | Represents investment of security lending cash collateral. (Note 2). |
(m) | Maturity value of $4,863,077. Collateralized by U.S. Government Agency obligations with a rate of 3.000%, maturity date of 6/30/24, and an aggregate market value, including accrued interest, of $4,960,367. |
(n) | The rate shown represents yield-to-maturity. |
(o) | See Note 6 for aggregate cost for federal tax purposes. |
The accompanying notes are an integral part of the financial statements.
113
MML Total Return Bond Fund – Portfolio of Investments (Continued) |
(#) Exchange-Traded Options Purchased
Description | | Expiration
Date | | | Exercise
Price | | | No. of
Contracts | | | Notional
Amount | | | Value | | | Premiums
Paid
(Received) | | | Unrealized
Appreciation/
(Depreciation) | |
Call | | | | | | | | | | | | | | | | | | | | | | | | | | | | | | | | |
Eurodollar 1 Year Mid Curve Future | | | 9/16/22 | | | | 98.38 | | | | 51 | | | | USD | | | | 12,329,250 | | | $ | 2,550 | | | $ | 21,819 | | | $ | (19,269 | ) |
Eurodollar 1 Year Mid Curve Future | | | 9/16/22 | | | | 98.75 | | | | 110 | | | | USD | | | | 26,592,500 | | | | 2,750 | | | | 65,435 | | | | (62,685 | ) |
| | | | | | | | | | | | | | | | | | | | | | | $ | 5,300 | | | $ | 87,254 | | | $ | (81,954 | ) |
Exchange-Traded Options Written
Description | | Expiration
Date | | | Exercise
Price | | | No. of
Contracts | | | Notional
Amount | | | Value | | | Premiums
Paid
(Received) | | | Unrealized
Appreciation/
(Depreciation) | |
Call | | | | | | | | | | | | | | | | | | | | | | | | | | | | | | | | |
Eurodollar 1 Year Mid Curve Future | | | 9/16/22 | | | | 99.00 | | | | 250 | | | | USD | | | | 60,437,500 | | | $ | (3,125 | ) | | $ | (82,545 | ) | | $ | 79,420 | |
Forward contracts
Counterparty | | Settlement
Date | | | Currency Purchased | | | Currency Sold | | | Unrealized
Appreciation
(Depreciation) | |
Citibank N.A.* | | | 7/08/22 | | | | EUR | | | | 152,000 | | | | USD | | | | 159,925 | | | $ | (608 | ) |
Citibank N.A.* | | | 7/08/22 | | | | USD | | | | 162,370 | | | | EUR | | | | 152,000 | | | | 3,052 | |
Citibank N.A.* | | | 10/07/22 | | | | USD | | | | 151,529 | | | | EUR | | | | 143,000 | | | | 654 | |
| | | | | | | | | | | | | | | | | | | | | | | $ | 3,098 | |
Futures contracts
| | Expiration
Date | | | Number of
Contracts | | | Notional
Amount | | | Value/ Net
Unrealized
Appreciation/
(Depreciation) | |
Long | | | | | | | | | | | | | | | | |
U.S. Treasury Note 2 Year | | | 9/30/22 | | | | 34 | | | $ | 7,180,432 | | | $ | (39,901 | ) |
The accompanying notes are an integral part of the financial statements.
114
MML Total Return Bond Fund – Portfolio of Investments (Continued) |
Centrally Cleared Interest Rate Swaps
Paid by the Fund | Received by the Fund | | | | | | | | | | | | | | | | | | | | | | | | |
Rate/
Reference | | Frequency | | Rate/
Reference | | Frequency | | | Termination
Date | | | Notional
Amount | | | Value | | | Upfront
Premium
Paid/
(Received) | | | Unrealized
Appreciation
(Depreciation) | |
12 mo. SOFR | | | Annually | | Fixed 1.950% | | | Annually | | | | 6/10/24 | | | | USD | | | | 19,270,000 | | | $ | (383,608 | ) | | $ | — | | | $ | (383,608 | ) |
3-Month USD LIBOR BBA | | | Quarterly | | Fixed 1.073% | | | Semi-Annually | | | | 7/24/25 | | | | USD | | | | 3,875,000 | | | | (142,958 | ) | | | — | | | | (142,958 | ) |
3-Month USD LIBOR BBA | | | Quarterly | | Fixed 1.034% | | | Semi-Annually | | | | 7/24/25 | | | | USD | | | | 5,725,000 | | | | (215,381 | ) | | | — | | | | (215,381 | ) |
3-Month USD LIBOR BBA | | | Quarterly | | Fixed 1.026% | | | Semi-Annually | | | | 7/24/25 | | | | USD | | | | 7,750,000 | | | | (292,723 | ) | | | — | | | | (292,723 | ) |
3-Month USD LIBOR BBA | | | Quarterly | | Fixed 1.390% | | | Semi-Annually | | | | 9/28/25 | | | | USD | | | | 15,085,000 | | | | (448,394 | ) | | | — | | | | (448,394 | ) |
3-Month USD LIBOR BBA | | | Quarterly | | Fixed 1.688% | | | Semi-Annually | | | | 12/07/25 | | | | USD | | | | 10,555,000 | | | | (245,351 | ) | | | — | | | | (245,351 | ) |
Fixed 1.808% | | | Semi-Annually | | 3-Month USD LIBOR BBA | | | Quarterly | | | | 7/24/53 | | | | USD | | | | 325,000 | | | | 68,921 | | | | — | | | | 68,921 | |
Fixed 1.785% | | | Semi-Annually | | 3-Month USD LIBOR BBA | | | Quarterly | | | | 7/24/53 | | | | USD | | | | 475,000 | | | | 102,830 | | | | — | | | | 102,830 | |
Fixed 1.773% | | | Semi-Annually | | 3-Month USD LIBOR BBA | | | Quarterly | | | | 7/24/53 | | | | USD | | | | 650,000 | | | | 142,311 | | | | — | | | | 142,311 | |
Fixed 1.870% | | | Semi-Annually | | 3-Month USD LIBOR BBA | | | Quarterly | | | | 9/28/53 | | | | USD | | | | 1,285,000 | | | | 253,007 | | | | — | | | | 253,007 | |
Fixed 1.743% | | | Semi-Annually | | 3-Month USD LIBOR BBA | | | Quarterly | | | | 12/07/53 | | | | USD | | | | 880,000 | | | | 192,768 | | | | — | | | | 192,768 | |
| | | | | | | | | | | | | | | | | | | | | | | | $ | (968,578 | ) | | $ | — | | | $ | (968,578 | ) |
* Contracts are subject to a master netting agreement or similar agreement.
Currency Legend
The accompanying notes are an integral part of the financial statements.
115
MML Series Investment Fund – Financial Statements | |
Statements of Assets and Liabilities
June 30, 2022 (Unaudited) | |
| | | MML
Conservative
Allocation
Fund | | | MML
Balanced
Allocation
Fund | |
Assets: | | | | | | | | |
Investments, at value - unaffiliated issuers (Note 2) (a) | | $ | 8,566,413 | | | $ | 8,005,518 | |
Investments, at value - affiliated issuers (Notes 2 & 7) (b) | | | 314,294,250 | | | | 367,426,041 | |
Repurchase agreements, at value (Note 2) (c) | | | — | | | | — | |
Other short-term investments, at value (Note 2) (d) | | | — | | | | — | |
Total investments (e) | | | 322,860,663 | | | | 375,431,559 | |
Receivables from: | | | | | | | | |
Investments sold | | | | | | | | |
Regular delivery | | | 127,958 | | | | 342,684 | |
Fund shares sold | | | 5,113 | | | | 122,482 | |
Investment adviser (Note 3) | | | — | | | | — | |
Dividends | | | — | | | | — | |
Total assets | | | 322,993,734 | | | | 375,896,725 | |
Liabilities: | | | | | | | | |
Payables for: | | | | | | | | |
Investments purchased | | | | | | | | |
Regular delivery | | | — | | | | — | |
Fund shares repurchased | | | 129,848 | | | | 461,398 | |
Collateral held for securities on loan (Note 2) (f) | | | — | | | | — | |
Trustees’ fees and expenses (Note 3) | | | 41,455 | | | | 50,089 | |
Affiliates (Note 3): | | | | | | | | |
Administration fees | | | — | | | | — | |
Investment advisory fees | | | 27,100 | | | | 31,678 | |
Service fees | | | 167,653 | | | | 193,250 | |
Accrued expense and other liabilities | | | 45,776 | | | | 47,745 | |
Total liabilities | | | 411,832 | | | | 784,160 | |
Net assets | | $ | 322,581,902 | | | $ | 375,112,565 | |
Net assets consist of: | | | | | | | | |
Paid-in capital | | $ | 324,128,991 | | | $ | 372,073,107 | |
Accumulated Gain (Loss) | | | (1,547,089 | ) | | | 3,039,458 | |
Net assets | | $ | 322,581,902 | | | $ | 375,112,565 | |
(a) | Cost of investments - unaffiliated issuers: | | $ | 10,902,182 | | | $ | 10,227,441 | |
(b) | Cost of investments - affiliated issuers: | | $ | 343,820,453 | | | $ | 392,986,455 | |
(c) | Cost of repurchase agreements: | | $ | — | | | $ | — | |
(d) | Cost of other short-term investments: | | $ | — | | | $ | — | |
(e) | Securities on loan with market value of: | | $ | — | | | $ | — | |
(f) | Non-cash collateral is not included. | | | | | | | | |
The accompanying notes are an integral part of the financial statements.
116
| | MML
Moderate
Allocation
Fund | | | MML
Growth
Allocation
Fund | | | MML
Aggressive
Allocation
Fund | | | MML
American
Funds Growth
Fund | | | MML
American
Funds
International
Fund | | | MML
American
Funds Core
Allocation
Fund | | | MML
Blue Chip
Growth Fund | |
| | | | | | | | | | | | | | | | | | | | | | | | | | | | |
| | $ | 14,884,970 | | | $ | 10,821,346 | | | $ | 1,012,530 | | | $ | 203,529,115 | | | $ | 45,221,293 | | | $ | 740,295,665 | | | $ | 402,912,981 | |
| | | 1,333,424,065 | | | | 935,998,868 | | | | 128,615,610 | | | | — | | | | — | | | | — | | | | — | |
| | | — | | | | — | | | | — | | | | — | | | | — | | | | — | | | | 2,730,797 | |
| | | — | | | | — | | | | — | | | | — | | | | — | | | | — | | | | 100 | |
| | | 1,348,309,035 | | | | 946,820,214 | | | | 129,628,140 | | | | 203,529,115 | | | | 45,221,293 | | | | 740,295,665 | | | | 405,643,878 | |
| | | | | | | | | | | | | | | | | | | | | | | | | | | | |
| | | | | | | | | | | | | | | | | | | | | | | | | | | | |
| | | 223,045 | | | | 103,281 | | | | — | | | | — | | | | — | | | | 350,093 | | | | — | |
| | | 43,232 | | | | 244,892 | | | | 37,147 | | | | 3,679,455 | | | | 259,852 | | | | 72,939 | | | | 914,322 | |
| | | — | | | | — | | | | — | | | | — | | | | — | | | | 61,751 | | | | — | |
| | | — | | | | — | | | | — | | | | — | | | | — | | | | — | | | | 83,633 | |
| | | 1,348,575,312 | | | | 947,168,387 | | | | 129,665,287 | | | | 207,208,570 | | | | 45,481,145 | | | | 740,780,448 | | | | 406,641,833 | |
| | | | | | | | | | | | | | | | | | | | | | | | | | | | |
| | | | | | | | | | | | | | | | | | | | | | | | | | | | |
| | | | | | | | | | | | | | | | | | | | | | | | | | | | |
| | | — | | | | — | | | | 25,989 | | | | 3,673,687 | | | | 257,311 | | | | — | | | | 896,178 | |
| | | 252,616 | | | | 338,618 | | | | 9,833 | | | | 3,617 | | | | 2,077 | | | | 415,621 | | | | 48,097 | |
| | | — | | | | — | | | | — | | | | — | | | | — | | | | — | | | | 1,057,491 | |
| | | 187,008 | | | | 144,917 | | | | 12,749 | | | | 15,669 | | | | 5,545 | | | | 79,407 | | | | 43,990 | |
| | | | | | | | | | | | | | | | | | | | | | | | | | | | |
| | | — | | | | — | | | | — | | | | 42,839 | | | | 9,668 | | | | 155,949 | | | | — | |
| | | 113,811 | | | | 79,882 | | | | 10,989 | | | | 25,703 | | | | 5,801 | | | | 124,445 | | | | 258,031 | |
| | | 756,254 | | | | 400,763 | | | | 50,185 | | | | 141,445 | | | | 30,712 | | | | 494,106 | | | | 90,500 | |
| | | 86,281 | | | | 69,244 | | | | 38,728 | | | | 32,072 | | | | 28,972 | | | | 50,904 | | | | 104,523 | |
| | | 1,395,970 | | | | 1,033,424 | | | | 148,473 | | | | 3,935,032 | | | | 340,086 | | | | 1,320,432 | | | | 2,498,810 | |
| | $ | 1,347,179,342 | | | $ | 946,134,963 | | | $ | 129,516,814 | | | $ | 203,273,538 | | | $ | 45,141,059 | | | $ | 739,460,016 | | | $ | 404,143,023 | |
| | | | | | | | | | | | | | | | | | | | | | | | | | | | |
| | $ | 1,321,977,913 | | | $ | 892,263,835 | | | $ | 124,835,284 | | | $ | 135,007,939 | | | $ | 48,055,125 | | | $ | 657,203,622 | | | $ | 273,886,775 | |
| | | 25,201,429 | | | | 53,871,128 | | | | 4,681,530 | | | | 68,265,599 | | | | (2,914,066 | ) | | | 82,256,394 | | | | 130,256,248 | |
| | $ | 1,347,179,342 | | | $ | 946,134,963 | | | $ | 129,516,814 | | | $ | 203,273,538 | | | $ | 45,141,059 | | | $ | 739,460,016 | | | $ | 404,143,023 | |
| | $ | 18,902,668 | | | $ | 13,821,063 | | | $ | 1,284,308 | | | $ | 221,399,001 | | | $ | 56,687,013 | | | $ | 806,483,397 | | | $ | 351,560,223 | |
| | $ | 1,433,442,826 | | | $ | 997,081,230 | | | $ | 140,851,103 | | | $ | — | | | $ | — | | | $ | — | | | $ | — | |
| | $ | — | | | $ | — | | | $ | — | | | $ | — | | | $ | — | | | $ | — | | | $ | 2,730,797 | |
| | $ | — | | | $ | — | | | $ | — | | | $ | — | | | $ | — | | | $ | — | | | $ | 100 | |
| | $ | — | | | $ | — | | | $ | — | | | $ | — | | | $ | — | | | $ | — | | | $ | 1,891,580 | |
| | | | | | | | | | | | | | | | | | | | | | | | | | | | |
The accompanying notes are an integral part of the financial statements.
117
MML Series Investment Fund – Financial Statements (Continued) |
Statements of Assets and Liabilities
June 30, 2022 (Unaudited) |
| | | MML
Conservative
Allocation
Fund | | | MML
Balanced
Allocation
Fund | |
Initial Class shares: | | | | | | | | |
Net assets | | $ | 71,773,144 | | | $ | 86,031,856 | |
Shares outstanding (a) | | | 7,794,326 | | | | 9,308,667 | |
Net asset value, offering price and redemption price per share | | $ | 9.21 | | | $ | 9.24 | |
Service Class shares: | | | | | | | | |
Net assets | | $ | 250,808,758 | | | $ | 289,080,709 | |
Shares outstanding (a) | | | 27,599,413 | | | | 31,650,088 | |
Net asset value, offering price and redemption price per share | | $ | 9.09 | | | $ | 9.13 | |
Service Class I shares: | | | | | | | | |
Net assets | | $ | — | | | $ | — | |
Shares outstanding (a) | | | — | | | | — | |
Net asset value, offering price and redemption price per share | | $ | — | | | $ | — | |
(a) | Authorized unlimited number of shares with no par value. |
The accompanying notes are an integral part of the financial statements.
118
| | MML
Moderate
Allocation
Fund | | | MML
Growth
Allocation
Fund | | | MML
Aggressive
Allocation
Fund | | | MML
American
Funds Growth
Fund | | | MML
American
Funds
International
Fund | | | MML
American
Funds Core
Allocation
Fund | | | MML
Blue Chip
Growth Fund | |
| | | | | | | | | | | | | | | | | | | | | | | | | | | | |
| | $ | 224,321,652 | | | $ | 348,005,318 | | | $ | 55,686,007 | | | $ | — | | | $ | — | | | $ | — | | | $ | 275,393,903 | |
| | | 23,147,242 | | | | 41,545,283 | | | | 5,837,705 | | | | — | | | | — | | | | — | | | | 19,668,920 | |
| | $ | 9.69 | | | $ | 8.38 | | | $ | 9.54 | | | $ | — | | | $ | — | | | $ | — | | | $ | 14.00 | |
| | | | | | | | | | | | | | | | | | | | | | | | | | | | |
| | $ | 1,122,857,690 | | | $ | 598,129,645 | | | $ | 73,830,807 | | | $ | — | | | $ | — | | | $ | — | | | $ | 128,749,120 | |
| | | 117,546,940 | | | | 72,233,555 | | | | 7,898,756 | | | | — | | | | — | | | | — | | | | 9,816,409 | |
| | $ | 9.55 | | | $ | 8.28 | | | $ | 9.35 | | | $ | — | | | $ | — | | | $ | — | | | $ | 13.12 | |
| | | | | | | | | | | | | | | | | | | | | | | | | | | | |
| | $ | — | | | $ | — | | | $ | — | | | $ | 203,273,538 | | | $ | 45,141,059 | | | $ | 739,460,016 | | | $ | — | |
| | | — | | | | — | | | | — | | | | 12,909,905 | | | | 5,605,921 | | | | 65,859,462 | | | | — | |
| | $ | — | | | $ | — | | | $ | — | | | $ | 15.75 | | | $ | 8.05 | | | $ | 11.23 | | | $ | — | |
The accompanying notes are an integral part of the financial statements.
119
MML Series Investment Fund – Financial Statements (Continued) |
Statements of Assets and Liabilities
June 30, 2022 (Unaudited) |
| | | MML
Equity
Income Fund | | | MML
Equity
Index Fund | |
Assets: | | | | | | | | |
Investments, at value (Note 2) (a) | | $ | 385,614,382 | | | $ | 597,021,432 | |
Repurchase agreements, at value (Note 2) (b) | | | 3,370,058 | | | | 3,572,534 | |
Other short-term investments, at value (Note 2) (c) | | | 1,077 | | | | 852,880 | |
Total investments (d) | | | 388,985,517 | | | | 601,446,846 | |
Cash | | | 16,208 | | | | — | |
Foreign currency, at value (e) | | | 479 | | | | — | |
Receivables from: | | | | | | | | |
Investments sold | | | | | | | | |
Regular delivery | | | 1,614,038 | | | | — | |
Fund shares sold | | | 3,265 | | | | 518,661 | |
Collateral pledged for open futures contracts (Note 2) | | | — | | | | 860,000 | |
Interest and dividends | | | 705,075 | | | | 473,333 | |
Foreign taxes withheld | | | 76,103 | | | | — | |
Total assets | | | 391,400,685 | | | | 603,298,840 | |
Liabilities: | | | | | | | | |
Payables for: | | | | | | | | |
Investments purchased | | | | | | | | |
Regular delivery | | | 336,329 | | | | — | |
Fund shares repurchased | | | 3,285,599 | | | | 54,658 | |
Collateral held for securities on loan (Note 2) (f) | | | 1,618,767 | | | | — | |
Trustees’ fees and expenses (Note 3) | | | 56,156 | | | | 76,363 | |
Variation margin on open derivative instruments (Note 2) | | | — | | | | 38,071 | |
Affiliates (Note 3): | | | | | | | | |
Administration fees | | | — | | | | 52,323 | |
Investment advisory fees | | | 246,681 | | | | 49,061 | |
Service fees | | | 52,293 | | | | 26,519 | |
Due to custodian | | | — | | | | 851,297 | |
Accrued expense and other liabilities | | | 80,548 | | | | 114,184 | |
Total liabilities | | | 5,676,373 | | | | 1,262,476 | |
Net assets | | $ | 385,724,312 | | | $ | 602,036,364 | |
Net assets consist of: | | | | | | | | |
Paid-in capital | | $ | 236,075,610 | | | $ | 290,991,433 | |
Accumulated Gain (Loss) | | | 149,648,702 | | | | 311,044,931 | |
Net assets | | $ | 385,724,312 | | | $ | 602,036,364 | |
(a) | Cost of investments: | | $ | 319,788,374 | | | $ | 350,799,173 | |
(b) | Cost of repurchase agreements: | | $ | 3,370,058 | | | $ | 3,572,534 | |
(c) | Cost of other short-term investments: | | $ | 1,077 | | | $ | 853,608 | |
(d) | Securities on loan with market value of: | | $ | 1,586,838 | | | $ | 133,689 | |
(e) | Cost of foreign currency: | | $ | 482 | | | $ | — | |
(f) | Non-cash collateral is not included. | | | | | | | | |
The accompanying notes are an integral part of the financial statements.
120
| | MML
Focused
Equity Fund | | | MML
Foreign
Fund | | | MML
Fundamental
Equity Fund | | | MML
Fundamental
Value Fund | | | MML
Global Fund | | | MML
Income &
Growth Fund | | | MML
International
Equity Fund | |
| | | | | | | | | | | | | | | | | | | | | | | | | | | | |
| | $ | 311,790,041 | | | $ | 181,956,011 | | | $ | 180,508,718 | | | $ | 162,675,379 | | | $ | 130,704,840 | | | $ | 216,661,145 | | | $ | 202,243,594 | |
| | | 3,122,339 | | | | 442,616 | | | | 816,582 | | | | 3,752,529 | | | | 949,537 | | | | 3,148,640 | | | | 2,138,053 | |
| | | — | | | | — | | | | — | | | | — | | | | — | | | | — | | | | — | |
| | | 314,912,380 | | | | 182,398,627 | | | | 181,325,300 | | | | 166,427,908 | | | | 131,654,377 | | | | 219,809,785 | | | | 204,381,647 | |
| | | — | | | | — | | | | — | | | | 16,760 | | | | 10,388 | | | | — | | | | 15,273 | |
| | | — | | | | 193,599 | | | | 282 | | | | 56,820 | | | | 4 | | | | — | | | | 31,591 | |
| | | | | | | | | | | | | | | | | | | | | | | | | | | | |
| | | | | | | | | | | | | | | | | | | | | | | | | | | | |
| | | — | | | | 128,407 | | | | — | | | | — | | | | 74,120 | | | | 113,881 | | | | 125,887 | |
| | | 2,741 | | | | 1,617 | | | | 2,337 | | | | 1,563 | | | | 110,964 | | | | 60,965 | | | | 1,819 | |
| | | — | | | | 789 | | | | — | | | | — | | | | — | | | | — | | | | — | |
| | | 425,674 | | | | 329,657 | | | | 93,128 | | | | 154,132 | | | | 140,156 | | | | 526,819 | | | | 191,524 | |
| | | — | | | | 1,022,868 | | | | 5,373 | | | | 39,417 | | | | 737,053 | | | | — | | | | 917,964 | |
| | | 315,340,795 | | | | 184,075,564 | | | | 181,426,420 | | | | 166,696,600 | | | | 132,727,062 | | | | 220,511,450 | | | | 205,665,705 | |
| | | | | | | | | | | | | | | | | | | | | | | | | | | | |
| | | | | | | | | | | | | | | | | | | | | | | | | | | | |
| | | | | | | | | | | | | | | | | | | | | | | | | | | | |
| | | — | | | | 392,968 | | | | 111,381 | | | | — | | | | 130,965 | | | | — | | | | 60,717 | |
| | | 294,785 | | | | 1,005,236 | | | | 85,850 | | | | 30,220 | | | | 60,146 | | | | 124,856 | | | | 27,848 | |
| | | — | | | | 21,389 | | | | — | | | | — | | | | — | | | | — | | | | 8,019 | |
| | | 15,031 | | | | 39,054 | | | | 16,245 | | | | 20,384 | | | | 24,304 | | | | 26,888 | | | | 13,624 | |
| | | — | | | | — | | | | — | | | | — | | | | — | | | | — | | | | — | |
| | | | | | | | | | | | | | | | | | | | | | | | | | | | |
| | | 39,523 | | | | — | | | | 23,043 | | | | 21,420 | | | | 17,030 | | | | — | | | | 26,386 | |
| | | 178,637 | | | | 136,572 | | | | 92,168 | | | | 85,679 | | | | 68,118 | | | | 121,385 | | | | 137,237 | |
| | | 13,209 | | | | 4,311 | | | | 13,352 | | | | 14,033 | | | | 10,173 | | | | 18,508 | | | | 4,631 | |
| | | — | | | | 724 | | | | — | | | | — | | | | — | | | | — | | | | — | |
| | | 69,578 | | | | 108,017 | | | | 66,384 | | | | 54,436 | | | | 105,593 | | | | 66,861 | | | | 81,688 | |
| | | 610,763 | | | | 1,708,271 | | | | 408,423 | | | | 226,172 | | | | 416,329 | | | | 358,498 | | | | 360,150 | |
| | $ | 314,730,032 | | | $ | 182,367,293 | | | $ | 181,017,997 | | | $ | 166,470,428 | | | $ | 132,310,733 | | | $ | 220,152,952 | | | $ | 205,305,555 | |
| | | | | | | | | | | | | | | | | | | | | | | | | | | | |
| | $ | 245,509,110 | | | $ | 177,996,590 | | | $ | 150,363,963 | | | $ | 105,227,264 | | | $ | 18,303,045 | | | $ | 146,196,512 | | | $ | 234,256,284 | |
| | | 69,220,922 | | | | 4,370,703 | | | | 30,654,034 | | | | 61,243,164 | | | | 114,007,688 | | | | 73,956,440 | | | | (28,950,729 | ) |
| | $ | 314,730,032 | | | $ | 182,367,293 | | | $ | 181,017,997 | | | $ | 166,470,428 | | | $ | 132,310,733 | | | $ | 220,152,952 | | | $ | 205,305,555 | |
| | $ | 287,898,912 | | | $ | 201,366,122 | | | $ | 183,182,645 | | | $ | 140,664,404 | | | $ | 119,740,085 | | | $ | 188,804,492 | | | $ | 242,770,911 | |
| | $ | 3,122,339 | | | $ | 442,616 | | | $ | 816,582 | | | $ | 3,752,529 | | | $ | 949,537 | | | $ | 3,148,640 | | | $ | 2,138,053 | |
| | $ | — | | | $ | — | | | $ | — | | | $ | — | | | $ | — | | | $ | — | | | $ | — | |
| | $ | — | | | $ | 799,911 | | | $ | — | | | $ | 1,185,726 | | | $ | 571,311 | | | $ | 147,734 | | | $ | 2,559,682 | |
| | $ | — | | | $ | 192,291 | | | $ | 299 | | | $ | 58,113 | | | $ | 4 | | | $ | — | | | $ | 31,326 | |
| | | | | | | | | | | | | | | | | | | | | | | | | | | | |
The accompanying notes are an integral part of the financial statements.
121
MML Series Investment Fund – Financial Statements (Continued) |
Statements of Assets and Liabilities
June 30, 2022 (Unaudited) |
| | | MML
Equity
Income Fund | | | MML
Equity
Index Fund | |
Initial Class shares: | | | | | | | | |
Net assets | | $ | 307,718,142 | | | $ | — | |
Shares outstanding (a) | | | 27,160,486 | | | | — | |
Net asset value, offering price and redemption price per share | | $ | 11.33 | | | $ | — | |
Class I shares: | | | | | | | | |
Net assets | | $ | — | | | $ | 49,392,220 | |
Shares outstanding (a) | | | — | | | | 1,753,889 | |
Net asset value, offering price and redemption price per share | | $ | — | | | $ | 28.16 | |
Class II shares: | | | | | | | | |
Net assets | | $ | — | | | $ | 234,959,749 | |
Shares outstanding (a) | | | — | | | | 8,345,396 | |
Net asset value, offering price and redemption price per share | | $ | — | | | $ | 28.15 | |
Class III shares: | | | | | | | | |
Net assets | | $ | — | | | $ | 279,019,124 | |
Shares outstanding (a) | | | — | | | | 9,922,831 | |
Net asset value, offering price and redemption price per share | | $ | — | | | $ | 28.12 | |
Service Class shares: | | | | | | | | |
Net assets | | $ | 78,006,170 | | | $ | — | |
Shares outstanding (a) | | | 7,000,714 | | | | — | |
Net asset value, offering price and redemption price per share | | $ | 11.14 | | | $ | — | |
Service Class I shares: | | | | | | | | |
Net assets | | $ | — | | | $ | 38,665,271 | |
Shares outstanding (a) | | | — | | | | 1,444,616 | |
Net asset value, offering price and redemption price per share | | $ | — | | | $ | 26.77 | |
(a) | Authorized unlimited number of shares with no par value. |
The accompanying notes are an integral part of the financial statements.
122
| | MML
Focused
Equity Fund | | | MML
Foreign
Fund | | | MML
Fundamental
Equity Fund | | | MML
Fundamental
Value Fund | | | MML
Global Fund | | | MML
Income &
Growth Fund | | | MML
International
Equity Fund | |
| | | | | | | | | | | | | | | | | | | | | | | | | | | | |
| | $ | — | | | $ | 176,078,677 | | | $ | — | | | $ | — | | | $ | — | | | $ | 192,305,174 | | | $ | — | |
| | | — | | | | 19,619,208 | | | | — | | | | — | | | | — | | | | 16,832,925 | | | | — | |
| | $ | — | | | $ | 8.97 | | | $ | — | | | $ | — | | | $ | — | | | $ | 11.42 | | | $ | — | |
| | | | | | | | | | | | | | | | | | | | | | | | | | | | |
| | $ | — | | | $ | — | | | $ | — | | | $ | — | | | $ | 102,155,107 | | | $ | — | | | $ | — | |
| | | — | | | | — | | | | — | | | | — | | | | 8,718,788 | | | | — | | | | — | |
| | $ | — | | | $ | — | | | $ | — | | | $ | — | | | $ | 11.72 | | | $ | — | | | $ | — | |
| | | | | | | | | | | | | | | | | | | | | | | | | | | | |
| | $ | 294,603,809 | | | $ | — | | | $ | 161,272,303 | | | $ | 145,329,766 | | | $ | 15,199,648 | �� | | $ | — | | | $ | 198,592,821 | |
| | | 39,828,825 | | | | — | | | | 16,437,327 | | | | 10,980,175 | | | | 1,262,182 | | | | — | | | | 22,243,619 | |
| | $ | 7.40 | | | $ | — | | | $ | 9.81 | | | $ | 13.24 | | | $ | 12.04 | | | $ | — | | | $ | 8.93 | |
| | | | | | | | | | | | | | | | | | | | | | | | | | | | |
| | $ | — | | | $ | — | | | $ | — | | | $ | — | | | $ | — | | | $ | — | | | $ | — | |
| | | — | | | | — | | | | — | | | | — | | | | — | | | | — | | | | — | |
| | $ | — | | | $ | — | | | $ | — | | | $ | — | | | $ | — | | | $ | — | | | $ | — | |
| | | | | | | | | | | | | | | | | | | | | | | | | | | | |
| | $ | — | | | $ | 6,288,616 | | | $ | — | | | $ | — | | | $ | — | | | $ | 27,847,778 | | | $ | — | |
| | | — | | | | 705,941 | | | | — | | | | — | | | | — | | | | 2,482,855 | | | | — | |
| | $ | — | | | $ | 8.91 | | | $ | — | | | $ | — | | | $ | — | | | $ | 11.22 | | | $ | — | |
| | | | | | | | | | | | | | | | | | | | | | | | | | | | |
| | $ | 20,126,223 | | | $ | — | | | $ | 19,745,694 | | | $ | 21,140,662 | | | $ | 14,955,978 | | | $ | — | | | $ | 6,712,734 | |
| | | 2,840,243 | | | | — | | | | 2,104,915 | | | | 1,639,389 | | | | 1,298,832 | | | | — | | | | 760,758 | |
| | $ | 7.09 | | | $ | — | | | $ | 9.38 | | | $ | 12.90 | | | $ | 11.51 | | | $ | — | | | $ | 8.82 | |
The accompanying notes are an integral part of the financial statements.
123
MML Series Investment Fund – Financial Statements (Continued) |
Statements of Assets and Liabilities
June 30, 2022 (Unaudited) |
| | | MML
Large Cap
Growth Fund | | | MML
Managed
Volatility Fund | |
Assets: | | | | | | | | |
Investments, at value (Note 2) (a) | | $ | 154,621,839 | | | $ | 112,361,756 | |
Repurchase agreements, at value (Note 2) (b) | | | 2,180,094 | | | | 2,791,292 | |
Other short-term investments, at value (Note 2) (c) | | | — | | | | — | |
Total investments (d) | | | 156,801,933 | | | | 115,153,048 | |
Cash | | | — | | | | 1,626 | |
Foreign currency, at value (e) | | | — | | | | 29,550 | |
Receivables from: | | | | | | | | |
Investments sold | | | | | | | | |
Regular delivery | | | — | | | | — | |
Delayed delivery | | | — | | | | — | |
Open forward contracts (Note 2) | | | — | | | | — | |
Fund shares sold | | | 46,700 | | | | 25,400 | |
Collateral pledged for open futures and options contracts (Note 2) | | | — | | | | — | |
Collateral pledged for open swap agreements (Note 2) | | | — | | | | — | |
Variation margin on open derivative instruments (Note 2) | | | — | | | | — | |
Interest and dividends | | | 11,294 | | | | 86,375 | |
Interest tax reclaim | | | — | | | | — | |
Foreign taxes withheld | | | 182,642 | | | | — | |
Total assets | | | 157,042,569 | | | | 115,295,999 | |
Liabilities: | | | | | | | | |
Payables for: | | | | | | | | |
Investments purchased | | | | | | | | |
Regular delivery | | | 67,150 | | | | — | |
Delayed delivery | | | — | | | | — | |
Written options outstanding, at value (Note 2) (f) | | | — | | | | 1,460,275 | |
Open forward contracts (Note 2) | | | — | | | | — | |
Interest and dividends | | | — | | | | — | |
Fund shares repurchased | | | 27,909 | | | | 3,275,517 | |
Collateral held for securities on loan (Note 2) (g) | | | — | | | | — | |
Trustees’ fees and expenses (Note 3) | | | 17,070 | | | | 28,255 | |
Affiliates (Note 3): | | | | | | | | |
Administration fees | | | — | | | | — | |
Investment advisory fees | | | 86,813 | | | | 71,316 | |
Service fees | | | 12,574 | | | | 14,133 | |
Due to custodian | | | — | | | | — | |
Accrued expense and other liabilities | | | 53,972 | | | | 182,332 | |
Total liabilities | | | 265,488 | | | | 5,031,828 | |
Net assets | | $ | 156,777,081 | | | $ | 110,264,171 | |
Net assets consist of: | | | | | | | | |
Paid-in capital | | $ | 135,704,433 | | | $ | 61,633,499 | |
Accumulated Gain (Loss) | | | 21,072,648 | | | | 48,630,672 | |
Net assets | | $ | 156,777,081 | | | $ | 110,264,171 | |
(a) | Cost of investments: | | $ | 159,961,497 | | | $ | 75,053,542 | |
(b) | Cost of repurchase agreements: | | $ | 2,180,094 | | | $ | 2,791,292 | |
(c) | Cost of other short-term investments: | | $ | — | | | $ | — | |
(d) | Securities on loan with market value of: | | $ | — | | | $ | — | |
(e) | Cost of foreign currency: | | $ | — | | | $ | 28,942 | |
(f) | Premiums on written options: | | $ | — | | | $ | 2,864,544 | |
(g) | Non-cash collateral is not included. | | | | | | | | |
The accompanying notes are an integral part of the financial statements.
124
| | MML
Mid Cap
Growth Fund | | | MML
Mid Cap
Value Fund | | | MML Small
Cap Growth
Equity Fund | | | MML Small
Company
Value Fund | | | MML
Small/Mid
Cap Value
Fund | | | MML
Sustainable
Equity Fund | | | MML
Total Return
Bond Fund | |
| | | | | | | | | | | | | | | | | | | | | | | | | | | | |
| | $ | 305,940,598 | | | $ | 292,391,550 | | | $ | 141,847,640 | | | $ | 78,472,851 | | | $ | 134,254,323 | | | $ | 132,587,587 | | | $ | 370,085,141 | |
| | | 12,245,321 | | | | 6,915,027 | | | | 1,557,535 | | | | 713,729 | | | | 1,811,476 | | | | 175,656 | | | | 4,863,045 | |
| | | 102 | | | | — | | | | — | | | | — | | | | — | | | | — | | | | 15,333,990 | |
| | | 318,186,021 | | | | 299,306,577 | | | | 143,405,175 | | | | 79,186,580 | | | | 136,065,799 | | | | 132,763,243 | | | | 390,282,176 | |
| | | — | | | | — | | | | 2,534 | | | | — | | | | 23 | | | | — | | | | 93,155 | |
| | | — | | | | 54 | | | | 10 | | | | 39 | | | | — | | | | 73 | | | | — | |
| | | | | | | | | | | | | | | | | | | | | | | | | | | | |
| | | | | | | | | | | | | | | | | | | | | | | | | | | | |
| | | 2,423,359 | | | | 414,276 | | | | 298,594 | | | | 130,904 | | | | 192,863 | | | | 200,575 | | | | 832,011 | |
| | | — | | | | — | | | | — | | | | — | | | | — | | | | — | | | | 28,869,667 | |
| | | — | | | | 70,951 | | | | — | | | | 1,984 | | | | — | | | | 3,147 | | | | 3,706 | |
| | | 867,421 | | | | 13,178 | | | | 3,305,035 | | | | 1,235 | | | | 625,155 | | | | 40,713 | | | | 838 | |
| | | — | | | | — | | | | — | | | | — | | | | — | | | | — | | | | 1,825,000 | |
| | | — | | | | — | | | | — | | | | — | | | | — | | | | — | | | | 807,645 | |
| | | — | | | | — | | | | — | | | | — | | | | — | | | | — | | | | 143,550 | |
| | | 63,274 | | | | 517,392 | | | | 103,740 | | | | 97,341 | | | | 138,733 | | | | 121,961 | | | | 1,445,423 | |
| | | — | | | | — | | | | — | | | | — | | | | — | | | | — | | | | 967 | |
| | | 1,781 | | | | 25,901 | | | | — | | | | — | | | | — | | | | 3,002 | | | | — | |
| | | 321,541,856 | | | | 300,348,329 | | | | 147,115,088 | | | | 79,418,083 | | | | 137,022,573 | | | | 133,132,714 | | | | 424,304,138 | |
| | | | | | | | | | | | | | | | | | | | | | | | | | | | |
| | | | | | | | | | | | | | | | | | | | | | | | | | | | |
| | | | | | | | | | | | | | | | | | | | | | | | | | | | |
| | | 1,438,151 | | | | 1,335,392 | | | | 451,015 | | | | 289,793 | | | | 1,733,992 | | | | 138,057 | | | | 2,497,580 | |
| | | — | | | | — | | | | — | | | | — | | | | — | | | | — | | | | 92,096,535 | |
| | | — | | | | — | | | | — | | | | — | | | | — | | | | — | | | | 3,125 | |
| | | — | | | | 20,030 | | | | — | | | | — | | | | — | | | | — | | | | 608 | |
| | | — | | | | — | | | | — | | | | — | | | | — | | | | — | | | | 2,050 | |
| | | 39,059 | | | | 2,925,449 | | | | 10,342 | | | | 30,507 | | | | 54,323 | | | | 48,958 | | | | 162,323 | |
| | | 1,148,290 | | | | — | | | | 3,141,719 | | | | 718,563 | | | | — | | | | — | | | | 15,507,583 | |
| | | 47,822 | | | | 50,698 | | | | 29,973 | | | | 10,478 | | | | 24,660 | | | | 19,220 | | | | 35,603 | |
| | | | | | | | | | | | | | | | | | | | | | | | | | | | |
| | | — | | | | — | | | | — | | | | 10,082 | | | | — | | | | — | | | | 38,881 | |
| | | 208,752 | | | | 214,521 | | | | 124,445 | | | | 53,772 | | | | 87,317 | | | | 56,454 | | | | 103,682 | |
| | | 56,304 | | | | 33,283 | | | | 16,059 | | | | 16,916 | | | | 15,966 | | | | 32,216 | | | | 26,229 | |
| | | — | | | | 330,699 | | | | — | | | | — | | | | — | | | | — | | | | — | |
| | | 106,209 | | | | 90,155 | | | | 64,867 | | | | 43,128 | | | | 58,958 | | | | 53,413 | | | | 139,419 | |
| | | 3,044,587 | | | | 5,000,227 | | | | 3,838,420 | | | | 1,173,239 | | | | 1,975,216 | | | | 348,318 | | | | 110,613,618 | |
| | $ | 318,497,269 | | | $ | 295,348,102 | | | $ | 143,276,668 | | | $ | 78,244,844 | | | $ | 135,047,357 | | | $ | 132,784,396 | | | $ | 313,690,520 | |
| | | | | | | | | | | | | | | | | | | | | | | | | | | | |
| | $ | 202,468,709 | | | $ | 187,779,543 | | | $ | 117,255,410 | | | $ | 47,651,794 | | | $ | 84,623,817 | | | $ | 59,222,184 | | | $ | 351,040,585 | |
| | | 116,028,560 | | | | 107,568,559 | | | | 26,021,258 | | | | 30,593,050 | | | | 50,423,540 | | | | 73,562,212 | | | | (37,350,065 | ) |
| | $ | 318,497,269 | | | $ | 295,348,102 | | | $ | 143,276,668 | | | $ | 78,244,844 | | | $ | 135,047,357 | | | $ | 132,784,396 | | | $ | 313,690,520 | |
| | $ | 293,213,620 | | | $ | 301,184,150 | | | $ | 152,176,857 | | | $ | 93,702,719 | | | $ | 139,570,109 | | | $ | 120,667,082 | | | $ | 390,446,155 | |
| | $ | 12,245,321 | | | $ | 6,915,027 | | | $ | 1,557,535 | | | $ | 713,729 | | | $ | 1,811,476 | | | $ | 175,656 | | | $ | 4,863,045 | |
| | $ | 102 | | | $ | — | | | $ | — | | | $ | — | | | $ | — | | | $ | — | | | $ | 15,354,279 | |
| | $ | 5,809,239 | | | $ | 6,149,965 | | | $ | 10,225,545 | | | $ | 5,039,624 | | | $ | — | | | $ | — | | | $ | 15,759,754 | |
| | $ | — | | | $ | 55 | | | $ | 11 | | | $ | 39 | | | $ | — | | | $ | 73 | | | $ | — | |
| | $ | — | | | $ | — | | | $ | — | | | $ | — | | | $ | — | | | $ | — | | | $ | 82,545 | |
| | | | | | | | | | | | | | | | | | | | | | | | | | | | |
The accompanying notes are an integral part of the financial statements.
125
MML Series Investment Fund – Financial Statements (Continued) |
Statements of Assets and Liabilities
June 30, 2022 (Unaudited) |
| | | MML
Large Cap
Growth Fund | | | MML
Managed
Volatility Fund | |
Initial Class shares: | | | | | | | | |
Net assets | | $ | 138,669,463 | | | $ | 89,003,558 | |
Shares outstanding (a) | | | 12,939,201 | | | | 6,667,060 | |
Net asset value, offering price and redemption price per share | | $ | 10.72 | | | $ | 13.35 | |
Class II shares: | | | | | | | | |
Net assets | | $ | — | | | $ | — | |
Shares outstanding (a) | | | — | | | | — | |
Net asset value, offering price and redemption price per share | | $ | — | | | $ | — | |
Service Class shares: | | | | | | | | |
Net assets | | $ | 18,107,618 | | | $ | 21,260,613 | |
Shares outstanding (a) | | | 1,775,392 | | | | 1,607,817 | |
Net asset value, offering price and redemption price per share | | $ | 10.20 | | | $ | 13.22 | |
Service Class I shares: | | | | | | | | |
Net assets | | $ | — | | | $ | — | |
Shares outstanding (a) | | | — | | | | — | |
Net asset value, offering price and redemption price per share | | $ | — | | | $ | — | |
(a) | Authorized unlimited number of shares with no par value. |
The accompanying notes are an integral part of the financial statements.
126
| | MML
Mid Cap
Growth Fund | | | MML
Mid Cap
Value Fund | | | MML Small
Cap Growth
Equity Fund | | | MML Small
Company
Value Fund | | | MML
Small/Mid
Cap Value
Fund | | | MML
Sustainable
Equity Fund | | | MML
Total Return
Bond Fund | |
| | | | | | | | | | | | | | | | | | | | | | | | | | | | |
| | $ | 235,835,848 | | | $ | 245,860,702 | | | $ | 120,156,259 | | | $ | — | | | $ | 111,835,283 | | | $ | 85,355,097 | | | $ | — | |
| | | 19,799,970 | | | | 21,251,763 | | | | 10,669,860 | | | | — | | | | 9,473,389 | | | | 4,368,915 | | | | — | |
| | $ | 11.91 | | | $ | 11.57 | | | $ | 11.26 | | | $ | — | | | $ | 11.81 | | | $ | 19.54 | | | $ | — | |
| | | | | | | | | | | | | | | | | | | | | | | | | | | | |
| | $ | — | | | $ | — | | | $ | — | | | $ | 53,114,786 | | | $ | — | | | $ | — | | | $ | 273,037,204 | |
| | | — | | | | — | | | | — | | | | 3,555,349 | | | | — | | | | — | | | | 29,469,190 | |
| | $ | — | | | $ | — | | | $ | — | | | $ | 14.94 | | | $ | — | | | $ | — | | | $ | 9.27 | |
| | | | | | | | | | | | | | | | | | | | | | | | | | | | |
| | $ | 82,661,421 | | | $ | 49,487,400 | | | $ | 23,120,409 | | | $ | — | | | $ | 23,212,074 | | | $ | 47,429,299 | | | $ | — | |
| | | 7,485,912 | | | | 4,376,499 | | | | 2,283,794 | | | | — | | | | 1,996,293 | | | | 2,458,052 | | | | — | |
| | $ | 11.04 | | | $ | 11.31 | | | $ | 10.12 | | | $ | — | | | $ | 11.63 | | | $ | 19.30 | | | $ | — | |
| | | | | | | | | | | | | | | | | | | | | | | | | | | | |
| | $ | — | | | $ | — | | | $ | — | | | $ | 25,130,058 | | | $ | — | | | $ | — | | | $ | 40,653,316 | |
| | | — | | | | — | | | | — | | | | 1,758,419 | | | | — | | | | — | | | | 4,457,121 | |
| | $ | — | | | $ | — | | | $ | — | | | $ | 14.29 | | | $ | — | | | $ | — | | | $ | 9.12 | |
The accompanying notes are an integral part of the financial statements.
127
MML Series Investment Fund – Financial Statements (Continued) | |
Statements of Operations
For the Six Months Ended June 30, 2022 (Unaudited) | |
| | | MML
Conservative
Allocation
Fund | | | MML
Balanced
Allocation
Fund | |
Investment income (Note 2): | | | | | | | | |
Dividends (a) | | $ | — | | | $ | — | |
Interest | | | — | | | | — | |
Securities lending net income | | | — | | | | — | |
Non cash income | | | — | | | | — | |
Total investment income | | | — | | | | — | |
Expenses (Note 3): | | | | | | | | |
Investment advisory fees | | | 179,558 | | | | 210,263 | |
Custody fees | | | 9,299 | | | | 9,296 | |
Audit fees | | | 18,049 | | | | 18,113 | |
Legal fees | | | 4,078 | | | | 4,746 | |
Proxy fees | | | 406 | | | | 406 | |
Shareholder reporting fees | | | 7,421 | | | | 8,187 | |
Trustees’ fees | | | 9,619 | | | | 11,274 | |
| | | | 228,430 | | | | 262,285 | |
Administration fees: | | | | | | | | |
Service Class I | | | — | | | | — | |
Distribution and Service fees: | | | | | | | | |
Service Class | | | 350,702 | | | | 405,548 | |
Service Class I | | | — | | | | — | |
Total expenses | | | 579,132 | | | | 667,833 | |
Expenses waived (Note 3): | | | | | | | | |
Service Class I fees reimbursed by adviser | | | — | | | | — | |
Net expenses: | | | 579,132 | | | | 667,833 | |
Net investment income (loss) | | | (579,132 | ) | | | (667,833 | ) |
Realized and unrealized gain (loss): | | | | | | | | |
Net realized gain (loss) on: | | | | | | | | |
Investment transactions - unaffiliated issuers | | | 10,296 | | | | 51,515 | |
Investment transactions - affiliated issuers (Note 7) | | | 1,138,589 | | | | 737,496 | |
Foreign currency transactions | | | — | | | | — | |
Realized gain distributions - unaffiliated issuers | | | — | | | | — | |
Net realized gain (loss) | | | 1,148,885 | | | | 789,011 | |
Net change in unrealized appreciation (depreciation) on: | | | | | | | | |
Investment transactions - unaffiliated issuers | | | (1,764,670 | ) | | | (1,726,418 | ) |
Investment transactions - affiliated issuers (Note 7) | | | (55,798,484 | ) | | | (67,935,638 | ) |
Net change in unrealized appreciation (depreciation) | | | (57,563,154 | ) | | | (69,662,056 | ) |
Net realized gain (loss) and change in unrealized appreciation (depreciation) | | | (56,414,269 | ) | | | (68,873,045 | ) |
Net increase (decrease) in net assets resulting from operations | | $ | (56,993,401 | ) | | $ | (69,540,878 | ) |
(a) | Net of foreign withholding tax of: | | $ | — | | | $ | — | |
The accompanying notes are an integral part of the financial statements.
128
| | MML
Moderate
Allocation
Fund | | | MML
Growth
Allocation
Fund | | | MML
Aggressive
Allocation
Fund | | | MML
American
Funds Growth
Fund | | | MML
American
Funds
International
Fund | | | MML
American
Funds Core
Allocation
Fund | | | MML
Blue Chip
Growth Fund | |
| | | | | | | | | | | | | | | | | | | | | | | | | | | | |
| | $ | — | | | $ | — | | | $ | — | | | $ | 329,901 | | | $ | 236,350 | | | $ | 3,665,323 | | | $ | 992,286 | |
| | | — | | | | — | | | | — | | | | — | | | | — | | | | — | | | | 16,643 | |
| | | — | | | | — | | | | — | | | | — | | | | — | | | | — | | | | 8,042 | |
| | | — | | | | — | | | | — | | | | — | | | | — | | | | — | | | | 101,577 | |
| | | — | | | | — | | | | — | | | | 329,901 | | | | 236,350 | | | | 3,665,323 | | | | 1,118,548 | |
| | | | | | | | | | | | | | | | | | | | | | | | | | | | |
| | | 766,403 | | | | 534,365 | | | | 74,160 | | | | 181,357 | | | | 38,850 | | | | 815,683 | | | | 1,833,836 | |
| | | 9,295 | | | | 9,333 | | | | 9,263 | | | | 1,667 | | | | 1,667 | | | | 2,623 | | | | 30,157 | |
| | | 19,315 | | | | 18,796 | | | | 17,830 | | | | 17,901 | | | | 17,701 | | | | 18,511 | | | | 21,381 | |
| | | 18,073 | | | | 12,125 | | | | 1,662 | | | | 2,740 | | | | 606 | | | | 9,347 | | | | 5,607 | |
| | | 406 | | | | 406 | | | | 406 | | | | 406 | | | | 406 | | | | 406 | | | | 406 | |
| | | 22,378 | | | | 16,392 | | | | 4,812 | | | | 9,266 | | | | 7,067 | | | | 13,181 | | | | 18,086 | |
| | | 42,419 | | | | 28,821 | | | | 3,977 | | | | 6,548 | | | | 1,423 | | | | 22,112 | | | | 13,478 | |
| | | 878,289 | | | | 620,238 | | | | 112,110 | | | | 219,885 | | | | 67,720 | | | | 881,863 | | | | 1,922,951 | |
| | | | | | | | | | | | | | | | | | | | | | | | | | | | |
| | | — | | | | — | | | | — | | | | 302,262 | | | | 64,749 | | | | 1,032,621 | | | | — | |
| | | | | | | | | | | | | | | | | | | | | | | | | | | | |
| | | 1,601,167 | | | | 843,385 | | | | 105,725 | | | | — | | | | — | | | | — | | | | 198,320 | |
| | | — | | | | — | | | | — | | | | 302,262 | | | | 64,749 | | | | 1,032,621 | | | | — | |
| | | 2,479,456 | | | | 1,463,623 | | | | 217,835 | | | | 824,409 | | | | 197,218 | | | | 2,947,105 | | | | 2,121,271 | |
| | | | | | | | | | | | | | | | | | | | | | | | | | | | |
| | | — | | | | — | | | | — | | | | — | | | | — | | | | (408,509 | ) | | | — | |
| | | 2,479,456 | | | | 1,463,623 | | | | 217,835 | | | | 824,409 | | | | 197,218 | | | | 2,538,596 | | | | 2,121,271 | |
| | | (2,479,456 | ) | | | (1,463,623 | ) | | | (217,835 | ) | | | (494,508 | ) | | | 39,132 | | | | 1,126,727 | | | | (1,002,723 | ) |
| | | | | | | | | | | | | | | | | | | | | | | | | | | | |
| | | | | | | | | | | | | | | | | | | | | | | | | | | | |
| | | (152,869 | ) | | | (14,522 | ) | | | 322,066 | | | | 3,667,119 | | | | (284,933 | ) | | | 5,548,414 | | | | (2,908,647 | ) |
| | | 4,745,706 | | | | 2,949,154 | | | | 82,248 | | | | — | | | | — | | | | — | | | | — | |
| | | — | | | | — | | | | — | | | | — | | | | — | | | | — | | | | (65 | ) |
| | | — | | | | — | | | | — | | | | 32,021,495 | | | | 6,676,194 | | | | 85,294,546 | | | | — | |
| | | 4,592,837 | | | | 2,934,632 | | | | 404,314 | | | | 35,688,614 | | | | 6,391,261 | | | | 90,842,960 | | | | (2,908,712 | ) |
| | | | | | | | | | | | | | | | | | | | | | | | | | | | |
| | | (2,679,439 | ) | | | (2,204,081 | ) | | | (1,102,952 | ) | | | (122,189,463 | ) | | | (19,996,713 | ) | | | (228,047,011 | ) | | | (218,230,305 | ) |
| | | (268,840,787 | ) | | | (200,919,856 | ) | | | (29,489,959 | ) | | | — | | | | — | | | | — | | | | — | |
| | | (271,520,226 | ) | | | (203,123,937 | ) | | | (30,592,911 | ) | | | (122,189,463 | ) | | | (19,996,713 | ) | | | (228,047,011 | ) | | | (218,230,305 | ) |
| | | (266,927,389 | ) | | | (200,189,305 | ) | | | (30,188,597 | ) | | | (86,500,849 | ) | | | (13,605,452 | ) | | | (137,204,051 | ) | | | (221,139,017 | ) |
| | $ | (269,406,845 | ) | | $ | (201,652,928 | ) | | $ | (30,406,432 | ) | | $ | (86,995,357 | ) | | $ | (13,566,320 | ) | | $ | (136,077,324 | ) | | $ | (222,141,740 | ) |
The accompanying notes are an integral part of the financial statements.
129
MML Series Investment Fund – Financial Statements (Continued) |
Statements of Operations
For the Six Months Ended June 30, 2022 (Unaudited) |
| | | MML
Equity
Income Fund | | | MML
Equity
Index Fund | |
Investment income (Note 2): | | | | | | | | |
Dividends (a) | | $ | 5,892,942 | | | $ | 5,304,301 | |
Interest | | | 590 | | | | 1,680 | |
Securities lending net income | | | 5,517 | | | | 322 | |
Non cash income | | | — | | | | — | |
Total investment income | | | 5,899,049 | | | | 5,306,303 | |
Expenses (Note 3): | | | | | | | | |
Investment advisory fees | | | 1,633,621 | | | | 323,920 | |
Custody fees | | | 18,718 | | | | 23,059 | |
Audit fees | | | 20,922 | | | | 21,528 | |
Legal fees | | | 5,412 | | | | 8,299 | |
Proxy fees | | | 406 | | | | 406 | |
Shareholder reporting fees | | | 14,928 | | | | 25,527 | |
Trustees’ fees | | | 11,011 | | | | 17,234 | |
| | | | 1,705,018 | | | | 419,973 | |
Administration fees: | | | | | | | | |
Class I | | | — | | | | 85,371 | |
Class II | | | — | | | | 199,772 | |
Service Class I | | | — | | | | 67,711 | |
Distribution and Service fees: | | | | | | | | |
Service Class | | | 107,104 | | | | — | |
Service Class I | | | — | | | | 56,426 | |
Total expenses | | | 1,812,122 | | | | 829,253 | |
Expenses waived (Note 3): | | | | | | | | |
Initial Class advisory fees waived | | | (52,492 | ) | | | — | |
Class II advisory fees waived | | | — | | | | — | |
Service Class advisory fees waived | | | (12,853 | ) | | | — | |
Service Class I advisory fees waived | | | — | | | | — | |
Net expenses: | | | 1,746,777 | | | | 829,253 | |
Net investment income (loss) | | | 4,152,272 | | | | 4,477,050 | |
Realized and unrealized gain (loss): | | | | | | | | |
Net realized gain (loss) on: | | | | | | | | |
Investment transactions | | | 18,066,303 | | | | 18,532,488 | |
Futures contracts | | | — | | | | (1,047,686 | ) |
Foreign currency transactions | | | (11,350 | ) | | | — | |
Forward Contracts | | | — | | | | — | |
Net realized gain (loss) | | | 18,054,953 | | | | 17,484,802 | |
Net change in unrealized appreciation (depreciation) on: | | | | | | | | |
Investment transactions | | | (58,079,508 | ) | | | (174,585,225 | ) |
Futures contracts | | | — | | | | (181,425 | ) |
Translation of assets and liabilities in foreign currencies | | | (2,096 | ) | | | — | |
Forward contracts | | | — | | | | — | |
Net change in unrealized appreciation (depreciation) | | | (58,081,604 | ) | | | (174,766,650 | ) |
Net realized gain (loss) and change in unrealized appreciation (depreciation) | | | (40,026,651 | ) | | | (157,281,848 | ) |
Net increase (decrease) in net assets resulting from operations | | $ | (35,874,379 | ) | | $ | (152,804,798 | ) |
(a) | Net of foreign withholding tax of: | | $ | 143,989 | | | $ | 1,270 | |
* | Net of net increase (decrease) in accrued foreign capital gains tax of: | | $ | — | | | $ | — | |
The accompanying notes are an integral part of the financial statements.
130
| | MML
Focused
Equity Fund | | | MML
Foreign
Fund | | | MML
Fundamental
Equity Fund | | | MML
Fundamental
Value Fund | | | MML
Global Fund | | | MML
Income &
Growth Fund | | | MML
International
Equity Fund | |
| | | | | | | | | | | | | | | | | | | | | | | | | | | | |
| | $ | 2,906,127 | | | $ | 4,735,070 | | | $ | 1,641,382 | | | $ | 1,863,120 | | | $ | 1,575,075 | | | $ | 2,727,728 | | | $ | 3,984,644 | |
| | | 576 | | | | 27 | | | | 204 | | | | 170 | | | | 62 | | | | 709 | | | | 472 | |
| | | — | | | | 21,291 | | | | 1,053 | | | | 2,065 | | | | 4,723 | | | | 1,521 | | | | 16,949 | |
| | | — | | | | 173,644 | | | | — | | | | — | | | | — | | | | — | | | | 47,415 | |
| | | 2,906,703 | | | | 4,930,032 | | | | 1,642,639 | | | | 1,865,355 | | | | 1,579,860 | | | | 2,729,958 | | | | 4,049,480 | |
| | | | | | | | | | | | | | | | | | | | | | | | | | | | |
| | | 1,130,667 | | | | 929,197 | | | | 634,751 | | | | 557,883 | | | | 479,576 | | | | 784,435 | | | | 923,567 | |
| | | 11,040 | | | | 47,620 | | | | 15,345 | | | | 14,263 | | | | 31,718 | | | | 13,581 | | | | 68,725 | |
| | | 20,807 | | | | 23,646 | | | | 20,704 | | | | 20,678 | | | | 23,912 | | | | 21,081 | | | | 28,005 | |
| | | 2,999 | | | | 2,664 | | | | 1,996 | | | | 2,016 | | | | 3,806 | | | | 3,209 | | | | 1,672 | |
| | | 406 | | | | 406 | | | | 406 | | | | 406 | | | | 406 | | | | 406 | | | | 406 | |
| | | 11,429 | | | | 9,591 | | | | 9,101 | | | | 23,790 | | | | 11,056 | | | | 9,375 | | | | 6,745 | |
| | | 7,692 | | | | 6,212 | | | | 5,090 | | | | 4,852 | | | | 7,135 | | | | 6,323 | | | | 4,967 | |
| | | 1,185,040 | | | | 1,019,336 | | | | 687,393 | | | | 623,888 | | | | 557,609 | | | | 838,410 | | | | 1,034,087 | |
| | | | | | | | | | | | | | | | | | | | | | | | | | | | |
| | | — | | | | — | | | | — | | | | — | | | | 93,976 | | | | — | | | | — | |
| | | 235,657 | | | | — | | | | 141,899 | | | | 122,698 | | | | 13,088 | | | | — | | | | 167,449 | |
| | | 16,017 | | | | — | | | | 16,789 | | | | 16,773 | | | | 12,831 | | | | — | | | | 5,778 | |
| | | | | | | | | | | | | | | | | | | | | | | | | | | | |
| | | — | | | | 9,048 | | | | — | | | | — | | | | — | | | | 37,791 | | | | — | |
| | | 26,694 | | | | — | | | | 27,981 | | | | 27,955 | | | | 21,385 | | | | — | | | | 9,631 | |
| | | 1,463,408 | | | | 1,028,384 | | | | 874,062 | | | | 791,314 | | | | 698,889 | | | | 876,201 | | | | 1,216,945 | |
| | | | | | | | | | | | | | | | | | | | | | | | | | | | |
| | | — | | | | (17,692 | ) | | | — | | | | — | | | | — | | | | — | | | | — | |
| | | — | | | | — | | | | — | | | | (16,358 | ) | | | — | | | | — | | | | (111,633 | ) |
| | | — | | | | (611 | ) | | | — | | | | — | | | | — | | | | — | | | | — | |
| | | — | | | | — | | | | — | | | | (2,239 | ) | | | — | | | | — | | | | (3,852 | ) |
| | | 1,463,408 | | | | 1,010,081 | | | | 874,062 | | | | 772,717 | | | | 698,889 | | | | 876,201 | | | | 1,101,460 | |
| | | 1,443,295 | | | | 3,919,951 | | | | 768,577 | | | | 1,092,638 | | | | 880,971 | | | | 1,853,757 | | | | 2,948,020 | |
| | | | | | | | | | | | | | | | | | | | | | | | | | | | |
| | | | | | | | | | | | �� | | | | | | | | | | | | | | | | |
| | | 16,896,943 | | | | 1,965,147 | | | | 456,114 | | | | 6,399,344 | | | | 5,610,943 | | | | 16,869,810 | | | | 929,111 | |
| | | — | | | | — | | | | — | | | | — | | | | — | | | | — | | | | — | |
| | | 4,541 | | | | (76,327 | ) | | | 1,229 | | | | 486 | | | | (5,661 | ) | | | 1,511 | | | | (52,035 | ) |
| | | — | | | | — | | | | — | | | | — | | | | — | | | | — | | | | 84,995 | |
| | | 16,901,484 | | | | 1,888,820 | | | | 457,343 | | | | 6,399,830 | | | | 5,605,282 | | | | 16,871,321 | | | | 962,071 | |
| | | | | | | | | | | | | | | | | | | | | | | | | | | | |
| | | (57,548,094 | ) | | | (49,596,133 | ) | | | (53,378,801 | ) | | | (28,117,911 | ) | | | (44,578,021 | ) | | | (37,901,223 | ) | | | (53,631,206 | )* |
| | | — | | | | — | | | | — | | | | — | | | | — | | | | — | | | | — | |
| | | — | | | | (67,466 | ) | | | (34 | ) | | | (2,700 | ) | | | (43,924 | ) | | | — | | | | (68,566 | ) |
| | | — | | | | — | | | | — | | | | — | | | | — | | | | — | | | | 15,249 | |
| | | (57,548,094 | ) | | | (49,663,599 | ) | | | (53,378,835 | ) | | | (28,120,611 | ) | | | (44,621,945 | ) | | | (37,901,223 | ) | | | (53,684,523 | ) |
| | | (40,646,610 | ) | | | (47,774,779 | ) | | | (52,921,492 | ) | | | (21,720,781 | ) | | | (39,016,663 | ) | | | (21,029,902 | ) | | | (52,722,452 | ) |
| | $ | (39,203,315 | ) | | $ | (43,854,828 | ) | | $ | (52,152,915 | ) | | $ | (20,628,143 | ) | | $ | (38,135,692 | ) | | $ | (19,176,145 | ) | | $ | (49,774,432 | ) |
| | $ | — | | | $ | 483,048 | | | $ | 7,326 | | | $ | 45,089 | | | $ | 140,453 | | | $ | 16,326 | | | $ | 543,189 | |
| | $ | — | | | $ | — | | | $ | — | | | $ | — | | | $ | — | | | $ | — | | | $ | 7,192 | |
The accompanying notes are an integral part of the financial statements.
131
MML Series Investment Fund – Financial Statements (Continued) |
Statements of Operations
For the Six Months Ended June 30, 2022 (Unaudited) |
| | | MML
Large Cap
Growth Fund | | | MML
Managed
Volatility Fund | |
Investment income (Note 2): | | | | | | | | |
Dividends (a) | | $ | 719,030 | | | $ | 958,174 | |
Interest | | | 289 | | | | 604 | |
Securities lending net income | | | — | | | | 21 | |
Total investment income | | | 719,319 | | | | 958,799 | |
Expenses (Note 3): | | | | | | | | |
Investment advisory fees | | | 610,871 | | | | 472,526 | |
Custody fees | | | 10,300 | | | | 118,547 | |
Audit fees | | | 20,675 | | | | 20,622 | |
Legal fees | | | 1,613 | | | | 1,681 | |
Proxy fees | | | 406 | | | | 406 | |
Shareholder reporting fees | | | 7,980 | | | | 15,233 | |
Trustees’ fees | | | 4,312 | | | | 3,337 | |
| | | | 656,157 | | | | 632,352 | |
Administration fees: | | | | | | | | |
Class II | | | — | | | | — | |
Service Class I | | | — | | | | — | |
Distribution and Service fees: | | | | | | | | |
Service Class | | | 27,200 | | | | 29,370 | |
Service Class I | | | — | | | | — | |
Total expenses | | | 683,357 | | | | 661,722 | |
Expenses waived (Note 3): | | | | | | | | |
Initial Class advisory fees waived | | | — | | | | — | |
Class II advisory fees waived | | | — | | | | — | |
Service Class advisory fees waived | | | — | | | | — | |
Service Class I advisory fees waived | | | — | | | | — | |
Net expenses: | | | 683,357 | | | | 661,722 | |
Net investment income (loss) | | | 35,962 | | | | 297,077 | |
Realized and unrealized gain (loss): | | | | | | | | |
Net realized gain (loss) on: | | | | | | | | |
Investment transactions | | | 10,635,013 | | | | 5,336,689 | |
Futures contracts | | | — | | | | — | |
Written options | | | — | | | | 6,655,744 | |
Swap agreements | | | — | | | | — | |
Foreign currency transactions | | | — | | | | — | |
Forward contracts | | | — | | | | — | |
Net realized gain (loss) | | | 10,635,013 | | | | 11,992,433 | |
Net change in unrealized appreciation (depreciation) on: | | | | | | | | |
Investment transactions | | | (74,741,313 | ) | | | (30,487,209 | ) |
Futures contracts | | | — | | | | — | |
Written options | | | — | | | | 1,631,494 | |
Swap agreements | | | — | | | | — | |
Translation of assets and liabilities in foreign currencies | | | — | | | | (519 | ) |
Forward contracts | | | — | | | | — | |
Net change in unrealized appreciation (depreciation) | | | (74,741,313 | ) | | | (28,856,234 | ) |
Net realized gain (loss) and change in unrealized appreciation (depreciation) | | | (64,106,300 | ) | | | (16,863,801 | ) |
Net increase (decrease) in net assets resulting from operations | | $ | (64,070,338 | ) | | $ | (16,566,724 | ) |
(a) | Net of foreign withholding tax of: | | $ | 54,897 | | | $ | 227 | |
The accompanying notes are an integral part of the financial statements.
132
| | MML
Mid Cap
Growth Fund | | | MML
Mid Cap
Value Fund | | | MML Small
Cap Growth
Equity Fund | | | MML Small
Company
Value Fund | | | MML
Small/Mid
Cap Value
Fund | | | MML
Sustainable
Equity Fund | | | MML
Total Return
Bond Fund | |
| | | | | | | | | | | | | | | | | | | | | | | | | | | | |
| | $ | 954,441 | | | $ | 4,356,217 | | | $ | 796,704 | | | $ | 779,710 | | | $ | 1,371,541 | | | $ | 1,034,834 | | | $ | — | |
| | | 2,217 | | | | 551 | | | | 2,126 | | | | — | | | | 122 | | | | 43 | | | | 4,251,108 | |
| | | 8,935 | | | | 9,744 | | | | 10,329 | | | | 9,383 | | | | 344 | | | | 198 | | | | 37,561 | |
| | | 965,593 | | | | 4,366,512 | | | | 809,159 | | | | 789,093 | | | | 1,372,007 | | | | 1,035,075 | | | | 4,288,669 | |
| | | | | | | | | | | | | | | | | | | | | | | | | | | | |
| | | 1,434,828 | | | | 1,400,110 | | | | 862,333 | | | | 354,964 | | | | 593,049 | | | | 379,037 | | | | 701,847 | |
| | | 32,484 | | | | 26,938 | | | | 18,364 | | | | 15,168 | | | | 14,280 | | | | 11,014 | | | | 74,021 | |
| | | 21,272 | | | | 21,970 | | | | 22,105 | | | | 20,928 | | | | 20,663 | | | | 20,649 | | | | 22,975 | |
| | | 5,115 | | | | 4,719 | | | | 2,047 | | | | 957 | | | | 1,913 | | | | 1,647 | | | | 5,759 | |
| | | 406 | | | | 406 | | | | 406 | | | | 406 | | | | 406 | | | | 406 | | | | 406 | |
| | | 15,379 | | | | 11,847 | | | | 7,524 | | | | 5,909 | | | | 7,444 | | | | 7,161 | | | | 16,273 | |
| | | 11,442 | | | | 9,072 | | | | 4,698 | | | | 2,305 | | | | 4,453 | | | | 3,979 | | | | 8,898 | |
| | | 1,520,926 | | | | 1,475,062 | | | | 917,477 | | | | 400,637 | | | | 642,208 | | | | 423,893 | | | | 830,179 | |
| | | | | | | | | | | | | | | | | | | | | | | | | | | | |
| | | — | | | | — | | | | — | | | | 45,434 | | | | — | | | | — | | | | 229,881 | |
| | | — | | | | — | | | | — | | | | 21,122 | | | | — | | | | — | | | | 33,311 | |
| | | | | | | | | | | | | | | | | | | | | | | | | | | | |
| | | 119,730 | | | | 67,383 | | | | 34,324 | | | | — | | | | 33,626 | | | | 67,113 | | | | — | |
| | | — | | | | — | | | | — | | | | 35,203 | | | | — | | | | — | | | | 55,519 | |
| | | 1,640,656 | | | | 1,542,445 | | | | 951,801 | | | | 502,396 | | | | 675,834 | | | | 491,006 | | | | 1,148,890 | |
| | | | | | | | | | | | | | | | | | | | | | | | | | | | |
| | | — | | | | — | | | | (20,756 | ) | | | — | | | | — | | | | — | | | | — | |
| | | — | | | | — | | | | — | | | | (45,431 | ) | | | — | | | | — | | | | — | |
| | | — | | | | — | | | | (4,119 | ) | | | — | | | | — | | | | — | | | | — | |
| | | — | | | | — | | | | — | | | | (21,125 | ) | | | — | | | | — | | | | — | |
| | | 1,640,656 | | | | 1,542,445 | | | | 926,926 | | | | 435,840 | | | | 675,834 | | | | 491,006 | | | | 1,148,890 | |
| | | (675,063 | ) | | | 2,824,067 | | | | (117,767 | ) | | | 353,253 | | | | 696,173 | | | | 544,069 | | | | 3,139,779 | |
| | | | | | | | | | | | | | | | | | | | | | | | | | | | |
| | | | | | | | | | | | | | | | | | | | | | | | | | | | |
| | | 4,350,392 | | | | 35,884,080 | | | | (8,340,129 | ) | | | 1,699,260 | | | | 13,992,113 | | | | 39,203,844 | | | | (21,081,821 | ) |
| | | — | | | | — | | | | — | | | | — | | | | — | | | | — | | | | 217,529 | |
| | | — | | | | — | | | | — | | | | — | | | | — | | | | — | | | | (997,923 | ) |
| | | — | | | | — | | | | — | | | | — | | | | — | | | | — | | | | 30,511 | |
| | | 987 | | | | (12,322 | ) | | | (6 | ) | | | (428 | ) | | | — | | | | (8,881 | ) | | | 266 | |
| | | — | | | | 1,682,422 | | | | — | | | | 69,494 | | | | — | | | | 6,678 | | | | 40,490 | |
| | | 4,351,379 | | | | 37,554,180 | | | | (8,340,135 | ) | | | 1,768,326 | | | | 13,992,113 | | | | 39,201,641 | | | | (21,790,948 | ) |
| | | | | | | | | | | | | | | | | | | | | | | | | | | | |
| | | (130,772,476 | ) | | | (66,758,886 | ) | | | (42,600,291 | ) | | | (18,074,601 | ) | | | (48,777,434 | ) | | | (74,439,509 | ) | | | (24,699,516 | ) |
| | | — | | | | — | | | | — | | | | — | | | | — | | | | — | | | | (42,883 | ) |
| | | — | | | | — | | | | — | | | | — | | | | — | | | | — | | | | 46,438 | |
| | | — | | | | — | | | | — | | | | — | | | | — | | | | — | | | | (702,949 | ) |
| | | 30 | | | | (1,654 | ) | | | (1 | ) | | | — | | | | — | | | | (96 | ) | | | (73 | ) |
| | | — | | | | 305,170 | | | | — | | | | 7,789 | | | | — | | | | 3,147 | | | | (32,565 | ) |
| | | (130,772,446 | ) | | | (66,455,370 | ) | | | (42,600,292 | ) | | | (18,066,812 | ) | | | (48,777,434 | ) | | | (74,436,458 | ) | | | (25,431,548 | ) |
| | | (126,421,067 | ) | | | (28,901,190 | ) | | | (50,940,427 | ) | | | (16,298,486 | ) | | | (34,785,321 | ) | | | (35,234,817 | ) | | | (47,222,496 | ) |
| | $ | (127,096,130 | ) | | $ | (26,077,123 | ) | | $ | (51,058,194 | ) | | $ | (15,945,233 | ) | | $ | (34,089,148 | ) | | $ | (34,690,748 | ) | | $ | (44,082,717 | ) |
| | $ | 1,097 | | | $ | 66,445 | | | $ | 856 | | | $ | 5,430 | | | $ | 1,808 | | | $ | 4,451 | | | $ | — | |
The accompanying notes are an integral part of the financial statements.
133
MML Series Investment Fund – Financial Statements (Continued) | |
Statements of Changes in Net Assets | |
| | | MML
Conservative
Allocation Fund | |
| | | Six Months
Ended
June 30, 2022
(Unaudited) | | | Year
Ended
December 31, 2021 | |
Increase (Decrease) in Net Assets: | | | | | | | | |
Operations: | | | | | | | | |
Net investment income (loss) | | $ | (579,132 | ) | | $ | 7,496,513 | |
Net realized gain (loss) | | | 1,148,885 | | | | 35,667,069 | |
Net change in unrealized appreciation (depreciation) | | | (57,563,154 | ) | | | (9,587,387 | ) |
Net increase (decrease) in net assets resulting from operations | | | (56,993,401 | ) | | | 33,576,195 | |
Distributions to shareholders (Note 2): | | | | | | | | |
Initial Class | | | — | | | | (3,732,707 | ) |
Service Class | | | — | | | | (12,357,121 | ) |
Total distributions | | | — | | | | (16,089,828 | ) |
Net fund share transactions (Note 5): | | | | | | | | |
Initial Class | | | (1,981,159 | ) | | | (14,286,613 | ) |
Service Class | | | (19,187,139 | ) | | | (37,286,727 | ) |
Increase (decrease) in net assets from fund share transactions | | | (21,168,298 | ) | | | (51,573,340 | ) |
Total increase (decrease) in net assets | | | (78,161,699 | ) | | | (34,086,973 | ) |
Net assets | | | | | | | | |
Beginning of period | | | 400,743,601 | | | | 434,830,574 | |
End of period | | $ | 322,581,902 | | | $ | 400,743,601 | |
The accompanying notes are an integral part of the financial statements.
134
| | MML
Balanced
Allocation Fund | | | MML
Moderate
Allocation Fund | | | MML
Growth Allocation
Fund | |
| | Six Months
Ended
June 30, 2022
(Unaudited) | | | Year
Ended
December 31, 2021 | | | Six Months
Ended
June 30, 2022
(Unaudited) | | | Year
Ended
December 31, 2021 | | | Six Months
Ended
June 30, 2022
(Unaudited) | | | Year
Ended
December 31, 2021 | |
| | | | | | | | | | | | | | | | | | | | | | | | |
| | | | | | | | | | | | | | | | | | | | | | | | |
| | $ | (667,833 | ) | | $ | 8,075,213 | | | $ | (2,479,456 | ) | | $ | 25,466,940 | | | $ | (1,463,623 | ) | | $ | 14,700,478 | |
| | | 789,011 | | | | 35,066,448 | | | | 4,592,837 | | | | 150,529,735 | | | | 2,934,632 | | | | 125,516,658 | |
| | | (69,662,056 | ) | | | 1,576,575 | | | | (271,520,226 | ) | | | 28,058,278 | | | | (203,123,937 | ) | | | 21,135,066 | |
| | | (69,540,878 | ) | | | 44,718,236 | | | | (269,406,845 | ) | | | 204,054,953 | | | | (201,652,928 | ) | | | 161,352,202 | |
| | | | | | | | | | | | | | | | | | | | | | | | |
| | | — | | | | (4,524,699 | ) | | | — | | | | (14,369,142 | ) | | | — | | | | (26,000,345 | ) |
| | | — | | | | (14,700,679 | ) | | | — | | | | (72,819,090 | ) | | | — | | | | (43,218,278 | ) |
| | | — | | | | (19,225,378 | ) | | | — | | | | (87,188,232 | ) | | | — | | | | (69,218,623 | ) |
| | | | | | | | | | | | | | | | | | | | | | | | |
| | | (4,902,630 | ) | | | (8,921,595 | ) | | | (16,356,279 | ) | | | (37,230,262 | ) | | | (21,581,819 | ) | | | (46,904,892 | ) |
| | | (20,222,298 | ) | | | (29,861,152 | ) | | | (113,264,804 | ) | | | (212,270,785 | ) | | | (37,960,584 | ) | | | (83,342,821 | ) |
| | | (25,124,928 | ) | | | (38,782,747 | ) | | | (129,621,083 | ) | | | (249,501,047 | ) | | | (59,542,403 | ) | | | (130,247,713 | ) |
| | | (94,665,806 | ) | | | (13,289,889 | ) | | | (399,027,928 | ) | | | (132,634,326 | ) | | | (261,195,331 | ) | | | (38,114,134 | ) |
| | | | | | | | | | | | | | | | | | | | | | | | |
| | | 469,778,371 | | | | 483,068,260 | | | | 1,746,207,270 | | | | 1,878,841,596 | | | | 1,207,330,294 | | | | 1,245,444,428 | |
| | $ | 375,112,565 | | | $ | 469,778,371 | | | $ | 1,347,179,342 | | | $ | 1,746,207,270 | | | $ | 946,134,963 | | | $ | 1,207,330,294 | |
The accompanying notes are an integral part of the financial statements.
135
MML Series Investment Fund – Financial Statements (Continued) |
Statements of Changes in Net Assets |
| | | MML
Aggressive
Allocation Fund | |
| | | Six Months
Ended
June 30, 2022
(Unaudited) | | | Year
Ended
December 31, 2021 | |
Increase (Decrease) in Net Assets: | | | | | | | | |
Operations: | | | | | | | | |
Net investment income (loss) | | $ | (217,835 | ) | | $ | 1,508,753 | |
Net realized gain (loss) | | | 404,314 | | | | 21,347,657 | |
Net change in unrealized appreciation (depreciation) | | | (30,592,911 | ) | | | 2,729,646 | |
Net increase (decrease) in net assets resulting from operations | | | (30,406,432 | ) | | | 25,586,056 | |
Distributions to shareholders (Note 2): | | | | | | | | |
Initial Class | | | — | | | | (3,793,658 | ) |
Service Class | | | — | | | | (4,972,518 | ) |
Service Class I | | | — | | | | — | |
Total distributions | | | — | | | | (8,766,176 | ) |
Net fund share transactions (Note 5): | | | | | | | | |
Initial Class | | | (4,454,999 | ) | | | (560,281 | ) |
Service Class | | | (3,842,484 | ) | | | (8,314,247 | ) |
Service Class I | | | — | | | | — | |
Increase (decrease) in net assets from fund share transactions | | | (8,297,483 | ) | | | (8,874,528 | ) |
Total increase (decrease) in net assets | | | (38,703,915 | ) | | | 7,945,352 | |
Net assets | | | | | | | | |
Beginning of period | | | 168,220,729 | | | | 160,275,377 | |
End of period | | $ | 129,516,814 | | | $ | 168,220,729 | |
The accompanying notes are an integral part of the financial statements.
136
| | MML
American Funds
Growth Fund | | | MML
American Funds
International Fund | | | MML
American Funds
Core Allocation
Fund | |
| | Six Months
Ended
June 30, 2022
(Unaudited) | | | Year
Ended
December 31, 2021 | | | Six Months
Ended
June 30, 2022
(Unaudited) | | | Year
Ended
December 31, 2021 | | | Six Months
Ended
June 30, 2022
(Unaudited) | | | Year
Ended
December 31, 2021 | |
| | | | | | | | | | | | | | | | | | | | | | | | |
| | | | | | | | | | | | | | | | | | | | | | | | |
| | $ | (494,508 | ) | | $ | (597,776 | ) | | $ | 39,132 | | | $ | 1,147,808 | | | $ | 1,126,727 | | | $ | 9,493,175 | |
| | | 35,688,614 | | | | 51,652,024 | | | | 6,391,261 | | | | 1,076,747 | | | | 90,842,960 | | | | 58,363,875 | |
| | | (122,189,463 | ) | | | 3,023,836 | | | | (19,996,713 | ) | | | (3,274,434 | ) | | | (228,047,011 | ) | | | 46,359,412 | |
| | | (86,995,357 | ) | | | 54,078,084 | | | | (13,566,320 | ) | | | (1,049,879 | ) | | | (136,077,324 | ) | | | 114,216,462 | |
| | | | | | | | | | | | | | | | | | | | | | | | |
| | | — | | | | — | | | | — | | | | — | | | | — | | | | — | |
| | | — | | | | — | | | | — | | | | — | | | | — | | | | — | |
| | | — | | | | (15,195,901 | ) | | | — | | | | (977,803 | ) | | | — | | | | (35,113,927 | ) |
| | | — | | | | (15,195,901 | ) | | | — | | | | (977,803 | ) | | | — | | | | (35,113,927 | ) |
| | | | | | | | | | | | | | | | | | | | | | | | |
| | | — | | | | — | | | | — | | | | — | | | | — | | | | — | |
| | | — | | | | — | | | | — | | | | — | | | | — | | | | — | |
| | | (2,235,307 | ) | | | (3,842,156 | ) | | | (962,314 | ) | | | 666,810 | | | | (58,250,527 | ) | | | (89,042,196 | ) |
| | | (2,235,307 | ) | | | (3,842,156 | ) | | | (962,314 | ) | | | 666,810 | | | | (58,250,527 | ) | | | (89,042,196 | ) |
| | | (89,230,664 | ) | | | 35,040,027 | | | | (14,528,634 | ) | | | (1,360,872 | ) | | | (194,327,851 | ) | | | (9,939,661 | ) |
| | | | | | | | | | | | | | | | | | | | | | | | |
| | | 292,504,202 | | | | 257,464,175 | | | | 59,669,693 | | | | 61,030,565 | | | | 933,787,867 | | | | 943,727,528 | |
| | $ | 203,273,538 | | | $ | 292,504,202 | | | $ | 45,141,059 | | | $ | 59,669,693 | | | $ | 739,460,016 | | | $ | 933,787,867 | |
The accompanying notes are an integral part of the financial statements.
137
MML Series Investment Fund – Financial Statements (Continued) |
Statements of Changes in Net Assets |
| | | MML
Blue Chip Growth
Fund | |
| | | Six Months
Ended
June 30, 2022
(Unaudited) | | | Year
Ended
December 31, 2021 | |
Increase (Decrease) in Net Assets: | | | | | | | | |
Operations: | | | | | | | | |
Net investment income (loss) | | $ | (1,002,723 | ) | | $ | (3,040,652 | ) |
Net realized gain (loss) | | | (2,908,712 | ) | | | 86,430,345 | |
Net change in unrealized appreciation (depreciation) | | | (218,230,305 | ) | | | (1,392,292 | ) |
Net increase (decrease) in net assets resulting from operations | | | (222,141,740 | ) | | | 81,997,401 | |
Distributions to shareholders (Note 2): | | | | | | | | |
Initial Class | | | — | | | | (38,541,114 | ) |
Class I | | | — | | | | — | |
Class II | | | — | | | | — | |
Class III | | | — | | | | — | |
Service Class | | | — | | | | (20,907,454 | ) |
Service Class I | | | — | | | | — | |
Total distributions | | | — | | | | (59,448,568 | ) |
Net fund share transactions (Note 5): | | | | | | | | |
Initial Class | | | 1,036,599 | | | | 59,227,612 | |
Class I | | | — | | | | — | |
Class II | | | — | | | | — | |
Class III | | | — | | | | — | |
Service Class | | | (3,439,630 | ) | | | 13,680,075 | |
Service Class I | | | — | | | | — | |
Increase (decrease) in net assets from fund share transactions | | | (2,403,031 | ) | | | 72,907,687 | |
Total increase (decrease) in net assets | | | (224,544,771 | ) | | | 95,456,520 | |
Net assets | | | | | | | | |
Beginning of period | | | 628,687,794 | | | | 533,231,274 | |
End of period | | $ | 404,143,023 | | | $ | 628,687,794 | |
The accompanying notes are an integral part of the financial statements.
138
| | MML
Equity Income
Fund | | | MML
Equity Index Fund | | | MML
Focused Equity
Fund | |
| | Six Months
Ended
June 30, 2022
(Unaudited) | | | Year
Ended
December 31, 2021 | | | Six Months
Ended
June 30, 2022
(Unaudited) | | | Year
Ended
December 31, 2021 | | | Six Months
Ended
June 30, 2022
(Unaudited) | | | Year
Ended
December 31, 2021 | |
| | | | | | | | | | | | | | | | | | | | | | | | |
| | | | | | | | | | | | | | | | | | | | | | | | |
| | $ | 4,152,272 | | | $ | 6,922,226 | | | $ | 4,477,050 | | | $ | 8,119,505 | | | $ | 1,443,295 | | | $ | 2,701,349 | |
| | | 18,054,953 | | | | 55,884,175 | | | | 17,484,802 | | | | 40,603,509 | | | | 16,901,484 | | | | 25,021,393 | |
| | | (58,081,604 | ) | | | 40,615,994 | | | | (174,766,650 | ) | | | 129,047,822 | | | | (57,548,094 | ) | | | 34,345,792 | |
| | | (35,874,379 | ) | | | 103,422,395 | | | | (152,804,798 | ) | | | 177,770,836 | | | | (39,203,315 | ) | | | 62,068,534 | |
| | | | | | | | | | | | | | | | | | | | | | | | |
| | | — | | | | (14,539,543 | ) | | | — | | | | — | | | | — | | | | — | |
| | | — | | | | — | | | | — | | | | (3,410,079 | ) | | | — | | | | — | |
| | | — | | | | — | | | | — | | | | (15,589,702 | ) | | | — | | | | (19,232,937 | ) |
| | | — | | | | — | | | | — | | | | (19,307,250 | ) | | | — | | | | — | |
| | | — | | | | (3,561,313 | ) | | | — | | | | — | | | | — | | | | — | |
| | | — | | | | — | | | | — | | | | (2,915,856 | ) | | | — | | | | (1,434,203 | ) |
| | | — | | | | (18,100,856 | ) | | | — | | | | (41,222,887 | ) | | | — | | | | (20,667,140 | ) |
| | | | | | | | | | | | | | | | | | | | | | | | |
| | | (32,724,122 | ) | | | (65,572,871 | ) | | | — | | | | — | | | | — | | | | — | |
| | | — | | | | — | | | | (3,151,075 | ) | | | (8,078,776 | ) | | | — | | | | — | |
| | | — | | | | — | | | | (5,339,118 | ) | | | 8,726,265 | | | | (6,977,691 | ) | | | 22,304,981 | |
| | | — | | | | — | | | | (10,269,884 | ) | | | (11,761,933 | ) | | | — | | | | — | |
| | | (3,264,764 | ) | | | (10,213,562 | ) | | | — | | | | — | | | | — | | | | — | |
| | | — | | | | — | | | | (3,687,356 | ) | | | (986,690 | ) | | | (353,964 | ) | | | 502,795 | |
| | | (35,988,886 | ) | | | (75,786,433 | ) | | | (22,447,433 | ) | | | (12,101,134 | ) | | | (7,331,655 | ) | | | 22,807,776 | |
| | | (71,863,265 | ) | | | 9,535,106 | | | | (175,252,231 | ) | | | 124,446,815 | | | | (46,534,970 | ) | | | 64,209,170 | |
| | | | | | | | | | | | | | | | | | | | | | | | |
| | | 457,587,577 | | | | 448,052,471 | | | | 777,288,595 | | | | 652,841,780 | | | | 361,265,002 | | | | 297,055,832 | |
| | $ | 385,724,312 | | | $ | 457,587,577 | | | $ | 602,036,364 | | | $ | 777,288,595 | | | $ | 314,730,032 | | | $ | 361,265,002 | |
The accompanying notes are an integral part of the financial statements.
139
MML Series Investment Fund – Financial Statements (Continued) |
Statements of Changes in Net Assets |
| | | MML
Foreign Fund | |
| | | Six Months
Ended
June 30, 2022
(Unaudited) | | | Year
Ended
December 31, 2021 | |
Increase (Decrease) in Net Assets: | | | | | | | | |
Operations: | | | | | | | | |
Net investment income (loss) | | $ | 3,919,951 | | | $ | 5,309,115 | |
Net realized gain (loss) | | | 1,888,820 | | | | 21,502,193 | |
Net change in unrealized appreciation (depreciation) | | | (49,663,599 | ) | | | 7,132,915 | |
Net increase (decrease) in net assets resulting from operations | | | (43,854,828 | ) | | | 33,944,223 | |
Distributions to shareholders (Note 2): | | | | | | | | |
Initial Class | | | — | | | | (6,407,754 | ) |
Class I | | | — | | | | — | |
Class II | | | — | | | | ��� | |
Service Class | | | — | | | | (192,117 | ) |
Service Class I | | | — | | | | — | |
Total distributions | | | — | | | | (6,599,871 | ) |
Net fund share transactions (Note 5): | | | | | | | | |
Initial Class | | | (19,095,713 | ) | | | (55,471,468 | ) |
Class I | | | — | | | | — | |
Class II | | | — | | | | — | |
Service Class | | | (292,521 | ) | | | (1,091,260 | ) |
Service Class I | | | — | | | | — | |
Increase (decrease) in net assets from fund share transactions | | | (19,388,234 | ) | | | (56,562,728 | ) |
Total increase (decrease) in net assets | | | (63,243,062 | ) | | | (29,218,376 | ) |
Net assets | | | | | | | | |
Beginning of period | | | 245,610,355 | | | | 274,828,731 | |
End of period | | $ | 182,367,293 | | | $ | 245,610,355 | |
The accompanying notes are an integral part of the financial statements.
140
| | MML
Fundamental
Equity Fund | | | MML
Fundamental Value
Fund | | | MML
Global Fund | |
| | Six Months
Ended
June 30, 2022
(Unaudited) | | | Year
Ended
December 31, 2021 | | | Six Months
Ended
June 30, 2022
(Unaudited) | | | Year
Ended
December 31, 2021 | | | Six Months
Ended
June 30, 2022
(Unaudited) | | | Year
Ended
December 31, 2021 | |
| | | | | | | | | | | | | | | | | | | | | | | | |
| | | | | | | | | | | | | | | | | | | | | | | | |
| | $ | 768,577 | | | $ | 1,533,777 | | | $ | 1,092,638 | | | $ | 1,716,263 | | | $ | 880,971 | | | $ | 2,184,911 | |
| | | 457,343 | | | | 31,117,236 | | | | 6,399,830 | | | | 34,080,303 | | | | 5,605,282 | | | | 95,994,538 | |
| | | (53,378,835 | ) | | | 16,358,111 | | | | (28,120,611 | ) | | | 17,472,558 | | | | (44,621,945 | ) | | | (36,075,447 | ) |
| | | (52,152,915 | ) | | | 49,009,124 | | | | (20,628,143 | ) | | | 53,269,124 | | | | (38,135,692 | ) | | | 62,104,002 | |
| | | | | | | | | | | | | | | | | | | | | | | | |
| | | — | | | | — | | | | — | | | | — | | | | — | | | | — | |
| | | — | | | | — | | | | — | | | | — | | | | — | | | | (33,942,130 | ) |
| | | — | | | | (17,289,403 | ) | | | — | | | | (2,957,707 | ) | | | — | | | | (1,862,521 | ) |
| | | — | | | | — | | | | — | | | | — | | | | — | | | | — | |
| | | — | | | | (2,011,177 | ) | | | — | | | | (312,511 | ) | | | — | | | | (1,901,117 | ) |
| | | — | | | | (19,300,580 | ) | | | — | | | | (3,270,218 | ) | | | — | | | | (37,705,768 | ) |
| | | | | | | | | | | | | | | | | | | | | | | | |
| | | — | | | | — | | | | — | | | | — | | | | — | | | | — | |
| | | — | | | | — | | | | — | | | | — | | | | (19,749,306 | ) | | | (231,901,017 | ) |
| | | (12,704,839 | ) | | | 32,759,203 | | | | (10,122,151 | ) | | | (50,990,501 | ) | | | (663,706 | ) | | | 293,903 | |
| | | — | | | | — | | | | — | | | | — | | | | — | | | | — | |
| | | 135,783 | | | | 1,845,344 | | | | 1,672,879 | | | | 1,630,567 | | | | (531,648 | ) | | | 392,623 | |
| | | (12,569,056 | ) | | | 34,604,547 | | | | (8,449,272 | ) | | | (49,359,934 | ) | | | (20,944,660 | ) | | | (231,214,491 | ) |
| | | (64,721,971 | ) | | | 64,313,091 | | | | (29,077,415 | ) | | | 638,972 | | | | (59,080,352 | ) | | | (206,816,257 | ) |
| | | | | | | | | | | | | | | | | | | | | | | | |
| | | 245,739,968 | | | | 181,426,877 | | | | 195,547,843 | | | | 194,908,871 | | | | 191,391,085 | | | | 398,207,342 | |
| | $ | 181,017,997 | | | $ | 245,739,968 | | | $ | 166,470,428 | | | $ | 195,547,843 | | | $ | 132,310,733 | | | $ | 191,391,085 | |
The accompanying notes are an integral part of the financial statements.
141
MML Series Investment Fund – Financial Statements (Continued) |
Statements of Changes in Net Assets |
| | | MML
Income & Growth
Fund | |
| | | Six Months
Ended
June 30, 2022
(Unaudited) | | | Year
Ended
December 31, 2021 | |
Increase (Decrease) in Net Assets: | | | | | | | | |
Operations: | | | | | | | | |
Net investment income (loss) | | $ | 1,853,757 | | | $ | 3,388,012 | |
Net realized gain (loss) | | | 16,871,321 | | | | 35,764,471 | |
Net change in unrealized appreciation (depreciation) | | | (37,901,223 | ) | | | 23,692,628 | |
Net increase (decrease) in net assets resulting from operations | | | (19,176,145 | ) | | | 62,845,111 | |
Distributions to shareholders (Note 2): | | | | | | | | |
Initial Class | | | — | | | | (3,966,776 | ) |
Class II | | | — | | | | — | |
Service Class | | | — | | | | (483,810 | ) |
Service Class I | | | — | | | | — | |
Total distributions | | | — | | | | (4,450,586 | ) |
Net fund share transactions (Note 5): | | | | | | | | |
Initial Class | | | (12,701,410 | ) | | | (71,827,735 | ) |
Class II | | | — | | | | — | |
Service Class | | | (1,260,800 | ) | | | (1,714,716 | ) |
Service Class I | | | — | | | | — | |
Increase (decrease) in net assets from fund share transactions | | | (13,962,210 | ) | | | (73,542,451 | ) |
Total increase (decrease) in net assets | | | (33,138,355 | ) | | | (15,147,926 | ) |
Net assets | | | | | | | | |
Beginning of period | | | 253,291,307 | | | | 268,439,233 | |
End of period | | $ | 220,152,952 | | | $ | 253,291,307 | |
The accompanying notes are an integral part of the financial statements.
142
| | MML
International
Equity Fund | | | MML
Large Cap Growth
Fund | | | MML
Managed Volatility
Fund | |
| | Six Months
Ended
June 30, 2022
(Unaudited) | | | Year
Ended
December 31, 2021 | | | Six Months
Ended
June 30, 2022
(Unaudited) | | | Year
Ended
December 31, 2021 | | | Six Months
Ended
June 30, 2022
(Unaudited) | | | Year
Ended
December 31, 2021 | |
| | | | | | | | | | | | | | | | | | | | | | | | |
| | | | | | | | | | | | | | | | | | | | | | | | |
| | $ | 2,948,020 | | | $ | 2,387,824 | | | $ | 35,962 | | | $ | (225,060 | ) | | $ | 297,077 | | | $ | 490,544 | |
| | | 962,071 | | | | 23,518,210 | | | | 10,635,013 | | | | 16,564,832 | | | | 11,992,433 | | | | 705,802 | |
| | | (53,684,523 | ) | | | (8,031,257 | ) | | | (74,741,313 | ) | | | 8,293,487 | | | | (28,856,234 | ) | | | 14,245,211 | |
| | | (49,774,432 | ) | | | 17,874,777 | | | | (64,070,338 | ) | | | 24,633,259 | | | | (16,566,724 | ) | | | 15,441,557 | |
| | | | | | | | | | | | | | | | | | | | | | | | |
| | | — | | | | — | | | | — | | | | (15,351,370 | ) | | | — | | | | (1,116,050 | ) |
| | | — | | | | (1,043,525 | ) | | | — | | | | — | | | | — | | | | — | |
| | | — | | | | — | | | | — | | | | (2,540,115 | ) | | | — | | | | (189,127 | ) |
| | | — | | | | (39,246 | ) | | | — | | | | — | | | | — | | | | — | |
| | | — | | | | (1,082,771 | ) | | | — | | | | (17,891,485 | ) | | | — | | | | (1,305,177 | ) |
| | | | | | | | | | | | | | | | | | | | | | | | |
| | | — | | | | — | | | | (1,619,529 | ) | | | 71,237,108 | | | | (12,204,952 | ) | | | (13,533,508 | ) |
| | | (2,334,086 | ) | | | 73,322,159 | | | | — | | | | — | | | | — | | | | — | |
| | | — | | | | — | | | | (363,552 | ) | | | 2,162,036 | | | | (1,591,997 | ) | | | (3,570,364 | ) |
| | | (75,593 | ) | | | 659,784 | | | | — | | | | — | | | | — | | | | — | |
| | | (2,409,679 | ) | | | 73,981,943 | | | | (1,983,081 | ) | | | 73,399,144 | | | | (13,796,949 | ) | | | (17,103,872 | ) |
| | | (52,184,111 | ) | | | 90,773,949 | | | | (66,053,419 | ) | | | 80,140,918 | | | | (30,363,673 | ) | | | (2,967,492 | ) |
| | | | | | | | | | | | | | | | | | | | | | | | |
| | | 257,489,666 | | | | 166,715,717 | | | | 222,830,500 | | | | 142,689,582 | | | | 140,627,844 | | | | 143,595,336 | |
| | $ | 205,305,555 | | | $ | 257,489,666 | | | $ | 156,777,081 | | | $ | 222,830,500 | | | $ | 110,264,171 | | | $ | 140,627,844 | |
The accompanying notes are an integral part of the financial statements.
143
MML Series Investment Fund – Financial Statements (Continued) |
Statements of Changes in Net Assets |
| | | MML
Mid Cap Growth
Fund | |
| | | Six Months
Ended
June 30, 2022
(Unaudited) | | | Year
Ended
December 31, 2021 | |
Increase (Decrease) in Net Assets: | | | | | | | | |
Operations: | | | | | | | | |
Net investment income (loss) | | $ | (675,063 | ) | | $ | (2,249,274 | ) |
Net realized gain (loss) | | | 4,351,379 | | | | 105,809,675 | |
Net change in unrealized appreciation (depreciation) | | | (130,772,446 | ) | | | (37,213,167 | ) |
Net increase (decrease) in net assets resulting from operations | | | (127,096,130 | ) | | | 66,347,234 | |
Distributions to shareholders (Note 2): | | | | | | | | |
Initial Class | | | — | | | | (73,246,023 | ) |
Class II | | | — | | | | — | |
Service Class | | | — | | | | (25,312,531 | ) |
Service Class I | | | — | | | | — | |
Total distributions | | | — | | | | (98,558,554 | ) |
Net fund share transactions (Note 5): | | | | | | | | |
Initial Class | | | (13,550,029 | ) | | | (69,578,065 | ) |
Class II | | | — | | | | — | |
Service Class | | | (2,776,560 | ) | | | 11,071,866 | |
Service Class I | | | — | | | | — | |
Increase (decrease) in net assets from fund share transactions | | | (16,326,589 | ) | | | (58,506,199 | ) |
Total increase (decrease) in net assets | | | (143,422,719 | ) | | | (90,717,519 | ) |
Net assets | | | | | | | | |
Beginning of period | | | 461,919,988 | | | | 552,637,507 | |
End of period | | $ | 318,497,269 | | | $ | 461,919,988 | |
The accompanying notes are an integral part of the financial statements.
144
| | MML
Mid Cap Value
Fund | | | MML
Small Cap Growth
Equity Fund | | | MML
Small Company
Value Fund | |
| | Six Months
Ended
June 30, 2022
(Unaudited) | | | Year
Ended
December 31, 2021 | | | Six Months
Ended
June 30, 2022
(Unaudited) | | | Year
Ended
December 31, 2021 | | | Six Months
Ended
June 30, 2022
(Unaudited) | | | Year
Ended
December 31, 2021 | |
| | | | | | | | | | | | | | | | | | | | | | | | |
| | | | | | | | | | | | | | | | | | | | | | | | |
| | $ | 2,824,067 | | | $ | 5,276,758 | | | $ | (117,767 | ) | | $ | (1,119,827 | ) | | $ | 353,253 | | | $ | 85,713 | |
| | | 37,554,180 | | | | 77,904,945 | | | | (8,340,135 | ) | | | 47,033,355 | | | | 1,768,326 | | | | 44,257,606 | |
| | | (66,455,370 | ) | | | (391,209 | ) | | | (42,600,292 | ) | | | (30,870,726 | ) | | | (18,066,812 | ) | | | (22,532,215 | ) |
| | | (26,077,123 | ) | | | 82,790,494 | | | | (51,058,194 | ) | | | 15,042,802 | | | | (15,945,233 | ) | | | 21,811,104 | |
| | | | | | | | | | | | | | | | | | | | | | | | |
| | | — | | | | (11,485,165 | ) | | | — | | | | (26,449,940 | ) | | | — | | | | — | |
| | | — | | | | — | | | | — | | | | — | | | | — | | | | (4,232,677 | ) |
| | | — | | | | (1,976,411 | ) | | | — | | | | (5,524,203 | ) | | | — | | | | — | |
| | | — | | | | — | | | | — | | | | — | | | | — | | | | (1,927,989 | ) |
| | | — | | | | (13,461,576 | ) | | | — | | | | (31,974,143 | ) | | | — | | | | (6,160,666 | ) |
| | | | | | | | | | | | | | | | | | | | | | | | |
| | | (27,862,790 | ) | | | (113,301,697 | ) | | | (3,027,272 | ) | | | (677,490 | ) | | | — | | | | — | |
| | | — | | | | — | | | | — | | | | — | | | | (3,664,335 | ) | | | (9,461,658 | ) |
| | | (1,800,262 | ) | | | (4,821,534 | ) | | | (1,083,861 | ) | | | 4,842,905 | | | | — | | | | — | |
| | | — | | | | — | | | | — | | | | — | | | | (715,400 | ) | | | (41,589 | ) |
| | | (29,663,052 | ) | | | (118,123,231 | ) | | | (4,111,133 | ) | | | 4,165,415 | | | | (4,379,735 | ) | | | (9,503,247 | ) |
| | | (55,740,175 | ) | | | (48,794,313 | ) | | | (55,169,327 | ) | | | (12,765,926 | ) | | | (20,324,968 | ) | | | 6,147,191 | |
| | | | | | | | | | | | | | | | | | | | | | | | |
| | | 351,088,277 | | | | 399,882,590 | | | | 198,445,995 | | | | 211,211,921 | | | | 98,569,812 | | | | 92,422,621 | |
| | $ | 295,348,102 | | | $ | 351,088,277 | | | $ | 143,276,668 | | | $ | 198,445,995 | | | $ | 78,244,844 | | | $ | 98,569,812 | |
The accompanying notes are an integral part of the financial statements.
145
MML Series Investment Fund – Financial Statements (Continued) |
Statements of Changes in Net Assets |
| | | MML
Small/Mid Cap
Value Fund | |
| | | Six Months
Ended
June 30, 2022
(Unaudited) | | | Year
Ended
December 31, 2021 | |
Increase (Decrease) in Net Assets: | | | | | | | | |
Operations: | | | | | | | | |
Net investment income (loss) | | $ | 696,173 | | | $ | 1,843,580 | |
Net realized gain (loss) | | | 13,992,113 | | | | 45,551,764 | |
Net change in unrealized appreciation (depreciation) | | | (48,777,434 | ) | | | 12,198,307 | |
Net increase (decrease) in net assets resulting from operations | | | (34,089,148 | ) | | | 59,593,651 | |
Distributions to shareholders (Note 2): | | | | | | | | |
Initial Class | | | — | | | | (1,587,906 | ) |
Class II | | | — | | | | — | |
Service Class | | | — | | | | (239,776 | ) |
Service Class I | | | — | | | | — | |
Total distributions | | | — | | | | (1,827,682 | ) |
Net fund share transactions (Note 5): | | | | | | | | |
Initial Class | | | (9,212,226 | ) | | | (65,105,278 | ) |
Class II | | | — | | | | — | |
Service Class | | | (882,226 | ) | | | 123,121 | |
Service Class I | | | — | | | | — | |
Increase (decrease) in net assets from fund share transactions | | | (10,094,452 | ) | | | (64,982,157 | ) |
Total increase (decrease) in net assets | | | (44,183,600 | ) | | | (7,216,188 | ) |
Net assets | | | | | | | | |
Beginning of period | | | 179,230,957 | | | | 186,447,145 | |
End of period | | $ | 135,047,357 | | | $ | 179,230,957 | |
The accompanying notes are an integral part of the financial statements.
146
| | MML
Sustainable Equity
Fund | | | MML
Total Return Bond
Fund | |
| | Six Months
Ended
June 30, 2022
(Unaudited) | | | Year
Ended
December 31, 2021 | | | Six Months
Ended
June 30, 2022
(Unaudited) | | | Year
Ended
December 31, 2021 | |
| | | | | | | | | | | | | | | | |
| | | | | | | | | | | | | | | | |
| | $ | 544,069 | | | $ | 1,071,998 | | | $ | 3,139,779 | | | $ | 3,996,645 | |
| | | 39,201,641 | | | | 20,522,856 | | | | (21,790,948 | ) | | | (754,915 | ) |
| | | (74,436,458 | ) | | | 18,106,179 | | | | (25,431,548 | ) | | | (8,443,618 | ) |
| | | (34,690,748 | ) | | | 39,701,033 | | | | (44,082,717 | ) | | | (5,201,888 | ) |
| | | | | | | | | | | | | | | | |
| | | — | | | | (6,904,294 | ) | | | — | | | | — | |
| | | — | | | | — | | | | — | | | | (21,382,221 | ) |
| | | — | | | | (3,555,773 | ) | | | — | | | | — | |
| | | — | | | | — | | | | — | | | | (3,001,071 | ) |
| | | — | | | | (10,460,067 | ) | | | — | | | | (24,383,292 | ) |
| | | | | | | | | | | | | | | | |
| | | (5,196,086 | ) | | | (12,363,850 | ) | | | — | | | | — | |
| | | — | | | | — | | | | (43,138,815 | ) | | | 92,426,887 | |
| | | (1,189,289 | ) | | | 1,624,422 | | | | — | | | | — | |
| | | — | | | | — | | | | (4,131,861 | ) | | | 2,945,102 | |
| | | (6,385,375 | ) | | | (10,739,428 | ) | | | (47,270,676 | ) | | | 95,371,989 | |
| | | (41,076,123 | ) | | | 18,501,538 | | | | (91,353,393 | ) | | | 65,786,809 | |
| | | | | | | | | | | | | | | | |
| | | 173,860,519 | | | | 155,358,981 | | | | 405,043,913 | | | | 339,257,104 | |
| | $ | 132,784,396 | | | $ | 173,860,519 | | | $ | 313,690,520 | | | $ | 405,043,913 | |
The accompanying notes are an integral part of the financial statements.
147
MML Series Investment Fund – Financial Statements (Continued) |
Financial Highlights (For a share outstanding throughout each period) |
MML Conservative Allocation Fund
| | | Income (loss) from investment
operations | Less distributions to shareholders | | | Ratios / Supplemental Data |
| | Net
asset
value,
beginning
of period | Net
investment
income
(loss)c | Net
realized
and
unrealized
gain (loss)
on
investments | Total
income
(loss) from
investment
operations | From net
investment
income | From net
realized
gains | Total
distributions | Net
asset
value,
end of
the
period | Total
returnm | Net
assets,
end of
the
period
(000’s) | Ratio of
expenses
to average
daily net
assetsw | Net
investment
income
(loss) to
average
daily net
assets |
Initial Class | | | | | | | | | | | |
6/30/22r | $ 10.77 | $ (0.01) | $ (1.55) | $ (1.56) | $ — | $ — | $ — | $ 9.21 | (14.48%)b | $ 71,773 | 0.13%a | (0.13%)a |
12/31/21 | 10.34 | 0.22 | 0.66 | 0.88 | (0.13) | (0.32) | (0.45) | 10.77 | 8.60% | 86,161 | 0.12% | 2.05% |
12/31/20 | 9.95 | 0.09 | 0.86 | 0.95 | (0.27) | (0.29) | (0.56) | 10.34 | 9.93% | 96,649 | 0.12% | 0.95% |
12/31/19 | 9.23 | 0.25 | 1.13 | 1.38 | (0.28) | (0.38) | (0.66) | 9.95 | 15.20% | 95,290 | 0.13% | 2.55% |
12/31/18 | 10.01 | 0.22 | (0.55) | (0.33) | (0.25) | (0.20) | (0.45) | 9.23 | (3.50%) | 90,797 | 0.12% | 2.22% |
12/31/17 | 9.63 | 0.22 | 0.70 | 0.92 | (0.23) | (0.31) | (0.54) | 10.01 | 9.62% | 107,294 | 0.12% | 2.23% |
Service Class | | | | | | | | | | | |
6/30/22r | $ 10.64 | $ (0.02) | $ (1.53) | $ (1.55) | $ — | $ — | $ — | $ 9.09 | (14.57%)b | $ 250,809 | 0.38%a | (0.38%)a |
12/31/21 | 10.22 | 0.19 | 0.65 | 0.84 | (0.10) | (0.32) | (0.42) | 10.64 | 8.33% | 314,582 | 0.37% | 1.75% |
12/31/20 | 9.84 | 0.07 | 0.85 | 0.92 | (0.25) | (0.29) | (0.54) | 10.22 | 9.67% | 338,181 | 0.37% | 0.72% |
12/31/19 | 9.13 | 0.22 | 1.12 | 1.34 | (0.25) | (0.38) | (0.63) | 9.84 | 14.93% | 312,658 | 0.38% | 2.31% |
12/31/18 | 9.90 | 0.19 | (0.53) | (0.34) | (0.23) | (0.20) | (0.43) | 9.13 | (3.70%) | 306,230 | 0.37% | 1.94% |
12/31/17 | 9.53 | 0.20 | 0.68 | 0.88 | (0.20) | (0.31) | (0.51) | 9.90 | 9.33% | 368,843 | 0.37% | 2.00% |
| | | Year ended December 31 |
| | Six months ended
June 30, 2022b,r | 2021 | 2020 | 2019 | 2018 | 2017 |
Portfolio turnover ratex | 5% | 28% | 43% | 29% | 18% | 14% |
b | Percentage represents the results for the period and is not annualized. |
c | Per share amount calculated on the average shares method. |
m | Total return does not reflect expenses that apply at the separate account level or to related insurance products. Inclusion of these charges would reduce the total return figures for all periods shown. |
w | Expenses of the underlying funds are not included in the Fund’s expense ratio. The Fund indirectly bears its proportionate share of the expenses of any underlying fund. |
x | Amount does not include the portfolio activity of any underlying fund. |
The accompanying notes are an integral part of the financial statements.
148
MML Series Investment Fund – Financial Statements (Continued) |
Financial Highlights (For a share outstanding throughout each period) |
MML Balanced Allocation Fund
| | | Income (loss) from investment
operations | Less distributions to shareholders | | | Ratios / Supplemental Data |
| | Net
asset
value,
beginning
of period | Net
investment
income
(loss)c | Net
realized
and
unrealized
gain (loss)
on
investments | Total
income
(loss) from
investment
operations | From net
investment
income | From net
realized
gains | Total
distributions | Net
asset
value,
end of
the
period | Total
returnm | Net
assets,
end of
the
period
(000’s) | Ratio of
expenses
to average
daily net
assetsw | Net
investment
income
(loss) to
average
daily net
assets |
Initial Class | | | | | | | | | | | |
6/30/22r | $ 10.88 | $ (0.01) | $ (1.63) | $ (1.64) | $ — | $ — | $ — | $ 9.24 | (15.07%)b | $ 86,032 | 0.12%a | (0.12%)a |
12/31/21 | 10.32 | 0.20 | 0.82 | 1.02 | (0.14) | (0.32) | (0.46) | 10.88 | 9.98% | 106,757 | 0.12% | 1.88% |
12/31/20 | 9.89 | 0.09 | 0.94 | 1.03 | (0.26) | (0.34) | (0.60) | 10.32 | 10.93% | 109,924 | 0.12% | 0.97% |
12/31/19 | 9.12 | 0.23 | 1.27 | 1.50 | (0.26) | (0.47) | (0.73) | 9.89 | 16.75% | 125,465 | 0.12% | 2.32% |
12/31/18 | 10.16 | 0.20 | (0.61) | (0.41) | (0.24) | (0.39) | (0.63) | 9.12 | (4.47%) | 116,177 | 0.12% | 2.00% |
12/31/17 | 9.70 | 0.21 | 0.88 | 1.09 | (0.20) | (0.43) | (0.63) | 10.16 | 11.48% | 139,773 | 0.12% | 2.06% |
Service Class | | | | | | | | | | | |
6/30/22r | $ 10.77 | $ (0.02) | $ (1.62) | $ (1.64) | $ — | $ — | $ — | $ 9.13 | (15.23%)b | $ 289,081 | 0.37%a | (0.37%)a |
12/31/21 | 10.22 | 0.17 | 0.81 | 0.98 | (0.11) | (0.32) | (0.43) | 10.77 | 9.70% | 363,021 | 0.37% | 1.62% |
12/31/20 | 9.80 | 0.07 | 0.92 | 0.99 | (0.23) | (0.34) | (0.57) | 10.22 | 10.65% | 373,144 | 0.37% | 0.72% |
12/31/19 | 9.03 | 0.20 | 1.27 | 1.47 | (0.23) | (0.47) | (0.70) | 9.80 | 16.61% | 408,868 | 0.37% | 2.07% |
12/31/18 | 10.07 | 0.17 | (0.61) | (0.44) | (0.21) | (0.39) | (0.60) | 9.03 | (4.76%) | 391,230 | 0.37% | 1.76% |
12/31/17 | 9.62 | 0.18 | 0.88 | 1.06 | (0.18) | (0.43) | (0.61) | 10.07 | 11.21% | 459,581 | 0.37% | 1.82% |
| | | Year ended December 31 |
| | Six months ended
June 30, 2022b,r | 2021 | 2020 | 2019 | 2018 | 2017 |
Portfolio turnover ratex | 2% | 25% | 22% | 28% | 17% | 15% |
b | Percentage represents the results for the period and is not annualized. |
c | Per share amount calculated on the average shares method. |
m | Total return does not reflect expenses that apply at the separate account level or to related insurance products. Inclusion of these charges would reduce the total return figures for all periods shown. |
w | Expenses of the underlying funds are not included in the Fund’s expense ratio. The Fund indirectly bears its proportionate share of the expenses of any underlying fund. |
x | Amount does not include the portfolio activity of any underlying fund. |
The accompanying notes are an integral part of the financial statements.
149
MML Series Investment Fund – Financial Statements (Continued) |
Financial Highlights (For a share outstanding throughout each period) |
MML Moderate Allocation Fund
| | | Income (loss) from investment
operations | Less distributions to shareholders | | | Ratios / Supplemental Data |
| | Net
asset
value,
beginning
of period | Net
investment
income
(loss)c | Net
realized
and
unrealized
gain (loss)
on
investments | Total
income
(loss) from
investment
operations | From net
investment
income | From net
realized
gains | Total
distributions | Net
asset
value,
end of
the
period | Total
returnm | Net
assets,
end of
the
period
(000’s) | Ratio of
expenses
to average
daily net
assetsw | Net
investment
income
(loss) to
average
daily net
assets |
Initial Class | | | | | | | | | | | |
6/30/22r | $ 11.54 | $ (0.01) | $ (1.84) | $ (1.85) | $ — | $ — | $ — | $ 9.69 | (16.03%)b | $ 224,322 | 0.11%a | (0.11%)a |
12/31/21 | 10.84 | 0.18 | 1.11 | 1.29 | (0.16) | (0.43) | (0.59) | 11.54 | 11.99% | 284,654 | 0.11% | 1.60% |
12/31/20 | 10.53 | 0.10 | 0.95 | 1.05 | (0.26) | (0.48) | (0.74) | 10.84 | 10.54% | 303,037 | 0.11% | 1.04% |
12/31/19 | 9.71 | 0.21 | 1.54 | 1.75 | (0.28) | (0.65) | (0.93) | 10.53 | 18.58% | 378,044 | 0.12% | 2.05% |
12/31/18 | 11.00 | 0.19 | (0.73) | (0.54) | (0.24) | (0.51) | (0.75) | 9.71 | (5.48%) | 349,719 | 0.11% | 1.79% |
12/31/17 | 10.38 | 0.20 | 1.15 | 1.35 | (0.20) | (0.53) | (0.73) | 11.00 | 13.33% | 417,670 | 0.11% | 1.84% |
Service Class | | | | | | | | | | | |
6/30/22r | $ 11.38 | $ (0.02) | $ (1.81) | $ (1.83) | $ — | $ — | $ — | $ 9.55 | (16.08%)b | $ 1,122,858 | 0.36%a | (0.36%)a |
12/31/21 | 10.70 | 0.15 | 1.09 | 1.24 | (0.13) | (0.43) | (0.56) | 11.38 | 11.67% | 1,461,553 | 0.36% | 1.36% |
12/31/20 | 10.41 | 0.08 | 0.92 | 1.00 | (0.23) | (0.48) | (0.71) | 10.70 | 10.16% | 1,575,805 | 0.36% | 0.76% |
12/31/19 | 9.60 | 0.18 | 1.53 | 1.71 | (0.25) | (0.65) | (0.90) | 10.41 | 18.36% | 1,751,648 | 0.37% | 1.78% |
12/31/18 | 10.88 | 0.16 | (0.72) | (0.56) | (0.21) | (0.51) | (0.72) | 9.60 | (5.70%) | 1,690,215 | 0.36% | 1.54% |
12/31/17 | 10.28 | 0.17 | 1.14 | 1.31 | (0.18) | (0.53) | (0.71) | 10.88 | 12.99% | 2,047,202 | 0.36% | 1.60% |
| | | Year ended December 31 |
| | Six months ended
June 30, 2022b,r | 2021 | 2020 | 2019 | 2018 | 2017 |
Portfolio turnover ratex | 1% | 21% | 19% | 28% | 15% | 13% |
b | Percentage represents the results for the period and is not annualized. |
c | Per share amount calculated on the average shares method. |
m | Total return does not reflect expenses that apply at the separate account level or to related insurance products. Inclusion of these charges would reduce the total return figures for all periods shown. |
w | Expenses of the underlying funds are not included in the Fund’s expense ratio. The Fund indirectly bears its proportionate share of the expenses of any underlying fund. |
x | Amount does not include the portfolio activity of any underlying fund. |
The accompanying notes are an integral part of the financial statements.
150
MML Series Investment Fund – Financial Statements (Continued) |
Financial Highlights (For a share outstanding throughout each period) |
MML Growth Allocation Fund
| | | Income (loss) from investment
operations | Less distributions to shareholders | | | Ratios / Supplemental Data |
| | Net
asset
value,
beginning
of period | Net
investment
income
(loss)c | Net
realized
and
unrealized
gain (loss)
on
investments | Total
income
(loss) from
investment
operations | From net
investment
income | From net
realized
gains | Total
distributions | Net
asset
value,
end of
the
period | Total
returnm | Net
assets,
end of
the
period
(000’s) | Ratio of
expenses
to average
daily net
assetsw | Net
investment
income
(loss) to
average
daily net
assets |
Initial Class | | | | | | | | | | | |
6/30/22r | $ 10.11 | $ (0.01) | $ (1.72) | $ (1.73) | $ — | $ — | $ — | $ 8.38 | (17.11%)b | $ 348,005 | 0.12%a | (0.12%)a |
12/31/21 | 9.38 | 0.14 | 1.19 | 1.33 | (0.16) | (0.44) | (0.60) | 10.11 | 14.33% | 443,650 | 0.12% | 1.36% |
12/31/20 | 9.04 | 0.09 | 0.98 | 1.07 | (0.18) | (0.55) | (0.73) | 9.38 | 12.76% | 456,817 | 0.11% | 1.07% |
12/31/19 | 8.35 | 0.15 | 1.55 | 1.70 | (0.22) | (0.79) | (1.01) | 9.04 | 21.21% | 573,104 | 0.12% | 1.64% |
12/31/18 | 9.75 | 0.14 | (0.73) | (0.59) | (0.18) | (0.63) | (0.81) | 8.35 | (6.90%) | 536,767 | 0.11% | 1.47% |
12/31/17 | 9.16 | 0.15 | 1.28 | 1.43 | (0.15) | (0.69) | (0.84) | 9.75 | 16.07% | 647,613 | 0.11% | 1.53% |
Service Class | | | | | | | | | | | |
6/30/22r | $ 10.00 | $ (0.02) | $ (1.70) | $ (1.72) | $ — | $ — | $ — | $ 8.28 | (17.20%)b | $ 598,130 | 0.37%a | (0.37%)a |
12/31/21 | 9.29 | 0.11 | 1.17 | 1.28 | (0.13) | (0.44) | (0.57) | 10.00 | 13.93% | 763,680 | 0.37% | 1.10% |
12/31/20 | 8.96 | 0.07 | 0.97 | 1.04 | (0.16) | (0.55) | (0.71) | 9.29 | 12.47% | 788,627 | 0.36% | 0.82% |
12/31/19 | 8.28 | 0.12 | 1.54 | 1.66 | (0.19) | (0.79) | (0.98) | 8.96 | 20.93% | 978,390 | 0.37% | 1.40% |
12/31/18 | 9.67 | 0.12 | (0.73) | (0.61) | (0.15) | (0.63) | (0.78) | 8.28 | (7.10%) | 915,318 | 0.36% | 1.22% |
12/31/17 | 9.09 | 0.12 | 1.28 | 1.40 | (0.13) | (0.69) | (0.82) | 9.67 | 15.81% | 1,080,728 | 0.36% | 1.27% |
| | | Year ended December 31 |
| | Six months ended
June 30, 2022b,r | 2021 | 2020 | 2019 | 2018 | 2017 |
Portfolio turnover ratex | 3% | 27% | 18% | 29% | 17% | 16% |
b | Percentage represents the results for the period and is not annualized. |
c | Per share amount calculated on the average shares method. |
m | Total return does not reflect expenses that apply at the separate account level or to related insurance products. Inclusion of these charges would reduce the total return figures for all periods shown. |
w | Expenses of the underlying funds are not included in the Fund’s expense ratio. The Fund indirectly bears its proportionate share of the expenses of any underlying fund. |
x | Amount does not include the portfolio activity of any underlying fund. |
The accompanying notes are an integral part of the financial statements.
151
MML Series Investment Fund – Financial Statements (Continued) |
Financial Highlights (For a share outstanding throughout each period) |
MML Aggressive Allocation Fund
| | | Income (loss) from investment
operations | Less distributions to shareholders | | | Ratios / Supplemental Data |
| | Net
asset
value,
beginning
of period | Net
investment
income
(loss)c | Net
realized
and
unrealized
gain (loss)
on
investments | Total
income
(loss) from
investment
operations | From net
investment
income | From net
realized
gains | Total
distributions | Net
asset
value,
end of
the
period | Total
returnm | Net
assets,
end of
the
period
(000’s) | Ratio of
expenses
to average
daily net
assetsw | Net
investment
income
(loss) to
average
daily net
assets |
Initial Class | | | | | | | | | | | |
6/30/22r | $ 11.70 | $ (0.01) | $ (2.15) | $ (2.16) | $ — | $ — | $ — | $ 9.54 | (18.46%)b | $ 55,686 | 0.15%a | (0.15%)a |
12/31/21 | 10.58 | 0.12 | 1.63 | 1.75 | (0.15) | (0.48) | (0.63) | 11.70 | 16.65% | 73,193 | 0.14% | 1.05% |
12/31/20 | 10.16 | 0.10 | 1.15 | 1.25 | (0.16) | (0.67) | (0.83) | 10.58 | 13.35% | 66,655 | 0.15% | 1.08% |
12/31/19 | 9.20 | 0.12 | 1.99 | 2.11 | (0.21) | (0.94) | (1.15) | 10.16 | 23.93% | 67,730 | 0.15% | 1.24% |
12/31/18 | 10.68 | 0.12 | (0.90) | (0.78) | (0.15) | (0.55) | (0.70) | 9.20 | (8.12%) | 56,195 | 0.15% | 1.10% |
12/31/17 | 9.67 | 0.12 | 1.65 | 1.77 | (0.12) | (0.64) | (0.76) | 10.68 | 18.77% | 66,517 | 0.15% | 1.17% |
Service Class | | | | | | | | | | | |
6/30/22r | $ 11.48 | $ (0.02) | $ (2.11) | $ (2.13) | $ — | $ — | $ — | $ 9.35 | (18.55%)b | $ 73,831 | 0.40%a | (0.40%)a |
12/31/21 | 10.39 | 0.09 | 1.60 | 1.69 | (0.12) | (0.48) | (0.60) | 11.48 | 16.40% | 95,028 | 0.39% | 0.78% |
12/31/20 | 9.99 | 0.07 | 1.13 | 1.20 | (0.13) | (0.67) | (0.80) | 10.39 | 13.08% | 93,621 | 0.40% | 0.80% |
12/31/19 | 9.06 | 0.09 | 1.96 | 2.05 | (0.18) | (0.94) | (1.12) | 9.99 | 23.65% | 95,667 | 0.40% | 0.95% |
12/31/18 | 10.54 | 0.09 | (0.90) | (0.81) | (0.12) | (0.55) | (0.67) | 9.06 | (8.44%) | 83,212 | 0.40% | 0.87% |
12/31/17 | 9.56 | 0.10 | 1.62 | 1.72 | (0.10) | (0.64) | (0.74) | 10.54 | 18.44% | 90,246 | 0.40% | 0.95% |
| | | Year ended December 31 |
| | Six months ended
June 30, 2022b,r | 2021 | 2020 | 2019 | 2018 | 2017 |
Portfolio turnover ratex | 7% | 37% | 17% | 32% | 19% | 20% |
b | Percentage represents the results for the period and is not annualized. |
c | Per share amount calculated on the average shares method. |
m | Total return does not reflect expenses that apply at the separate account level or to related insurance products. Inclusion of these charges would reduce the total return figures for all periods shown. |
w | Expenses of the underlying funds are not included in the Fund’s expense ratio. The Fund indirectly bears its proportionate share of the expenses of any underlying fund. |
x | Amount does not include the portfolio activity of any underlying fund. |
The accompanying notes are an integral part of the financial statements.
152
MML Series Investment Fund – Financial Statements (Continued) |
Financial Highlights (For a share outstanding throughout each period) |
MML American Funds Growth Fund
| | | Income (loss) from investment
operations | Less distributions to shareholders | | | Ratios / Supplemental Data |
| | Net
asset
value,
beginning
of period | Net
investment
income
(loss)c,j | Net
realized
and
unrealized
gain (loss)
on
investments | Total
income
(loss) from
investment
operations | From net
investment
income | From net
realized
gains | Total
distributions | Net
asset
value,
end of
the
period | Total
returnm | Net
assets,
end of
the
period
(000’s) | Ratio of
expenses
to average
daily net
assets
before
expense
waiversu | Ratio of
expenses
to average
daily net
assets
after
expense
waiversu,j | Net
investment
income
(loss) to
average
daily net
assets |
Service Class I | | | | | | | | | | | | |
6/30/22r | $ 22.52 | $ (0.04) | $ (6.73) | $ (6.77) | $ — | $ — | $ — | $ 15.75 | (30.06%)b | $ 203,274 | 0.68%a | N/A | (0.41%)a |
12/31/21 | 19.56 | (0.05) | 4.20 | 4.15 | — | (1.19) | (1.19) | 22.52 | 21.48% | 292,504 | 0.68% | N/A | (0.21%) |
12/31/20 | 14.33 | (0.02) | 7.11 | 7.09 | (0.12) | (1.74) | (1.86) | 19.56 | 51.49% | 257,464 | 0.68% | N/A | (0.12%) |
12/31/19 | 12.70 | 0.04 | 3.53 | 3.57 | (0.05) | (1.89) | (1.94) | 14.33 | 30.33% | 197,036 | 0.69% | 0.69%l | 0.31% |
12/31/18 | 14.37 | 0.00d | 0.15 | 0.15 | (0.04) | (1.78) | (1.82) | 12.70 | (0.73%) | 162,360 | 0.69% | 0.69%l | 0.01% |
12/31/17 | 12.37 | 0.01 | 3.31 | 3.32 | (0.04) | (1.28) | (1.32) | 14.37 | 27.78% | 171,896 | 0.68% | 0.68%l | 0.07% |
| | | Year ended December 31 |
| | Six months ended
June 30, 2022b,r | 2021 | 2020 | 2019 | 2018 | 2017 |
Portfolio turnover ratex | 4% | 13% | 8% | 12% | 12% | 11% |
b | Percentage represents the results for the period and is not annualized. |
c | Per share amount calculated on the average shares method. |
d | Amount is less than $0.005 per share. |
j | Computed after giving effect to an agreement by MML Advisers to waive certain fees and expenses of the Fund. |
l | Expenses incurred during the period fell under the expense cap. |
m | Total return does not reflect expenses that apply at the separate account level or to related insurance products. Inclusion of these charges would reduce the total return figures for all periods shown. |
u | Expenses of the Master Fund are not included in the Fund’s expense ratio. The Fund indirectly bears its proportionate share of the expenses of the Master Fund. |
x | Amount does not include the portfolio activity of the Master Fund. |
The accompanying notes are an integral part of the financial statements.
153
MML Series Investment Fund – Financial Statements (Continued) |
Financial Highlights (For a share outstanding throughout each period) |
MML American Funds International Fund
| | | Income (loss) from investment
operations | Less distributions to shareholders | | | Ratios / Supplemental Data |
| | Net
asset
value,
beginning
of period | Net
investment
income
(loss)c,j | Net
realized
and
unrealized
gain (loss)
on
investments | Total
income
(loss) from
investment
operations | From net
investment
income | From net
realized
gains | Total
distributions | Net
asset
value,
end of
the
period | Total
returnm | Net
assets,
end of
the
period
(000’s) | Ratio of
expenses
to average
daily net
assets
before
expense
waiversu | Ratio of
expenses
to average
daily net
assets
after
expense
waiversu,j | Net
investment
income
(loss) to
average
daily net
assets |
Service Class I | | | | | | | | | | | | |
6/30/22r | $ 10.44 | $ 0.01 | $ (2.40) | $ (2.39) | $ — | $ — | $ — | $ 8.05 | (22.89%)b | $ 45,141 | 0.76%a | N/A | 0.15%a |
12/31/21 | 10.82 | 0.21 | (0.42) | (0.21) | (0.01) | (0.16) | (0.17) | 10.44 | (1.96%) | 59,670 | 0.75% | N/A | 1.89% |
12/31/20 | 10.19 | 0.01 | 1.25 | 1.26 | (0.10) | (0.53) | (0.63) | 10.82 | 13.44% | 61,031 | 0.73% | N/A | 0.14% |
12/31/19 | 9.07 | 0.09 | 1.83 | 1.92 | (0.28) | (0.52) | (0.80) | 10.19 | 22.31% | 63,943 | 0.74% | 0.73% | 0.96% |
12/31/18 | 10.93 | 0.13 | (1.55) | (1.42) | (0.09) | (0.35) | (0.44) | 9.07 | (13.52%) | 56,712 | 0.73% | 0.70% | 1.24% |
12/31/17 | 9.12 | 0.08 | 2.73 | 2.81 | (0.09) | (0.91) | (1.00) | 10.93 | 31.65% | 66,931 | 0.72% | 0.70% | 0.80% |
| | | Year ended December 31 |
| | Six months ended
June 30, 2022b,r | 2021 | 2020 | 2019 | 2018 | 2017 |
Portfolio turnover ratex | 5% | 13% | 5% | 8% | 11% | 9% |
b | Percentage represents the results for the period and is not annualized. |
c | Per share amount calculated on the average shares method. |
j | Computed after giving effect to an agreement by MML Advisers to waive certain fees and expenses of the Fund. |
m | Total return does not reflect expenses that apply at the separate account level or to related insurance products. Inclusion of these charges would reduce the total return figures for all periods shown. |
u | Expenses of the Master Fund are not included in the Fund’s expense ratio. The Fund indirectly bears its proportionate share of the expenses of the Master Fund. |
x | Amount does not include the portfolio activity of the Master Fund. |
The accompanying notes are an integral part of the financial statements.
154
MML Series Investment Fund – Financial Statements (Continued) |
Financial Highlights (For a share outstanding throughout each period) |
MML American Funds Core Allocation Fund
| | | Income (loss) from investment
operations | Less distributions to shareholders | | | Ratios / Supplemental Data |
| | Net
asset
value,
beginning
of period | Net
investment
income
(loss)c,j | Net
realized
and
unrealized
gain (loss)
on
investments | Total
income
(loss) from
investment
operations | From net
investment
income | From net
realized
gains | Total
distributions | Net
asset
value,
end of
the
period | Total
returnm | Net
assets,
end of
the
period
(000’s) | Ratio of
expenses
to average
daily net
assetsw | Ratio of
expenses
to average
daily net
assets
after
expense
waiversw,j | Net
investment
income
(loss) to
average
daily net
assets |
Service Class I | | | | | | | | | | | | |
6/30/22r | $ 13.22 | $ 0.02 | $ (2.01) | $ (1.99) | $ — | $ — | $ — | $ 11.23 | (15.05%)b | $ 739,460 | 0.71%a | 0.61%a | 0.27%a |
12/31/21 | 12.16 | 0.13 | 1.42 | 1.55 | (0.17) | (0.32) | (0.49) | 13.22 | 12.85% | 933,788 | 0.71% | 0.65% | 1.00% |
12/31/20 | 11.72 | 0.12 | 1.15 | 1.27 | (0.20) | (0.63) | (0.83) | 12.16 | 11.39% | 943,728 | 0.71% | N/A | 1.08% |
12/31/19 | 10.98 | 0.18 | 1.72 | 1.90 | (0.29) | (0.87) | (1.16) | 11.72 | 18.12% | 1,001,411 | 0.71% | N/A | 1.52% |
12/31/18 | 12.60 | 0.17 | (0.69) | (0.52) | (0.22) | (0.88) | (1.10) | 10.98 | (4.84%) | 956,051 | 0.71% | N/A | 1.41% |
12/31/17 | 11.94 | 0.16 | 1.56 | 1.72 | (0.18) | (0.88) | (1.06) | 12.60 | 14.94% | 1,094,274 | 0.71% | N/A | 1.25% |
| | | Year ended December 31 |
| | Six months ended
June 30, 2022b,r | 2021 | 2020 | 2019 | 2018 | 2017 |
Portfolio turnover ratex | 9% | 11% | 14% | 16% | 15% | 16% |
b | Percentage represents the results for the period and is not annualized. |
c | Per share amount calculated on the average shares method. |
j | Computed after giving effect to an agreement by MML Advisers to waive certain fees and expenses of the Fund. |
m | Total return does not reflect expenses that apply at the separate account level or to related insurance products. Inclusion of these charges would reduce the total return figures for all periods shown. |
w | Expenses of the underlying funds are not included in the Fund’s expense ratio. The Fund indirectly bears its proportionate share of the expenses of any underlying fund. |
x | Amount does not include the portfolio activity of any underlying fund. |
The accompanying notes are an integral part of the financial statements.
155
MML Series Investment Fund – Financial Statements (Continued) |
Financial Highlights (For a share outstanding throughout each period) |
MML Blue Chip Growth Fund
| | | Income (loss) from investment
operations | Less distributions to shareholders | | | Ratios / Supplemental Data |
| | Net
asset
value,
beginning
of the
period | Net
investment
income
(loss)c | Net
realized
and
unrealized
gain (loss)
on
investments | Total
income
(loss) from
investment
operations | From net
investment
income | From net
realized
gains | Total
distributions | Net
asset
value,
end of
the
period | Total
returnm | Net
assets,
end of
the
period
(000’s) | Ratio of
expenses
to average
daily net
assets | Net
investment
income
(loss) to
average
daily net
assets |
Initial Class | | | | | | | | | | | |
6/30/22r | $ 21.62 | $ (0.03) | $ (7.59) | $ (7.62) | $ — | $ — | $ — | $ 14.00 | (35.25%)b | $ 275,394 | 0.78%a | (0.32%)a |
12/31/21 | 20.51 | (0.10) | 3.48 | 3.38 | — | (2.27) | (2.27) | 21.62 | 16.34% | 425,249 | 0.77% | (0.44%) |
12/31/20 | 16.49 | (0.06) | 5.68 | 5.62 | — | (1.60) | (1.60) | 20.51 | 34.40% | 351,504 | 0.78% | (0.35%) |
12/31/19 | 14.60 | (0.02) | 4.16 | 4.14 | — | (2.25) | (2.25) | 16.49 | 29.84% | 304,381 | 0.79% | (0.09%) |
12/31/18 | 17.41 | (0.00)d | 0.86 | 0.86 | — | (3.67) | (3.67) | 14.60 | 1.88% | 254,050 | 0.79% | (0.02%) |
12/31/17 | 13.98 | 0.00d | 4.93 | 4.93 | (0.00)d | (1.50) | (1.50) | 17.41 | 36.22% | 301,054 | 0.80% | 0.00%e |
Service Class | | | | | | | | | | | |
6/30/22r | $ 20.28 | $ (0.05) | $ (7.11) | $ (7.16) | $ — | $ — | $ — | $ 13.12 | (35.31%)b | $ 128,749 | 1.03%a | (0.57%)a |
12/31/21 | 19.40 | (0.14) | 3.29 | 3.15 | — | (2.27) | (2.27) | 20.28 | 16.08% | 203,439 | 1.02% | (0.69%) |
12/31/20 | 15.71 | (0.10) | 5.39 | 5.29 | — | (1.60) | (1.60) | 19.40 | 34.00% | 181,728 | 1.03% | (0.60%) |
12/31/19 | 14.03 | (0.05) | 3.98 | 3.93 | — | (2.25) | (2.25) | 15.71 | 29.56% | 137,293 | 1.04% | (0.35%) |
12/31/18 | 16.88 | (0.05) | 0.87 | 0.82 | — | (3.67) | (3.67) | 14.03 | 1.68% | 99,468 | 1.04% | (0.26%) |
12/31/17 | 13.62 | (0.04) | 4.80 | 4.76 | — | (1.50) | (1.50) | 16.88 | 35.89% | 77,091 | 1.05% | (0.25%) |
| | | Year ended December 31 |
| | Six months ended
June 30, 2022b,r | 2021 | 2020 | 2019 | 2018 | 2017 |
Portfolio turnover rate | 9% | 41% | 26% | 33% | 28% | 25% |
b | Percentage represents the results for the period and is not annualized. |
c | Per share amount calculated on the average shares method. |
d | Amount is less than $0.005 per share. |
e | Amount is less than 0.005%. |
m | Total return does not reflect expenses that apply at the separate account level or to related insurance products. Inclusion of these charges would reduce the total return figures for all periods shown. |
The accompanying notes are an integral part of the financial statements.
156
MML Series Investment Fund – Financial Statements (Continued) |
Financial Highlights (For a share outstanding throughout each period) |
MML Equity Income Fund
| | | Income (loss) from investment
operations | Less distributions to shareholders | | | Ratios / Supplemental Data |
| | Net
asset
value,
beginning
of the
period | Net
investment
income
(loss)c,j | Net
realized
and
unrealized
gain (loss)
on
investments | Total
income
(loss) from
investment
operations | From net
investment
income | From net
realized
gains | Total
distributions | Net
asset
value,
end of
the
period | Total
returnm | Net
assets,
end of
the
period
(000’s) | Ratio of
expenses
to average
daily net
assets
before
expense
waiver | Ratio of
expenses
to average
daily net
assets
after
expense
waiversj | Net
investment
income
(loss) to
average
daily net
assets |
Initial Class | | | | | | | | | | | | |
6/30/22r | $ 12.38 | $ 0.12 | $ (1.17) | $ (1.05) | $ — | $ — | $ — | $ 11.33 | (8.48%)b | $ 307,718 | 0.78%a | 0.75%a | 1.95%a |
12/31/21 | 10.28 | 0.18 | 2.43 | 2.61 | (0.27) | (0.24) | (0.51) | 12.38 | 25.58% | 368,999 | 0.78% | 0.75% | 1.57% |
12/31/20 | 11.18 | 0.22 | (0.22) | 0.00d | (0.23) | (0.67) | (0.90) | 10.28 | 1.34% | 365,382 | 0.79% | 0.76% | 2.32% |
12/31/19 | 10.04 | 0.24 | 2.25 | 2.49 | (0.27) | (1.08) | (1.35) | 11.18 | 26.45% | 396,909 | 0.78% | 0.75% | 2.22% |
12/31/18 | 12.50 | 0.26 | (1.23) | (0.97) | (0.24) | (1.25) | (1.49) | 10.04 | (9.36%) | 358,947 | 0.79% | 0.76% | 2.17% |
12/31/17 | 11.78 | 0.23 | 1.58 | 1.81 | (0.27) | (0.82) | (1.09) | 12.50 | 16.33% | 440,607 | 0.79% | 0.76% | 1.93% |
Service Class | | | | | | | | | | | | |
6/30/22r | $ 12.19 | $ 0.10 | $ (1.15) | $ (1.05) | $ — | $ — | $ — | $ 11.14 | (8.61%)b | $ 78,006 | 1.03%a | 1.00%a | 1.71%a |
12/31/21 | 10.14 | 0.15 | 2.39 | 2.54 | (0.25) | (0.24) | (0.49) | 12.19 | 25.18% | 88,588 | 1.03% | 1.00% | 1.32% |
12/31/20 | 11.03 | 0.19 | (0.20) | (0.01) | (0.21) | (0.67) | (0.88) | 10.14 | 1.17% | 82,671 | 1.04% | 1.01% | 2.06% |
12/31/19 | 9.92 | 0.21 | 2.22 | 2.43 | (0.24) | (1.08) | (1.32) | 11.03 | 26.12% | 86,749 | 1.03% | 1.00% | 1.98% |
12/31/18 | 12.37 | 0.23 | (1.22) | (0.99) | (0.21) | (1.25) | (1.46) | 9.92 | (9.60%) | 75,335 | 1.04% | 1.01% | 1.92% |
12/31/17 | 11.68 | 0.20 | 1.56 | 1.76 | (0.25) | (0.82) | (1.07) | 12.37 | 15.97% | 86,193 | 1.04% | 1.01% | 1.68% |
| | | Year ended December 31 |
| | Six months ended
June 30, 2022b,r | 2021 | 2020 | 2019 | 2018 | 2017 |
Portfolio turnover rate | 7% | 21% | 32% | 18% | 19% | 25% |
b | Percentage represents the results for the period and is not annualized. |
c | Per share amount calculated on the average shares method. |
d | Amount is less than $0.005 per share. |
j | Computed after giving effect to an agreement by MML Advisers to waive certain fees and expenses of the Fund. |
m | Total return does not reflect expenses that apply at the separate account level or to related insurance products. Inclusion of these charges would reduce the total return figures for all periods shown. |
The accompanying notes are an integral part of the financial statements.
157
MML Series Investment Fund – Financial Statements (Continued) |
Financial Highlights (For a share outstanding throughout each period) |
MML Equity Index Fund
| | | Income (loss) from investment
operations | Less distributions to shareholders | | | Ratios / Supplemental Data |
| | Net
asset
value,
beginning
of the
period | Net
investment
income
(loss)c | Net
realized
and
unrealized
gain (loss)
on
investments | Total
income
(loss) from
investment
operations | From net
investment
income | From net
realized
gains | Total
distributions | Net
asset
value,
end of
the
period | Total
returnm | Net
assets,
end of
the
period
(000’s) | Ratio of
expenses
to average
daily net
assets | Net
investment
income
(loss) to
average
daily net
assets |
Class I | | | | | | | | | | | | |
6/30/22r | $ 35.26 | $ 0.18 | $ (7.28) | $ (7.10) | $ — | $ — | $ — | $ 28.16 | (20.14%)b | $ 49,392 | 0.42%a | 1.12%a |
12/31/21 | 29.07 | 0.31 | 7.77 | 8.08 | (0.43) | (1.46) | (1.89) | 35.26 | 28.19% | 65,271 | 0.42% | 0.96% |
12/31/20 | 32.46 | 0.42 | 4.71 | 5.13 | (0.55) | (7.97) | (8.52) | 29.07 | 18.06% | 61,002 | 0.43% | 1.43% |
12/31/19 | 28.09 | 0.48 | 7.71 | 8.19 | (0.90) | (2.92) | (3.82) | 32.46 | 30.86% | 57,944 | 0.44% | 1.51% |
12/31/18 | 31.01 | 0.49 | (1.76) | (1.27) | (0.50) | (1.15) | (1.65) | 28.09 | (4.80%) | 51,998 | 0.43% | 1.57% |
12/31/17 | 26.53 | 0.45 | 5.11 | 5.56 | (0.29) | (0.79) | (1.08) | 31.01 | 21.34% | 66,374 | 0.43% | 1.57% |
Class II | | | | | | | | | | | | |
6/30/22r | $ 35.22 | $ 0.20 | $ (7.27) | $ (7.07) | $ — | $ — | $ — | $ 28.15 | (20.07%)b | $ 234,960 | 0.27%a | 1.28%a |
12/31/21 | 29.04 | 0.36 | 7.76 | 8.12 | (0.48) | (1.46) | (1.94) | 35.22 | 28.37% | 299,922 | 0.27% | 1.11% |
12/31/20 | 32.45 | 0.46 | 4.71 | 5.17 | (0.61) | (7.97) | (8.58) | 29.04 | 18.21% | 239,890 | 0.28% | 1.58% |
12/31/19 | 28.10 | 0.52 | 7.72 | 8.24 | (0.97) | (2.92) | (3.89) | 32.45 | 31.06% | 209,951 | 0.29% | 1.66% |
12/31/18 | 31.01 | 0.54 | (1.75) | (1.21) | (0.55) | (1.15) | (1.70) | 28.10 | (4.63%) | 159,638 | 0.28% | 1.72% |
12/31/17 | 26.55 | 0.50 | 5.10 | 5.60 | (0.35) | (0.79) | (1.14) | 31.01 | 21.50% | 186,674 | 0.28% | 1.72% |
Class III | | | | | | | | | | | | |
6/30/22r | $ 35.15 | $ 0.22 | $ (7.25) | $ (7.03) | $ — | $ — | $ — | $ 28.12 | (20.00%)b | $ 279,019 | 0.12%a | 1.43%a |
12/31/21 | 28.98 | 0.41 | 7.74 | 8.15 | (0.52) | (1.46) | (1.98) | 35.15 | 28.54% | 359,612 | 0.12% | 1.26% |
12/31/20 | 32.39 | 0.50 | 4.71 | 5.21 | (0.65) | (7.97) | (8.62) | 28.98 | 18.41% | 307,589 | 0.13% | 1.72% |
12/31/19 | 28.05 | 0.57 | 7.70 | 8.27 | (1.01) | (2.92) | (3.93) | 32.39 | 31.27% | 268,217 | 0.14% | 1.82% |
12/31/18 | 30.97 | 0.59 | (1.75) | (1.16) | (0.60) | (1.16) | (1.76) | 28.05 | (4.52%) | 391,891 | 0.13% | 1.87% |
12/31/17 | 26.51 | 0.54 | 5.10 | 5.64 | (0.39) | (0.79) | (1.18) | 30.97 | 21.69% | 440,242 | 0.13% | 1.87% |
Service Class I | | | | | | | | | | | |
6/30/22r | $ 33.55 | $ 0.13 | $ (6.91) | $ (6.78) | $ — | $ — | $ — | $ 26.77 | (20.21%)b | $ 38,665 | 0.67%a | 0.87%a |
12/31/21 | 27.76 | 0.22 | 7.40 | 7.62 | (0.37) | (1.46) | (1.83) | 33.55 | 27.86% | 52,483 | 0.67% | 0.71% |
12/31/20 | 31.35 | 0.33 | 4.52 | 4.85 | (0.47) | (7.97) | (8.44) | 27.76 | 17.74% | 44,361 | 0.68% | 1.18% |
12/31/19 | 27.24 | 0.38 | 7.48 | 7.86 | (0.83) | (2.92) | (3.75) | 31.35 | 30.56% | 45,967 | 0.69% | 1.26% |
12/31/18 | 30.13 | 0.40 | (1.70) | (1.30) | (0.43) | (1.16) | (1.59) | 27.24 | (5.04%) | 40,822 | 0.68% | 1.32% |
12/31/17 | 25.84 | 0.37 | 4.96 | 5.33 | (0.25) | (0.79) | (1.04) | 30.13 | 21.01% | 48,712 | 0.68% | 1.32% |
| | | Year ended December 31 |
| | Six months ended
June 30, 2022b,r | 2021 | 2020 | 2019 | 2018 | 2017 |
Portfolio turnover rate | 1% | 3% | 5% | 5% | 3% | 7% |
b | Percentage represents the results for the period and is not annualized. |
c | Per share amount calculated on the average shares method. |
m | Total return does not reflect expenses that apply at the separate account level or to related insurance products. Inclusion of these charges would reduce the total return figures for all periods shown. |
The accompanying notes are an integral part of the financial statements.
158
MML Series Investment Fund – Financial Statements (Continued) |
Financial Highlights (For a share outstanding throughout each period) |
MML Focused Equity Fund
| | | Income (loss) from investment
operations | Less distributions to shareholders | | | Ratios / Supplemental Data |
| | Net
asset
value,
beginning
of the
period | Net
investment
income
(loss)c,j | Net
realized
and
unrealized
gain (loss)
on
investments | Total
income
(loss) from
investment
operations | From net
investment
income | From net
realized
gain | Total
distributions | Net
asset
value,
end of
the
period | Total
returnm | Net
assets,
end of
the
period
(000’s) | Ratio of
expenses
to average
daily net
assets
before
expense
waivers | Ratio of
expenses
to average
daily net
assets
after
expense
waiversj | Net
investment
income
(loss) to
average
daily net
assets |
Class II | | | | | | | | | | | | |
6/30/22r | $ 8.30 | $ 0.03 | $ (0.93) | $ (0.90) | $ — | $ — | $ — | $ 7.40 | (10.84%)b | $ 294,604 | 0.86%a | N/A | 0.88%a |
12/31/21 | 7.25 | 0.07 | 1.51 | 1.58 | (0.08) | (0.45) | (0.53) | 8.30 | 22.25% | 338,277 | 0.87% | N/A | 0.89% |
12/31/20 | 6.77 | 0.07 | 0.76 | 0.83 | (0.05) | (0.30) | (0.35) | 7.25 | 12.76% | 277,370 | 0.87% | N/A | 1.10% |
12/31/19 | 5.33 | 0.07 | 1.53 | 1.60 | (0.02) | (0.14) | (0.16) | 6.77 | 30.15% | 297,347 | 0.89% | 0.88% | 1.11% |
12/31/18 | 12.69 | 0.11 | 0.66 | 0.77 | (0.37) | (7.76) | (8.13) | 5.33 | 1.18% | 48,276 | 0.95% | 0.87% | 1.25% |
12/31/17 | 13.20 | 0.27 | 2.35 | 2.62 | (0.36) | (2.77) | (3.13) | 12.69 | 21.99% | 57,382 | 0.94% | N/A | 2.00% |
Service Class I | | | | | | | | | | | | |
6/30/22r | $ 7.96 | $ 0.02 | $ (0.89) | $ (0.87) | $ — | $ — | $ — | $ 7.09 | (10.93%)b | $ 20,126 | 1.11%a | N/A | 0.63%a |
12/31/21 | 6.98 | 0.05 | 1.45 | 1.50 | (0.07) | (0.45) | (0.52) | 7.96 | 21.88% | 22,988 | 1.12% | N/A | 0.64% |
12/31/20 | 6.53 | 0.05 | 0.74 | 0.79 | (0.04) | (0.30) | (0.34) | 6.98 | 12.54% | 19,686 | 1.12% | N/A | 0.85% |
12/31/19 | 5.15 | 0.05 | 1.47 | 1.52 | (0.00)d | (0.14) | (0.14) | 6.53 | 29.73% | 18,439 | 1.15% | 1.13% | 0.90% |
12/31/18 | 12.52 | 0.09 | 0.66 | 0.75 | (0.36) | (7.76) | (8.12) | 5.15 | 0.99% | 10,980 | 1.20% | 1.12% | 1.01% |
12/31/17 | 13.11 | 0.18 | 2.37 | 2.55 | (0.37) | (2.77) | (3.14) | 12.52 | 21.61% | 9,981 | 1.19% | N/A | 1.39% |
| | | Year ended December 31 |
| | Six months ended
June 30, 2022b,r | 2021 | 2020 | 2019 | 2018 | 2017 |
Portfolio turnover rate | 18% | 34% | 36% | 36% | 64% | 108% |
b | Percentage represents the results for the period and is not annualized. |
c | Per share amount calculated on the average shares method. |
d | Amount is less than $0.005 per share. |
j | Computed after giving effect to an agreement by MML Advisers to waive certain fees and expenses of the Fund. |
m | Total return does not reflect expenses that apply at the separate account level or to related insurance products. Inclusion of these charges would reduce the total return figures for all periods shown. |
The accompanying notes are an integral part of the financial statements.
159
MML Series Investment Fund – Financial Statements (Continued) |
Financial Highlights (For a share outstanding throughout each period) |
MML Foreign Fund
| | | Income (loss) from investment
operations | Less distributions to shareholders | | | Ratios / Supplemental Data |
| | Net
asset
value,
beginning
of the
period | Net
investment
income
(loss)c,j | Net
realized
and
unrealized
gain (loss)
on
investments | Total
income
(loss) from
investment
operations | From net
investment
income | From net
realized
gains | Total
distributions | Net
asset
value,
end of
the
period | Total
returnm | Net
assets,
end of
the
period
(000’s) | Ratio of
expenses
to average
daily net
assets
before
expense
waivers | Ratio of
expenses
to average
daily net
assets
after
expense
waiversj | Net
investment
income
(loss) to
average
daily net
assets |
Initial Class | | | | | | | | | | | | |
6/30/22r | $ 11.04 | $ 0.18 | $ (2.25) | $ (2.07) | $ — | $ — | $ — | $ 8.97 | (18.75%)b | $ 176,079 | 0.94%a | 0.93%a | 3.63%a |
12/31/21 | 10.02 | 0.22 | 1.09 | 1.31 | (0.29) | — | (0.29) | 11.04 | 13.04% | 237,547 | 0.94% | 0.92% | 1.99% |
12/31/20 | 10.10 | 0.14 | 0.37 | 0.51 | (0.27) | (0.32) | (0.59) | 10.02 | 5.93% | 266,506 | 0.92% | 0.88% | 1.61% |
12/31/19 | 9.25 | 0.26 | 0.92 | 1.18 | (0.18) | (0.15) | (0.33) | 10.10 | 13.17% | 307,367 | 0.94% | 0.89% | 2.69% |
12/31/18 | 11.25 | 0.20 | (1.95) | (1.75) | (0.25) | — | (0.25) | 9.25 | (15.90%) | 294,037 | 0.98% | 0.97% | 1.81% |
12/31/17 | 9.44 | 0.19 | 1.85 | 2.04 | (0.23) | — | (0.23) | 11.25 | 21.73% | 382,813 | 0.97% | N/A | 1.79% |
Service Class | | | | | | | | | | | | |
6/30/22r | $ 10.98 | $ 0.17 | $ (2.24) | $ (2.07) | $ — | $ — | $ — | $ 8.91 | (18.85%)b | $ 6,289 | 1.19%a | 1.18%a | 3.43%a |
12/31/21 | 9.95 | 0.19 | 1.10 | 1.29 | (0.26) | — | (0.26) | 10.98 | 12.95% | 8,063 | 1.19% | 1.17% | 1.72% |
12/31/20 | 10.04 | 0.12 | 0.36 | 0.48 | (0.25) | (0.32) | (0.57) | 9.95 | 5.57% | 8,323 | 1.17% | 1.13% | 1.36% |
12/31/19 | 9.20 | 0.24 | 0.90 | 1.14 | (0.15) | (0.15) | (0.30) | 10.04 | 12.78% | 9,820 | 1.19% | 1.14% | 2.44% |
12/31/18 | 11.18 | 0.17 | (1.93) | (1.76) | (0.22) | — | (0.22) | 9.20 | (16.03%) | 9,324 | 1.23% | 1.22% | 1.57% |
12/31/17 | 9.38 | 0.16 | 1.84 | 2.00 | (0.20) | — | (0.20) | 11.18 | 21.45% | 11,488 | 1.22% | N/A | 1.53% |
| | | Year ended December 31 |
| | Six months ended
June 30, 2022b,r | 2021 | 2020 | 2019 | 2018 | 2017 |
Portfolio turnover rate | 5% | 16% | 106% | 43% | 18% | 15% |
b | Percentage represents the results for the period and is not annualized. |
c | Per share amount calculated on the average shares method. |
j | Computed after giving effect to an agreement by MML Advisers to waive certain fees and expenses of the Fund. |
m | Total return does not reflect expenses that apply at the separate account level or to related insurance products. Inclusion of these charges would reduce the total return figures for all periods shown. |
The accompanying notes are an integral part of the financial statements.
160
MML Series Investment Fund – Financial Statements (Continued) |
Financial Highlights (For a share outstanding throughout each period) |
MML Fundamental Equity Fund
| | | Income (loss) from investment
operations | Less distributions to shareholders | | | Ratios / Supplemental Data |
| | Net
asset
value,
beginning
of the
period | Net
investment
income
(loss)c,j | Net
realized
and
unrealized
gain (loss)
on
investments | Total
income
(loss) from
investment
operations | From net
investment
income | From net
realized
gains | Total
distributions | Net
asset
value,
end of
the
period | Total
returnm | Net
assets,
end of
the
period
(000’s) | Ratio of
expenses
to average
daily net
assets
before
expense
waivers | Ratio of
expenses
to average
daily net
assets
after
expense
waiversj | Net
investment
income
(loss) to
average
daily net
assets |
Class II | | | | | | | | | | | | |
6/30/22r | $ 12.55 | $ 0.04 | $ (2.78) | $ (2.74) | $ — | $ — | $ — | $ 9.81 | (21.83%)b | $ 161,272 | 0.80%a | N/A | 0.75%a |
12/31/21 | 10.73 | 0.09 | 2.81 | 2.90 | (0.06) | (1.02) | (1.08) | 12.55 | 27.67% | 220,586 | 0.81% | N/A | 0.77% |
12/31/20 | 10.02 | 0.07 | 1.85 | 1.92 | (0.00)d | (1.21) | (1.21) | 10.73 | 20.02% | 161,496 | 0.82% | 0.82%k | 0.73% |
12/31/19 | 9.37 | 0.01 | 2.92 | 2.93 | (0.06) | (2.22) | (2.28) | 10.02 | 33.74% | 101,937 | 0.87% | 0.87%l | 0.09% |
12/31/18 | 12.94 | 0.06 | 0.66 | 0.72 | (0.15) | (4.14) | (4.29) | 9.37 | 0.80% | 90,145 | 0.83% | 0.83%l | 0.50% |
12/31/17 | 11.42 | 0.11 | 2.92 | 3.03 | (0.13) | (1.38) | (1.51) | 12.94 | 27.67% | 120,666 | 0.84% | 0.84%l | 0.84% |
Service Class I | | | | | | | | | | | | |
6/30/22r | $ 12.01 | $ 0.03 | $ (2.66) | $ (2.63) | $ — | $ — | $ — | $ 9.38 | (21.90%)b | $ 19,746 | 1.05%a | N/A | 0.50%a |
12/31/21 | 10.31 | 0.06 | 2.70 | 2.76 | (0.04) | (1.02) | (1.06) | 12.01 | 27.38% | 25,154 | 1.06% | N/A | 0.52% |
12/31/20 | 9.70 | 0.05 | 1.77 | 1.82 | — | (1.21) | (1.21) | 10.31 | 19.59% | 19,931 | 1.08% | 1.07% | 0.48% |
12/31/19 | 9.15 | (0.02) | 2.84 | 2.82 | (0.05) | (2.22) | (2.27) | 9.70 | 33.33% | 15,457 | 1.12% | 1.12%l | (0.16%) |
12/31/18 | 12.74 | 0.03 | 0.67 | 0.70 | (0.15) | (4.14) | (4.29) | 9.15 | 0.66% | 10,401 | 1.08% | 1.08%l | 0.27% |
12/31/17 | 11.29 | 0.07 | 2.89 | 2.96 | (0.13) | (1.38) | (1.51) | 12.74 | 27.32% | 6,875 | 1.09% | 1.09%l | 0.57% |
| | | Year ended December 31 |
| | Six months ended
June 30, 2022b,r | 2021 | 2020 | 2019 | 2018 | 2017 |
Portfolio turnover rate | 21% | 56% | 113% | 129% | 61% | 40% |
b | Percentage represents the results for the period and is not annualized. |
c | Per share amount calculated on the average shares method. |
d | Amount is less than $0.005 per share. |
j | Computed after giving effect to an agreement by MML Advisers to waive certain fees and expenses of the Fund. |
k | Amount waived had no impact on the ratio of expenses to average daily net assets. |
l | Expenses incurred during the period fell under the expense cap. |
m | Total return does not reflect expenses that apply at the separate account level or to related insurance products. Inclusion of these charges would reduce the total return figures for all periods shown. |
The accompanying notes are an integral part of the financial statements.
161
MML Series Investment Fund – Financial Statements (Continued) |
Financial Highlights (For a share outstanding throughout each period) |
MML Fundamental Value Fund
| | | Income (loss) from investment
operations | Less distributions to shareholders | | | Ratios / Supplemental Data |
| | Net
asset
value,
beginning
of the
period | Net
investment
income
(loss)c,j | Net
realized
and
unrealized
gain (loss)
on
investments | Total
income
(loss) from
investment
operations | From net
investment
income | From net
realized
gains | Total
distributions | Net
asset
value,
end of
the
period | Total
returnm | Net
assets,
end of
the
period
(000’s) | Ratio of
expenses
to average
daily net
assets
before
expense
waivers | Ratio of
expenses
to average
daily net
assets
after
expense
waiversj | Net
investment
income
(loss) to
average
daily net
assets |
Class II | | | | | | | | | | | | |
6/30/22r | $ 14.86 | $ 0.09 | $ (1.71) | $ (1.62) | $ — | $ — | $ — | $ 13.24 | (10.90%)b | $ 145,330 | 0.82%a | 0.80%a | 1.20%a |
12/31/21 | 11.62 | 0.12 | 3.36 | 3.48 | (0.24) | — | (0.24) | 14.86 | 30.02% | 173,486 | 0.83% | 0.81% | 0.87% |
12/31/20 | 13.09 | 0.19 | (0.08)aa | 0.11 | (0.15) | (1.43) | (1.58) | 11.62 | 2.67% | 178,953 | 0.80% | 0.78% | 1.71% |
12/31/19 | 12.38 | 0.18 | 2.40 | 2.58 | (0.27) | (1.60) | (1.87) | 13.09 | 22.79% | 193,994 | 0.81% | 0.79% | 1.35% |
12/31/18 | 15.42 | 0.26 | (1.63) | (1.37) | (0.25) | (1.42) | (1.67) | 12.38 | (10.34%) | 168,520 | 0.80% | 0.78% | 1.76% |
12/31/17 | 14.74 | 0.25 | 1.83 | 2.08 | (0.29) | (1.11) | (1.40) | 15.42 | 15.10% | 225,883 | 0.80% | 0.79% | 1.65% |
Service Class I | | | | | | | | | | | | |
6/30/22r | $ 14.49 | $ 0.07 | $ (1.66) | $ (1.59) | $ — | $ — | $ — | $ 12.90 | (10.97%)b | $ 21,141 | 1.07%a | 1.05%a | 0.97%a |
12/31/21 | 11.35 | 0.08 | 3.28 | 3.36 | (0.22) | — | (0.22) | 14.49 | 29.68% | 22,062 | 1.08% | 1.06% | 0.61% |
12/31/20 | 12.83 | 0.16 | (0.09)aa | 0.07 | (0.12) | (1.43) | (1.55) | 11.35 | 2.37% | 15,956 | 1.05% | 1.03% | 1.47% |
12/31/19 | 12.17 | 0.14 | 2.36 | 2.50 | (0.24) | (1.60) | (1.84) | 12.83 | 22.49% | 16,173 | 1.06% | 1.04% | 1.10% |
12/31/18 | 15.20 | 0.22 | (1.60) | (1.38) | (0.23) | (1.42) | (1.65) | 12.17 | (10.56%) | 13,283 | 1.05% | 1.03% | 1.53% |
12/31/17 | 14.57 | 0.21 | 1.80 | 2.01 | (0.27) | (1.11) | (1.38) | 15.20 | 14.78% | 13,212 | 1.05% | 1.04% | 1.39% |
| | | Year ended December 31 |
| | Six months ended
June 30, 2022b,r | 2021 | 2020 | 2019 | 2018 | 2017 |
Portfolio turnover rate | 13% | 42% | 86% | 131% | 28% | 18% |
b | Percentage represents the results for the period and is not annualized. |
c | Per share amount calculated on the average shares method. |
j | Computed after giving effect to an agreement by MML Advisers to waive certain fees and expenses of the Fund. |
m | Total return does not reflect expenses that apply at the separate account level or to related insurance products. Inclusion of these charges would reduce the total return figures for all periods shown. |
aa | The amount shown for a share outstanding does not correspond with the aggregate net realized and unrealized gain (loss) for the period due to the timing of purchases and redemptions of Fund shares in relation to the fluctuating market values of the Fund. |
The accompanying notes are an integral part of the financial statements.
162
MML Series Investment Fund – Financial Statements (Continued) |
Financial Highlights (For a share outstanding throughout each period) |
MML Global Fund
| | | Income (loss) from investment
operations | Less distributions to shareholders | | | Ratios / Supplemental Data |
| | Net
asset
value,
beginning
of the
period | Net
investment
income
(loss)c | Net
realized
and
unrealized
gain (loss)
on
investments | Total
income
(loss) from
investment
operations | From net
investment
income | From net
realized
gains | Total
distributions | Net
asset
value,
end of
the
period | Total
returnm | Net
assets,
end of
the
period
(000’s) | Ratio of
expenses
to average
daily net
assets | Net
investment
income
(loss) to
average
daily net
assets |
Class I | | | | | | | | | | | |
6/30/22r | $ 14.85 | $ 0.07 | $ (3.20) | $ (3.13) | $ — | $ — | $ — | $ 11.72 | (21.08%)b | $ 102,155 | 0.85%a | 1.12%a |
12/31/21 | 13.96 | 0.09 | 2.30 | 2.39 | (0.14) | (1.36) | (1.50) | 14.85 | 17.32% | 151,785 | 0.80% | 0.61% |
12/31/20 | 12.86 | 0.11 | 1.61 | 1.72 | (0.14) | (0.48) | (0.62) | 13.96 | 14.02% | 361,660 | 0.80% | 0.88% |
12/31/19 | 10.25 | 0.15 | 2.94 | 3.09 | (0.08) | (0.40) | (0.48) | 12.86 | 30.59% | 411,174 | 0.79% | 1.23% |
12/31/18 | 13.04 | 0.15 | (1.16) | (1.01) | (0.15) | (1.63) | (1.78) | 10.25 | (9.53%) | 179,973 | 0.83% | 1.21% |
12/31/17 | 11.54 | 0.14 | 2.56 | 2.70 | (0.16) | (1.04) | (1.20) | 13.04 | 24.16% | 206,795 | 0.83% | 1.10% |
Class II | | | | | | | | | | | |
6/30/22r | $ 15.27 | $ 0.08 | $ (3.31) | $ (3.23) | $ — | $ — | $ — | $ 12.04 | (21.15%)b | $ 15,200 | 0.85%a | 1.15%a |
12/31/21 | 14.31 | 0.09 | 2.37 | 2.46 | (0.14) | (1.36) | (1.50) | 15.27 | 17.42% | 20,021 | 0.80% | 0.57% |
12/31/20 | 13.17 | 0.11 | 1.64 | 1.75 | (0.13) | (0.48) | (0.61) | 14.31 | 13.96% | 18,461 | 0.80% | 0.86% |
12/31/19 | 10.48 | 0.16 | 3.00 | 3.16 | (0.07) | (0.40) | (0.47) | 13.17 | 30.58% | 17,896 | 0.79% | 1.31% |
12/31/18 | 13.30 | 0.15 | (1.19) | (1.04) | (0.15) | (1.63) | (1.78) | 10.48 | (9.57%) | 14,950 | 0.83% | 1.21% |
12/31/17 | 11.74 | 0.14 | 2.62 | 2.76 | (0.16) | (1.04) | (1.20) | 13.30 | 24.30% | 18,082 | 0.83% | 1.09% |
Service Class I | | | | | | | | | | | |
6/30/22r | $ 14.62 | $ 0.06 | $ (3.17) | $ (3.11) | $ — | $ — | $ — | $ 11.51 | (21.27%)b | $ 14,956 | 1.10%a | 0.90%a |
12/31/21 | 13.76 | 0.05 | 2.28 | 2.33 | (0.11) | (1.36) | (1.47) | 14.62 | 17.16% | 19,585 | 1.05% | 0.32% |
12/31/20 | 12.69 | 0.07 | 1.59 | 1.66 | (0.11) | (0.48) | (0.59) | 13.76 | 13.70% | 18,086 | 1.05% | 0.60% |
12/31/19 | 10.11 | 0.13 | 2.89 | 3.02 | (0.04) | (0.40) | (0.44) | 12.69 | 30.28% | 17,108 | 1.04% | 1.06% |
12/31/18 | 12.90 | 0.12 | (1.16) | (1.04) | (0.12) | (1.63) | (1.75) | 10.11 | (9.84%) | 13,989 | 1.08% | 0.97% |
12/31/17 | 11.43 | 0.11 | 2.54 | 2.65 | (0.14) | (1.04) | (1.18) | 12.90 | 23.95% | 15,989 | 1.08% | 0.84% |
| | | Year ended December 31 |
| | Six months ended
June 30, 2022b,r | 2021 | 2020 | 2019 | 2018 | 2017 |
Portfolio turnover rate | 4% | 9% | 13% | 16% | 15% | 10% |
b | Percentage represents the results for the period and is not annualized. |
c | Per share amount calculated on the average shares method. |
m | Total return does not reflect expenses that apply at the separate account level or to related insurance products. Inclusion of these charges would reduce the total return figures for all periods shown. |
The accompanying notes are an integral part of the financial statements.
163
MML Series Investment Fund – Financial Statements (Continued) |
Financial Highlights (For a share outstanding throughout each period) |
MML Income & Growth Fund
| | | Income (loss) from investment
operations | Less distributions to shareholders | | | Ratios / Supplemental Data |
| | Net
asset
value,
beginning
of the
period | Net
investment
income
(loss)c | Net
realized
and
unrealized
gain (loss)
on
investments | Total
income
(loss) from
investment
operations | From net
investment
income | From net
realized
gains | Total
distributions | Net
asset
value,
end of
the
period | Total
returnm | Net
assets,
end of
the
period
(000’s) | Ratio of
expenses
to average
daily net
assets | Net
investment
income
(loss) to
average
daily net
assets |
Initial Class | | | | | | | | | | | |
6/30/22r | $ 12.41 | $ 0.10 | $ (1.09) | $ (0.99) | $ — | $ — | $ — | $ 11.42 | (7.98%)b | $ 192,305 | 0.69%a | 1.57%a |
12/31/21 | 10.00 | 0.15 | 2.47 | 2.62 | (0.21) | — | (0.21) | 12.41 | 26.27% | 221,734 | 0.69% | 1.29% |
12/31/20 | 9.94 | 0.15 | 0.12aa | 0.27 | (0.18) | (0.03) | (0.21) | 10.00 | 3.03% | 241,441 | 0.70% | 1.75% |
12/31/19 | 8.49 | 0.19 | 1.82 | 2.01 | (0.19) | (0.37) | (0.56) | 9.94 | 24.43% | 274,290 | 0.69% | 2.00% |
12/31/18 | 12.72 | 0.21 | (1.25) | (1.04) | (0.22) | (2.97) | (3.19) | 8.49 | (11.68%) | 240,456 | 0.70% | 1.86% |
12/31/17 | 11.86 | 0.22 | 1.74 | 1.96 | (0.21) | (0.89) | (1.10) | 12.72 | 17.43% | 289,310 | 0.70% | 1.80% |
Service Class | | | | | | | | | | | |
6/30/22r | $ 12.20 | $ 0.08 | $ (1.06) | $ (0.98) | $ — | $ — | $ — | $ 11.22 | (8.03%)b | $ 27,848 | 0.94%a | 1.32%a |
12/31/21 | 9.84 | 0.12 | 2.43 | 2.55 | (0.19) | — | (0.19) | 12.20 | 25.94% | 31,557 | 0.94% | 1.07% |
12/31/20 | 9.78 | 0.13 | 0.11aa | 0.24 | (0.15) | (0.03) | (0.18) | 9.84 | 2.79% | 26,998 | 0.95% | 1.50% |
12/31/19 | 8.36 | 0.16 | 1.80 | 1.96 | (0.17) | (0.37) | (0.54) | 9.78 | 24.14% | 29,436 | 0.94% | 1.75% |
12/31/18 | 12.58 | 0.18 | (1.23) | (1.05) | (0.20) | (2.97) | (3.17) | 8.36 | (11.94%) | 24,440 | 0.95% | 1.62% |
12/31/17 | 11.74 | 0.19 | 1.73 | 1.92 | (0.19) | (0.89) | (1.08) | 12.58 | 17.21% | 27,683 | 0.95% | 1.55% |
| | | Year ended December 31 |
| | Six months ended
June 30, 2022b,r | 2021 | 2020 | 2019 | 2018 | 2017 |
Portfolio turnover rate | 16% | 28% | 49% | 43% | 30% | 110% |
b | Percentage represents the results for the period and is not annualized. |
c | Per share amount calculated on the average shares method. |
m | Total return does not reflect expenses that apply at the separate account level or to related insurance products. Inclusion of these charges would reduce the total return figures for all periods shown. |
aa | The amount shown for a share outstanding does not correspond with the aggregate net realized and unrealized gain (loss) for the period due to the timing of purchases and redemptions of Fund shares in relation to the fluctuating market values of the Fund. |
The accompanying notes are an integral part of the financial statements.
164
MML Series Investment Fund – Financial Statements (Continued) |
Financial Highlights (For a share outstanding throughout each period) |
MML International Equity Fund
| | | Income (loss) from investment
operations | Less distributions to shareholders | | | Ratios / Supplemental Data |
| | Net
asset
value,
beginning
of the
period | Net
investment
income
(loss)c,j | Net
realized
and
unrealized
gain (loss)
on
investments | Total
income
(loss) from
investment
operations | From net
investment
income | From net
realized
gains | Total
distributions | Net
asset
value,
end of
the
period | Total
returnm | Net
assets,
end of
the
period
(000’s) | Ratio of
expenses
to average
daily net
assets
before
expense
waivers | Ratio of
expenses
to average
daily net
assets
after
expense
waiversj | Net
investment
income
(loss) to
average
daily net
assets |
Class II | | | | | | | | | | | | |
6/30/22r | $ 11.08 | $ 0.13 | $ (2.28) | $ (2.15) | $ — | $ — | $ — | $ 8.93 | (19.40%)b | $ 198,593 | 1.05%a | 0.95%a | 2.56%a |
12/31/21 | 9.98 | 0.14 | 1.03 | 1.17 | (0.07) | — | (0.07) | 11.08 | 11.77% | 249,038 | 1.05% | 0.97% | 1.32% |
12/31/20 | 10.10 | 0.03 | 0.38 | 0.41 | (0.28) | (0.25) | (0.53) | 9.98 | 5.37% | 159,694 | 1.07% | 1.00% | 0.39% |
12/31/19 | 8.91 | 0.29 | 1.74 | 2.03 | (0.19) | (0.65) | (0.84) | 10.10 | 24.63% | 178,397 | 1.05% | 1.00% | 3.02% |
12/31/18 | 11.97 | 0.21 | (3.02) | (2.81) | (0.17) | (0.08) | (0.25) | 8.91 | (23.79%) | 154,540 | 1.12% | 1.00% | 1.91% |
12/31/17 | 9.33 | 0.18 | 2.64 | 2.82 | (0.18) | — | (0.18) | 11.97 | 30.35% | 187,213 | 1.09% | 1.00% | 1.62% |
Service Class I | | | | | | | | | | | | |
6/30/22r | $ 10.96 | $ 0.12 | $ (2.26) | $ (2.14) | $ — | $ — | $ — | $ 8.82 | (19.53%)b | $ 6,713 | 1.30%a | 1.20%a | 2.34%a |
12/31/21 | 9.88 | 0.12 | 1.02 | 1.14 | (0.06) | — | (0.06) | 10.96 | 11.49% | 8,452 | 1.29% | 1.22% | 1.09% |
12/31/20 | 10.01 | 0.01 | 0.37 | 0.38 | (0.26) | (0.25) | (0.51) | 9.88 | 5.07% | 7,021 | 1.32% | 1.25% | 0.10% |
12/31/19 | 8.84 | 0.26 | 1.73 | 1.99 | (0.17) | (0.65) | (0.82) | 10.01 | 24.35% | 6,821 | 1.30% | 1.25% | 2.70% |
12/31/18 | 11.90 | 0.18 | (2.99) | (2.81) | (0.17) | (0.08) | (0.25) | 8.84 | (23.98%) | 4,767 | 1.37% | 1.25% | 1.64% |
12/31/17 | 9.29 | 0.11 | 2.67 | 2.78 | (0.17) | — | (0.17) | 11.90 | 30.05% | 4,000 | 1.34% | 1.25% | 0.95% |
| | | Year ended December 31 |
| | Six months ended
June 30, 2022b,r | 2021 | 2020 | 2019 | 2018 | 2017 |
Portfolio turnover rate | 10% | 75% | 49% | 37% | 43% | 45% |
b | Percentage represents the results for the period and is not annualized. |
c | Per share amount calculated on the average shares method. |
j | Computed after giving effect to an agreement by MML Advisers to waive certain fees and expenses of the Fund. |
m | Total return does not reflect expenses that apply at the separate account level or to related insurance products. Inclusion of these charges would reduce the total return figures for all periods shown. |
The accompanying notes are an integral part of the financial statements.
165
MML Series Investment Fund – Financial Statements (Continued) |
Financial Highlights (For a share outstanding throughout each period) |
MML Large Cap Growth Fund
| | | Income (loss) from investment
operations | Less distributions to shareholders | | | Ratios / Supplemental Data |
| | Net
asset
value,
beginning
of the
period | Net
investment
income
(loss)c | Net
realized
and
unrealized
gain (loss)
on
investments | Total
income
(loss) from
investment
operations | From net
investment
income | From net
realized
gains | Total
distributions | Net
asset
value,
end of
the
period | Total
returnm | Net
assets,
end of
the
period
(000’s) | Ratio of
expenses
to average
daily net
assets | Net
investment
income
(loss) to
average
daily net
assets |
Initial Class | | | | | | | | | | | |
6/30/22r | $ 15.04 | $ 0.00d | $ (4.32) | $ (4.32) | $ — | $ — | $ — | $ 10.72 | (28.72%)b | $ 138,669 | 0.70%a | 0.07%a |
12/31/21 | 13.98 | (0.01) | 2.59 | 2.58 | (0.01) | (1.51) | (1.52) | 15.04 | 18.41% | 196,928 | 0.70% | (0.10%) |
12/31/20 | 11.09 | 0.01 | 3.49 | 3.50 | (0.04) | (0.57) | (0.61) | 13.98 | 31.78% | 120,464 | 0.72% | 0.10% |
12/31/19 | 9.68 | 0.05 | 2.89 | 2.94 | (0.07) | (1.46) | (1.53) | 11.09 | 31.99% | 95,272 | 0.74% | 0.45% |
12/31/18 | 10.69 | 0.06 | (0.19) | (0.13) | (0.07) | (0.81) | (0.88) | 9.68 | (2.26%) | 83,211 | 0.72% | 0.56% |
12/31/17 | 10.63 | 0.07 | 3.23 | 3.30 | (0.05) | (3.19) | (3.24) | 10.69 | 33.51% | 106,989 | 0.73% | 0.58% |
Service Class | | | | | | | | | | | |
6/30/22r | $ 14.33 | $ (0.01)bb | $ (4.12) | $ (4.13) | $ — | $ — | $ — | $ 10.20 | (28.82%)b | $ 18,108 | 0.95%a | (0.18%)a |
12/31/21 | 13.41 | (0.05) | 2.48 | 2.43 | — | (1.51) | (1.51) | 14.33 | 18.08% | 25,902 | 0.95% | (0.33%) |
12/31/20 | 10.66 | (0.02)bb | 3.36 | 3.34 | (0.02) | (0.57) | (0.59) | 13.41 | 31.53% | 22,226 | 0.97% | (0.15%) |
12/31/19 | 9.36 | 0.02 | 2.79 | 2.81 | (0.05) | (1.46) | (1.51) | 10.66 | 31.66% | 16,394 | 0.99% | 0.19% |
12/31/18 | 10.37 | 0.03 | (0.17) | (0.14) | (0.06) | (0.81) | (0.87) | 9.36 | (2.46%) | 10,591 | 0.97% | 0.30% |
12/31/17 | 10.41 | 0.03 | 3.15 | 3.18 | (0.03) | (3.19) | (3.22) | 10.37 | 33.00% | 7,510 | 0.98% | 0.29% |
| | | Year ended December 31 |
| | Six months ended
June 30, 2022b,r | 2021 | 2020 | 2019 | 2018 | 2017 |
Portfolio turnover rate | 18% | 21% | 32% | 11% | 16% | 3% |
b | Percentage represents the results for the period and is not annualized. |
c | Per share amount calculated on the average shares method. |
d | Amount is less than $0.005 per share. |
m | Total return does not reflect expenses that apply at the separate account level or to related insurance products. Inclusion of these charges would reduce the total return figures for all periods shown. |
bb | The amount shown for a share outstanding does not correspond with the aggregate net investment income (loss) as shown on the Statement of Operations for the period due to the timing of class-specific expenses. See Note 3 for each fund’s expense structure. |
The accompanying notes are an integral part of the financial statements.
166
MML Series Investment Fund – Financial Statements (Continued) |
Financial Highlights (For a share outstanding throughout each period) |
MML Managed Volatility Fund
| | | Income (loss) from investment
operations | Less distributions to shareholders | | | Ratios / Supplemental Data |
| | Net
asset
value,
beginning
of the
period | Net
investment
income
(loss)c | Net
realized
and
unrealized
gain (loss)
on
investments | Total
income
(loss) from
investment
operations | From net
investment
income | From net
realized
gains | Total
distributions | Net
asset
value,
end of
the
period | Total
returnm | Net
assets,
end of
the
period
(000’s) | Ratio of
expenses
to average
daily net
assets | Net
investment
income
(loss) to
average
daily net
assets |
Initial Class | | | | | | | | | | | |
6/30/22r | $ 15.23 | $ 0.04 | $ (1.92) | $ (1.88) | $ — | $ — | $ — | $ 13.35 | (12.33%)b | $ 89,004 | 1.00%a | 0.52%a |
12/31/21 | 13.78 | 0.06 | 1.53 | 1.59 | (0.14) | — | (0.14) | 15.23 | 11.54% | 114,646 | 0.99% | 0.39% |
12/31/20 | 13.10 | 0.10 | 0.76 | 0.86 | (0.18) | — | (0.18) | 13.78 | 6.68% | 116,694 | 1.06% | 0.78% |
12/31/19 | 11.90 | 0.13 | 1.28 | 1.41 | (0.21) | — | (0.21) | 13.10 | 11.90% | 124,549 | 0.97% | 1.05% |
12/31/18 | 12.63 | 0.12 | (0.69) | (0.57) | (0.16) | — | (0.16) | 11.90 | (4.69%) | 121,635 | 0.96% | 0.99% |
12/31/17 | 11.74 | 0.14 | 0.91 | 1.05 | (0.16) | — | (0.16) | 12.63 | 9.03% | 150,737 | 0.90% | 1.13% |
Service Class | | | | | | | | | | | |
6/30/22r | $ 15.10 | $ 0.02 | $ (1.90) | $ (1.88) | $ — | $ — | $ — | $ 13.22 | (12.44%)b | $ 21,261 | 1.25%a | 0.27%a |
12/31/21 | 13.67 | 0.02 | 1.52 | 1.54 | (0.11) | — | (0.11) | 15.10 | 11.26% | 25,982 | 1.24% | 0.14% |
12/31/20 | 12.99 | 0.07 | 0.76 | 0.83 | (0.15) | — | (0.15) | 13.67 | 6.42% | 26,901 | 1.31% | 0.53% |
12/31/19 | 11.80 | 0.10 | 1.26 | 1.36 | (0.17) | — | (0.17) | 12.99 | 11.62% | 30,588 | 1.22% | 0.81% |
12/31/18 | 12.53 | 0.09 | (0.70) | (0.61) | (0.12) | — | (0.12) | 11.80 | (4.93%) | 28,963 | 1.21% | 0.74% |
12/31/17 | 11.64 | 0.11 | 0.91 | 1.02 | (0.13) | — | (0.13) | 12.53 | 8.76% | 33,698 | 1.15% | 0.88% |
| | | Year ended December 31 |
| | Six months ended
June 30, 2022b,r | 2021 | 2020 | 2019 | 2018 | 2017 |
Portfolio turnover rate | 5% | 5% | 20% | 2% | 5% | 2% |
b | Percentage represents the results for the period and is not annualized. |
c | Per share amount calculated on the average shares method. |
m | Total return does not reflect expenses that apply at the separate account level or to related insurance products. Inclusion of these charges would reduce the total return figures for all periods shown. |
The accompanying notes are an integral part of the financial statements.
167
MML Series Investment Fund – Financial Statements (Continued) |
Financial Highlights (For a share outstanding throughout each period) |
MML Mid Cap Growth Fund
| | | Income (loss) from investment
operations | Less distributions to shareholders | | | Ratios / Supplemental Data |
| | Net
asset
value,
beginning
of the
period | Net
investment
income
(loss)c | Net
realized
and
unrealized
gain (loss)
on
investments | Total
income
(loss) from
investment
operations | From net
investment
income | From net
realized
gains | Total
distributions | Net
asset
value,
end of
the
period | Total
returnm | Net
assets,
end of
the
period
(000’s) | Ratio of
expenses
to average
daily net
assets | Net
investment
income
(loss) to
average
daily net
assets |
Initial Class | | | | | | | | | | | |
6/30/22r | $ 16.52 | $ (0.02) | $ (4.59) | $ (4.61) | $ — | $ — | $ — | $ 11.91 | (27.91%)b | $ 235,836 | 0.82%a | (0.30%)a |
12/31/21 | 18.10 | (0.07) | 2.48 | 2.41 | — | (3.99) | (3.99) | 16.52 | 13.21% | 343,781 | 0.80% | (0.38%) |
12/31/20 | 15.88 | (0.03) | 3.83 | 3.80 | (0.01) | (1.57) | (1.58) | 18.10 | 25.57% | 434,830 | 0.81% | (0.19%) |
12/31/19 | 13.94 | 0.02 | 4.17 | 4.19 | (0.00)d | (2.25) | (2.25) | 15.88 | 31.30% | 407,351 | 0.81% | 0.12% |
12/31/18 | 16.19 | 0.01 | (0.07) | (0.06) | — | (2.19) | (2.19) | 13.94 | (2.17%) | 328,715 | 0.81% | 0.07% |
12/31/17 | 14.35 | (0.01) | 3.45 | 3.44 | (0.01) | (1.59) | (1.60) | 16.19 | 24.81% | 382,666 | 0.81% | (0.08%) |
Service Class | | | | | | | | | | | |
6/30/22r | $ 15.34 | $ (0.03) | $ (4.27) | $ (4.30) | $ — | $ — | $ — | $ 11.04 | (28.03%)b | $ 82,661 | 1.07%a | (0.55%)a |
12/31/21 | 17.09 | (0.11) | 2.35 | 2.24 | — | (3.99) | (3.99) | 15.34 | 12.99% | 118,139 | 1.05% | (0.63%) |
12/31/20 | 15.10 | (0.06) | 3.62 | 3.56 | — | (1.57) | (1.57) | 17.09 | 25.25% | 117,808 | 1.06% | (0.44%) |
12/31/19 | 13.37 | (0.02) | 4.00 | 3.98 | — | (2.25) | (2.25) | 15.10 | 31.01% | 108,793 | 1.06% | (0.13%) |
12/31/18 | 15.65 | (0.03) | (0.06) | (0.09) | — | (2.19) | (2.19) | 13.37 | (2.45%) | 88,952 | 1.06% | (0.18%) |
12/31/17 | 13.95 | (0.05) | 3.34 | 3.29 | — | (1.59) | (1.59) | 15.65 | 24.47% | 91,145 | 1.06% | (0.33%) |
| | | Year ended December 31 |
| | Six months ended
June 30, 2022b,r | 2021 | 2020 | 2019 | 2018 | 2017 |
Portfolio turnover rate | 16% | 33% | 66% | 28% | 26% | 28% |
b | Percentage represents the results for the period and is not annualized. |
c | Per share amount calculated on the average shares method. |
d | Amount is less than $0.005 per share. |
m | Total return does not reflect expenses that apply at the separate account level or to related insurance products. Inclusion of these charges would reduce the total return figures for all periods shown. |
The accompanying notes are an integral part of the financial statements.
168
MML Series Investment Fund – Financial Statements (Continued) |
Financial Highlights (For a share outstanding throughout each period) |
MML Mid Cap Value Fund
| | | Income (loss) from investment
operations | Less distributions to shareholders | | | Ratios / Supplemental Data |
| | Net
asset
value,
beginning
of the
period | Net
investment
income
(loss)c | Net
realized
and
unrealized
gain (loss)
on
investments | Total
income
(loss) from
investment
operations | From net
investment
income | From net
realized
gains | Total
distributions | Net
asset
value,
end of
the
period | Total
returnm | Net
assets,
end of
the
period
(000’s) | Ratio of
expenses
to average
daily net
assets | Net
investment
income
(loss) to
average
daily net
assets |
Initial Class | | | | | | | | | | | |
6/30/22r | $ 12.58 | $ 0.11 | $ (1.12) | $ (1.01) | $ — | $ — | $ — | $ 11.57 | (8.03%)b | $ 245,861 | 0.88%a | 1.73%a |
12/31/21 | 10.59 | 0.17 | 2.28 | 2.45 | (0.18) | (0.28) | (0.46) | 12.58 | 23.31% | 295,384 | 0.88% | 1.39% |
12/31/20 | 10.60 | 0.15 | 0.01 | 0.16 | (0.17) | — | (0.17) | 10.59 | 1.71% | 348,614 | 0.89% | 1.62% |
12/31/19 | 9.35 | 0.17 | 2.37 | 2.54 | (0.18) | (1.11) | (1.29) | 10.60 | 29.13% | 389,141 | 0.88% | 1.65% |
12/31/18 | 12.14 | 0.15 | (1.48) | (1.33) | (0.19) | (1.27) | (1.46) | 9.35 | (12.99%) | 343,432 | 0.88% | 1.30% |
12/31/17 | 11.79 | 0.20 | 1.09 | 1.29 | (0.19) | (0.75) | (0.94) | 12.14 | 11.70% | 438,601 | 0.88% | 1.69% |
Service Class | | | | | | | | | | | |
6/30/22r | $ 12.31 | $ 0.09 | $ (1.09) | $ (1.00) | $ — | $ — | $ — | $ 11.31 | (8.12%)b | $ 49,487 | 1.14%a | 1.49%a |
12/31/21 | 10.38 | 0.14 | 2.22 | 2.36 | (0.15) | (0.28) | (0.43) | 12.31 | 22.95% | 55,704 | 1.13% | 1.16% |
12/31/20 | 10.39 | 0.13 | 0.00d | 0.13 | (0.14) | — | (0.14) | 10.38 | 1.48% | 51,269 | 1.14% | 1.37% |
12/31/19 | 9.18 | 0.14 | 2.33 | 2.47 | (0.15) | (1.11) | (1.26) | 10.39 | 28.90% | 53,223 | 1.13% | 1.40% |
12/31/18 | 11.96 | 0.12 | (1.47) | (1.35) | (0.16) | (1.27) | (1.43) | 9.18 | (13.31%) | 43,275 | 1.13% | 1.06% |
12/31/17 | 11.63 | 0.17 | 1.08 | 1.25 | (0.17) | (0.75) | (0.92) | 11.96 | 11.46% | 49,723 | 1.13% | 1.46% |
| | | Year ended December 31 |
| | Six months ended
June 30, 2022b,r | 2021 | 2020 | 2019 | 2018 | 2017 |
Portfolio turnover rate | 40% | 46% | 74% | 39% | 59% | 42% |
b | Percentage represents the results for the period and is not annualized. |
c | Per share amount calculated on the average shares method. |
d | Amount is less than $0.005 per share. |
m | Total return does not reflect expenses that apply at the separate account level or to related insurance products. Inclusion of these charges would reduce the total return figures for all periods shown. |
The accompanying notes are an integral part of the financial statements.
169
MML Series Investment Fund – Financial Statements (Continued) |
Financial Highlights (For a share outstanding throughout each period) |
MML Small Cap Growth Equity Fund
| | | Income (loss) from investment
operations | Less distributions
to shareholders | | | Ratios / Supplemental Data |
| | Net
asset
value,
beginning
of the
period | Net
investment
income
(loss)c,j | Net
realized
and
unrealized
gain (loss)
on
investments | Total
income
(loss) from
investment
operations | From net
realized
gains | Total
distributions | Net
asset
value,
end of
the
period | Total
returnm | Net
assets,
end of
the
period
(000’s) | Ratio of
expenses
to average
daily net
assets
before
expense
waivers | Ratio of
expenses
to average
daily net
assets
after
expense
waiversj | Net
investment
income
(loss) to
average
daily net
assets |
Initial Class | | | | | | | | | | | |
6/30/22r | $ 15.26 | $ (0.01) | $ (3.99) | $ (4.00) | $ — | $ — | $ 11.26 | (26.18%)b | $ 120,156 | 1.11%a | 1.08%a | (0.10%)a |
12/31/21 | 16.86 | (0.09) | 1.31 | 1.22 | (2.82) | (2.82) | 15.26 | 7.31% | 165,781 | 1.10% | 1.07% | (0.50%) |
12/31/20 | 14.13 | (0.04) | 4.55 | 4.51 | (1.78) | (1.78) | 16.86 | 35.62% | 180,047 | 1.11% | 1.08% | (0.27%) |
12/31/19 | 12.82 | (0.01) | 4.11 | 4.10 | (2.79) | (2.79) | 14.13 | 34.32% | 170,426 | 1.11% | 1.09% | (0.06%) |
12/31/18 | 14.98 | (0.03) | (0.32) | (0.35) | (1.81) | (1.81) | 12.82 | (4.87%) | 151,854 | 1.09% | 1.07% | (0.17%) |
12/31/17 | 12.69 | (0.03) | 2.87 | 2.84 | (0.55) | (0.55) | 14.98 | 22.81% | 198,404 | 1.09% | 1.09%k | (0.21%) |
Service Class | | | | | | | | | | | |
6/30/22r | $ 13.73 | $ (0.02) | $ (3.59) | $ (3.61) | $ — | $ — | $ 10.12 | (26.27%)b | $ 23,120 | 1.36%a | 1.33%a | (0.35%)a |
12/31/21 | 15.48 | (0.11) | 1.18 | 1.07 | (2.82) | (2.82) | 13.73 | 7.04% | 32,665 | 1.35% | 1.32% | (0.75%) |
12/31/20 | 13.14 | (0.06) | 4.18 | 4.12 | (1.78) | (1.78) | 15.48 | 35.29% | 31,165 | 1.36% | 1.33% | (0.52%) |
12/31/19 | 12.11 | (0.04) | 3.86 | 3.82 | (2.79) | (2.79) | 13.14 | 33.99% | 26,026 | 1.36% | 1.34% | (0.30%) |
12/31/18 | 14.27 | (0.06) | (0.29) | (0.35) | (1.81) | (1.81) | 12.11 | (5.11%) | 19,281 | 1.34% | 1.32% | (0.39%) |
12/31/17 | 12.14 | (0.06) | 2.74 | 2.68 | (0.55) | (0.55) | 14.27 | 22.51% | 16,124 | 1.35% | 1.34% | (0.45%) |
| | | Year ended December 31 |
| | Six months ended
June 30, 2022b,r | 2021 | 2020 | 2019 | 2018 | 2017 |
Portfolio turnover rate | 38% | 73% | 79% | 63% | 76% | 74% |
b | Percentage represents the results for the period and is not annualized. |
c | Per share amount calculated on the average shares method. |
j | Computed after giving effect to an agreement by MML Advisers to waive certain fees and expenses of the Fund. |
k | Amount waived had no impact on the ratio of expenses to average daily net assets. |
m | Total return does not reflect expenses that apply at the separate account level or to related insurance products. Inclusion of these charges would reduce the total return figures for all periods shown. |
The accompanying notes are an integral part of the financial statements.
170
MML Series Investment Fund – Financial Statements (Continued) |
Financial Highlights (For a share outstanding throughout each period) |
MML Small Company Value Fund
| | | Income (loss) from investment
operations | Less distributions to shareholders | | | Ratios / Supplemental Data |
| | Net
asset
value,
beginning
of the
period | Net
investment
income
(loss)c,j | Net
realized
and
unrealized
gain (loss)
on
investments | Total
income
(loss) from
investment
operations | From net
investment
income | From net
realized
gains | Total
distributions | Net
asset
value,
end of
the
period | Total
returnm | Net
assets,
end of
the
period
(000’s) | Ratio of
expenses
to average
daily net
assets
before
expense
waivers | Ratio of
expenses
to average
daily net
assets
after
expense
waiversj | Net
investment
income
(loss) to
average
daily net
assets |
Class II | | | | | | | | | | | | |
6/30/22r | $ 17.91 | $ 0.07 | $ (3.04) | $ (2.97) | $ — | $ — | $ — | $ 14.94 | (16.58%)b | $ 53,115 | 1.05%a | 0.90%a | 0.87%a |
12/31/21 | 15.25 | 0.03 | 3.77 | 3.80 | (0.06) | (1.08) | (1.14) | 17.91 | 25.47% | 67,627 | 1.05% | 0.98% | 0.16% |
12/31/20 | 14.75 | 0.04 | 1.15 | 1.19 | (0.03) | (0.66) | (0.69) | 15.25 | 9.16% | 65,955 | 1.06% | 1.01% | 0.33% |
12/31/19 | 13.86 | 0.04 | 3.20 | 3.24 | (0.04) | (2.31) | (2.35) | 14.75 | 25.54% | 74,855 | 1.06% | 1.01% | 0.25% |
12/31/18 | 16.90 | 0.05 | (2.01) | (1.96) | (0.06) | (1.02) | (1.08) | 13.86 | (12.94%) | 66,976 | 1.02% | 0.97% | 0.30% |
12/31/17 | 17.23 | 0.05 | 1.73 | 1.78 | (0.10) | (2.01) | (2.11) | 16.90 | 11.69% | 89,256 | 1.02% | 0.97% | 0.30% |
Service Class I | | | | | | | | | | | | |
6/30/22r | $ 17.15 | $ 0.05 | $ (2.91) | $ (2.86) | $ — | $ — | $ — | $ 14.29 | (16.68%)b | $ 25,130 | 1.30%a | 1.15%a | 0.63%a |
12/31/21 | 14.66 | (0.01)bb | 3.61 | 3.60 | (0.03) | (1.08) | (1.11) | 17.15 | 25.12% | 30,943 | 1.30% | 1.23% | (0.08%) |
12/31/20 | 14.21 | 0.01 | 1.11 | 1.12 | (0.01) | (0.66) | (0.67) | 14.66 | 8.92% | 26,467 | 1.31% | 1.26% | 0.07% |
12/31/19 | 13.43 | 0.00d | 3.10 | 3.10 | (0.01) | (2.31) | (2.32) | 14.21 | 25.26% | 25,636 | 1.31% | 1.26% | 0.01% |
12/31/18 | 16.43 | 0.01 | (1.96) | (1.95) | (0.03) | (1.02) | (1.05) | 13.43 | (13.19%) | 19,861 | 1.27% | 1.22% | 0.06% |
12/31/17 | 16.83 | 0.01 | 1.68 | 1.69 | (0.08) | (2.01) | (2.09) | 16.43 | 11.42% | 20,671 | 1.27% | 1.22% | 0.06% |
| | | Year ended December 31 |
| | Six months ended
June 30, 2022b,r | 2021 | 2020 | 2019 | 2018 | 2017 |
Portfolio turnover rate | 23% | 127% | 29% | 24% | 22% | 14% |
b | Percentage represents the results for the period and is not annualized. |
c | Per share amount calculated on the average shares method. |
d | Amount is less than $0.005 per share. |
j | Computed after giving effect to an agreement by MML Advisers to waive certain fees and expenses of the Fund. |
m | Total return does not reflect expenses that apply at the separate account level or to related insurance products. Inclusion of these charges would reduce the total return figures for all periods shown. |
bb | The amount shown for a share outstanding does not correspond with the aggregate net investment income (loss) as shown on the Statement of Operations for the period due to the timing of class-specific expenses. See Note 3 for each fund’s expense structure. |
The accompanying notes are an integral part of the financial statements.
171
MML Series Investment Fund – Financial Statements (Continued) |
Financial Highlights (For a share outstanding throughout each period) |
MML Small/Mid Cap Value Fund
| | | Income (loss) from investment
operations | Less distributions to shareholders | | | Ratios / Supplemental Data |
| | Net
asset
value,
beginning
of the
period | Net
investment
income
(loss)c | Net
realized
and
unrealized
gain (loss)
on
investments | Total
income
(loss) from
investment
operations | From net
investment
income | From net
realized
gains | Total
distributions | Net
asset
value,
end of
the
period | Total
returnm | Net
assets,
end of
the
period
(000’s) | Ratio of
expenses
to average
daily net
assets | Net
investment
income
(loss) to
average
daily net
assets |
Initial Class | | | | | | | | | | | |
6/30/22r | $ 14.72 | $ 0.06 | $ (2.97) | $ (2.91) | $ — | $ — | $ — | $ 11.81 | (19.77%)b | $ 111,835 | 0.81%a | 0.92%a |
12/31/21 | 10.94 | 0.13 | 3.79 | 3.92 | (0.14) | — | (0.14) | 14.72 | 35.94% | 149,280 | 0.81% | 0.99% |
12/31/20 | 11.06 | 0.09 | 0.30 | 0.39 | (0.10) | (0.41) | (0.51) | 10.94 | 4.65% | 164,145 | 0.81% | 0.98% |
12/31/19 | 10.61 | 0.12 | 1.83 | 1.95 | (0.07) | (1.43) | (1.50) | 11.06 | 20.39% | 179,503 | 0.81% | 1.04% |
12/31/18 | 13.99 | 0.09 | (1.87) | (1.78) | (0.07) | (1.53) | (1.60) | 10.61 | (15.00%) | 163,607 | 0.80% | 0.63% |
12/31/17 | 13.23 | 0.06 | 1.60 | 1.66 | (0.07) | (0.83) | (0.90) | 13.99 | 13.44% | 210,030 | 0.80% | 0.47% |
Service Class | | | | | | | | | | | |
6/30/22r | $ 14.51 | $ 0.04 | $ (2.92) | $ (2.88) | $ — | $ — | $ — | $ 11.63 | (19.85%)b | $ 23,212 | 1.06%a | 0.68%a |
12/31/21 | 10.79 | 0.10 | 3.74 | 3.84 | (0.12) | — | (0.12) | 14.51 | 35.64% | 29,951 | 1.06% | 0.77% |
12/31/20 | 10.92 | 0.07 | 0.28 | 0.35 | (0.07) | (0.41) | (0.48) | 10.79 | 4.32% | 22,302 | 1.06% | 0.73% |
12/31/19 | 10.50 | 0.09 | 1.80 | 1.89 | (0.04) | (1.43) | (1.47) | 10.92 | 19.98% | 23,295 | 1.06% | 0.80% |
12/31/18 | 13.85 | 0.05 | (1.83) | (1.78) | (0.04) | (1.53) | (1.57) | 10.50 | (15.12%) | 19,189 | 1.05% | 0.39% |
12/31/17 | 13.12 | 0.03 | 1.57 | 1.60 | (0.04) | (0.83) | (0.87) | 13.85 | 13.08% | 22,386 | 1.05% | 0.23% |
| | | Year ended December 31 |
| | Six months ended
June 30, 2022b,r | 2021 | 2020 | 2019 | 2018 | 2017 |
Portfolio turnover rate | 23% | 50% | 60% | 35% | 38% | 34% |
b | Percentage represents the results for the period and is not annualized. |
c | Per share amount calculated on the average shares method. |
m | Total return does not reflect expenses that apply at the separate account level or to related insurance products. Inclusion of these charges would reduce the total return figures for all periods shown. |
The accompanying notes are an integral part of the financial statements.
172
MML Series Investment Fund – Financial Statements (Continued) |
Financial Highlights (For a share outstanding throughout each period) |
MML Sustainable Equity Fund
| | | Income (loss) from investment
operations | Less distributions to shareholders | | | Ratios / Supplemental Data |
| | Net
asset
value,
beginning
of the
period | Net
investment
income
(loss)c | Net
realized
and
unrealized
gain (loss)
on
investments | Total
income
(loss) from
investment
operations | From net
investment
income | From net
realized
gains | Total
distributions | Net
asset
value,
end of
the
period | Total
returnm | Net
assets,
end of
the
period
(000’s) | Ratio of
expenses
to average
daily net
assets | Net
investment
income
(loss) to
average
daily net
assets |
Initial Class | | | | | | | | | | | |
6/30/22r | $ 24.54 | $ 0.09 | $ (5.09) | $ (5.00) | $ — | $ — | $ — | $ 19.54 | (20.37%)b | $ 85,355 | 0.56%a | 0.81%a |
12/31/21 | 20.53 | 0.17 | 5.35 | 5.52 | (0.20) | (1.31) | (1.51) | 24.54 | 27.14% | 112,894 | 0.56% | 0.74% |
12/31/20 | 19.43 | 0.19 | 2.50 | 2.69 | (0.18) | (1.41) | (1.59) | 20.53 | 14.51% | 105,573 | 0.57% | 1.03% |
12/31/19 | 16.35 | 0.19 | 4.86 | 5.05 | (0.19) | (1.78) | (1.97) | 19.43 | 32.10% | 106,949 | 0.57% | 1.02% |
12/31/18 | 17.39 | 0.19 | (1.07) | (0.88) | (0.16) | — | (0.16) | 16.35 | (5.20%) | 92,893 | 0.56% | 1.07% |
12/31/17 | 14.19 | 0.16 | 3.19 | 3.35 | (0.15) | — | (0.15) | 17.39 | 23.70% | 111,830 | 0.56% | 1.02% |
Service Class | | | | | | | | | | | |
6/30/22r | $ 24.26 | $ 0.06 | $ (5.02) | $ (4.96) | $ — | $ — | $ — | $ 19.30 | (20.45%)b | $ 47,429 | 0.81%a | 0.56%a |
12/31/21 | 20.33 | 0.10 | 5.29 | 5.39 | (0.15) | (1.31) | (1.46) | 24.26 | 26.78% | 60,966 | 0.81% | 0.44% |
12/31/20 | 19.26 | 0.14 | 2.47 | 2.61 | (0.13) | (1.41) | (1.54) | 20.33 | 14.24% | 49,786 | 0.82% | 0.78% |
12/31/19 | 16.22 | 0.14 | 4.83 | 4.97 | (0.15) | (1.78) | (1.93) | 19.26 | 31.82% | 46,002 | 0.82% | 0.77% |
12/31/18 | 17.27 | 0.15 | (1.08) | (0.93) | (0.12) | — | (0.12) | 16.22 | (5.46%) | 33,821 | 0.81% | 0.83% |
12/31/17 | 14.10 | 0.12 | 3.17 | 3.29 | (0.12) | — | (0.12) | 17.27 | 23.41% | 30,610 | 0.81% | 0.77% |
| | | Year ended December 31 |
| | Six months ended
June 30, 2022b,r | 2021 | 2020 | 2019 | 2018 | 2017 |
Portfolio turnover rate | 68% | 12% | 17% | 16% | 15% | 12% |
b | Percentage represents the results for the period and is not annualized. |
c | Per share amount calculated on the average shares method. |
m | Total return does not reflect expenses that apply at the separate account level or to related insurance products. Inclusion of these charges would reduce the total return figures for all periods shown. |
The accompanying notes are an integral part of the financial statements.
173
MML Series Investment Fund – Financial Statements (Continued) |
Financial Highlights (For a share outstanding throughout each period) |
MML Total Return Bond Fund
| | | Income (loss) from investment
operations | Less distributions to shareholders | | | Ratios / Supplemental Data |
| | Net
asset
value,
beginning
of the
period | Net
investment
income
(loss)c,j | Net
realized
and
unrealized
gain (loss)
on
investments | Total
income
(loss) from
investment
operations | From net
investment
income | From net
realized
gains | Total
distributions | Net
asset
value,
end of
the
period | Total
returnm | Net
assets,
end of
the
period
(000’s) | Ratio of
expenses
to average
daily net
assets
before
expense
waivers | Ratio of
expenses
to average
daily net
assets
after
expense
waiversj | Net
investment
income
(loss) to
average
daily net
assets
(including
interest
expense) |
Class II | | | | | | | | | | | | |
6/30/22r | $ 10.47 | $ 0.09 | $ (1.29) | $ (1.20) | $ — | $ — | $ — | $ 9.27 | (11.46%)b | $ 273,037 | 0.62%a | N/A | 1.82%a |
12/31/21 | 11.28 | 0.12 | (0.25) | (0.13) | (0.20) | (0.48) | (0.68) | 10.47 | (1.19%) | 354,653 | 0.61% | N/A | 1.12% |
12/31/20 | 10.74 | 0.20 | 0.74 | 0.94 | (0.35) | (0.05) | (0.40) | 11.28 | 8.79% | 288,005 | 0.62% | 0.61% | 1.77% |
12/31/19 | 10.16 | 0.26 | 0.65 | 0.91 | (0.33) | — | (0.33) | 10.74 | 8.91% | 342,002 | 0.61% | 0.60% | 2.48% |
12/31/18 | 10.36 | 0.25 | (0.26) | (0.01) | (0.19) | — | (0.19) | 10.16 | (0.07%) | 353,571 | 0.60% | 0.60%l | 2.51% |
12/31/17 | 10.27 | 0.19 | 0.11 | 0.30 | (0.21) | — | (0.21) | 10.36 | 2.96% | 408,199 | 0.62% | 0.60% | 1.85% |
Service Class I | | | | | | | | | | | | |
6/30/22r | $ 10.32 | $ 0.08 | $ (1.28) | $ (1.20) | $ — | $ — | $ — | $ 9.12 | (11.63%)b | $ 40,653 | 0.87%a | N/A | 1.58%a |
12/31/21 | 11.14 | 0.09 | (0.25) | (0.16) | (0.18) | (0.48) | (0.66) | 10.32 | (1.51%) | 50,391 | 0.86% | N/A | 0.87% |
12/31/20 | 10.62 | 0.16 | 0.75 | 0.91 | (0.34) | (0.05) | (0.39) | 11.14 | 8.60% | 51,252 | 0.87% | 0.86% | 1.47% |
12/31/19 | 10.06 | 0.23 | 0.64 | 0.87 | (0.31) | — | (0.31) | 10.62 | 8.65% | 34,011 | 0.86% | 0.85% | 2.21% |
12/31/18 | 10.27 | 0.23 | (0.27) | (0.04) | (0.17) | — | (0.17) | 10.06 | (0.35%) | 25,533 | 0.85% | 0.85%l | 2.28% |
12/31/17 | 10.18 | 0.16 | 0.12 | 0.28 | (0.19) | — | (0.19) | 10.27 | 2.73% | 21,858 | 0.87% | 0.85% | 1.60% |
| | | Year ended December 31 |
| | Six months ended
June 30, 2022b,r | 2021 | 2020 | 2019 | 2018 | 2017 |
Portfolio turnover rate | 221% | 441% | 328% | 219% | 250% | 313% |
b | Percentage represents the results for the period and is not annualized. |
c | Per share amount calculated on the average shares method. |
j | Computed after giving effect to an agreement by MML Advisers to waive certain fees and expenses of the Fund. |
l | Expenses incurred during the period fell under the expense cap. |
m | Total return does not reflect expenses that apply at the separate account level or to related insurance products. Inclusion of these charges would reduce the total return figures for all periods shown. |
The accompanying notes are an integral part of the financial statements.
174
Notes to Financial Statements (Unaudited) |
1. The Funds
MML Series Investment Fund (the “Trust”) is registered under the Investment Company Act of 1940, as amended (the “1940 Act”), as an open-end management investment company. The Trust is organized under the laws of the Commonwealth of Massachusetts as a Massachusetts business trust pursuant to an Agreement and Declaration of Trust dated December 19, 1984, as restated May 14, 1993, and further amended and restated as of December 15, 2011, as it may be further amended from time to time. The Trust consists of the following series (each individually referred to as a “Fund” or collectively as the “Funds”):
MML Conservative Allocation Fund (“Conservative Allocation Fund”)
MML Balanced Allocation Fund (“Balanced Allocation Fund”)
MML Moderate Allocation Fund (“Moderate Allocation Fund”)
MML Growth Allocation Fund (“Growth Allocation Fund”)
MML Aggressive Allocation Fund (“Aggressive Allocation Fund”)
MML American Funds Growth Fund (“MML American Funds Growth Fund”)
MML American Funds International Fund (“MML American Funds International Fund”)
MML American Funds Core Allocation Fund (“MML American Funds Core Allocation Fund”)
MML Blue Chip Growth Fund (“Blue Chip Growth Fund”)
MML Equity Income Fund (“Equity Income Fund”)
MML Equity Index Fund (“Equity Index Fund”)
MML Focused Equity Fund (“Focused Equity Fund”)
MML Foreign Fund (“Foreign Fund”)
MML Fundamental Equity Fund (“Fundamental Equity Fund”)
MML Fundamental Value Fund (“Fundamental Value Fund”)
MML Global Fund (“Global Fund”)
MML Income & Growth Fund (“Income & Growth Fund”)
MML International Equity Fund (“International Equity Fund”)
MML Large Cap Growth Fund (“Large Cap Growth Fund”)
MML Managed Volatility Fund (“Managed Volatility Fund”)
MML Mid Cap Growth Fund (“Mid Cap Growth Fund”)
MML Mid Cap Value Fund (“Mid Cap Value Fund”)
MML Small Cap Growth Equity Fund (“Small Cap Growth Equity Fund”)
MML Small Company Value Fund (“Small Company Value Fund”)
MML Small/Mid Cap Value Fund (“Small/Mid Cap Value Fund”)
MML Sustainable Equity Fund (formerly known as MML Growth & Income Fund) (“Sustainable Equity Fund”)
MML Total Return Bond Fund (“Total Return Bond Fund”)
The Trust makes shares of the Funds available for the investment of assets of various separate investment accounts established by Massachusetts Mutual Life Insurance Company (“MassMutual”) and by life insurance companies which are subsidiaries of MassMutual. Shares of the Trust are not offered to the general public. MassMutual, MML Bay State Life Insurance Company, C.M. Life Insurance Company, and the Allocation Funds (as defined below), which are “funds of funds” series of the Trust, are the record owners of all of the outstanding shares of the Funds.
Each share class of a Fund represents an interest in the same portfolio of assets. The principal difference among the classes is the level of service and administration fees, and shareholder and distribution service expenses borne by the classes. Because each class will have different fees and expenses, performance and share prices will vary between the classes. The classes of shares are offered to different types of investors, as outlined in the Funds’ Prospectus.
The Conservative Allocation Fund, Balanced Allocation Fund, Moderate Allocation Fund, Growth Allocation Fund, and Aggressive Allocation Fund (the “Allocation Funds”) invest their investable assets in shares of series of the Trust and MML Series Investment Fund II advised by MML Investment Advisers, LLC (“MML Advisers”) and non-affiliated mutual funds (together, the “MML Underlying Funds”). The financial statements included herein are those of the Funds. The financial
175
Notes to Financial Statements (Unaudited) (Continued) |
statements of the applicable MML Underlying Funds that are not Funds of the Trust are presented separately and can be obtained from the Securities and Exchange Commission’s (“SEC”) EDGAR database on its website at http://www.sec.gov or by calling MML Advisers at 1-888-309-3539.
MML American Funds Growth Fund and MML American Funds International Fund (each a “Feeder Fund,” collectively the “Feeder Funds”) invest all of their assets in Class 1 shares of the Growth and International Funds, respectively, each a series of the American Funds Insurance Series (each a “Master Fund,” collectively the “Master Funds”). Each Master Fund is an open-end investment company and organized as a Massachusetts business trust. Each Feeder Fund has an investment objective that is consistent with its corresponding Master Fund. Each Master Fund intends to comply with the requirements under Subchapter M of the Internal Revenue Code of 1986, as amended (the “Code”), applicable to mutual funds and intends to distribute substantially all of its taxable income and capital gains to shareholders, which includes the applicable Feeder Fund, to qualify as a regulated investment company. The performance of the Feeder Funds is directly affected by the performance of the Master Funds. The financial statements of the Master Funds, including the Summary Investment Portfolios, are provided separately and should be read in conjunction with the Feeder Funds’ financial statements. As of June 30, 2022, the MML American Funds Growth Fund and MML American Funds International Fund owned 0.65% and 0.66% of the Growth and International Master Funds, respectively. The MML American Funds Core Allocation Fund invests all of its investable assets in shares of various series of American Funds Insurance Series, which are managed by Capital Research and Management Company (together, the “American Underlying Funds” and collectively with the MML Underlying Funds, the “Underlying Funds”). The SEC file number for the American Funds Insurance Series is 811-03857. Additional information related to the Master Funds’ and American Underlying Funds’ financial reports can be located on the SEC’s EDGAR database on its website at http://www.sec.gov.
2. Significant Accounting Policies
The following is a summary of significant accounting policies followed consistently by each Fund in the preparation of the financial statements in conformity with accounting principles generally accepted in the United States of America (“generally accepted accounting principles”). The preparation of the financial statements in accordance with generally accepted accounting principles requires management to make estimates and assumptions that affect the reported amounts and disclosures in the financial statements. Actual results could differ from those estimates.
Each Fund is an investment company and accordingly follows the investment company accounting and reporting guidance of the Financial Accounting Standards Board (“FASB”) Accounting Standards Codification Topic 946, Financial Services – Investment Companies.
Investment Valuation
The net asset value of each Fund’s shares is determined once daily as of the close of regular trading on the New York Stock Exchange (“NYSE”), on each day the NYSE is open for trading (a “business day”). The NYSE normally closes at 4:00 p.m. Eastern Time, but may close earlier on some days. If the NYSE is scheduled to close early, the business day will be considered to end as of the time of the NYSE’s scheduled close. A Fund will not treat an intraday disruption in NYSE trading or other event that causes an unscheduled closing of the NYSE as a close of business of the NYSE for these purposes and will instead fair value securities in accordance with procedures approved annually by the Board of Trustees (“Trustees”), and under the general oversight of the Trustees. On holidays and other days when the NYSE is closed, each Fund’s net asset value generally is not calculated and the Funds do not anticipate accepting buy or sell orders. However, the value of each Fund’s assets may still be affected on such days to the extent that a Fund or an Underlying Fund or Master Fund holds foreign securities that trade on days that foreign securities markets are open.
The net asset value of each of each of the Allocation Funds, Feeder Funds, and MML American Funds Core Allocation Fund is based upon the net asset value(s) of its corresponding Master Fund or Underlying Funds. Shares of the Master Fund and Underlying Funds are valued at their closing net asset values as reported on each business day.
176
Notes to Financial Statements (Unaudited) (Continued) |
The Prospectuses and Statements of Additional Information (“SAIs”) for the Underlying Funds and Master Funds, as applicable, explain the valuation methods for the Underlying Funds and Master Funds, including the circumstances under which the Underlying Funds or Master Funds, may use fair value pricing and the effects of doing so. Such Prospectuses and SAIs are available on the SEC’s EDGAR database on its website at http://www.sec.gov.
Equity securities and derivative contracts that are actively traded on a national securities exchange or contract market are valued on the basis of information furnished by a pricing service, which provides the last reported sale price, or, in the case of futures contracts, the settlement price, for securities or derivatives listed on the exchange or contract market or the official closing price on the NASDAQ National Market System (“NASDAQ System”), or in the case of over-the-counter (“OTC”) securities for which an official closing price is unavailable or not reported on the NASDAQ System, the last reported bid price. Portfolio securities traded on more than one national securities exchange are valued at the last price at the close of the exchange representing the principal market for such securities. Debt securities are valued on the basis of valuations furnished by a pricing service, which generally determines valuations taking into account factors such as institutional-size trading in similar securities, yield, quality, coupon rate, maturity, type of issue, trading characteristics, and other market data. Shares of other open-end mutual funds are valued at their closing net asset values as reported on each business day.
Investments for which market quotations are readily available are marked to market daily based on those quotations. Market quotations may be provided by third-party vendors or market makers, and may be determined on the basis of a variety of factors, such as broker quotations, financial modeling, and other market data, such as market indexes and yield curves, counterparty information, and foreign exchange rates. U.S. Government and agency securities may be valued on the basis of market quotations or using a model that may incorporate market observable data such as reported sales of similar securities, broker quotes, yields, bids, offers, quoted market prices, and reference data. The fair values of OTC derivative contracts, including forward, swap, and option contracts related to interest rates, foreign currencies, credit standing of reference entities, equity prices, or commodity prices, may be based on market quotations or may be modeled using a series of techniques, including simulation models, depending on the contract and the terms of the transaction. The fair values of asset-backed securities and mortgage-backed securities are estimated based on models that consider the estimated cash flows of each debt tranche of the issuer, established benchmark yield, and estimated tranche-specific spread to the benchmark yield based on the unique attributes of the tranche, including, but not limited to, prepayment speed assumptions and attributes of the collateral.
Investments for which market quotations are not available or for which a pricing service or vendor does not provide a value, or for which such market quotations or values are considered by the investment adviser or subadviser to be unreliable (including, for example, certain foreign securities, thinly-traded securities, certain restricted securities, certain initial public offerings, or securities whose values may have been affected by a significant event) are stated at fair valuations determined in good faith by the Funds’ Valuation Committee1 in accordance with procedures approved annually by the Trustees, and under the general oversight of the Trustees. The Funds’ Valuation Committee employs various methods to determine fair valuations including a regular review of significant inputs and assumptions and review of any related market activity. The Funds’ Valuation Committee reports to the Trustees at its regularly scheduled meetings. It is possible that fair value prices will be used by the Funds to a significant extent. The value determined for an investment using the Funds’ fair value procedures may differ from recent market prices for the investment and may be significantly different from the value realized upon the sale of such investment.
The Funds and certain Underlying Funds or Master Funds may invest in securities that are traded principally in foreign markets and that trade on weekends and other days when the Funds do not price their shares. As a result, the values of the Funds’ portfolio securities may change on days when the prices of the Funds’ shares are not calculated. The prices of the Funds’ shares will reflect any such changes when the prices of the Funds’ shares are next calculated, which is the next business day. The Funds may use fair value pricing more frequently for securities primarily traded in foreign markets because, among other things, most foreign markets close well before the Funds value their securities. The earlier close of these foreign markets gives rise to the possibility that significant events, including broad market moves, may have occurred in the interim. The Funds’ investments may be priced
1 | The voting members of the Valuation Committee consist of the President, Treasurer, Assistant Treasurers, Vice Presidents (except for the CCO, Secretary, and Assistant Secretaries) of the Trust, as well as such other members as the Trustees may from time to time designate. The non-voting members of the Valuation Committee consist of the CCO, Secretary, and Assistant Secretaries. The Valuation Committee reviews and determines the fair valuation of portfolio securities and the Funds’ pricing procedures in general. |
177
Notes to Financial Statements (Unaudited) (Continued) |
based on fair values provided by a third-party vendor, based on certain factors and methodologies applied by such vendor, in the event that there is movement in the U.S. market, between the close of the foreign market and the time the Funds calculate their net asset values. All assets and liabilities expressed in foreign currencies are converted into U.S. dollars at the mean between the buying and selling rates of such currencies against the U.S. dollar at the end of each business day.
For investments in equity or debt issued by privately held companies or funds (“Private Company” or collectively, the “Private Companies”) and any other investments fair valued using significant unobservable inputs, as described below, the fair valuation approaches used by third party service providers and/or the Funds’ subadvisers utilize one or a combination of, but not limited to, the following inputs:
Market approach: (i) recent market transactions, including subsequent rounds of financing, in the underlying investment or comparable issuers; (ii) recapitalizations and other transactions across the capital structure; and (iii) market multiples of comparable issuers.
Income approach: (i) future cash flows discounted to present value and adjusted as appropriate for liquidity, credit, and/or market risks; (ii) quoted prices for similar investments or assets in active markets; and (iii) other risk factors, such as interest rates, yield curves, volatilities, prepayment speeds, loss severities, credit risks, recovery rates, liquidation amounts, and/or default rates.
Cost approach: (i) audited or unaudited financial statements, investor communications, and financial or operational metrics issued by the Private Company; (ii) changes in the valuation of relevant indexes or publicly traded companies comparable to the Private Company; (iii) relevant news and other public sources; and (iv) known secondary market transactions in the Private Company’s interests and merger or acquisition activity in companies comparable to the Private Company.
Investments in series of preferred stock issued by Private Companies are typically valued utilizing Market approach in determining the enterprise value of the company. Such investments often contain rights and preferences that differ from other series of preferred and common stock of the same issuer. Valuation techniques such as the current value method (“CVM”), an option pricing model (“OPM”), a probability weighted expected return model (“PWERM”), or a hybrid of those techniques are used in allocating enterprise value of the company, as deemed appropriate under the circumstances. The CVM allocates value among the various parts of a company’s capital structure assuming that the value of convertible preferred stock is represented by the most favorable claim the preferred stockholders have on the enterprise value as of the valuation date. The use of OPM and PWERM techniques involve a determination of the exit scenarios of the investment in order to appropriately allocate the enterprise value of the company among the various parts of its capital structure.
The Private Companies are not subject to the public company disclosure, timing, and reporting standards as other investments held by a Fund. Typically, the most recently available information for a Private Company is as of a date that is earlier than the date a Fund is calculating its net asset value. This factor may result in a difference between the value of the investment and the price a Fund could receive upon the sale of the investment.
Fair value is defined as the price that would be received to sell an asset or paid to transfer a liability in an orderly transaction between market participants at the measurement date. A three-tier hierarchy is utilized to maximize the use of observable market data inputs and minimize the use of unobservable inputs and to establish classification of fair value measurements for disclosure purposes. Inputs refer broadly to the assumptions that market participants would use in pricing the asset or liability, including assumptions about risk, for example, the risk inherent in a particular valuation technique used to measure fair value (such as a pricing model) and/or the risk inherent in the inputs to the valuation technique. Inputs may be observable or unobservable. Observable inputs are inputs that reflect the assumptions market participants would use in pricing the asset or liability and are developed based on market data obtained from sources independent of the reporting entity. Unobservable inputs are inputs that reflect the reporting entity’s own assumptions about the assumptions market participants would use in pricing the asset or liability and are developed based on the best information available in the circumstances. The three-tier hierarchy of inputs is summarized
178
Notes to Financial Statements (Unaudited) (Continued) |
in the three broad Levels listed below. The inputs or methodology used for valuing investments are not necessarily an indication of the risk associated with investing in those investments and the determination of the significance of a particular input to the fair value measurement in its entirety requires judgment and consideration of factors specific to each security.
Level 1 – quoted prices (unadjusted) in active markets for identical investments that the Funds can access at the measurement date
Level 2 – other significant observable inputs (including quoted prices for similar investments, interest rates, prepayment speeds, credit risk, etc.)
Level 3 – significant unobservable inputs, to the extent observable inputs are not available (including the Funds’ own assumptions in determining the fair value of investments)
The availability of observable inputs can vary from security to security and is affected by a wide variety of factors, including, for example, the type of security, whether the security is new and not yet established in the marketplace, the liquidity of markets, and other characteristics particular to the security. To the extent that valuation is based on models or inputs that are less observable or unobservable in the market, the determination of fair value requires more judgment. Accordingly, the degree of judgment exercised in determining fair value is greatest for instruments categorized in Level 3.
Changes in valuation techniques may result in transfers in or out of an investment’s assigned Level within the hierarchy. In addition, in periods of market dislocation, the observability of prices and inputs may be reduced for many instruments. This condition, as well as changes related to liquidity of investments, could cause a security to be reclassified between Levels.
In certain cases, the inputs used to measure fair value may fall into different Levels of the fair value hierarchy. In such cases, for disclosure purposes, the Level in the fair value hierarchy within which the fair value measurement falls is determined based on the lowest Level input that is significant to the overall fair value measurement.
The Allocation Funds, Feeder Funds, and MML American Funds Core Allocation Fund characterized all investments at Level 1, as of June 30, 2022. The Focused Equity Fund, Fundamental Value Fund, Income & Growth Fund, Large Cap Growth Fund, Small Cap Growth Equity Fund, and Small/Mid Cap Value Fund characterized all long-term investments at Level 1, and all short-term investments at Level 2, as of June 30, 2022. For each Fund noted in the preceding sentences, the level classification by major category of investments is the same as the category presentation in the Portfolio of Investments.
The following is the aggregate value by input level, as of June 30, 2022, for the remaining Funds’ investments:
| | | Level 1 | | | Level 2 | | | Level 3 | | | Total | |
Blue Chip Growth Fund | | | | | | | | | | | | | | | | |
Asset Investments | | | | | | | | | | | | | | | | |
Common Stock | | $ | 396,359,969 | | | $ | 2,889,989 | * | | $ | 920,002 | ** | | $ | 400,169,960 | |
Preferred Stock | | | — | | | | — | | | | 847,415 | ** | | | 847,415 | |
Corporate Debt | | | — | | | | 838,115 | | | | — | | | | 838,115 | |
Mutual Funds | | | 1,057,491 | | | | — | | | | — | | | | 1,057,491 | |
Short-Term Investments | | | 100 | | | | 2,730,797 | | | | — | | | | 2,730,897 | |
Total Investments | | $ | 397,417,560 | | | $ | 6,458,901 | | | $ | 1,767,417 | | | $ | 405,643,878 | |
| | | | | | | | | | | | | | | | | |
Equity Income Fund | | | | | | | | | | | | | | | | |
Asset Investments | | | | | | | | | | | | | | | | |
Common Stock | | $ | 365,144,281 | | | $ | 12,563,874 | * | | $ | — | | | $ | 377,708,155 | |
Preferred Stock | | | 6,287,460 | | | | — | | | | — | | | | 6,287,460 | |
Mutual Funds | | | 1,618,767 | | | | — | | | | — | | | | 1,618,767 | |
Short-Term Investments | | | 1,077 | | | | 3,370,058 | | | | — | | | | 3,371,135 | |
Total Investments | | $ | 373,051,585 | | | $ | 15,933,932 | | | $ | — | | | $ | 388,985,517 | |
179
Notes to Financial Statements (Unaudited) (Continued) |
| | | Level 1 | | | Level 2 | | | Level 3 | | | Total | |
Equity Index Fund | | | | | | | | | | | | | | | | |
Asset Investments | | | | | | | | | | | | | | | | |
Common Stock | | $ | 597,021,432 | | | $ | — | | | $ | — | | | $ | 597,021,432 | |
Short-Term Investments | | | — | | | | 4,425,414 | | | | — | | | | 4,425,414 | |
Total Investments | | $ | 597,021,432 | | | $ | 4,425,414 | | | $ | — | | | $ | 601,446,846 | |
Liability Derivatives | | | | | | | | | | | | | | | | |
Futures Contracts | | $ | (123,062 | ) | | $ | — | | | $ | — | | | $ | (123,062 | ) |
| | | | | | | | | | | | | | | | | |
Foreign Fund | | | | | | | | | | | | | | | | |
Asset Investments | | | | | | | | | | | | | | | | |
Common Stock* | | | | | | | | | | | | | | | | |
Australia | | $ | 601,126 | | | $ | 6,166,837 | | | $ | — | | | $ | 6,767,963 | |
Austria | | | — | | | | 402,312 | | | | — | | | | 402,312 | |
Belgium | | | — | | | | 5,217,714 | | | | — | | | | 5,217,714 | |
Canada | | | 979,355 | | | | — | | | | — | | | | 979,355 | |
Cayman Islands | | | — | | | | 5,726,085 | | | | — | | | | 5,726,085 | |
Finland | | | — | | | | 1,141,720 | | | | — | | | | 1,141,720 | |
France | | | — | | | | 19,000,274 | | | | — | | | | 19,000,274 | |
Germany | | | — | | | | 20,636,791 | | | | — | | | | 20,636,791 | |
Ireland | | | 1,926,451 | | | | 5,466,520 | | | | — | | | | 7,392,971 | |
Israel | | | 1,924,124 | | | | — | | | | — | | | | 1,924,124 | |
Italy | | | — | | | | 444,312 | | | | — | | | | 444,312 | |
Japan | | | — | | | | 38,941,748 | | | | — | | | | 38,941,748 | |
Luxembourg | | | — | | | | 1,366,933 | | | | — | | | | 1,366,933 | |
Netherlands | | | 2,973,985 | | | | 7,504,091 | | | | — | | | | 10,478,076 | |
Norway | | | — | | | | 1,457,859 | | | | — | | | | 1,457,859 | |
Republic of Korea | | | — | | | | 3,096,989 | | | | — | | | | 3,096,989 | |
Singapore | | | — | | | | 2,487,191 | | | | — | | | | 2,487,191 | |
Sweden | | | — | | | | 4,201,956 | | | | 1,186,973 | ** | | | 5,388,929 | |
Switzerland | | | — | | | | 17,917,193 | | | | — | | | | 17,917,193 | |
United Kingdom | | | 784,195 | | | | 30,381,888 | | | | — | | | | 31,166,083 | |
Mutual Funds | | | 21,389 | | | | — | | | | — | | | | 21,389 | |
Short-Term Investments | | | — | | | | 442,616 | | | | — | | | | 442,616 | |
Total Investments | | $ | 9,210,625 | | | $ | 172,001,029 | | | $ | 1,186,973 | | | $ | 182,398,627 | |
| | | | | | | | | | | | | | | | | |
Fundamental Equity Fund | | | | | | | | | | | | | | | | |
Asset Investments | | | | | | | | | | | | | | | | |
Common Stock | | $ | 179,049,760 | | | $ | 1,458,958 | * | | $ | — | | | $ | 180,508,718 | |
Short-Term Investments | | | — | | | | 816,582 | | | | — | | | | 816,582 | |
Total Investments | | $ | 179,049,760 | | | $ | 2,275,540 | | | $ | — | | | $ | 181,325,300 | |
| | | | | | | | | | | | | | | | | |
Global Fund | | | | | | | | | | | | | | | | |
Asset Investments | | | | | | | | | | | | | | | | |
Common Stock* | | | | | | | | | | | | | | | | |
Austria | | $ | — | | | $ | 366,390 | | | $ | — | | | $ | 366,390 | |
Canada | | | 5,139,364 | | | | — | | | | — | | | | 5,139,364 | |
Denmark | | | — | | | | 704,135 | | | | — | | | | 704,135 | |
France | | | — | | | | 14,145,717 | | | | — | | | | 14,145,717 | |
Germany | | | — | | | | 5,371,767 | | | | — | | | | 5,371,767 | |
Ireland | | | 11,246,709 | | | | 2,746,841 | | | | — | | | | 13,993,550 | |
Israel | | | 1,317,294 | | | | — | | | | — | | | | 1,317,294 | |
Japan | | | — | | | | 2,337,136 | | | | — | | | | 2,337,136 | |
Mexico | | | 302,945 | | | | — | | | | — | | | | 302,945 | |
180
Notes to Financial Statements (Unaudited) (Continued) |
| | | Level 1 | | | Level 2 | | | Level 3 | | | Total | |
Global Fund (Continued) | | | | | | | | | | | | | | | | |
Asset Investments (Continued) | | | | | | | | | | | | | | | | |
Common Stock* (Continued) | | | | | | | | | | | | | | | | |
Netherlands | | $ | — | | | $ | 3,378,017 | | | $ | — | | | $ | 3,378,017 | |
Republic of Korea | | | — | | | | 1,055,867 | | | | — | | | | 1,055,867 | |
Spain | | | — | | | | 1,039,070 | | | | — | | | | 1,039,070 | |
Sweden | | | — | | | | 2,125,282 | | | | — | | | | 2,125,282 | |
Switzerland | | | — | | | | 11,700,105 | | | | — | | | | 11,700,105 | |
United Kingdom | | | 484,541 | | | | 9,447,921 | | | | — | | | | 9,932,462 | |
United States | | | 57,738,281 | | | | — | | | | — | | | | 57,738,281 | |
Warrants | | | 57,458 | | | | — | | | | — | | | | 57,458 | |
Short-Term Investments | | | — | | | | 949,537 | | | | — | | | | 949,537 | |
Total Investments | | $ | 76,286,592 | | | $ | 55,367,785 | | | $ | — | | | $ | 131,654,377 | |
| | | | | | | | | | | | | | | | | |
International Equity Fund | | | | | | | | | | | | | | | | |
Asset Investments | | | | | | | | | | | | | | | | |
Common Stock* | | | | | | | | | | | | | | | | |
Australia | | $ | — | | | $ | 1,214,239 | | | $ | — | | | $ | 1,214,239 | |
Belgium | | | — | | | | 2,164,135 | | | | — | | | | 2,164,135 | |
Canada | | | 8,072,720 | | | | — | | | | — | | | | 8,072,720 | |
Cayman Islands | | | 827,437 | | | | 4,584,232 | | | | — | | | | 5,411,669 | |
Denmark | | | — | | | | 4,880,691 | | | | — | | | | 4,880,691 | |
Finland | | | — | | | | 449,656 | | | | — | | | | 449,656 | |
France | | | — | | | | 34,716,636 | | | | — | | | | 34,716,636 | |
Germany | | | — | | | | 31,120,407 | | | | — | | | | 31,120,407 | |
Hong Kong | | | — | | | | 3,787,335 | | | | — | | | | 3,787,335 | |
India | | | 631,710 | | | | 628,154 | | | | — | | | | 1,259,864 | |
Ireland | | | 2,145,410 | | | | 1,822,710 | | | | — | | | | 3,968,120 | |
Israel | | | 1,821,463 | | | | — | | | | — | | | | 1,821,463 | |
Italy | | | — | | | | 4,527,127 | | | | — | | | | 4,527,127 | |
Japan | | | — | | | | 21,323,003 | | | | — | | | | 21,323,003 | |
Mexico | | | 656,036 | | | | — | | | | — | | | | 656,036 | |
Netherlands | | | — | | | | 10,824,588 | | | | — | | | | 10,824,588 | |
Portugal | | | — | | | | 1,063,213 | | | | — | | | | 1,063,213 | |
Republic of Korea | | | — | | | | 872,911 | | | | — | | | | 872,911 | |
Singapore | | | — | | | | 1,738,037 | | | | — | | | | 1,738,037 | |
Spain | | | — | | | | 2,090,113 | | | | — | | | | 2,090,113 | |
Sweden | | | — | | | | 3,020,219 | | | | — | | | | 3,020,219 | |
Switzerland | | | — | | | | 27,452,006 | | | | — | | | | 27,452,006 | |
Taiwan | | | 1,977,533 | | | | — | | | | — | | | | 1,977,533 | |
United Kingdom | | | 1,041,975 | | | | 24,745,564 | | | | — | | | | 25,787,539 | |
United States | | | 1,157,647 | | | | — | | | | — | | | | 1,157,647 | |
Preferred Stock* | | | | | | | | | | | | | | | | |
Republic of Korea | | | — | | | | 878,668 | | | | — | | | | 878,668 | |
Mutual Funds | | | 8,019 | | | | — | | | | — | | | | 8,019 | |
Short-Term Investments | | | — | | | | 2,138,053 | | | | — | | | | 2,138,053 | |
Total Investments | | $ | 18,339,950 | | | $ | 186,041,697 | | | $ | — | | | $ | 204,381,647 | |
| | | | | | | | | | | | | | | | | |
181
Notes to Financial Statements (Unaudited) (Continued) |
| | | Level 1 | | | Level 2 | | | Level 3 | | | Total | |
Managed Volatility Fund | | | | | | | | | | | | | | | | |
Asset Investments | | | | | | | | | | | | | | | | |
Common Stock | | $ | 110,446,379 | | | $ | — | | | $ | — | | | $ | 110,446,379 | |
Corporate Debt | | | — | | | | — | | | | — | +,** | | | — | |
Purchased Options | | | 1,915,377 | | | | — | | | | — | | | | 1,915,377 | |
Short-Term Investments | | | — | | | | 2,791,292 | | | | — | | | | 2,791,292 | |
Total Investments | | $ | 112,361,756 | | | $ | 2,791,292 | | | $ | — | | | $ | 115,153,048 | |
Liability Derivatives | | | | | | | | | | | | | | | | |
Written Options | | $ | (1,460,275 | ) | | $ | — | | | $ | — | | | $ | (1,460,275 | ) |
| | | | | | | | | | | | | | | | | |
Mid Cap Growth Fund | | | | | | | | | | | | | | | | |
Asset Investments | | | | | | | | | | | | | | | | |
Common Stock | | $ | 302,267,860 | | | $ | — | | | $ | 981,778 | ** | | $ | 303,249,638 | |
Preferred Stock | | | — | | | | — | | | | 1,542,670 | ** | | | 1,542,670 | |
Mutual Funds | | | 1,148,290 | | | | — | | | | — | | | | 1,148,290 | |
Short-Term Investments | | | 102 | | | | 12,245,321 | | | | — | | | | 12,245,423 | |
Total Investments | | $ | 303,416,252 | | | $ | 12,245,321 | | | $ | 2,524,448 | | | $ | 318,186,021 | |
| | | | | | | | | | | | | | | | | |
Mid Cap Value Fund | | | | | | | | | | | | | | | | |
Asset Investments | | | | | | | | | | | | | | | | |
Common Stock | | $ | 269,280,666 | | | $ | 21,481,320 | * | | $ | — | | | $ | 290,761,986 | |
Preferred Stock | | | — | | | | 1,629,564 | * | | | — | | | | 1,629,564 | |
Short-Term Investments | | | — | | | | 6,915,027 | | | | — | | | | 6,915,027 | |
Total Investments | | $ | 269,280,666 | | | $ | 30,025,911 | | | $ | — | | | $ | 299,306,577 | |
Asset Derivatives | | | | | | | | | | | | | | | | |
Forward Contracts | | $ | — | | | $ | 70,951 | | | $ | — | | | $ | 70,951 | |
Liability Derivatives | | | | | | | | | | | | | | | | |
Forward Contracts | | $ | — | | | $ | (20,030 | ) | | $ | — | | | $ | (20,030 | ) |
| | | | | | | | | | | | | | | | | |
Small Company Value Fund | | | | | | | | | | | | | | | | |
Asset Investments | | | | | | | | | | | | | | | | |
Common Stock | | $ | 77,164,816 | | | $ | 589,472 | * | | $ | — | | | $ | 77,754,288 | |
Mutual Funds | | | 718,563 | | | | — | | | | — | | | | 718,563 | |
Short-Term Investments | | | — | | | | 713,729 | | | | — | | | | 713,729 | |
Total Investments | | $ | 77,883,379 | | | $ | 1,303,201 | | | $ | — | | | $ | 79,186,580 | |
Asset Derivatives | | | | | | | | | | | | | | | | |
Forward Contracts | | $ | — | | | $ | 1,984 | | | $ | — | | | $ | 1,984 | |
| | | | | | | | | | | | | | | | | |
Sustainable Equity Fund | | | | | | | | | | | | | | | | |
Asset Investments | | | | | | | | | | | | | | | | |
Common Stock | | $ | 130,817,238 | | | $ | 1,696,031 | * | | $ | — | | | $ | 132,513,269 | |
Mutual Funds | | | 74,318 | | | | — | | | | — | | | | 74,318 | |
Short-Term Investments | | | — | | | | 175,656 | | | | — | | | | 175,656 | |
Total Investments | | $ | 130,891,556 | | | $ | 1,871,687 | | | $ | — | | | $ | 132,763,243 | |
Asset Derivatives | | | | | | | | | | | | | | | | |
Forward Contracts | | $ | — | | | $ | 3,147 | | | $ | — | | | $ | 3,147 | |
| | | | | | | | | | | | | | | | | |
182
Notes to Financial Statements (Unaudited) (Continued) |
| | | Level 1 | | | Level 2 | | | Level 3 | | | Total | |
Total Return Bond Fund | | | | | | | | | | | | | | | | |
Asset Investments | | | | | | | | | | | | | | | | |
Common Stock | | $ | 196,473 | | | $ | — | | | $ | — | | | $ | 196,473 | |
Bank Loans | | | — | | | | 5,881,140 | | | | — | | | | 5,881,140 | |
Corporate Debt | | | — | | | | 91,393,696 | | | | — | +,** | | | 91,393,696 | |
Municipal Obligations | | | — | | | | 3,250,514 | | | | — | | | | 3,250,514 | |
Non-U.S. Government Agency Obligations | | | — | | | | 48,462,465 | | | | — | | | | 48,462,465 | |
Sovereign Debt Obligations | | | — | | | | 3,771,923 | | | | — | | | | 3,771,923 | |
U.S. Government Agency Obligations and Instrumentalities | | | — | | | | 107,838,025 | | | | — | | | | 107,838,025 | |
U.S. Treasury Obligations | | | — | | | | 93,780,082 | | | | — | | | | 93,780,082 | |
Purchased Options | | | 5,300 | | | | — | | | | — | | | | 5,300 | |
Rights | | | — | | | | — | | | | — | +,** | | | — | |
Mutual Funds | | | 15,507,583 | | | | — | | | | — | | | | 15,507,583 | |
Short-Term Investments | | | — | | | | 20,197,035 | | | | — | | | | 20,197,035 | |
Unfunded Loan Commitments*** | | | | | | | (2,060 | ) | | | | | | | (2,060 | ) |
Total Investments | | $ | 15,709,356 | | | $ | 374,572,820 | | | $ | — | | | $ | 390,282,176 | |
Asset Derivatives | | | | | | | | | | | | | | | | |
Swap Agreements | | $ | — | | | $ | 759,837 | | | $ | — | | | $ | 759,837 | |
Forward Contracts | | | — | | | | 3,706 | | | | — | | | | 3,706 | |
Total | | $ | — | | | $ | 763,543 | | | $ | — | | | $ | 763,543 | |
Liability Derivatives | | | | | | | | | | | | | | | | |
Futures Contracts | | $ | (39,901 | ) | | $ | — | | | $ | — | | | $ | (39,901 | ) |
Swap Agreements | | | — | | | | (1,728,415 | ) | | | — | | | | (1,728,415 | ) |
Written Options | | | (3,125 | ) | | | — | | | | — | | | | (3,125 | ) |
Forward Contracts | | | — | | | | (608 | ) | | | — | | | | (608 | ) |
Total | | $ | (43,026 | ) | | $ | (1,729,023 | ) | | $ | — | | | $ | (1,772,049 | ) |
* | Includes foreign equity securities whose values were adjusted to reflect market trading of comparable securities or other correlated instruments after the close of trading in their respective foreign markets, as applicable. |
** | None of the unobservable inputs for Level 3 assets, individually or collectively, had a material impact on the Fund(s). Level 3 investments at June 30, 2022 in relation to net assets were not significant. |
*** | Unfunded loan commitments are valued at the unrealized appreciation (depreciation) on the commitment. |
+ | Represents a security at $0 value as of June 30, 2022. |
For certain Fund(s) the Statement of Assets and Liabilities shows receivables from investments sold on a delayed delivery basis, collateral pledged for open futures and options contracts, collateral pledged for open swap agreements, as well as, any applicable liabilities for investments purchased on a delayed delivery basis, amounts due to custodian, and collateral held for securities on loan. These amounts approximate fair value and would be categorized at Level 2 for each applicable Fund as of June 30, 2022.
The Funds had no Level 3 transfers during the period ended June 30, 2022.
Derivative Instruments
Derivatives are financial instruments whose values are based on the values of one or more underlying indicators, such as a security, asset, currency, interest rate, or index. Derivative transactions can create investment leverage and may be highly volatile. Losses from derivatives can be substantially greater than the derivatives’ original cost and can sometimes be unlimited. A Fund may not be able to close out a derivative transaction at a favorable time or price.
183
Notes to Financial Statements (Unaudited) (Continued) |
At June 30, 2022, and during the period then ended, the Fund(s) had the following derivatives and transactions in derivatives, grouped into the indicated risk categories:
| | | Equity Risk | | | Foreign
Exchange
Risk | | | Interest/
Inflation Rate
Risk | | | Total | |
Equity Index Fund | | | | | | | | | | | | | | | | |
Liability Derivatives | | | | | | | | | | | | | | | | |
Futures Contracts^^ | | $ | (123,062 | ) | | $ | — | | | $ | — | | | $ | (123,062 | ) |
Realized Gain (Loss)# | | | | | | | | | | | | | | | | |
Futures Contracts | | $ | (1,047,686 | ) | | $ | — | | | $ | — | | | $ | (1,047,686 | ) |
Change in Appreciation (Depreciation)## | | | | | | | | | | | | | | | | |
Futures Contracts | | $ | (181,425 | ) | | $ | — | | | $ | — | | | $ | (181,425 | ) |
| | | | | | | | | | | | | | | | | |
International Equity Fund | | | | | | | | | | | | | | | | |
Realized Gain (Loss)# | | | | | | | | | | | | | | | | |
Forward Contracts | | $ | — | | | $ | 84,995 | | | $ | — | | | $ | 84,995 | |
Change in Appreciation (Depreciation)## | | | | | | | | | | | | | | | | |
Forward Contracts | | $ | — | | | $ | 15,249 | | | $ | — | | | $ | 15,249 | |
| | | | | | | | | | | | | | | | | |
Managed Volatility Fund | | | | | | | | | | | | | | | | |
Asset Derivatives | | | | | | | | | | | | | | | | |
Purchased Options*,^^^ | | $ | 1,915,377 | | | $ | — | | | $ | — | | | $ | 1,915,377 | |
Liability Derivatives | | | | | | | | | | | | | | | | |
Written Options^,^^^ | | $ | (1,460,275 | ) | | $ | — | | | $ | — | | | $ | (1,460,275 | ) |
Realized Gain (Loss)# | | | | | | | | | | | | | | | | |
Purchased Options | | $ | 1,942,771 | | | $ | — | | | $ | — | | | $ | 1,942,771 | |
Written Options | | | 6,655,744 | | | | — | | | | — | | | | 6,655,744 | |
Total Realized Gain (Loss) | | $ | 8,598,515 | | | $ | — | | | $ | — | | | $ | 8,598,515 | |
Change in Appreciation (Depreciation)## | | | | | | | | | | | | | | | | |
Purchased Options | | $ | 792,630 | | | $ | — | | | $ | — | | | $ | 792,630 | |
Written Options | | | 1,631,494 | | | | — | | | | — | | | | 1,631,494 | |
Total Change in Appreciation (Depreciation) | | $ | 2,424,124 | | | $ | — | | | $ | — | | | $ | 2,424,124 | |
| | | | | | | | | | | | | | | | | |
Mid Cap Value Fund | | | | | | | | | | | | | | | | |
Asset Derivatives | | | | | | | | | | | | | | | | |
Forward Contracts* | | $ | — | | | $ | 70,951 | | | $ | — | | | $ | 70,951 | |
Liability Derivatives | | | | | | | | | | | | | | | | |
Forward Contracts^ | | $ | — | | | $ | (20,030 | ) | | $ | — | | | $ | (20,030 | ) |
Realized Gain (Loss)# | | | | | | | | | | | | | | | | |
Forward Contracts | | $ | — | | | $ | 1,682,422 | | | $ | — | | | $ | 1,682,422 | |
Change in Appreciation (Depreciation)## | | | | | | | | | | | | | | | | |
Forward Contracts | | $ | — | | | $ | 305,170 | | | $ | — | | | $ | 305,170 | |
| | | | | | | | | | | | | | | | | |
184
Notes to Financial Statements (Unaudited) (Continued) |
| | | Equity Risk | | | Foreign
Exchange
Risk | | | Interest/
Inflation Rate
Risk | | | Total | |
Small Company Value Fund | | | | | | | | | | | | | | | | |
Asset Derivatives | | | | | | | | | | | | | | | | |
Forward Contracts* | | $ | — | | | $ | 1,984 | | | $ | — | | | $ | 1,984 | |
Realized Gain (Loss)# | | | | | | | | | | | | | | | | |
Forward Contracts | | $ | — | | | $ | 69,494 | | | $ | — | | | $ | 69,494 | |
Change in Appreciation (Depreciation)## | | | | | | | | | | | | | | | | |
Forward Contracts | | $ | — | | | $ | 7,789 | | | $ | — | | | $ | 7,789 | |
| | | | | | | | | | | | | | | | | |
Sustainable Equity Fund | | | | | | | | | | | | | | | | |
Asset Derivatives | | | | | | | | | | | | | | | | |
Forward Contracts* | | $ | — | | | $ | 3,147 | | | $ | — | | | $ | 3,147 | |
Realized Gain (Loss)# | | | | | | | | | | | | | | | | |
Forward Contracts | | $ | — | | | $ | 6,678 | | | $ | — | | | $ | 6,678 | |
Change in Appreciation (Depreciation)## | | | | | | | | | | | | | | | | |
Forward Contracts | | $ | — | | | $ | 3,147 | | | $ | — | | | $ | 3,147 | |
| | | | | | | | | | | | | | | | | |
Total Return Bond Fund | | | | | | | | | | | | | | | | |
Asset Derivatives | | | | | | | | | | | | | | | | |
Purchased Options*,^^^ | | $ | — | | | $ | — | | | $ | 5,300 | | | $ | 5,300 | |
Forward Contracts* | | | — | | | | 3,706 | | | | — | | | | 3,706 | |
Swap Agreements^^,^^^ | | | — | | | | — | | | | 759,837 | | | | 759,837 | |
Total Value | | $ | — | | | $ | 3,706 | | | $ | 765,137 | | | $ | 768,843 | |
Liability Derivatives | | | | | | | | | | | | | | | | |
Forward Contracts^ | | $ | — | | | $ | (608 | ) | | $ | — | | | $ | (608 | ) |
Futures Contracts^^ | | | — | | | | — | | | | (39,901 | ) | | | (39,901 | ) |
Swap Agreements^^,^^^ | | | — | | | | — | | | | (1,728,415 | ) | | | (1,728,415 | ) |
Written Options^,^^^ | | | — | | | | — | | | | (3,125 | ) | | | (3,125 | ) |
Total Value | | $ | — | | | $ | (608 | ) | | $ | (1,771,441 | ) | | $ | (1,772,049 | ) |
Realized Gain (Loss)# | | | | | | | | | | | | | | | | |
Purchased Options | | $ | — | | | $ | — | | | $ | (12,553 | ) | | $ | (12,553 | ) |
Forward Contracts | | | — | | | | 40,490 | | | | — | | | | 40,490 | |
Futures Contracts | | | — | | | | — | | | | 217,529 | | | | 217,529 | |
Swap Agreements | | | — | | | | — | | | | 30,511 | | | | 30,511 | |
Written Options | | | — | | | | — | | | | (997,923 | ) | | | (997,923 | ) |
Total Realized Gain (Loss) | | $ | — | | | $ | 40,490 | | | $ | (762,436 | ) | | $ | (721,946 | ) |
Change in Appreciation (Depreciation)## | | | | | | | | | | | | | | | | |
Purchased Options | | $ | — | | | $ | — | | | $ | (37,624 | ) | | $ | (37,624 | ) |
Forward Contracts | | | — | | | | (32,565 | ) | | | — | | | | (32,565 | ) |
Futures Contracts | | | — | | | | — | | | | (42,883 | ) | | | (42,883 | ) |
Swap Agreements | | | — | | | | — | | | | (702,949 | ) | | | (702,949 | ) |
Written Options | | | — | | | | — | | | | 46,438 | | | | 46,438 | |
Total Change in Appreciation (Depreciation) | | $ | — | | | $ | (32,565 | ) | | $ | (737,018 | ) | | $ | (769,583 | ) |
* | Statements of Assets and Liabilities location: Investments, at value, or Receivables from: open forward contracts, as applicable. |
^ | Statements of Assets and Liabilities location: Payables for: open forward contracts or written options outstanding, at value, as applicable. |
^^ | Cumulative appreciation (depreciation) on futures contracts and centrally cleared swaps is reported in “Futures Contracts” and “Swap Agreements” in each applicable Fund’s Portfolio of Investments. Only current day’s variation margin, if any, is reported within the Statements of Assets and Liabilities. |
185
Notes to Financial Statements (Unaudited) (Continued) |
^^^ | Represents centrally cleared swaps or exchange-traded purchased and written options, which are not subject to a master netting agreement or similar agreement. |
# | Statements of Operations location: Amounts are included in net realized gain (loss) on: investment transactions, forward contracts, futures contracts, swap agreements, or written options, as applicable. |
## | Statements of Operations location: Amounts are included in net change in unrealized appreciation (depreciation) on: investment transactions, forward contracts, futures contracts, swap agreements, or written options, as applicable. |
For the period ended June 30, 2022, the number of contracts, notional amounts, or shares/units for each derivative type was as follows:
| | | Number of Contracts, Notional Amounts, or Shares/Units† | |
Fund Name | | Futures
Contracts | | | Forward
Contracts | | | Swap
Agreements | | | Purchased
Options | | | Purchased
Swaptions | | | Written
Options | | | Written
Swaptions | |
Equity Index Fund | | | 18 | | | $ | — | | | $ | — | | | | — | | | $ | — | | | | — | | | $ | — | |
International Equity Fund | | | — | | | | 1,314,395 | | | | — | | | | — | | | | — | | | | — | | | | — | |
Managed Volatility Fund | | | — | | | | — | | | | — | | | | 219 | | | | — | | | | 288 | | | | — | |
Mid Cap Value Fund | | | — | | | | 26,226,833 | | | | — | | | | — | | | | — | | | | — | | | | — | |
Small Company Value Fund | | | — | | | | 763,829 | | | | — | | | | — | | | | — | | | | — | | | | — | |
Sustainable Equity Fund | | | — | | | | 1,275,088 | | | | — | | | | — | | | | — | | | | — | | | | — | |
Total Return Bond Fund | | | 70 | | | | 1,586,460 | | | | 49,816,667 | | | | 231 | | | | 1,350,000 | | | | 827 | | | | 19,270,000 | |
† | Amount(s) disclosed represent average number of contracts for futures contracts, notional amounts for forward contracts, swap agreements, purchased swaptions, and written swaptions, or shares/units outstanding for purchased options and written options based on absolute values, which is indicative of volume of this derivative type, for the months that the Fund held such derivatives during the period ended June 30, 2022. |
The Portfolio of Investments included in a Fund’s financial statements shows the assets or liabilities of the Fund associated with individual derivatives transactions. The terms of many of those transactions contemplate that derivatives receivables and payables between the same two parties may be netted and that the parties will collateralize certain obligations. The following tables provide an illustration of the possible effect of netting provisions and of collateral (delivered or received) on a Fund’s derivatives exposure as of June 30, 2022. Netting arrangements vary among different counterparties, and the actual disposition of derivatives receivables and payables, and of collateral, in a bankruptcy or insolvency can be complicated and difficult to predict.
The following table presents derivative assets by counterparty net of amounts available for offset under a master netting agreement (“MNA”) or similar agreement and net of the related collateral received by the Fund(s) as of June 30, 2022.
Counterparty | | Derivative
Assets Subject
to an MNA by
Counterparty† | | | Financial
Instruments
Available for
Offset | | | Collateral
Received*** | | | Net Amount* | |
Mid Cap Value Fund | | | | | | | | | | | | | | | | |
Bank of America N.A. | | $ | 27,482 | | | $ | (819 | ) | | $ | — | | | $ | 26,663 | |
JP Morgan Chase Bank N.A. | | | 43,469 | | | | — | | | | — | | | | 43,469 | |
| | | $ | 70,951 | | | $ | (819 | ) | | $ | — | | | $ | 70,132 | |
Small Company Value | | | | | | | | | | | | | | | | |
UBS AG | | $ | 1,984 | | | $ | — | | | $ | — | | | $ | 1,984 | |
| | | | | | | | | | | �� | | | | | | |
Sustainable Equity Fund | | | | | | | | | | | | | | | | |
JP Morgan Chase Bank N.A. | | $ | 3,147 | | | $ | — | | | $ | — | | | $ | 3,147 | |
| | | | | | | | | | | | | | | | | |
Total Return Bond Fund | | | | | | | | | | | | | | | | |
Citibank N.A. | | $ | 3,706 | | | $ | (608 | ) | | $ | — | | | $ | 3,098 | |
186
Notes to Financial Statements (Unaudited) (Continued) |
The following table presents derivative liabilities by counterparty net of amounts available for offset under an MNA or similar agreement and net of the related collateral pledged by the Fund(s) as of June 30, 2022.
Counterparty | | Derivative
Liabilities Subject
to an MNA by
Counterparty† | | | Financial
Instruments
Available for
Offset | | | Collateral
Pledged*** | | | Net Amount** | |
Mid Cap Value Fund | | | | | | | | | | | | | | | | |
Bank of America N.A. | | $ | (819 | ) | | $ | 819 | | | $ | — | | | $ | — | |
UBS AG | | | (19,211 | ) | | | — | | | | — | | | | (19,211 | ) |
| | | $ | (20,030 | ) | | $ | 819 | | | $ | — | | | $ | (19,211 | ) |
Total Return Bond Fund | | | | | | | | | | | | | | | | |
Citibank N.A. | | $ | (608 | ) | | $ | 608 | | | $ | — | | | $ | — | |
* | Represents the net amount receivable from the counterparty in the event of default. |
** | Represents the net amount payable to the counterparty in the event of default. |
*** | The amount presented here may be less than the total amount of collateral received/pledged as the net amount of derivative assets and liabilities for a counterparty cannot be less than $0. |
† | The amount presented here may be less than the total amount shown in the Statements of Assets and Liabilities as some derivatives held by the counterparty are not covered within an MNA or similar agreement. |
Such agreements typically permit a single net payment in the event of default, including the bankruptcy or insolvency of the counterparty. The Fund(s) and counterparties may not be permitted to sell, re-pledge, or use the collateral they receive. In the event that cash collateral is restricted for use, the balance will be reflected as restricted cash within the Statement of Assets and Liabilities.
Further details regarding the derivatives and other investments held by the Fund(s) during the period ended June 30, 2022, are discussed below.
Foreign Currency Exchange Transactions
A Fund may enter into foreign currency exchange transactions for hedging purposes in order to protect against uncertainty in the level of future foreign currency exchange rates, or for other, non-hedging purposes.
A Fund may enter into foreign currency exchange transactions, including foreign currency forward contracts. These contracts call for the Fund to deliver in the future an amount of one currency in return for an amount of another currency, at an exchange rate determined at the time the contract is entered into. Forward contracts are private contractual arrangements and a Fund is subject to the risk that its counterparty will not, or will not be able to, perform its obligations. This type of arrangement may require the Fund to post margin. A Fund may enter into foreign currency exchange transactions in order to hedge against changes in the values of the assets or liabilities denominated in one or more foreign currencies, or otherwise to increase or reduce a Fund’s exposure to various foreign currencies. The use of foreign currency exchange transactions may create investment leverage.
Whenever a Fund enters into a foreign currency exchange transaction, it is subject to the risk that the value of the transaction will move in a direction unfavorable to it. When the Fund uses the transactions for hedging purposes, it is likely that the Fund will have an asset or liability that will offset any loss (or gain) on the transactions, at least in part. If a Fund enters into foreign currency exchange transactions other than for hedging purposes (for example, seeking to profit from an anticipated change in the values of currencies by creating directional exposures in the portfolio with respect to one or more currencies), it will generally be subject to the same risks, but is less likely to have assets or liabilities that will offset any losses on the transactions. There can be no assurance that a Fund will be able to terminate any foreign currency exchange transaction prior to its maturity in order to limit its loss on the transaction.
Forward foreign currency contracts are marked to market daily and the change in their value is recorded by the Funds as an unrealized gain or loss. Forward foreign currency contracts are valued at the settlement price established through dealers or other market sources on the day which they are traded. When a forward foreign currency contract is extinguished, through delivery or
187
Notes to Financial Statements (Unaudited) (Continued) |
offset by entering into another forward foreign currency contract, the Funds record a realized gain or loss equal to the difference between the value of the contract at the time it was opened and the value of the contract at the time it was extinguished or offset. The notional or contractual amounts of these instruments do not necessarily represent the amounts potentially subject to risk. The measurement of the risk associated with these instruments is meaningful only when all related and offsetting transactions and counterparty risks are considered.
A Fund’s current exposure to a counterparty is the unrealized appreciation on the contract.
Futures Contracts
A Fund may seek to manage a variety of different risks, such as interest rate risk, equity price risk, and currency risk, through the use of futures contracts and related options.
Futures Contracts. A Fund may use interest rate futures contracts to adjust the interest rate sensitivity (duration) of its portfolio or the credit exposure of the portfolio. Interest rate futures contracts obligate the long or short holder to take or make delivery of a specified quantity of a financial instrument, such as a specific fixed income security, during a specified future period at a specified price. A Fund may use index futures contracts to hedge against broad market risks to its portfolio or to gain broad market exposure when it holds uninvested cash or as an inexpensive substitute for cash investments directly in securities or other assets, including commodities and precious metals. Securities index futures contracts are contracts to buy or sell units of a securities index at a specified future date at a price agreed upon when the contract is made and are settled in cash. Positions in futures contracts may be closed out only on an exchange or board of trade which provides a market for such futures. Because futures contracts are exchange-traded, they typically have minimal exposure to counterparty risk.
Parties to a futures contract are not required to post the entire notional amount of the contract, but rather a small percentage of that amount (by way of margin), both at the time they enter into futures transactions, and then on a daily basis if their positions decline in value; as a result, futures contracts are highly leveraged. Such payments are known as variation margin and are recorded by the Funds as unrealized gains or losses. Because futures markets are highly leveraged, they can be extremely volatile, and there can be no assurance that the pricing of a futures contract will correlate precisely with the pricing of the asset or index underlying it or the asset or liability of the Fund that is the subject of the hedge. It may not always be possible for a Fund to enter into a closing transaction with respect to a futures contract it has entered into, at a favorable time or price. When a Fund enters into a futures transaction, it is subject to the risk that the value of the futures contract will move in a direction unfavorable to it. When a Fund uses futures contracts for hedging purposes, it is likely that the Fund will have an asset or liability that will offset any loss (or gain) on the transactions, at least in part.
Options on Futures Contracts. If a Fund buys an option on a futures contract, it will have the right to assume a futures contract at a particular price during the course of the option. Its potential loss should generally be limited to the amount of the premium paid and any transaction costs. If a Fund sells an option on a futures contract, it is subject generally to the same risks as if it had entered into a futures contract underlying the option itself.
When a futures contract is closed, the Fund records a realized gain or loss equal to the difference between the value of the contract at the time it was opened and the value at the time it was closed. Futures contracts are valued at the settlement price established each day by the board of trade or exchange on which they are traded. For information regarding the accounting treatment of options, see “Options, Rights, and Warrants” below.
Swap Agreements
Swap agreements are typically two-party contracts entered into primarily by institutional investors. In a standard “swap” transaction, two parties agree to exchange the returns (or differentials in rates of return) earned or realized on particular predetermined investments or instruments or rates, which may be adjusted for an interest factor. The gross returns to be exchanged or “swapped” between the parties are generally calculated with respect to a “notional amount,” (i.e., the return on or increase in value of a particular dollar amount invested at a particular interest rate or in a “basket” of securities representing a particular index).
188
Notes to Financial Statements (Unaudited) (Continued) |
Interest Rate Swaps. When a Fund enters into an interest rate swap, it typically agrees to make payments to its counterparty based on a specified long- or short-term interest rate, and will receive payments from its counterparty based on another interest rate. Other forms of interest rate swap agreements include, among others, interest rate caps, under which, in return for a specified payment stream, one party agrees to make payments to the other to the extent that interest rates exceed a specified rate, or “cap”; interest rate floors, under which, in return for a specified payment stream, one party agrees to make payments to the other to the extent that interest rates fall below a specified rate, or “floor”; and interest rate collars, under which a party sells a cap and purchases a floor or vice versa in an attempt to protect itself against interest rate movements exceeding given minimum or maximum levels. A Fund may enter into an interest rate swap in order, for example, to hedge against the effect of interest rate changes on the value of specific securities in its portfolio, or to adjust the interest rate sensitivity (duration) or the credit exposure of its portfolio overall, or otherwise as a substitute for a direct investment in debt securities.
Whenever a Fund enters into a swap agreement, it takes on counterparty risk — the risk that its counterparty will be unable or unwilling to meet its obligations under the swap agreement. The Fund also takes the risk that the market will move against its position in the swap agreement. In the case of an interest rate swap, the value of the swap may increase or decrease depending on changes in interest rates. When the Fund enters into any type of swap for hedging purposes, it is likely that the Fund will have an asset or liability that will offset any loss (or gain) on the swap, at least in part. Swap agreements may be non-transferable or otherwise highly illiquid, and a Fund may not be able to terminate or transfer a swap agreement at any particular time or at an acceptable price.
Swaptions. A Fund may also enter into options on swap agreements (“swaptions”). A swaption is a contract that gives a counterparty the right (but not the obligation) to enter into a new swap agreement or to shorten, extend, cancel, or otherwise modify an existing swap agreement, at some designated future time on specified terms. A Fund may write (sell) and purchase put and call swaptions. Depending on the terms of the particular option agreement, a Fund will generally incur a greater degree of risk when it writes a swaption than it will incur when it purchases a swaption. When a Fund purchases a swaption, it risks losing only the amount of the premium it has paid should it decide to let the option expire unexercised. However, when a Fund writes a swaption, upon exercise of the option the Fund will become obligated according to the terms of the underlying agreement. A Fund may enter into swaptions for the same purposes as swaps. For information regarding the accounting treatment of options, see “Options, Rights, and Warrants” below.
Centrally Cleared Swaps. Certain clearinghouses currently offer clearing for limited types of derivatives transactions, principally certain interest rate swaps, certain index swaps, and credit derivatives. In a cleared derivative transaction, a Fund typically enters into the transaction with a financial institution counterparty, and performance of the transaction is effectively guaranteed by a central clearinghouse, thereby reducing or eliminating the Fund’s exposure to the credit risk of its original counterparty. The Fund will be required to post amounts (“initial margin”) with the clearinghouse or at the instruction of the clearinghouse. The initial margin required by a clearinghouse may be greater than the initial margin the Fund would be required to post in an uncleared transaction. If cash is deposited as the initial margin, it is shown as collateral on a Fund’s Statement of Assets and Liabilities. Swap agreements are marked-to-market daily and subsequent payments (“variation margin”) are made or received by a Fund depending on whether unrealized gains or losses are incurred. These amounts are reflected as receivables or payables on a Fund’s Statement of Assets and Liabilities (“Variation margin on open derivative instruments”) and as a component of net change in unrealized appreciation (depreciation) on a Fund’s Statement of Operations. Only a limited number of transaction types are currently eligible for clearing.
During the term of a swap transaction, changes in the value of the swap are recognized as unrealized gains or losses by marking to market to reflect the market value of the swap. When the swap is terminated, a Fund will record a realized gain or loss equal to the difference, if any, between the proceeds from (or cost of) the closing transaction and a Fund’s basis in the agreement. Upfront swap premium payments paid or received by a Fund, if any, are recorded within the value of the open swap agreement on the Fund’s Statement of Assets and Liabilities and represent payments paid or received upon entering into the swap agreement to compensate for differences between stated terms of the swap agreement and prevailing market conditions (credit spreads, currency exchange rates, and other relevant factors). These upfront payments are recorded as realized gain or loss on the Fund’s Statement of Operations upon termination or maturity of the swap agreement.
189
Notes to Financial Statements (Unaudited) (Continued) |
During the term of a swap transaction, the periodic net payments can be made for a set period of time or may be triggered by a predetermined credit event. The net periodic payments may be based on a fixed or variable interest rate, the change in market value of a specified security, basket of securities or index, or the return generated by a security. These periodic payments received or made by the Funds are recorded in the accompanying Statements of Operations as realized gains and losses, respectively.
A Fund’s current exposure to a counterparty is the fair value of the transaction.
Options, Rights, and Warrants
A Fund may purchase and sell put and call options on portfolio securities or an index of securities to enhance investment performance or to protect against changes in market prices. A Fund that invests in debt securities may also purchase and sell put and call options to adjust the interest rate sensitivity of its portfolio or the credit exposure of the portfolio.
Call Options. A call option gives the holder the right to purchase, and obligates the writer to sell, a security at the strike price at any time before the expiration date in the case of an American-style option or only on the expiration date in the case of a European-style option.
Put Options. A put option gives the holder the right to sell, and obligates the writer to buy, a security at the exercise price.
Writing put and call options. A Fund may write call options on a security it owns, in a “directional” strategy hoping to realize a greater current return through the receipt of premiums. In return for the option premium, the Fund takes the risk that it will have to forego any increase in the value of the security over the strike price. When a Fund has written a call option on a security it does not own, its exposure on such an option is theoretically unlimited. A Fund may enter into closing purchase transactions in order to realize a profit or limit a loss on a previously written call option or, in the case of a call option on a security it owns, to free itself to sell the underlying security or to write another call on the security, or protect a security from being called in an unexpected market rise. Any profits from a closing purchase transaction in the case of a call option on a security a Fund owns may be offset by a decline in the value of the underlying security. Conversely, because increases in the market price of a call option will generally reflect increases in the market price of the underlying security, any loss resulting from a closing purchase transaction relating to a call option on a security a Fund owns is likely to be offset in whole or in part by unrealized appreciation of the underlying security owned by the Fund. A Fund may not be able to close out a call option that it has previously written. A Fund may write put options in order to enhance its current return by taking a long directional position as to a security or index of securities. By writing a put option, the Fund assumes the risk that it may be required to purchase the underlying security for an exercise price higher than its then current market value, resulting in a potential capital loss unless the security later appreciates in value. A Fund may terminate a put option that it has written before it expires by entering into a closing purchase transaction. Any loss from this transaction may be partially or entirely offset by the premium received on the terminated option. A Fund may not be able to close out a put option that it has previously written.
When a Fund writes a call or put option, an amount equal to the premium received is recorded as a liability. Premiums received from writing options which expire are treated as realized gains. Premiums received from writing options which are exercised or closed are added to the proceeds or offset against the amount paid on the underlying investment to determine the realized gain or loss.
Purchasing put and call options. A Fund may purchase put options to protect portfolio holdings against a decline in market value of a security or securities held by it. A Fund may also purchase a put option hoping to profit from an anticipated decline in the value of the underlying security. If the Fund holds the security underlying the option, the option premium and any transaction costs will reduce any profit the Fund might have realized had it sold the underlying security instead of buying the put option. A Fund may purchase call options to hedge against an increase in the price of securities that the Fund wants ultimately to buy. A Fund may also purchase a call option as a long directional investment hoping to profit from an anticipated increase in the value of the underlying security. In order for a call option to be profitable, the market price of the underlying security must rise sufficiently above the exercise price to cover the premium and transaction costs. These costs will reduce any profit the Fund might have realized had it bought the underlying security at the time it purchased the call option.
190
Notes to Financial Statements (Unaudited) (Continued) |
When a Fund purchases an option, it runs the risk that it will lose its entire investment in the option in a relatively short period of time, unless the Fund exercises the option or enters into a closing sale transaction before the option’s expiration. If the price of the underlying security does not rise (in the case of a call) or fall (in the case of a put) to an extent sufficient to cover the option premium and transaction costs, the Fund will lose part or all of its investment in the option. This contrasts with an investment by a Fund in the underlying security, since the Fund will not realize a loss if the security’s price does not change. Premiums paid for purchasing options that expire are treated as realized losses.
Exchange Traded Options. Exchange traded options purchased or sold by a Fund may be traded on a securities or options exchange or market. Such options typically have minimal exposure to counterparty risk. However, an exchange or market may at times find it necessary to impose restrictions on particular types of options transactions, such as opening transactions. If an underlying security ceases to meet qualifications imposed by the market or the Options Clearing Corporation, new series of options on that security will no longer be opened to replace expiring series, and opening transactions in existing series may be prohibited. Exchange traded options are valued at the last sale price, or if no sales are reported, the last bid price.
OTC Options. OTC options purchased or sold by a Fund are not traded on securities or options exchanges or backed by clearinghouses. Rather, they are entered into directly between a Fund and the counterparty to the option. In the case of an OTC option purchased by the Fund, the value of the option to the Fund will depend on the willingness and ability of the option writer to perform its obligations to the Fund. In addition, OTC options may not be transferable and there may be little or no secondary market for them, so they may be considered illiquid. It may not be possible to enter into closing transactions with respect to OTC options or otherwise to terminate such options, and as a result a Fund may be required to remain obligated on an unfavorable OTC option until its expiration. OTC options are valued using prices supplied by a primary pricing source, selected pursuant to procedures approved by the Trustees.
Rights and Warrants. A Fund may purchase or hold warrants or rights in order to gain exposure to the underlying security without owning the security, including, for example, cases where the Fund hopes to lock in the price today of a security it may wish to purchase in the future. Warrants generally give the holder the right, but not the obligation, to buy a security at a stated price. In order for a warrant to be profitable, the market price of the underlying security must rise sufficiently above the exercise price to cover any premium and transaction costs. Rights may similarly confer on the holder the right to purchase or acquire securities, including through participation in a so-called rights offering. Bonds may be issued with warrants or other rights attached to purchase or acquire equity or other debt securities, typically of the bond issuer. The market prices of bonds with warrants or rights attached to purchase equity securities or bonds may, to some degree, reflect changes in the values of the underlying securities.
When a Fund purchases or otherwise acquires warrants or other rights, it runs the risk that it will lose its entire investment in the warrants or rights, unless the Fund exercises the warrant or right, acquires the underlying securities, or enters into a closing transaction before expiration. If the price of the underlying security does not rise to an extent sufficient to cover any premium and transaction costs, the Fund will lose part or all of its investment. Any premiums or purchase price paid for warrants or other rights that expire are treated as realized losses. Warrants and similar rights differ from options in that they are typically written by the issuer of the security underlying the warrant or right. Although some warrants and rights may be non-transferable, others may be traded over-the-counter or on an exchange.
Inflation-Linked Securities
Inflation-linked securities are typically fixed income securities whose principal values are periodically adjusted according to a measure of inflation. If the index measuring inflation falls, the principal value of an inflation-linked security will be adjusted downward, and consequently the interest payable on the security (calculated with respect to a smaller principal amount) will be reduced. Repayment of the original principal of the security upon maturity (as adjusted for inflation) is guaranteed in the case of U.S. Treasury inflation-linked securities. For securities that do not provide a similar guarantee, the adjusted principal value of the security repaid at maturity may be less than the original principal.
Alternatively, the interest rates payable on certain inflation-linked securities may be adjusted according to a measure of inflation. As a result, the principal values of such securities do not adjust according to the rate of inflation, although the interest payable on such securities may decline during times of falling inflation.
191
Notes to Financial Statements (Unaudited) (Continued) |
The values of inflation-linked securities are expected to change in response to changes in real interest rates. Real interest rates are tied to the relationship between nominal interest rates and the rate of inflation. If nominal interest rates increase at a faster rate than inflation, real interest rates may rise, leading to a decrease in value of inflation-linked securities. Inflation-linked securities may cause a potential cash flow mismatch to investors, because an increase in the principal amount of an inflation-linked security will be treated as interest income currently subject to tax at ordinary income rates even though investors will not receive repayment of principal until maturity. If a Fund invests in such securities, it will be required to distribute such interest income in order to qualify for treatment as a regulated investment company and eliminate the Fund-level tax, without a corresponding receipt of cash, and therefore may be required to dispose of portfolio securities at a time when it may not be advantageous to do so in order to make such distributions.
Bank Loans
A Fund may invest in bank loans including, for example, corporate loans, loan participations, direct debt, bank debt, and bridge debt. A Fund may invest in a loan by lending money to a borrower directly as part of a syndicate of lenders. In a syndicated loan, the agent that originated and structured the loan typically administers and enforces the loan on behalf of the syndicate. Failure by the agent to fulfill its obligations may delay or adversely affect receipt of payment by a Fund. A Fund may also invest in loans through novations, assignments, and participation interests. In a novation, a Fund typically assumes all of the rights of a lending institution in a loan, including the right to receive payments of principal and interest and other amounts directly from the borrower and to enforce its rights as a lender directly against the borrower. When a Fund takes an assignment of a loan, the Fund acquires some or all of the interest of another lender (or assignee) in the loan. In such cases, the Fund may be required generally to rely upon the assignor to demand payment and enforce rights under the loan. If a Fund acquires a participation in the loan, the Fund purchases an indirect interest in a loan held by a third party and the Fund typically will have a contractual relationship only with the third party loan investor, not with the borrower. As a result, a Fund may have the right to receive payments of principal, interest, and any fees to which it is entitled only from the loan investor selling the participation and only upon receipt by such loan investor of such payments from the borrower. In such cases, a Fund assumes the credit risk of both the borrower and the loan investor selling the participation, and the Fund may be unable to realize some or all of the value of its interest in the loan in the event of the insolvency of the third party.
Changes in the financial condition of the borrower or economic conditions or other circumstances may reduce the capacity of the borrower to make principal and interest payments on such instruments and may lead to defaults. The value of any collateral securing a bank loan may decline after the Fund invests, and there is a risk that the value of the collateral may not be sufficient to cover the amount owed to the Fund.
The Total Return Bond Fund entered into certain loan agreements which are unfunded. The Total Return Bond Fund is obligated to fund these commitments at the borrower’s discretion. These commitments are disclosed in the Total Return Bond Fund’s Portfolio of Investments. At June 30, 2022, the Total Return Bond Fund had sufficient cash and/or securities to cover these commitments.
Repurchase Agreements
Each Fund may enter into repurchase agreements with certain banks and broker-dealers whereby a Fund acquires a security for cash and obtains a simultaneous commitment from the seller to repurchase the security at an agreed upon price and date. A Fund, through its custodian, takes possession of the securities collateralizing the repurchase agreement in a segregated account. Repurchase agreements must be fully collateralized at all times, but involve some risk to a Fund if the other party should default on its obligation and the Fund is delayed or prevented from recovering the collateral, or if the Fund is required to return collateral to a borrower at a time when it may realize a loss on the investment of that collateral.
When-Issued, Delayed-Delivery, Forward Commitment, and To-Be-Announced Transactions
A Fund may enter into when-issued, delayed-delivery, forward commitment, or to-be-announced (“TBA”) transactions (collectively, the “Forward Transactions”) in order to lock in the purchase price of the underlying security, or in order to adjust the interest rate exposure of the Fund’s existing portfolio. In Forward Transactions, a Fund commits to purchase or sell particular securities, with payment and delivery to take place at a future date. In the case of TBA purchase commitments, the unit price and
192
Notes to Financial Statements (Unaudited) (Continued) |
the estimated principal amount are established when the Fund enters into a commitment, with the actual principal amount being within a specified range of the estimate. Although a Fund does not typically pay for the securities in these types of transactions until they are delivered, it immediately assumes the risks of ownership, including the risk of price fluctuation. As a result, each of these types of transactions may create investment leverage in a Fund’s portfolio and increase the volatility of the Fund. If a Fund’s counterparty fails to deliver a security purchased in a Forward Transaction, there may be a loss, and the Fund may have missed an opportunity to make an alternative investment.
These securities are valued on the basis of valuations furnished by a pricing service, selected pursuant to procedures approved by the Trustees, which determines valuations taking into account appropriate factors such as institutional-size trading in similar groups of securities, yield, quality, coupon rate, maturity, type of issue, trading characteristics, and other market data. Securities for which no market quotation is available are valued at fair value in accordance with procedures approved by the Trustees. The Funds record on a daily basis the unrealized appreciation (depreciation) based upon changes in the values of these securities. When a Forward Transaction is closed, the Funds record a realized gain or loss equal to the difference between the value of the transaction at the time it was opened and the value of the transaction at the time it was closed.
Dollar Roll Transactions
A Fund may enter into dollar roll transactions, in which the Fund sells mortgage-backed securities for delivery in the current month and simultaneously contracts to purchase substantially similar securities on a specified future date from the same party. A Fund may invest in dollar rolls in order to benefit from anticipated changes in pricing for the mortgage-backed securities during the term of the transaction, or for the purpose of creating investment leverage. In a dollar roll, the securities that are to be purchased will be of the same type as the securities sold, but will be supported by different pools of mortgages.
Dollar rolls involve the risk that the Fund’s counterparty will be unable to deliver the mortgage-backed securities underlying the dollar roll at the fixed time. If the counterparty files for bankruptcy or becomes insolvent, a Fund’s use of the transaction proceeds may be restricted pending a determination by the counterparty or its representative, whether to enforce the Fund’s obligation to repurchase the securities. A Fund can incur a loss on a dollar roll transaction (either because its counterparty fails to perform or because the value of the mortgages subject to the transaction declines) and on the investments made by the Fund with the proceeds of the dollar roll transaction.
A Fund accounts for a dollar roll transaction as a purchase and sale whereby the difference in the sales price and purchase price of the security sold is recorded as a realized gain (loss). If certain criteria are met, these dollar roll transactions may be considered financing transactions, whereby the difference in the sales price and the future purchase price is recorded as an adjustment to interest income. Dollar roll transactions generally have the effect of creating leverage in a Fund’s portfolio.
Securities Lending
Each Fund, other than the Allocation Funds, Feeder Funds, and MML American Funds Core Allocation Fund, may lend its securities; however, lending cannot exceed 33% of the total assets of the Fund taken at current value. The Funds’ securities lending activities are governed by a Securities Lending Agency Agreement (“Lending Agreement”) between each Fund and the lending agent (“Agent”). The Lending Agreement authorizes the Agent to lend portfolio securities held by a Fund to approved borrowers (each, a “Borrower”).
Each Fund expects that in connection with any securities on loan, the loan will be secured continuously by collateral consisting of cash (U.S. currency) and/or securities (U.S. Treasury and Agency obligations) adjusted daily to have value at least equal to the current market value of the securities loaned. The market value of the loaned securities is determined at the close of business of a Fund and any additional collateral is delivered to the Fund the next business day. The Funds bear the risk of loss with respect to the investment of cash collateral. As with other extensions of credit, the Funds may bear the risk of delay in recovery of the loaned securities or even loss of rights in the collateral should the Borrower of the securities fail financially. Pursuant to the Lending Agreement, the Agent has provided indemnification to the Funds in the event of default by a Borrower with respect to a loan. The Funds receive compensation for lending their securities in the form of a securities loan fee paid by the Borrower, as
193
Notes to Financial Statements (Unaudited) (Continued) |
well as a share of the income earned on investment of the cash collateral received for the loaned securities. At June 30, 2022, the Funds’ collateral was equal to or greater than 100% of the market value of securities on loan and all of the Funds’ cash collateral was invested in the State Street Navigator Securities Lending Government Money Market Portfolio.
Subject to the terms of the Lending Agreement and the agreement between the Agent and the applicable Borrower (“Borrowing Agreement”), security loans can be terminated by the Agent, the Fund, or the Borrower and the related securities must be returned within the earlier of the customary settlement period for such securities or the period of time specified in the Borrowing Agreement.
The Funds employ the Agent to implement their securities lending program and the Agent receives a fee from the Funds for its services. In addition, the Funds may be required to pay a rebate to the Borrower. Accordingly, a Fund’s compensation for lending its securities is reduced by any such fees or rebate paid to the Agent or Borrower, respectively. Income received by the Funds in securities lending transactions during the period ended June 30, 2022, is reflected as securities lending income on the Statement of Operations.
Accounting for Investment Transactions
Investment transactions are accounted for on the trade date. Realized gains and losses on sales of investments and unrealized appreciation and depreciation of investments are computed by the specific identification cost method. Proceeds received from litigation, if any, are included in realized gains on investment transactions for any investments that are no longer held in the portfolio and as a reduction in cost for investments that continue to be held in the portfolio. Interest income, adjusted for amortization of discounts and premiums on debt securities, is earned from the settlement date and is recorded on the accrual basis. Dividend income is recorded on the ex-dividend date. Withholding taxes on foreign interest, dividends, and capital gains have been provided for in accordance with the applicable country’s tax rules and rates. Foreign dividend income is recorded on the ex-dividend date or as soon as practicable after the Fund determines the existence of a dividend declaration after exercising reasonable due diligence. Distributions received on securities that represent a return of capital or capital gains are recorded as a reduction of cost of investments and/or as a realized gain.
Foreign Currency Translation
The books and records of the Funds are maintained in U.S. dollars. The market values of foreign currencies, foreign securities, and other assets and liabilities denominated in foreign currencies are translated into U.S. dollars at the mean of the buying and selling rates of such currencies against the U.S. dollar at the end of each business day. Purchases and sales of foreign securities and income and expense items are translated at the rates of exchange prevailing on the respective dates of such transactions. The Funds do not isolate that portion of the results of operations arising from changes in the exchange rates from that portion arising from changes in the market prices of securities. Net realized foreign currency gains and losses resulting from changes in exchange rates include foreign currency gains and losses between trade date and settlement date on investment securities transactions, foreign currency transactions, and the difference between the amounts of dividends or interest recorded on the books of the Funds and the amount actually received.
Allocation of Operating Activity
In maintaining the records for the Funds, the income and expense accounts are allocated daily to each class of shares. Investment income and loss, and unrealized and realized gains or losses are prorated among the classes of shares based on the relative net assets of each. Expenses are allocated to each class of shares depending on the nature of the expenditures. Administration and service fees, if any, which are directly attributable to a class of shares, are charged to that class’s operations. Expenses of a Fund not directly attributable to the operations of any specific class of shares of the Fund are prorated among the classes to which the expense relates based on relative net assets or another alternative method.
194
Notes to Financial Statements (Unaudited) (Continued) |
In addition, each of the Allocation Funds, Feeder Funds, and MML American Funds Core Allocation Fund will also incur certain fees and expenses indirectly as a shareholder in the Underlying Funds or Master Funds. Because the Underlying Funds have varied expense and fee levels, and the Allocation Funds and MML American Funds Core Allocation Fund may own different proportions of Underlying Funds at different times, the amount of fees and expenses indirectly incurred by each of the Allocation Funds and MML American Funds Core Allocation Fund will vary.
Foreign Securities
The Global Fund invests a significant amount of its assets in foreign securities and each of the Foreign Fund and the International Equity Fund invests substantially all of its assets in foreign securities. The other Funds ,except for the Allocation Funds, Feeder Funds, and MML American Funds Core Allocation Fund, may also invest in foreign securities. In addition, certain Underlying Funds or Master Funds may invest in foreign securities. Foreign securities, including American Depositary Receipts, are subject to additional risks compared to securities of U.S. issuers, including international trade, currency, political, regulatory, and diplomatic risks. In addition, fluctuations in currency exchange rates may adversely affect the values of foreign securities and the price of a Fund’s shares. Emerging markets securities are subject to greater risks than securities issued in developed foreign markets, including less liquidity, greater price volatility, higher relative rates of inflation, greater political, economic, and social instability, greater custody and operational risks, and greater volatility in currency exchange rates.
Federal Income Tax
It is each Fund’s intent to continue to comply with the provisions of Subchapter M of the Code, applicable to a regulated investment company. Under such provisions, the Funds would not be subject to federal income taxes on their ordinary income and net realized capital gains to the extent they are distributed or deemed to have been distributed to their shareholders. Therefore, the Funds have not made any provision for federal income tax.
Dividends and Distributions to Shareholders
Dividends from net investment income and distributions of any net realized capital gains of each Fund are declared and paid annually and at other times as may be required to satisfy tax or regulatory requirements.
Distributions to shareholders are recorded on the ex-dividend date. Income and capital gain distributions are determined in accordance with income tax regulations, which may differ from generally accepted accounting principles. As a result, net investment income and net realized capital gains on investment transactions for a reporting period may differ significantly from distributions during such period.
3. | Advisory Fees and Other Transactions |
Investment Advisory Fees and Investment Subadvisers
MML Advisers, a wholly-owned subsidiary of MassMutual, serves as investment adviser to each Fund. Under the investment advisory agreements between MML Advisers and the Trust on behalf of each Fund, MML Advisers is responsible for providing investment management services for each Fund. In return for these services, MML Advisers receives advisory fees, based upon each Fund’s average daily net assets, computed and accrued daily and payable monthly, at the annual rates shown in the following table.
MML Advisers has also entered into investment subadvisory agreements for certain Funds with the unaffiliated investment subadviser(s) shown in the following table. MML Advisers pays a subadvisory fee to each of these subadvisers based upon the aggregate net assets under management which include (1) the average daily net assets of the specified Fund which it manages, and, if applicable, (2) the average daily net assets of other Funds or accounts of MML Advisers or its affiliates for which the subadviser provides subadvisory services.
195
Notes to Financial Statements (Unaudited) (Continued) |
The applicable Funds’ subadvisory fees are paid monthly by MML Advisers out of the advisory fees.
Fund | Investment Advisory Fee | Investment Subadviser(s) |
Conservative Allocation Fund | 0.10% | N/A |
Balanced Allocation Fund | 0.10% | N/A |
Moderate Allocation Fund | 0.10% | N/A |
Growth Allocation Fund | 0.10% | N/A |
Aggressive Allocation Fund | 0.10% | N/A |
MML American Funds Growth Fund | 0.15% on the first $500 million; and 0.125% on any excess over $500 million | N/A |
MML American Funds International Fund | 0.15% on the first $500 million; and 0.125% on any excess over $500 million | N/A |
MML American Funds Core Allocation Fund | 0.20% on the first $750 million; and 0.175% on any excess over $750 million | N/A |
Blue Chip Growth Fund | 0.75% on the first $400 million; and 0.70% on any excess over $400 million | T. Rowe Price Associates, Inc. |
Equity Income Fund | 0.75% on the first $500 million; and 0.70% on any excess over $500 million | T. Rowe Price Associates, Inc. |
Equity Index Fund | 0.10% on the first $500 million; and 0.08% on any excess over $500 million | Northern Trust Investments, Inc. |
Focused Equity Fund | 0.70% on the first $250 million; and 0.60% on any excess over $250 million | Wellington Management Company LLP |
Foreign Fund | 0.86% on the first $500 million; and 0.82% on any excess over $500 million | Thompson, Siegel & Walmsley LLC |
Fundamental Equity Fund | 0.60% on the first $250 million; and 0.58% on any excess over $250 million | Invesco Advisers, Inc. |
Fundamental Value Fund | 0.60% on the first $500 million; and 0.575% on any excess over $500 million | Boston Partners Global Investors, Inc. |
Global Fund | 0.60% on the first $500 million; and 0.55% on any excess over $500 million | Massachusetts Financial Services Company |
Income & Growth Fund | 0.65% on the first $500 million; and 0.60% on any excess over $500 million | Barrow, Hanley, Mewhinney & Strauss, LLC |
International Equity Fund | 0.80% on the first $250 million; and 0.75% on any excess over $250 million | Harris Associates L.P.; and Massachusetts Financial Services Company |
Large Cap Growth Fund | 0.65% on the first $500 million; and 0.60% on any excess over $500 million | Loomis, Sayles & Company, L.P. |
Managed Volatility Fund | 0.75% on the first $500 million; and 0.70% on any excess over $500 million | Gateway Investment Advisers, LLC |
Mid Cap Growth Fund* | 0.77% on the first $500 million; and 0.75% on any excess over $500 million | T. Rowe Price Associates, Inc.; and Wellington Management Company LLP |
Mid Cap Value Fund | 0.84% on the first $500 million; and 0.80% on any excess over $500 million | American Century Investment Management, Inc. |
Small Cap Growth Equity Fund | 1.04% on the first $200 million; and 1.00% on any excess over $200 million | Wellington Management Company LLP |
Small Company Value Fund | 0.80% on the first $150 million; and 0.70% on any excess over $150 million | American Century Investment Management, Inc. |
Small/Mid Cap Value Fund | 0.75% on the first $500 million; and 0.70% on any excess over $500 million | AllianceBernstein L.P. |
Sustainable Equity Fund** | 0.50% on the first $500 million; and 0.475% on any excess over $500 million | American Century Investment Management, Inc. |
Total Return Bond Fund | 0.40% on the first $500 million; and 0.38% on any excess over $500 million | Metropolitan West Asset Management, LLC |
* | Effective March 7, 2022, T. Rowe Price Investment Management, Inc. was added as a sub-subadviser to the portion of the Fund subadvised by T. Rowe Price Associates, Inc. |
196
Notes to Financial Statements (Unaudited) (Continued) |
** | Effective April 29, 2022, American Century Investment Management, Inc. replaced Massachusetts Financial Services Company as subadviser of the Fund. |
Administration Fees
For the Funds noted below, under a separate Administrative and Shareholder Services Agreement between the Trust and MML Advisers, on behalf of each Fund, MML Advisers is obligated to provide administrative and shareholder services and bear some of the Fund specific administrative expenses. In return for these services, MML Advisers receives an administrative services fee, based upon the average daily net assets of the applicable class of shares of the Funds, at the following annual rates:
| | Class I | Class II | Class III | Service
Class I |
MML American Funds Growth Fund | N/A | N/A | N/A | 0.25% |
MML American Funds International Fund | N/A | N/A | N/A | 0.25% |
MML American Funds Core Allocation Fund | N/A | N/A | N/A | 0.25% |
Equity Index Fund | 0.30% | 0.15% | None | 0.30% |
Focused Equity Fund | N/A | 0.15% | N/A | 0.15% |
Fundamental Equity Fund | N/A | 0.15% | N/A | 0.15% |
Fundamental Value Fund | N/A | 0.15% | N/A | 0.15% |
Global Fund | 0.15% | 0.15% | N/A | 0.15% |
International Equity Fund | N/A | 0.15% | N/A | 0.15% |
Small Company Value Fund | N/A | 0.15% | N/A | 0.15% |
Total Return Bond Fund | N/A | 0.15% | N/A | 0.15% |
Distribution and Service Fees
MML Distributors, LLC (the “Distributor”) acts as distributor to the Funds. Pursuant to a Distribution and Services Plan adopted by the Funds pursuant to Rule 12b-1 under the 1940 Act, Service Class shares and Service Class I shares of the Funds pay an annual fee of 0.25% of the average daily net asset value of Service Class shares and Service Class I shares. This fee, or a portion thereof, is paid to: (i) the Distributor for services provided and expenses incurred by it in connection with the distribution of Service Class shares or Service Class I shares, as applicable, of each Fund; and/or (ii) MassMutual for services provided and expenses incurred by it for purposes of maintaining or providing personal services to Service Class and Service Class I shareholders. The Distributor is a wholly-owned subsidiary of MassMutual.
Expense Caps and Waivers
MML Advisers has agreed to cap the fees and expenses of the Fund noted below (other than extraordinary legal and other expenses, interest expense, expenses related to borrowings, securities lending, leverage, taxes, and brokerage, short sale dividend and loan expense, or other non-recurring or unusual expenses such as organizational expenses and shareholder meeting expenses, as applicable) based upon the average daily net assets of the applicable class of shares of the Fund, as follows:
| | Service
Class I |
MML American Funds Core Allocation Fund* | 1.01% |
* | Expense cap in effect through April 30, 2023. |
MML Advisers has agreed to waive 0.10% of the advisory fee of the International Equity Fund through April 30, 2023.
MML Advisers has agreed to waive 0.15% of the advisory fee of the Small Company Value Fund through April 30, 2023.
197
Notes to Financial Statements (Unaudited) (Continued) |
MML Advisers has agreed to voluntarily waive 0.03% of the advisory fee of the Equity Income Fund. MML Advisers may amend or discontinue this waiver at any time without advance notice.
Effective May 1, 2022, MML Advisers has agreed to waive 0.01% of the advisory fee of the Foreign Fund through April 30, 2023. Prior to May 1, 2022, MML Advisers voluntarily waived 0.02% of the advisory fee of the Foreign Fund.
MML Advisers has agreed to waive 0.02% of the advisory fee of the Fundamental Value Fund through April 30, 2023.
MML Advisers has agreed to waive 0.03% of the advisory fee of the Small Cap Growth Equity Fund through April 30, 2023.
Expense caps and waiver amounts are reflected as a reduction of expenses on the Statements of Operations.
Rebated Brokerage Commissions
The Funds listed below have entered into agreements with certain brokers whereby the brokers will rebate to the Funds, in cash, a portion of brokerage commissions. Rebated brokerage commissions are amounts earned by the Funds and are included with realized gain or loss on investment transactions presented in the Statements of Operations. For the period ended June 30, 2022, brokerage commissions rebated under these agreements were as follows:
| | Rebated
Commissions |
Focused Equity Fund | $ 220 |
Foreign Fund | 2,207 |
Fundamental Equity Fund | 821 |
Income & Growth Fund | 119 |
Large Cap Growth Fund | 2,016 |
Managed Volatility Fund | 103 |
Mid Cap Growth Fund | 446 |
Small Cap Growth Equity Fund | 901 |
Small/Mid Cap Value Fund | 78 |
Deferred Compensation
Trustees of the Funds who are not officers or employees of MassMutual may elect to defer receipt of their annual fees in accordance with terms of a Non-Qualified Deferred Compensation Plan. Amounts deferred shall accrue interest or earnings and shall be recorded on the Funds’ books as other liabilities. Deferred compensation is included within Trustees’ fees and expenses in the Statements of Assets and Liabilities.
Other
Certain officers and trustees of the Funds may also be employees of MassMutual. The compensation of a trustee who is not an employee of MassMutual is borne by the Funds.
198
Notes to Financial Statements (Unaudited) (Continued) |
4. Purchases and Sales of Investments
Cost of purchases and proceeds from sales of investment securities (excluding short-term investments) and in Underlying Funds or Master Funds, for the period ended June 30, 2022, were as follows:
| | | Purchases | | | Sales | |
| | | Long-Term U.S.
Government
Securities | | | Other Long-Term
Securities | | | Long-Term U.S.
Government
Securities | | | Other Long-Term
Securities | |
Conservative Allocation Fund | | $ | — | | | $ | 17,242,918 | | | $ | — | | | $ | 39,024,649 | |
Balanced Allocation Fund | | | — | | | | 6,473,442 | | | | — | | | | 32,309,437 | |
Moderate Allocation Fund | | | — | | | | 19,890,457 | | | | — | | | | 152,196,507 | |
Growth Allocation Fund | | | — | | | | 27,269,275 | | | | — | | | | 88,376,632 | |
Aggressive Allocation Fund | | | — | | | | 10,042,604 | | | | — | | | | 18,568,517 | |
MML American Funds Growth Fund | | | — | | | | 39,453,666 | | | | — | | | | 10,229,881 | |
MML American Funds International Fund | | | — | | | | 8,496,628 | | | | — | | | | 2,748,672 | |
MML American Funds Core Allocation Fund | | | — | | | | 101,707,081 | | | | — | | | | 73,677,519 | |
Blue Chip Growth Fund | | | — | | | | 45,564,608 | | | | — | | | | 49,166,349 | |
Equity Income Fund | | | — | | | | 31,535,794 | | | | — | | | | 63,235,484 | |
Equity Index Fund | | | — | | | | 5,518,381 | | | | — | | | | 27,680,074 | |
Focused Equity Fund | | | — | | | | 61,561,389 | | | | — | | | | 67,364,926 | |
Foreign Fund | | | — | | | | 10,480,943 | | | | — | | | | 24,465,415 | |
Fundamental Equity Fund | | | — | | | | 45,143,886 | | | | — | | | | 57,629,879 | |
Fundamental Value Fund | | | — | | | | 23,433,004 | | | | — | | | | 31,778,393 | |
Global Fund | | | — | | | | 6,106,624 | | | | — | | | | 26,700,369 | |
Income & Growth Fund | | | — | | | | 38,824,517 | | | | — | | | | 52,926,580 | |
International Equity Fund | | | — | | | | 23,521,703 | | | | — | | | | 22,386,551 | |
Large Cap Growth Fund | | | — | | | | 34,272,312 | | | | — | | | | 33,754,086 | |
Managed Volatility Fund | | | — | | | | 6,237,697 | | | | — | | | | 6,165,863 | |
Mid Cap Growth Fund | | | — | | | | 58,353,107 | | | | — | | | | 78,087,278 | |
Mid Cap Value Fund | | | — | | | | 130,266,426 | | | | — | | | | 153,079,736 | |
Small Cap Growth Equity Fund | | | — | | | | 63,497,003 | | | | — | | | | 67,891,097 | |
Small Company Value Fund | | | — | | | | 20,193,864 | | | | — | | | | 24,157,830 | |
Small/Mid Cap Value Fund | | | — | | | | 37,202,009 | | | | — | | | | 49,178,322 | |
Sustainable Equity Fund | | | — | | | | 104,715,962 | | | | — | | | | 110,536,076 | |
Total Return Bond Fund | | | 842,904,372 | | | | 44,561,483 | | | | 901,388,049 | | | | 36,176,074 | |
The Funds may purchase from, or sell securities to, other affiliated Funds under procedures adopted by the Trustees. These procedures have been designed to ensure that cross trades conducted by the Funds comply with Rule 17a-7 under the 1940 Act. The cross trades disclosed in the table below are included within the respective purchases and sales amounts shown in the table above, as applicable.
| | Purchases | Sales | Realized
Gains/Losses |
Focused Equity Fund | $ — | $ 3,241,427 | $ 974,628 |
Global Fund | — | 194,335 | 90,942 |
International Equity Fund | — | 47,496 | (2,833) |
Mid Cap Growth Fund | 118,534 | 189,364 | 78,822 |
Mid Cap Value Fund | 378,054 | — | — |
Small Cap Growth Equity Fund | — | 25,107 | 7,099 |
199
Notes to Financial Statements (Unaudited) (Continued) |
5. Capital Share Transactions
Changes in shares outstanding for each Fund were as follows:
| | | Six Months Ended June 30, 2022 | | | Year Ended December 31, 2021 | |
| | | Shares | | | Amount | | | Shares | | | Amount | |
Conservative Allocation Fund Initial Class | | | | | | | | | | | | | | | | |
Sold | | | 579,843 | | | $ | 5,643,034 | | | | 1,317,401 | | | $ | 14,142,765 | |
Issued as reinvestment of dividends | | | — | | | | — | | | | 350,160 | | | | 3,732,707 | |
Redeemed | | | (783,039 | ) | | | (7,624,193 | ) | | | (3,017,345 | ) | | | (32,162,085 | ) |
Net increase (decrease) | | | (203,196 | ) | | $ | (1,981,159 | ) | | | (1,349,784 | ) | | $ | (14,286,613 | ) |
Conservative Allocation Fund Service Class | | | | | | | | | | | | | | | �� | |
Sold | | | 1,263,879 | | | $ | 12,448,198 | | | | 3,213,504 | | | $ | 33,738,624 | |
Issued as reinvestment of dividends | | | — | | | | — | | | | 1,172,402 | | | | 12,357,121 | |
Redeemed | | | (3,216,923 | ) | | | (31,635,337 | ) | | | (7,919,464 | ) | | | (83,382,472 | ) |
Net increase (decrease) | | | (1,953,044 | ) | | $ | (19,187,139 | ) | | | (3,533,558 | ) | | $ | (37,286,727 | ) |
Balanced Allocation Fund Initial Class | | | | | | | | | | | | | | | | |
Sold | | | 302,734 | | | $ | 3,043,315 | | | | 877,652 | | | $ | 9,456,200 | |
Issued as reinvestment of dividends | | | — | | | | — | | | | 421,294 | | | | 4,524,699 | |
Redeemed | | | (804,637 | ) | | | (7,945,945 | ) | | | (2,135,654 | ) | | | (22,902,494 | ) |
Net increase (decrease) | | | (501,903 | ) | | $ | (4,902,630 | ) | | | (836,708 | ) | | $ | (8,921,595 | ) |
Balanced Allocation Fund Service Class | | | | | | | | | | | | | | | | |
Sold | | | 693,152 | | | $ | 6,797,479 | | | | 1,625,967 | | | $ | 17,295,303 | |
Issued as reinvestment of dividends | | | — | | | | — | | | | 1,381,643 | | | | 14,700,679 | |
Redeemed | | | (2,757,469 | ) | | | (27,019,777 | ) | | | (5,807,202 | ) | | | (61,857,134 | ) |
Net increase (decrease) | | | (2,064,317 | ) | | $ | (20,222,298 | ) | | | (2,799,592 | ) | | $ | (29,861,152 | ) |
Moderate Allocation Fund Initial Class | | | | | | | | | | | | | | | | |
Sold | | | 363,249 | | | $ | 3,788,957 | | | | 862,377 | | | $ | 9,880,653 | |
Issued as reinvestment of dividends | | | — | | | | — | | | | 1,267,120 | | | | 14,369,142 | |
Redeemed | | | (1,892,820 | ) | | | (20,145,236 | ) | | | (5,411,452 | ) | | | (61,480,057 | ) |
Net increase (decrease) | | | (1,529,571 | ) | | $ | (16,356,279 | ) | | | (3,281,955 | ) | | $ | (37,230,262 | ) |
Moderate Allocation Fund Service Class | | | | | | | | | | | | | | | | |
Sold | | | 719,787 | | | $ | 7,551,351 | | | | 1,516,893 | | | $ | 17,134,928 | |
Issued as reinvestment of dividends | | | — | | | | — | | | | 6,501,705 | | | | 72,819,090 | |
Redeemed | | | (11,556,016 | ) | | | (120,816,155 | ) | | | (26,871,869 | ) | | | (302,224,803 | ) |
Net increase (decrease) | | | (10,836,229 | ) | | $ | (113,264,804 | ) | | | (18,853,271 | ) | | $ | (212,270,785 | ) |
Growth Allocation Fund Initial Class | | | | | | | | | | | | | | | | |
Sold | | | 391,181 | | | $ | 3,592,157 | | | | 1,318,991 | | | $ | 13,173,938 | |
Issued as reinvestment of dividends | | | — | | | | — | | | | 2,628,953 | | | | 26,000,345 | |
Redeemed | | | (2,747,153 | ) | | | (25,173,976 | ) | | | (8,729,559 | ) | | | (86,079,175 | ) |
Net increase (decrease) | | | (2,355,972 | ) | | $ | (21,581,819 | ) | | | (4,781,615 | ) | | $ | (46,904,892 | ) |
Growth Allocation Fund Service Class | | | | | | | | | | | | | | | | |
Sold | | | 1,385,938 | | | $ | 12,585,810 | | | | 1,363,263 | | | $ | 13,444,521 | |
Issued as reinvestment of dividends | | | — | | | | — | | | | 4,410,028 | | | | 43,218,278 | |
Redeemed | | | (5,503,619 | ) | | | (50,546,394 | ) | | | (14,314,207 | ) | | | (140,005,620 | ) |
Net increase (decrease) | | | (4,117,681 | ) | | $ | (37,960,584 | ) | | | (8,540,916 | ) | | $ | (83,342,821 | ) |
200
Notes to Financial Statements (Unaudited) (Continued) |
| | | Six Months Ended June 30, 2022 | | | Year Ended December 31, 2021 | |
| | | Shares | | | Amount | | | Shares | | | Amount | |
Aggressive Allocation Fund Initial Class | | | | | | | | | | | | | | | | |
Sold | | | 320,230 | | | $ | 3,475,962 | | | | 522,864 | | | $ | 6,030,795 | |
Issued as reinvestment of dividends | | | — | | | | — | | | | 332,777 | | | | 3,793,658 | |
Redeemed | | | (739,703 | ) | | | (7,930,961 | ) | | | (899,303 | ) | | | (10,384,734 | ) |
Net increase (decrease) | | | (419,473 | ) | | $ | (4,454,999 | ) | | | (43,662 | ) | | $ | (560,281 | ) |
Aggressive Allocation Fund Service Class | | | | | | | | | | | | | | | | |
Sold | | | 171,059 | | | $ | 1,834,631 | | | | 561,991 | | | $ | 6,286,103 | |
Issued as reinvestment of dividends | | | — | | | | — | | | | 444,372 | | | | 4,972,518 | |
Redeemed | | | (552,633 | ) | | | (5,677,115 | ) | | | (1,734,728 | ) | | | (19,572,868 | ) |
Net increase (decrease) | | | (381,574 | ) | | $ | (3,842,484 | ) | | | (728,365 | ) | | $ | (8,314,247 | ) |
MML American Funds Growth Fund Service Class I | | | | | | | | | | | | | | | | |
Sold | | | 746,233 | | | $ | 13,432,331 | | | | 1,421,642 | | | $ | 30,291,273 | |
Issued as reinvestment of dividends | | | — | | | | — | | | | 705,801 | | | | 15,195,901 | |
Redeemed | | | (827,445 | ) | | | (15,667,638 | ) | | | (2,302,374 | ) | | | (49,329,330 | ) |
Net increase (decrease) | | | (81,212 | ) | | $ | (2,235,307 | ) | | | (174,931 | ) | | $ | (3,842,156 | ) |
MML American Funds International Fund Service Class I | | | | | | | | | | | | | | | | |
Sold | | | 289,825 | | | $ | 2,692,308 | | | | 830,093 | | | $ | 8,945,240 | |
Issued as reinvestment of dividends | | | — | | | | — | | | | 88,810 | | | | 977,803 | |
Redeemed | | | (400,647 | ) | | | (3,654,622 | ) | | | (842,683 | ) | | | (9,256,233 | ) |
Net increase (decrease) | | | (110,822 | ) | | $ | (962,314 | ) | | | 76,220 | | | $ | 666,810 | |
MML American Funds Core Allocation Fund Service Class I | | | | | | | | | | | | | | | | |
Sold | | | 951,899 | | | $ | 11,615,543 | | | | 1,930,223 | | | $ | 24,669,541 | |
Issued as reinvestment of dividends | | | — | | | | — | | | | 2,724,122 | | | | 35,113,927 | |
Redeemed | | | (5,725,373 | ) | | | (69,866,070 | ) | | | (11,603,125 | ) | | | (148,825,664 | ) |
Net increase (decrease) | | | (4,773,474 | ) | | $ | (58,250,527 | ) | | | (6,948,780 | ) | | $ | (89,042,196 | ) |
Blue Chip Growth Fund Initial Class | | | | | | | | | | | | | | | | |
Sold | | | 1,401,989 | | | $ | 24,873,843 | | | | 3,597,688 | | | $ | 81,865,367 | |
Issued as reinvestment of dividends | | | — | | | | — | | | | 1,759,868 | | | | 38,541,114 | |
Redeemed | | | (1,401,846 | ) | | | (23,837,244 | ) | | | (2,825,029 | ) | | | (61,178,869 | ) |
Net increase (decrease) | | | 143 | | | $ | 1,036,599 | | | | 2,532,527 | | | $ | 59,227,612 | |
Blue Chip Growth Fund Service Class | | | | | | | | | | | | | | | | |
Sold | | | 364,704 | | | $ | 5,566,856 | | | | 631,588 | | | $ | 12,914,196 | |
Issued as reinvestment of dividends | | | — | | | | — | | | | 1,016,899 | | | | 20,907,454 | |
Redeemed | | | (580,954 | ) | | | (9,006,486 | ) | | | (981,051 | ) | | | (20,141,575 | ) |
Net increase (decrease) | | | (216,250 | ) | | $ | (3,439,630 | ) | | | 667,436 | | | $ | 13,680,075 | |
Equity Income Fund Initial Class | | | | | | | | | | | | | | | | |
Sold | | | 212,682 | | | $ | 2,607,403 | | | | 2,692,533 | | | $ | 32,621,441 | |
Issued as reinvestment of dividends | | | — | | | | — | | | | 1,222,838 | | | | 14,539,543 | |
Redeemed | | | (2,868,553 | ) | | | (35,331,525 | ) | | | (9,632,127 | ) | | | (112,733,855 | ) |
Net increase (decrease) | | | (2,655,871 | ) | | $ | (32,724,122 | ) | | | (5,716,756 | ) | | $ | (65,572,871 | ) |
Equity Income Fund Service Class | | | | | | | | | | | | | | | | |
Sold | | | 342,744 | | | $ | 4,133,365 | | | | 389,998 | | | $ | 4,508,653 | |
Issued as reinvestment of dividends | | | — | | | | — | | | | 304,126 | | | | 3,561,313 | |
Redeemed | | | (611,352 | ) | | | (7,398,129 | ) | | | (1,580,650 | ) | | | (18,283,528 | ) |
Net increase (decrease) | | | (268,608 | ) | | $ | (3,264,764 | ) | | | (886,526 | ) | | $ | (10,213,562 | ) |
201
Notes to Financial Statements (Unaudited) (Continued) |
| | | Six Months Ended June 30, 2022 | | | Year Ended December 31, 2021 | |
| | | Shares | | | Amount | | | Shares | | | Amount | |
Equity Index Fund Class I | | | | | | | | | | | | | | | | |
Sold | | | 40,272 | | | $ | 1,250,167 | | | | 152,663 | | | $ | 4,732,504 | |
Issued as reinvestment of dividends | | | — | | | | — | | | | 102,868 | | | | 3,410,078 | |
Redeemed | | | (137,599 | ) | | | (4,401,242 | ) | | | (502,825 | ) | | | (16,221,358 | ) |
Net increase (decrease) | | | (97,327 | ) | | $ | (3,151,075 | ) | | | (247,294 | ) | | $ | (8,078,776 | ) |
Equity Index Fund Class II | | | | | | | | | | | | | | | | |
Sold | | | 136,275 | | | $ | 4,359,184 | | | | 374,280 | | | $ | 12,166,442 | |
Issued as reinvestment of dividends | | | — | | | | — | | | | 470,988 | | | | 15,589,702 | |
Redeemed | | | (305,784 | ) | | | (9,698,302 | ) | | | (590,486 | ) | | | (19,029,879 | ) |
Net increase (decrease) | | | (169,509 | ) | | $ | (5,339,118 | ) | | | 254,782 | | | $ | 8,726,265 | |
Equity Index Fund Class III | | | | | | | | | | | | | | | | |
Sold | | | 40,260 | | | $ | 1,213,185 | | | | 37,959 | | | $ | 1,237,022 | |
Issued as reinvestment of dividends | | | — | | | | — | | | | 584,714 | | | | 19,307,250 | |
Redeemed | | | (347,476 | ) | | | (11,483,069 | ) | | | (1,007,733 | ) | | | (32,306,205 | ) |
Net increase (decrease) | | | (307,216 | ) | | $ | (10,269,884 | ) | | | (385,060 | ) | | $ | (11,761,933 | ) |
Equity Index Fund Service Class I | | | | | | | | | | | | | | | | |
Sold | | | 167,444 | | | $ | 5,072,089 | | | | 266,450 | | | $ | 8,421,480 | |
Issued as reinvestment of dividends | | | — | | | | — | | | | 92,362 | | | | 2,915,856 | |
Redeemed | | | (287,068 | ) | | | (8,759,445 | ) | | | (392,561 | ) | | | (12,324,026 | ) |
Net increase (decrease) | | | (119,624 | ) | | $ | (3,687,356 | ) | | | (33,749 | ) | | $ | (986,690 | ) |
Focused Equity Fund Class II | | | | | | | | | | | | | | | | |
Sold | | | 1,575,704 | | | $ | 12,690,906 | | | | 6,913,546 | | | $ | 55,330,646 | |
Issued as reinvestment of dividends | | | — | | | | — | | | | 2,459,455 | | | | 19,232,937 | |
Redeemed | | | (2,509,172 | ) | | | (19,668,597 | ) | | | (6,847,984 | ) | | | (52,258,602 | ) |
Net increase (decrease) | | | (933,468 | ) | | $ | (6,977,691 | ) | | | 2,525,017 | | | $ | 22,304,981 | |
Focused Equity Fund Service Class I | | | | | | | | | | | | | | | | |
Sold | | | 229,195 | | | $ | 1,703,661 | | | | 294,885 | | | $ | 2,200,618 | |
Issued as reinvestment of dividends | | | — | | | | — | | | | 190,972 | | | | 1,434,203 | |
Redeemed | | | (276,821 | ) | | | (2,057,625 | ) | | | (417,907 | ) | | | (3,132,026 | ) |
Net increase (decrease) | | | (47,626 | ) | | $ | (353,964 | ) | | | 67,950 | | | $ | 502,795 | |
Foreign Fund Initial Class | | | | | | | | | | | | | | | | |
Sold | | | 147,861 | | | $ | 1,500,925 | | | | 698,911 | | | $ | 7,592,093 | |
Issued as reinvestment of dividends | | | — | | | | — | | | | 584,116 | | | | 6,407,754 | |
Redeemed | | | (2,036,502 | ) | | | (20,596,638 | ) | | | (6,384,869 | ) | | | (69,471,315 | ) |
Net increase (decrease) | | | (1,888,641 | ) | | $ | (19,095,713 | ) | | | (5,101,842 | ) | | $ | (55,471,468 | ) |
Foreign Fund Service Class | | | | | | | | | | | | | | | | |
Sold | | | 21,009 | | | $ | 209,240 | | | | 34,152 | | | $ | 369,219 | |
Issued as reinvestment of dividends | | | — | | | | — | | | | 17,609 | | | | 192,117 | |
Redeemed | | | (49,648 | ) | | | (501,761 | ) | | | (153,281 | ) | | | (1,652,596 | ) |
Net increase (decrease) | | | (28,639 | ) | | $ | (292,521 | ) | | | (101,520 | ) | | $ | (1,091,260 | ) |
Fundamental Equity Fund Class II | | | | | | | | | | | | | | | | |
Sold | | | 109,806 | | | $ | 1,223,043 | | | | 4,573,320 | | | $ | 57,115,425 | |
Issued as reinvestment of dividends | | | — | | | | — | | | | 1,459,021 | | | | 17,289,403 | |
Redeemed | | | (1,250,544 | ) | | | (13,927,882 | ) | | | (3,512,142 | ) | | | (41,645,625 | ) |
Net increase (decrease) | | | (1,140,738 | ) | | $ | (12,704,839 | ) | | | 2,520,199 | | | $ | 32,759,203 | |
Fundamental Equity Fund Service Class I | | | | | | | | | | | | | | | | |
Sold | | | 163,975 | | | $ | 1,755,059 | | | | 264,135 | | | $ | 3,035,868 | |
Issued as reinvestment of dividends | | | — | | | | — | | | | 177,196 | | | | 2,011,177 | |
Redeemed | | | (152,918 | ) | | | (1,619,276 | ) | | | (280,442 | ) | | | (3,201,701 | ) |
Net increase (decrease) | | | 11,057 | | | $ | 135,783 | | | | 160,889 | | | $ | 1,845,344 | |
202
Notes to Financial Statements (Unaudited) (Continued) |
| | | Six Months Ended June 30, 2022 | | | Year Ended December 31, 2021 | |
| | | Shares | | | Amount | | | Shares | | | Amount | |
Fundamental Value Fund Class II | | | | | | | | | | | | | | | | |
Sold | | | 70,004 | | | $ | 1,010,602 | | | | 130,603 | | | $ | 1,785,480 | |
Issued as reinvestment of dividends | | | — | | | | — | | | | 208,878 | | | | 2,957,707 | |
Redeemed | | | (766,888 | ) | | | (11,132,753 | ) | | | (4,068,912 | ) | | | (55,733,688 | ) |
Net increase (decrease) | | | (696,884 | ) | | $ | (10,122,151 | ) | | | (3,729,431 | ) | | $ | (50,990,501 | ) |
Fundamental Value Fund Service Class I | | | | | | | | | | | | | | | | |
Sold | | | 277,847 | | | $ | 3,927,849 | | | | 343,977 | | | $ | 4,659,686 | |
Issued as reinvestment of dividends | | | — | | | | — | | | | 22,597 | | | | 312,511 | |
Redeemed | | | (160,673 | ) | | | (2,254,970 | ) | | | (250,312 | ) | | | (3,341,630 | ) |
Net increase (decrease) | | | 117,174 | | | $ | 1,672,879 | | | | 116,262 | | | $ | 1,630,567 | |
Global Fund Class I | | | | | | | | | | | | | | | | |
Sold | | | 293,432 | | | $ | 3,929,699 | | | | 814,729 | | | $ | 12,513,054 | |
Issued as reinvestment of dividends | | | — | | | | — | | | | 2,324,803 | | | | 33,942,130 | |
Redeemed | | | (1,793,292 | ) | | | (23,679,005 | ) | | | (18,836,865 | ) | | | (278,356,201 | ) |
Net increase (decrease) | | | (1,499,860 | ) | | $ | (19,749,306 | ) | | | (15,697,333 | ) | | $ | (231,901,017 | ) |
Global Fund Class II | | | | | | | | | | | | | | | | |
Sold | | | 21,907 | | | $ | 295,225 | | | | 36,326 | | | $ | 558,440 | |
Issued as reinvestment of dividends | | | — | | | | — | | | | 124,085 | | | | 1,862,521 | |
Redeemed | | | (71,142 | ) | | | (958,931 | ) | | | (139,227 | ) | | | (2,127,058 | ) |
Net increase (decrease) | | | (49,235 | ) | | $ | (663,706 | ) | | | 21,184 | | | $ | 293,903 | |
Global Fund Service Class I | | | | | | | | | | | | | | | | |
Sold | | | 50,843 | | | $ | 655,817 | | | | 115,794 | | | $ | 1,716,730 | |
Issued as reinvestment of dividends | | | — | | | | — | | | | 132,206 | | | | 1,901,117 | |
Redeemed | | | (91,995 | ) | | | (1,187,465 | ) | | | (222,281 | ) | | | (3,225,224 | ) |
Net increase (decrease) | | | (41,152 | ) | | $ | (531,648 | ) | | | 25,719 | | | $ | 392,623 | |
Income & Growth Fund Initial Class | | | | | | | | | | | | | | | | |
Sold | | | 202,906 | | | $ | 2,457,375 | | | | 285,316 | | | $ | 3,304,306 | |
Issued as reinvestment of dividends | | | — | | | | — | | | | 331,393 | | | | 3,966,776 | |
Redeemed | | | (1,238,658 | ) | | | (15,158,785 | ) | | | (6,897,198 | ) | | | (79,098,817 | ) |
Net increase (decrease) | | | (1,035,752 | ) | | $ | (12,701,410 | ) | | | (6,280,489 | ) | | $ | (71,827,735 | ) |
Income & Growth Fund Service Class | | | | | | | | | | | | | | | | |
Sold | | | 94,078 | | | $ | 1,109,525 | | | | 175,639 | | | $ | 2,029,727 | |
Issued as reinvestment of dividends | | | — | | | | — | | | | 41,070 | | | | 483,810 | |
Redeemed | | | (198,250 | ) | | | (2,370,325 | ) | | | (374,578 | ) | | | (4,228,253 | ) |
Net increase (decrease) | | | (104,172 | ) | | $ | (1,260,800 | ) | | | (157,869 | ) | | $ | (1,714,716 | ) |
International Equity Fund Class II | | | | | | | | | | | | | | | | |
Sold | | | 846,252 | | | $ | 8,534,911 | | | | 9,069,663 | | | $ | 101,495,259 | |
Issued as reinvestment of dividends | | | — | | | | — | | | | 95,386 | | | | 1,043,524 | |
Redeemed | | | (1,088,537 | ) | | | (10,868,997 | ) | | | (2,682,521 | ) | | | (29,216,624 | ) |
Net increase (decrease) | | | (242,285 | ) | | $ | (2,334,086 | ) | | | 6,482,528 | | | $ | 73,322,159 | |
International Equity Fund Service Class I | | | | | | | | | | | | | | | | |
Sold | | | 50,090 | | | $ | 505,132 | | | | 171,454 | | | $ | 1,857,514 | |
Issued as reinvestment of dividends | | | — | | | | — | | | | 3,620 | | | | 39,246 | |
Redeemed | | | (60,544 | ) | | | (580,725 | ) | | | (114,321 | ) | | | (1,236,976 | ) |
Net increase (decrease) | | | (10,454 | ) | | $ | (75,593 | ) | | | 60,753 | | | $ | 659,784 | |
Large Cap Growth Fund Initial Class | | | | | | | | | | | | | | | | |
Sold | | | 737,482 | | | $ | 9,715,348 | | | | 5,215,773 | | | $ | 82,059,146 | |
Issued as reinvestment of dividends | | | — | | | | — | | | | 1,018,671 | | | | 15,351,370 | |
Redeemed | | | (890,522 | ) | | | (11,334,877 | ) | | | (1,757,405 | ) | | | (26,173,408 | ) |
Net increase (decrease) | | | (153,040 | ) | | $ | (1,619,529 | ) | | | 4,477,039 | | | $ | 71,237,108 | |
203
Notes to Financial Statements (Unaudited) (Continued) |
| | | Six Months Ended June 30, 2022 | | | Year Ended December 31, 2021 | |
| | | Shares | | | Amount | | | Shares | | | Amount | |
Large Cap Growth Fund Service Class | | | | | | | | | | | | | | | | |
Sold | | | 81,297 | | | $ | 992,152 | | | | 219,583 | | | $ | 3,134,867 | |
Issued as reinvestment of dividends | | | — | | | | — | | | | 176,765 | | | | 2,540,115 | |
Redeemed | | | (113,169 | ) | | | (1,355,704 | ) | | | (246,696 | ) | | | (3,512,946 | ) |
Net increase (decrease) | | | (31,872 | ) | | $ | (363,552 | ) | | | 149,652 | | | $ | 2,162,036 | |
Managed Volatility Fund Initial Class | | | | | | | | | | | | | | | | |
Sold | | | 64,565 | | | $ | 920,648 | | | | 456,777 | | | $ | 6,665,778 | |
Issued as reinvestment of dividends | | | — | | | | — | | | | 74,816 | | | | 1,116,050 | |
Redeemed | | | (926,374 | ) | | | (13,125,600 | ) | | | (1,469,731 | ) | | | (21,315,336 | ) |
Net increase (decrease) | | | (861,809 | ) | | $ | (12,204,952 | ) | | | (938,138 | ) | | $ | (13,533,508 | ) |
Managed Volatility Fund Service Class | | | | | | | | | | | | | | | | |
Sold | | | 69,218 | | | $ | 979,755 | | | | 76,169 | | | $ | 1,111,406 | |
Issued as reinvestment of dividends | | | — | | | | — | | | | 12,773 | | | | 189,127 | |
Redeemed | | | (181,826 | ) | | | (2,571,752 | ) | | | (336,632 | ) | | | (4,870,897 | ) |
Net increase (decrease) | | | (112,608 | ) | | $ | (1,591,997 | ) | | | (247,690 | ) | | $ | (3,570,364 | ) |
Mid Cap Growth Fund Initial Class | | | | | | | | | | | | | | | | |
Sold | | | 503,002 | | | $ | 7,052,360 | | | | 376,598 | | | $ | 6,871,013 | |
Issued as reinvestment of dividends | | | — | | | | — | | | | 4,417,734 | | | | 73,246,023 | |
Redeemed | | | (1,508,085 | ) | | | (20,602,389 | ) | | | (8,013,135 | ) | | | (149,695,101 | ) |
Net increase (decrease) | | | (1,005,083 | ) | | $ | (13,550,029 | ) | | | (3,218,803 | ) | | $ | (69,578,065 | ) |
Mid Cap Growth Fund Service Class | | | | | | | | | | | | | | | | |
Sold | | | 267,235 | | | $ | 3,308,039 | | | | 261,708 | | | $ | 4,464,715 | |
Issued as reinvestment of dividends | | | — | | | | — | | | | 1,643,671 | | | | 25,312,531 | |
Redeemed | | | (483,578 | ) | | | (6,084,599 | ) | | | (1,095,218 | ) | | | (18,705,380 | ) |
Net increase (decrease) | | | (216,343 | ) | | $ | (2,776,560 | ) | | | 810,161 | | | $ | 11,071,866 | |
Mid Cap Value Fund Initial Class | | | | | | | | | | | | | | | | |
Sold | | | 145,231 | | | $ | 1,815,734 | | | | 516,336 | | | $ | 6,216,110 | |
Issued as reinvestment of dividends | | | — | | | | — | | | | 951,546 | | | | 11,485,165 | |
Redeemed | | | (2,369,910 | ) | | | (29,678,524 | ) | | | (10,898,765 | ) | | | (131,002,972 | ) |
Net increase (decrease) | | | (2,224,679 | ) | | $ | (27,862,790 | ) | | | (9,430,883 | ) | | $ | (113,301,697 | ) |
Mid Cap Value Fund Service Class | | | | | | | | | | | | | | | | |
Sold | | | 291,286 | | | $ | 3,561,743 | | | | 207,527 | | | $ | 2,459,200 | |
Issued as reinvestment of dividends | | | — | | | | — | | | | 167,209 | | | | 1,976,411 | |
Redeemed | | | (438,616 | ) | | | (5,362,005 | ) | | | (790,210 | ) | | | (9,257,145 | ) |
Net increase (decrease) | | | (147,330 | ) | | $ | (1,800,262 | ) | | | (415,474 | ) | | $ | (4,821,534 | ) |
Small Cap Growth Equity Fund Initial Class | | | | | | | | | | | | | | | | |
Sold | | | 555,156 | | | $ | 6,802,702 | | | | 752,478 | | | $ | 12,451,857 | |
Issued as reinvestment of dividends | | | — | | | | — | | | | 1,745,045 | | | | 26,449,940 | |
Redeemed | | | (749,714 | ) | | | (9,829,974 | ) | | | (2,310,590 | ) | | | (39,579,287 | ) |
Net increase (decrease) | | | (194,558 | ) | | $ | (3,027,272 | ) | | | 186,933 | | | $ | (677,490 | ) |
Small Cap Growth Equity Fund Service Class | | | | | | | | | | | | | | | | |
Sold | | | 101,405 | | | $ | 1,179,118 | | | | 274,287 | | | $ | 4,200,610 | |
Issued as reinvestment of dividends | | | — | | | | — | | | | 404,553 | | | | 5,524,203 | |
Redeemed | | | (195,840 | ) | | | (2,262,979 | ) | | | (314,080 | ) | | | (4,881,908 | ) |
Net increase (decrease) | | | (94,435 | ) | | $ | (1,083,861 | ) | | | 364,760 | | | $ | 4,842,905 | |
204
Notes to Financial Statements (Unaudited) (Continued) |
| | | Six Months Ended June 30, 2022 | | | Year Ended December 31, 2021 | |
| | | Shares | | | Amount | | | Shares | | | Amount | |
Small Company Value Fund Class II | | | | | | | | | | | | | | | | |
Sold | | | 26,072 | | | $ | 433,032 | | | | 49,542 | | | $ | 857,690 | |
Issued as reinvestment of dividends | | | — | | | | — | | | | 252,697 | | | | 4,232,677 | |
Redeemed | | | (247,386 | ) | | | (4,097,367 | ) | | | (851,408 | ) | | | (14,552,025 | ) |
Net increase (decrease) | | | (221,314 | ) | | $ | (3,664,335 | ) | | | (549,169 | ) | | $ | (9,461,658 | ) |
Small Company Value Fund Service Class I | | | | | | | | | | | | | | | | |
Sold | | | 64,290 | | | $ | 1,016,555 | | | | 220,846 | | | $ | 3,680,415 | |
Issued as reinvestment of dividends | | | — | | | | — | | | | 120,049 | | | | 1,927,989 | |
Redeemed | | | (110,020 | ) | | | (1,731,955 | ) | | | (342,502 | ) | | | (5,649,993 | ) |
Net increase (decrease) | | | (45,730 | ) | | $ | (715,400 | ) | | | (1,607 | ) | | $ | (41,589 | ) |
Small/Mid Cap Value Fund Initial Class | | | | | | | | | | | | | | | | |
Sold | | | 143,192 | | | $ | 1,856,400 | | | | 251,132 | | | $ | 3,419,445 | |
Issued as reinvestment of dividends | | | — | | | | — | | | | 113,828 | | | | 1,587,906 | |
Redeemed | | | (813,705 | ) | | | (11,068,626 | ) | | | (5,230,139 | ) | | | (70,112,629 | ) |
Net increase (decrease) | | | (670,513 | ) | | $ | (9,212,226 | ) | | | (4,865,179 | ) | | $ | (65,105,278 | ) |
Small/Mid Cap Value Fund Service Class | | | | | | | | | | | | | | | | |
Sold | | | 68,925 | | | $ | 921,442 | | | | 487,440 | | | $ | 6,596,608 | |
Issued as reinvestment of dividends | | | — | | | | — | | | | 17,413 | | | | 239,776 | |
Redeemed | | | (136,347 | ) | | | (1,803,668 | ) | | | (507,167 | ) | | | (6,713,263 | ) |
Net increase (decrease) | | | (67,422 | ) | | $ | (882,226 | ) | | | (2,314 | ) | | $ | 123,121 | |
Sustainable Equity Fund Initial Class | | | | | | | | | | | | | | | | |
Sold | | | 46,528 | | | $ | 1,037,553 | | | | 66,627 | | | $ | 1,538,558 | |
Issued as reinvestment of dividends | | | — | | | | — | | | | 291,690 | | | | 6,904,294 | |
Redeemed | | | (278,903 | ) | | | (6,233,639 | ) | | | (899,707 | ) | | | (20,806,702 | ) |
Net increase (decrease) | | | (232,375 | ) | | $ | (5,196,086 | ) | | | (541,390 | ) | | $ | (12,363,850 | ) |
Sustainable Equity Fund Service Class | | | | | | | | | | | | | | | | |
Sold | | | 59,064 | | | $ | 1,305,686 | | | | 245,830 | | | $ | 5,684,791 | |
Issued as reinvestment of dividends | | | — | | | | — | | | | 151,762 | | | | 3,555,773 | |
Redeemed | | | (113,791 | ) | | | (2,494,975 | ) | | | (334,157 | ) | | | (7,616,142 | ) |
Net increase (decrease) | | | (54,727 | ) | | $ | (1,189,289 | ) | | | 63,435 | | | $ | 1,624,422 | |
Total Return Bond Fund Class II | | | | | | | | | | | | | | | | |
Sold | | | 353,587 | | | $ | 3,445,893 | | | | 12,039,126 | | | $ | 133,221,787 | |
Issued as reinvestment of dividends | | | — | | | | — | | | | 2,030,600 | | | | 21,382,221 | |
Redeemed | | | (4,773,246 | ) | | | (46,584,708 | ) | | | (5,702,540 | ) | | | (62,177,121 | ) |
Net increase (decrease) | | | (4,419,659 | ) | | $ | (43,138,815 | ) | | | 8,367,186 | | | $ | 92,426,887 | |
Total Return Bond Fund Service Class I | | | | | | | | | | | | | | | | |
Sold | | | 183,727 | | | $ | 1,762,517 | | | | 900,135 | | | $ | 9,677,022 | |
Issued as reinvestment of dividends | | | — | | | | — | | | | 288,842 | | | | 3,001,071 | |
Redeemed | | | (611,717 | ) | | | (5,894,378 | ) | | | (905,850 | ) | | | (9,732,991 | ) |
Net increase (decrease) | | | (427,990 | ) | | $ | (4,131,861 | ) | | | 283,127 | | | $ | 2,945,102 | |
205
Notes to Financial Statements (Unaudited) (Continued) |
6. | Federal Income Tax Information |
At June 30, 2022, the aggregate cost of investments and the unrealized appreciation (depreciation) in the value of all investments owned by the Fund(s), as computed on a federal income tax basis, were as follows:
| | | Federal
Income Tax
Cost | | | Tax Basis
Unrealized
Appreciation | | | Tax Basis
Unrealized
(Depreciation) | | | Net Unrealized
Appreciation
(Depreciation) | |
Conservative Allocation Fund | | $ | 354,722,635 | | | $ | 9,226,481 | | | $ | (41,088,453 | ) | | $ | (31,861,972 | ) |
Balanced Allocation Fund | | | 403,213,896 | | | | 11,078,544 | | | | (38,860,881 | ) | | | (27,782,337 | ) |
Moderate Allocation Fund | | | 1,452,345,494 | | | | 44,705,012 | | | | (148,741,471 | ) | | | (104,036,459 | ) |
Growth Allocation Fund | | | 1,010,902,293 | | | | 36,444,605 | | | | (100,526,684 | ) | | | (64,082,079 | ) |
Aggressive Allocation Fund | | | 142,135,411 | | | | 3,869,366 | | | | (16,376,637 | ) | | | (12,507,271 | ) |
MML American Funds Growth Fund | | | 221,399,001 | | | | — | | | | (17,869,886 | ) | | | (17,869,886 | ) |
MML American Funds International Fund | | | 56,687,013 | | | | — | | | | (11,465,720 | ) | | | (11,465,720 | ) |
MML American Funds Core Allocation Fund | | | 806,483,397 | | | | 812,500 | | | | (67,000,232 | ) | | | (66,187,732 | ) |
Blue Chip Growth Fund | | | 354,291,120 | | | | 128,575,362 | | | | (77,222,604 | ) | | | 51,352,758 | |
Equity Income Fund | | | 323,159,509 | | | | 81,212,966 | | | | (15,386,958 | ) | | | 65,826,008 | |
Equity Index Fund | | | 355,225,315 | | | | 266,636,672 | | | | (20,415,141 | ) | | | 246,221,531 | |
Focused Equity Fund | | | 291,021,251 | | | | 40,231,669 | | | | (16,340,540 | ) | | | 23,891,129 | |
Foreign Fund | | | 201,808,738 | | | | 12,400,070 | | | | (31,810,181 | ) | | | (19,410,111 | ) |
Fundamental Equity Fund | | | 183,999,227 | | | | 15,253,225 | | | | (17,927,152 | ) | | | (2,673,927 | ) |
Fundamental Value Fund | | | 144,416,933 | | | | 30,342,552 | | | | (8,331,577 | ) | | | 22,010,975 | |
Global Fund | | | 120,689,622 | | | | 18,361,731 | | | | (7,396,976 | ) | | | 10,964,755 | |
Income & Growth Fund | | | 191,953,132 | | | | 37,009,680 | | | | (9,153,027 | ) | | | 27,856,653 | |
International Equity Fund | | | 244,908,964 | | | | 4,634,405 | | | | (45,161,722 | ) | | | (40,527,317 | ) |
Large Cap Growth Fund | | | 162,141,591 | | | | 20,692,245 | | | | (26,031,903 | ) | | | (5,339,658 | ) |
Managed Volatility Fund | | | 77,844,834 | | | | 40,441,734 | | | | (3,133,520 | ) | | | 37,308,214 | |
Mid Cap Growth Fund | | | 305,459,043 | | | | 58,991,757 | | | | (46,264,779 | ) | | | 12,726,978 | |
Mid Cap Value Fund | | | 308,099,177 | | | | 14,480,781 | | | | (23,273,381 | ) | | | (8,792,600 | ) |
Small Cap Growth Equity Fund | | | 153,734,392 | | | | 12,088,031 | | | | (22,417,248 | ) | | | (10,329,217 | ) |
Small Company Value Fund | | | 94,416,448 | | | | 1,294,131 | | | | (16,523,999 | ) | | | (15,229,868 | ) |
Small/Mid Cap Value Fund | | | 141,381,585 | | | | 11,956,661 | | | | (17,272,447 | ) | | | (5,315,786 | ) |
Sustainable Equity Fund | | | 120,842,738 | | | | 23,421,980 | | | | (11,501,475 | ) | | | 11,920,505 | |
Total Return Bond Fund | | | 410,663,479 | | | | 1,277,546 | | | | (21,658,849 | ) | | | (20,381,303 | ) |
Net capital loss carryforwards may be applied against any net realized taxable gains in succeeding years, subject to the carryforward period limitations, where applicable. On December 22, 2010, the Regulated Investment Company Modernization Act of 2010 (the “Modernization Act”) was signed by the President. The Modernization Act changed the capital loss carryforward rules as they relate to regulated investment companies. Capital losses generated in tax years beginning after the date of enactment may now be carried forward indefinitely, and retain the character of the original loss.
At December 31, 2021, the following Fund(s) had post-enactment accumulated capital loss carryforwards:
| | | Short Term
Capital Loss
Carryforward | | | Long Term
Capital Loss
Carryforward | |
Managed Volatility Fund | | $ | 1,016,129 | | | $ | — | |
Total Return Bond Fund | | | — | | | | 1,659,466 | |
Net capital loss carryforwards for the Fund(s) shown in the above table are from post-enactment years and are, therefore, not subject to the eight-year carryforward period and possible expiration.
206
Notes to Financial Statements (Unaudited) (Continued) |
Generally accepted accounting principles in the United States of America require that only distributions in excess of tax basis earnings and profits be reported in the financial statements as a return of capital.
The tax character of distributions (including capital gain dividends, if any, designated pursuant to Section 852 of the Code) paid during the year ended December 31, 2021, was as follows:
| | | Ordinary
Income | | | Long Term
Capital Gain | |
Conservative Allocation Fund | | $ | 4,127,931 | | | $ | 11,961,897 | |
Balanced Allocation Fund | | | 5,188,953 | | | | 14,036,425 | |
Moderate Allocation Fund | | | 21,088,797 | | | | 66,099,435 | |
Growth Allocation Fund | | | 17,313,032 | | | | 51,905,591 | |
Aggressive Allocation Fund | | | 1,924,724 | | | | 6,841,452 | |
MML American Funds Growth Fund | | | — | | | | 15,195,901 | |
MML American Funds International Fund | | | 78,005 | | | | 899,798 | |
MML American Funds Core Allocation Fund | | | 12,434,688 | | | | 22,679,239 | |
Blue Chip Growth Fund | | | — | | | | 59,448,568 | |
Equity Income Fund | | | 10,129,058 | | | | 7,971,798 | |
Equity Index Fund | | | 10,561,732 | | | | 30,661,155 | |
Focused Equity Fund | | | 5,363,033 | | | | 15,304,107 | |
Foreign Fund | | | 6,599,871 | | | | — | |
Fundamental Equity Fund | | | 4,811,850 | | | | 14,488,730 | |
Fundamental Value Fund | | | 3,270,218 | | | | — | |
Global Fund | | | 3,475,898 | | | | 34,229,870 | |
Income & Growth Fund | | | 4,450,586 | | | | — | |
International Equity Fund | | | 1,082,771 | | | | — | |
Large Cap Growth Fund | | | 1,300,212 | | | | 16,591,273 | |
Managed Volatility Fund | | | 1,305,177 | | | | — | |
Mid Cap Growth Fund | | | 12,553,859 | | | | 86,004,695 | |
Mid Cap Value Fund | | | 5,099,259 | | | | 8,362,317 | |
Small Cap Growth Equity Fund | | | 14,675,515 | | | | 17,298,628 | |
Small Company Value Fund | | | 465,390 | | | | 5,695,276 | |
Small/Mid Cap Value Fund | | | 1,827,682 | | | | — | |
Sustainable Equity Fund | | | 1,289,287 | | | | 9,170,780 | |
Total Return Bond Fund | | | 20,704,098 | | | | 3,679,194 | |
The following Fund(s) have elected to pass through the foreign tax credit for the year ended December 31, 2021:
| | | Amount | |
Conservative Allocation Fund | | $ | 81,872 | |
Balanced Allocation Fund | | | 130,019 | |
Moderate Allocation Fund | | | 646,884 | |
Growth Allocation Fund | | | 547,035 | |
Aggressive Allocation Fund | | | 85,735 | |
MML American Funds International Fund | | | 57,729 | |
MML American Funds Core Allocation Fund | | | 101,179 | |
Foreign Fund | | | 517,260 | |
Global Fund | | | 306,299 | |
International Equity Fund | | | 609,603 | |
207
Notes to Financial Statements (Unaudited) (Continued) |
Capital accounts within the financial statements are periodically adjusted for permanent differences between book and tax accounting. These adjustments have no impact on net assets or the results of operations. Temporary book and tax accounting differences will reverse in subsequent periods. At December 31, 2021, temporary book and tax accounting differences were primarily attributable to the deferral of wash sale losses, deferred Trustee compensation, and other temporary basis adjustments.
At December 31, 2021, the components of distributable earnings on a tax basis were as follows:
| | | Undistributed
Ordinary
Income | | | Undistributed
Long Term
Capital Gain
(Capital Loss
Carryover) | | | Other
Temporary
Differences | | | Unrealized
Appreciation
(Depreciation) | | | Total | |
Conservative Allocation Fund | | $ | 12,472,960 | | | $ | 27,523,402 | | | $ | (41,968 | ) | | $ | 15,491,918 | | | $ | 55,446,312 | |
Balanced Allocation Fund | | | 13,376,765 | | | | 27,755,636 | | | | (50,903 | ) | | | 31,498,838 | | | | 72,580,336 | |
Moderate Allocation Fund | | | 43,264,614 | | | | 127,629,933 | | | | (189,584 | ) | | | 123,903,311 | | | | 294,608,274 | |
Growth Allocation Fund | | | 25,329,836 | | | | 110,665,912 | | | | (149,553 | ) | | | 119,677,861 | | | | 255,524,056 | |
Aggressive Allocation Fund | | | 2,644,335 | | | | 19,536,104 | | | | (12,283 | ) | | | 12,919,806 | | | | 35,087,962 | |
MML American Funds Growth Fund | | | 975,307 | | | | 50,084,011 | | | | (14,037 | ) | | | 104,215,675 | | | | 155,260,956 | |
MML American Funds International Fund | | | 1,148,515 | | | | 1,076,742 | | | | (5,505 | ) | | | 8,432,502 | | | | 10,652,254 | |
MML American Funds Core Allocation Fund | | | 16,557,018 | | | | 51,312,277 | | | | (77,887 | ) | | | 150,542,310 | | | | 218,333,718 | |
Blue Chip Growth Fund | | | 493,752 | | | | 82,886,139 | | | | (42,540 | ) | | | 269,060,637 | | | | 352,397,988 | |
Equity Income Fund | | | 12,308,253 | | | | 50,222,454 | | | | (58,214 | ) | | | 123,050,588 | | | | 185,523,081 | |
Equity Index Fund | | | 8,993,570 | | | | 38,687,466 | | | | (77,847 | ) | | | 416,246,540 | | | | 463,849,729 | |
Focused Equity Fund | | | 2,944,180 | | | | 24,842,339 | | | | (12,891 | ) | | | 80,650,609 | | | | 108,424,237 | |
Foreign Fund | | | 7,316,991 | | | | 13,669,206 | | | | (41,167 | ) | | | 27,280,501 | | | | 48,225,531 | |
Fundamental Equity Fund | | | 7,017,900 | | | | 25,350,020 | | | | (15,770 | ) | | | 50,454,799 | | | | 82,806,949 | |
Fundamental Value Fund | | | 5,802,722 | | | | 27,391,891 | | | | (20,572 | ) | | | 48,697,266 | | | | 81,871,307 | |
Global Fund | | | 2,471,592 | | | | 94,902,571 | | | | (22,743 | ) | | | 54,791,960 | | | | 152,143,380 | |
Income & Growth Fund | | | 4,808,918 | | | | 24,019,703 | | | | (27,160 | ) | | | 64,331,124 | | | | 93,132,585 | |
International Equity Fund | | | 3,912,267 | | | | 10,003,274 | | | | (13,076 | ) | | | 6,921,238 | | | | 20,823,703 | |
Large Cap Growth Fund | | | 422,374 | | | | 16,660,382 | | | | (17,250 | ) | | | 68,077,480 | | | | 85,142,986 | |
Managed Volatility Fund | | | 519,957 | | | | (1,016,129 | ) | | | (30,564 | ) | | | 65,724,132 | | | | 65,197,396 | |
Mid Cap Growth Fund | | | 13,545,528 | | | | 89,060,912 | | | | (47,904 | ) | | | 140,566,154 | | | | 243,124,690 | |
Mid Cap Value Fund | | | 30,273,829 | | | | 50,726,510 | | | | (52,884 | ) | | | 52,698,227 | | | | 133,645,682 | |
Small Cap Growth Equity Fund | | | 12,735,218 | | | | 32,979,193 | | | | (31,657 | ) | | | 31,396,698 | | | | 77,079,452 | |
Small Company Value Fund | | | 3,979,912 | | | | 39,995,634 | | | | (10,698 | ) | | | 2,573,435 | | | | 46,538,283 | |
Small/Mid Cap Value Fund | | | 22,683,798 | | | | 19,449,510 | | | | (25,689 | ) | | | 42,405,069 | | | | 84,512,688 | |
Sustainable Equity Fund | | | 1,492,550 | | | | 20,494,918 | | | | (19,758 | ) | | | 86,285,250 | | | | 108,252,960 | |
Total Return Bond Fund | | | 5,120,633 | | | | (1,659,466 | ) | | | (35,793 | ) | | | 3,307,278 | | | | 6,732,652 | |
The Funds did not have any unrecognized tax benefits at June 30, 2022, nor were there any increases or decreases in unrecognized tax benefits for the period then ended. The Funds recognize interest and penalties, if any, related to unrecognized tax benefits as an income tax expense in the Statements of Operations. During the period ended June 30, 2022, the Funds did not incur any such interest or penalties. The Funds are subject to examination by U.S. federal and state tax authorities for returns filed for the prior three fiscal years. Foreign taxes are provided for based on the Funds’ understanding of the tax rules and rates that exist in the foreign markets in which they invest.
208
Notes to Financial Statements (Unaudited) (Continued) |
7. Investment in Affiliated Issuers
A summary of the Funds’ transactions in the securities of affiliated issuers during the period ended June 30, 2022, was as follows:
| | | Beginning
Value as of
12/31/21 | | | Purchases | | | Sales | | | Change in
Unrealized
Appreciation/
Depreciation | | | Net Realized
Gain (Loss) | | | Value as of
6/30/22 | | | Number of
Shares Held
as of
6/30/22 | |
Conservative Allocation Fund | | | | | | | | | | | | | | | | | | | | | | | | | | | | |
MML Blue Chip Growth Fund, Initial Class | | $ | 18,878,130 | | | $ | 2,388,846 | | | $ | (1,162,181 | ) | | $ | (7,072,365 | ) | | $ | 79,728 | | | $ | 13,112,158 | | | | 936,583 | |
MML Dynamic Bond Fund, Class II | | | 46,152,132 | | | | 1,306,387 | | | | (3,904,512 | ) | | | (4,607,946 | ) | | | (274,173 | ) | | | 38,671,888 | | | | 4,311,247 | |
MML Equity Income Fund, Initial Class | | | 13,865,662 | | | | 340,666 | | | | (1,018,178 | ) | | | (1,318,057 | ) | | | 194,801 | | | | 12,064,894 | | | | 1,064,863 | |
MML Equity Index Fund, Class III | | | 323,786 | | | | — | | | | (306,837 | ) | | | (73,671 | ) | | | 56,722 | | | | — | | | | — | |
MML Focused Equity Fund, Class II | | | 23,344,555 | | | | 1,920,015 | | | | (1,529,575 | ) | | | (2,926,716 | ) | | | 328,818 | | | | 21,137,097 | | | | 2,856,364 | |
MML Foreign Fund, Initial Class | | | 7,767,047 | | | | 284,709 | | | | (850,933 | ) | | | (1,415,374 | ) | | | 26,119 | | | | 5,811,568 | | | | 647,889 | |
MML Fundamental Equity Fund, Class II | | | 14,509,139 | | | | 364,756 | | | | (1,090,179 | ) | | | (3,278,130 | ) | | | 198,623 | | | | 10,704,209 | | | | 1,091,153 | |
MML Fundamental Value Fund, Class II | | | 11,875,092 | | | | 291,249 | | | | (870,482 | ) | | | (1,324,404 | ) | | | 82,262 | | | | 10,053,717 | | | | 759,344 | |
MML Global Fund, Class I | | | 7,284,169 | | | | 727,584 | | | | (1,833,581 | ) | | | (1,531,630 | ) | | | 128,451 | | | | 4,774,993 | | | | 407,423 | |
MML High Yield Fund, Class II | | | 3,198,901 | | | | 98,570 | | | | (294,606 | ) | | | (429,530 | ) | | | (892 | ) | | | 2,572,443 | | | | 298,774 | |
MML Income & Growth Fund, Initial Class | | | 11,443,113 | | | | 291,249 | | | | (870,482 | ) | | | (1,093,130 | ) | | | 222,502 | | | | 9,993,252 | | | | 875,066 | |
MML Inflation-Protected and Income Fund, Initial Class | | | 15,378,186 | | | | 394,282 | | | | (3,178,423 | ) | | | (1,465,242 | ) | | | 154,037 | | | | 11,282,840 | | | | 1,124,909 | |
MML International Equity Fund, Class II | | | 14,566,592 | | | | 1,519,199 | | | | (850,933 | ) | | | (2,989,691 | ) | | | 83,525 | | | | 12,328,692 | | | | 1,380,593 | |
MML Large Cap Growth Fund, Initial Class | | | 10,689,895 | | | | 243,068 | | | | (726,479 | ) | | | (3,086,871 | ) | | | 91,544 | | | | 7,211,157 | | | | 672,683 | |
MML Managed Bond Fund, Initial Class | | | 84,781,807 | | | | 2,350,575 | | | | (7,025,370 | ) | | | (9,994,664 | ) | | | 35,112 | | | | 70,147,460 | | | | 6,122,289 | |
MML Mid Cap Growth Fund, Initial Class | | | 9,792,436 | | | | 780,286 | | | | (736,633 | ) | | | (2,851,076 | ) | | | 98,810 | | | | 7,083,823 | | | | 594,779 | |
MML Mid Cap Value Fund, Initial Class | | | 7,344,208 | | | | 187,165 | | | | (559,397 | ) | | | (756,988 | ) | | | 196,833 | | | | 6,411,821 | | | | 554,176 | |
MML Short-Duration Bond Fund, Class II | | | 20,222,310 | | | | 591,422 | | | | (1,767,636 | ) | | | (1,480,243 | ) | | | (89,007 | ) | | | 17,476,846 | | | | 1,954,904 | |
MML Small Cap Growth Equity Fund, Initial Class | | | 1,016,603 | | | | 56,829 | | | | (169,849 | ) | | | (259,721 | ) | | | 9,940 | | | | 653,802 | | | | 58,044 | |
MML Small Company Value Fund, Class II | | | 4,263,155 | | | | 107,481 | | | | (321,237 | ) | | | (690,343 | ) | | | 4,299 | | | | 3,363,355 | | | | 225,124 | |
MML Small/Mid Cap Value Fund, Initial Class | | | 2,213,947 | | | | 58,991 | | | | (176,313 | ) | | | (476,433 | ) | | | 52,920 | | | | 1,673,112 | | | | 141,669 | |
MML Strategic Emerging Markets Fund, Class II | | | 3,715,182 | | | | 1,109,464 | | | | (327,162 | ) | | | (943,831 | ) | | | (134,553 | ) | | | 3,419,100 | | | | 444,039 | |
MML Total Return Bond Fund, Class II | | | 55,603,249 | | | | 1,567,269 | | | | (6,684,235 | ) | | | (5,732,428 | ) | | | (407,832 | ) | | | 44,346,023 | | | | 4,783,821 | |
| | | $ | 388,229,296 | | | $ | 16,980,062 | | | $ | (36,255,213 | ) | | $ | (55,798,484 | ) | | $ | 1,138,589 | | | $ | 314,294,250 | | | | | |
Balanced Allocation Fund | | | | | | | | | | | | | | | | | | | | | | | | | | | | |
MML Blue Chip Growth Fund, Initial Class | | $ | 26,815,070 | | | $ | 180,819 | | | $ | (1,281,550 | ) | | $ | (9,368,787 | ) | | $ | 80,477 | | | $ | 16,426,029 | | | | 1,173,288 | |
MML Dynamic Bond Fund, Class II | | | 47,473,621 | | | | 438,738 | | | | (3,109,561 | ) | | | (4,858,231 | ) | | | (171,625 | ) | | | 39,772,942 | | | | 4,433,996 | |
MML Equity Income Fund, Initial Class | | | 18,695,294 | | | | 158,269 | | | | (1,121,738 | ) | | | (1,645,209 | ) | | | 123,450 | | | | 16,210,066 | | | | 1,430,721 | |
MML Equity Index Fund, Class III | | | 588,392 | | | | — | | | | (557,592 | ) | | | (125,638 | ) | | | 94,838 | | | | — | | | | — | |
MML Focused Equity Fund, Class II | | | 30,754,605 | | | | 1,352,050 | | | | (1,680,570 | ) | | | (3,720,295 | ) | | | 345,389 | | | | 27,051,179 | | | | 3,655,565 | |
MML Foreign Fund, Initial Class | | | 10,706,884 | | | | 132,393 | | | | (938,332 | ) | | | (1,942,854 | ) | | | 14,633 | | | | 7,972,724 | | | | 888,821 | |
MML Fundamental Equity Fund, Class II | | | 19,761,204 | | | | 169,759 | | | | (1,203,169 | ) | | | (4,411,544 | ) | | | 201,799 | | | | 14,518,049 | | | | 1,479,923 | |
MML Fundamental Value Fund, Class II | | | 15,252,771 | | | | 135,864 | | | | (962,943 | ) | | | (1,546,378 | ) | | | (52,209 | ) | | | 12,827,105 | | | | 968,815 | |
MML Global Fund, Class I | | | 14,083,881 | | | | 465,663 | | | | (2,021,909 | ) | | | (3,089,552 | ) | | | 258,527 | | | | 9,696,610 | | | | 827,356 | |
MML High Yield Fund, Class II | | | 3,437,409 | | | | 33,104 | | | | (234,627 | ) | | | (459,112 | ) | | | (5,296 | ) | | | 2,771,478 | | | | 321,891 | |
MML Income & Growth Fund, Initial Class | | | 15,201,327 | | | | 135,865 | | | | (962,943 | ) | | | (1,343,813 | ) | | | 178,937 | | | | 13,209,373 | | | | 1,156,688 | |
MML Inflation-Protected and Income Fund, Initial Class | | | 15,731,738 | | | | 132,416 | | | | (938,499 | ) | | | (1,537,664 | ) | | | 35,896 | | | | 13,423,887 | | | | 1,338,374 | |
MML International Equity Fund, Class II | | | 22,956,392 | | | | 613,984 | | | | (938,333 | ) | | | (4,521,443 | ) | | | 84,868 | | | | 18,195,468 | | | | 2,037,566 | |
MML Large Cap Growth Fund, Initial Class | | | 15,224,548 | | | | 112,886 | | | | (800,077 | ) | | | (4,404,919 | ) | | | 119,896 | | | | 10,252,334 | | | | 956,374 | |
MML Managed Bond Fund, Initial Class | | | 85,697,030 | | | | 789,420 | | | | (5,595,017 | ) | | | (9,898,287 | ) | | | (179,338 | ) | | | 70,813,808 | | | | 6,180,446 | |
MML Mid Cap Growth Fund, Initial Class | | | 12,915,451 | | | | 567,042 | | | | (812,293 | ) | | | (3,508,619 | ) | | | (95,521 | ) | | | 9,066,060 | | | | 761,214 | |
MML Mid Cap Value Fund, Initial Class | | | 10,856,755 | | | | 87,036 | | | | (616,854 | ) | | | (916,064 | ) | | | 80,043 | | | | 9,490,916 | | | | 820,304 | |
MML Short-Duration Bond Fund, Class II | | | 21,086,825 | | | | 198,624 | | | | (1,407,749 | ) | | | (1,552,362 | ) | | | (86,726 | ) | | | 18,238,612 | | | | 2,040,113 | |
MML Small Cap Growth Equity Fund, Initial Class | | | 1,618,629 | | | | 26,713 | | | | (189,331 | ) | | | (405,119 | ) | | | 402 | | | | 1,051,294 | | | | 93,332 | |
MML Small Company Value Fund, Class II | | | 5,263,639 | | | | 49,692 | | | | (352,197 | ) | | | (870,983 | ) | | | 24,374 | | | | 4,114,525 | | | | 275,403 | |
MML Small/Mid Cap Value Fund, Initial Class | | | 3,072,382 | | | | 27,575 | | | | (195,438 | ) | | | (641,133 | ) | | | 51,916 | | | | 2,315,302 | | | | 196,046 | |
MML Strategic Emerging Markets Fund, Class II | | | 4,495,858 | | | | 50,901 | | | | (360,766 | ) | | | (1,046,535 | ) | | | (124,624 | ) | | | 3,014,834 | | | | 391,537 | |
MML Total Return Bond Fund, Class II | | | 56,561,333 | | | | 526,353 | | | | (3,730,533 | ) | | | (6,121,097 | ) | | | (242,610 | ) | | | 46,993,446 | | | | 5,069,412 | |
| | | $ | 458,251,038 | | | $ | 6,385,166 | | | $ | (30,012,021 | ) | | $ | (67,935,638 | ) | | $ | 737,496 | | | $ | 367,426,041 | | | | | |
209
Notes to Financial Statements (Unaudited) (Continued) |
| | | Beginning
Value as of
12/31/21 | | | Purchases | | | Sales | | | Change in
Unrealized
Appreciation/
Depreciation | | | Net Realized
Gain (Loss) | | | Value as of
6/30/22 | | | Number of
Shares Held
as of
6/30/22 | |
Moderate Allocation Fund | | | | | | | | | | | | | | | | | | | | | | | | | | | | |
MML Blue Chip Growth Fund, Initial Class | | $ | 119,078,373 | | | $ | 8,020,700 | | | $ | (7,072,347 | ) | | $ | (42,863,344 | ) | | $ | 237,458 | | | $ | 77,400,840 | | | | 5,528,631 | |
MML Dynamic Bond Fund, Class II | | | 136,034,260 | | | | 31,194 | | | | (10,658,016 | ) | | | (13,695,983 | ) | | | (467,761 | ) | | | 111,243,694 | | | | 12,401,750 | |
MML Equity Income Fund, Initial Class | | | 85,186,498 | | | | 18,087 | | | | (6,179,884 | ) | | | (7,091,156 | ) | | | 363,784 | | | | 72,297,329 | | | | 6,381,053 | |
MML Equity Index Fund, Class III | | | 2,570,749 | | | | — | | | | (2,436,178 | ) | | | (549,851 | ) | | | 415,280 | | | | — | | | | — | |
MML Focused Equity Fund, Class II | | | 150,519,148 | | | | 2,463,301 | | | | (9,267,020 | ) | | | (18,038,703 | ) | | | 2,006,515 | | | | 127,683,241 | | | | 17,254,492 | |
MML Foreign Fund, Initial Class | | | 48,011,592 | | | | 15,144 | | | | (5,174,166 | ) | | | (8,737,406 | ) | | | 339,809 | | | | 34,454,973 | | | | 3,841,134 | |
MML Fundamental Equity Fund, Class II | | | 91,989,309 | | | | 19,418 | | | | (6,634,535 | ) | | | (19,719,853 | ) | | | 441,568 | | | | 66,095,907 | | | | 6,737,605 | |
MML Fundamental Value Fund, Class II | | | 73,990,776 | | | | 15,525 | | | | (5,304,260 | ) | | | (7,654,287 | ) | | | 62,086 | | | | 61,109,840 | | | | 4,615,547 | |
MML Global Fund, Class I | | | 68,406,406 | | | | 330,771 | | | | (11,149,238 | ) | | | (14,326,094 | ) | | | 1,133,826 | | | | 44,395,671 | | | | 3,788,027 | |
MML High Yield Fund, Class II | | | 12,424,398 | | | | 3,106 | | | | (1,061,555 | ) | | | (1,624,839 | ) | | | (14,939 | ) | | | 9,726,171 | | | | 1,129,637 | |
MML Income & Growth Fund, Initial Class | | | 70,525,048 | | | | 15,525 | | | | (5,304,261 | ) | | | (6,289,653 | ) | | | 1,022,370 | | | | 59,969,029 | | | | 5,251,228 | |
MML Inflation-Protected and Income Fund, Initial Class | | | 42,813,623 | | | | 9,320 | | | | (7,184,666 | ) | | | (4,114,227 | ) | | | 411,656 | | | | 31,935,706 | | | | 3,184,019 | |
MML International Equity Fund, Class II | | | 106,431,468 | | | | 5,264,494 | | | | (5,174,167 | ) | | | (21,195,865 | ) | | | 483,887 | | | | 85,809,817 | | | | 9,609,162 | |
MML Large Cap Growth Fund, Initial Class | | | 66,912,533 | | | | 12,929 | | | | (4,417,411 | ) | | | (19,418,852 | ) | | | 898,575 | | | | 43,987,774 | | | | 4,103,337 | |
MML Managed Bond Fund, Initial Class | | | 245,507,034 | | | | 56,112 | | | | (19,171,690 | ) | | | (27,901,742 | ) | | | (515,815 | ) | | | 197,973,899 | | | | 17,278,650 | |
MML Mid Cap Growth Fund, Initial Class | | | 59,752,007 | | | | 531,542 | | | | (4,484,766 | ) | | | (15,294,895 | ) | | | (884,236 | ) | | | 39,619,652 | | | | 3,326,587 | |
MML Mid Cap Value Fund, Initial Class | | | 48,295,182 | | | | 9,971 | | | | (3,407,075 | ) | | | (3,967,922 | ) | | | 351,919 | | | | 41,282,075 | | | | 3,568,027 | |
MML Short-Duration Bond Fund, Class II | | | 60,746,848 | | | | 13,981 | | | | (4,776,999 | ) | | | (4,390,208 | ) | | | (258,497 | ) | | | 51,335,125 | | | | 5,742,184 | |
MML Small Cap Growth Equity Fund, Initial Class | | | 10,801,917 | | | | 3,072 | | | | (1,049,626 | ) | | | (2,576,051 | ) | | | (105,167 | ) | | | 7,074,145 | | | | 628,033 | |
MML Small Company Value Fund, Class II | | | 26,754,460 | | | | 5,667 | | | | (1,936,476 | ) | | | (4,402,337 | ) | | | 159,690 | | | | 20,581,004 | | | | 1,377,577 | |
MML Small/Mid Cap Value Fund, Initial Class | | | 15,358,966 | | | | 3,137 | | | | (1,072,078 | ) | | | (3,092,330 | ) | | | 190,360 | | | | 11,388,055 | | | | 964,272 | |
MML Strategic Emerging Markets Fund, Class II | | | 22,136,448 | | | | 3,005,822 | | | | (1,989,341 | ) | | | (5,694,036 | ) | | | (314,573 | ) | | | 17,144,320 | | | | 2,226,535 | |
MML Total Return Bond Fund, Class II | | | 163,083,343 | | | | 37,439 | | | | (24,791,742 | ) | | | (16,201,153 | ) | | | (1,212,089 | ) | | | 120,915,798 | | | | 13,043,775 | |
| | | $ | 1,727,330,386 | | | $ | 19,886,257 | | | $ | (149,697,497 | ) | | $ | (268,840,787 | ) | | $ | 4,745,706 | | | $ | 1,333,424,065 | | | | | |
Growth Allocation Fund | | | | | | | | | | | | | | | | | | | | | | | | | | | | |
MML Blue Chip Growth Fund, Initial Class | | $ | 101,175,724 | | | $ | 7,442,591 | | | $ | (4,400,854 | ) | | $ | (36,399,736 | ) | | $ | 7,784 | | | $ | 67,825,509 | | | | 4,844,679 | |
MML Dynamic Bond Fund, Class II | | | 61,776,329 | | | | 366,936 | | | | (3,648,584 | ) | | | (6,326,637 | ) | | | (179,424 | ) | | | 51,988,620 | | | | 5,795,833 | |
MML Equity Income Fund, Initial Class | | | 71,688,995 | | | | 387,400 | | | | (3,852,058 | ) | | | (5,760,679 | ) | | | (31,907 | ) | | | 62,431,751 | | | | 5,510,305 | |
MML Equity Index Fund, Class III | | | 2,421,041 | | | | — | | | | (2,294,307 | ) | | | (519,159 | ) | | | 392,425 | | | | — | | | | — | |
MML Focused Equity Fund, Class II | | | 113,058,200 | | | | 5,375,404 | | | | (5,778,087 | ) | | | (13,550,195 | ) | | | 1,223,843 | | | | 100,329,165 | | | | 13,557,995 | |
MML Foreign Fund, Initial Class | | | 39,542,796 | | | | 324,527 | | | | (3,226,894 | ) | | | (7,315,037 | ) | | | 248,187 | | | | 29,573,579 | | | | 3,296,943 | |
MML Fundamental Equity Fund, Class II | | | 80,360,265 | | | | 415,171 | | | | (4,128,204 | ) | | | (17,852,042 | ) | | | 757,525 | | | | 59,552,715 | | | | 6,070,613 | |
MML Fundamental Value Fund, Class II | | | 61,906,707 | | | | 331,856 | | | | (3,299,766 | ) | | | (6,610,089 | ) | | | 128,845 | | | | 52,457,553 | | | | 3,962,051 | |
MML Global Fund, Class I | | | 53,002,880 | | | | 1,302,372 | | | | (6,944,265 | ) | | | (11,182,870 | ) | | | 645,619 | | | | 36,823,736 | | | | 3,141,957 | |
MML High Yield Fund, Class II | | | 4,657,791 | | | | 27,672 | | | | (275,157 | ) | | | (627,446 | ) | | | (912 | ) | | | 3,781,948 | | | | 439,251 | |
MML Income & Growth Fund, Initial Class | | | 60,362,634 | | | | 331,856 | | | | (3,299,766 | ) | | | (4,563,523 | ) | | | (48,917 | ) | | | 52,782,284 | | | | 4,621,916 | |
MML Inflation-Protected and Income Fund, Initial Class | | | 20,725,646 | | | | 110,690 | | | | (4,600,629 | ) | | | (1,942,146 | ) | | | 219,831 | | | | 14,513,392 | | | | 1,446,998 | |
MML International Equity Fund, Class II | | | 90,146,881 | | | | 762,961 | | | | (3,226,894 | ) | | | (17,083,810 | ) | | | (138,658 | ) | | | 70,460,480 | | | | 7,890,311 | |
MML Large Cap Growth Fund, Initial Class | | | 56,371,209 | | | | 7,276,663 | | | | (2,750,971 | ) | | | (17,607,681 | ) | | | 465,688 | | | | 43,754,908 | | | | 4,081,615 | |
MML Managed Bond Fund, Initial Class | | | 112,318,571 | | | | 659,710 | | | | (14,559,748 | ) | | | (12,784,780 | ) | | | 139,141 | | | | 85,772,894 | | | | 7,486,036 | |
MML Mid Cap Growth Fund, Initial Class | | | 50,540,072 | | | | 880,731 | | | | (2,792,917 | ) | | | (13,394,601 | ) | | | (488,016 | ) | | | 34,745,269 | | | | 2,917,319 | |
MML Mid Cap Value Fund, Initial Class | | | 40,109,326 | | | | 213,035 | | | | (2,118,283 | ) | | | (3,289,618 | ) | | | 217,476 | | | | 35,131,936 | | | | 3,036,468 | |
MML Short-Duration Bond Fund, Class II | | | 28,358,715 | | | | 166,034 | | | | (1,650,944 | ) | | | (2,105,258 | ) | | | (88,562 | ) | | | 24,679,985 | | | | 2,760,625 | |
MML Small Cap Growth Equity Fund, Initial Class | | | 11,808,558 | | | | 65,739 | | | | (653,661 | ) | | | (2,919,893 | ) | | | (91,027 | ) | | | 8,209,716 | | | | 728,847 | |
MML Small Company Value Fund, Class II | | | 26,739,054 | | | | 121,633 | | | | (1,209,449 | ) | | | (4,461,758 | ) | | | 136,403 | | | | 21,325,883 | | | | 1,427,435 | |
MML Small/Mid Cap Value Fund, Initial Class | | | 12,052,462 | | | | 67,497 | | | | (671,139 | ) | | | (2,334,979 | ) | | | 27,904 | | | | 9,141,745 | | | | 774,068 | |
MML Strategic Emerging Markets Fund, Class II | | | 18,206,002 | | | | 125,011 | | | | (1,243,029 | ) | | | (4,529,495 | ) | | | (192,684 | ) | | | 12,365,805 | | | | 1,605,949 | |
MML Total Return Bond Fund, Class II | | | 75,444,836 | | | | 439,992 | | | | (9,374,999 | ) | | | (7,758,424 | ) | | | (401,410 | ) | | | 58,349,995 | | | | 6,294,498 | |
| | | $ | 1,192,774,694 | | | $ | 27,195,481 | | | $ | (86,000,605 | ) | | $ | (200,919,856 | ) | | $ | 2,949,154 | | | $ | 935,998,868 | | | | | |
210
Notes to Financial Statements (Unaudited) (Continued) |
| | | Beginning
Value as of
12/31/21 | | | Purchases | | | Sales | | | Change in
Unrealized
Appreciation/
Depreciation | | | Net Realized
Gain (Loss) | | | Value as of
6/30/22 | | | Number of
Shares Held
as of
6/30/22 | |
Aggressive Allocation Fund | | | | | | | | | | | | | | | | | | | | | | | | | | | | |
MML Blue Chip Growth Fund, Initial Class | | $ | 17,179,439 | | | $ | 1,758,589 | | | $ | (924,534 | ) | | $ | (6,287,435 | ) | | $ | 24,905 | | | $ | 11,750,964 | | | | 839,355 | |
MML Dynamic Bond Fund, Class II | | | 3,208,185 | | | | 79,137 | | | | (282,940 | ) | | | (321,211 | ) | | | (16,113 | ) | | | 2,667,058 | | | | 297,331 | |
MML Equity Income Fund, Initial Class | | | 11,529,611 | | | | 226,547 | | | | (809,976 | ) | | | (977,182 | ) | | | 42,235 | | | | 10,011,235 | | | | 883,604 | |
MML Equity Index Fund, Class III | | | 348,718 | | | | — | | | | (330,464 | ) | | | (72,123 | ) | | | 53,869 | | | | — | | | | — | |
MML Focused Equity Fund, Class II | | | 20,203,154 | | | | 1,445,804 | | | | (1,213,129 | ) | | | (2,509,929 | ) | | | 273,028 | | | | 18,198,928 | | | | 2,459,315 | |
MML Foreign Fund, Initial Class | | | 6,387,202 | | | | 189,334 | | | | (676,931 | ) | | | (1,188,888 | ) | | | 38,372 | | | | 4,749,089 | | | | 529,441 | |
MML Fundamental Equity Fund, Class II | | | 12,811,706 | | | | 242,568 | | | | (867,255 | ) | | | (2,819,627 | ) | | | 88,862 | | | | 9,456,254 | | | | 963,940 | |
MML Fundamental Value Fund, Class II | | | 10,392,476 | | | | 194,096 | | | | (693,951 | ) | | | (1,110,665 | ) | | | 17,876 | | | | 8,799,832 | | | | 664,640 | |
MML Global Fund, Class I | | | 3,841,463 | | | | 1,007,891 | | | | (1,458,643 | ) | | | (789,231 | ) | | | (4,738 | ) | | | 2,596,742 | | | | 221,565 | |
MML High Yield Fund, Class II | | | 644,392 | | | | 5,959 | | | | (21,306 | ) | | | (88,668 | ) | | | (151 | ) | | | 540,226 | | | | 62,744 | |
MML Income & Growth Fund, Initial Class | | | 10,036,146 | | | | 194,096 | | | | (693,951 | ) | | | (792,172 | ) | | | 20,443 | | | | 8,764,562 | | | | 767,475 | |
MML Inflation-Protected and Income Fund, Initial Class | | | 924,296 | | | | 23,836 | | | | (585,223 | ) | | | (12,302 | ) | | | (38,535 | ) | | | 312,072 | | | | 31,114 | |
MML International Equity Fund, Class II | | | 14,964,880 | | | | 347,913 | | | | (676,931 | ) | | | (2,735,578 | ) | | | (145,091 | ) | | | 11,755,193 | | | | 1,316,371 | |
MML Large Cap Growth Fund, Initial Class | | | 9,864,502 | | | | 1,661,643 | | | | (577,925 | ) | | | (3,139,827 | ) | | | 74,083 | | | | 7,882,476 | | | | 735,306 | |
MML Managed Bond Fund, Initial Class | | | 7,994,965 | | | | 142,027 | | | | (2,507,788 | ) | | | (761,258 | ) | | | (56,179 | ) | | | 4,811,767 | | | | 419,959 | |
MML Mid Cap Growth Fund, Initial Class | | | 8,384,819 | | | | 2,030,880 | | | | (586,003 | ) | | | (2,496,389 | ) | | | (103,364 | ) | | | 7,229,943 | | | | 607,048 | |
MML Mid Cap Value Fund, Initial Class | | | 6,773,808 | | | | 124,468 | | | | (445,010 | ) | | | (571,633 | ) | | | 50,507 | | | | 5,932,140 | | | | 512,717 | |
MML Short-Duration Bond Fund, Class II | | | 2,517,949 | | | | 35,755 | | | | (127,835 | ) | | | (187,690 | ) | | | (9,201 | ) | | | 2,228,978 | | | | 249,326 | |
MML Small Cap Growth Equity Fund, Initial Class | | | 2,303,388 | | | | 37,998 | | | | (135,853 | ) | | | (584,807 | ) | | | (5,773 | ) | | | 1,614,953 | | | | 143,373 | |
MML Small Company Value Fund, Class II | | | 4,246,531 | | | | 71,271 | | | | (254,816 | ) | | | (703,545 | ) | | | 16,104 | | | | 3,375,545 | | | | 225,940 | |
MML Small/Mid Cap Value Fund, Initial Class | | | 1,913,833 | | | | 39,436 | | | | (140,993 | ) | | | (363,137 | ) | | | (3,813 | ) | | | 1,445,326 | | | | 122,382 | |
MML Strategic Emerging Markets Fund, Class II | | | 3,136,291 | | | | 72,796 | | | | (260,265 | ) | | | (772,781 | ) | | | (48,681 | ) | | | 2,127,360 | | | | 276,281 | |
MML Total Return Bond Fund, Class II | | | 3,999,052 | | | | 94,671 | | | | (1,338,478 | ) | | | (203,881 | ) | | | (186,397 | ) | | | 2,364,967 | | | | 255,120 | |
| | | $ | 163,606,806 | | | $ | 10,026,715 | | | $ | (15,610,200 | ) | | $ | (29,489,959 | ) | | $ | 82,248 | | | $ | 128,615,610 | | | | | |
8. Indemnifications
Under the Funds’ organizational documents, current and former Trustees and Officers are provided with specified rights to indemnification against liabilities arising in connection with the performance of their duties to the Funds, and shareholders are indemnified against personal liability for obligations of the Funds. In the normal course of business, the Funds may also enter into contracts that provide general indemnifications. The Funds’ maximum exposure under these arrangements is unknown as this would be dependent on future claims that may be made against the Funds. The risk of material loss from such claims is considered remote.
9. New Accounting Pronouncements
In January 2021, FASB issued Accounting Standards Update 2021-01 — Reference Rate Reform (Topic 848) — Scope (“ASU 2021-01”) as an update to Accounting Standards Update 2020-04 — Reference Rate Reform (Topic 848) — Facilitation of the Effects of Reference Rate Reform on Financial Reporting (“ASU 2020-04”) in order to make certain clarifications. ASU 2020-04 and ASU 2021-01 provide optional temporary financial reporting relief from the effect of certain types of contract modifications due to the planned discontinuation of the London Interbank Offered Rate (“LIBOR”) and other interbank-offered based reference rates. The temporary relief provided by ASU 2020-04 and ASU 2021-01 is effective for certain reference rate-related contract modifications that occur during the period March 12, 2020 through December 31, 2022. Management does not believe the impact of adopting ASU 2020-04 and ASU 2021-01 will have a material impact on the financial statements.
10. Coronavirus (COVID-19) Pandemic
The global pandemic outbreak of the novel coronavirus known as COVID-19 and efforts to contain its spread have produced, and will likely continue to produce, substantial market volatility, severe market dislocations and liquidity constraints in many markets, exchange trading suspensions and closures, higher default rates, and global business disruption, and they may result in
211
Notes to Financial Statements (Unaudited) (Continued) |
future significant adverse effects, such as declines in global financial markets and a substantial economic downturn or recession throughout the world. Such factors may have a significant adverse effect on a Fund’s performance and have the potential to impair the ability of a Fund’s investment adviser, subadviser, or other service providers to serve the Fund and could lead to disruptions that negatively impact the Fund.
11. Russian-Ukraine War
In February 2022, Russia commenced a large-scale military attack on Ukraine. The outbreak of hostilities between the two countries could result in more widespread conflict and could have a severe adverse effect on the regional and the global financial markets and economies. One or more of the Funds hold positions in securities or other instruments that are economically tied to Russia. Investments in Russia are subject to political, economic, legal, market, and currency risks, as well as the risks related to the economic sanctions on Russia, Russian individuals, and Russian corporate and banking entities imposed by the United States and/or other countries. Such sanctions — which affect companies in many sectors, including energy, financial services, and defense, among others — could adversely affect the global energy and financial markets and, thus, could affect the value of a Fund’s investments, even beyond any direct exposure the Fund may have to Russian issuers or the adjoining geographic regions. Such sanctions may also result in a decline in the value and liquidity of Russian securities and a weakening of the ruble, and will impair a Fund’s ability to buy, sell, receive, or deliver Russian securities. In addition, certain transactions have been or may be prohibited and/or existing investments have or may become illiquid (e.g., because transacting in certain existing investments is prohibited), which could cause a Fund to sell other portfolio holdings at a disadvantageous time or price in order to meet shareholder redemptions.
212
Other Information (Unaudited) |
Proxy Voting
A description of the policies and procedures that each Fund’s investment adviser and subadvisers use to vote proxies relating to the Fund’s portfolio securities is available, without charge, upon request, by calling 1-888-309-3539, and on the SEC’s EDGAR database on its website at http://www.sec.gov.
Information regarding how the Funds voted proxies relating to portfolio securities during the most recent 12-month period ended June 30 is available, without charge, upon request, on the MassMutual website at http://www.massmutual.com/funds and on the SEC’s EDGAR database on its website at http://www.sec.gov.
Quarterly Reporting
The Funds file their complete schedule of portfolio holdings with the SEC for the first and third quarters of each fiscal year as an exhibit to their reports on Form N-PORT. The Funds’ Forms N-PORT are available on the SEC’s EDGAR database on its website at http://www.sec.gov. In addition, the Funds make the complete schedule of portfolio holdings from their filings on Form N-PORT available to shareholders at http://www.massmutual.com/funds.
Liquidity Risk Management Program
In 2016, the SEC adopted Rule 22e-4 under the 1940 Act (the “Liquidity Rule”) to promote effective liquidity risk management throughout the open-end investment company industry, thereby reducing the risk that a fund will be unable to meet its redemption obligations and mitigating dilution of fund shareholders. Pursuant to the Liquidity Rule, the Funds have established and maintain a Liquidity Risk Management Program (the “Program”) that incorporates the requirements of the Liquidity Rule. The Program is administered by MML Advisers, which has established a Liquidity Risk Management Program Committee (the “Committee”) to oversee the required management, assessments, reviews, and reports for the Program.
The Program’s principal objectives include supporting each Fund’s compliance with limits on investments in illiquid assets and mitigating the risk that the Fund will be unable to meet its redemption obligations in a timely manner. The Program also includes a number of elements that support the management and assessment of liquidity risk, including an annual assessment of factors that influence a Fund’s liquidity and the periodic classification of the Fund’s investments into groupings that reflect MML Advisers’ assessment of their relative liquidity under current market conditions.
At a meeting of the Board held on March 22, 2022, the Trustees received a report prepared by the Committee regarding the operation and effectiveness of the Program for the period January 1, 2021 through December 31, 2021. In the report, the Committee concluded that the Program proved to be adequately designed to address the Funds’ liquidity risks and operated effectively.
There can be no assurance that the Program will achieve its objectives in the future. Please refer to each Fund’s prospectus for more information regarding the Fund’s exposure to liquidity risk and other principal risks to which an investment in the Fund may be subject.
Trustees’ Approval of Investment Advisory Contracts
At their meeting in March 2022, the Trustees, including the Trustees who are not “interested persons” (as such term is defined in the 1940 Act) of the Trust, MML Advisers, or the subadvisers (the “Independent Trustees”), approved a new subadvisory agreement (“New Subadvisory Agreement”) with American Century Investment Management, Inc. (“American Century”) for the Sustainable Equity Fund. In preparation for the meeting, the Trustees requested, and MML Advisers provided in advance, certain materials relevant to the consideration of the New Subadvisory Agreement. In all of their deliberations, the Trustees were advised by independent counsel.
In reviewing the New Subadvisory Agreement, the Independent Trustees discussed with MML Advisers and considered a wide range of information about, among other things: (i) American Century and its personnel with responsibility for providing services to the Sustainable Equity Fund; (ii) the terms of the New Subadvisory Agreement; (iii) the scope and quality of the services that American Century is expected to provide under the New Subadvisory Agreement; (iv) the historical investment performance
213
Other Information (Unaudited) (Continued) |
track record of American Century; and (v) the fees payable to American Century by MML Advisers for the Sustainable Equity Fund, the effect of such fees on the profitability to MML Advisers, and any information provided by American Century regarding the fees paid to it by other funds with similar investment objectives as the Sustainable Equity Fund.
Prior to the votes being taken to approve the New Subadvisory Agreement, the Independent Trustees met separately in executive session to discuss the appropriateness of such contract. The Independent Trustees weighed the foregoing matters in light of the advice given to them by their independent legal counsel as to the law applicable to the review of investment advisory contracts. In arriving at a decision, the Trustees, including the Independent Trustees, did not identify any single matter as all-important or controlling. The foregoing summary does not detail all of the matters considered.
Based on the foregoing, the Trustees concluded, with respect to the New Subadvisory Agreement, that: (i) overall, they were satisfied with the nature, extent, and quality of services expected to be provided under the New Subadvisory Agreement; (ii) MML Advisers’ projected level of profitability due to the New Subadvisory Agreement is not excessive and the subadvisory fee amount under the New Subadvisory Agreement is fair and reasonable; (iii) the investment process and strategy of American Century appear well suited to the Sustainable Equity Fund given its investment objective and policies; and (iv) the terms of the New Subadvisory Agreement are fair and reasonable with respect to the Sustainable Equity Fund, and are in the best interests of the Sustainable Equity Fund’s shareholders. After carefully considering the information summarized above, the Trustees, including the Independent Trustees voting separately, unanimously voted to approve the New Subadvisory Agreement.
The New Subadvisory Agreement became effective on April 29, 2022.
At their meetings in May and June 2022, the Contract Committee (the “Committee”) and the Trustees, including the Independent Trustees, re-approved the existing advisory and subadvisory agreements (collectively, the “Contracts”) for each of the Conservative Allocation Fund, Balanced Allocation Fund, Moderate Allocation Fund, Growth Allocation Fund, Aggressive Allocation Fund, MML American Funds Growth Fund, MML American Funds International Fund, MML American Funds Core Allocation Fund, Blue Chip Growth Fund, Equity Income Fund, Equity Index Fund, Focused Equity Fund, Foreign Fund, Fundamental Equity Fund, Fundamental Value Fund, Global Fund, Income & Growth Fund, International Equity Fund, Large Cap Growth Fund, Managed Volatility Fund, Mid Cap Growth Fund, Mid Cap Value Fund, Small Cap Growth Equity Fund, Small Company Value Fund, Small/Mid Cap Value Fund, Sustainable Equity Fund, and Total Return Bond Fund, as applicable. In preparation for the meetings, the Trustees requested, and MML Advisers and the subadvisers provided in advance, certain materials relevant to the consideration of the Contracts (the “Meeting Materials”). In all of their deliberations, the Trustees were advised by independent counsel.
The Committee received in advance of the meetings (i) a memorandum from MML Advisers discussing the nature and quality of the services it provides as investment adviser to the Funds; (ii) a profitability analysis prepared by MML Advisers; and (iii) a fee and performance study report (the “Third-Party Report”) with respect to each Fund prepared by an independent third-party vendor (the “Third-Party”). The Third-Party Report provided detailed comparative advisory fee, total expense, and performance information for each Fund to assist the Committee in its evaluation of the Contracts. The Committee also considered information presented to it throughout the year regarding MML Advisers and each of the subadvisers.
The Committee considered the nature, scope, and quality of services MML Advisers provides to the Funds, including: (i) the financial condition, stability, and business strategy of MML Advisers; (ii) the capabilities of MML Advisers with respect to regulatory compliance and its ability to monitor compliance with the investment policies of the Funds; (iii) MML Advisers’ ability to provide investment oversight and provide for administrative and shareholder services to the Funds; and (iv) the experience and qualifications of the personnel of MML Advisers that perform, or oversee the performance of, the services provided to the Funds, and the needs of the Funds for administrative and shareholder services. The Committee noted that it had received in the Meeting Materials or during the course of the past year: (i) detailed information regarding MML Advisers’ ability to provide investment oversight and provide for administrative and shareholder services to the Funds; and (ii) a wide range of information about the subadvisers and their personnel with responsibility for providing services to the Funds, as applicable, and the fees payable to each subadviser by MML Advisers. MML Advisers reviewed with the Committee in detail the work MML Advisers does in its oversight roles, the expertise it brings to these roles, the size of its teams, and the financial commitment it has made to provide those services.
214
Other Information (Unaudited) (Continued) |
The Committee then reviewed and considered, for each Fund separately, the detailed information presented in the Third-Party Report regarding: (i) Fund expenses, including, among other things, both the Fund’s net advisory fee and total net expense ratio against peer funds; and (ii) the Fund’s relative performance (over various time periods against funds in its “category” and a benchmark index). In connection with the Committee’s review, MML Advisers provided commentary and analysis regarding each Fund’s expenses and performance and a recommendation as to the action to be taken by the Committee. Throughout the discussion, MML Advisers responded to Committee members’ questions and provided additional information concerning each Fund.
The Committee reviewed the expense and performance information for each Fund. (References to any one- or three-year period below are to periods ended December 31, 2021. In all cases, the comparative expense information is that of a Fund’s “peer group” and the comparative performance information is that of a Fund’s “performance category.”)
The Committee considered that the total net expense ratios for the majority of the Funds were within the top three comparative quintiles of their peer groups. Those Funds include the Equity Index Fund, Small/Mid Cap Value Fund, Focused Equity Fund, Mid Cap Value Fund, Growth Allocation Fund, MML American Funds Growth Fund, Total Return Bond Fund, Managed Volatility Fund, Income & Growth Fund, Sustainable Equity Fund, Large Cap Growth Fund, Mid Cap Growth Fund, Small Company Value Fund, and Global Fund. Of those Funds, all had net advisory fees at or below the medians of their peer groups, or in the top three comparative quintiles of their peer groups, except the Mid Cap Value Fund, Income & Growth Fund, and Large Cap Growth Fund. The Committee considered MML Advisers’ statement that the advisory arrangements for those Funds require the Adviser to bear shareholder servicing expenses having the effect of increasing the Fund’s net advisory fees above the rates that would otherwise prevail, and that the shareholder services in question are the same as the services required under any separate shareholder servicing agreement relating to other Funds in the Trust and the MML Series Investment Fund II. The Committee considered MML Advisers’ statement that, if the net advisory fees for those Funds were reduced by the portion of the fees attributable to administrative services (which include shareholder services), the net advisory fee would, in the case of each of the Funds, be less than the applicable peer group median.
In the case of a number of Funds, the Committee noted that the Fund’s net advisory fees were at or below the medians of their peer group or within the top three quintiles of their peer group, although their total net expense ratios were higher than the sixtieth percentiles of their peer groups. For the Fundamental Value Fund, Conservative Allocation Fund, Balanced Allocation Fund, Moderate Allocation Fund, Aggressive Allocation Fund, MML American Funds Core Allocation Fund, MML American Funds International Fund, Fundamental Equity Fund, and International Equity Fund, the Committee considered that the levels of the Funds’ net advisory fees and other factors cited by MML Advisers, as applicable, including recent and/or long-term investment performance, MML Advisers’ high level conviction in the Fund’s subadviser, and the fee waivers and expense caps currently in place for certain Funds, favored continuation of the Funds’ advisory agreements.
The Committee noted that a number of Funds had both total net expense ratios and net advisory fees above the sixtieth percentiles of their peer group. Those Funds included the Equity Income Fund, Blue Chip Growth Fund, Small Cap Growth Equity Fund, and Foreign Fund. The Committee considered MML Advisers’ statement that, if the net advisory fees for those Funds were reduced by the portion of the fees attributable to administrative services (which include shareholder services), the net advisory fee paid by each Fund other than Small Cap Growth Equity Fund would be less than the applicable peer group median or, in the case of the Foreign Fund, within two basis points of the peer group median. In the case of the Small Cap Growth Equity Fund, the Committee considered MML Advisers’ statement that, although the Fund’s net advisory fee is still significantly above the peer group median, it considered the fee acceptable both in light of the fact that it considers the Fund’s subadviser to be among the premier managers in the small-cap space and worth compensating at a premium to the market in light of the Fund’s long-term performance record. In each case, the Committee determined that the Fund’s net advisory fee did not appear unreasonable in light of the information presented.
The Committee determined on the basis of these factors that the Funds’ net advisory fees, and the total net expenses of the Funds generally, were consistent with the continuation of their advisory agreements.
215
Other Information (Unaudited) (Continued) |
The Committee considered that the majority of Funds achieved three-year investment performance above the medians of their performance categories, or in the top three comparative quintiles of their performance categories. Those included Equity Index Fund, Small/Mid Cap Value Fund, Fundamental Value Fund, Small Cap Growth Equity Fund, Conservative Allocation Fund, Balanced Allocation Fund, MML American Funds Core Allocation Fund, MML American Funds Growth Fund, Income & Growth Fund, Sustainable Equity Fund, Small Company Value Fund, Fundamental Equity Fund, Global Fund, Foreign Fund, and International Equity Fund. In addition, the Committee considered that the Moderate Allocation Fund and Mid Cap Growth Fund experienced three-year investment performance outside the top three comparative quintiles of their performance categories, but experienced improved performance for the one-year period, in the third comparative quintile of their performance categories.
As to the Equity Income Fund, the Committee considered that the Fund had experienced one- and three-year performance in the 62nd and 64th comparative percentiles of its performance category, respectively. The Committee considered MML Advisers’ statement that the Fund’s subadviser employs a dividend-focused investment strategy that has been out of favor in recent high growth-oriented markets, but that the Fund offers investors a high quality diversifying equity investment strategy. The Committee considered MML Advisers’ high degree of confidence in the Fund’s investment strategy and the subadviser.
As to the Focused Equity Fund, Mid Cap Value Fund, and Large Cap Growth Fund, the Committee noted that each Fund had experienced three-year investment performance outside the top three quintiles of its performance category. The Committee considered MML Advisers’ statement that each Fund’s underperformance was due in part to the Fund’s lower risk profile during a period in which investors preferred higher momentum, more speculative positions. The Committee also noted MML Advisers’ statement that each of the Focused Equity Fund and Mid Cap Value Fund had outperformed its performance category for the ten-year period, in the 23rd and 25th comparative percentiles, respectively. As to the Large Cap Growth Fund, the Committee considered MML Advisers’ statement that, despite to unfavorable stock selection in recent periods, MML Advisers has confidence in the subadviser’s approach.
As to the Blue Chip Growth Fund, the Committee noted that the Fund had experienced performance for the one- and three-year periods in the 84th and 90th comparative percentiles of its performance category, respectively. The Committee considered MML Advisers’ statement that a relatively small number of stock selection decisions were outsized contributors to the Fund’s recent underperformance, and that the Fund had experienced generally favorable longer-term performance. The Committee also noted MML Advisers’ statement that the subadviser had appointed a new lead portfolio manager in 2021, and that MML Advisers has placed the Fund under review in light of recent underperformance and the change in portfolio management team leadership.
As to the Growth Allocation Fund and Aggressive Allocation Fund, the Committee noted that each Fund had experienced three-year investment performance outside the top sixty percent of its performance category. As to the Growth Allocation Fund, MML Advisers noted that the Fund was only slightly outside the third comparative quintile, at the 62nd percentile, of its performance category. The Committee considered MML Advisers’ statement that the underperformance of both Funds was primarily due to the relatively high equity allocation of each Fund, and to the underperformance of the MML Underlying Funds in which the Funds were invested. The Committee considered MML Advisers’ statement that it is confident in its asset allocation process and strategy, and that, at least in the case of certain of the underlying equity Funds, the highly momentum-driven markets in recent periods have created a headwind to more favorable performance.
As to the MML American Funds International Fund, the Committee noted that the Fund had experienced performance for the one- and three-year periods in the 97th and 100th comparative percentiles of its performance category, respectively. The Committee considered MML Advisers’ statement that underperformance was due in part to the Fund’s relatively high emerging market equities and cash allocations and to the Fund’s more conservative investment approach relative to peers. The Committee also noted MML Advisers’ statement that, subject to shareholder approval, the Fund is expected to be liquidated in late 2022.
As to the Total Return Bond Fund, the Committee noted that, although the Fund had experienced performance for the one- and three-year periods in the 70th and 61st comparative percentiles of its performance category, respectively, the Fund had outperformed its benchmark by 0.60% with respect to the trailing three-year period and had exceeded its benchmark return in each of the last three calendar years. The Committee also considered MML Advisers’ statement that the Fund has exhibited lower risk and volatility compared to its peers in risk-off periods, including during the market volatility in March 2020. The Committee considered MML Advisers’ strong confidence in the subadviser and in its strategy for managing the Fund.
216
Other Information (Unaudited) (Continued) |
As to the Managed Volatility Fund, the Committee noted that the Fund had experienced performance in the 100th comparative percentile of its performance category for each of the one- and three-year periods. The Committee considered MML Advisers’ statements that the Fund’s performance category is composed of only one other fund, making comparison challenging, and that the Fund’s longer-term performance is more favorable, in the 1st comparative percentile for each of the five- and ten-year periods. The Committee considered MML Advisers’ statement that the subadviser’s strategy has delivered on its mandate of delivering absolute returns with lower volatility than equity markets with positive returns in seven of the eight full calendar years that the subadviser has managed the Fund along with volatility significantly below the S&P 500 Index.
The Committee also reviewed and considered information included in the Meeting Materials, or discussed at the meeting and during the course of the year, concerning economies of scale and the profitability of MML Advisers’ advisory relationship with the various Funds, including: (i) a description of MML Advisers’ revenues from the Funds (including advisory fees and administrative and shareholder services fees, as applicable) and the expense allocation methodology employed by MML Advisers; and (ii) profitability information for each individual Fund. The discussions included consideration of the intangible benefits derived by MML Advisers and its affiliates resulting from their relationships with the Funds and any so-called “fallout benefits” to MML Advisers (which were not considered to be substantial in any event), such as any reputational value derived from serving as investment adviser to the Funds, and benefits accruing to subadvisers due to so-called “soft-dollar arrangements.” Prior to the votes being taken to approve the Contracts, the Committee met separately in executive session to discuss the appropriateness of such contracts. The Committee weighed the foregoing matters in light of the advice given to them by their independent legal counsel as to the law applicable to the review of investment advisory contracts. In arriving at a decision, the Committee did not identify any single matter as all-important or controlling. The foregoing summary does not detail all of the matters considered.
As to each of the Funds, the Committee concluded that: (i) overall, it was satisfied with the nature, extent, and quality of services provided, and expected to be provided in the future, under the Contracts, including the level of MML Advisers’ oversight of each Fund and the subadvisory process; (ii) MML Advisers’ levels of profitability from its relationship with the various Funds are not excessive and the advisory fees payable under the advisory agreements and each Fund’s total net expenses are fair and reasonable; (iii) the investment processes, research capabilities, and philosophies of the subadvisers generally appear well suited to the Funds, as applicable, given their investment objectives and policies; (iv) either the relative or absolute performance of a Fund (in each case, taking into account the applicable investment strategy and risk profile of the Fund), or the steps MML Advisers has proposed in respect of the underperformance of a Fund, are sufficient to warrant continuation of the Contracts for each of the Funds; and (v) the terms of the Contracts are fair and reasonable with respect to each Fund and are in the best interests of each Fund’s shareholders.
Submission of Matters to a Vote of Security Holders
A Special Meeting of Shareholders of the Trust was held on May 25, 2022 and on the adjournment date of June 9, 2022. The Notice of Meeting of Shareholders, and a Proxy Statement and voting instruction card, were first mailed, or otherwise made available, on or about April 8, 2022 to shareholders of record as of February 25, 2022. The results of the vote on the matters submitted to shareholders at the Special Meeting are as follows:
Proposal 1: | To elect Allan W. Blair, Nabil N. El-Hage, Michael R. Fanning, Maria D. Furman, R. Bradford Malt, C. Ann Merrifield, Clifford M. Noreen, Cynthia R. Plouché, Jason J. Price, and Susan B. Sweeney as Trustees of each Trust of which the Funds are series for an indefinite term of office.* |
217
Other Information (Unaudited) (Continued) |
This matter was approved by the Trust’s shareholders on June 9, 2022. The results of the votes were as follows:
| | Shares Voted | Shares For | % of Shares
Outstanding | Withhold | % of Shares
Outstanding |
Allan W. Blair | 836,355,491.101 | 819,239,879.174 | 97.063% | 17,115,611.927 | 2.027% |
Nabil N. El-Hage | 836,355,491.101 | 820,023,997.857 | 97.156% | 16,331,493.244 | 1.934% |
Michael R. Fanning | 836,355,491.101 | 820,349,272.325 | 97.194% | 16,006,218.776 | 1.896% |
Maria D. Furman | 836,355,491.101 | 818,355,990.457 | 96.958% | 17,999,500.644 | 2.132% |
R. Bradford Malt | 836,355,491.101 | 819,735,779.473 | 97.122% | 16,619,711.628 | 1.969% |
C. Ann Merrifield | 836,355,491.101 | 818,406,703.737 | 96.964% | 17,948,787.364 | 2.126% |
Clifford M. Noreen | 836,355,491.101 | 820,407,214.709 | 97.201% | 15,948,276.392 | 1.889% |
Cynthia R. Plouché | 836,355,491.101 | 818,750,862.042 | 97.005% | 17,604,629.059 | 2.085% |
Jason J. Price | 836,355,491.101 | 820,393,954.933 | 97.200% | 15,961,536.168 | 1.891% |
Susan B. Sweeney | 836,355,491.101 | 818,772,013.146 | 97.008% | 17,583,477.955 | 2.083% |
* | Denotes Trust-wide proposal and voting results. |
Proposal 3: | To change the status of certain Funds from diversified funds to non-diversified funds. |
This matter was approved by the following Fund’s shareholders on June 9, 2022. The results of the votes were as follows:
| Shares Voted | Shares For | % of Shares
Outstanding | Against | % of Shares
Outstanding | Abstain | % of Shares
Outstanding |
Blue Chip Growth Fund | 29,066,255.075 | 27,557,765.389 | 94.087% | 1,099,245.855 | 3.753% | 409,243.831 | 1.397% |
218
Other Information (Unaudited) (Continued) |
Fund Expenses June 30, 2022
Expense Examples:
The following information is in regards to expenses for the six months ended June 30, 2022:
As a shareholder of the Funds, you incur ongoing costs, including advisory fees, distribution and/or service (12b-1) fees, and other Fund expenses. These examples are intended to help you understand your ongoing costs (in dollars) of investing in the Funds and to compare these costs with the ongoing costs of investing in other mutual funds. These examples are based on an investment of $1,000 invested for the six months ended June 30, 2022.
Actual Expenses:
The first four columns of the table below provide information about actual account values and actual expenses. You may use this information, together with the amount you invested, to estimate the expenses that you paid over the period. Simply divide your account value by $1,000 (for example, an $8,600 account value divided by $1,000 = 8.6), then multiply the result by the number under the heading entitled “Operating Expenses Incurred” to estimate the expenses you paid on your account during this period.
Hypothetical Example for Comparison Purposes:
The last two columns of the table below provide information about hypothetical account values and hypothetical expenses based on the Fund’s actual expense ratio and an assumed rate of return of 5% per year before expenses, which is not the Fund’s actual return. The hypothetical account values and expenses may not be used to estimate the actual ending account balance or expenses you paid for the period. You may use this information to compare the ongoing costs of investing in the Fund and other funds. To do so, compare this 5% hypothetical example with the 5% hypothetical examples that appear in the shareholder reports of the other funds.
Please note that the expenses shown in the table are meant to highlight your ongoing costs only and do not reflect any transactional costs. Therefore, the last two columns of the table are useful in comparing ongoing costs only, and will not help you determine the relative total costs of owning different funds. In addition, if these transactional costs were included, your costs would have been higher.
| | Beginning
Value | Annualized
Expense
Ratio | Ending
Value (Based
on Actual
Returns and
Expenses) | Operating
Expenses
Incurred* | Ending Value
(Based on
Hypothetical
Returns and
Expenses) | Operating
Expenses
Incurred* |
Conservative Allocation Fund | | | | | | |
Initial Class | $1,000 | 0.13% | $855.20 | $0.60 | $1,024.10 | $0.65 |
Service Class | 1,000 | 0.38% | 854.30 | 1.75 | 1,022.90 | 1.91 |
Balanced Allocation Fund | | | | | | |
Initial Class | 1,000 | 0.12% | 849.30 | 0.55 | 1,024.20 | 0.60 |
Service Class | 1,000 | 0.37% | 847.70 | 1.70 | 1,023.00 | 1.86 |
Moderate Allocation Fund | | | | | | |
Initial Class | 1,000 | 0.11% | 839.70 | 0.50 | 1,024.20 | 0.55 |
Service Class | 1,000 | 0.36% | 839.20 | 1.64 | 1,023.00 | 1.81 |
Growth Allocation Fund | | | | | | |
Initial Class | 1,000 | 0.12% | 828.90 | 0.54 | 1,024.20 | 0.60 |
Service Class | 1,000 | 0.37% | 828.00 | 1.68 | 1,023.00 | 1.86 |
Aggressive Allocation Fund | | | | | | |
Initial Class | 1,000 | 0.15% | 815.40 | 0.68 | 1,024.10 | 0.75 |
Service Class | 1,000 | 0.40% | 814.50 | 1.80 | 1,022.80 | 2.01 |
219
Other Information (Unaudited) (Continued) |
| | Beginning
Value | Annualized
Expense
Ratio | Ending
Value (Based
on Actual
Returns and
Expenses) | Operating
Expenses
Incurred* | Ending Value
(Based on
Hypothetical
Returns and
Expenses) | Operating
Expenses
Incurred* |
MML American Funds Growth Fund | | | | | | |
Service Class I** | $1,000 | 1.02% | $699.40 | $4.30 | $1,019.70 | $5.11 |
MML American Funds International Fund | | | | | | |
Service Class I** | 1,000 | 1.30% | 771.10 | 5.71 | 1,018.30 | 6.51 |
MML American Funds Core Allocation Fund | | | | | | |
Service Class I | 1,000 | 0.61% | 849.50 | 2.80 | 1,021.80 | 3.06 |
Blue Chip Growth Fund | | | | | | |
Initial Class | 1,000 | 0.78% | 647.50 | 3.19 | 1,020.90 | 3.91 |
Service Class | 1,000 | 1.03% | 646.90 | 4.21 | 1,019.70 | 5.16 |
Equity Income Fund | | | | | | |
Initial Class | 1,000 | 0.75% | 915.20 | 3.56 | 1,021.10 | 3.76 |
Service Class | 1,000 | 1.00% | 913.90 | 4.75 | 1,019.80 | 5.01 |
Equity Index Fund | | | | | | |
Class I | 1,000 | 0.42% | 798.60 | 1.87 | 1,022.70 | 2.11 |
Class II | 1,000 | 0.27% | 799.30 | 1.20 | 1,023.50 | 1.35 |
Class III | 1,000 | 0.12% | 800.00 | 0.54 | 1,024.20 | 0.60 |
Service Class I | 1,000 | 0.67% | 797.90 | 2.99 | 1,021.50 | 3.36 |
Focused Equity Fund | | | | | | |
Class II | 1,000 | 0.86% | 891.60 | 4.03 | 1,020.50 | 4.31 |
Service Class I | 1,000 | 1.11% | 890.70 | 5.20 | 1,019.30 | 5.56 |
Foreign Fund | | | | | | |
Initial Class | 1,000 | 0.93% | 812.50 | 4.18 | 1,020.20 | 4.66 |
Service Class | 1,000 | 1.18% | 811.50 | 5.30 | 1,018.90 | 5.91 |
Fundamental Equity Fund | | | | | | |
Class II | 1,000 | 0.80% | 781.70 | 3.53 | 1,020.80 | 4.01 |
Service Class I | 1,000 | 1.05% | 781.00 | 4.64 | 1,019.60 | 5.26 |
Fundamental Value Fund | | | | | | |
Class II | 1,000 | 0.80% | 891.00 | 3.75 | 1,020.80 | 4.01 |
Service Class I | 1,000 | 1.05% | 890.30 | 4.92 | 1,019.60 | 5.26 |
Global Fund | | | | | | |
Class I | 1,000 | 0.85% | 789.20 | 3.77 | 1,020.60 | 4.26 |
Class II | 1,000 | 0.85% | 788.50 | 3.77 | 1,020.60 | 4.26 |
Service Class I | 1,000 | 1.10% | 787.30 | 4.87 | 1,019.30 | 5.51 |
Income & Growth Fund | | | | | | |
Initial Class | 1,000 | 0.69% | 920.20 | 3.29 | 1,021.40 | 3.46 |
Service Class | 1,000 | 0.94% | 919.70 | 4.47 | 1,020.10 | 4.71 |
International Equity Fund | | | | | | |
Class II | 1,000 | 0.95% | 806.00 | 4.25 | 1,020.10 | 4.76 |
Service Class I | 1,000 | 1.20% | 804.70 | 5.37 | 1,018.80 | 6.01 |
Large Cap Growth Fund | | | | | | |
Initial Class | 1,000 | 0.70% | 712.80 | 2.97 | 1,021.30 | 3.51 |
Service Class | 1,000 | 0.95% | 711.80 | 4.03 | 1,020.10 | 4.76 |
Managed Volatility Fund | | | | | | |
Initial Class | 1,000 | 1.00% | 876.70 | 4.65 | 1,019.80 | 5.01 |
Service Class | 1,000 | 1.25% | 875.60 | 5.81 | 1,018.60 | 6.26 |
Mid Cap Growth Fund | | | | | | |
Initial Class | 1,000 | 0.82% | 720.90 | 3.50 | 1,020.70 | 4.11 |
Service Class | 1,000 | 1.07% | 719.70 | 4.56 | 1,019.50 | 5.36 |
220
Other Information (Unaudited) (Continued) |
| | Beginning
Value | Annualized
Expense
Ratio | Ending
Value (Based
on Actual
Returns and
Expenses) | Operating
Expenses
Incurred* | Ending Value
(Based on
Hypothetical
Returns and
Expenses) | Operating
Expenses
Incurred* |
Mid Cap Value Fund | | | | | | |
Initial Class | $1,000 | 0.88% | $919.70 | $4.19 | $1,020.40 | $4.41 |
Service Class | 1,000 | 1.14% | 918.80 | 5.42 | 1,019.10 | 5.71 |
Small Cap Growth Equity Fund | | | | | | |
Initial Class | 1,000 | 1.08% | 738.20 | 4.65 | 1,019.40 | 5.41 |
Service Class | 1,000 | 1.33% | 737.30 | 5.73 | 1,018.20 | 6.66 |
Small Company Value Fund | | | | | | |
Class II | 1,000 | 0.90% | 834.20 | 4.09 | 1,020.30 | 4.51 |
Service Class I | 1,000 | 1.15% | 833.20 | 5.23 | 1,019.10 | 5.76 |
Small/Mid Cap Value Fund | | | | | | |
Initial Class | 1,000 | 0.81% | 802.30 | 3.62 | 1,020.80 | 4.06 |
Service Class | 1,000 | 1.06% | 801.50 | 4.73 | 1,019.50 | 5.31 |
Sustainable Equity Fund | | | | | | |
Initial Class | 1,000 | 0.56% | 796.30 | 2.49 | 1,022.00 | 2.81 |
Service Class | 1,000 | 0.81% | 795.50 | 3.61 | 1,020.80 | 4.06 |
Total Return Bond Fund | | | | | | |
Class II | 1,000 | 0.62% | 885.40 | 2.90 | 1,021.70 | 3.11 |
Service Class I | 1,000 | 0.87% | 883.70 | 4.06 | 1,020.50 | 4.36 |
* | Expenses are calculated using the annualized expense ratio for the six months ended June 30, 2022, multiplied by the average account value over the period, multiplied by 181 days in the period, divided by 365 days in the year, unless stated otherwise. The annualized expense ratio does not reflect expenses deducted under the variable life insurance or variable annuity contract through which the Funds are invested in. Inclusion of these expenses would increase the annualized expense ratios shown. |
** | The annualized expense ratio reflects the expenses of both the Feeder Fund and the Master Fund in which it invests. |
221
[THIS PAGE INTENTIONALLY LEFT BLANK]
[THIS PAGE INTENTIONALLY LEFT BLANK]
Underwriter:
MML Distributors, LLC
1295 State Street
Springfield, Massachusetts 01111-0001

© 2022 Massachusetts Mutual Life Insurance Company (MassMutual®), Springfield, MA 01111-0001. All rights reserved. www.MassMutual.com. Investment Adviser: MML Investment Advisers, LLC | MM202307-302418 |
American Funds
Insurance Series® Semi-annual report
for the six months ended
June 30, 2022 |  |

Investing in global
companies for
the long term
American Funds Insurance Series, by Capital Group, is the underlying investment vehicle for many variable annuities and insurance products. For over 90 years, Capital Group has invested with a long-term focus based on thorough research and attention to risk.
Investing for short periods makes losses more likely. For current information and month-end results, visit capitalgroup.com/afis. For information about your insurance contract and month-end results, go to the website of the company that issued your contract.
Investing outside the United States involves risks, such as currency fluctuations, periods of illiquidity and price volatility, as more fully described in the prospectus. These risks may be heightened in connection with investments in developing countries. Investing in small-capitalization stocks can involve greater risk than is customarily associated with investing in stocks of larger, more established companies. The return of principal for bond funds and for funds with significant underlying bond holdings is not guaranteed. Fund shares are subject to the same interest rate, inflation and credit risks associated with the underlying bond holdings. High-yield bonds are subject to greater fluctuations in value and risk of loss of income and principal than investment-grade bonds. Bond ratings, which typically range from AAA/Aaa (highest) to D (lowest), are assigned by credit rating agencies such as Standard & Poor’s, Moody’s and/or Fitch as an indication of an issuer’s creditworthiness. Hedge instruments, including exchange-traded futures contracts and exchange-traded put options, may not provide an effective hedge of the underlying securities because changes in the prices of such instruments may not track those of the securities they are intended to hedge. In addition, the managed risk strategy may not effectively protect the funds from market declines and will limit the funds’ participation in market gains. The use of the managed risk strategy could cause the funds’ returns to lag those of the underlying funds in certain market conditions. Refer to the funds’ prospectuses and the Risk Factors section of this report for more information on these and other risks associated with investing in the funds.
Investments are not FDIC-insured, nor are they deposits of or guaranteed by a bank or any other entity, so they may lose value.
Fellow investors:
Results for the American Funds Insurance Series for the periods ended June 30, 2022, are shown on the following pages, as well as results of the funds’ benchmarks.
For additional information about the series, its investment results, holdings and portfolio managers, visit capitalgroup.com/afis. You can also access information about Capital Group’s American Funds and read our insights about the markets, retirement, saving for college, investing fundamentals and more at capitalgroup.com.
Contents
| American Funds Insurance Series | 1 |
Fund results shown are for past periods and are not predictive of results for future periods. Current and future results may be lower or higher than those shown. Prices and returns will vary, so investors may lose money. Investing for short periods makes losses more likely. For current information and month-end results, visit capitalgroup.com/afis. For information about your insurance contract and month-end results, go to the website of the company that issued your contract.
Results at a glance
For periods ended June 30, 2022, with all distributions reinvested
| | | Inception | | Cumulative total returns | | Average annual total returns |
| Class 1 shares | | date | | 6 months | | 1 year | | 5 years | | 10 years | | Lifetime |
| Global Growth Fund | | 4/30/97 | | | –27.84 | % | | | –24.63 | % | | | 8.62 | % | | | 11.25 | % | | | 9.58 | % |
| MSCI All Country World Index (ACWI)1 | | | | | –20.18 | | | | –15.75 | | | | 7.00 | | | | 8.76 | | | | 6.21 | |
| Global Small Capitalization Fund | | 4/30/98 | | | –31.99 | | | | –34.36 | | | | 4.59 | | | | 7.86 | | | | 8.41 | |
| MSCI All Country World Small Cap Index1 | | | | | –22.27 | | | | –21.82 | | | | 4.68 | | | | 8.33 | | | | 7.20 | |
| Growth Fund | | 2/8/84 | | | –29.80 | | | | –24.04 | | | | 13.89 | | | | 14.92 | | | | 12.82 | |
| S&P 500 Index2 | | | | | –19.96 | | | | –10.62 | | | | 11.31 | | | | 12.96 | | | | 11.24 | |
| International Fund | | 5/1/90 | | | –22.53 | | | | –26.93 | | | | 0.91 | | | | 5.20 | | | | 7.10 | |
| MSCI All Country World Index (ACWI) ex USA1 | | | | | –18.42 | | | | –19.42 | | | | 2.50 | | | | 4.83 | | | | 5.28 | |
| New World Fund | | 6/17/99 | | | –23.72 | | | | –27.22 | | | | 4.65 | | | | 5.53 | | | | 7.50 | |
| MSCI All Country World Index (ACWI)1 | | | | | –20.18 | | | | –15.75 | | | | 7.00 | | | | 8.76 | | | | 5.01 | |
| Washington Mutual Investors Fund | | 7/5/01 | | | –12.88 | | | | –3.07 | | | | 8.48 | | | | 11.55 | | | | 6.88 | |
| S&P 500 Index2 | | | | | –19.96 | | | | –10.62 | | | | 11.31 | | | | 12.96 | | | | 7.63 | |
| Capital World Growth and Income Fund | | 5/1/06 | | | –21.20 | | | | –17.65 | | | | 5.31 | | | | 8.66 | | | | 6.28 | |
| MSCI All Country World Index (ACWI)1 | | | | | –20.18 | | | | –15.75 | | | | 7.00 | | | | 8.76 | | | | 5.63 | |
| Growth-Income Fund | | 2/8/84 | | | –19.68 | | | | –12.58 | | | | 9.59 | | | | 12.27 | | | | 11.05 | |
| S&P 500 Index2 | | | | | –19.96 | | | | –10.62 | | | | 11.31 | | | | 12.96 | | | | 11.24 | |
| International Growth and Income Fund | | 11/18/08 | | | –19.00 | | | | –20.17 | | | | 1.55 | | | | 4.33 | | | | 6.80 | |
| MSCI All Country World Index (ACWI) ex USA1 | | | | | –18.42 | | | | –19.42 | | | | 2.50 | | | | 4.83 | | | | 6.78 | |
| Capital Income Builder | | 5/1/14 | | | –9.64 | | | | –5.14 | | | | 4.68 | | | | — | | | | 4.22 | |
| 70%/30% MSCI ACWI/Bloomberg U.S. Aggregate Index3 | | | | | –17.26 | | | | –13.99 | | | | 5.41 | | | | — | | | | 5.25 | |
| MSCI All Country World Index (ACWI)1 | | | | | –20.18 | | | | –15.75 | | | | 7.00 | | | | — | | | | 6.55 | |
| Bloomberg U.S. Aggregate Index4 | | | | | –10.35 | | | | –10.29 | | | | 0.88 | | | | — | | | | 1.56 | |
| Asset Allocation Fund | | 8/1/89 | | | –15.78 | | | | –11.82 | | | | 6.50 | | | | 8.86 | | | | 8.25 | |
| 60%/40% S&P 500 Index/Bloomberg U.S. Aggregate Index5 | | | | | –16.11 | | | | –10.24 | | | | 7.37 | | | | 8.50 | | | | 8.28 | |
| S&P 500 Index2 | | | | | –19.96 | | | | –10.62 | | | | 11.31 | | | | 12.96 | | | | 9.84 | |
| Bloomberg U.S. Aggregate Index4 | | | | | –10.35 | | | | –10.29 | | | | 0.88 | | | | 1.54 | | | | 5.28 | |
| American Funds Global Balanced Fund | | 5/2/11 | | | –16.31 | | | | –12.41 | | | | 4.74 | | | | 6.04 | | | | 5.25 | |
| 60%/40% MSCI ACWI/Bloomberg Global Aggregate Index6 | | | | | –17.66 | | | | –15.41 | | | | 4.18 | | | | 5.41 | | | | 4.37 | |
| MSCI All Country World Index (ACWI)1 | | | | | –20.18 | | | | –15.75 | | | | 7.00 | | | | 8.76 | | | | 6.78 | |
| Bloomberg Global Aggregate Index4 | | | | | –13.91 | | | | –15.25 | | | | –0.55 | | | | 0.11 | | | | 0.32 | |
| The Bond Fund of America | | 1/2/96 | | | –9.96 | | | | –9.48 | | | | 1.79 | | | | 2.12 | | | | 4.22 | |
| Bloomberg U.S. Aggregate Index4 | | | | | –10.35 | | | | –10.29 | | | | 0.88 | | | | 1.54 | | | | 4.37 | |
| Capital World Bond Fund | | 10/4/06 | | | –16.05 | | | | –17.37 | | | | –0.82 | | | | 0.25 | | | | 2.58 | |
| Bloomberg Global Aggregate Index4 | | | | | –13.91 | | | | –15.25 | | | | –0.55 | | | | 0.11 | | | | 2.29 | |
| American High-Income Trust | | 2/8/84 | | | –12.42 | | | | –10.67 | | | | 3.13 | | | | 4.46 | | | | 8.17 | |
| Bloomberg U.S. Corporate High Yield 2% Issuer Capped Index4 | | | | | –14.19 | | | | –12.82 | | | | 2.09 | | | | 4.47 | | | | N/A | |
| American Funds Mortgage Fund | | 5/2/11 | | | –6.77 | | | | –6.54 | | | | 1.03 | | | | 1.60 | | | | 2.02 | |
| Bloomberg U.S. Mortgage Backed Securities Index4 | | | | | –8.78 | | | | –9.03 | | | | 0.36 | | | | 1.18 | | | | 1.60 | |
| Ultra-Short Bond Fund | | 2/8/84 | | | 0.09 | | | | –0.09 | | | | 0.79 | | | | 0.35 | | | | 3.17 | |
| Bloomberg Short–Term Government/Corporate Index4 | | | | | –0.37 | | | | –0.37 | | | | 1.25 | | | | 0.84 | | | | N/A | |
| U.S. Government Securities Fund | | 12/2/85 | | | –7.08 | | | | –6.27 | | | | 1.66 | | | | 1.64 | | | | 5.36 | |
| Bloomberg U.S. Government/ Mortgage-Backed Securities Index4 | | | | | –8.93 | | | | –8.91 | | | | 0.62 | | | | 1.10 | | | | 5.63 | |
| 2 | American Funds Insurance Series |
| | | Inception | | Cumulative total returns | | Average annual total returns |
| Class P1 shares | | date | | 6 months | | 1 year | | 5 years | | Lifetime |
| Managed Risk Growth Fund | | 5/1/13 | | | –22.20 | % | | | –18.21 | % | | | 9.47 | % | | | 8.95 | % |
| S&P 500 Managed Risk Index — Moderate Aggressive7 | | | | | –13.90 | | | | –6.01 | | | | 7.36 | | | | 8.28 | |
| Managed Risk International Fund | | 5/1/13 | | | –15.68 | | | | –21.14 | | | | –0.41 | | | | 0.86 | |
| S&P EPAC Ex. Korea LargeMidCap Managed Risk Index — Moderate Aggressive7 | | | | | –14.46 | | | | –12.88 | | | | 1.43 | | | | 1.89 | |
| Managed Risk Washington Mutual Investors Fund | | 5/1/13 | | | –9.45 | | | | –2.50 | | | | 4.16 | | | | 5.71 | |
| S&P 500 Managed Risk Index — Moderate7 | | | | | –13.22 | | | | –6.26 | | | | 6.66 | | | | 7.51 | |
| Managed Risk Growth-Income Fund | | 5/1/13 | | | –15.87 | | | | –10.85 | | | | 6.66 | | | | 7.19 | |
| S&P 500 Managed Risk Index — Moderate7 | | | | | –13.22 | | | | –6.26 | | | | 6.66 | | | | 7.51 | |
| Managed Risk Asset Allocation Fund | | 9/28/12 | | | –14.40 | | | | –11.09 | | | | 4.34 | | | | 6.16 | |
| S&P 500 Managed Risk Index — Moderate Conservative7 | | | | | –12.74 | | | | –6.70 | | | | 5.97 | | | | 7.15 | |
The market indexes shown are unmanaged and, therefore, have no expenses. Investors cannot invest directly in an index.
Investment results assume all distributions are reinvested and reflect applicable fees and expenses. When applicable, investment results reflect fee waivers and/ or expense reimbursements, without which results would have been lower. The investment adviser is currently waiving a portion of its management fee for Global Growth Fund, Global Small Capitalization Fund, New World Fund, Washington Mutual Investors Fund, Capital World Growth and Income Fund, International Growth and Income Fund, Capital Income Builder, American Funds Global Balanced Fund, The Bond Fund of America, Capital World Bond Fund, American High-Income Trust, American Funds Mortgage Fund, U.S. Government Securities Fund, Managed Risk Growth Fund, Managed Risk International Fund, Managed Risk Washington Mutual Investors Fund, Managed Risk Growth-Income Fund and Managed Risk Asset Allocation Fund. The waivers will be in effect through at least May 1, 2023. The waivers may only be modified or terminated with the approval of the series’ board. Visit capitalgroup.com/afis for more information.
| 1 | Source: MSCI. Results for MSCI indexes reflect dividends net of withholding taxes and reinvestment of distributions. MSCI All Country World Index is a free float-adjusted market capitalization weighted index that is designed to measure equity market results in the global developed and emerging markets, consisting of more than 40 developed and emerging market country indexes. MSCI All Country World Small Cap Index is a free float-adjusted market capitalization-weighted index that is designed to measure equity market results of smaller capitalization companies in both developed and emerging markets. MSCI All Country World ex USA Index is a free float-adjusted market capitalization weighted index that is designed to measure equity market results in the global developed and emerging markets, excluding the United States. The index consists of more than 40 developed and emerging market country indexes. |
| 2 | Source: S&P Dow Jones Indices LLC. S&P 500 Index is a market capitalization-weighted index based on the results of approximately 500 widely held common stocks. |
| 3 | Sources: MSCI and Bloomberg Index Services Ltd. The 70%/30% MSCI ACWI/Bloomberg U.S. Aggregate Index blends the MSCIACWI (All Country World Index) with the Bloomberg U.S. Aggregate Index by weighting their total returns at 70% and 30%, respectively. Its result assumes the blend is rebalanced monthly. |
| 4 | Source: Bloomberg Index Services Ltd. Bloomberg U.S. Aggregate Index represents the U.S. investment-grade (rated BBB/Baa and above) fixed-rate bond market. Bloomberg Global Aggregate Index represents the global investment-grade fixed income markets. Bloomberg U.S. Mortgage Backed Securities Index is a market-value-weighted index that covers the mortgage-backed pass-through securities of Ginnie Mae (GNMA), Fannie Mae (FNMA), and Freddie Mac (FHLMC). Bloomberg U.S. Corporate High Yield 2% Issuer Capped Index covers the universe of fixed-rate, non-investment-grade debt. The index limits the maximum exposure of any one issuer to 2%.Bloomberg U.S. Government/Mortgage-Backed Securities Index covers obligations issued by the U.S. Treasury and U.S. government agencies. Bloomberg Short-Term Government/Corporate Index consists of investment-grade, fixed rate, publicly placed, dollar-denominated and non-convertible securities with remaining maturity from one up to (but not including) 12 months within either the government or corporate sector. |
| 5 | Sources: Bloomberg Index Services Ltd. and S&P Dow Jones Indices LLC. Blends the S&P 500 with the Bloomberg U.S. Aggregate Index by weighting their total returns at 60% and 40%, respectively. Results assume the blend is rebalanced monthly. |
| 6 | Sources: MSCI and Bloomberg Index Services Ltd. The 60%/40% MSCI ACWI/Bloomberg Global Aggregate Index blends the MSCIACWI (All Country World Index) with the Bloomberg Global Aggregate Index by weighting their cumulative total returns at 60% and 40%, respectively. Its result assumes the blend is rebalanced monthly. |
| 7 | Source: S&P Dow Jones Indices LLC. Standard & Poor’s Managed Risk Index Series is designed to simulate a dynamic protective portfolio that allocates between the underlying equity index and cash, based on realized volatilities of the underlying equity and bond indexes, while maintaining a fixed allocation to the underlying bond index. |
| American Funds Insurance Series | 3 |
About the series
Unless otherwise indicated, American Funds Insurance Series investment results are for Class 1 shares (Class P1 shares for managed risk funds). Class 1A shares began operations on January 6, 2017. Class 2 shares began operations on April 30, 1997. Class 3 shares began operations on January 16, 2004. Class 4 shares began operations on December 14, 2012. Results encompassing periods prior to those dates assume a hypothetical investment in Class 1 shares and include the deduction of additional annual expenses (0.25% for Class 1A shares, 0.25% for Class 2 shares, 0.18% for Class 3 shares and 0.50% for Class 4 shares).
The variable annuities and life insurance contracts that use the series’ funds contain certain fees and expenses not reflected in this report. Investment results assume all distributions are reinvested and reflect applicable fees and expenses. When applicable, results reflect fee waivers and/or expense reimbursements, without which they would have been lower. Visit capitalgroup.com/afis for more information.
The investment adviser is currently waiving a portion of its management fee for Global Growth Fund, Global Small Capitalization Fund, New World Fund, Washington Mutual Investors Fund, Capital World Growth and Income Fund, International Growth and Income Fund, Capital Income Builder, American Funds Global Balanced Fund, The Bond Fund of America, Capital World Bond Fund, American High-Income Trust, American Funds Mortgage Fund and U.S. Government Securities Fund. The waivers will be in effect through at least May 1, 2023. The waivers may only be modified or terminated with the approval of the series’ board. Applicable fund results shown reflect the waivers, without which results would have been lower. Refer to the Financial Highlights tables in this report for details.
For the managed risk funds, the investment adviser is currently waiving a portion of its management fee equal to 0.05% of each fund’s net assets. In addition, the investment adviser is currently reimbursing a portion of other expenses for Managed Risk International Fund. The waivers and reimbursement will be in effect through at least May 1, 2023, unless modified or terminated by the series’ board. After that time, the investment adviser may elect to extend, modify or terminate the reimbursement. The waivers may only be modified or terminated with the approval of the series’ board. Applicable fund results shown reflect the waivers and reimbursement, without which results would have been lower. Refer to the Financial Highlights tables in this report for details.
The Managed Risk Growth Fund pursues its objective by investing in shares of American Funds Insurance Series – Growth FundSM and American Funds Insurance Series – The Bond Fund of AmericaSM. The Managed Risk International Fund pursues its objective by investing in shares of American Funds Insurance Series –International FundSM and American Funds Insurance Series – The Bond Fund of AmericaSM. The Managed Risk Washington Mutual Investors Fund pursues its objective by investing in shares of American Funds Insurance Series – Washington Mutual Investors FundSM and American Funds Insurance Series – U.S. Government Securities FundSM. The Managed Risk Growth-Income Fund pursues its objective by investing in shares of American Funds Insurance Series – Growth-Income FundSM and American Funds Insurance Series – The Bond Fund of AmericaSM. The Managed Risk Asset Allocation Fund pursues its objective by investing in shares of American Funds Insurance Series – Asset Allocation FundSM. The funds seek to manage portfolio volatility and provide downside protection, primarily through the use of exchange-traded futures. The benefit of the funds’ managed risk strategy should be most apparent during periods of high volatility and in down markets. In steady or rising markets, the funds’ results can be expected to lag those of the underlying fund.
Funds are listed in the report as follows: equity, balanced, fixed income and managed risk.
| 4 | American Funds Insurance Series |
Global Growth Fund
Fund results shown are for past periods and are not predictive of results for future periods. Current and future results may be lower or higher than those shown. Prices and returns will vary, so investors may lose money. Investing for short periods makes losses more likely. For current information and month-end results, visit capitalgroup.com/afis. For information about your insurance contract and month-end results, go to the website of the company that issued your contract.
Total returns based on a $1,000 investment
For periods ended June 30, 2022*
| | | 6 months | | 1 year | | 5 years | | 10 years | | Lifetime
(since April 30, 1997) | | Gross
expense ratio | | Net
expense ratio |
| | | | | | | | | | | | | | | | | | | | | | | | | | | | | |
| Class 1 | | | -27.84 | % | | | -24.63 | % | | | 8.62 | % | | | 11.25 | % | | | 9.58 | % | | | 0.53 | % | | | 0.42 | % |
| Class 1A | | | -27.91 | | | | -24.79 | | | | 8.36 | | | | 10.99 | | | | 9.31 | | | | 0.78 | | | | 0.67 | |
| Class 2 | | | -27.91 | | | | -24.80 | | | | 8.36 | | | | 10.98 | | | | 9.30 | | | | 0.78 | | | | 0.67 | |
| Class 4 | | | -27.99 | | | | -24.98 | | | | 8.08 | | | | 10.75 | | | | 9.05 | | | | 1.03 | | | | 0.92 | |
Investment results assume all distributions are reinvested and reflect applicable fees and expenses. The investment adviser is currently waiving a portion of its management fee. This waiver will be in effect through at least May 1, 2023. The waiver may only be modified or terminated with the approval of the fund’s board. Net expense ratios reflect the waiver, without which they would have been higher. When applicable, investment results reflect fee waivers and/or expense reimbursements, without which results would have been lower. Visit capitalgroup.com/afis for more information. Expense ratios are restated to reflect current fees and are as of the fund’s prospectus dated May 1, 2022. Refer to the Financial Highlights table in this report for details.
| * | Periods greater than one year are annualized. |
| Where the fund’s assets were invested as of June 30, 2022 | Percent of net assets |
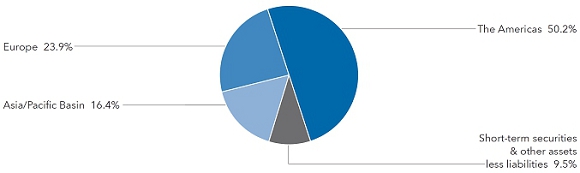
| American Funds Insurance Series | 5 |
Global Small Capitalization Fund
Fund results shown are for past periods and are not predictive of results for future periods. Current and future results may be lower or higher than those shown. Prices and returns will vary, so investors may lose money. Investing for short periods makes losses more likely. For current information and month-end results, visit capitalgroup.com/afis. For information about your insurance contract and month-end results, go to the website of the company that issued your contract.
Total returns based on a $1,000 investment
For periods ended June 30, 2022*
| | | 6 months | | 1 year | | 5 years | | 10 years | | Lifetime
(since April 30, 1998) | | Gross
expense ratio | | Net
expense ratio |
| | | | | | | | | | | | | | | | | | | | | | | | | | | | | |
| Class 1 | | | –31.99 | % | | | –34.36 | % | | | 4.59 | % | | | 7.86 | % | | | 8.41 | % | | | 0.70 | % | | | 0.65 | % |
| Class 1A | | | –32.05 | | | | –34.50 | | | | 4.34 | | | | 7.60 | | | | 8.14 | | | | 0.95 | | | | 0.90 | |
| Class 2 | | | –32.09 | | | | –34.53 | | | | 4.33 | | | | 7.59 | | | | 8.14 | | | | 0.95 | | | | 0.90 | |
| Class 4 | | | –32.13 | | | | –34.66 | | | | 4.07 | | | | 7.33 | | | | 7.87 | | | | 1.20 | | | | 1.15 | |
Investment results assume all distributions are reinvested and reflect applicable fees and expenses. The investment adviser is currently waiving a portion of its management fee. This waiver will be in effect through at least May 1, 2023. The waiver may only be modified or terminated with the approval of the fund’s board. Net expense ratios reflect the waiver, without which they would have been higher. When applicable, investment results reflect fee waivers and/or expense reimbursements, without which results would have been lower. Visit capitalgroup.com/afis for more information. Expense ratios are restated to reflect current fees and are as of the fund’s prospectus dated May 1, 2022. Refer to the Financial Highlights table in this report for details.
| * | Periods greater than one year are annualized. |
| Where the fund’s assets were invested as of June 30, 2022 | Percent of net assets |

| 6 | American Funds Insurance Series |
Growth Fund
Fund results shown are for past periods and are not predictive of results for future periods. Current and future results may be lower or higher than those shown. Prices and returns will vary, so investors may lose money. Investing for short periods makes losses more likely. For current information and month-end results, visit capitalgroup.com/afis. For information about your insurance contract and month-end results, go to the website of the company that issued your contract.
Total returns based on a $1,000 investment
For periods ended June 30, 2022*
| | | 6 months | | 1 year | | 5 years | | 10 years | | Lifetime
(since February 8, 1984) | | Expense
ratio |
| | | | | | | | | | | | | | | | | | | | | | | | | |
| Class 1 | | | –29.80 | % | | | –24.04 | % | | | 13.89 | % | | | 14.92 | % | | | 12.82 | % | | | 0.35 | % |
| Class 1A | | | –29.89 | | | | –24.24 | | | | 13.61 | | | | 14.64 | | | | 12.54 | | | | 0.60 | |
| Class 2 | | | –29.90 | | | | –24.24 | | | | 13.61 | | | | 14.63 | | | | 12.54 | | | | 0.60 | |
| Class 3 | | | –29.88 | | | | –24.19 | | | | 13.69 | | | | 14.71 | | | | 12.62 | | | | 0.53 | |
| Class 4 | | | –29.98 | | | | –24.43 | | | | 13.32 | | | | 14.36 | | | | 12.26 | | | | 0.85 | |
Investment results assume all distributions are reinvested and reflect applicable fees and expenses. When applicable, investment results reflect fee waivers and/or expense reimbursements, without which results would have been lower. Visit capitalgroup.com/afis for more information. Expense ratios are as of the fund’s prospectus dated May 1, 2022. Refer to the Financial Highlights table in this report for details.
| * | Periods greater than one year are annualized. |
| Where the fund’s assets were invested as of June 30, 2022 | Percent of net assets |

| American Funds Insurance Series | 7 |
International Fund
Fund results shown are for past periods and are not predictive of results for future periods. Current and future results may be lower or higher than those shown. Prices and returns will vary, so investors may lose money. Investing for short periods makes losses more likely. For current information and month-end results, visit capitalgroup.com/afis. For information about your insurance contract and month-end results, go to the website of the company that issued your contract.
Total returns based on a $1,000 investment
For periods ended June 30, 2022*
| | | 6 months | | 1 year | | 5 years | | 10 years | | Lifetime
(since May 1, 1990) | | Expense
ratio |
| | | | | | | | | | | | | | | | | | | | | | | | | |
| Class 1 | | | –22.53 | % | | | –26.93 | % | | | 0.91 | % | | | 5.20 | % | | | 7.10 | % | | | 0.54 | % |
| Class 1A | | | –22.66 | | | | –27.15 | | | | 0.66 | | | | 4.94 | | | | 6.83 | | | | 0.79 | |
| Class 2 | | | –22.63 | | | | –27.14 | | | | 0.66 | | | | 4.94 | | | | 6.83 | | | | 0.79 | |
| Class 3 | | | –22.64 | | | | –27.12 | | | | 0.72 | | | | 5.01 | | | | 6.91 | | | | 0.72 | |
| Class 4 | | | –22.78 | | | | –27.36 | | | | 0.40 | | | | 4.69 | | | | 6.57 | | | | 1.04 | |
Investment results assume all distributions are reinvested and reflect applicable fees and expenses. When applicable, investment results reflect fee waivers and/or expense reimbursements, without which results would have been lower. Visit capitalgroup.com/afis for more information. Expense ratios are restated to reflect current fees and are as of the fund’s prospectus dated May 1, 2022. Refer to the Financial Highlights table in this report for details.
| * | Periods greater than one year are annualized. |
| Where the fund’s assets were invested as of June 30, 2022 | Percent of net assets |

| 8 | American Funds Insurance Series |
New World Fund®
Fund results shown are for past periods and are not predictive of results for future periods. Current and future results may be lower or higher than those shown. Prices and returns will vary, so investors may lose money. Investing for short periods makes losses more likely. For current information and month-end results, visit capitalgroup.com/afis. For information about your insurance contract and month-end results, go to the website of the company that issued your contract.
Total returns based on a $1,000 investment
For periods ended June 30, 2022*
| | | 6 months | | 1 year | | 5 years | | 10 years | | Lifetime
(since June 17, 1999) | | Gross
expense ratio | | Net
expense ratio |
| | | | | | | | | | | | | | | | | | | | | | |
| Class 1 | | | –23.72 | % | | | –27.22 | % | | | 4.65 | % | | | 5.53 | % | | | 7.50 | % | | | 0.64 | % | | | 0.57 | % |
| Class 1A | | | –23.82 | | | | –27.39 | | | | 4.39 | | | | 5.27 | | | | 7.24 | | | | 0.89 | | | | 0.82 | |
| Class 2 | | | –23.84 | | | | –27.41 | | | | 4.39 | | | | 5.26 | | | | 7.24 | | | | 0.89 | | | | 0.82 | |
| Class 4 | | | –23.89 | | | | –27.56 | | | | 4.13 | | | | 5.02 | | | | 6.97 | | | | 1.14 | | | | 1.07 | |
Investment results assume all distributions are reinvested and reflect applicable fees and expenses. The investment adviser is currently waiving a portion of its management fee. This waiver will be in effect through at least May 1, 2023. The waiver may only be modified or terminated with the approval of the fund’s board. Net expense ratios reflect the waiver, without which they would have been higher. When applicable, investment results reflect fee waivers and/or expense reimbursements, without which results would have been lower. Visit capitalgroup.com/afis for more information. Expense ratios are restated to reflect current fees and are as of the fund’s prospectus dated May 1, 2022. Refer to the Financial Highlights table in this report for details.
| * | Periods greater than one year are annualized. |
| Where the fund’s assets were invested as of June 30, 2022 | Percent of net assets |
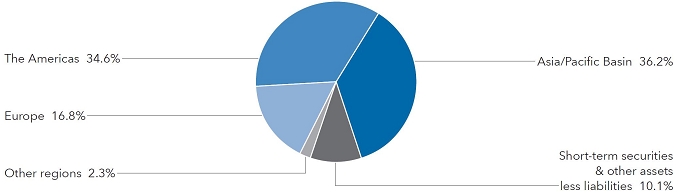
| American Funds Insurance Series | 9 |
Washington Mutual Investors FundSM
Fund results shown are for past periods and are not predictive of results for future periods. Current and future results may be lower or higher than those shown. Prices and returns will vary, so investors may lose money. Investing for short periods makes losses more likely. For current information and month-end results, visit capitalgroup.com/afis. For information about your insurance contract and month-end results, go to the website of the company that issued your contract.
Total returns based on a $1,000 investment
For periods ended June 30, 2022†
| | | 6 months | | 1 year | | 5 years | | 10 years | | Lifetime
(since May 1, 2006) | | Gross
expense ratio | | Net
expense ratio |
| | | | | | | | | | | | | | | | | | | | | | |
| Class 1 | | | –12.88 | % | | | –3.07 | % | | | 8.48 | % | | | 11.55 | % | | | 6.88 | % | | | 0.41 | % | | | 0.27 | % |
| Class 1A | | | –12.98 | | | | –3.37 | | | | 8.21 | | | | 11.28 | | | | 6.62 | | | | 0.66 | | | | 0.52 | |
| Class 2 | | | –13.01 | | | | –3.37 | | | | 8.19 | | | | 11.26 | | | | 6.61 | | | | 0.66 | | | | 0.52 | |
| Class 4 | | | –13.13 | | | | –3.58 | | | | 7.93 | | | | 11.05 | | | | 6.37 | | | | 0.91 | | | | 0.77 | |
Investment results assume all distributions are reinvested and reflect applicable fees and expenses. The investment adviser is currently waiving a portion of its management fee. This waiver will be in effect through at least May 1, 2023. The waiver may only be modified or terminated with the approval of the fund’s board. Net expense ratios reflect the waiver, without which they would have been higher. When applicable, investment results reflect fee waivers and/or expense reimbursements, without which results would have been lower. Visit capitalgroup.com/afis for more information. Expense ratios are restated to reflect current fees and are as of the fund’s prospectus dated May 1, 2022. Refer to the Financial Highlights table in this report for details.
| † | Periods greater than one year are annualized. |
| Where the fund’s assets were invested as of June 30, 2022 | Percent of net assets |

| 10 | American Funds Insurance Series |
Capital World Growth and Income Fund®
Fund results shown are for past periods and are not predictive of results for future periods. Current and future results may be lower or higher than those shown. Prices and returns will vary, so investors may lose money. Investing for short periods makes losses more likely. For current information and month-end results, visit capitalgroup.com/afis. For information about your insurance contract and month-end results, go to the website of the company that issued your contract.
Total returns based on a $1,000 investment
For periods ended June 30, 2022*
| | | 6 months | | 1 year | | 5 years | | 10 years | | Lifetime
(since May 1, 2006) | | Gross
expense ratio | | Net
expense ratio |
| | | | | | | | | | | | | | | | | | | | | | |
| Class 1 | | | –21.20 | % | | | –17.65 | % | | | 5.31 | % | | | 8.66 | % | | | 6.28 | % | | | 0.53 | % | | | 0.42 | % |
| Class 1A | | | –21.28 | | | | –17.87 | | | | 5.05 | | | | 8.41 | | | | 6.02 | | | | 0.78 | | | | 0.67 | |
| Class 2 | | | –21.30 | | | | –17.87 | | | | 5.05 | | | | 8.40 | | | | 6.01 | | | | 0.78 | | | | 0.67 | |
| Class 4 | | | –21.40 | | | | –18.07 | | | | 4.79 | | | | 8.14 | | | | 5.76 | | | | 1.03 | | | | 0.92 | |
Investment results assume all distributions are reinvested and reflect applicable fees and expenses. The investment adviser is currently waiving a portion of its management fee. This waiver will be in effect through at least May 1, 2023. The waiver may only be modified or terminated with the approval of the fund’s board. Net expense ratios reflect the waiver, without which they would have been higher. When applicable, investment results reflect fee waivers and/or expense reimbursements, without which results would have been lower. Visit capitalgroup.com/afis for more information. Expense ratios are restated to reflect current fees and are as of the fund’s prospectus dated May 1, 2022. Refer to the Financial Highlights table in this report for details.
| * | Periods greater than one year are annualized. |
| Where the fund’s assets were invested as of June 30, 2022 | Percent of net assets |

| American Funds Insurance Series | 11 |
Growth-Income Fund
Fund results shown are for past periods and are not predictive of results for future periods. Current and future results may be lower or higher than those shown. Prices and returns will vary, so investors may lose money. Investing for short periods makes losses more likely. For current information and month-end results, visit capitalgroup.com/afis. For information about your insurance contract and month-end results, go to the website of the company that issued your contract.
Total returns based on a $1,000 investment
For periods ended June 30, 2022*
| | | 6 months | | 1 year | | 5 years | | 10 years | | Lifetime
(since February 8, 1984) | | Expense
ratio |
| | | | | | | | | | | | | | | | | | | |
| Class 1 | | | –19.68 | % | | | –12.58 | % | | | 9.59 | % | | | 12.27 | % | | | 11.05 | % | | | 0.29 | % |
| Class 1A | | | –19.78 | | | | –12.78 | | | | 9.32 | | | | 12.00 | | | | 10.77 | | | | 0.54 | |
| Class 2 | | | –19.79 | | | | –12.79 | | | | 9.32 | | | | 11.98 | | | | 10.77 | | | | 0.54 | |
| Class 3 | | | –19.75 | | | | –12.72 | | | | 9.39 | | | | 12.06 | | | | 10.85 | | | | 0.47 | |
| Class 4 | | | –19.88 | | | | –13.00 | | | | 9.04 | | | | 11.72 | | | | 10.50 | | | | 0.79 | |
Investment results assume all distributions are reinvested and reflect applicable fees and expenses. When applicable, investment results reflect fee waivers and/or expense reimbursements, without which results would have been lower. Visit capitalgroup.com/afis for more information. Expense ratios are as of the fund’s prospectus dated May 1, 2022. Refer to the Financial Highlights table in this report for details.
| * | Periods greater than one year are annualized. |
| Where the fund’s assets were invested as of June 30, 2022 | Percent of net assets |

| 12 | American Funds Insurance Series |
International Growth and Income Fund
Fund results shown are for past periods and are not predictive of results for future periods. Current and future results may be lower or higher than those shown. Prices and returns will vary, so investors may lose money. Investing for short periods makes losses more likely. For current information and month-end results, visit capitalgroup.com/afis. For information about your insurance contract and month-end results, go to the website of the company that issued your contract.
Total returns based on a $1,000 investment
For periods ended June 30, 2022*
| | | 6 months | | 1 year | | 5 years | | 10 years | | Lifetime
(since November 18, 2008) | | Gross
expense ratio | | Net
expense ratio |
| | | | | | | | | | | | | | | | | | | | | | |
| Class 1 | | | –19.00 | % | | | –20.17 | % | | | 1.55 | % | | | 4.33 | % | | | 6.80 | % | | | 0.54 | % | | | 0.53 | % |
| Class 1A | | | –19.14 | | | | –20.42 | | | | 1.29 | | | | 4.08 | | | | 6.54 | | | | 0.79 | | | | 0.78 | |
| Class 2 | | | –19.16 | | | | –20.41 | | | | 1.27 | | | | 4.06 | | | | 6.53 | | | | 0.79 | | | | 0.78 | |
| Class 4 | | | –19.24 | | | | –20.59 | | | | 1.03 | | | | 3.84 | | | | 6.29 | | | | 1.04 | | | | 1.03 | |
Investment results assume all distributions are reinvested and reflect applicable fees and expenses. The investment adviser is currently waiving a portion of its management fee. This waiver will be in effect through at least May 1, 2023. The waiver may only be modified or terminated with the approval of the fund’s board. Net expense ratios reflect the waiver, without which they would have been higher. When applicable, investment results reflect fee waivers and/or expense reimbursements, without which results would have been lower. Visit capitalgroup.com/afis for more information. Expense ratios are restated to reflect current fees and are as of the fund’s prospectus dated May 1, 2022. Refer to the Financial Highlights table in this report for details.
| * | Periods greater than one year are annualized. |
| Where the fund’s assets were invested as of June 30, 2022 | Percent of net assets |
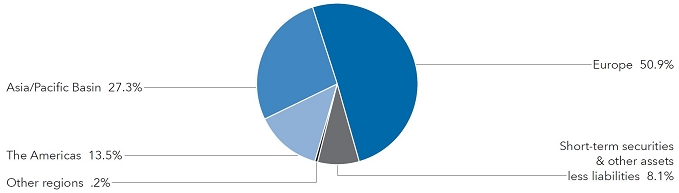
| American Funds Insurance Series | 13 |
Capital Income Builder®
Fund results shown are for past periods and are not predictive of results for future periods. Current and future results may be lower or higher than those shown. Prices and returns will vary, so investors may lose money. Investing for short periods makes losses more likely. For current information and month-end results, visit capitalgroup.com/afis. For information about your insurance contract and month-end results, go to the website of the company that issued your contract.
Total returns based on a $1,000 investment
For periods ended June 30, 2022*
| | | 6 months | | 1 year | | 5 years | | Lifetime
(since May 1, 2014) | | Gross
expense ratio | | Net
expense ratio |
| | | | | | | | | | | | | | | | | | | |
| Class 1 | | | –9.64 | % | | | –5.14 | % | | | 4.68 | % | | | 4.22 | % | | | 0.41 | % | | | 0.27 | % |
| Class 1A | | | –9.68 | | | | –5.38 | | | | 4.43 | | | | 3.97 | | | | 0.66 | | | | 0.52 | |
| Class 2 | | | –9.67 | | | | –5.37 | | | | 4.43 | | | | 4.05 | | | | 0.66 | | | | 0.52 | |
| Class 4 | | | –9.81 | | | | –5.62 | | | | 4.17 | | | | 3.71 | | | | 0.91 | | | | 0.77 | |
Investment results assume all distributions are reinvested and reflect applicable fees and expenses. The investment adviser is currently waiving a portion of its management fee. This waiver will be in effect through at least May 1, 2023. The waiver may only be modified or terminated with the approval of the fund’s board. Net expense ratios reflect the waiver, without which they would have been higher. When applicable, investment results reflect fee waivers and/or expense reimbursements, without which results would have been lower. Visit capitalgroup.com/afis for more information. Expense ratios are restated to reflect current fees and are as of the fund’s prospectus dated May 1, 2022. Refer to the Financial Highlights table in this report for details.
| * | Periods greater than one year are annualized. |
| Where the fund’s assets were invested as of June 30, 2022 | Percent of net assets |
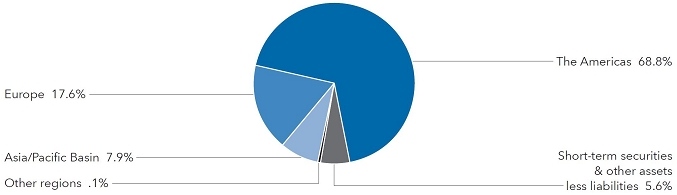
| 14 | American Funds Insurance Series |
Asset Allocation Fund
Fund results shown are for past periods and are not predictive of results for future periods. Current and future results may be lower or higher than those shown. Prices and returns will vary, so investors may lose money. Investing for short periods makes losses more likely. For current information and month-end results, visit capitalgroup.com/afis. For information about your insurance contract and month-end results, go to the website of the company that issued your contract.
Total returns based on a $1,000 investment
For periods ended June 30, 2022*
| | | 6 months | | 1 year | | 5 years | | 10 years | | Lifetime
(since August 1, 1989) | | Expense
ratio |
| | | | | | | | | | | | | | | | | | | |
| Class 1 | | | –15.78 | % | | | –11.82 | % | | | 6.50 | % | | | 8.86 | % | | | 8.25 | % | | | 0.30 | % |
| Class 1A | | | –15.88 | | | | –12.03 | | | | 6.24 | | | | 8.60 | | | | 7.99 | | | | 0.55 | |
| Class 2 | | | –15.91 | | | | –12.06 | | | | 6.23 | | | | 8.58 | | | | 7.98 | | | | 0.55 | |
| Class 3 | | | –15.89 | | | | –12.01 | | | | 6.30 | | | | 8.66 | | | | 8.06 | | | | 0.48 | |
| Class 4 | | | –16.01 | | | | –12.29 | | | | 5.96 | | | | 8.36 | | | | 7.73 | | | | 0.80 | |
Investment results assume all distributions are reinvested and reflect applicable fees and expenses. When applicable, investment results reflect fee waivers and/or expense reimbursements, without which results would have been lower. Visit capitalgroup.com/afis for more information. Expense ratios are as of the fund’s prospectus dated May 1, 2022. Refer to the Financial Highlights table in this report for details.
| * | Periods greater than one year are annualized. |
| Where the fund’s assets were invested as of June 30, 2022 | Percent of net assets |

| American Funds Insurance Series | 15 |
American Funds Global Balanced FundSM
Fund results shown are for past periods and are not predictive of results for future periods. Current and future results may be lower or higher than those shown. Prices and returns will vary, so investors may lose money. Investing for short periods makes losses more likely. For current information and month-end results, visit capitalgroup.com/afis. For information about your insurance contract and month-end results, go to the website of the company that issued your contract.
Total returns based on a $1,000 investment
For periods ended June 30, 2022*
| | | 6 months | | 1 year | | 5 years | | 10 years | | Lifetime
(since May 2, 2011) | | Gross
expense ratio | | Net
expense ratio |
| | | | | | | | | | | | | | | | | | | | | | |
| Class 1 | | | –16.31 | % | | | –12.41 | % | | | 4.74 | % | | | 6.04 | % | | | 5.25 | % | | | 0.52 | % | | | 0.51 | % |
| Class 1A | | | –16.48 | | | | –12.65 | | | | 4.48 | | | | 5.79 | | | | 5.01 | | | | 0.77 | | | | 0.76 | |
| Class 2 | | | –16.41 | | | | –12.61 | | | | 4.47 | | | | 5.78 | | | | 4.99 | | | | 0.77 | | | | 0.76 | |
| Class 4 | | | –16.53 | | | | –12.87 | | | | 4.20 | | | | 5.63 | | | | 4.83 | | | | 1.02 | | | | 1.01 | |
Investment results assume all distributions are reinvested and reflect applicable fees and expenses. The investment adviser is currently waiving a portion of its management fee. This waiver will be in effect through at least May 1, 2023. The waiver may only be modified or terminated with the approval of the fund’s board. Net expense ratios reflect the waiver, without which they would have been higher. When applicable, investment results reflect fee waivers and/or expense reimbursements, without which results would have been lower. Visit capitalgroup.com/afis for more information. Expense ratios are restated to reflect current fees and are as of the fund’s prospectus dated May 1, 2022. Refer to the Financial Highlights table in this report for details.
| * | Periods greater than one year are annualized. |
| Where the fund’s assets were invested as of June 30, 2022 | Percent of net assets |

| 16 | American Funds Insurance Series |
The Bond Fund of America®
Fund results shown are for past periods and are not predictive of results for future periods. Current and future results may be lower or higher than those shown. Prices and returns will vary, so investors may lose money. Investing for short periods makes losses more likely. For current information and month-end results, visit capitalgroup.com/afis. For information about your insurance contract and month-end results, go to the website of the company that issued your contract.
Total returns based on a $1,000 investment
For periods ended June 30, 2022*
| | | 6 months | | 1 year | | 5 years | | 10 years | | Lifetime
(since January 2, 1996) | | Gross
expense ratio | | Net
expense ratio |
| | | | | | | | | | | | | | | |
| Class 1 | | | –9.96 | % | | | –9.48 | % | | | 1.79 | % | | | 2.12 | % | | | 4.22 | % | | | 0.39 | % | | | 0.20 | % |
| Class 1A | | | –10.09 | | | | –9.70 | | | | 1.55 | | | | 1.87 | | | | 3.97 | | | | 0.64 | | | | 0.45 | |
| Class 2 | | | –10.14 | | | | –9.68 | | | | 1.54 | | | | 1.86 | | | | 3.96 | | | | 0.64 | | | | 0.45 | |
| Class 4 | | | –10.22 | | | | –9.92 | | | | 1.28 | | | | 1.62 | | | | 3.71 | | | | 0.89 | | | | 0.70 | |
Investment results assume all distributions are reinvested and reflect applicable fees and expenses. The investment adviser is currently waiving a portion of its management fee. This waiver will be in effect through at least May 1, 2023. The waiver may only be modified or terminated with the approval of the fund’s board. Net expense ratios reflect the waiver, without which they would have been higher. When applicable, investment results reflect fee waivers and/or expense reimbursements, without which results would have been lower. Visit capitalgroup.com/afis for more information. Expense ratios are restated to reflect current fees and are as of the fund’s prospectus dated May 1, 2022. Refer to the Financial Highlights table in this report for details.
| * | Periods greater than one year are annualized. |
| Where the fund’s assets were invested as of June 30, 2022 | Percent of net assets |
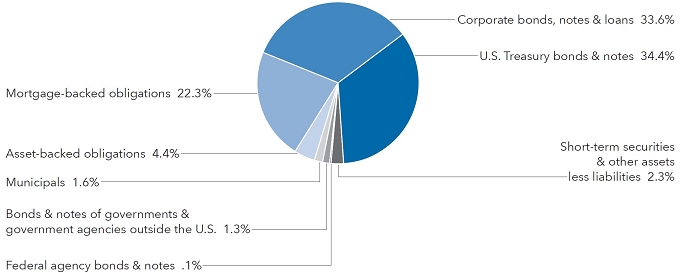
| American Funds Insurance Series | 17 |
Capital World Bond Fund®
Fund results shown are for past periods and are not predictive of results for future periods. Current and future results may be lower or higher than those shown. Prices and returns will vary, so investors may lose money. Investing for short periods makes losses more likely. For current information and month-end results, visit capitalgroup.com/afis. For information about your insurance contract and month-end results, go to the website of the company that issued your contract.
Total returns based on a $1,000 investment
For periods ended June 30, 2022*
| | | 6 months | | 1 year | | 5 years | | 10 years | | Lifetime
(since October 4, 2006) | | Gross
expense ratio |
| | | | | | | | | | | | | | | | | | | |
| Class 1 | | | –16.05 | % | | | –17.37 | % | | | –0.82 | % | | | 0.25 | % | | | 2.58 | % | | | 0.50 | % |
| Class 1A | | | –16.22 | | | | –17.63 | | | | –1.05 | | | | 0.01 | | | | 2.34 | | | | 0.75 | |
| Class 2 | | | –16.21 | | | | –17.65 | | | | –1.06 | | | | –0.01 | | | | 2.32 | | | | 0.75 | |
| Class 4 | | | –16.26 | | | | –17.79 | | | | –1.31 | | | | –0.21 | | | | 2.10 | | | | 1.00 | |
Investment results assume all distributions are reinvested and reflect applicable fees and expenses. The investment adviser is currently waiving a portion of its management fee. This waiver will be in effect through at least May 1, 2023. The waiver may only be modified or terminated with the approval of the fund’s board. Net expense ratios reflect the waiver, without which they would have been higher. When applicable, investment results reflect fee waivers and/or expense reimbursements, without which results would have been lower. Visit capitalgroup.com/afis for more information. Expense ratios are restated to reflect current fees and are as of the fund’s prospectus dated May 1, 2022. Refer to the Financial Highlights table in this report for details.
| * | Periods greater than one year are annualized. |
| Where the fund’s assets were invested as of June 30, 2022 | Percent of net assets |
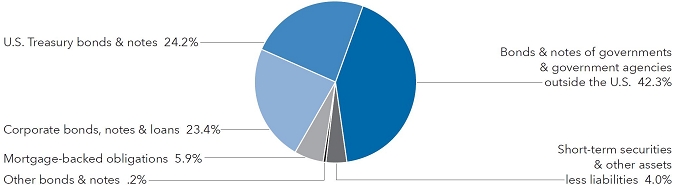
| 18 | American Funds Insurance Series |
American High-Income Trust®
Fund results shown are for past periods and are not predictive of results for future periods. Current and future results may be lower or higher than those shown. Prices and returns will vary, so investors may lose money. Investing for short periods makes losses more likely. For current information and month-end results, visit capitalgroup.com/afis. For information about your insurance contract and month-end results, go to the website of the company that issued your contract.
Total returns based on a $1,000 investment
For periods ended June 30, 2022*
| | | 6 months | | 1 year | | 5 years | | 10 years | | Lifetime
(since February 8, 1984) | | Gross
expense ratio | | Net
expense ratio |
| | | | | | | | | | | | | | | |
| Class 1 | | | –12.42 | % | | | –10.67 | % | | | 3.13 | % | | | 4.46 | % | | | 8.17 | % | | | 0.44 | % | | | 0.30 | % |
| Class 1A | | | –12.60 | | | | –11.01 | | | | 2.85 | | | | 4.20 | | | | 7.90 | | | | 0.69 | | | | 0.55 | |
| Class 2 | | | –12.52 | | | | –10.94 | | | | 2.87 | | | | 4.19 | | | | 7.90 | | | | 0.69 | | | | 0.55 | |
| Class 3 | | | –12.58 | | | | –10.91 | | | | 2.93 | | | | 4.25 | | | | 7.97 | | | | 0.62 | | | | 0.48 | |
| Class 4 | | | –12.68 | | | | –11.12 | | | | 2.61 | | | | 3.98 | | | | 7.64 | | | | 0.94 | | | | 0.80 | |
Investment results assume all distributions are reinvested and reflect applicable fees and expenses. The investment adviser is currently waiving a portion of its management fee. This waiver will be in effect through at least May 1, 2023. The waiver may only be modified or terminated with the approval of the fund’s board. Net expense ratios reflect the waiver, without which they would have been higher. When applicable, investment results reflect fee waivers and/or expense reimbursements, without which results would have been lower. Visit capitalgroup.com/afis for more information. Expense ratios are restated to reflect current fees and are as of the fund’s prospectus dated May 1, 2022. Refer to the Financial Highlights table in this report for details.
| * | Periods greater than one year are annualized. |
| Where the fund’s assets were invested as of June 30, 2022 | Percent of net assets |

| American Funds Insurance Series | 19 |
American Funds Mortgage Fund®
Fund results shown are for past periods and are not predictive of results for future periods. Current and future results may be lower or higher than those shown. Prices and returns will vary, so investors may lose money. Investing for short periods makes losses more likely. For current information and month-end results, visit capitalgroup.com/afis. For information about your insurance contract and month-end results, go to the website of the company that issued your contract.
Total returns based on a $1,000 investment
For periods ended June 30, 2022*
| | | 6 months | | 1 year | | 5 years | | 10 years | | Lifetime
(since May 2, 2011) | | Gross
expense ratio | | Net
expense ratio |
| | | | | | | | | | | | | | | |
| Class 1 | | | –6.77 | % | | | –6.54 | % | | | 1.03 | % | | | 1.60 | % | | | 2.02 | % | | | 0.37 | % | | | 0.25 | % |
| Class 1A | | | –6.94 | | | | –6.82 | | | | 0.78 | | | | 1.35 | | | | 1.77 | | | | 0.62 | | | | 0.50 | |
| Class 2 | | | –6.93 | | | | –6.81 | | | | 0.77 | | | | 1.34 | | | | 1.76 | | | | 0.62 | | | | 0.50 | |
| Class 4 | | | –7.05 | | | | –7.09 | | | | 0.52 | | | | 1.14 | | | | 1.56 | | | | 0.87 | | | | 0.75 | |
Investment results assume all distributions are reinvested and reflect applicable fees and expenses. The investment adviser is currently waiving a portion of its management fee. This waiver will be in effect through at least May 1, 2023. The waiver may only be modified or terminated with the approval of the fund’s board. Net expense ratios reflect the waiver, without which they would have been higher. When applicable, investment results reflect fee waivers and/or expense reimbursements, without which results would have been lower. Visit capitalgroup.com/afis for more information. Expense ratios are restated to reflect current fees and are as of the fund’s prospectus dated May 1, 2022. Refer to the Financial Highlights table in this report for details.
| * | Periods greater than one year are annualized. |
| Where the fund’s assets were invested as of June 30, 2022 | Percent of net assets |
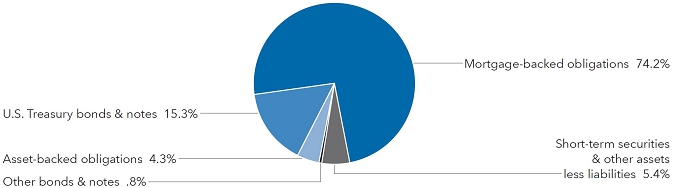
| 20 | American Funds Insurance Series |
Ultra-Short Bond Fund
Fund results shown are for past periods and are not predictive of results for future periods. Current and future results may be lower or higher than those shown. Prices and returns will vary, so investors may lose money. Investing for short periods makes losses more likely. For current information and month-end results, visit capitalgroup.com/afis. For information about your insurance contract and month-end results, go to the website of the company that issued your contract.
Total returns based on a $1,000 investment
For periods ended June 30, 2022*
| | | 6 months | | 1 year | | 5 years | | 10 years | | Lifetime
(since February 8, 1984) | | Expense
ratio |
| | | | | | | | | | | | | |
| Class 1 | | | 0.09 | % | | | –0.09 | % | | | 0.79 | % | | | 0.35 | % | | | 3.17 | % | | | 0.31 | % |
| Class 1A | | | 0.00 | | | | –0.09 | | | | 0.79 | | | | 0.24 | | | | 2.95 | | | | 0.56 | |
| Class 2 | | | –0.09 | | | | –0.36 | | | | 0.54 | | | | 0.09 | | | | 2.92 | | | | 0.56 | |
| Class 3 | | | –0.09 | | | | –0.27 | | | | 0.61 | | | | 0.16 | | | | 2.99 | | | | 0.49 | |
| Class 4 | | | –0.18 | | | | –0.54 | | | | 0.30 | | | | –0.08 | | | | 2.68 | | | | 0.81 | |
Investment results assume all distributions are reinvested and reflect applicable fees and expenses. When applicable, investment results reflect fee waivers and/or expense reimbursements, without which results would have been lower. Visit capitalgroup.com/afis for more information. Expense ratios are restated to reflect current fees and are as of the fund’s prospectus dated May 1, 2022. Refer to the Financial Highlights table in this report for details.
| * | Periods greater than one year are annualized. |
| Where the fund’s assets were invested as of June 30, 2022 | | Percent of net assets |
| | | |
| Commercial paper | | | 69.4 | % |
| Federal agency bills & notes | | | 17.6 | |
| U.S. Treasury bills | | | 11.2 | |
| Other assets less liabilities | | | 1.8 | |
| Total | | | 100.0 | % |
| American Funds Insurance Series | 21 |
U.S. Government Securities Fund®
Fund results shown are for past periods and are not predictive of results for future periods. Current and future results may be lower or higher than those shown. Prices and returns will vary, so investors may lose money. Investing for short periods makes losses more likely. For current information and month-end results, visit capitalgroup.com/afis. For information about your insurance contract and month-end results, go to the website of the company that issued your contract.
Total returns based on a $1,000 investment
For periods ended June 30, 2022*
| | | 6 months | | 1 year | | 5 years | | 10 years | | Lifetime
(since December 2, 1985) | | Gross
expense ratio | | Net
expense ratio |
| | | | | | | | | | | | | | | |
| Class 1 | | | –7.08 | % | | | –6.27 | % | | | 1.66 | % | | | 1.64 | % | | | 5.36 | % | | | 0.34 | % | | | 0.22 | % |
| Class 1A | | | –7.15 | | | | –6.43 | | | | 1.42 | | | | 1.41 | | | | 5.11 | | | | 0.59 | | | | 0.47 | |
| Class 2 | | | –7.21 | | | | –6.51 | | | | 1.41 | | | | 1.38 | | | | 5.10 | | | | 0.59 | | | | 0.47 | |
| Class 3 | | | –7.18 | | | | –6.43 | | | | 1.48 | | | | 1.46 | | | | 5.17 | | | | 0.52 | | | | 0.40 | |
| Class 4 | | | –7.35 | | | | –6.68 | | | | 1.15 | | | | 1.18 | | | | 4.85 | | | | 0.84 | | | | 0.72 | |
Investment results assume all distributions are reinvested and reflect applicable fees and expenses. The investment adviser is currently waiving a portion of its management fee. This waiver will be in effect through at least May 1, 2023. The waiver may only be modified or terminated with the approval of the fund’s board. Net expense ratios reflect the waiver, without which they would have been higher. When applicable, investment results reflect fee waivers and/or expense reimbursements, without which results would have been lower. Visit capitalgroup.com/afis for more information. Expense ratios are restated to reflect current fees and are as of the fund’s prospectus dated May 1, 2022. Refer to the Financial Highlights table in this report for details.
| * | Periods greater than one year are annualized. |
| Where the fund’s assets were invested as of June 30, 2022 | Percent of net assets |
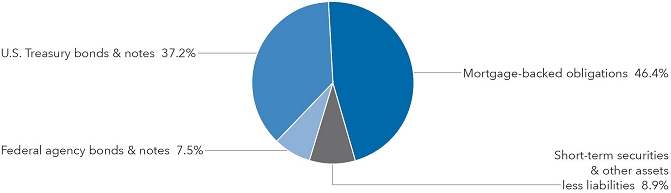
| 22 | American Funds Insurance Series |
Managed Risk Growth Fund
Fund results shown are for past periods and are not predictive of results for future periods. Current and future results may be lower or higher than those shown. Prices and returns will vary, so investors may lose money. Investing for short periods makes losses more likely. For current information and month-end results, visit capitalgroup.com/afis. For information about your insurance contract and month-end results, go to the website of the company that issued your contract.
Total returns based on a $1,000 investment
For periods ended June 30, 2022*
| | | 6 months | | 1 year | | 5 years | | Lifetime
(since May 1, 2013) | | Gross
expense ratio | | Net
expense ratio |
| | | | | | | | | | | | | |
| Class P1 | | | –22.20 | % | | | –18.21 | % | | | 9.47 | % | | | 8.95 | % | | | 0.74 | % | | | 0.69 | % |
| Class P2 | | | –22.32 | | | | –18.44 | | | | 9.21 | | | | 8.64 | | | | 0.99 | | | | 0.94 | |
The investment adviser is currently waiving a portion of its management fee. This waiver will be in effect through at least May 1, 2023. The waiver may only be modified or terminated with the approval of the fund’s board. Net expense ratios shown reflect the waiver, without which they would have been higher. When applicable, investment results reflect fee waivers and/or expense reimbursements, without which results would have been lower. Visit capitalgroup.com/afis for more information. Expense ratios are as of the fund’s prospectus dated May 1, 2022.
| * | Periods greater than one year are annualized. |
| American Funds Insurance Series | 23 |
Managed Risk International Fund
Fund results shown are for past periods and are not predictive of results for future periods. Current and future results may be lower or higher than those shown. Prices and returns will vary, so investors may lose money. Investing for short periods makes losses more likely. For current information and month-end results, visit capitalgroup.com/afis. For information about your insurance contract and month-end results, go to the website of the company that issued your contract.
Total returns based on a $1,000 investment
For periods ended June 30, 2022*
| | | 6 months | | 1 year | | 5 years | | Lifetime
(since May 1, 2013) | | Gross
expense ratio | | Net
expense ratio |
| | | | | | | | | | | | | |
| Class P1 | | | –15.68 | % | | | –21.14 | % | | | –0.41 | % | | | 0.86 | % | | | 0.93 | % | | | 0.85 | % |
| Class P2 | | | –15.83 | | | | –21.38 | | | | –0.73 | | | | 0.50 | | | | 1.18 | | | | 1.10 | |
The investment adviser is currently waiving a portion of its management fee. In addition, the investment adviser is currently reimbursing a portion of other expenses. This waiver and reimbursement will be in effect through at least May 1, 2023. The adviser may elect at its discretion to extend, modify or terminate the reimbursement at that time. The waiver may only be modified or terminated with the approval of the fund’s board. Net expense ratios shown reflect the waiver and reimbursement, without which they would have been higher. When applicable, investment results reflect fee waivers and/or expense reimbursements, without which results would have been lower. Visit capitalgroup.com/afis for more information. Expense ratios are restated to reflect current fees and are as of the fund’s prospectus dated May 1, 2022.
| * | Periods greater than one year are annualized. |
| 24 | American Funds Insurance Series |
Managed Risk Washington Mutual Investors Fund
Fund results shown are for past periods and are not predictive of results for future periods. Current and future results may be lower or higher than those shown. Prices and returns will vary, so investors may lose money. Investing for short periods makes losses more likely. For current information and month-end results, visit capitalgroup.com/afis. For information about your insurance contract and month-end results, go to the website of the company that issued your contract.
Total returns based on a $1,000 investment
For periods ended June 30, 2022*
| | | 6 months | | 1 year | | 5 years | | Lifetime
(since May 1, 2013) | | Gross
expense ratio | | Net
expense ratio |
| | | | | | | | | | | | | |
| Class P1 | | | –9.45 | % | | | –2.50 | % | | | 4.16 | % | | | 5.71 | % | | | 0.69 | % | | | 0.64 | % |
| Class P2 | | | –9.56 | | | | –2.81 | | | | 3.84 | | | | 5.36 | | | | 0.94 | | | | 0.89 | |
The investment adviser is currently waiving a portion of its management fee. This waiver will be in effect through at least May 1, 2023. The waiver may only be modified or terminated with the approval of the fund’s board. Net expense ratios shown reflect the waiver, without which they would have been higher. When applicable, investment results reflect fee waivers and/or expense reimbursements, without which results would have been lower. Visit capitalgroup.com/afis for more information. Expense ratios are restated to reflect current fees and are as of the fund’s prospectus dated May 1, 2022.
| * | Periods greater than one year are annualized. |
| American Funds Insurance Series | 25 |
Managed Risk Growth-Income Fund
Fund results shown are for past periods and are not predictive of results for future periods. Current and future results may be lower or higher than those shown. Prices and returns will vary, so investors may lose money. Investing for short periods makes losses more likely. For current information and month-end results, visit capitalgroup.com/afis. For information about your insurance contract and month-end results, go to the website of the company that issued your contract.
Total returns based on a $1,000 investment
For periods ended June 30, 2022*
| | | 6 months | | 1 year | | 5 years | | Lifetime
(since May 1, 2013) | | Gross
expense ratio | | Net
expense ratio |
| | | | | | | | | | | | | |
| Class P1 | | | –15.87 | % | | | –10.85 | % | | | 6.66 | % | | | 7.19 | % | | | 0.68 | % | | | 0.63 | % |
| Class P2 | | | –16.01 | | | | –11.15 | | | | 6.36 | | | | 6.88 | | | | 0.93 | | | | 0.88 | |
The investment adviser is currently waiving a portion of its management fee. This waiver will be in effect through at least May 1, 2023. The waiver may only be modified or terminated with the approval of the fund’s board. Net expense ratios shown reflect the waiver, without which they would have been higher. When applicable, investment results reflect fee waivers and/or expense reimbursements, without which results would have been lower. Visit capitalgroup.com/afis for more information. Expense ratios are as of the fund’s prospectus dated May 1, 2022.
| * | Periods greater than one year are annualized. |
| 26 | American Funds Insurance Series |
Managed Risk Asset Allocation Fund
Fund results shown are for past periods and are not predictive of results for future periods. Current and future results may be lower or higher than those shown. Prices and returns will vary, so investors may lose money. Investing for short periods makes losses more likely. For current information and month-end results, visit capitalgroup.com/afis. For information about your insurance contract and month-end results, go to the website of the company that issued your contract.
Total returns based on a $1,000 investment
For periods ended June 30, 2022*
| | | 6 months | | 1 year | | 5 years | | Lifetime
(since September 28, 2012) | | Gross
expense ratio | | Net
expense ratio |
| | | | | | | | | | | | | |
| Class P1 | | | –14.40 | % | | | –11.09 | % | | | 4.34 | % | | | 6.16 | % | | | 0.70 | % | | | 0.65 | % |
| Class P2 | | | –14.50 | | | | –11.31 | | | | 4.08 | | | | 5.90 | | | | 0.95 | | | | 0.90 | |
The investment adviser is currently waiving a portion of its management fee. This waiver will be in effect through at least May 1, 2023. The waiver may only be modified or terminated with the approval of the fund’s board. Net expense ratios shown reflect the waiver, without which they would have been higher. When applicable, investment results reflect fee waivers and/or expense reimbursements, without which results would have been lower. Visit capitalgroup.com/afis for more information. Expense ratios are as of the fund’s prospectus dated May 1, 2022.
| * | Periods greater than one year are annualized. |
| American Funds Insurance Series | 27 |
Global Growth Fund
| Investment portfolio June 30, 2022 | unaudited |
| Common stocks 89.00% | | Shares | | | Value
(000) | |
| Information technology 24.63% | | | | | | | | |
| Microsoft Corp. | | | 1,862,700 | | | $ | 478,396 | |
| Taiwan Semiconductor Manufacturing Company, Ltd. | | | 20,131,000 | | | | 322,275 | |
| Taiwan Semiconductor Manufacturing Company, Ltd. (ADR) | | | 140,000 | | | | 11,445 | |
| ASML Holding NV | | | 458,318 | | | | 218,942 | |
| ASML Holding NV (New York registered) (ADR) | | | 234,500 | | | | 111,594 | |
| Adyen NV1 | | | 64,475 | | | | 93,782 | |
| Applied Materials, Inc. | | | 875,000 | | | | 79,608 | |
| Broadcom, Inc. | | | 125,300 | | | | 60,872 | |
| Fiserv, Inc.1 | | | 497,600 | | | | 44,272 | |
| MongoDB, Inc., Class A1 | | | 139,000 | | | | 36,071 | |
| Samsung Electronics Co., Ltd. | | | 785,100 | | | | 34,466 | |
| Apple, Inc. | | | 229,880 | | | | 31,429 | |
| Hexagon AB, Class B | | | 2,920,500 | | | | 30,333 | |
| NVIDIA Corp. | | | 167,500 | | | | 25,391 | |
| Keyence Corp. | | | 69,400 | | | | 23,723 | |
| EPAM Systems, Inc.1 | | | 72,800 | | | | 21,460 | |
| Mastercard, Inc., Class A | | | 53,300 | | | | 16,815 | |
| Capgemini SE | | | 85,000 | | | | 14,560 | |
| Visa, Inc., Class A | | | 70,197 | | | | 13,821 | |
| DocuSign, Inc.1 | | | 180,000 | | | | 10,328 | |
| Network International Holdings PLC1 | | | 3,731,800 | | | | 8,577 | |
| Shopify, Inc., Class A, subordinate voting shares1 | | | 140,000 | | | | 4,374 | |
| | | | | | | | 1,692,534 | |
| | | | | | | | | |
| Health care 16.62% | | | | | | | | |
| UnitedHealth Group, Inc. | | | 320,450 | | | | 164,593 | |
| Pfizer, Inc. | | | 1,884,219 | | | | 98,790 | |
| AstraZeneca PLC | | | 748,300 | | | | 98,378 | |
| ResMed, Inc. | | | 378,000 | | | | 79,240 | |
| DexCom, Inc.1 | | | 1,012,000 | | | | 75,424 | |
| Cigna Corp. | | | 259,119 | | | | 68,283 | |
| Merck & Co., Inc. | | | 620,000 | | | | 56,525 | |
| Regeneron Pharmaceuticals, Inc.1 | | | 95,036 | | | | 56,179 | |
| Eli Lilly and Company | | | 136,600 | | | | 44,290 | |
| Mettler-Toledo International, Inc.1 | | | 34,600 | | | | 39,747 | |
| CVS Health Corp. | | | 371,000 | | | | 34,377 | |
| Novo Nordisk A/S, Class B | | | 280,400 | | | | 31,100 | |
| Elevance Health, Inc. | | | 53,100 | | | | 25,625 | |
| NovoCure, Ltd.1 | | | 340,000 | | | | 23,630 | |
| Tandem Diabetes Care, Inc.1 | | | 379,084 | | | | 22,438 | |
| Bayer AG | | | 363,860 | | | | 21,628 | |
| Danaher Corp. | | | 82,100 | | | | 20,814 | |
| Catalent, Inc.1 | | | 166,200 | | | | 17,832 | |
| Zoetis, Inc., Class A | | | 98,300 | | | | 16,897 | |
| Eurofins Scientific SE, non-registered shares | | | 182,400 | | | | 14,351 | |
| Novartis AG | | | 165,600 | | | | 14,025 | |
| Virbac SA | | | 36,000 | | | | 14,015 | |
| Sanofi | | | 135,000 | | | | 13,630 | |
| Olympus Corp. | | | 665,800 | | | | 13,379 | |
| Vertex Pharmaceuticals, Inc.1 | | | 43,700 | | | | 12,314 | |
| Dechra Pharmaceuticals PLC | | | 267,600 | | | | 11,264 | |
| Alnylam Pharmaceuticals, Inc.1 | | | 68,000 | | | | 9,918 | |
| Thermo Fisher Scientific, Inc. | | | 17,472 | | | | 9,492 | |
| Siemens Healthineers AG | | | 178,000 | | | | 9,045 | |
| Genus PLC | | | 270,000 | | | | 8,243 | |
| Bachem Holding AG, Class B | | | 101,500 | | | | 7,054 | |
| Rede D’Or Sao Luiz SA | | | 1,073,663 | | | | 5,945 | |
| Organon & Co. | | | 62,000 | | | | 2,092 | |
| Viatris, Inc. | | | 110,678 | | | | 1,159 | |
| EUROAPI1 | | | 5,869 | | | | 93 | |
| | | | | | | | 1,141,809 | |
| 28 | American Funds Insurance Series |
Global Growth Fund (continued)
| Common stocks (continued) | | Shares | | | Value
(000) | |
| Consumer discretionary 14.76% | | | | | | | | |
| Chipotle Mexican Grill, Inc.1 | | | 141,600 | | | $ | 185,108 | |
| Amazon.com, Inc.1 | | | 1,436,000 | | | | 152,517 | |
| LVMH Moët Hennessy-Louis Vuitton SE | | | 210,400 | | | | 128,258 | |
| Floor & Decor Holdings, Inc., Class A1 | | | 914,698 | | | | 57,589 | |
| Domino’s Pizza, Inc. | | | 138,400 | | | | 53,936 | |
| Prosus NV, Class N | | | 760,993 | | | | 49,827 | |
| Renault SA1 | | | 1,688,781 | | | | 42,102 | |
| NIKE, Inc., Class B | | | 370,600 | | | | 37,875 | |
| Cie. Financière Richemont SA, Class A | | | 291,500 | | | | 31,039 | |
| MGM China Holdings, Ltd.1 | | | 54,589,200 | | | | 30,958 | |
| Home Depot, Inc. | | | 92,275 | | | | 25,308 | |
| Domino’s Pizza Enterprises, Ltd. | | | 430,000 | | | | 20,183 | |
| YUM! Brands, Inc. | | | 166,000 | | | | 18,843 | |
| Coupang, Inc., Class A1 | | | 1,392,204 | | | | 17,751 | |
| Booking Holdings, Inc.1 | | | 9,900 | | | | 17,315 | |
| XPeng, Inc., Class A1,2 | | | 979,200 | | | | 15,773 | |
| Wynn Macau, Ltd.1 | | | 21,430,000 | | | | 14,556 | |
| EssilorLuxottica | | | 95,943 | | | | 14,368 | |
| IDP Education, Ltd. | | | 871,300 | | | | 14,326 | |
| MercadoLibre, Inc.1 | | | 21,200 | | | | 13,502 | |
| Stellantis NV | | | 1,038,800 | | | | 12,826 | |
| Evolution AB | | | 140,000 | | | | 12,729 | |
| Dollar Tree Stores, Inc.1 | | | 75,200 | | | | 11,720 | |
| Entain PLC1 | | | 665,250 | | | | 10,082 | |
| Moncler SpA | | | 217,370 | | | | 9,324 | |
| Melco Resorts & Entertainment, Ltd. (ADR)1 | | | 1,559,600 | | | | 8,968 | |
| Tesla, Inc.1 | | | 10,768 | | | | 7,251 | |
| | | | | | | | 1,014,034 | |
| | | | | | | | | |
| Consumer staples 8.76% | | | | | | | | |
| British American Tobacco PLC | | | 3,329,455 | | | | 142,643 | |
| Kweichow Moutai Co., Ltd., Class A | | | 388,821 | | | | 118,779 | |
| Philip Morris International, Inc. | | | 919,500 | | | | 90,791 | |
| Keurig Dr Pepper, Inc. | | | 1,624,000 | | | | 57,473 | |
| Nestlé SA | | | 481,100 | | | | 56,161 | |
| Altria Group, Inc. | | | 1,248,500 | | | | 52,150 | |
| Monster Beverage Corp.1 | | | 350,920 | | | | 32,530 | |
| Costco Wholesale Corp. | | | 39,170 | | | | 18,773 | |
| Carrefour SA, non-registered shares | | | 842,900 | | | | 14,915 | |
| Simply Good Foods Co., Class A1 | | | 263,800 | | | | 9,964 | |
| Bunge, Ltd. | | | 85,000 | | | | 7,709 | |
| | | | | | | | 601,888 | |
| | | | | | | | | |
| Financials 8.62% | | | | | | | | |
| Tradeweb Markets, Inc., Class A | | | 1,634,960 | | | | 111,586 | |
| AIA Group, Ltd. | | | 10,109,600 | | | | 109,576 | |
| Kotak Mahindra Bank, Ltd. | | | 2,915,200 | | | | 61,318 | |
| AXA SA | | | 1,692,893 | | | | 38,426 | |
| Aon PLC, Class A | | | 101,000 | | | | 27,238 | |
| JPMorgan Chase & Co. | | | 209,800 | | | | 23,625 | |
| Citigroup, Inc. | | | 497,600 | | | | 22,885 | |
| Société Générale | | | 1,011,450 | | | | 22,142 | |
| Ping An Insurance (Group) Company of China, Ltd., Class H | | | 3,254,000 | | | | 22,124 | |
| Prudential PLC | | | 1,773,082 | | | | 21,929 | |
| Zurich Insurance Group AG | | | 42,200 | | | | 18,354 | |
| CME Group, Inc., Class A | | | 80,000 | | | | 16,376 | |
| HDFC Life Insurance Company, Ltd. | | | 2,289,515 | | | | 15,945 | |
| Banco Santander, SA | | | 5,334,500 | | | | 15,027 | |
| Wells Fargo & Company | | | 377,200 | | | | 14,775 | |
| FinecoBank SpA | | | 893,000 | | | | 10,687 | |
| Macquarie Group, Ltd. | | | 91,100 | | | | 10,345 | |
| DBS Group Holdings, Ltd. | | | 483,600 | | | | 10,331 | |
| American Funds Insurance Series | 29 |
Global Growth Fund (continued)
| Common stocks (continued) | | Shares | | | Value
(000) | |
| Financials (continued) | | | | | | | | |
| Bank of America Corp. | | | 320,200 | | | $ | 9,968 | |
| AU Small Finance Bank, Ltd. | | | 1,071,462 | | | | 8,028 | |
| Jackson Financial, Inc., Class A | | | 44,327 | | | | 1,186 | |
| Moscow Exchange MICEX-RTS PJSC1,3,4 | | | 12,640,000 | | | | — | 5 |
| | | | | | | | 591,871 | |
| | | | | | | | | |
| Communication services 4.71% | | | | | | | | |
| Alphabet, Inc., Class A1 | | | 76,350 | | | | 166,386 | |
| Alphabet, Inc., Class C1 | | | 39,000 | | | | 85,311 | |
| Meta Platforms, Inc., Class A1 | | | 240,900 | | | | 38,845 | |
| Tencent Holdings, Ltd. | | | 297,100 | | | | 13,418 | |
| Publicis Groupe SA | | | 273,000 | | | | 13,349 | |
| Sea, Ltd., Class A (ADR)1 | | | 95,851 | | | | 6,409 | |
| | | | | | | | 323,718 | |
| | | | | | | | | |
| Industrials 4.69% | | | | | | | | |
| Caterpillar, Inc. | | | 231,600 | | | | 41,401 | |
| MTU Aero Engines AG | | | 167,000 | | | | 30,399 | |
| Alliance Global Group, Inc. | | | 156,400,700 | | | | 25,031 | |
| DSV A/S | | | 171,230 | | | | 23,913 | |
| Airbus SE, non-registered shares | | | 245,400 | | | | 23,775 | |
| GT Capital Holdings, Inc. | | | 2,454,611 | | | | 21,830 | |
| NIBE Industrier AB, Class B | | | 2,328,700 | | | | 17,483 | |
| Safran SA | | | 156,300 | | | | 15,431 | |
| L3Harris Technologies, Inc. | | | 62,600 | | | | 15,130 | |
| Suzhou Maxwell Technologies Co., Ltd., Class A | | | 194,970 | | | | 14,297 | |
| Carrier Global Corp. | | | 370,900 | | | | 13,226 | |
| Canadian Pacific Railway, Ltd. (CAD denominated) | | | 183,000 | | | | 12,782 | |
| Daikin Industries, Ltd. | | | 74,600 | | | | 11,959 | |
| Techtronic Industries Co., Ltd. | | | 1,070,000 | | | | 11,161 | |
| SMC Corp. | | | 22,500 | | | | 10,028 | |
| General Electric Co. | | | 157,500 | | | | 10,028 | |
| Nidec Corp. | | | 143,000 | | | | 8,832 | |
| BayCurrent Consulting, Inc. | | | 32,100 | | | | 8,541 | |
| Boeing Company1 | | | 51,300 | | | | 7,014 | |
| | | | | | | | 322,261 | |
| | | | | | | | | |
| Energy 3.06% | | | | | | | | |
| Canadian Natural Resources, Ltd. (CAD denominated) | | | 1,168,000 | | | | 62,765 | |
| Reliance Industries, Ltd.1 | | | 1,601,273 | | | | 52,630 | |
| Tourmaline Oil Corp. | | | 707,000 | | | | 36,762 | |
| Aker BP ASA2 | | | 599,979 | | | | 20,838 | |
| Equinor ASA | | | 592,000 | | | | 20,588 | |
| Gaztransport & Technigaz SA | | | 75,000 | | | | 9,392 | |
| Halliburton Company | | | 235,128 | | | | 7,374 | |
| Gazprom PJSC (ADR)3,4 | | | 4,173,000 | | | | — | 5 |
| LUKOIL Oil Co. PJSC (ADR)3,4 | | | 246,300 | | | | — | 5 |
| | | | | | | | 210,349 | |
| | | | | | | | | |
| Materials 2.63% | | | | | | | | |
| Sherwin-Williams Company | | | 445,000 | | | | 99,640 | |
| Vale SA, ordinary nominative shares | | | 1,397,000 | | | | 20,437 | |
| Linde PLC | | | 48,000 | | | | 13,801 | |
| Koninklijke DSM NV | | | 93,100 | | | | 13,376 | |
| Shin-Etsu Chemical Co., Ltd. | | | 113,500 | | | | 12,799 | |
| Corteva, Inc. | | | 201,300 | | | | 10,898 | |
| First Quantum Minerals, Ltd. | | | 507,000 | | | | 9,619 | |
| | | | | | | | 180,570 | |
| 30 | American Funds Insurance Series |
Global Growth Fund (continued)
| Common stocks (continued) | | Shares | | | Value
(000) | |
| Real estate 0.38% | | | | | | | | |
| Country Garden Services Holdings Co., Ltd. | | | 3,058,700 | | | $ | 13,623 | |
| Goodman Logistics (HK), Ltd. REIT | | | 1,027,500 | | | | 12,653 | |
| | | | | | | | 26,276 | |
| | | | | | | | | |
| Utilities 0.14% | | | | | | | | |
| Brookfield Infrastructure Partners LP | | | 247,500 | | | | 9,456 | |
| | | | | | | | | |
| Total common stocks (cost: $4,373,649,000) | | | | | | | 6,114,766 | |
| | | | | | | | | |
| Preferred securities 1.51% | | | | | | | | |
| Health care 1.21% | | | | | | | | |
| Sartorius AG, nonvoting non-registered preferred shares2 | | | 239,000 | | | | 83,504 | |
| | | | | | | | | |
| | | | | | | | | |
| Information technology 0.30% | | | | | | | | |
| Samsung Electronics Co., Ltd., nonvoting preferred shares | | | 512,300 | | | | 20,517 | |
| | | | | | | | | |
| Total preferred securities (cost: $27,546,000) | | | | | | | 104,021 | |
| | | | | | | | | |
| Short-term securities 9.46% | | | | | | | | |
| Money market investments 9.19% | | | | | | | | |
| Capital Group Central Cash Fund 1.38%6,7 | | | 6,318,224 | | | | 631,696 | |
| | | | | | | | | |
| Money market investments purchased with collateral from securities on loan 0.27% | | | | | | | | |
| Capital Group Central Cash Fund 1.38%6,7,8 | | | 52,186 | | | | 5,217 | |
| Goldman Sachs Financial Square Government Fund, Institutional Shares 1.39%6,8 | | | 2,754,831 | | | | 2,755 | |
| BlackRock Liquidity Funds – FedFund, Institutional Shares 1.32%6,8 | | | 2,608,796 | | | | 2,609 | |
| Invesco Short-Term Investments Trust – Government & Agency Portfolio, Institutional Class 1.38%6,8 | | | 2,608,796 | | | | 2,609 | |
| Morgan Stanley Institutional Liquidity Funds – Government Portfolio, Institutional Class 1.38%6,8 | | | 2,608,796 | | | | 2,609 | |
| State Street Institutional U.S. Government Money Market Fund, Institutional Class 1.40%6,8 | | | 2,608,796 | | | | 2,609 | |
| | | | | | | | 18,408 | |
| | | | | | | | | |
| Total short-term securities (cost: $650,218,000) | | | | | | | 650,104 | |
| Total investment securities 99.97% (cost: $5,051,413,000) | | | | | | | 6,868,891 | |
| Other assets less liabilities 0.03% | | | | | | | 1,855 | |
| | | | | | | | | |
| Net assets 100.00% | | | | | | $ | 6,870,746 | |
| American Funds Insurance Series | 31 |
Global Growth Fund (continued)
Investments in affiliates7
| | | Value of
affiliates at
1/1/2022
(000) | | | Additions
(000) | | | Reductions
(000) | | | Net
realized
loss
(000) | | | Net
unrealized
depreciation
(000) | | | Value of
affiliates at
6/30/2022
(000) | | | Dividend
income
(000) | |
| Short-term securities 9.27% | | | | | | | | | | | | | | | | | | | | | | | | | | | | |
| Money market investments 9.19% | | | | | | | | | | | | | | | | | | | | | | | | | | | |
| Capital Group Central Cash Fund 1.38%6 | | $ | 376,714 | | | $ | 1,043,895 | | | $ | 788,734 | | | $ | (20 | ) | | $ | (159 | ) | | $ | 631,696 | | | $ | 1,427 | |
| Money market investments purchased with collateral from securities on loan 0.08% | | | | | | | | | | | | | | | | | | | | | | | | | | | | |
| Capital Group Central Cash Fund 1.38%6,8 | | | 1,808 | | | | 3,409 | 9 | | | | | | | | | | | | | | | 5,217 | | | | — | 10 |
| Total short-term securities | | | | | | | | | | | | | | | | | | | | | | | 636,913 | | | | | |
| Total 9.27% | | | | | | | | | | | | | | $ | (20 | ) | | $ | (159 | ) | | $ | 636,913 | | | $ | 1,427 | |
| 1 | Security did not produce income during the last 12 months. |
| 2 | All or a portion of this security was on loan. The total value of all such securities was $27,348,000, which represented .40% of the net assets of the fund. Refer to Note 5 for more information on securities lending. |
| 3 | Valued under fair value procedures adopted by authority of the board of trustees. The total value of all such securities was less than $1,000, which represented less than .01% of the net assets of the fund. |
| 4 | Value determined using significant unobservable inputs. |
| 5 | Amount less than one thousand. |
| 6 | Rate represents the seven-day yield at 6/30/2022. |
| 7 | Part of the same “group of investment companies” as the fund as defined under the Investment Company Act of 1940, as amended. |
| 8 | Security purchased with cash collateral from securities on loan. Refer to Note 5 for more information on securities lending. |
| 9 | Represents net activity. Refer to Note 5 for more information on securities lending. |
| 10 | Dividend income is included with securities lending income in the fund’s statement of operations and is not shown in this table. |
Key to abbreviations
ADR = American Depositary Receipts
CAD = Canadian dollars
REIT = Real Estate Investment Trust
Refer to the notes to financial statements.
| 32 | American Funds Insurance Series |
Global Small Capitalization Fund
| Investment portfolio June 30, 2022 | | unaudited |
| Common stocks 88.73% | | Shares | | | Value
(000) | |
| Information technology 20.36% | | | | | | | | |
| Wolfspeed, Inc.1 | | | 800,681 | | | $ | 50,803 | |
| PAR Technology Corp.1,2 | | | 837,615 | | | | 31,402 | |
| Ceridian HCM Holding, Inc.1 | | | 629,935 | | | | 29,657 | |
| Confluent, Inc., Class A1 | | | 1,124,085 | | | | 26,124 | |
| eMemory Technology, Inc.3 | | | 734,430 | | | | 25,309 | |
| Net One Systems Co., Ltd. | | | 908,156 | | | | 20,080 | |
| Nordic Semiconductor ASA1 | | | 1,217,741 | | | | 18,891 | |
| Tanla Platforms, Ltd. | | | 1,477,291 | | | | 18,793 | |
| Kingdee International Software Group Co., Ltd.1 | | | 7,337,224 | | | | 17,205 | |
| AvidXchange Holdings, Inc.1,2 | | | 2,786,637 | | | | 17,110 | |
| Marqeta, Inc., Class A1 | | | 2,071,598 | | | | 16,801 | |
| Qorvo, Inc.1 | | | 169,518 | | | | 15,989 | |
| SUMCO Corp.2 | | | 1,146,200 | | | | 14,860 | |
| Euronet Worldwide, Inc.1 | | | 144,187 | | | | 14,504 | |
| ALTEN SA, non-registered shares | | | 124,108 | | | | 13,500 | |
| Silicon Laboratories, Inc.1 | | | 95,000 | | | | 13,321 | |
| Pegasystems, Inc. | | | 263,141 | | | | 12,589 | |
| Gitlab, Inc., Class A1,2 | | | 213,816 | | | | 11,362 | |
| OVH Groupe SAS1,2 | | | 590,318 | | | | 10,702 | |
| Avalara, Inc.1 | | | 149,119 | | | | 10,528 | |
| Truecaller AB, Class B1,2 | | | 2,177,076 | | | | 10,441 | |
| Silergy Corp. | | | 128,330 | | | | 10,337 | |
| SimCorp AS | | | 139,192 | | | | 10,104 | |
| SINBON Electronics Co., Ltd. | | | 1,142,550 | | | | 9,760 | |
| Keywords Studios PLC | | | 344,606 | | | | 9,204 | |
| MACOM Technology Solutions Holdings, Inc.1 | | | 190,000 | | | | 8,759 | |
| SHIFT, Inc.1 | | | 59,200 | | | | 7,705 | |
| Extreme Networks, Inc.1 | | | 828,378 | | | | 7,389 | |
| Aspen Technology, Inc.1 | | | 36,561 | | | | 6,716 | |
| Linklogis, Inc., Class B1 | | | 6,753,115 | | | | 6,678 | |
| Credo Technology Group Holding, Ltd.1,2 | | | 555,400 | | | | 6,487 | |
| MongoDB, Inc., Class A1 | | | 23,300 | | | | 6,046 | |
| CCC Intelligent Solutions Holdings, Inc.1,2 | | | 644,074 | | | | 5,926 | |
| Expensify, Inc., Class A1,2 | | | 331,464 | | | | 5,897 | |
| INFICON Holding AG | | | 7,397 | | | | 5,827 | |
| Kingboard Laminates Holdings, Ltd. | | | 4,498,000 | | | | 5,549 | |
| Rapid7, Inc.1 | | | 82,650 | | | | 5,521 | |
| Unimicron Technology Corp. | | | 1,016,007 | | | | 5,416 | |
| Cognex Corp. | | | 116,600 | | | | 4,958 | |
| Smartsheet, Inc., Class A1 | | | 157,100 | | | | 4,938 | |
| Bentley Systems, Inc., Class B | | | 142,373 | | | | 4,741 | |
| GlobalWafers Co., Ltd. | | | 311,000 | | | | 4,738 | |
| AppFolio, Inc., Class A1 | | | 51,790 | | | | 4,694 | |
| SentinelOne, Inc., Class A1,2 | | | 186,212 | | | | 4,344 | |
| BE Semiconductor Industries NV | | | 87,146 | | | | 4,189 | |
| Olo, Inc., Class A1,2 | | | 408,110 | | | | 4,028 | |
| HashiCorp, Inc., Class A1,2 | | | 134,900 | | | | 3,971 | |
| Network International Holdings PLC1 | | | 1,713,100 | | | | 3,937 | |
| Digital Turbine, Inc.1 | | | 215,000 | | | | 3,756 | |
| Softcat PLC | | | 222,430 | | | | 3,566 | |
| Globant SA1 | | | 17,730 | | | | 3,085 | |
| StoneCo, Ltd., Class A1 | | | 386,700 | | | | 2,978 | |
| Semtech Corp.1 | | | 50,000 | | | | 2,749 | |
| Kingboard Holdings, Ltd. | | | 710,000 | | | | 2,687 | |
| SiteMinder, Ltd.1 | | | 704,640 | | | | 1,707 | |
| Cvent Holding Corp.1 | | | 344,800 | | | | 1,593 | |
| Bechtle AG, non-registered shares | | | 36,937 | | | | 1,510 | |
| Yotpo, Ltd.1,3,4,5,6 | | | 678,736 | | | | 1,093 | |
| American Funds Insurance Series | 33 |
Global Small Capitalization Fund (continued)
| Common stocks (continued) | | Shares | | | Value
(000) | |
| Information technology (continued) | | | | | | | | |
| PagSeguro Digital, Ltd., Class A1 | | | 84,354 | | | $ | 864 | |
| Topicus.com, Inc., subordinate voting shares1 | | | 11,100 | | | | 626 | |
| Copperleaf Technologies, Inc.1 | | | 79,200 | | | | 394 | |
| | | | | | | | 594,438 | |
| | | | | | | | | |
| Industrials 16.31% | | | | | | | | |
| International Container Terminal Services, Inc. | | | 11,690,490 | | | | 39,121 | |
| Stericycle, Inc.1 | | | 571,050 | | | | 25,041 | |
| IMCD NV | | | 177,337 | | | | 24,336 | |
| Visional, Inc.1 | | | 542,050 | | | | 24,330 | |
| Japan Airport Terminal Co., Ltd.1 | | | 517,000 | | | | 20,614 | |
| Fasadgruppen Group AB | | | 2,370,503 | | | | 19,535 | |
| Alfen NV1 | | | 204,601 | | | | 18,902 | |
| Boyd Group Services, Inc.2 | | | 162,409 | | | | 17,495 | |
| Interpump Group SpA | | | 447,000 | | | | 17,042 | |
| Instalco AB | | | 4,098,065 | | | | 16,945 | |
| Vicor Corp., Class A1 | | | 306,576 | | | | 16,779 | |
| Trelleborg AB, Class B | | | 783,350 | | | | 15,782 | |
| Melrose Industries PLC | | | 6,512,400 | | | | 11,867 | |
| CG Power and Industrial Solutions, Ltd.1 | | | 4,880,108 | | | | 11,843 | |
| Montrose Environmental Group, Inc.1 | | | 348,186 | | | | 11,755 | |
| Japan Elevator Service Holdings Co., Ltd. | | | 1,121,800 | | | | 11,674 | |
| AirTAC International Group1 | | | 319,062 | | | | 10,634 | |
| Cleanaway Waste Management, Ltd. | | | 6,029,320 | | | | 10,488 | |
| Woodward, Inc. | | | 105,000 | | | | 9,711 | |
| Centre Testing International Group Co., Ltd. | | | 2,684,839 | | | | 9,309 | |
| DL E&C Co., Ltd. | | | 254,136 | | | | 8,113 | |
| Guangzhou Baiyun International Airport Co., Ltd., Class A | | | 3,524,879 | | | | 7,851 | |
| GVS SpA1,2 | | | 867,862 | | | | 7,076 | |
| Comfort Systems USA, Inc. | | | 84,100 | | | | 6,993 | |
| Cargotec OYJ, Class B, non-registered shares | | | 258,700 | | | | 6,799 | |
| Wizz Air Holdings PLC1 | | | 298,983 | | | | 6,384 | |
| SIS, Ltd.1 | | | 1,097,471 | | | | 6,308 | |
| Chart Industries, Inc.1 | | | 37,647 | | | | 6,301 | |
| Engcon AB, Class B1 | | | 1,043,935 | | | | 6,286 | |
| Rumo SA | | | 1,900,000 | | | | 5,798 | |
| Kajaria Ceramics, Ltd. | | | 450,000 | | | | 5,400 | |
| Atlas Corp.2 | | | 500,000 | | | | 5,355 | |
| KEI Industries, Ltd. | | | 357,929 | | | | 5,224 | |
| Carel Industries SpA | | | 252,900 | | | | 5,025 | |
| ITM Power PLC1,2 | | | 2,322,000 | | | | 4,884 | |
| Controladora Vuela Compañía de Aviación, SAB de CV, Class A, ordinary participation certificates (ADR)1 | | | 460,200 | | | | 4,726 | |
| Addtech AB, Class B | | | 353,050 | | | | 4,604 | |
| Diploma PLC | | | 161,300 | | | | 4,375 | |
| Saia, Inc.1 | | | 20,727 | | | | 3,897 | |
| easyJet PLC1 | | | 860,105 | | | | 3,838 | |
| LIXIL Corp. | | | 196,500 | | | | 3,679 | |
| Sulzer AG | | | 54,789 | | | | 3,403 | |
| Granite Construction, Inc. | | | 96,892 | | | | 2,823 | |
| Antares Vision SpA1,2 | | | 281,100 | | | | 2,551 | |
| VAT Group AG | | | 7,251 | | | | 1,729 | |
| Froy ASA | | | 209,829 | | | | 964 | |
| Howden Joinery Group PLC | | | 131,029 | | | | 961 | |
| The AZEK Co., Inc., Class A1 | | | 54,400 | | | | 911 | |
| Matson, Inc. | | | 8,674 | | | | 632 | |
| | | | | | | | 476,093 | |
| 34 | American Funds Insurance Series |
Global Small Capitalization Fund (continued)
| Common stocks (continued) | | Shares | | | Value
(000) | |
| Consumer discretionary 15.60% | | | | | | | | |
| Mattel, Inc.1 | | | 1,400,000 | | | $ | 31,262 | |
| Thor Industries, Inc. | | | 370,472 | | | | 27,685 | |
| Skechers USA, Inc., Class A1 | | | 650,000 | | | | 23,127 | |
| Helen of Troy, Ltd.1 | | | 141,542 | | | | 22,988 | |
| Lands’ End, Inc.1,7 | | | 2,100,000 | | | | 22,302 | |
| YETI Holdings, Inc.1 | | | 512,805 | | | | 22,189 | |
| Entain PLC1 | | | 1,424,930 | | | | 21,595 | |
| Five Below, Inc.1 | | | 165,181 | | | | 18,736 | |
| Asbury Automotive Group, Inc.1 | | | 97,426 | | | | 16,498 | |
| Evolution AB | | | 172,264 | | | | 15,662 | |
| Wyndham Hotels & Resorts, Inc. | | | 227,498 | | | | 14,951 | |
| Light & Wonder, Inc.1 | | | 299,658 | | | | 14,081 | |
| Inchcape PLC | | | 1,569,000 | | | | 13,284 | |
| Tube Investments of India, Ltd. | | | 515,708 | | | | 12,024 | |
| Coursera, Inc.1 | | | 817,039 | | | | 11,586 | |
| Everi Holdings, Inc.1 | | | 709,832 | | | | 11,577 | |
| WH Smith PLC1 | | | 649,917 | | | | 11,123 | |
| Leslie’s, Inc.1 | | | 676,964 | | | | 10,276 | |
| Golden Entertainment, Inc.1 | | | 256,800 | | | | 10,156 | |
| Tongcheng Travel Holdings, Ltd.1 | | | 4,691,200 | | | | 10,092 | |
| Basic-Fit NV1 | | | 259,466 | | | | 9,810 | |
| Kindred Group PLC (SDR) | | | 1,164,011 | | | | 9,679 | |
| Musti Group OYJ | | | 495,800 | | | | 8,854 | |
| DraftKings, Inc., Class A1,2 | | | 756,364 | | | | 8,827 | |
| Haichang Ocean Park Holdings, Ltd.1,2 | | | 8,156,000 | | | | 8,274 | |
| Chervon Holdings, Ltd.2 | | | 1,316,900 | | | | 7,401 | |
| Compagnie Plastic Omnium SA | | | 409,500 | | | | 7,094 | |
| DESCENTE, Ltd. | | | 295,025 | | | | 6,828 | |
| Zhongsheng Group Holdings, Ltd. | | | 938,500 | | | | 6,620 | |
| Shoei Co., Ltd. | | | 144,700 | | | | 5,663 | |
| On Holding AG, Class A1,2 | | | 291,402 | | | | 5,155 | |
| Melco Resorts & Entertainment, Ltd. (ADR)1 | | | 803,773 | | | | 4,622 | |
| TopBuild Corp.1 | | | 27,200 | | | | 4,547 | |
| Melco International Development, Ltd.1 | | | 6,130,000 | | | | 4,531 | |
| Domino’s Pizza Enterprises, Ltd. | | | 95,471 | | | | 4,481 | |
| Thule Group AB | | | 102,200 | | | | 2,511 | |
| IDP Education, Ltd. | | | 150,966 | | | | 2,482 | |
| Arco Platform, Ltd., Class A1,2 | | | 158,600 | | | | 2,368 | |
| Elior Group SA1 | | | 882,500 | | | | 1,959 | |
| Warby Parker, Inc., Class A1,2 | | | 167,332 | | | | 1,884 | |
| NEXTAGE Co., Ltd. | | | 39,100 | | | | 673 | |
| | | | | | | | 455,457 | |
| | | | | | | | | |
| Health care 14.75% | | | | | | | | |
| Insulet Corp.1 | | | 337,461 | | | | 73,546 | |
| Haemonetics Corp.1 | | | 1,018,080 | | | | 66,358 | |
| Integra LifeSciences Holdings Corp.1 | | | 569,500 | | | | 30,770 | |
| CanSino Biologics, Inc., Class H2 | | | 2,442,000 | | | | 25,006 | |
| Max Healthcare Institute, Ltd.1 | | | 5,343,659 | | | | 24,830 | |
| Oak Street Health, Inc.1 | | | 1,310,260 | | | | 21,541 | |
| Globus Medical, Inc., Class A1 | | | 381,773 | | | | 21,433 | |
| CONMED Corp. | | | 189,609 | | | | 18,157 | |
| Ocumension Therapeutics1,2 | | | 9,650,966 | | | | 17,268 | |
| Hapvida Participacoes e Investimentos SA1 | | | 12,352,106 | | | | 12,910 | |
| New Horizon Health, Ltd.1 | | | 3,707,844 | | | | 11,152 | |
| ICON PLC1 | | | 46,061 | | | | 9,981 | |
| CompuGroup Medical SE & Co. KGaA | | | 228,815 | | | | 9,745 | |
| Shandong Pharmaceutical Glass Co., Ltd., Class A | | | 2,180,508 | | | | 9,104 | |
| Medmix AG | | | 399,754 | | | | 8,852 | |
| Health Catalyst, Inc.1 | | | 568,785 | | | | 8,242 | |
| iRhythm Technologies, Inc.1 | | | 73,000 | | | | 7,886 | |
| Amplifon SpA | | | 241,936 | | | | 7,416 | |
| American Funds Insurance Series | 35 |
Global Small Capitalization Fund (continued)
| Common stocks (continued) | | Shares | | | Value
(000) | |
| Health care (continued) | | | | | | | | |
| Netcare, Ltd. | | | 7,889,376 | | | $ | 6,920 | |
| Ambu AS, Class B, non-registered shares2 | | | 595,252 | | | | 5,780 | |
| Angelalign Technology, Inc.2 | | | 284,600 | | | | 5,702 | |
| Encompass Health Corp. | | | 82,226 | | | | 4,609 | |
| Amedisys, Inc.1 | | | 38,867 | | | | 4,086 | |
| Bachem Holding AG, Class B | | | 46,560 | | | | 3,236 | |
| Penumbra, Inc.1 | | | 25,400 | | | | 3,163 | |
| Nordhealth AS, Class A1,2 | | | 1,279,999 | | | | 2,950 | |
| Arjo AB, Class B | | | 422,850 | | | | 2,674 | |
| Gland Pharma, Ltd.1 | | | 75,273 | | | | 2,575 | |
| Amvis Holdings, Inc. | | | 87,800 | | | | 2,446 | |
| Medincell SA1,2 | | | 397,121 | | | | 2,160 | |
| | | | | | | | 430,498 | |
| | | | | | | | | |
| Financials 7.94% | | | | | | | | |
| Star Health & Allied Insurance Co., Ltd.1,3,5,6 | | | 6,037,336 | | | | 33,624 | |
| Cholamandalam Investment and Finance Co., Ltd. | | | 3,684,053 | | | | 28,900 | |
| Eurobank Ergasias Services and Holdings SA1 | | | 25,119,028 | | | | 22,196 | |
| Independent Bank Group, Inc. | | | 280,449 | | | | 19,045 | |
| Trupanion, Inc.1 | | | 300,000 | | | | 18,078 | |
| Stifel Financial Corp. | | | 271,050 | | | | 15,184 | |
| IIFL Wealth Management, Ltd. | | | 513,500 | | | | 9,630 | |
| SouthState Corp. | | | 108,850 | | | | 8,398 | |
| Aavas Financiers, Ltd.1 | | | 272,734 | | | | 6,960 | |
| Patria Investments, Ltd., Class A | | | 508,200 | | | | 6,718 | |
| Remgro, Ltd. | | | 820,300 | | | | 6,550 | |
| IIFL Finance, Ltd. | | | 1,459,000 | | | | 5,981 | |
| SiriusPoint, Ltd.1 | | | 1,100,000 | | | | 5,962 | |
| Eastern Bankshares, Inc. | | | 278,164 | | | | 5,135 | |
| Glacier Bancorp, Inc. | | | 91,858 | | | | 4,356 | |
| United Community Banks, Inc. | | | 140,000 | | | | 4,227 | |
| Aptus Value Housing Finance India, Ltd.1 | | | 1,065,624 | | | | 3,803 | |
| Janus Henderson Group PLC | | | 160,000 | | | | 3,762 | |
| WealthNavi, Inc.1,2 | | | 278,900 | | | | 3,634 | |
| PT Bank Raya Indonesia Tbk1 | | | 71,098,896 | | | | 3,365 | |
| Indian Energy Exchange, Ltd. | | | 1,653,632 | | | | 3,324 | |
| East West Bancorp, Inc. | | | 49,700 | | | | 3,221 | |
| Haci Ömer Sabanci Holding AS | | | 2,323,200 | | | | 2,632 | |
| Bridgepoint Group PLC | | | 740,731 | | | | 2,179 | |
| National Bank of Greece SA1 | | | 660,979 | | | | 1,955 | |
| Capitec Bank Holdings, Ltd. | | | 15,161 | | | | 1,847 | |
| Allfunds Group PLC | | | 138,012 | | | | 1,064 | |
| | | | | | | | 231,730 | |
| | | | | | | | | |
| Materials 3.76% | | | | | | | | |
| Perimeter Solutions SA1,2 | | | 3,039,911 | | | | 32,953 | |
| LANXESS AG | | | 388,200 | | | | 13,905 | |
| Lundin Mining Corp. | | | 1,361,244 | | | | 8,629 | |
| JSR Corp. | | | 325,300 | | | | 8,439 | |
| Navin Fluorine International, Ltd. | | | 175,000 | | | | 8,092 | |
| MMG, Ltd.1 | | | 18,704,000 | | | | 6,960 | |
| Nanofilm Technologies International, Ltd. | | | 4,058,851 | | | | 6,807 | |
| PI Industries, Ltd. | | | 188,382 | | | | 6,105 | |
| Vidrala, SA, non-registered shares | | | 61,827 | | | | 4,484 | |
| OZ Minerals, Ltd. | | | 340,000 | | | | 4,168 | |
| Toyo Gosei Co., Ltd. | | | 55,800 | | | | 3,381 | |
| Recticel SA/NV | | | 175,000 | | | | 2,612 | |
| Mayr-Melnhof Karton AG, non-registered shares | | | 10,516 | | | | 1,785 | |
| Arkema SA | | | 15,200 | | | | 1,353 | |
| | | | | | | | 109,673 | |
| 36 | American Funds Insurance Series |
Global Small Capitalization Fund (continued)
| Common stocks (continued) | | Shares | | | Value
(000) | |
| Consumer staples 3.07% | | | | | | | | |
| Grocery Outlet Holding Corp.1 | | | 521,782 | | | $ | 22,244 | |
| Shop Apotheke Europe NV, non-registered shares1 | | | 169,444 | | | | 15,061 | |
| Freshpet, Inc.1 | | | 256,895 | | | | 13,330 | |
| Monde Nissin Corp.1 | | | 49,971,450 | | | | 11,815 | |
| Dole PLC | | | 970,631 | | | | 8,211 | |
| Scandinavian Tobacco Group A/S | | | 305,111 | | | | 5,967 | |
| Hilton Food Group PLC | | | 375,115 | | | | 4,667 | |
| Royal Unibrew A/S | | | 44,000 | | | | 3,896 | |
| AAK AB | | | 223,527 | | | | 3,647 | |
| Zur Rose Group AG1,2 | | | 9,250 | | | | 694 | |
| Vector Group, Ltd. | | | 15,654 | | | | 164 | |
| | | | | | | | 89,696 | |
| | | | | | | | | |
| Real estate 2.10% | | | | | | | | |
| Embassy Office Parks REIT | | | 4,939,400 | | | | 23,405 | |
| Altus Group, Ltd.2 | | | 475,189 | | | | 16,461 | |
| Macrotech Developers, Ltd.1 | | | 582,697 | | | | 7,888 | |
| JHSF Participações SA | | | 5,073,950 | | | | 5,652 | |
| Mindspace Business Parks REIT | | | 1,250,000 | | | | 5,546 | |
| ESR-Logos REIT1 | | | 8,344,400 | | | | 2,433 | |
| | | | | | | | 61,385 | |
| | | | | | | | | |
| Communication services 2.09% | | | | | | | | |
| Lions Gate Entertainment Corp., Class B1 | | | 2,531,585 | | | | 22,354 | |
| JCDecaux SA1 | | | 788,279 | | | | 13,242 | |
| Pearson PLC | | | 636,200 | | | | 5,807 | |
| Bandwidth, Inc., Class A1 | | | 284,506 | | | | 5,354 | |
| Ubisoft Entertainment SA1 | | | 98,993 | | | | 4,347 | |
| Trustpilot Group PLC1,2 | | | 2,966,832 | | | | 3,662 | |
| Rightmove PLC | | | 512,400 | | | | 3,545 | |
| VTEX, Class A1,2 | | | 885,406 | | | | 2,727 | |
| | | | | | | | 61,038 | |
| | | | | | | | | |
| Utilities 1.68% | | | | | | | | |
| ENN Energy Holdings, Ltd. | | | 1,878,900 | | | | 30,865 | |
| AC Energy Corp. | | | 99,272,800 | | | | 14,516 | |
| Neoenergia SA | | | 1,288,255 | | | | 3,672 | |
| | | | | | | | 49,053 | |
| | | | | | | | | |
| Energy 1.07% | | | | | | | | |
| Venture Global LNG, Inc., Series C1,3,4,5,6 | | | 2,760 | | | | 18,936 | |
| DT Midstream, Inc. | | | 129,414 | | | | 6,344 | |
| Subsea 7 SA | | | 703,801 | | | | 5,626 | |
| Helmerich & Payne, Inc. | | | 7,700 | | | | 331 | |
| | | | | | | | 31,237 | |
| | | | | | | | | |
| Total common stocks (cost: $2,397,123,000) | | | | | | | 2,590,298 | |
| | | | | | | | | |
| | | | | | | | | |
| Preferred securities 0.92% | | | | | | | | |
| Information technology 0.64% | | | | | | | | |
| SmartHR, Inc., Series D, preferred shares1,3,4,5 | | | 3,006 | | | | 10,073 | |
| Yotpo, Ltd., Series F, preferred shares1,3,4,5,6 | | | 2,158,609 | | | | 3,475 | |
| Yotpo, Ltd., Series B, preferred shares1,3,4,5,6 | | | 287,894 | | | | 464 | |
| Yotpo, Ltd., Series C, preferred shares1,3,4,5,6 | | | 274,070 | | | | 441 | |
| Yotpo, Ltd., Series A-1, preferred shares1,3,4,5,6 | | | 183,819 | | | | 296 | |
| Yotpo, Ltd., Series A, preferred shares1,3,4,5,6 | | | 89,605 | | | | 144 | |
| Yotpo, Ltd., Series C-1, preferred shares1,3,4,5,6 | | | 75,980 | | | | 122 | |
| American Funds Insurance Series | 37 |
Global Small Capitalization Fund (continued)
| Preferred securities (continued) | | Shares | | | Value
(000) | |
| Information technology (continued) | | | | | | | | |
| Yotpo, Ltd., Series D, preferred shares1,3,4,5,6 | | | 42,368 | | | $ | 68 | |
| Yotpo, Ltd., Series B-1, preferred shares1,3,4,5,6 | | | 33,838 | | | | 55 | |
| Outreach Corp., Series G, preferred shares1,3,4,5 | | | 154,354 | | | | 3,515 | |
| | | | | | | | 18,653 | |
| | | | | | | | | |
| Industrials 0.21% | | | | | | | | |
| Azul SA, preferred nominative shares (ADR)1,2 | | | 800,316 | | | | 5,683 | |
| Azul SA, preferred nominative shares1 | | | 109,500 | | | | 259 | |
| | | | | | | | 5,942 | |
| | | | | | | | | |
| Health care 0.07% | | | | | | | | |
| PACT Pharma, Inc., Series C, 8.00% noncumulative preferred shares1,3,4,5 | | | 2,931,405 | | | | 2,052 | |
| | | | | | | | | |
| Total preferred securities (cost: $42,519,000) | | | | | | | 26,647 | |
| | | | | | | | | |
| Rights & warrants 0.47% | | | | | | | | |
| Information technology 0.47% | | | | | | | | |
| OPT Machine Vision Tech Co., Ltd., Class A, warrants, expire 20231,3,6 | | | 355,879 | | | | 13,750 | |
| | | | | | | | | |
| Total rights & warrants (cost: $18,773,000) | | | | | | | 13,750 | |
| | | | | | | | | |
| Short-term securities 12.53% | | | | | | | | |
| Money market investments 9.90% | | | | | | | | |
| Capital Group Central Cash Fund 1.38%7,8 | | | 2,891,439 | | | | 289,086 | |
| | | | | | | | | |
| | | | | | | | | |
| Money market investments purchased with collateral from securities on loan 2.63% | | | | | | | | |
| Capital Group Central Cash Fund 1.38%7,8,9 | | | 217,762 | | | | 21,772 | |
| Goldman Sachs Financial Square Government Fund, Institutional Shares 1.39%8,9 | | | 11,495,263 | | | | 11,495 | |
| BlackRock Liquidity Funds – FedFund, Institutional Shares 1.32%8,9 | | | 10,885,893 | | | | 10,886 | |
| Invesco Short-Term Investments Trust – Government & Agency Portfolio, Institutional Class 1.38%8,9 | | | 10,885,893 | | | | 10,886 | |
| Morgan Stanley Institutional Liquidity Funds – Government Portfolio, Institutional Class 1.38%8,9 | | | 10,885,893 | | | | 10,886 | |
| State Street Institutional U.S. Government Money Market Fund, Institutional Class 1.40%8,9 | | | 10,885,893 | | | | 10,886 | |
| | | | | | | | 76,811 | |
| | | | | | | | | |
| Total short-term securities (cost: $365,949,000) | | | | | | | 365,897 | |
| Total investment securities 102.65% (cost: $2,824,364,000) | | | | | | | 2,996,592 | |
| Other assets less liabilities (2.65)% | | | | | | | (77,341 | ) |
| | | | | | | | | |
| Net assets 100.00% | | | | | | $ | 2,919,251 | |
| 38 | American Funds Insurance Series |
Global Small Capitalization Fund (continued)
| Investments in affiliates7 | | | | | | | | | | | |
| | | | | | | | | | | | |
| | | Value of
affiliates at
1/1/2022
(000) | | | Additions
(000) | | | Reductions
(000) | | | Net
realized
gain
(000) | | | Net
unrealized
depreciation
(000) | | | Value of
affiliates at
6/30/2022
(000) | | | Dividend
income
(000) | |
| Common stocks 0.76% | | | | | | | | | | | | | | | | | | | | | | | | | | | | |
| Consumer discretionary 0.76% | | | | | | | | | | | | | | | | | | | | | | | | | | | | |
| Lands’ End, Inc.1 | | $ | 41,223 | | | $ | — | | | $ | — | | | $ | — | | | $ | (18,921 | ) | | $ | 22,302 | | | $ | — | |
| Short-term securities 10.65% | | | | | | | | | | | | | | | | | | | | | | | | | | | | |
| Money market investments 9.90% | | | | | | | | | | | | | | | | | | | | | | | | | | | | |
| Capital Group Central Cash Fund 1.38%8 | | | 203,087 | | | | 646,355 | | | | 560,290 | | | | 6 | | | | (72 | ) | | | 289,086 | | | | 606 | |
| Money market investments purchased with collateral from securities on loan 0.75% | | | | | | | | | | | | | | | | | | | | | | | | | | | | |
| Capital Group Central Cash Fund 1.38%8,9 | | | 32,260 | | | | | | | | 10,488 | 10 | | | | | | | | | | | 21,772 | | | | — | 11 |
| Total short-term securities | | | | | | | | | | | | | | | | | | | | | | | 310,858 | | | | | |
| Total 11.41% | | | | | | | | | | | | | | $ | 6 | | | $ | (18,993 | ) | | $ | 333,160 | | | $ | 606 | |
Private placement securities5
| | | Acquisition
date | | Cost
(000) | | | Value
(000) | | | Percent
of net
assets | |
| Star Health & Allied Insurance Co., Ltd. | | 3/30/2021 | | $ | 40,710 | | | $ | 33,624 | | | | 1.15 | % |
| Venture Global LNG, Inc., Series C | | 5/1/2015 | | | 8,280 | | | | 18,936 | | | | .65 | |
| SmartHR, Inc., Series D, preferred shares | | 5/28/2021 | | | 14,344 | | | | 10,073 | | | | .35 | |
| Yotpo, Ltd., Series F, preferred shares | | 2/25/2021 | | | 4,748 | | | | 3,475 | | | | .12 | |
| Yotpo, Ltd. | | 3/16/2021 | | | 1,418 | | | | 1,093 | | | | .04 | |
| Yotpo, Ltd., Series B, preferred shares | | 3/16/2021 | | | 602 | | | | 464 | | | | .02 | |
| Yotpo, Ltd., Series C, preferred shares | | 3/16/2021 | | | 573 | | | | 441 | | | | .02 | |
| Yotpo, Ltd., Series A-1, preferred shares | | 3/16/2021 | | | 384 | | | | 296 | | | | .01 | |
| Yotpo, Ltd., Series A, preferred shares | | 3/16/2021 | | | 187 | | | | 144 | | | | .00 | |
| Yotpo, Ltd., Series C-1, preferred shares | | 3/16/2021 | | | 159 | | | | 122 | | | | .00 | |
| Yotpo, Ltd., Series D, preferred shares | | 3/16/2021 | | | 89 | | | | 68 | | | | .00 | |
| Yotpo, Ltd., Series B-1, preferred shares | | 3/16/2021 | | | 71 | | | | 55 | | | | .00 | |
| Outreach Corp., Series G, preferred shares | | 5/27/2021 | | | 4,517 | | | | 3,515 | | | | .12 | |
| PACT Pharma, Inc., Series C, 8.00% noncumulative preferred shares | | 2/7/2020 | | | 6,000 | | | | 2,052 | | | | .07 | |
| Total | | | | $ | 82,082 | | | $ | 74,358 | | | | 2.55 | % |
| 1 | Security did not produce income during the last 12 months. |
| 2 | All or a portion of this security was on loan. The total value of all such securities was $96,178,000, which represented 3.29% of the net assets of the fund. Refer to Note 5 for more information on securities lending. |
| 3 | Valued under fair value procedures adopted by authority of the board of trustees. The total value of all such securities was $113,417,000, which represented 3.89% of the net assets of the fund. |
| 4 | Value determined using significant unobservable inputs. |
| 5 | Acquired through a private placement transaction exempt from registration under the Securities Act of 1933. May be subject to legal or contractual restrictions on resale. |
| 6 | Acquired in a transaction exempt from registration under Rule 144A of the Securities Act of 1933. May be resold in the U.S. in transactions exempt from registration, normally to qualified institutional buyers. The total value of all such securities was $72,468,000, which represented 2.48% of the net assets of the fund. |
| 7 | Affiliate of the fund or part of the same “group of investment companies” as the fund, as defined under the Investment Company Act of 1940, as amended. |
| 8 | Rate represents the seven-day yield at 6/30/2022. |
| 9 | Security purchased with cash collateral from securities on loan. Refer to Note 5 for more information on securities lending. |
| 10 | Represents net activity. Refer to Note 5 for more information on securities lending. |
| 11 | Dividend income is included with securities lending income in the fund’s statement of operations and is not shown in this table. |
| American Funds Insurance Series | 39 |
Global Small Capitalization Fund (continued)
Key to abbreviations
ADR = American Depositary Receipts
REIT = Real Estate Investment Trust
SDR = Swedish Depositary Receipts
Refer to the notes to financial statements.
| 40 | American Funds Insurance Series |
Growth Fund | |
| Investment portfolio June 30, 2022 | unaudited |
| Common stocks 94.46% | | Shares | | | Value
(000) | |
| Information technology 20.53% | | | | | | | | |
| Microsoft Corp. | | | 7,106,878 | | | $ | 1,825,259 | |
| Broadcom, Inc. | | | 1,486,641 | | | | 722,225 | |
| ASML Holding NV | | | 635,000 | | | | 303,345 | |
| ASML Holding NV (New York registered) (ADR) | | | 189,937 | | | | 90,387 | |
| Taiwan Semiconductor Manufacturing Company, Ltd. | | | 13,774,000 | | | | 220,507 | |
| Taiwan Semiconductor Manufacturing Company, Ltd. (ADR) | | | 926,437 | | | | 75,736 | |
| Apple, Inc. | | | 1,610,716 | | | | 220,217 | |
| Visa, Inc., Class A | | | 911,636 | | | | 179,492 | |
| Mastercard, Inc., Class A | | | 510,964 | | | | 161,199 | |
| Salesforce, Inc.1 | | | 888,000 | | | | 146,556 | |
| ServiceNow, Inc.1 | | | 294,921 | | | | 140,241 | |
| FleetCor Technologies, Inc.1 | | | 631,000 | | | | 132,579 | |
| Micron Technology, Inc. | | | 2,394,690 | | | | 132,378 | |
| Wolfspeed, Inc.1 | | | 1,978,082 | | | | 125,509 | |
| NVIDIA Corp. | | | 805,499 | | | | 122,106 | |
| RingCentral, Inc., Class A1 | | | 2,099,303 | | | | 109,710 | |
| Applied Materials, Inc. | | | 1,150,222 | | | | 104,647 | |
| Bill.com Holdings, Inc.1 | | | 871,600 | | | | 95,824 | |
| Shopify, Inc., Class A, subordinate voting shares1 | | | 2,843,580 | | | | 88,833 | |
| Tyler Technologies, Inc.1 | | | 263,200 | | | | 87,509 | |
| MongoDB, Inc., Class A1 | | | 324,518 | | | | 84,212 | |
| Fidelity National Information Services, Inc. | | | 884,718 | | | | 81,102 | |
| Cloudflare, Inc., Class A1 | | | 1,514,130 | | | | 66,243 | |
| Unity Software, Inc.1,2 | | | 1,660,000 | | | | 61,121 | |
| Genpact, Ltd. | | | 1,393,000 | | | | 59,008 | |
| MicroStrategy, Inc., Class A1,2 | | | 358,514 | | | | 58,904 | |
| Keyence Corp. | | | 165,500 | | | | 56,574 | |
| DocuSign, Inc.1 | | | 967,514 | | | | 55,516 | |
| Trimble, Inc.1 | | | 840,920 | | | | 48,967 | |
| Block, Inc., Class A1 | | | 749,493 | | | | 46,064 | |
| SK hynix, Inc. | | | 653,000 | | | | 45,766 | |
| GoDaddy, Inc., Class A1 | | | 645,081 | | | | 44,872 | |
| Intel Corp. | | | 1,136,000 | | | | 42,498 | |
| Concentrix Corp. | | | 305,551 | | | | 41,445 | |
| Amadeus IT Group SA, Class A, non-registered shares1 | | | 635,696 | | | | 35,414 | |
| NetApp, Inc. | | | 527,540 | | | | 34,417 | |
| Ceridian HCM Holding, Inc.1 | | | 712,011 | | | | 33,521 | |
| Silicon Laboratories, Inc.1 | | | 231,815 | | | | 32,505 | |
| Flex, Ltd.1 | | | 2,234,300 | | | | 32,330 | |
| Motorola Solutions, Inc. | | | 152,000 | | | | 31,859 | |
| MKS Instruments, Inc. | | | 302,111 | | | | 31,006 | |
| Nuvei Corp., subordinate voting shares1 | | | 806,616 | | | | 29,151 | |
| Adobe, Inc.1 | | | 69,034 | | | | 25,271 | |
| Smartsheet, Inc., Class A1 | | | 729,700 | | | | 22,934 | |
| Zendesk, Inc.1 | | | 307,500 | | | | 22,777 | |
| Toast, Inc., Class A1 | | | 1,712,718 | | | | 22,163 | |
| Alteryx, Inc., Class A1 | | | 402,200 | | | | 19,475 | |
| VeriSign, Inc.1 | | | 110,053 | | | | 18,415 | |
| TE Connectivity, Ltd. | | | 156,600 | | | | 17,719 | |
| Lam Research Corp. | | | 40,617 | | | | 17,309 | |
| Qualtrics International, Inc., Class A1 | | | 1,276,855 | | | | 15,973 | |
| Fiserv, Inc.1 | | | 164,000 | | | | 14,591 | |
| Ciena Corp.1 | | | 308,700 | | | | 14,108 | |
| TELUS International (Cda), Inc., subordinate voting shares1 | | | 533,800 | | | | 13,382 | |
| Enphase Energy, Inc.1 | | | 62,172 | | | | 12,138 | |
| Globant SA1 | | | 57,138 | | | | 9,942 | |
| Kulicke and Soffa Industries, Inc. | | | 151,860 | | | | 6,501 | |
| Stripe, Inc., Class B1,3,4,5 | | | 168,598 | | | | 6,000 | |
| SentinelOne, Inc., Class A1 | | | 220,600 | | | | 5,147 | |
| | | | | | | | 6,400,599 | |
| American Funds Insurance Series | 41 |
Growth Fund (continued)
| Common stocks (continued) | | Shares | | | Value
(000) | |
| Consumer discretionary 18.92% | | | | | | | | |
| Tesla, Inc.1 | | | 3,682,000 | | | $ | 2,479,533 | |
| Amazon.com, Inc.1 | | | 5,222,200 | | | | 554,650 | |
| Dollar General Corp. | | | 2,185,220 | | | | 536,340 | |
| Home Depot, Inc. | | | 931,000 | | | | 255,345 | |
| D.R. Horton, Inc. | | | 3,324,144 | | | | 220,025 | |
| LVMH Moët Hennessy-Louis Vuitton SE | | | 313,000 | | | | 190,803 | |
| Las Vegas Sands Corp.1 | | | 5,500,000 | | | | 184,745 | |
| Chipotle Mexican Grill, Inc.1 | | | 114,237 | | | | 149,338 | |
| Dollar Tree Stores, Inc.1 | | | 803,915 | | | | 125,290 | |
| Hermès International | | | 94,901 | | | | 106,115 | |
| Booking Holdings, Inc.1 | | | 60,300 | | | | 105,464 | |
| Airbnb, Inc., Class A1 | | | 1,044,500 | | | | 93,044 | |
| Royal Caribbean Cruises, Ltd.1 | | | 2,282,305 | | | | 79,675 | |
| O’Reilly Automotive, Inc.1 | | | 116,600 | | | | 73,663 | |
| NVR, Inc.1 | | | 18,380 | | | | 73,596 | |
| Target Corp. | | | 479,700 | | | | 67,748 | |
| Aramark | | | 1,793,164 | | | | 54,925 | |
| NIKE, Inc., Class B | | | 489,400 | | | | 50,017 | |
| Darden Restaurants, Inc. | | | 433,876 | | | | 49,080 | |
| Caesars Entertainment, Inc.1 | | | 968,000 | | | | 37,074 | |
| Domino’s Pizza, Inc. | | | 94,000 | | | | 36,633 | |
| Norwegian Cruise Line Holdings, Ltd.1,2 | | | 3,076,903 | | | | 34,215 | |
| Salvatore Ferragamo SpA2 | | | 2,174,477 | | | | 33,498 | |
| Polaris, Inc. | | | 280,000 | | | | 27,798 | |
| Floor & Decor Holdings, Inc., Class A1 | | | 420,000 | | | | 26,443 | |
| Cie. Financière Richemont SA, Class A | | | 219,805 | | | | 23,405 | |
| Burlington Stores, Inc.1 | | | 158,707 | | | | 21,621 | |
| LGI Homes, Inc.1 | | | 248,150 | | | | 21,564 | |
| adidas AG | | | 121,710 | | | | 21,525 | |
| Adient PLC1 | | | 722,000 | | | | 21,393 | |
| Helen of Troy, Ltd.1 | | | 112,111 | | | | 18,208 | |
| VF Corp. | | | 408,000 | | | | 18,021 | |
| YETI Holdings, Inc.1 | | | 405,000 | | | | 17,524 | |
| General Motors Company1 | | | 490,000 | | | | 15,562 | |
| Etsy, Inc.1 | | | 202,000 | | | | 14,788 | |
| YUM! Brands, Inc. | | | 129,700 | | | | 14,722 | |
| Hilton Worldwide Holdings, Inc. | | | 128,708 | | | | 14,343 | |
| Aptiv PLC1 | | | 140,000 | | | | 12,470 | |
| Flutter Entertainment PLC1 | | | 82,221 | | | | 8,313 | |
| Carvana Co., Class A1,2 | | | 210,400 | | | | 4,751 | |
| Arrival Group1,2 | | | 1,690,300 | | | | 2,671 | |
| Arrival Group1 | | | 304,769 | | | | 481 | |
| Westwing Group SE, non-registered shares1,2 | | | 381,550 | | | | 2,839 | |
| | | | | | | | 5,899,258 | |
| | | | | | | | | |
| Health care 15.48% | | | | | | | | |
| UnitedHealth Group, Inc. | | | 1,709,751 | | | | 878,179 | |
| Regeneron Pharmaceuticals, Inc.1 | | | 1,220,938 | | | | 721,733 | |
| Intuitive Surgical, Inc.1 | | | 2,058,000 | | | | 413,061 | |
| Centene Corp.1 | | | 4,420,730 | | | | 374,038 | |
| Thermo Fisher Scientific, Inc. | | | 532,200 | | | | 289,134 | |
| Alnylam Pharmaceuticals, Inc.1 | | | 1,879,309 | | | | 274,097 | |
| Vertex Pharmaceuticals, Inc.1 | | | 879,601 | | | | 247,863 | |
| Seagen, Inc.1 | | | 1,379,013 | | | | 244,003 | |
| NovoCure, Ltd.1 | | | 2,388,098 | | | | 165,973 | |
| Eli Lilly and Company | | | 337,300 | | | | 109,363 | |
| Moderna, Inc.1 | | | 750,000 | | | | 107,138 | |
| CVS Health Corp. | | | 1,034,700 | | | | 95,875 | |
| Pfizer, Inc. | | | 1,675,000 | | | | 87,820 | |
| Edwards Lifesciences Corp.1 | | | 768,111 | | | | 73,040 | |
| AstraZeneca PLC | | | 550,784 | | | | 72,411 | |
| Gilead Sciences, Inc. | | | 899,185 | | | | 55,579 | |
| 42 | American Funds Insurance Series |
Growth Fund (continued)
| Common stocks (continued) | | Shares | | | Value
(000) | |
| Health care (continued) | | | | | | | | |
| Horizon Therapeutics PLC1 | | | 613,731 | | | $ | 48,951 | |
| Verily Life Sciences, LLC1,3,4,5 | | | 300,178 | | | | 44,928 | |
| Catalent, Inc.1 | | | 409,100 | | | | 43,892 | |
| Danaher Corp. | | | 165,735 | | | | 42,017 | |
| Molina Healthcare, Inc.1 | | | 145,723 | | | | 40,746 | |
| Biohaven Pharmaceutical Holding Co., Ltd.1 | | | 268,400 | | | | 39,109 | |
| Zimmer Biomet Holdings, Inc. | | | 353,900 | | | | 37,181 | |
| Abbott Laboratories | | | 331,012 | | | | 35,964 | |
| Inari Medical, Inc.1 | | | 502,200 | | | | 34,145 | |
| Humana, Inc. | | | 65,982 | | | | 30,884 | |
| Zoetis, Inc., Class A | | | 160,483 | | | | 27,585 | |
| Align Technology, Inc.1 | | | 112,000 | | | | 26,507 | |
| Guardant Health, Inc.1 | | | 482,401 | | | | 19,460 | |
| Mettler-Toledo International, Inc.1 | | | 16,900 | | | | 19,414 | |
| CRISPR Therapeutics AG1,2 | | | 235,087 | | | | 14,286 | |
| Exact Sciences Corp.1 | | | 341,000 | | | | 13,432 | |
| Oak Street Health, Inc.1 | | | 806,352 | | | | 13,256 | |
| Ascendis Pharma A/S (ADR)1 | | | 140,377 | | | | 13,049 | |
| Karuna Therapeutics, Inc.1 | | | 100,032 | | | | 12,655 | |
| Galapagos NV1 | | | 223,566 | | | | 12,427 | |
| DexCom, Inc.1 | | | 148,800 | | | | 11,090 | |
| Fate Therapeutics, Inc.1 | | | 417,000 | | | | 10,333 | |
| Ultragenyx Pharmaceutical, Inc.1 | | | 161,278 | | | | 9,622 | |
| Pacific Biosciences of California, Inc.1,2 | | | 1,711,590 | | | | 7,565 | |
| Vir Biotechnology, Inc.1 | | | 282,975 | | | | 7,207 | |
| Sana Biotechnology, Inc.1,2 | | | 179,600 | | | | 1,155 | |
| | | | | | | | 4,826,167 | |
| | | | | | | | | |
| Communication services 14.88% | | | | | | | | |
| Meta Platforms, Inc., Class A1 | | | 10,118,530 | | | | 1,631,613 | |
| Alphabet, Inc., Class C1 | | | 377,972 | | | | 826,795 | |
| Alphabet, Inc., Class A1 | | | 111,616 | | | | 243,240 | |
| Netflix, Inc.1 | | | 3,656,304 | | | | 639,378 | |
| Activision Blizzard, Inc. | | | 3,750,000 | | | | 291,975 | |
| Charter Communications, Inc., Class A1 | | | 410,286 | | | | 192,231 | |
| Verizon Communications, Inc. | | | 3,720,000 | | | | 188,790 | |
| Snap, Inc., Class A, nonvoting shares1 | | | 8,880,711 | | | | 116,604 | |
| ZoomInfo Technologies, Inc.1 | | | 3,077,300 | | | | 102,289 | |
| Comcast Corp., Class A | | | 2,311,991 | | | | 90,722 | |
| Frontier Communications Parent, Inc.1 | | | 3,168,010 | | | | 74,575 | |
| T-Mobile US, Inc.1 | | | 447,940 | | | | 60,266 | |
| Pinterest, Inc., Class A1 | | | 1,752,664 | | | | 31,828 | |
| Bumble, Inc., Class A1 | | | 1,013,387 | | | | 28,527 | |
| Tencent Holdings, Ltd. | | | 605,000 | | | | 27,325 | |
| Take-Two Interactive Software, Inc.1 | | | 201,000 | | | | 24,629 | |
| Iridium Communications, Inc.1 | | | 604,439 | | | | 22,703 | |
| Vimeo, Inc.1 | | | 3,348,913 | | | | 20,160 | |
| Electronic Arts, Inc. | | | 141,481 | | | | 17,211 | |
| Match Group, Inc.1 | | | 120,000 | | | | 8,363 | |
| | | | | | | | 4,639,224 | |
| | | | | | | | | |
| Industrials 8.17% | | | | | | | | |
| TransDigm Group, Inc.1 | | | 562,400 | | | | 301,823 | |
| Jacobs Engineering Group, Inc. | | | 2,169,000 | | | | 275,745 | |
| Carrier Global Corp. | | | 7,599,761 | | | | 271,007 | |
| Uber Technologies, Inc.1 | | | 11,166,767 | | | | 228,472 | |
| Delta Air Lines, Inc.1 | | | 7,215,000 | | | | 209,019 | |
| United Rentals, Inc.1 | | | 638,400 | | | | 155,074 | |
| Caterpillar, Inc. | | | 676,300 | | | | 120,895 | |
| MTU Aero Engines AG | | | 616,989 | | | | 112,310 | |
| Ryanair Holdings PLC (ADR)1 | | | 1,500,325 | | | | 100,897 | |
| Ryanair Holdings PLC1 | | | 96,554 | | | | 1,141 | |
| American Funds Insurance Series | 43 |
Growth Fund (continued)
| Common stocks (continued) | | Shares | | | Value
(000) | |
| Industrials (continued) | | | | | | | | |
| Airbus SE, non-registered shares | | | 955,893 | | | $ | 92,610 | |
| Robert Half International, Inc. | | | 1,155,800 | | | | 86,558 | |
| United Airlines Holdings, Inc.1 | | | 1,695,914 | | | | 60,069 | |
| Dun & Bradstreet Holdings, Inc.1 | | | 3,869,573 | | | | 58,160 | |
| Middleby Corp.1 | | | 449,500 | | | | 56,349 | |
| Boeing Company1 | | | 395,000 | | | | 54,004 | |
| Northrop Grumman Corp. | | | 98,700 | | | | 47,235 | |
| Canadian Pacific Railway, Ltd. | | | 496,000 | | | | 34,641 | |
| BWX Technologies, Inc. | | | 607,600 | | | | 33,473 | |
| Axon Enterprise, Inc.1 | | | 353,000 | | | | 32,889 | |
| AMETEK, Inc. | | | 253,600 | | | | 27,868 | |
| Waste Connections, Inc. | | | 222,159 | | | | 27,539 | |
| Rockwell Automation | | | 129,246 | | | | 25,760 | |
| HEICO Corp. | | | 195,000 | | | | 25,568 | |
| Armstrong World Industries, Inc. | | | 326,344 | | | | 24,463 | |
| ITT, Inc. | | | 343,000 | | | | 23,063 | |
| L3Harris Technologies, Inc. | | | 90,000 | | | | 21,753 | |
| Advanced Drainage Systems, Inc. | | | 195,343 | | | | 17,594 | |
| Safran SA | | | 142,541 | | | | 14,073 | |
| TuSimple Holdings, Inc., Class A1,2 | | | 1,158,932 | | | | 8,379 | |
| | | | | | | | 2,548,431 | |
| | | | | | | | | |
| Financials 6.20% | | | | | | | | |
| Bank of America Corp. | | | 14,780,700 | | | | 460,123 | |
| S&P Global, Inc. | | | 524,936 | | | | 176,935 | |
| First Republic Bank | | | 1,029,156 | | | | 148,404 | |
| Capital One Financial Corp. | | | 1,399,000 | | | | 145,762 | |
| KKR & Co., Inc. | | | 2,218,594 | | | | 102,699 | |
| SVB Financial Group1 | | | 246,315 | | | | 97,292 | |
| Western Alliance Bancorporation | | | 1,071,775 | | | | 75,667 | |
| Apollo Asset Management, Inc. | | | 1,557,942 | | | | 75,529 | |
| T. Rowe Price Group, Inc. | | | 642,000 | | | | 72,938 | |
| Wells Fargo & Company | | | 1,735,200 | | | | 67,968 | |
| Tradeweb Markets, Inc., Class A | | | 922,410 | | | | 62,954 | |
| Marsh & McLennan Companies, Inc. | | | 403,461 | | | | 62,637 | |
| MSCI, Inc. | | | 146,390 | | | | 60,335 | |
| Signature Bank | | | 301,426 | | | | 54,019 | |
| Blackstone, Inc., nonvoting shares | | | 360,000 | | | | 32,843 | |
| Aon PLC, Class A | | | 110,000 | | | | 29,665 | |
| Blue Owl Capital, Inc., Class A | | | 2,891,712 | | | | 29,004 | |
| Brookfield Asset Management, Inc., Class A | | | 585,103 | | | | 26,020 | |
| CME Group, Inc., Class A | | | 121,648 | | | | 24,901 | |
| Ryan Specialty Holdings, Inc., Class A1 | | | 611,300 | | | | 23,957 | |
| Arch Capital Group, Ltd.1 | | | 458,700 | | | | 20,866 | |
| American International Group, Inc. | | | 386,130 | | | | 19,743 | |
| Intercontinental Exchange, Inc. | | | 209,648 | | | | 19,715 | |
| Ares Management Corp., Class A | | | 310,500 | | | | 17,655 | |
| Trupanion, Inc.1 | | | 287,655 | | | | 17,334 | |
| Goosehead Insurance, Inc., Class A | | | 211,148 | | | | 9,643 | |
| | | | | | | | 1,934,608 | |
| | | | | | | | | |
| Energy 4.97% | | | | | | | | |
| Halliburton Company | | | 12,143,661 | | | | 380,825 | |
| Canadian Natural Resources, Ltd. (CAD denominated) | | | 6,840,000 | | | | 367,560 | |
| Cenovus Energy, Inc. (CAD denominated) | | | 14,694,800 | | | | 279,580 | |
| EQT Corp. | | | 2,268,000 | | | | 78,019 | |
| Tourmaline Oil Corp.2 | | | 1,408,700 | | | | 73,248 | |
| Pioneer Natural Resources Company | | | 328,000 | | | | 73,170 | |
| EOG Resources, Inc. | | | 574,314 | | | | 63,427 | |
| Suncor Energy, Inc. | | | 1,747,125 | | | | 61,296 | |
| ConocoPhillips | | | 651,015 | | | | 58,468 | |
| Coterra Energy, Inc. | | | 1,275,197 | | | | 32,888 | |
| 44 | American Funds Insurance Series |
Growth Fund (continued)
| Common stocks (continued) | | Shares | | | Value
(000) | |
| Energy (continued) | | | | | | | | |
| MEG Energy Corp.1 | | | 2,365,000 | | | $ | 32,741 | |
| Chesapeake Energy Corp. | | | 255,400 | | | | 20,713 | |
| Range Resources Corp.1 | | | 823,000 | | | | 20,369 | |
| Equitrans Midstream Corp. | | | 936,942 | | | | 5,959 | |
| | | | | | | | 1,548,263 | |
| | | | | | | | | |
| Materials 2.58% | | | | | | | | |
| Wheaton Precious Metals Corp. | | | 3,674,000 | | | | 132,374 | |
| Grupo México, SAB de CV, Series B | | | 25,356,800 | | | | 104,998 | |
| Vale SA, ordinary nominative shares (ADR) | | | 7,130,772 | | | | 104,323 | |
| Linde PLC | | | 319,392 | | | | 91,835 | |
| Barrick Gold Corp. | | | 4,447,467 | | | | 78,676 | |
| CF Industries Holdings, Inc. | | | 703,000 | | | | 60,268 | |
| Royal Gold, Inc. | | | 517,000 | | | | 55,205 | |
| Franco-Nevada Corp. | | | 390,000 | | | | 51,301 | |
| Allegheny Technologies, Inc.1 | | | 2,070,860 | | | | 47,029 | |
| LyondellBasell Industries NV | | | 343,500 | | | | 30,043 | |
| Sherwin-Williams Company | | | 69,458 | | | | 15,552 | |
| Summit Materials, Inc., Class A1 | | | 561,313 | | | | 13,073 | |
| Ball Corp. | | | 145,200 | | | | 9,986 | |
| Nutrien, Ltd. (CAD denominated) | | | 58,971 | | | | 4,696 | |
| Mosaic Co. | | | 78,919 | | | | 3,728 | |
| | | | | | | | 803,087 | |
| | | | | | | | | |
| Consumer staples 2.20% | | | | | | | | |
| Costco Wholesale Corp. | | | 253,000 | | | | 121,258 | |
| British American Tobacco PLC | | | 2,768,763 | | | | 118,622 | |
| Constellation Brands, Inc., Class A | | | 427,912 | | | | 99,729 | |
| Monster Beverage Corp.1 | | | 985,000 | | | | 91,309 | |
| Altria Group, Inc. | | | 2,062,600 | | | | 86,155 | |
| Archer Daniels Midland Company | | | 784,800 | | | | 60,900 | |
| Estée Lauder Companies, Inc., Class A | | | 211,111 | | | | 53,764 | |
| Molson Coors Beverage Company, Class B, restricted voting shares | | | 608,423 | | | | 33,165 | |
| Philip Morris International, Inc. | | | 201,113 | | | | 19,858 | |
| | | | | | | | 684,760 | |
| | | | | | | | | |
| Utilities 0.42% | | | | | | | | |
| PG&E Corp.1 | | | 7,077,065 | | | | 70,629 | |
| CenterPoint Energy, Inc. | | | 855,797 | | | | 25,315 | |
| AES Corp. | | | 1,085,884 | | | | 22,814 | |
| Edison International | | | 199,191 | | | | 12,597 | |
| | | | | | | | 131,355 | |
| | | | | | | | | |
| Real estate 0.11% | | | | | | | | |
| Equinix, Inc. REIT | | | 51,784 | | | | 34,023 | |
| | | | | | | | | |
| Total common stocks (cost: $19,846,265,000) | | | | | | | 29,449,775 | |
| | | | | | | | | |
| Preferred securities 0.19% | | | | | | | | |
| Information technology 0.16% | | | | | | | | |
| PsiQuantum Corp., Series D, preferred shares1,3,4,5 | | | 906,761 | | | | 23,781 | |
| Samsung Electronics Co., Ltd., nonvoting preferred shares | | | 531,000 | | | | 21,266 | |
| Tipalti Solutions, Ltd., Series F, preferred shares1,3,4,5 | | | 406,310 | | | | 3,295 | |
| Stripe, Inc., Series H, 6.00% noncumulative preferred shares1,3,4,5 | | | 52,656 | | | | 1,874 | |
| | | | | | | | 50,216 | |
| | | | | | | | | |
| Industrials 0.03% | | | | | | | | |
| ABL Space Systems Co., Series B2, preferred shares1,3,4,5 | | | 153,713 | | | | 8,885 | |
| | | | | | | | | |
| Total preferred securities (cost: $65,451,000) | | | | | | | 59,101 | |
| American Funds Insurance Series | 45 |
Growth Fund (continued)
| Convertible bonds & notes 0.02% | | Principal amount
(000) | | | Value
(000) | |
| Consumer staples 0.01% | | | | | | |
| JUUL Labs, Inc., convertible notes, 7.00% PIK 20253,4,5,6 | | USD | 44,875 | | | $ | 4,115 | |
| | | | | | | | 4,115 | |
| | | | | | | | | |
| Industrials 0.01% | | | | | | | | |
| Einride AB, convertible notes, 7.00% 20233,4,5 | | | 2,500 | | | | 2,969 | |
| | | | | | | | 2,969 | |
| | | | | | | | | |
| Total convertible bonds & notes (cost: $45,836,000) | | | | | | | 7,084 | |
| | | | | | | | | |
| Short-term securities 5.23% | | | Shares | | | | | |
| Money market investments 4.99% | | | | | | | | |
| Capital Group Central Cash Fund 1.38%7,8 | | | 15,555,891 | | | | 1,555,278 | |
| | | | | | | | | |
| Money market investments purchased with collateral from securities on loan 0.24% | |
| Capital Group Central Cash Fund 1.38%7,8,9 | | | 206,977 | | | | 20,693 | |
| Goldman Sachs Financial Square Government Fund, Institutional Shares 1.39%7,9 | | | 10,925,949 | | | | 10,926 | |
| Invesco Short-Term Investments Trust – Government & Agency Portfolio, Institutional Class 1.38%7,9 | | | 10,346,758 | | | | 10,347 | |
| Morgan Stanley Institutional Liquidity Funds – Government Portfolio, Institutional Class 1.38%7,9 | | | 10,346,758 | | | | 10,347 | |
| State Street Institutional U.S. Government Money Market Fund, Institutional Class 1.40%7,9 | | | 10,346,758 | | | | 10,347 | |
| BlackRock Liquidity Funds – FedFund, Institutional Shares 1.32%7,9 | | | 10,346,758 | | | | 10,346 | |
| | | | | | | | 73,006 | |
| Total short-term securities (cost: $1,628,508,000) | | | | | | | 1,628,284 | |
| Total investment securities 99.90% (cost: $21,586,060,000) | | | | | | | 31,144,244 | |
| Other assets less liabilities 0.10% | | | | | | | 31,927 | |
| | | | | | | | | |
| Net assets 100.00% | | | | | | $ | 31,176,171 | |
Investments in affiliates8
| | | Value of
affiliates at
1/1/2022
(000) | | | Additions
(000) | | | Reductions
(000) | | | Net
realized
gain
(000) | | | Net
unrealized
depreciation
(000) | | | Value of
affiliates at
6/30/2022
(000) | | | Dividend
income
(000) | |
| Short-term securities 5.06% | | | | | | | | | | | | | | | | | | | | | | | | | | | | |
| Money market investments 4.99% | | | | | | | | | | | | | | | | | | | | | | | | | | | | |
| Capital Group Central Cash Fund 1.38%7 | | $ | 1,610,187 | | | $ | 2,905,660 | | | $ | 2,960,150 | | | $ | 1 | | | $ | (420 | ) | | $ | 1,555,278 | | | $ | 3,145 | |
| Money market investments purchased with collateral from securities on loan 0.07% | | | | | | | | | | | | | | | | | | | | | | | | | | | | |
| Capital Group Central Cash Fund 1.38%7,9 | | | 20,304 | | | | 389 | 10 | | | | | | | | | | | | | | | 20,693 | | | | — | 11 |
| Total short-term securities | | | | | | | | | | | | | | | | | | | | | | | 1,575,971 | | | | | |
| Total 5.06% | | | | | | | | | | | | | | $ | 1 | | | $ | (420 | ) | | $ | 1,575,971 | | | $ | 3,145 | |
| 46 | American Funds Insurance Series |
Growth Fund (continued)
Private placement securities5
| | | Acquisition
date(s) | | Cost
(000) | | | Value
(000) | | | Percent
of net
assets | |
| Verily Life Sciences, LLC | | 12/21/2018 | | $ | 37,000 | | | $ | 44,928 | | | | .14 | % |
| PsiQuantum Corp., Series D, preferred shares | | 5/28/2021 | | | 23,781 | | | | 23,781 | | | | .08 | |
| ABL Space Systems Co., Series B2, preferred shares | | 10/22/2021 | | | 10,452 | | | | 8,885 | | | | .03 | |
| Stripe, Inc., Class B | | 5/6/2021 | | | 6,766 | | | | 6,000 | | | | .02 | |
| Stripe, Inc., Series H, 6.00% noncumulative preferred shares | | 3/15/2021 | | | 2,113 | | | | 1,874 | | | | .01 | |
| JUUL Labs, Inc., convertible notes, 7.00% PIK 2025 | | 2/3/2020-5/3/2022 | | | 43,336 | | | | 4,115 | | | | .01 | |
| Tipalti Solutions, Ltd., Series F, preferred shares | | 12/1/2021 | | | 6,956 | | | | 3,295 | | | | .01 | |
| Einride AB, convertible notes, 7.00% 2023 | | 1/7/2022 | | | 2,500 | | | | 2,969 | | | | .01 | |
| Total | | | | $ | 132,904 | | | $ | 95,847 | | | | .31 | % |
| 1 | Security did not produce income during the last 12 months. |
| 2 | All or a portion of this security was on loan. The total value of all such securities was $78,405,000, which represented .25% of the net assets of the fund. Refer to Note 5 for more information on securities lending. |
| 3 | Valued under fair value procedures adopted by authority of the board of trustees. The total value of all such securities was $95,847,000, which represented .31% of the net assets of the fund. |
| 4 | Value determined using significant unobservable inputs. |
| 5 | Acquired through a private placement transaction exempt from registration under the Securities Act of 1933. May be subject to legal or contractual restrictions on resale. |
| 6 | Payment in kind; the issuer has the option of paying additional securities in lieu of cash. Payment methods and rates are as of the most recent payment when available. |
| 7 | Rate represents the seven-day yield at 6/30/2022. |
| 8 | Part of the same “group of investment companies” as the fund as defined under the Investment Company Act of 1940, as amended. |
| 9 | Security purchased with cash collateral from securities on loan. Refer to Note 5 for more information on securities lending. |
| 10 | Represents net activity. Refer to Note 5 for more information on securities lending. |
| 11 | Dividend income is included with securities lending income in the fund’s statement of operations and is not shown in this table. |
Key to abbreviations
ADR = American Depositary Receipts
CAD = Canadian dollars
REIT = Real Estate Investment Trust
USD = U.S. dollars
Refer to the notes to financial statements.
| American Funds Insurance Series | 47 |
| International Fund | | |
| Investment portfolio June 30, 2022 | | unaudited |
| | | |
| Common stocks 85.49% | | Shares | | | Value
(000) | |
| Industrials 13.12% | | | | | | | | |
| Airbus SE, non-registered shares | | | 1,707,475 | | | $ | 165,425 | |
| Recruit Holdings Co., Ltd. | | | 3,491,309 | | | | 102,799 | |
| Melrose Industries PLC | | | 36,613,980 | | | | 66,722 | |
| Safran SA | | | 579,000 | | | | 57,163 | |
| Ryanair Holdings PLC (ADR)1 | | | 535,700 | | | | 36,026 | |
| Ryanair Holdings PLC1 | | | 191,358 | | | | 2,261 | |
| SMC Corp. | | | 77,100 | | | | 34,362 | |
| Siemens AG | | | 331,702 | | | | 33,749 | |
| MTU Aero Engines AG | | | 182,000 | | | | 33,129 | |
| DSV A/S | | | 230,223 | | | | 32,152 | |
| ASSA ABLOY AB, Class B | | | 1,452,142 | | | | 30,846 | |
| NIBE Industrier AB, Class B | | | 3,878,804 | | | | 29,120 | |
| Ashtead Group PLC | | | 645,000 | | | | 27,002 | |
| International Container Terminal Services, Inc. | | | 7,953,240 | | | | 26,615 | |
| Grab Holdings, Ltd., Class A1 | | | 9,470,179 | | | | 23,960 | |
| Kingspan Group PLC | | | 384,796 | | | | 23,146 | |
| Shenzhen Inovance Technology Co., Ltd., Class A | | | 2,350,967 | | | | 23,133 | |
| Aena SME, SA, non-registered shares1 | | | 175,000 | | | | 22,236 | |
| ZTO Express (Cayman), Inc., Class A (ADR) | | | 685,354 | | | | 18,813 | |
| Brenntag SE | | | 222,191 | | | | 14,460 | |
| CCR SA, ordinary nominative shares | | | 5,580,000 | | | | 13,360 | |
| Rumo SA | | | 4,301,900 | | | | 13,127 | |
| Airports of Thailand PCL, foreign registered shares1 | | | 5,078,900 | | | | 10,215 | |
| Diploma PLC | | | 335,900 | | | | 9,110 | |
| Fluidra, SA, non-registered shares | | | 432,985 | | | | 8,775 | |
| Thales SA | | | 70,763 | | | | 8,680 | |
| Zhejiang Sanhua Intelligent Controls Co., Ltd., Class A | | | 2,073,434 | | | | 8,511 | |
| LIXIL Corp. | | | 441,700 | | | | 8,269 | |
| BAE Systems PLC | | | 617,024 | | | | 6,236 | |
| Techtronic Industries Co., Ltd. | | | 437,500 | | | | 4,564 | |
| | | | | | | | 893,966 | |
| | | | | | | | | |
| Information technology 11.40% | | | | | | | | |
| Taiwan Semiconductor Manufacturing Company, Ltd. | | | 6,501,000 | | | | 104,074 | |
| ASML Holding NV | | | 205,218 | | | | 98,034 | |
| Shopify, Inc., Class A, subordinate voting shares1 | | | 2,665,310 | | | | 83,264 | |
| Nice, Ltd. (ADR)1 | | | 397,150 | | | | 76,431 | |
| Nomura Research Institute, Ltd. | | | 2,761,500 | | | | 73,474 | |
| SK hynix, Inc. | | | 826,941 | | | | 57,957 | |
| Fujitsu, Ltd. | | | 345,900 | | | | 43,250 | |
| Samsung Electronics Co., Ltd. | | | 631,500 | | | | 27,723 | |
| NXP Semiconductors NV | | | 173,200 | | | | 25,639 | |
| Keyence Corp. | | | 64,200 | | | | 21,946 | |
| Infineon Technologies AG | | | 728,000 | | | | 17,616 | |
| STMicroelectronics NV2 | | | 539,236 | | | | 16,953 | |
| Atlassian Corp. PLC, Class A1 | | | 78,500 | | | | 14,711 | |
| Silergy Corp. | | | 176,000 | | | | 14,177 | |
| Suse SA1,2 | | | 576,586 | | | | 13,088 | |
| TELUS International (Cda), Inc., subordinate voting shares1 | | | 499,900 | | | | 12,532 | |
| OBIC Co., Ltd. | | | 83,700 | | | | 11,838 | |
| Kingdee International Software Group Co., Ltd.1 | | | 4,786,000 | | | | 11,223 | |
| Delta Electronics, Inc. | | | 1,408,000 | | | | 10,489 | |
| Hexagon AB, Class B | | | 925,700 | | | | 9,615 | |
| ASM International NV | | | 31,648 | | | | 7,913 | |
| Constellation Software, Inc. | | | 5,300 | | | | 7,868 | |
| Canva, Inc.1,3,4,5 | | | 4,819 | | | | 7,357 | |
| PagSeguro Digital, Ltd., Class A1 | | | 426,548 | | | | 4,368 | |
| Block, Inc., Class A (CDI)1 | | | 45,372 | | | | 2,834 | |
| StoneCo, Ltd., Class A1 | | | 317,126 | | | | 2,442 | |
| | | | | | | | 776,816 | |
| | |
| 48 | American Funds Insurance Series |
International Fund (continued)
| Common stocks (continued) | | Shares | | | Value
(000) | |
| Financials 11.36% | | | | | | | | |
| Kotak Mahindra Bank, Ltd. | | | 8,323,107 | | | $ | 175,067 | |
| AIA Group, Ltd. | | | 12,210,576 | | | | 132,348 | |
| ABN AMRO Bank NV | | | 10,182,910 | | | | 114,342 | |
| HDFC Bank, Ltd. | | | 2,292,812 | | | | 39,137 | |
| HDFC Bank, Ltd. (ADR) | | | 277,000 | | | | 15,224 | |
| Aegon NV2 | | | 12,263,736 | | | | 53,052 | |
| CaixaBank, SA | | | 14,195,517 | | | | 49,344 | |
| ING Groep NV | | | 2,815,632 | | | | 27,828 | |
| Bajaj Finance, Ltd. | | | 396,342 | | | | 27,104 | |
| Nu Holdings, Ltd., Class A1,2 | | | 6,890,117 | | | | 25,769 | |
| Futu Holdings, Ltd. (ADR)1,2 | | | 440,706 | | | | 23,009 | |
| KBC Groep NV | | | 406,187 | | | | 22,790 | |
| XP, Inc., Class A1 | | | 963,259 | | | | 17,300 | |
| FinecoBank SpA | | | 1,211,135 | | | | 14,494 | |
| Ping An Insurance (Group) Company of China, Ltd., Class H | | | 898,500 | | | | 6,109 | |
| Ping An Insurance (Group) Company of China, Ltd., Class A | | | 817,263 | | | | 5,700 | |
| B3 SA-Brasil, Bolsa, Balcao | | | 4,413,000 | | | | 9,242 | |
| Allfunds Group PLC | | | 1,158,708 | | | | 8,937 | |
| Bajaj Finserv, Ltd. | | | 50,931 | | | | 7,050 | |
| | | | | | | | 773,846 | |
| | | | | | | | | |
| Health care 11.06% | | | | | | | | |
| Daiichi Sankyo Company, Ltd. | | | 9,080,408 | | | | 230,022 | |
| Olympus Corp. | | | 5,808,100 | | | | 116,714 | |
| WuXi Biologics (Cayman), Inc.1 | | | 12,609,300 | | | | 115,378 | |
| Grifols, SA, Class A, non-registered shares1,2 | | | 2,451,598 | | | | 46,335 | |
| Grifols, SA, Class B (ADR)1 | | | 793,690 | | | | 9,429 | |
| Bayer AG | | | 841,261 | | | | 50,004 | |
| Siemens Healthineers AG | | | 833,668 | | | | 42,363 | |
| WuXi AppTec Co., Ltd., Class A | | | 2,367,360 | | | | 36,775 | |
| WuXi AppTec Co., Ltd., Class H | | | 312,000 | | | | 4,155 | |
| Merck KGaA | | | 110,400 | | | | 18,627 | |
| M3, Inc. | | | 644,835 | | | | 18,526 | |
| HOYA Corp. | | | 198,300 | | | | 16,932 | |
| Hapvida Participacoes e Investimentos SA1 | | | 9,734,853 | | | | 10,175 | |
| Insulet Corp.1 | | | 46,653 | | | | 10,167 | |
| Alcon, Inc. | | | 133,937 | | | | 9,355 | |
| CanSino Biologics, Inc., Class H2 | | | 729,200 | | | | 7,467 | |
| bioMérieux SA | | | 58,300 | | | | 5,694 | |
| Ambu AS, Class B, non-registered shares2 | | | 545,233 | | | | 5,294 | |
| | | | | | | | 753,412 | |
| | | | | | | | | |
| Energy 9.56% | | | | | | | | |
| Reliance Industries, Ltd.1 | | | 9,435,600 | | | | 310,127 | |
| Petróleo Brasileiro SA (Petrobras), ordinary nominative shares (ADR) | | | 6,724,576 | | | | 78,543 | |
| Neste OYJ | | | 1,756,952 | | | | 77,772 | |
| TotalEnergies SE | | | 1,147,298 | | | | 60,560 | |
| Canadian Natural Resources, Ltd. (CAD denominated) | | | 818,700 | | | | 43,994 | |
| Woodside Energy Group, Ltd. | | | 1,967,852 | | | | 43,249 | |
| Cenovus Energy, Inc. (CAD denominated) | | | 1,190,000 | | | | 22,641 | |
| Shell PLC (GBP denominated) | | | 573,839 | | | | 14,907 | |
| | | | | | | | 651,793 | |
| | | | | | | | | |
| Materials 9.23% | | | | | | | | |
| First Quantum Minerals, Ltd. | | | 10,951,800 | | | | 207,771 | |
| Fortescue Metals Group, Ltd. | | | 11,257,992 | | | | 136,223 | |
| Vale SA, ordinary nominative shares (ADR) | | | 6,886,607 | | | | 100,751 | |
| Vale SA, ordinary nominative shares | | | 770,681 | | | | 11,274 | |
| Linde PLC (EUR denominated)2 | | | 135,800 | | | | 38,986 | |
| Linde PLC | �� | | 35,287 | | | | 10,146 | |
| Shin-Etsu Chemical Co., Ltd. | | | 395,300 | | | | 44,576 | |
| Wacker Chemie AG | | | 147,773 | | | | 21,309 | |
| | |
| American Funds Insurance Series | 49 |
International Fund (continued)
| Common stocks (continued) | | Shares | | | Value
(000) | |
| Materials (continued) | | | | | | | | |
| Ivanhoe Mines, Ltd., Class A1 | | | 3,403,051 | | | $ | 19,590 | |
| JSR Corp. | | | 379,200 | | | | 9,838 | |
| Koninklijke DSM NV | | | 55,354 | | | | 7,953 | |
| Yunnan Energy New Material Co., Ltd., Class A | | | 196,300 | | | | 7,344 | |
| Akzo Nobel NV | | | 107,048 | | | | 7,025 | |
| BASF SE | | | 136,760 | | | | 5,951 | |
| | | | | | | | 628,737 | |
| | | | | | | | | |
| Consumer discretionary 8.85% | | | | | | | | |
| MercadoLibre, Inc.1 | | | 132,887 | | | | 84,632 | |
| Evolution AB | | | 916,701 | | | | 83,348 | |
| Sony Group Corp. | | | 920,500 | | | | 75,272 | |
| Galaxy Entertainment Group, Ltd. | | | 9,204,000 | | | | 54,895 | |
| Ferrari NV (EUR denominated) | | | 254,543 | | | | 46,734 | |
| LVMH Moët Hennessy-Louis Vuitton SE | | | 72,682 | | | | 44,306 | |
| Maruti Suzuki India, Ltd. | | | 303,300 | | | | 32,533 | |
| Alibaba Group Holding, Ltd. (ADR)1 | | | 213,000 | | | | 24,214 | |
| Alibaba Group Holding, Ltd.1 | | | 414,200 | | | | 5,907 | |
| Kering SA | | | 53,565 | | | | 27,511 | |
| JD.com, Inc., Class A (ADR) | | | 239,660 | | | | 15,391 | |
| JD.com, Inc., Class A | | | 266,775 | | | | 8,595 | |
| Entain PLC1 | | | 1,560,453 | | | | 23,649 | |
| Coupang, Inc., Class A1 | | | 1,509,600 | | | | 19,247 | |
| Flutter Entertainment PLC1 | | | 158,674 | | | | 16,043 | |
| EssilorLuxottica | | | 80,200 | | | | 12,010 | |
| InterContinental Hotels Group PLC | | | 155,468 | | | | 8,232 | |
| Bandai Namco Holdings, Inc. | | | 108,742 | | | | 7,677 | |
| Aptiv PLC1 | | | 84,000 | | | | 7,482 | |
| On Holding AG, Class A1 | | | 308,680 | | | | 5,461 | |
| | | | | | | | 603,139 | |
| | | | | | | | | |
| Consumer staples 4.49% | | | | | | | | |
| Kweichow Moutai Co., Ltd., Class A | | | 224,223 | | | | 68,496 | |
| Danone SA | | | 878,392 | | | | 49,026 | |
| British American Tobacco PLC | | | 911,000 | | | | 39,030 | |
| Treasury Wine Estates, Ltd. | | | 4,562,804 | | | | 35,747 | |
| Seven & i Holdings Co., Ltd. | | | 864,100 | | | | 33,544 | |
| Kobe Bussan Co., Ltd. | | | 754,900 | | | | 18,500 | |
| Inner Mongolia Yili Industrial Group Co., Ltd., Class A | | | 2,653,503 | | | | 15,439 | |
| CP ALL PCL, foreign registered shares | | | 9,053,300 | | | | 15,388 | |
| Nestlé SA | | | 78,463 | | | | 9,159 | |
| Chocoladefabriken Lindt & Sprüngli AG | | | 80 | | | | 8,388 | |
| Shiseido Company, Ltd. | | | 179,400 | | | | 7,201 | |
| Dabur India, Ltd. | | | 933,875 | | | | 5,865 | |
| | | | | | | | 305,783 | |
| | | | | | | | | |
| Communication services 3.50% | | | | | | | | |
| Bharti Airtel, Ltd.1 | | | 12,732,125 | | | | 110,429 | |
| Bharti Airtel, Ltd., interim shares1 | | | 836,308 | | | | 3,203 | |
| Universal Music Group NV | | | 1,312,633 | | | | 26,320 | |
| Sea, Ltd., Class A (ADR)1 | | | 357,779 | | | | 23,921 | |
| Informa PLC1 | | | 3,630,108 | | | | 23,367 | |
| Ubisoft Entertainment SA1 | | | 518,403 | | | | 22,763 | |
| Singapore Telecommunications, Ltd. | | | 5,800,500 | | | | 10,563 | |
| Vivendi SE | | | 907,392 | | | | 9,220 | |
| SoftBank Group Corp. | | | 224,200 | | | | 8,650 | |
| Yandex NV, Class A1,3,4 | | | 313,000 | | | | — | 6 |
| | | | | | | | 238,436 | |
| | | | | | | | | |
| Utilities 2.24% | | | | | | | | |
| ENN Energy Holdings, Ltd. | | | 9,285,300 | | | | 152,530 | |
| | |
| 50 | American Funds Insurance Series |
International Fund (continued)
| Common stocks (continued) | | Shares | | | Value
(000) | |
| Real estate 0.68% | | | | | | | | |
| ESR Group, Ltd.1 | | | 14,852,600 | | | $ | 40,128 | |
| Ayala Land, Inc. | | | 13,552,800 | | | | 6,285 | |
| | | | | | | | 46,413 | |
| | | | | | | | | |
| Total common stocks (cost: $5,416,609,000) | | | | | | | 5,824,871 | |
| | | | | | | | | |
| Preferred securities 0.78% | | | | | | | | |
| Health care 0.40% | | | | | | | | |
| Grifols, SA, Class B, nonvoting non-registered preferred shares1 | | | 2,274,930 | | | | 26,892 | |
| | | | | | | | | |
| Energy 0.23% | | | | | | | | |
| Petróleo Brasileiro SA (Petrobras), preferred nominative shares | | | 2,980,131 | | | | 15,905 | |
| | | | | | | | | |
| Financials 0.14% | | | | | | | | |
| Itaú Unibanco Holding SA, preferred nominative shares | | | 2,246,000 | | | | 9,729 | |
| | | | | | | | | |
| Information technology 0.01% | | | | | | | | |
| Canva, Inc., Series A, noncumulative preferred shares1,3,4,5 | | | 422 | | | | 644 | |
| Canva, Inc., Series A-3, noncumulative preferred shares1,3,4,5 | | | 18 | | | | 27 | |
| Canva, Inc., Series A-4, noncumulative preferred shares1,3,4,5 | | | 1 | | | | 2 | |
| | | | | | | | 673 | |
| | | | | | | | | |
| Total preferred securities (cost: $70,947,000) | | | | | | | 53,199 | |
| | | | | | | | | |
| Rights & warrants 0.24% | | | | | | | | |
| Health care 0.24% | | | | | | | | |
| WuXi AppTec Co., Ltd., Class A, warrants, expire 20221,3,7 | | | 1,075,200 | | | | 16,702 | |
| | | | | | | | | |
| Total rights & warrants (cost: $20,683,000) | | | | | | | 16,702 | |
| | | | | | | | | |
| Short-term securities 14.40% | | | | | | | | |
| Money market investments 13.41% | | | | | | | | |
| Capital Group Central Cash Fund 1.38%8,9 | | | 9,140,101 | | | | 913,827 | |
| | | | | | | | | |
| Money market investments purchased with collateral from securities on loan 0.99% | | | | | | | | |
| Capital Group Central Cash Fund 1.38%8,9,10 | | | 190,714 | | | | 19,067 | |
| Goldman Sachs Financial Square Government Fund, Institutional Shares 1.39%8,10 | | | 10,067,468 | | | | 10,067 | |
| BlackRock Liquidity Funds – FedFund, Institutional Shares 1.32%8,10 | | | 9,533,786 | | | | 9,534 | |
| Invesco Short-Term Investments Trust – Government & Agency Portfolio, Institutional Class 1.38%8,10 | | | 9,533,786 | | | | 9,534 | |
| Morgan Stanley Institutional Liquidity Funds – Government Portfolio, Institutional Class 1.38%8,10 | | | 9,533,786 | | | | 9,534 | |
| State Street Institutional U.S. Government Money Market Fund, Institutional Class 1.40%8,10 | | | 9,533,786 | | | | 9,534 | |
| | | | | | | | 67,270 | |
| | | | | | | | | |
| Total short-term securities (cost: $981,221,000) | | | | | | | 981,097 | |
| Total investment securities 100.91% (cost: $6,489,460,000) | | | | | | | 6,875,869 | |
| Other assets less liabilities (0.91)% | | | | | | | (62,255 | ) |
| | | | | | | | | |
| Net assets 100.00% | | | | | | $ | 6,813,614 | |
| | |
| American Funds Insurance Series | 51 |
International Fund (continued)
Investments in affiliates9
| | | Value of
affiliates at
1/1/2022
(000) | | | Additions
(000) | | | Reductions
(000) | | | Net
realized
gain
(000) | | | Net
unrealized
depreciation
(000) | | | Value of
affiliates at
6/30/2022
(000) | | | Dividend
income
(000) | |
| Short-term securities 13.69% | | | | | | | | | | | | | | | | | | | | | | | | | | | | |
| Money market investments 13.41% | | | | | | | | | | | | | | | | | | | | | | | | | | | | |
| Capital Group Central Cash Fund 1.38%8 | | $ | 977,398 | | | $ | 1,096,883 | | | $ | 1,160,244 | | | $ | 20 | | | $ | (230 | ) | | $ | 913,827 | | | $ | 1,992 | |
| Money market investments purchased with collateral from securities on loan 0.28% | | | | | | | | | | | | | | | | | | | | | | | | | | | | |
| Capital Group Central Cash Fund 1.38%8,10 | | | 34,059 | | | | | | | | 14,992 | 11 | | | | | | | | | | | 19,067 | | | | — | 12 |
| Total short-term securities | | | | | | | | | | | | | | | | | | | | | | | 932,894 | | | | | |
| Total 13.69% | | | | | | | | | | | | | | $ | 20 | | | $ | (230 | ) | | $ | 932,894 | | | $ | 1,992 | |
Private placement securities5
| | | Acquisition
date(s) | | | Cost
(000) | | | Value
(000) | | | Percent
of net
assets | |
| Canva, Inc. | | 8/26/2021-11/4/2021 | | | $ | 8,215 | | | $ | 7,357 | | | | .11 | % |
| Canva, Inc., Series A, noncumulative preferred shares | | 11/4/2021 | | | | 719 | | | | 644 | | | | .01 | |
| Canva, Inc., Series A-3, noncumulative preferred shares | | 11/4/2021 | | | | 31 | | | | 27 | | | | .00 | |
| Canva, Inc., Series A-4, noncumulative preferred shares | | 11/4/2021 | | | | 2 | | | | 2 | | | | .00 | |
| Total | | | | | $ | 8,967 | | | $ | 8,030 | | | | .12 | % |
| | |
| 1 | Security did not produce income during the last 12 months. |
| 2 | All or a portion of this security was on loan. The total value of all such securities was $71,916,000, which represented 1.06% of the net assets of the fund. Refer to Note 5 for more information on securities lending. |
| 3 | Valued under fair value procedures adopted by authority of the board of trustees. The total value of all such securities was $24,732,000, which represented .36% of the net assets of the fund. |
| 4 | Value determined using significant unobservable inputs. |
| 5 | Acquired through a private placement transaction exempt from registration under the Securities Act of 1933. May be subject to legal or contractual restrictions on resale. |
| 6 | Amount less than one thousand. |
| 7 | Acquired in a transaction exempt from registration under Rule 144A of the Securities Act of 1933. May be resold in the U.S. in transactions exempt from registration, normally to qualified institutional buyers. The total value of all such securities was $16,702,000, which represented .25% of the net assets of the fund. |
| 8 | Rate represents the seven-day yield at 6/30/2022. |
| 9 | Part of the same “group of investment companies” as the fund as defined under the Investment Company Act of 1940, as amended. |
| 10 | Security purchased with cash collateral from securities on loan. Refer to Note 5 for more information on securities lending. |
| 11 | Represents net activity. Refer to Note 5 for more information on securities lending. |
| 12 | Dividend income is included with securities lending income in the fund’s statement of operations and is not shown in this table. |
Key to abbreviations
ADR = American Depositary Receipts
CAD = Canadian dollars
CDI = CREST Depository Interest
EUR = Euros
GBP = British pounds
Refer to the notes to financial statements.
| 52 | American Funds Insurance Series |
| New World Fund | |
| Investment portfolio June 30, 2022 | unaudited |
| | |
| Common stocks 85.69% | | Shares | | | Value
(000) | |
| Information technology 15.68% | | | | | | | | |
| Microsoft Corp. | | | 398,934 | | | $ | 102,458 | |
| Taiwan Semiconductor Manufacturing Company, Ltd. | | | 4,004,000 | | | | 64,100 | |
| Broadcom, Inc. | | | 52,546 | | | | 25,527 | |
| Micron Technology, Inc. | | | 453,986 | | | | 25,096 | |
| ASML Holding NV | | | 51,193 | | | | 24,455 | |
| Wolfspeed, Inc.1 | | | 340,065 | | | | 21,577 | |
| Adobe, Inc.1 | | | 51,971 | | | | 19,024 | |
| Tata Consultancy Services, Ltd. | | | 427,278 | | | | 17,677 | |
| Apple, Inc. | | | 129,278 | | | | 17,675 | |
| Mastercard, Inc., Class A | | | 48,408 | | | | 15,272 | |
| Silergy Corp. | | | 181,094 | | | | 14,587 | |
| Visa, Inc., Class A | | | 52,549 | | | | 10,346 | |
| PagSeguro Digital, Ltd., Class A1 | | | 922,834 | | | | 9,450 | |
| Samsung Electronics Co., Ltd. | | | 207,833 | | | | 9,124 | |
| NVIDIA Corp. | | | 55,678 | | | | 8,440 | |
| Keyence Corp. | | | 24,600 | | | | 8,409 | |
| EPAM Systems, Inc.1 | | | 26,998 | | | | 7,958 | |
| TELUS International (Cda), Inc., subordinate voting shares1 | | | 294,869 | | | | 7,392 | |
| Network International Holdings PLC1 | | | 2,797,596 | | | | 6,430 | |
| Accenture PLC, Class A | | | 21,156 | | | | 5,874 | |
| Nokia Corp. | | | 1,149,271 | | | | 5,347 | |
| SAP SE | | | 56,875 | | | | 5,181 | |
| Tokyo Electron, Ltd. | | | 15,500 | | | | 5,061 | |
| Flat Glass Group Co., Ltd., Class H1,2 | | | 1,420,000 | | | | 4,995 | |
| Edenred SA | | | 102,606 | | | | 4,835 | |
| Nice, Ltd. (ADR)1 | | | 24,926 | | | | 4,797 | |
| Kingdee International Software Group Co., Ltd.1 | | | 1,904,000 | | | | 4,465 | |
| MediaTek, Inc. | | | 154,000 | | | | 3,372 | |
| Halma PLC | | | 107,927 | | | | 2,639 | |
| Trimble, Inc.1 | | | 42,730 | | | | 2,488 | |
| SK hynix, Inc. | | | 34,099 | | | | 2,390 | |
| ON Semiconductor Corp.1 | | | 46,661 | | | | 2,347 | |
| Amadeus IT Group SA, Class A, non-registered shares1 | | | 39,769 | | | | 2,215 | |
| Advanced Micro Devices, Inc.1 | | | 27,588 | | | | 2,110 | |
| DLocal, Ltd., Class A1 | | | 78,185 | | | | 2,052 | |
| Logitech International SA | | | 38,622 | | | | 2,018 | |
| Cognizant Technology Solutions Corp., Class A | | | 27,762 | | | | 1,874 | |
| Infosys, Ltd. | | | 96,230 | | | | 1,781 | |
| Applied Materials, Inc. | | | 19,121 | | | | 1,740 | |
| PayPal Holdings, Inc.1 | | | 24,259 | | | | 1,694 | |
| StoneCo, Ltd., Class A1 | | | 208,228 | | | | 1,603 | |
| FleetCor Technologies, Inc.1 | | | 7,609 | | | | 1,599 | |
| KLA Corp. | | | 4,986 | | | | 1,591 | |
| Hexagon AB, Class B | | | 105,226 | | | | 1,093 | |
| Globant SA1 | | | 6,239 | | | | 1,086 | |
| Hamamatsu Photonics KK | | | 27,200 | | | | 1,056 | |
| Euronet Worldwide, Inc.1 | | | 10,178 | | | | 1,024 | |
| Hundsun Technologies, Inc., Class A | | | 150,377 | | | | 978 | |
| MKS Instruments, Inc. | | | 8,486 | | | | 871 | |
| Coforge, Ltd. | | | 18,403 | | | | 825 | |
| Autodesk, Inc.1 | | | 4,715 | | | | 811 | |
| VeriSign, Inc.1 | | | 4,446 | | | | 744 | |
| Infineon Technologies AG | | | 26,555 | | | | 643 | |
| Atlassian Corp. PLC, Class A1 | | | 3,424 | | | | 642 | |
| Canva, Inc.1,3,4,5 | | | 385 | | | | 588 | |
| Fabrinet, non-registered shares1 | | | 6,992 | | | | 567 | |
| Intel Corp. | | | 3,575 | | | | 134 | |
| | | | | | | | 500,127 | |
| | |
| American Funds Insurance Series | 53 |
New World Fund (continued)
| Common stocks (continued) | | Shares | | | Value
(000) | |
| Financials 11.95% | | | | | | | | |
| Kotak Mahindra Bank, Ltd. | | | 3,010,627 | | | $ | 63,325 | |
| AIA Group, Ltd. | | | 3,976,200 | | | | 43,097 | |
| Ping An Insurance (Group) Company of China, Ltd., Class H | | | 4,121,344 | | | | 28,021 | |
| HDFC Bank, Ltd. | | | 1,260,295 | | | | 21,512 | |
| B3 SA-Brasil, Bolsa, Balcao | | | 10,216,738 | | | | 21,396 | |
| Capitec Bank Holdings, Ltd. | | | 170,562 | | | | 20,781 | |
| Bajaj Finance, Ltd. | | | 256,491 | | | | 17,540 | |
| Industrial and Commercial Bank of China, Ltd., Class H | | | 23,013,000 | | | | 13,667 | |
| AU Small Finance Bank, Ltd. | | | 1,514,002 | | | | 11,344 | |
| Banco Bilbao Vizcaya Argentaria, SA | | | 2,164,760 | | | | 9,824 | |
| PB Fintech, Ltd.1 | | | 1,162,870 | | | | 8,437 | |
| Nu Holdings, Ltd., Class A1 | | | 2,004,606 | | | | 7,497 | |
| ICICI Bank, Ltd. (ADR) | | | 300,062 | | | | 5,323 | |
| ICICI Bank, Ltd. | | | 240,154 | | | | 2,151 | |
| Discovery, Ltd.1 | | | 921,680 | | | | 7,257 | |
| China Merchants Bank Co., Ltd., Class H | | | 1,045,500 | | | | 6,995 | |
| S&P Global, Inc. | | | 20,318 | | | | 6,848 | |
| UniCredit SpA | | | 682,154 | | | | 6,480 | |
| XP, Inc., Class A1 | | | 341,304 | | | | 6,130 | |
| Hong Kong Exchanges and Clearing, Ltd. | | | 117,600 | | | | 5,785 | |
| Bank Rakyat Indonesia (Persero) Tbk PT | | | 20,501,900 | | | | 5,711 | |
| Eurobank Ergasias Services and Holdings SA1 | | | 6,082,762 | | | | 5,375 | |
| Moody’s Corp. | | | 17,945 | | | | 4,881 | |
| Postal Savings Bank of China Co., Ltd., Class H | | | 6,062,000 | | | | 4,813 | |
| Société Générale | | | 207,077 | | | | 4,533 | |
| East Money Information Co., Ltd., Class A | | | 1,153,656 | | | | 4,377 | |
| Lufax Holding, Ltd. (ADR) | | | 687,300 | | | | 4,124 | |
| Alpha Services and Holdings SA1 | | | 4,683,510 | | | | 4,084 | |
| Aon PLC, Class A | | | 10,856 | | | | 2,928 | |
| Bank Mandiri (Persero) Tbk PT | | | 5,279,900 | | | | 2,809 | |
| Standard Bank Group, Ltd. | | | 290,750 | | | | 2,773 | |
| Canara Bank | | | 1,185,969 | | | | 2,722 | |
| Bajaj Finserv, Ltd. | | | 18,250 | | | | 2,526 | |
| Fairfax Financial Holdings, Ltd., subordinate voting shares | | | 4,711 | | | | 2,496 | |
| Bank Central Asia Tbk PT | | | 5,066,200 | | | | 2,466 | |
| DBS Group Holdings, Ltd. | | | 111,373 | | | | 2,379 | |
| HDFC Life Insurance Company, Ltd. | | | 337,705 | | | | 2,352 | |
| Futu Holdings, Ltd. (ADR)1,2 | | | 41,701 | | | | 2,177 | |
| Banco Santander México, SA, Institución de Banca Múltiple, Grupo Financiero Santander México, Class B | | | 1,385,817 | | | | 1,414 | |
| China Construction Bank Corp., Class H | | | 2,059,000 | | | | 1,383 | |
| TISCO Financial Group PCL, foreign registered shares | | | 343,800 | | | | 862 | |
| Grupo Financiero Banorte, SAB de CV, Series O | | | 85,744 | | | | 478 | |
| TCS Group Holding PLC (GDR)1,3,4 | | | 78,482 | | | | — | 6 |
| Moscow Exchange MICEX-RTS PJSC1,3,4 | | | 438,203 | | | | — | 6 |
| Sberbank of Russia PJSC1,3,4,7 | | | 2,662,164 | | | | — | 6 |
| | | | | | | | 381,073 | |
| | | | | | | | | |
| Health care 11.67% | | | | | | | | |
| Thermo Fisher Scientific, Inc. | | | 73,249 | | | | 39,795 | |
| Eli Lilly and Company | | | 99,900 | | | | 32,391 | |
| Abbott Laboratories | | | 232,881 | | | | 25,302 | |
| Novo Nordisk A/S, Class B | | | 209,543 | | | | 23,241 | |
| WuXi Biologics (Cayman), Inc.1 | | | 2,445,600 | | | | 22,378 | |
| AstraZeneca PLC | | | 149,534 | | | | 19,659 | |
| WuXi AppTec Co., Ltd., Class A | | | 809,559 | | | | 12,576 | |
| WuXi AppTec Co., Ltd., Class H | | | 491,300 | | | | 6,543 | |
| PerkinElmer, Inc. | | | 124,925 | | | | 17,767 | |
| Danaher Corp. | | | 60,094 | | | | 15,235 | |
| Jiangsu Hengrui Medicine Co., Ltd., Class A | | | 2,512,188 | | | | 13,919 | |
| Carl Zeiss Meditec AG, non-registered shares2 | | | 100,330 | | | | 11,976 | |
| BeiGene, Ltd. (ADR)1 | | | 65,037 | | | | 10,526 | |
| | |
| 54 | American Funds Insurance Series |
New World Fund (continued)
| Common stocks (continued) | | Shares | | | Value
(000) | |
| Health care (continued) | | | | | | | | |
| BeiGene, Ltd., Class H1,2 | | | 49,700 | | | $ | 624 | |
| Laurus Labs, Ltd. | | | 1,762,486 | | | | 10,371 | |
| CanSino Biologics, Inc., Class H | | | 996,718 | | | | 10,206 | |
| Shionogi & Co., Ltd. | | | 183,000 | | | | 9,246 | |
| CSL, Ltd. | | | 49,605 | | | | 9,213 | |
| Pfizer, Inc. | | | 174,518 | | | | 9,150 | |
| Olympus Corp. | | | 398,800 | | | | 8,014 | |
| Hypera SA, ordinary nominative shares | | | 1,020,998 | | | | 7,421 | |
| Hapvida Participacoes e Investimentos SA1 | | | 6,522,586 | | | | 6,817 | |
| Zoetis, Inc., Class A | | | 33,143 | | | | 5,697 | |
| Pharmaron Beijing Co., Ltd., Class A | | | 340,250 | | | | 4,839 | |
| Pharmaron Beijing Co., Ltd., Class H | | | 26,850 | | | | 269 | |
| Siemens Healthineers AG | | | 82,699 | | | | 4,202 | |
| Rede D’Or Sao Luiz SA | | | 756,718 | | | | 4,190 | |
| Hutchmed China, Ltd.1,2 | | | 808,232 | | | | 1,992 | |
| Hutchmed China, Ltd. (ADR)1 | | | 150,024 | | | | 1,896 | |
| Legend Biotech Corp. (ADR)1 | | | 65,903 | | | | 3,625 | |
| Straumann Holding AG | | | 29,438 | | | | 3,535 | |
| Grifols, SA, Class A, non-registered shares1 | | | 155,398 | | | | 2,937 | |
| Teva Pharmaceutical Industries, Ltd. (ADR)1 | | | 248,351 | | | | 1,868 | |
| OdontoPrev SA, ordinary nominative shares | | | 1,044,247 | | | | 1,866 | |
| Align Technology, Inc.1 | | | 7,775 | | | | 1,840 | |
| Mettler-Toledo International, Inc.1 | | | 1,508 | | | | 1,732 | |
| Angelalign Technology, Inc. | | | 85,000 | | | | 1,703 | |
| Medtronic PLC | | | 16,413 | | | | 1,473 | |
| Asahi Intecc Co., Ltd. | | | 91,800 | | | | 1,386 | |
| Genus PLC | | | 40,970 | | | | 1,251 | |
| Innovent Biologics, Inc.1 | | | 220,000 | | | | 978 | |
| Merck KGaA | | | 5,502 | | | | 928 | |
| Hangzhou Tigermed Consulting Co., Ltd., Class A | | | 50,871 | | | | 870 | |
| Zai Lab, Ltd. (ADR)1 | | | 16,060 | | | | 557 | |
| Shandong Pharmaceutical Glass Co., Ltd., Class A | | | 66,700 | | | | 278 | |
| | | | | | | | 372,282 | |
| | | | | | | | | |
| Consumer discretionary 10.52% | | | | | | | | |
| LVMH Moët Hennessy-Louis Vuitton SE | | | 60,448 | | | | 36,849 | |
| MercadoLibre, Inc.1 | | | 35,216 | | | | 22,428 | |
| General Motors Company1 | | | 699,053 | | | | 22,202 | |
| Hermès International | | | 17,033 | | | | 19,046 | |
| Galaxy Entertainment Group, Ltd. | | | 2,970,000 | | | | 17,714 | |
| Li Ning Co., Ltd. | | | 1,835,501 | | | | 17,006 | |
| Evolution AB | | | 179,821 | | | | 16,350 | |
| EssilorLuxottica | | | 85,613 | | | | 12,821 | |
| Trip.com Group, Ltd. (ADR)1 | | | 409,020 | | | | 11,228 | |
| XPeng, Inc., Class A1,2 | | | 663,978 | | | | 10,696 | |
| Midea Group Co., Ltd., Class A | | | 1,104,055 | | | | 9,960 | |
| JD.com, Inc., Class A | | | 240,530 | | | | 7,749 | |
| Kering SA | | | 14,088 | | | | 7,236 | |
| YUM! Brands, Inc. | | | 63,025 | | | | 7,154 | |
| Huazhu Group, Ltd. (ADR) | | | 181,055 | | | | 6,898 | |
| Zhongsheng Group Holdings, Ltd. | | | 885,500 | | | | 6,246 | |
| Cie. Financière Richemont SA, Class A | | | 58,126 | | | | 6,189 | |
| Booking Holdings, Inc.1 | | | 3,215 | | | | 5,623 | |
| Alibaba Group Holding, Ltd.1 | | | 382,972 | | | | 5,461 | |
| Astra International Tbk PT | | | 12,241,400 | | | | 5,444 | |
| Americanas SA, ordinary nominative shares | | | 2,105,517 | | | | 5,403 | |
| NIKE, Inc., Class B | | | 52,547 | | | | 5,370 | |
| Jumbo SA | | | 367,791 | | | | 5,342 | |
| Tesla, Inc.1 | | | 7,065 | | | | 4,758 | |
| Pop Mart International Group, Ltd. | | | 980,400 | | | | 4,735 | |
| Industria de Diseño Textil, SA | | | 206,902 | | | | 4,681 | |
| Marriott International, Inc., Class A | | | 32,868 | | | | 4,470 | |
| | |
| American Funds Insurance Series | 55 |
New World Fund (continued)
| Common stocks (continued) | | Shares | | | Value
(000) | |
| Consumer discretionary (continued) | | | | | | | | |
| JD Health International, Inc.1 | | | 523,450 | | | $ | 4,106 | |
| Titan Co., Ltd. | | | 158,667 | | | | 3,900 | |
| IDP Education, Ltd. | | | 218,530 | | | | 3,593 | |
| China MeiDong Auto Holdings, Ltd. | | | 950,000 | | | | 2,990 | |
| Lear Corp. | | | 23,098 | | | | 2,908 | |
| Maruti Suzuki India, Ltd. | | | 24,639 | | | | 2,643 | |
| Samsonite International SA1 | | | 1,322,400 | | | | 2,632 | |
| Airbnb, Inc., Class A1 | | | 27,875 | | | | 2,483 | |
| InterContinental Hotels Group PLC | | | 42,267 | | | | 2,238 | |
| Aptiv PLC1 | | | 24,637 | | | | 2,194 | |
| Prosus NV, Class N | | | 31,819 | | | | 2,083 | |
| Entain PLC1 | | | 118,320 | | | | 1,793 | |
| Inchcape PLC | | | 202,422 | | | | 1,714 | |
| Shangri-La Asia, Ltd.1 | | | 2,024,000 | | | | 1,641 | |
| Fast Retailing Co., Ltd. | | | 2,700 | | | | 1,414 | |
| Melco Resorts & Entertainment, Ltd. (ADR)1 | | | 237,753 | | | | 1,367 | |
| FSN E-Commerce Ventures, Ltd.1 | | | 68,803 | | | | 1,226 | |
| Naspers, Ltd., Class N | | | 7,089 | | | | 1,032 | |
| Gree Electric Appliances, Inc. of Zhuhai, Class A | | | 150,246 | | | | 757 | |
| Stellantis NV | | | 61,093 | | | | 754 | |
| adidas AG | | | 4,196 | | | | 742 | |
| Flutter Entertainment PLC1 | | | 6,950 | | | | 703 | |
| Levi Strauss & Co., Class A | | | 42,463 | | | | 693 | |
| Jiumaojiu International Holdings, Ltd.2 | | | 239,000 | | | | 635 | |
| Cyrela Brazil Realty SA, ordinary nominative shares | | | 117,858 | | | | 266 | |
| Ozon Holdings PLC (ADR)1,3,4 | | | 209,599 | | | | — | 6 |
| | | | | | | | 335,566 | |
| | | | | | | | | |
| Industrials 8.88% | | | | | | | | |
| Airbus SE, non-registered shares | | | 375,800 | | | | 36,409 | |
| IMCD NV | | | 130,844 | | | | 17,956 | |
| Shenzhen Inovance Technology Co., Ltd., Class A | | | 1,466,674 | | | | 14,432 | |
| General Electric Co. | | | 215,458 | | | | 13,718 | |
| DSV A/S | | | 96,469 | | | | 13,472 | |
| Safran SA | | | 128,904 | | | | 12,726 | |
| International Container Terminal Services, Inc. | | | 3,767,720 | | | | 12,608 | |
| Copa Holdings, SA, Class A1 | | | 189,059 | | | | 11,981 | |
| Larsen & Toubro, Ltd. | | | 594,628 | | | | 11,733 | |
| Rumo SA | | | 3,508,073 | | | | 10,705 | |
| Zhejiang Sanhua Intelligent Controls Co., Ltd., Class A | | | 2,393,424 | | | | 9,825 | |
| Grab Holdings, Ltd., Class A1 | | | 3,233,079 | | | | 8,180 | |
| Suzhou Maxwell Technologies Co., Ltd., Class A | | | 98,600 | | | | 7,230 | |
| Caterpillar, Inc. | | | 39,829 | | | | 7,120 | |
| CCR SA, ordinary nominative shares | | | 2,717,276 | | | | 6,506 | |
| TransDigm Group, Inc.1 | | | 10,219 | | | | 5,484 | |
| Contemporary Amperex Technology Co., Ltd., Class A | | | 67,047 | | | | 5,348 | |
| Nidec Corp. | | | 84,200 | | | | 5,200 | |
| Thales SA | | | 38,118 | | | | 4,676 | |
| Carrier Global Corp. | | | 120,077 | | | | 4,282 | |
| InPost SA1,2 | | | 729,246 | | | | 4,228 | |
| Daikin Industries, Ltd. | | | 26,000 | | | | 4,168 | |
| Wizz Air Holdings PLC1 | | | 191,404 | | | | 4,087 | |
| Raytheon Technologies Corp. | | | 42,230 | | | | 4,059 | |
| ZTO Express (Cayman), Inc., Class A (ADR) | | | 136,462 | | | | 3,746 | |
| Centre Testing International Group Co., Ltd. | | | 978,596 | | | | 3,393 | |
| Boeing Company1 | | | 24,587 | | | | 3,362 | |
| SMC Corp. | | | 7,300 | | | | 3,253 | |
| Spirax-Sarco Engineering PLC | | | 25,418 | | | | 3,056 | |
| Ryanair Holdings PLC (ADR)1 | | | 42,600 | | | | 2,865 | |
| Interpump Group SpA | | | 73,018 | | | | 2,784 | |
| AirTAC International Group1 | | | 74,000 | | | | 2,466 | |
| Hitachi, Ltd. | | | 49,300 | | | | 2,339 | |
| | |
| 56 | American Funds Insurance Series |
New World Fund (continued)
| Common stocks (continued) | | Shares | | | Value
(000) | |
| Industrials (continued) | | | | | | | | |
| Bureau Veritas SA | | | 87,556 | | | $ | 2,243 | |
| Epiroc AB, Class B | | | 158,534 | | | | 2,142 | |
| Mitsubishi Heavy Industries, Ltd. | | | 58,500 | | | | 2,046 | |
| Grupo Aeroportuario del Pacífico, SAB de CV, Class B | | | 144,377 | | | | 2,011 | |
| ABB, Ltd. | | | 74,036 | | | | 1,974 | |
| Bharat Electronics, Ltd. | | | 627,525 | | | | 1,860 | |
| Havells India, Ltd. | | | 127,229 | | | | 1,769 | |
| Siemens AG | | | 15,401 | | | | 1,567 | |
| Haitian International Holdings, Ltd. | | | 509,000 | | | | 1,301 | |
| Atlas Copco AB, Class B | | | 136,812 | | | | 1,144 | |
| Experian PLC | | | 27,683 | | | | 811 | |
| China Merchants Port Holdings Co., Ltd. | | | 272,000 | | | | 462 | |
| Hefei Meyer Optoelectronic Technology, Inc., Class A | | | 126,100 | | | | 408 | |
| | | | | | | | 283,135 | |
| | | | | | | | | |
| Materials 7.76% | | | | | | | | |
| Vale SA, ordinary nominative shares | | | 1,749,384 | | | | 25,592 | |
| Vale SA, ordinary nominative shares (ADR) | | | 1,614,308 | | | | 23,617 | |
| First Quantum Minerals, Ltd. | | | 1,631,131 | | | | 30,945 | |
| Freeport-McMoRan, Inc. | | | 771,837 | | | | 22,584 | |
| Asian Paints, Ltd. | | | 583,858 | | | | 19,926 | |
| Sika AG | | | 64,792 | | | | 14,931 | |
| Albemarle Corp. | | | 70,823 | | | | 14,801 | |
| Linde PLC | | | 47,848 | | | | 13,758 | |
| Pidilite Industries, Ltd. | | | 429,669 | | | | 11,371 | |
| Beijing Oriental Yuhong Waterproof Technology Co., Ltd., Class A | | | 861,793 | | | | 6,626 | |
| Sociedad Química y Minera de Chile SA, Class B (ADR) | | | 62,332 | | | | 5,207 | |
| Givaudan SA | | | 1,416 | | | | 4,979 | |
| LANXESS AG | | | 137,274 | | | | 4,917 | |
| Wacker Chemie AG | | | 34,003 | | | | 4,903 | |
| Barrick Gold Corp. | | | 271,788 | | | | 4,808 | |
| Shin-Etsu Chemical Co., Ltd. | | | 41,300 | | | | 4,657 | |
| Yunnan Energy New Material Co., Ltd., Class A | | | 124,100 | | | | 4,643 | |
| Shandong Sinocera Functional Material Co., Ltd., Class A | | | 575,500 | | | | 3,088 | |
| Fresnillo PLC | | | 300,858 | | | | 2,808 | |
| SKSHU Paint Co., Ltd., Class A1 | | | 141,065 | | | | 2,727 | |
| Loma Negra Compania Industrial Argentina SA (ADR) | | | 530,050 | | | | 2,693 | |
| SIG Group AG | | | 92,597 | | | | 2,039 | |
| Amcor PLC (CDI) | | | 151,073 | | | | 1,881 | |
| Arkema SA | | | 20,250 | | | | 1,802 | |
| CCL Industries, Inc., Class B, nonvoting shares | | | 37,100 | | | | 1,754 | |
| Koninklijke DSM NV | | | 12,188 | | | | 1,751 | |
| Nutrien, Ltd. | | | 16,357 | | | | 1,303 | |
| OCI NV | | | 37,480 | | | | 1,236 | |
| Corteva, Inc. | | | 19,843 | | | | 1,074 | |
| Umicore SA | | | 27,264 | | | | 952 | |
| Glencore PLC | | | 166,729 | | | | 903 | |
| Celanese Corp. | | | 7,208 | | | | 848 | |
| Anglo American PLC | | | 19,828 | | | | 709 | |
| BASF SE | | | 13,092 | | | | 570 | |
| Impala Platinum Holdings, Ltd. | | | 51,110 | | | | 569 | |
| Navin Fluorine International, Ltd. | | | 10,286 | | | | 476 | |
| Polymetal International PLC | | | 76,572 | | | | 169 | |
| Alrosa PJSC3,4 | | | 1,123,215 | | | | — | 6 |
| | | | | | | | 247,617 | |
| | | | | | | | | |
| Consumer staples 6.83% | | | | | | | | |
| Kweichow Moutai Co., Ltd., Class A | | | 197,607 | | | | 60,366 | |
| ITC, Ltd. | | | 4,202,675 | | | | 14,555 | |
| Bunge, Ltd. | | | 154,489 | | | | 14,011 | |
| Constellation Brands, Inc., Class A | | | 50,621 | | | | 11,798 | |
| Nestlé SA | | | 94,775 | | | | 11,063 | |
| | |
| American Funds Insurance Series | 57 |
New World Fund (continued)
| Common stocks (continued) | | Shares | | | Value
(000) | |
| Consumer staples (continued) | | | | | | | | |
| Anheuser-Busch InBev SA/NV | | | 184,861 | | | $ | 9,950 | |
| British American Tobacco PLC | | | 204,480 | | | | 8,760 | |
| Japan Tobacco, Inc.2 | | | 420,300 | | | | 7,267 | |
| Philip Morris International, Inc. | | | 64,416 | | | | 6,360 | |
| Carlsberg A/S, Class B | | | 49,429 | | | | 6,296 | |
| Wuliangye Yibin Co., Ltd., Class A | | | 199,771 | | | | 6,026 | |
| Pernod Ricard SA | | | 32,594 | | | | 5,988 | |
| Monster Beverage Corp.1 | | | 62,896 | | | | 5,830 | |
| Varun Beverages, Ltd. | | | 522,753 | | | | 5,233 | |
| Raia Drogasil SA, ordinary nominative shares | | | 1,406,218 | | | | 5,159 | |
| Kimberly-Clark de México, SAB de CV, ordinary participation certificates, Class A2 | | 3,747,683 | | | | 5,075 | |
| Foshan Haitian Flavouring and Food Co., Ltd., Class A | | | 314,996 | | | | 4,252 | |
| Avenue Supermarts, Ltd.1 | | | 98,499 | | | | 4,248 | |
| Dabur India, Ltd. | | | 499,893 | | | | 3,139 | |
| Inner Mongolia Yili Industrial Group Co., Ltd., Class A | | | 502,900 | | | | 2,926 | |
| Arca Continental, SAB de CV | | | 404,001 | | | | 2,662 | |
| L’Oréal SA, non-registered shares | | | 6,365 | | | | 2,196 | |
| Mondelez International, Inc. | | | 32,465 | | | | 2,016 | |
| Proya Cosmetics Co., Ltd., Class A | | | 80,420 | | | | 1,984 | |
| Danone SA | | | 34,906 | | | | 1,948 | |
| Monde Nissin Corp.1 | | | 8,193,900 | | | | 1,937 | |
| United Spirits, Ltd.1 | | | 158,456 | | | | 1,524 | |
| Reckitt Benckiser Group PLC | | | 19,968 | | | | 1,500 | |
| Unilever PLC (EUR denominated) | | | 30,374 | | | | 1,379 | |
| Uni-Charm Corp. | | | 23,900 | | | | 800 | |
| Heineken NV | | | 5,989 | | | | 546 | |
| Shiseido Company, Ltd. | | | 11,200 | | | | 450 | |
| Diageo PLC | | | 9,646 | | | | 415 | |
| X5 Retail Group NV (GDR)3,4 | | | 88,147 | | | | — | 6 |
| | | | | | | | 217,659 | |
| | | | | | | | | |
| Communication services 4.86% | | | | | | | | |
| Alphabet, Inc., Class C1 | | | 16,377 | | | | 35,824 | |
| Alphabet, Inc., Class A1 | | | 3,933 | | | | 8,571 | |
| Tencent Holdings, Ltd. | | | 389,500 | | | | 17,592 | |
| Meta Platforms, Inc., Class A1 | | | 101,985 | | | | 16,445 | |
| América Móvil, SAB de CV, Series L (ADR) | | | 709,818 | | | | 14,501 | |
| Bharti Airtel, Ltd.1 | | | 1,599,162 | | | | 13,870 | |
| Bharti Airtel, Ltd., interim shares1 | | | 80,154 | | | | 307 | |
| Sea, Ltd., Class A (ADR)1 | | | 161,435 | | | | 10,793 | |
| Vodafone Group PLC | | | 5,163,100 | | | | 7,961 | |
| NetEase, Inc. | | | 176,100 | | | | 3,234 | |
| NetEase, Inc. (ADR) | | | 27,722 | | | | 2,588 | |
| Activision Blizzard, Inc. | | | 70,185 | | | | 5,465 | |
| Netflix, Inc.1 | | | 28,356 | | | | 4,959 | |
| Indus Towers, Ltd. | | | 1,750,611 | | | | 4,635 | |
| Telefónica, SA, non-registered shares1 | | | 411,518 | | | | 2,097 | |
| MTN Group, Ltd. | | | 250,294 | | | | 2,031 | |
| JCDecaux SA1 | | | 116,458 | | | | 1,956 | |
| Informa PLC1 | | | 261,509 | | | | 1,683 | |
| SoftBank Group Corp. | | | 13,700 | | | | 529 | |
| Yandex NV, Class A1,3,4 | | | 378,730 | | | | — | 6 |
| | | | | | | | 155,041 | |
| | | | | | | | | |
| Energy 4.31% | | | | | | | | |
| Reliance Industries, Ltd.1 | | | 2,050,136 | | | | 67,383 | |
| New Fortress Energy, Inc., Class A | | | 360,837 | | | | 14,278 | |
| BP PLC | | | 2,081,862 | | | | 9,840 | |
| Baker Hughes Co., Class A | | | 267,116 | | | | 7,712 | |
| Cheniere Energy, Inc. | | | 56,794 | | | | 7,555 | |
| Aker BP ASA2 | | | 92,604 | | | | 3,217 | |
| Aker BP ASA (SDR)3 | | | 72,417 | | | | 2,515 | |
| | |
| 58 | American Funds Insurance Series |
New World Fund (continued)
| Common stocks (continued) | | Shares | | | Value
(000) | |
| Energy (continued) | | | | | | | | |
| Exxon Mobil Corp. | | | 56,855 | | | $ | 4,869 | |
| Hess Corp. | | | 43,633 | | | | 4,622 | |
| TotalEnergies SE | | | 83,475 | | | | 4,406 | |
| Chevron Corp. | | | 25,503 | | | | 3,692 | |
| Shell PLC (GBP denominated) | | | 134,028 | | | | 3,482 | |
| INPEX Corp.2 | | | 195,000 | | | | 2,113 | |
| TechnipFMC PLC1 | | | 180,463 | | | | 1,215 | |
| Petróleo Brasileiro SA (Petrobras), ordinary nominative shares (ADR) | | | 32,841 | | | | 384 | |
| Orron Energy AB | | | 36,490 | | | | 25 | |
| Gazprom PJSC (ADR)3,4 | | | 472,929 | | | | — | 6 |
| Rosneft Oil Company PJSC (GDR)3,4 | | | 588,661 | | | | — | 6 |
| | | | | | | | 137,308 | |
| | | | | | | | | |
| Real estate 1.68% | | | | | | | | |
| Macrotech Developers, Ltd.1 | | | 833,489 | | | | 11,282 | |
| American Tower Corp. REIT | | | 41,814 | | | | 10,687 | |
| ESR Group, Ltd.1 | | | 2,773,600 | | | | 7,494 | |
| CK Asset Holdings, Ltd. | | | 960,000 | | | | 6,790 | |
| BR Malls Participacoes SA, ordinary nominative shares | | | 3,938,172 | | | | 5,659 | |
| Country Garden Services Holdings Co., Ltd. | | | 666,000 | | | | 2,966 | |
| China Overseas Land & Investment, Ltd. | | | 915,500 | | | | 2,894 | |
| Shimao Services Holdings, Ltd.1 | | | 5,605,187 | | | | 2,700 | |
| CTP NV | | | 198,078 | | | | 2,283 | |
| China Vanke Co., Ltd., Class H | | | 280,300 | | | | 705 | |
| | | | | | | | 53,460 | |
| | | | | | | | | |
| Utilities 1.55% | | | | | | | | |
| ENN Energy Holdings, Ltd. | | | 1,778,100 | | | | 29,209 | |
| AES Corp. | | | 460,707 | | | | 9,680 | |
| Engie SA | | | 448,515 | | | | 5,154 | |
| Power Grid Corporation of India, Ltd. | | | 1,119,742 | | | | 3,005 | |
| Enel SpA | | | 329,104 | | | | 1,800 | |
| China Resources Gas Group, Ltd. | | | 100,000 | | | | 466 | |
| China Gas Holdings, Ltd. | | | 67,400 | | | | 104 | |
| | | | | | | | 49,418 | |
| | | | | | | | | |
| Total common stocks (cost: $2,290,258,000) | | | | | | | 2,732,686 | |
| | | | | | | | | |
| Preferred securities 0.94% | | | | | | | | |
| Consumer discretionary 0.29% | | | | | | | | |
| Getir BV, Series D, preferred shares1,3,4,5 | | | 7,768 | | | | 4,996 | |
| Porsche Automobil Holding SE, nonvoting preferred shares | | | 63,178 | | | | 4,179 | |
| | | | | | | | 9,175 | |
| | | | | | | | | |
| Materials 0.24% | | | | | | | | |
| Gerdau SA, preferred nominative shares | | | 1,782,592 | | | | 7,613 | |
| | | | | | | | | |
| Real estate 0.19% | | | | | | | | |
| QuintoAndar, Ltd., Series E, preferred shares1,3,4,5 | | | 32,657 | | | | 4,925 | |
| QuintoAndar, Ltd., Series E-1, preferred shares1,3,4,5 | | | 8,400 | | | | 1,267 | |
| | | | | | | | 6,192 | |
| | | | | | | | | |
| Industrials 0.08% | | | | | | | | |
| GOL Linhas Aéreas Inteligentes SA, preferred nominative shares1 | | | 1,385,809 | | | | 2,402 | |
| GOL Linhas Aéreas Inteligentes SA, preferred nominative shares (ADR)1,2 | | | 65,296 | | | | 222 | |
| | | | | | | | 2,624 | |
| | | | | | | | | |
| Health care 0.07% | | | | | | | | |
| Grifols, SA, Class B, nonvoting non-registered preferred shares1 | | | 179,075 | | | | 2,117 | |
| | |
| American Funds Insurance Series | 59 |
New World Fund (continued)
| Preferred securities (continued) | | Shares | | | Value
(000) | |
| Financials 0.04% | | | | | | | | |
| Itaú Unibanco Holding SA, preferred nominative (ADR) | | | 151,962 | | | $ | 650 | |
| Itaú Unibanco Holding SA, preferred nominative shares | | | 113,600 | | | | 492 | |
| | | | | | | | 1,142 | |
| | | | | | | | | |
| Energy 0.03% | | | | | | | | |
| Petróleo Brasileiro SA (Petrobras), preferred nominative shares | | | 168,756 | | | | 901 | |
| | | | | | | | | |
| Information technology 0.00% | | | | | | | | |
| Canva, Inc., Series A, noncumulative preferred shares1,3,4,5 | | | 34 | | | | 52 | |
| Canva, Inc., Series A-3, noncumulative preferred shares1,3,4,5 | | | 1 | | | | 1 | |
| | | | | | | | 53 | |
| | | | | | | | | |
| Total preferred securities (cost: $29,021,000) | | | | | | | 29,817 | |
| | | | | | | | | |
| Rights & warrants 0.02% | | | | | | | | |
| Materials 0.02% | | | | | | | | |
| Shandong Sinocera Functional Material Co., Ltd., Class A, warrants, expire 20221,3,7 | | | 124,600 | | | | 668 | |
| | | | | | | | | |
| Consumer discretionary 0.00% | | | | | | | | |
| Compagnie Financière Richemont SA, Class A, warrants, expire 20231 | | | 105,741 | | | | 58 | |
| | | | | | | | | |
| Total rights & warrants (cost: $837,000) | | | | | | | 726 | |
| | | | | | | | | |
| Bonds, notes & other debt instruments 3.25% | | Principal amount
(000) | | | | | |
| Bonds & notes of governments & government agencies outside the U.S. 2.72% | | | | | | | | |
| Abu Dhabi (Emirate of) 2.50% 20297 | | USD | 1,000 | | | | 920 | |
| Abu Dhabi (Emirate of) 1.70% 20317 | | | 885 | | | | 745 | |
| Angola (Republic of) 8.25% 2028 | | | 500 | | | | 417 | |
| Angola (Republic of) 8.00% 20297 | | | 1,800 | | | | 1,430 | |
| Angola (Republic of) 8.75% 20327 | | | 480 | | | | 385 | |
| Argentine Republic 1.00% 2029 | | | 100 | | | | 23 | |
| Argentine Republic 0.50% 2030 (0.75% on 7/9/2023)8 | | | 5,341 | | | | 1,267 | |
| Argentine Republic 1.125% 2035 (1.50% on 7/9/2022)8 | | | 4,190 | | | | 908 | |
| Argentine Republic 2.00% 2038 (3.875% on 7/9/2022)8 | | | 1,318 | | | | 377 | |
| Argentine Republic 2.50% 2041 (3.50% on 7/9/2022)8 | | | 10,200 | | | | 2,751 | |
| Armenia (Republic of) 7.15% 2025 | | | 290 | | | | 287 | |
| Bahrain (Kingdom of) 6.75% 20297 | | | 500 | | | | 480 | |
| Belarus (Republic of) 6.875% 2023 | | | 915 | | | | 174 | |
| Belarus (Republic of) 5.875% 2026 | | | 230 | | | | 38 | |
| Belarus (Republic of) 7.625% 2027 | | | 335 | | | | 55 | |
| Brazil (Federative Republic of) 6.00% 20279 | | BRL | 21,131 | | | | 4,107 | |
| Brazil (Federative Republic of) 10.00% 2027 | | | 19,869 | | | | 3,450 | |
| Chile (Republic of) 3.10% 2041 | | USD | 375 | | | | 286 | |
| Chile (Republic of) 4.34% 2042 | | | 645 | | | | 575 | |
| China (People’s Republic of), Series INBK, 2.89% 2031 | | CNY | 36,200 | | | | 5,417 | |
| China (People’s Republic of), Series INBK, 3.72% 2051 | | | 34,650 | | | | 5,526 | |
| Colombia (Republic of) 4.50% 2026 | | USD | 280 | | | | 263 | |
| Colombia (Republic of) 3.00% 2030 | | | 213 | | | | 162 | |
| Colombia (Republic of) 3.25% 2032 | | | 700 | | | | 508 | |
| Colombia (Republic of) 7.375% 2037 | | | 1,090 | | | | 1,011 | |
| Colombia (Republic of) 5.625% 2044 | | | 320 | | | | 231 | |
| Colombia (Republic of) 5.00% 2045 | | | 348 | | | | 234 | |
| Colombia (Republic of) 5.20% 2049 | | | 555 | | | | 378 | |
| Colombia (Republic of) 4.125% 2051 | | | 350 | | | | 211 | |
| Cote d’Ivoire (Republic of) 4.875% 2032 | | EUR | 150 | | | | 114 | |
| Dominican Republic 6.875% 2026 | | USD | 370 | | | | 378 | |
| | |
| 60 | American Funds Insurance Series |
New World Fund (continued)
| Bonds, notes & other debt instruments (continued) | | Principal amount
(000) | | | Value
(000) | |
| Bonds & notes of governments & government agencies outside the U.S. (continued) | | |
| Dominican Republic 8.625% 20277 | | USD | 575 | | | $ | 599 | |
| Dominican Republic 5.50% 20297 | | | 275 | | | | 240 | |
| Dominican Republic 11.375% 2029 | | DOP | 12,800 | | | | 234 | |
| Dominican Republic 6.00% 20337 | | USD | 150 | | | | 125 | |
| Dominican Republic 7.45% 2044 | | | 1,400 | | | | 1,200 | |
| Dominican Republic 7.45% 20447 | | | 1,125 | | | | 964 | |
| Dominican Republic 6.85% 2045 | | | 320 | | | | 254 | |
| Dominican Republic 5.875% 20607 | | | 280 | | | | 192 | |
| Egypt (Arab Republic of) 5.75% 20247 | | | 450 | | | | 403 | |
| Egypt (Arab Republic of) 5.625% 2030 | | EUR | 260 | | | | 170 | |
| Egypt (Arab Republic of) 5.875% 20317 | | USD | 365 | | | | 228 | |
| Egypt (Arab Republic of) 6.375% 2031 | | EUR | 350 | | | | 232 | |
| Egypt (Arab Republic of) 7.625% 20327 | | USD | 1,140 | | | | 750 | |
| Egypt (Arab Republic of) 7.625% 2032 | | | 275 | | | | 181 | |
| Egypt (Arab Republic of) 8.50% 2047 | | | 1,200 | | | | 715 | |
| Egypt (Arab Republic of) 8.875% 2050 | | | 850 | | | | 519 | |
| Egypt (Arab Republic of) 8.75% 2051 | | | 755 | | | | 457 | |
| Egypt (Arab Republic of) 8.15% 20597 | | | 500 | | | | 291 | |
| Ethiopia (Federal Democratic Republic of) 6.625% 2024 | | | 1,830 | | | | 1,047 | |
| Export-Import Bank of India 3.25% 2030 | | | 1,180 | | | | 1,028 | |
| Gabonese Republic 6.95% 2025 | | | 540 | | | | 475 | |
| Gabonese Republic 7.00% 2031 | | | 520 | | | | 381 | |
| Ghana (Republic of) 6.375% 2027 | | | 485 | | | | 279 | |
| Ghana (Republic of) 7.875% 2027 | | | 200 | | | | 117 | |
| Ghana (Republic of) 7.625% 2029 | | | 460 | | | | 227 | |
| Ghana (Republic of) 7.75% 20297 | | | 1,125 | | | | 565 | |
| Ghana (Republic of) 8.125% 2032 | | | 2,130 | | | | 1,037 | |
| Honduras (Republic of) 6.25% 2027 | | | 1,365 | | | | 1,074 | |
| Honduras (Republic of) 5.625% 2030 | | | 678 | | | | 460 | |
| Honduras (Republic of) 5.625% 20307 | | | 281 | | | | 191 | |
| Indonesia (Republic of) 6.625% 2037 | | | 500 | | | | 550 | |
| Indonesia (Republic of) 5.25% 2042 | | | 840 | | | | 824 | |
| Iraq (Republic of) 6.752% 2023 | | | 960 | | | | 940 | |
| Jordan (Hashemite Kingdom of) 5.75% 20277 | | | 800 | | | | 705 | |
| Kazakhstan (Republic of) 6.50% 20457 | | | 800 | | | | 806 | |
| Kenya (Republic of) 7.25% 2028 | | | 200 | | | | 145 | |
| Kenya (Republic of) 8.25% 20487 | | | 1,800 | | | | 1,112 | |
| Mozambique (Republic of) 5.00% 2031 (9.00% on 9/15/2023)8 | | | 880 | | | | 640 | |
| Oman (Sultanate of) 4.875% 20257 | | | 565 | | | | 554 | |
| Oman (Sultanate of) 5.375% 2027 | | | 750 | | | | 731 | |
| Oman (Sultanate of) 6.25% 20317 | | | 890 | | | | 862 | |
| Pakistan (Islamic Republic of) 5.625% 2022 | | | 850 | | | | 799 | |
| Pakistan (Islamic Republic of) 8.25% 20257 | | | 410 | | | | 296 | |
| Pakistan (Islamic Republic of) 6.00% 20267 | | | 380 | | | | 258 | |
| Pakistan (Islamic Republic of) 6.875% 20277 | | | 1,050 | | | | 716 | |
| Pakistan (Islamic Republic of) 7.875% 2036 | | | 200 | | | | 121 | |
| Panama (Republic of) 3.75% 20267 | | | 1,180 | | | | 1,148 | |
| Panama (Republic of) 4.50% 2047 | | | 1,155 | | | | 951 | |
| Panama (Republic of) 4.50% 2050 | | | 400 | | | | 326 | |
| Panama (Republic of) 4.30% 2053 | | | 400 | | | | 315 | |
| Panama (Republic of) 4.50% 2063 | | | 200 | | | | 154 | |
| Paraguay (Republic of) 4.70% 20277 | | | 400 | | | | 385 | |
| Paraguay (Republic of) 4.95% 2031 | | | 320 | | | | 297 | |
| Peru (Republic of) 3.00% 2034 | | | 425 | | | | 350 | |
| Peru (Republic of) 6.55% 2037 | | | 1,070 | | | | 1,163 | |
| Peru (Republic of) 3.55% 2051 | | | 370 | | | | 277 | |
| Peru (Republic of) 2.78% 2060 | | | 365 | | | | 227 | |
| PETRONAS Capital, Ltd. 4.55% 20507 | | | 400 | | | | 383 | |
| Philippines (Republic of) 1.648% 2031 | | | 580 | | | | 467 | |
| Philippines (Republic of) 6.375% 2034 | | | 820 | | | | 923 | |
| Philippines (Republic of) 3.95% 2040 | | | 900 | | | | 785 | |
| | |
| American Funds Insurance Series | 61 |
New World Fund (continued)
| Bonds, notes & other debt instruments (continued) | | Principal amount
(000) | | | Value
(000) | |
| Bonds & notes of governments & government agencies outside the U.S. (continued) | | | | | |
| Philippines (Republic of) 3.70% 2041 | | USD | 505 | | | $ | 421 | |
| Philippines (Republic of) 2.95% 2045 | | | 790 | | | | 569 | |
| PT Indonesia Asahan Aluminium Tbk 6.757% 2048 | | | 200 | | | | 181 | |
| Qatar (State of) 4.50% 20287 | | | 2,000 | | | | 2,075 | |
| Qatar (State of) 4.50% 2028 | | | 600 | | | | 622 | |
| Romania 2.00% 2032 | | EUR | 1,375 | | | | 987 | |
| Romania 2.00% 2033 | | | 300 | | | | 205 | |
| Romania 5.125% 20487 | | USD | 500 | | | | 390 | |
| Russian Federation 4.25% 202710 | | | 1,000 | | | | 275 | |
| Russian Federation 4.375% 20297 | | | 800 | | | | 188 | |
| Russian Federation 5.10% 2035 | | | 1,600 | | | | 381 | |
| Russian Federation 5.25% 20473,10 | | | 1,200 | | | | 342 | |
| Senegal (Republic of) 4.75% 2028 | | EUR | 950 | | | | 811 | |
| South Africa (Republic of) 5.875% 2030 | | USD | 1,500 | | | | 1,357 | |
| South Africa (Republic of) 5.875% 2032 | | | 400 | | | | 342 | |
| Sri Lanka (Democratic Socialist Republic of) 6.125% 202510 | | | 450 | | | | 150 | |
| Sri Lanka (Democratic Socialist Republic of) 6.85% 202510 | | | 1,904 | | | | 628 | |
| Sri Lanka (Democratic Socialist Republic of) 6.825% 2026 | | | 1,270 | | | | 441 | |
| Sri Lanka (Democratic Socialist Republic of) 7.55% 2030 | | | 471 | | | | 153 | |
| Tunisia (Republic of) 6.75% 2023 | | EUR | 465 | | | | 340 | |
| Tunisia (Republic of) 6.75% 2023 | | | 310 | | | | 226 | |
| Tunisia (Republic of) 5.625% 2024 | | | 710 | | | | 438 | |
| Tunisia (Republic of) 5.75% 2025 | | USD | 875 | | | | 489 | |
| Turkey (Republic of) 6.375% 2025 | | | 200 | | | | 178 | |
| Turkey (Republic of) 7.625% 2029 | | | 200 | | | | 169 | |
| Turkey (Republic of) 11.875% 2030 | | | 800 | | | | 845 | |
| Turkey (Republic of) 5.875% 2031 | | | 1,170 | | | | 842 | |
| Turkey (Republic of) 4.875% 2043 | | | 400 | | | | 238 | |
| Turkey (Republic of) 5.75% 2047 | | | 2,205 | | | | 1,363 | |
| Ukraine 8.994% 2024 | | | 600 | | | | 159 | |
| Ukraine 7.75% 2027 | | | 2,328 | | | | 607 | |
| Ukraine 9.75% 2028 | | | 900 | | | | 228 | |
| Ukraine 7.375% 2032 | | | 2,180 | | | | 546 | |
| United Mexican States 4.50% 2029 | | | 300 | | | | 292 | |
| United Mexican States 4.75% 2032 | | | 870 | | | | 836 | |
| United Mexican States 4.75% 2044 | | | 1,090 | | | | 910 | |
| United Mexican States 3.75% 2071 | | | 200 | | | | 128 | |
| United Mexican States, Series M, 7.50% 2027 | | MXN | 20,360 | | | | 947 | |
| Venezuela (Bolivarian Republic of) 7.00% 201810 | | USD | 64 | | | | 5 | |
| Venezuela (Bolivarian Republic of) 7.75% 201910 | | | 1,149 | | | | 89 | |
| Venezuela (Bolivarian Republic of) 6.00% 202010 | | | 950 | | | | 74 | |
| Venezuela (Bolivarian Republic of) 12.75% 202210 | | | 85 | | | | 7 | |
| Venezuela (Bolivarian Republic of) 9.00% 202310 | | | 1,383 | | | | 118 | |
| Venezuela (Bolivarian Republic of) 8.25% 202410 | | | 299 | | | | 25 | |
| Venezuela (Bolivarian Republic of) 7.65% 202510 | | | 129 | | | | 11 | |
| Venezuela (Bolivarian Republic of) 11.75% 202610 | | | 64 | | | | 6 | |
| Venezuela (Bolivarian Republic of) 9.25% 202710 | | | 170 | | | | 15 | |
| Venezuela (Bolivarian Republic of) 9.25% 202810 | | | 319 | | | | 28 | |
| Venezuela (Bolivarian Republic of) 11.95% 203110 | | | 106 | | | | 9 | |
| Venezuela (Bolivarian Republic of) 7.00% 203810 | | | 107 | | | | 9 | |
| | | | | | | | 86,648 | |
| | | | | | | | | |
| Corporate bonds, notes & loans 0.45% | | | | | | | | |
| Energy 0.15% | | | | | | | | |
| Oleoducto Central SA 4.00% 20277 | | | 255 | | | | 213 | |
| Petrobras Global Finance Co. 6.85% 2115 | | | 314 | | | | 259 | |
| Petróleos Mexicanos 6.875% 2026 | | | 1,025 | | | | 926 | |
| Petróleos Mexicanos 6.49% 2027 | | | 2,020 | | | | 1,754 | |
| Petróleos Mexicanos 8.75% 20297 | | | 755 | | | | 685 | |
| | |
| 62 | American Funds Insurance Series |
New World Fund (continued)
| Bonds, notes & other debt instruments (continued) | | Principal amount
(000) | | | Value
(000) | |
| Corporate bonds, notes & loans (continued) | | | | | | | | |
| Energy (continued) | | | | | | | | |
| Petróleos Mexicanos 6.70% 2032 | | USD | 622 | | | $ | 475 | |
| Petrorio Luxembourg SARL 6.125% 2026 | | | 200 | | | | 184 | |
| Sinopec Group Overseas Development (2018), Ltd. 3.10% 20517 | | | 630 | | | | 450 | |
| | | | | | | | 4,946 | |
| | | | | | | | | |
| Financials 0.10% | | | | | | | | |
| Bangkok Bank PCL 3.733% 2034 (5-year UST Yield Curve Rate T Note Constant Maturity + 1.90% on 9/25/2029)8 | | | 1,140 | | | | 1,000 | |
| China Construction Bank Corp. 2.85% 2032 (5-year UST Yield Curve Rate T Note Constant Maturity + 1.40% on 1/21/2027)8 | | | 830 | | | | 777 | |
| HDFC Bank, Ltd. 3.70% junior subordinated perpetual bonds (5-Year UST Yield Curve Rate T Note Constant Maturity + 2.925% on 2/25/2027)7,8 | | | 600 | | | | 499 | |
| Power Financial Corp., Ltd. 6.15% 2028 | | | 432 | | | | 450 | |
| Power Financial Corp., Ltd. 4.50% 2029 | | | 273 | | | | 255 | |
| Power Financial Corp., Ltd. 3.35% 2031 | | | 310 | | | | 258 | |
| | | | | | | | 3,239 | |
| | | | | | | | | |
| Materials 0.06% | | | | | | | | |
| Braskem Idesa SAPI 7.45% 2029 | | | 775 | | | | 666 | |
| Braskem Idesa SAPI 7.45% 20297 | | | 300 | | | | 258 | |
| CSN Resources SA 7.625% 2026 | | | 224 | | | | 227 | |
| GC Treasury Center Co., Ltd. 4.40% 20327 | | | 230 | | | | 212 | |
| Sasol Financing USA, LLC 5.875% 2024 | | | 500 | | | | 490 | |
| | | | | | | | 1,853 | |
| | | | | | | | | |
| Consumer discretionary 0.05% | | | | | | | | |
| Alibaba Group Holding, Ltd. 4.20% 2047 | | | 600 | | | | 498 | |
| Alibaba Group Holding, Ltd. 3.15% 2051 | | | 410 | | | | 281 | |
| Meituan Dianping 3.05% 20307 | | | 800 | | | | 596 | |
| Sands China, Ltd. 4.375% 2030 | | | 220 | | | | 161 | |
| | | | | | | | 1,536 | |
| | | | | | | | | |
| Communication services 0.04% | | | | | | | | |
| Axiata SPV5 Labuan, Ltd. 3.064% 2050 | | | 357 | | | | 257 | |
| PLDT, Inc. 2.50% 2031 | | | 210 | | | | 176 | |
| Tencent Holdings, Ltd. 3.975% 2029 | | | 400 | | | | 379 | |
| Tencent Holdings, Ltd. 3.24% 20507 | | | 580 | | | | 401 | |
| | | | | | | | 1,213 | |
| | | | | | | | | |
| Utilities 0.03% | | | | | | | | |
| AES Panama Generation Holdings SRL 4.375% 20307 | | | 280 | | | | 240 | |
| Empresas Publicas de Medellin ESP 4.25% 20297 | | | 412 | | | | 322 | |
| Empresas Publicas de Medellin ESP 4.375% 20317 | | | 360 | | | | 276 | |
| | | | | | | | 838 | |
| | | | | | | | | |
| Industrials 0.01% | | | | | | | | |
| Mexico City Airport Trust 4.25% 2026 | | | 475 | | | | 438 | |
| | | | | | | | | |
| Consumer staples 0.01% | | | | | | | | |
| Marfrig Global Foods SA 3.95% 2031 | | | 320 | | | | 246 | |
| | | | | | | | | |
| Total corporate bonds, notes & loans | | | | | | | 14,309 | |
| | | | | | | | | |
| U.S. Treasury bonds & notes 0.08% | | | | | | | | |
| U.S. Treasury 0.08% | | | | | | | | |
| U.S. Treasury (3-month U.S. Treasury Bill Yield - 0.015%) 1.662% 202411,12 | | | 2,730 | | | | 2,731 | |
| | | | | | | | | |
| Total bonds, notes & other debt instruments (cost: $137,365,000) | | | | | | | 103,688 | |
| | |
| American Funds Insurance Series | 63 |
New World Fund (continued)
| Short-term securities 10.15% | | Shares | | | Value
(000) | |
| Money market investments 9.91% | | | | | | | | |
| Capital Group Central Cash Fund 1.38%13,14 | | | 3,161,065 | | | $ | 316,043 | |
| | | | | | | | | |
| Money market investments purchased with collateral from securities on loan 0.24% | | | | | | | | |
| Capital Group Central Cash Fund 1.38%13,14,15 | | | 21,446 | | | | 2,145 | |
| Goldman Sachs Financial Square Government Fund, Institutional Shares 1.39%13,15 | | | 1,132,122 | | | | 1,132 | |
| BlackRock Liquidity Funds – FedFund, Institutional Shares 1.32%13,15 | | | 1,072,108 | | | | 1,072 | |
| Invesco Short-Term Investments Trust – Government & Agency Portfolio, Institutional Class 1.38%13,15 | | | 1,072,108 | | | | 1,072 | |
| Morgan Stanley Institutional Liquidity Funds – Government Portfolio, Institutional Class 1.38%13,15 | | | 1,072,108 | | | | 1,072 | |
| State Street Institutional U.S. Government Money Market Fund, Institutional Class 1.40%13,15 | | | 1,072,108 | | | | 1,072 | |
| | | | | | | | 7,565 | |
| | | | | | | | | |
| Total short-term securities (cost: $323,653,000) | | | | | | | 323,608 | |
| Total investment securities 100.05% (cost: $2,781,134,000) | | | | | | | 3,190,525 | |
| Other assets less liabilities (0.05)% | | | | | | | (1,526 | ) |
| | | | | | | | | |
| Net assets 100.00% | | | | | | $ | 3,188,999 | |
Futures contracts
| Contracts | | Type | | Number of
contracts | | Expiration | | | Notional
amount
(000) | | Value and
unrealized
appreciation
(depreciation)
at 6/30/2022
(000) | |
| 5 Year U.S. Treasury Note Futures | | Short | | 111 | | September 2022 | | | USD(12,460 | ) | | $ | 97 | |
| 10 Year Euro-Bund Futures | | Short | | 11 | | September 2022 | | | (1,715 | ) | | | (12 | ) |
| 10 Year U.S. Treasury Note Futures | | Short | | 4 | | September 2022 | | | (474 | ) | | | (3 | ) |
| 10 Year Ultra U.S. Treasury Note Futures | | Short | | 33 | | September 2022 | | | (4,203 | ) | | | 63 | |
| 30 Year Ultra U.S. Treasury Bond Futures | | Long | | 44 | | September 2022 | | | 6,791 | | | | (103 | ) |
| | | | | | | | | | | | | $ | 42 | |
Forward currency contracts
| Contract amount | | | | | | | Unrealized
appreciation
(depreciation) | |
Currency purchased
(000) | | | Currency sold
(000) | | | Counterparty | | Settlement
date | | at 6/30/2022
(000) | |
| | USD 1,797 | | | | EUR 1,680 | | | Standard Chartered Bank | | 7/11/2022 | | | $ | 35 | |
| | USD 1,111 | | | | EUR 1,054 | | | UBS AG | | 7/27/2022 | | | | 5 | |
| | USD 429 | | | | EUR 410 | | | Citibank | | 7/27/2022 | | | | (1 | ) |
| | | | | | | | | | | | | | $ | 39 | |
| | |
| 64 | American Funds Insurance Series |
New World Fund (continued)
Investments in affiliates14
| | | Value of
affiliates at
1/1/2022
(000) | | | Additions
(000) | | | Reductions
(000) | | | Net
realized
loss
(000) | | | Net
unrealized
depreciation
(000) | | | Value of
affiliates at
6/30/2022
(000) | | | Dividend
income
(000) | |
| Short-term securities 9.98% | | | | | | | | | | | | | | | | | | | | | | | | | | | | |
| Money market investments 9.91% | | | | | | | | | | | | | | | | | | | | | | | | | | | | |
| Capital Group Central Cash Fund 1.38%13 | | $ | 216,764 | | | $ | 518,042 | | | $ | 418,693 | | | $ | (9 | ) | | $ | (61 | ) | | $ | 316,043 | | | $ | 640 | |
| Money market investments purchased with collateral from securities on loan 0.07% | | | | | | | | | | | | | | | | | | | | | | | | | | | | |
| Capital Group Central Cash Fund 1.38%13,15 | | | 4,255 | | | | | | | | 2,110 | 16 | | | | | | | | | | | 2,145 | | | | — | 17 |
| Total short-term securities | | | | | | | | | | | | | | | | | | | | | | | 318,188 | | | | | |
| Total 9.98% | | | | | | | | | | | | | | $ | (9 | ) | | $ | (61 | ) | | $ | 318,188 | | | $ | 640 | |
Private placement securities5
| | | Acquisition
date(s) | | | Cost
(000) | | | Value
(000) | | | Percent
of net
assets | |
| QuintoAndar, Ltd., Series E, preferred shares | | 5/26/2021 | | | $ | 5,258 | | | $ | 4,925 | | | | .15 | % |
| QuintoAndar, Ltd., Series E-1, preferred shares | | 12/20/2021 | | | | 1,716 | | | | 1,267 | | | | .04 | |
| Getir BV, Series D, preferred shares | | 5/27/2021 | | | | 3,500 | | | | 4,996 | | | | .16 | |
| Canva, Inc. | | 8/26/2021-11/4/2021 | | | | 656 | | | | 588 | | | | .02 | |
| Canva, Inc., Series A, noncumulative preferred shares | | 11/4/2021 | | | | 58 | | | | 52 | | | | .00 | |
| Canva, Inc., Series A-3, noncumulative preferred shares | | 11/4/2021 | | | | 2 | | | | 1 | | | | .00 | |
| Total | | | | | $ | 11,190 | | | $ | 11,829 | | | | .37 | % |
| | |
| 1 | Security did not produce income during the last 12 months. |
| 2 | All or a portion of this security was on loan. The total value of all such securities was $14,516,000, which represented .46% of the net assets of the fund. Refer to Note 5 for more information on securities lending. |
| 3 | Valued under fair value procedures adopted by authority of the board of trustees. The total value of all such securities was $15,354,000, which represented .48% of the net assets of the fund. |
| 4 | Value determined using significant unobservable inputs. |
| 5 | Acquired through a private placement transaction exempt from registration under the Securities Act of 1933. May be subject to legal or contractual restrictions on resale. |
| 6 | Amount less than one thousand. |
| 7 | Acquired in a transaction exempt from registration under Rule 144A of the Securities Act of 1933. May be resold in the U.S. in transactions exempt from registration, normally to qualified institutional buyers. The total value of all such securities was $23,206,000, which represented .73% of the net assets of the fund. |
| 8 | Step bond; coupon rate may change at a later date. |
| 9 | Index-linked bond whose principal amount moves with a government price index. |
| 10 | Scheduled interest and/or principal payment was not received. |
| 11 | All or a portion of this security was pledged as collateral. The total value of pledged collateral was $56,000, which represented less than .01% of the net assets of the fund. |
| 12 | Coupon rate may change periodically. Reference rate and spread are as of the most recent information available. Some coupon rates are determined by the issuer or agent based on current market conditions; therefore, the reference rate and spread are not available. |
| 13 | Rate represents the seven-day yield at 6/30/2022. |
| 14 | Part of the same “group of investment companies” as the fund as defined under the Investment Company Act of 1940, as amended. |
| 15 | Security purchased with cash collateral from securities on loan. Refer to Note 5 for more information on securities lending. |
| 16 | Represents net activity. Refer to Note 5 for more information on securities lending. |
| 17 | Dividend income is included with securities lending income in the fund’s statement of operations and is not shown in this table. |
| | |
| American Funds Insurance Series | 65 |
New World Fund (continued)
Key to abbreviations
ADR = American Depositary Receipts
BRL = Brazilian reais
CDI = CREST Depository Interest
CNY = Chinese yuan
DOP = Dominican pesos
EUR = Euros
GBP = British pounds
GDR = Global Depositary Receipts
MXN = Mexican pesos
REIT = Real Estate Investment Trust
SDR = Swedish Depositary Receipts
USD = U.S. dollars
Refer to the notes to financial statements.
| 66 | American Funds Insurance Series |
Washington Mutual Investors Fund
| Investment portfolio June 30, 2022 | unaudited |
| Common stocks 95.01% | | Shares | | | Value
(000) | |
| Health care 21.46% | | | | | | | | |
| UnitedHealth Group, Inc. | | | 796,858 | | | $ | 409,290 | |
| Pfizer, Inc. | | | 4,842,021 | | | | 253,867 | |
| CVS Health Corp. | | | 2,048,877 | | | | 189,849 | |
| Johnson & Johnson | | | 1,035,170 | | | | 183,753 | |
| Eli Lilly and Company | | | 384,935 | | | | 124,808 | |
| AbbVie, Inc. | | | 733,883 | | | | 112,402 | |
| Humana, Inc. | | | 215,320 | | | | 100,785 | |
| AstraZeneca PLC (ADR) | | | 1,430,241 | | | | 94,496 | |
| Elevance Health, Inc. | | | 156,459 | | | | 75,504 | |
| Abbott Laboratories | | | 661,606 | | | | 71,884 | |
| Cigna Corp. | | | 246,335 | | | | 64,914 | |
| Gilead Sciences, Inc. | | | 1,033,081 | | | | 63,855 | |
| Danaher Corp. | | | 202,837 | | | | 51,423 | |
| Bristol-Myers Squibb Company | | | 534,888 | | | | 41,187 | |
| GSK PLC (ADR)1 | | | 620,748 | | | | 27,021 | |
| Thermo Fisher Scientific, Inc. | | | 39,089 | | | | 21,236 | |
| Zimmer Biomet Holdings, Inc. | | | 179,120 | | | | 18,818 | |
| Regeneron Pharmaceuticals, Inc.2 | | | 26,592 | | | | 15,719 | |
| Novo Nordisk A/S, Class B (ADR) | | | 136,927 | | | | 15,258 | |
| Roche Holding AG (ADR) | | | 332,061 | | | | 13,850 | |
| Molina Healthcare, Inc.2 | | | 38,989 | | | | 10,902 | |
| Zoetis, Inc., Class A | | | 50,277 | | | | 8,642 | |
| Edwards Lifesciences Corp.2 | | | 85,300 | | | | 8,111 | |
| Baxter International, Inc. | | | 114,187 | | | | 7,334 | |
| ResMed, Inc. | | | 27,020 | | | | 5,664 | |
| Novartis AG (ADR) | | | 54,811 | | | | 4,633 | |
| | | | | | | | 1,995,205 | |
| | | | | | | | | |
| Information technology 17.49% | | | | | | | | |
| Broadcom, Inc. | | | 995,400 | | | | 483,575 | |
| Microsoft Corp. | | | 1,863,466 | | | | 478,594 | |
| Intel Corp. | | | 3,020,637 | | | | 113,002 | |
| Apple, Inc. | | | 790,361 | | | | 108,058 | |
| ASML Holding NV (New York registered) (ADR) | | | 136,017 | | | | 64,728 | |
| Fidelity National Information Services, Inc. | | | 695,919 | | | | 63,795 | |
| Visa, Inc., Class A | | | 260,973 | | | | 51,383 | |
| Automatic Data Processing, Inc. | | | 141,598 | | | | 29,741 | |
| KLA Corp. | | | 92,945 | | | | 29,657 | |
| Mastercard, Inc., Class A | | | 92,154 | | | | 29,073 | |
| Paychex, Inc. | | | 227,131 | | | | 25,863 | |
| Applied Materials, Inc. | | | 266,611 | | | | 24,256 | |
| SAP SE (ADR) | | | 253,285 | | | | 22,978 | |
| NetApp, Inc. | | | 291,087 | | | | 18,991 | |
| TE Connectivity, Ltd. | | | 165,716 | | | | 18,751 | |
| Motorola Solutions, Inc. | | | 89,048 | | | | 18,664 | |
| Texas Instruments, Inc. | | | 108,222 | | | | 16,628 | |
| QUALCOMM, Inc. | | | 85,889 | | | | 10,972 | |
| Analog Devices, Inc. | | | 51,759 | | | | 7,562 | |
| EPAM Systems, Inc.2 | | | 20,114 | | | | 5,929 | |
| Micron Technology, Inc. | | | 81,603 | | | | 4,511 | |
| | | | | | | | 1,626,711 | |
| | | | | | | | | |
| Financials 15.09% | | | | | | | | |
| Marsh & McLennan Companies, Inc. | | | 1,348,096 | | | | 209,292 | |
| CME Group, Inc., Class A | | | 938,805 | | | | 192,173 | |
| BlackRock, Inc. | | | 172,499 | | | | 105,059 | |
| Chubb, Ltd. | | | 482,363 | | | | 94,823 | |
| JPMorgan Chase & Co. | | | 800,597 | | | | 90,155 | |
| PNC Financial Services Group, Inc. | | | 424,034 | | | | 66,900 | |
| Discover Financial Services | | | 653,082 | | | | 61,769 | |
| Wells Fargo & Company | | | 1,358,294 | | | | 53,204 | |
| Citizens Financial Group, Inc. | | | 1,383,929 | | | | 49,392 | |
| American Funds Insurance Series | 67 |
Washington Mutual Investors Fund (continued)
| Common stocks (continued) | | Shares | | | Value
(000) | |
| Financials (continued) | | | | | | | | |
| Capital One Financial Corp. | | | 465,273 | | | $ | 48,477 | |
| Bank of America Corp. | | | 1,398,611 | | | | 43,539 | |
| S&P Global, Inc. | | | 123,927 | | | | 41,771 | |
| Intercontinental Exchange, Inc. | | | 437,688 | | | | 41,160 | |
| Toronto-Dominion Bank | | | 613,252 | | | | 40,217 | |
| M&T Bank Corp. | | | 179,930 | | | | 28,679 | |
| Travelers Companies, Inc. | | | 149,753 | | | | 25,328 | |
| Nasdaq, Inc. | | | 156,107 | | | | 23,813 | |
| Bank of Nova Scotia1 | | | 382,643 | | | | 22,656 | |
| Apollo Asset Management, Inc. | | | 451,240 | | | | 21,876 | |
| KeyCorp | | | 1,248,831 | | | | 21,517 | |
| Aon PLC, Class A | | | 76,913 | | | | 20,742 | |
| KKR & Co., Inc. | | | 343,773 | | | | 15,913 | |
| Carlyle Group, Inc. | | | 489,328 | | | | 15,492 | |
| Truist Financial Corp. | | | 325,043 | | | | 15,417 | |
| Morgan Stanley | | | 189,430 | | | | 14,408 | |
| Fifth Third Bancorp | | | 405,156 | | | | 13,613 | |
| Moody’s Corp. | | | 34,233 | | | | 9,310 | |
| Everest Re Group, Ltd. | | | 23,395 | | | | 6,557 | |
| Arthur J. Gallagher & Co. | | | 23,039 | | | | 3,756 | |
| Charles Schwab Corp. | | | 38,738 | | | | 2,448 | |
| Progressive Corp. | | | 14,654 | | | | 1,704 | |
| Blackstone, Inc., nonvoting shares | | | 18,477 | | | | 1,686 | |
| | | | | | | | 1,402,846 | |
| | | | | | | | | |
| Industrials 10.08% | | | | | | | | |
| Northrop Grumman Corp. | | | 329,943 | | | | 157,901 | |
| Lockheed Martin Corp. | | | 273,396 | | | | 117,549 | |
| L3Harris Technologies, Inc. | | | 378,970 | | | | 91,597 | |
| CSX Corp. | | | 2,723,188 | | | | 79,136 | |
| Raytheon Technologies Corp. | | | 809,696 | | | | 77,820 | |
| Caterpillar, Inc. | | | 407,624 | | | | 72,867 | |
| United Parcel Service, Inc., Class B | | | 382,633 | | | | 69,846 | |
| Norfolk Southern Corp. | | | 272,217 | | | | 61,872 | |
| Honeywell International, Inc. | | | 309,349 | | | | 53,768 | |
| Waste Connections, Inc. | | | 213,382 | | | | 26,451 | |
| ABB, Ltd. (ADR) | | | 769,666 | | | | 20,573 | |
| Boeing Company2 | | | 107,073 | | | | 14,639 | |
| Huntington Ingalls Industries, Inc. | | | 47,307 | | | | 10,304 | |
| Republic Services, Inc. | | | 78,273 | | | | 10,244 | |
| BAE Systems PLC (ADR) | | | 223,315 | | | | 9,067 | |
| PACCAR, Inc. | | | 108,835 | | | | 8,961 | |
| HEICO Corp. | | | 59,743 | | | | 7,833 | |
| Johnson Controls International PLC | | | 161,819 | | | | 7,748 | |
| Rockwell Automation | | | 37,903 | | | | 7,554 | |
| Union Pacific Corp. | | | 35,399 | | | | 7,550 | |
| Air Lease Corp., Class A | | | 168,866 | | | | 5,645 | |
| Cummins, Inc. | | | 28,357 | | | | 5,488 | |
| RELX PLC (ADR) | | | 186,041 | | | | 5,012 | |
| Equifax, Inc. | | | 20,700 | | | | 3,784 | |
| Carrier Global Corp. | | | 75,148 | | | | 2,680 | |
| Waste Management, Inc. | | | 11,150 | | | | 1,706 | |
| | | | | | | | 937,595 | |
| | | | | | | | | |
| Communication services 6.25% | | | | | | | | |
| Comcast Corp., Class A | | | 7,060,959 | | | | 277,072 | |
| Alphabet, Inc., Class C2 | | | 41,812 | | | | 91,462 | |
| Alphabet, Inc., Class A2 | | | 22,411 | | | | 48,839 | |
| Verizon Communications, Inc. | | | 1,439,159 | | | | 73,037 | |
| Meta Platforms, Inc., Class A2 | | | 203,431 | | | | 32,803 | |
| Activision Blizzard, Inc. | | | 398,372 | | | | 31,017 | |
| 68 | American Funds Insurance Series |
Washington Mutual Investors Fund (continued)
| Common stocks (continued) | | Shares | | | Value
(000) | |
| Communication services (continued) | | | | | | | | |
| AT&T, Inc. | | | 1,021,586 | | | $ | 21,413 | |
| Electronic Arts, Inc. | | | 36,898 | | | | 4,489 | |
| Deutsche Telekom AG (ADR) | | | 46,580 | | | | 928 | |
| | | | | | | | 581,060 | |
| | | | | | | | | |
| Energy 6.13% | | | | | | | | |
| Chevron Corp. | | | 784,607 | | | | 113,595 | |
| Pioneer Natural Resources Company | | | 441,802 | | | | 98,557 | |
| Baker Hughes Co., Class A | | | 3,185,578 | | | | 91,968 | |
| EOG Resources, Inc. | | | 644,611 | | | | 71,191 | |
| ConocoPhillips | | | 655,015 | | | | 58,827 | |
| Exxon Mobil Corp. | | | 480,043 | | | | 41,111 | |
| TC Energy Corp. | | | 687,906 | | | | 35,641 | |
| Canadian Natural Resources, Ltd. | | | 428,638 | | | | 23,009 | |
| Coterra Energy, Inc. | | | 659,802 | | | | 17,016 | |
| Valero Energy Corp. | | | 96,484 | | | | 10,254 | |
| Enbridge, Inc. | | | 218,229 | | | | 9,222 | |
| | | | | | | | 570,391 | |
| | | | | | | | | |
| Consumer discretionary 6.03% | | | | | | | | |
| Home Depot, Inc. | | | 583,060 | | | | 159,916 | |
| YUM! Brands, Inc. | | | 557,887 | | | | 63,326 | |
| General Motors Company2 | | | 1,817,415 | | | | 57,721 | |
| Darden Restaurants, Inc. | | | 491,537 | | | | 55,603 | |
| VF Corp. | | | 913,081 | | | | 40,331 | |
| Dollar General Corp. | | | 105,032 | | | | 25,779 | |
| Wynn Resorts, Ltd.2 | | | 446,262 | | | | 25,428 | |
| TJX Companies, Inc. | | | 438,382 | | | | 24,484 | |
| Target Corp. | | | 165,824 | | | | 23,419 | |
| Starbucks Corp. | | | 274,185 | | | | 20,945 | |
| Amazon.com, Inc.2 | | | 123,804 | | | | 13,149 | |
| Chipotle Mexican Grill, Inc.2 | | | 9,251 | | | | 12,093 | |
| D.R. Horton, Inc. | | | 146,593 | | | | 9,703 | |
| Royal Caribbean Cruises, Ltd.2 | | | 242,395 | | | | 8,462 | |
| NIKE, Inc., Class B | | | 69,525 | | | | 7,105 | |
| McDonald’s Corp. | | | 21,948 | | | | 5,419 | |
| Polaris, Inc. | | | 52,835 | | | | 5,245 | |
| Domino’s Pizza, Inc. | | | 6,418 | | | | 2,501 | |
| | | | | | | | 560,629 | |
| | | | | | | | | |
| Consumer staples 5.51% | | | | | | | | |
| Archer Daniels Midland Company | | | 1,393,507 | | | | 108,136 | |
| Nestlé SA (ADR) | | | 576,464 | | | | 67,095 | |
| Keurig Dr Pepper, Inc. | | | 1,644,363 | | | | 58,194 | |
| Kraft Heinz Company | | | 1,101,959 | | | | 42,029 | |
| Procter & Gamble Company | | | 270,452 | | | | 38,888 | |
| Reckitt Benckiser Group PLC (ADR)1 | | | 2,220,407 | | | | 33,817 | |
| Hormel Foods Corp. | | | 601,233 | | | | 28,474 | |
| General Mills, Inc. | | | 351,211 | | | | 26,499 | |
| Costco Wholesale Corp. | | | 42,867 | | | | 20,545 | |
| Mondelez International, Inc. | | | 308,720 | | | | 19,168 | |
| Conagra Brands, Inc. | | | 424,766 | | | | 14,544 | |
| Church & Dwight Co., Inc. | | | 154,431 | | | | 14,310 | |
| Unilever PLC (ADR) | | | 283,070 | | | | 12,973 | |
| Walgreens Boots Alliance, Inc. | | | 316,943 | | | | 12,012 | |
| Kimberly-Clark Corp. | | | 59,250 | | | | 8,008 | |
| Danone (ADR) | | | 694,054 | | | | 7,732 | |
| | | | | | | | 512,424 | |
| American Funds Insurance Series | 69 |
Washington Mutual Investors Fund (continued)
| Common stocks (continued) | | Shares | | | Value
(000) | |
| Utilities 3.01% | | | | | | | | |
| Sempra Energy | | | 382,340 | | | $ | 57,454 | |
| Constellation Energy Corp. | | | 851,722 | | | | 48,770 | |
| Entergy Corp. | | | 357,514 | | | | 40,270 | |
| Exelon Corp. | | | 656,854 | | | | 29,769 | |
| Evergy, Inc. | | | 394,084 | | | | 25,714 | |
| CMS Energy Corp. | | | 357,860 | | | | 24,156 | |
| Public Service Enterprise Group, Inc. | | | 235,300 | | | | 14,890 | |
| NextEra Energy, Inc. | | | 147,221 | | | | 11,404 | |
| Edison International | | | 159,615 | | | | 10,094 | |
| Dominion Energy, Inc. | | | 124,211 | | | | 9,913 | |
| Xcel Energy, Inc. | | | 110,238 | | | | 7,800 | |
| | | | | | | | 280,234 | |
| | | | | | | | | |
| Materials 2.66% | | | | | | | | |
| Dow, Inc. | | | 826,397 | | | | 42,650 | |
| Rio Tinto PLC (ADR)1 | | | 662,958 | | | | 40,440 | |
| Linde PLC | | | 132,451 | | | | 38,084 | |
| LyondellBasell Industries NV | | | 390,543 | | | | 34,157 | |
| Corteva, Inc. | | | 428,754 | | | | 23,213 | |
| Nucor Corp. | | | 172,143 | | | | 17,973 | |
| Air Products and Chemicals, Inc. | | | 66,153 | | | | 15,909 | |
| Huntsman Corp. | | | 442,172 | | | | 12,536 | |
| Sherwin-Williams Company | | | 36,847 | | | | 8,250 | |
| Albemarle Corp. | | | 34,177 | | | | 7,142 | |
| Celanese Corp. | | | 35,401 | | | | 4,164 | |
| H.B. Fuller Co. | | | 38,637 | | | | 2,326 | |
| | | | | | | | 246,844 | |
| | | | | | | | | |
| Real estate 1.30% | | | | | | | | |
| Regency Centers Corp. REIT | | | 716,891 | | | | 42,519 | |
| Digital Realty Trust, Inc. REIT | | | 309,518 | | | | 40,185 | |
| Extra Space Storage, Inc. REIT | | | 85,573 | | | | 14,558 | |
| American Tower Corp. REIT | | | 47,490 | | | | 12,138 | |
| Boston Properties, Inc. REIT | | | 66,803 | | | | 5,944 | |
| Alexandria Real Estate Equities, Inc. REIT | | | 38,009 | | | | 5,512 | |
| | | | | | | | 120,856 | |
| | | | | | | | | |
| Total common stocks (cost: $7,598,704,000) | | | | | | | 8,834,795 | |
| | | | | | | | | |
| Convertible stocks 0.67% | | | | | | | | |
| Information technology 0.34% | | | | | | | | |
| Broadcom, Inc., Series A, cumulative convertible preferred shares, 8.00% 2022 | | | 21,152 | | | | 31,794 | |
| | | | | | | | | |
| Health care 0.21% | | | | | | | | |
| Becton, Dickinson and Company, Series B, convertible preferred shares, 6.00% 20231 | | | 197,800 | | | | 9,783 | |
| Danaher Corp., Series B, cumulative convertible preferred shares, 5.00% 20231 | | | 6,821 | | | | 9,026 | |
| | | | | | | | 18,809 | |
| | | | | | | | | |
| Utilities 0.07% | | | | | | | | |
| NextEra Energy, Inc., convertible preferred units, 5.279% 2023 | | | 73,300 | | | | 3,639 | |
| American Electric Power Company, Inc., convertible preferred units, 6.125% 2023 | | | 56,400 | | | | 3,046 | |
| | | | | | | | 6,685 | |
| | | | | | | | | |
| Financials 0.05% | | | | | | | | |
| KKR & Co., Inc., Series C, convertible preferred shares, 6.00% 2023 | | | 79,100 | | | | 4,625 | |
| | | | | | | | | |
| Total convertible stocks (cost: $64,933,000) | | | | | | | 61,913 | |
| 70 | American Funds Insurance Series |
Washington Mutual Investors Fund (continued)
| Short-term securities 4.75% | | Shares | | | Value
(000) | |
| Money market investments 4.21% | | | | | | | | |
| Capital Group Central Cash Fund 1.38%3,4 | | | 3,914,264 | | | $ | 391,348 | |
| | | | | | | | | |
| Money market investments purchased with collateral from securities on loan 0.54% | | | | | | | | |
| Capital Group Central Cash Fund 1.38%3,4,5 | | | 141,925 | | | | 14,189 | |
| Goldman Sachs Financial Square Government Fund, Institutional Shares 1.39%3,5 | | | 7,491,971 | | | | 7,492 | |
| BlackRock Liquidity Funds – FedFund, Institutional Shares 1.32%3,5 | | | 7,094,818 | | | | 7,095 | |
| Invesco Short-Term Investments Trust – Government & Agency Portfolio, Institutional Class 1.38%3,5 | | | 7,094,818 | �� | | | 7,095 | |
| Morgan Stanley Institutional Liquidity Funds – Government Portfolio, Institutional Class 1.38%3,5 | | | 7,094,818 | | | | 7,095 | |
| State Street Institutional U.S. Government Money Market Fund, Institutional Class 1.40%3,5 | | | 7,094,818 | | | | 7,095 | |
| | | | | | | | 50,061 | |
| | | | | | | | | |
| Total short-term securities (cost: $441,464,000) | | | | | | | 441,409 | |
| Total investment securities 100.43% (cost: $8,105,101,000) | | | | | | | 9,338,117 | |
| Other assets less liabilities (0.43)% | | | | | | | (39,638 | ) |
| | | | | | | | | |
| Net assets 100.00% | | | | | | $ | 9,298,479 | |
Investments in affiliates4
| | | Value of
affiliates at
1/1/2022
(000) | | | Additions
(000) | | | Reductions
(000) | | | Net
realized
loss
(000) | | | Net
unrealized
depreciation
(000) | | | Value of
affiliates at
6/30/2022
(000) | | | Dividend
income
(000) | |
| Short-term securities 4.36% | | | | | | | | | | | | | | | | | | | | | | | | | | | | |
| Money market investments 4.21% | | | | | | | | | | | | | | | | | | | | | | | | | | | | |
| Capital Group Central Cash Fund 1.38%3 | | $ | 321,870 | | | $ | 932,368 | | | $ | 862,775 | | | $ | (19 | ) | | $ | (96 | ) | | $ | 391,348 | | | $ | 823 | |
| Money market investments purchased with collateral from securities on loan 0.15% | | | | | | | | | | | | | | | | | | | | | | | | | | | | |
| Capital Group Central Cash Fund 1.38%3,5 | | | 9,273 | | | | 4,916 | 6 | | | | | | | | | | | | | | | 14,189 | | | | — | 7 |
| Total short-term securities | | | | | | | | | | | | | | | | | | | | | | | 405,537 | | | | | |
| Total 4.36% | | | | | | | | | | | | | | $ | (19 | ) | | $ | (96 | ) | | $ | 405,537 | | | $ | 823 | |
| 1 | All or a portion of this security was on loan. The total value of all such securities was $81,124,000, which represented .87% of the net assets of the fund. Refer to Note 5 for more information on securities lending. |
| 2 | Security did not produce income during the last 12 months. |
| 3 | Rate represents the seven-day yield at 6/30/2022. |
| 4 | Part of the same “group of investment companies” as the fund as defined under the Investment Company Act of 1940, as amended. |
| 5 | Security purchased with cash collateral from securities on loan. Refer to Note 5 for more information on securities lending. |
| 6 | Represents net activity. Refer to Note 5 for more information on securities lending. |
| 7 | Dividend income is included with securities lending income in the fund’s statement of operations and is not shown in this table. |
Key to abbreviation
| ADR = | American Depositary Receipts |
| REIT = | Real Estate Investment Trust |
Refer to the notes to financial statements.
| American Funds Insurance Series | 71 |
Capital World Growth and Income Fund
| Investment portfolio June 30, 2022 | unaudited |
| | |
| Common stocks 94.25% | | Shares | | | Value
(000) | |
| Information technology 16.90% | | | | | | | | |
| Microsoft Corp. | | | 232,205 | | | $ | 59,638 | |
| Broadcom, Inc. | | | 104,687 | | | | 50,858 | |
| Taiwan Semiconductor Manufacturing Company, Ltd. | | | 2,850,800 | | | | 45,638 | |
| ASML Holding NV | | | 47,460 | | | | 22,672 | |
| Tokyo Electron, Ltd. | | | 55,100 | | | | 17,990 | |
| Apple, Inc. | | | 117,010 | | | | 15,998 | |
| EPAM Systems, Inc.1 | | | 42,721 | | | | 12,593 | |
| Accenture PLC, Class A | | | 25,447 | | | | 7,065 | |
| Micron Technology, Inc. | | | 123,659 | | | | 6,836 | |
| Mastercard, Inc., Class A | | | 16,110 | | | | 5,082 | |
| Capgemini SE | | | 24,354 | | | | 4,171 | |
| Delta Electronics, Inc. | | | 478,000 | | | | 3,561 | |
| Logitech International SA | | | 68,047 | | | | 3,555 | |
| SK hynix, Inc. | | | 48,181 | | | | 3,377 | |
| Fujitsu, Ltd. | | | 25,800 | | | | 3,226 | |
| Hexagon AB, Class B | | | 269,199 | | | | 2,796 | |
| Applied Materials, Inc. | | | 30,672 | | | | 2,790 | |
| Keyence Corp. | | | 7,700 | | | | 2,632 | |
| OBIC Co., Ltd. | | | 15,800 | | | | 2,235 | |
| Ceridian HCM Holding, Inc.1 | | | 39,542 | | | | 1,862 | |
| MediaTek, Inc. | | | 85,000 | | | | 1,861 | |
| Worldline SA, non-registered shares1 | | | 44,279 | | | | 1,642 | |
| TE Connectivity, Ltd. | | | 13,769 | | | | 1,558 | |
| ServiceNow, Inc.1 | | | 3,204 | | | | 1,524 | |
| Microchip Technology, Inc. | | | 24,738 | | | | 1,437 | |
| DocuSign, Inc.1 | | | 23,514 | | | | 1,349 | |
| Advanced Micro Devices, Inc.1 | | | 17,101 | | | | 1,308 | |
| Zscaler, Inc.1 | | | 7,768 | | | | 1,161 | |
| GlobalWafers Co., Ltd. | | | 71,000 | | | | 1,082 | |
| PagSeguro Digital, Ltd., Class A1 | | | 93,201 | | | | 954 | |
| Snowflake, Inc., Class A1 | | | 6,444 | | | | 896 | |
| Nomura Research Institute, Ltd. | | | 28,600 | | | | 761 | |
| RingCentral, Inc., Class A1 | | | 12,898 | | | | 674 | |
| SS&C Technologies Holdings, Inc. | | | 10,174 | | | | 591 | |
| Atlassian Corp. PLC, Class A1 | | | 2,187 | | | | 410 | |
| Adobe, Inc.1 | | | 1,019 | | | | 373 | |
| Shopify, Inc., Class A, subordinate voting shares1 | | | 2,620 | | | | 82 | |
| | | | | | | | 292,238 | |
| | | | | | | | | |
| Financials 14.33% | | | | | | | | |
| Zurich Insurance Group AG | | | 45,107 | | | | 19,618 | |
| Kotak Mahindra Bank, Ltd. | | | 870,564 | | | | 18,311 | |
| Toronto-Dominion Bank (CAD denominated) | | | 226,171 | | | | 14,831 | |
| AIA Group, Ltd. | | | 1,325,999 | | | | 14,372 | |
| CME Group, Inc., Class A | | | 69,452 | | | | 14,217 | |
| JPMorgan Chase & Co. | | | 92,208 | | | | 10,384 | |
| ING Groep NV | | | 1,015,415 | | | | 10,036 | |
| HDFC Bank, Ltd. | | | 433,439 | | | | 7,398 | |
| HDFC Bank, Ltd. (ADR) | | | 15,384 | | | | 846 | |
| Wells Fargo & Company | | | 201,199 | | | | 7,881 | |
| DNB Bank ASA | | | 415,741 | | | | 7,452 | |
| Ping An Insurance (Group) Company of China, Ltd., Class H | | | 1,058,500 | | | | 7,197 | |
| B3 SA-Brasil, Bolsa, Balcao | | | 3,340,070 | | | | 6,995 | |
| KBC Groep NV | | | 124,391 | | | | 6,979 | |
| PNC Financial Services Group, Inc. | | | 40,788 | | | | 6,435 | |
| Nasdaq, Inc. | | | 38,692 | | | | 5,902 | |
| HDFC Life Insurance Company, Ltd. | | | 706,444 | | | | 4,920 | |
| Intercontinental Exchange, Inc. | | | 50,696 | | | | 4,767 | |
| Chubb, Ltd. | | | 23,999 | | | | 4,718 | |
| Aon PLC, Class A | | | 16,274 | | | | 4,389 | |
| Lufax Holding, Ltd. (ADR) | | | 723,447 | | | | 4,341 | |
| Discover Financial Services | | | 45,734 | | | | 4,325 | |
| | |
| 72 | American Funds Insurance Series |
Capital World Growth and Income Fund (continued)
| Common stocks (continued) | | Shares | | | Value
(000) | |
| Financials (continued) | | | | | | | | |
| American International Group, Inc. | | | 78,621 | | | $ | 4,020 | |
| Hong Kong Exchanges and Clearing, Ltd. | | | 76,300 | | | | 3,753 | |
| Fifth Third Bancorp | | | 98,490 | | | | 3,309 | |
| S&P Global, Inc. | | | 9,704 | | | | 3,271 | |
| China Merchants Bank Co., Ltd., Class H | | | 402,000 | | | | 2,690 | |
| China Merchants Bank Co., Ltd., Class A1 | | | 86,187 | | | | 543 | |
| Citigroup, Inc. | | | 63,268 | | | | 2,910 | |
| Blackstone, Inc., nonvoting shares | | | 27,530 | | | | 2,512 | |
| Macquarie Group, Ltd. | | | 20,305 | | | | 2,306 | |
| Berkshire Hathaway, Inc., Class B1 | | | 8,401 | | | | 2,294 | |
| Morgan Stanley | | | 25,627 | | | | 1,949 | |
| China Pacific Insurance (Group) Co., Ltd., Class H | | | 782,000 | | | | 1,911 | |
| AXA SA | | | 83,131 | | | | 1,887 | |
| Legal & General Group PLC | | | 644,377 | | | | 1,879 | |
| Moody’s Corp. | | | 6,865 | | | | 1,867 | |
| Banco Santander, SA | | | 642,643 | | | | 1,810 | |
| BNP Paribas SA | | | 35,932 | | | | 1,708 | |
| Postal Savings Bank of China Co., Ltd., Class H | | | 2,145,000 | | | | 1,703 | |
| Fairfax Financial Holdings, Ltd., subordinate voting shares | | | 3,119 | | | | 1,653 | |
| Power Corporation of Canada, subordinate voting shares | | | 63,342 | | | | 1,630 | |
| FinecoBank SpA | | | 134,386 | | | | 1,608 | |
| Apollo Asset Management, Inc. | | | 32,705 | | | | 1,586 | |
| National Bank of Canada2 | | | 22,477 | | | | 1,475 | |
| Blue Owl Capital, Inc., Class A | | | 142,699 | | | | 1,431 | |
| MSCI, Inc. | | | 3,392 | | | | 1,398 | |
| Tryg A/S | | | 57,214 | | | | 1,285 | |
| Tradeweb Markets, Inc., Class A | | | 18,072 | | | | 1,233 | |
| Marsh & McLennan Companies, Inc. | | | 7,865 | | | | 1,221 | |
| East Money Information Co., Ltd., Class A | | | 306,800 | | | | 1,164 | |
| XP, Inc., Class A1 | | | 61,520 | | | | 1,105 | |
| Bajaj Finance, Ltd. | | | 15,050 | | | | 1,029 | |
| Aegon NV2 | | | 196,376 | | | | 849 | |
| Swedbank AB, Class A | | | 47,850 | | | | 605 | |
| Sberbank of Russia PJSC1,3,4,5 | | | 3,196,952 | | | | — | 6 |
| | | | | | | | 247,908 | |
| | | | | | | | | |
| Health care 13.20% | | | | | | | | |
| UnitedHealth Group, Inc. | | | 67,543 | | | | 34,692 | |
| Abbott Laboratories | | | 251,978 | | | | 27,377 | |
| Eli Lilly and Company | | | 50,969 | | | | 16,526 | |
| Thermo Fisher Scientific, Inc. | | | 22,955 | | | | 12,471 | |
| Pfizer, Inc. | | | 216,083 | | | | 11,329 | |
| Novartis AG | | | 126,639 | | | | 10,725 | |
| Centene Corp.1 | | | 111,784 | | | | 9,458 | |
| Daiichi Sankyo Company, Ltd. | | | 355,000 | | | | 8,993 | |
| Amgen, Inc. | | | 36,646 | | | | 8,916 | |
| AstraZeneca PLC | | | 64,835 | | | | 8,524 | |
| Siemens Healthineers AG | | | 158,547 | | | | 8,057 | |
| Gilead Sciences, Inc. | | | 119,653 | | | | 7,396 | |
| Stryker Corp. | | | 33,705 | | | | 6,705 | |
| Sanofi | | | 65,965 | | | | 6,660 | |
| PerkinElmer, Inc. | | | 42,073 | | | | 5,984 | |
| Olympus Corp. | | | 222,100 | | | | 4,463 | |
| Medtronic PLC | | | 44,519 | | | | 3,996 | |
| Vertex Pharmaceuticals, Inc.1 | | | 10,765 | | | | 3,033 | |
| Bayer AG | | | 50,506 | | | | 3,002 | |
| Novo Nordisk A/S, Class B | | | 22,508 | | | | 2,496 | |
| Zoetis, Inc., Class A | | | 11,722 | | | | 2,015 | |
| Insulet Corp.1 | | | 8,893 | | | | 1,938 | |
| ResMed, Inc. | | | 8,919 | | | | 1,870 | |
| Cigna Corp. | | | 6,882 | | | | 1,813 | |
| Carl Zeiss Meditec AG, non-registered shares | | | 15,068 | | | | 1,798 | |
| | |
| American Funds Insurance Series | 73 |
Capital World Growth and Income Fund (continued)
| Common stocks (continued) | | Shares | | | Value
(000) | |
| Health care (continued) | | | | | | | | |
| Baxter International, Inc. | | | 26,428 | | | $ | 1,697 | |
| Alcon, Inc. | | | 22,793 | | | | 1,592 | |
| AbbVie, Inc. | | | 10,300 | | | | 1,578 | |
| DexCom, Inc.1 | | | 20,784 | | | | 1,549 | |
| Chugai Pharmaceutical Co., Ltd.2 | | | 60,300 | | | | 1,542 | |
| Intuitive Surgical, Inc.1 | | | 7,543 | | | | 1,514 | |
| Guardant Health, Inc.1 | | | 33,985 | | | | 1,371 | |
| Merck KGaA | | | 7,118 | | | | 1,201 | |
| Rede D’Or Sao Luiz SA | | | 199,176 | | | | 1,103 | |
| Edwards Lifesciences Corp.1 | | | 11,385 | | | | 1,083 | |
| GSK PLC | | | 37,032 | | | | 796 | |
| Boston Scientific Corp.1 | | | 19,572 | | | | 729 | |
| CSL, Ltd. | | | 3,803 | | | | 706 | |
| M3, Inc. | | | 21,100 | | | | 606 | |
| Agilon Health, Inc.1 | | | 19,961 | | | | 436 | |
| CVS Health Corp. | | | 3,377 | | | | 313 | |
| Molina Healthcare, Inc.1 | | | 1,089 | | | | 304 | |
| EUROAPI1 | | | 2,830 | | | | 45 | |
| | | | | | | | 228,402 | |
| | | | | | | | | |
| Industrials 10.63% | | | | | | | | |
| Airbus SE, non-registered shares | | | 169,970 | | | | 16,467 | |
| General Electric Co. | | | 251,069 | | | | 15,986 | |
| BAE Systems PLC | | | 1,271,586 | | | | 12,851 | |
| Lockheed Martin Corp. | | | 26,519 | | | | 11,402 | |
| Carrier Global Corp. | | | 278,413 | | | | 9,928 | |
| CSX Corp. | | | 325,955 | | | | 9,472 | |
| Raytheon Technologies Corp. | | | 97,001 | | | | 9,323 | |
| Safran SA | | | 70,335 | | | | 6,944 | |
| L3Harris Technologies, Inc. | | | 28,606 | | | | 6,914 | |
| Deere & Company | | | 22,511 | | | | 6,741 | |
| Caterpillar, Inc. | | | 32,626 | | | | 5,832 | |
| LIXIL Corp. | | | 298,500 | | | | 5,588 | |
| Melrose Industries PLC | | | 2,468,805 | | | | 4,499 | |
| RELX PLC | | | 124,070 | | | | 3,362 | |
| RELX PLC (ADR) | | | 15,132 | | | | 408 | |
| VINCI SA | | | 42,274 | | | | 3,764 | |
| Recruit Holdings Co., Ltd. | | | 120,034 | | | | 3,534 | |
| Bureau Veritas SA | | | 130,728 | | | | 3,350 | |
| Compagnie de Saint-Gobain SA, non-registered shares | | | 75,890 | | | | 3,256 | |
| TransDigm Group, Inc.1 | | | 5,974 | | | | 3,206 | |
| Siemens AG | | | 30,571 | | | | 3,110 | |
| Johnson Controls International PLC | | | 55,955 | | | | 2,679 | |
| Bunzl PLC | | | 71,427 | | | | 2,364 | |
| Brenntag SE | | | 36,308 | | | | 2,363 | |
| ManpowerGroup, Inc. | | | 30,899 | | | | 2,361 | |
| Canadian Pacific Railway, Ltd. | | | 33,610 | | | | 2,347 | |
| Eiffage SA | | | 23,538 | | | | 2,118 | |
| Schneider Electric SE | | | 16,584 | | | | 1,962 | |
| Boeing Company1 | | | 13,627 | | | | 1,863 | |
| Thales SA | | | 14,997 | | | | 1,840 | |
| Daikin Industries, Ltd. | | | 11,200 | | | | 1,795 | |
| ASSA ABLOY AB, Class B | | | 80,154 | | | | 1,703 | |
| Ritchie Bros. Auctioneers, Inc. | | | 26,122 | | | | 1,700 | |
| Zhejiang Sanhua Intelligent Controls Co., Ltd., Class A | | | 406,700 | | | | 1,670 | |
| BayCurrent Consulting, Inc. | | | 5,700 | | | | 1,517 | |
| Waste Connections, Inc. | | | 11,989 | | | | 1,486 | |
| Nidec Corp. | | | 21,900 | | | | 1,353 | |
| SMC Corp. | | | 2,900 | | | | 1,292 | |
| Rockwell Automation | | | 5,363 | | | | 1,069 | |
| ACS Actividades de Construcción y Servicios SA | | | 43,545 | | | | 1,056 | |
| Adecco Group AG | | | 30,464 | | | | 1,035 | |
| | |
| 74 | American Funds Insurance Series |
Capital World Growth and Income Fund (continued)
| Common stocks (continued) | | Shares | | | Value
(000) | |
| Industrials (continued) | | | | | | | | |
| Atlas Copco AB, Class B | | | 91,684 | | | $ | 767 | |
| Interpump Group SpA | | | 16,870 | | | | 643 | |
| Honeywell International, Inc. | | | 1,774 | | | | 308 | |
| International Consolidated Airlines Group SA (CDI)1,2 | | | 221,732 | | | | 291 | |
| Otis Worldwide Corp. | | | 4,082 | | | | 288 | |
| Ryanair Holdings PLC (ADR)1 | | | 1,400 | | | | 94 | |
| | | | | | | | 183,901 | |
| | | | | | | | | |
| Consumer discretionary 8.99% | | | | | | | | |
| LVMH Moët Hennessy-Louis Vuitton SE | | | 41,387 | | | | 25,229 | |
| Home Depot, Inc. | | | 69,134 | | | | 18,961 | |
| General Motors Company1 | | | 395,836 | | | | 12,572 | |
| Amazon.com, Inc.1 | | | 110,370 | | | | 11,722 | |
| Rivian Automotive, Inc., Class A1,2 | | | 238,652 | | | | 6,143 | |
| Stellantis NV | | | 491,644 | | | | 6,072 | |
| Midea Group Co., Ltd., Class A | | | 608,297 | | | | 5,488 | |
| Sony Group Corp. | | | 66,700 | | | | 5,454 | |
| Booking Holdings, Inc.1 | | | 2,932 | | | | 5,128 | |
| Marriott International, Inc., Class A | | | 35,169 | | | | 4,783 | |
| Flutter Entertainment PLC1 | | | 46,266 | | | | 4,678 | |
| Cie. Financière Richemont SA, Class A | | | 42,168 | | | | 4,490 | |
| Restaurant Brands International, Inc. (CAD denominated)2 | | | 74,819 | | | | 3,753 | |
| Restaurant Brands International, Inc. | | | 12,226 | | | | 613 | |
| Shimano, Inc. | | | 20,200 | | | | 3,412 | |
| Chipotle Mexican Grill, Inc.1 | | | 2,186 | | | | 2,858 | |
| Industria de Diseño Textil, SA | | | 121,254 | | | | 2,743 | |
| Astra International Tbk PT | | | 5,952,600 | | | | 2,647 | |
| Evolution AB | | | 26,108 | | | | 2,374 | |
| Sands China, Ltd.1 | | | 916,400 | | | | 2,186 | |
| MercadoLibre, Inc.1 | | | 3,315 | | | | 2,111 | |
| Pan Pacific International Holdings Corp. | | | 124,500 | | | | 1,987 | |
| YUM! Brands, Inc. | | | 17,358 | | | | 1,970 | |
| InterContinental Hotels Group PLC | | | 37,148 | | | | 1,967 | |
| EssilorLuxottica | | | 12,617 | | | | 1,890 | |
| NIKE, Inc., Class B | | | 18,444 | | | | 1,885 | |
| Darden Restaurants, Inc. | | | 14,188 | | | | 1,605 | |
| Royal Caribbean Cruises, Ltd.1 | | | 44,462 | | | | 1,552 | |
| Target Corp. | | | 10,079 | | | | 1,424 | |
| Taylor Wimpey PLC | | | 927,507 | | | | 1,317 | |
| Tesla, Inc.1 | | | 1,844 | | | | 1,242 | |
| Kindred Group PLC (SDR) | | | 136,247 | | | | 1,133 | |
| Shenzhou International Group Holdings, Ltd. | | | 93,000 | | | | 1,127 | |
| Kering SA | | | 1,760 | | | | 904 | |
| Wynn Macau, Ltd.1 | | | 942,000 | | | | 640 | |
| Dollar Tree Stores, Inc.1 | | | 2,864 | | | | 446 | |
| Aristocrat Leisure, Ltd. | | | 11,992 | | | | 285 | |
| Entain PLC1 | | | 17,337 | | | | 263 | |
| JD.com, Inc., Class A | | | 6,747 | | | | 217 | |
| Airbnb, Inc., Class A1 | | | 2,134 | | | | 190 | |
| Cazoo Group, Ltd., Class A1 | | | 63,213 | | | | 46 | |
| | | | | | | | 155,507 | |
| | | | | | | | | |
| Consumer staples 7.59% | | | | | | | | |
| Philip Morris International, Inc. | | | 283,405 | | | | 27,983 | |
| Nestlé SA | | | 128,106 | | | | 14,954 | |
| Keurig Dr Pepper, Inc. | | | 375,742 | | | | 13,298 | |
| British American Tobacco PLC | | | 248,143 | | | | 10,631 | |
| British American Tobacco PLC (ADR) | | | 6,936 | | | | 298 | |
| Kweichow Moutai Co., Ltd., Class A | | | 31,900 | | | | 9,745 | |
| Kroger Co. | | | 177,589 | | | | 8,405 | |
| Ocado Group PLC1 | | | 843,207 | | | | 8,019 | |
| Bunge, Ltd. | | | 51,771 | | | | 4,695 | |
| | |
| American Funds Insurance Series | 75 |
Capital World Growth and Income Fund (continued)
| Common stocks (continued) | | Shares | | | Value
(000) | |
| Consumer staples (continued) | | | | | | | | |
| Imperial Brands PLC | | | 200,059 | | | $ | 4,471 | |
| Danone SA | | | 72,028 | | | | 4,020 | |
| Heineken NV | | | 34,303 | | | | 3,128 | |
| Treasury Wine Estates, Ltd. | | | 396,969 | | | | 3,110 | |
| Inner Mongolia Yili Industrial Group Co., Ltd., Class A | | | 527,800 | | | | 3,071 | |
| Arca Continental, SAB de CV | | | 440,180 | | | | 2,900 | |
| Seven & i Holdings Co., Ltd. | | | 64,700 | | | | 2,512 | |
| Altria Group, Inc. | | | 58,835 | | | | 2,458 | |
| Constellation Brands, Inc., Class A | | | 9,529 | | | | 2,221 | |
| ITC, Ltd. | | | 614,263 | | | | 2,127 | |
| Varun Beverages, Ltd. | | | 185,051 | | | | 1,852 | |
| Ajinomoto Co., Inc. | | | 55,600 | | | | 1,352 | |
| | | | | | | | 131,250 | |
| | | | | | | | | |
| Energy 6.20% | | | | | | | | |
| Canadian Natural Resources, Ltd. (CAD denominated) | | | 483,954 | | | | 26,006 | |
| EOG Resources, Inc. | | | 94,807 | | | | 10,470 | |
| TotalEnergies SE | | | 179,680 | | | | 9,484 | |
| Baker Hughes Co., Class A | | | 298,859 | | | | 8,628 | |
| ConocoPhillips | | | 66,573 | | | | 5,979 | |
| TC Energy Corp. (CAD denominated) | | | 104,163 | | | | 5,396 | |
| Reliance Industries, Ltd.1 | | | 149,117 | | | | 4,901 | |
| Tourmaline Oil Corp. | | | 92,483 | | | | 4,809 | |
| BP PLC | | | 975,459 | | | | 4,611 | |
| Cenovus Energy, Inc. (CAD denominated) | | | 216,254 | | | | 4,114 | |
| Shell PLC (GBP denominated) | | | 155,689 | | | | 4,044 | |
| Aker BP ASA (SDR)3 | | | 67,333 | | | | 2,338 | |
| Aker BP ASA2 | | | 37,369 | | | | 1,298 | |
| Woodside Energy Group, Ltd. | | | 120,486 | | | | 2,648 | |
| Woodside Energy Group, Ltd. (CDI)1 | | | 37,623 | | | | 797 | |
| Suncor Energy, Inc. | | | 84,929 | | | | 2,980 | |
| Var Energi ASA | | | 756,669 | | | | 2,970 | |
| Halliburton Company | | | 94,296 | | | | 2,957 | |
| Cameco Corp. | | | 130,751 | | | | 2,749 | |
| Orron Energy AB | | | 62,313 | | | | 43 | |
| Gazprom PJSC (ADR)3,4 | | | 1,124,152 | | | | — | 6 |
| | | | | | | | 107,222 | |
| | | | | | | | | |
| Materials 6.17% | | | | | | | | |
| Vale SA, ordinary nominative shares | | | 1,617,361 | | | | 23,660 | |
| Vale SA, ordinary nominative shares (ADR) | | | 910,365 | | | | 13,319 | |
| Fortescue Metals Group, Ltd. | | | 1,279,107 | | | | 15,477 | |
| Rio Tinto PLC | | | 254,680 | | | | 15,242 | |
| Linde PLC | | | 20,404 | | | | 5,867 | |
| Freeport-McMoRan, Inc. | | | 188,466 | | | | 5,514 | |
| BHP Group, Ltd. (CDI) | | | 142,026 | | | | 3,971 | |
| Barrick Gold Corp. (CAD denominated)2 | | | 127,238 | | | | 2,250 | |
| Barrick Gold Corp. | | | 89,841 | | | | 1,589 | |
| Albemarle Corp. | | | 11,592 | | | | 2,422 | |
| Air Liquide SA, non-registered shares | | | 16,503 | | | | 2,216 | |
| Dow, Inc. | | | 42,130 | | | | 2,174 | |
| HeidelbergCement AG | | | 43,833 | | | | 2,106 | |
| Shin-Etsu Chemical Co., Ltd. | | | 17,300 | | | | 1,951 | |
| Amcor PLC (CDI) | | | 154,993 | | | | 1,930 | |
| Evonik Industries AG | | | 86,135 | | | | 1,838 | |
| CRH PLC | | | 45,078 | | | | 1,559 | |
| First Quantum Minerals, Ltd. | | | 65,205 | | | | 1,237 | |
| Koninklijke DSM NV | | | 6,143 | | | | 883 | |
| | |
| 76 | American Funds Insurance Series |
Capital World Growth and Income Fund (continued)
| Common stocks (continued) | | Shares | | | Value
(000) | |
| Materials (continued) | | | | | | | | |
| Lynas Rare Earths, Ltd.1 | | | 129,901 | | | $ | 783 | |
| Anglo American Platinum, Ltd. | | | 4,725 | | | | 414 | |
| Akzo Nobel NV | | | 5,299 | | | | 348 | |
| | | | | | | | 106,750 | |
| | | | | | | | | |
| Communication services 5.39% | | | | | | | | |
| Alphabet, Inc., Class C1 | | | 12,258 | | | | 26,814 | |
| Alphabet, Inc., Class A1 | | | 5,301 | | | | 11,552 | |
| Comcast Corp., Class A | | | 340,637 | | | | 13,367 | |
| Netflix, Inc.1 | | | 38,683 | | | | 6,764 | |
| NetEase, Inc. | | | 354,500 | | | | 6,510 | |
| Meta Platforms, Inc., Class A1 | | | 39,178 | | | | 6,317 | |
| SoftBank Corp. | | | 553,985 | | | | 6,151 | |
| Universal Music Group NV | | | 141,985 | | | | 2,847 | |
| Bharti Airtel, Ltd.1 | | | 196,064 | | | | 1,700 | |
| Bharti Airtel, Ltd., interim shares1 | | | 13,994 | | | | 54 | |
| Tencent Holdings, Ltd. | | | 36,900 | | | | 1,667 | |
| Nippon Telegraph and Telephone Corp. | | | 56,400 | | | | 1,620 | |
| Deutsche Telekom AG | | | 76,322 | | | | 1,515 | |
| Take-Two Interactive Software, Inc.1 | | | 12,130 | | | | 1,486 | |
| Omnicom Group, Inc. | | | 22,926 | | | | 1,458 | |
| Publicis Groupe SA | | | 27,032 | | | | 1,322 | |
| Singapore Telecommunications, Ltd. | | | 468,700 | | | | 854 | |
| ITV PLC | | | 1,034,699 | | | | 822 | |
| SoftBank Group Corp. | | | 9,100 | | | | 351 | |
| Yandex NV, Class A1,3,4 | | | 151,598 | | | | — | 6 |
| | | | | | | | 93,171 | |
| | | | | | | | | |
| Utilities 2.92% | | | | | | | | |
| National Grid PLC | | | 541,460 | | | | 6,934 | |
| DTE Energy Company | | | 52,656 | | | | 6,674 | |
| China Resources Gas Group, Ltd. | | | 1,196,632 | | | | 5,574 | |
| Iberdrola, SA, non-registered shares | | | 505,184 | | | | 5,239 | |
| E.ON SE | | | 427,621 | | | | 3,589 | |
| Edison International | | | 53,709 | | | | 3,396 | |
| PG&E Corp.1 | | | 330,808 | | | | 3,301 | |
| Engie SA | | | 238,699 | | | | 2,743 | |
| Engie SA, bonus shares3 | | | 41,586 | | | | 478 | |
| NextEra Energy, Inc. | | | 38,313 | | | | 2,968 | |
| Enel SpA | | | 481,112 | | | | 2,632 | |
| Power Grid Corporation of India, Ltd. | | | 681,829 | | | | 1,829 | |
| Endesa, SA | | | 71,889 | | | | 1,356 | |
| AES Corp. | | | 47,865 | | | | 1,006 | |
| Exelon Corp. | | | 21,703 | | | | 984 | |
| Constellation Energy Corp. | | | 16,138 | | | | 924 | |
| Public Service Enterprise Group, Inc. | | | 14,569 | | | | 922 | |
| | | | | | | | 50,549 | |
| | | | | | | | | |
| Real estate 1.93% | | | | | | | | |
| Longfor Group Holdings, Ltd. | | | 1,549,500 | | | | 7,316 | |
| Crown Castle International Corp. REIT | | | 40,669 | | | | 6,848 | |
| VICI Properties, Inc. REIT | | | 154,395 | | | | 4,600 | |
| American Tower Corp. REIT | | | 12,850 | | | | 3,284 | |
| Country Garden Services Holdings Co., Ltd. | | | 456,968 | | | | 2,035 | |
| Americold Realty Trust, Inc. | | | 65,356 | | | | 1,963 | |
| W. P. Carey, Inc. REIT | | | 22,705 | | | | 1,881 | |
| China Resources Mixc Lifestyle Services, Ltd. | | | 344,000 | | | | 1,706 | |
| Equinix, Inc. REIT | | | 2,143 | | | | 1,408 | |
| | |
| American Funds Insurance Series | 77 |
Capital World Growth and Income Fund (continued)
| Common stocks (continued) | | Shares | | | Value
(000) | |
| Real estate (continued) | | | | | | | | |
| Boston Properties, Inc. REIT | | | 10,901 | | | $ | 970 | |
| Sun Hung Kai Properties, Ltd. | | | 63,000 | | | | 744 | |
| Iron Mountain, Inc. REIT | | | 11,618 | | | | 566 | |
| | | | | | | | 33,321 | |
| | | | | | | | | |
| Total common stocks (cost: $1,481,441,000) | | | | | | | 1,630,219 | |
| | | | | | | | | |
| Preferred securities 0.46% | | | | | | | | |
| Consumer discretionary 0.39% | | | | | | | | |
| Volkswagen AG, nonvoting preferred shares | | | 50,187 | | | | 6,701 | |
| | | | | | | | | |
| Health care 0.05% | | | | | | | | |
| Grifols, SA, Class B, nonvoting non-registered preferred shares1 | | | 70,967 | | | | 839 | |
| | | | | | | | | |
| Financials 0.02% | | | | | | | | |
| Fannie Mae, Series S, 8.25% noncumulative preferred shares1 | | | 58,870 | | | | 205 | |
| Federal Home Loan Mortgage Corp., Series Z, 8.375% noncumulative preferred shares1,2 | | | 61,516 | | | | 204 | |
| | | | | | | | 409 | |
| | | | | | | | | |
| Total preferred securities (cost: $13,625,000) | | | | | | | 7,949 | |
| | | | | | | | | |
| Convertible stocks 0.14% | | | | | | | | |
| Information technology 0.14% | | | | | | | | |
| Broadcom, Inc., Series A, cumulative convertible preferred shares, 8.00% 2022 | | | 1,566 | | | | 2,354 | |
| | | | | | | | | |
| Total convertible stocks (cost: $2,438,000) | | | | | | | 2,354 | |
| | | | | | | | | |
| Convertible bonds & notes 0.06% | | Principal amount
(000) | | | | | |
| Communication services 0.06% | | | | | | | | |
| Sea, Ltd., convertible notes, 2.375% 2025 | | USD | 952 | | | | 1,058 | |
| | | | | | | | | |
| Total convertible bonds & notes (cost: $2,437,000) | | | | | | | 1,058 | |
| | | | | | | | | |
| Bonds, notes & other debt instruments 0.33% | | | | | | | | |
| Corporate bonds, notes & loans 0.27% | | | | | | | | |
| Health care 0.14% | | | | | | | | |
| Teva Pharmaceutical Finance Co. BV 6.00% 2024 | | | 1,600 | | | | 1,580 | |
| Teva Pharmaceutical Finance Co. BV 3.15% 2026 | | | 1,100 | | | | 905 | |
| | | | | | | | 2,485 | |
| | | | | | | | | |
| Consumer discretionary 0.06% | | | | | | | | |
| General Motors Company 5.40% 2023 | | | 300 | | | | 305 | |
| Royal Caribbean Cruises, Ltd. 11.50% 20255 | | | 477 | | | | 491 | |
| Royal Caribbean Cruises, Ltd. 5.50% 20285 | | | 275 | | | | 192 | |
| | | | | | | | 988 | |
| | | | | | | | | |
| Energy 0.04% | | | | | | | | |
| TransCanada PipeLines, Ltd. 5.10% 2049 | | | 800 | | | | 792 | |
| | | | | | | | | |
| Financials 0.03% | | | | | | | | |
| Lloyds Banking Group PLC 3.369% 20467 | | | 709 | | | | 504 | |
| | | | | | | | | |
| Total corporate bonds, notes & loans | | | | | | | 4,769 | |
| | |
| 78 | American Funds Insurance Series |
Capital World Growth and Income Fund (continued)
| Bonds, notes & other debt instruments (continued) | | Principal amount
(000) | | | Value
(000) | |
| Bonds & notes of governments & government agencies outside the U.S. 0.06% | | | | | | | | |
| United Mexican States, Series M, 8.00% 2023 | | MXN | 20,000 | | | $ | 976 | |
| | | | | | | | | |
| Total bonds, notes & other debt instruments (cost: $6,398,000) | | | | | | | 5,745 | |
| | | | | | | | | |
| Short-term securities 5.37% | | Shares | | | | | |
| Money market investments 4.57% | | | | | | | | |
| Capital Group Central Cash Fund 1.38%8,9 | | | 790,171 | | | | 79,001 | |
| | | | | | | | | |
| Money market investments purchased with collateral from securities on loan 0.80% | | | | | | | | |
| Capital Group Central Cash Fund 1.38%8,9,10 | | | 39,384 | | | | 3,937 | |
| Goldman Sachs Financial Square Government Fund, Institutional Shares 1.39%8,10 | | | 2,079,009 | | | | 2,079 | |
| BlackRock Liquidity Funds – FedFund, Institutional Shares 1.32%8,10 | | | 1,968,799 | | | | 1,969 | |
| Invesco Short-Term Investments Trust – Government & Agency Portfolio, Institutional Class 1.38%8,10 | | | 1,968,799 | | | | 1,969 | |
| Morgan Stanley Institutional Liquidity Funds – Government Portfolio, Institutional Class 1.38%8,10 | | | 1,968,800 | | | | 1,969 | |
| State Street Institutional U.S. Government Money Market Fund, Institutional Class 1.40%8,10 | | | 1,968,800 | | | | 1,968 | |
| | | | | | | | 13,891 | |
| | | | | | | | | |
| Total short-term securities (cost: $92,900,000) | | | | | | | 92,892 | |
| Total investment securities 100.61% (cost: $1,599,239,000) | | | | | | | 1,740,217 | |
| Other assets less liabilities (0.61)% | | | | | | | (10,617 | ) |
| | | | | | | | | |
| Net assets 100.00% | | | | | | $ | 1,729,600 | |
Investments in affiliates9
| | | Value of
affiliates at
1/1/2022
(000) | | | Additions
(000) | | | Reductions
(000) | | | Net
realized
loss
(000) | | | Net
unrealized
depreciation
(000) | | | Value of
affiliates at
6/30/2022
(000) | | | Dividend
income
(000) | |
| Short-term securities 4.80% | | | | | | | | | | | | | | | | | | | | | | | | | | | | |
| Money market investments 4.57% | | | | | | | | | | | | | | | | | | | | | | | | | | | | |
| Capital Group Central Cash Fund 1.38%8 | | $ | 12,989 | | | $ | 285,710 | | | $ | 219,678 | | | $ | (13 | ) | | $ | (7 | ) | | $ | 79,001 | | | $ | 172 | |
| Money market investments purchased with collateral from securities on loan 0.23% | | | | | | | | | | | | | | | | | | | | | | | | | | | | |
| Capital Group Central Cash Fund 1.38%8,10 | | | 293 | | | | 3,644 | 11 | | | | | | | | | | | | | | | 3,937 | | | | — | 12 |
| Total short-term securities | | | | | | | | | | | | | | | | | | | | | | | 82,938 | | | | | |
| Total 4.80% | | | | | | | | | | | | | | $ | (13 | ) | | $ | (7 | ) | | $ | 82,938 | | | $ | 172 | |
| | |
| American Funds Insurance Series | 79 |
Capital World Growth and Income Fund (continued)
| 1 | Security did not produce income during the last 12 months. |
| 2 | All or a portion of this security was on loan. The total value of all such securities was $16,355,000, which represented .95% of the net assets of the fund. Refer to Note 5 for more information on securities lending. |
| 3 | Valued under fair value procedures adopted by authority of the board of trustees. The total value of all such securities was $2,816,000, which represented .16% of the net assets of the fund. |
| 4 | Value determined using significant unobservable inputs. |
| 5 | Acquired in a transaction exempt from registration under Rule 144A of the Securities Act of 1933. May be resold in the U.S. in transactions exempt from registration, normally to qualified institutional buyers. The total value of all such securities was $683,000, which represented .04% of the net assets of the fund. |
| 6 | Amount less than one thousand. |
| 7 | Coupon rate may change periodically. Reference rate and spread are as of the most recent information available. Some coupon rates are determined by the issuer or agent based on current market conditions; therefore, the reference rate and spread are not available. |
| 8 | Rate represents the seven-day yield at 6/30/2022. |
| 9 | Part of the same “group of investment companies” as the fund as defined under the Investment Company Act of 1940, as amended. |
| 10 | Security purchased with cash collateral from securities on loan. Refer to Note 5 for more information on securities lending. |
| 11 | Represents net activity. Refer to Note 5 for more information on securities lending. |
| 12 | Dividend income is included with securities lending income in the fund’s statement of operations and is not shown in this table. |
Key to abbreviations
ADR = American Depositary Receipts
CAD = Canadian dollars
CDI = CREST Depository Interest
GBP = British pounds
MXN = Mexican pesos
REIT = Real Estate Investment Trust
SDR = Swedish Depositary Receipts
USD = U.S. dollars
Refer to the notes to financial statements.
| 80 | American Funds Insurance Series |
Growth-Income Fund
| Investment portfolio June 30, 2022 | unaudited |
| | |
| Common stocks 90.60% | | Shares | | | Value
(000) | |
| Information technology 19.81% | | | | | | | | |
| Microsoft Corp. | | | 7,427,783 | | | $ | 1,907,678 | |
| Broadcom, Inc. | | | 1,996,843 | | | | 970,086 | |
| Mastercard, Inc., Class A | | | 1,425,952 | | | | 449,859 | |
| Apple, Inc. | | | 2,742,000 | | | | 374,886 | |
| Visa, Inc., Class A | | | 1,346,541 | | | | 265,120 | |
| Taiwan Semiconductor Manufacturing Company, Ltd. | | | 13,692,000 | | | | 219,194 | |
| ASML Holding NV | | | 290,068 | | | | 138,568 | |
| ASML Holding NV (New York registered) (ADR) | | | 137,293 | | | | 65,335 | |
| Automatic Data Processing, Inc. | | | 845,000 | | | | 177,484 | |
| Accenture PLC, Class A | | | 625,335 | | | | 173,624 | |
| ServiceNow, Inc.1 | | | 280,858 | | | | 133,554 | |
| Concentrix Corp. | | | 904,367 | | | | 122,668 | |
| Applied Materials, Inc. | | | 1,300,400 | | | | 118,310 | |
| Fidelity National Information Services, Inc. | | | 1,268,981 | | | | 116,327 | |
| Global Payments, Inc. | | | 973,628 | | | | 107,722 | |
| GoDaddy, Inc., Class A1 | | | 1,402,444 | | | | 97,554 | |
| KLA Corp. | | | 301,000 | | | | 96,043 | |
| FleetCor Technologies, Inc.1 | | | 420,507 | | | | 88,353 | |
| Euronet Worldwide, Inc.1 | | | 763,602 | | | | 76,811 | |
| Intel Corp. | | | 1,931,884 | | | | 72,272 | |
| QUALCOMM, Inc. | | | 564,911 | | | | 72,162 | |
| Micron Technology, Inc. | | | 1,140,549 | | | | 63,050 | |
| Analog Devices, Inc. | | | 398,402 | | | | 58,203 | |
| TELUS International (Cda), Inc., subordinate voting shares1 | | | 2,302,991 | | | | 57,736 | |
| Adobe, Inc.1 | | | 143,116 | | | | 52,389 | |
| Cognizant Technology Solutions Corp., Class A | | | 760,350 | | | | 51,316 | |
| MKS Instruments, Inc. | | | 481,000 | | | | 49,365 | |
| Fiserv, Inc.1 | | | 536,700 | | | | 47,750 | |
| Texas Instruments, Inc. | | | 308,278 | | | | 47,367 | |
| Datadog, Inc., Class A1 | | | 365,800 | | | | 34,839 | |
| Snowflake, Inc., Class A1 | | | 225,042 | | | | 31,294 | |
| Atlassian Corp. PLC, Class A1 | | | 141,050 | | | | 26,433 | |
| Trimble, Inc.1 | | | 443,800 | | | | 25,842 | |
| Dye & Durham, Ltd.2 | | | 1,322,100 | | | | 22,340 | |
| Lam Research Corp. | | | 50,039 | | | | 21,324 | |
| Block, Inc., Class A1 | | | 301,422 | | | | 18,525 | |
| Ceridian HCM Holding, Inc.1 | | | 350,352 | | | | 16,495 | |
| Paychex, Inc. | | | 127,131 | | | | 14,476 | |
| VeriSign, Inc.1 | | | 61,000 | | | | 10,207 | |
| | | | | | | | 6,492,561 | |
| | | | | | | | | |
| Health care 12.99% | | | | | | | | |
| UnitedHealth Group, Inc. | | | 2,233,644 | | | | 1,147,267 | |
| Abbott Laboratories | | | 6,014,324 | | | | 653,456 | |
| AbbVie, Inc. | | | 3,041,423 | | | | 465,824 | |
| Novo Nordisk A/S, Class B | | | 2,341,449 | | | | 259,694 | |
| Humana, Inc. | | | 535,731 | | | | 250,760 | |
| Elevance Health, Inc. | | | 465,299 | | | | 224,544 | |
| AstraZeneca PLC | | | 1,209,323 | | | | 158,988 | |
| AstraZeneca PLC (ADR) | | | 721,200 | | | | 47,649 | |
| Thermo Fisher Scientific, Inc. | | | 301,203 | | | | 163,638 | |
| Bristol-Myers Squibb Company | | | 1,859,278 | | | | 143,164 | |
| PerkinElmer, Inc. | | | 769,600 | | | | 109,452 | |
| Pfizer, Inc. | | | 2,030,169 | | | | 106,442 | |
| GSK PLC | | | 4,812,300 | | | | 103,429 | |
| Seagen, Inc.1 | | | 432,135 | | | | 76,462 | |
| Medtronic PLC | | | 764,000 | | | | 68,569 | |
| Eli Lilly and Company | | | 180,974 | | | | 58,677 | |
| Royalty Pharma PLC, Class A | | | 1,170,161 | | | | 49,194 | |
| Edwards Lifesciences Corp.1 | | | 317,059 | | | | 30,149 | |
| Stryker Corp. | | | 148,897 | | | | 29,620 | |
| Roche Holding AG, nonvoting non-registered shares | | | 85,502 | | | | 28,531 | |
| | |
| American Funds Insurance Series | 81 |
Growth-Income Fund (continued)
| Common stocks (continued) | | Shares | | | Value
(000) | |
| Health care (continued) | | | | | | | | |
| Horizon Therapeutics PLC1 | | | 318,690 | | | $ | 25,419 | |
| Zimmer Biomet Holdings, Inc. | | | 171,174 | | | | 17,984 | |
| NovoCure, Ltd.1 | | | 193,600 | | | | 13,455 | |
| Zoetis, Inc., Class A | | | 68,400 | | | | 11,757 | |
| Vir Biotechnology, Inc.1 | | | 258,400 | | | | 6,581 | |
| Guardant Health, Inc.1 | | | 146,925 | | | | 5,927 | |
| | | | | | | | 4,256,632 | |
| | | | | | | | | |
| Industrials 12.17% | | | | | | | | |
| Raytheon Technologies Corp. | | | 7,634,279 | | | | 733,731 | |
| General Electric Co. | | | 5,898,742 | | | | 375,573 | |
| Northrop Grumman Corp. | | | 633,267 | | | | 303,063 | |
| TFI International, Inc. | | | 2,669,105 | | | | 214,276 | |
| Carrier Global Corp. | | | 5,749,143 | | | | 205,014 | |
| Woodward, Inc. | | | 2,204,500 | | | | 203,894 | |
| General Dynamics Corp. | | | 848,975 | | | | 187,836 | |
| Waste Connections, Inc. | | | 1,425,463 | | | | 176,700 | |
| TransDigm Group, Inc.1 | | | 302,520 | | | | 162,353 | |
| Airbus SE, non-registered shares | | | 1,617,590 | | | | 156,717 | |
| L3Harris Technologies, Inc. | | | 607,462 | | | | 146,824 | |
| BWX Technologies, Inc. | | | 2,159,505 | | | | 118,967 | |
| Norfolk Southern Corp. | | | 482,759 | | | | 109,726 | |
| Old Dominion Freight Line, Inc. | | | 397,800 | | | | 101,948 | |
| Waste Management, Inc. | | | 625,300 | | | | 95,658 | |
| ITT, Inc. | | | 1,244,379 | | | | 83,672 | |
| Equifax, Inc. | | | 424,308 | | | | 77,555 | |
| Lockheed Martin Corp. | | | 180,000 | | | | 77,393 | |
| Honeywell International, Inc. | | | 409,067 | | | | 71,100 | |
| Air Lease Corp., Class A | | | 2,097,300 | | | | 70,113 | |
| United Airlines Holdings, Inc.1 | | | 1,810,598 | | | | 64,131 | |
| United Rentals, Inc.1 | | | 256,000 | | | | 62,185 | |
| Fortive Corp. | | | 1,085,000 | | | | 59,002 | |
| Safran SA | | | 539,713 | | | | 53,285 | |
| CSX Corp. | | | 1,350,000 | | | | 39,231 | |
| Cummins, Inc. | | | 100,000 | | | | 19,353 | |
| Otis Worldwide Corp. | | | 268,100 | | | | 18,947 | |
| | | | | | | | 3,988,247 | |
| | | | | | | | | |
| Communication services 9.54% | | | | | | | | |
| Alphabet, Inc., Class C1 | | | 313,067 | | | | 684,818 | |
| Alphabet, Inc., Class A1 | | | 281,863 | | | | 614,253 | |
| Meta Platforms, Inc., Class A1 | | | 3,574,586 | | | | 576,402 | |
| Comcast Corp., Class A | | | 13,245,788 | | | | 519,765 | |
| Netflix, Inc.1 | | | 1,632,923 | | | | 285,549 | |
| Charter Communications, Inc., Class A1 | | | 429,912 | | | | 201,427 | |
| Electronic Arts, Inc. | | | 1,168,000 | | | | 142,087 | |
| Tencent Holdings, Ltd. | | | 1,782,100 | | | | 80,488 | |
| Take-Two Interactive Software, Inc.1 | | | 178,984 | | | | 21,931 | |
| | | | | | | | 3,126,720 | |
| | | | | | | | | |
| Financials 9.29% | | | | | | | | |
| JPMorgan Chase & Co. | | | 3,311,830 | | | | 372,945 | |
| Chubb, Ltd. | | | 1,451,726 | | | | 285,380 | |
| Marsh & McLennan Companies, Inc. | | | 1,709,201 | | | | 265,353 | |
| PNC Financial Services Group, Inc. | | | 1,341,714 | | | | 211,682 | |
| Arthur J. Gallagher & Co. | | | 1,189,650 | | | | 193,961 | |
| BlackRock, Inc. | | | 258,532 | | | | 157,456 | |
| Aon PLC, Class A | | | 527,512 | | | | 142,259 | |
| Nasdaq, Inc. | | | 912,520 | | | | 139,196 | |
| Morgan Stanley | | | 1,592,297 | | | | 121,110 | |
| American International Group, Inc. | | | 2,047,230 | | | | 104,675 | |
| Signature Bank | | | 529,521 | | | | 94,896 | |
| | |
| 82 | American Funds Insurance Series |
Growth-Income Fund (continued)
| Common stocks (continued) | | Shares | | | Value
(000) | |
| Financials (continued) | | | | | | | | |
| Moody’s Corp. | | | 327,321 | | | $ | 89,022 | |
| KeyCorp | | | 4,886,953 | | | | 84,202 | |
| B3 SA-Brasil, Bolsa, Balcao | | | 39,829,500 | | | | 83,412 | |
| Berkshire Hathaway, Inc., Class B1 | | | 285,000 | | | | 77,811 | |
| S&P Global, Inc. | | | 228,138 | | | | 76,896 | |
| Charles Schwab Corp. | | | 1,145,212 | | | | 72,355 | |
| Webster Financial Corp. | | | 1,701,139 | | | | 71,703 | |
| State Street Corp. | | | 1,077,260 | | | | 66,413 | |
| Power Corporation of Canada, subordinate voting shares2 | | | 2,293,100 | | | | 59,002 | |
| Bank of America Corp. | | | 1,891,332 | | | | 58,877 | |
| Blue Owl Capital, Inc., Class A2 | | | 4,369,165 | | | | 43,823 | |
| MSCI, Inc. | | | 98,300 | | | | 40,514 | |
| Discover Financial Services | | | 363,743 | | | | 34,403 | |
| TPG, Inc., Class A2 | | | 1,347,552 | | | | 32,220 | |
| SVB Financial Group1 | | | 67,100 | | | | 26,504 | |
| Citizens Financial Group, Inc. | | | 728,750 | | | | 26,009 | |
| Principal Financial Group, Inc. | | | 140,880 | | | | 9,409 | |
| CME Group, Inc., Class A | | | 5,500 | | | | 1,126 | |
| | | | | | | | 3,042,614 | |
| | | | | | | | | |
| Consumer discretionary 7.95% | | | | | | | | |
| Amazon.com, Inc.1 | | | 7,241,191 | | | | 769,087 | |
| General Motors Company1 | | | 8,736,000 | | | | 277,455 | |
| Dollar Tree Stores, Inc.1 | | | 1,279,006 | | | | 199,333 | |
| Home Depot, Inc. | | | 658,461 | | | | 180,596 | |
| Hilton Worldwide Holdings, Inc. | | | 1,337,320 | | | | 149,031 | |
| Wyndham Hotels & Resorts, Inc. | | | 1,842,940 | | | | 121,118 | |
| Royal Caribbean Cruises, Ltd.1 | | | 2,814,603 | | | | 98,258 | |
| Dollar General Corp. | | | 335,615 | | | | 82,373 | |
| InterContinental Hotels Group PLC | | | 1,396,700 | | | | 73,959 | |
| Lear Corp. | | | 569,068 | | | | 71,640 | |
| Chipotle Mexican Grill, Inc.1 | | | 53,110 | | | | 69,429 | |
| Kering SA | | | 101,695 | | | | 52,231 | |
| Rivian Automotive, Inc., Class A1,2 | | | 1,838,450 | | | | 47,322 | |
| McDonald’s Corp. | | | 186,000 | | | | 45,920 | |
| Ford Motor Co. | | | 3,848,000 | | | | 42,828 | |
| Starbucks Corp. | | | 524,000 | | | | 40,028 | |
| Aptiv PLC1 | | | 427,399 | | | | 38,068 | |
| CarMax, Inc.1 | | | 379,600 | | | | 34,346 | |
| Darden Restaurants, Inc. | | | 296,000 | | | | 33,484 | |
| Airbnb, Inc., Class A1 | | | 350,000 | | | | 31,178 | |
| D.R. Horton, Inc. | | | 457,091 | | | | 30,255 | |
| Burlington Stores, Inc.1 | | | 201,000 | | | | 27,382 | |
| VF Corp. | | | 555,000 | | | | 24,514 | |
| Norwegian Cruise Line Holdings, Ltd.1,2 | | | 2,047,967 | | | | 22,773 | |
| YUM! Brands, Inc. | | | 196,630 | | | | 22,320 | |
| NVR, Inc.1 | | | 5,298 | | | | 21,214 | |
| | | | | | | | 2,606,142 | |
| | | | | | | | | |
| Consumer staples 5.36% | | | | | | | | |
| Philip Morris International, Inc. | | | 6,790,089 | | | | 670,453 | |
| British American Tobacco PLC | | | 9,433,859 | | | | 404,174 | |
| Keurig Dr Pepper, Inc. | | | 5,314,367 | | | | 188,075 | |
| General Mills, Inc. | | | 1,378,800 | | | | 104,030 | |
| Molson Coors Beverage Company, Class B, restricted voting shares | | | 1,620,313 | | | | 88,323 | |
| Mondelez International, Inc. | | | 1,332,847 | | | | 82,757 | |
| Anheuser-Busch InBev SA/NV | | | 1,339,531 | | | | 72,097 | |
| Archer Daniels Midland Company | | | 540,100 | | | | 41,912 | |
| Bunge, Ltd. | | | 388,852 | | | | 35,265 | |
| | | | | | | | | |
| American Funds Insurance Series | 83 |
Growth-Income Fund (continued)
| Common stocks (continued) | | Shares | | | Value
(000) | |
| Consumer staples (continued) | | | | | | | | |
| Procter & Gamble Company | | | 180,677 | | | $ | 25,980 | |
| Kraft Heinz Company | | | 567,200 | | | | 21,633 | |
| Constellation Brands, Inc., Class A | | | 91,971 | | | | 21,435 | |
| | | | | | | | 1,756,134 | |
| | | | | | | | | |
| Energy 5.16% | | | | | | | | |
| Canadian Natural Resources, Ltd. (CAD denominated) | | | 7,047,400 | | | | 378,705 | |
| ConocoPhillips | | | 3,413,983 | | | | 306,610 | |
| Chevron Corp. | | | 2,053,300 | | | | 297,277 | |
| EOG Resources, Inc. | | | 2,040,378 | | | | 225,339 | |
| Baker Hughes Co., Class A | | | 6,585,624 | | | | 190,127 | |
| TC Energy Corp. (CAD denominated)2 | | | 1,821,019 | | | | 94,333 | |
| Equitrans Midstream Corp. | | | 10,215,807 | | | | 64,973 | |
| Exxon Mobil Corp. | | | 660,220 | | | | 56,541 | |
| Suncor Energy, Inc. | | | 1,451,133 | | | | 50,911 | |
| Halliburton Company | | | 738,400 | | | | 23,156 | |
| Weatherford International1 | | | 100,000 | | | | 2,117 | |
| | | | | | | | 1,690,089 | |
| | | | | | | | | |
| Utilities 3.17% | | | | | | | | |
| PG&E Corp.1 | | | 24,316,996 | | | | 242,684 | |
| Edison International | | | 1,947,800 | | | | 123,179 | |
| Entergy Corp. | | | 963,500 | | | | 108,529 | |
| CenterPoint Energy, Inc. | | | 2,840,104 | | | | 84,010 | |
| Constellation Energy Corp. | | | 1,414,838 | | | | 81,014 | |
| Sempra Energy | | | 510,000 | | | | 76,638 | |
| Enel SpA | | | 12,931,498 | | | | 70,739 | |
| AES Corp. | | | 2,803,707 | | | | 58,906 | |
| DTE Energy Company | | | 401,000 | | | | 50,827 | |
| CMS Energy Corp. | | | 729,800 | | | | 49,261 | |
| NextEra Energy, Inc. | | | 460,000 | | | | 35,632 | |
| Exelon Corp. | | | 643,766 | | | | 29,175 | |
| Evergy, Inc. | | | 418,980 | | | | 27,338 | |
| | | | | | | | 1,037,932 | |
| | | | | | | | | |
| Materials 2.95% | | | | | | | | |
| Linde PLC | | | 1,000,332 | | | | 287,626 | |
| Vale SA, ordinary nominative shares (ADR) | | | 8,009,475 | | | | 117,179 | |
| Vale SA, ordinary nominative shares | | | 3,404,848 | | | | 49,809 | |
| LyondellBasell Industries NV | | | 1,735,980 | | | | 151,829 | |
| Celanese Corp. | | | 779,474 | | | | 91,674 | |
| Freeport-McMoRan, Inc. | | | 2,382,960 | | | | 69,725 | |
| Corteva, Inc. | | | 908,750 | | | | 49,200 | |
| Sherwin-Williams Company | | | 196,181 | | | | 43,927 | |
| Barrick Gold Corp. | | | 2,373,000 | | | | 41,978 | |
| Allegheny Technologies, Inc.1 | | | 1,769,447 | | | | 40,184 | |
| Albemarle Corp. | | | 112,161 | | | | 23,439 | |
| | | | | | | | 966,570 | |
| | | | | | | | | |
| Real estate 2.21% | | | | | | | | |
| VICI Properties, Inc. REIT | | | 12,137,342 | | | | 361,571 | |
| Equinix, Inc. REIT | | | 298,158 | | | | 195,896 | |
| Crown Castle International Corp. REIT | | | 864,782 | | | | 145,612 | |
| Digital Realty Trust, Inc. REIT | | | 160,000 | | | | 20,773 | |
| | | | | | | | 723,852 | |
| | | | | | | | | |
| Total common stocks (cost: $20,458,974,000) | | | | | | | 29,687,493 | |
| | |
| 84 | American Funds Insurance Series |
Growth-Income Fund (continued)
| Convertible stocks 1.19% | | Shares | | | Value
(000) | |
| Health care 0.50% | | | | | | | | |
| Danaher Corp., Series B, cumulative convertible preferred shares, 5.00% 20232 | | | 123,957 | | | $ | 164,021 | |
| | | | | | | | | |
| Information technology 0.47% | | | | | | | | |
| Broadcom, Inc., Series A, cumulative convertible preferred shares, 8.00% 2022 | | | 102,783 | | | | 154,498 | |
| | | | | | | | | |
| Consumer discretionary 0.12% | | | | | | | | |
| Aptiv PLC, Series A, convertible preferred shares, 5.50% 2023 | | | 379,775 | | | | 40,024 | |
| | | | | | | | | |
| Financials 0.09% | | | | | | | | |
| KKR & Co., Inc., Series C, convertible preferred shares, 6.00% 2023 | | | 527,700 | | | | 30,855 | |
| | | | | | | | | |
| Industrials 0.01% | | | | | | | | |
| Stanley Black & Decker, Inc., convertible preferred shares, 5.25% 2022 | | | 35,448 | | | | 2,389 | |
| | | | | | | | | |
| Total convertible stocks (cost: $372,605,000) | | | | | | | 391,787 | |
| | | | | | | | | |
| Bonds, notes & other debt instruments 0.02% | | Principal amount
(000 | ) | | | | |
| Corporate bonds, notes & loans 0.02% | | | | | | | | |
| Industrials 0.02% | | | | | | | | |
| Boeing Company 4.875% 2025 | | USD | 4,706 | | | | 4,695 | |
| | | | | | | | | |
| Consumer discretionary 0.00% | | | | | | | | |
| General Motors Financial Co. 4.30% 2025 | | | 160 | | | | 158 | |
| General Motors Financial Co. 5.25% 2026 | | | 827 | | | | 829 | |
| | | | | | | | 987 | |
| | | | | | | | | |
| Energy 0.00% | | | | | | | | |
| Weatherford International, Ltd. 11.00% 20243 | | | 637 | | | | 643 | |
| | | | | | | | | |
| Total corporate bonds, notes & loans | | | | | | | 6,325 | |
| Total bonds, notes & other debt instruments (cost: $6,224,000) | | | | | | | 6,325 | |
| | | | | | | |
| Short-term securities 8.68% | | Shares | | | | | |
| Money market investments 6.89% | | | | | | | | |
| Capital Group Central Cash Fund 1.38%4,5 | | | 22,578,323 | | | | 2,257,381 | |
| | | | | | | | | |
| | | Weighted
average yield | | | Principal amount | | | | |
| | | at acquisition | | | (000) | | | | |
| U.S. Treasury bills 1.30% | | | | | | | | | |
| U.S. Treasury 7/14/2022 | | | 0.752 | % | | USD | 425,900 | | | | 425,733 | |
| | | | | | | | | | | | | |
| | | Shares | | | | |
| Money market investments purchased with collateral from securities on loan 0.49% | | | | | | | | |
| Capital Group Central Cash Fund 1.38%4,5,6 | | | 455,088 | | | | 45,499 | |
| Goldman Sachs Financial Square Government Fund, Institutional Shares 1.39%4,6 | | | 24,023,345 | | | | 24,023 | |
| BlackRock Liquidity Funds – FedFund, Institutional Shares 1.32%4,6 | | | 22,749,855 | | | | 22,750 | |
| | |
| American Funds Insurance Series | 85 |
Growth-Income Fund (continued)
| Short-term securities (continued) | | Shares | | | Value
(000) | |
| Money market investments purchased with collateral from securities on loan (continued) | | | | | | | | |
| Invesco Short-Term Investments Trust – Government & Agency Portfolio, Institutional Class 1.38%4,6 | | | 22,749,855 | | | $ | 22,750 | |
| Morgan Stanley Institutional Liquidity Funds – Government Portfolio, Institutional Class 1.38%4,6 | | | 22,749,855 | | | | 22,750 | |
| State Street Institutional U.S. Government Money Market Fund, Institutional Class 1.40%4,6 | | | 22,749,855 | | | | 22,750 | |
| | | | | | | | 160,522 | |
| | | | | | | | | |
| Total short-term securities (cost: $2,843,952,000) | | | | | | | 2,843,636 | |
| Total investment securities 100.49% (cost: $23,681,755,000) | | | | | | | 32,929,241 | |
| Other assets less liabilities (0.49)% | | | | | | | (160,481 | ) |
| | | | | | | | | |
| Net assets 100.00% | | | | | | $ | 32,768,760 | |
Investments in affiliates5
| | | Value of
affiliates at
1/1/2022
(000) | | | Additions
(000) | | | Reductions
(000) | | | Net
realized
loss
(000) | | | Net
unrealized
depreciation
(000) | | | Value of
affiliates at
6/30/2022
(000) | | | Dividend
income
(000) | |
| Short-term securities 7.03% | | | | | | | | | | | | | | | | | | | | | | | | | | | | |
| Money market investments 6.89% | | | | | | | | | | | | | | | | | | | | | | | | | | | | |
| Capital Group Central Cash Fund 1.38%4 | | $ | 1,220,761 | | | $ | 3,693,243 | | | $ | 2,656,129 | | | $ | (29 | ) | | $ | (465 | ) | | $ | 2,257,381 | | | $ | 4,194 | |
| Money market investments purchased with collateral from securities on loan 0.14% | | | | | | | | | | | | | | | | | | | | | | | | | | | | |
| Capital Group Central Cash Fund 1.38%4,6 | | | 39,148 | | | | 6,351 | 7 | | | | | | | | | | | | | | | 45,499 | | | | — | 8 |
| Total short-term securities | | | | | | | | | | | | | | | | | | | | | | | 2,302,880 | | | | | |
| Total 7.03% | | | | | | | | | | | | | | $ | (29 | ) | | $ | (465 | ) | | $ | 2,302,880 | | | $ | 4,194 | |
| | |
| 1 | Security did not produce income during the last 12 months. |
| 2 | All or a portion of this security was on loan. The total value of all such securities was $171,950,000, which represented .52% of the net assets of the fund. Refer to Note 5 for more information on securities lending. |
| 3 | Acquired in a transaction exempt from registration under Rule 144A of the Securities Act of 1933. May be resold in the U.S. in transactions exempt from registration, normally to qualified institutional buyers. The total value of all such securities was $643,000, which represented less than .01% of the net assets of the fund. |
| 4 | Rate represents the seven-day yield at 6/30/2022. |
| 5 | Part of the same “group of investment companies” as the fund as defined under the Investment Company Act of 1940, as amended. |
| 6 | Security purchased with cash collateral from securities on loan. Refer to Note 5 for more information on securities lending. |
| 7 | Represents net activity. Refer to Note 5 for more information on securities lending. |
| 8 | Dividend income is included with securities lending income in the fund’s statement of operations and is not shown in this table. |
Key to abbreviations
ADR = American Depositary Receipts
CAD = Canadian dollars
REIT = Real Estate Investment Trust
USD = U.S. dollars
Refer to the notes to financial statements.
| 86 | American Funds Insurance Series |
International Growth and Income Fund
| Investment portfolio June 30, 2022 | unaudited |
| | |
| Common stocks 91.29% | | Shares | | | Value
(000) | |
| Financials 15.12% | | | | | | | | |
| Ping An Insurance (Group) Company of China, Ltd., Class H | | | 594,500 | | | $ | 4,042 | |
| AXA SA | | | 157,942 | | | | 3,585 | |
| AIA Group, Ltd. | | | 314,200 | | | | 3,406 | |
| Toronto-Dominion Bank (CAD denominated) | | | 40,774 | | | | 2,674 | |
| Euronext NV | | | 20,289 | | | | 1,656 | |
| Hong Kong Exchanges and Clearing, Ltd. | | | 33,100 | | | | 1,628 | |
| HDFC Bank, Ltd. | | | 94,308 | | | | 1,610 | |
| Société Générale | | | 66,916 | | | | 1,465 | |
| Zurich Insurance Group AG | | | 3,302 | | | | 1,436 | |
| DNB Bank ASA | | | 74,593 | | | | 1,337 | |
| UniCredit SpA | | | 129,378 | | | | 1,229 | |
| B3 SA-Brasil, Bolsa, Balcao | | | 575,984 | | | | 1,206 | |
| KBC Groep NV | | | 21,390 | | | | 1,200 | |
| Aon PLC, Class A | | | 4,304 | | | | 1,161 | |
| London Stock Exchange Group PLC | | | 12,499 | | | | 1,161 | |
| Resona Holdings, Inc. | | | 301,900 | | | | 1,131 | |
| HDFC Life Insurance Company, Ltd. | | | 155,362 | | | | 1,082 | |
| UBS Group AG | | | 55,531 | | | | 895 | |
| Banco Santander, SA | | | 301,578 | | | | 849 | |
| Skandinaviska Enskilda Banken AB, Class A | | | 85,977 | | | | 844 | |
| Banco Bilbao Vizcaya Argentaria, SA | | | 176,628 | | | | 802 | |
| Industrial and Commercial Bank of China, Ltd., Class H | | | 1,231,040 | | | | 731 | |
| Prudential PLC | | | 56,970 | | | | 705 | |
| Fairfax Financial Holdings, Ltd., subordinate voting shares | | | 1,188 | | | | 630 | |
| Hang Seng Bank, Ltd. | | | 35,700 | | | | 630 | |
| China Merchants Bank Co., Ltd., Class H | | | 92,000 | | | | 616 | |
| Brookfield Asset Management, Inc., Class A (CAD denominated) | | | 13,334 | | | | 593 | |
| Tokio Marine Holdings, Inc. | | | 10,100 | | | | 588 | |
| DBS Group Holdings, Ltd. | | | 27,095 | | | | 579 | |
| Islandsbanki hf. | | | 625,967 | | | | 567 | |
| XP, Inc., Class A1 | | | 29,924 | | | | 537 | |
| Postal Savings Bank of China Co., Ltd., Class H | | | 659,000 | | | | 523 | |
| Discovery, Ltd.1 | | | 61,031 | | | | 481 | |
| Banca Generali SpA | | | 16,214 | | | | 458 | |
| Bank of Nova Scotia (CAD denominated) | | | 7,643 | | | | 452 | |
| Kotak Mahindra Bank, Ltd. | | | 17,873 | | | | 376 | |
| Partners Group Holding AG | | | 403 | | | | 363 | |
| ICICI Securities, Ltd. | | | 45,682 | | | | 248 | |
| EQT AB | | | 11,659 | | | | 239 | |
| Allfunds Group PLC | | | 26,191 | | | | 202 | |
| ING Groep NV | | | 17,116 | | | | 169 | |
| ICICI Bank, Ltd. (ADR) | | | 9,236 | | | | 164 | |
| Moscow Exchange MICEX-RTS PJSC1,2,3 | | | 346,177 | | | | — | 4 |
| Sberbank of Russia PJSC1,2,3,5 | | | 476,388 | | | | — | 4 |
| | | | | | | | 44,250 | |
| | | | | | | | | |
| Consumer staples 12.46% | | | | | | | | |
| British American Tobacco PLC | | | 225,738 | | | | 9,672 | |
| Philip Morris International, Inc. | | | 55,231 | | | | 5,454 | |
| Nestlé SA | | | 32,890 | | | | 3,840 | |
| Kweichow Moutai Co., Ltd., Class A | | | 10,600 | | | | 3,238 | |
| Anheuser-Busch InBev SA/NV | | | 40,341 | | | | 2,171 | |
| Carlsberg A/S, Class B | | | 11,219 | | | | 1,429 | |
| Imperial Brands PLC | | | 58,436 | | | | 1,306 | |
| Wuliangye Yibin Co., Ltd., Class A | | | 42,700 | | | | 1,288 | |
| Pernod Ricard SA | | | 6,233 | | | | 1,145 | |
| Foshan Haitian Flavouring and Food Co., Ltd., Class A | | | 71,354 | | | | 963 | |
| Asahi Group Holdings, Ltd.6 | | | 27,500 | | | | 901 | |
| Carrefour SA, non-registered shares | | | 47,118 | | | | 834 | |
| Japan Tobacco, Inc. | | | 46,800 | | | | 809 | |
| Associated British Foods PLC | | | 40,194 | | | | 772 | |
| Ocado Group PLC1 | | | 63,803 | | | | 607 | |
| | |
| American Funds Insurance Series | 87 |
International Growth and Income Fund (continued)
| Common stocks (continued) | | Shares | | | Value
(000) | |
| Consumer staples (continued) | | | | | | | | |
| Arca Continental, SAB de CV | | | 79,817 | | | $ | 526 | |
| Varun Beverages, Ltd. | | | 42,575 | | | | 426 | |
| L’Oréal SA, non-registered shares | | | 1,159 | | | | 400 | |
| Reckitt Benckiser Group PLC | | | 4,662 | | | | 350 | |
| Danone SA | | | 4,142 | | | | 231 | |
| Avenue Supermarts, Ltd.1 | | | 2,324 | | | | 100 | |
| X5 Retail Group NV (GDR)2,3 | | | 4,521 | | | | — | 4 |
| | | | | | | | 36,462 | |
| | | | | | | | | |
| Information technology 11.52% | | | | | | | | |
| Taiwan Semiconductor Manufacturing Company, Ltd. | | | 546,000 | | | | 8,741 | |
| ASML Holding NV | | | 10,243 | | | | 4,893 | |
| Tokyo Electron, Ltd. | | | 9,000 | | | | 2,939 | |
| Edenred SA | | | 50,961 | | | | 2,402 | |
| MediaTek, Inc. | | | 84,000 | | | | 1,839 | |
| Samsung Electronics Co., Ltd. | | | 41,275 | | | | 1,812 | |
| Broadcom, Inc. | | | 3,663 | | | | 1,780 | |
| Kingdee International Software Group Co., Ltd.1 | | | 446,000 | | | | 1,046 | |
| SAP SE | | | 11,226 | | | | 1,023 | |
| Keyence Corp. | | | 2,700 | | | | 923 | |
| Nokia Corp. | | | 184,636 | | | | 859 | |
| SK hynix, Inc. | | | 12,042 | | | | 844 | |
| TDK Corp. | | | 25,300 | | | | 781 | |
| Logitech International SA6 | | | 14,122 | | | | 738 | |
| EPAM Systems, Inc.1 | | | 1,859 | | | | 548 | |
| Vanguard International Semiconductor Corp. | | | 182,000 | | | | 470 | |
| Halma PLC | | | 13,130 | | | | 321 | |
| Capgemini SE | | | 1,725 | | | | 295 | |
| Amadeus IT Group SA, Class A, non-registered shares1 | | | 4,613 | | | | 257 | |
| Infosys, Ltd. (ADR) | | | 13,636 | | | | 252 | |
| AVEVA Group PLC | | | 7,320 | | | | 201 | |
| Nice, Ltd. (ADR)1 | | | 946 | | | | 182 | |
| Nomura Research Institute, Ltd. | | | 5,300 | | | | 141 | |
| Fujitsu, Ltd. | | | 1,000 | | | | 125 | |
| eMemory Technology, Inc.2 | | | 3,000 | | | | 103 | |
| Lightspeed Commerce, Inc., subordinate voting shares1,6 | | | 2,130 | | | | 47 | |
| Lightspeed Commerce, Inc., subordinate voting shares (CAD denominated)1 | | | 1,792 | | | | 40 | |
| STMicroelectronics NV | | | 2,295 | | | | 72 | |
| DLocal, Ltd., Class A1 | | | 2,309 | | | | 61 | |
| | | | | | | | 33,735 | |
| | | | | | | | | |
| Consumer discretionary 11.23% | | | | | | | | |
| Evolution AB | | | 42,576 | | | | 3,871 | |
| LVMH Moët Hennessy-Louis Vuitton SE | | | 5,788 | | | | 3,528 | |
| Renault SA1 | | | 74,924 | | | | 1,868 | |
| InterContinental Hotels Group PLC | | | 25,460 | | | | 1,348 | |
| MGM China Holdings, Ltd.1 | | | 2,300,000 | | | | 1,304 | |
| Restaurant Brands International, Inc. (CAD denominated) | | | 25,900 | | | | 1,299 | |
| Coupang, Inc., Class A1 | | | 99,034 | | | | 1,263 | |
| Prosus NV, Class N | | | 19,000 | | | | 1,244 | |
| Stellantis NV | | | 98,287 | | | | 1,214 | |
| Midea Group Co., Ltd., Class A | | | 133,400 | | | | 1,203 | |
| Li Ning Co., Ltd. | | | 122,000 | | | | 1,130 | |
| Galaxy Entertainment Group, Ltd. | | | 182,000 | | | | 1,086 | |
| OPAP SA | | | 67,568 | | | | 967 | |
| B&M European Value Retail SA | | | 202,634 | | | | 905 | |
| Wynn Macau, Ltd.1 | | | 1,318,400 | | | | 896 | |
| Mercedes-Benz Group AG | | | 15,347 | | | | 888 | |
| Sodexo SA | | | 11,499 | | | | 808 | |
| Valeo SA, non-registered shares | | | 40,094 | | | | 774 | |
| Nitori Holdings Co., Ltd. | | | 7,400 | | | | 703 | |
| Industria de Diseño Textil, SA | | | 29,457 | | | | 667 | |
| | |
| 88 | American Funds Insurance Series |
International Growth and Income Fund (continued)
| Common stocks (continued) | | Shares | | | Value
(000) | |
| Consumer discretionary (continued) | | | | | | | | |
| EssilorLuxottica | | | 4,450 | | | $ | 666 | |
| Paltac Corp. | | | 21,500 | | | | 666 | |
| Sands China, Ltd.1 | | | 275,200 | | | | 657 | |
| Entain PLC1 | | | 33,218 | | | | 503 | |
| Pop Mart International Group, Ltd. | | | 91,400 | | | | 441 | |
| Pan Pacific International Holdings Corp. | | | 24,400 | | | | 389 | |
| Americanas SA, ordinary nominative shares | | | 150,325 | | | | 386 | |
| D’Ieteren Group | | | 2,482 | | | | 363 | |
| Kindred Group PLC (SDR) | | | 39,687 | | | | 330 | |
| JD.com, Inc., Class A | | | 9,324 | | | | 300 | |
| adidas AG | | | 1,537 | | | | 272 | |
| Games Workshop Group PLC | | | 2,691 | | | | 219 | |
| Domino’s Pizza Enterprises, Ltd. | | | 4,471 | | | | 210 | |
| IDP Education, Ltd. | | | 12,216 | | | | 201 | |
| Kering SA | | | 287 | | | | 147 | |
| Balkrishna Industries, Ltd. | | | 3,940 | | | | 107 | |
| MercadoLibre, Inc.1 | | | 88 | | | | 56 | |
| | | | | | | | 32,879 | |
| | | | | | | | | |
| Industrials 10.83% | | | | | | | | |
| Airbus SE, non-registered shares | | | 50,956 | | | | 4,937 | |
| BAE Systems PLC | | | 445,308 | | | | 4,500 | |
| Rheinmetall AG | | | 7,282 | | | | 1,681 | |
| CCR SA, ordinary nominative shares | | | 663,205 | | | | 1,588 | |
| ABB, Ltd. | | | 53,832 | | | | 1,436 | |
| SMC Corp. | | | 3,100 | | | | 1,382 | |
| LIXIL Corp. | | | 67,600 | | | | 1,265 | |
| RELX PLC | | | 46,044 | | | | 1,248 | |
| Alliance Global Group, Inc. | | | 7,774,400 | | | | 1,244 | |
| Cathay Pacific Airways, Ltd.1 | | | 1,112,000 | | | | 1,217 | |
| Husqvarna AB, Class B | | | 137,565 | | | | 1,012 | |
| Daikin Industries, Ltd. | | | 5,800 | | | | 930 | |
| Ryanair Holdings PLC (ADR)1 | | | 13,438 | | | | 904 | |
| Brenntag SE | | | 12,910 | | | | 840 | |
| Safran SA | | | 7,582 | | | | 749 | |
| Waste Connections, Inc. (CAD denominated) | | | 5,214 | | | | 646 | |
| InPost SA1 | | | 98,336 | | | | 570 | |
| Siemens AG | | | 5,122 | | | | 521 | |
| Bunzl PLC | | | 15,343 | | | | 508 | |
| Experian PLC | | | 17,224 | | | | 504 | |
| TFI International, Inc. (CAD denominated) | | | 5,970 | | | | 479 | |
| Coor Service Management Holding AB | | | 57,449 | | | | 451 | |
| Epiroc AB, Class A | | | 19,808 | | | | 306 | |
| Epiroc AB, Class B | | | 10,197 | | | | 138 | |
| Caterpillar, Inc. | | | 2,260 | | | | 404 | |
| BELIMO Holding AG | | | 1,068 | | | | 376 | |
| Deutsche Post AG | | | 9,567 | | | | 358 | |
| Interpump Group SpA | | | 8,630 | | | | 329 | |
| DSV A/S | | | 2,122 | | | | 296 | |
| SITC International Holdings Co., Ltd. | | | 79,659 | | | | 225 | |
| Adecco Group AG | | | 6,455 | | | | 219 | |
| Wizz Air Holdings PLC1 | | | 9,958 | | | | 213 | |
| Hitachi, Ltd. | | | 2,400 | | | | 114 | |
| Contemporary Amperex Technology Co., Ltd., Class A | | | 1,300 | | | | 104 | |
| | | | | | | | 31,694 | |
| | | | | | | | | |
| Health care 9.90% | | | | | | | | |
| AstraZeneca PLC | | | 73,599 | | | | 9,676 | |
| Novo Nordisk A/S, Class B | | | 39,486 | | | | 4,379 | |
| Sanofi | | | 37,985 | | | | 3,835 | |
| GSK PLC | | | 125,753 | | | | 2,703 | |
| Bayer AG | | | 27,477 | | | | 1,633 | |
| | |
| American Funds Insurance Series | 89 |
International Growth and Income Fund (continued)
| Common stocks (continued) | | Shares | | | Value
(000) | |
| Health care (continued) | | | | | | | | |
| Siemens Healthineers AG | | | 29,414 | | | $ | 1,495 | |
| Grifols, SA, Class B (ADR)1 | | | 89,399 | | | | 1,062 | |
| Shionogi & Co., Ltd. | | | 14,600 | | | | 738 | |
| EUROAPI1 | | | 38,541 | | | | 608 | |
| Koninklijke Philips NV (EUR denominated)6 | | | 20,932 | | | | 451 | |
| Sonova Holding AG | | | 1,294 | | | | 412 | |
| Roche Holding AG, nonvoting non-registered shares | | | 1,183 | | | | 395 | |
| Novartis AG | | | 4,335 | | | | 367 | |
| CanSino Biologics, Inc., Class H | | | 30,400 | | | | 311 | |
| Genus PLC | | | 7,584 | | | | 231 | |
| Hutchmed China, Ltd. (ADR)1 | | | 17,569 | | | | 222 | |
| BeiGene, Ltd. (ADR)1 | | | 1,332 | | | | 216 | |
| Hypera SA, ordinary nominative shares | | | 27,468 | | | | 200 | |
| Innovent Biologics, Inc.1 | | | 13,000 | | | | 58 | |
| | | | | | | | 28,992 | |
| | | | | | | | | |
| Energy 5.77% | | | | | | | | |
| BP PLC | | | 586,455 | | | | 2,772 | |
| TC Energy Corp. (CAD denominated) | | | 41,511 | | | | 2,150 | |
| TotalEnergies SE | | | 39,592 | | | | 2,090 | |
| Equinor ASA | | | 57,171 | | | | 1,988 | |
| Aker BP ASA (SDR)2 | | | 45,833 | | | | 1,592 | |
| Aker BP ASA | | | 8,613 | | | | 299 | |
| Canadian Natural Resources, Ltd. (CAD denominated) | | | 27,978 | | | | 1,503 | |
| Cameco Corp. | | | 52,229 | | | | 1,098 | |
| Schlumberger, Ltd. | | | 29,844 | | | | 1,067 | |
| Tourmaline Oil Corp. | | | 14,597 | | | | 759 | |
| Reliance Industries, Ltd.1 | | | 19,013 | | | | 625 | |
| TechnipFMC PLC1 | | | 75,572 | | | | 509 | |
| INPEX Corp. | | | 23,700 | | | | 257 | |
| Var Energi ASA | | | 42,709 | | | | 168 | |
| Orron Energy AB | | | 31,059 | | | | 21 | |
| Gazprom PJSC (ADR)2,3 | | | 335,575 | | | | — | 4 |
| LUKOIL Oil Co. PJSC (ADR)2,3 | | | 9,706 | | | | — | 4 |
| Sovcomflot PAO2,3 | | | 356,717 | | | | — | 4 |
| | | | | | | | 16,898 | |
| | | | | | | | | |
| Communication services 4.92% | | | | | | | | |
| Koninklijke KPN NV | | | 793,506 | | | | 2,828 | |
| Tencent Holdings, Ltd. | | | 46,000 | | | | 2,078 | |
| Vodafone Group PLC | | | 1,149,321 | | | | 1,772 | |
| BT Group PLC | | | 690,442 | | | | 1,566 | |
| Nippon Telegraph and Telephone Corp. | | | 38,800 | | | | 1,114 | |
| Publicis Groupe SA | | | 19,700 | | | | 963 | |
| América Móvil, SAB de CV, Series L (ADR) | | | 45,273 | | | | 925 | |
| SoftBank Corp. | | | 59,500 | | | | 661 | |
| Indus Towers, Ltd. | | | 245,887 | | | | 651 | |
| Deutsche Telekom AG | | | 28,506 | | | | 566 | |
| Viaplay Group AB, Class B1 | | | 20,507 | | | | 421 | |
| Telefónica, SA, non-registered shares1 | | | 53,453 | | | | 272 | |
| NetEase, Inc. | | | 10,800 | | | | 198 | |
| Universal Music Group NV | | | 9,437 | | | | 189 | |
| Sea, Ltd., Class A (ADR)1 | | | 2,777 | | | | 186 | |
| Yandex NV, Class A1,2,3 | | | 5,000 | | | | — | 4 |
| | | | | | | | 14,390 | |
| | | | | | | | | |
| Materials 4.67% | | | | | | | | |
| Vale SA, ordinary nominative shares | | | 216,760 | | | | 3,171 | |
| Vale SA, ordinary nominative shares (ADR) | | | 107,874 | | | | 1,578 | |
| Linde PLC | | | 7,517 | | | | 2,161 | |
| Koninklijke DSM NV | | | 8,300 | | | | 1,193 | |
| Barrick Gold Corp. (CAD denominated)6 | | | 29,977 | | | | 530 | |
| | | | | | | | | |
| 90 | American Funds Insurance Series |
International Growth and Income Fund (continued)
| Common stocks (continued) | | Shares | | | Value
(000) | |
| Materials (continued) | | | | | | | | |
| Barrick Gold Corp. | | | 27,000 | | | $ | 478 | |
| Asahi Kasei Corp. | | | 98,300 | | | | 751 | |
| Glencore PLC | | | 131,072 | | | | 710 | |
| Rio Tinto PLC | | | 10,440 | | | | 625 | |
| Sociedad Química y Minera de Chile SA, Class B (ADR) | | | 6,427 | | | | 537 | |
| Fortescue Metals Group, Ltd. | | | 42,224 | | | | 511 | |
| Fresnillo PLC | | | 33,572 | | | | 313 | |
| Sika AG | | | 1,208 | | | | 278 | |
| Air Liquide SA, non-registered shares | | | 1,669 | | | | 224 | |
| Shandong Sinocera Functional Material Co., Ltd., Class A | | | 41,300 | | | | 222 | |
| Shin-Etsu Chemical Co., Ltd. | | | 1,900 | | | | 214 | |
| Givaudan SA | | | 52 | | | | 183 | |
| Alrosa PJSC2,3 | | | 53,607 | | | | — | 4 |
| | | | | | | | 13,679 | |
| | | | | | | | | |
| Utilities 2.59% | | | | | | | | |
| Engie SA | | | 190,289 | | | | 2,187 | |
| Brookfield Infrastructure Partners LP | | | 55,511 | | | | 2,121 | |
| Enel SpA | | | 254,531 | | | | 1,392 | |
| ENN Energy Holdings, Ltd. | | | 73,800 | | | | 1,212 | |
| Iberdrola, SA, non-registered shares | | | 36,760 | | | | 381 | |
| Guangdong Investment, Ltd. | | | 276,000 | | | | 292 | |
| | | | | | | | 7,585 | |
| | | | | | | | | |
| Real estate 2.28% | | | | | | | | |
| CK Asset Holdings, Ltd. | | | 324,500 | | | | 2,295 | |
| Longfor Group Holdings, Ltd. | | | 443,000 | | | | 2,092 | |
| Link REIT | | | 104,400 | | | | 851 | |
| Embassy Office Parks REIT | | | 133,382 | | | | 632 | |
| Unibail-Rodamco-Westfield REIT, non-registered shares1 | | | 10,527 | | | | 537 | |
| Country Garden Services Holdings Co., Ltd. | | | 60,000 | | | | 267 | |
| | | | | | | | 6,674 | |
| | | | | | | | | |
| Total common stocks (cost: $290,577,000) | | | | | | | 267,238 | |
| | | | | | | |
| Preferred securities 0.65% | | | | | | |
| Information technology 0.33% | | | | | | | | |
| Samsung Electronics Co., Ltd., nonvoting preferred shares | | | 23,993 | | | | 961 | |
| | | | | | | | | |
| Materials 0.16% | | | | | | | | |
| Gerdau SA, preferred nominative shares | | | 113,297 | | | | 484 | |
| | | | | | | | | |
| Consumer discretionary 0.16% | | | | | | | | |
| Volkswagen AG, nonvoting preferred shares | | | 3,471 | | | | 463 | |
| | | | | | | | | |
| Total preferred securities (cost: $2,726,000) | | | | | | | 1,908 | |
| | | | | | | | | |
| Short-term securities 7.83% | | | | | | | | |
| Money market investments 7.40% | | | | | | | | |
| Capital Group Central Cash Fund 1.38%7,8 | | | 216,555 | | | | 21,651 | |
| | |
| American Funds Insurance Series | 91 |
International Growth and Income Fund (continued)
| Short-term securities (continued) | | Shares | | | Value
(000) | |
| Money market investments purchased with collateral from securities on loan 0.43% | | | | | | | | |
| Capital Group Central Cash Fund 1.38%7,8,9 | | | 3,605 | | | $ | 361 | |
| Goldman Sachs Financial Square Government Fund, Institutional Shares 1.39%7,9 | | | 190,311 | | | | 191 | |
| BlackRock Liquidity Funds – FedFund, Institutional Shares 1.32%7,9 | | | 180,222 | | | | 180 | |
| Invesco Short-Term Investments Trust – Government & Agency Portfolio, Institutional Class 1.38%7,9 | | | 180,223 | | | | 180 | |
| Morgan Stanley Institutional Liquidity Funds – Government Portfolio, Institutional Class 1.38%7,9 | | | 180,223 | | | | 180 | |
| State Street Institutional U.S. Government Money Market Fund, Institutional Class 1.40%7,9 | | | 180,223 | | | | 180 | |
| | | | | | | | 1,272 | |
| | | | | | | | | |
| Total short-term securities (cost: $22,924,000) | | | | | | | 22,923 | |
| Total investment securities 99.77% (cost: $316,227,000) | | | | | | | 292,069 | |
| Other assets less liabilities 0.23% | | | | | | | 671 | |
| | | | | | | | | |
| Net assets 100.00% | | | | | | $ | 292,740 | |
Forward currency contracts
| | | | | | | Unrealized | |
| Contract amount | | | | | | appreciation | |
| Currency purchased | | Currency sold | | | | | Settlement | | at 6/30/2022 | |
| (000) | | (000) | | | Counterparty | | date | | (000) | |
| | USD 446 | | | GBP 365 | | | JPMorgan Chase | | 9/16/2022 | | | $ | 1 | |
Investments in affiliates8
| | | Value of
affiliates at
1/1/2022
(000) | | | Additions
(000) | | | Reductions
(000) | | | Net
realized
loss
(000) | | | Net
unrealized
depreciation
(000) | | | Value of
affiliates at
6/30/2022
(000) | | | Dividend
income
(000) | |
| Short-term securities 7.52% | | | | | | | | | | | | | | | | | | | | | | | | | | | | |
| Money market investments 7.40% | | | | | | | | | | | | | | | | | | | | | | | | | | | | |
| Capital Group Central Cash Fund 1.38%7 | | $ | 21,699 | | | $ | 53,334 | | | $ | 53,374 | | | $ | (2 | ) | | $ | (6 | ) | | $ | 21,651 | | | $ | 52 | |
| Money market investments purchased with collateral from securities on loan 0.12% | | | | | | | | | | | | | | | | | | | | | | | | | | | | |
| Capital Group Central Cash Fund 1.38%7,9 | | | — | | | | 361 | 10 | | | | | | | | | | | | | | | 361 | | | | — | 11 |
| Total short-term securities | | | | | | | | | | | | | | | | | | | | | | | 22,012 | | | | | |
| Total 7.52% | | | | | | | | | | | | | | $ | (2 | ) | | $ | (6 | ) | | $ | 22,012 | | | $ | 52 | |
| | |
| 1 | Security did not produce income during the last 12 months. |
| 2 | Valued under fair value procedures adopted by authority of the board of trustees. The total value of all such securities was $1,695,000, which represented .58% of the net assets of the fund. |
| 3 | Value determined using significant unobservable inputs. |
| 4 | Amount less than one thousand. |
| 5 | Acquired in a transaction exempt from registration under Rule 144A of the Securities Act of 1933. May be resold in the U.S. in transactions exempt from registration, normally to qualified institutional buyers. The total value of all such securities was less than $1,000, which represented less than .01% of the net assets of the fund. |
| 6 | All or a portion of this security was on loan. The total value of all such securities was $2,221,000, which represented .76% of the net assets of the fund. Refer to Note 5 for more information on securities lending. |
| 7 | Rate represents the seven-day yield at 6/30/2022. |
| 8 | Part of the same “group of investment companies” as the fund as defined under the Investment Company Act of 1940, as amended. |
| 9 | Security purchased with cash collateral from securities on loan. Refer to Note 5 for more information on securities lending. |
| 10 | Represents net activity. Refer to Note 5 for more information on securities lending. |
| 11 | Dividend income is included with securities lending income in the fund’s statement of operations and is not shown in this table. |
| | |
| 92 | American Funds Insurance Series |
International Growth and Income Fund (continued)
Key to abbreviations
ADR = American Depositary Receipts
CAD = Canadian dollars
EUR = Euros
GBP = British pounds
GDR = Global Depositary Receipts
REIT = Real Estate Investment Trust
SDR = Swedish Depositary Receipts
USD = U.S. dollars
Refer to the notes to financial statements.
| American Funds Insurance Series | 93 |
| Capital Income Builder | |
| Investment portfolio June 30, 2022 | unaudited |
| Common stocks 72.76% | | Shares | | | Value
(000) | |
| Financials 12.34% | | | | | | | | |
| Zurich Insurance Group AG | | | 39,843 | | | $ | 17,329 | |
| Toronto-Dominion Bank (CAD denominated) | | | 159,743 | | | | 10,475 | |
| PNC Financial Services Group, Inc. | | | 59,040 | | | | 9,315 | |
| CME Group, Inc., Class A | | | 44,748 | | | | 9,160 | |
| Morgan Stanley | | | 85,379 | | | | 6,494 | |
| Münchener Rückversicherungs-Gesellschaft AG | | | 23,528 | | | | 5,528 | |
| DNB Bank ASA | | | 294,024 | | | | 5,270 | |
| JPMorgan Chase & Co. | | | 46,574 | | | | 5,245 | |
| Power Corporation of Canada, subordinate voting shares | | | 179,126 | | | | 4,609 | |
| Principal Financial Group, Inc. | | | 58,334 | | | | 3,896 | |
| DBS Group Holdings, Ltd. | | | 158,153 | | | | 3,379 | |
| Ping An Insurance (Group) Company of China, Ltd., Class H | | | 441,500 | | | | 3,002 | |
| Ping An Insurance (Group) Company of China, Ltd., Class A | | | 28,657 | | | | 200 | |
| Tryg A/S | | | 135,983 | | | | 3,053 | |
| KeyCorp | | | 169,905 | | | | 2,927 | |
| American International Group, Inc. | | | 53,986 | | | | 2,760 | |
| Webster Financial Corp. | | | 64,148 | | | | 2,704 | |
| AIA Group, Ltd. | | | 241,600 | | | | 2,619 | |
| Great-West Lifeco, Inc. | | | 93,285 | | | | 2,278 | |
| B3 SA-Brasil, Bolsa, Balcao | | | 1,032,986 | | | | 2,163 | |
| KBC Groep NV | | | 37,463 | | | | 2,102 | |
| BlackRock, Inc. | | | 3,246 | | | | 1,977 | |
| Travelers Companies, Inc. | | | 10,982 | | | | 1,857 | |
| East West Bancorp, Inc. | | | 28,480 | | | | 1,846 | |
| ING Groep NV | | | 161,558 | | | | 1,597 | |
| Kaspi.kz JSC1 | | | 28,497 | | | | 1,297 | |
| Kaspi.kz JSC (GDR) | | | 4,869 | | | | 221 | |
| National Bank of Canada2 | | | 22,809 | | | | 1,497 | |
| Citizens Financial Group, Inc. | | | 40,543 | | | | 1,447 | |
| OneMain Holdings, Inc. | | | 37,485 | | | | 1,401 | |
| State Street Corp. | | | 18,128 | | | | 1,118 | |
| Truist Financial Corp. | | | 23,131 | | | | 1,097 | |
| Swedbank AB, Class A | | | 84,919 | | | | 1,073 | |
| China Pacific Insurance (Group) Co., Ltd., Class H | | | 424,950 | | | | 1,039 | |
| Franklin Resources, Inc. | | | 40,856 | | | | 952 | |
| PICC Property and Casualty Co., Ltd., Class H | | | 904,000 | | | | 940 | |
| Euronext NV | | | 10,888 | | | | 889 | |
| Hang Seng Bank, Ltd. | | | 50,100 | | | | 884 | |
| BNP Paribas SA | | | 17,927 | | | | 852 | |
| Hong Kong Exchanges and Clearing, Ltd. | | | 17,200 | | | | 846 | |
| Marsh & McLennan Companies, Inc. | | | 5,132 | | | | 797 | |
| EFG International AG | | | 107,137 | | | | 788 | |
| Citigroup, Inc. | | | 16,200 | | | | 745 | |
| Bank Central Asia Tbk PT | | | 1,423,700 | | | | 693 | |
| TPG, Inc., Class A2 | | | 26,945 | | | | 644 | |
| China Merchants Bank Co., Ltd., Class H | | | 88,000 | | | | 589 | |
| Vontobel Holding AG | | | 8,314 | | | | 584 | |
| Banco Santander, SA | | | 201,758 | | | | 568 | |
| Patria Investments, Ltd., Class A | | | 36,005 | | | | 476 | |
| Macquarie Group, Ltd. | | | 3,698 | | | | 420 | |
| Wells Fargo & Company | | | 10,594 | | | | 415 | |
| Cullen/Frost Bankers, Inc. | | | 3,136 | | | | 365 | |
| SouthState Corp. | | | 3,028 | | | | 234 | |
| Blackstone, Inc., nonvoting shares | | | 2,530 | | | | 231 | |
| CaixaBank, SA | | | 59,094 | | | | 205 | |
| UniCredit SpA | | | 17,367 | | | | 165 | |
| IIFL Wealth Management, Ltd. | | | 8,122 | | | | 152 | |
| Moscow Exchange MICEX-RTS PJSC3,4,5 | | | 875,002 | | | | — | 6 |
| Sberbank of Russia PJSC1,3,4,5 | | | 204,176 | | | | — | 6 |
| | | | | | | | 135,409 | |
| 94 | American Funds Insurance Series |
Capital Income Builder (continued)
| Common stocks (continued) | | Shares | | | Value
(000) | |
| Consumer staples 10.32% | | | | | | | | |
| Philip Morris International, Inc. | | | 270,227 | | | $ | 26,682 | |
| British American Tobacco PLC | | | 455,151 | | | | 19,500 | |
| Nestlé SA | | | 81,615 | | | | 9,527 | |
| General Mills, Inc. | | | 111,828 | | | | 8,437 | |
| PepsiCo, Inc. | | | 47,687 | | | | 7,948 | |
| Kimberly-Clark Corp. | | | 48,490 | | | | 6,553 | |
| Altria Group, Inc. | | | 151,739 | | | | 6,338 | |
| Imperial Brands PLC | | | 184,470 | | | | 4,123 | |
| ITC, Ltd. | | | 1,161,693 | | | | 4,023 | |
| Unilever PLC (GBP denominated) | | | 72,454 | | | | 3,282 | |
| Danone SA | | | 47,160 | | | | 2,632 | |
| Carlsberg A/S, Class B | | | 19,656 | | | | 2,504 | |
| Keurig Dr Pepper, Inc. | | | 54,657 | | | | 1,934 | |
| Anheuser-Busch InBev SA/NV | | | 26,838 | | | | 1,444 | |
| Coca-Cola Company | | | 21,263 | | | | 1,338 | |
| Kraft Heinz Company | | | 31,511 | | | | 1,202 | |
| Mondelez International, Inc. | | | 14,188 | | | | 881 | |
| Procter & Gamble Company | | | 5,012 | | | | 721 | |
| Vector Group, Ltd. | | | 68,110 | | | | 715 | |
| Seven & i Holdings Co., Ltd. | | | 18,300 | | | | 710 | |
| Inner Mongolia Yili Industrial Group Co., Ltd., Class A | | | 95,200 | | | | 554 | |
| Wuliangye Yibin Co., Ltd., Class A | | | 17,100 | | | | 516 | |
| Reckitt Benckiser Group PLC | | | 6,554 | | | | 492 | |
| Viscofan, SA, non-registered shares | | | 8,226 | | | | 453 | |
| Scandinavian Tobacco Group A/S | | | 21,667 | | | | 424 | |
| Hilton Food Group PLC | | | 29,160 | | | | 363 | |
| Coca-Cola HBC AG (CDI) | | | 800 | | | | 18 | |
| | | | | | | | 113,314 | |
| | | | | | | | | |
| Health care 8.71% | | | | | | | | |
| AbbVie, Inc. | | | 142,914 | | | | 21,889 | |
| Amgen, Inc. | | | 51,643 | | | | 12,565 | |
| GSK PLC | | | 458,716 | | | | 9,859 | |
| Gilead Sciences, Inc. | | | 155,252 | | | | 9,596 | |
| AstraZeneca PLC | | | 53,547 | | | | 7,040 | |
| Medtronic PLC | | | 76,150 | | | | 6,834 | |
| Abbott Laboratories | | | 62,845 | | | | 6,828 | |
| Novartis AG | | | 72,111 | | | | 6,107 | |
| UnitedHealth Group, Inc. | | | 5,796 | | | | 2,977 | |
| Pfizer, Inc. | | | 50,556 | | | | 2,651 | |
| Roche Holding AG, nonvoting non-registered shares | | | 7,287 | | | | 2,432 | |
| Bristol-Myers Squibb Company | | | 28,685 | | | | 2,209 | |
| Royalty Pharma PLC, Class A | | | 41,526 | | | | 1,746 | |
| CVS Health Corp. | | | 7,829 | | | | 725 | |
| Merck & Co., Inc. | | | 7,825 | | | | 713 | |
| EBOS Group, Ltd. | | | 28,985 | | | | 706 | |
| Bayer AG | | | 11,554 | | | | 687 | |
| Koninklijke Philips NV (EUR denominated) | | | 2,984 | | | | 64 | |
| Organon & Co. | | | 662 | | | | 22 | |
| | | | | | | | 95,650 | |
| | | | | | | | | |
| Information technology 8.04% | | | | | | | | |
| Broadcom, Inc. | | | 57,187 | | | | 27,783 | |
| Microsoft Corp. | | | 68,566 | | | | 17,610 | |
| Taiwan Semiconductor Manufacturing Company, Ltd. | | | 620,800 | | | | 9,938 | |
| QUALCOMM, Inc. | | | 39,978 | | | | 5,107 | |
| Automatic Data Processing, Inc. | | | 15,874 | | | | 3,334 | |
| Intel Corp. | | | 77,261 | | | | 2,890 | |
| MediaTek, Inc. | | | 110,000 | | | | 2,408 | |
| KLA Corp. | | | 6,685 | | | | 2,133 | |
| GlobalWafers Co., Ltd. | | | 136,938 | | | | 2,086 | |
| Texas Instruments, Inc. | | | 12,972 | | | | 1,993 | |
| American Funds Insurance Series | 95 |
Capital Income Builder (continued)
| Common stocks (continued) | | Shares | | | Value
(000) | |
| Information technology (continued) | | | | | | | | |
| Paychex, Inc. | | | 16,447 | | | $ | 1,873 | |
| NetApp, Inc. | | | 28,247 | | | | 1,843 | |
| Apple, Inc. | | | 12,770 | | | | 1,746 | |
| Vanguard International Semiconductor Corp. | | | 566,700 | | | | 1,464 | |
| Tokyo Electron, Ltd. | | | 3,400 | | | | 1,110 | |
| Western Union Company | | | 66,602 | | | | 1,097 | |
| SAP SE | | | 9,801 | | | | 893 | |
| Fidelity National Information Services, Inc. | | | 9,453 | | | | 867 | |
| Analog Devices, Inc. | | | 4,507 | | | | 658 | |
| Tripod Technology Corp. | | | 142,000 | | | | 533 | |
| SINBON Electronics Co., Ltd. | | | 42,446 | | | | 363 | |
| International Business Machines Corp. | | | 2,381 | | | | 336 | |
| BE Semiconductor Industries NV | | | 3,388 | | | | 163 | |
| | | | | | | | 88,228 | |
| | | | | | | | | |
| Utilities 6.73% | | | | | | | | |
| Dominion Energy, Inc. | | | 128,049 | | | | 10,220 | |
| DTE Energy Company | | | 52,990 | | | | 6,717 | |
| National Grid PLC | | | 465,204 | | | | 5,957 | |
| Power Grid Corporation of India, Ltd. | | | 2,035,755 | | | | 5,462 | |
| Iberdrola, SA, non-registered shares | | | 447,637 | | | | 4,642 | |
| The Southern Co. | | | 63,638 | | | | 4,538 | |
| Enel SpA | | | 809,492 | | | | 4,428 | |
| E.ON SE | | | 508,142 | | | | 4,264 | |
| Edison International | | | 53,687 | | | | 3,395 | |
| Public Service Enterprise Group, Inc. | | | 48,416 | | | | 3,064 | |
| Duke Energy Corp. | | | 26,321 | | | | 2,822 | |
| Evergy, Inc. | | | 39,780 | | | | 2,596 | |
| AES Corp. | | | 104,535 | | | | 2,196 | |
| Entergy Corp. | | | 19,327 | | | | 2,177 | |
| NextEra Energy, Inc. | | | 24,483 | | | | 1,896 | |
| Exelon Corp. | | | 41,656 | | | | 1,888 | |
| Engie SA | | | 109,459 | | | | 1,258 | |
| Engie SA, bonus shares3 | | | 36,900 | | | | 424 | |
| SSE PLC | | | 72,232 | | | | 1,421 | |
| CenterPoint Energy, Inc. | | | 48,046 | | | | 1,421 | |
| Sempra Energy | | | 5,735 | | | | 862 | |
| Power Assets Holdings, Ltd. | | | 106,500 | | | | 670 | |
| ENN Energy Holdings, Ltd. | | | 32,400 | | | | 532 | |
| Centrica PLC5 | | | 502,131 | | | | 489 | |
| American Electric Power Company, Inc. | | | 2,832 | | | | 272 | |
| CMS Energy Corp. | | | 3,992 | | | | 270 | |
| | | | | | | | 73,881 | |
| | | | | | | | | |
| Real estate 6.72% | | | | | | | | |
| Crown Castle International Corp. REIT | | | 136,797 | | | | 23,034 | |
| VICI Properties, Inc. REIT | | | 642,122 | | | | 19,129 | |
| Digital Realty Trust, Inc. REIT | | | 45,793 | | | | 5,945 | |
| Gaming and Leisure Properties, Inc. REIT | | | 95,781 | | | | 4,392 | |
| Link REIT | | | 355,366 | | | | 2,898 | |
| Federal Realty Investment Trust REIT | | | 27,495 | | | | 2,632 | |
| CK Asset Holdings, Ltd. | | | 308,000 | | | | 2,178 | |
| American Tower Corp. REIT | | | 7,508 | | | | 1,919 | |
| Equinix, Inc. REIT | | | 2,214 | | | | 1,455 | |
| Longfor Group Holdings, Ltd. | | | 249,000 | | | | 1,176 | |
| Embassy Office Parks REIT | | | 234,370 | | | | 1,111 | |
| Charter Hall Group REIT | | | 145,400 | | | | 1,087 | |
| Powergrid Infrastructure Investment Trust | | | 650,141 | | | | 1,062 | |
| Americold Realty Trust, Inc. | | | 32,239 | | | | 968 | |
| Mindspace Business Parks REIT | | | 214,689 | | | | 953 | |
| Extra Space Storage, Inc. REIT | | | 5,512 | | | | 938 | |
| TAG Immobilien AG | | | 63,810 | | | | 728 | |
| 96 | American Funds Insurance Series |
Capital Income Builder (continued)
| Common stocks (continued) | | Shares | | | Value
(000) | |
| Real estate (continued) | | | | | | | | |
| Sun Hung Kai Properties, Ltd. | | | 61,255 | | | $ | 724 | |
| CTP NV | | | 49,335 | | | | 569 | |
| PSP Swiss Property AG | | | 3,583 | | | | 399 | |
| CubeSmart REIT | | | 7,663 | | | | 327 | |
| Douglas Elliman, Inc. | | | 29,146 | | | | 140 | |
| | | | | | | | 73,764 | |
| | | | | | | | | |
| Industrials 5.98% | | | | | | | | |
| Raytheon Technologies Corp. | | | 212,630 | | | | 20,436 | |
| Lockheed Martin Corp. | | | 13,286 | | | | 5,712 | |
| BAE Systems PLC | | | 507,662 | | | | 5,130 | |
| Honeywell International, Inc. | | | 20,665 | | | | 3,592 | |
| L3Harris Technologies, Inc. | | | 13,435 | | | | 3,247 | |
| Singapore Technologies Engineering, Ltd. | | | 1,096,500 | | | | 3,220 | |
| RELX PLC | | | 98,945 | | | | 2,681 | |
| RELX PLC (ADR) | | | 7,965 | | | | 215 | |
| Kone OYJ, Class B | | | 54,424 | | | | 2,587 | |
| VINCI SA | | | 25,880 | | | | 2,304 | |
| BOC Aviation, Ltd. | | | 245,100 | | | | 2,060 | |
| Siemens AG | | | 19,999 | | | | 2,035 | |
| Trinity Industries, Inc. | | | 72,684 | | | | 1,760 | |
| CCR SA, ordinary nominative shares | | | 449,174 | | | | 1,075 | |
| ABB, Ltd. | | | 38,536 | | | | 1,028 | |
| LIXIL Corp. | | | 54,600 | | | | 1,022 | |
| Compañia de Distribución Integral Logista Holdings, SA, non-registered shares | | | 49,377 | | | | 966 | |
| Trelleborg AB, Class B | | | 47,577 | | | | 959 | |
| Grupo Aeroportuario del Pacífico, SAB de CV, Class B | | | 64,480 | | | | 898 | |
| Ventia Services Group Pty, Ltd. | | | 490,862 | | | | 844 | |
| United Parcel Service, Inc., Class B | | | 4,455 | | | | 813 | |
| Waste Management, Inc. | | | 4,008 | | | | 613 | |
| General Dynamics Corp. | | | 2,480 | | | | 549 | |
| Deutsche Post AG | | | 14,410 | | | | 540 | |
| Airbus SE, non-registered shares | | | 3,671 | | | | 356 | |
| Atlas Corp.2 | | | 23,578 | | | | 252 | |
| Norfolk Southern Corp. | | | 1,084 | | | | 246 | |
| Sulzer AG | | | 3,814 | | | | 237 | |
| Melrose Industries PLC | | | 122,162 | | | | 223 | |
| | | | | | | | 65,600 | |
| | | | | | | | | |
| Energy 5.22% | | | | | | | | |
| TC Energy Corp. (CAD denominated)2 | | | 205,882 | | | | 10,665 | |
| TC Energy Corp. | | | 15,067 | | | | 781 | |
| Canadian Natural Resources, Ltd. (CAD denominated) | | | 190,567 | | | | 10,240 | |
| Chevron Corp. | | | 45,673 | | | | 6,613 | |
| TotalEnergies SE | | | 76,665 | | | | 4,047 | |
| BP PLC | | | 747,631 | | | | 3,534 | |
| Shell PLC (GBP denominated) | | | 116,755 | | | | 3,033 | |
| Shell PLC (ADR) | | | 8,003 | | | | 418 | |
| Exxon Mobil Corp. | | | 36,914 | | | | 3,161 | |
| EOG Resources, Inc. | | | 26,655 | | | | 2,944 | |
| ConocoPhillips | | | 30,877 | | | | 2,773 | |
| Enbridge, Inc. (CAD denominated) | | | 48,315 | | | | 2,040 | |
| Baker Hughes Co., Class A | | | 50,603 | | | | 1,461 | |
| Schlumberger, Ltd. | | | 35,730 | | | | 1,278 | |
| Equitrans Midstream Corp. | | | 200,167 | | | | 1,273 | |
| Woodside Energy Group, Ltd. | | | 34,151 | | | | 750 | |
| Woodside Energy Group, Ltd. (CDI)5 | | | 23,081 | | | | 489 | |
| Pioneer Natural Resources Company | | | 5,252 | | | | 1,172 | |
| DT Midstream, Inc. | | | 12,803 | | | | 628 | |
| Gazprom PJSC (ADR)3,4 | | | 440,214 | | | | — | 6 |
| | | | | | | | 57,300 | |
| American Funds Insurance Series | 97 |
Capital Income Builder (continued)
| Common stocks (continued) | | Shares | | | Value
(000) | |
| Communication services 3.26% | | | | | | | | |
| Comcast Corp., Class A | | | 269,639 | | | $ | 10,581 | |
| Verizon Communications, Inc. | | | 106,248 | | | | 5,392 | |
| SoftBank Corp. | | | 373,800 | | | | 4,150 | |
| Koninklijke KPN NV | | | 1,040,033 | | | | 3,707 | |
| BCE, Inc. | | | 64,510 | | | | 3,171 | |
| Nippon Telegraph and Telephone Corp. | | | 66,400 | | | | 1,907 | |
| HKT Trust and HKT, Ltd., units | | | 1,381,240 | | | | 1,855 | |
| Singapore Telecommunications, Ltd. | | | 573,200 | | | | 1,044 | |
| Pearson PLC | | | 106,351 | | | | 971 | |
| WPP PLC | | | 81,133 | | | | 814 | |
| Omnicom Group, Inc. | | | 10,162 | | | | 646 | |
| Indus Towers, Ltd. | | | 211,665 | | | | 560 | |
| ITV PLC | | | 569,947 | | | | 453 | |
| ProSiebenSat.1 Media SE | | | 40,927 | | | | 378 | |
| Vodafone Group PLC | | | 144,892 | | | | 223 | |
| | | | | | | | 35,852 | |
| | | | | | | | | |
| Consumer discretionary 2.73% | | | | | | | | |
| McDonald’s Corp. | | | 19,734 | | | | 4,872 | |
| Midea Group Co., Ltd., Class A | | | 385,475 | | | | 3,477 | |
| Home Depot, Inc. | | | 12,486 | | | | 3,425 | |
| Industria de Diseño Textil, SA | | | 151,346 | | | | 3,424 | |
| Kering SA | | | 5,429 | | | | 2,788 | |
| Starbucks Corp. | | | 36,027 | | | | 2,752 | |
| VF Corp. | | | 27,355 | | | | 1,208 | |
| Hasbro, Inc. | | | 14,296 | | | | 1,171 | |
| Galaxy Entertainment Group, Ltd. | | | 190,000 | | | | 1,133 | |
| YUM! Brands, Inc. | | | 9,688 | | | | 1,100 | |
| Cie. Financière Richemont SA, Class A | | | 9,843 | | | | 1,048 | |
| LVMH Moët Hennessy-Louis Vuitton SE | | | 1,480 | | | | 902 | |
| Darden Restaurants, Inc. | | | 7,867 | | | | 890 | |
| Restaurant Brands International, Inc. | | | 14,808 | | | | 743 | |
| OPAP SA | | | 27,844 | | | | 398 | |
| Inchcape PLC | | | 26,460 | | | | 224 | |
| Thule Group AB | | | 8,654 | | | | 213 | |
| Kindred Group PLC (SDR) | | | 19,169 | | | | 159 | |
| | | | | | | | 29,927 | |
| | | | | | | | | |
| Materials 2.71% | | | | | | | | |
| Vale SA, ordinary nominative shares (ADR) | | | 354,178 | | | | 5,181 | |
| Vale SA, ordinary nominative shares | | | 248,874 | | | | 3,641 | |
| Rio Tinto PLC | | | 77,432 | | | | 4,634 | |
| BHP Group, Ltd. (CDI) | | | 127,875 | | | | 3,576 | |
| LyondellBasell Industries NV | | | 28,394 | | | | 2,483 | |
| Linde PLC | | | 8,196 | | | | 2,357 | |
| Air Products and Chemicals, Inc. | | | 8,303 | | | | 1,997 | |
| Evonik Industries AG | | | 53,622 | | | | 1,144 | |
| International Flavors & Fragrances, Inc. | | | 8,013 | | | | 954 | |
| BASF SE | | | 21,232 | | | | 924 | |
| Sociedad Química y Minera de Chile SA, Class B (ADR) | | | 8,531 | | | | 713 | |
| Asahi Kasei Corp. | | | 92,600 | | | | 707 | |
| UPM-Kymmene Oyj | | | 19,277 | | | | 586 | |
| Nexa Resources SA2 | | | 51,286 | | | | 308 | |
| WestRock Co. | | | 7,448 | | | | 297 | |
| Fortescue Metals Group, Ltd. | | | 19,956 | | | | 241 | |
| | | | | | | | 29,743 | |
| | | | | | | | | |
| Total common stocks (cost: $689,320,000) | | | | | | | 798,668 | |
| 98 | American Funds Insurance Series |
Capital Income Builder (continued)
| Preferred securities 0.05% | | Shares | | | Value
(000) | |
| Information technology 0.05% | | | | | | | | |
| Samsung Electronics Co., Ltd., nonvoting preferred shares | | | 12,647 | | | $ | 506 | |
| | | | | | | | | |
| Total preferred securities (cost: $419,000) | | | | | | | 506 | |
| | | | | | | | | |
| Rights & warrants 0.00% | | | | | | | | |
| Consumer discretionary 0.00% | | | | | | | | |
| Compagnie Financière Richemont SA, Class A, warrants, expire 20235 | | | 7,130 | | | | 4 | |
| | | | | | | | | |
| Total rights & warrants (cost: $0) | | | | | | | 4 | |
| | | | | | | | | |
| Convertible stocks 0.65% | | | | | | | | |
| Information technology 0.33% | | | | | | | | |
| Broadcom, Inc., Series A, cumulative convertible preferred shares, 8.00% 2022 | | | 2,393 | | | | 3,597 | |
| | | | | | | | | |
| Utilities 0.15% | | | | | | | | |
| AES Corp., convertible preferred units, 6.875% 2024 | | | 8,659 | | | | 747 | |
| American Electric Power Company, Inc., convertible preferred units, 6.125% 2023 | | | 9,704 | | | | 524 | |
| NextEra Energy, Inc., convertible preferred units, 6.219% 2023 | | | 8,500 | | | | 418 | |
| | | | | | | | 1,689 | |
| | | | | | | | | |
| Health care 0.10% | | | | | | | | |
| Danaher Corp., Series B, cumulative convertible preferred shares, 5.00% 20232 | | | 841 | | | | 1,113 | |
| | | | | | | | | |
| Consumer discretionary 0.07% | | | | | | | | |
| Aptiv PLC, Series A, convertible preferred shares, 5.50% 2023 | | | 6,948 | | | | 732 | |
| | | | | | | | | |
| Total convertible stocks (cost: $6,038,000) | | | | | | | 7,131 | |
| | | | | | | | | |
| Investment funds 2.62% | | | | | | | | |
| Capital Group Central Corporate Bond Fund7 | | | 3,406,631 | | | | 28,752 | |
| | | | | | | | | |
| Total investment funds (cost: $33,973,000) | | | | | | | 28,752 | |
| | | | | | | | | |
| Bonds, notes & other debt instruments 18.31% | | Principal amount
(000) | | | | |
| U.S. Treasury bonds & notes 9.47% | | | | | | | | |
| U.S. Treasury 6.36% | | | | | | | | |
| U.S. Treasury 0.125% 2022 | | USD | 1,625 | | | | 1,606 | |
| U.S. Treasury 0.125% 2023 | | | 2,200 | | | | 2,169 | |
| U.S. Treasury 0.375% 2023 | | | 875 | | | | 846 | |
| U.S. Treasury 0.625% 2024 | | | 11,050 | | | | 10,470 | |
| U.S. Treasury 0.75% 2024 | | | 5,965 | | | | 5,655 | |
| U.S. Treasury 2.50% 2024 | | | 5,424 | | | | 5,378 | |
| U.S. Treasury 0.375% 2025 | | | 507 | | | | 471 | |
| U.S. Treasury 0.75% 2026 | | | 4,903 | | | | 4,495 | |
| U.S. Treasury 0.75% 2026 | | | 3,850 | | | | 3,523 | |
| U.S. Treasury 0.75% 2026 | | | 1 | | | | 1 | |
| U.S. Treasury 1.125% 2026 | | | 4,030 | | | | 3,714 | |
| U.S. Treasury 1.875% 2026 | | | 6,300 | | | | 6,026 | |
| U.S. Treasury 2.00% 20268 | | | 2,800 | | | | 2,677 | |
| U.S. Treasury 0.50% 2027 | | | 2,900 | | | | 2,567 | |
| U.S. Treasury 2.50% 2027 | | | 1,440 | | | | 1,405 | |
| U.S. Treasury 2.625% 2027 | | | 6,605 | | | | 6,479 | |
| U.S. Treasury 1.25% 2028 | | | 1,350 | | | | 1,219 | |
| U.S. Treasury 2.875% 2032 | | | 5,696 | | | | 5,628 | |
| American Funds Insurance Series | 99 |
Capital Income Builder (continued)
| Bonds, notes & other debt instruments (continued) | | Principal amount
(000) | | | Value
(000) | |
| U.S. Treasury bonds & notes (continued) | | | | | | | | |
| U.S. Treasury (continued) | | | | | | | | |
| U.S. Treasury 1.125% 20408 | | USD | 2,400 | | | $ | 1,665 | |
| U.S. Treasury 2.00% 2041 | | | 300 | | | | 237 | |
| U.S. Treasury 2.375% 20518 | | | 197 | | | | 165 | |
| U.S. Treasury 2.25% 20528 | | | 4,176 | | | | 3,422 | |
| | | | | | | | 69,818 | |
| | | | | | | | | |
| U.S. Treasury inflation-protected securities 3.11% | | | | | | | | |
| U.S. Treasury Inflation-Protected Security 0.125% 20239 | | | 2,532 | | | | 2,576 | |
| U.S. Treasury Inflation-Protected Security 0.375% 20239 | | | 1,764 | | | | 1,796 | |
| U.S. Treasury Inflation-Protected Security 0.625% 20239 | | | 3,298 | | | | 3,356 | |
| U.S. Treasury Inflation-Protected Security 0.125% 20249 | | | 5,769 | | | | 5,828 | |
| U.S. Treasury Inflation-Protected Security 0.125% 20249 | | | 4,979 | | | | 5,011 | |
| U.S. Treasury Inflation-Protected Security 0.50% 20249 | | | 2,491 | | | | 2,527 | |
| U.S. Treasury Inflation-Protected Security 0.625% 20249 | | | 2,986 | | | | 3,036 | |
| U.S. Treasury Inflation-Protected Security 0.125% 20259 | | | 1,231 | | | | 1,231 | |
| U.S. Treasury Inflation-Protected Security 0.125% 20259 | | | 223 | | | | 223 | |
| U.S. Treasury Inflation-Protected Security 0.25% 20259 | | | 523 | | | | 526 | |
| U.S. Treasury Inflation-Protected Security 0.375% 20259 | | | 366 | | | | 369 | |
| U.S. Treasury Inflation-Protected Security 0.125% 20269 | | | 2,317 | | | | 2,295 | |
| U.S. Treasury Inflation-Protected Security 0.125% 20309 | | | 2,078 | | | | 1,980 | |
| U.S. Treasury Inflation-Protected Security 0.125% 20319 | | | 1,777 | | | | 1,686 | |
| U.S. Treasury Inflation-Protected Security 0.125% 20319 | | | 135 | | | | 128 | |
| U.S. Treasury Inflation-Protected Security 0.125% 20518,9 | | | 1,971 | | | | 1,506 | |
| | | | | | | | 34,074 | |
| | | | | | | | | |
| Total U.S. Treasury bonds & notes | | | | | | | 103,892 | |
| | | | | | | | | |
| Mortgage-backed obligations 6.24% | | | | | | | | |
| Federal agency mortgage-backed obligations 5.38% | | | | | | | | |
| Fannie Mae Pool #695412 5.00% 203310 | | | — | 6 | | | — | 6 |
| Fannie Mae Pool #AD3566 5.00% 203510 | | | 2 | | | | 2 | |
| Fannie Mae Pool #AC0794 5.00% 203910 | | | 5 | | | | 5 | |
| Fannie Mae Pool #931768 5.00% 203910 | | | 1 | | | | 1 | |
| Fannie Mae Pool #AE0311 3.50% 204010 | | | 10 | | | | 9 | |
| Fannie Mae Pool #932606 5.00% 204010 | | | 3 | | | | 3 | |
| Fannie Mae Pool #AJ1873 4.00% 204110 | | | 7 | | | | 7 | |
| Fannie Mae Pool #AE1248 5.00% 204110 | | | 9 | | | | 9 | |
| Fannie Mae Pool #AE1274 5.00% 204110 | | | 7 | | | | 7 | |
| Fannie Mae Pool #AE1277 5.00% 204110 | | | 5 | | | | 5 | |
| Fannie Mae Pool #AE1283 5.00% 204110 | | | 2 | | | | 3 | |
| Fannie Mae Pool #AE1290 5.00% 204210 | | | 5 | | | | 6 | |
| Fannie Mae Pool #AT0300 3.50% 204310 | | | 2 | | | | 2 | |
| Fannie Mae Pool #AT3954 3.50% 204310 | | | 2 | | | | 2 | |
| Fannie Mae Pool #AY1829 3.50% 204410 | | | 2 | | | | 2 | |
| Fannie Mae Pool #BJ5015 4.00% 204710 | | | 42 | | | | 42 | |
| Fannie Mae Pool #BH3122 4.00% 204710 | | | 1 | | | | 1 | |
| Fannie Mae Pool #BK6840 4.00% 204810 | | | 28 | | | | 28 | |
| Fannie Mae Pool #BK5232 4.00% 204810 | | | 21 | | | | 21 | |
| Fannie Mae Pool #BK9743 4.00% 204810 | | | 8 | | | | 8 | |
| Fannie Mae Pool #BK9761 4.50% 204810 | | | 5 | | | | 5 | |
| Fannie Mae Pool #CA5540 3.00% 205010 | | | 3,412 | | | | 3,206 | |
| Fannie Mae Pool #BF0142 5.50% 205610 | | | 422 | | | | 453 | |
| Fannie Mae Pool #BF0342 5.50% 205910 | | | 280 | | | | 305 | |
| Fannie Mae Pool #BF0497 3.00% 206010 | | | 346 | | | | 326 | |
| Freddie Mac Pool #Q15874 4.00% 204310 | | | 1 | | | | 1 | |
| Freddie Mac Pool #G67711 4.00% 204810 | | | 254 | | | | 255 | |
| Freddie Mac Pool #Q56599 4.00% 204810 | | | 32 | | | | 32 | |
| Freddie Mac Pool #Q55971 4.00% 204810 | | | 22 | | | | 22 | |
| Freddie Mac Pool #Q56175 4.00% 204810 | | | 19 | | | | 19 | |
| Freddie Mac Pool #Q55970 4.00% 204810 | | | 11 | | | | 11 | |
| Freddie Mac Pool #Q58411 4.50% 204810 | | | 58 | | | | 60 | |
| 100 | American Funds Insurance Series |
Capital Income Builder (continued)
| Bonds, notes & other debt instruments (continued) | | Principal amount
(000) | | | Value
(000) | |
| Mortgage-backed obligations (continued) | | | | | | | | |
| Federal agency mortgage-backed obligations (continued) | | | | | | | | |
| Freddie Mac Pool #Q58436 4.50% 204810 | | USD | 31 | | | $ | 31 | |
| Freddie Mac Pool #Q58378 4.50% 204810 | | | 21 | | | | 21 | |
| Freddie Mac Pool #Q57242 4.50% 204810 | | | 16 | | | | 16 | |
| Freddie Mac Pool #ZT1704 4.50% 204910 | | | 1,338 | | | | 1,369 | |
| Freddie Mac Seasoned Credit Risk Transfer Trust, Series 2017-2, Class MA, 3.00% 205610 | | | 253 | | | | 246 | |
| Freddie Mac Seasoned Credit Risk Transfer Trust, Series 2017-2, Class HA, 3.00% 205610,11 | | | 249 | | | | 243 | |
| Freddie Mac Seasoned Credit Risk Transfer Trust, Series 2017-1, Class HA, 3.00% 205610,11 | | | 122 | | | | 119 | |
| Freddie Mac Seasoned Credit Risk Transfer Trust, Series 2017-4, Class HT, 3.25% 205710,11 | | | 103 | | | | 100 | |
| Freddie Mac Seasoned Credit Risk Transfer Trust, Series 2017-4, Class MT, 3.50% 205710 | | | 85 | | | | 83 | |
| Freddie Mac Seasoned Credit Risk Transfer Trust, Series 2018-3, Class MA, 3.50% 205710 | | | 22 | | | | 21 | |
| Freddie Mac Seasoned Credit Risk Transfer Trust, Series 2019-1, Class MT, 3.50% 205810 | | | 1,051 | | | | 1,024 | |
| Freddie Mac Seasoned Credit Risk Transfer Trust, Series 2019-2, Class MA, 3.50% 205810 | | | 676 | | | | 669 | |
| Freddie Mac Seasoned Credit Risk Transfer Trust, Series 2019-1, Class MA, 3.50% 205810 | | | 444 | | | | 440 | |
| Freddie Mac Seasoned Credit Risk Transfer Trust, Series 2019-3, Class MA, 3.50% 205810 | | | 20 | | | | 20 | |
| Freddie Mac Seasoned Credit Risk Transfer Trust, Series 2019-3, Class MT, 3.50% 205810 | | | 11 | | | | 10 | |
| Freddie Mac Seasoned Loan Structured Transaction Trust, Series 2018-2, Class A1, 3.50% 202810 | | | 993 | | | | 985 | |
| Freddie Mac Seasoned Loan Structured Transaction Trust, Series 2019-2, Class A1C, 2.75% 202910 | | | 1,388 | | | | 1,334 | |
| Government National Mortgage Assn. 4.00% 205210,12 | | | 3,313 | | | | 3,292 | |
| Government National Mortgage Assn. 4.00% 205210,12 | | | 2,829 | | | | 2,818 | |
| Government National Mortgage Assn. 4.50% 205210,12 | | | 1,145 | | | | 1,157 | |
| Government National Mortgage Assn. 5.00% 205210,12 | | | 3,624 | | | | 3,700 | |
| Government National Mortgage Assn. 5.00% 205210,12 | | | 27 | | | | 28 | |
| Government National Mortgage Assn. Pool #MA5764 4.50% 204910 | | | 502 | | | | 514 | |
| Government National Mortgage Assn. Pool #694836 5.665% 205910 | | | 1 | | | | 1 | |
| Government National Mortgage Assn. Pool #765152 4.14% 206110 | | | — | 6 | | | — | 6 |
| Government National Mortgage Assn. Pool #766525 4.70% 206210 | | | — | 6 | | | — | 6 |
| Government National Mortgage Assn. Pool #725893 5.20% 206410 | | | — | 6 | | | — | 6 |
| Government National Mortgage Assn. Pool #AA7554 6.64% 206410 | | | 1 | | | | 1 | |
| Uniform Mortgage-Backed Security 2.50% 203710,12 | | | 1,608 | | | | 1,536 | |
| Uniform Mortgage-Backed Security 3.00% 205210,12 | | | 1,900 | | | | 1,768 | |
| Uniform Mortgage-Backed Security 3.00% 205210,12 | | | 1,720 | | | | 1,602 | |
| Uniform Mortgage-Backed Security 3.50% 205210,12 | | | 1,927 | | | | 1,851 | |
| Uniform Mortgage-Backed Security 4.00% 205210,12 | | | 11,242 | | | | 11,051 | |
| Uniform Mortgage-Backed Security 4.00% 205210,12 | | | 531 | | | | 523 | |
| Uniform Mortgage-Backed Security 4.50% 205210,12 | | | 7,550 | | | | 7,550 | |
| Uniform Mortgage-Backed Security 4.50% 205210,12 | | | 5,351 | | | | 5,362 | |
| Uniform Mortgage-Backed Security 5.00% 205210,12 | | | 3,606 | | | | 3,664 | |
| Uniform Mortgage-Backed Security 5.00% 205210,12 | | | 1,050 | | | | 1,069 | |
| | | | | | | | 59,076 | |
| | | | | | | | | |
| Collateralized mortgage-backed obligations (privately originated) 0.52% | | | | | | | | |
| Arroyo Mortgage Trust, Series 2021-1R, Class A1, 1.175% 20481,10,11 | | | 161 | | | | 150 | |
| Binom Securitization Trust, Series 2022-RPL1, Class A1, 3.00% 20611,10,11 | | | 91 | | | | 87 | |
| BRAVO Residential Funding Trust, Series 2022-RPL1, Class A1, 2.75% 20611,10 | | | 95 | | | | 89 | |
| Cascade Funding Mortgage Trust, Series 2020-HB4, Class A, 0.946% 20301,10,11 | | | 97 | | | | 96 | |
| Cascade Funding Mortgage Trust, Series 2021-HB7, Class A, 1.151% 20311,10,11 | | | 153 | | | | 150 | |
| Cascade Funding Mortgage Trust, Series 2021-HB6, Class A, 0.898% 20361,10,11 | | | 122 | | | | 120 | |
| American Funds Insurance Series | 101 |
Capital Income Builder (continued)
| Bonds, notes & other debt instruments (continued) | | Principal amount
(000) | | | Value
(000) | |
| Mortgage-backed obligations (continued) | | | | | | | | |
| Collateralized mortgage-backed obligations (privately originated) (continued) | | | | | | | | |
| CIM Trust, Series 2022-R2, Class A1, 3.75% 20611,10,11 | | USD | 201 | | | $ | 195 | |
| Citigroup Mortgage Loan Trust, Inc., Series 2020-EXP1, Class A1A, 1.804% 20601,10,11 | | | 12 | | | | 11 | |
| Connecticut Avenue Securities, Series 2021-R01, Class 1M1, (30-day Average USD-SOFR + 0.75%) 1.676% 20411,10,11 | | | 11 | | | | 11 | |
| Connecticut Avenue Securities, Series 2022-R04, Class 1M1, (30-day Average USD-SOFR + 2.00%) 2.926% 20421,10,11 | | | 158 | | | | 155 | |
| Finance of America Structured Securities Trust, Series 2019-JR4, Class A, 2.00% 20691,10 | | | 68 | | | | 69 | |
| Finance of America Structured Securities Trust, Series 2019-JR3, Class A, 2.00% 20691,10 | | | 61 | | | | 63 | |
| Flagstar Mortgage Trust, Series 2021-10INV, Class A3, 2.50% 20511,10,11 | | | 122 | | | | 105 | |
| Freddie Mac Structured Agency Credit Risk Debt Notes, Series 2015-DNA3, Class M3, (1-month USD-LIBOR + 4.70%) 6.324% 202810,11 | | | 294 | | | | 303 | |
| Freddie Mac Structured Agency Credit Risk Debt Notes, Series 2022-DNA3, Class M1A, (30-day Average USD-SOFR + 2.00%) 2.926% 20421,10,11 | | | 171 | | | | 169 | |
| Freddie Mac Structured Agency Credit Risk Debt Notes, Series 2022-DNA4, Class M1A, (30-day Average USD-SOFR + 2.20%) 3.126% 20421,10,11 | | | 96 | | | | 94 | |
| Freddie Mac Structured Agency Credit Risk Debt Notes, Series 2020-DNA1, Class M2, (1-month USD-LIBOR + 1.70%) 3.324% 20501,10,11 | | | 247 | | | | 244 | |
| Freddie Mac Structured Agency Credit Risk Debt Notes, Series 2020-DNA2, Class M2, (1-month USD-LIBOR + 1.85%) 3.474% 20501,10,11 | | | 482 | | | | 477 | |
| Freddie Mac Structured Agency Credit Risk Debt Notes, Series 2020-DNA3, Class B1, (1-month USD-LIBOR + 5.10%) 6.724% 20501,10,11 | | | 120 | | | | 122 | |
| Freddie Mac Structured Agency Credit Risk Debt Notes, Series 2020-DNA4, Class B1, (1-month USD-LIBOR + 6.00%) 7.624% 20501,10,11 | | | 175 | | | | 183 | |
| Home Partners of America Trust, Series 2022-1, Class A, 3.93% 20391,10 | | | 202 | | | | 197 | |
| Legacy Mortgage Asset Trust, Series 2019-GS5, Class A1, 3.20% 20591,10,11 | | | 137 | | | | 137 | |
| Legacy Mortgage Asset Trust, Series 2021-GS2, Class A1, 1.75% 20611,10,11 | | | 83 | | | | 79 | |
| Legacy Mortgage Asset Trust, Series 2022-GS1, Class A1, 4.00% 2061 (7.00% on 4/25/2025)1,3,10,13 | | | 215 | | | | 208 | |
| Legacy Mortgage Asset Trust, Series 2021-GS5, Class A1, 2.25% 2067 (5.25% on 11/25/2024)1,10,13 | | | 141 | | | | 132 | |
| Mello Warehouse Securitization Trust, Series 2020-2, Class A, (1-month USD-LIBOR + 0.80%) 2.424% 20531,10,11 | | | 105 | | | | 104 | |
| Mello Warehouse Securitization Trust, Series 2021-3, Class A, (1-month USD-LIBOR + 0.85%) 2.474% 20551,10,11 | | | 202 | | | | 196 | |
| MRA Issuance Trust, Series 2020-10, Class A3, (1-month USD-LIBOR + 1.30%) 2.10% 20221,10,11 | | | 353 | | | | 349 | |
| NewRez Warehouse Securitization Trust, Series 2021-1, Class A, (1-month USD-LIBOR + 0.75%) 2.374% 20551,10,11 | | | 281 | | | | 278 | |
| Progress Residential Trust, Series 2022-SFR3, Class A, 3.20% 20391,10 | | | 100 | | | | 95 | |
| Reverse Mortgage Investment Trust, Series 2021-HB1, Class A, 1.259% 20311,10,11 | | | 90 | | | | 86 | |
| Towd Point Mortgage Trust, Series 2016-5, Class A1, 2.50% 20561,10,11 | | | 29 | | | | 29 | |
| Towd Point Mortgage Trust, Series 2017-6, Class A1, 2.75% 20571,10,11 | | | 47 | | | | 46 | |
| Towd Point Mortgage Trust, Series 2017-3, Class A1, 2.75% 20571,10,11 | | | 26 | | | | 25 | |
| Towd Point Mortgage Trust, Series 2018-2, Class A1, 3.25% 20581,10,11 | | | 57 | | | | 56 | |
| Towd Point Mortgage Trust, Series 2018-5, Class A1A, 3.25% 20581,10,11 | | | 28 | | | | 28 | |
| Towd Point Mortgage Trust, Series 2020-4, Class A1, 1.75% 20601,10 | | | 516 | | | | 476 | |
| Treehouse Park Improvement Association No.1 - Anleihen 9.75% 20331,3,4 | | | 100 | | | | 88 | |
| Tricon Residential, Series 2021-SFR1, Class A, 1.943% 20381,10 | | | 196 | | | | 179 | |
| | | | | | | | 5,681 | |
| 102 | American Funds Insurance Series |
Capital Income Builder (continued)
| Bonds, notes & other debt instruments (continued) | | Principal amount
(000) | | | Value
(000) | |
| Mortgage-backed obligations (continued) | | | | | | | | |
| Commercial mortgage-backed securities 0.34% | | | | | | | | |
| Boca Commercial Mortgage Trust, Series 2022-BOCA, Class A, (1-month USD CME Term SOFR + 1.767%) 2.27% 20391,10,11 | | USD | 110 | | | $ | 108 | |
| BPR Trust, Series 2022-OANA, Class A, (1-month USD CME Term SOFR + 1.898%) 3.177% 20371,10,11 | | | 329 | | | | 323 | |
| BX Trust, Series 2022-CSMO, Class A, (1-month USD CME Term SOFR + 2.11%) 2.865% 20271,10,11 | | | 332 | | | | 329 | |
| BX Trust, Series 2021-VOLT, Class A, (1-month USD-LIBOR + 0.70%) 2.024% 20361,10,11 | | | 548 | | | | 529 | |
| BX Trust, Series 2021-ARIA, Class A, (1-month USD-LIBOR + 0.899%) 2.223% 20361,10,11 | | | 266 | | | | 251 | |
| BX Trust, Series 2021-ARIA, Class C, (1-month USD-LIBOR + 1.646%) 2.97% 20361,10,11 | | | 100 | | | | 93 | |
| BX Trust, Series 2022-IND, Class A, (1-month USD CME Term SOFR + 1.491%) 2.825% 20371,10,11 | | | 166 | | | | 162 | |
| BX Trust, Series 2021-SOAR, Class A, (1-month USD-LIBOR + 0.67%) 1.994% 20381,10,11 | | | 173 | | | | 166 | |
| BX Trust, Series 2021-SOAR, Class D, (1-month USD-LIBOR + 1.40%) 2.724% 20381,10,11 | | | 99 | | | | 94 | |
| BX Trust, Series 2021-ACNT, Class C, (1-month USD-LIBOR + 1.50%) 2.825% 20381,10,11 | | | 100 | | | | 95 | |
| Extended Stay America Trust, Series 2021-ESH, Class A, (1-month USD-LIBOR + 1.08%) 2.405% 20381,10,11 | | | 99 | | | | 97 | |
| GS Mortgage Securities Trust, Series 2018-HULA, Class A, 2.244% 20251,10,11 | | | 229 | | | | 224 | |
| Hawaii Hotel Trust, Series 2019-MAUI, Class A, (1-month USD-LIBOR + 1.15%) 2.474% 20381,10,11 | | | 300 | | | | 292 | |
| JPMorgan Chase Commercial Mortgage Securities Trust, Series 2022-OPO, Class C, 3.45% 20391,10,11 | | | 100 | | | | 89 | |
| La Quinta Mortgage Trust, Series 2022-LAQ, Class A, (1-month USD CME Term SOFR + 1.724%) 3.058% 20391,10,11 | | | 193 | | | | 188 | |
| LUXE Commercial Mortgage Trust, Series 2021-TRIP, Class A, (1-month USD-LIBOR + 1.05%) 2.374% 20381,10,11 | | | 179 | | | | 173 | |
| Multi Family Connecticut Avenue Securities, Series 2019-1, Class M10, (1-month USD-LIBOR + 3.25%) 4.874% 20491,10,11 | | | 150 | | | | 140 | |
| SREIT Trust, Series 2021-MFP, Class A, (1-month USD-LIBOR + 0.731%) 2.055% 20381,10,11 | | | 361 | | | | 344 | |
| | | | | | | | 3,697 | |
| | | | | | | | | |
| Total mortgage-backed obligations | | | | | | | 68,454 | |
| | | | | | | | | |
| Corporate bonds, notes & loans 1.83% | | | | | | | | |
| Energy 0.35% | | | | | | | | |
| Apache Corp. 4.25% 2030 | | | 385 | | | | 342 | |
| Baker Hughes Co. 2.061% 2026 | | | 8 | | | | 7 | |
| BP Capital Markets America, Inc. 3.633% 2030 | | | 360 | | | | 341 | |
| Cenovus Energy, Inc. 5.40% 2047 | | | 75 | | | | 72 | |
| Diamondback Energy, Inc. 4.25% 2052 | | | 57 | | | | 48 | |
| Energy Transfer Operating LP 5.00% 2050 | | | 66 | | | | 56 | |
| Energy Transfer Partners LP 5.30% 2047 | | | 14 | | | | 12 | |
| EQT Corp. 5.00% 2029 | | | 35 | | | | 34 | |
| EQT Corp. 3.625% 20311 | | | 20 | | | | 17 | |
| Equinor ASA 2.375% 2030 | | | 365 | | | | 320 | |
| Exxon Mobil Corp. 2.995% 2039 | | | 200 | | | | 164 | |
| MPLX LP 5.50% 2049 | | | 625 | | | | 581 | |
| New Fortress Energy, Inc. 6.50% 20261 | | | 80 | | | | 73 | |
| NGL Energy Operating, LLC 7.50% 20261 | | | 80 | | | | 72 | |
| ONEOK, Inc. 3.10% 2030 | | | 42 | | | | 36 | |
| ONEOK, Inc. 4.95% 2047 | | | 51 | | | | 44 | |
| ONEOK, Inc. 7.15% 2051 | | | 97 | | | | 103 | |
| Pemex Project Funding Master Trust, Series 13, 6.625% 2035 | | | 150 | | | | 103 | |
| Petróleos Mexicanos 6.50% 2029 | | | 20 | | | | 16 | |
| Petróleos Mexicanos 8.75% 20291 | | | 222 | | | | 201 | |
| American Funds Insurance Series | 103 |
Capital Income Builder (continued)
| Bonds, notes & other debt instruments (continued) | | Principal amount
(000) | | | Value
(000) | |
| Corporate bonds, notes & loans (continued) | | | | | | | | |
| Energy (continued) | | | | | | | | |
| Petróleos Mexicanos 7.69% 2050 | | USD | 75 | | | $ | 50 | |
| Sabine Pass Liquefaction, LLC 4.50% 2030 | | | 142 | | | | 136 | |
| Shell International Finance BV 2.00% 2024 | | | 420 | | | | 408 | |
| TransCanada Corp. 5.875% 2076 (3-month USD-LIBOR + 4.64% on 8/15/2026)13 | | | 540 | | | | 515 | |
| TransCanada PipeLines, Ltd. 5.10% 2049 | | | 150 | | | | 149 | |
| | | | | | | | 3,900 | |
| | | | | | | | | |
| Health care 0.31% | | | | | | | | |
| AbbVie, Inc. 3.20% 2029 | | | 25 | | | | 23 | |
| AbbVie, Inc. 4.25% 2049 | | | 39 | | | | 35 | |
| Amgen, Inc. 3.35% 2032 | | | 36 | | | | 33 | |
| Amgen, Inc. 4.20% 2052 | | | 19 | | | | 17 | |
| AstraZeneca PLC 3.375% 2025 | | | 200 | | | | 198 | |
| AstraZeneca PLC 3.00% 2051 | | | 11 | | | | 9 | |
| Centene Corp. 4.625% 2029 | | | 530 | | | | 496 | |
| Centene Corp. 3.375% 2030 | | | 179 | | | | 152 | |
| Centene Corp. 2.625% 2031 | | | 40 | | | | 32 | |
| Gilead Sciences, Inc. 1.65% 2030 | | | 8 | | | | 7 | |
| HCA, Inc. 3.625% 20321 | | | 16 | | | | 14 | |
| Humana, Inc. 3.70% 2029 | | | 12 | | | | 11 | |
| Merck & Co., Inc. 1.70% 2027 | | | 118 | | | | 107 | |
| Merck & Co., Inc. 3.40% 2029 | | | 110 | | | | 106 | |
| Merck & Co., Inc. 2.15% 2031 | | | 168 | | | | 145 | |
| Pfizer, Inc. 2.70% 2050 | | | 425 | | | | 324 | |
| Regeneron Pharmaceuticals, Inc. 1.75% 2030 | | | 8 | | | | 6 | |
| Regeneron Pharmaceuticals, Inc. 2.80% 2050 | | | 2 | | | | 1 | |
| Shire PLC 3.20% 2026 | | | 270 | | | | 260 | |
| Teva Pharmaceutical Finance Co. BV 6.00% 2024 | | | 700 | | | | 691 | |
| Teva Pharmaceutical Finance Co. BV 3.15% 2026 | | | 650 | | | | 535 | |
| Teva Pharmaceutical Finance Co. BV 4.10% 2046 | | | 300 | | | | 188 | |
| | | | | | | | 3,390 | |
| | | | | | | | | |
| Consumer discretionary 0.25% | | | | | | | | |
| Bayerische Motoren Werke AG 3.45% 20271 | | | 25 | | | | 24 | |
| Bayerische Motoren Werke AG 4.15% 20301 | | | 290 | | | | 285 | |
| Bayerische Motoren Werke AG 3.70% 20321 | | | 25 | | | | 24 | |
| Daimler Trucks Finance North America, LLC 1.125% 20231 | | | 495 | | | | 476 | |
| Daimler Trucks Finance North America, LLC 1.625% 20241 | | | 175 | | | | 165 | |
| Daimler Trucks Finance North America, LLC 2.375% 20281 | | | 150 | | | | 129 | |
| Daimler Trucks Finance North America, LLC 2.50% 20311 | | | 150 | | | | 122 | |
| Ford Motor Co. 2.30% 2025 | | | 200 | | | | 180 | |
| Ford Motor Credit Company, LLC 5.125% 2025 | | | 200 | | | | 191 | |
| Grand Canyon University 4.125% 2024 | | | 200 | | | | 191 | |
| Royal Caribbean Cruises, Ltd. 10.875% 20231 | | | 250 | | | | 251 | |
| Royal Caribbean Cruises, Ltd. 11.50% 20251 | | | 160 | | | | 165 | |
| Toyota Motor Credit Corp. 2.15% 2022 | | | 505 | | | | 505 | |
| | | | | | | | 2,708 | |
| | | | | | | | | |
| Utilities 0.23% | | | | | | | | |
| AEP Transmission Co., LLC 3.80% 2049 | | | 45 | | | | 39 | |
| Edison International 4.125% 2028 | | | 132 | | | | 123 | |
| FirstEnergy Corp. 2.25% 2030 | | | 107 | | | | 85 | |
| FirstEnergy Corp. 2.65% 2030 | | | 493 | | | | 408 | |
| Pacific Gas and Electric Co. 3.25% 2024 | | | 1,025 | | | | 999 | |
| Pacific Gas and Electric Co. 2.95% 2026 | | | 97 | | | | 88 | |
| Pacific Gas and Electric Co. 3.75% 2028 | | | 105 | | | | 93 | |
| Pacific Gas and Electric Co. 4.65% 2028 | | | 284 | | | | 263 | |
| 104 | American Funds Insurance Series |
Capital Income Builder (continued)
| Bonds, notes & other debt instruments (continued) | | Principal amount
(000) | | | Value
(000) | |
| Corporate bonds, notes & loans (continued) | | | | | | | | |
| Utilities (continued) | | | | | | | | |
| Pacific Gas and Electric Co. 2.50% 2031 | | USD | 375 | | | $ | 287 | |
| Southern California Edison Co., Series C, 3.60% 2045 | | | 206 | | | | 156 | |
| Union Electric Co. 3.90% 2052 | | | 25 | | | | 22 | |
| | | | | | | | 2,563 | |
| | | | | | | | | |
| Communication services 0.23% | | | | | | | | |
| América Móvil, SAB de CV, 8.46% 2036 | | MXN | 1,300 | | | | 55 | |
| AT&T, Inc. 3.50% 2041 | | USD | 75 | | | | 60 | |
| CCO Holdings, LLC and CCO Holdings Capital Corp. 4.25% 20311 | | | 360 | | | | 294 | |
| CCO Holdings, LLC and CCO Holdings Capital Corp. 4.75% 20321 | | | 25 | | | | 21 | |
| CCO Holdings, LLC and CCO Holdings Capital Corp. 4.25% 20341 | | | 175 | | | | 136 | |
| Magallanes, Inc. 4.279% 20321 | | | 36 | | | | 32 | |
| Magallanes, Inc. 5.05% 20421 | | | 47 | | | | 40 | |
| Magallanes, Inc. 5.141% 20521 | | | 63 | | | | 53 | |
| Netflix, Inc. 4.875% 2028 | | | 150 | | | | 141 | |
| SBA Tower Trust 1.631% 20261 | | | 253 | | | | 227 | |
| Sprint Corp. 6.875% 2028 | | | 325 | | | | 343 | |
| Sprint Corp. 8.75% 2032 | | | 275 | | | | 332 | |
| T-Mobile US, Inc. 3.875% 2030 | | | 625 | | | | 584 | |
| Verizon Communications, Inc. 2.355% 2032 | | | 126 | | | | 105 | |
| Walt Disney Company 4.625% 2040 | | | 120 | | | | 117 | |
| | | | | | | | 2,540 | |
| | | | | | | | | |
| Financials 0.15% | | | | | | | | |
| AerCap Ireland Capital, Ltd. / AerCap Global Aviation Trust 3.30% 2032 | | | 150 | | | | 120 | |
| Bank of America Corp. 1.922% 2031 (USD-SOFR + 1.37% on 10/24/2030)13 | | | 231 | | | | 185 | |
| Charles Schwab Corp. 2.45% 2027 | | | 25 | | | | 23 | |
| Citigroup, Inc. 3.057% 2033 (USD-SOFR + 1.351% on 1/25/2032)13 | | | 35 | | | | 30 | |
| CME Group, Inc. 2.65% 2032 | | | 50 | | | | 44 | |
| Corebridge Financial, Inc. 3.85% 20291 | | | 180 | | | | 166 | |
| Corebridge Financial, Inc. 3.90% 20321 | | | 32 | | | | 29 | |
| Corebridge Financial, Inc. 4.35% 20421 | | | 7 | | | | 6 | |
| Corebridge Financial, Inc. 4.40% 20521 | | | 49 | | | | 41 | |
| Danske Bank AS 4.298% 2028 (1-year UST Yield Curve Rate T Note Constant Maturity + 1.75% on 4/1/2027)1,13 | | | 200 | | | | 190 | |
| Goldman Sachs Group, Inc. 2.65% 2032 (USD-SOFR + 1.264% on 10/21/2031)13 | | | 75 | | | | 62 | |
| Goldman Sachs Group, Inc. 3.102% 2033 (USD-SOFR + 1.41% on 2/24/2032)13 | | | 40 | | | | 34 | |
| Intercontinental Exchange, Inc. 4.60% 2033 | | | 18 | | | | 18 | |
| Intercontinental Exchange, Inc. 4.95% 2052 | | | 16 | | | | 16 | |
| JPMorgan Chase & Co. 1.953% 2032 (USD-SOFR + 1.065% on 2/4/2031)13 | | | 227 | | | | 182 | |
| JPMorgan Chase & Co. 2.963% 2033 (USD-SOFR + 1.26% on 1/25/2032)13 | | | 17 | | | | 15 | |
| JPMorgan Chase & Co., Series I, (3-month USD-LIBOR + 3.47%) 4.709% junior subordinated perpetual bonds11 | | | 105 | | | | 100 | |
| Navient Corp. 5.00% 2027 | | | 150 | | | | 123 | |
| New York Life Global Funding 3.00% 20281 | | | 150 | | | | 142 | |
| SVB Financial Group 4.70% junior subordinated perpetual bonds (5-year UST Yield Curve Rate T Note Constant Maturity + 3.064% on 11/15/2031)13 | | | 38 | | | | 29 | |
| Wells Fargo & Company 3.35% 2033 (USD-SOFR + 1.50% on 3/2/2032)13 | | | 105 | | | | 93 | |
| | | | | | | | 1,648 | |
| | | | | | | | | |
| Consumer staples 0.10% | | | | | | | | |
| 7-Eleven, Inc. 0.80% 20241 | | | 50 | | | | 47 | |
| 7-Eleven, Inc. 0.95% 20261 | | | 60 | | | | 53 | |
| 7-Eleven, Inc. 1.30% 20281 | | | 45 | | | | 38 | |
| 7-Eleven, Inc. 1.80% 20311 | | | 325 | | | | 254 | |
| Altria Group, Inc. 3.70% 2051 | | | 25 | | | | 16 | |
| British American Tobacco PLC 4.70% 2027 | | | 105 | | | | 103 | |
| British American Tobacco PLC 4.448% 2028 | | | 150 | | | | 142 | |
| British American Tobacco PLC 4.54% 2047 | | | 82 | | | | 60 | |
| American Funds Insurance Series | 105 |
Capital Income Builder (continued)
| Bonds, notes & other debt instruments (continued) | | Principal amount
(000) | | | Value
(000) | |
| Corporate bonds, notes & loans (continued) | | | | | | | | |
| Consumer staples (continued) | | | | | | | | |
| British American Tobacco PLC 4.758% 2049 | | USD | 121 | | | $ | 92 | |
| Kraft Heinz Company 3.00% 2026 | | | 93 | | | | 88 | |
| Kraft Heinz Company 4.875% 2049 | | | 170 | | | | 150 | |
| Kraft Heinz Company 5.50% 2050 | | | 75 | | | | 72 | |
| | | | | | | | 1,115 | |
| | | | | | | | | |
| Industrials 0.09% | | | | | | | | |
| Boeing Company 4.508% 2023 | | | 270 | | | | 271 | |
| Boeing Company 2.75% 2026 | | | 91 | | | | 85 | |
| Boeing Company 5.15% 2030 | | | 284 | | | | 273 | |
| Boeing Company 5.805% 2050 | | | 95 | | | | 87 | |
| Canadian Pacific Railway, Ltd. 2.45% 2031 | | | 78 | | | | 67 | |
| Canadian Pacific Railway, Ltd. 3.10% 2051 | | | 102 | | | | 75 | |
| CSX Corp. 4.75% 2048 | | | 50 | | | | 49 | |
| Masco Corp. 3.125% 2051 | | | 10 | | | | 7 | |
| Union Pacific Corp. 2.80% 2032 | | | 17 | | | | 15 | |
| Union Pacific Corp. 3.50% 2053 | | | 20 | | | | 16 | |
| | | | | | | | 945 | |
| | | | | | | | | |
| Information technology 0.07% | | | | | | | | |
| Broadcom, Inc. 4.00% 20291 | | | 6 | | | | 6 | |
| Broadcom, Inc. 4.15% 20321 | | | 11 | | | | 10 | |
| Broadcom, Inc. 3.75% 20511 | | | 91 | | | | 68 | |
| Lenovo Group, Ltd. 5.875% 2025 | | | 400 | | | | 412 | |
| Oracle Corp. 2.875% 2031 | | | 140 | | | | 115 | |
| Oracle Corp. 3.60% 2050 | | | 150 | | | | 104 | |
| ServiceNow, Inc. 1.40% 2030 | | | 130 | | | | 102 | |
| | | | | | | | 817 | |
| | | | | | | | | |
| Materials 0.03% | | | | | | | | |
| Dow Chemical Co. 3.60% 2050 | | | 75 | | | | 57 | |
| International Flavors & Fragrances, Inc. 1.832% 20271 | | | 100 | | | | 86 | |
| International Flavors & Fragrances, Inc. 3.468% 20501 | | | 10 | | | | 7 | |
| LYB International Finance III, LLC 4.20% 2050 | | | 49 | | | | 40 | |
| LYB International Finance III, LLC 3.625% 2051 | | | 102 | | | | 76 | |
| South32 Treasury (USA), Ltd. 4.35% 20321 | | | 14 | | | | 13 | |
| | | | | | | | 279 | |
| | | | | | | | | |
| Real estate 0.02% | | | | | | | | |
| American Tower Corp. 4.05% 2032 | | | 11 | | | | 10 | |
| Equinix, Inc. 1.55% 2028 | | | 25 | | | | 21 | |
| Equinix, Inc. 3.20% 2029 | | | 144 | | | | 128 | |
| Equinix, Inc. 2.50% 2031 | | | 47 | | | | 38 | |
| | | | | | | | 197 | |
| | | | | | | | | |
| Total corporate bonds, notes & loans | | | | | | | 20,102 | |
| | | | | | | | | |
| Asset-backed obligations 0.68% | | | | | | | | |
| Aesop Funding, LLC, Series 2020-2, Class A, 2.02% 20271,10 | | | 197 | | | | 181 | |
| Aesop Funding, LLC, Series 2020-2A, Class B, 2.96% 20271,10 | | | 100 | | | | 94 | |
| Affirm Asset Securitization Trust, Series 2022-X1, Class A, 1.75% 20271,10 | | | 178 | | | | 175 | |
| American Homes 4 Rent, Series 2014-SFR2, Class A, 3.786% 20361,10 | | | 86 | | | | 86 | |
| American Homes 4 Rent, Series 2015-SFR2, Class A, 3.732% 20521,10 | | | 88 | | | | 87 | |
| American Homes 4 Rent, Series 2015-SFR2, Class B, 4.295% 20521,10 | | | 100 | | | | 99 | |
| AmeriCredit Automobile Receivables Trust, Series 2022-2, Class A2B, (30-day Average USD-SOFR + 1.15%) 1.927% 202510,11 | | | 150 | | | | 150 | |
| Bankers Healthcare Group Securitization Trust, Series 2022-A, Class A, 1.71% 20351,10 | | | 91 | | | | 87 | |
| CF Hippolyta, LLC, Series 2020-1, Class A1, 1.69% 20601,10 | | | 359 | | | | 326 | |
| CF Hippolyta, LLC, Series 2020-1, Class A2, 1.99% 20601,10 | | | 90 | | | | 77 | |
| CF Hippolyta, LLC, Series 2020-1, Class B1, 2.28% 20601,10 | | | 92 | | | | 83 | |
| 106 | American Funds Insurance Series |
Capital Income Builder (continued)
| Bonds, notes & other debt instruments (continued) | | Principal amount
(000) | | | Value
(000) | |
| Asset-backed obligations (continued) | | | | | | | | |
| CF Hippolyta, LLC, Series 2020-1, Class B2, 2.60% 20601,10 | | USD | 92 | | | $ | 79 | |
| CF Hippolyta, LLC, Series 2021-1, Class A1, 1.53% 20611,10 | | | 323 | | | | 285 | |
| Exeter Automobile Receivables Trust, Series 2022-3A, Class A2, 3.45% 202410 | | | 63 | | | | 63 | |
| FirstKey Homes Trust, Series 2022-SFR2, Class A, 4.145% 20391,10 | | | 132 | | | | 130 | |
| Ford Credit Auto Owner Trust, Series 2022-B, Class A2B, (30-day Average USD-SOFR + 0.60%) 1.252% 202510,11 | | | 73 | | | | 73 | |
| Freedom Financial, Series 2022-1FP, Class A, 0.94% 20291,10 | | | 72 | | | | 71 | |
| GCI Funding I, LLC, Series 2020-1, Class A, 2.82% 20451,10 | | | 566 | | | | 523 | |
| GCI Funding I, LLC, Series 2021-1, Class A, 2.38% 20461,10 | | | 91 | | | | 81 | |
| Global SC Finance V SRL, Series 2019-1A, Class B, 4.81% 20391,10 | | | 145 | | | | 140 | |
| Hertz Vehicle Financing III, LLC, Series 2021-1A, Class A, 1.21% 20251,10 | | | 247 | | | | 231 | |
| Hertz Vehicle Financing III, LLC, Series 2021-1A, Class B, 1.56% 20251,10 | | | 100 | | | | 93 | |
| Hertz Vehicle Financing III, LLC, Series 2021-2A, Class A, 1.68% 20271,10 | | | 268 | | | | 237 | |
| Hertz Vehicle Financing III, LLC, Series 2021-2A, Class B, 2.12% 20271,10 | | | 100 | | | | 89 | |
| Hertz Vehicle Financing III, LLC, Series 2021-2A, Class C, 2.52% 20271,10 | | | 100 | | | | 88 | |
| Navient Student Loan Trust, Series 2021-A, Class A, 0.84% 20691,10 | | | 51 | | | | 47 | |
| Navient Student Loan Trust, Series 2021-C, Class A, 1.06% 20691,10 | | | 156 | | | | 144 | |
| Nelnet Student Loan Trust, Series 2021-A, Class APT1, 1.36% 20621,10 | | | 236 | | | | 219 | |
| Nelnet Student Loan Trust, Series 2021-B, Class AFX, 1.42% 20621,10 | | | 471 | | | | 437 | |
| Nelnet Student Loan Trust, Series 2021-C, Class AFL, (1-month USD-LIBOR + 0.74%) 2.335% 20621,10,11 | | | 248 | | | | 242 | |
| New Economy Assets Phase 1 Issuer, LLC, Series 2021-1, Class A1, 1.91% 20611,10 | | | 935 | | | | 817 | |
| Nissan Auto Lease Trust, Series 2021-A, Class A3, 0.52% 202410 | | | 199 | | | | 193 | |
| Nissan Auto Lease Trust, Series 2022-A, Class A2B, (30-day Average USD-SOFR + 0.60%) 1.113% 202410,11 | | | 250 | | | | 246 | |
| OnDeck Asset Securitization Trust, LLC, Series 2021-1A, Class A, 1.59% 20271,10 | | | 100 | | | | 91 | |
| Oportun Funding, LLC, Series 2021-B, Class A, 1.47% 20311,10 | | | 100 | | | | 93 | |
| SMB Private Education Loan Trust, Series 2021-A, Class APT2, 1.07% 20531,10 | | | 84 | | | | 74 | |
| Stonepeak Infrastructure Partners, Series 2021-1A, Class AA, 2.301% 20331,10 | | | 224 | | | | 209 | |
| Toyota Auto Loan Extended Note Trust, Series 2021-1, Class A, 1.07% 20341,10,11 | | | 335 | | | | 304 | |
| Verizon Master Trust, Series 2022-3, Class A, 3.01% 2027 (3.76% on 11/20/2023)10,13 | | | 160 | | | | 159 | |
| Volkswagen Auto Lease Trust, Series 2022-A, Class A2, 3.02% 202410 | | | 110 | | | | 109 | |
| Westlake Automobile Receivables Trust, Series 2022-2A, Class A2A, 3.36% 20251,10 | | | 494 | | | | 492 | |
| | | | | | | | 7,504 | |
| | | | | | | | | |
| Bonds & notes of governments & government agencies outside the U.S. 0.07% | | | | | | | | |
| Peru (Republic of) 2.783% 2031 | | | 190 | | | | 162 | |
| Portuguese Republic 5.125% 2024 | | | 18 | | | | 19 | |
| Qatar (State of) 4.50% 2028 | | | 200 | | | | 207 | |
| Saudi Arabia (Kingdom of) 3.625% 2028 | | | 200 | | | | 198 | |
| United Mexican States 3.25% 2030 | | | 200 | | | | 176 | |
| | | | | | | | 762 | |
| | | | | | | | | |
| Municipals 0.02% | | | | | | | | |
| California 0.00% | | | | | | | | |
| Golden State Tobacco Securitization Corp., Enhanced Tobacco Settlement Asset-Backed Bonds, Series 2021-B, 2.746% 2034 | | | 15 | | | | 13 | |
| | | | | | | | | |
| Illinois 0.02% | | | | | | | | |
| G.O. Bonds, Pension Funding, Series 2003, 5.10% 2033 | | | 225 | | | | 227 | |
| | | | | | | | | |
| Total municipals | | | | | | | 240 | |
| | | | | | | | | |
| Total bonds, notes & other debt instruments (cost: $210,549,000) | | | | | | | 200,954 | |
| American Funds Insurance Series | 107 |
Capital Income Builder (continued)
| Short-term securities 10.25% | | Shares | | | Value
(000) | |
| Money market investments 9.10% | | | | | | | | |
| Capital Group Central Cash Fund 1.38%7,14 | | | 999,523 | | | $ | 99,932 | |
| | | | | | | | | |
| Money market investments purchased with collateral from securities on loan 1.15% | | | | | | | | |
| Capital Group Central Cash Fund 1.38%7,14,15 | | | 35,799 | | | | 3,579 | |
| Goldman Sachs Financial Square Government Fund, Institutional Shares 1.39%14,15 | | | 1,889,762 | | | | 1,890 | |
| Invesco Short-Term Investments Trust – Government & Agency Portfolio, Institutional Class 1.38%14,15 | | | 1,789,584 | | | | 1,790 | |
| Morgan Stanley Institutional Liquidity Funds – Government Portfolio, Institutional Class 1.38%14,15 | | | 1,789,585 | | | | 1,790 | |
| BlackRock Liquidity Funds – FedFund, Institutional Shares 1.32%14,15 | | | 1,789,584 | | | | 1,789 | |
| State Street Institutional U.S. Government Money Market Fund, Institutional Class 1.40%14,15 | | | 1,789,585 | | | | 1,789 | |
| | | | | | | | 12,627 | |
| | | | | | | | | |
| Total short-term securities (cost: $112,575,000) | | | | | | | 112,559 | |
| Total investment securities 104.64% (cost: $1,052,874,000) | | | | | | | 1,148,574 | |
| Other assets less liabilities (4.64)% | | | | | | | (50,964 | ) |
| | | | | | | | | |
| Net assets 100.00% | | | | | | $ | 1,097,610 | |
Futures contracts
| Contracts | | Type | | Number of
contracts | | Expiration | | Notional
amount
(000) | | | Value and
unrealized
appreciation
(depreciation)
at 6/30/2022
(000) | |
| 30 Day Federal Funds Futures | | Long | | 64 | | September 2022 | | USD | 26,065 | | | | $ | 8 | |
| 90 Day Eurodollar Futures | | Long | | 94 | | September 2022 | | | 22,747 | | | | | (611 | ) |
| 2 Year U.S. Treasury Note Futures | | Short | | 34 | | September 2022 | | | (7,141 | ) | | | | (68 | ) |
| 5 Year U.S. Treasury Note Futures | | Long | | 129 | | September 2022 | | | 14,480 | | | | | 7 | |
| 10 Year Ultra U.S. Treasury Note Futures | | Long | | 37 | | September 2022 | | | 4,713 | | | | | (67 | ) |
| 10 Year U.S. Treasury Note Futures | | Long | | 25 | | September 2022 | | | 2,963 | | | | | (34 | ) |
| 20 Year U.S. Treasury Bond Futures | | Long | | 11 | | September 2022 | | | 1,525 | | | | | (21 | ) |
| 30 Year Ultra U.S. Treasury Bond Futures | | Long | | 67 | | September 2022 | | | 10,341 | | | | | (241 | ) |
| | | | | | | | | | | | | | $ | (1,027 | ) |
Swap contracts
Interest rate swaps
Centrally cleared interest rate swaps
| Receive | | Pay | | | | Notional | | Value at | | Upfront
premium | | Unrealized
appreciation | |
| Rate | | Payment frequency | | Rate | | Payment frequency | | Expiration date | | | amount (000) | | 6/30/2022
(000) | | paid
(000) | | at 6/30/2022
(000) | |
| 3.5291% | | Annual | | U.S. EFFR | | Annual | | 6/16/2024 | | | USD 5,635 | | | $ | 57 | | | $ | — | | | $ | 57 | |
| 3.497% | | Annual | | U.S. EFFR | | Annual | | 6/16/2024 | | | 5,600 | | | | 53 | | | | — | | | | 53 | |
| 3.52647% | | Annual | | U.S. EFFR | | Annual | | 6/16/2024 | | | 5,215 | | | | 52 | | | | — | | | | 52 | |
| 3.4325% | | Annual | | U.S. EFFR | | Annual | | 6/17/2024 | | | 4,100 | | | | 34 | | | | — | | | | 34 | |
| 3.4585% | | Annual | | U.S. EFFR | | Annual | | 6/17/2024 | | | 898 | | | | 8 | | | | — | | | | 8 | |
| 108 | American Funds Insurance Series |
Capital Income Builder (continued)
Swap contracts (continued)
Interest rate swaps (continued)
Centrally cleared interest rate swaps (continued)
| Receive | | Pay | | | | Notional | | Value at | | Upfront
premium | | Unrealized
appreciation | |
| Rate | | Payment
frequency | | Rate | | Payment
frequency | | Expiration
date | | | amount
(000) | | 6/30/2022
(000) | | paid
(000) | | at 6/30/2022 (000) | |
| 3-month USD-LIBOR | | Quarterly | | 0.5935% | | Semi-annual | | 5/18/2030 | | | USD 7,200 | | | $ | 1,224 | | | $ | — | | | $ | 1,224 | |
| 3-month USD-LIBOR | | Quarterly | | 0.807% | | Semi-annual | | 5/18/2050 | | | 805 | | | | 329 | | | | — | | | | 329 | |
| | | | | | | | | | | | | | | $ | 1,757 | | | $ | — | | | $ | 1,757 | |
Credit default swaps
Centrally cleared credit default swaps on credit indices — sell protection
Financing
rate received | | Payment
frequency | | Reference
index | | Expiration
date | | Notional
amount
(000) | | | Value at
6/30/2022
(000) | | | Upfront
premium
paid
(000) | | | Unrealized
depreciation
at 6/30/2022
(000) | |
| 5.00% | | Quarterly | | CDX.NA.HY.38 | | 6/20/2027 | | | USD 6,138 | | | $ | (185 | ) | | $ | 174 | | | $ | (359 | ) |
Investments in affiliates7
| | | Value of
affiliates at
1/1/2022
(000) | | | Additions
(000) | | | Reductions
(000) | | | Net
realized
loss
(000) | | | Net
unrealized
depreciation
(000) | | | Value of
affiliates at
6/30/2022
(000) | | | Dividend
income
(000) | |
| Investment funds 2.62% | | | | | | | | | | | | | | | | | | | | | | | | | | | | |
| Capital Group Central Corporate Bond Fund | | $ | 30,304 | | | $ | 3,186 | | | $ | — | | | $ | — | | | $ | (4,738 | ) | | $ | 28,752 | | | $ | 402 | |
| | | | | | | | | | | | | | | | | | | | | | | | | | | | | |
| Short-term securities 9.43% | | | | | | | | | | | | | | | | | | | | | | | | | | | | |
| Money market investments 9.10% | | | | | | | | | | | | | | | | | | | | | | | | | | | | |
| Capital Group Central Cash Fund 1.38%14 | | | 42,892 | | | | 156,994 | | | | 99,931 | | | | (4 | ) | | | (19 | ) | | | 99,932 | | | | 185 | |
| | | | | | | | | | | | | | | | | | | | | | | | | | | | | |
| Money market investments purchased with collateral from securities on loan 0.33% | | | | | | | | | | | | | | | | | | | | | | | | | | | | |
| Capital Group Central Cash Fund 1.38%14,15 | | | 1,954 | | | | 1,625 | 16 | | | | | | | | | | | | | | | 3,579 | | | | — | 17 |
| Total short-term securities | | | | | | | | | | | | | | | | | | | | | | | 103,511 | | | | | |
| Total 12.05% | | | | | | | | | | | | | | $ | (4 | ) | | $ | (4,757 | ) | | $ | 132,263 | | | $ | 587 | |
| American Funds Insurance Series | 109 |
Capital Income Builder (continued)
| 1 | Acquired in a transaction exempt from registration under Rule 144A of the Securities Act of 1933. May be resold in the U.S. in transactions exempt from registration, normally to qualified institutional buyers. The total value of all such securities was $20,860,000, which represented 1.90% of the net assets of the fund. |
| 2 | All or a portion of this security was on loan. The total value of all such securities was $13,384,000, which represented 1.22% of the net assets of the fund. Refer to Note 5 for more information on securities lending. |
| 3 | Valued under fair value procedures adopted by authority of the board of trustees. The total value of all such securities was $720,000, which represented .07% of the net assets of the fund. |
| 4 | Value determined using significant unobservable inputs. |
| 5 | Security did not produce income during the last 12 months. |
| 6 | Amount less than one thousand. |
| 7 | Part of the same “group of investment companies” as the fund as defined under the Investment Company Act of 1940, as amended. |
| 8 | All or a portion of this security was pledged as collateral. The total value of pledged collateral was $1,776,000, which represented .16% of the net assets of the fund. |
| 9 | Index-linked bond whose principal amount moves with a government price index. |
| 10 | Principal payments may be made periodically. Therefore, the effective maturity date may be earlier than the stated maturity date. |
| 11 | Coupon rate may change periodically. Reference rate and spread are as of the most recent information available. Some coupon rates are determined by the issuer or agent based on current market conditions; therefore, the reference rate and spread are not available. |
| 12 | Purchased on a TBA basis. |
| 13 | Step bond; coupon rate may change at a later date. |
| 14 | Rate represents the seven-day yield at 6/30/2022. |
| 15 | Security purchased with cash collateral from securities on loan. Refer to Note 5 for more information on securities lending. |
| 16 | Represents net activity. Refer to Note 5 for more information on securities lending. |
| 17 | Dividend income is included with securities lending income in the fund’s statement of operations and is not shown in this table. |
Key to abbreviations
ADR = American Depositary Receipts
Assn. = Association
CAD = Canadian dollars
CDI = CREST Depository Interest
CME = CME Group
EFFR = Effective Federal Funds Rate
EUR = Euros
G.O. = General Obligation
GBP = British pounds
GDR = Global Depositary Receipts
LIBOR = London Interbank Offered Rate
MXN = Mexican pesos
REIT = Real Estate Investment Trust
SDR = Swedish Depositary Receipts
SOFR = Secured Overnight Financing Rate
TBA = To be announced
USD = U.S. dollars
Refer to the notes to financial statements.
| 110 | American Funds Insurance Series |
Asset Allocation Fund
| Investment portfolio June 30, 2022 | unaudited |
| Common stocks 66.90% | | Shares | | | Value
(000) | |
| Health care 11.72% | | | | | | | | |
| UnitedHealth Group, Inc. | | | 1,060,800 | | | $ | 544,859 | |
| Johnson & Johnson | | | 2,330,000 | | | | 413,598 | |
| Humana, Inc. | | | 522,000 | | | | 244,333 | |
| Cigna Corp. | | | 900,000 | | | | 237,168 | |
| Pfizer, Inc. | | | 3,387,556 | | | | 177,610 | |
| Abbott Laboratories | | | 1,600,000 | | | | 173,840 | |
| CVS Health Corp. | | | 1,813,000 | | | | 167,993 | |
| Vertex Pharmaceuticals, Inc.1 | | | 555,500 | | | | 156,534 | |
| Eli Lilly and Company | | | 400,469 | | | | 129,844 | |
| Regeneron Pharmaceuticals, Inc.1 | | | 214,600 | | | | 126,856 | |
| AbbVie, Inc. | | | 821,978 | | | | 125,894 | |
| Gilead Sciences, Inc. | | | 1,845,000 | | | | 114,039 | |
| Bristol-Myers Squibb Company | | | 1,117,017 | | | | 86,010 | |
| Thermo Fisher Scientific, Inc. | | | 116,000 | | | | 63,020 | |
| Centene Corp.1 | | | 531,513 | | | | 44,971 | |
| AbCellera Biologics, Inc.1,2 | | | 2,676,672 | | | | 28,507 | |
| Alnylam Pharmaceuticals, Inc.1 | | | 188,334 | | | | 27,469 | |
| Rotech Healthcare, Inc.1,3,4,5 | | | 184,138 | | | | 18,782 | |
| Zoetis, Inc., Class A | | | 95,618 | | | | 16,436 | |
| Horizon Therapeutics PLC1 | | | 192,328 | | | | 15,340 | |
| Ultragenyx Pharmaceutical, Inc.1 | | | 217,400 | | | | 12,970 | |
| | | | | | | | 2,926,073 | |
| | | | | | | | | |
| Information technology 10.33% | | | | | | | | |
| Microsoft Corp. | | | 3,906,015 | | | | 1,003,182 | |
| Broadcom, Inc. | | | 1,536,813 | | | | 746,599 | |
| Taiwan Semiconductor Manufacturing Company, Ltd. (ADR) | | | 2,930,000 | | | | 239,528 | |
| ASML Holding NV (New York registered) (ADR) | | | 341,764 | | | | 162,639 | |
| MKS Instruments, Inc. | | | 1,500,000 | | | | 153,945 | |
| Mastercard, Inc., Class A | | | 195,977 | | | | 61,827 | |
| NVIDIA Corp. | | | 332,696 | | | | 50,433 | |
| MicroStrategy, Inc., Class A1,2 | | | 203,897 | | | | 33,500 | |
| Paychex, Inc. | | | 240,000 | | | | 27,329 | |
| DocuSign, Inc.1 | | | 440,000 | | | | 25,247 | |
| Apple, Inc. | | | 150,000 | | | | 20,508 | |
| GoDaddy, Inc., Class A1 | | | 281,000 | | | | 19,546 | |
| KLA Corp. | | | 49,000 | | | | 15,635 | |
| Applied Materials, Inc. | | | 135,000 | | | | 12,282 | |
| Adobe, Inc.1 | | | 15,500 | | | | 5,674 | |
| | | | | | | | 2,577,874 | |
| | | | | | | | | |
| Financials 9.61% | | | | | | | | |
| CME Group, Inc., Class A | | | 977,200 | | | | 200,033 | |
| Apollo Asset Management, Inc. | | | 3,886,410 | | | | 188,413 | |
| Chubb, Ltd. | | | 800,000 | | | | 157,264 | |
| First Republic Bank | | | 1,000,000 | | | | 144,200 | |
| Aon PLC, Class A | | | 489,000 | | | | 131,874 | |
| Toronto-Dominion Bank (CAD denominated) | | | 1,996,383 | | | | 130,916 | |
| Capital One Financial Corp. | | | 1,150,000 | | | | 119,818 | |
| Synchrony Financial | | | 4,100,000 | | | | 113,242 | |
| JPMorgan Chase & Co. | | | 998,100 | | | | 112,396 | |
| Bank of America Corp. | | | 3,500,000 | | | | 108,955 | |
| Western Alliance Bancorporation | | | 1,182,849 | | | | 83,509 | |
| Intercontinental Exchange, Inc. | | | 776,000 | | | | 72,975 | |
| SLM Corp. | | | 4,530,000 | | | | 72,208 | |
| KKR & Co., Inc. | | | 1,497,000 | | | | 69,296 | |
| Blue Owl Capital, Inc., Class A2 | | | 6,623,054 | | | | 66,429 | |
| Wells Fargo & Company | | | 1,570,000 | | | | 61,497 | |
| M&T Bank Corp. | | | 375,000 | | | | 59,771 | |
| Ares Management Corp., Class A | | | 1,015,403 | | | | 57,736 | |
| Nasdaq, Inc. | | | 370,100 | | | | 56,455 | |
| Brookfield Asset Management, Inc., Class A | | | 1,260,000 | | | | 56,032 | |
| American Funds Insurance Series | 111 |
Asset Allocation Fund (continued)
| Common stocks (continued) | | Shares | | | Value
(000) | |
| Financials (continued) | | | | | | | | |
| Signature Bank | | | 271,435 | | | $ | 48,644 | |
| Fifth Third Bancorp | | | 1,191,000 | | | | 40,018 | |
| S&P Global, Inc. | | | 118,700 | | | | 40,009 | |
| The Bank of N.T. Butterfield & Son, Ltd. | | | 1,120,585 | | | | 34,951 | |
| Citizens Financial Group, Inc. | | | 940,000 | | | | 33,549 | |
| EQT AB | | | 1,446,647 | | | | 29,612 | |
| Antin Infrastructure Partners SA | | | 1,243,300 | | | | 29,342 | |
| Blackstone, Inc., nonvoting shares | | | 237,500 | | | | 21,667 | |
| Bridgepoint Group PLC | | | 5,809,554 | | | | 17,086 | |
| Progressive Corp. | | | 105,000 | | | | 12,208 | |
| OneMain Holdings, Inc. | | | 300,000 | | | | 11,214 | |
| Islandsbanki hf. | | | 9,555,235 | | | | 8,663 | |
| Hong Kong Exchanges and Clearing, Ltd. | | | 170,000 | | | | 8,363 | |
| Jonah Energy Parent, LLC3,4 | | | 32,117 | | | | 2,061 | |
| Sberbank of Russia PJSC1,3,4,6 | | | 8,880,000 | | | | — | 7 |
| | | | | | | | 2,400,406 | |
| | | | | | | | | |
| Consumer discretionary 7.83% | | | | �� | | | | |
| Aramark | | | 11,375,152 | | | | 348,421 | |
| Home Depot, Inc. | | | 1,226,200 | | | | 336,310 | |
| Amazon.com, Inc.1 | | | 2,371,740 | | | | 251,903 | |
| Dollar General Corp. | | | 736,909 | | | | 180,867 | |
| LVMH Moët Hennessy-Louis Vuitton SE | | | 224,596 | | | | 136,912 | |
| Booking Holdings, Inc.1 | | | 72,045 | | | | 126,006 | |
| General Motors Company1 | | | 3,750,000 | | | | 119,100 | |
| Target Corp. | | | 750,000 | | | | 105,922 | |
| Lear Corp. | | | 800,000 | | | | 100,712 | |
| D.R. Horton, Inc. | | | 870,000 | | | | 57,585 | |
| Etsy, Inc.1 | | | 742,289 | | | | 54,343 | |
| Royal Caribbean Cruises, Ltd.1 | | | 1,470,324 | | | | 51,329 | |
| YUM! Brands, Inc. | | | 277,000 | | | | 31,442 | |
| Xpeng, Inc., Class A (ADR)1 | | | 703,800 | | | | 22,339 | |
| Darden Restaurants, Inc. | | | 142,000 | | | | 16,063 | |
| Chipotle Mexican Grill, Inc.1 | | | 5,800 | | | | 7,582 | |
| Dr. Martens PLC | | | 2,375,000 | | | | 6,863 | |
| | | | | | | | 1,953,699 | |
| | | | | | | | | |
| Consumer staples 5.92% | | | | | | | | |
| Philip Morris International, Inc. | | | 8,992,421 | | | | 887,912 | |
| British American Tobacco PLC (ADR) | | | 2,634,146 | | | | 113,031 | |
| British American Tobacco PLC | | | 1,400,000 | | | | 59,980 | |
| Nestlé SA | | | 1,300,000 | | | | 151,754 | |
| Archer Daniels Midland Company | | | 1,880,000 | | | | 145,888 | |
| Altria Group, Inc. | | | 1,570,000 | | | | 65,579 | |
| Avenue Supermarts, Ltd.1 | | | 970,539 | | | | 41,860 | |
| Costco Wholesale Corp. | | | 26,000 | | | | 12,461 | |
| | | | | | | | 1,478,465 | |
| | | | | | | | | |
| Industrials 5.63% | | | | | | | | |
| Northrop Grumman Corp. | | | 853,553 | | | | 408,485 | |
| L3Harris Technologies, Inc. | | | 1,194,000 | | | | 288,590 | |
| Lockheed Martin Corp. | | | 644,500 | | | | 277,109 | |
| Boeing Company1 | | | 820,000 | | | | 112,110 | |
| Caterpillar, Inc. | | | 618,000 | | | | 110,474 | |
| CSX Corp. | | | 2,628,369 | | | | 76,380 | |
| Raytheon Technologies Corp. | | | 395,000 | | | | 37,963 | |
| Storskogen Group AB, Class B2 | | | 23,562,528 | | | | 33,329 | |
| AMETEK, Inc. | | | 140,000 | | | | 15,385 | |
| Cintas Corp. | | | 40,000 | | | | 14,941 | |
| 112 | American Funds Insurance Series |
Asset Allocation Fund (continued)
| Common stocks (continued) | | Shares | | | Value
(000) | |
| Industrials (continued) | | | | | | | | |
| Copart, Inc.1 | | | 116,000 | | | $ | 12,605 | |
| Chart Industries, Inc.1 | | | 68,000 | | | | 11,382 | |
| Air Lease Corp., Class A | | | 220,000 | | | | 7,355 | |
| | | | | | | | 1,406,108 | |
| | | | | | | | | |
| Communication services 5.09% | | | | | | | | |
| Alphabet, Inc., Class C1 | | | 194,843 | | | | 426,209 | |
| Alphabet, Inc., Class A1 | | | 8,450 | | | | 18,415 | |
| Charter Communications, Inc., Class A1 | | | 821,000 | | | | 384,663 | |
| Meta Platforms, Inc., Class A1 | | | 1,506,948 | | | | 242,995 | |
| Comcast Corp., Class A | | | 3,307,000 | | | | 129,767 | |
| Activision Blizzard, Inc. | | | 447,541 | | | | 34,846 | |
| Netflix, Inc.1 | | | 168,491 | | | | 29,464 | |
| Electronic Arts, Inc. | | | 35,000 | | | | 4,258 | |
| | | | | | �� | | 1,270,617 | |
| | | | | | | | | |
| Materials 4.17% | | | | | | | | |
| Corteva, Inc. | | | 3,900,000 | | | | 211,146 | |
| Vale SA, ordinary nominative shares | | | 7,201,887 | | | | 105,356 | |
| Mosaic Co. | | | 1,940,000 | | | | 91,626 | |
| Royal Gold, Inc. | | | 845,000 | | | | 90,229 | |
| Nucor Corp. | | | 812,700 | | | | 84,854 | |
| LyondellBasell Industries NV | | | 850,000 | | | | 74,341 | |
| Rio Tinto PLC | | | 1,175,000 | | | | 70,322 | |
| First Quantum Minerals, Ltd. | | | 3,220,000 | | | | 61,088 | |
| Newmont Corp. | | | 900,000 | | | | 53,703 | |
| Wheaton Precious Metals Corp. | | | 1,353,000 | | | | 48,749 | |
| Franco-Nevada Corp. | | | 347,089 | | | | 45,657 | |
| Allegheny Technologies, Inc.1 | | | 1,750,000 | | | | 39,742 | |
| Nutrien, Ltd. (CAD denominated) | | | 400,272 | | | | 31,877 | |
| Air Products and Chemicals, Inc. | | | 84,000 | | | | 20,200 | |
| Sherwin-Williams Company | | | 54,700 | | | | 12,248 | |
| | | | | | | | 1,041,138 | |
| | | | | | | | | |
| Energy 3.43% | | | | | | | | |
| Canadian Natural Resources, Ltd. (CAD denominated) | | | 7,565,100 | | | | 406,524 | |
| Pioneer Natural Resources Company | | | 782,000 | | | | 174,448 | |
| Cenovus Energy, Inc. (CAD denominated) | | | 6,000,000 | | | | 114,155 | |
| Hess Corp. | | | 400,000 | | | | 42,376 | |
| Chevron Corp. | | | 270,000 | | | | 39,091 | |
| ConocoPhillips | | | 402,000 | | | | 36,104 | |
| TC Energy Corp. | | | 631,700 | | | | 32,728 | |
| Equitrans Midstream Corp. | | | 1,060,000 | | | | 6,742 | |
| Chesapeake Energy Corp. | | | 30,189 | | | | 2,448 | |
| Diamond Offshore Drilling, Inc.1,2 | | | 247,104 | | | | 1,455 | |
| Diamond Offshore Drilling, Inc.1,6 | | | 86,354 | | | | 509 | |
| McDermott International, Ltd.1,3,4 | | | 40,219 | | | | 23 | |
| Bighorn Permian Resources, LLC1,3,4 | | | 4,392 | | | | 23 | |
| Constellation Oil Services Holding SA, Class B-11,3,4 | | | 480,336 | | | | — | 7 |
| | | | | | | | 856,626 | |
| | | | | | | | | |
| Real estate 2.25% | | | | | | | | |
| VICI Properties, Inc. REIT | | | 11,720,160 | | | | 349,144 | |
| Gaming and Leisure Properties, Inc. REIT | | | 2,595,400 | | | | 119,025 | |
| STORE Capital Corp. REIT | | | 2,200,000 | | | | 57,376 | |
| Crown Castle International Corp. REIT | | | 166,000 | | | | 27,951 | |
| Equinix, Inc. REIT | | | 12,700 | | | | 8,344 | |
| | | | | | | | 561,840 | |
| American Funds Insurance Series | 113 |
Asset Allocation Fund (continued)
| Common stocks (continued) | | Shares | | | Value
(000) | |
| Utilities 0.92% | | | | | | | | |
| Enel SpA | | | 20,400,000 | | | $ | 111,594 | |
| Exelon Corp. | | | 1,195,231 | | | | 54,168 | |
| CenterPoint Energy, Inc. | | | 1,197,782 | | | | 35,430 | |
| Evergy, Inc. | | | 298,000 | | | | 19,445 | |
| Constellation Energy Corp. | | | 138,666 | | | | 7,940 | |
| | | | | | | | 228,577 | |
| | | | | | | | | |
| Total common stocks (cost: $12,391,314,000) | | | | | | | 16,701,423 | |
| | | | | | | | | |
| Preferred securities 0.00% | | | | | | | | |
| Industrials 0.00% | | | | | | | | |
| ACR III LSC Holdings, LLC, Series B, preferred shares1,3,4,6 | | | 450 | | | | 144 | |
| | | | | | | | | |
| Total preferred securities (cost: $466,000) | | | | | | | 144 | |
| | | | | | | | | |
| Rights & warrants 0.00% | | | | | | | | |
| Energy 0.00% | | | | | | | | |
| Constellation Oil Services Holding SA, Class D, warrants1,3,4 | | | 4 | | | | — | 7 |
| | | | | | | | | |
| Total rights & warrants (cost: $0) | | | | | | | — | 7 |
| | | | | | | | | |
| Convertible stocks 0.20% | | | | | | | | |
| Health care 0.20% | | | | | | | | |
| Carbon Health Technologies, Inc., convertible preferred shares, 1.00% 20243,4,5 | | | 50,000 | | | | 50,000 | |
| | | | | | | | | |
| Total convertible stocks (cost: $50,000,000) | | | | | | | 50,000 | |
| | | | | | | | | |
| Investment funds 5.58% | | | | | | | | |
| Capital Group Central Corporate Bond Fund8 | | | 165,135,085 | | | | 1,393,740 | |
| | | | | | | | | |
| Total investment funds (cost: $1,663,339,000) | | | | | | | 1,393,740 | |
| | | | | | | | | |
| Bonds, notes & other debt instruments 22.54% | | Principal amount
(000) | | | | | |
| U.S. Treasury bonds & notes 8.05% | | | | | | | | |
| U.S. Treasury 5.58% | | | | | | | | |
| U.S. Treasury 1.375% 2022 | | USD | 280 | | | | 280 | |
| U.S. Treasury 1.625% 2022 | | | 94 | | | | 94 | |
| U.S. Treasury 0.125% 2023 | | | 44,825 | | | | 44,081 | |
| U.S. Treasury 2.25% 2023 | | | 5,000 | | | | 4,948 | |
| U.S. Treasury 2.375% 2023 | | | 5,000 | | | | 4,994 | |
| U.S. Treasury 2.75% 2023 | | | 15,000 | | | | 14,988 | |
| U.S. Treasury 1.00% 2024 | | | 10,725 | | | | 10,214 | |
| U.S. Treasury 1.50% 2024 | | | 907 | | | | 877 | |
| U.S. Treasury 2.25% 2024 | | | 5,000 | | | | 4,945 | |
| U.S. Treasury 2.50% 2024 | | | 239,179 | | | | 237,066 | |
| U.S. Treasury 2.50% 2024 | | | 700 | | | | 694 | |
| U.S. Treasury 3.00% 2024 | | | 16,500 | | | | 16,515 | |
| U.S. Treasury 0.25% 2025 | | | 23,812 | | | | 21,979 | |
| U.S. Treasury 2.50% 2025 | | | 3,500 | | | | 3,455 | |
| U.S. Treasury 2.75% 2025 | | | 3,229 | | | | 3,205 | |
| U.S. Treasury 2.875% 2025 | | | 2,724 | | | | 2,714 | |
| U.S. Treasury 3.00% 2025 | | | 10,000 | | | | 9,985 | |
| U.S. Treasury 0.375% 2026 | | | 75,000 | | | | 68,192 | |
| U.S. Treasury 0.50% 2026 | | | 42,515 | | | | 38,755 | |
| U.S. Treasury 0.75% 2026 | | | 16,833 | | | | 15,431 | |
| U.S. Treasury 0.75% 2026 | | | 52 | | | | 47 | |
| U.S. Treasury 0.875% 2026 | | | 565 | | | | 516 | |
| U.S. Treasury 1.125% 2026 | | | 471 | | | | 434 | |
| 114 | American Funds Insurance Series |
Asset Allocation Fund (continued)
| Bonds, notes & other debt instruments (continued) | | Principal amount
(000) | | | Value
(000) | |
| U.S. Treasury bonds & notes (continued) | | | | | | | | |
| U.S. Treasury (continued) | | | | | | | | |
| U.S. Treasury 1.50% 2026 | | USD | 500 | | | $ | 470 | |
| U.S. Treasury 1.625% 2026 | | | 35,000 | | | | 32,935 | |
| U.S. Treasury 1.625% 2026 | | | 7,000 | | | | 6,656 | |
| U.S. Treasury 1.625% 2026 | | | 1,500 | | | | 1,422 | |
| U.S. Treasury 0.50% 2027 | | | 36,300 | | | | 31,990 | |
| U.S. Treasury 0.625% 2027 | | | 7,109 | | | | 6,228 | |
| U.S. Treasury 1.125% 2027 | | | 762 | | | | 698 | |
| U.S. Treasury 2.375% 2027 | | | 880 | | | | 852 | |
| U.S. Treasury 2.625% 2027 | | | 105,393 | | | | 103,390 | |
| U.S. Treasury 1.25% 2028 | | | 3,142 | | | | 2,813 | |
| U.S. Treasury 1.375% 2028 | | | 10,900 | | | | 9,819 | |
| U.S. Treasury 1.50% 2028 | | | 50,000 | | | | 45,377 | |
| U.S. Treasury 2.875% 2028 | | | 5,217 | | | | 5,154 | |
| U.S. Treasury 2.875% 2029 | | | 50,000 | | | | 49,389 | |
| U.S. Treasury 0.625% 2030 | | | 20,225 | | | | 16,856 | |
| U.S. Treasury 1.50% 2030 | | | 36,651 | | | | 32,903 | |
| U.S. Treasury 2.875% 20329 | | | 206,475 | | | | 204,015 | |
| U.S. Treasury 1.125% 2040 | | | 62,775 | | | | 43,559 | |
| U.S. Treasury 1.375% 20409 | | | 52,695 | | | | 37,810 | |
| U.S. Treasury 1.75% 2041 | | | 47,854 | | | | 36,257 | |
| U.S. Treasury 2.00% 2041 | | | 1,181 | | | | 934 | |
| U.S. Treasury 2.375% 2042 | | | 9,305 | | | | 7,857 | |
| U.S. Treasury 3.25% 2042 | | | 10,694 | | | | 10,393 | |
| U.S. Treasury 2.50% 2046 | | | 3,755 | | | | 3,174 | |
| U.S. Treasury 3.00% 2047 | | | 9,355 | | | | 8,718 | |
| U.S. Treasury 3.00% 2048 | | | 336 | | | | 316 | |
| U.S. Treasury 2.25% 2049 | | | 15,000 | | | | 12,253 | |
| U.S. Treasury 1.375% 2050 | | | 12,500 | | | | 8,194 | |
| U.S. Treasury 2.00% 2050 | | | 13,825 | | | | 10,674 | |
| U.S. Treasury 2.00% 2051 | | | 1,356 | | | | 1,044 | |
| U.S. Treasury 2.375% 2051 | | | 4,758 | | | | 4,001 | |
| U.S. Treasury 2.25% 20529 | | | 187,501 | | | | 153,630 | |
| | | | | | | | 1,394,190 | |
| | | | | | | | | |
| U.S. Treasury inflation-protected securities 2.47% | | | | | | | | |
| U.S. Treasury Inflation-Protected Security 0.125% 202410 | | | 95,764 | | | | 96,387 | |
| U.S. Treasury Inflation-Protected Security 0.125% 202410 | | | 7,579 | | | | 7,657 | |
| U.S. Treasury Inflation-Protected Security 0.50% 202410 | | | 21,407 | | | | 21,715 | |
| U.S. Treasury Inflation-Protected Security 0.625% 202410 | | | 97,111 | | | | 98,720 | |
| U.S. Treasury Inflation-Protected Security 0.125% 202510 | | | 25,738 | | | | 25,752 | |
| U.S. Treasury Inflation-Protected Security 0.125% 202510 | | | 3,788 | | | | 3,785 | |
| U.S. Treasury Inflation-Protected Security 0.25% 202510 | | | 24,408 | | | | 24,560 | |
| U.S. Treasury Inflation-Protected Security 0.375% 202510 | | | 4,510 | | | | 4,555 | |
| U.S. Treasury Inflation-Protected Security 0.125% 202610 | | | 117,121 | | | | 115,994 | |
| U.S. Treasury Inflation-Protected Security 0.125% 202610 | | | 42,270 | | | | 41,868 | |
| U.S. Treasury Inflation-Protected Security 0.75% 202810 | | | 20,152 | | | | 20,324 | |
| U.S. Treasury Inflation-Protected Security 0.875% 202910 | | | 22,718 | | | | 22,903 | |
| U.S. Treasury Inflation-Protected Security 0.125% 203110 | | | 26,261 | | | | 24,919 | |
| U.S. Treasury Inflation-Protected Security 0.125% 203210 | | | 58,733 | | | | 55,582 | |
| U.S. Treasury Inflation-Protected Security 1.00% 20499,10 | | | 53,507 | | | | 51,174 | |
| | | | | | | | 615,895 | |
| | | | | | | | | |
| Total U.S. Treasury bonds & notes | | | | | | | 2,010,085 | |
| | | | | | | | | |
| Mortgage-backed obligations 6.72% | | | | | | | | |
| Federal agency mortgage-backed obligations 6.11% | | | | | | | | |
| Fannie Mae Pool #AD7072 4.00% 202511 | | | 2 | | | | 2 | |
| Fannie Mae Pool #AE2321 4.00% 202511 | | | 1 | | | | 1 | |
| Fannie Mae Pool #AE3069 4.00% 202511 | | | 1 | | | | 1 | |
| Fannie Mae Pool #AH6431 4.00% 202611 | | | 228 | | | | 230 | |
| Fannie Mae Pool #890329 4.00% 202611 | | | 35 | | | | 35 | |
| American Funds Insurance Series | 115 |
Asset Allocation Fund (continued)
| Bonds, notes & other debt instruments (continued) | | Principal amount
(000) | | | Value
(000) | |
| Mortgage-backed obligations (continued) | | | | | | | | |
| Federal agency mortgage-backed obligations (continued) | | | | | | | | |
| Fannie Mae Pool #AH5618 4.00% 202611 | | USD | 2 | | | $ | 2 | |
| Fannie Mae Pool #AH0829 4.00% 202611 | | | 2 | | | | 2 | |
| Fannie Mae Pool #MA1109 4.00% 202711 | | | 3 | | | | 3 | |
| Fannie Mae Pool #MA3653 3.00% 202911 | | | 16 | | | | 15 | |
| Fannie Mae Pool #AL8347 4.00% 202911 | | | 244 | | | | 247 | |
| Fannie Mae Pool #254767 5.50% 203311 | | | 226 | | | | 242 | |
| Fannie Mae Pool #555956 5.50% 203311 | | | 146 | | | | 156 | |
| Fannie Mae Pool #BN1085 4.00% 203411 | | | 431 | | | | 438 | |
| Fannie Mae Pool #BN3172 4.00% 203411 | | | 167 | | | | 169 | |
| Fannie Mae Pool #AS8554 3.00% 203611 | | | 6,381 | | | | 6,242 | |
| Fannie Mae Pool #929185 5.50% 203611 | | | 398 | | | | 426 | |
| Fannie Mae Pool #893641 6.00% 203611 | | | 796 | | | | 872 | |
| Fannie Mae Pool #893688 6.00% 203611 | | | 168 | | | | 184 | |
| Fannie Mae Pool #907239 6.00% 203611 | | | 56 | | | | 61 | |
| Fannie Mae Pool #AD0249 5.50% 203711 | | | 120 | | | | 129 | |
| Fannie Mae Pool #190379 5.50% 203711 | | | 61 | | | | 65 | |
| Fannie Mae Pool #924952 6.00% 203711 | | | 908 | | | | 995 | |
| Fannie Mae Pool #888292 6.00% 203711 | | | 600 | | | | 657 | |
| Fannie Mae Pool #928031 6.00% 203711 | | | 69 | | | | 75 | |
| Fannie Mae Pool #888637 6.00% 203711 | | | 11 | | | | 12 | |
| Fannie Mae Pool #AD0119 6.00% 203811 | | | 1,024 | | | | 1,123 | |
| Fannie Mae Pool #AD0095 6.00% 203811 | | | 757 | | | | 830 | |
| Fannie Mae Pool #995674 6.00% 203811 | | | 338 | | | | 370 | |
| Fannie Mae Pool #AE0021 6.00% 203811 | | | 302 | | | | 331 | |
| Fannie Mae Pool #AL7164 6.00% 203811 | | | 202 | | | | 216 | |
| Fannie Mae Pool #AB0538 6.00% 203811 | | | 114 | | | | 124 | |
| Fannie Mae Pool #889983 6.00% 203811 | | | 20 | | | | 22 | |
| Fannie Mae Pool #995391 6.00% 203811 | | | 17 | | | | 18 | |
| Fannie Mae Pool #995224 6.00% 203811 | | | 8 | | | | 9 | |
| Fannie Mae Pool #AD0833 6.00% 203911 | | | — | 7 | | | — | 7 |
| Fannie Mae Pool #AL0013 6.00% 204011 | | | 202 | | | | 222 | |
| Fannie Mae Pool #AL0309 6.00% 204011 | | | 69 | | | | 76 | |
| Fannie Mae Pool #MA4501 2.00% 204111 | | | 9,156 | | | | 8,189 | |
| Fannie Mae Pool #MA4387 2.00% 204111 | | | 8,007 | | | | 7,161 | |
| Fannie Mae Pool #AB4536 6.00% 204111 | | | 457 | | | | 495 | |
| Fannie Mae Pool #AL7228 6.00% 204111 | | | 267 | | | | 288 | |
| Fannie Mae Pool #FS0305 1.50% 204211 | | | 23,696 | | | | 20,310 | |
| Fannie Mae Pool #MA4520 2.00% 204211 | | | 15,523 | | | | 13,806 | |
| Fannie Mae Pool #AP2131 3.50% 204211 | | | 3,348 | | | | 3,291 | |
| Fannie Mae Pool #AU8813 4.00% 204311 | | | 2,395 | | | | 2,419 | |
| Fannie Mae Pool #AU9348 4.00% 204311 | | | 1,403 | | | | 1,417 | |
| Fannie Mae Pool #AU9350 4.00% 204311 | | | 1,073 | | | | 1,082 | |
| Fannie Mae Pool #AL8773 3.50% 204511 | | | 5,612 | | | | 5,517 | |
| Fannie Mae Pool #AL8354 3.50% 204511 | | | 1,445 | | | | 1,418 | |
| Fannie Mae Pool #AS8310 3.00% 204611 | | | 396 | | | | 375 | |
| Fannie Mae Pool #AL8522 3.50% 204611 | | | 2,959 | | | | 2,895 | |
| Fannie Mae Pool #BD9699 3.50% 204611 | | | 1,500 | | | | 1,467 | |
| Fannie Mae Pool #BD9307 4.00% 204611 | | | 1,337 | | | | 1,343 | |
| Fannie Mae Pool #BC7611 4.00% 204611 | | | 115 | | | | 115 | |
| Fannie Mae Pool #BM1179 3.00% 204711 | | | 509 | | | | 482 | |
| Fannie Mae Pool #BE1290 3.50% 204711 | | | 2,188 | | | | 2,140 | |
| Fannie Mae Pool #CA0770 3.50% 204711 | | | 1,665 | | | | 1,632 | |
| Fannie Mae Pool #MA3211 4.00% 204711 | | | 2,898 | | | | 2,913 | |
| Fannie Mae Pool #257036 7.00% 204711 | | | 6 | | | | 7 | |
| Fannie Mae Pool #256975 7.00% 204711 | | | 2 | | | | 2 | |
| Fannie Mae Pool #FM3278 3.50% 204811 | | | 18,036 | | | | 17,646 | |
| Fannie Mae Pool #MA3277 4.00% 204811 | | | 12 | | | | 12 | |
| Fannie Mae Pool #BK5255 4.00% 204811 | | | 13 | | | | 12 | |
| Fannie Mae Pool #CA4756 3.00% 204911 | | | 1,857 | | | | 1,745 | |
| Fannie Mae Pool #CB2375 2.50% 205111 | | | 8,289 | | | | 7,502 | |
| Fannie Mae Pool #CB2319 2.50% 205111 | | | 204 | | | | 185 | |
| 116 | American Funds Insurance Series |
Asset Allocation Fund (continued)
| Bonds, notes & other debt instruments (continued) | | Principal amount
(000) | | | Value
(000) | |
| Mortgage-backed obligations (continued) | | | | | | | | |
| Federal agency mortgage-backed obligations (continued) | | | | | | | | |
| Fannie Mae Pool #CB2372 2.50% 205111 | | USD | 97 | | | $ | 88 | |
| Fannie Mae Pool #BT9510 2.50% 205111 | | | 97 | | | | 88 | |
| Fannie Mae Pool #BT9483 2.50% 205111 | | | 98 | | | | 88 | |
| Fannie Mae Pool #FM8453 3.00% 205111 | | | 5,152 | | | | 4,861 | |
| Fannie Mae, Series 2001-T10, Class A1, 7.00% 204111 | | | 92 | | | | 98 | |
| Fannie Mae, Series 2002-W3, Class A5, 7.50% 204111 | | | 27 | | | | 30 | |
| Fannie Mae, Series 2012-M14, Class A2, Multi Family, 2.301% 202211,12 | | | 204 | | | | 203 | |
| Fannie Mae, Series 2014-M1, Class A2, Multi Family, 3.28% 202311,12 | | | 2,529 | | | | 2,521 | |
| Fannie Mae, Series 2014-M2, Class A2, Multi Family, 3.513% 202311,12 | | | 2,637 | | | | 2,643 | |
| Fannie Mae, Series 2014-M9, Class A2, Multi Family, 3.103% 202411,12 | | | 4,093 | | | | 4,063 | |
| Fannie Mae, Series 2014-M3, Class A2, Multi Family, 3.501% 202411,12 | | | 1,853 | | | | 1,852 | |
| Fannie Mae, Series 2017-M3, Class A2, Multi Family, 2.556% 202611,12 | | | 7,783 | | | | 7,501 | |
| Fannie Mae, Series 2017-M7, Class A2, Multi Family, 2.961% 202711,12 | | | 2,784 | | | | 2,717 | |
| Fannie Mae, Series 2006-43, Class JO, principal only, 0% 203611 | | | 46 | | | | 40 | |
| Freddie Mac Pool #C91912 3.00% 203711 | | | 11,757 | | | | 11,544 | |
| Freddie Mac Pool #G03978 5.00% 203811 | | | 462 | | | | 488 | |
| Freddie Mac Pool #G04553 6.50% 203811 | | | 55 | | | | 60 | |
| Freddie Mac Pool #G08347 4.50% 203911 | | | 72 | | | | 75 | |
| Freddie Mac Pool #C03518 5.00% 204011 | | | 612 | | | | 646 | |
| Freddie Mac Pool #Q05807 4.00% 204211 | | | 1,777 | | | | 1,796 | |
| Freddie Mac Pool #Q23185 4.00% 204311 | | | 1,403 | | | | 1,418 | |
| Freddie Mac Pool #Q23190 4.00% 204311 | | | 833 | | | | 844 | |
| Freddie Mac Pool #760014 2.797% 204511,12 | | | 204 | | | | 203 | |
| Freddie Mac Pool #Q37988 4.00% 204511 | | | 6,202 | | | | 6,243 | |
| Freddie Mac Pool #G60344 4.00% 204511 | | | 5,323 | | | | 5,382 | |
| Freddie Mac Pool #Z40130 3.00% 204611 | | | 4,764 | | | | 4,558 | |
| Freddie Mac Pool #Q41909 4.50% 204611 | | | 285 | | | | 292 | |
| Freddie Mac Pool #Q41090 4.50% 204611 | | | 252 | | | | 257 | |
| Freddie Mac Pool #760015 2.557% 204711,12 | | | 487 | | | | 482 | |
| Freddie Mac Pool #Q46021 3.50% 204711 | | | 1,166 | | | | 1,141 | |
| Freddie Mac Pool #SI2002 4.00% 204811 | | | 2,562 | | | | 2,570 | |
| Freddie Mac Pool #SD7528 2.00% 205011 | | | 18,947 | | | | 16,578 | |
| Freddie Mac Pool #SD7545 2.50% 205111 | | | 7,407 | | | | 6,727 | |
| Freddie Mac Pool #RA6483 2.50% 205111 | | | 7,232 | | | | 6,535 | |
| Freddie Mac Pool #QD3220 2.50% 205111 | | | 97 | | | | 88 | |
| Freddie Mac Pool #RA5971 3.00% 205111 | | | 7,186 | | | | 6,752 | |
| Freddie Mac, Series T041, Class 3A, 4.493% 203211,12 | | | 199 | | | | 201 | |
| Freddie Mac, Series K044, Class A2, Multi Family, 2.811% 202511 | | | 3,573 | | | | 3,519 | |
| Freddie Mac, Series K047, Class A2, Multi Family, 3.329% 202511 | | | 4,000 | | | | 3,987 | |
| Freddie Mac, Series K733, Class A2, Multi Family, 3.75% 202511,12 | | | 9,778 | | | | 9,861 | |
| Freddie Mac, Series K055, Class A2, Multi Family, 2.673% 202611 | | | 10,050 | | | | 9,788 | |
| Freddie Mac, Series K734, Class A2, Multi Family, 3.208% 202611 | | | 7,370 | | | | 7,314 | |
| Freddie Mac, Series K066, Class A2, Multi Family, 3.117% 202711 | | | 4,755 | | | | 4,675 | |
| Freddie Mac, Series K076, Class A2, Multi Family, 3.90% 202811 | | | 3,237 | | | | 3,300 | |
| Freddie Mac, Series K143, Class A2, Multi Family, 2.35% 203211 | | | 19,961 | | | | 17,884 | |
| Freddie Mac Seasoned Credit Risk Transfer Trust, Series 2017-2, Class MA, 3.00% 205611 | | | 5,498 | | | | 5,359 | |
| Freddie Mac Seasoned Credit Risk Transfer Trust, Series 2017-2, Class HA, 3.00% 205611,12 | | | 5,424 | | | | 5,296 | |
| Freddie Mac Seasoned Credit Risk Transfer Trust, Series 2017-1, Class HA, 3.00% 205611,12 | | | 2,810 | | | | 2,745 | |
| Freddie Mac Seasoned Credit Risk Transfer Trust, Series 2017-3, Class HA, 3.25% 205611,12 | | | 1,218 | | | | 1,198 | |
| Freddie Mac Seasoned Credit Risk Transfer Trust, Series 2017-4, Class HT, 3.25% 205711,12 | | | 971 | | | | 939 | |
| Freddie Mac Seasoned Credit Risk Transfer Trust, Series 2018-2, Class MT, 3.50% 205711 | | | 2,047 | | | | 1,996 | |
| Freddie Mac Seasoned Credit Risk Transfer Trust, Series 2018-3, Class MA, 3.50% 205711 | | | 1,982 | | | | 1,964 | |
| Freddie Mac Seasoned Credit Risk Transfer Trust, Series 2017-4, Class MT, 3.50% 205711 | | | 796 | | | | 778 | |
| American Funds Insurance Series | 117 |
Asset Allocation Fund (continued)
| Bonds, notes & other debt instruments (continued) | | Principal amount
(000) | | | Value
(000) | |
| Mortgage-backed obligations (continued) | | | | | | | | |
| Federal agency mortgage-backed obligations (continued) | | | | | | | | |
| Freddie Mac Seasoned Credit Risk Transfer Trust, Series 2019-2, Class MA, 3.50% 205811 | | USD | 10,209 | | | $ | 10,103 | |
| Freddie Mac Seasoned Credit Risk Transfer Trust, Series 2019-4, Class MA, 3.00% 205911 | | | 5,832 | | | | 5,680 | |
| Freddie Mac Seasoned Loan Structured Transaction Trust, Series 2018-2, Class A1, 3.50% 202811 | | | 2,318 | | | | 2,299 | |
| Freddie Mac Seasoned Loan Structured Transaction Trust, Series 2019-3, Class A1C, 2.75% 202911 | | | 2,951 | | | | 2,836 | |
| Freddie Mac Seasoned Loan Structured Transaction Trust, Series 2019-1, Class A1, 3.50% 202911 | | | 4,582 | | | | 4,542 | |
| Freddie Mac Seasoned Loan Structured Transaction Trust, Series 2019-1, Class A2, 3.50% 202911 | | | 2,455 | | | | 2,412 | |
| Government National Mortgage Assn. 2.00% 205211,13 | | | 68,784 | | | | 61,046 | |
| Government National Mortgage Assn. 2.50% 205211,13 | | | 5,866 | | | | 5,370 | |
| Government National Mortgage Assn. 3.00% 205211,13 | | | 98,663 | | | | 93,044 | |
| Government National Mortgage Assn. 3.50% 205211,13 | | | 16,452 | | | | 15,968 | |
| Government National Mortgage Assn. 4.00% 205211,13 | | | 8,644 | | | | 8,590 | |
| Government National Mortgage Assn. 4.00% 205211,13 | | | 7,382 | | | | 7,352 | |
| Government National Mortgage Assn. 4.50% 205211,13 | | | 33,456 | | | | 33,830 | |
| Government National Mortgage Assn. Pool #BD7245 4.00% 204811 | | | 441 | | | | 441 | |
| Government National Mortgage Assn. Pool #MA5652 4.50% 204811 | | | 381 | | | | 388 | |
| Government National Mortgage Assn. Pool #MA6602 4.50% 205011 | | | 226 | | | | 231 | |
| Government National Mortgage Assn. Pool #MA7259 4.50% 205111 | | | 2,018 | | | | 2,065 | |
| Government National Mortgage Assn. Pool #MA7316 4.50% 205111 | | | 558 | | | | 569 | |
| Uniform Mortgage-Backed Security 1.50% 203711,13 | | | 19,795 | | | | 18,006 | |
| Uniform Mortgage-Backed Security 2.00% 203711,13 | | | 27,169 | | | | 25,366 | |
| Uniform Mortgage-Backed Security 2.50% 203711,13 | | | 638 | | | | 609 | |
| Uniform Mortgage-Backed Security 3.00% 203711,13 | | | 12,453 | | | | 12,169 | |
| Uniform Mortgage-Backed Security 2.00% 205211,13 | | | 134,092 | | | | 116,283 | |
| Uniform Mortgage-Backed Security 2.50% 205211,13 | | | 155,788 | | | | 139,985 | |
| Uniform Mortgage-Backed Security 3.00% 205211,13 | | | 236,465 | | | | 220,060 | |
| Uniform Mortgage-Backed Security 3.00% 205211,13 | | | 4,800 | | | | 4,472 | |
| Uniform Mortgage-Backed Security 3.50% 205211,13 | | | 130,313 | | | | 125,212 | |
| Uniform Mortgage-Backed Security 4.00% 205211,13 | | | 73,067 | | | | 71,827 | |
| Uniform Mortgage-Backed Security 4.00% 205211,13 | | | 27,346 | | | | 26,928 | |
| Uniform Mortgage-Backed Security 4.50% 205211,13 | | | 79,783 | | | | 79,936 | |
| Uniform Mortgage-Backed Security 4.50% 205211,13 | | | 27,637 | | | | 27,639 | |
| Uniform Mortgage-Backed Security 5.00% 205211,13 | | | 80,945 | | | | 82,414 | |
| Uniform Mortgage-Backed Security 5.00% 205211,13 | | | 14,450 | | | | 14,681 | |
| | | | | | | | 1,525,097 | |
| | | | | | | | | |
| Commercial mortgage-backed securities 0.46% | | | | | | | | |
| Bank Commercial Mortgage Trust, Series 2020-BN26, Class A4, 2.403% 206311 | | | 2,909 | | | | 2,554 | |
| Bank Commercial Mortgage Trust, Series 2022-BNK40, Class A4, 3.507% 206411,12 | | | 2,550 | | | | 2,383 | |
| Barclays Commercial Mortgage Securities, LLC, Series 2017-DELC, Class A, 2.174% 20366,11,12 | | | 2,000 | | | | 1,961 | |
| Benchmark Mortgage Trust, Series 2018-B2, Class A4, 3.615% 205111 | | | 1,000 | | | | 967 | |
| Benchmark Mortgage Trust, Series 2020-B17, Class A5, 2.289% 205311 | | | 2,960 | | | | 2,574 | |
| Benchmark Mortgage Trust, Series 2022-B35, Class A5, 4.594% 205511,12 | | | 6,337 | | | | 6,467 | |
| BX Trust, Series 2021-SDMF, Class A, (1-month USD-LIBOR + 0.589%) 1.913% 20346,11,12 | | | 5,954 | | | | 5,658 | |
| BX Trust, Series 2021-VOLT, Class A, (1-month USD-LIBOR + 0.70%) 2.024% 20366,11,12 | | | 4,505 | | | | 4,352 | |
| BX Trust, Series 2021-ARIA, Class A, (1-month USD-LIBOR + 0.899%) 2.223% 20366,11,12 | | | 7,968 | | | | 7,506 | |
| BX Trust, Series 2021-ARIA, Class B, (1-month USD-LIBOR + 1.297%) 2.621% 20366,11,12 | | | 5,968 | | | | 5,594 | |
| BX Trust, Series 2021-SOAR, Class A, (1-month USD-LIBOR + 0.67%) 1.994% 20386,11,12 | | | 7,481 | | | | 7,192 | |
| 118 | American Funds Insurance Series |
Asset Allocation Fund (continued)
| Bonds, notes & other debt instruments (continued) | | Principal amount
(000) | | | Value
(000) | |
| Mortgage-backed obligations (continued) | | | | | | | | |
| Commercial mortgage-backed securities (continued) | | | | | | | | |
| BX Trust, Series 2021-ACNT, Class A, (1-month USD-LIBOR + 0.85%) 2.174% 20386,11,12 | | USD | 5,254 | | | $ | 5,065 | |
| BX Trust, Series 2021-SOAR, Class B, (1-month USD-LIBOR + 0.87%) 2.194% 20386,11,12 | | | 1,351 | | | | 1,297 | |
| BX Trust, Series 2021-SOAR, Class C, (1-month USD-LIBOR + 1.10%) 2.424% 20386,11,12 | | | 1,220 | | | | 1,161 | |
| Citigroup Commercial Mortgage Trust, Series 2015-GC29, Class AAB, 2.984% 204811 | | | 614 | | | | 607 | |
| Commercial Mortgage Trust, Series 2015-PC1, Class A5, 3.902% 205011 | | | 4,735 | | | | 4,684 | |
| CSAIL Commercial Mortgage Trust, Series 2015-C4, Class ASB, 3.617% 204811 | | | 923 | | | | 916 | |
| Extended Stay America Trust, Series 2021-ESH, Class A, (1-month USD-LIBOR + 1.08%) 2.405% 20386,11,12 | | | 1,564 | | | | 1,528 | |
| Extended Stay America Trust, Series 2021-ESH, Class B, (1-month USD-LIBOR + 1.38%) 2.705% 20386,11,12 | | | 1,428 | | | | 1,388 | |
| Extended Stay America Trust, Series 2021-ESH, Class C, (1-month USD-LIBOR + 1.70%) 3.025% 20386,11,12 | | | 1,492 | | | | 1,446 | |
| Grace Mortgage Trust, Series 2020-GRCE, Class A, 2.347% 20406,11 | | | 3,795 | | | | 3,147 | |
| GS Mortgage Securities Trust, Series 2020-GC47, Class A5, 2.377% 205311 | | | 2,489 | | | | 2,168 | |
| JPMorgan Chase Commercial Mortgage Securities Trust, Series 2022-OPO, Class A, 3.024% 20396,11 | | | 1,964 | | | | 1,812 | |
| JPMorgan Chase Commercial Mortgage Securities Trust, Series 2022-OPO, Class C, 3.377% 20396,11 | | | 868 | | | | 797 | |
| JPMorgan Chase Commercial Mortgage Securities Trust, Series 2022-OPO, Class C, 3.45% 20396,11,12 | | | 523 | | | | 467 | |
| JPMorgan Chase Commercial Mortgage Securities Trust, Series 2021-410T, Class A, 2.287% 20426,11 | | | 1,431 | | | | 1,254 | |
| LUXE Commercial Mortgage Trust, Series 2021-TRIP, Class A, (1-month USD-LIBOR + 1.05%) 2.374% 20386,11,12 | | | 3,572 | | | | 3,445 | |
| LUXE Commercial Mortgage Trust, Series 2021-TRIP, Class B, (1-month USD-LIBOR + 1.40%) 2.724% 20386,11,12 | | | 1,904 | | | | 1,828 | |
| Manhattan West Mortgage Trust, Series 2020-1MW, Class A, 2.13% 20396,11 | | | 13,772 | | | | 12,136 | |
| MHC Commercial Mortgage Trust, CMO, Series 2021-MHC, Class A, (1-month USD-LIBOR + 0.801%) 2.125% 20266,11,12 | | | 3,950 | | | | 3,854 | |
| Morgan Stanley Bank of America Merrill Lynch Trust, Series 2015-C27, Class ASB, 3.557% 204711 | | | 663 | | | | 657 | |
| Morgan Stanley Bank of America Merrill Lynch Trust, Series 2015-C22, Class ASB, 3.04% 204811 | | | 582 | | | | 573 | |
| SLG Office Trust, Series 2021-OVA, Class A, 2.585% 20416,11 | | | 2,194 | | | | 1,867 | |
| SREIT Trust, Series 2021-MFP, Class A, (1-month USD-LIBOR + 0.731%) 2.055% 20386,11,12 | | | 4,808 | | | | 4,576 | |
| StorageMart Commercial Mortgage Trust, Series 2022-MINI, Class A, (1-month USD CME Term SOFR + 1.00%) 2.279% 20396,11,12 | | | 10,709 | | | | 10,315 | |
| | | | | | | | 114,196 | |
| | | | | | | | | |
| Collateralized mortgage-backed obligations (privately originated) 0.15% | | | | | | | | |
| Arroyo Mortgage Trust, Series 2021-1R, Class A1, 1.175% 20486,11,12 | | | 1,254 | | | | 1,164 | |
| Bellemeade Re, Ltd., Series 2019-3A, Class M1B, (1-month USD-LIBOR + 1.60%) 3.224% 20296,11,12 | | | 1,556 | | | | 1,550 | |
| Cascade Funding Mortgage Trust, Series 2018-RM2, Class A, 3.861% 20686,11,12 | | | 1,345 | | | | 1,322 | |
| Connecticut Avenue Securities, Series 2021-R01, Class 1M1, (30-day Average USD-SOFR + 0.75%) 1.676% 20416,11,12 | | | 562 | | | | 556 | |
| Credit Suisse Mortgage Trust, Series 2020-NET, Class A, 2.257% 20376,11 | | | 4,102 | | | | 3,789 | |
| Credit Suisse Mortgage Trust, Series 2017-RPL3, Class A1, 2.00% 20606,11,12 | | | 2,230 | | | | 2,101 | |
| CS First Boston Mortgage Securities Corp., Series 2004-5, Class IVA1, 6.00% 203411 | | | 156 | | | | 152 | |
| Finance of America Structured Securities Trust, Series 2019-JR2, Class A1, 2.00% 20696,11 | | | 6,481 | | | | 6,980 | |
| Finance of America Structured Securities Trust, Series 2019-JR1, Class A, 2.00% 20696,11 | | | 2,299 | | | | 2,478 | |
| Freddie Mac Structured Agency Credit Risk Debt Notes, Series 2015-DNA1, Class M3, (1-month USD-LIBOR + 3.30%) 4.924% 202711,12 | | | 321 | | | | 324 | |
| Home Partners of America Trust, Series 2021-2, Class A, 1.901% 20266,11 | | | 4,356 | | | | 3,897 | |
| American Funds Insurance Series | 119 |
Asset Allocation Fund (continued)
| Bonds, notes & other debt instruments (continued) | | Principal amount
(000) | | | Value
(000) | |
| Mortgage-backed obligations (continued) | | | | | | | | |
| Collateralized mortgage-backed obligations (privately originated) (continued) | | | | | | | | |
| Legacy Mortgage Asset Trust, Series 2019-GS5, Class A1, 3.20% 20596,11,12 | | USD | 3,481 | | | $ | 3,482 | |
| Legacy Mortgage Asset Trust, Series 2019-GS7, Class A1, 3.25% 20596,11,12 | | | 1,133 | | | | 1,129 | |
| MASTR Alternative Loan Trust, Series 2004-2, Class 2A1, 6.00% 203411 | | | 329 | | | | 320 | |
| Mello Warehouse Securitization Trust, Series 2021-3, Class A, (1-month USD-LIBOR + 0.85%) 2.474% 20556,11,12 | | | 4,040 | | | | 3,926 | |
| MRA Issuance Trust, Series 2020-10, Class A3, (1-month USD-LIBOR + 1.30%) 2.10% 20226,11,12 | | | 1,745 | | | | 1,723 | |
| Onslow Bay Financial Mortgage Loan Trust, Series 2022-J1, Class A2, 2.50% 20526,11,12 | | | 2,862 | | | | 2,449 | |
| RMF Proprietary Issuance Trust, Series 2019-1, Class A, 2.75% 20636,11,12 | | | 403 | | | | 395 | |
| | | | | | | | 37,737 | |
| | | | | | | | | |
| Total mortgage-backed obligations | | | | | | | 1,677,030 | |
| | | | | | | | | |
| Corporate bonds, notes & loans 6.00% | | | | | | | | |
| Financials 1.23% | | | | | | | | |
| ACE INA Holdings, Inc. 2.875% 2022 | | | 3,880 | | | | 3,881 | |
| ACE INA Holdings, Inc. 3.35% 2026 | | | 880 | | | | 862 | |
| ACE INA Holdings, Inc. 4.35% 2045 | | | 400 | | | | 378 | |
| Advisor Group Holdings, LLC 6.25% 20286 | | | 4,470 | | | | 3,907 | |
| AerCap Ireland Capital, Ltd. / AerCap Global Aviation Trust 2.45% 2026 | | | 5,457 | | | | 4,756 | |
| AerCap Ireland Capital, Ltd. / AerCap Global Aviation Trust 3.00% 2028 | | | 4,501 | | | | 3,796 | |
| AerCap Ireland Capital, Ltd. / AerCap Global Aviation Trust 3.30% 2032 | | | 2,838 | | | | 2,275 | |
| AerCap Ireland Capital, Ltd. / AerCap Global Aviation Trust 3.40% 2033 | | | 1,781 | | | | 1,409 | |
| AerCap Ireland Capital, Ltd. / AerCap Global Aviation Trust 3.85% 2041 | | | 1,970 | | | | 1,423 | |
| AG Merger Sub II, Inc. 10.75% 20276 | | | 2,420 | | | | 2,396 | |
| Alliant Holdings Intermediate, LLC / Alliant Holdings 4.25% 20276 | | | 2,100 | | | | 1,821 | |
| Alliant Holdings Intermediate, LLC / Alliant Holdings 5.875% 20296 | | | 2,295 | | | | 1,908 | |
| Ally Financial, Inc. 8.00% 2031 | | | 3,000 | | | | 3,286 | |
| American International Group, Inc. 2.50% 2025 | | | 15,800 | | | | 15,080 | |
| AmWINS Group, Inc. 4.875% 20296 | | | 1,348 | | | | 1,106 | |
| Aretec Escrow Issuer, Inc. 7.50% 20296 | | | 1,000 | | | | 854 | |
| Bangkok Bank PCL 3.733% 2034 (5-year UST Yield Curve Rate T Note Constant Maturity + 1.90% on 9/25/2029)14 | | | 2,428 | | | | 2,131 | |
| Bank of America Corp. 3.55% 2024 (3-month USD-LIBOR + 0.78% on 3/5/2023)14 | | | 6,000 | | | | 5,983 | |
| Bank of America Corp. 1.843% 2025 (USD-SOFR + 0.67% on 2/4/2024)14 | | | 6,000 | | | | 5,788 | |
| Bank of America Corp. 1.197% 2026 (USD-SOFR + 1.01% on 10/24/2025)14 | | | 2,500 | | | | 2,241 | |
| Bank of America Corp. 1.734% 2027 (USD-SOFR + 0.96% on 7/22/2026)14 | | | 1,565 | | | | 1,394 | |
| Bank of America Corp. 3.419% 2028 (3-month USD-LIBOR + 1.04% on 12/20/2027)14 | | | 2,345 | | | | 2,186 | |
| Bank of America Corp. 1.922% 2031 (USD-SOFR + 1.37% on 10/24/2030)14 | | | 1,000 | | | | 800 | |
| Bank of America Corp. 2.572% 2032 (USD-SOFR + 1.21% on 10/20/2031)14 | | | 1,953 | | | | 1,613 | |
| Bank of Nova Scotia 1.625% 2023 | | | 5,000 | | | | 4,932 | |
| Berkshire Hathaway, Inc. 2.75% 2023 | | | 1,615 | | | | 1,615 | |
| Berkshire Hathaway, Inc. 3.125% 2026 | | | 500 | | | | 491 | |
| BNP Paribas 2.159% 2029 (USD-SOFR + 1.218% on 9/15/2028)6,14 | | | 2,400 | | | | 2,010 | |
| Castlelake Aviation Finance DAC 5.00% 20276 | | | 3,370 | | | | 2,805 | |
| Citigroup, Inc. 2.976% 2030 (USD-SOFR + 1.422% on 11/5/2029)14 | | | 3,254 | | | | 2,843 | |
| CME Group, Inc. 3.75% 2028 | | | 3,425 | | | | 3,380 | |
| Coinbase Global, Inc. 3.375% 20286 | | | 2,625 | | | | 1,660 | |
| Coinbase Global, Inc. 3.625% 20316 | | | 2,875 | | | | 1,623 | |
| Commonwealth Bank of Australia 3.35% 2024 | | | 1,225 | | | | 1,219 | |
| Commonwealth Bank of Australia 3.35% 20246 | | | 1,000 | | | | 995 | |
| Commonwealth Bank of Australia 2.688% 20316 | | | 4,575 | | | | 3,728 | |
| Compass Diversified Holdings 5.25% 20296 | | | 820 | | | | 678 | |
| Compass Diversified Holdings 5.00% 20326 | | | 715 | | | | 554 | |
| Corebridge Financial, Inc. 3.50% 20256 | | | 642 | | | | 624 | |
| Corebridge Financial, Inc. 3.65% 20276 | | | 914 | | | | 860 | |
| Corebridge Financial, Inc. 3.85% 20296 | | | 621 | | | | 574 | |
| Corebridge Financial, Inc. 3.90% 20326 | | | 351 | | | | 315 | |
| Corebridge Financial, Inc. 4.35% 20426 | | | 203 | | | | 174 | |
| Corebridge Financial, Inc. 4.40% 20526 | | | 489 | | | | 409 | |
| 120 | American Funds Insurance Series |
Asset Allocation Fund (continued)
| Bonds, notes & other debt instruments (continued) | | Principal amount
(000) | | | Value
(000) | |
| Corporate bonds, notes & loans (continued) | | | | | | | | |
| Financials (continued) | | | | | | | | |
| Crédit Agricole SA 4.375% 20256 | | USD | 850 | | | $ | 837 | |
| Credit Suisse Group AG 3.80% 2023 | | | 1,625 | | | | 1,610 | |
| Credit Suisse Group AG 3.869% 2029 (3-month USD-LIBOR + 1.41% on 1/12/2028)6,14 | | | 800 | | | | 720 | |
| Danske Bank AS 3.773% 2025 (1-year UST Yield Curve Rate T Note Constant Maturity + 1.45% on 3/28/2024)6,14 | | | 6,000 | | | | 5,905 | |
| Deutsche Bank AG 2.552% 2028 (USD-SOFR + 1.318% on 1/7/2027)14 | | | 5,000 | | | | 4,332 | |
| Digital Currency Group, Inc., Term Loan, (3-month USD-LIBOR + 7.00%) 8.00% 20263,4,12,15 | | | 816 | | | | 723 | |
| Digital Currency Group, Inc., Term Loan, 8.75% 20263,4,15 | | | 1,089 | | | | 926 | |
| FS Energy and Power Fund 7.50% 20236 | | | 1,995 | | | | 2,003 | |
| Goldman Sachs Group, Inc. 1.948% 2027 (USD-SOFR + 0.913% on 10/21/2026)14 | | | 2,198 | | | | 1,947 | |
| Goldman Sachs Group, Inc. 2.64% 2028 (USD-SOFR + 1.114% on 2/24/2027)14 | | | 4,000 | | | | 3,633 | |
| Goldman Sachs Group, Inc. 3.814% 2029 (3-month USD-LIBOR + 1.158% on 4/23/2028)14 | | | 390 | | | | 368 | |
| Goldman Sachs Group, Inc. 2.615% 2032 (USD-SOFR + 1.281% on 4/22/2031)14 | | | 2,323 | | | | 1,931 | |
| Goldman Sachs Group, Inc. 3.21% 2042 (USD-SOFR + 1.513% on 4/22/2041)14 | | | 2,000 | | | | 1,531 | |
| Groupe BPCE SA 2.75% 20236 | | | 600 | | | | 598 | |
| Groupe BPCE SA 5.70% 20236 | | | 2,250 | | | | 2,284 | |
| Groupe BPCE SA 5.15% 20246 | | | 3,710 | | | | 3,713 | |
| Groupe BPCE SA 1.00% 20266 | | | 3,000 | | | | 2,664 | |
| Hightower Holding, LLC 6.75% 20296 | | | 870 | | | | 655 | |
| HSBC Holdings PLC 4.25% 2024 | | | 3,000 | | | | 2,988 | |
| HSBC Holdings PLC 2.633% 2025 (3-month USD-LIBOR + 1.14% on 11/7/2024)14 | | | 625 | | | | 597 | |
| HSBC Holdings PLC 2.099% 2026 (USD-SOFR + 1.929% on 6/4/2025)14 | | | 3,000 | | | | 2,775 | |
| HSBC Holdings PLC 3.973% 2030 (3-month USD-LIBOR + 1.61% on 5/22/2029)14 | | | 1,500 | | | | 1,379 | |
| Icahn Enterprises Finance Corp. 5.25% 2027 | | | 1,185 | | | | 1,052 | |
| Icahn Enterprises Finance Corp. 4.375% 2029 | | | 1,525 | | | | 1,235 | |
| Intercontinental Exchange, Inc. 2.65% 2040 | | | 7,425 | | | | 5,464 | |
| Intesa Sanpaolo SpA 3.375% 20236 | | | 750 | | | | 747 | |
| Intesa Sanpaolo SpA 3.25% 20246 | | | 750 | | | | 727 | |
| Intesa Sanpaolo SpA 5.017% 20246 | | | 1,730 | | | | 1,652 | |
| Intesa Sanpaolo SpA 3.875% 20276 | | | 300 | | | | 277 | |
| JPMorgan Chase & Co. 3.559% 2024 (3-month USD-LIBOR + 0.73% on 4/23/2023)14 | | | 4,725 | | | | 4,713 | |
| JPMorgan Chase & Co. 4.08% 2026 (USD-SOFR + 1.32% on 4/26/2025)14 | | | 6,000 | | | | 5,933 | |
| JPMorgan Chase & Co. 4.323% 2028 (USD-SOFR + 1.56% on 4/26/2027)14 | | | 4,000 | | | | 3,938 | |
| JPMorgan Chase & Co. 4.586% 2033 (USD-SOFR + 1.80% on 4/26/2032)14 | | | 299 | | | | 294 | |
| Kasikornbank PCL HK 3.343% 2031 (5-year UST Yield Curve Rate T Note Constant Maturity + 1.70% on 10/2/2026)14 | | | 1,222 | | | | 1,101 | |
| Ladder Capital Corp. 4.25% 20276 | | | 3,757 | | | | 3,039 | |
| Lloyds Banking Group PLC 2.907% 2023 (3-month USD-LIBOR + 0.81% on 11/7/2022)14 | | | 750 | | | | 748 | |
| Lloyds Banking Group PLC 4.05% 2023 | | | 2,000 | | | | 2,006 | |
| Lloyds Banking Group PLC 1.627% 2027 (1-year UST Yield Curve Rate T Note Constant Maturity + 0.85% on 5/11/2026)14 | | | 800 | | | | 712 | |
| Lloyds Banking Group PLC 4.375% 2028 | | | 2,150 | | | | 2,091 | |
| LPL Holdings, Inc. 4.625% 20276 | | | 2,700 | | | | 2,525 | |
| LPL Holdings, Inc. 4.375% 20316 | | | 1,805 | | | | 1,545 | |
| Marsh & McLennan Companies, Inc. 3.875% 2024 | | | 820 | | | | 822 | |
| Marsh & McLennan Companies, Inc. 4.375% 2029 | | | 1,705 | | | | 1,687 | |
| Marsh & McLennan Companies, Inc. 4.90% 2049 | | | 719 | | | | 707 | |
| Marsh & McLennan Companies, Inc. 2.90% 2051 | | | 920 | | | | 648 | |
| MGIC Investment Corp. 5.25% 2028 | | | 1,175 | | | | 1,054 | |
| Mitsubishi UFJ Financial Group, Inc. 2.801% 2024 | | | 1,610 | | | | 1,569 | |
| Morgan Stanley 3.737% 2024 (3-month USD-LIBOR + 0.847% on 4/24/2023)14 | | | 300 | | | | 299 | |
| Morgan Stanley 3.125% 2026 | | | 325 | | | | 311 | |
| Morgan Stanley 2.699% 2031 (USD-SOFR + 1.143% on 1/22/2030)14 | | | 2,000 | | | | 1,734 | |
| Morgan Stanley 3.217% 2042 (USD-SOFR + 1.485% on 4/22/2041)14 | | | 856 | | | | 675 | |
| MSCI, Inc. 3.625% 20316 | | | 2,225 | | | | 1,836 | |
| National Australia Bank, Ltd. 1.887% 20276 | | | 5,000 | | | | 4,539 | |
| Navient Corp. 5.50% 2023 | | | 2,594 | | | | 2,576 | |
| American Funds Insurance Series | 121 |
Asset Allocation Fund (continued)
| Bonds, notes & other debt instruments (continued) | | Principal amount
(000) | | | Value
(000) | |
| Corporate bonds, notes & loans (continued) | | | | | | | | |
| Financials (continued) | | | | | | | | |
| Navient Corp. 5.875% 2024 | | USD | 1,005 | | | $ | 926 | |
| Navient Corp. 6.125% 2024 | | | 8,030 | | | | 7,629 | |
| Navient Corp. 5.50% 2029 | | | 5,980 | | | | 4,620 | |
| New York Life Global Funding 2.35% 20266 | | | 590 | | | | 558 | |
| Northwestern Mutual Global Funding 1.75% 20276 | | | 9,400 | | | | 8,553 | |
| Onemain Finance Corp. 3.875% 2028 | | | 756 | | | | 579 | |
| Owl Rock Capital Corp. 3.75% 2025 | | | 2,874 | | | | 2,661 | |
| Owl Rock Capital Corp. 4.00% 2025 | | | 102 | | | | 96 | |
| Owl Rock Capital Corp. 3.40% 2026 | | | 1,290 | | | | 1,135 | |
| Owl Rock Capital Corp. II 4.625% 20246 | | | 2,305 | | | | 2,194 | |
| Owl Rock Capital Corp. III 3.125% 20276 | | | 2,520 | | | | 2,156 | |
| Owl Rock Core Income Corp. 4.70% 20276 | | | 2,500 | | | | 2,283 | |
| Oxford Finance, LLC / Oxford Finance Co-Issuer II, Inc. 6.375% 20276 | | | 1,125 | | | | 1,079 | |
| PNC Financial Services Group, Inc. 2.854% 202214 | | | 1,445 | | | | 1,446 | |
| PNC Financial Services Group, Inc. 3.90% 2024 | | | 2,000 | | | | 2,006 | |
| Power Financial Corp., Ltd. 5.25% 2028 | | | 383 | | | | 381 | |
| Power Financial Corp., Ltd. 6.15% 2028 | | | 350 | | | | 364 | |
| Power Financial Corp., Ltd. 4.50% 2029 | | | 554 | | | | 517 | |
| Power Financial Corp., Ltd. 3.95% 2030 | | | 1,213 | | | | 1,077 | |
| Prudential Financial, Inc. 4.35% 2050 | | | 2,205 | | | | 2,036 | |
| Prudential Financial, Inc. 3.70% 2051 | | | 755 | | | | 632 | |
| Quicken Loans, LLC 3.625% 20296 | | | 1,505 | | | | 1,186 | |
| Rabobank Nederland 4.375% 2025 | | | 4,500 | | | | 4,469 | |
| Rocket Mortgage / Rocket Mortgage Co-Issuer, Inc. 2.875% 20266 | | | 2,110 | | | | 1,750 | |
| Royal Bank of Canada 1.15% 2025 | | | 4,711 | | | | 4,365 | |
| Ryan Specialty Group, LLC 4.375% 20306 | | | 270 | | | | 235 | |
| Springleaf Finance Corp. 6.125% 2024 | | | 2,550 | | | | 2,442 | |
| Starwood Property Trust, Inc. 5.50% 20236 | | | 1,160 | | | | 1,149 | |
| Starwood Property Trust, Inc. 4.375% 20276 | | | 1,540 | | | | 1,339 | |
| Swiss Re Finance (Luxembourg) SA 5.00% 2049 (5-year UST Yield Curve Rate T Note Constant Maturity + 3.582% on 4/2/2029)6,14 | | | 2,800 | | | | 2,658 | |
| Toronto-Dominion Bank 2.65% 2024 | | | 625 | | | | 614 | |
| Toronto-Dominion Bank 0.75% 2025 | | | 5,375 | | | | 4,858 | |
| Toronto-Dominion Bank 1.25% 2026 | | | 2,425 | | | | 2,154 | |
| Toronto-Dominion Bank 1.95% 2027 | | | 2,500 | | | | 2,263 | |
| Toronto-Dominion Bank 2.45% 2032 | | | 1,500 | | | | 1,255 | |
| Travelers Companies, Inc. 4.00% 2047 | | | 860 | | | | 763 | |
| U.S. Bancorp 2.375% 2026 | | | 4,000 | | | | 3,779 | |
| UBS Group AG 4.125% 20256 | | | 2,750 | | | | 2,732 | |
| UniCredit SpA 4.625% 20276 | | | 625 | | | | 600 | |
| Wells Fargo & Company 2.164% 2026 (3-month USD-LIBOR + 0.75% on 2/11/2025)14 | | | 8,000 | | | | 7,528 | |
| Wells Fargo & Company 3.526% 2028 (USD-SOFR + 1.51% on 3/24/2027)14 | | | 4,337 | | | | 4,112 | |
| Wells Fargo & Company 2.879% 2030 (3-month USD-LIBOR + 1.17% on 10/30/2029)14 | | | 729 | | | | 642 | |
| Westpac Banking Corp. 2.75% 2023 | | | 1,750 | | | | 1,747 | |
| Westpac Banking Corp. 2.894% 2030 (5-year UST Yield Curve Rate T Note Constant Maturity + 1.35% on 2/4/2025)14 | | | 3,000 | | | | 2,846 | |
| Westpac Banking Corp. 2.668% 2035 (5-year UST Yield Curve Rate T Note Constant Maturity + 1.75% on 11/15/2030)14 | | | 3,325 | | | | 2,650 | |
| Westpac Banking Corp. 2.963% 2040 | | | 1,500 | | | | 1,087 | |
| | | | | | | | 307,289 | |
| | | | | | | | | |
| Energy 0.69% | | | | | | | | |
| Antero Midstream Partners LP 5.375% 20296 | | | 2,170 | | | | 1,947 | |
| Antero Resources Corp. 7.625% 20296 | | | 1,634 | | | | 1,665 | |
| Ascent Resources - Utica, LLC 7.00% 20266 | | | 2,000 | | | | 1,863 | |
| Ascent Resources - Utica, LLC 5.875% 20296 | | | 1,040 | | | | 917 | |
| Bonanza Creek Energy, Inc. 5.00% 20266 | | | 480 | | | | 431 | |
| BP Capital Markets America, Inc. 2.772% 2050 | | | 681 | | | | 474 | |
| Canadian Natural Resources, Ltd. 2.95% 2023 | | | 1,935 | | | | 1,928 | |
| 122 | American Funds Insurance Series |
Asset Allocation Fund (continued)
| Bonds, notes & other debt instruments (continued) | | Principal amount
(000) | | | Value
(000) | |
| Corporate bonds, notes & loans (continued) | | | | | | | | |
| Energy (continued) | | | | | | | | |
| Canadian Natural Resources, Ltd. 2.05% 2025 | | USD | 961 | | | $ | 900 | |
| Canadian Natural Resources, Ltd. 4.95% 2047 | | | 1,559 | | | | 1,480 | |
| Cheniere Energy Partners LP 4.50% 2029 | | | 1,085 | | | | 971 | |
| Cheniere Energy Partners LP 4.00% 2031 | | | 4,485 | | | | 3,824 | |
| Cheniere Energy Partners LP 3.25% 20326 | | | 998 | | | | 788 | |
| Cheniere Energy, Inc. 4.625% 2028 | | | 4,645 | | | | 4,198 | |
| Chesapeake Energy Corp. 4.875% 202216 | | | 7,225 | | | | 140 | |
| Chesapeake Energy Corp. 5.50% 20266 | | | 685 | | | | 654 | |
| Chesapeake Energy Corp. 5.875% 20296 | | | 2,240 | | | | 2,117 | |
| CNX Midstream Partners LP 4.75% 20306 | | | 1,055 | | | | 888 | |
| CNX Resources Corp. 7.25% 20276 | | | 1,725 | | | | 1,693 | |
| CNX Resources Corp. 6.00% 20296 | | | 2,675 | | | | 2,504 | |
| Comstock Resources, Inc. 5.875% 20306 | | | 450 | | | | 388 | |
| Constellation Oil Services Holding SA 13.50% 20253,4,6 | | | 1,121 | | | | 1,120 | |
| Constellation Oil Services Holding SA 4.00% PIK or 3.00% Cash 202617 | | | 428 | | | | 358 | |
| Diamond Foreign Asset Co. / Diamond Finance, LLC 9.00% Cash 20276,12,17 | | | 204 | | | | 201 | |
| Diamond Foreign Asset Co. / Diamond Finance, LLC 9.00% Cash 202712,17 | | | 185 | | | | 182 | |
| Diamondback Energy, Inc. 4.40% 2051 | | | 2,594 | | | | 2,215 | |
| DT Midstream, Inc. 4.375% 20316 | | | 1,680 | | | | 1,412 | |
| Enbridge Energy Partners LP, Series B, 7.50% 2038 | | | 300 | | | | 353 | |
| Enbridge, Inc. 4.00% 2023 | | | 278 | | | | 279 | |
| Enbridge, Inc. 2.50% 2025 | | | 300 | | | | 289 | |
| Enbridge, Inc. 3.70% 2027 | | | 62 | | | | 59 | |
| Energy Transfer Operating LP 5.00% 2050 | | | 1,869 | | | | 1,593 | |
| Energy Transfer Partners LP 4.50% 2024 | | | 1,210 | | | | 1,211 | |
| Energy Transfer Partners LP 4.75% 2026 | | | 2,494 | | | | 2,488 | |
| Energy Transfer Partners LP 5.25% 2029 | | | 757 | | | | 751 | |
| Energy Transfer Partners LP 6.00% 2048 | | | 774 | | | | 729 | |
| Energy Transfer Partners LP 6.25% 2049 | | | 757 | | | | 735 | |
| Enterprise Products Operating, LLC 4.90% 2046 | | | 500 | | | | 458 | |
| EQM Midstream Partners, LP 4.125% 2026 | | | 686 | | | | 594 | |
| EQM Midstream Partners, LP 6.50% 20276 | | | 1,690 | | | | 1,574 | |
| EQM Midstream Partners, LP 5.50% 2028 | | | 3,088 | | | | 2,672 | |
| EQM Midstream Partners, LP 7.50% 20306 | | | 642 | | | | 618 | |
| EQM Midstream Partners, LP 4.75% 20316 | | | 1,635 | | | | 1,309 | |
| EQT Corp. 5.00% 2029 | | | 340 | | | | 330 | |
| EQT Corp. 7.50% 203014 | | | 1,110 | | | | 1,194 | |
| EQT Corp. 3.625% 20316 | | | 400 | | | | 346 | |
| Equinor ASA 3.00% 2027 | | | 4,000 | | | | 3,853 | |
| Equinor ASA 3.625% 2028 | | | 3,685 | | | | 3,605 | |
| Exxon Mobil Corp. 2.019% 2024 | | | 643 | | | | 627 | |
| Exxon Mobil Corp. 2.44% 2029 | | | 1,963 | | | | 1,768 | |
| Exxon Mobil Corp. 3.452% 2051 | | | 1,000 | | | | 819 | |
| Genesis Energy, LP 6.50% 2025 | | | 4,280 | | | | 3,954 | |
| Genesis Energy, LP 6.25% 2026 | | | 1,805 | | | | 1,615 | |
| Genesis Energy, LP 8.00% 2027 | | | 3,812 | | | | 3,384 | |
| Genesis Energy, LP 7.75% 2028 | | | 470 | | | | 407 | |
| Halliburton Company 3.80% 2025 | | | 6 | | | | 6 | |
| Harvest Midstream I, LP 7.50% 20286 | | | 850 | | | | 800 | |
| Hess Midstream Operations LP 4.25% 20306 | | | 960 | | | | 806 | |
| Hess Midstream Operations LP 5.50% 20306 | | | 400 | | | | 360 | |
| Hess Midstream Partners LP 5.125% 20286 | | | 2,155 | | | | 1,938 | |
| Hilcorp Energy I, LP 6.00% 20306 | | | 350 | | | | 305 | |
| Hilcorp Energy I, LP 6.00% 20316 | | | 460 | | | | 397 | |
| Holly Energy Partners LP / Holly Energy Finance Corp. 6.375% 20276 | | | 545 | | | | 514 | |
| Marathon Oil Corp. 4.40% 2027 | | | 1,005 | | | | 982 | |
| MPLX LP 4.125% 2027 | | | 500 | | | | 484 | |
| MPLX LP 2.65% 2030 | | | 4,273 | | | | 3,571 | |
| MPLX LP 4.50% 2038 | | | 750 | | | | 659 | |
| MPLX LP 4.70% 2048 | | | 1,101 | | | | 928 | |
| MPLX LP 5.50% 2049 | | | 4,491 | | | | 4,176 | |
| American Funds Insurance Series | 123 |
Asset Allocation Fund (continued)
| Bonds, notes & other debt instruments (continued) | | Principal amount
(000) | | | Value
(000) | |
| Corporate bonds, notes & loans (continued) | | | | | | | | |
| Energy (continued) | | | | | | | | |
| New Fortress Energy, Inc. 6.75% 20256 | | USD | 1,065 | | | $ | 1,009 | |
| New Fortress Energy, Inc. 6.50% 20266 | | | 2,435 | | | | 2,210 | |
| NGL Energy Operating, LLC 7.50% 20266 | | | 13,095 | | | | 11,832 | |
| NGL Energy Partners LP 6.125% 2025 | | | 3,422 | | | | 2,603 | |
| Oasis Midstream Partners LP / OMP Finance Corp. 8.00% 20296 | | | 4,265 | | | | 3,969 | |
| Oasis Petroleum, Inc. 6.375% 20266 | | | 1,945 | | | | 1,802 | |
| ONEOK, Inc. 5.85% 2026 | | | 2,469 | | | | 2,562 | |
| ONEOK, Inc. 5.20% 2048 | | | 2,500 | | | | 2,222 | |
| Parkland Corp. 4.625% 20306 | | | 1,035 | | | | 841 | |
| Petróleos Mexicanos 6.875% 2025 | | | 3,755 | | | | 3,520 | |
| Petróleos Mexicanos 5.35% 2028 | | | 1,870 | | | | 1,489 | |
| Petróleos Mexicanos 6.75% 2047 | | | 706 | | | | 438 | |
| Pioneer Natural Resources Company 2.15% 2031 | | | 1,669 | | | | 1,376 | |
| Plains All American Pipeline LP 3.80% 2030 | | | 113 | | | | 100 | |
| Range Resources Corp. 8.25% 2029 | | | 1,040 | | | | 1,062 | |
| Range Resources Corp. 4.75% 20306 | | | 1,670 | | | | 1,500 | |
| Rockies Express Pipeline, LLC 4.95% 20296 | | | 2,689 | | | | 2,304 | |
| Schlumberger BV 3.75% 20246 | | | 495 | | | | 493 | |
| Schlumberger BV 4.00% 20256 | | | 70 | | | | 70 | |
| Southwestern Energy Co. 7.75% 2027 | | | 2,450 | | | | 2,503 | |
| Southwestern Energy Co. 8.375% 2028 | | | 395 | | | | 417 | |
| Southwestern Energy Co. 5.375% 2029 | | | 1,355 | | | | 1,259 | |
| Southwestern Energy Co. 5.375% 2030 | | | 1,945 | | | | 1,793 | |
| Southwestern Energy Co. 4.75% 2032 | | | 960 | | | | 823 | |
| Statoil ASA 3.25% 2024 | | | 2,850 | | | | 2,835 | |
| Statoil ASA 4.25% 2041 | | | 2,000 | | | | 1,876 | |
| Sunoco Logistics Operating Partners LP 5.40% 2047 | | | 650 | | | | 572 | |
| Sunoco LP 4.50% 2029 | | | 1,050 | | | | 868 | |
| Sunoco LP 4.50% 20306 | | | 1,255 | | | | 1,016 | |
| Targa Resources Partners LP 5.50% 2030 | | | 2,260 | | | | 2,161 | |
| Teekay Offshore Partners LP 8.50% 20233,4,6 | | | 3,550 | | | | 3,230 | |
| Total SE 2.986% 2041 | | | 88 | | | | 69 | |
| TransCanada PipeLines, Ltd. 4.25% 2028 | | | 1,090 | | | | 1,062 | |
| TransCanada PipeLines, Ltd. 4.10% 2030 | | | 598 | | | | 572 | |
| TransCanada PipeLines, Ltd. 4.75% 2038 | | | 2,000 | | | | 1,896 | |
| TransCanada PipeLines, Ltd. 4.875% 2048 | | | 700 | | | | 673 | |
| Valero Energy Corp. 4.00% 2029 | | | 4,000 | | | | 3,787 | |
| Venture Global Calcasieu Pass, LLC 4.125% 20316 | | | 840 | | | | 720 | |
| Weatherford International, Ltd. 11.00% 20246 | | | 1,196 | | | | 1,207 | |
| Weatherford International, Ltd. 6.50% 20286 | | | 2,380 | | | | 2,140 | |
| Weatherford International, Ltd. 8.625% 20306 | | | 6,460 | | | | 5,373 | |
| Western Gas Partners LP 4.50% 2028 | | | 4,468 | | | | 4,051 | |
| Western Midstream Operating, LP 4.55% 2030 (4.30% on 8/1/2022)14 | | | 1,125 | | | | 976 | |
| Williams Companies, Inc. 3.50% 2030 | | | 1,094 | | | | 987 | |
| | | | | | | | 173,066 | |
| | | | | | | | | |
| Health care 0.68% | | | | | | | | |
| AbbVie, Inc. 3.80% 2025 | | | 206 | | | | 205 | |
| AbbVie, Inc. 2.95% 2026 | | | 1,445 | | | | 1,370 | |
| AdaptHealth, LLC 5.125% 20306 | | | 830 | | | | 701 | |
| AmerisourceBergen Corp. 0.737% 2023 | | | 1,961 | | | | 1,924 | |
| Amgen, Inc. 4.20% 2052 | | | 875 | | | | 769 | |
| Amgen, Inc. 4.40% 2062 | | | 1,697 | | | | 1,481 | |
| Anthem, Inc. 2.375% 2025 | | | 818 | | | | 788 | |
| AstraZeneca Finance, LLC 1.20% 2026 | | | 3,786 | | | | 3,431 | |
| AstraZeneca Finance, LLC 1.75% 2028 | | | 1,871 | | | | 1,652 | |
| AstraZeneca Finance, LLC 2.25% 2031 | | | 742 | | | | 647 | |
| AstraZeneca PLC 3.375% 2025 | | | 1,140 | | | | 1,131 | |
| Bausch Health Companies, Inc. 6.125% 20276 | | | 1,600 | | | | 1,363 | |
| Bausch Health Companies, Inc. 4.875% 20286 | | | 2,125 | | | | 1,667 | |
| 124 | American Funds Insurance Series |
Asset Allocation Fund (continued)
| Bonds, notes & other debt instruments (continued) | | Principal amount
(000) | | | Value
(000) | |
| Corporate bonds, notes & loans (continued) | | | | | | | | |
| Health care (continued) | | | | | | | | |
| Bausch Health Companies, Inc. 5.00% 20286 | | USD | 1,735 | | | $ | 929 | |
| Bausch Health Companies, Inc. 5.00% 20296 | | | 1,000 | | | | 523 | |
| Bausch Health Companies, Inc. 5.25% 20316 | | | 3,910 | | | | 2,012 | |
| Baxter International, Inc. 1.322% 2024 | | | 7,109 | | | | 6,682 | |
| Baxter International, Inc. 1.915% 2027 | | | 4,739 | | | | 4,248 | |
| Baxter International, Inc. 2.272% 2028 | | | 3,180 | | | | 2,788 | |
| Bayer US Finance II, LLC 3.875% 20236 | | | 1,685 | | | | 1,683 | |
| Becton, Dickinson and Company 3.363% 2024 | | | 198 | | | | 196 | |
| Boston Scientific Corp. 3.45% 2024 | | | 313 | | | | 313 | |
| Centene Corp. 4.25% 2027 | | | 565 | | | | 529 | |
| Centene Corp. 2.45% 2028 | | | 1,325 | | | | 1,109 | |
| Centene Corp. 4.625% 2029 | | | 4,785 | | | | 4,476 | |
| Centene Corp. 3.00% 2030 | | | 5,865 | | | | 4,876 | |
| Cigna Corp. 3.75% 2023 | | | 245 | | | | 246 | |
| Cigna Corp. 4.80% 2038 | | | 2,692 | | | | 2,623 | |
| Community Health Systems, Inc. 5.625% 20276 | | | 1,600 | | | | 1,359 | |
| Community Health Systems, Inc. 5.25% 20306 | | | 2,935 | | | | 2,236 | |
| Eli Lilly and Company 3.375% 2029 | | | 1,353 | | | | 1,325 | |
| GlaxoSmithKline PLC 3.625% 2025 | | | 3,585 | | | | 3,593 | |
| HCA, Inc. 3.375% 20296 | | | 804 | | | | 708 | |
| HCA, Inc. 3.50% 2030 | | | 4,050 | | | | 3,457 | |
| HCA, Inc. 3.625% 20326 | | | 1,000 | | | | 845 | |
| HCA, Inc. 4.375% 20426 | | | 1,500 | | | | 1,210 | |
| HCA, Inc. 4.625% 20526 | | | 1,450 | | | | 1,162 | |
| Jazz Securities DAC 4.375% 20296 | | | 1,975 | | | | 1,761 | |
| Merck & Co., Inc. 1.90% 2028 | | | 2,611 | | | | 2,322 | |
| Merck & Co., Inc. 2.75% 2051 | | | 1,103 | | | | 817 | |
| Molina Healthcare, Inc. 4.375% 20286 | | | 440 | | | | 394 | |
| Molina Healthcare, Inc. 3.875% 20306 | | | 2,899 | | | | 2,483 | |
| Molina Healthcare, Inc. 3.875% 20326 | | | 3,855 | | | | 3,240 | |
| Novant Health, Inc. 3.168% 2051 | | | 3,750 | | | | 2,921 | |
| Novartis Capital Corp. 1.75% 2025 | | | 1,250 | | | | 1,207 | |
| Novartis Capital Corp. 2.00% 2027 | | | 2,386 | | | | 2,224 | |
| Owens & Minor, Inc. 4.375% 2024 | | | 5,615 | | | | 5,496 | |
| Owens & Minor, Inc. 4.50% 20296 | | | 3,685 | | | | 3,013 | |
| Par Pharmaceutical, Inc. 7.50% 20276 | | | 6,678 | | | | 5,096 | |
| Pfizer, Inc. 2.95% 2024 | | | 825 | | | | 822 | |
| Shire PLC 2.875% 2023 | | | 1,365 | | | | 1,350 | |
| Summa Health 3.511% 2051 | | | 1,655 | | | | 1,363 | |
| Tenet Healthcare Corp. 4.875% 20266 | | | 11,225 | | | | 10,366 | |
| Tenet Healthcare Corp. 4.25% 20296 | | | 2,060 | | | | 1,741 | |
| Tenet Healthcare Corp. 4.375% 20306 | | | 1,925 | | | | 1,632 | |
| Teva Pharmaceutical Finance Co. BV 6.00% 2024 | | | 7,016 | | | | 6,928 | |
| Teva Pharmaceutical Finance Co. BV 7.125% 2025 | | | 1,935 | | | | 1,891 | |
| Teva Pharmaceutical Finance Co. BV 3.15% 2026 | | | 17,790 | | | | 14,646 | |
| Teva Pharmaceutical Finance Co. BV 5.125% 2029 | | | 10,195 | | | | 8,424 | |
| Teva Pharmaceutical Finance Co. BV 4.10% 2046 | | | 3,550 | | | | 2,222 | |
| UnitedHealth Group, Inc. 1.15% 2026 | | | 2,610 | | | | 2,370 | |
| UnitedHealth Group, Inc. 4.00% 2029 | | | 3,541 | | | | 3,510 | |
| UnitedHealth Group, Inc. 2.00% 2030 | | | 974 | | | | 835 | |
| UnitedHealth Group, Inc. 2.30% 2031 | | | 1,312 | | | | 1,138 | |
| UnitedHealth Group, Inc. 4.20% 2032 | | | 767 | | | | 767 | |
| UnitedHealth Group, Inc. 3.05% 2041 | | | 3,875 | | | | 3,130 | |
| UnitedHealth Group, Inc. 3.25% 2051 | | | 2,504 | | | | 1,970 | |
| UnitedHealth Group, Inc. 4.75% 2052 | | | 7,505 | | | | 7,514 | |
| | | | | | | | 169,850 | |
| American Funds Insurance Series | 125 |
Asset Allocation Fund (continued)
| Bonds, notes & other debt instruments (continued) | | Principal amount
(000) | | | Value
(000) | |
| Corporate bonds, notes & loans (continued) | | | | | | | | |
| Consumer discretionary 0.66% | | | | | | | | |
| Allied Universal Holdco, LLC 4.625% 20286 | | USD | 1,660 | | | $ | 1,374 | |
| Amazon.com, Inc. 2.70% 2060 | | | 2,765 | | | | 1,880 | |
| American Honda Finance Corp. 3.50% 2028 | | | 750 | | | | 723 | |
| Asbury Automotive Group, Inc. 4.625% 20296 | | | 2,115 | | | | 1,751 | |
| Atlas LuxCo 4 SARL 4.625% 20286 | | | 1,065 | | | | 864 | |
| Bayerische Motoren Werke AG 2.25% 20236 | | | 300 | | | | 296 | |
| Caesars Entertainment, Inc. 6.25% 20256 | | | 2,815 | | | | 2,722 | |
| Carnival Corp. 7.625% 20266 | | | 700 | | | | 544 | |
| Carnival Corp. 4.00% 20286 | | | 3,875 | | | | 3,191 | |
| Carvana Co. 5.625% 20256 | | | 1,340 | | | | 1,031 | |
| Carvana Co. 5.50% 20276 | | | 3,661 | | | | 2,368 | |
| Carvana Co. 5.875% 20286 | | | 3,474 | | | | 2,210 | |
| Carvana Co. 4.875% 20296 | | | 2,150 | | | | 1,226 | |
| Daimler Trucks Finance North America, LLC 3.50% 20256 | | | 2,000 | | | | 1,961 | |
| Daimler Trucks Finance North America, LLC 2.00% 20266 | | | 2,400 | | | | 2,158 | |
| Daimler Trucks Finance North America, LLC 3.65% 20276 | | | 450 | | | | 431 | |
| Daimler Trucks Finance North America, LLC 2.375% 20286 | | | 1,350 | | | | 1,163 | |
| Fertitta Entertainment, Inc. 4.625% 20296 | | | 3,580 | | | | 3,062 | |
| Fertitta Entertainment, Inc. 6.75% 20306 | | | 1,790 | | | | 1,379 | |
| First Student Bidco, Inc. / First Transit Parent, Inc. 4.00% 20296 | | | 1,300 | | | | 1,042 | |
| Ford Motor Credit Company, LLC 3.375% 2025 | | | 4,475 | | | | 4,044 | |
| Ford Motor Credit Company, LLC 5.125% 2025 | | | 5,855 | | | | 5,603 | |
| Ford Motor Credit Company, LLC 2.70% 2026 | | | 2,110 | | | | 1,801 | |
| Ford Motor Credit Company, LLC 4.542% 2026 | | | 2,455 | | | | 2,251 | |
| General Motors Financial Co. 3.50% 2024 | | | 4,145 | | | | 4,054 | |
| General Motors Financial Co. 2.35% 2027 | | | 272 | | | | 240 | |
| General Motors Financial Co. 2.70% 2027 | | | 467 | | | | 411 | |
| Hanesbrands, Inc. 4.875% 20266 | | | 2,700 | | | | 2,506 | |
| Hilton Grand Vacations Borrower 5.00% 20296 | | | 3,580 | | | | 2,905 | |
| Hilton Worldwide Holdings, Inc. 4.00% 20316 | | | 1,885 | | | | 1,572 | |
| Home Depot, Inc. 1.50% 2028 | | | 3,000 | | | | 2,614 | |
| Home Depot, Inc. 3.90% 2028 | | | 825 | | | | 826 | |
| Home Depot, Inc. 2.95% 2029 | | | 4,000 | | | | 3,737 | |
| Home Depot, Inc. 1.875% 2031 | | | 3,000 | | | | 2,501 | |
| Home Depot, Inc. 4.25% 2046 | | | 2,000 | | | | 1,882 | |
| Home Depot, Inc. 4.50% 2048 | | | 428 | | | | 418 | |
| Hyundai Capital America 3.25% 20226 | | | 480 | | | | 480 | |
| Hyundai Capital America 1.00% 20246 | | | 3,025 | | | | 2,810 | |
| Hyundai Capital America 1.50% 20266 | | | 850 | | | | 753 | |
| Hyundai Capital America 1.65% 20266 | | | 3,075 | | | | 2,714 | |
| Hyundai Capital America 2.375% 20276 | | | 2,579 | | | | 2,271 | |
| Hyundai Capital America 2.10% 20286 | | | 3,075 | | | | 2,595 | |
| International Game Technology PLC 6.50% 20256 | | | 2,855 | | | | 2,846 | |
| International Game Technology PLC 5.25% 20296 | | | 6,490 | | | | 5,890 | |
| KB Home 7.25% 2030 | | | 1,295 | | | | 1,229 | |
| Kontoor Brands, Inc. 4.125% 20296 | | | 910 | | | | 724 | |
| Lindblad Expeditions, LLC 6.75% 20276 | | | 775 | | | | 666 | |
| Lithia Motors, Inc. 3.875% 20296 | | | 1,425 | | | | 1,213 | |
| Lithia Motors, Inc. 4.375% 20316 | | | 1,025 | | | | 876 | |
| Marriott International, Inc. 2.75% 2033 | | | 2,500 | | | | 1,969 | |
| Melco International Development, Ltd. 5.75% 20286 | | | 1,710 | | | | 1,103 | |
| NCL Corp., Ltd. 5.875% 20266 | | | 825 | | | | 650 | |
| NCL Corp., Ltd. 5.875% 20276 | | | 1,375 | | | | 1,178 | |
| NCL Corp., Ltd. 7.75% 20296 | | | 1,375 | | | | 1,054 | |
| Neiman Marcus Group, LLC 7.125% 20266 | | | 1,345 | | | | 1,244 | |
| Party City Holdings, Inc. 8.75% 20266 | | | 1,650 | | | | 1,112 | |
| Penske Automotive Group, Inc. 3.75% 2029 | | | 1,375 | | | | 1,147 | |
| Premier Entertainment Sub, LLC 5.625% 20296 | | | 1,690 | | | | 1,206 | |
| Premier Entertainment Sub, LLC 5.875% 20316 | | | 1,690 | | | | 1,175 | |
| QVC, Inc. 4.75% 2027 | | | 220 | | | | 174 | |
| QVC, Inc. 4.375% 2028 | | | 1,704 | | | | 1,264 | |
| 126 | American Funds Insurance Series |
Asset Allocation Fund (continued)
| Bonds, notes & other debt instruments (continued) | | Principal amount
(000) | | | Value
(000) | |
| Corporate bonds, notes & loans (continued) | | | | | | | | |
| Consumer discretionary (continued) | | | | | | | | |
| Real Hero Merger Sub 2, Inc. 6.25% 20296 | | USD | 715 | | | $ | 543 | |
| Royal Caribbean Cruises, Ltd. 11.50% 20256 | | | 2,023 | | | | 2,084 | |
| Royal Caribbean Cruises, Ltd. 4.25% 20266 | | | 3,120 | | | | 2,222 | |
| Royal Caribbean Cruises, Ltd. 5.375% 20276 | | | 2,520 | | | | 1,838 | |
| Sally Holdings, LLC and Sally Capital, Inc. 5.625% 2025 | | | 2,705 | | | | 2,544 | |
| Sands China, Ltd. 2.55% 20276,14 | | | 2,075 | | | | 1,515 | |
| Scientific Games Corp. 7.00% 20286 | | | 750 | | | | 705 | |
| Scientific Games Corp. 7.25% 20296 | | | 2,240 | | | | 2,104 | |
| Sonic Automotive, Inc. 4.625% 20296 | | | 3,035 | | | | 2,356 | |
| Sonic Automotive, Inc. 4.875% 20316 | | | 1,325 | | | | 999 | |
| Stellantis Finance US, Inc. 1.711% 20276 | | | 2,200 | | | | 1,915 | |
| Stellantis Finance US, Inc. 2.691% 20316 | | | 2,150 | | | | 1,705 | |
| Tempur Sealy International, Inc. 4.00% 20296 | | | 1,235 | | | | 997 | |
| The Gap, Inc. 3.625% 20296 | | | 486 | | | | 342 | |
| The Gap, Inc. 3.875% 20316 | | | 323 | | | | 226 | |
| Toyota Motor Credit Corp. 0.80% 2026 | | | 429 | | | | 388 | |
| Toyota Motor Credit Corp. 1.90% 2027 | | | 4,640 | | | | 4,267 | |
| Toyota Motor Credit Corp. 3.05% 2028 | | | 2,430 | | | | 2,300 | |
| Travel + Leisure Co. 4.50% 20296 | | | 2,100 | | | | 1,628 | |
| VICI Properties LP 4.625% 20296 | | | 995 | | | | 891 | |
| VICI Properties LP / VICI Note Co., Inc. 3.50% 20256 | | | 1,100 | | | | 1,031 | |
| VICI Properties LP / VICI Note Co., Inc. 4.625% 20256 | | | 1,050 | | | | 1,001 | |
| VICI Properties LP / VICI Note Co., Inc. 4.50% 20266 | | | 600 | | | | 553 | |
| VICI Properties LP / VICI Note Co., Inc. 3.75% 20276 | | | 450 | | | | 397 | |
| VICI Properties LP / VICI Note Co., Inc. 3.875% 20296 | | | 2,225 | | | | 1,918 | |
| VICI Properties LP / VICI Note Co., Inc. 4.125% 20306 | | | 3,185 | | | | 2,754 | |
| Volkswagen Group of America Finance, LLC 4.25% 20236 | | | 3,770 | | | | 3,772 | |
| Volkswagen Group of America Finance, LLC 4.625% 20256 | | | 3,845 | | | | 3,846 | |
| Volkswagen Group of America Finance, LLC 3.20% 20266 | | | 3,201 | | | | 3,031 | |
| Wheel Pros, Inc. 6.50% 20296 | | | 1,750 | | | | 1,239 | |
| Wyndham Destinations, Inc. 4.625% 20306 | | | 1,300 | | | | 1,009 | |
| Wyndham Worldwide Corp. 4.375% 20286 | | | 2,255 | | | | 1,976 | |
| Wynn Las Vegas, LLC and Wynn Capital Corp. 4.25% 20236 | | | 2,193 | | | | 2,108 | |
| | | | | | | | 163,288 | |
| | | | | | | | | |
| Communication services 0.57% | | | | | | | | |
| Alphabet, Inc. 1.998% 2026 | | | 3,000 | | | | 2,843 | |
| Alphabet, Inc. 1.90% 2040 | | | 1,375 | | | | 988 | |
| Alphabet, Inc. 2.25% 2060 | | | 1,265 | | | | 825 | |
| AT&T, Inc. 3.50% 2053 | | | 5,140 | | | | 3,905 | |
| CCO Holdings, LLC and CCO Holdings Capital Corp. 4.908% 2025 | | | 500 | | | | 502 | |
| CCO Holdings, LLC and CCO Holdings Capital Corp. 4.50% 20306 | | | 3,500 | | | | 2,917 | |
| CCO Holdings, LLC and CCO Holdings Capital Corp. 4.75% 20306 | | | 2,500 | | | | 2,146 | |
| CCO Holdings, LLC and CCO Holdings Capital Corp. 4.25% 20316 | | | 3,875 | | | | 3,169 | |
| CCO Holdings, LLC and CCO Holdings Capital Corp. 4.50% 2032 | | | 2,710 | | | | 2,203 | |
| CCO Holdings, LLC and CCO Holdings Capital Corp. 4.75% 20326 | | | 2,150 | | | | 1,766 | |
| CCO Holdings, LLC and CCO Holdings Capital Corp. 3.90% 2052 | | | 3,000 | | | | 2,088 | |
| Comcast Corp. 2.35% 2027 | | | 4,000 | | | | 3,732 | |
| Comcast Corp. 3.20% 2036 | | | 375 | | | | 318 | |
| Comcast Corp. 3.90% 2038 | | | 250 | | | | 226 | |
| Comcast Corp. 2.80% 2051 | | | 791 | | | | 561 | |
| Comcast Corp. 2.887% 2051 | | | 2,571 | | | | 1,840 | |
| CSC Holdings, LLC 3.375% 20316 | | | 1,875 | | | | 1,392 | |
| DIRECTV Holdings, LLC and DIRECTV Financing Co., Inc. 5.875% 20276 | | | 3,655 | | | | 3,130 | |
| Embarq Corp. 7.995% 2036 | | | 3,450 | | | | 2,598 | |
| Fox Corp. 4.03% 2024 | | | 1,120 | | | | 1,121 | |
| Frontier Communications Corp. 5.875% 20276 | | | 2,225 | | | | 2,006 | |
| Frontier Communications Corp. 5.00% 20286 | | | 5,550 | | | | 4,730 | |
| Frontier Communications Corp. 6.75% 20296 | | | 4,400 | | | | 3,631 | |
| Frontier Communications Holdings, LLC 5.875% 2029 | | | 1,850 | | | | 1,427 | |
| American Funds Insurance Series | 127 |
Asset Allocation Fund (continued)
| Bonds, notes & other debt instruments (continued) | | Principal amount
(000) | | | Value
(000) | |
| Corporate bonds, notes & loans (continued) | | | | | | | | |
| Communication services (continued) | | | | | | | | |
| Frontier Communications Holdings, LLC 6.00% 20306 | | USD | 1,900 | | | $ | 1,467 | |
| Frontier Communications Holdings, LLC 8.75% 20306 | | | 1,100 | | | | 1,114 | |
| Gray Escrow II, Inc. 5.375% 20316 | | | 900 | | | | 723 | |
| iHeartCommunications, Inc. 5.25% 20276 | | | 3,093 | | | | 2,652 | |
| Intelsat Jackson Holding Co. 6.50% 20306 | | | 2,891 | | | | 2,392 | |
| Ligado Networks, LLC 15.50% PIK 20236,17 | | | 2,782 | | | | 1,517 | |
| Live Nation Entertainment, Inc. 3.75% 20286 | | | 1,350 | | | | 1,168 | |
| Magallanes, Inc. 3.638% 20256 | | | 3,807 | | | | 3,692 | |
| Magallanes, Inc. 3.755% 20276 | | | 1,018 | | | | 956 | |
| Magallanes, Inc. 4.054% 20296 | | | 1,435 | | | | 1,315 | |
| Magallanes, Inc. 4.279% 20326 | | | 2,903 | | | | 2,597 | |
| Magallanes, Inc. 5.05% 20426 | | | 2,500 | | | | 2,131 | |
| Magallanes, Inc. 5.141% 20526 | | | 1,500 | | | | 1,261 | |
| Midas OpCo Holdings, LLC 5.625% 20296 | | | 3,205 | | | | 2,584 | |
| Netflix, Inc. 4.875% 2028 | | | 1,250 | | | | 1,179 | |
| Netflix, Inc. 5.875% 2028 | | | 2,175 | | | | 2,132 | |
| Netflix, Inc. 5.375% 20296 | | | 25 | | | | 24 | |
| Netflix, Inc. 6.375% 2029 | | | 50 | | | | 51 | |
| News Corp. 3.875% 20296 | | | 875 | | | | 758 | |
| News Corp. 5.125% 20326 | | | 550 | | | | 488 | |
| Nexstar Broadcasting, Inc. 4.75% 20286 | | | 3,175 | | | | 2,729 | |
| SBA Tower Trust 1.631% 20266 | | | 8,707 | | | | 7,799 | |
| Scripps Escrow II, Inc. 3.875% 20296 | | | 2,325 | | | | 1,953 | |
| Sinclair Television Group, Inc. 4.125% 20306 | | | 1,175 | | | | 934 | |
| Sirius XM Radio, Inc. 4.00% 20286 | | | 3,575 | | | | 3,105 | |
| Sirius XM Radio, Inc. 4.125% 20306 | | | 950 | | | | 796 | |
| Sirius XM Radio, Inc. 3.875% 20316 | | | 1,975 | | | | 1,576 | |
| Sprint Corp. 7.625% 2026 | | | 2,425 | | | | 2,560 | |
| Sprint Corp. 6.875% 2028 | | | 7,550 | | | | 7,962 | |
| Take-Two Interactive Software, Inc. 3.30% 2024 | | | 3,175 | | | | 3,135 | |
| Take-Two Interactive Software, Inc. 3.70% 2027 | | | 2,783 | | | | 2,704 | |
| Take-Two Interactive Software, Inc. 4.00% 2032 | | | 2,438 | | | | 2,291 | |
| TEGNA, Inc. 5.00% 2029 | | | 1,500 | | | | 1,423 | |
| T-Mobile US, Inc. 1.50% 2026 | | | 500 | | | | 452 | |
| T-Mobile US, Inc. 2.05% 2028 | | | 325 | | | | 282 | |
| T-Mobile US, Inc. 3.375% 2029 | | | 1,700 | | | | 1,492 | |
| Univision Communications, Inc. 6.625% 20276 | | | 5,800 | | | | 5,533 | |
| Univision Communications, Inc. 4.50% 20296 | | | 3,475 | | | | 2,920 | |
| Univision Communications, Inc. 7.375% 20306 | | | 225 | | | | 220 | |
| Virgin Media O2 4.25% 20316 | | | 4,525 | | | | 3,650 | |
| Virgin Media Secured Finance PLC 4.50% 20306 | | | 2,115 | | | | 1,743 | |
| VMED O2 UK Financing I PLC 4.75% 20316 | | | 225 | | | | 182 | |
| Vodafone Group PLC 4.375% 2028 | | | 350 | | | | 349 | |
| Vodafone Group PLC 5.25% 2048 | | | 500 | | | | 477 | |
| Vodafone Group PLC 4.25% 2050 | | | 4,350 | | | | 3,644 | |
| Ziggo Bond Co. BV 5.125% 20306 | | | 1,775 | | | | 1,395 | |
| Ziggo Bond Finance BV 4.875% 20306 | | | 725 | | | | 617 | |
| | | | | | | | 142,188 | |
| | | | | | | | | |
| Industrials 0.48% | | | | | | | | |
| AAdvantage Loyalty IP, Ltd. 5.50% 20266 | | | 1,005 | | | | 927 | |
| ADT Security Corp. 4.125% 20296 | | | 1,630 | | | | 1,327 | |
| Allison Transmission Holdings, Inc. 3.75% 20316 | | | 3,445 | | | | 2,767 | |
| Avis Budget Car Rental, LLC 5.75% 20276 | | | 1,025 | | | | 912 | |
| Avis Budget Group, Inc. 5.375% 20296 | | | 2,450 | | | | 2,042 | |
| Avolon Holdings Funding, Ltd. 3.95% 20246 | | | 1,587 | | | | 1,521 | |
| Avolon Holdings Funding, Ltd. 4.25% 20266 | | | 1,126 | | | | 1,044 | |
| Avolon Holdings Funding, Ltd. 4.375% 20266 | | | 1,975 | | | | 1,832 | |
| Boeing Company 4.875% 2025 | | | 1,555 | | | | 1,551 | |
| Boeing Company 3.10% 2026 | | | 251 | | | | 234 | |
| 128 | American Funds Insurance Series |
Asset Allocation Fund (continued)
| Bonds, notes & other debt instruments (continued) | | Principal amount
(000) | | | Value
(000) | |
| Corporate bonds, notes & loans (continued) | | | | | | | | |
| Industrials (continued) | | | | | | | | |
| Boeing Company 3.25% 2028 | | USD | 4,000 | | | $ | 3,578 | |
| Boeing Company 5.15% 2030 | | | 1,100 | | | | 1,057 | |
| Boeing Company 3.60% 2034 | | | 6,250 | | | | 4,996 | |
| Boeing Company 5.805% 2050 | | | 4,000 | | | | 3,681 | |
| Bombardier, Inc. 7.50% 20246 | | | 760 | | | | 715 | |
| Bombardier, Inc. 7.125% 20266 | | | 2,900 | | | | 2,400 | |
| Bombardier, Inc. 7.875% 20276 | | | 6,745 | | | | 5,632 | |
| Bombardier, Inc. 6.00% 20286 | | | 1,010 | | | | 758 | |
| BWX Technologies, Inc. 4.125% 20296 | | | 1,025 | | | | 901 | |
| Canadian National Railway Company 3.20% 2046 | | | 930 | | | | 728 | |
| Canadian Pacific Railway, Ltd. 1.75% 2026 | | | 1,385 | | | | 1,254 | |
| Canadian Pacific Railway, Ltd. 2.45% 2031 | | | 1,738 | | | | 1,489 | |
| Canadian Pacific Railway, Ltd. 3.10% 2051 | | | 829 | | | | 612 | |
| Clarivate Science Holdings Corp. 3.875% 20286 | | | 590 | | | | 495 | |
| Clarivate Science Holdings Corp. 4.875% 20296 | | | 520 | | | | 429 | |
| CoreLogic, Inc. 4.50% 20286 | | | 6,075 | | | | 4,688 | |
| Covert Mergeco, Inc. 4.875% 20296 | | | 1,035 | | | | 844 | |
| CSX Corp. 4.25% 2029 | | | 1,062 | | | | 1,057 | |
| CSX Corp. 2.50% 2051 | | | 1,125 | | | | 759 | |
| General Electric Capital Corp. 4.418% 2035 | | | 649 | | | | 607 | |
| Honeywell International, Inc. 2.30% 2024 | | | 2,640 | | | | 2,595 | |
| Honeywell International, Inc. 1.35% 2025 | | | 5,947 | | | | 5,606 | |
| Honeywell International, Inc. 2.70% 2029 | | | 1,470 | | | | 1,350 | |
| Icahn Enterprises Finance Corp. 4.75% 2024 | | | 2,090 | | | | 1,957 | |
| L3Harris Technologies, Inc. 1.80% 2031 | | | 2,625 | | | | 2,098 | |
| LSC Communications, Inc. 8.75% 20233,4,6,16 | | | 4,063 | | | | 39 | |
| Masco Corp. 1.50% 2028 | | | 774 | | | | 650 | |
| Masco Corp. 2.00% 2031 | | | 497 | | | | 391 | |
| Masco Corp. 3.125% 2051 | | | 230 | | | | 158 | |
| MasTec, Inc. 4.50% 20286 | | | 1,425 | | | | 1,284 | |
| Meritor, Inc. 4.50% 20286 | | | 730 | | | | 704 | |
| Norfolk Southern Corp. 3.05% 2050 | | | 2,746 | | | | 2,018 | |
| Northrop Grumman Corp. 2.93% 2025 | | | 1,820 | | | | 1,782 | |
| Northrop Grumman Corp. 3.25% 2028 | | | 3,495 | | | | 3,325 | |
| Otis Worldwide Corp. 2.293% 2027 | | | 2,135 | | | | 1,935 | |
| Roller Bearing Company of America, Inc. 4.375% 20296 | | | 195 | | | | 166 | |
| Rolls-Royce PLC 5.75% 20276 | | | 765 | | | | 692 | |
| Siemens AG 1.20% 20266 | | | 3,887 | | | | 3,525 | |
| Siemens AG 1.70% 20286 | | | 3,700 | | | | 3,245 | |
| SkyMiles IP, Ltd. 4.75% 20286 | | | 2,950 | | | | 2,789 | |
| The Brink’s Co. 4.625% 20276 | | | 2,385 | | | | 2,124 | |
| TransDigm, Inc. 6.25% 20266 | | | 3,476 | | | | 3,361 | |
| TransDigm, Inc. 5.50% 2027 | | | 2,200 | | | | 1,874 | |
| Triumph Group, Inc. 6.25% 20246 | | | 3,390 | | | | 3,028 | |
| Triumph Group, Inc. 8.875% 20246 | | | 1,877 | | | | 1,893 | |
| Triumph Group, Inc. 7.75% 20256 | | | 3,600 | | | | 2,777 | |
| Union Pacific Corp. 2.40% 2030 | | | 2,414 | | | | 2,137 | |
| Union Pacific Corp. 2.95% 2052 | | | 1,000 | | | | 738 | |
| Union Pacific Corp. 3.839% 2060 | | | 546 | | | | 457 | |
| Union Pacific Corp. 3.799% 2071 | | | 545 | | | | 438 | |
| United Airlines Holdings, Inc. 6.50% 20276 | | | 2,200 | | | | 2,169 | |
| United Airlines, Inc. 4.375% 20266 | | | 975 | | | | 863 | |
| United Airlines, Inc. 4.625% 20296 | | | 2,225 | | | | 1,895 | |
| United Rentals, Inc. 3.875% 2031 | | | 2,050 | | | | 1,733 | |
| United Technologies Corp. 3.65% 2023 | | | 52 | | | | 52 | |
| United Technologies Corp. 3.95% 2025 | | | 3,155 | | | | 3,166 | |
| United Technologies Corp. 4.125% 2028 | | | 1,075 | | | | 1,062 | |
| Vertical U.S. Newco, Inc. 5.25% 20276 | | | 2,000 | | | | 1,787 | |
| | | | | | | | 118,700 | |
| American Funds Insurance Series | 129 |
Asset Allocation Fund (continued)
| Bonds, notes & other debt instruments (continued) | | Principal amount
(000) | | | Value
(000) | |
| Corporate bonds, notes & loans (continued) | | | | | | | | |
| Materials 0.39% | | | | | | | | |
| Alcoa Nederland Holding BV 4.125% 20296 | | USD | 950 | | | $ | 851 | |
| Allegheny Technologies, Inc. 4.875% 2029 | | | 710 | | | | 567 | |
| Allegheny Technologies, Inc. 5.125% 2031 | | | 1,110 | | | | 852 | |
| Anglo American Capital PLC 2.25% 20286 | | | 484 | | | | 418 | |
| Anglo American Capital PLC 2.625% 20306 | | | 2,500 | | | | 2,060 | |
| Anglo American Capital PLC 3.95% 20506 | | | 1,281 | | | | 985 | |
| Arconic Rolled Products Corp. 6.125% 20286 | | | 750 | | | | 702 | |
| Ball Corp. 3.125% 2031 | | | 3,520 | | | | 2,845 | |
| Can-Pack SA / Canpack US, LLC 3.875% 20296 | | | 935 | | | | 731 | |
| Chevron Phillips Chemical Co., LLC 3.30% 20236 | | | 595 | | | | 594 | |
| Cleveland-Cliffs, Inc. 5.875% 2027 | | | 9,000 | | | | 8,408 | |
| Cleveland-Cliffs, Inc. 4.625% 20296 | | | 1,825 | | | | 1,614 | |
| Cleveland-Cliffs, Inc. 4.875% 20316 | | | 1,351 | | | | 1,194 | |
| CVR Partners LP 6.125% 20286 | | | 745 | | | | 667 | |
| Dow Chemical Co. 3.60% 2050 | | | 1,328 | | | | 1,016 | |
| First Quantum Minerals, Ltd. 6.50% 20246 | | | 2,204 | | | | 2,121 | |
| First Quantum Minerals, Ltd. 7.50% 20256 | | | 11,350 | | | | 10,754 | |
| First Quantum Minerals, Ltd. 6.875% 20266 | | | 3,625 | | | | 3,346 | |
| First Quantum Minerals, Ltd. 6.875% 20276 | | | 4,240 | | | | 3,798 | |
| FXI Holdings, Inc. 7.875% 20246 | | | 1,721 | | | | 1,496 | |
| FXI Holdings, Inc. 12.25% 20266 | | | 4,392 | | | | 3,917 | |
| Glencore Funding, LLC 4.125% 20246 | | | 945 | | | | 941 | |
| International Flavors & Fragrances, Inc. 1.832% 20276 | | | 5,400 | | | | 4,657 | |
| International Paper Co. 7.30% 2039 | | | 2,005 | | | | 2,345 | |
| Joseph T. Ryerson & Son, Inc. 8.50% 20286 | | | 164 | | | | 169 | |
| Kaiser Aluminum Corp. 4.625% 20286 | | | 1,620 | | | | 1,351 | |
| LSB Industries, Inc. 6.25% 20286 | | | 860 | | | | 760 | |
| LYB International Finance III, LLC 2.25% 2030 | | | 1,198 | | | | 989 | |
| LYB International Finance III, LLC 3.625% 2051 | | | 2,537 | | | | 1,878 | |
| LYB International Finance III, LLC 3.80% 2060 | | | 1,186 | | | | 844 | |
| Methanex Corp. 5.125% 2027 | | | 6,180 | | | | 5,464 | |
| Mineral Resources, Ltd. 8.50% 20306 | | | 1,525 | | | | 1,505 | |
| Mosaic Co. 3.25% 2022 | | | 1,125 | | | | 1,126 | |
| Mosaic Co. 4.05% 2027 | | | 1,050 | | | | 1,028 | |
| Nova Chemicals Corp. 4.25% 20296 | | | 1,875 | | | | 1,468 | |
| Novelis Corp. 3.875% 20316 | | | 1,115 | | | | 861 | |
| Praxair, Inc. 1.10% 2030 | | | 2,938 | | | | 2,352 | |
| Rio Tinto Finance (USA), Ltd. 2.75% 2051 | | | 1,837 | | | | 1,347 | |
| SCIH Salt Holdings, Inc. 4.875% 20286 | | | 3,485 | | | | 2,904 | |
| SCIH Salt Holdings, Inc. 6.625% 20296 | | | 1,230 | | | | 974 | |
| Sherwin-Williams Company 3.125% 2024 | | | 275 | | | | 271 | |
| Sherwin-Williams Company 3.80% 2049 | | | 5,208 | | | | 4,176 | |
| South32 Treasury (USA), Ltd. 4.35% 20326 | | | 2,180 | | | | 2,039 | |
| Venator Materials Corp. 5.75% 20256 | | | 5,845 | | | | 4,689 | |
| Venator Materials Corp. 9.50% 20256 | | | 1,700 | | | | 1,708 | |
| Warrior Met Coal, Inc. 7.875% 20286 | | | 2,900 | | | | 2,767 | |
| Westlake Chemical Corp. 4.375% 2047 | | | 500 | | | | 428 | |
| | | | | | | | 97,977 | |
| | | | | | | | | |
| Utilities 0.39% | | | | | | | | |
| Ameren Corp. 2.50% 2024 | | | 969 | | | | 940 | |
| American Electric Power Company, Inc. 2.95% 2022 | | | 3,020 | | | | 3,011 | |
| Calpine Corp. 3.75% 20316 | | | 1,975 | | | | 1,610 | |
| Commonwealth Edison Co. 4.35% 2045 | | | 1,085 | | | | 1,006 | |
| Commonwealth Edison Co. 3.85% 2052 | | | 2,600 | | | | 2,297 | |
| Dominion Resources, Inc., junior subordinated, 3.071% 202414 | | | 1,775 | | | | 1,734 | |
| Duke Energy Carolinas, LLC 3.95% 2028 | | | 1,250 | | | | 1,233 | |
| Duke Energy Florida, LLC 3.20% 2027 | | | 1,445 | | | | 1,411 | |
| Duke Energy Indiana, Inc. 3.25% 2049 | | | 1,225 | | | | 950 | |
| Duke Energy Progress, LLC 3.70% 2046 | | | 457 | | | | 390 | |
| 130 | American Funds Insurance Series |
Asset Allocation Fund (continued)
| Bonds, notes & other debt instruments (continued) | | Principal amount
(000) | | | Value
(000) | |
| Corporate bonds, notes & loans (continued) | | | | | | | | |
| Utilities (continued) | | | | | | | | |
| Duke Energy Progress, LLC 2.50% 2050 | | USD | 202 | | | $ | 138 | |
| Duke Energy Progress, LLC 2.90% 2051 | | | 91 | | | | 67 | |
| Edison International 3.55% 2024 | | | 2,200 | | | | 2,148 | |
| EDP Finance BV 3.625% 20246 | | | 4,100 | | | | 4,070 | |
| Electricité de France SA 4.75% 20356 | | | 1,250 | | | | 1,165 | |
| Electricité de France SA 4.875% 20386 | | | 2,750 | | | | 2,439 | |
| Electricité de France SA 5.60% 2040 | | | 525 | | | | 503 | |
| Emera US Finance LP 3.55% 2026 | | | 320 | | | | 307 | |
| Enersis Américas SA 4.00% 2026 | | | 245 | | | | 237 | |
| Entergy Corp. 2.80% 2030 | | | 3,325 | | | | 2,855 | |
| Entergy Texas, Inc. 1.75% 2031 | | | 3,650 | | | | 2,956 | |
| Eversource Energy 3.80% 2023 | | | 2,730 | | | | 2,737 | |
| FirstEnergy Corp. 3.40% 2050 | | | 2,250 | | | | 1,530 | |
| FirstEnergy Transmission, LLC 2.866% 20286 | | | 675 | | | | 572 | |
| Northern States Power Co. 4.125% 2044 | | | 3,525 | | | | 3,203 | |
| NRG Energy, Inc. 3.625% 20316 | | | 2,600 | | | | 2,044 | |
| Pacific Gas and Electric Co. 2.10% 2027 | | | 125 | | | | 105 | |
| Pacific Gas and Electric Co. 2.50% 2031 | | | 2,941 | | | | 2,252 | |
| Pacific Gas and Electric Co. 3.30% 2040 | | | 100 | | | | 69 | |
| Pacific Gas and Electric Co. 4.20% 2041 | | | 4,100 | | | | 3,009 | |
| Pacific Gas and Electric Co. 3.50% 2050 | | | 1,250 | | | | 837 | |
| PacifiCorp, First Mortgage Bonds, 4.125% 2049 | | | 4,000 | | | | 3,591 | |
| PG&E Corp. 5.00% 2028 | | | 3,750 | | | | 3,174 | |
| PG&E Corp. 5.25% 2030 | | | 3,400 | | | | 2,804 | |
| Public Service Company of Colorado 1.875% 2031 | | | 2,775 | | | | 2,322 | |
| Public Service Electric and Gas Co. 3.60% 2047 | | | 548 | | | | 465 | |
| Public Service Electric and Gas Co. 3.15% 2050 | | | 2,451 | | | | 1,909 | |
| Public Service Enterprise Group, Inc. 2.65% 2022 | | | 1,900 | | | | 1,899 | |
| Southern California Edison Co. 2.85% 2029 | | | 4,450 | | | | 3,947 | |
| Southern California Edison Co. 6.00% 2034 | | | 2,500 | | | | 2,697 | |
| Southern California Edison Co. 5.35% 2035 | | | 3,000 | | | | 2,997 | |
| Southern California Edison Co. 5.75% 2035 | | | 675 | | | | 699 | |
| Southern California Edison Co. 4.00% 2047 | | | 264 | | | | 215 | |
| Southern California Edison Co. 3.45% 2052 | | | 2,475 | | | | 1,847 | |
| Talen Energy Corp. 7.25% 20276,16 | | | 8,334 | | | | 8,218 | |
| Talen Energy Corp., Term Loan B, (3-month USD-LIBOR + 3.75%) 5.416% 202612,15,16 | | | 2,815 | | | | 2,705 | |
| Talen Energy Supply, LLC 7.625% 20286,16 | | | 1,180 | | | | 1,158 | |
| Targa Resources Partners LP 4.00% 2032 | | | 1,750 | | | | 1,501 | |
| Venture Global Calcasieu Pass, LLC 3.875% 20296 | | | 1,030 | | | | 904 | |
| Virginia Electric and Power Co. 2.40% 2032 | | | 2,575 | | | | 2,203 | |
| Virginia Electric and Power Co. 4.60% 2048 | | | 2,650 | | | | 2,555 | |
| Xcel Energy, Inc. 2.60% 2029 | | | 1,950 | | | | 1,702 | |
| | | | | | | | 97,337 | |
| | | | | | | | | |
| Real estate 0.34% | | | | | | | | |
| Alexandria Real Estate Equities, Inc. 3.80% 2026 | | | 315 | | | | 309 | |
| Alexandria Real Estate Equities, Inc. 3.95% 2028 | | | 1,220 | | | | 1,182 | |
| Alexandria Real Estate Equities, Inc. 2.75% 2029 | | | 1,940 | | | | 1,699 | |
| Alexandria Real Estate Equities, Inc. 3.375% 2031 | | | 1,320 | | | | 1,170 | |
| Alexandria Real Estate Equities, Inc. 1.875% 2033 | | | 4,095 | | | | 3,084 | |
| Alexandria Real Estate Equities, Inc. 4.85% 2049 | | | 410 | | | | 381 | |
| American Campus Communities, Inc. 3.75% 2023 | | | 3,055 | | | | 3,059 | |
| American Campus Communities, Inc. 4.125% 2024 | | | 2,075 | | | | 2,087 | |
| American Campus Communities, Inc. 3.625% 2027 | | | 9,545 | | | | 9,374 | |
| American Campus Communities, Inc. 3.875% 2031 | | | 331 | | | | 326 | |
| American Tower Corp. 1.45% 2026 | | | 2,369 | | | | 2,074 | |
| American Tower Corp. 1.60% 2026 | | | 2,347 | | | | 2,101 | |
| American Tower Corp. 3.55% 2027 | | | 1,425 | | | | 1,337 | |
| American Tower Corp. 1.50% 2028 | | | 2,500 | | | | 2,081 | |
| American Funds Insurance Series | 131 |
Asset Allocation Fund (continued)
| Bonds, notes & other debt instruments (continued) | | Principal amount
(000) | | | Value
(000) | |
| Corporate bonds, notes & loans (continued) | | | | | | | | |
| Real estate (continued) | | | | | | | | |
| American Tower Corp. 3.60% 2028 | | USD | 1,000 | | | $ | 936 | |
| American Tower Corp. 2.30% 2031 | | | 1,500 | | | | 1,190 | |
| American Tower Corp. 2.95% 2051 | | | 2,000 | | | | 1,358 | |
| Brandywine Operating Partnership LP 3.95% 2023 | | | 1,070 | | | | 1,068 | |
| Brookfield Property REIT, Inc. 5.75% 20266 | | | 2,575 | | | | 2,357 | |
| Diversified Healthcare Trust 4.375% 2031 | | | 2,120 | | | | 1,444 | |
| Essex Portfolio LP 3.875% 2024 | | | 1,000 | | | | 998 | |
| Essex Portfolio LP 3.50% 2025 | | | 6,825 | | | | 6,686 | |
| Extra Space Storage, Inc. 2.35% 2032 | | | 1,385 | | | | 1,099 | |
| Gaming and Leisure Properties, Inc. 3.35% 2024 | | | 1,263 | | | | 1,212 | |
| Host Hotels & Resorts LP 4.50% 2026 | | | 355 | | | | 349 | |
| Howard Hughes Corp. 5.375% 20286 | | | 1,450 | | | | 1,217 | |
| Howard Hughes Corp. 4.125% 20296 | | | 1,860 | | | | 1,438 | |
| Howard Hughes Corp. 4.375% 20316 | | | 2,615 | | | | 1,940 | |
| Invitation Homes Operating Partnership LP 2.00% 2031 | | | 2,401 | | | | 1,850 | |
| Iron Mountain, Inc. 5.25% 20306 | | | 3,785 | | | | 3,298 | |
| Iron Mountain, Inc. 4.50% 20316 | | | 2,650 | | | | 2,173 | |
| Kennedy-Wilson Holdings, Inc. 4.75% 2029 | | | 2,645 | | | | 2,146 | |
| Kennedy-Wilson Holdings, Inc. 4.75% 2030 | | | 1,140 | | | | 894 | |
| Kennedy-Wilson Holdings, Inc. 5.00% 2031 | | | 2,260 | | | | 1,755 | |
| Park Intermediate Holdings, LLC 4.875% 20296 | | | 2,280 | | | | 1,961 | |
| Public Storage 2.37% 2022 | | | 565 | | | | 564 | |
| Public Storage 1.85% 2028 | | | 2,490 | | | | 2,159 | |
| Public Storage 1.95% 2028 | | | 2,027 | | | | 1,754 | |
| Public Storage 2.30% 2031 | | | 719 | | | | 605 | |
| Realogy Corp. 5.75% 20296 | | | 2,260 | | | | 1,718 | |
| RHP Hotel Properties LP / RHP Finance Corp. 4.50% 20296 | | | 1,300 | | | | 1,105 | |
| RLJ Lodging Trust, LP 4.00% 20296 | | | 1,240 | | | | 1,021 | |
| Scentre Group 3.25% 20256 | | | 1,000 | | | | 957 | |
| Scentre Group 3.50% 20256 | | | 3,075 | | | | 2,989 | |
| Scentre Group 3.75% 20276 | | | 2,430 | | | | 2,331 | |
| Sun Communities Operating LP 2.30% 2028 | | | 1,845 | | | | 1,580 | |
| Sun Communities Operating LP 2.70% 2031 | | | 876 | | | | 707 | |
| UDR, Inc. 2.95% 2026 | | | 760 | | | | 718 | |
| | | | | | | | 85,841 | |
| | | | | | | | | |
| Information technology 0.30% | | | | | | | | |
| Adobe, Inc. 1.90% 2025 | | | 366 | | | | 353 | |
| Almonde, Inc., Term Loan, (3-month USD-LIBOR + 7.25%) 8.489% 202512,15 | | | 4,150 | | | | 3,593 | |
| Analog Devices, Inc. 1.70% 2028 | | | 1,286 | | | | 1,128 | |
| Analog Devices, Inc. 2.10% 2031 | | | 1,212 | | | | 1,036 | |
| Analog Devices, Inc. 2.80% 2041 | | | 2,961 | | | | 2,325 | |
| Analog Devices, Inc. 2.95% 2051 | | | 1,955 | | | | 1,495 | |
| Apple, Inc. 3.00% 2024 | | | 625 | | | | 624 | |
| Apple, Inc. 3.35% 2027 | | | 40 | | | | 40 | |
| Apple, Inc. 1.20% 2028 | | | 5,000 | | | | 4,379 | |
| Avaya, Inc. 6.125% 20286 | | | 1,600 | | | | 1,048 | |
| Booz Allen Hamilton, Inc. 4.00% 20296 | | | 1,000 | | | | 874 | |
| Broadcom, Inc. 1.95% 20286 | | | 1,407 | | | | 1,199 | |
| Broadcom, Inc. 4.15% 20326 | | | 2,811 | | | | 2,541 | |
| Broadcom, Inc. 2.60% 20336 | | | 2,524 | | | | 1,944 | |
| Broadcom, Inc. 3.469% 20346 | | | 1,771 | | | | 1,444 | |
| Broadcom, Inc. 3.50% 20416 | | | 3,948 | | | | 2,984 | |
| CommScope Finance, LLC 6.00% 20266 | | | 1,600 | | | | 1,477 | |
| Diebold Nixdorf AG, Term Loan B, (3-month USD-LIBOR + 2.75%) 4.00% 202312,15 | | | 5,393 | | | | 4,577 | |
| Diebold Nixdorf, Inc. 9.375% 20256 | | | 10,131 | | | | 7,097 | |
| Diebold, Inc. 8.50% 2024 | | | 6,790 | | | | 3,540 | |
| Fidelity National Information Services, Inc. 3.10% 2041 | | | 302 | | | | 221 | |
| Fiserv, Inc. 3.50% 2029 | | | 471 | | | | 430 | |
| Fiserv, Inc. 2.65% 2030 | | | 3,605 | | | | 3,057 | |
| 132 | American Funds Insurance Series |
Asset Allocation Fund (continued)
| Bonds, notes & other debt instruments (continued) | | Principal amount
(000) | | | Value
(000) | |
| Corporate bonds, notes & loans (continued) | | | | | | | | |
| Information technology (continued) | | | | | | | | |
| Gartner, Inc. 4.50% 20286 | | USD | 650 | | | $ | 598 | |
| Intuit, Inc. 0.95% 2025 | | | 1,530 | | | | 1,410 | |
| Intuit, Inc. 1.35% 2027 | | | 1,395 | | | | 1,219 | |
| Intuit, Inc. 1.65% 2030 | | | 1,845 | | | | 1,517 | |
| Mastercard, Inc. 2.00% 2031 | | | 3,874 | | | | 3,269 | |
| Microsoft Corp. 2.921% 2052 | | | 4,814 | | | | 3,805 | |
| MoneyGram International, Inc. 5.375% 20266 | | | 750 | | | | 715 | |
| NCR Corp. 5.125% 20296 | | | 1,650 | | | | 1,399 | |
| PayPal Holdings, Inc. 2.65% 2026 | | | 2,364 | | | | 2,243 | |
| PayPal Holdings, Inc. 2.30% 2030 | | | 2,200 | | | | 1,891 | |
| Sabre GLBL, Inc. 7.375% 20256 | | | 728 | | | | 677 | |
| Sabre Holdings Corp. 9.25% 20256 | | | 1,197 | | | | 1,156 | |
| Square, Inc. 3.50% 20316 | | | 2,325 | | | | 1,858 | |
| Synaptics, Inc. 4.00% 20296 | | | 875 | | | | 712 | |
| Unisys Corp. 6.875% 20276 | | | 725 | | | | 634 | |
| VeriSign, Inc. 2.70% 2031 | | | 625 | | | | 504 | |
| Veritas Holdings, Ltd. 7.50% 20256 | | | 2,635 | | | | 1,983 | |
| Viavi Solutions, Inc. 3.75% 20296 | | | 725 | | | | 608 | |
| Xerox Corp. 5.00% 20256 | | | 2,275 | | | | 2,119 | |
| | | | | | | | 75,723 | |
| | | | | | | | | |
| Consumer staples 0.27% | | | | | | | | |
| 7-Eleven, Inc. 0.80% 20246 | | | 1,700 | | | | 1,612 | |
| 7-Eleven, Inc. 0.95% 20266 | | | 825 | | | | 729 | |
| 7-Eleven, Inc. 1.30% 20286 | | | 2,500 | | | | 2,081 | |
| Albertsons Companies, Inc. 3.50% 20296 | | | 1,385 | | | | 1,125 | |
| Altria Group, Inc. 2.45% 2032 | | | 125 | | | | 94 | |
| Altria Group, Inc. 5.80% 2039 | | | 2,820 | | | | 2,567 | |
| Altria Group, Inc. 3.40% 2041 | | | 1,500 | | | | 995 | |
| Altria Group, Inc. 4.50% 2043 | | | 3,000 | | | | 2,259 | |
| Altria Group, Inc. 5.95% 2049 | | | 490 | | | | 430 | |
| Altria Group, Inc. 3.70% 2051 | | | 1,395 | | | | 894 | |
| Anheuser-Busch InBev NV 4.00% 2028 | | | 845 | | | | 835 | |
| Anheuser-Busch InBev NV 4.35% 2040 | | | 2,500 | | | | 2,242 | |
| Anheuser-Busch InBev NV 4.60% 2048 | | | 1,500 | | | | 1,350 | |
| British American Tobacco PLC 3.222% 2024 | | | 2,826 | | | | 2,750 | |
| British American Tobacco PLC 3.215% 2026 | | | 3,323 | | | | 3,108 | |
| British American Tobacco PLC 4.39% 2037 | | | 2,459 | | | | 1,955 | |
| British American Tobacco PLC 4.54% 2047 | | | 940 | | | | 691 | |
| Central Garden & Pet Co. 4.125% 20316 | | | 1,395 | | | | 1,122 | |
| Coca-Cola Company 1.00% 2028 | | | 940 | | | | 812 | |
| Conagra Brands, Inc. 1.375% 2027 | | | 4,615 | | | | 3,856 | |
| Constellation Brands, Inc. 3.60% 2028 | | | 625 | | | | 594 | |
| Constellation Brands, Inc. 2.25% 2031 | | | 1,487 | | | | 1,208 | |
| Coty, Inc. 4.75% 20296 | | | 1,220 | | | | 1,050 | |
| Imperial Tobacco Finance PLC 3.50% 20236 | | | 4,000 | | | | 3,978 | |
| Kronos Acquisition Holdings, Inc. 5.00% 20266 | | | 2,430 | | | | 2,081 | |
| Lamb Weston Holdings, Inc. 4.125% 20306 | | | 2,210 | | | | 1,919 | |
| PepsiCo, Inc. 1.95% 2031 | | | 3,001 | | | | 2,559 | |
| PepsiCo, Inc. 2.625% 2041 | | | 5,000 | | | | 3,934 | |
| PepsiCo, Inc. 3.625% 2050 | | | 777 | | | | 703 | |
| PepsiCo, Inc. 2.75% 2051 | | | 1,723 | | | | 1,324 | |
| Philip Morris International, Inc. 2.375% 2022 | | | 1,960 | | | | 1,958 | |
| Philip Morris International, Inc. 2.875% 2024 | | | 788 | | | | 779 | |
| Philip Morris International, Inc. 3.25% 2024 | | | 2,000 | | | | 1,975 | |
| Philip Morris International, Inc. 0.875% 2026 | | | 2,990 | | | | 2,656 | |
| Philip Morris International, Inc. 3.375% 2029 | | | 788 | | | | 712 | |
| Philip Morris International, Inc. 1.75% 2030 | | | 2,956 | | | | 2,293 | |
| Post Holdings, Inc. 4.625% 20306 | | | 2,886 | | | | 2,440 | |
| American Funds Insurance Series | 133 |
Asset Allocation Fund (continued)
| Bonds, notes & other debt instruments (continued) | | Principal amount
(000) | | | Value
(000) | |
| Corporate bonds, notes & loans (continued) | | | | | | | | |
| Consumer staples (continued) | | | | | | | | |
| Prestige Brands International, Inc. 3.75% 20316 | | USD | 1,115 | | | $ | 926 | |
| Reynolds American, Inc. 5.85% 2045 | | | 2,030 | | | | 1,707 | |
| Simmons Foods, Inc. 4.625% 20296 | | | 560 | | | | 474 | |
| | | | | | | | 66,777 | |
| | | | | | | | | |
| Total corporate bonds, notes & loans | | | | | | | 1,498,036 | |
| | | | | | | | | |
| Asset-backed obligations 1.46% | | | | | | | | |
| Aesop Funding, LLC, Series 2017-2A, Class A, 2.97% 20246,11 | | | 1,920 | | | | 1,914 | |
| Aesop Funding, LLC, Series 2018-1A, Class A, 3.70% 20246,11 | | | 1,114 | | | | 1,113 | |
| Aesop Funding, LLC, Series 2018-2A, Class A, 4.00% 20256,11 | | | 3,100 | | | | 3,101 | |
| Aesop Funding, LLC, Series 2021-1A, Class A, 1.38% 20276,11 | | | 13,378 | | | | 11,987 | |
| Aesop Funding, LLC, Series 2020-2, Class A, 2.02% 20276,11 | | | 539 | | | | 496 | |
| Aesop Funding, LLC, Series 2020-2A, Class B, 2.96% 20276,11 | | | 138 | | | | 130 | |
| Affirm Asset Securitization Trust, Series 2021-Z2, Class A, 1.17% 20266,11 | | | 1,545 | | | | 1,504 | |
| Allegro CLO, Ltd., Series 2016-1A, Class AR2, (3-month USD-LIBOR + 0.95%) 1.994% 20306,11,12 | | | 2,395 | | | | 2,361 | |
| Allegro CLO, Ltd., Series 2017-1A, Class AR, (3-month USD-LIBOR + 0.95%) 1.994% 20306,11,12 | | | 1,639 | | | | 1,604 | |
| Ares CLO, Ltd., Series 2017-42A, Class AR, (3-month USD-LIBOR + 0.92%) 2.056% 20286,11,12 | | | 3,042 | | | | 3,004 | |
| Ballyrock CLO, Ltd., Series 2019-2A, Class A1AR, (3-month USD-LIBOR + 1.00%) 2.478% 20306,11,12 | | | 3,660 | | | | 3,604 | |
| Bankers Healthcare Group Securitization Trust, Series 2021-A, Class A, 1.42% 20336,11 | | | 638 | | | | 597 | |
| Castlelake Aircraft Securitization Trust, Series 2021-1, Class A, 2.868% 20376,11 | | | 4,936 | | | | 4,371 | |
| Castlelake Aircraft Securitization Trust, Series 2017-1R, Class A, 2.741% 20416,11 | | | 754 | | | | 678 | |
| Cent CLO, Ltd., Series 2014-21A, Class AR, (3-month USD-LIBOR + 0.97%) 2.195% 20306,11,12 | | | 5,185 | | | | 5,118 | |
| CF Hippolyta, LLC, Series 2020-1, Class A1, 1.69% 20606,11 | | | 5,261 | | | | 4,774 | |
| CF Hippolyta, LLC, Series 2020-1, Class A2, 1.99% 20606,11 | | | 1,774 | | | | 1,520 | |
| CF Hippolyta, LLC, Series 2021-1, Class A1, 1.53% 20616,11 | | | 6,175 | | | | 5,453 | |
| CLI Funding VI, LLC, Series 2020-2A, Class A, 2.03% 20456,11 | | | 1,560 | | | | 1,401 | |
| CLI Funding VI, LLC, Series 2020-3A, Class A, 2.07% 20456,11 | | | 1,260 | | | | 1,138 | |
| CLI Funding VI, LLC, Series 2020-1A, Class A, 2.08% 20456,11 | | | 5,730 | | | | 5,129 | |
| CLI Funding VIII, LLC, Series 2021-1A, Class A, 1.64% 20466,11 | | | 1,713 | | | | 1,514 | |
| Cloud Pass-Through Trust, Series 2019-1A, Class CLOU, 3.554% 20226,11,12 | | | 9 | | | | 9 | |
| Credit Acceptance Auto Loan Trust, Series 2020-1A, Class A, 2.01% 20296,11 | | | 1,420 | | | | 1,415 | |
| Drive Auto Receivables Trust, Series 2019-3, Class C, 2.90% 202511 | | | 258 | | | | 259 | |
| Drive Auto Receivables Trust, Series 2020-1, Class C, 2.36% 202611 | | | 1,273 | | | | 1,272 | |
| Drivetime Auto Owner Trust, Series 2019-3, Class C, 2.74% 20256,11 | | | 16 | | | | 16 | |
| Dryden Senior Loan Fund, CLO, Series 2017-47A, Class A1R, (3-month USD-LIBOR + 0.98%) 2.024% 20286,11,12 | | | 5,382 | | | | 5,306 | |
| EDvestinU Private Education Loan, LLC, Series 2021-A, Class A, 1.80% 20456,11 | | | 380 | | | | 338 | |
| Enterprise Fleet Financing, LLC, Series 2022-1, Class A2, 3.03% 20286,11 | | | 6,605 | | | | 6,491 | |
| FirstKey Homes Trust, Series 2020-SFR2, Class A, 1.266% 20376,11 | | | 6,023 | | | | 5,552 | |
| Ford Credit Auto Owner Trust, Series 2018-2, Class A, 3.47% 20306,11 | | | 4,825 | | | | 4,811 | |
| Ford Credit Auto Owner Trust, Series 2018-1, Class A, 3.52% 20306,11 | | | 6,000 | | | | 5,980 | |
| Ford Credit Auto Owner Trust, Series 2020-1, Class A, 2.04% 20316,11 | | | 8,861 | | | | 8,478 | |
| Ford Credit Auto Owner Trust, Series 2018-1, Class A, 3.19% 20316,11 | | | 9,605 | | | | 9,457 | |
| GCI Funding I, LLC, Series 2020-1, Class A, 2.82% 20456,11 | | | 765 | | | | 707 | |
| GCI Funding I, LLC, Series 2020-1, Class B, 3.81% 20456,11 | | | 308 | | | | 285 | |
| Global SC Finance V SRL, Series 2019-1A, Class B, 4.81% 20396,11 | | | 2,657 | | | | 2,568 | |
| Global SC Finance V SRL, Series 2020-1A, Class A, 2.17% 20406,11 | | | 11,017 | | | | 10,100 | |
| Global SC Finance VII SRL, Series 2020-2A, Class A, 2.26% 20406,11 | | | 13,797 | | | | 12,635 | |
| Global SC Finance VII SRL, Series 2021-1A, Class A, 1.86% 20416,11 | | | 4,279 | | | | 3,815 | |
| Global SC Finance VII SRL, Series 2021-2A, Class A, 1.95% 20416,11 | | | 6,372 | | | | 5,692 | |
| Global SC Finance VII SRL, Series 2021-2A, Class B, 2.49% 20416,11 | | | 504 | | | | 444 | |
| Hertz Vehicle Financing III, LLC, Series 2021-A, Class B, 3.65% 20233,4,6,11 | | | 5,930 | | | | 5,755 | |
| Hertz Vehicle Financing III, LLC, Series 2021-1A, Class A, 1.21% 20256,11 | | | 8,452 | | | | 7,914 | |
| Hertz Vehicle Financing III, LLC, Series 2021-1A, Class B, 1.56% 20256,11 | | | 634 | | | | 587 | |
| 134 | American Funds Insurance Series |
Asset Allocation Fund (continued)
| Bonds, notes & other debt instruments (continued) | | Principal amount
(000) | | | Value
(000) | |
| Asset-backed obligations (continued) | | | | | | | | |
| Hertz Vehicle Financing III, LLC, Series 2021-1A, Class C, 2.05% 20256,11 | | USD | 405 | | | $ | 374 | |
| Hertz Vehicle Financing III, LLC, Series 2022-4A, Class A, 3.73% 20266,11 | | | 8,390 | | | | 8,242 | |
| Hertz Vehicle Financing III, LLC, Series 2021-2A, Class A, 1.68% 20276,11 | | | 9,163 | | | | 8,097 | |
| Hertz Vehicle Financing III, LLC, Series 2021-2A, Class B, 2.12% 20276,11 | | | 685 | | | | 606 | |
| Hertz Vehicle Financing III, LLC, Series 2021-2A, Class C, 2.52% 20276,11 | | | 429 | | | | 376 | |
| Hertz Vehicle Financing III, LLC, Series 2022-2A, Class A, 2.33% 20286,11 | | | 8,400 | | | | 7,621 | |
| Hertz Vehicle Financing III, LLC, Series 2022-5A, Class A, 3.89% 20286,11 | | | 8,750 | | | | 8,454 | |
| Honda Auto Receivables Owner Trust, Series 2019-2, Class A3, 2.52% 202311 | | | 265 | | | | 265 | |
| Longfellow Place CLO, Ltd., Series 2013-1A, Class AR3, (3-month USD-LIBOR + 1.00%) 2.044% 20296,11,12 | | | 1,745 | | | | 1,733 | |
| Madison Park Funding, Ltd., CLO, Series 2015-17A, Class AR2, (3-month USD-LIBOR + 1.00%) 2.098% 20306,11,12 | | | 5,545 | | | | 5,465 | |
| Marathon CLO, Ltd., Series 2017-9A, Class A1AR, (3-month USD-LIBOR + 1.15%) 2.194% 20296,11,12 | | | 2,659 | | | | 2,626 | |
| Mercury Financial Credit Card Master Trust, Series 2021-1A, Class A, 1.54% 20266,11 | | | 4,700 | | | | 4,474 | |
| Mission Lane Credit Card Master Trust, Series 2021-A, Class A, 1.59% 20266,11 | | | 1,900 | | | | 1,831 | |
| Navient Student Loan Trust, Series 2021-C, Class A, 1.06% 20696,11 | | | 5,551 | | | | 5,119 | |
| Navient Student Loan Trust, Series 2021-G, Class A, 1.58% 20706,11 | | | 6,389 | | | | 5,656 | |
| Navigator Aircraft ABS, Ltd., Series 2021-1, Class A, 2.771% 20466,11 | | | 6,588 | | | | 5,880 | |
| Nelnet Student Loan Trust, Series 2021-C, Class AFX, 1.32% 20626,11 | | | 11,925 | | | | 10,963 | |
| Nelnet Student Loan Trust, Series 2021-A, Class APT1, 1.36% 20626,11 | | | 6,594 | | | | 6,105 | |
| Nelnet Student Loan Trust, Series 2021-B, Class AFX, 1.42% 20626,11 | | | 11,169 | | | | 10,363 | |
| New Economy Assets Phase 1 Issuer, LLC, Series 2021-1, Class A1, 1.91% 20616,11 | | | 23,051 | | | | 20,148 | |
| Newark BSL CLO 2, Ltd., Series 2017-1A, Class A1R, (3-month USD-LIBOR + 0.97%) 2.154% 20306,11,12 | | | 1,765 | | | | 1,740 | |
| Palmer Square Loan Funding, CLO, Series 2020-4, Class A1, (3-month USD-LIBOR + 1.00%) 2.524% 20286,11,12 | | | 1,645 | | | | 1,634 | |
| Palmer Square Loan Funding, CLO, Series 2021-4A, Class A1, (3-month USD-LIBOR + 0.80%) 1.844% 20296,11,12 | | | 9,142 | | | | 8,992 | |
| Palmer Square Loan Funding, CLO, Series 2021-1, Class A1, (3-month USD-LIBOR + 0.90%) 1.963% 20296,11,12 | | | 500 | | | | 494 | |
| Palmer Square Loan Funding, CLO, Series 2021-4A, Class A2, (3-month USD-LIBOR + 1.40%) 2.444% 20296,11,12 | | | 5,378 | | | | 5,209 | |
| PG&E Wildfire Recovery Funding, LLC, Series 2022-A, Class A2, 4.263% 203611 | | | 2,725 | | | | 2,745 | |
| Race Point CLO, Ltd., Series 2015-9A, Class A1A2, (3-month USD-LIBOR + 0.94%) 1.984% 20306,11,12 | | | 4,634 | | | | 4,558 | |
| Santander Drive Auto Receivables Trust, Series 2020-1, Class B, 3.03% 202411 | | | 55 | | | | 55 | |
| Santander Drive Auto Receivables Trust, Series 2020-1, Class C, 4.11% 202511 | | | 1,000 | | | | 1,001 | |
| SMB Private Education Loan Trust, Series 2021-A, Class A2A2, (1-month USD-LIBOR + 0.73%) 2.054% 20536,11,12 | | | 7,530 | | | | 7,325 | |
| SOLRR Aircraft Aviation Holding, Ltd., Series 2021-1, Class A, 2.636% 20466,11 | | | 3,575 | | | | 3,262 | |
| Sound Point CLO, Ltd., Series 2015-1RA, Class AR, (3-month USD-LIBOR + 1.08%) 2.124% 20306,11,12 | | | 2,985 | | | | 2,947 | |
| Sprite, Ltd., Series 2021-1, Class A, 3.75% 20466,11 | | | 5,063 | | | | 4,590 | |
| Stellar Jay Ireland DAC, Series 2021-1, Class A, 3.967% 20416,11 | | | 4,796 | | | | 4,281 | |
| Stonepeak Infrastructure Partners, Series 2021-1A, Class AA, 2.301% 20336,11 | | | 2,639 | | | | 2,464 | |
| Stonepeak Infrastructure Partners, Series 2021-1A, Class A, 2.675% 20336,11 | | | 2,167 | | | | 1,986 | |
| SuttonPark Structured Settlements, Series 2021-1, Class A, 1.95% 20756,11 | | | 3,687 | | | | 3,434 | |
| TAL Advantage V, LLC, Series 2020-1A, Class A, 2.05% 20456,11 | | | 1,945 | | | | 1,767 | |
| Textainer Marine Containers, Ltd., Series 2020-2A, Class A, 2.10% 20456,11 | | | 852 | | | | 773 | |
| Textainer Marine Containers, Ltd., Series 2021-1A, Class A, 1.68% 20466,11 | | | 968 | | | | 846 | |
| Textainer Marine Containers, Ltd., Series 2021-2A, Class A, 2.23% 20466,11 | | | 4,624 | | | | 4,119 | |
| Toyota Auto Loan Extended Note Trust, Series 2019-1, Class A, 2.56% 20316,11 | | | 3,250 | | | | 3,181 | |
| Toyota Auto Loan Extended Note Trust, Series 2020-1, Class A, 1.35% 20336,11 | | | 889 | | | | 828 | |
| Toyota Auto Loan Extended Note Trust, Series 2021-1, Class A, 1.07% 20346,11,12 | | | 7,257 | | | | 6,579 | |
| Triton Container Finance VIII, LLC, Series 2020-1, Class A, 2.11% 20456,11 | | | 10,888 | | | | 9,705 | |
| Triton Container Finance VIII, LLC, Series 2021-1, Class A, 1.86% 20466,11 | | | 2,941 | | | | 2,573 | |
| | | | | | | | 363,883 | |
| American Funds Insurance Series | 135 |
Asset Allocation Fund (continued)
| Bonds, notes & other debt instruments (continued) | | Principal amount
(000) | | | Value
(000) | |
| Bonds & notes of governments & government agencies outside the U.S. 0.16% | | | | | | | | |
| CPPIB Capital, Inc. 2.75% 20276 | | USD | 6,600 | | | $ | 6,411 | |
| European Investment Bank 0.75% 2026 | | | 6,194 | | | | 5,605 | |
| OMERS Finance Trust 3.50% 20326 | | | 4,315 | | | | 4,216 | |
| OMERS Finance Trust 4.00% 20526 | | | 4,315 | | | | 4,046 | |
| Panama (Republic of) 3.298% 2033 | | | 4,365 | | | | 3,740 | |
| Panama (Republic of) 4.50% 2063 | | | 1,035 | | | | 799 | |
| Peru (Republic of) 1.862% 2032 | | | 2,525 | | | | 1,920 | |
| Peru (Republic of) 2.78% 2060 | | | 3,775 | | | | 2,346 | |
| Qatar (State of) 3.375% 20246 | | | 2,315 | | | | 2,310 | |
| Qatar (State of) 4.00% 20296 | | | 745 | | | | 753 | |
| Qatar (State of) 4.817% 20496 | | | 750 | | | | 757 | |
| Saudi Arabia (Kingdom of) 3.25% 20306 | | | 1,750 | | | | 1,649 | |
| Saudi Arabia (Kingdom of) 5.25% 20506 | | | 1,000 | | | | 1,020 | |
| United Mexican States 2.659% 2031 | | | 2,703 | | | | 2,231 | |
| United Mexican States 3.771% 2061 | | | 1,528 | | | | 995 | |
| | | | | | | | 38,798 | |
| | | | | | | | | |
| Municipals 0.15% | | | | | | | | |
| California 0.02% | | | | | | | | |
| Golden State Tobacco Securitization Corp., Enhanced Tobacco Settlement Asset-Backed Bonds, Series 2021-A-1, 2.158% 2026 | | | 1,200 | | | | 1,117 | |
| Golden State Tobacco Securitization Corp., Enhanced Tobacco Settlement Asset-Backed Bonds, Series 2021-A-1, 2.332% 2027 | | | 1,660 | | | | 1,521 | |
| Golden State Tobacco Securitization Corp., Enhanced Tobacco Settlement Asset-Backed Bonds, Series 2021-B, 2.746% 2034 | | | 495 | | | | 428 | |
| Golden State Tobacco Securitization Corp., Enhanced Tobacco Settlement Asset-Backed Bonds, Series 2021-B, 3.293% 2042 | | | 1,170 | | | | 947 | |
| Golden State Tobacco Securitization Corp., Enhanced Tobacco Settlement Asset-Backed Bonds, Series 2021-B, 3.00% 2046 | | | 2,470 | | | | 2,173 | |
| | | | | | | | 6,186 | |
| | | | | | | | | |
| Connecticut 0.00% | | | | | | | | |
| Housing Fin. Auth., Housing Mortgage Fin. Program Bonds, Series 2014-C-1, 4.00% 2044 | | | 15 | | | | 15 | |
| Housing Fin. Auth., Housing Mortgage Fin. Program Bonds, Series 2014-A-1, 4.00% 2044 | | | 5 | | | | 5 | |
| | | | | | | | 20 | |
| | | | | | | | | |
| Florida 0.04% | | | | | | | | |
| Board of Administration Fin. Corp., Rev. Bonds, Series 2020-A, 1.705% 2027 | | | 5,335 | | | | 4,830 | |
| Board of Administration Fin. Corp., Rev. Bonds, Series 2020-A, 2.154% 2030 | | | 5,365 | | | | 4,667 | |
| | | | | | | | 9,497 | |
| | | | | | | | | |
| Guam 0.00% | | | | | | | | |
| A.B. Won Pat International Airport Auth., General Rev. Bonds, Series 2021-A, 3.839% 2036 | | | 240 | | | | 212 | |
| A.B. Won Pat International Airport Auth., General Rev. Bonds, Series 2021-A, 4.46% 2043 | | | 315 | | | | 273 | |
| | | | | | | | 485 | |
| | | | | | | | | |
| Illinois 0.02% | | | | | | | | |
| G.O. Bonds, Pension Funding, Series 2003, Assured Guaranty Municipal insured, 5.10% 2033 | | | 4,125 | | | | 4,208 | |
| | | | | | | | | |
| Maryland 0.00% | | | | | | | | |
| Community Dev. Administration, Dept. of Housing and Community Dev., Residential Rev. Ref. Bonds, Series 2014-E, 2.857% 2040 | | | 15 | | | | 15 | |
| 136 | American Funds Insurance Series |
Asset Allocation Fund (continued)
| Bonds, notes & other debt instruments (continued) | | Principal amount
(000) | | | Value
(000) | |
| Municipals (continued) | | | | | | | | |
| Minnesota 0.00% | | | | | | | | |
| Housing Fin. Agcy., Residential Housing Fin. Bonds, Series 2014-A, 4.00% 2038 | | USD | 40 | | | $ | 41 | |
| | | | | | | | | |
| Nebraska 0.00% | | | | | | | | |
| Investment Fin. Auth., Single Family Housing Rev. Bonds, Series 2013-A, 3.00% 2043 | | | 5 | | | | 5 | |
| | | | | | | | | |
| New York 0.03% | | | | | | | | |
| Dormitory Auth., Taxable State Personal Income Tax Rev. Bonds (General Purpose), Series 2021-C, 1.187% 2026 | | | 2,865 | | | | 2,621 | |
| Dormitory Auth., Taxable State Personal Income Tax Rev. Bonds (General Purpose), Series 2021-C, 1.748% 2028 | | | 4,745 | | | | 4,223 | |
| | | | | | | | 6,844 | |
| | | | | | | | | |
| Ohio 0.02% | | | | | | | | |
| Cleveland-Cuyahoga Port Auth., Federal Lease Rev. Bonds (VA Cleveland Health Care Center Project), Series 2021, 4.425% 2031 | | | 5,140 | | | | 4,820 | |
| | | | | | | | | |
| South Carolina 0.00% | | | | | | | | |
| Housing Fin. Auth., Mortgage Rev. Ref. Bonds, Series 2014, AMT, 4.00% 2041 | | | 10 | | | | 10 | |
| | | | | | | | | |
| South Dakota 0.00% | | | | | | | | |
| Housing Dev. Auth., Homeownership Mortgage Bonds, Series 2014-F, 4.00% 2034 | | | 5 | | | | 5 | |
| | | | | | | | | |
| Tennessee 0.00% | | | | | | | | |
| Housing Dev. Agcy., Residential Fin. Program Bonds, Series 2013-2-A, AMT, 4.00% 2043 | | | 5 | | | | 5 | |
| | | | | | | | | |
| Wisconsin 0.02% | | | | | | | | |
| Public Fin. Auth., Federal Lease Rev. Bonds (Fort Sam Acquisition Fncg.), Series 2022, 4.95% 2034 | | | 5,885 | | | | 5,577 | |
| | | | | | | | | |
| Total municipals | | | | | | | 37,718 | |
| | | | | | | | | |
| Total bonds, notes & other debt instruments (cost: $6,006,118,000) | | | | | | | 5,625,550 | |
| | | | | | | | | |
| Short-term securities 9.60% | | | Shares | | | | | |
| Money market investments 9.40% | | | | | | | | |
| Capital Group Central Cash Fund 1.38%8,18 | | | 23,469,371 | | | | 2,346,468 | |
| | | | | | | | | |
| Money market investments purchased with collateral from securities on loan 0.20% | | | | | | | | |
| Capital Group Central Cash Fund 1.38%8,18,19 | | | 141,112 | | | | 14,109 | |
| Goldman Sachs Financial Square Government Fund, Institutional Shares 1.39%18,19 | | | 7,449,054 | | | | 7,449 | |
| BlackRock Liquidity Funds – FedFund, Institutional Shares 1.32%18,19 | | | 7,054,176 | | | | 7,054 | |
| American Funds Insurance Series | 137 |
Asset Allocation Fund (continued)
| Short-term securities (continued) | | Shares | | | Value
(000) | |
| Money market investments purchased with collateral from securities on loan (continued) | | | | | | | | |
| Invesco Short-Term Investments Trust – Government & Agency Portfolio, Institutional Class 1.38%18,19 | | | 7,054,175 | | | $ | 7,054 | |
| Morgan Stanley Institutional Liquidity Funds – Government Portfolio, Institutional Class 1.38%18,19 | | | 7,054,175 | | | | 7,054 | |
| State Street Institutional U.S. Government Money Market Fund, Institutional Class 1.40%18,19 | | | 7,054,175 | | | | 7,054 | |
| | | | | | | | 49,774 | |
| | | | | | | | | |
| Total short-term securities (cost: $2,396,504,000) | | | | | | | 2,396,242 | |
| Total investment securities 104.82% (cost: $22,507,741,000) | | | | | | | 26,167,099 | |
| Other assets less liabilities (4.82)% | | | | | | | (1,202,094 | ) |
| | | | | | | | | |
| Net assets 100.00% | | | | | | $ | 24,965,005 | |
Futures contracts
| Contracts | | Type | | Number of
contracts | | Expiration | | Notional
amount
(000) | | | Value and
unrealized
appreciation
(depreciation)
at 6/30/2022
(000) | |
| 2 Year U.S. Treasury Note Futures | | Long | | 2,307 | | September 2022 | | USD | 484,506 | | | | $ | 2,968 | |
| 5 Year U.S. Treasury Note Futures | | Short | | 348 | | September 2022 | | | (39,063 | ) | | | | (174 | ) |
| 10 Year U.S. Treasury Note Futures | | Short | | 699 | | September 2022 | | | (82,853 | ) | | | | 1,080 | |
| 10 Year Ultra U.S. Treasury Note Futures | | Short | | 3,135 | | September 2022 | | | (399,321 | ) | | | | 2,171 | |
| 20 Year U.S. Treasury Bond Futures | | Long | | 1,460 | | September 2022 | | | 202,393 | | | | | (3,327 | ) |
| 30 Year Ultra U.S. Treasury Bond Futures | | Short | | 311 | | September 2022 | | | (48,001 | ) | | | | 1,392 | |
| | | | | | | | | | | | | | $ | 4,110 | |
Swap contracts
Credit default swaps
Centrally cleared credit default swaps on credit indices — buy protection
| | | | | | | | | | | | | | Upfront | | | Unrealized | |
| | | | | | | | | Notional | | Value at | | | premium | | | appreciation | |
| Reference | | Financing | | Payment | | Expiration | | amount | | 6/30/2022 | | | received | | | at 6/30/2022 | |
| index | | rate paid | | frequency | | date | | (000) | | (000) | | | (000) | | | (000) | |
| CDX.NA.IG.38 | | 1.00% | | Quarterly | | 6/20/2027 | | USD191,572 | | | $88 | | | | $(1,760 | ) | | | $1,848 | |
Investments in affiliates8
| | | Value of
affiliates at
1/1/2022
(000) | | | Additions
(000) | | | Reductions
(000) | | | Net
realized
loss
(000) | | | Net
unrealized
appreciation
(depreciation)
(000) | | | Value of
affiliates at
6/30/2022
(000) | | | Dividend
income
(000) | |
| Common stocks 0.00% | | | | | | | | | | | | | | | | | | | | | | | | | | | | |
| Health care 0.00% | | | | | | | | | | | | | | | | | | | | | | | | | | | | |
| NuCana PLC (ADR)1,20 | | $ | 7,086 | | | $ | — | | | $ | 2,674 | | | $ | (14,288 | ) | | $ | 9,876 | | | $ | — | | | $ | — | |
| Investment funds 5.58% | | | | | | | | | | | | | | | | | | | | | | | | | | | | |
| Capital Group Central Corporate Bond Fund | | | 1,617,261 | | | | 20,332 | | | | — | | | | — | | | | (243,853 | ) | | | 1,393,740 | | | | 20,332 | |
| 138 | American Funds Insurance Series |
Asset Allocation Fund (continued)
Investments in affiliates8 (continued)
| | | Value of
affiliates at
1/1/2022
(000) | | | Additions
(000) | | | Reductions
(000) | | | Net
realized
loss
(000) | | | Net
unrealized
appreciation
(depreciation)
(000) | | | Value of
affiliates at
6/30/2022
(000) | | | Dividend
income
(000) | |
| Short-term securities 9.46% | | | | | | | | | | | | | | | | | | | | | | | | | | | | |
| Money market investments 9.40% | | | | | | | | | | | | | | | | | | | | | | | | | | | | |
| Capital Group Central Cash Fund 1.38%18 | | $ | 1,417,334 | | | $ | 2,594,892 | | | $ | 1,665,138 | | | $ | (73 | ) | | $ | (547 | ) | | $ | 2,346,468 | | | $ | 4,686 | |
| Money market investments purchased with collateral from securities on loan 0.06% | | | | | | | | | | | | | | | | | | | | | | | | | | | | |
| Capital Group Central Cash Fund 1.38%18,19 | | | 8,492 | | | | 5,617 | 21 | | | | | | | | | | | | | | | 14,109 | | | | — | 22 |
| Total short-term securities | | | | | | | | | | | | | | | | | | | | | | | 2,360,577 | | | | | |
| Total 15.04% | | | | | | | | | | | | | | $ | (14,361 | ) | | $ | (234,524 | ) | | $ | 3,754,317 | | | $ | 25,018 | |
Private placement securities5
| | | Acquisition
date | | Cost
(000) | | | Value
(000) | | | Percent
of net
assets | |
| Carbon Health Technologies, Inc., convertible preferred shares, 1.00% 2024 | | 7/9/2021 | | $ | 50,000 | | | $ | 50,000 | | | | .20 | % |
| Rotech Healthcare, Inc. | | 9/26/2013 | | | 6,949 | | | | 18,782 | | | | .08 | |
| Total | | | | $ | 56,949 | | | $ | 68,782 | | | | .28 | % |
| | |
| 1 | Security did not produce income during the last 12 months. |
| 2 | All or a portion of this security was on loan. The total value of all such securities was $53,318,000, which represented .21% of the net assets of the fund. Refer to Note 5 for more information on securities lending. |
| 3 | Valued under fair value procedures adopted by authority of the board of trustees. The total value of all such securities was $82,826,000, which represented .33% of the net assets of the fund. |
| 4 | Value determined using significant unobservable inputs. |
| 5 | Acquired through a private placement transaction exempt from registration under the Securities Act of 1933. May be subject to legal or contractual restrictions on resale. |
| 6 | Acquired in a transaction exempt from registration under Rule 144A of the Securities Act of 1933. May be resold in the U.S. in transactions exempt from registration, normally to qualified institutional buyers. The total value of all such securities was $1,138,626,000, which represented 4.56% of the net assets of the fund. |
| 7 | Amount less than one thousand. |
| 8 | Affiliate of the fund or part of the same “group of investment companies” as the fund, as defined under the Investment Company Act of 1940, as amended. |
| 9 | All or a portion of this security was pledged as collateral. The total value of pledged collateral was $29,059,000, which represented .12% of the net assets of the fund. |
| 10 | Index-linked bond whose principal amount moves with a government price index. |
| 11 | Principal payments may be made periodically. Therefore, the effective maturity date may be earlier than the stated maturity date. |
| 12 | Coupon rate may change periodically. Reference rate and spread are as of the most recent information available. Some coupon rates are determined by the issuer or agent based on current market conditions; therefore, the reference rate and spread are not available. |
| 13 | Purchased on a TBA basis. |
| 14 | Step bond; coupon rate may change at a later date. |
| 15 | Loan participations and assignments; may be subject to legal or contractual restrictions on resale. The total value of all such loans was $12,524,000, which represented .05% of the net assets of the fund. |
| 16 | Scheduled interest and/or principal payment was not received. |
| 17 | Payment in kind; the issuer has the option of paying additional securities in lieu of cash. Payment methods and rates are as of the most recent payment when available. |
| 18 | Rate represents the seven-day yield at 6/30/2022. |
| 19 | Security purchased with cash collateral from securities on loan. Refer to Note 5 for more information on securities lending. |
| 20 | Affiliated issuer during the reporting period but no longer held at 6/30/2022. |
| 21 | Represents net activity. Refer to Note 5 for more information on securities lending. |
| 22 | Dividend income is included with securities lending income in the fund’s statement of operations and is not shown in this table. |
| American Funds Insurance Series | 139 |
Asset Allocation Fund (continued)
Key to abbreviations
ADR = American Depositary Receipts
Agcy. = Agency
AMT = Alternative Minimum Tax
Assn. = Association
Auth. = Authority
CAD = Canadian dollars
CLO = Collateralized Loan Obligations
CME = CME Group
CMO = Collateralized Mortgage Obligations
DAC = Designated Activity Company
Dept. = Department
Dev. = Development
Fin. = Finance
Fncg. = Financing
G.O. = General Obligation
LIBOR = London Interbank Offered Rate
Ref. = Refunding
REIT = Real Estate Investment Trust
Rev. = Revenue
SOFR = Secured Overnight Financing Rate
TBA = To be announced
USD = U.S. dollars
Refer to the notes to financial statements.
| 140 | American Funds Insurance Series |
| American Funds Global Balanced Fund | |
| (formerly Global Balanced Fund) | |
| Investment portfolio June 30, 2022 | unaudited |
| Common stocks 57.98% | | Shares | | | Value
(000) | |
| Financials 9.06% | | | | | | | | |
| B3 SA-Brasil, Bolsa, Balcao | | | 2,155,801 | | | $ | 4,515 | |
| Zurich Insurance Group AG | | | 9,057 | | | | 3,939 | |
| DNB Bank ASA | | | 157,370 | | | | 2,821 | |
| Toronto-Dominion Bank (CAD denominated) | | | 32,930 | | | | 2,159 | |
| ING Groep NV | | | 218,488 | | | | 2,159 | |
| PNC Financial Services Group, Inc. | | | 12,445 | | | | 1,963 | |
| Tradeweb Markets, Inc., Class A | | | 26,076 | | | | 1,780 | |
| Kotak Mahindra Bank, Ltd. | | | 82,308 | | | | 1,731 | |
| Citigroup, Inc. | | | 31,974 | | | | 1,470 | |
| AIA Group, Ltd. | | | 130,600 | | | | 1,416 | |
| Housing Development Finance Corp., Ltd. | | | 45,344 | | | | 1,246 | |
| HDFC Bank, Ltd. | | | 70,602 | | | | 1,205 | |
| BNP Paribas SA | | | 13,671 | | | | 650 | |
| JPMorgan Chase & Co. | | | 5,741 | | | | 647 | |
| Nasdaq, Inc. | | | 3,936 | | | | 600 | |
| Tryg A/S | | | 26,250 | | | | 589 | |
| Bank Central Asia Tbk PT | | | 1,201,700 | | | | 585 | |
| Aegon NV1 | | | 132,576 | | | | 574 | |
| Ping An Insurance (Group) Company of China, Ltd., Class H | | | 70,500 | | | | 479 | |
| Ping An Insurance (Group) Company of China, Ltd., Class A | | | 11,200 | | | | 78 | |
| Banco Santander, SA | | | 187,371 | | | | 528 | |
| CME Group, Inc., Class A | | | 2,404 | | | | 492 | |
| Münchener Rückversicherungs-Gesellschaft AG | | | 2,026 | | | | 476 | |
| KBC Groep NV | | | 8,458 | | | | 475 | |
| Swedbank AB, Class A | | | 30,035 | | | | 380 | |
| FinecoBank SpA | | | 28,303 | | | | 339 | |
| Fairfax Financial Holdings, Ltd., subordinate voting shares | | | 551 | | | | 292 | |
| Lufax Holding, Ltd. (ADR) | | | 47,602 | | | | 286 | |
| Allfunds Group PLC | | | 18,078 | | | | 139 | |
| | | | | | | | 34,013 | |
| | | | | | | | | |
| Health care 7.83% | | | | | | | | |
| Abbott Laboratories | | | 75,002 | | | | 8,149 | |
| Novartis AG | | | 30,322 | | | | 2,568 | |
| Siemens Healthineers AG | | | 48,353 | | | | 2,457 | |
| UnitedHealth Group, Inc. | | | 4,765 | | | | 2,447 | |
| Thermo Fisher Scientific, Inc. | | | 3,503 | | | | 1,903 | |
| Gilead Sciences, Inc. | | | 28,817 | | | | 1,781 | |
| AstraZeneca PLC | | | 13,160 | | | | 1,730 | |
| Merck KGaA | | | 8,544 | | | | 1,442 | |
| PerkinElmer, Inc. | | | 9,013 | | | | 1,282 | |
| AbbVie, Inc. | | | 7,420 | | | | 1,137 | |
| Medtronic PLC | | | 11,719 | | | | 1,052 | |
| Amgen, Inc. | | | 3,544 | | | | 862 | |
| Stryker Corp. | | | 4,289 | | | | 853 | |
| BioMarin Pharmaceutical, Inc.2 | | | 7,114 | | | | 590 | |
| Humana, Inc. | | | 1,257 | | | | 588 | |
| Bayer AG | | | 9,217 | | | | 548 | |
| | | | | | | | 29,389 | |
| | | | | | | | | |
| Industrials 7.76% | | | | | | | | |
| Raytheon Technologies Corp. | | | 74,921 | | | | 7,201 | |
| BAE Systems PLC | | | 251,418 | | | | 2,541 | |
| General Electric Co. | | | 37,623 | | | | 2,395 | |
| General Dynamics Corp. | | | 8,844 | | | | 1,957 | |
| Carrier Global Corp. | | | 51,285 | | | | 1,829 | |
| VINCI SA | | | 16,433 | | | | 1,463 | |
| RELX PLC | | | 49,296 | | | | 1,336 | |
| Siemens AG | | | 12,400 | | | | 1,262 | |
| Kingspan Group PLC | | | 20,469 | | | | 1,231 | |
| Thales SA | | | 9,837 | | | | 1,207 | |
| American Funds Insurance Series | 141 |
American Funds Global Balanced Fund (continued)
(formerly Global Balanced Fund)
| Common stocks (continued) | | Shares | | | Value
(000) | |
| Industrials (continued) | | | | | | | | |
| Honeywell International, Inc. | | | 6,933 | | | $ | 1,205 | |
| CSX Corp. | | | 39,937 | | | | 1,160 | |
| LIXIL Corp. | | | 57,300 | | | | 1,073 | |
| SMC Corp. | | | 2,100 | | | | 936 | |
| Safran SA | | | 4,779 | | | | 472 | |
| L3Harris Technologies, Inc. | | | 1,234 | | | | 298 | |
| Melrose Industries PLC | | | 156,807 | | | | 286 | |
| Airbus SE, non-registered shares | | | 2,836 | | | | 275 | |
| Lockheed Martin Corp. | | | 609 | | | | 262 | |
| NIBE Industrier AB, Class B | | | 33,720 | | | | 253 | |
| Bureau Veritas SA | | | 8,207 | | | | 210 | |
| DSV A/S | | | 1,312 | | | | 183 | |
| Ryanair Holdings PLC (ADR)2 | | | 1,300 | | | | 87 | |
| | | | | | | | 29,122 | |
| | | | | | | | | |
| Information technology 7.44% | | | | | | | | |
| Microsoft Corp. | | | 33,242 | | | | 8,537 | |
| Broadcom, Inc. | | | 17,541 | | | | 8,522 | |
| Micron Technology, Inc. | | | 46,889 | | | | 2,592 | |
| Apple, Inc. | | | 14,528 | | | | 1,986 | |
| Taiwan Semiconductor Manufacturing Company, Ltd. | | | 103,000 | | | | 1,649 | |
| GlobalWafers Co., Ltd. | | | 90,000 | | | | 1,371 | |
| Adobe, Inc.2 | | | 3,492 | | | | 1,278 | |
| ServiceNow, Inc.2 | | | 2,335 | | | | 1,110 | |
| Accenture PLC, Class A | | | 3,181 | | | | 883 | |
| | | | | | | | 27,928 | |
| | | | | | | | | |
| Utilities 5.51% | | | | | | | | |
| DTE Energy Company | | | 32,874 | | | | 4,167 | |
| National Grid PLC | | | 191,463 | | | | 2,452 | |
| Power Grid Corporation of India, Ltd. | | | 884,910 | | | | 2,374 | |
| NextEra Energy, Inc. | | | 30,640 | | | | 2,373 | |
| E.ON SE | | | 281,377 | | | | 2,361 | |
| Duke Energy Corp. | | | 17,632 | | | | 1,890 | |
| Public Service Enterprise Group, Inc. | | | 23,120 | | | | 1,463 | |
| Dominion Energy, Inc. | | | 14,973 | | | | 1,195 | |
| ENN Energy Holdings, Ltd. | | | 67,300 | | | | 1,106 | |
| Iberdrola, SA, non-registered shares | | | 80,267 | | | | 833 | |
| Enel SpA | | | 87,509 | | | | 479 | |
| | | | | | | | 20,693 | |
| | | | | | | | | |
| Consumer staples 5.12% | | | | | | | | |
| Nestlé SA | | | 37,614 | | | | 4,391 | |
| Philip Morris International, Inc. | | | 37,743 | | | | 3,727 | |
| ITC, Ltd. | | | 993,677 | | | | 3,441 | |
| Imperial Brands PLC | | | 101,076 | | | | 2,259 | |
| British American Tobacco PLC | | | 28,823 | | | | 1,235 | |
| Pernod Ricard SA | | | 5,944 | | | | 1,092 | |
| Heineken NV | | | 10,102 | | | | 921 | |
| Altria Group, Inc. | | | 15,371 | | | | 642 | |
| Inner Mongolia Yili Industrial Group Co., Ltd., Class A | | | 109,000 | | | | 634 | |
| Treasury Wine Estates, Ltd. | | | 42,600 | | | | 334 | |
| Kweichow Moutai Co., Ltd., Class A | | | 1,021 | | | | 312 | |
| Davide Campari-Milano NV | | | 21,508 | | | | 226 | |
| | | | | | | | 19,214 | |
| 142 | American Funds Insurance Series |
American Funds Global Balanced Fund (continued)
(formerly Global Balanced Fund)
| Common stocks (continued) | | Shares | | | Value
(000) | |
| Communication services 3.67% | | | | | | | | |
| Comcast Corp., Class A | | | 108,820 | | | $ | 4,270 | |
| Alphabet, Inc., Class A2 | | | 1,325 | | | | 2,887 | |
| Alphabet, Inc., Class C2 | | | 435 | | | | 952 | |
| Netflix, Inc.2 | | | 8,391 | | | | 1,467 | |
| BCE, Inc. | | | 23,357 | | | | 1,148 | |
| Omnicom Group, Inc. | | | 11,276 | | | | 717 | |
| Universal Music Group NV | | | 33,143 | | | | 665 | |
| SoftBank Corp. | | | 58,600 | | | | 651 | |
| Meta Platforms, Inc., Class A2 | | | 3,285 | | | | 530 | |
| Electronic Arts, Inc. | | | 4,197 | | | | 510 | |
| | | | | | | | 13,797 | |
| | | | | | | | | |
| Energy 3.50% | | | | | | | | |
| Canadian Natural Resources, Ltd. (CAD denominated)1 | | | 106,085 | | | | 5,701 | |
| Neste OYJ | | | 44,747 | | | | 1,981 | |
| Shell PLC (GBP denominated) | | | 57,460 | | | | 1,493 | |
| Chevron Corp. | | | 8,464 | | | | 1,225 | |
| BP PLC | | | 197,492 | | | | 933 | |
| TC Energy Corp. (CAD denominated) | | | 12,821 | | | | 664 | |
| Baker Hughes Co., Class A | | | 18,517 | | | | 535 | |
| DT Midstream, Inc. | | | 7,634 | | | | 374 | |
| Woodside Energy Group, Ltd. (CDI)2 | | | 11,841 | | | | 251 | |
| | | | | | | | 13,157 | |
| | | | | | | | | |
| Materials 3.48% | | | | | | | | |
| Freeport-McMoRan, Inc. | | | 91,356 | | | | 2,673 | |
| Linde PLC | | | 6,777 | | | | 1,948 | |
| BHP Group, Ltd. (CDI) | | | 64,727 | | | | 1,810 | |
| Evonik Industries AG | | | 75,312 | | | | 1,607 | |
| Fortescue Metals Group, Ltd. | | | 110,218 | | | | 1,334 | |
| Rio Tinto PLC | | | 21,289 | | | | 1,274 | |
| Vale SA, ordinary nominative shares (ADR) | | | 67,040 | | | | 981 | |
| Shin-Etsu Chemical Co., Ltd. | | | 4,900 | | | | 552 | |
| UPM-Kymmene Oyj | | | 15,780 | | | | 480 | |
| Air Liquide SA, non-registered shares | | | 2,959 | | | | 397 | |
| | | | | | | | 13,056 | |
| | | | | | | | | |
| Consumer discretionary 2.49% | | | | | | | | |
| General Motors Company2 | | | 98,406 | | | | 3,125 | |
| LVMH Moët Hennessy-Louis Vuitton SE | | | 2,533 | | | | 1,544 | |
| Ferrari NV | | | 4,222 | | | | 775 | |
| Ferrari NV (EUR denominated) | | | 1,623 | | | | 298 | |
| InterContinental Hotels Group PLC | | | 13,131 | | | | 695 | |
| Amazon.com, Inc.2 | | | 4,940 | | | | 525 | |
| Astra International Tbk PT | | | 1,106,100 | | | | 492 | |
| Cie. Financière Richemont SA, Class A | | | 4,164 | | | | 443 | |
| Starbucks Corp. | | | 4,927 | | | | 376 | |
| Royal Caribbean Cruises, Ltd.2 | | | 8,753 | | | | 306 | |
| Airbnb, Inc., Class A2 | | | 2,869 | | | | 256 | |
| Ford Motor Co. | | | 22,680 | | | | 252 | |
| Aptiv PLC2 | | | 2,744 | | | | 244 | |
| JD.com, Inc., Class A | | | 1,200 | | | | 39 | |
| | | | | | | | 9,370 | |
| American Funds Insurance Series | 143 |
American Funds Global Balanced Fund (continued)
(formerly Global Balanced Fund)
| Common stocks (continued) | | Shares | | | Value
(000) | |
| Real estate 2.12% | | | | | | | | |
| Crown Castle International Corp. REIT | | | 14,805 | | | $ | 2,493 | |
| Equinix, Inc. REIT | | | 2,715 | | | | 1,784 | |
| Embassy Office Parks REIT | | | 363,682 | | | | 1,723 | |
| CTP NV | | | 78,913 | | | | 910 | |
| Digital Realty Trust, Inc. REIT | | | 4,862 | | | | 631 | |
| Americold Realty Trust, Inc. | | | 13,585 | | | | 408 | |
| | | | | | | | 7,949 | |
| | | | | | | | | |
| Total common stocks (cost: $209,035,000) | | | | | | | 217,688 | |
| | | | | | | | | |
| Preferred securities 0.37% | | | | | | | | |
| Financials 0.37% | | | | | | | | |
| Fannie Mae, Series S, 8.25% noncumulative preferred shares2 | | | 223,000 | | | | 776 | |
| Federal Home Loan Mortgage Corp., Series Z, 8.375% noncumulative preferred shares2 | | | 192,000 | | | | 636 | |
| | | | | | | | | |
| Total preferred securities (cost: $1,545,000) | | | | | | | 1,412 | |
| | | | | | | | | |
| Convertible stocks 0.11% | | | | | | | | |
| Health care 0.11% | | | | | | | | |
| Danaher Corp., Series B, cumulative convertible preferred shares, 5.00% 2023 | | | 300 | | | | 397 | |
| | | | | | | | | |
| Total convertible stocks (cost: $410,000) | | | | | | | 397 | |
| | | | | | | | | |
| Bonds, notes & other debt instruments 36.78% | | Principal amount
(000) | | | | |
| U.S. Treasury bonds & notes 14.46% | | | | | | |
| U.S. Treasury 13.94% | | | | | | | | |
| U.S. Treasury 1.875% 2022 | | USD | 1,810 | | | | 1,810 | |
| U.S. Treasury 2.50% 2023 | | | 1,182 | | | | 1,180 | |
| U.S. Treasury 2.75% 2023 | | | 1,485 | | | | 1,484 | |
| U.S. Treasury 0.375% 2024 | | | 440 | | | | 417 | |
| U.S. Treasury 1.50% 2024 | | | 5,058 | | | | 4,939 | |
| U.S. Treasury 1.50% 2024 | | | 1,300 | | | | 1,256 | |
| U.S. Treasury 2.50% 2024 | | | 995 | | | | 986 | |
| U.S. Treasury 0.25% 2025 | | | 1,004 | | | | 920 | |
| U.S. Treasury 0.375% 2025 | | | 50 | | | | 46 | |
| U.S. Treasury 1.75% 2025 | | | 440 | | | | 425 | |
| U.S. Treasury 2.875% 2025 | | | 1,031 | | | | 1,027 | |
| U.S. Treasury 0.50% 2026 | | | 500 | | | | 456 | |
| U.S. Treasury 0.625% 2026 | | | 500 | | | | 453 | |
| U.S. Treasury 0.75% 2026 | | | 2,075 | | | | 1,906 | |
| U.S. Treasury 0.875% 2026 | | | 500 | | | | 457 | |
| U.S. Treasury 0.875% 2026 | | | 454 | | | | 417 | |
| U.S. Treasury 1.125% 2026 | | | 1,000 | | | | 922 | |
| U.S. Treasury 1.875% 2027 | | | 6,696 | | | | 6,356 | |
| U.S. Treasury 2.25% 2027 | | | 298 | | | | 287 | |
| U.S. Treasury 2.50% 2027 | | | 1,325 | | | | 1,293 | |
| U.S. Treasury 2.75% 2027 | | | 10,830 | | | | 10,683 | |
| U.S. Treasury 2.875% 2028 | | | 1,275 | | | | 1,260 | |
| U.S. Treasury 2.875% 2028 | | | 557 | | | | 550 | |
| U.S. Treasury 0.625% 2030 | | | 2,223 | | | | 1,853 | |
| U.S. Treasury 0.625% 2030 | | | 650 | | | | 538 | |
| U.S. Treasury 1.25% 2031 | | | 575 | | | | 494 | |
| U.S. Treasury 1.375% 2031 | | | 834 | | | | 723 | |
| U.S. Treasury 1.625% 2031 | | | 375 | | | | 335 | |
| U.S. Treasury 1.875% 2032 | | | 3,109 | | | | 2,813 | |
| U.S. Treasury 2.875% 2032 | | | 340 | | | | 336 | |
| U.S. Treasury 1.875% 2041 | | | 920 | | | | 719 | |
| 144 | American Funds Insurance Series |
American Funds Global Balanced Fund (continued)
(formerly Global Balanced Fund)
| Bonds, notes & other debt instruments (continued) | | Principal amount
(000) | | | Value
(000) | |
| U.S. Treasury bonds & notes (continued) | | | | | | | | |
| U.S. Treasury (continued) | | | | | | | | |
| U.S. Treasury 2.25% 2041 | | USD | 525 | | | $ | 436 | |
| U.S. Treasury 2.875% 2046 | | | 400 | | | | 364 | |
| U.S. Treasury 1.25% 2050 | | | 140 | | | | 89 | |
| U.S. Treasury 1.875% 20513 | | | 1,626 | | | | 1,215 | |
| U.S. Treasury 2.00% 20513 | | | 2,396 | | | | 1,844 | |
| U.S. Treasury 2.375% 2051 | | | 490 | | | | 412 | |
| U.S. Treasury 2.25% 2052 | | | 765 | | | | 627 | |
| | | | | | | | 52,328 | |
| | | | | | | | | |
| U.S. Treasury inflation-protected securities 0.52% | | | | | | | | |
| U.S. Treasury Inflation-Protected Security 0.125% 20244 | | | 804 | | | | 812 | |
| U.S. Treasury Inflation-Protected Security 0.125% 20244 | | | 558 | | | | 562 | |
| U.S. Treasury Inflation-Protected Security 0.375% 20274 | | | 357 | | | | 355 | |
| U.S. Treasury Inflation-Protected Security 1.00% 20494 | | | 241 | | | | 231 | |
| | | | | | | | 1,960 | |
| | | | | | | | | |
| Total U.S. Treasury bonds & notes | | | | | | | 54,288 | |
| | | | | | | | | |
| Bonds & notes of governments & government agencies outside the U.S. 14.07% |
| Abu Dhabi (Emirate of) 2.50% 20225 | | | 200 | | | | 200 | |
| Abu Dhabi (Emirate of) 0.75% 20235 | | | 275 | | | | 266 | |
| Agricultural Development Bank of China 3.75% 2029 | | CNY | 550 | | | | 86 | |
| Asian Development Bank 1.125% 2025 | | GBP | 100 | | | | 117 | |
| Australia (Commonwealth of), Series 159, 0.25% 2024 | | AUD | 500 | | | | 324 | |
| Australia (Commonwealth of), Series 139, 3.25% 2025 | | | 875 | | | | 606 | |
| Australia (Commonwealth of), Series 152, 2.75% 2028 | | | 310 | | | | 205 | |
| Australia (Commonwealth of), Series 163, 1.00% 2031 | | | 660 | | | | 360 | |
| Australia (Commonwealth of), Series 166, 3.00% 2033 | | | 2,250 | | | | 1,451 | |
| Austria (Republic of) 0% 2031 | | EUR | 660 | | | | 592 | |
| Brazil (Federative Republic of) 10.00% 2023 | | BRL | 600 | | | | 113 | |
| Brazil (Federative Republic of) 0% 2024 | | | 1,700 | | | | 269 | |
| Brazil (Federative Republic of) 10.00% 2025 | | | 900 | | | | 162 | |
| Canada 0.75% 2024 | | CAD | 1,125 | | | | 830 | |
| Canada 2.25% 2025 | | | 1,400 | | | | 1,062 | |
| Canada 0.25% 2026 | | | 570 | | | | 400 | |
| Canada 2.25% 2029 | | | 1,525 | | | | 1,120 | |
| Chile (Republic of) 5.80% 2024 | | CLP | 85,000 | | | | 90 | |
| Chile (Republic of) 4.50% 2026 | | | 5,000 | | | | 5 | |
| Chile (Republic of) 5.00% 2028 | | | 60,000 | | | | 60 | |
| Chile (Republic of) 4.70% 2030 | | | 355,000 | | | | 346 | |
| China (People’s Republic of), Series 1910, 3.86% 2049 | | CNY | 2,110 | | | | 343 | |
| China (People’s Republic of), Series INBK, 3.39% 2050 | | | 1,100 | | | | 165 | |
| China (People’s Republic of), Series INBK, 3.81% 2050 | | | 11,200 | | | | 1,808 | |
| China Development Bank Corp., Series 2008, 2.89% 2025 | | | 3,240 | | | | 487 | |
| China Development Bank Corp., Series 2009, 3.39% 2027 | | | 10,400 | | | | 1,588 | |
| China Development Bank Corp., Series 2004, 3.43% 2027 | | | 1,060 | | | | 162 | |
| China Development Bank Corp., Series 1805, 4.88% 2028 | | | 2,040 | | | | 334 | |
| Colombia (Republic of), Series B, 5.75% 2027 | | COP | 2,331,300 | | | | 445 | |
| Colombia (Republic of), Series B, 7.00% 2031 | | | 6,087,800 | | | | 1,115 | |
| European Investment Bank 0.375% 2027 | | EUR | 110 | | | | 108 | |
| European Investment Bank 0.25% 2032 | | | 860 | | | | 760 | |
| European Union 0% 2026 | | | 100 | | | | 99 | |
| European Union 0.25% 2026 | | | 50 | | | | 50 | |
| French Republic O.A.T. 0% 2030 | | | 1,320 | | | | 1,194 | |
| French Republic O.A.T. 0% 2032 | | | 650 | | | | 563 | |
| French Republic O.A.T. 3.25% 2045 | | | 160 | | | | 192 | |
| Germany (Federal Republic of) 0% 2025 | | | 525 | | | | 538 | |
| Germany (Federal Republic of) 0% 2027 | | | 1,510 | | | | 1,507 | |
| Germany (Federal Republic of) 0% 2031 | | | 3,080 | | | | 2,867 | |
| American Funds Insurance Series | 145 |
American Funds Global Balanced Fund (continued)
(formerly Global Balanced Fund)
| Bonds, notes & other debt instruments (continued) | | Principal amount
(000) | | | Value
(000) | |
| Bonds & notes of governments & government agencies outside the U.S. (continued) |
| Germany (Federal Republic of) 0% 2032 | | EUR | 540 | | | $ | 497 | |
| Germany (Federal Republic of) 0% 2050 | | | 200 | | | | 134 | |
| Greece (Hellenic Republic of) 3.45% 2024 | | | 320 | | | | 346 | |
| Greece (Hellenic Republic of) 3.375% 2025 | | | 300 | | | | 322 | |
| Greece (Hellenic Republic of) 1.75% 2032 | | | 725 | | | | 644 | |
| Hungary (Republic of) 2.125% 20315 | | USD | 460 | | | | 357 | |
| Hungary (Republic of) 3.125% 20515 | | | 200 | | | | 133 | |
| Hungary (Republic of), Series C, 1.00% 2025 | | HUF | 43,000 | | | | 90 | |
| India (Republic of) 5.15% 2025 | | INR | 8,000 | | | | 96 | |
| Indonesia (Republic of), Series 78, 8.25% 2029 | | IDR | 4,301,000 | | | | 307 | |
| Indonesia (Republic of), Series 82, 7.00% 2030 | | | 1,000,000 | | | | 67 | |
| Indonesia (Republic of), Series 87, 6.50% 2031 | | | 1,253,000 | | | | 80 | |
| Israel (State of) 2.875% 2024 | | EUR | 200 | | | | 213 | |
| Israel (State of) 1.50% 2027 | | | 100 | | | | 100 | |
| Italy (Republic of) 1.35% 2030 | | | 660 | | | | 615 | |
| Japan, Series 17, 0.10% 20234 | | JPY | 10,690 | | | | 81 | |
| Japan, Series 19, 0.10% 20244 | | | 31,020 | | | | 236 | |
| Japan, Series 18, 0.10% 20244 | | | 21,240 | | | | 161 | |
| Japan, Series 150, 0.005% 2026 | | | 84,950 | | | | 626 | |
| Japan, Series 21, 0.10% 20264 | | | 41,385 | | | | 320 | |
| Japan, Series 346, 0.10% 2027 | | | 134,150 | | | | 993 | |
| Japan, Series 22, 0.10% 20274 | | | 25,941 | | | | 204 | |
| Japan, Series 24, 0.10% 20294 | | | 26,043 | | | | 203 | |
| Japan, Series 365, 0.10% 2031 | | | 317,600 | | | | 2,311 | |
| Japan, Series 363, 0.10% 2031 | | | 56,000 | | | | 407 | |
| Japan, Series 152, 1.20% 2035 | | | 264,400 | | | | 2,118 | |
| Japan, Series 179, 0.50% 2041 | | | 71,600 | | | | 492 | |
| Japan, Series 42, 1.70% 2044 | | | 50,150 | | | | 423 | |
| Japan, Series 37, 0.60% 2050 | | | 26,950 | | | | 171 | |
| Japan, Series 70, 0.70% 2051 | | | 60,350 | | | | 391 | |
| Japan, Series 73, 0.70% 2051 | | | 7,000 | | | | 45 | |
| Japan, Series 74, 1.00% 2052 | | | 130,700 | | | | 913 | |
| KfW 1.125% 2025 | | GBP | 95 | | | | 111 | |
| Malaysia (Federation of), Series 0119, 3.906% 2026 | | MYR | 1,380 | | | | 313 | |
| Malaysia (Federation of), Series 0219, 3.885% 2029 | | | 620 | | | | 137 | |
| Malaysia (Federation of), Series 0419, 3.828% 2034 | | | 90 | | | | 19 | |
| Malaysia (Federation of), Series 0418, 4.893% 2038 | | | 300 | | | | 69 | |
| Malaysia (Federation of), Series 0519, 3.757% 2040 | | | 1,450 | | | | 287 | |
| Malaysia (Federation of), Series 0216, 4.736% 2046 | | | 409 | | | | 90 | |
| Malaysia (Federation of), Series 0518, 4.921% 2048 | | | 1,078 | | | | 242 | |
| Morocco (Kingdom of) 3.50% 2024 | | EUR | 100 | | | | 104 | |
| Morocco (Kingdom of) 1.50% 2031 | | | 100 | | | | 70 | |
| Netherlands (Kingdom of the) 5.50% 2028 | | | 100 | | | | 128 | |
| Nova Scotia (Province of) 3.15% 2051 | | CAD | 170 | | | | 108 | |
| Peru (Republic of) 2.392% 2026 | | USD | 90 | | | | 84 | |
| Philippines (Republic of) 0.001% 2024 | | JPY | 100,000 | | | | 731 | |
| Philippines (Republic of) 0.25% 2025 | | EUR | 100 | | | | 98 | |
| Philippines (Republic of) 1.648% 2031 | | USD | 200 | | | | 161 | |
| Poland (Republic of), Series 0725, 3.25% 2025 | | PLN | 1,900 | | | | 377 | |
| Poland (Republic of), Series 1029, 2.75% 2029 | | | 410 | | | | 70 | |
| Portuguese Republic 0.475% 2030 | | EUR | 230 | | | | 211 | |
| Romania 2.125% 2028 | | | 130 | | | | 112 | |
| Romania 3.624% 2030 | | | 615 | | | | 528 | |
| Romania 2.00% 2032 | | | 100 | | | | 72 | |
| Romania 2.00% 2033 | | | 200 | | | | 136 | |
| Romania 3.50% 2034 | | | 65 | | | | 50 | |
| Romania 3.75% 2034 | | | 130 | | | | 103 | |
| Romania 3.375% 2038 | | | 80 | | | | 56 | |
| Romania 4.625% 2049 | | | 39 | | | | 29 | |
| 146 | American Funds Insurance Series |
American Funds Global Balanced Fund (continued)
(formerly Global Balanced Fund)
| Bonds, notes & other debt instruments (continued) | | Principal amount
(000) | | | Value
(000) | |
| Bonds & notes of governments & government agencies outside the U.S. (continued) |
| Romania 3.375% 2050 | | EUR | 73 | | | $ | 46 | |
| Russian Federation 7.00% 2023 | | RUB | 16,600 | | | | 27 | |
| Russian Federation 2.875% 2025 | | EUR | 200 | | | | 56 | |
| Russian Federation 4.25% 20276 | | USD | 200 | | | | 55 | |
| Russian Federation 4.375% 2029 | | | 200 | | | | 47 | |
| Russian Federation 6.90% 20296 | | RUB | 28,250 | | | | 46 | |
| Russian Federation 7.65% 20306 | | | 38,320 | | | | 63 | |
| Russian Federation 5.90% 20316 | | | 5,620 | | | | 9 | |
| Russian Federation 6.90% 2031 | | | 18,200 | | | | 30 | |
| Russian Federation 8.50% 20316 | | | 5,530 | | | | 9 | |
| Russian Federation 7.70% 20336 | | | 23,030 | | | | 38 | |
| Russian Federation 7.25% 20346 | | | 8,140 | | | | 13 | |
| Serbia (Republic of) 3.125% 2027 | | EUR | 640 | | | | 589 | |
| Serbia (Republic of) 3.125% 2027 | | | 385 | | | | 354 | |
| Serbia (Republic of) 2.05% 2036 | | | 185 | | | | 115 | |
| South Africa (Republic of), Series R-2030, 8.00% 2030 | | ZAR | 3,000 | | | | 160 | |
| South Korea (Republic of), Series 2209, 2.00% 2022 | | KRW | 560,000 | | | | 431 | |
| Spain (Kingdom of) 0.80% 2027 | | EUR | 490 | | | | 490 | |
| Spain (Kingdom of) 0.50% 2031 | | | 325 | | | | 288 | |
| Spain (Kingdom of) 0.70% 2032 | | | 830 | | | | 739 | |
| Tunisia (Republic of) 6.75% 2023 | | | 260 | | | | 190 | |
| Tunisia (Republic of) 6.75% 2023 | | | 150 | | | | 110 | |
| Ukraine 6.876% 20295 | | USD | 250 | | | | 62 | |
| Ukraine 6.876% 2029 | | | 200 | | | | 50 | |
| United Kingdom 1.75% 2022 | | GBP | 280 | | | | 341 | |
| United Kingdom 2.75% 2024 | | | 50 | | | | 62 | |
| United Kingdom 1.25% 2027 | | | 410 | | | | 483 | |
| United Kingdom 0.375% 2030 | | | 490 | | | | 518 | |
| United Kingdom 0.25% 2031 | | | 770 | | | | 786 | |
| United Kingdom 4.25% 2032 | | | 1,475 | | | | 2,112 | |
| United Kingdom 0.625% 2035 | | | 155 | | | | 148 | |
| United Kingdom 3.25% 2044 | | | 250 | | | | 334 | |
| United Kingdom 0.625% 2050 | | | 95 | | | | 71 | |
| United Kingdom 1.25% 2051 | | | 164 | | | | 146 | |
| United Mexican States, Series M, 5.75% 2026 | | MXN | 18,200 | | | | 805 | |
| United Mexican States, Series M, 7.50% 2027 | | | 21,950 | | | | 1,021 | |
| United Mexican States, Series M, 7.75% 2031 | | | 5,000 | | | | 229 | |
| United Mexican States, Series M, 8.00% 2047 | | | 4,000 | | | | 178 | |
| | | | | | | | 52,832 | |
| | | | | | | | | |
| Corporate bonds, notes & loans 5.39% | | | | | | |
| Financials 1.59% | | | | | | | | |
| ACE INA Holdings, Inc. 2.875% 2022 | | USD | 10 | | | | 10 | |
| ACE INA Holdings, Inc. 3.35% 2026 | | | 10 | | | | 10 | |
| ACE INA Holdings, Inc. 4.35% 2045 | | | 20 | | | | 19 | |
| Allianz SE 4.75% perpetual bonds (3-month EUR-EURIBOR + 3.60% on 10/24/2023)7 | | EUR | 100 | | | | 105 | |
| Bank of America Corp. 0.976% 2025 (USD-SOFR + 0.69% on 4/22/2024)7 | | USD | 200 | | | | 188 | |
| Bank of America Corp. 1.319% 2026 (USD-SOFR + 1.15% on 6/19/2025)7 | | | 500 | | | | 455 | |
| Bank of America Corp. 1.734% 2027 (USD-SOFR + 0.96% on 7/22/2026)7 | | | 160 | | | | 143 | |
| Bank of America Corp. 3.419% 2028 (3-month USD-LIBOR + 1.04% on 12/20/2027)7 | | | 236 | | | | 220 | |
| Bank of America Corp. 2.496% 2031 (3-month USD-LIBOR + 0.99% on 2/13/2030)7 | | | 20 | | | | 17 | |
| Citigroup, Inc. 0.981% 2025 (USD-SOFR + 0.669% on 5/1/2024)7 | | | 103 | | | | 97 | |
| Citigroup, Inc. 3.106% 2026 (USD-SOFR + 2.842% on 3/8/2026)7 | | | 175 | | | | 168 | |
| Citigroup, Inc. 1.462% 2027 (USD-SOFR + 0.67% on 6/9/2026)7 | | | 310 | | | | 275 | |
| Citigroup, Inc. 3.07% 2028 (USD-SOFR + 1.28% on 2/24/2027)7 | | | 110 | | | | 102 | |
| Citigroup, Inc. 4.91% 2033 (USD-SOFR + 2.086% on 5/24/2032)7 | | | 29 | | | | 29 | |
| Commonwealth Bank of Australia 2.688% 20315 | | | 225 | | | | 183 | |
| Corebridge Financial, Inc. 3.90% 20325 | | | 59 | | | | 53 | |
| American Funds Insurance Series | 147 |
American Funds Global Balanced Fund (continued)
(formerly Global Balanced Fund)
| Bonds, notes & other debt instruments (continued) | | Principal amount
(000) | | | Value
(000) | |
| Corporate bonds, notes & loans (continued) | | | | | | | | |
| Financials (continued) | | | | | | | | |
| Goldman Sachs Group, Inc. 2.905% 2023 (3-month USD-LIBOR + 0.99% on 7/24/2022)7 | | USD | 130 | | | $ | 130 | |
| Goldman Sachs Group, Inc. 3.50% 2025 | | | 207 | | | | 203 | |
| Goldman Sachs Group, Inc. 2.615% 2032 (USD-SOFR + 1.281% on 4/22/2031)7 | | | 130 | | | | 108 | |
| Goldman Sachs Group, Inc. 1.00% 20335 | | EUR | 210 | | | | 165 | |
| Goldman Sachs Group, Inc. 4.017% 2038 (3-month USD-LIBOR + 1.373% on 10/31/2037)7 | | USD | 78 | | | | 68 | |
| Groupe BPCE SA 5.70% 20235 | | | 200 | | | | 203 | |
| Groupe BPCE SA 1.00% 2025 | | EUR | 100 | | | | 100 | |
| HSBC Holdings PLC 4.292% 2026 (3-month USD-LIBOR + 1.348% on 9/12/2025)7 | | USD | 200 | | | | 196 | |
| Intercontinental Exchange, Inc. 4.00% 2027 | | | 390 | | | | 384 | |
| JPMorgan Chase & Co. 3.25% 2022 | | | 28 | | | | 28 | |
| JPMorgan Chase & Co. 1.578% 2027 (USD-SOFR + 0.885% on 4/22/2026)7 | | | 186 | | | | 166 | |
| JPMorgan Chase & Co. 4.493% 2031 (USD-SOFR + 3.79% on 3/24/2030)7 | | | 160 | | | | 156 | |
| Morgan Stanley 0.985% 2026 (USD-SOFR + 0.72% on 12/10/2025)7 | | | 200 | | | | 178 | |
| Morgan Stanley 3.125% 2026 | | | 110 | | | | 105 | |
| Morgan Stanley 1.593% 2027 (USD-SOFR + 0.879% on 5/4/2026)7 | | | 126 | | | | 112 | |
| Morgan Stanley 2.699% 2031 (USD-SOFR + 1.143% on 1/22/2030)7 | | | 72 | | | | 62 | |
| Morgan Stanley 2.95% 2032 (3-month EUR-EURIBOR +1.245% on 5/7/2031)7 | | EUR | 510 | | | | 507 | |
| New York Life Insurance Company 3.75% 20505 | | USD | 23 | | | | 19 | |
| Nordea Bank AB 3.60% 20255 | | | 200 | | | | 198 | |
| PNC Financial Services Group, Inc. 2.854% 20227 | | | 100 | | | | 100 | |
| Royal Bank of Canada 1.20% 2026 | | | 175 | | | | 158 | |
| Wells Fargo & Company 2.393% 2028 (USD-SOFR + 2.10% on 6/2/2027)7 | | | 400 | | | | 359 | |
| Wells Fargo & Company 3.526% 2028 (USD-SOFR + 1.51% on 3/24/2027)7 | | | 210 | | | | 199 | |
| | | | | | | | 5,978 | |
| | | | | | | | | |
| Utilities 0.74% | | | | | | | | |
| Alabama Power Co. 3.00% 2052 | | | 250 | | | | 184 | |
| CMS Energy Corp. 3.00% 2026 | | | 150 | | | | 144 | |
| Duke Energy Carolinas, LLC 3.05% 2023 | | | 280 | | | | 280 | |
| Duke Energy Progress, LLC 3.70% 2028 | | | 75 | | | | 73 | |
| Edison International 4.125% 2028 | | | 160 | | | | 149 | |
| Enel Finance International SA 1.875% 20285 | | | 200 | | | | 168 | |
| Enersis Américas SA 4.00% 2026 | | | 35 | | | | 34 | |
| Exelon Corp. 3.40% 2026 | | | 150 | | | | 146 | |
| FirstEnergy Corp. 3.50% 20285 | | | 35 | | | | 33 | |
| Florida Power & Light Company 2.875% 2051 | | | 120 | | | | 89 | |
| Interstate Power and Light Co. 2.30% 2030 | | | 50 | | | | 43 | |
| NextEra Energy Capital Holdings, Inc. 2.75% 2029 | | | 232 | | | | 205 | |
| Niagara Mohawk Power Corp. 3.508% 20245 | | | 85 | | | | 83 | |
| Pacific Gas and Electric Co. 2.95% 2026 | | | 25 | | | | 23 | |
| Pacific Gas and Electric Co. 2.10% 2027 | | | 100 | | | | 84 | |
| Pacific Gas and Electric Co. 3.00% 2028 | | | 140 | | | | 121 | |
| Pacific Gas and Electric Co. 4.65% 2028 | | | 114 | | | | 106 | |
| Pacific Gas and Electric Co. 4.55% 2030 | | | 31 | | | | 27 | |
| Pacific Gas and Electric Co. 2.50% 2031 | | | 600 | | | | 459 | |
| Pacific Gas and Electric Co. 3.25% 2031 | | | 50 | | | | 40 | |
| Pacific Gas and Electric Co. 3.50% 2050 | | | 137 | | | | 92 | |
| Xcel Energy, Inc. 3.35% 2026 | | | 216 | | | | 209 | |
| | | | | | | | 2,792 | |
| | | | | | | | | |
| Communication services 0.60% | | | | | | | | |
| AT&T, Inc. 2.75% 2031 | | | 375 | | | | 324 | |
| AT&T, Inc. 2.55% 2033 | | | 64 | | | | 52 | |
| Comcast Corp. 0% 2026 | | EUR | 100 | | | | 95 | |
| Comcast Corp. 0.25% 2029 | | | 100 | | | | 87 | |
| Deutsche Telekom International Finance BV 9.25% 2032 | | USD | 45 | | | | 60 | |
| KT Corp. 0.22% 2022 | | JPY | 100,000 | | | | 737 | |
| 148 | American Funds Insurance Series |
American Funds Global Balanced Fund (continued)
(formerly Global Balanced Fund)
| Bonds, notes & other debt instruments (continued) | | Principal amount
(000) | | | Value
(000) | |
| Corporate bonds, notes & loans (continued) | | | | | | | | |
| Communication services (continued) | | | | | | | | |
| Magallanes, Inc. 5.05% 20425 | | USD | 168 | | | $ | 143 | |
| Orange SA 9.00% 20317 | | | 65 | | | | 84 | |
| T-Mobile US, Inc. 2.05% 2028 | | | 200 | | | | 174 | |
| Verizon Communications, Inc. 0.375% 2029 | | EUR | 140 | | | | 125 | |
| Verizon Communications, Inc. 2.55% 2031 | | USD | 325 | | | | 278 | |
| Verizon Communications, Inc. 0.75% 2032 | | EUR | 100 | | | | 83 | |
| | | | | | | | 2,242 | |
| | | | | | | | | |
| Consumer discretionary 0.59% | | | | | | | | |
| Amazon.com, Inc. 2.80% 2024 | | USD | 45 | | | | 45 | |
| Amazon.com, Inc. 1.20% 2027 | | | 50 | | | | 44 | |
| Bayerische Motoren Werke AG 3.90% 20255 | | | 70 | | | | 70 | |
| Bayerische Motoren Werke AG 4.15% 20305 | | | 70 | | | | 69 | |
| Daimler Trucks Finance North America, LLC 3.65% 20275 | | | 150 | | | | 144 | |
| General Motors Financial Co. 1.05% 2024 | | | 116 | | | | 110 | |
| General Motors Financial Co. 2.40% 2028 | | | 150 | | | | 127 | |
| Hyundai Capital America 3.25% 20225 | | | 65 | | | | 65 | |
| Hyundai Capital America 1.50% 20265 | | | 250 | | | | 221 | |
| Hyundai Capital America 2.375% 20275 | | | 109 | | | | 96 | |
| Hyundai Capital Services, Inc. 3.75% 20235 | | | 250 | | | | 250 | |
| Royal Caribbean Cruises, Ltd. 11.50% 20255 | | | 142 | | | | 146 | |
| Royal Caribbean Cruises, Ltd. 5.50% 20285 | | | 130 | | | | 91 | |
| Stellantis Finance US, Inc. 2.691% 20315 | | | 200 | | | | 159 | |
| Stellantis NV 1.25% 2033 | | EUR | 500 | | | | 366 | |
| Toyota Motor Credit Corp. 3.375% 2030 | | USD | 33 | | | | 31 | |
| Volkswagen International Finance NV 4.375% junior subordinated perpetual bonds (9-year EUR Mid-Swap + 3.36% on 3/28/2031)7 | | EUR | 200 | | | | 169 | |
| | | | | | | | 2,203 | |
| | | | | | | | | |
| Energy 0.49% | | | | | | | | |
| Canadian Natural Resources, Ltd. 2.95% 2030 | | USD | 161 | | | | 142 | |
| Enbridge, Inc. 4.25% 2026 | | | 70 | | | | 69 | |
| Enbridge, Inc. 3.70% 2027 | | | 45 | | | | 43 | |
| Enbridge, Inc. 3.40% 2051 | | | 39 | | | | 29 | |
| Energy Transfer Operating LP 5.00% 2050 | | | 136 | | | | 116 | |
| Halliburton Company 3.80% 2025 | | | 2 | | | | 2 | |
| Kinder Morgan, Inc. 4.30% 2025 | | | 165 | | | | 164 | |
| Kinder Morgan, Inc. 3.60% 2051 | | | 120 | | | | 89 | |
| MPLX LP 2.65% 2030 | | | 75 | | | | 63 | |
| MPLX LP 5.50% 2049 | | | 215 | | | | 200 | |
| Petróleos Mexicanos 7.47% 2026 | | MXN | 5,330 | | | | 231 | |
| Petróleos Mexicanos 5.95% 2031 | | USD | 161 | | | | 118 | |
| Petróleos Mexicanos 6.75% 2047 | | | 38 | | | | 24 | |
| Qatar Petroleum 3.125% 20415 | | | 270 | | | | 213 | |
| Statoil ASA 3.70% 2024 | | | 50 | | | | 50 | |
| TransCanada Corp. 5.875% 2076 (3-month USD-LIBOR + 4.64% on 8/15/2026)7 | | | 288 | | | | 274 | |
| | | | | | | | 1,827 | |
| | | | | | | | | |
| Industrials 0.37% | | | | | | | | |
| Boeing Company 4.508% 2023 | | | 400 | | | | 401 | |
| Canadian Pacific Railway, Ltd. 3.10% 2051 | | | 164 | | | | 121 | |
| Carrier Global Corp. 2.242% 2025 | | | 6 | | | | 6 | |
| Carrier Global Corp. 2.493% 2027 | | | 7 | | | | 6 | |
| CSX Corp. 3.80% 2050 | | | 6 | | | | 5 | |
| CSX Corp. 2.50% 2051 | | | 75 | | | | 51 | |
| General Electric Capital Corp. 4.418% 2035 | | | 200 | | | | 187 | |
| Lima Metro Line 2 Finance, Ltd. 5.875% 20345 | | | 97 | | | | 96 | |
| American Funds Insurance Series | 149 |
American Funds Global Balanced Fund (continued)
(formerly Global Balanced Fund)
| Bonds, notes & other debt instruments (continued) | | Principal amount
(000) | | | Value
(000) | |
| Corporate bonds, notes & loans (continued) | | | | | | | | |
| Industrials (continued) | | | | | | | | |
| MISC Capital Two (Labuan), Ltd. 3.75% 20275 | | USD | 200 | | | $ | 188 | |
| Singapore Airlines, Ltd. 3.375% 2029 | | | 200 | | | | 182 | |
| United Technologies Corp. 4.125% 2028 | | | 170 | | | | 168 | |
| | | | | | | | 1,411 | |
| | | | | | | | | |
| Health care 0.30% | | | | | | | | |
| Aetna, Inc. 2.80% 2023 | | | 10 | | | | 10 | |
| Amgen, Inc. 1.90% 2025 | | | 40 | | | | 38 | |
| Amgen, Inc. 2.20% 2027 | | | 30 | | | | 28 | |
| AstraZeneca Finance, LLC 2.25% 2031 | | | 69 | | | | 60 | |
| AstraZeneca PLC 3.50% 2023 | | | 150 | | | | 150 | |
| Becton, Dickinson and Company 3.734% 2024 | | | 10 | | | | 10 | |
| Becton, Dickinson and Company 3.70% 2027 | | | 43 | | | | 42 | |
| Becton, Dickinson and Company 2.823% 2030 | | | 28 | | | | 25 | |
| Cigna Corp. 4.125% 2025 | | | 80 | | | | 80 | |
| EMD Finance, LLC 3.25% 20255 | | | 250 | | | | 246 | |
| Stryker Corp. 0.75% 2029 | | EUR | 210 | | | | 188 | |
| Takeda Pharmaceutical Company, Ltd. 2.25% 2026 | | | 100 | | | | 103 | |
| UnitedHealth Group, Inc. 4.00% 2029 | | USD | 135 | | | | 134 | |
| | | | | | | | 1,114 | |
| | | | | | | | | |
| Information technology 0.27% | | | | | | | | |
| Broadcom, Inc. 3.15% 2025 | | | 17 | | | | 16 | |
| Broadcom, Inc. 4.00% 20295 | | | 42 | | | | 39 | |
| Broadcom, Inc. 4.15% 2030 | | | 70 | | | | 64 | |
| Broadcom, Inc. 3.419% 20335 | | | 53 | | | | 44 | |
| Lenovo Group, Ltd. 5.875% 2025 | | | 269 | | | | 277 | |
| Mastercard, Inc. 2.00% 2031 | | | 102 | | | | 86 | |
| Microsoft Corp. 2.40% 2026 | | | 187 | | | | 180 | |
| Oracle Corp. 2.65% 2026 | | | 216 | | | | 200 | |
| PayPal Holdings, Inc. 4.40% 2032 | | | 99 | | | | 98 | |
| | | | | | | | 1,004 | |
| | | | | | | | | |
| Consumer staples 0.23% | | | | | | | | |
| Altria Group, Inc. 2.20% 2027 | | EUR | 270 | | | | 255 | |
| Anheuser-Busch InBev NV 4.00% 2028 | | USD | 100 | | | | 99 | |
| Anheuser-Busch InBev NV 4.75% 2029 | | | 220 | | | | 224 | |
| British American Tobacco PLC 3.215% 2026 | | | 62 | | | | 58 | |
| British American Tobacco PLC 3.557% 2027 | | | 105 | | | | 96 | |
| British American Tobacco PLC 4.70% 2027 | | | 67 | | | | 66 | |
| British American Tobacco PLC 3.462% 2029 | | | 75 | | | | 64 | |
| | | | | | | | 862 | |
| | | | | | | | | |
| Real estate 0.19% | | | | | | | | |
| American Campus Communities, Inc. 3.75% 2023 | | | 100 | | | | 100 | |
| American Campus Communities, Inc. 4.125% 2024 | | | 90 | | | | 90 | |
| American Tower Corp. 0.875% 2029 | | EUR | 250 | | | | 213 | |
| Equinix, Inc. 2.15% 2030 | | USD | 197 | | | | 160 | |
| Essex Portfolio LP 3.50% 2025 | | | 120 | | | | 118 | |
| Essex Portfolio LP 3.375% 2026 | | | 40 | | | | 39 | |
| | | | | | | | 720 | |
| | | | | | | | | |
| Materials 0.02% | | | | | | | | |
| Vale Overseas, Ltd. 3.75% 2030 | | | 94 | | | | 83 | |
| | | | | | | | | |
| Total corporate bonds, notes & loans | | | | | | | 20,236 | |
| 150 | American Funds Insurance Series |
American Funds Global Balanced Fund (continued)
(formerly Global Balanced Fund)
| Bonds, notes & other debt instruments (continued) | | Principal amount
(000) | | | Value
(000) | |
| Mortgage-backed obligations 2.39% | | | | | | | | |
| Federal agency mortgage-backed obligations 1.32% | | | | | | | | |
| Fannie Mae Pool #FM7100 3.50% 20508 | | USD | 379 | | | $ | 370 | |
| Government National Mortgage Assn. 3.50% 20528,9 | | | 1,300 | | | | 1,262 | |
| Uniform Mortgage-Backed Security 2.50% 20528,9 | | | 990 | | | | 890 | |
| Uniform Mortgage-Backed Security 4.00% 20528,9 | | | 1,145 | | | | 1,125 | |
| Uniform Mortgage-Backed Security 4.50% 20528,9 | | | 1,267 | | | | 1,269 | |
| Uniform Mortgage-Backed Security 4.50% 20528,9 | | | 33 | | | | 33 | |
| | | | | | | | 4,949 | |
| | | | | | | | | |
| Other mortgage-backed securities 1.07% | | | | | | | | |
| Nordea Kredit 0.50% 20408 | | DKK | 1,666 | | | | 192 | |
| Nykredit Realkredit AS, Series 01E, 1.50% 20378 | | | 520 | | | | 67 | |
| Nykredit Realkredit AS, Series 01E, 0.50% 20408 | | | 7,444 | | | | 856 | |
| Nykredit Realkredit AS, Series 01E, 1.50% 20408 | | | 1,320 | | | | 168 | |
| Nykredit Realkredit AS, Series 01E, 0.50% 20438 | | | 20,999 | | | | 2,393 | |
| Nykredit Realkredit AS, Series 01E, 0.50% 20508 | | | 1,391 | | | | 147 | |
| Nykredit Realkredit AS, Series CCE, 1.00% 20508 | | | 599 | | | | 66 | |
| Nykredit Realkredit AS, Series 01E, 1.00% 20538 | | | 876 | | | | 96 | |
| Realkredit Danmark AS 1.00% 20538 | | | 197 | | | | 22 | |
| | | | | | | | 4,007 | |
| | | | | | | | | |
| Total mortgage-backed obligations | | | | | | | 8,956 | |
| | | | | | | | | |
| Asset-backed obligations 0.43% | | | | | | | | |
| AmeriCredit Automobile Receivables Trust, Series 2022-2, Class A2B, (30-day Average USD-SOFR + 1.15%) 1.927% 20258,10 | | USD | 230 | | | | 230 | |
| Exeter Automobile Receivables Trust, Series 2022-3A, Class A2, 3.45% 20248 | | | 98 | | | | 98 | |
| Ford Credit Auto Owner Trust, Series 2022-B, Class A2B, (30-day Average USD-SOFR + 0.60%) 1.252% 20258,10 | | | 116 | | | | 116 | |
| Nissan Auto Lease Trust, Series 2021-A, Class A3, 0.52% 20248 | | | 302 | | | | 293 | |
| Nissan Auto Lease Trust, Series 2022-A, Class A2B, (30-day Average USD-SOFR + 0.60%) 1.113% 20248,10 | | | 300 | | | | 295 | |
| Verizon Master Trust, Series 2022-3, Class A, 3.01% 2027 (3.76% on 11/20/2023)7,8 | | | 250 | | | | 248 | |
| Volkswagen Auto Lease Trust, Series 2022-A, Class A2, 3.02% 20248 | | | 167 | | | | 166 | |
| Westlake Automobile Receivables Trust, Series 2022-2A, Class A2A, 3.36% 20255,8 | | | 182 | | | | 181 | |
| | | | | | | | 1,627 | |
| | | | | | | | | |
| Municipals 0.04% | | | | | | | | |
| Ohio 0.02% | | | | | | | | |
| Turnpike and Infrastructure Commission, Turnpike Rev. Ref. Bonds (Infrastructure Projects), Series 2020-A, 3.216% 2048 | | | 100 | | | | 78 | |
| | | | | | | | | |
| Texas 0.02% | | | | | | | | |
| Grand Parkway Transportation Corp., Grand Parkway System Toll Rev. Ref. Bonds, Series 2020-B, 3.236% 2052 | | | 80 | | | | 65 | |
| | | | | | | | | |
| Total municipals | | | | | | | 143 | |
| | | | | | | | | |
| Total bonds, notes & other debt instruments (cost: $153,808,000) | | | | | | | 138,082 | |
| | | | | | | | | |
| Short-term securities 6.46% | | | Shares | | | | | |
| Money market investments 3.11% | | | | | | | | |
| Capital Group Central Cash Fund 1.38%11,12 | | | 116,695 | | | | 11,667 | |
| American Funds Insurance Series | 151 |
American Funds Global Balanced Fund (continued)
(formerly Global Balanced Fund)
| Short-term securities (continued) | | Weighted
average yield
at acquisition | | | Principal amount
(000) | | | Value
(000) | |
| U.S. Treasury bills 2.39% | | | | | | | | | | | | |
| U.S. Treasury 7/21/2022 | | | 0.804 | % | | USD | 9,000 | | | $ | 8,995 | |
| | | | | | | | | | | | | |
| | | | | | | | Shares | | | | | |
| Money market investments purchased with collateral from securities on loan 0.96% |
| Capital Group Central Cash Fund 1.38%11,12,13 | | | | | | | 10,218 | | | | 1,021 | |
| Goldman Sachs Financial Square Government Fund, Institutional Shares 1.39%11,13 | | | | | | | 539,399 | | | | 540 | |
| BlackRock Liquidity Funds – FedFund, Institutional Shares 1.32%11,13 | | | | | | | 510,806 | | | | 511 | |
| Invesco Short-Term Investments Trust – Government & Agency Portfolio, Institutional Class 1.38%11,13 | | | | | | | 510,805 | | | | 511 | |
| Morgan Stanley Institutional Liquidity Funds – Government Portfolio, Institutional Class 1.38%11,13 | | | | | | | 510,805 | | | | 511 | |
| State Street Institutional U.S. Government Money Market Fund, Institutional Class 1.40%11,13 | | | | | | | 510,805 | | | | 511 | |
| | | | | | | | | | | | 3,605 | |
| | | | | | | | | | | | | |
| Total short-term securities (cost: $24,267,000) | | | | | | | | | | | 24,267 | |
| Total investment securities 101.70% (cost: $389,065,000) | | | | | | | | | | | 381,846 | |
| Other assets less liabilities (1.70)% | | | | | | | | | | | (6,368 | ) |
| | | | | | | | | | | | | |
| Net assets 100.00% | | | | | | | | | | $ | 375,478 | |
Futures contracts
| Contracts | | Type | | Number of
contracts | | Expiration | | Notional
amount
(000) | | | Value and
unrealized
appreciation
(depreciation)
at 6/30/2022
(000) | |
| 2 Year U.S. Treasury Note Futures | | Short | | 1 | | September 2022 | | USD | (210 | ) | | | $ | 1 | |
| 5 Year Euro-Bobl Futures | | Long | | 29 | | September 2022 | | | 3,774 | | | | | (39 | ) |
| 5 Year U.S. Treasury Note Futures | | Long | | 7 | | September 2022 | | | 786 | | | | | 8 | |
| 10 Year Euro-Bund Futures | | Long | | 11 | | September 2022 | | | 1,715 | | | | | (18 | ) |
| 10 Year Italy Government Bond Futures | | Short | | 11 | | September 2022 | | | (1,419 | ) | | | | 24 | |
| 10 Year Japanese Government Bond Futures | | Short | | 2 | | September 2022 | | | (2,191 | ) | | | | (14 | ) |
| 10 Year Australian Treasury Bond Futures | | Long | | 4 | | September 2022 | | | 328 | | | | | 2 | |
| 10 Year Ultra U.S. Treasury Note Futures | | Short | | 1 | | September 2022 | | | (127 | ) | | | | 2 | |
| 10 Year U.S. Treasury Note Futures | | Short | | 9 | | September 2022 | | | (1,067 | ) | | | | (1 | ) |
| 10 Year UK Gilt Futures | | Short | | 2 | | September 2022 | | | (277 | ) | | | | 11 | |
| 20 Year U.S. Treasury Bond Futures | | Long | | 2 | | September 2022 | | | 277 | | | | | (3 | ) |
| 30 Year Ultra U.S. Treasury Bond Futures | | Long | | 2 | | September 2022 | | | 309 | | | | | (7 | ) |
| | | | | | | | | | | | | | $ | (34 | ) |
| 152 | American Funds Insurance Series |
American Funds Global Balanced Fund (continued)
(formerly Global Balanced Fund)
Forward currency contracts
| Contract amount | | | | | | Unrealized
appreciation
(depreciation) | |
Currency purchased
(000) | | Currency sold
(000) | | Counterparty | | Settlement
date | | at 6/30/2022
(000) | |
| USD | | 287 | | NZD | | 440 | | Bank of America | | 7/11/2022 | | | $ | 12 | |
| USD | | 413 | | GBP | | 330 | | Barclays Bank PLC | | 7/11/2022 | | | | 11 | |
| USD | | 226 | | MXN | | 4,470 | | Bank of America | | 7/11/2022 | | | | 4 | |
| HUF | | 204,710 | | EUR | | 514 | | Bank of America | | 7/11/2022 | | | | 2 | |
| EUR | | 140 | | USD | | 146 | | Bank of America | | 7/11/2022 | | | | 1 | |
| USD | | 168 | | EUR | | 160 | | BNP Paribas | | 7/11/2022 | | | | 1 | |
| EUR | | 2,560 | | DKK | | 19,040 | | Bank of America | | 7/11/2022 | | | | — | 14 |
| EUR | | 200 | | USD | | 210 | | JPMorgan Chase | | 7/11/2022 | | | | — | 14 |
| JPY | | 86,760 | | USD | | 640 | | BNP Paribas | | 7/11/2022 | | | | — | 14 |
| EUR | | 120 | | USD | | 127 | | Bank of New York Mellon | | 7/11/2022 | | | | (1 | ) |
| JPY | | 76,090 | | USD | | 562 | | BNP Paribas | | 7/11/2022 | | | | (1 | ) |
| MXN | | 1,517 | | USD | | 77 | | Bank of America | | 7/11/2022 | | | | (2 | ) |
| EUR | | 120 | | USD | | 129 | | JPMorgan Chase | | 7/11/2022 | | | | (3 | ) |
| SEK | | 1,270 | | USD | | 130 | | Bank of America | | 7/11/2022 | | | | (6 | ) |
| CAD | | 900 | | USD | | 713 | | HSBC Bank | | 7/11/2022 | | | | (14 | ) |
| EUR | | 4,552 | | USD | | 4,868 | | Standard Chartered Bank | | 7/11/2022 | | | | (95 | ) |
| JPY | | 637,220 | | USD | | 4,934 | | BNP Paribas | | 7/11/2022 | | | | (234 | ) |
| USD | | 352 | | COP | | 1,337,640 | | Citibank | | 7/12/2022 | | | | 31 | |
| KRW | | 1,261,900 | | USD | | 1,015 | | Bank of America | | 7/12/2022 | | | | (36 | ) |
| USD | | 1,593 | | MYR | | 7,000 | | Bank of America | | 7/14/2022 | | | | 1 | |
| MYR | | 2,865 | | USD | | 651 | | Standard Chartered Bank | | 7/14/2022 | | | | 1 | |
| MYR | | 1,430 | | USD | | 325 | | HSBC Bank | | 7/14/2022 | | | | — | 14 |
| MYR | | 1,090 | | USD | | 248 | | Standard Chartered Bank | | 7/14/2022 | | | | — | 14 |
| MYR | | 815 | | USD | | 185 | | HSBC Bank | | 7/14/2022 | | | | — | 14 |
| USD | | 239 | | CNH | | 1,600 | | UBS AG | | 7/27/2022 | | | | — | 14 |
| USD | | 687 | | AUD | | 960 | | Citibank | | 7/29/2022 | | | | 24 | |
| USD | | 525 | | AUD | | 740 | | Morgan Stanley | | 7/29/2022 | | | | 14 | |
| AUD | | 340 | | USD | | 235 | | HSBC Bank | | 7/29/2022 | | | | — | 14 |
| AUD | | 960 | | USD | | 681 | | Morgan Stanley | | 7/29/2022 | | | | (18 | ) |
| PLN | | 4,260 | | USD | | 922 | | Citibank | | 2/2/2023 | | | | 1 | |
| USD | | 420 | | PLN | | 1,940 | | Citibank | | 2/2/2023 | | | | (1 | ) |
| PLN | | 1,940 | | USD | | 468 | | BNP Paribas | | 2/2/2023 | | | | (48 | ) |
| | | | | | | | | | | | | | $ | (356 | ) |
Swap contracts
Interest rate swaps
Centrally cleared interest rate swaps
| Receive | | Pay | | | | Notional | | | Value at | | | Upfront
premium | | | Unrealized
(depreciation)
appreciation | |
| Rate | | Payment
frequency | | Rate | | Payment
frequency | | Expiration
date | | amount
(000) | | | 6/30/2022
(000) | | | paid
(000) | | | at 6/30/2022
(000) | |
| 1.2475% | | Semi-annual | | 3-month NZD-BBR-FRA | | Quarterly | | 8/20/2023 | | | NZD 375 | | | | $ | (7 | ) | | | $ | — | | | | $ | (7 | ) |
| 1.234974% | | Semi-annual | | 3-month NZD-BBR-FRA | | Quarterly | | 8/20/2023 | | | 3,197 | | | | | (58 | ) | | | | — | | | | | (58 | ) |
| 1.2375% | | Semi-annual | | 3-month NZD-BBR-FRA | | Quarterly | | 8/26/2023 | | | 1,178 | | | | | (22 | ) | | | | — | | | | | (22 | ) |
| 1.264% | | Semi-annual | | 3-month NZD-BBR-FRA | | Quarterly | | 8/27/2023 | | | 2,945 | | | | | (54 | ) | | | | — | | | | | (54 | ) |
| 1.26% | | Semi-annual | | 3-month NZD-BBR-FRA | | Quarterly | | 8/30/2023 | | | 486 | | | | | (9 | ) | | | | — | | | | | (9 | ) |
| 1.28% | | Semi-annual | | 3-month NZD-BBR-FRA | | Quarterly | | 8/31/2023 | | | 486 | | | | | (9 | ) | | | | — | | | | | (9 | ) |
| 1.30% | | Semi-annual | | 3-month NZD-BBR-FRA | | Quarterly | | 9/3/2023 | | | 533 | | | | | (10 | ) | | | | — | | | | | (10 | ) |
| 1.4975% | | Semi-annual | | 3-month NZD-BBR-FRA | | Quarterly | | 9/21/2023 | | | 1,001 | | | | | (18 | ) | | | | — | | | | | (18 | ) |
| American Funds Insurance Series | 153 |
American Funds Global Balanced Fund (continued)
(formerly Global Balanced Fund)
Swap contracts (continued)
Interest rate swaps (continued)
Centrally cleared interest rate swaps (continued)
| Receive | | Pay | | | | Notional | | | Value at | | | Upfront
premium | | | Unrealized (depreciation)
appreciation | |
| Rate | | Payment
frequency | | Rate | | Payment
frequency | | Expiration
date | | amount
(000) | | | 6/30/2022
(000) | | | paid
(000) | | | at 6/30/2022
(000) | |
| 1.445% | | Semi-annual | | 3-month NZD-BBR-FRA | | Quarterly | | 9/28/2023 | | NZD | 1,000 | | | | $ | (19 | ) | | | $ | — | | | | $ | (19 | ) |
| 1.4475% | | Semi-annual | | 3-month NZD-BBR-FRA | | Quarterly | | 9/29/2023 | | | 1,019 | | | | | (19 | ) | | | | — | | | | | (19 | ) |
| 1.4475% | | Semi-annual | | 3-month NZD-BBR-FRA | | Quarterly | | 9/30/2023 | | | 1,023 | | | | | (19 | ) | | | | — | | | | | (19 | ) |
| 1.5125% | | Semi-annual | | 3-month NZD-BBR-FRA | | Quarterly | | 10/14/2023 | | | 904 | | | | | (17 | ) | | | | — | | | | | (17 | ) |
| 1.53% | | Semi-annual | | 3-month NZD-BBR-FRA | | Quarterly | | 10/14/2023 | | | 1,031 | | | | | (19 | ) | | | | — | | | | | (19 | ) |
| 1.5625% | | Semi-annual | | 3-month NZD-BBR-FRA | | Quarterly | | 10/15/2023 | | | 1,029 | | | | | (19 | ) | | | | — | | | | | (19 | ) |
| 1.59% | | Semi-annual | | 3-month NZD-BBR-FRA | | Quarterly | | 10/18/2023 | | | 1,029 | | | | | (19 | ) | | | | — | | | | | (19 | ) |
| 1.62% | | Semi-annual | | 3-month NZD-BBR-FRA | | Quarterly | | 10/19/2023 | | | 1,144 | | | | | (21 | ) | | | | — | | | | | (21 | ) |
| 3.7697% | | Semi-annual | | 3-month NZD-BBR-FRA | | Quarterly | | 11/6/2023 | | | 5,500 | | | | | (7 | ) | | | | — | | | | | (7 | ) |
| 2.24% | | Semi-annual | | 3-month NZD-BBR-FRA | | Quarterly | | 11/8/2023 | | | 1,463 | | | | | (20 | ) | | | | — | | | | | (20 | ) |
| 2.2525% | | Semi-annual | | 3-month NZD-BBR-FRA | | Quarterly | | 11/8/2023 | | | 1,463 | | | | | (20 | ) | | | | — | | | | | (20 | ) |
| 2.20% | | Semi-annual | | 3-month NZD-BBR-FRA | | Quarterly | | 11/9/2023 | | | 123 | | | | | (2 | ) | | | | — | | | | | (2 | ) |
| 2.495% | | Annual | | SONIA | | Annual | | 5/5/2024 | | GBP | 3,050 | | | | | (14 | ) | | | | — | | | | | (14 | ) |
| 2.42% | | Annual | | SONIA | | Annual | | 5/5/2024 | | | 6,100 | | | | | (33 | ) | | | | — | | | | | (33 | ) |
| 2.9588% | | Annual | | SONIA | | Annual | | 6/9/2024 | | | 4,180 | | | | | 5 | | | | | — | | | | | 5 | |
| 6.59% | | 28-day | | 28-day MXN-TIIE | | 28-day | | 6/25/2026 | | MXN | 2,000 | | | | | (8 | ) | | | | — | | | | | (8 | ) |
| 6.585% | | 28-day | | 28-day MXN-TIIE | | 28-day | | 6/25/2026 | | | 2,600 | | | | | (11 | ) | | | | — | | | | | (11 | ) |
| 6.64% | | 28-day | | 28-day MXN-TIIE | | 28-day | | 6/25/2026 | | | 3,200 | | | | | (13 | ) | | | | — | | | | | (13 | ) |
| 6.6175% | | 28-day | | 28-day MXN-TIIE | | 28-day | | 6/25/2026 | | | 8,600 | | | | | (36 | ) | | | | — | | | | | (36 | ) |
| 6.633% | | 28-day | | 28-day MXN-TIIE | | 28-day | | 6/25/2026 | | | 8,900 | | | | | (37 | ) | | | | — | | | | | (37 | ) |
| 6.58% | | 28-day | | 28-day MXN-TIIE | | 28-day | | 6/25/2026 | | | 11,300 | | | | | (47 | ) | | | | — | | | | | (47 | ) |
| 7.59% | | 28-day | | 28-day MXN-TIIE | | 28-day | | 10/29/2026 | | | 2,500 | | | | | (7 | ) | | | | — | | | | | (7 | ) |
| 7.62% | | 28-day | | 28-day MXN-TIIE | | 28-day | | 10/29/2026 | | | 3,701 | | | | | (9 | ) | | | | — | | | | | (9 | ) |
| 7.66% | | 28-day | | 28-day MXN-TIIE | | 28-day | | 10/29/2026 | | | 6,100 | | | | | (15 | ) | | | | — | | | | | (15 | ) |
| 7.64% | | 28-day | | 28-day MXN-TIIE | | 28-day | | 10/29/2026 | | | 6,000 | | | | | (15 | ) | | | | — | | | | | (15 | ) |
| 7.52% | | 28-day | | 28-day MXN-TIIE | | 28-day | | 10/30/2026 | | | 7,639 | | | | | (21 | ) | | | | — | | | | | (21 | ) |
| 9.07% | | 28-day | | 28-day MXN-TIIE | | 28-day | | 4/28/2027 | | | 20,400 | | | | | 2 | | | | | — | | | | | 2 | |
| | | | | | | | | | | | | | | | $ | (647 | ) | | | $ | — | | | | $ | (647 | ) |
Credit default swaps
Centrally cleared credit default swaps on credit indices — sell protection
Financing
rate received | | Payment
frequency | | Reference
index | | Expiration
date | | Notional
amount
(000) | | Value at
6/30/2022
(000) | | | Upfront
premium
paid
(000) | | | Unrealized
depreciation
at 6/30/2022
(000) | |
| 1.00% | | Quarterly | | CDX.NA.IG.38 | | 6/20/2027 | | USD8,652 | | | $ | (4 | ) | | | $ | 76 | | | | $ | (80 | ) |
| 154 | American Funds Insurance Series |
American Funds Global Balanced Fund (continued)
(formerly Global Balanced Fund)
Investments in affiliates12
| | | Value of
affiliates at
1/1/2022
(000) | | | Additions
(000) | | | Reductions
(000) | | | Net
realized
loss
(000) | | | Net
unrealized
appreciation
(000) | | | Value of
affiliates at
6/30/2022
(000) | | Dividend
income
(000) | |
| Short-term securities 3.38% | |
| Money market investments 3.11% | |
| Capital Group Central Cash Fund 1.38%11 | | $ | 1,127 | | | $ | 91,279 | | | $ | 80,737 | | | $ | (2 | ) | | $ | — | 14 | | $ | 11,667 | | | $ | 41 | |
| Money market investments purchased with collateral from securities on loan 0.27% | |
| Capital Group Central Cash Fund 1.38%11,13 | | | — | | | | 1,021 | 15 | | | | | | | | | | | | | | | 1,021 | | | | — | 16 |
| Total short-term securities | | | | | | | | | | | | | | | | | | | | | | | 12,688 | | | | | |
| Total 3.38% | | | | | | | | | | | | | | $ | (2 | ) | | $ | — | 14 | | $ | 12,688 | | | $ | 41 | |
| 1 | All or a portion of this security was on loan. The total value of all such securities was $3,814,000, which represented 1.02% of the net assets of the fund. Refer to Note 5 for more information on securities lending. |
| 2 | Security did not produce income during the last 12 months. |
| 3 | All or a portion of this security was pledged as collateral. The total value of pledged collateral was $839,000, which represented .22% of the net assets of the fund. |
| 4 | Index-linked bond whose principal amount moves with a government price index. |
| 5 | Acquired in a transaction exempt from registration under Rule 144A of the Securities Act of 1933. May be resold in the U.S. in transactions exempt from registration, normally to qualified institutional buyers. The total value of all such securities was $4,584,000, which represented 1.22% of the net assets of the fund. |
| 6 | Scheduled interest and/or principal payment was not received. |
| 7 | Step bond; coupon rate may change at a later date. |
| 8 | Principal payments may be made periodically. Therefore, the effective maturity date may be earlier than the stated maturity date. |
| 9 | Purchased on a TBA basis. |
| 10 | Coupon rate may change periodically. Reference rate and spread are as of the most recent information available. Some coupon rates are determined by the issuer or agent based on current market conditions; therefore, the reference rate and spread are not available. |
| 11 | Rate represents the seven-day yield at 6/30/2022. |
| 12 | Part of the same “group of investment companies” as the fund as defined under the Investment Company Act of 1940, as amended. |
| 13 | Security purchased with cash collateral from securities on loan. Refer to Note 5 for more information on securities lending. |
| 14 | Amount less than one thousand. |
| 15 | Represents net activity. Refer to Note 5 for more information on securities lending. |
| 16 | Dividend income is included with securities lending income in the fund’s statement of operations and is not shown in this table. |
Key to abbreviations
ADR = American Depositary Receipts
Assn. = Association
AUD = Australian dollars
BBR = Bank Base Rate
BRL = Brazilian reais
CAD = Canadian dollars
CDI = CREST Depository Interest
CLP = Chilean pesos
CNH = Chinese yuan renminbi
CNY = Chinese yuan
COP = Colombian pesos
DKK = Danish kroner
EUR = Euros
EURIBOR = Euro Interbank Offered Rate
FRA = Forward Rate Agreement
GBP = British pounds
HUF = Hungarian forints
IDR = Indonesian rupiah
INR = Indian rupees
JPY = Japanese yen
KRW = South Korean won
LIBOR = London Interbank Offered Rate
MXN = Mexican pesos
MYR = Malaysian ringgits
NZD = New Zealand dollars
PLN = Polish zloty
Ref. = Refunding
REIT = Real Estate Investment Trust
Rev. = Revenue
RUB = Russian rubles
SEK = Swedish kronor
SOFR = Secured Overnight Financing Rate
SONIA = Sterling Overnight Interbank Average Rate
TBA = To be announced
TIIE = Equilibrium Interbank Interest Rate
USD = U.S. dollars
ZAR = South African rand
Refer to the notes to financial statements.
| American Funds Insurance Series | 155 |
The Bond Fund of America
| Investment portfolio June 30, 2022 | unaudited |
| Bonds, notes & other debt instruments 97.74% | | Principal amount
(000) | | | Value
(000) | |
| U.S. Treasury bonds & notes 34.45% | | | | | | | | |
| U.S. Treasury 18.89% | | | | | | | | |
| U.S. Treasury 0.125% 2023 | | USD | 39,035 | | | $ | 38,075 | |
| U.S. Treasury 0.25% 2024 | | | 40,500 | | | | 38,405 | |
| U.S. Treasury 0.375% 2024 | | | 42,000 | | | | 39,846 | |
| U.S. Treasury 0.375% 2024 | | | 23,504 | | | | 22,441 | |
| U.S. Treasury 0.375% 2024 | | | 15,740 | | | | 14,856 | |
| U.S. Treasury 2.125% 2024 | | | 72,100 | | | | 70,764 | |
| U.S. Treasury 2.50% 2024 | | | 35,000 | | | | 34,691 | |
| U.S. Treasury 2.50% 2024 | | | 22,390 | | | | 22,199 | |
| U.S. Treasury 0.375% 2025 | | | 114,120 | | | | 103,990 | |
| U.S. Treasury 2.875% 20251 | | | 96,200 | | | | 95,793 | |
| U.S. Treasury 2.875% 2025 | | | 72,100 | | | | 71,811 | |
| U.S. Treasury 2.875% 2025 | | | 6,866 | | | | 6,842 | |
| U.S. Treasury 0.375% 2026 | | | 40,000 | | | | 36,369 | |
| U.S. Treasury 0.75% 2026 | | | 26,766 | | | | 24,364 | |
| U.S. Treasury 0.75% 2026 | | | 20,625 | | | | 18,872 | |
| U.S. Treasury 1.375% 20261 | | | 45,000 | | | | 42,060 | |
| U.S. Treasury 0.50% 2027 | | | 125,625 | | | | 111,178 | |
| U.S. Treasury 0.50% 2027 | | | 70,675 | | | | 62,018 | |
| U.S. Treasury 2.25% 20271 | | | 120,200 | | | | 115,235 | |
| U.S. Treasury 2.25% 20271 | | | 72,100 | | | | 69,515 | |
| U.S. Treasury 2.625% 2027 | | | 15,056 | | | | 14,770 | |
| U.S. Treasury 6.125% 2027 | | | 24,000 | | | | 27,583 | |
| U.S. Treasury 1.25% 2028 | | | 79,480 | | | | 71,576 | |
| U.S. Treasury 2.75% 2029 | | | 44,840 | | | | 43,940 | |
| U.S. Treasury 1.625% 2031 | | | 1,630 | | | | 1,455 | |
| U.S. Treasury 2.875% 2032 | | | 31,925 | | | | 31,545 | |
| U.S. Treasury 1.125% 2040 | | | 124,213 | | | | 86,191 | |
| U.S. Treasury 1.375% 2040 | | | 40,000 | | | | 28,701 | |
| U.S. Treasury 1.875% 2041 | | | 79,700 | | | | 62,288 | |
| U.S. Treasury 2.00% 2041 | | | 247 | | | | 195 | |
| U.S. Treasury 2.375% 2042 | | | 14,871 | | | | 12,557 | |
| U.S. Treasury 3.00% 20491 | | | 123,340 | | | | 117,155 | |
| U.S. Treasury 1.25% 20501 | | | 21,285 | | | | 13,483 | |
| U.S. Treasury 1.875% 2051 | | | 4,670 | | | | 3,490 | |
| U.S. Treasury 2.00% 2051 | | | 1,587 | | | | 1,221 | |
| U.S. Treasury 2.25% 20521 | | | 628,814 | | | | 515,222 | |
| U.S. Treasury 2.875% 2052 | | | 1,320 | | | | 1,241 | |
| | | | | | | | 2,071,937 | |
| | | | | | | | | |
| U.S. Treasury inflation-protected securities 15.56% | | | | | | | | |
| U.S. Treasury Inflation-Protected Security 0.125% 20222 | | | 6,799 | | | | 6,825 | |
| U.S. Treasury Inflation-Protected Security 0.125% 20232 | | | 200,073 | | | | 203,596 | |
| U.S. Treasury Inflation-Protected Security 0.375% 20232 | | | 6,377 | | | | 6,493 | |
| U.S. Treasury Inflation-Protected Security 0.625% 20232 | | | 83,356 | | | | 84,819 | |
| U.S. Treasury Inflation-Protected Security 0.125% 20242 | | | 351,896 | | | | 355,487 | |
| U.S. Treasury Inflation-Protected Security 0.125% 20242 | | | 123,409 | | | | 124,212 | |
| U.S. Treasury Inflation-Protected Security 0.50% 20242 | | | 72,952 | | | | 74,002 | |
| U.S. Treasury Inflation-Protected Security 0.625% 20242 | | | 232,229 | | | | 236,077 | |
| U.S. Treasury Inflation-Protected Security 0.125% 20252 | | | 87,139 | | | | 87,082 | |
| U.S. Treasury Inflation-Protected Security 0.125% 20252 | | | 41,070 | | | | 41,092 | |
| U.S. Treasury Inflation-Protected Security 0.25% 20252 | | | 27,421 | | | | 27,592 | |
| U.S. Treasury Inflation-Protected Security 0.375% 20252 | | | 103,865 | | | | 104,894 | |
| U.S. Treasury Inflation-Protected Security 0.125% 20262 | | | 33,471 | | | | 33,153 | |
| U.S. Treasury Inflation-Protected Security 0.125% 20262 | | | 17,486 | | | | 17,342 | |
| U.S. Treasury Inflation-Protected Security 0.125% 20262 | | | 12,968 | | | | 12,844 | |
| U.S. Treasury Inflation-Protected Security 0.625% 20262 | | | 3,201 | | | | 3,238 | |
| U.S. Treasury Inflation-Protected Security 0.125% 20272 | | | 83,953 | | | | 82,613 | |
| U.S. Treasury Inflation-Protected Security 0.375% 20271,2 | | | 83,283 | | | | 83,036 | |
| U.S. Treasury Inflation-Protected Security 0.50% 20281,2 | | | 87,889 | | | | 87,363 | |
| 156 | American Funds Insurance Series |
The Bond Fund of America (continued)
| Bonds, notes & other debt instruments (continued) | | Principal amount
(000) | | | Value
(000) | |
| U.S. Treasury bonds & notes (continued) | | | | | | | | |
| U.S. Treasury inflation-protected securities (continued) | | | | | | | | |
| U.S. Treasury Inflation-Protected Security 0.125% 20312 | | USD | 19,604 | | | $ | 18,602 | |
| U.S. Treasury Inflation-Protected Security 0.125% 20312 | | | 12,947 | | | | 12,285 | |
| U.S. Treasury Inflation-Protected Security 0.125% 20512 | | | 5,935 | | | | 4,535 | |
| | | | | | | | 1,707,182 | |
| | | | | | | | | |
| Total U.S. Treasury bonds & notes | | | | | | | 3,779,119 | |
| | | | | | | | | |
| Corporate bonds, notes & loans 33.56% | | | | | | | | |
| Financials 9.21% | | | | | | | | |
| ACE INA Holdings, Inc. 2.875% 2022 | | | 3,625 | | | | 3,626 | |
| ACE INA Holdings, Inc. 3.35% 2026 | | | 2,025 | | | | 1,984 | |
| ACE INA Holdings, Inc. 4.35% 2045 | | | 2,220 | | | | 2,099 | |
| AerCap Holdings NV 6.50% 2025 | | | 1,798 | | | | 1,842 | |
| AerCap Ireland Capital, Ltd. / AerCap Global Aviation Trust 1.15% 2023 | | | 3,130 | | | | 2,984 | |
| AerCap Ireland Capital, Ltd. / AerCap Global Aviation Trust 1.65% 2024 | | | 5,996 | | | | 5,543 | |
| AerCap Ireland Capital, Ltd. / AerCap Global Aviation Trust 2.45% 2026 | | | 10,289 | | | | 8,966 | |
| AerCap Ireland Capital, Ltd. / AerCap Global Aviation Trust 3.00% 2028 | | | 12,359 | | | | 10,422 | |
| AerCap Ireland Capital, Ltd. / AerCap Global Aviation Trust 3.30% 2032 | | | 12,595 | | | | 10,095 | |
| AerCap Ireland Capital, Ltd. / AerCap Global Aviation Trust 3.40% 2033 | | | 5,120 | | | | 4,049 | |
| AerCap Ireland Capital, Ltd. / AerCap Global Aviation Trust 3.85% 2041 | | | 1,254 | | | | 906 | |
| Ally Financial, Inc. 5.125% 2024 | | | 1,500 | | | | 1,516 | |
| Ally Financial, Inc. 8.00% 2031 | | | 8,479 | | | | 9,288 | |
| Ally Financial, Inc. 8.00% 2031 | | | 7,070 | | | | 7,868 | |
| Arthur J. Gallagher & Co. 3.50% 2051 | | | 1,073 | | | | 822 | |
| Banco Santander, SA 1.722% 2027 (1-year UST Yield Curve Rate T Note Constant Maturity + 0.90% on 9/14/2026)3 | | | 1,400 | | | | 1,216 | |
| Bank of America Corp. 1.53% 2025 (USD-SOFR + 0.65% on 12/6/2024)3 | | | 1,970 | | | | 1,835 | |
| Bank of America Corp. 3.841% 2025 (USD-SOFR + 1.11% on 4/25/2024)3 | | | 2,635 | | | | 2,624 | |
| Bank of America Corp. 1.658% 2027 (USD-SOFR + 0.91% on 3/11/2026)3 | | | 981 | | | | 881 | |
| Bank of America Corp. 1.734% 2027 (USD-SOFR + 0.96% on 7/22/2026)3 | | | 7,989 | | | | 7,115 | |
| Bank of America Corp. 3.419% 2028 (3-month USD-LIBOR + 1.04% on 12/20/2027)3 | | | 10,129 | | | | 9,442 | |
| Bank of America Corp. 4.376% 2028 (USD-SOFR + 1.58% on 4/27/2027)3 | | | 2,635 | | | | 2,596 | |
| Bank of America Corp. 2.087% 2029 (USD-SOFR + 1.06% on 6/14/2028)3 | | | 2,773 | | | | 2,377 | |
| Bank of America Corp. 1.922% 2031 (USD-SOFR + 1.37% on 10/24/2030)3 | | | 21,177 | | | | 16,935 | |
| Bank of America Corp. 2.299% 2032 (USD-SOFR + 1.22% on 7/21/2031)3 | | | 36,155 | | | | 29,253 | |
| Bank of America Corp. 2.572% 2032 (USD-SOFR + 1.21% on 10/20/2031)3 | | | 2,613 | | | | 2,158 | |
| Bank of America Corp. 2.687% 2032 (USD-SOFR + 1.32% on 4/22/2031)3 | | | 8,343 | | | | 7,012 | |
| Bank of America Corp. 2.972% 2033 (USD-SOFR + 1.33% on 2/4/2032)3 | | | 4,089 | | | | 3,487 | |
| Bank of America Corp. 4.571% 2033 (USD-SOFR + 1.83% on 4/27/2032)3 | | | 11,965 | | | | 11,659 | |
| Bank of Nova Scotia 2.45% 2032 | | | 900 | | | | 749 | |
| Berkshire Hathaway Finance Corp. 4.20% 2048 | | | 8,720 | | | | 7,990 | |
| BNP Paribas 2.819% 2025 (3-month USD-LIBOR + 1.111% on 11/19/2024)3,4 | | | 2,875 | | | | 2,750 | |
| BNP Paribas 2.219% 2026 (USD-SOFR + 2.074% on 6/9/2025)3,4 | | | 12,000 | | | | 11,095 | |
| BNP Paribas 1.323% 2027 (USD-SOFR + 1.004% on 1/13/2026)3,4 | | | 9,981 | | | | 8,833 | |
| BNP Paribas 2.591% 2028 (USD-SOFR + 1.228% on 1/20/2027)3,4 | | | 13,134 | | | | 11,824 | |
| BNP Paribas 2.159% 2029 (USD-SOFR + 1.218% on 9/15/2028)3,4 | | | 3,594 | | | | 3,010 | |
| BNP Paribas 2.871% 2032 (USD-SOFR + 1.387% on 4/19/2031)3,4 | | | 4,177 | | | | 3,457 | |
| BNP Paribas 3.132% 2033 (USD-SOFR + 1.561% on 1/20/2032)3,4 | | | 3,694 | | | | 3,096 | |
| Canadian Imperial Bank of Commerce (CIBC) 3.60% 2032 | | | 3,635 | | | | 3,304 | |
| Capital One Financial Corp. 1.343% 2024 (USD-SOFR + 0.69% on 12/6/2023)3 | | | 4,525 | | | | 4,339 | |
| Capital One Financial Corp. 4.927% 2028 (USD-SOFR + 2.057% on 5/10/2027)3 | | | 4,650 | | | | 4,609 | |
| China Ping An Insurance Overseas (Holdings), Ltd. 2.85% 2031 | | | 1,126 | | | | 914 | |
| CIT Group, Inc. 3.929% 2024 (USD-SOFR + 3.827% on 6/19/2023)3 | | | 5,410 | | | | 5,377 | |
| Citigroup, Inc. 4.60% 2026 | | | 1,800 | | | | 1,805 | |
| Citigroup, Inc. 1.462% 2027 (USD-SOFR + 0.67% on 6/9/2026)3 | | | 8,740 | | | | 7,742 | |
| Citigroup, Inc. 3.07% 2028 (USD-SOFR + 1.28% on 2/24/2027)3 | | | 5,520 | | | | 5,125 | |
| Citigroup, Inc. 3.057% 2033 (USD-SOFR + 1.351% on 1/25/2032)3 | | | 2,110 | | | | 1,790 | |
| Citigroup, Inc. 3.785% 2033 (USD-SOFR + 1.939% on 3/17/2032)3 | | | 5,350 | | | | 4,825 | |
| Citigroup, Inc. 4.91% 2033 (USD-SOFR + 2.086% on 5/24/2032)3 | | | 2,373 | | | | 2,344 | |
| Corebridge Financial, Inc. 3.50% 20254 | | | 1,439 | | | | 1,400 | |
| Corebridge Financial, Inc. 3.65% 20274 | | | 4,493 | | | | 4,228 | |
| American Funds Insurance Series | 157 |
The Bond Fund of America (continued)
| Bonds, notes & other debt instruments (continued) | | Principal amount
(000) | | | Value
(000) | |
| Corporate bonds, notes & loans (continued) | | | | | | | | |
| Financials (continued) | | | | | | | | |
| Corebridge Financial, Inc. 3.85% 20294 | | USD | 5,794 | | | $ | 5,360 | |
| Corebridge Financial, Inc. 3.90% 20324 | | | 5,959 | | | | 5,352 | |
| Corebridge Financial, Inc. 4.35% 20424 | | | 361 | | | | 309 | |
| Corebridge Financial, Inc. 4.40% 20524 | | | 1,352 | | | | 1,130 | |
| Crédit Agricole SA 1.907% 2026 (USD-SOFR + 1.676% on 6/16/2025)3,4 | | | 4,450 | | | | 4,099 | |
| Crédit Agricole SA 1.247% 2027 (USD-SOFR + 0.892% on 1/26/2026)3,4 | | | 3,400 | | | | 2,999 | |
| Credit Suisse Group AG 2.997% 2023 (3-month USD-LIBOR + 1.20% on 12/14/2022)3,4 | | | 12,000 | | | | 11,922 | |
| Credit Suisse Group AG 3.80% 2023 | | | 12,925 | | | | 12,809 | |
| Credit Suisse Group AG 4.207% 2024 (3-month USD-LIBOR + 1.24% on 6/12/2023)3,4 | | | 500 | | | | 496 | |
| Credit Suisse Group AG 2.593% 2025 (USD-SOFR + 1.56% on 9/11/2024)3,4 | | | 850 | | | | 801 | |
| Credit Suisse Group AG 2.193% 2026 (USD-SOFR + 2.044% on 6/5/2025)3,4 | | | 5,750 | | | | 5,219 | |
| Credit Suisse Group AG 1.305% 2027 (USD-SOFR + 0.98% on 2/2/2026)3,4 | | | 10,950 | | | | 9,423 | |
| Credit Suisse Group AG 4.194% 2031 (USD-SOFR + 3.73% on 4/1/2030)3,4 | | | 3,096 | | | | 2,742 | |
| Credit Suisse Group AG 3.091% 2032 (USD-SOFR + 1.73% on 5/14/2031)3,4 | | | 7,369 | | | | 5,872 | |
| Danske Bank AS 1.549% 2027 (UST Yield Curve Rate T Note Constant Maturity 1-year + 0.73% on 9/10/2026)3,4 | | | 2,990 | | | | 2,621 | |
| Danske Bank AS 4.298% 2028 (1-year UST Yield Curve Rate T Note Constant Maturity + 1.75% on 4/1/2027)3,4 | | | 2,975 | | | | 2,824 | |
| Deutsche Bank AG 3.30% 2022 | | | 2,695 | | | | 2,695 | |
| Deutsche Bank AG 3.95% 2023 | | | 6,350 | | | | 6,338 | |
| Deutsche Bank AG 0.898% 2024 | | | 2,500 | | | | 2,344 | |
| Deutsche Bank AG 2.222% 2024 (USD-SOFR + 2.159% on 9/18/2023)3 | | | 10,475 | | | | 10,106 | |
| Deutsche Bank AG 3.70% 2024 | | | 5,150 | | | | 5,062 | |
| Deutsche Bank AG 3.70% 2024 | | | 2,550 | | | | 2,521 | |
| Deutsche Bank AG 3.961% 2025 (USD-SOFR + 2.581% on 11/26/2024)3 | | | 8,586 | | | | 8,305 | |
| Deutsche Bank AG 2.129% 2026 (USD-SOFR + 1.87% on 11/24/2025)3 | | | 42,264 | | | | 37,590 | |
| Deutsche Bank AG 4.10% 2026 | | | 7,305 | | | | 7,177 | |
| Deutsche Bank AG 4.10% 2026 | | | 857 | | | | 848 | |
| Deutsche Bank AG 2.311% 2027 (USD-SOFR + 1.219% on 11/16/2026)3 | | | 3,825 | | | | 3,304 | |
| Deutsche Bank AG 2.552% 2028 (USD-SOFR + 1.318% on 1/7/2027)3 | | | 6,135 | | | | 5,315 | |
| Deutsche Bank AG 3.547% 2031 (USD-SOFR + 3.043% on 9/18/2030)3 | | | 2,900 | | | | 2,431 | |
| Deutsche Bank AG 3.035% 2032 (USD-SOFR + 1.718% on 5/28/2031)3 | | | 2,100 | | | | 1,664 | |
| DNB Bank ASA 1.535% 2027 (5-year UST Yield Curve Rate T Note Constant Maturity + 0.72% on 5/25/2026)3,4 | | | 1,200 | | | | 1,072 | |
| GE Capital Funding, LLC 4.55% 2032 | | | 400 | | | | 386 | |
| Goldman Sachs Group, Inc. 1.431% 2027 (USD-SOFR + 0.795% on 3/9/2026)3 | | | 3,030 | | | | 2,691 | |
| Goldman Sachs Group, Inc. 1.542% 2027 (USD-SOFR + 0.818% on 9/10/2026)3 | | | 13,275 | | | | 11,662 | |
| Goldman Sachs Group, Inc. 1.948% 2027 (USD-SOFR + 0.913% on 10/21/2026)3 | | | 13,961 | | | | 12,365 | |
| Goldman Sachs Group, Inc. 2.64% 2028 (USD-SOFR + 1.114% on 2/24/2027)3 | | | 1,235 | | | | 1,122 | |
| Goldman Sachs Group, Inc. 3.615% 2028 (USD-SOFR + 1.846% on 3/15/2027)3 | | | 7,403 | | | | 7,012 | |
| Goldman Sachs Group, Inc. 3.814% 2029 (3-month USD-LIBOR + 1.158% on 4/23/2028)3 | | | 9,600 | | | | 9,061 | |
| Goldman Sachs Group, Inc. 2.383% 2032 (USD-SOFR + 1.248% on 7/21/2031)3 | | | 19,697 | | | | 15,947 | |
| Goldman Sachs Group, Inc. 2.615% 2032 (USD-SOFR + 1.281% on 4/22/2031)3 | | | 2,535 | | | | 2,107 | |
| Goldman Sachs Group, Inc. 2.65% 2032 (USD-SOFR + 1.264% on 10/21/2031)3 | | | 6,075 | | | | 5,013 | |
| Goldman Sachs Group, Inc. 3.102% 2033 (USD-SOFR + 1.41% on 2/24/2032)3 | | | 10,422 | | | | 8,911 | |
| Goldman Sachs Group, Inc. 2.908% 2042 (USD-SOFR + 1.40% on 7/21/2041)3 | | | 3,160 | | | | 2,313 | |
| Goldman Sachs Group, Inc. 5.30% junior subordinated perpetual bonds (3-month USD-LIBOR + 3.834% on 11/10/2026)3 | | | 1,750 | | | | 1,650 | |
| Groupe BPCE SA 2.75% 20234 | | | 6,875 | | | | 6,855 | |
| Groupe BPCE SA 5.70% 20234 | | | 28,166 | | | | 28,597 | |
| Groupe BPCE SA 5.15% 20244 | | | 5,481 | | | | 5,485 | |
| Groupe BPCE SA 1.625% 20254 | | | 2,980 | | | | 2,811 | |
| Groupe BPCE SA 1.652% 2026 (USD-SOFR + 1.52% on 10/6/2025)3,4 | | | 6,350 | | | | 5,693 | |
| HSBC Holdings PLC 2.251% 2027 (USD-SOFR + 1.10% on 11/22/2026)3 | | | 5,270 | | | | 4,699 | |
| HSBC Holdings PLC 4.755% 2028 (USD-SOFR + 2.11% on 6/9/2027)3 | | | 6,610 | | | | 6,432 | |
| HSBC Holdings PLC 2.206% 2029 (USD-SOFR + 1.285% on 8/17/2028)3 | | | 2,628 | | | | 2,210 | |
| HSBC Holdings PLC 4.583% 2029 (3-month USD-LIBOR + 1.535% on 6/19/2028)3 | | | 9,525 | | | | 9,192 | |
| HSBC Holdings PLC 2.804% 2032 (USD-SOFR + 1.187% on 5/24/2031)3 | | | 6,490 | | | | 5,336 | |
| Huarong Finance 2017 Co., Ltd. 4.25% 2027 | | | 6,335 | | | | 5,527 | |
| 158 | American Funds Insurance Series |
The Bond Fund of America (continued)
| Bonds, notes & other debt instruments (continued) | | Principal amount
(000) | | | Value
(000) | |
| Corporate bonds, notes & loans (continued) | | | | | | | | |
| Financials (continued) | | | | | | | | |
| Huarong Finance 2017 Co., Ltd. 4.75% 2027 | | USD | 669 | | | $ | 605 | |
| Huarong Finance 2019 Co., Ltd. (3-month USD-LIBOR + 1.125%) 2.631% 20235 | | | 2,750 | | | | 2,688 | |
| Huarong Finance 2019 Co., Ltd. (3-month USD-LIBOR + 1.25%) 2.756% 20255 | | | 397 | | | | 373 | |
| Huarong Finance II Co., Ltd. 5.00% 2025 | | | 480 | | | | 454 | |
| Huarong Finance II Co., Ltd. 5.50% 2025 | | | 6,669 | | | | 6,477 | |
| Huarong Finance II Co., Ltd. 4.625% 2026 | | | 200 | | | | 184 | |
| Huarong Finance II Co., Ltd. 4.875% 2026 | | | 2,106 | | | | 1,935 | |
| Intercontinental Exchange, Inc. 4.35% 2029 | | | 8,710 | | | | 8,607 | |
| Intercontinental Exchange, Inc. 4.60% 2033 | | | 4,601 | | | | 4,584 | |
| Intercontinental Exchange, Inc. 4.95% 2052 | | | 1,517 | | | | 1,489 | |
| Intercontinental Exchange, Inc. 5.20% 2062 | | | 3,465 | | | | 3,469 | |
| Intesa Sanpaolo SpA 3.375% 20234 | | | 10,035 | | | | 9,993 | |
| Intesa Sanpaolo SpA 3.25% 20244 | | | 770 | | | | 746 | |
| Intesa Sanpaolo SpA 5.017% 20244 | | | 68,143 | | | | 65,083 | |
| Intesa Sanpaolo SpA 5.71% 20264 | | | 15,400 | | | | 14,694 | |
| Intesa Sanpaolo SpA 3.875% 20274 | | | 6,250 | | | | 5,773 | |
| Intesa Sanpaolo SpA 3.875% 20284 | | | 1,986 | | | | 1,839 | |
| Iron Mountain Information Management Services, Inc. 5.00% 20324 | | | 2,060 | | | | 1,667 | |
| JPMorgan Chase & Co. 0.969% 2025 (USD-SOFR + 0.58% on 6/23/2024)3 | | | 5,870 | | | | 5,493 | |
| JPMorgan Chase & Co. 1.561% 2025 (USD-SOFR + 0.605% on 12/10/2024)3 | | | 11,105 | | | | 10,380 | |
| JPMorgan Chase & Co. 4.08% 2026 (USD-SOFR + 1.32% on 4/26/2025)3 | | | 3,620 | | | | 3,580 | |
| JPMorgan Chase & Co. 1.47% 2027 (USD-SOFR + 0.765% on 9/22/2026)3 | | | 5,965 | | | | 5,236 | |
| JPMorgan Chase & Co. 1.578% 2027 (USD-SOFR + 0.885% on 4/22/2026)3 | | | 1,832 | | | | 1,633 | |
| JPMorgan Chase & Co. 2.947% 2028 (USD-SOFR + 1.17% on 2/24/2027)3 | | | 4,350 | | | | 4,034 | |
| JPMorgan Chase & Co. 4.323% 2028 (USD-SOFR + 1.56% on 4/26/2027)3 | | | 12,080 | | | | 11,892 | |
| JPMorgan Chase & Co. 2.069% 2029 (USD-SOFR + 1.015% on 6/1/2028)3 | | | 2,453 | | | | 2,112 | |
| JPMorgan Chase & Co. 3.509% 2029 (3-month USD-LIBOR + 0.945% on 1/23/2028)3 | | | 9,600 | | | | 8,989 | |
| JPMorgan Chase & Co. 4.203% 2029 (3-month USD-LIBOR + 1.26% on 7/23/2028)3 | | | 11,980 | | | | 11,568 | |
| JPMorgan Chase & Co. 2.522% 2031 (USD-SOFR + 2.04% on 4/22/2030)3 | | | 1,766 | | | | 1,506 | |
| JPMorgan Chase & Co. 2.545% 2032 (USD-SOFR + 1.18% on 11/8/2031)3 | | | 5,313 | | | | 4,420 | |
| JPMorgan Chase & Co. 2.58% 2032 (USD-SOFR + 1.25% on 4/22/2031)3 | | | 4,802 | | | | 4,045 | |
| JPMorgan Chase & Co. 2.963% 2033 (USD-SOFR + 1.26% on 1/25/2032)3 | | | 553 | | | | 475 | |
| JPMorgan Chase & Co. 4.586% 2033 (USD-SOFR + 1.80% on 4/26/2032)3 | | | 1,907 | | | | 1,875 | |
| Kasikornbank PCL HK 3.343% 2031 (5-year UST Yield Curve Rate T Note Constant Maturity + 1.70% on 10/2/2026)3 | | | 2,415 | | | | 2,176 | |
| Keb Hana Bank 3.25% 20274 | | | 1,315 | | | | 1,265 | |
| Lloyds Banking Group PLC 2.438% 2026 (1-year UST Yield Curve Rate T Note Constant Maturity + 1.00% on 2/5/2025)3 | | | 2,675 | | | | 2,533 | |
| Lloyds Banking Group PLC 4.375% 2028 | | | 8,825 | | | | 8,583 | |
| Marsh & McLennan Companies, Inc. 2.375% 2031 | | | 367 | | | | 308 | |
| Marsh & McLennan Companies, Inc. 2.90% 2051 | | | 505 | | | | 356 | |
| MetLife Capital Trust IV, junior subordinated, 7.875% 2067 (3-month USD-LIBOR + 3.96% on 12/1/2037)3,4 | | | 1,405 | | | | 1,518 | |
| MetLife, Inc. 3.60% 2025 | | | 3,490 | | | | 3,472 | |
| Mitsubishi UFJ Financial Group, Inc. 0.962% 2025 (1-year UST Yield Curve Rate T Note Constant Maturity + 0.45% on 10/11/2024)3 | | | 2,960 | | | | 2,744 | |
| Mitsubishi UFJ Financial Group, Inc. 1.538% 2027 (1-year UST Yield Curve Rate T Note Constant Maturity + 0.75% on 7/20/2026)3 | | | 6,200 | | | | 5,487 | |
| Mitsubishi UFJ Financial Group, Inc. 1.64% 2027 (1-year UST Yield Curve Rate T Note Constant Maturity + 0.67% on 10/13/2026)3 | | | 2,225 | | | | 1,963 | |
| Mitsubishi UFJ Financial Group, Inc. 2.341% 2028 (1-year UST Yield Curve Rate T Note Constant Maturity + 0.83% on 1/19/2027)3 | | | 2,970 | | | | 2,679 | |
| Mitsubishi UFJ Financial Group, Inc. 4.08% 2028 (1-year UST Yield Curve Rate T Note Constant Maturity + 1.30% on 4/19/2027)3 | | | 2,945 | | | | 2,871 | |
| Mizuho Financial Group, Inc. 1.554% 2027 (1-year UST Yield Curve Rate T Note Constant Maturity + 0.75% on 7/9/2026)3 | | | 4,615 | | | | 4,068 | |
| Morgan Stanley 0.791% 2025 (USD-SOFR + 0.509% on 1/22/2024)3 | | | 3,065 | | | | 2,900 | |
| Morgan Stanley 2.72% 2025 (USD-SOFR + 1.152% on 7/22/2024)3 | | | 2,300 | | | | 2,218 | |
| Morgan Stanley 2.63% 2026 (USD-SOFR + 0.94% on 2/18/2025)3 | | | 2,680 | | | | 2,560 | |
| Morgan Stanley 1.512% 2027 (USD-SOFR + 0.858% on 7/20/2026)3 | | | 10,488 | | | | 9,217 | |
| Morgan Stanley 4.21% 2028 (USD-SOFR + 1.61% on 4/20/2027)3 | | | 3,671 | | | | 3,592 | |
| American Funds Insurance Series | 159 |
The Bond Fund of America (continued)
| Bonds, notes & other debt instruments (continued) | | Principal amount
(000) | | | Value
(000) | |
| Corporate bonds, notes & loans (continued) | | | | | | | | |
| Financials (continued) | | | | | | | | |
| Morgan Stanley 2.239% 2032 (USD-SOFR + 1.178% on 7/21/2031)3 | | USD | 30,007 | | | $ | 24,341 | |
| Morgan Stanley 2.511% 2032 (USD-SOFR + 1.20% on 10/20/2031)3 | | | 3,951 | | | | 3,269 | |
| Morgan Stanley 2.943% 2033 (USD-SOFR + 1.29% on 1/21/2032)3 | | | 6,616 | | | | 5,677 | |
| Morgan Stanley 5.297% 2037 (USD-SOFR + 2.62% on 4/20/2032)3 | | | 2,286 | | | | 2,216 | |
| MSCI, Inc. 3.25% 20334 | | | 2,750 | | | | 2,197 | |
| Navient Corp. 6.75% 2025 | | | 425 | | | | 384 | |
| OneMain Holdings, Inc. 7.125% 2026 | | | 250 | | | | 232 | |
| PNC Financial Services Group, Inc. 2.854% 20223 | | | 5,850 | | | | 5,853 | |
| Rede D’Or Finance SARL 4.50% 20304 | | | 1,572 | | | | 1,330 | |
| Santander Holdings USA, Inc. 3.50% 2024 | | | 8,325 | | | | 8,186 | |
| Santander Holdings USA, Inc. 2.49% 20283 | | | 3,625 | | | | 3,202 | |
| Sumitomo Mitsui Banking Corp. 2.174% 2027 | | | 1,100 | | | | 996 | |
| SVB Financial Group 4.70% junior subordinated perpetual bonds (5-year UST Yield Curve Rate T Note Constant Maturity + 3.064% on 11/15/2031)3 | | | 1,530 | | | | 1,155 | |
| Synchrony Financial 4.375% 2024 | | | 3,640 | | | | 3,620 | |
| Toronto-Dominion Bank 1.95% 2027 | | | 1,060 | | | | 960 | |
| Toronto-Dominion Bank 2.00% 2031 | | | 3,510 | | | | 2,854 | |
| Toronto-Dominion Bank 2.45% 2032 | | | 4,145 | | | | 3,467 | |
| Toronto-Dominion Bank 4.456% 2032 | | | 4,181 | | | | 4,138 | |
| Travelers Companies, Inc. 2.55% 2050 | | | 768 | | | | 535 | |
| UBS Group AG 1.494% 2027 (1-year UST Yield Curve Rate T Note Constant Maturity + 0.85% on 8/10/2026)3,4 | | | 4,000 | | | | 3,503 | |
| UniCredit SpA 4.625% 20274 | | | 1,395 | | | | 1,339 | |
| UniCredit SpA 5.861% 2032 (5-year USD-ICE Swap + 3.703% on 6/19/2027)3,4 | | | 16,130 | | | | 14,212 | |
| Vigorous Champion International, Ltd. 4.25% 2029 | | | 462 | | | | 429 | |
| Wells Fargo & Company 2.406% 2025 (3-month USD-LIBOR + 0.825% on 10/30/2024)3 | | | 20,480 | | | | 19,520 | |
| Wells Fargo & Company 3.908% 2026 (USD-SOFR + 1.32% on 4/25/2025)3 | | | 3,524 | | | | 3,470 | |
| Wells Fargo & Company 3.526% 2028 (USD-SOFR + 1.51% on 3/24/2027)3 | | | 9,236 | | | | 8,756 | |
| Wells Fargo & Company 3.35% 2033 (USD-SOFR + 1.50% on 3/2/2032)3 | | | 7,665 | | | | 6,809 | |
| Wells Fargo & Company 4.611% 2053 (USD-SOFR + 2.13% on 4/25/2052)3 | | | 3,153 | | | | 2,923 | |
| Willis North America, Inc. 4.65% 2027 | | | 1,290 | | | | 1,270 | |
| | | | | | | | 1,010,284 | |
| | | | | | | | | |
| Utilities 4.28% | | | | | | | | |
| AEP Texas, Inc. 3.45% 2051 | | | 1,475 | | | | 1,135 | |
| Alabama Power Co. 3.00% 2052 | | | 3,880 | | | | 2,854 | |
| Alfa Desarrollo SpA 4.55% 20514 | | | 1,002 | | | | 722 | |
| Ameren Corp. 4.50% 2049 | | | 2,875 | | | | 2,777 | |
| Baltimore Gas & Electric 4.55% 2052 | | | 525 | | | | 510 | |
| Berkshire Hathaway Energy Company 4.50% 2045 | | | 5,895 | | | | 5,471 | |
| Comisión Federal de Electricidad 4.688% 20294 | | | 3,655 | | | | 3,281 | |
| Comisión Federal de Electricidad 3.875% 20334 | | | 1,340 | | | | 1,016 | |
| Connecticut Light and Power Co. 2.05% 2031 | | | 1,775 | | | | 1,502 | |
| Consumers Energy Co. 4.05% 2048 | | | 1,413 | | | | 1,289 | |
| Consumers Energy Co. 3.10% 2050 | | | 4,123 | �� | | | 3,176 | |
| Consumers Energy Co. 3.75% 2050 | | | 5,625 | | | | 4,915 | |
| Consumers Energy Co. 3.50% 2051 | | | 235 | | | | 196 | |
| Duke Energy Corp. 3.75% 2024 | | | 3,826 | | | | 3,825 | |
| Duke Energy Florida, LLC 3.40% 2046 | | | 5,669 | | | | 4,476 | |
| Duke Energy Florida, LLC 3.00% 2051 | | | 711 | | | | 532 | |
| Duke Energy Progress, LLC 3.70% 2028 | | | 3,750 | | | | 3,635 | |
| Duke Energy Progress, LLC 2.00% 2031 | | | 1,775 | | | | 1,472 | |
| Duke Energy Progress, LLC 2.50% 2050 | | | 644 | | | | 441 | |
| Edison International 3.125% 2022 | | | 2,900 | | | | 2,896 | |
| Edison International 3.55% 2024 | | | 6,850 | | | | 6,689 | |
| Edison International 4.95% 2025 | | | 175 | | | | 176 | |
| Edison International 5.75% 2027 | | | 3,181 | | | | 3,231 | |
| Edison International 4.125% 2028 | | | 3,644 | | | | 3,401 | |
| 160 | American Funds Insurance Series |
The Bond Fund of America (continued)
| Bonds, notes & other debt instruments (continued) | | Principal amount
(000) | | | Value
(000) | |
| Corporate bonds, notes & loans (continued) | | | | | | | | |
| Utilities (continued) | | | | | | | | |
| Electricité de France SA 2.625% junior subordinated perpetual bonds (5-year EUR Mid-Swap + 2.86% on 6/1/2028)3 | | EUR | 2,800 | | | $ | 2,077 | |
| Emera US Finance LP 0.833% 2024 | | USD | 600 | | | | 561 | |
| Emera US Finance LP 2.639% 2031 | | | 4,400 | | | | 3,660 | |
| Emera, Inc. 6.75% 2076 (3-month USD-LIBOR + 5.44% on 6/15/2026)3 | | | 1,425 | | | | 1,380 | |
| Enel Società per Azioni 8.75% 2073 (USD Semi Annual 30/360 (vs. 3-month USD-LIBOR) + 5.88% on 9/24/2023)3,4 | | | 1,000 | | | | 1,028 | |
| ENN Clean Energy International Investment, Ltd. 3.375% 20264 | | | 1,310 | | | | 1,191 | |
| Entergy Louisiana, LLC 4.20% 2048 | | | 6,325 | | | | 5,818 | |
| Eversource Energy 3.80% 2023 | | | 5,000 | | | | 5,013 | |
| FirstEnergy Corp. 1.60% 2026 | | | 20,066 | | | | 17,548 | |
| FirstEnergy Corp. 3.50% 20284 | | | 2,400 | | | | 2,260 | |
| FirstEnergy Corp. 4.10% 20284 | | | 425 | | | | 415 | |
| FirstEnergy Corp. 2.25% 2030 | | | 13,707 | | | | 10,880 | |
| FirstEnergy Corp. 2.65% 2030 | | | 12,524 | | | | 10,351 | |
| FirstEnergy Corp., Series B, 4.40% 20273 | | | 12,178 | | | | 11,509 | |
| FirstEnergy Transmission, LLC 2.866% 20284 | | | 4,000 | | | | 3,387 | |
| Florida Power & Light Company 2.45% 2032 | | | 6,025 | | | | 5,257 | |
| Florida Power & Light Company 2.875% 2051 | | | 9,334 | | | | 6,961 | |
| Georgia Power Co. 3.70% 2050 | | | 275 | | | | 219 | |
| Interchile SA 4.50% 20564 | | | 465 | | | | 383 | |
| Israel Electric Corp., Ltd. 4.25% 20284 | | | 10,190 | | | | 9,821 | |
| Israel Electric Corp., Ltd. 3.75% 20324 | | | 340 | | | | 305 | |
| Jersey Central Power & Light Co. 2.75% 20324 | | | 525 | | | | 447 | |
| Mississippi Power Co. 4.25% 2042 | | | 5,020 | | | | 4,387 | |
| Monongahela Power Co. 3.55% 20274 | | | 1,700 | | | | 1,619 | |
| NextEra Energy Capital Holdings, Inc. 1.875% 2027 | | | 3,000 | | | | 2,708 | |
| NextEra Energy Capital Holdings, Inc. 2.44% 2032 | | | 2,765 | | | | 2,305 | |
| NiSource Finance Corp. 5.00% 2052 | | | 2,150 | | | | 2,105 | |
| Northern States Power Co. 3.20% 2052 | | | 298 | | | | 235 | |
| Northern States Power Co. 4.50% 2052 | | | 3,065 | | | | 3,028 | |
| Pacific Gas and Electric Co. 1.367% 2023 | | | 11,550 | | | | 11,377 | |
| Pacific Gas and Electric Co. 3.25% 2023 | | | 5,615 | | | | 5,537 | |
| Pacific Gas and Electric Co. 3.40% 2024 | | | 2,000 | | | | 1,924 | |
| Pacific Gas and Electric Co. 2.95% 2026 | | | 10,850 | | | | 9,872 | |
| Pacific Gas and Electric Co. 3.15% 2026 | | | 27,543 | | | | 25,256 | |
| Pacific Gas and Electric Co. 3.30% 2027 | | | 12,289 | | | | 10,741 | |
| Pacific Gas and Electric Co. 3.30% 2027 | | | 5,850 | | | | 5,246 | |
| Pacific Gas and Electric Co. 3.75% 2028 | | | 13,075 | | | | 11,555 | |
| Pacific Gas and Electric Co. 4.65% 2028 | | | 7,900 | | | | 7,326 | |
| Pacific Gas and Electric Co. 4.55% 2030 | | | 35,299 | | | | 31,399 | |
| Pacific Gas and Electric Co. 2.50% 2031 | | | 19,695 | | | | 15,083 | |
| Pacific Gas and Electric Co. 3.25% 2031 | | | 1,300 | | | | 1,051 | |
| Pacific Gas and Electric Co. 3.30% 2040 | | | 8,898 | | | | 6,148 | |
| Pacific Gas and Electric Co. 3.75% 2042 | | | 9,466 | | | | 6,423 | |
| Pacific Gas and Electric Co. 4.75% 2044 | | | 336 | | | | 258 | |
| Pacific Gas and Electric Co. 3.50% 2050 | | | 6,836 | | | | 4,579 | |
| Public Service Electric and Gas Co. 3.20% 2029 | | | 6,000 | | | | 5,721 | |
| Public Service Electric and Gas Co. 1.90% 2031 | | | 775 | | | | 645 | |
| Public Service Electric and Gas Co. 3.10% 2032 | | | 7,500 | | | | 6,898 | |
| Puget Energy, Inc. 3.65% 2025 | | | 300 | | | | 294 | |
| Southern California Edison Co. 2.85% 2029 | | | 8,200 | | | | 7,273 | |
| Southern California Edison Co. 4.20% 2029 | | | 11,000 | | | | 10,595 | |
| Southern California Edison Co. 2.50% 2031 | | | 5,149 | | | | 4,329 | |
| Southern California Edison Co. 5.35% 2035 | | | 6,450 | | | | 6,444 | |
| Southern California Edison Co. 5.75% 2035 | | | 4,549 | | | | 4,710 | |
| Southern California Edison Co. 5.625% 2036 | | | 7,051 | | | | 7,125 | |
| Southern California Edison Co. 5.55% 2037 | | | 3,844 | | | | 3,872 | |
| Southern California Edison Co. 5.95% 2038 | | | 5,121 | | | | 5,312 | |
| Southern California Edison Co. 4.00% 2047 | | | 9,402 | | | | 7,645 | |
| Southern California Edison Co. 4.125% 2048 | | | 8,048 | | | | 6,637 | |
| American Funds Insurance Series | 161 |
The Bond Fund of America (continued)
| Bonds, notes & other debt instruments (continued) | | Principal amount
(000) | | | Value
(000) | |
| Corporate bonds, notes & loans (continued) | | | | | | | | |
| Utilities (continued) | | | | | | | | |
| Southern California Edison Co. 4.875% 2049 | | USD | 916 | | | $ | 832 | |
| Southern California Edison Co. 3.65% 2050 | | | 5,353 | | | | 4,102 | |
| Southern California Edison Co. 3.65% 2051 | | | 6,978 | | | | 5,428 | |
| Southern California Edison Co., Series C, 3.60% 2045 | | | 2,717 | | | | 2,060 | |
| Southwestern Electric Power Co. 1.65% 2026 | | | 3,550 | | | | 3,237 | |
| Southwestern Electric Power Co. 3.25% 2051 | | | 2,270 | | | | 1,685 | |
| Union Electric Co. 2.15% 2032 | | | 3,175 | | | | 2,641 | |
| Virginia Electric and Power Co. 2.30% 2031 | | | 2,425 | | | | 2,053 | |
| Virginia Electric and Power Co. 2.40% 2032 | | | 5,795 | | | | 4,958 | |
| WEC Energy Group, Inc. 2.20% 2028 | | | 1,575 | | | | 1,379 | |
| Wisconsin Electric Power Co. 2.85% 2051 | | | 375 | | | | 273 | |
| Wisconsin Power and Light Co. 1.95% 2031 | | | 525 | | | | 437 | |
| Wisconsin Power and Light Co. 3.65% 2050 | | | 1,075 | | | | 884 | |
| Xcel Energy, Inc. 3.30% 2025 | | | 5,650 | | | | 5,551 | |
| Xcel Energy, Inc. 1.75% 2027 | | | 5,660 | | | | 5,061 | |
| Xcel Energy, Inc. 2.60% 2029 | | | 2,925 | | | | 2,553 | |
| Xcel Energy, Inc. 2.35% 2031 | | | 8,500 | | | | 7,026 | |
| Xcel Energy, Inc. 4.60% 2032 | | | 11,675 | | | | 11,590 | |
| | | | | | | | 469,501 | |
| | | | | | | | | |
| Consumer discretionary 4.04% | | | | | | | | |
| Allied Universal Holdco, LLC 4.625% 20284 | | | 335 | | | | 277 | |
| Amazon.com, Inc. 3.30% 2027 | | | 1,760 | | | | 1,728 | |
| Amazon.com, Inc. 1.65% 2028 | | | 3,860 | | | | 3,424 | |
| Amazon.com, Inc. 3.45% 2029 | | | 1,305 | | | | 1,270 | |
| Amazon.com, Inc. 3.60% 2032 | | | 6,830 | | | | 6,584 | |
| Amazon.com, Inc. 2.875% 2041 | | | 650 | | | | 521 | |
| Amazon.com, Inc. 3.10% 2051 | | | 9,380 | | | | 7,400 | |
| Amazon.com, Inc. 3.95% 2052 | | | 1,635 | | | | 1,513 | |
| Amazon.com, Inc. 3.25% 2061 | | | 4,100 | | | | 3,128 | |
| Amazon.com, Inc. 4.10% 2062 | | | 470 | | | | 426 | |
| Atlas LuxCo 4 SARL 4.625% 20284 | | | 255 | | | | 207 | |
| Bayerische Motoren Werke AG 1.25% 20264 | | | 100 | | | | 90 | |
| Bayerische Motoren Werke AG 3.45% 20274 | | | 1,075 | | | | 1,049 | |
| Bayerische Motoren Werke AG 1.95% 20314 | | | 620 | | | | 507 | |
| Bayerische Motoren Werke AG 3.70% 20324 | | | 1,350 | | | | 1,275 | |
| Daimler Trucks Finance North America, LLC 1.125% 20234 | | | 3,015 | | | | 2,896 | |
| Daimler Trucks Finance North America, LLC 1.625% 20244 | | | 4,950 | | | | 4,658 | |
| Daimler Trucks Finance North America, LLC 3.50% 20254 | | | 1,750 | | | | 1,716 | |
| Daimler Trucks Finance North America, LLC 3.65% 20274 | | | 4,140 | | | | 3,969 | |
| Daimler Trucks Finance North America, LLC 2.375% 20284 | | | 3,975 | | | | 3,425 | |
| Daimler Trucks Finance North America, LLC 2.50% 20314 | | | 9,625 | | | | 7,853 | |
| DaimlerChrysler North America Holding Corp. 1.75% 20234 | | | 8,000 | | | | 7,907 | |
| DaimlerChrysler North America Holding Corp. 3.35% 20234 | | | 2,000 | | | | 2,003 | |
| Ford Motor Credit Company, LLC 5.125% 2025 | | | 3,870 | | | | 3,704 | |
| Ford Motor Credit Company, LLC 3.815% 2027 | | | 3,790 | | | | 3,229 | |
| Ford Motor Credit Company, LLC 4.125% 2027 | | | 39,080 | | | | 34,523 | |
| Ford Motor Credit Company, LLC 4.271% 2027 | | | 18,542 | | | | 16,667 | |
| Ford Motor Credit Company, LLC 5.113% 2029 | | | 4,205 | | | | 3,779 | |
| General Motors Company 4.35% 2025 | | | 11,358 | | | | 11,229 | |
| General Motors Company 6.125% 2025 | | | 28,743 | | | | 29,756 | |
| General Motors Company 4.20% 2027 | | | 1,030 | | | | 978 | |
| General Motors Company 5.40% 2048 | | | 7,200 | | | | 6,278 | |
| General Motors Financial Co. 3.55% 2022 | | | 3,703 | | | | 3,703 | |
| General Motors Financial Co. 3.25% 2023 | | | 964 | | | | 963 | |
| General Motors Financial Co. 1.05% 2024 | | | 4,200 | | | | 3,984 | |
| General Motors Financial Co. 3.50% 2024 | | | 9,945 | | | | 9,727 | |
| General Motors Financial Co. 2.75% 2025 | | | 3,634 | | | | 3,415 | |
| General Motors Financial Co. 2.90% 2025 | | | 1,032 | | | | 986 | |
| General Motors Financial Co. 3.80% 2025 | | | 3,153 | | | | 3,078 | |
| 162 | American Funds Insurance Series |
The Bond Fund of America (continued)
| Bonds, notes & other debt instruments (continued) | | Principal amount
(000) | | | Value
(000) | |
| Corporate bonds, notes & loans (continued) | | | | | | | | |
| Consumer discretionary (continued) | | | | | | | | |
| General Motors Financial Co. 1.50% 2026 | | USD | 5,050 | | | $ | 4,415 | |
| General Motors Financial Co. 2.35% 2027 | | | 4,070 | | | | 3,588 | |
| General Motors Financial Co. 2.70% 2027 | | | 2,406 | | | | 2,119 | |
| General Motors Financial Co. 2.40% 2028 | | | 13,909 | | | | 11,769 | |
| General Motors Financial Co. 2.40% 2028 | | | 464 | | | | 386 | |
| General Motors Financial Co. 3.60% 2030 | | | 465 | | | | 402 | |
| General Motors Financial Co. 2.35% 2031 | | | 6,075 | | | | 4,716 | |
| General Motors Financial Co. 2.70% 2031 | | | 6,075 | | | | 4,793 | |
| Grand Canyon University 4.125% 2024 | | | 4,190 | | | | 4,006 | |
| Home Depot, Inc. 2.95% 2029 | | | 6,081 | | | | 5,681 | |
| Home Depot, Inc. 4.50% 2048 | | | 1,915 | | | | 1,871 | |
| Hyundai Capital America 2.85% 20224 | | | 4,118 | | | | 4,108 | |
| Hyundai Capital America 3.25% 20224 | | | 1,521 | | | | 1,521 | |
| Hyundai Capital America 1.25% 20234 | | | 3,150 | | | | 3,054 | |
| Hyundai Capital America 2.375% 20234 | | | 9,977 | | | | 9,852 | |
| Hyundai Capital America 0.875% 20244 | | | 2,780 | | | | 2,601 | |
| Hyundai Capital America 1.00% 20244 | | | 2,750 | | | | 2,555 | |
| Hyundai Capital America 3.40% 20244 | | | 8,180 | | | | 8,030 | |
| Hyundai Capital America 1.80% 20254 | | | 12,714 | | | | 11,642 | |
| Hyundai Capital America 2.65% 20254 | | | 13,054 | | | | 12,464 | |
| Hyundai Capital America 1.30% 20264 | | | 6,000 | | | | 5,332 | |
| Hyundai Capital America 1.50% 20264 | | | 8,310 | | | | 7,365 | |
| Hyundai Capital America 1.65% 20264 | | | 7,275 | | | | 6,421 | |
| Hyundai Capital America 2.375% 20274 | | | 6,264 | | | | 5,516 | |
| Hyundai Capital America 3.00% 20274 | | | 10,408 | | | | 9,583 | |
| Hyundai Capital America 1.80% 20284 | | | 6,000 | | | | 5,070 | |
| Hyundai Capital America 2.00% 20284 | | | 5,900 | | | | 4,966 | |
| Hyundai Capital America 2.10% 20284 | | | 4,010 | | | | 3,384 | |
| Hyundai Capital Services, Inc. 1.25% 20264 | | | 3,695 | | | | 3,328 | |
| KIA Corp. 2.375% 20254 | | | 1,580 | | | | 1,513 | |
| Limited Brands, Inc. 6.875% 2035 | | | 740 | | | | 603 | |
| Marriott International, Inc. 5.75% 2025 | | | 330 | | | | 343 | |
| Marriott International, Inc. 3.125% 2026 | | | 410 | | | | 392 | |
| Marriott International, Inc. 2.75% 2033 | | | 2,226 | | | | 1,753 | |
| McDonald’s Corp. 2.125% 2030 | | | 2,482 | | | | 2,124 | |
| McDonald’s Corp. 4.45% 2047 | | | 3,535 | | | | 3,284 | |
| McDonald’s Corp. 3.625% 2049 | | | 2,938 | | | | 2,433 | |
| Meituan Dianping 3.05% 20304 | | | 3,200 | | | | 2,385 | |
| Nissan Motor Co., Ltd. 2.60% 20224 | | | 1,415 | | | | 1,408 | |
| Nissan Motor Co., Ltd. 3.043% 20234 | | | 240 | | | | 236 | |
| Nissan Motor Co., Ltd. 3.522% 20254 | | | 800 | | | | 758 | |
| Nissan Motor Co., Ltd. 2.00% 20264 | | | 12,000 | | | | 10,396 | |
| Nissan Motor Co., Ltd. 4.345% 20274 | | | 1,790 | | | | 1,645 | |
| Nissan Motor Co., Ltd. 2.75% 20284 | | | 11,200 | | | | 9,374 | |
| Nissan Motor Co., Ltd. 4.81% 20304 | | | 17,533 | | | | 15,593 | |
| Sands China, Ltd. 2.55% 20273,4 | | | 2,368 | | | | 1,728 | |
| Starbucks Corp. 3.75% 2047 | | | 3,785 | | | | 3,077 | |
| Stellantis Finance US, Inc. 1.711% 20274 | | | 3,500 | | | | 3,046 | |
| Stellantis Finance US, Inc. 2.691% 20314 | | | 4,280 | | | | 3,393 | |
| Toyota Motor Credit Corp. 3.375% 2030 | | | 4,954 | | | | 4,665 | |
| VICI Properties LP / VICI Note Co., Inc. 4.125% 20304 | | | 425 | | | | 368 | |
| Volkswagen Group of America Finance, LLC 4.25% 20234 | | | 15,000 | | | | 15,009 | |
| Volkswagen Group of America Finance, LLC 2.85% 20244 | | | 1,087 | | | | 1,060 | |
| Volkswagen Group of America Finance, LLC 3.35% 20254 | | | 2,636 | | | | 2,550 | |
| Volkswagen Group of America Finance, LLC 4.35% 20274 | | | 2,550 | | | | 2,502 | |
| Wyndham Destinations, Inc. 6.625% 20264 | | | 675 | | | | 641 | |
| Wynn Resorts Finance, LLC 5.125% 20294 | | | 410 | | | | 323 | |
| | | | | | | | 442,965 | |
| American Funds Insurance Series | 163 |
The Bond Fund of America (continued)
| Bonds, notes & other debt instruments (continued) | | Principal amount
(000) | | | Value
(000) | |
| Corporate bonds, notes & loans (continued) | | | | | | | | |
| Energy 3.52% | | | | | | | | |
| Antero Resources Corp. 5.375% 20304 | | USD | 280 | | | $ | 256 | |
| Apache Corp. 4.625% 2025 | | | 645 | | | | 643 | |
| Apache Corp. 4.25% 2030 | | | 2,465 | �� | | | 2,189 | |
| Apache Corp. 5.35% 2049 | | | 800 | | | | 634 | |
| Baker Hughes Co. 2.061% 2026 | | | 1,136 | | | | 1,043 | |
| Canadian Natural Resources, Ltd. 2.05% 2025 | | | 754 | | | | 706 | |
| Canadian Natural Resources, Ltd. 3.85% 2027 | | | 1,151 | | | | 1,104 | |
| Cenovus Energy, Inc. 5.375% 2025 | | | 2,763 | | | | 2,847 | |
| Cenovus Energy, Inc. 4.25% 2027 | | | 18,067 | | | | 17,725 | |
| Cenovus Energy, Inc. 2.65% 2032 | | | 2,969 | | | | 2,459 | |
| Cenovus Energy, Inc. 5.25% 2037 | | | 770 | | | | 753 | |
| Cenovus Energy, Inc. 5.40% 2047 | | | 15,180 | | | | 14,617 | |
| Cheniere Energy Partners LP 3.25% 20324 | | | 937 | | | | 740 | |
| Cheniere Energy, Inc. 7.00% 2024 | | | 410 | | | | 425 | |
| Chevron Corp. 2.355% 2022 | | | 4,800 | | | | 4,793 | |
| Chevron Corp. 2.954% 2026 | | | 3,365 | | | | 3,285 | |
| Chevron Corp. 3.078% 2050 | | | 692 | | | | 552 | |
| Columbia Pipeline Partners LP 5.80% 2045 | | | 1,410 | | | | 1,454 | |
| Devon Energy Corp. 4.50% 2030 | | | 5,197 | | | | 4,914 | |
| Diamondback Energy, Inc. 4.40% 2051 | | | 2,016 | | | | 1,721 | |
| Diamondback Energy, Inc. 4.25% 2052 | | | 3,135 | | | | 2,607 | |
| DT Midstream, Inc. 4.125% 20294 | | | 555 | | | | 472 | |
| Ecopetrol SA 5.875% 2045 | | | 452 | | | | 308 | |
| Enbridge, Inc. 4.00% 2023 | | | 1,500 | | | | 1,506 | |
| Energy Transfer Operating LP 5.875% 2024 | | | 294 | | | | 300 | |
| Energy Transfer Operating LP 2.90% 2025 | | | 4,402 | | | | 4,188 | |
| Energy Transfer Operating LP 3.75% 2030 | | | 5,567 | | | | 5,023 | |
| Energy Transfer Operating LP 5.00% 2050 | | | 14,895 | | | | 12,698 | |
| Energy Transfer Partners LP 4.20% 2023 | | | 2,860 | | | | 2,866 | |
| Energy Transfer Partners LP 4.50% 2024 | | | 4,915 | | | | 4,921 | |
| Energy Transfer Partners LP 4.75% 2026 | | | 1,506 | | | | 1,502 | |
| Energy Transfer Partners LP 4.95% 2028 | | | 4,559 | | | | 4,497 | |
| Energy Transfer Partners LP 5.25% 2029 | | | 1,275 | | | | 1,264 | |
| Energy Transfer Partners LP 5.30% 2047 | | | 8,984 | | | | 7,797 | |
| Energy Transfer Partners LP 6.25% junior subordinated perpetual bonds (3-month USD-LIBOR + 4.028% on 2/15/2023)3 | | | 7,850 | | | | 5,894 | |
| Energy Transfer Partners LP 6.625% junior subordinated perpetual bonds (3-month USD-LIBOR + 4.155% on 2/15/2028)3 | | | 500 | | | | 370 | |
| Enterprise Products Operating, LLC 3.20% 2052 | | | 1,771 | | | | 1,274 | |
| Enterprise Products Operating, LLC 3.30% 2053 | | | 2,358 | | | | 1,719 | |
| EQT Corp. 7.50% 20303 | | | 7,500 | | | | 8,065 | |
| Equinor ASA 3.625% 2028 | | | 4,928 | | | | 4,821 | |
| Equinor ASA 3.125% 2030 | | | 20,000 | | | | 18,563 | |
| Equinor ASA 3.25% 2049 | | | 5,687 | | | | 4,523 | |
| Exxon Mobil Corp. 3.043% 2026 | | | 4,625 | | | | 4,544 | |
| Exxon Mobil Corp. 2.61% 2030 | | | 1,040 | | | | 935 | |
| MPLX LP 4.00% 2028 | | | 4,665 | | | | 4,436 | |
| MPLX LP 5.50% 2049 | | | 8,081 | | | | 7,514 | |
| Odebrecht Drilling Norbe 1.00% PIK and 6.35% Cash 20264,6 | | | 39 | | | | 24 | |
| Odebrecht Drilling Norbe 0% perpetual bonds4 | | | 1,150 | | | | 5 | |
| Oleoducto Central SA 4.00% 20274 | | | 1,715 | | | | 1,434 | |
| Oleoducto Central SA 4.00% 2027 | | | 350 | | | | 293 | |
| ONEOK, Inc. 2.20% 2025 | | | 193 | | | | 180 | |
| ONEOK, Inc. 4.55% 2028 | | | 1,610 | | | | 1,558 | |
| ONEOK, Inc. 6.35% 2031 | | | 984 | | | | 1,029 | |
| ONEOK, Inc. 5.20% 2048 | | | 9,363 | | | | 8,321 | |
| ONEOK, Inc. 4.45% 2049 | | | 440 | | | | 351 | |
| ONEOK, Inc. 7.15% 2051 | | | 3,275 | | | | 3,482 | |
| Petróleos Mexicanos 3.50% 2023 | | | 1,500 | | | | 1,479 | |
| Petróleos Mexicanos 6.875% 2025 | | | 5,000 | | | | 4,687 | |
| Petróleos Mexicanos 6.875% 2026 | | | 43,810 | | | | 39,562 | |
| 164 | American Funds Insurance Series |
The Bond Fund of America (continued)
| Bonds, notes & other debt instruments (continued) | | Principal amount
(000) | | | Value
(000) | |
| Corporate bonds, notes & loans (continued) | | | | | | | | |
| Energy (continued) | | | | | | | | |
| Petróleos Mexicanos 6.50% 2027 | | USD | 31,829 | | | $ | 27,694 | |
| Petróleos Mexicanos 6.50% 2029 | | | 3,409 | | | | 2,782 | |
| Petróleos Mexicanos 8.75% 20294 | | | 7,215 | | | | 6,545 | |
| Petróleos Mexicanos 6.70% 2032 | | | 18,259 | | | | 13,961 | |
| Petróleos Mexicanos 7.69% 2050 | | | 285 | | | | 191 | |
| Qatar Petroleum 2.25% 20314 | | | 22,020 | | | | 18,846 | |
| Qatar Petroleum 3.125% 20414 | | | 7,310 | | | | 5,751 | |
| Qatar Petroleum 3.30% 20514 | | | 2,185 | | | | 1,693 | |
| SA Global Sukuk, Ltd. 1.602% 20264 | | | 7,645 | | | | 6,982 | |
| Sabine Pass Liquefaction, LLC 5.625% 20233 | | | 1,000 | | | | 1,010 | |
| Sabine Pass Liquefaction, LLC 5.75% 2024 | | | 8,000 | | | | 8,166 | |
| Sabine Pass Liquefaction, LLC 5.625% 2025 | | | 10,000 | | | | 10,211 | |
| Sabine Pass Liquefaction, LLC 5.875% 2026 | | | 15,700 | | | | 16,249 | |
| Shell International Finance BV 3.875% 2028 | | | 9,410 | | | | 9,293 | |
| Shell International Finance BV 2.75% 2030 | | | 1,186 | | | | 1,071 | |
| Southwestern Energy Co. 5.95% 20253 | | | 495 | | | | 490 | |
| Sunoco Logistics Operating Partners LP 5.40% 2047 | | | 5,396 | | | | 4,745 | |
| Total Capital Canada, Ltd. 2.75% 2023 | | | 2,140 | | | | 2,125 | |
| Total Capital International 3.455% 2029 | | | 885 | | | | 843 | |
| TransCanada PipeLines, Ltd. 4.10% 2030 | | | 1,578 | | | | 1,509 | |
| Western Midstream Operating, LP 3.60% 2025 (3.35% on 8/1/2022)3 | | | 2,782 | | | | 2,568 | |
| Western Midstream Operating, LP 4.55% 2030 (4.30% on 8/1/2022)3 | | | 2,202 | | | | 1,911 | |
| Western Midstream Operating, LP 5.75% 2050 (5.50% on 8/1/2022)3 | | | 3,079 | | | | 2,482 | |
| Williams Partners LP 4.50% 2023 | | | 500 | | | | 504 | |
| Williams Partners LP 4.30% 2024 | | | 595 | | | | 598 | |
| | | | | | | | 386,092 | |
| | | | | | | | | |
| Health care 3.17% | | | | | | | | |
| AbbVie, Inc. 3.20% 2029 | | | 4,783 | | | | 4,404 | |
| AbbVie, Inc. 4.25% 2049 | | | 8 | | | | 7 | |
| Amgen, Inc. 2.45% 2030 | | | 5,131 | | | | 4,479 | |
| Amgen, Inc. 3.35% 2032 | | | 493 | | | | 452 | |
| Amgen, Inc. 4.40% 2062 | | | 196 | | | | 171 | |
| Anthem, Inc. 2.375% 2025 | | | 1,534 | | | | 1,479 | |
| Anthem, Inc. 4.10% 2032 | | | 8,711 | | | | 8,486 | |
| Anthem, Inc. 4.55% 2052 | | | 1,721 | | | | 1,623 | |
| AstraZeneca Finance, LLC 1.75% 2028 | | | 1,429 | | | | 1,262 | |
| AstraZeneca Finance, LLC 2.25% 2031 | | | 2,087 | | | | 1,819 | |
| AstraZeneca PLC 4.00% 2029 | | | 5,920 | | | | 5,901 | |
| Bausch Health Companies, Inc. 4.875% 20284 | | | 830 | | | | 651 | |
| Baxter International, Inc. 2.539% 2032 | | | 3,906 | | | | 3,301 | |
| Bayer US Finance II, LLC 4.25% 20254 | | | 17,570 | | | | 17,370 | |
| Centene Corp. 4.25% 2027 | | | 14,860 | | | | 13,917 | |
| Centene Corp. 2.45% 2028 | | | 12,410 | | | | 10,384 | |
| Centene Corp. 4.625% 2029 | | | 14,945 | | | | 13,980 | |
| Centene Corp. 3.375% 2030 | | | 15,718 | | | | 13,375 | |
| Centene Corp. 2.50% 2031 | | | 8,550 | | | | 6,813 | |
| Centene Corp. 2.625% 2031 | | | 2,510 | | | | 2,002 | |
| Danaher Corp. 2.80% 2051 | | | 1,090 | | | | 787 | |
| Eli Lilly and Company 3.375% 2029 | | | 1,255 | | | | 1,229 | |
| Gilead Sciences, Inc. 1.65% 2030 | | | 1,570 | | | | 1,287 | |
| HCA, Inc. 3.125% 20274 | | | 755 | | | | 687 | |
| HCA, Inc. 3.375% 20294 | | | 1,770 | | | | 1,558 | |
| HCA, Inc. 3.625% 20324 | | | 5,729 | | | | 4,840 | |
| HCA, Inc. 4.625% 20524 | | | 390 | | | | 313 | |
| Laboratory Corporation of America Holdings 1.55% 2026 | | | 1,058 | | | | 951 | |
| Laboratory Corporation of America Holdings 4.70% 2045 | | | 4,160 | | | | 3,703 | |
| Merck & Co., Inc. 1.70% 2027 | | | 3,093 | | | | 2,812 | |
| Merck & Co., Inc. 2.15% 2031 | | | 5,845 | | | | 5,033 | |
| Merck & Co., Inc. 2.75% 2051 | | | 808 | | | | 598 | |
| American Funds Insurance Series | 165 |
The Bond Fund of America (continued)
| Bonds, notes & other debt instruments (continued) | | Principal amount
(000) | | | Value
(000) | |
| Corporate bonds, notes & loans (continued) | | | | | | | | |
| Health care (continued) | | | | | | | | |
| Regeneron Pharmaceuticals, Inc. 1.75% 2030 | | USD | 1,918 | | | $ | 1,540 | |
| Roche Holdings, Inc. 1.93% 20284 | | | 7,845 | | | | 6,941 | |
| Roche Holdings, Inc. 2.076% 20314 | | | 14,737 | | | | 12,579 | |
| Roche Holdings, Inc. 2.607% 20514 | | | 645 | | | | 469 | |
| Shire PLC 3.20% 2026 | | | 14,406 | | | | 13,847 | |
| Teva Pharmaceutical Finance Co. BV 7.125% 2025 | | | 45,000 | | | | 43,984 | |
| Teva Pharmaceutical Finance Co. BV 3.15% 2026 | | | 68,853 | | | | 56,684 | |
| Teva Pharmaceutical Finance Co. BV 6.75% 2028 | | | 26,824 | | | | 25,053 | |
| Teva Pharmaceutical Finance Co. BV 4.10% 2046 | | | 46,666 | | | | 29,209 | |
| UnitedHealth Group, Inc. 3.35% 2022 | | | 4,385 | | | | 4,385 | |
| UnitedHealth Group, Inc. 3.75% 2025 | | | 5,410 | | | | 5,410 | |
| UnitedHealth Group, Inc. 3.70% 2027 | | | 1,184 | | | | 1,181 | |
| UnitedHealth Group, Inc. 4.00% 2029 | | | 2,231 | | | | 2,211 | |
| UnitedHealth Group, Inc. 2.00% 2030 | | | 855 | | | | 733 | |
| UnitedHealth Group, Inc. 4.20% 2032 | | | 3,169 | | | | 3,169 | |
| UnitedHealth Group, Inc. 3.05% 2041 | | | 1,300 | | | | 1,050 | |
| UnitedHealth Group, Inc. 4.25% 2048 | | | 960 | | | | 897 | |
| UnitedHealth Group, Inc. 3.25% 2051 | | | 927 | | | | 729 | |
| UnitedHealth Group, Inc. 4.75% 2052 | | | 1,400 | | | | 1,402 | |
| UnitedHealth Group, Inc. 4.95% 2062 | | | 550 | | | | 559 | |
| | | | | | | | 347,706 | |
| | | | | | | | | |
| Communication services 3.16% | | | | | | | | |
| AT&T, Inc. 1.70% 2026 | | | 19,000 | | | | 17,392 | |
| AT&T, Inc. 1.65% 2028 | | | 4,700 | | | | 4,070 | |
| AT&T, Inc. 4.30% 2030 | | | 15,940 | | | | 15,569 | |
| AT&T, Inc. 2.55% 2033 | | | 15,003 | | | | 12,188 | |
| AT&T, Inc. 3.50% 2053 | | | 19,935 | | | | 15,144 | |
| CCO Holdings, LLC and CCO Holdings Capital Corp. 5.125% 20274 | | | 4,800 | | | | 4,546 | |
| CCO Holdings, LLC and CCO Holdings Capital Corp. 2.25% 2029 | | | 1,351 | | | | 1,111 | |
| CCO Holdings, LLC and CCO Holdings Capital Corp. 2.80% 2031 | | | 5,642 | | | | 4,524 | |
| CCO Holdings, LLC and CCO Holdings Capital Corp. 4.75% 20324 | | | 1,265 | | | | 1,039 | |
| CCO Holdings, LLC and CCO Holdings Capital Corp. 4.40% 2033 | | | 2,642 | | | | 2,362 | |
| CCO Holdings, LLC and CCO Holdings Capital Corp. 4.25% 20344 | | | 3,875 | | | | 3,007 | |
| CCO Holdings, LLC and CCO Holdings Capital Corp. 5.75% 2048 | | | 5,000 | | | | 4,492 | |
| CCO Holdings, LLC and CCO Holdings Capital Corp. 5.25% 2053 | | | 1,240 | | | | 1,050 | |
| CenturyLink, Inc. 4.00% 20274 | | | 17,946 | | | | 15,226 | |
| Comcast Corp. 3.15% 2028 | | | 7,200 | | | | 6,870 | |
| Comcast Corp. 2.65% 2030 | | | 7,500 | | | | 6,718 | |
| Comcast Corp. 4.00% 2048 | | | 5,000 | | | | 4,357 | |
| Magallanes, Inc. 3.428% 20244 | | | 6,552 | | | | 6,429 | |
| Magallanes, Inc. 3.638% 20254 | | | 3,056 | | | | 2,964 | |
| Magallanes, Inc. 3.755% 20274 | | | 9,501 | | | | 8,920 | |
| Magallanes, Inc. 4.054% 20294 | | | 1,316 | | | | 1,206 | |
| Magallanes, Inc. 4.279% 20324 | | | 4,932 | | | | 4,413 | |
| Magallanes, Inc. 5.05% 20424 | | | 3,147 | | | | 2,682 | |
| Magallanes, Inc. 5.141% 20524 | | | 11,141 | | | | 9,366 | |
| Magallanes, Inc. 5.391% 20624 | | | 2,802 | | | | 2,348 | |
| Netflix, Inc. 4.875% 2028 | | | 20,119 | | | | 18,976 | |
| Netflix, Inc. 5.875% 2028 | | | 25,021 | | | | 24,526 | |
| Netflix, Inc. 5.375% 20294 | | | 12,400 | | | | 11,740 | |
| Netflix, Inc. 6.375% 2029 | | | 2,930 | | | | 2,965 | |
| Netflix, Inc. 4.875% 20304 | | | 13,375 | | | | 12,266 | |
| News Corp. 5.125% 20324 | | | 1,300 | | | | 1,154 | |
| SBA Tower Trust 1.631% 20264 | | | 6,741 | | | | 6,038 | |
| Sirius XM Radio, Inc. 4.00% 20284 | | | 675 | | | | 586 | |
| Sprint Corp. 7.625% 2025 | | | 6,665 | | | | 6,960 | |
| Tencent Holdings, Ltd. 2.39% 20304 | | | 10,000 | | | | 8,379 | |
| T-Mobile US, Inc. 3.50% 2025 | | | 3,275 | | | | 3,207 | |
| T-Mobile US, Inc. 2.25% 2026 | | | 2,388 | | | | 2,153 | |
| 166 | American Funds Insurance Series |
The Bond Fund of America (continued)
| Bonds, notes & other debt instruments (continued) | | Principal amount
(000) | | | Value
(000) | |
| Corporate bonds, notes & loans (continued) | | | | | | | | |
| Communication services (continued) | | | | | | | | |
| T-Mobile US, Inc. 2.625% 2026 | | USD | 9,691 | | | $ | 8,813 | |
| T-Mobile US, Inc. 3.75% 2027 | | | 5,000 | | | | 4,819 | |
| T-Mobile US, Inc. 2.40% 2029 | | | 1,224 | | | | 1,059 | |
| T-Mobile US, Inc. 2.625% 2029 | | | 3,117 | | | | 2,632 | |
| T-Mobile US, Inc. 3.875% 2030 | | | 4,500 | | | | 4,204 | |
| T-Mobile US, Inc. 2.875% 2031 | | | 7,913 | | | | 6,584 | |
| T-Mobile US, Inc. 3.50% 2031 | | | 9,629 | | | | 8,334 | |
| T-Mobile US, Inc. 3.00% 2041 | | | 2,100 | | | | 1,569 | |
| T-Mobile US, Inc. 3.40% 2052 | | | 12,280 | | | | 9,096 | |
| Verizon Communications, Inc. 4.329% 2028 | | | 1,539 | | | | 1,532 | |
| Verizon Communications, Inc. 1.75% 2031 | | | 10,090 | | | | 8,114 | |
| Verizon Communications, Inc. 2.55% 2031 | | | 8,375 | | | | 7,168 | |
| Verizon Communications, Inc. 2.355% 2032 | | | 4,743 | | | | 3,937 | |
| Verizon Communications, Inc. 3.40% 2041 | | | 2,050 | | | | 1,673 | |
| Verizon Communications, Inc. 2.875% 2050 | | | 3,000 | | | | 2,133 | |
| Verizon Communications, Inc. 3.55% 2051 | | | 1,975 | | | | 1,587 | |
| Verizon Communications, Inc. 3.875% 2052 | | | 3,155 | | | | 2,651 | |
| Vodafone Group PLC 4.375% 2028 | | | 10,000 | | | | 9,963 | |
| Vodafone Group PLC 4.25% 2050 | | | 3,050 | | | | 2,555 | |
| ZipRecruiter, Inc. 5.00% 20304 | | | 1,500 | | | | 1,262 | |
| | | | | | | | 346,628 | |
| | | | | | | | | |
| Industrials 2.89% | | | | | | | | |
| ADT Security Corp. 4.125% 20294 | | | 510 | | | | 415 | |
| AerCap Ireland Capital, Ltd. / AerCap Global Aviation Trust 1.75% 2026 | | | 2,841 | | | | 2,486 | |
| Aeropuerto International de Tocume SA 4.00% 20414 | | | 730 | | | | 593 | |
| Aeropuerto International de Tocume SA 5.125% 20614 | | | 565 | | | | 449 | |
| Air Lease Corp. 0.80% 2024 | | | 3,175 | | | | 2,910 | |
| Air Lease Corp. 2.875% 2026 | | | 11,453 | | | | 10,531 | |
| Air Lease Corp. 2.20% 2027 | | | 3,060 | | | | 2,669 | |
| Air Lease Corp. 2.10% 2028 | | | 2,450 | | | | 1,967 | |
| Avolon Holdings Funding, Ltd. 3.95% 20244 | | | 12,514 | | | | 11,991 | |
| Avolon Holdings Funding, Ltd. 2.125% 20264 | | | 8,333 | | | | 7,214 | |
| Avolon Holdings Funding, Ltd. 4.25% 20264 | | | 3,302 | | | | 3,062 | |
| Avolon Holdings Funding, Ltd. 2.528% 20274 | | | 2,142 | | | | 1,748 | |
| Avolon Holdings Funding, Ltd. 3.25% 20274 | | | 8,000 | | | | 6,972 | |
| BNSF Funding Trust I, junior subordinated, 6.613% 2055 (3-month USD-LIBOR + 2.35% on 1/15/2026)3 | | | 1,680 | | | | 1,650 | |
| Boeing Company 4.508% 2023 | | | 11,358 | | | | 11,389 | |
| Boeing Company 1.95% 2024 | | | 5,646 | | | | 5,467 | |
| Boeing Company 2.80% 2024 | | | 500 | | | | 490 | |
| Boeing Company 4.875% 2025 | | | 34,682 | | | | 34,602 | |
| Boeing Company 2.196% 2026 | | | 16,571 | | | | 14,962 | |
| Boeing Company 2.75% 2026 | | | 16,588 | | | | 15,429 | |
| Boeing Company 3.10% 2026 | | | 649 | | | | 605 | |
| Boeing Company 2.70% 2027 | | | 6,473 | | | | 5,766 | |
| Boeing Company 5.04% 2027 | | | 15,716 | | | | 15,537 | |
| Boeing Company 3.25% 2028 | | | 11,379 | | | | 10,179 | |
| Boeing Company 3.25% 2028 | | | 1,925 | | | | 1,716 | |
| Boeing Company 5.15% 2030 | | | 42,874 | | | | 41,190 | |
| Boeing Company 3.625% 2031 | | | 1,602 | | | | 1,384 | |
| Boeing Company 3.90% 2049 | | | 1,411 | | | | 1,004 | |
| Boeing Company 5.805% 2050 | | | 4,122 | | | | 3,793 | |
| Canadian Pacific Railway, Ltd. 1.75% 2026 | | | 1,982 | | | | 1,795 | |
| Canadian Pacific Railway, Ltd. 2.45% 2031 | | | 3,131 | | | | 2,682 | |
| Canadian Pacific Railway, Ltd. 3.00% 2041 | | | 1,677 | | | | 1,315 | |
| Canadian Pacific Railway, Ltd. 3.10% 2051 | | | 3,111 | | | | 2,297 | |
| Carrier Global Corp. 3.377% 2040 | | | 15,000 | | | | 11,784 | |
| Dun & Bradstreet Corp. 5.00% 20294 | | | 2,798 | | | | 2,420 | |
| General Dynamics Corp. 3.625% 2030 | | | 675 | | | | 655 | |
| American Funds Insurance Series | 167 |
The Bond Fund of America (continued)
| Bonds, notes & other debt instruments (continued) | | Principal amount (000) | | | Value
(000) | |
| Corporate bonds, notes & loans (continued) | | | | | | | | |
| Industrials (continued) | | | | | | | | |
| General Electric Capital Corp. 4.418% 2035 | | USD | 5,977 | | | $ | 5,590 | |
| General Electric Capital Corp., Series A, 6.75% 2032 | | | 675 | | | | 756 | |
| Lockheed Martin Corp. 1.85% 2030 | | | 1,080 | | | | 923 | |
| Lockheed Martin Corp. 4.50% 2036 | | | 424 | | | | 422 | |
| Mexico City Airport Trust 5.50% 2046 | | | 1,959 | | | | 1,357 | |
| Mexico City Airport Trust 5.50% 2047 | | | 5,909 | | | | 4,069 | |
| Mexico City Airport Trust 5.50% 20474 | | | 1,132 | | | | 780 | |
| MISC Capital Two (Labuan), Ltd. 3.75% 20274 | | | 2,690 | | | | 2,529 | |
| Norfolk Southern Corp. 4.55% 2053 | | | 1,188 | | | | 1,126 | |
| Northrop Grumman Corp. 3.25% 2028 | | | 10,845 | | | | 10,318 | |
| Raytheon Technologies Corp. 1.90% 2031 | | | 3,087 | | | | 2,533 | |
| Raytheon Technologies Corp. 2.375% 2032 | | | 1,321 | | | | 1,119 | |
| Raytheon Technologies Corp. 2.82% 2051 | | | 665 | | | | 477 | |
| Raytheon Technologies Corp. 3.03% 2052 | | | 1,190 | | | | 889 | |
| Republic Services, Inc. 2.375% 2033 | | | 1,635 | | | | 1,338 | |
| Summit Digitel Infrastructure Private, Ltd. 2.875% 20314 | | | 2,550 | | | | 1,973 | |
| Triton Container International, Ltd. 1.15% 20244 | | | 1,609 | | | | 1,507 | |
| Triton Container International, Ltd. 3.15% 20314 | | | 2,482 | | | | 2,009 | |
| Union Pacific Corp. 2.15% 2027 | | | 2,213 | | | | 2,052 | |
| Union Pacific Corp. 2.40% 2030 | | | 4,454 | | | | 3,942 | |
| Union Pacific Corp. 2.375% 2031 | | | 5,554 | | | | 4,805 | |
| Union Pacific Corp. 2.80% 2032 | | | 5,240 | | | | 4,670 | |
| Union Pacific Corp. 3.375% 2042 | | | 530 | | | | 442 | |
| Union Pacific Corp. 3.25% 2050 | | | 7,000 | | | | 5,505 | |
| Union Pacific Corp. 2.95% 2052 | | | 1,405 | | | | 1,037 | |
| United Rentals, Inc. 5.50% 2027 | | | 2,500 | | | | 2,456 | |
| United Technologies Corp. 3.125% 2027 | | | 4,551 | | | | 4,356 | |
| United Technologies Corp. 4.125% 2028 | | | 4,974 | | | | 4,914 | |
| Waste Management, Inc. 4.15% 2032 | | | 2,155 | | | | 2,115 | |
| | | | | | | | 317,127 | |
| | | | | | | | | |
| Consumer staples 1.50% | | | | | | | | |
| 7-Eleven, Inc. 1.80% 20314 | | | 5,013 | | | | 3,918 | |
| 7-Eleven, Inc. 2.80% 20514 | | | 5,000 | | | | 3,269 | |
| Altria Group, Inc. 4.40% 2026 | | | 4,585 | | | | 4,512 | |
| Altria Group, Inc. 4.50% 2043 | | | 1,585 | | | | 1,194 | |
| Altria Group, Inc. 5.95% 2049 | | | 9,039 | | | | 7,940 | |
| Anheuser-Busch InBev NV 4.75% 2029 | | | 7,500 | | | | 7,638 | |
| Anheuser-Busch InBev NV 5.55% 2049 | | | 5,000 | | | | 5,117 | |
| Anheuser-Busch InBev NV 4.50% 2050 | | | 1,355 | | | | 1,220 | |
| British American Tobacco International Finance PLC 3.95% 20254 | | | 16,879 | | | | 16,570 | |
| British American Tobacco International Finance PLC 1.668% 2026 | | | 4,070 | | | | 3,608 | |
| British American Tobacco PLC 3.557% 2027 | | | 10,991 | | | | 10,064 | |
| British American Tobacco PLC 2.259% 2028 | | | 4,348 | | | | 3,647 | |
| British American Tobacco PLC 4.448% 2028 | | | 3,065 | | | | 2,905 | |
| British American Tobacco PLC 4.742% 2032 | | | 2,675 | | | | 2,381 | |
| British American Tobacco PLC 4.39% 2037 | | | 1,500 | | | | 1,192 | |
| British American Tobacco PLC 4.54% 2047 | | | 14,400 | | | | 10,583 | |
| British American Tobacco PLC 4.758% 2049 | | | 22,045 | | | | 16,661 | |
| British American Tobacco PLC 5.65% 2052 | | | 610 | | | | 528 | |
| Conagra Brands, Inc. 5.30% 2038 | | | 436 | | | | 412 | |
| Conagra Brands, Inc. 5.40% 2048 | | | 57 | | | | 54 | |
| Constellation Brands, Inc. 3.50% 2027 | | | 7,500 | | | | 7,207 | |
| Constellation Brands, Inc. 4.35% 2027 | | | 890 | | | | 883 | |
| Constellation Brands, Inc. 2.875% 2030 | | | 620 | | | | 540 | |
| Constellation Brands, Inc. 2.25% 2031 | | | 1,487 | | | | 1,207 | |
| Constellation Brands, Inc. 4.75% 2032 | | | 2,284 | | | | 2,273 | |
| Imperial Tobacco Finance PLC 3.50% 20234 | | | 2,335 | | | | 2,322 | |
| JBS Luxembourg SARL 2.50% 20274 | | | 3,880 | | | | 3,384 | |
| JBS Luxembourg SARL 3.625% 20324 | | | 1,430 | | | | 1,159 | |
| 168 | American Funds Insurance Series |
The Bond Fund of America (continued)
| Bonds, notes & other debt instruments (continued) | | Principal amount
(000) | | | Value
(000) | |
| Corporate bonds, notes & loans (continued) | | | | | | | | |
| Consumer staples (continued) | | | | | | | | |
| JBS USA Lux SA 3.00% 20294 | | USD | 2,709 | | | $ | 2,293 | |
| JBS USA Lux SA 5.50% 20304 | | | 435 | | | | 412 | |
| JBS USA Lux SA 3.00% 20324 | | | 3,430 | | | | 2,639 | |
| Kraft Heinz Company 4.875% 2049 | | | 1,270 | | | | 1,124 | |
| Kraft Heinz Company 5.50% 2050 | | | 2,725 | | | | 2,622 | |
| PepsiCo, Inc. 1.95% 2031 | | | 6,979 | | | | 5,952 | |
| Philip Morris International, Inc. 4.125% 2043 | | | 4,117 | | | | 3,331 | |
| Philip Morris International, Inc. 4.875% 2043 | | | 5,433 | | | | 4,845 | |
| PT Indofood CBP Sukses Makmur Tbk 3.398% 2031 | | | 3,110 | | | | 2,422 | |
| PT Indofood CBP Sukses Makmur Tbk 4.745% 2051 | | | 685 | | | | 461 | |
| Reynolds American, Inc. 4.45% 2025 | | | 14,570 | | | | 14,503 | |
| Reynolds American, Inc. 5.85% 2045 | | | 1,970 | | | | 1,656 | |
| | | | | | | | 164,648 | |
| | | | | | | | | |
| Information technology 0.87% | | | | | | | | |
| Analog Devices, Inc. 1.70% 2028 | | | 1,962 | | | | 1,721 | |
| Analog Devices, Inc. 2.80% 2041 | | | 521 | | | | 409 | |
| Apple, Inc. 2.70% 2051 | | | 7,080 | | | | 5,296 | |
| Broadcom Corp. / Broadcom Cayman Finance, Ltd. 3.875% 2027 | | | 7,027 | | | | 6,768 | |
| Broadcom, Inc. 4.00% 20294 | | | 2,940 | | | | 2,727 | |
| Broadcom, Inc. 4.15% 20324 | | | 2,270 | | | | 2,052 | |
| Broadcom, Inc. 3.469% 20344 | | | 32,636 | | | | 26,605 | |
| Broadcom, Inc. 3.137% 20354 | | | 1,164 | | | | 885 | |
| Broadcom, Inc. 3.187% 20364 | | | 4,803 | | | | 3,658 | |
| Global Payments, Inc. 2.90% 2031 | | | 1,005 | | | | 824 | |
| Oracle Corp. 1.65% 2026 | | | 8,417 | | | | 7,554 | |
| Oracle Corp. 2.30% 2028 | | | 6,875 | | | | 5,922 | |
| Oracle Corp. 2.875% 2031 | | | 7,393 | | | | 6,098 | |
| Oracle Corp. 3.95% 2051 | | | 4,869 | | | | 3,584 | |
| PayPal Holdings, Inc. 3.90% 2027 | | | 1,233 | | | | 1,230 | |
| PayPal Holdings, Inc. 2.30% 2030 | | | 330 | | | | 284 | |
| PayPal Holdings, Inc. 4.40% 2032 | | | 6,461 | | | | 6,404 | |
| PayPal Holdings, Inc. 5.05% 2052 | | | 1,665 | | | | 1,656 | |
| PayPal Holdings, Inc. 5.25% 2062 | | | 375 | | | | 372 | |
| salesforce.com, inc. 1.95% 2031 | | | 3,775 | | | | 3,210 | |
| salesforce.com, inc. 2.70% 2041 | | | 875 | | | | 678 | |
| salesforce.com, inc. 2.90% 2051 | | | 5,140 | | | | 3,893 | |
| salesforce.com, inc. 3.05% 2061 | | | 265 | | | | 194 | |
| Square, Inc. 2.75% 20264 | | | 1,975 | | | | 1,757 | |
| Square, Inc. 3.50% 20314 | | | 825 | | | | 659 | |
| VeriSign, Inc. 2.70% 2031 | | | 1,494 | | | | 1,204 | |
| | | | | | | | 95,644 | |
| | | | | | | | | |
| Real estate 0.76% | | | | | | | | |
| Alexandria Real Estate Equities, Inc. 4.50% 2029 | | | 70 | | | | 68 | |
| American Campus Communities, Inc. 3.75% 2023 | | | 2,900 | | | | 2,904 | |
| American Campus Communities, Inc. 3.875% 2031 | | | 620 | | | | 610 | |
| American Tower Corp. 1.45% 2026 | | | 657 | | | | 575 | |
| American Tower Corp. 3.65% 2027 | | | 5,390 | | | | 5,123 | |
| American Tower Corp. 2.30% 2031 | | | 1,180 | | | | 936 | |
| American Tower Corp. 2.70% 2031 | | | 1,100 | | | | 906 | |
| American Tower Corp. 4.05% 2032 | | | 1,278 | | | | 1,166 | |
| Corporacion Inmobiliaria Vesta, SAB de CV, 3.625% 20314 | | | 395 | | | | 314 | |
| Corporate Office Properties LP 2.00% 2029 | | | 1,139 | | | | 919 | |
| Corporate Office Properties LP 2.75% 2031 | | | 1,547 | | | | 1,252 | |
| Corporate Office Properties LP 2.90% 2033 | | | 564 | | | | 438 | |
| Crown Castle International Corp. 2.50% 2031 | | | 2,451 | | | | 2,008 | |
| Equinix, Inc. 2.90% 2026 | | | 3,287 | | | | 3,058 | |
| Equinix, Inc. 3.20% 2029 | | | 3,846 | | | | 3,420 | |
| Equinix, Inc. 2.50% 2031 | | | 7,760 | | | | 6,295 | |
| American Funds Insurance Series | 169 |
The Bond Fund of America (continued)
| Bonds, notes & other debt instruments (continued) | | Principal amount
(000) | | | Value
(000) | |
| Corporate bonds, notes & loans (continued) | | | | | | | | |
| Real estate (continued) | | | | | | | | |
| Equinix, Inc. 3.90% 2032 | | USD | 1,155 | | | $ | 1,046 | |
| Equinix, Inc. 3.40% 2052 | | | 1,201 | | | | 891 | |
| Extra Space Storage, Inc. 2.35% 2032 | | | 698 | | | | 554 | |
| FibraSOMA 4.375% 20314 | | | 1,475 | | | | 1,054 | |
| Hospitality Properties Trust 4.50% 2025 | | | 855 | | | | 677 | |
| Hospitality Properties Trust 3.95% 2028 | | | 1,710 | | | | 1,173 | |
| Howard Hughes Corp. 4.375% 20314 | | | 675 | | | | 501 | |
| Invitation Homes Operating Partnership LP 2.30% 2028 | | | 767 | | | | 646 | |
| Invitation Homes Operating Partnership LP 2.00% 2031 | | | 2,048 | | | | 1,578 | |
| Invitation Homes Operating Partnership LP 2.70% 2034 | | | 660 | | | | 509 | |
| Iron Mountain, Inc. 4.875% 20274 | | | 1,605 | | | | 1,455 | |
| Iron Mountain, Inc. 5.25% 20284 | | | 3,500 | | | | 3,149 | |
| Iron Mountain, Inc. 5.25% 20304 | | | 675 | | | | 588 | |
| Omega Healthcare Investors, Inc. 4.375% 2023 | | | 186 | | | | 187 | |
| Piedmont Operating Partnership LP 4.45% 2024 | | | 1,000 | | | | 1,004 | |
| Public Storage 1.95% 2028 | | | 993 | | | | 859 | |
| Public Storage 2.30% 2031 | | | 3,195 | | | | 2,688 | |
| Scentre Group 3.50% 20254 | | | 4,565 | | | | 4,437 | |
| Sun Communities Operating LP 2.30% 2028 | | | 1,026 | | | | 879 | |
| Sun Communities Operating LP 2.70% 2031 | | | 3,877 | | | | 3,129 | |
| VICI Properties LP 4.375% 2025 | | | 670 | | | | 655 | |
| VICI Properties LP 4.75% 2028 | | | 6,844 | | | | 6,545 | |
| VICI Properties LP 4.95% 2030 | | | 5,515 | | | | 5,237 | |
| VICI Properties LP 5.125% 2032 | | | 11,766 | | | | 11,112 | |
| VICI Properties LP 5.625% 2052 | | | 2,695 | | | | 2,458 | |
| | | | | | | | 83,003 | |
| | | | | | | | | |
| Materials 0.16% | | | | | | | | |
| Air Products and Chemicals, Inc. 2.70% 2040 | | | 2,911 | | | | 2,333 | |
| Ecolab, Inc. 1.65% 2027 | | | 835 | | | | 764 | |
| Ecolab, Inc. 2.125% 2032 | | | 2,580 | | | | 2,179 | |
| Ecolab, Inc. 2.70% 2051 | | | 335 | | | | 239 | |
| Glencore Funding, LLC 2.625% 20314 | | | 790 | | | | 638 | |
| Glencore Funding, LLC 3.375% 20514 | | | 370 | | | | 253 | |
| International Flavors & Fragrances, Inc. 2.30% 20304 | | | 3,536 | | | | 2,909 | |
| LYB International Finance III, LLC 2.25% 2030 | | | 3,802 | | | | 3,139 | |
| LYB International Finance III, LLC 3.625% 2051 | | | 2,617 | | | | 1,938 | |
| Methanex Corp. 5.125% 2027 | | | 510 | | | | 451 | |
| Nova Chemicals Corp. 4.25% 20294 | | | 425 | | | | 333 | |
| South32 Treasury (USA), Ltd. 4.35% 20324 | | | 1,976 | | | | 1,848 | |
| | | | | | | | 17,024 | |
| | | | | | | | | |
| Total corporate bonds, notes & loans | | | | | | | 3,680,622 | |
| | | | | | | | | |
| Mortgage-backed obligations 22.30% | | | | | | | | |
| Federal agency mortgage-backed obligations 19.52% | | | | | | | | |
| Fannie Mae Pool #976945 5.50% 20237 | | | 3 | | | | 3 | |
| Fannie Mae Pool #AB1068 4.50% 20257 | | | 49 | | | | 50 | |
| Fannie Mae Pool #256133 4.50% 20267 | | | 47 | | | | 47 | |
| Fannie Mae Pool #AR3058 3.00% 20287 | | | 83 | | | | 82 | |
| Fannie Mae Pool #AS8018 3.00% 20317 | | | 49 | | | | 48 | |
| Fannie Mae Pool #BM4741 3.00% 20327 | | | 32 | | | | 32 | |
| Fannie Mae Pool #924866 1.765% 20375,7 | | | 430 | | | | 428 | |
| Fannie Mae Pool #945680 6.00% 20377 | | | 455 | | | | 495 | |
| Fannie Mae Pool #913966 6.00% 20377 | | | 35 | | | | 38 | |
| Fannie Mae Pool #889982 5.50% 20387 | | | 998 | | | | 1,072 | |
| Fannie Mae Pool #988588 5.50% 20387 | | | 190 | | | | 204 | |
| Fannie Mae Pool #AB1297 5.00% 20407 | | | 198 | | | | 208 | |
| Fannie Mae Pool #MA4501 2.00% 20417 | | | 10,409 | | | | 9,309 | |
| Fannie Mae Pool #AI1862 5.00% 20417 | | | 1,034 | | | | 1,086 | |
| Fannie Mae Pool #AH8144 5.00% 20417 | | | 820 | | | | 856 | |
| 170 | American Funds Insurance Series |
The Bond Fund of America (continued)
| Bonds, notes & other debt instruments (continued) | | Principal amount
(000) | | | Value
(000) | |
| Mortgage-backed obligations (continued) | | | | | | | | |
| Federal agency mortgage-backed obligations (continued) | | | | | | | | |
| Fannie Mae Pool #AH9479 5.00% 20417 | | USD | 767 | | | $ | 803 | |
| Fannie Mae Pool #AI3510 5.00% 20417 | | | 594 | | | | 621 | |
| Fannie Mae Pool #AJ0704 5.00% 20417 | | | 480 | | | | 503 | |
| Fannie Mae Pool #AJ5391 5.00% 20417 | | | 350 | | | | 369 | |
| Fannie Mae Pool #MA4540 2.00% 20427 | | | 2,734 | | | | 2,445 | |
| Fannie Mae Pool #AZ3904 4.00% 20457 | | | 42 | | | | 42 | |
| Fannie Mae Pool #AL8522 3.50% 20467 | | | 945 | | | | 924 | |
| Fannie Mae Pool #BD1968 4.00% 20467 | | | 1,284 | | | | 1,290 | |
| Fannie Mae Pool #BE0592 4.00% 20467 | | | 316 | | | | 314 | |
| Fannie Mae Pool #BD5477 4.00% 20467 | | | 180 | | | | 180 | |
| Fannie Mae Pool #CA0770 3.50% 20477 | | | 5,135 | | | | 5,033 | |
| Fannie Mae Pool #CA0706 4.00% 20477 | | | 99 | | | | 100 | |
| Fannie Mae Pool #MA3058 4.00% 20477 | | | 45 | | | | 45 | |
| Fannie Mae Pool #BM4413 4.50% 20477 | | | 3,155 | | | | 3,217 | |
| Fannie Mae Pool #BF0293 3.00% 20487 | | | 7,571 | | | | 7,145 | |
| Fannie Mae Pool #FM4891 3.50% 20487 | | | 22,390 | | | | 21,904 | |
| Fannie Mae Pool #BF0318 3.50% 20487 | | | 6,098 | | | | 5,948 | |
| Fannie Mae Pool #CA1189 3.50% 20487 | | | 1,457 | | | | 1,425 | |
| Fannie Mae Pool #BJ5749 4.00% 20487 | | | 18 | | | | 18 | |
| Fannie Mae Pool #BM4676 4.00% 20487 | | | 14 | | | | 14 | |
| Fannie Mae Pool #CA3807 3.00% 20497 | | | 1,460 | | | | 1,374 | |
| Fannie Mae Pool #CA3806 3.00% 20497 | | | 941 | | | | 887 | |
| Fannie Mae Pool #FM0007 3.50% 20497 | | | 17,115 | | | | 16,640 | |
| Fannie Mae Pool #FM1954 3.50% 20497 | | | 7,239 | | | | 7,038 | |
| Fannie Mae Pool #FM1589 3.50% 20497 | | | 4,704 | | | | 4,573 | |
| Fannie Mae Pool #FM1262 4.00% 20497 | | | 25,162 | | | | 25,188 | |
| Fannie Mae Pool #FM5507 3.00% 20507 | | | 18,969 | | | | 17,967 | |
| Fannie Mae Pool #BF0145 3.50% 20577 | | | 12,754 | | | | 12,439 | |
| Fannie Mae Pool #BF0264 3.50% 20587 | | | 9,600 | | | | 9,363 | |
| Fannie Mae Pool #BF0332 3.00% 20597 | | | 20,766 | | | | 19,494 | |
| Fannie Mae Pool #BF0497 3.00% 20607 | | | 18,133 | | | | 17,096 | |
| Fannie Mae, Series 2001-4, Class GA, 9.00% 20255,7 | | | — | | | | — | |
| Fannie Mae, Series 2001-50, Class BA, 7.00% 20417 | | | 8 | | | | 8 | |
| Fannie Mae, Series 2002-W3, Class A5, 7.50% 20417 | | | 19 | | | | 22 | |
| Fannie Mae, Series 2002-W1, Class 2A, 5.017% 20425,7 | | | 23 | | | | 23 | |
| Freddie Mac Pool #ZS8507 3.00% 20287 | | | 130 | | | | 130 | |
| Freddie Mac Pool #ZK7590 3.00% 20297 | | | 2,852 | | | | 2,837 | |
| Freddie Mac Pool #A15120 5.50% 20337 | | | 55 | | | | 57 | |
| Freddie Mac Pool #QN1073 3.00% 20347 | | | 51 | | | | 50 | |
| Freddie Mac Pool #G05196 5.50% 20387 | | | 54 | | | | 59 | |
| Freddie Mac Pool #G05267 5.50% 20387 | | | 41 | | | | 44 | |
| Freddie Mac Pool #G06020 5.50% 20397 | | | 79 | | | | 85 | |
| Freddie Mac Pool #A93948 4.50% 20407 | | | 169 | | | | 175 | |
| Freddie Mac Pool #G05860 5.50% 20407 | | | 283 | | | | 305 | |
| Freddie Mac Pool #RB5138 2.00% 20417 | | | 2,743 | | | | 2,453 | |
| Freddie Mac Pool #G06868 4.50% 20417 | | | 191 | | | | 197 | |
| Freddie Mac Pool #G06841 5.50% 20417 | | | 457 | | | | 492 | |
| Freddie Mac Pool #RB5148 2.00% 20427 | | | 5,687 | | | | 5,044 | |
| Freddie Mac Pool #RB5145 2.00% 20427 | | | 2,664 | | | | 2,382 | |
| Freddie Mac Pool #Z40130 3.00% 20467 | | | 22,230 | | | | 21,271 | |
| Freddie Mac Pool #G61733 3.00% 20477 | | | 5,538 | | | | 5,246 | |
| Freddie Mac Pool #ZT2100 3.00% 20477 | | | 116 | | | | 110 | |
| Freddie Mac Pool #G08789 4.00% 20477 | | | 682 | | | | 687 | |
| Freddie Mac Pool #G67709 3.50% 20487 | | | 14,463 | | | | 14,159 | |
| Freddie Mac Pool #G61628 3.50% 20487 | | | 355 | | | | 348 | |
| Freddie Mac Pool #Q58494 4.00% 20487 | | | 1,289 | | | | 1,292 | |
| Freddie Mac Pool #QA4673 3.00% 20497 | | | 31,780 | | | | 29,899 | |
| Freddie Mac Pool #SD7508 3.50% 20497 | | | 11,833 | | | | 11,505 | |
| Freddie Mac Pool #RA1369 3.50% 20497 | | | 2,174 | | | | 2,113 | |
| Freddie Mac Pool #ZN4842 3.50% 20497 | | | 760 | | | | 739 | |
| Freddie Mac, Series 3061, Class PN, 5.50% 20357 | | | 62 | | | | 66 | |
| American Funds Insurance Series | 171 |
The Bond Fund of America (continued)
| Bonds, notes & other debt instruments (continued) | | Principal amount
(000) | | | Value
(000) | |
| Mortgage-backed obligations (continued) | | | | | | | | |
| Federal agency mortgage-backed obligations (continued) | | | | | | | | |
| Freddie Mac, Series 3318, Class JT, 5.50% 20377 | | USD | 145 | | | $ | 153 | |
| Freddie Mac, Series 3156, Class PO, principal only, 0% 20367 | | | 134 | | | | 116 | |
| Freddie Mac, Series 3146, Class PO, principal only, 0% 20367 | | | 132 | | | | 112 | |
| Freddie Mac Seasoned Credit Risk Transfer Trust, Series 2018-3, Class MA, 3.50% 20577 | | | 9,092 | | | | 9,010 | |
| Freddie Mac Seasoned Credit Risk Transfer Trust, Series 2019-2, Class MA, 3.50% 20587 | | | 2,074 | | | | 2,052 | |
| Freddie Mac Seasoned Loan Structured Transaction Trust, Series 2022-1, Class A1, 3.50% 20327 | | | 11,275 | | | | 11,138 | |
| Government National Mortgage Assn. 2.00% 20527,8 | | | 10,080 | | | | 8,946 | |
| Government National Mortgage Assn. 2.00% 20527,8 | | | 4,705 | | | | 4,180 | |
| Government National Mortgage Assn. 3.00% 20527,8 | | | 32,748 | | | | 30,883 | |
| Government National Mortgage Assn. 3.50% 20527,8 | | | 51,755 | | | | 50,231 | |
| Government National Mortgage Assn. 4.00% 20527,8 | | | 70,236 | | | | 69,796 | |
| Government National Mortgage Assn. 4.00% 20527,8 | | | 18,306 | | | | 18,231 | |
| Government National Mortgage Assn. 4.50% 20527,8 | | | 166,259 | | | | 168,116 | |
| Government National Mortgage Assn. 5.00% 20527,8 | | | 152,746 | | | | 155,968 | |
| Government National Mortgage Assn. 5.00% 20527,8 | | | 2,680 | | | | 2,747 | |
| Government National Mortgage Assn. Pool #MA5817 4.00% 20497 | | | 13,668 | | | | 13,711 | |
| Government National Mortgage Assn. Pool #MA6221 4.50% 20497 | | | 5,718 | | | | 5,823 | |
| Government National Mortgage Assn. Pool #MA6042 5.00% 20497 | | | 40 | | | | 42 | |
| Uniform Mortgage-Backed Security 1.50% 20377,8 | | | 3,950 | | | | 3,593 | |
| Uniform Mortgage-Backed Security 2.50% 20377,8 | | | 7,545 | | | | 7,207 | |
| Uniform Mortgage-Backed Security 3.00% 20377,8 | | | 4,006 | | | | 3,914 | |
| Uniform Mortgage-Backed Security 2.00% 20527,8 | | | 34,799 | | | | 30,177 | |
| Uniform Mortgage-Backed Security 2.50% 20527,8 | | | 36,388 | | | | 32,697 | |
| Uniform Mortgage-Backed Security 3.00% 20527,8 | | | 76,300 | | | | 71,007 | |
| Uniform Mortgage-Backed Security 3.00% 20527,8 | | | 70,132 | | | | 65,338 | |
| Uniform Mortgage-Backed Security 3.50% 20527,8 | | | 33,659 | | | | 32,341 | |
| Uniform Mortgage-Backed Security 4.00% 20527,8 | | | 250,157 | | | | 245,911 | |
| Uniform Mortgage-Backed Security 4.00% 20527,8 | | | 12,042 | | | | 11,858 | |
| Uniform Mortgage-Backed Security 4.50% 20527,8 | | | 320,008 | | | | 320,024 | |
| Uniform Mortgage-Backed Security 4.50% 20527,8 | | | 192,067 | | | | 192,435 | |
| Uniform Mortgage-Backed Security 5.00% 20527,8 | | | 152,335 | | | | 154,766 | |
| Uniform Mortgage-Backed Security 5.00% 20527,8 | | | 116,315 | | | | 118,426 | |
| | | | | | | | 2,141,104 | |
| | | | | | | | | |
| Commercial mortgage-backed securities 1.37% | | | | | | | | |
| Bank Commercial Mortgage Trust, Series 2019-BN17, Class A4, 3.714% 20527 | | | 100 | | | | 97 | |
| Bank Commercial Mortgage Trust, Series 2019-BN16, Class A4, 4.005% 20527 | | | 770 | | | | 758 | |
| Bank Commercial Mortgage Trust, Series 2019-BN19, Class A3, 3.183% 20617 | | | 1,018 | | | | 949 | |
| Bank Commercial Mortgage Trust, Series 2018-BN10, Class A4, 3.428% 20617 | | | 130 | | | | 126 | |
| Bank Commercial Mortgage Trust, Series 2018-BN10, Class A5, 3.688% 20617 | | | 205 | | | | 199 | |
| Bank Commercial Mortgage Trust, Series 2018-BN12, Class A4, 4.255% 20615,7 | | | 2,444 | | | | 2,447 | |
| Bank Commercial Mortgage Trust, Series 2020-BN26, Class A4, 2.403% 20637 | | | 295 | | | | 259 | |
| Benchmark Mortgage Trust, Series 2018-B8, Class A5, 4.232% 20527 | | | 2,541 | | | | 2,532 | |
| Benchmark Mortgage Trust, Series 2018-B7, Class A4, 4.51% 20535,7 | | | 781 | | | | 789 | |
| Boca Commercial Mortgage Trust, Series 2022-BOCA, Class A, (1-month USD CME Term SOFR + 1.767%) 2.27% 20394,5,7 | | | 8,575 | | | | 8,422 | |
| BPR Trust, Series 2022-OANA, Class A, (1-month USD CME Term SOFR + 1.898%) 3.177% 20374,5,7 | | | 3,822 | | | | 3,753 | |
| BX Trust, Series 2022-CSMO, Class A, (1-month USD CME Term SOFR + 2.11%) 2.865% 20274,5,7 | | | 8,476 | | | | 8,391 | |
| BX Trust, Series 2021-VOLT, Class A, (1-month USD-LIBOR + 0.70%) 2.024% 20364,5,7 | | | 14,727 | | | | 14,226 | |
| BX Trust, Series 2021-RISE, Class A, (1-month USD-LIBOR + 0.74%) 2.072% 20364,5,7 | | | 12,622 | | | | 12,021 | |
| BX Trust, Series 2021-ARIA, Class A, (1-month USD-LIBOR + 0.899%) 2.223% 20364,5,7 | | | 5,292 | | | | 4,985 | |
| BX Trust, Series 2021-VOLT, Class B, (1-month USD-LIBOR + 0.95%) 2.274% 20364,5,7 | | | 570 | | | | 537 | |
| 172 | American Funds Insurance Series |
The Bond Fund of America (continued)
| Bonds, notes & other debt instruments (continued) | | Principal amount
(000) | | | Value
(000) | |
| Mortgage-backed obligations (continued) | | | | | | | | |
| Commercial mortgage-backed securities (continued) | | | | | | | | |
| BX Trust, Series 2021-ARIA, Class B, (1-month USD-LIBOR + 1.297%) 2.621% 20364,5,7 | | USD | 995 | | | $ | 933 | |
| BX Trust, Series 2021-ARIA, Class C, (1-month USD-LIBOR + 1.646%) 2.97% 20364,5,7 | | | 996 | | | | 931 | |
| BX Trust, Series 2022-IND, Class A, (1-month USD CME Term SOFR + 1.491%) 2.825% 20374,5,7 | | | 5,828 | | | | 5,684 | |
| BX Trust, Series 2021-SOAR, Class A, (1-month USD-LIBOR + 0.67%) 1.994% 20384,5,7 | | | 3,741 | | | | 3,596 | |
| BX Trust, Series 2021-ACNT, Class A, (1-month USD-LIBOR + 0.85%) 2.174% 20384,5,7 | | | 9,979 | | | | 9,620 | |
| BX Trust, Series 2021-SOAR, Class B, (1-month USD-LIBOR + 0.87%) 2.194% 20384,5,7 | | | 433 | | | | 416 | |
| BX Trust, Series 2021-SOAR, Class C, (1-month USD-LIBOR + 1.10%) 2.424% 20384,5,7 | | | 293 | | | | 279 | |
| BX Trust, Series 2021-ACNT, Class B, (1-month USD-LIBOR + 1.25%) 2.574% 20384,5,7 | | | 339 | | | | 325 | |
| BX Trust, Series 2021-SOAR, Class D, (1-month USD-LIBOR + 1.40%) 2.724% 20384,5,7 | | | 740 | | | | 701 | |
| BX Trust, Series 2021-ACNT, Class C, (1-month USD-LIBOR + 1.50%) 2.825% 20384,5,7 | | | 100 | | | | 96 | |
| BX Trust, Series 2021-ACNT, Class D, (1-month USD-LIBOR + 1.85%) 3.175% 20384,5,7 | | | 151 | | | | 144 | |
| Citigroup Commercial Mortgage Trust, Series 2016-GC36, Class A5, 3.616% 20497 | | | 610 | | | | 598 | |
| Commercial Mortgage Trust, Series 2013-LC13, Class B, 5.009% 20464,5,7 | | | 312 | | | | 311 | |
| Commercial Mortgage Trust, Series 2014-LC15, Class AM, 4.198% 20477 | | | 350 | | | | 347 | |
| CSAIL Commercial Mortgage Trust, Series 2015-C4, Class C, 4.711% 20485,7 | | | 204 | | | | 193 | |
| CSAIL Commercial Mortgage Trust, Series 2015-C2, Class A3, 3.231% 20577 | | | 1,137 | | | | 1,105 | |
| Deutsche Bank Commercial Mortgage Trust, Series 2016-C1, Class AM, 3.539% 20497 | | | 200 | | | | 193 | |
| Extended Stay America Trust, Series 2021-ESH, Class A, (1-month USD-LIBOR + 1.08%) 2.405% 20384,5,7 | | | 2,862 | | | | 2,795 | |
| Extended Stay America Trust, Series 2021-ESH, Class B, (1-month USD-LIBOR + 1.38%) 2.705% 20384,5,7 | | | 653 | | | | 635 | |
| Extended Stay America Trust, Series 2021-ESH, Class C, (1-month USD-LIBOR + 1.70%) 3.025% 20384,5,7 | | | 891 | | | | 863 | |
| Extended Stay America Trust, Series 2021-ESH, Class D, (1-month USD-LIBOR + 2.25%) 3.575% 20384,5,7 | | | 682 | | | | 660 | |
| Fontainebleau Miami Beach Trust, CMO, Series 2019-FBLU, Class A, 3.144% 20364,7 | | | 304 | | | | 292 | |
| Grace Mortgage Trust, Series 2020-GRCE, Class A, 2.347% 20404,7 | | | 1,897 | | | | 1,573 | |
| GS Mortgage Securities Trust, Series 2017-GS7, Class A4, 3.43% 20507 | | | 400 | | | | 387 | |
| GS Mortgage Securities Trust, Series 2019-GC38, Class A4, 3.968% 20527 | | | 100 | | | | 98 | |
| GS Mortgage Securities Trust, Series 2020-GC47, Class A5, 2.377% 20537 | | | 1,536 | | | | 1,338 | |
| JPMBB Commercial Mortgage Securities Trust, Series 2014-C18, Class A5, 4.079% 20477 | | | 3,280 | | | | 3,268 | |
| JPMDB Commercial Mortgage Securities Trust, Series 2017-C5, Class A5, 3.694% 20507 | | | 640 | | | | 625 | |
| JPMorgan Chase Commercial Mortgage Securities Trust, Series 2022-OPO, Class A, 3.024% 20394,7 | | | 7,867 | | | | 7,258 | |
| JPMorgan Chase Commercial Mortgage Securities Trust, Series 2016-JP4, Class A4, 3.648% 20495,7 | | | 2,040 | | | | 1,980 | |
| La Quinta Mortgage Trust, Series 2022-LAQ, Class A, (1-month USD CME Term SOFR + 1.724%) 3.058% 20394,5,7 | | | 3,258 | | | | 3,184 | |
| LUXE Commercial Mortgage Trust, Series 2021-TRIP, Class A, (1-month USD-LIBOR + 1.05%) 2.374% 20384,5,7 | | | 4,555 | | | | 4,394 | |
| MHC Commercial Mortgage Trust, CMO, Series 2021-MHC, Class A, (1-month USD-LIBOR + 0.801%) 2.125% 20264,5,7 | | | 154 | | | | 150 | |
| Morgan Stanley Bank of America Merrill Lynch Trust, Series 2014-C17, Class A5, 3.741% 20477 | | | 5,446 | | | | 5,389 | |
| Morgan Stanley Bank of America Merrill Lynch Trust, Series 2015-C22, Class A-4, 3.306% 20487 | | | 410 | | | | 399 | |
| Morgan Stanley Bank of America Merrill Lynch Trust, Series 2016-C32, Class A-4, 3.72% 20497 | | | 245 | | | | 240 | |
| American Funds Insurance Series | 173 |
The Bond Fund of America (continued)
| Bonds, notes & other debt instruments (continued) | | Principal amount
(000) | | | Value
(000) | |
| Mortgage-backed obligations (continued) | | | | | | | | |
| Commercial mortgage-backed securities (continued) | | | | | | | | |
| Morgan Stanley Capital I Trust, Series 2015-UBS8, Class AS, 4.114% 20487 | | USD | 730 | | | $ | 715 | |
| Morgan Stanley Capital I Trust, Series 2016-UBS9, Class C, 4.761% 20495,7 | | | 208 | | | | 195 | |
| SLG Office Trust, Series 2021-OVA, Class A, 2.585% 20414,7 | | | 4,065 | | | | 3,459 | |
| SREIT Trust, Series 2021-FLWR, Class A, (1-month USD-LIBOR + 0.577%) 1.901% 20364,5,7 | | | 9,351 | | | | 8,897 | |
| SREIT Trust, Series 2021-FLWR, Class B, (1-month USD-LIBOR + 0.926%) 2.25% 20364,5,7 | | | 1,000 | | | | 948 | |
| SREIT Trust, Series 2021-MFP, Class A, (1-month USD-LIBOR + 0.731%) 2.055% 20384,5,7 | | | 8,739 | | | | 8,317 | |
| SREIT Trust, Series 2021-MFP, Class B, (1-month USD-LIBOR + 1.079%) 2.404% 20384,5,7 | | | 263 | | | | 248 | |
| SREIT Trust, Series 2021-MFP, Class C, (1-month USD-LIBOR + 1.329%) 2.653% 20384,5,7 | | | 141 | | | | 133 | |
| Wells Fargo Commercial Mortgage Trust, Series 2015-SG1, Class A-4, 3.789% 20487 | | | 2,413 | | | | 2,352 | |
| Wells Fargo Commercial Mortgage Trust, Series 2015-C28, Class C, 4.219% 20485,7 | | | 220 | | | | 209 | |
| Wells Fargo Commercial Mortgage Trust, Series 2016-C37, Class A5, 3.794% 20497 | | | 2,550 | | | | 2,506 | |
| Wells Fargo Commercial Mortgage Trust, Series 2019-C54, Class A4, 3.146% 20527 | | | 1,019 | | | | 939 | |
| Wells Fargo Commercial Mortgage Trust, Series 2016-NXS5, Class AS, 3.988% 20597 | | | 250 | | | | 244 | |
| Wells Fargo Commercial Mortgage Trust, Series 2017-RC1, Class A4, 3.631% 20607 | | | 205 | | | | 200 | |
| | | | | | | | 150,853 | |
| | | | | | | | | |
| Collateralized mortgage-backed obligations (privately originated) 1.19% | | | | | | | | |
| Arroyo Mortgage Trust, Series 2021-1R, Class A1, 1.175% 20484,5,7 | | | 3,260 | | | | 3,026 | |
| Arroyo Mortgage Trust, Series 2020-1, Class A1A, 1.662% 20554,7 | | | 145 | | | | 140 | |
| Arroyo Mortgage Trust, Series 2022-1, Class A1A, 2.495% 2056 (3.495% on 2/25/2026)3,4,7 | | | 6,315 | | | | 6,000 | |
| Bellemeade Re, Ltd., Series 2019-3A, Class M1B, (1-month USD-LIBOR + 1.60%) 3.224% 20294,5,7 | | | 1,297 | | | | 1,292 | |
| BRAVO Residential Funding Trust, Series 2020-RPL2, Class A1, 2.00% 20594,5,7 | | | 1,001 | | | | 924 | |
| BRAVO Residential Funding Trust, Series 2020-RPL1, Class A1, 2.50% 20594,5,7 | | | 671 | | | | 649 | |
| BRAVO Residential Funding Trust, Series 2022-RPL1, Class A1, 2.75% 20614,7 | | | 5,155 | | | | 4,816 | |
| Cascade Funding Mortgage Trust, Series 2020-HB4, Class A, 0.946% 20304,5,7 | | | 583 | | | | 576 | |
| Cascade Funding Mortgage Trust, Series 2021-HB7, Class A, 1.151% 20314,5,7 | | | 3,400 | | | | 3,334 | |
| Cascade Funding Mortgage Trust, Series 2021-HB6, Class A, 0.898% 20364,5,7 | | | 1,983 | | | | 1,948 | |
| CIM Trust, Series 2022-R2, Class A1, 3.75% 20614,5,7 | | | 7,476 | | | | 7,249 | |
| Citigroup Mortgage Loan Trust, Inc., Series 2020-EXP1, Class A1A, 1.804% 20604,5,7 | | | 235 | | | | 224 | |
| COLT Funding, LLC, Series 2021-5, Class A1, 1.726% 20664,5,7 | | | 2,151 | | | | 1,960 | |
| Connecticut Avenue Securities, Series 2022-R04, Class 1M1, (30-day Average USD-SOFR + 2.00%) 2.926% 20424,5,7 | | | 1,505 | | | | 1,477 | |
| Connecticut Avenue Securities, Series 2022-R06, Class 1M1, (30-day Average USD-SOFR + 2.75%) 3.698% 20424,5,7 | | | 369 | | | | 368 | |
| Credit Suisse Mortgage Trust, Series 2020-NET, Class A, 2.257% 20374,7 | | | 1,578 | | | | 1,457 | |
| Credit Suisse Mortgage Trust, Series 2017-RPL3, Class A1, 2.00% 20604,5,7 | | | 1,726 | | | | 1,627 | |
| Finance of America Structured Securities Trust, Series 2019-JR2, Class A1, 2.00% 20694,7 | | | 2,700 | | | | 2,908 | |
| Finance of America Structured Securities Trust, Series 2019-JR1, Class A, 2.00% 20694,7 | | | 2,299 | | | | 2,478 | |
| Flagstar Mortgage Trust, Series 2021-10INV, Class A3, 2.50% 20514,5,7 | | | 3,342 | | | | 2,873 | |
| Flagstar Mortgage Trust, Series 2021-11INV, Class A4, 2.50% 20514,5,7 | | | 2,302 | | | | 1,977 | |
| Flagstar Mortgage Trust, Series 2021-5INV, Class A2, 2.50% 20514,5,7 | | | 2,158 | | | | 1,854 | |
| Flagstar Mortgage Trust, Series 2021-8INV, Class A3, 2.50% 20514,5,7 | | | 2,121 | | | | 1,818 | |
| Flagstar Mortgage Trust, Series 2021-6INV, Class A4, 2.50% 20514,5,7 | | | 2,021 | | | | 1,739 | |
| Freddie Mac Structured Agency Credit Risk Debt Notes, Series 2015-DNA3, Class M3, (1-month USD-LIBOR + 4.70%) 6.324% 20285,7 | | | 1,744 | | | | 1,798 | |
| Freddie Mac Structured Agency Credit Risk Debt Notes, Series 2021-DNA5, Class M2, (30-day Average USD-SOFR + 1.65%) 2.576% 20344,5,7 | | | 234 | | | | 226 | |
| Freddie Mac Structured Agency Credit Risk Debt Notes, Series 2022-DNA3, Class M1A, (30-day Average USD-SOFR + 2.00%) 2.926% 20424,5,7 | | | 2,420 | | | | 2,383 | |
| Freddie Mac Structured Agency Credit Risk Debt Notes, Series 2022-DNA4, Class M1A, (30-day Average USD-SOFR + 2.20%) 3.126% 20424,5,7 | | | 363 | | | | 359 | |
| 174 | American Funds Insurance Series |
The Bond Fund of America (continued)
| Bonds, notes & other debt instruments (continued) | | Principal amount
(000) | | | Value
(000) | |
| Mortgage-backed obligations (continued) | | | | | | | | |
| Collateralized mortgage-backed obligations (privately originated) (continued) | | | | | | | | |
| Freddie Mac Structured Agency Credit Risk Debt Notes, Series 2022-DNA5, Class M1A, (30-day Average USD-SOFR + 2.95%) 3.729% 20424,5,7 | | USD | 313 | | | $ | 314 | |
| Freddie Mac Structured Agency Credit Risk Debt Notes, Series 2020-DNA2, Class M2, (1-month USD-LIBOR + 1.85%) 3.474% 20504,5,7 | | | 3,548 | | | | 3,516 | |
| GCAT, Series 2021-NQM6, Class A1, 1.855% 20664,5,7 | | | 3,823 | | | | 3,492 | |
| Home Partners of America Trust, Series 2021-2, Class A, 1.901% 20264,7 | | | 5,446 | | | | 4,871 | |
| Hundred Acre Wood Trust, Series 2021-INV1, Class A3, 2.50% 20514,5,7 | | | 914 | | | | 788 | |
| JPMDB Commercial Mortgage Securities Trust, Series 2017-C7, Class A5, 3.409% 20507 | | | 240 | | | | 230 | |
| Legacy Mortgage Asset Trust, Series 2021-GS2, Class A1, 1.75% 20614,5,7 | | | 914 | | | | 861 | |
| Legacy Mortgage Asset Trust, Series 2022-GS1, Class A1, 4.00% 2061 (7.00% on 4/25/2025)3,4,7,9 | | | 3,806 | | | | 3,671 | |
| Legacy Mortgage Asset Trust, Series 2021-GS5, Class A1, 2.25% 2067 (5.25% on 11/25/2024)3,4,7 | | | 2,825 | | | | 2,645 | |
| Mello Warehouse Securitization Trust, Series 2021-3, Class A, (1-month USD-LIBOR + 0.85%) 2.474% 20554,5,7 | | | 16,160 | | | | 15,704 | |
| MFRA Trust, Series 2021-RPL1, Class A1, 1.131% 20604,5,7 | | | 3,428 | | | | 3,173 | |
| MRA Issuance Trust, Series 2020-10, Class A3, (1-month USD-LIBOR + 1.30%) 2.10% 20224,5,7 | | | 8,555 | | | | 8,448 | |
| PRKCM Trust, Series 2021-AFC2, Class A1, 2.071% 20564,5,7 | | | 3,760 | | | | 3,224 | |
| Progress Residential Trust, Series 2022-SFR3, Class A, 3.20% 20394,7 | | | 1,132 | | | | 1,070 | |
| Reverse Mortgage Investment Trust, Series 2021-HB1, Class A, 1.259% 20314,5,7 | | | 4,530 | | | | 4,359 | |
| Towd Point Mortgage Trust, Series 2020-4, Class A1, 1.75% 20604,7 | | | 11,719 | | | | 10,815 | |
| Treehouse Park Improvement Association No.1 - Anleihen 9.75% 20334,9,10 | | | 1,680 | | | | 1,490 | |
| Tricon Residential, Series 2021-SFR1, Class A, 1.943% 20384,7 | | | 5,038 | | | | 4,580 | |
| | | | | | | | 130,731 | |
| | | | | | | | | |
| Other mortgage-backed securities 0.22% | | | | | | | | |
| Nykredit Realkredit AS, Series CCE, 1.00% 20507 | | DKK | 78,145 | | | | 8,664 | |
| Nykredit Realkredit AS, Series 01E, 1.00% 20537 | | | 108,763 | | | | 11,927 | |
| Realkredit Danmark AS 1.00% 20537 | | | 29,536 | | | | 3,239 | |
| | | | | | | | 23,830 | |
| | | | | | | | | |
| Total mortgage-backed obligations | | | | | | | 2,446,518 | |
| | | | | | | | | |
| Asset-backed obligations 4.43% | | | | | | | | |
| Aesop Funding, LLC, Series 2019-2A, Class A, 3.35% 20254,7 | | USD | 2,210 | | | | 2,175 | |
| Aesop Funding, LLC, Series 2018-2A, Class A, 4.00% 20254,7 | | | 2,755 | | | | 2,756 | |
| Aesop Funding, LLC, Series 2020-1A, Class A, 2.33% 20264,7 | | | 7,689 | | | | 7,322 | |
| Aesop Funding, LLC, Series 2021-1A, Class A, 1.38% 20274,7 | | | 3,445 | | | | 3,087 | |
| Aesop Funding, LLC, Series 2021-1A, Class B, 1.63% 20274,7 | | | 531 | | | | 470 | |
| Aesop Funding, LLC, Series 2020-2, Class A, 2.02% 20274,7 | | | 2,427 | | | | 2,233 | |
| Aesop Funding, LLC, Series 2021-1A, Class C, 2.13% 20274,7 | | | 193 | | | | 170 | |
| Aesop Funding, LLC, Series 2020-2A, Class B, 2.96% 20274,7 | | | 623 | | | | 586 | |
| Aesop Funding, LLC, Series 2020-2A, Class C, 4.25% 20274,7 | | | 1,279 | | | | 1,229 | |
| Affirm Asset Securitization Trust, Series 2021-B, Class A, 1.03% 20264,7 | | | 701 | | | | 665 | |
| Affirm Asset Securitization Trust, Series 2021-Z2, Class A, 1.17% 20264,7 | | | 989 | | | | 963 | |
| Affirm Asset Securitization Trust, Series 2022-X1, Class A, 1.75% 20274,7 | | | 1,426 | | | | 1,402 | |
| AGL CLO, Ltd., Series 2022-18A, Class A1, (3-month USD CME Term SOFR + 1.32%) 2.438% 20314,5,7 | | | 8,585 | | | | 8,553 | |
| American Credit Acceptance Receivables Trust, Series 2020-3, Class C, 1.85% 20264,7 | | | 2,387 | | | | 2,364 | |
| American Credit Acceptance Receivables Trust, Series 2020-3, Class D, 2.40% 20264,7 | | | 2,500 | | | | 2,422 | |
| American Credit Acceptance Receivables Trust, Series 2021-1, Class C, 0.83% 20274,7 | | | 1,465 | | | | 1,432 | |
| American Credit Acceptance Receivables Trust, Series 2021-1, Class D, 1.14% 20274,7 | | | 806 | | | | 765 | |
| American Homes 4 Rent, Series 2014-SFR2, Class A, 3.786% 20364,7 | | | 1,147 | | | | 1,140 | |
| American Homes 4 Rent, Series 2015-SFR2, Class A, 3.732% 20524,7 | | | 2,811 | | | | 2,767 | |
| American Homes 4 Rent, Series 2015-SFR2, Class B, 4.295% 20524,7 | | | 396 | | | | 392 | |
| AmeriCredit Automobile Receivables Trust, Series 2021-2, Class B, 0.69% 20277 | | | 997 | | | | 941 | |
| AmeriCredit Automobile Receivables Trust, Series 2021-2, Class C, 1.01% 20277 | | | 1,109 | | | | 1,029 | |
| AmeriCredit Automobile Receivables Trust, Series 2021-2, Class D, 1.29% 20277 | | | 2,613 | | | | 2,404 | |
| American Funds Insurance Series | 175 |
The Bond Fund of America (continued)
| Bonds, notes & other debt instruments (continued) | | Principal amount
(000) | | | Value
(000) | |
| Asset-backed obligations (continued) | | | | | | | | |
| Ballyrock CLO, Ltd., Series 2019-2A, Class A1AR, (3-month USD-LIBOR + 1.00%) 2.478% 20304,5,7 | | USD | 575 | | | $ | 566 | |
| Bankers Healthcare Group Securitization Trust, Series 2021-B, Class A, 0.90% 20344,7 | | | 231 | | | | 219 | |
| Bankers Healthcare Group Securitization Trust, Series 2021-B, Class B, 1.67% 20344,7 | | | 269 | | | | 240 | |
| Blackbird Capital II Aircraft Lease, Ltd. / Blackbird Capital II Aircraft Lease US, LLC, Series 2021-1, Class A, 2.443% 20464,7 | | | 4,201 | | | | 3,601 | |
| Blackbird Capital II Aircraft Lease, Ltd. / Blackbird Capital II Aircraft Lease US, LLC, Series 2021-1, Class B, 3.446% 20464,7 | | | 497 | | | | 401 | |
| CarMaxAuto Owner Trust, Series 2019-2, Class C, 3.16% 20257 | | | 400 | | | | 397 | |
| CarMaxAuto Owner Trust, Series 2021-1, Class C, 0.94% 20267 | | | 210 | | | | 194 | |
| CarMaxAuto Owner Trust, Series 2021-1, Class D, 1.28% 20277 | | | 206 | | | | 188 | |
| Carvana Auto Receivables Trust, Series 2021-N4, Class C, 1.72% 20287 | | | 538 | | | | 514 | |
| Carvana Auto Receivables Trust, Series 2021-N4, Class A2, 1.80% 20287 | | | 884 | | | | 832 | |
| Castlelake Aircraft Securitization Trust, Series 2021-1, Class A, 2.868% 20374,7 | | | 16,378 | | | | 14,503 | |
| Castlelake Aircraft Securitization Trust, Series 2021-1, Class C, 3.464% 20374,7 | | | 6,342 | | | | 5,720 | |
| Castlelake Aircraft Securitization Trust, Series 2021-1, Class C, 6.171% 20374,7 | | | 685 | | | | 586 | |
| Castlelake Aircraft Securitization Trust, Series 2017-1R, Class A, 2.741% 20414,7 | | | 910 | | | | 818 | |
| CF Hippolyta, LLC, Series 2020-1, Class A1, 1.69% 20604,7 | | | 18,930 | | | | 17,179 | |
| CF Hippolyta, LLC, Series 2020-1, Class A2, 1.99% 20604,7 | | | 1,982 | | | | 1,698 | |
| CF Hippolyta, LLC, Series 2020-1, Class B1, 2.28% 20604,7 | | | 3,441 | | | | 3,093 | |
| CF Hippolyta, LLC, Series 2020-1, Class B2, 2.60% 20604,7 | | | 373 | | | | 318 | |
| CF Hippolyta, LLC, Series 2021-1, Class A1, 1.53% 20614,7 | | | 6,134 | | | | 5,417 | |
| CF Hippolyta, LLC, Series 2021-1, Class B1, 1.98% 20614,7 | | | 1,943 | | | | 1,681 | |
| CLI Funding VI, LLC, Series 2020-2A, Class A, 2.03% 20454,7 | | | 2,479 | | | | 2,226 | |
| CLI Funding VI, LLC, Series 2020-3A, Class A, 2.07% 20454,7 | | | 5,171 | | | | 4,672 | |
| CLI Funding VIII, LLC, Series 2021-1A, Class A, 2.38% 20464,7 | | | 464 | | | | 411 | |
| CPS Auto Receivables Trust, Series 2019-C, Class D, 3.17% 20254,7 | | | 918 | | | | 917 | |
| CPS Auto Receivables Trust, Series 2019-B, Class D, 3.69% 20254,7 | | | 1,539 | | | | 1,541 | |
| CPS Auto Receivables Trust, Series 2021-A, Class C, 0.83% 20264,7 | | | 694 | | | | 679 | |
| CPS Auto Receivables Trust, Series 2021-A, Class D, 1.16% 20264,7 | | | 590 | | | | 564 | |
| CPS Auto Receivables Trust, Series 2022-B, Class A, 2.88% 20264,7 | | | 2,591 | | | | 2,563 | |
| CPS Auto Receivables Trust, Series 2022-B, Class B, 3.88% 20284,7 | | | 2,111 | | | | 2,094 | |
| CPS Auto Receivables Trust, Series 2022-B, Class C, 4.33% 20284,7 | | | 2,797 | | | | 2,775 | |
| Credit Acceptance Auto Loan Trust, Series 2020-1A, Class A, 2.01% 20294,7 | | | 3,549 | | | | 3,537 | |
| Drive Auto Receivables Trust, Series 2021-1, Class B, 0.65% 20257 | | | 2,524 | | | | 2,513 | |
| Drive Auto Receivables Trust, Series 2019-3, Class C, 2.90% 20257 | | | 1,547 | | | | 1,548 | |
| Drive Auto Receivables Trust, Series 2019-2, Class C, 3.42% 20257 | | | 328 | | | | 328 | |
| Drive Auto Receivables Trust, Series 2019-3, Class D, 3.18% 20267 | | | 4,020 | | | | 3,994 | |
| Drive Auto Receivables Trust, Series 2021-1, Class C, 1.02% 20277 | | | 5,369 | | | | 5,233 | |
| Drive Auto Receivables Trust, Series 2021-1, Class D, 1.45% 20297 | | | 4,053 | | | | 3,798 | |
| Drivetime Auto Owner Trust, Series 2019-3, Class C, 2.74% 20254,7 | | | 128 | | | | 128 | |
| Drivetime Auto Owner Trust, Series 2019-3, Class D, 2.96% 20254,7 | | | 1,915 | | | | 1,902 | |
| Drivetime Auto Owner Trust, Series 2019-2A, Class C, 3.18% 20254,7 | | | 29 | | | | 29 | |
| Drivetime Auto Owner Trust, Series 2019-2A, Class D, 3.48% 20254,7 | | | 4,250 | | | | 4,242 | |
| Drivetime Auto Owner Trust, Series 2021-1A, Class C, 0.84% 20264,7 | | | 825 | | | | 787 | |
| Drivetime Auto Owner Trust, Series 2021-1A, Class D, 1.16% 20264,7 | | | 449 | | | | 417 | |
| Drivetime Auto Owner Trust, Series 2020-3A, Class C, 1.47% 20264,7 | | | 817 | | | | 795 | |
| Drivetime Auto Owner Trust, Series 2021-2A, Class B, 0.81% 20274,7 | | | 1,179 | | | | 1,144 | |
| Drivetime Auto Owner Trust, Series 2021-2A, Class C, 1.10% 20274,7 | | | 1,231 | | | | 1,169 | |
| Drivetime Auto Owner Trust, Series 2021-2A, Class D, 1.50% 20274,7 | | | 832 | | | | 774 | |
| EDvestinU Private Education Loan, LLC, Series 2021-A, Class A, 1.80% 20454,7 | | | 463 | | | | 412 | |
| Exeter Automobile Receivables Trust, Series 2019-3A, Class C, 2.79% 20244,7 | | | 170 | | | | 169 | |
| Exeter Automobile Receivables Trust, Series 2021-2, Class B, 0.57% 20257 | | | 1,663 | | | | 1,638 | |
| Exeter Automobile Receivables Trust, Series 2020-3A, Class C, 1.32% 20257 | | | 780 | | | | 773 | |
| Exeter Automobile Receivables Trust, Series 2020-1A, Class D, 2.73% 20254,7 | | | 900 | | | | 888 | |
| Exeter Automobile Receivables Trust, Series 2022-2A, Class A3, 2.80% 20257 | | | 1,162 | | | | 1,148 | |
| Exeter Automobile Receivables Trust, Series 2019-3A, Class D, 3.11% 20254,7 | | | 5,000 | | | | 4,969 | |
| Exeter Automobile Receivables Trust, Series 2019-2A, Class D, 3.71% 20254,7 | | | 5,194 | | | | 5,192 | |
| Exeter Automobile Receivables Trust, Series 2021-2, Class C, 0.98% 20267 | | | 1,807 | | | | 1,739 | |
| Exeter Automobile Receivables Trust, Series 2020-3A, Class D, 1.73% 20267 | | | 1,012 | | | | 984 | |
| Exeter Automobile Receivables Trust, Series 2022-2A, Class B, 3.65% 20267 | | | 3,047 | | | | 2,999 | |
| 176 | American Funds Insurance Series |
The Bond Fund of America (continued)
| Bonds, notes & other debt instruments (continued) | | Principal amount
(000) | | | Value
(000) | |
| Asset-backed obligations (continued) | | | | | | | | |
| Exeter Automobile Receivables Trust, Series 2021-2, Class D, 1.40% 20277 | | USD | 2,612 | | | $ | 2,436 | |
| Exeter Automobile Receivables Trust, Series 2022-2A, Class D, 4.56% 20287 | | | 1,201 | | | | 1,143 | |
| FirstKey Homes Trust, Series 2020-SFR2, Class A, 1.266% 20374,7 | | | 18,033 | | | | 16,623 | |
| FirstKey Homes Trust, Series 2021-SFR3, Class A, 2.135% 20384,7 | | | 1,393 | | | | 1,272 | |
| FirstKey Homes Trust, Series 2022-SFR2, Class A, 4.145% 20394,7 | | | 1,743 | | | | 1,716 | |
| Ford Credit Auto Owner Trust, Series 2018-2, Class A, 3.47% 20304,7 | | | 17,675 | | | | 17,625 | |
| Ford Credit Auto Owner Trust, Series 2018-1, Class A, 3.19% 20314,7 | | | 30,070 | | | | 29,605 | |
| GCI Funding I, LLC, Series 2020-1, Class A, 2.82% 20454,7 | | | 2,312 | | | | 2,138 | |
| GCI Funding I, LLC, Series 2021-1, Class A, 2.38% 20464,7 | | | 1,517 | | | | 1,345 | |
| GCI Funding I, LLC, Series 2021-1, Class B, 3.04% 20464,7 | | | 169 | | | | 148 | |
| Global SC Finance VII SRL, Series 2020-2A, Class A, 2.26% 20404,7 | | | 3,084 | | | | 2,824 | |
| Global SC Finance VII SRL, Series 2021-1A, Class A, 1.86% 20414,7 | | | 10,425 | | | | 9,296 | |
| Global SC Finance VII SRL, Series 2021-2A, Class A, 1.95% 20414,7 | | | 2,913 | | | | 2,602 | |
| Global SC Finance VII SRL, Series 2021-2A, Class B, 2.49% 20414,7 | | | 228 | | | | 201 | |
| GM Financial Automobile Leasing Trust, Series 2020-2, Class C, 2.56% 20247 | | | 301 | | | | 298 | |
| GM Financial Automobile Leasing Trust, Series 2020-2, Class D, 3.21% 20247 | | | 425 | | | | 422 | |
| Hertz Vehicle Financing III, LLC, Series 2021-A, Class B, 3.65% 20234,7,9,10 | | | 8,590 | | | | 8,337 | |
| Hertz Vehicle Financing III, LLC, Series 2021-1A, Class A, 1.21% 20254,7 | | | 12,703 | | | | 11,895 | |
| Hertz Vehicle Financing III, LLC, Series 2021-1A, Class B, 1.56% 20254,7 | | | 1,171 | | | | 1,083 | |
| Hertz Vehicle Financing III, LLC, Series 2021-1A, Class C, 2.05% 20254,7 | | | 810 | | | | 747 | |
| Hertz Vehicle Financing III, LLC, Series 2021-2A, Class A, 1.68% 20274,7 | | | 17,770 | | | | 15,703 | |
| Hertz Vehicle Financing III, LLC, Series 2021-2A, Class B, 2.12% 20274,7 | | | 1,264 | | | | 1,119 | |
| Hertz Vehicle Financing III, LLC, Series 2021-2A, Class C, 2.52% 20274,7 | | | 859 | | | | 753 | |
| LAD Auto Receivables Trust, Series 2021-1A, Class A, 1.30% 20264,7 | | | 1,324 | | | | 1,282 | |
| LAD Auto Receivables Trust, Series 2021-1A, Class B, 1.94% 20264,7 | | | 304 | | | | 286 | |
| Madison Park Funding, Ltd., CLO, Series 2015-17A, Class AR2, (3-month USD-LIBOR + 1.00%) 2.098% 20304,5,7 | | | 900 | | | | 887 | |
| Marathon CLO, Ltd., Series 2017-9A, Class A1AR, (3-month USD-LIBOR + 1.15%) 2.194% 20294,5,7 | | | 660 | | | | 652 | |
| Mission Lane Credit Card Master Trust, Series 2021-A, Class A, 1.59% 20264,7 | | | 1,242 | | | | 1,197 | |
| Mission Lane Credit Card Master Trust, Series 2021-A, Class B, 2.24% 20264,7 | | | 230 | | | | 222 | |
| Navient Student Loan Trust, Series 2021-EA, Class A, 0.97% 20694,7 | | | 2,721 | | | | 2,443 | |
| Navient Student Loan Trust, Series 2021-C, Class A, 1.06% 20694,7 | | | 4,424 | | | | 4,080 | |
| Navient Student Loan Trust, Series 2021-G, Class A, 1.58% 20704,7 | | | 958 | | | | 848 | |
| Navigator Aircraft ABS, Ltd., Series 2021-1, Class A, 2.771% 20464,7 | | | 4,565 | | | | 4,074 | |
| Nelnet Student Loan Trust, Series 2021-C, Class AFX, 1.32% 20624,7 | | | 358 | | | | 329 | |
| Nelnet Student Loan Trust, Series 2021-A, Class APT1, 1.36% 20624,7 | | | 6,020 | | | | 5,574 | |
| Nelnet Student Loan Trust, Series 2021-B, Class AFX, 1.42% 20624,7 | | | 13,741 | | | | 12,749 | |
| Nelnet Student Loan Trust, Series 2021-C, Class AFL, (1-month USD-LIBOR + 0.74%) 2.335% 20624,5,7 | | | 4,597 | | | | 4,489 | |
| New Economy Assets Phase 1 Issuer, LLC, Series 2021-1, Class A1, 1.91% 20614,7 | | | 50,765 | | | | 44,373 | |
| Newark BSL CLO 2, Ltd., Series 2017-1A, Class A1R, (3-month USD-LIBOR + 0.97%) 2.154% 20304,5,7 | | | 275 | | | | 271 | |
| Oportun Funding, LLC, Series 2021-A, Class A, 1.21% 20284,7 | | | 240 | | | | 225 | |
| Palmer Square Loan Funding, CLO, Series 2020-4, Class A1, (3-month USD-LIBOR + 1.00%) 2.524% 20284,5,7 | | | 1,355 | | | | 1,345 | |
| Palmer Square Loan Funding, CLO, Series 2021-1, Class A1, (3-month USD-LIBOR + 0.90%) 1.963% 20294,5,7 | | | 292 | | | | 289 | |
| PFS Financing Corp., Series 2021-B, Class A, 0.775% 20264,7 | | | 7,884 | | | | 7,318 | |
| Prestige Auto Receivables Trust, Series 2019-1A, Class C, 2.70% 20244,7 | | | 1,815 | | | | 1,813 | |
| Prestige Auto Receivables Trust, Series 2019-1A, Class D, 3.01% 20254,7 | | | 1,355 | | | | 1,341 | |
| Prodigy Finance DAC, Series 2021-1A, Class A, (1-month USD-LIBOR + 1.25%) 2.874% 20514,5,7 | | | 771 | | | | 758 | |
| Santander Drive Auto Receivables Trust, Series 2021-2, Class B, 0.59% 20257 | | | 1,510 | | | | 1,488 | |
| Santander Drive Auto Receivables Trust, Series 2019-2, Class D, 3.22% 20257 | | | 2,955 | | | | 2,948 | |
| Santander Drive Auto Receivables Trust, Series 2021-2, Class C, 0.90% 20267 | | | 2,812 | | | | 2,724 | |
| Santander Drive Auto Receivables Trust, Series 2020-3, Class C, 1.12% 20267 | | | 3,344 | | | | 3,319 | |
| Santander Drive Auto Receivables Trust, Series 2020-3, Class D, 1.64% 20267 | | | 2,211 | | | | 2,157 | |
| Santander Drive Auto Receivables Trust, Series 2021-3, Class C, 0.95% 20277 | | | 1,677 | | | | 1,614 | |
| Santander Drive Auto Receivables Trust, Series 2021-3, Class D, 1.33% 20277 | | | 2,236 | | | | 2,115 | |
| Santander Drive Auto Receivables Trust, Series 2021-2, Class D, 1.35% 20277 | | | 1,802 | | | | 1,692 | |
| American Funds Insurance Series | 177 |
The Bond Fund of America (continued)
| Bonds, notes & other debt instruments (continued) | | Principal amount (000) | | | Value
(000) | |
| Asset-backed obligations (continued) | | | | | | | | |
| Slam, Ltd., Series 2021-1, Class A, 2.434% 20464,7 | | USD | 2,732 | | | $ | 2,362 | |
| Slam, Ltd., Series 2021-1, Class B, 3.422% 20464,7 | | | 503 | | | | 427 | |
| SOLRR Aircraft Aviation Holding, Ltd., Series 2021-1, Class A, 2.636% 20464,7 | | | 2,478 | | | | 2,260 | |
| Sound Point CLO, Ltd., Series 2015-1RA, Class AR, (3-month USD-LIBOR + 1.08%) 2.124% 20304,5,7 | | | 475 | | | | 469 | |
| Sprite, Ltd., Series 2021-1, Class A, 3.75% 20464,7 | | | 3,396 | | | | 3,078 | |
| Stellar Jay Ireland DAC, Series 2021-1, Class A, 3.967% 20414,7 | | | 453 | | | | 404 | |
| Stonepeak Infrastructure Partners, Series 2021-1A, Class AA, 2.301% 20334,7 | | | 1,323 | | | | 1,235 | |
| Stonepeak Infrastructure Partners, Series 2021-1A, Class A, 2.675% 20334,7 | | | 1,525 | | | | 1,398 | |
| SuttonPark Structured Settlements, Series 2021-1, Class A, 1.95% 20754,7 | | | 2,581 | | | | 2,404 | |
| TAL Advantage V, LLC, Series 2020-1A, Class A, 2.05% 20454,7 | | | 3,175 | | | | 2,884 | |
| Textainer Marine Containers, Ltd., Series 2020-2A, Class A, 2.10% 20454,7 | | | 2,366 | | | | 2,145 | |
| Textainer Marine Containers, Ltd., Series 2020-1A, Class A, 2.73% 20454,7 | | | 1,364 | | | | 1,281 | |
| Textainer Marine Containers, Ltd., Series 2021-1A, Class A, 1.68% 20464,7 | | | 6,480 | | | | 5,665 | |
| Textainer Marine Containers, Ltd., Series 2021-2A, Class A, 2.23% 20464,7 | | | 5,440 | | | | 4,845 | |
| Textainer Marine Containers, Ltd., Series 2021-1A, Class B, 2.52% 20464,7 | | | 362 | | | | 322 | |
| TIF Funding II, LLC, Series 2020-1A, Class A, 2.09% 20454,7 | | | 4,571 | | | | 4,114 | |
| TIF Funding II, LLC, Series 2021-1A, Class B, 2.54% 20464,7 | | | 136 | | | | 117 | |
| Toyota Auto Loan Extended Note Trust, Series 2019-1, Class A, 2.56% 20314,7 | | | 6,000 | | | | 5,873 | |
| Triton Container Finance VIII, LLC, Series 2020-1, Class A, 2.11% 20454,7 | | | 10,965 | | | | 9,774 | |
| Triton Container Finance VIII, LLC, Series 2021-1, Class A, 1.86% 20464,7 | | | 4,412 | | | | 3,860 | |
| Triton Container Finance VIII, LLC, Series 2021-1A, Class B, 2.58% 20464,7 | | | 364 | | | | 316 | |
| Westlake Automobile Receivables Trust, Series 2020-3A, Class C, 1.24% 20254,7 | | | 1,557 | | | | 1,519 | |
| Westlake Automobile Receivables Trust, Series 2021-2, Class B, 0.62% 20264,7 | | | 1,690 | | | | 1,629 | |
| Westlake Automobile Receivables Trust, Series 2021-2, Class C, 0.89% 20264,7 | | | 2,181 | | | | 2,066 | |
| Westlake Automobile Receivables Trust, Series 2021-2, Class D, 1.23% 20264,7 | | | 1,446 | | | | 1,350 | |
| Westlake Automobile Receivables Trust, Series 2020-3A, Class D, 1.65% 20264,7 | | | 3,023 | | | | 2,908 | |
| | | | | | | | 486,061 | |
| | | | | | | | | |
| Municipals 1.63% | | | | | | | | |
| California 0.03% | | | | | | | | |
| G.O. Bonds, Series 2009, 7.50% 2034 | | | 2,100 | | | | 2,700 | |
| Golden State Tobacco Securitization Corp., Enhanced Tobacco Settlement Asset-Backed Bonds, Series 2021-B, 2.746% 2034 | | | 650 | | | | 562 | |
| | | | | | | | 3,262 | |
| | | | | | | | | |
| Illinois 1.48% | | | | | | | | |
| City of Chicago, Board of Education, Unlimited Tax G.O. Bonds (Dedicated Rev.), Series 2010-C, 6.319% 2029 | | | 65 | | | | 68 | |
| City of Chicago, Board of Education, Unlimited Tax G.O. Bonds (Dedicated Rev.), Series 2009-E, 6.138% 2039 | | | 30,835 | | | | 31,320 | |
| City of Chicago, Board of Education, Unlimited Tax G.O. Bonds (Dedicated Rev.), Series 2010-D, 6.519% 2040 | | | 8,945 | | | | 9,360 | |
| City of Chicago, Board of Education, Unlimited Tax G.O. Bonds (Qualified School Construction Bonds), Series 2009-G, 1.75% 2025 | | | 2,500 | | | | 2,233 | |
| G.O. Bonds, Series 2013-B, 4.31% 2023 | | | 2,125 | | | | 2,129 | |
| G.O. Bonds, Pension Funding, Series 2003, 4.95% 2023 | | | 6,228 | | | | 6,275 | |
| G.O. Bonds, Pension Funding, Series 2003, 5.10% 2033 | | | 107,000 | | | | 107,781 | |
| G.O. Bonds, Taxable Build America Bonds, Series 2010-2, 5.95% 2023 | | | 3,210 | | | | 3,250 | |
| | | | | | | | 162,416 | |
| | | | | | | | | |
| New York 0.05% | | | | | | | | |
| Dormitory Auth., Taxable State Personal Income Tax Rev. Bonds (General Purpose), Series 2021-C, 2.202% 2034 | | | 6,390 | | | | 5,227 | |
| | | | | | | | | |
| Texas 0.03% | | | | | | | | |
| Grand Parkway Transportation Corp., Grand Parkway System Toll Rev. Ref. Bonds, Series 2020-B, 3.236% 2052 | | | 4,075 | | | | 3,274 | |
| 178 | American Funds Insurance Series |
The Bond Fund of America (continued)
| Bonds, notes & other debt instruments (continued) | | Principal amount
(000) | | | Value
(000) | |
| Municipals (continued) | | | | | | | | |
| Wisconsin 0.04% | | | | | | | | |
| Public Fin. Auth., Federal Lease Rev. Bonds (Fort Sam Acquisition Fncg.), Series 2022, 4.95% 2034 | | USD | 4,600 | | | $ | 4,359 | |
| | | | | | | | | |
| Total municipals | | | | | | | 178,538 | |
| | | | | | | | | |
| Bonds & notes of governments & government agencies outside the U.S. 1.27% | | | | | | | | |
| Chile (Republic of) 3.50% 2034 | | | 600 | | | | 535 | |
| Chile (Republic of) 3.10% 2041 | | | 2,340 | | | | 1,786 | |
| Chile (Republic of) 4.34% 2042 | | | 1,320 | | | | 1,178 | |
| Chile (Republic of) 4.00% 2052 | | | 580 | | | | 482 | |
| China (People’s Republic of), Series INBK, 3.81% 2050 | | CNY | 13,380 | | | | 2,160 | |
| China (People’s Republic of), Series INBK, 3.72% 2051 | | | 48,340 | | | | 7,709 | |
| Colombia (Republic of) 4.125% 2051 | | USD | 3,120 | | | | 1,876 | |
| Colombia (Republic of), Series B, 5.75% 2027 | | COP | 24,813,800 | | | | 4,734 | |
| Dominican Republic 5.95% 20274 | | USD | 8,100 | | | | 7,753 | |
| Indonesia (Republic of) 3.35% 2071 | | | 1,660 | | | | 1,179 | |
| Israel (State of) 3.375% 2050 | | | 4,750 | | | | 3,851 | |
| Israel (State of) 3.875% 2050 | | | 4,775 | | | | 4,209 | |
| Panama (Republic of) 3.362% 2031 | | | 15,625 | | | | 13,773 | |
| Panama (Republic of) 3.87% 2060 | | | 7,500 | | | | 5,324 | |
| Panama (Republic of) 4.50% 2063 | | | 395 | | | | 305 | |
| Paraguay (Republic of) 5.00% 2026 | | | 1,250 | | | | 1,230 | |
| Peru (Republic of) 6.35% 2028 | | PEN | 5,840 | | | | 1,439 | |
| Peru (Republic of) 5.94% 2029 | | | 6,005 | | | | 1,434 | |
| Peru (Republic of) 2.783% 2031 | | USD | 3,790 | | | | 3,232 | |
| Peru (Republic of) 6.15% 2032 | | PEN | 12,950 | | | | 2,994 | |
| Peru (Republic of) 3.00% 2034 | | USD | 2,400 | | | | 1,975 | |
| Peru (Republic of) 3.60% 2072 | | | 7,640 | | | | 5,191 | |
| Philippines (Republic of) 3.229% 2027 | | | 475 | | | | 461 | |
| Philippines (Republic of) 3.20% 2046 | | | 4,900 | | | | 3,687 | |
| Philippines (Republic of) 4.20% 2047 | | | 272 | | | | 239 | |
| Portuguese Republic 5.125% 2024 | | | 24,775 | | | | 25,613 | |
| PT Indonesia Asahan Aluminium Tbk 5.71% 20234 | | | 1,020 | | | | 1,035 | |
| PT Indonesia Asahan Aluminium Tbk 4.75% 20254 | | | 1,270 | | | | 1,264 | |
| PT Indonesia Asahan Aluminium Tbk 5.45% 20304 | | | 340 | | | | 320 | |
| PT Indonesia Asahan Aluminium Tbk 5.80% 20504 | | | 1,150 | | | | 928 | |
| Qatar (State of) 4.50% 20284 | | | 5,100 | | | | 5,291 | |
| Qatar (State of) 5.103% 20484 | | | 3,400 | | | | 3,569 | |
| Romania 3.75% 2034 | | EUR | 5,625 | | | | 4,444 | |
| Saudi Arabia (Kingdom of) 3.628% 20274 | | USD | 5,000 | | | | 4,964 | |
| Saudi Arabia (Kingdom of) 3.625% 20284 | | | 11,435 | | | | 11,302 | |
| United Mexican States 3.50% 2034 | | | 1,030 | | | | 853 | |
| United Mexican States 4.40% 2052 | | | 675 | | | | 510 | |
| | | | | | | | 138,829 | |
| | | | | | | | | |
| Federal agency bonds & notes 0.10% | | | | | | | | |
| Fannie Mae 2.125% 20261 | | | 11,910 | | | | 11,502 | |
| | | | | | | | | |
| Total bonds, notes & other debt instruments (cost: $11,470,544,000) | | | | | | | 10,721,189 | |
| American Funds Insurance Series | 179 |
The Bond Fund of America (continued)
| Short-term securities 18.26% | | Shares | | | Value
(000) | |
| Money market investments 18.26% | | | | | | | | |
| Capital Group Central Cash Fund 1.38%11,12 | | | 20,033,647 | | | $ | 2,002,964 | |
| | | | | | | | | |
| Total short-term securities (cost: $2,003,265,000) | | | | | | | 2,002,964 | |
| Total investment securities 116.00% (cost: $13,473,809,000) | | | | | | | 12,724,153 | |
| Other assets less liabilities (16.00)% | | | | | | | (1,755,255 | ) |
| | | | | | | | | |
| Net assets 100.00% | | | | | | $ | 10,968,898 | |
Futures contracts
| Contracts | | Type | | Number of
contracts | | Expiration | | Notional
amount
(000) | | | Value and
unrealized
appreciation
(depreciation)
at 6/30/2022
(000) | |
| 30 Day Federal Funds Futures | | Long | | 3,679 | | September 2022 | | USD | 1,498,316 | | | | $ | 512 | |
| 90 Day Eurodollar Futures | | Long | | 2,771 | | September 2022 | | | 670,547 | | | | | (18,008 | ) |
| 3 Month SOFR Futures | | Short | | 658 | | June 2023 | | | (158,956 | ) | | | | 157 | |
| 2 Year U.S. Treasury Note Futures | | Short | | 4,626 | | September 2022 | | | (971,532 | ) | | | | (2,450 | ) |
| 5 Year Euro-Bobl Futures | | Short | | 63 | | September 2022 | | | (8,199 | ) | | | | 81 | |
| 5 Year U.S. Treasury Note Futures | | Long | | 2,237 | | September 2022 | | | 251,103 | | | | | 2,326 | |
| 10 Year Euro-Bund Futures | | Short | | 51 | | September 2022 | | | (7,951 | ) | | | | 207 | |
| 10 Year Ultra U.S. Treasury Note Futures | | Long | | 2,281 | | September 2022 | | | 290,542 | | | | | 4,736 | |
| 10 Year U.S. Treasury Note Futures | | Long | | 2,148 | | September 2022 | | | 254,605 | | | | | 2,999 | |
| 20 Year U.S. Treasury Bond Futures | | Long | | 1,463 | | September 2022 | | | 202,808 | | | | | (2,688 | ) |
| 30 Year Ultra U.S. Treasury Bond Futures | | Long | | 855 | | September 2022 | | | 131,964 | | | | | (2,789 | ) |
| | | | | | | | | | | | | | $ | (14,917 | ) |
Forward currency contracts
| Contract amount | | | | | | Unrealized
appreciation
(depreciation) | |
Currency purchased
(000) | | Currency sold
(000) | | Counterparty | | Settlement
date | | at 6/30/2022
(000) | |
| USD | | 5,555 | | COP | | 22,893,650 | | UBS AG | | 7/6/2022 | | | $ | 46 | |
| COP | | 22,893,650 | | USD | | 5,540 | | UBS AG | | 7/6/2022 | | | | (30 | ) |
| USD | | 3,074 | | PEN | | 11,415 | | Bank of America | | 7/12/2022 | | | | 96 | |
| KRW | | 16,629,740 | | USD | | 13,220 | | JPMorgan Chase | | 7/12/2022 | | | | (316 | ) |
| USD | | 621 | | EUR | | 582 | | Standard Chartered Bank | | 7/13/2022 | | | | 11 | |
| USD | | 1,231 | | EUR | | 1,180 | | JPMorgan Chase | | 7/18/2022 | | | | (7 | ) |
| USD | | 26,606 | | DKK | | 188,025 | | Bank of New York Mellon | | 7/27/2022 | | | | 65 | |
| USD | | 5,934 | | EUR | | 5,628 | | UBS AG | | 7/27/2022 | | | | 25 | |
| COP | | 1,073,945 | | USD | | 266 | | Citibank | | 7/28/2022 | | | | (9 | ) |
| KRW | | 32,053,900 | | USD | | 24,883 | | Citibank | | 8/5/2022 | | | | 2 | |
| USD | | 5,506 | | COP | | 22,893,650 | | UBS AG | | 8/8/2022 | | | | 31 | |
| USD | | 1,413 | | PEN | | 5,380 | | Citibank | | 8/26/2022 | | | | 17 | |
| USD | | 643 | | PEN | | 2,650 | | Morgan Stanley | | 8/26/2022 | | | | (45 | ) |
| USD | | 830 | | PEN | | 3,440 | | Citibank | | 8/26/2022 | | | | (63 | ) |
| | | | | | | | | | | | | | $ | (177 | ) |
| 180 | American Funds Insurance Series |
The Bond Fund of America (continued)
Swap contracts
Interest rate swaps
Centrally cleared interest rate swaps
| Receive | | Pay | | | | Notional | | | Value at | | | Upfront
premium | | | Unrealized
appreciation
(depreciation) | |
| Rate | | Payment
frequency | | Rate | | Payment
frequency | | Expiration
date | | amount
(000) | | | 6/30/2022
(000) | | | paid
(000) | | | at 6/30/2022
(000) | |
| SOFR | | Annual | | 0.471% | | Annual | | 10/26/2023 | | USD | 87,775 | | | | $ | 2,890 | | | | $ | — | | | | $ | 2,890 | |
| 0.45801% | | Annual | | SOFR | | Annual | | 10/26/2023 | | | 85,775 | | | | | (2,838 | ) | | | | — | | | | | (2,838 | ) |
| 3.5291% | | Annual | | U.S. EFFR | | Annual | | 6/16/2024 | | | 78,378 | | | | | 791 | | | | | — | | | | | 791 | |
| 3.52647% | | Annual | | U.S. EFFR | | Annual | | 6/16/2024 | | | 72,532 | | | | | 729 | | | | | — | | | | | 729 | |
| 3.497% | | Annual | | U.S. EFFR | | Annual | | 6/16/2024 | | | 27,000 | | | | | 256 | | | | | — | | | | | 256 | |
| 3.4325% | | Annual | | U.S. EFFR | | Annual | | 6/17/2024 | | | 19,800 | | | | | 164 | | | | | — | | | | | 164 | |
| 3.4585% | | Annual | | U.S. EFFR | | Annual | | 6/17/2024 | | | 4,154 | | | | | 36 | | | | | — | | | | | 36 | |
| 3-month USD-LIBOR | | Quarterly | | 1.972% | | Semi-annual | | 4/26/2051 | | | 23,200 | | | | | 4,303 | | | | | — | | | | | 4,303 | |
| 3-month USD-LIBOR | | Quarterly | | 1.9855% | | Semi-annual | | 4/26/2051 | | | 8,580 | | | | | 1,568 | | | | | — | | | | | 1,568 | |
| 3-month USD-LIBOR | | Quarterly | | 1.9778% | | Semi-annual | | 4/28/2051 | | | 13,500 | | | | | 2,488 | | | | | — | | | | | 2,488 | |
| | | | | | | | | | | | | | | | $ | 10,387 | | | | $ | — | | | | $ | 10,387 | |
Credit default swaps
Centrally cleared credit default swaps on credit indices — buy protection
Reference
index | | Financing
rate paid | | Payment
frequency | | Expiration
date | | Notional
amount
(000) | | Value at
6/30/2022
(000) | | Upfront
premium
received
(000) | | Unrealized
appreciation
at 6/30/2022
(000) | |
| CDX.NA.HY.38 | | 5.00% | | Quarterly | | 6/20/2027 | | USD114,617 | | $3,452 | | $(5,302 | ) | $8,754 | |
Investments in affiliates12
| | | Value of
affiliate at
1/1/2022
(000) | | | Additions
(000) | | | Reductions
(000) | | | Net
realized
loss
(000) | | | Net
unrealized
depreciation
(000) | | | Value of
affiliate at
6/30/2022
(000) | | | Dividend
income
(000) | |
| Short-term securities 18.26% | | | | | | | | | | | | | | | | | | | | | | | | | | | | |
| Money market investments 18.26% | | | | | | | | | | | | | | | | | | | | | | | | | | | | |
| Capital Group Central Cash Fund 1.38%11 | | $ | 1,311,257 | | | $ | 2,345,528 | | | | $1,653,314 | | | | $(83 | ) | | | $(424 | ) | | $ | 2,002,964 | | | | $3,972 | |
| 1 | All or a portion of this security was pledged as collateral. The total value of pledged collateral was $59,465,000, which represented .54% of the net assets of the fund. |
| 2 | Index-linked bond whose principal amount moves with a government price index. |
| 3 | Step bond; coupon rate may change at a later date. |
| 4 | Acquired in a transaction exempt from registration under Rule 144A of the Securities Act of 1933. May be resold in the U.S. in transactions exempt from registration, normally to qualified institutional buyers. The total value of all such securities was $1,572,955,000, which represented 14.34% of the net assets of the fund. |
| 5 | Coupon rate may change periodically. Reference rate and spread are as of the most recent information available. Some coupon rates are determined by the issuer or agent based on current market conditions; therefore, the reference rate and spread are not available. |
| 6 | Payment in kind; the issuer has the option of paying additional securities in lieu of cash. Payment methods and rates are as of the most recent payment when available. |
| 7 | Principal payments may be made periodically. Therefore, the effective maturity date may be earlier than the stated maturity date. |
| 8 | Purchased on a TBA basis. |
| 9 | Valued under fair value procedures adopted by authority of the board of trustees. The total value of all such securities was $13,498,000, which represented .12% of the net assets of the fund. |
| 10 | Value determined using significant unobservable inputs. |
| 11 | Rate represents the seven-day yield at 6/30/2022. |
| 12 | Part of the same “group of investment companies” as the fund as defined under the Investment Company Act of 1940, as amended. |
| American Funds Insurance Series | 181 |
The Bond Fund of America (continued)
Key to abbreviations
Assn. = Association
Auth. = Authority
CLO = Collateralized Loan Obligations
CME = CME Group
CMO = Collateralized Mortgage Obligations
CNY = Chinese yuan
COP = Colombian pesos
DAC = Designated Activity Company
DKK = Danish kroner
EFFR = Effective Federal Funds Rate
EUR = Euros
Fin. = Finance
Fncg. = Financing
G.O. = General Obligation
ICE = Intercontinental Exchange, Inc.
KRW = South Korean won
LIBOR = London Interbank Offered Rate
PEN = Peruvian nuevos soles
Ref. = Refunding
Rev. = Revenue
SOFR = Secured Overnight Financing Rate
TBA = To be announced
USD = U.S. dollars
Refer to the notes to financial statements.
| 182 | American Funds Insurance Series |
Capital World Bond Fund
| Investment portfolio June 30, 2022 | unaudited |
| Bonds, notes & other debt instruments 96.02% | | Principal amount
(000) | | | Value
(000) | |
| Euros 17.03% | | | | | | | | |
| Allianz SE 4.75% perpetual bonds (3-month EUR-EURIBOR + 3.60% on 10/24/2023)1 | | EUR | 4,200 | | | $ | 4,424 | |
| Altria Group, Inc. 1.00% 2023 | | | 1,020 | | | | 1,066 | |
| Altria Group, Inc. 1.70% 2025 | | | 1,600 | | | | 1,583 | |
| Altria Group, Inc. 2.20% 2027 | | | 2,900 | | | | 2,737 | |
| American Honda Finance Corp. 1.95% 2024 | | | 560 | | | | 587 | |
| American Tower Corp. 0.45% 2027 | | | 2,525 | | | | 2,308 | |
| American Tower Corp. 0.875% 2029 | | | 1,470 | | | | 1,255 | |
| AT&T, Inc. 1.60% 2028 | | | 2,350 | | | | 2,310 | |
| Austria (Republic of) 0% 2031 | | | 6,900 | | | | 6,189 | |
| Bank of America Corp. 3.648% 2029 (3-month EUR-EURIBOR + 3.67% on 3/31/2028)1,2 | | | 5,000 | | | | 5,339 | |
| CaixaBank, SA 2.25% 2030 (5-year EUR Annual (vs. 6-month EUR-EURIBOR) + 1.68% on 4/17/2025)1 | | | 2,400 | | | | 2,340 | |
| Comcast Corp. 0.25% 2029 | | | 955 | | | | 831 | |
| Deutsche Telekom International Finance BV 7.50% 2033 | | | 200 | | | | 288 | |
| Dow Chemical Co. 0.50% 2027 | | | 1,110 | | | | 1,027 | |
| Egypt (Arab Republic of) 5.625% 2030 | | | 300 | | | | 196 | |
| Equinor ASA 1.375% 2032 | | | 2,550 | | | | 2,344 | |
| European Investment Bank 0.25% 2032 | | | 4,900 | | | | 4,333 | |
| European Investment Bank 1.50% 2032 | | | 1,000 | | | | 991 | |
| European Union 0% 2026 | | | 1,600 | | | | 1,584 | |
| European Union 0.25% 2026 | | | 610 | | | | 607 | |
| European Union 0% 2031 | | | 705 | | | | 618 | |
| European Union 0% 2035 | | | 220 | | | | 171 | |
| European Union 0.20% 2036 | | | 1,500 | | | | 1,176 | |
| Finland (Republic of) 1.50% 2032 | | | 3,380 | | | | 3,405 | |
| French Republic O.A.T. 0.10% 20263 | | | 10,514 | | | | 11,696 | |
| French Republic O.A.T. 0% 2030 | | | 19,550 | | | | 17,683 | |
| French Republic O.A.T. 0% 2032 | | | 4,020 | | | | 3,484 | |
| French Republic O.A.T. 0.50% 2040 | | | 2,080 | | | | 1,594 | |
| French Republic O.A.T. 0.75% 2052 | | | 5,930 | | | | 3,963 | |
| Germany (Federal Republic of) 0% 2025 | | | 10,970 | | | | 11,249 | |
| Germany (Federal Republic of) 0% 2026 | | | 6,060 | | | | 6,093 | |
| Germany (Federal Republic of) 0% 2027 | | | 17,510 | | | | 17,478 | |
| Germany (Federal Republic of) 0% 2030 | | | 13,340 | | | | 12,768 | |
| Germany (Federal Republic of) 0% 2031 | | | 12,600 | | | | 11,730 | |
| Germany (Federal Republic of) 0% 2050 | | | 1,200 | | | | 805 | |
| Goldman Sachs Group, Inc. 3.375% 20252 | | | 5,000 | | | | 5,319 | |
| Goldman Sachs Group, Inc. 1.00% 20332 | | | 2,705 | | | | 2,126 | |
| Greece (Hellenic Republic of) 3.375% 2025 | | | 5,825 | | | | 6,258 | |
| Greece (Hellenic Republic of) 0.75% 2031 | | | 1,660 | | | | 1,363 | |
| Greece (Hellenic Republic of) 1.75% 2032 | | | 4,810 | | | | 4,271 | |
| Groupe BPCE SA 4.625% 2023 | | | 1,200 | | | | 1,286 | |
| Groupe BPCE SA 1.00% 2025 | | | 2,900 | | | | 2,901 | |
| Highland Holdings SARL 0.318% 2026 | | | 205 | | | | 192 | |
| Intesa Sanpaolo SpA 6.625% 2023 | | | 510 | | | | 555 | |
| Israel (State of) 2.875% 2024 | | | 1,180 | | | | 1,257 | |
| Italy (Republic of) 1.85% 2025 | | | 17,700 | | | | 18,507 | |
| Italy (Republic of) 1.35% 2030 | | | 7 | | | | 7 | |
| JPMorgan Chase & Co. 0.389% 2028 (3-month EUR-EURIBOR + 0.65% on 2/24/2027)1,2 | | | 3,208 | | | | 2,965 | |
| KfW 0.125% 2025 | | | 590 | | | | 599 | |
| Lloyds Banking Group PLC 1.75% 2028 (5-year EUR-EURIBOR + 1.30% on 9/7/2023)1 | | | 2,400 | | | | 2,448 | |
| Morgan Stanley 2.103% 2026 (3-month EUR-EURIBOR + 0.904% on 5/8/2025)1 | | | 580 | | | | 596 | |
| Morgan Stanley 2.95% 2032 (3-month EUR-EURIBOR +1.245% on 5/7/2031)1 | | | 1,535 | | | | 1,526 | |
| Morocco (Kingdom of) 3.50% 2024 | | | 1,400 | | | | 1,452 | |
| Morocco (Kingdom of) 1.50% 2031 | | | 4,100 | | | | 2,866 | |
| Petroleos Mexicanos 5.50% 2025 | | | 2,520 | | | | 2,650 | |
| Philippines (Republic of) 0.25% 2025 | | | 875 | | | | 855 | |
| Portuguese Republic 0.475% 2030 | | | 1,610 | | | | 1,474 | |
| Quebec (Province of) 0.25% 2031 | | | 920 | | | | 808 | |
| Quebec (Province of) 0.50% 2032 | | | 1,155 | | | | 1,021 | |
| American Funds Insurance Series | 183 |
Capital World Bond Fund (continued)
| Bonds, notes & other debt instruments (continued) | | Principal amount
(000) | | | Value
(000) | |
| Euros (continued) | | | | | | | | |
| Romania 2.125% 2028 | | EUR | 1,440 | | | $ | 1,246 | |
| Romania 1.75% 2030 | | | 2,560 | | | | 1,919 | |
| Romania 3.624% 2030 | | | 3,660 | | | | 3,144 | |
| Romania 2.00% 2032 | | | 1,605 | | | | 1,152 | |
| Romania 2.00% 2033 | | | 2,900 | | | | 1,978 | |
| Romania 3.75% 2034 | | | 1,440 | | | | 1,138 | |
| Russian Federation 2.875% 2025 | | | 3,000 | | | | 833 | |
| Russian Federation 2.875% 2025 | | | 1,500 | | | | 417 | |
| Serbia (Republic of) 3.125% 2027 | | | 10,287 | | | | 9,463 | |
| Serbia (Republic of) 1.00% 2028 | | | 420 | | | | 322 | |
| Serbia (Republic of) 1.50% 2029 | | | 4,153 | | | | 3,169 | |
| Spain (Kingdom of) 0.80% 2027 | | | 8,970 | | | | 8,972 | |
| Spain (Kingdom of) 1.45% 2029 | | | 1,890 | | | | 1,913 | |
| Spain (Kingdom of) 1.25% 2030 | | | 1,295 | | | | 1,261 | |
| Spain (Kingdom of) 0.50% 2031 | | | 4,645 | | | | 4,114 | |
| Spain (Kingdom of) 0.70% 2032 | | | 4,785 | | | | 4,258 | |
| Spain (Kingdom of) 1.90% 2052 | | | 1,010 | | | | 799 | |
| State Grid Overseas Investment, Ltd. 1.375% 2025 | | | 441 | | | | 444 | |
| State Grid Overseas Investment, Ltd. 2.125% 2030 | | | 200 | | | | 190 | |
| Stryker Corp. 0.25% 2024 | | | 480 | | | | 480 | |
| Stryker Corp. 0.75% 2029 | | | 980 | | | | 878 | |
| Stryker Corp. 1.00% 2031 | | | 450 | | | | 379 | |
| TOTAL SA 1.75% junior subordinated perpetual bonds (5-year EUR-EURIBOR + 1.765% on 4/4/2024)1 | | | 2,000 | | | | 1,973 | |
| Toyota Motor Credit Corp. 0.125% 2027 | | | 1,850 | | | | 1,672 | |
| Tunisia (Republic of) 6.75% 2023 | | | 5,209 | | | | 3,805 | |
| Tunisia (Republic of) 6.75% 2023 | | | 1,295 | | | | 946 | |
| Ukraine 6.75% 2026 | | | 3,119 | | | | 858 | |
| Ukraine 6.75% 2026 | | | 1,225 | | | | 337 | |
| Ukraine 4.375% 2030 | | | 2,705 | | | | 703 | |
| Volkswagen International Finance NV 4.375% junior subordinated perpetual bonds (9-year EUR Mid-Swap + 3.36% on 3/28/2031)1 | | | 1,300 | | | | 1,099 | |
| | | | | | | | 269,416 | |
| | | | | | | | | |
| Japanese yen 8.50% | | | | | | | | |
| Export-Import Bank of India 0.59% 2022 | | JPY | 400,000 | | | | 2,947 | |
| Japan, Series 18, 0.10% 20243 | | | 1,043,840 | | | | 7,913 | |
| Japan, Series 19, 0.10% 20243 | | | 455,063 | | | | 3,460 | |
| Japan, Series 21, 0.10% 20263 | | | 1,008,764 | | | | 7,794 | |
| Japan, Series 346, 0.10% 2027 | | | 777,900 | | | | 5,758 | |
| Japan, Series 356, 0.10% 2029 | | | 3,529,000 | | | | 25,867 | |
| Japan, Series 24, 0.10% 20293 | | | 364,593 | | | | 2,837 | |
| Japan, Series 359, 0.10% 2030 | | | 973,150 | | | | 7,102 | |
| Japan, Series 116, 2.20% 2030 | | | 576,100 | | | | 4,890 | |
| Japan, Series 26, 0.005% 20313 | | | 517,272 | | | | 4,033 | |
| Japan, Series 362, 0.10% 2031 | | | 737,200 | | | | 5,365 | |
| Japan, Series 363, 0.10% 2031 | | | 180,000 | | | | 1,308 | |
| Japan, Series 145, 1.70% 2033 | | | 1,302,050 | | | | 10,954 | |
| Japan, Series 152, 1.20% 2035 | | | 987,100 | | | | 7,907 | |
| Japan, Series 21, 2.30% 2035 | | | 720,000 | | | | 6,519 | |
| Japan, Series 179, 0.50% 2041 | | | 822,650 | | | | 5,653 | |
| Japan, Series 37, 0.60% 2050 | | | 694,500 | | | | 4,406 | |
| Japan, Series 73, 0.70% 2051 | | | 996,800 | | | | 6,448 | |
| Japan, Series 70, 0.70% 2051 | | | 925,450 | | | | 6,003 | |
| Philippines (Republic of) 0.001% 2024 | | | 900,000 | | | | 6,578 | |
| United Mexican States 0.62% 2022 | | | 100,000 | | | | 737 | |
| | | | | | | | 134,479 | |
| 184 | American Funds Insurance Series |
Capital World Bond Fund (continued)
| Bonds, notes & other debt instruments (continued) | | Principal amount
(000) | | | Value
(000) | |
| Chinese yuan renminbi 3.31% | | | | | | | | |
| Agricultural Development Bank of China 2.96% 2030 | | CNY | 41,790 | | | $ | 6,187 | |
| China (People’s Republic of), Series 1910, 3.86% 2049 | | | 103,240 | | | | 16,766 | |
| China (People’s Republic of), Series INBK, 3.39% 2050 | | | 31,040 | | | | 4,648 | |
| China (People’s Republic of), Series INBK, 3.81% 2050 | | | 54,930 | | | | 8,866 | |
| China (People’s Republic of), Series INBK, 3.53% 2051 | | | 48,570 | | | | 7,524 | |
| China Development Bank Corp., Series 1814, 4.15% 2025 | | | 20,900 | | | | 3,261 | |
| China Development Bank Corp., Series 1909, 3.50% 2026 | | | 10,400 | | | | 1,592 | |
| China Development Bank Corp., Series 1904, 3.68% 2026 | | | 11,700 | | | | 1,802 | |
| China Development Bank Corp., Series 2009, 3.39% 2027 | | | 11,130 | | | | 1,700 | |
| | | | | | | | 52,346 | |
| | | | | | | | | |
| British pounds 3.17% | | | | | | | | |
| American Honda Finance Corp. 0.75% 2026 | | GBP | 1,420 | | | | 1,538 | |
| Asian Development Bank 1.125% 2025 | | | 1,240 | | | | 1,456 | |
| France Télécom 5.375% 2050 | | | 300 | | | | 427 | |
| KfW 1.125% 2025 | | | 1,165 | | | | 1,367 | |
| Lloyds Banking Group PLC 7.625% 2025 | | | 655 | | | | 858 | |
| Quebec (Province of) 2.25% 2026 | | | 1,870 | | | | 2,239 | |
| United Kingdom 0.125% 2026 | | | 425 | | | | 486 | |
| United Kingdom 4.25% 2027 | | | 1,120 | | | | 1,519 | |
| United Kingdom 0.375% 2030 | | | 1,740 | | | | 1,840 | |
| United Kingdom 4.75% 2030 | | | 8,230 | | | | 12,063 | |
| United Kingdom 0.25% 2031 | | | 8,690 | | | | 8,870 | |
| United Kingdom 4.25% 2032 | | | 3,010 | | | | 4,309 | |
| United Kingdom 0.625% 2035 | | | 4,620 | | | | 4,425 | |
| United Kingdom 0.875% 2046 | | | 6,030 | | | | 5,093 | |
| United Kingdom 0.625% 2050 | | | 2,805 | | | | 2,085 | |
| United Kingdom 1.25% 2051 | | | 1,480 | | | | 1,315 | |
| United Kingdom 1.125% 2073 | | | 225 | | | | 176 | |
| | | | | | | | 50,066 | |
| | | | | | | | | |
| Canadian dollars 2.41% | | | | | | | | |
| Canada 1.00% 2022 | | CAD | 1,050 | | | | 814 | |
| Canada 0.75% 2024 | | | 14,570 | | | | 10,750 | |
| Canada 0.25% 2026 | | | 5,800 | | | | 4,070 | |
| Canada 2.25% 2029 | | | 27,100 | | | | 19,901 | |
| Canada 2.75% 2048 | | | 3,500 | | | | 2,521 | |
| | | | | | | | 38,056 | |
| | | | | | | | | |
| Mexican pesos 2.28% | | | | | | | | |
| Petróleos Mexicanos 7.19% 2024 | | MXN | 83,847 | | | | 3,829 | |
| United Mexican States 4.50% 20253 | | | 15,942 | | | | 805 | |
| United Mexican States, Series M, 5.75% 2026 | | | 74,700 | | | | 3,306 | |
| United Mexican States, Series M, 7.50% 2027 | | | 436,720 | | | | 20,311 | |
| United Mexican States, Series M20, 8.50% 2029 | | | 140,400 | | | | 6,783 | |
| United Mexican States, Series M30, 8.50% 2038 | | | 21,100 | | | | 996 | |
| | | | | | | | 36,030 | |
| | | | | | | | | |
| Danish kroner 2.12% | | | | | | | | |
| Nordea Kredit 0.50% 20404 | | DKK | 18,021 | | | | 2,079 | |
| Nykredit Realkredit AS, Series 01E, 0.50% 20404 | | | 137,570 | | | | 15,810 | |
| Nykredit Realkredit AS, Series 01E, 0.50% 20434 | | | 134,285 | | | | 15,302 | |
| Realkredit Danmark AS 1.00% 20534 | | | 2,757 | | | | 302 | |
| | | | | | | | 33,493 | |
| | | | | | | | | |
| Australian dollars 2.07% | | | | | | | | |
| Australia (Commonwealth of), Series 139, 3.25% 2025 | | AUD | 10,810 | | | | 7,488 | |
| Australia (Commonwealth of), Series 163, 1.00% 2031 | | | 31,664 | | | | 17,284 | |
| Australia (Commonwealth of), Series 166, 3.00% 2033 | | | 12,355 | | | | 7,968 | |
| | | | | | | | 32,740 | |
| American Funds Insurance Series | 185 |
Capital World Bond Fund (continued)
| Bonds, notes & other debt instruments (continued) | | Principal amount
(000) | | | Value
(000) | |
| Colombian pesos 1.00% | | | | | | | | |
| Colombia (Republic of), Series B, 5.75% 2027 | | COP | 17,890,000 | | | $ | 3,414 | |
| Colombia (Republic of), Series UVR, 2.25% 20293 | | | 36,689 | | | | 2,342 | |
| Colombia (Republic of), Series B, 7.00% 2031 | | | 36,645,300 | | | | 6,709 | |
| Colombia (Republic of), Series B, 7.25% 2050 | | | 21,884,200 | | | | 3,343 | |
| | | | | | | | 15,808 | |
| | | | | | | | | |
| Indonesian rupiah 0.68% | | | | | | | | |
| Indonesia (Republic of), Series 84, 7.25% 2026 | | IDR | 22,733,000 | | | | 1,574 | |
| Indonesia (Republic of), Series 56, 8.375% 2026 | | | 6,725,000 | | | | 488 | |
| Indonesia (Republic of), Series 59, 7.00% 2027 | | | 51,565,000 | | | | 3,557 | |
| Indonesia (Republic of), Series 78, 8.25% 2029 | | | 27,003,000 | | | | 1,930 | |
| Indonesia (Republic of), Series 82, 7.00% 2030 | | | 19,346,000 | | | | 1,289 | |
| Indonesia (Republic of), Series 68, 8.375% 2034 | | | 27,353,000 | | | | 1,956 | |
| | | | | | | | 10,794 | |
| | | | | | | | | |
| Malaysian ringgits 0.56% | | | | | | | | |
| Malaysia (Federation of), Series 0419, 3.828% 2034 | | MYR | 4,026 | | | | 847 | |
| Malaysia (Federation of), Series 0519, 3.757% 2040 | | | 40,283 | | | | 7,964 | |
| | | | | | | | 8,811 | |
| | | | | | | | | |
| Brazilian reais 0.54% | | | | | | | | |
| Brazil (Federative Republic of) 6.00% 20223 | | BRL | 4,464 | | | | 831 | |
| Brazil (Federative Republic of) 10.00% 2023 | | | 6,780 | | | | 1,273 | |
| Brazil (Federative Republic of) 0% 2024 | | | 8,440 | | | | 1,334 | |
| Brazil (Federative Republic of) 6.00% 20243 | | | 13,639 | | | | 2,558 | |
| Brazil (Federative Republic of) 10.00% 2025 | | | 14,300 | | | | 2,577 | |
| | | | | | | | 8,573 | |
| | | | | | | | | |
| Chilean pesos 0.48% | | | | | | | | |
| Chile (Republic of) 4.00% 2023 | | CLP | 2,300,000 | | | | 2,421 | |
| Chile (Republic of) 5.80% 2024 | | | 1,270,000 | | | | 1,342 | |
| Chile (Republic of) 1.50% 20263 | | | 762,209 | | | | 822 | |
| Chile (Republic of) 4.50% 2026 | | | 50,000 | | | | 51 | |
| Chile (Republic of) 5.00% 2028 | | | 955,000 | | | | 963 | |
| Chile (Republic of) 4.70% 2030 | | | 2,120,000 | | | | 2,068 | |
| | | | | | | | 7,667 | |
| | | | | | | | | |
| South Korean won 0.47% | | | | | | | | |
| South Korea (Republic of), Series 2503, 1.50% 2025 | | KRW | 5,183,670 | | | | 3,779 | |
| South Korea (Republic of), Series 2712, 2.375% 2027 | | | 5,158,930 | | | | 3,716 | |
| | | | | | | | 7,495 | |
| | | | | | | | | |
| Polish zloty 0.32% | | | | | | | | |
| Poland (Republic of), Series 0725, 3.25% 2025 | | PLN | 21,220 | | | | 4,213 | |
| Poland (Republic of), Series 1029, 2.75% 2029 | | | 4,900 | | | | 840 | |
| | | | | | | | 5,053 | |
| | | | | | | | | |
| Russian rubles 0.31% | | | | | | | | |
| Russian Federation 7.00% 2023 | | RUB | 430,300 | | | | 704 | |
| Russian Federation 6.90% 20295 | | | 403,750 | | | | 661 | |
| Russian Federation 7.65% 20305 | | | 712,330 | | | | 1,166 | |
| Russian Federation 5.90% 20315 | | | 79,600 | | | | 130 | |
| Russian Federation 6.90% 2031 | | | 212,995 | | | | 348 | |
| Russian Federation 8.50% 20315 | | | 695,165 | | | | 1,138 | |
| Russian Federation 7.70% 20335 | | | 295,840 | | | | 484 | |
| Russian Federation 7.25% 20345 | | | 121,920 | | | | 199 | |
| | | | | | | | 4,830 | |
| 186 | American Funds Insurance Series |
Capital World Bond Fund (continued)
| Bonds, notes & other debt instruments (continued) | | Principal amount
(000) | | | Value
(000) | |
| South African rand 0.19% | | | | | | | | |
| South Africa (Republic of), Series R-2030, 8.00% 2030 | | ZAR | 30,120 | | | $ | 1,609 | |
| South Africa (Republic of), Series R-2048, 8.75% 2048 | | | 30,850 | | | | 1,464 | |
| | | | | | | | 3,073 | |
| | | | | | | | | |
| Peruvian nuevos soles 0.09% | | | | | | | | |
| Peru (Republic of) 6.15% 2032 | | PEN | 5,980 | | | | 1,382 | |
| | | | | | | | | |
| Indian rupees 0.07% | | | | | | | | |
| India (Republic of) 5.15% 2025 | | INR | 96,010 | | | | 1,148 | |
| | | | | | | | | |
| Hungarian forints 0.07% | | | | | | | | |
| Hungary (Republic of), Series C, 1.00% 2025 | | HUF | 495,300 | | | | 1,032 | |
| | | | | | | | | |
| Romanian leu 0.06% | | | | | | | | |
| Romania 4.75% 2025 | | RON | 5,000 | | | | 962 | |
| | | | | | | | | |
| Ukrainian hryvnia 0.04% | | | | | | | | |
| Ukraine 16.06% 2022 | | UAH | 86,536 | | | | 634 | |
| | | | | | | | | |
| Norwegian kroner 0.04% | | | | | | | | |
| Norway (Kingdom of) 2.125% 2032 | | NOK | 6,615 | | | | 620 | |
| | | | | | | | | |
| U.S. dollars 50.21% | | | | | | | | |
| 7-Eleven, Inc. 0.95% 20262 | | USD | 520 | | | | 460 | |
| 7-Eleven, Inc. 1.30% 20282 | | | 2,180 | | | | 1,815 | |
| 7-Eleven, Inc. 1.80% 20312 | | | 2,015 | | | | 1,575 | |
| AbbVie, Inc. 2.90% 2022 | | | 1,170 | | | | 1,170 | |
| AbbVie, Inc. 3.20% 2022 | | | 200 | | | | 200 | |
| ACE INA Holdings, Inc. 2.875% 2022 | | | 195 | | | | 195 | |
| ACE INA Holdings, Inc. 3.35% 2026 | | | 195 | | | | 191 | |
| ACE INA Holdings, Inc. 4.35% 2045 | | | 425 | | | | 402 | |
| Advisor Group Holdings, LLC 6.25% 20282 | | | 365 | | | | 319 | |
| AerCap Ireland Capital, Ltd. / AerCap Global Aviation Trust 2.45% 2026 | | | 2,102 | | | | 1,832 | |
| Aeropuerto International de Tocume SA 5.125% 20612 | | | 660 | | | | 524 | |
| Aetna, Inc. 2.80% 2023 | | | 340 | | | | 336 | |
| AG Merger Sub II, Inc. 10.75% 20272 | | | 276 | | | | 273 | |
| Alabama Power Co. 3.00% 2052 | | | 980 | | | | 721 | |
| Albertsons Companies, Inc. 4.625% 20272 | | | 125 | | | | 112 | |
| Albertsons Companies, Inc. 3.50% 20292 | | | 140 | | | | 114 | |
| Alcoa Nederland Holding BV 4.125% 20292 | | | 75 | | | | 67 | |
| Allegheny Technologies, Inc. 4.875% 2029 | | | 60 | | | | 48 | |
| Allegheny Technologies, Inc. 5.125% 2031 | | | 45 | | | | 35 | |
| Alliant Holdings Intermediate, LLC 6.75% 20272 | | | 315 | | | | 280 | |
| Alliant Holdings Intermediate, LLC / Alliant Holdings 5.875% 20292 | | | 65 | | | | 54 | |
| Allied Universal Holdco, LLC 9.75% 20272 | | | 175 | | | | 149 | |
| Allied Universal Holdco, LLC 6.00% 20292 | | | 300 | | | | 219 | |
| Almonde, Inc., Term Loan, (3-month USD-LIBOR + 7.25%) 8.489% 20256,7 | | | 650 | | | | 563 | |
| Altria Group, Inc. 5.95% 2049 | | | 131 | | | | 115 | |
| Amazon.com, Inc. 1.50% 2030 | | | 2,040 | | | | 1,697 | |
| American Campus Communities, Inc. 3.75% 2023 | | | 1,810 | | | | 1,812 | |
| American Campus Communities, Inc. 4.125% 2024 | | | 1,195 | | | | 1,202 | |
| American Electric Power Company, Inc. 1.00% 2025 | | | 250 | | | | 225 | |
| American Express Co. 3.375% 2024 | | | 4,202 | | | | 4,176 | |
| AmeriGas Partners LP 5.875% 2026 | | | 15 | | | | 14 | |
| AmeriGas Partners LP 5.75% 2027 | | | 25 | | | | 23 | |
| American Funds Insurance Series | 187 |
Capital World Bond Fund (continued)
| Bonds, notes & other debt instruments (continued) | | Principal amount
(000) | | | Value
(000) | |
| U.S. dollars (continued) | | | | | | | | |
| Amgen, Inc. 2.20% 2027 | | USD | 445 | | | $ | 409 | |
| AmWINS Group, Inc. 4.875% 20292 | | | 30 | | | | 25 | |
| Anglo American Capital PLC 2.25% 20282 | | | 454 | | | | 392 | |
| Anglo American Capital PLC 3.95% 20502 | | | 521 | | | | 400 | |
| Angola (Republic of) 9.50% 2025 | | | 3,580 | | | | 3,295 | |
| Ardagh Group SA 6.50% Cash 20272,8 | | | 210 | | | | 156 | |
| Aretec Escrow Issuer, Inc. 7.50% 20292 | | | 225 | | | | 192 | |
| Argentine Republic 0.50% 2030 (0.75% on 7/9/2023)1 | | | 1,921 | | | | 456 | |
| Argentine Republic 1.125% 2035 (1.50% on 7/9/2022)1 | | | 3,025 | | | | 655 | |
| Arthur J. Gallagher & Co. 3.50% 2051 | | | 34 | | | | 26 | |
| Asbury Automotive Group, Inc. 4.625% 20292 | | | 25 | | | | 21 | |
| Asbury Automotive Group, Inc. 5.00% 20322 | | | 30 | | | | 25 | |
| Ascensus, Inc., Term Loan, (3-month USD-LIBOR + 6.50%) 7.50% 20296,7 | | | 120 | | | | 111 | |
| Ascent Resources - Utica, LLC 8.25% 20282 | | | 175 | | | | 167 | |
| Ascent Resources - Utica, LLC 5.875% 20292 | | | 55 | | | | 48 | |
| AssuredPartners, Inc. 7.00% 20252 | | | 155 | | | | 146 | |
| AssuredPartners, Inc. 5.625% 20292 | | | 205 | | | | 164 | |
| AstraZeneca PLC 3.50% 2023 | | | 2,700 | | | | 2,709 | |
| AT&T, Inc. 3.50% 2053 | | | 2,070 | | | | 1,573 | |
| Atkore, Inc. 4.25% 20312 | | | 25 | | | | 21 | |
| Atlantic Aviation FBO, Inc., Term Loan, (3-month USD-LIBOR + 3.00%) 4.06% 20286,7 | | | 150 | | | | 142 | |
| Avantor Funding, Inc. 4.625% 20282 | | | 65 | | | | 60 | |
| Avantor Funding, Inc. 3.875% 20292 | | | 90 | | | | 79 | |
| Bank of America Corp. 1.53% 2025 (USD-SOFR + 0.65% on 12/6/2024)1 | | | 6,260 | | | | 5,832 | |
| Bank of America Corp. 2.456% 2025 (3-month USD-LIBOR + 0.87% on 10/22/2024)1 | | | 847 | | | | 808 | |
| Bank of America Corp. 1.734% 2027 (USD-SOFR + 0.96% on 7/22/2026)1 | | | 3,745 | | | | 3,335 | |
| Bank of America Corp. 2.299% 2032 (USD-SOFR + 1.22% on 7/21/2031)1 | | | 4,780 | | | | 3,867 | |
| Bank of Nova Scotia 2.45% 2032 | | | 2,100 | | | | 1,747 | |
| Bausch Health Companies, Inc. 5.75% 20272 | | | 140 | | | | 116 | |
| Bayer AG 3.375% 20242 | | | 840 | | | | 821 | |
| Bayer US Finance II, LLC 4.25% 20252 | | | 203 | | | | 201 | |
| Bayerische Motoren Werke AG 3.90% 20252 | | | 900 | | | | 898 | |
| Bayerische Motoren Werke AG 4.15% 20302 | | | 900 | | | | 883 | |
| Beasley Mezzanine Holdings, LLC 8.625% 20262 | | | 30 | | | | 23 | |
| Belarus (Republic of) 6.875% 2023 | | | 4,955 | | | | 941 | |
| Belarus (Republic of) 7.625% 2027 | | | 2,100 | | | | 347 | |
| Berkshire Hathaway Energy Company 2.85% 2051 | | | 300 | | | | 213 | |
| Blue Racer Midstream, LLC and Blue Racer Finance Corp. 7.625% 20252 | | | 65 | | | | 62 | |
| BMC Software, Inc., Term Loan, (3-month USD-LIBOR + 5.50%) 6.128% 20266,7 | | | 25 | | | | 23 | |
| BNP Paribas 2.159% 2029 (USD-SOFR + 1.218% on 9/15/2028)1,2 | | | 700 | | | | 586 | |
| BNP Paribas 2.871% 2032 (USD-SOFR + 1.387% on 4/19/2031)1,2 | | | 1,275 | | | | 1,055 | |
| Boeing Company 5.15% 2030 | | | 4,000 | | | | 3,843 | |
| Bombardier, Inc. 7.125% 20262 | | | 85 | | | | 70 | |
| Bombardier, Inc. 6.00% 20282 | | | 90 | | | | 68 | |
| Bombardier, Inc. 7.45% 20342 | | | 125 | | | | 94 | |
| Bonanza Creek Energy, Inc. 5.00% 20262 | | | 30 | | | | 27 | |
| Booz Allen Hamilton, Inc. 3.875% 20282 | | | 63 | | | | 56 | |
| Booz Allen Hamilton, Inc. 4.00% 20292 | | | 27 | | | | 24 | |
| Boyd Gaming Corp. 4.75% 2027 | | | 120 | | | | 109 | |
| Boyne USA, Inc. 4.75% 20292 | | | 47 | | | | 41 | |
| Brandywine Operating Partnership LP 3.95% 2023 | | | 190 | | | | 190 | |
| Braskem Netherlands Finance BV 4.50% 20302 | | | 745 | | | | 637 | |
| British American Tobacco PLC 2.789% 2024 | | | 1,150 | | | | 1,114 | |
| British American Tobacco PLC 3.215% 2026 | | | 955 | | | | 893 | |
| British American Tobacco PLC 3.557% 2027 | | | 1,545 | | | | 1,415 | |
| British American Tobacco PLC 3.462% 2029 | | | 1,150 | | | | 987 | |
| British American Tobacco PLC 4.54% 2047 | | | 61 | | | | 45 | |
| British American Tobacco PLC 4.758% 2049 | | | 833 | | | | 630 | |
| Broadcom, Inc. 3.15% 2025 | | | 212 | | | | 204 | |
| Broadcom, Inc. 4.00% 20292 | | | 501 | | | | 465 | |
| Broadcom, Inc. 4.15% 2030 | | | 1,450 | | | | 1,330 | |
| Broadcom, Inc. 3.419% 20332 | | | 698 | | | | 578 | |
| 188 | American Funds Insurance Series |
Capital World Bond Fund (continued)
| Bonds, notes & other debt instruments (continued) | | Principal amount
(000) | | | Value
(000) | |
| U.S. dollars (continued) | | | | | | | | |
| Broadcom, Inc. 3.469% 20342 | | USD | 48 | | | $ | 39 | |
| Broadcom, Inc. 3.75% 20512 | | | 926 | | | | 688 | |
| BWX Technologies, Inc. 4.125% 20282 | | | 15 | | | | 13 | |
| BWX Technologies, Inc. 4.125% 20292 | | | 195 | | | | 171 | |
| Caesars Entertainment, Inc. 6.25% 20252 | | | 35 | | | | 34 | |
| Caesars Entertainment, Inc. 4.625% 20292 | | | 15 | | | | 12 | |
| California Resources Corp. 7.125% 20262 | | | 65 | | | | 64 | |
| Callon Petroleum Co. 7.50% 20302 | | | 30 | | | | 28 | |
| Canadian Pacific Railway, Ltd. 2.45% 2031 | | | 798 | | | | 684 | |
| Canadian Pacific Railway, Ltd. 3.10% 2051 | | | 1,378 | | | | 1,017 | |
| Can-Pack SA / Canpack US, LLC 3.875% 20292 | | | 90 | | | | 70 | |
| Carnival Corp. 6.00% 20292 | | | 100 | | | | 71 | |
| CCO Holdings, LLC and CCO Holdings Capital Corp. 3.75% 2028 | | | 2,650 | | | | 2,450 | |
| CCO Holdings, LLC and CCO Holdings Capital Corp. 4.50% 20302 | | | 340 | | | | 283 | |
| CCO Holdings, LLC and CCO Holdings Capital Corp. 4.75% 20302 | | | 135 | | | | 116 | |
| CCO Holdings, LLC and CCO Holdings Capital Corp. 4.25% 20312 | | | 155 | | | | 127 | |
| CCO Holdings, LLC and CCO Holdings Capital Corp. 4.50% 20332 | | | 162 | | | | 128 | |
| CCO Holdings, LLC and CCO Holdings Capital Corp. 4.25% 20342 | | | 90 | | | | 70 | |
| CDI Escrow Issuer, Inc. 5.75% 20302 | | | 70 | | | | 64 | |
| CDK Global, Inc. 7.25% 20292 | | | 75 | | | | 72 | |
| CEC Entertainment, Inc. 6.75% 20262 | | | 50 | | | | 44 | |
| Cedar Fair LP / Canadas Wonderland Co. / Magnum Management Corp. / Millennium Operations, LLC 5.50% 20252 | | | 75 | | | | 73 | |
| Centene Corp. 2.45% 2028 | | | 40 | | | | 33 | |
| Centene Corp. 4.625% 2029 | | | 325 | | | | 304 | |
| Centene Corp. 2.50% 2031 | | | 155 | | | | 124 | |
| Centerfield Media Parent, Inc. 6.625% 20262 | | | 113 | | | | 91 | |
| Central Garden & Pet Co. 4.125% 2030 | | | 74 | | | | 61 | |
| Central Garden & Pet Co. 4.125% 20312 | | | 110 | | | | 88 | |
| Charles River Laboratories International, Inc. 4.25% 20282 | | | 55 | | | | 49 | |
| Charles River Laboratories International, Inc. 4.00% 20312 | | | 90 | | | | 77 | |
| Cheniere Energy Partners LP 4.50% 2029 | | | 160 | | | | 143 | |
| Cheniere Energy Partners LP 4.00% 2031 | | | 75 | | | | 64 | |
| Cheniere Energy Partners LP 3.25% 20322 | | | 56 | | | | 44 | |
| Cheniere Energy, Inc. 4.625% 2028 | | | 40 | | | | 36 | |
| Chesapeake Energy Corp. 4.875% 20225 | | | 915 | | | | 18 | |
| Chesapeake Energy Corp. 5.50% 20262 | | | 40 | | | | 38 | |
| Chesapeake Energy Corp. 5.875% 20292 | | | 55 | | | | 52 | |
| Chesapeake Energy Corp. 6.75% 20292 | | | 30 | | | | 29 | |
| China Construction Bank Corp. (Hong Kong Branch) 1.00% 2023 | | | 6,000 | | | | 5,858 | |
| Cigna Corp. 2.375% 2031 | | | 375 | | | | 317 | |
| Citigroup, Inc. 0.981% 2025 (USD-SOFR + 0.669% on 5/1/2024)1 | | | 808 | | | | 758 | |
| Citigroup, Inc. 2.014% 2026 (USD-SOFR + 0.694% on 1/25/2025)1 | | | 421 | | | | 395 | |
| Citigroup, Inc. 3.106% 2026 (USD-SOFR + 2.842% on 3/8/2026)1 | | | 4,500 | | | | 4,325 | |
| Clarivate Science Holdings Corp. 3.875% 20282 | | | 65 | | | | 54 | |
| CMS Energy Corp. 3.875% 2024 | | | 100 | | | | 100 | |
| CMS Energy Corp. 3.00% 2026 | | | 1,200 | | | | 1,151 | |
| CNX Resources Corp. 7.25% 20272 | | | 175 | | | | 172 | |
| CNX Resources Corp. 6.00% 20292 | | | 115 | | | | 108 | |
| Coinbase Global, Inc. 3.375% 20282 | | | 100 | | | | 63 | |
| Coinbase Global, Inc. 3.625% 20312 | | | 85 | | | | 48 | |
| Colombia (Republic of) 3.875% 2027 | | | 350 | | | | 310 | |
| Commonwealth Bank of Australia 2.688% 20312 | | | 4,650 | | | | 3,789 | |
| Compass Diversified Holdings 5.25% 20292 | | | 232 | | | | 192 | |
| Compass Diversified Holdings 5.00% 20322 | | | 65 | | | | 50 | |
| Comstock Resources, Inc. 6.75% 20292 | | | 110 | | | | 99 | |
| Comstock Resources, Inc. 5.875% 20302 | | | 65 | | | | 56 | |
| Constellation Oil Services Holding SA 4.00% PIK or 3.00% Cash 20268 | | | 1,084 | | | | 905 | |
| Constellium SE 3.75% 20292 | | | 125 | | | | 99 | |
| Consumers Energy Co. 3.375% 2023 | | | 345 | | | | 346 | |
| Corebridge Financial, Inc. 3.90% 20322 | | | 748 | | | | 672 | |
| CoreLogic, Inc. 4.50% 20282 | | | 239 | | | | 184 | |
| American Funds Insurance Series | 189 |
Capital World Bond Fund (continued)
| Bonds, notes & other debt instruments (continued) | | Principal amount
(000) | | | Value
(000) | |
| U.S. dollars (continued) | | | | | | | | |
| CoreLogic, Inc., Term Loan, (3-month USD-LIBOR + 6.50%) 8.188% 20296,7 | | USD | 65 | | | $ | 48 | |
| Corporate Office Properties LP 2.75% 2031 | | | 1,212 | | | | 981 | |
| Covanta Holding Corp. 5.00% 2030 | | | 10 | | | | 8 | |
| Covert Mergeco, Inc. 4.875% 20292 | | | 25 | | | | 20 | |
| CQP Holdco LP / BIP-V Chinook Holdco, LLC 5.50% 20312 | | | 400 | | | | 342 | |
| Crédit Agricole SA 4.375% 20252 | | | 1,100 | | | | 1,083 | |
| Crédit Agricole SA 1.907% 2026 (USD-SOFR + 1.676% on 6/16/2025)1,2 | | | 2,675 | | | | 2,464 | |
| Credit Suisse Group AG 2.95% 2025 | | | 875 | | | | 839 | |
| Credit Suisse Group AG 3.091% 2032 (USD-SOFR + 1.73% on 5/14/2031)1,2 | | | 1,000 | | | | 797 | |
| Crestwood Midstream Partners LP 6.00% 20292 | | | 85 | | | | 74 | |
| Crown Castle International Corp. 2.50% 2031 | | | 767 | | | | 628 | |
| CSX Corp. 3.80% 2050 | | | 75 | | | | 63 | |
| CVR Partners LP 6.125% 20282 | | | 100 | | | | 90 | |
| Daimler Trucks Finance North America, LLC 3.65% 20272 | | | 725 | | | | 695 | |
| Dana, Inc. 4.25% 2030 | | | 20 | | | | 16 | |
| Danske Bank AS 3.875% 20232 | | | 1,675 | | | | 1,669 | |
| Darling Ingredients, Inc. 6.00% 20302 | | | 80 | | | | 80 | |
| Dave & Buster’s, Inc. 7.625% 20252 | | | 35 | | | | 35 | |
| DaVita, Inc. 4.625% 20302 | | | 65 | | | | 51 | |
| Deluxe Corp. 8.00% 20292 | | | 20 | | | | 16 | |
| Deutsche Bank AG 2.129% 2026 (USD-SOFR + 1.87% on 11/24/2025)1 | | | 850 | | | | 756 | |
| Deutsche Telekom International Finance BV 9.25% 2032 | | | 930 | | | | 1,237 | |
| Development Bank of Mongolia, LLC 7.25% 2023 | | | 1,980 | | | | 1,916 | |
| Diamond Foreign Asset Co. / Diamond Finance, LLC 9.00% Cash 20272,7,8 | | | 25 | | | | 25 | |
| Diamond Foreign Asset Co. / Diamond Finance, LLC 9.00% Cash 20277,8 | | | 22 | | | | 22 | |
| Diamond Sports Group, LLC 6.625% 20272 | | | 310 | | | | 39 | |
| Diebold Nixdorf AG, Term Loan B, (3-month USD-LIBOR + 2.75%) 4.00% 20236,7 | | | 106 | | | | 90 | |
| Diebold Nixdorf, Inc. 9.375% 20252 | | | 300 | | | | 210 | |
| Digital Currency Group, Inc., Term Loan, (3-month USD-LIBOR + 7.00%) 8.00% 20266,7,9,10 | | | 19 | | | | 17 | |
| Digital Currency Group, Inc., Term Loan, 8.75% 20266,9,10 | | | 26 | | | | 22 | |
| DIRECTV Financing, LLC, Term Loan, (3-month USD-LIBOR + 5.00%) 6.666% 20276,7 | | | 107 | | | | 99 | |
| DIRECTV Holdings, LLC and DIRECTV Financing Co., Inc. 5.875% 20272 | | | 165 | | | | 141 | |
| Discovery Communications, Inc. 3.625% 2030 | | | 468 | | | | 417 | |
| DISH DBS Corp. 5.25% 20262 | | | 15 | | | | 12 | |
| Dominican Republic 5.50% 20252 | | | 1,375 | | | | 1,368 | |
| Dominican Republic 8.625% 20272 | | | 225 | | | | 234 | |
| Dominican Republic 5.50% 20292 | | | 350 | | | | 306 | |
| Dominican Republic 6.40% 20492 | | | 813 | | | | 609 | |
| Duke Energy Corp. 3.75% 2024 | | | 550 | | | | 550 | |
| Duke Energy Progress, LLC 2.00% 2031 | | | 2,360 | | | | 1,957 | |
| Dun & Bradstreet Corp. 5.00% 20292 | | | 42 | | | | 36 | |
| Edison International 5.75% 2027 | | | 370 | | | | 376 | |
| Edison International 4.125% 2028 | | | 2,390 | | | | 2,231 | |
| Edison International 5.00% junior subordinated perpetual bonds (5-year UST Yield Curve Rate T Note Constant Maturity + 3.901% on 3/15/2027)1 | | | 100 | | | | 80 | |
| Electricité de France SA 4.875% 20382 | | | 795 | | | | 705 | |
| Empresas Publicas de Medellin ESP 4.25% 20292 | | | 1,030 | | | | 806 | |
| Enbridge, Inc. 4.00% 2023 | | | 600 | | | | 603 | |
| Endo Luxembourg Finance Co. I SARL / Endo U.S., Inc. 6.125% 20292 | | | 205 | | | | 155 | |
| Enel Finance International SA 1.375% 20262 | | | 1,248 | | | | 1,097 | |
| Enel Finance International SA 1.875% 20282 | | | 1,227 | | | | 1,030 | |
| Energy Transfer Operating LP 5.00% 2050 | | | 2,018 | | | | 1,720 | |
| Entegris Escrow Corp. 4.75% 20292 | | | 45 | | | | 42 | |
| Entergy Corp. 0.90% 2025 | | | 750 | | | | 676 | |
| EQM Midstream Partners, LP 6.50% 20272 | | | 170 | | | | 158 | |
| EQM Midstream Partners, LP 7.50% 20272 | | | 26 | | | | 25 | |
| EQM Midstream Partners, LP 7.50% 20302 | | | 50 | | | | 48 | |
| EQM Midstream Partners, LP 6.50% 2048 | | | 40 | | | | 31 | |
| EQT Corp. 7.50% 20301 | | | 40 | | | | 43 | |
| Equinix, Inc. 1.80% 2027 | | | 1,145 | | | | 995 | |
| Equinix, Inc. 2.15% 2030 | | | 9,390 | | | | 7,605 | |
| 190 | American Funds Insurance Series |
Capital World Bond Fund (continued)
| Bonds, notes & other debt instruments (continued) | | Principal amount
(000) | | | Value
(000) | |
| U.S. dollars (continued) | | | | | | | | |
| Ethiopia (Federal Democratic Republic of) 6.625% 2024 | | USD | 5,750 | | | $ | 3,291 | |
| Export-Import Bank of India 3.25% 2030 | | | 3,489 | | | | 3,038 | |
| Fair Isaac Corp. 4.00% 20282 | | | 140 | | | | 124 | |
| Fannie Mae, Series 2012-M17, Class A2, Multi Family, 2.184% 20224 | | | 523 | | | | 522 | |
| Fannie Mae Pool #MA2754 3.00% 20264 | | | 75 | | | | 74 | |
| Fannie Mae Pool #AP7888 3.50% 20424 | | | 367 | | | | 360 | |
| Fannie Mae Pool #AQ0770 3.50% 20424 | | | 136 | | | | 133 | |
| Fannie Mae Pool #AO4151 3.50% 20424 | | | 120 | | | | 118 | |
| Fertitta Entertainment, Inc. 4.625% 20292 | | | 25 | | | | 21 | |
| Fertitta Entertainment, Inc. 6.75% 20302 | | | 25 | | | | 19 | |
| First Quantum Minerals, Ltd. 6.875% 20262 | | | 325 | | | | 300 | |
| First Quantum Minerals, Ltd. 6.875% 20272 | | | 240 | | | | 215 | |
| First Student Bidco, Inc. / First Transit Parent, Inc. 4.00% 20292 | | | 85 | | | | 68 | |
| FirstEnergy Corp., Series B, 4.40% 20271 | | | 1,800 | | | | 1,701 | |
| FirstEnergy Transmission, LLC 2.866% 20282 | | | 2,325 | | | | 1,969 | |
| Florida Power & Light Company 2.875% 2051 | | | 1,465 | | | | 1,093 | |
| FMG Resources 4.375% 20312 | | | 175 | | | | 143 | |
| Ford Motor Co. 3.25% 2032 | | | 20 | | | | 15 | |
| Ford Motor Credit Company, LLC 3.81% 2024 | | | 290 | | | | 282 | |
| Ford Motor Credit Company, LLC 2.90% 2028 | | | 200 | | | | 161 | |
| Ford Motor Credit Company, LLC 4.00% 2030 | | | 125 | | | | 102 | |
| Freddie Mac Pool #ZS8588 3.00% 20304 | | | 53 | | | | 53 | |
| Fresnillo PLC 4.25% 20502 | | | 973 | | | | 716 | |
| Front Range BidCo, Inc. 6.125% 20282 | | | 160 | | | | 116 | |
| Frontier Communications Corp. 5.875% 20272 | | | 100 | | | | 90 | |
| Frontier Communications Corp. 5.00% 20282 | | | 65 | | | | 55 | |
| Frontier Communications Holdings, LLC 5.875% 2029 | | | 250 | | | | 193 | |
| FS Energy and Power Fund 7.50% 20232 | | | 170 | | | | 171 | |
| FXI Holdings, Inc. 7.875% 20242 | | | 140 | | | | 122 | |
| FXI Holdings, Inc. 12.25% 20262 | | | 497 | | | | 443 | |
| General Motors Financial Co. 1.05% 2024 | | | 725 | | | | 688 | |
| Genesis Energy, LP 8.00% 2027 | | | 150 | | | | 133 | |
| GeoPark, Ltd. 6.50% 2024 | | | 533 | | | | 541 | |
| Georgia (Republic of) 2.75% 20262 | | | 400 | | | | 332 | |
| Global Payments, Inc. 2.90% 2030 | | | 395 | | | | 334 | |
| Gol Finance SA 8.00% 20262 | | | 70 | | | | 47 | |
| Goldman Sachs Group, Inc. 2.905% 2023 (3-month USD-LIBOR + 0.99% on 7/24/2022)1 | | | 1,200 | | | | 1,200 | |
| Goldman Sachs Group, Inc. 1.542% 2027 (USD-SOFR + 0.818% on 9/10/2026)1 | | | 1,080 | | | | 949 | |
| Goldman Sachs Group, Inc. 2.383% 2032 (USD-SOFR + 1.248% on 7/21/2031)1 | | | 726 | | | | 588 | |
| Goldman Sachs Group, Inc. 2.615% 2032 (USD-SOFR + 1.281% on 4/22/2031)1 | | | 2,510 | | | | 2,086 | |
| Government National Mortgage Assn. 3.50% 20524,11 | | | 7,440 | | | | 7,221 | |
| GPC Merger Sub, Inc. 7.125% 20282 | | | 55 | | | | 44 | |
| Gray Escrow II, Inc. 5.375% 20312 | | | 30 | | | | 24 | |
| Group 1 Automotive, Inc. 4.00% 20282 | | | 145 | | | | 121 | |
| Groupe BPCE SA 5.15% 20242 | | | 1,800 | | | | 1,801 | |
| Grupo Energia Bogota SA ESP 4.875% 20302 | | | 660 | | | | 579 | |
| Hanesbrands, Inc. 4.875% 20262 | | | 100 | | | | 93 | |
| Harsco Corp. 5.75% 20272 | | | 200 | | | | 160 | |
| Harvest Midstream I, LP 7.50% 20282 | | | 25 | | | | 24 | |
| HCA, Inc. 5.625% 2028 | | | 120 | | | | 118 | |
| Hess Midstream Operations LP 5.50% 20302 | | | 30 | | | | 27 | |
| Hexion, Inc., Term Loan, (3-month USD CME Term SOFR + 4.50%) 5.924% 20296,7 | | | 40 | | | | 36 | |
| Hightower Holding, LLC 6.75% 20292 | | | 235 | | | | 177 | |
| Hilcorp Energy I, LP 6.00% 20302 | | | 16 | | | | 14 | |
| Hilcorp Energy I, LP 6.00% 20312 | | | 125 | | | | 108 | |
| Hilcorp Energy I, LP 6.25% 20322 | | | 15 | | | | 13 | |
| Hilton Worldwide Holdings, Inc. 4.875% 2030 | | | 25 | | | | 23 | |
| Hilton Worldwide Holdings, Inc. 4.00% 20312 | | | 55 | | | | 46 | |
| Holly Energy Partners LP / Holly Energy Finance Corp. 6.375% 20272 | | | 10 | | | | 9 | |
| Holly Energy Partners LP / Holly Energy Finance Corp. 5.00% 20282 | | | 12 | | | | 10 | |
| Honduras (Republic of) 6.25% 2027 | | | 2,083 | | | | 1,638 | |
| American Funds Insurance Series | 191 |
Capital World Bond Fund (continued)
| Bonds, notes & other debt instruments (continued) | | Principal amount
(000) | | | Value
(000) | |
| U.S. dollars (continued) | | | | | | | | |
| Honduras (Republic of) 5.625% 2030 | | USD | 958 | | | $ | 650 | |
| Howard Hughes Corp. 5.375% 20282 | | | 315 | | | | 264 | |
| Howard Hughes Corp. 4.125% 20292 | | | 195 | | | | 151 | |
| Howard Hughes Corp. 4.375% 20312 | | | 120 | | | | 89 | |
| Howard Midstream Energy Partners, LLC 6.75% 20272 | | | 60 | | | | 52 | |
| HSBC Holdings PLC 3.033% 2023 (3-month USD-LIBOR + 0.923% on 11/12/2022)1 | | | 430 | | | | 428 | |
| HSBC Holdings PLC 2.633% 2025 (3-month USD-LIBOR + 1.14% on 11/7/2024)1 | | | 305 | | | | 291 | |
| HSBC Holdings PLC 4.292% 2026 (3-month USD-LIBOR + 1.348% on 9/12/2025)1 | | | 4,172 | | | | 4,082 | |
| HSBC Holdings PLC 2.357% 2031 (USD-SOFR + 1.947% on 8/18/2030)1 | | | 1,032 | | | | 837 | |
| Huarong Finance 2019 Co., Ltd. (3-month USD-LIBOR + 1.125%) 2.631% 20237 | | | 3,326 | | | | 3,251 | |
| Huarong Finance 2019 Co., Ltd. (3-month USD-LIBOR + 1.25%) 2.756% 20257 | | | 363 | | | | 341 | |
| Huarong Finance II Co., Ltd. 5.00% 2025 | | | 1,007 | | | | 953 | |
| Huarong Finance II Co., Ltd. 5.50% 2025 | | | 880 | | | | 855 | |
| HUB International, Ltd. 7.00% 20262 | | | 230 | | | | 217 | |
| Hungary (Republic of) 2.125% 20312 | | | 2,910 | | | | 2,256 | |
| Hungary (Republic of) 3.125% 20512 | | | 1,255 | | | | 832 | |
| Hyundai Capital America 3.25% 20222 | | | 250 | | | | 250 | |
| Hyundai Capital America 0.875% 20242 | | | 1,200 | | | | 1,123 | |
| Hyundai Capital America 1.50% 20262 | | | 2,375 | | | | 2,105 | |
| Hyundai Capital America 1.65% 20262 | | | 1,800 | | | | 1,589 | |
| Hyundai Capital America 2.00% 20282 | | | 600 | | | | 505 | |
| Hyundai Capital Services, Inc. 3.75% 20232 | | | 2,450 | | | | 2,448 | |
| Imperial Tobacco Finance PLC 3.50% 20232 | | | 2,000 | | | | 1,989 | |
| Ingles Markets, Inc. 4.00% 20312 | | | 140 | | | | 121 | |
| Intercontinental Exchange, Inc. 4.00% 2027 | | | 1,810 | | | | 1,783 | |
| Intesa Sanpaolo SpA 5.017% 20242 | | | 3,270 | | | | 3,123 | |
| Iraq (Republic of) 6.752% 20232 | | | 545 | | | | 533 | |
| Iron Mountain Information Management Services, Inc. 5.00% 20322 | | | 55 | | | | 45 | |
| Iron Mountain, Inc. 5.25% 20302 | | | 155 | | | | 135 | |
| Israel (State of) 3.375% 2050 | | | 1,470 | | | | 1,192 | |
| Israel (State of) 3.875% 2050 | | | 795 | | | | 701 | |
| Jacobs Entertainment, Inc. 6.75% 20292 | | | 25 | | | | 21 | |
| JPMorgan Chase & Co. 1.045% 2026 (USD-SOFR + 0.80% on 11/19/2025)1 | | | 6,710 | | | | 5,975 | |
| JPMorgan Chase & Co. 2.963% 2033 (USD-SOFR + 1.26% on 1/25/2032)1 | | | 125 | | | | 107 | |
| Kantar Group, LLC, Term Loan B2, (3-month USD-LIBOR + 4.50%) 6.75% 20266,7 | | | 64 | | | | 60 | |
| KB Home 6.875% 2027 | | | 50 | | | | 48 | |
| Keb Hana Bank 3.25% 20272 | | | 1,370 | | | | 1,318 | |
| Kennedy-Wilson Holdings, Inc. 4.75% 2029 | | | 110 | | | | 89 | |
| Kennedy-Wilson Holdings, Inc. 4.75% 2030 | | | 85 | | | | 67 | |
| Kennedy-Wilson Holdings, Inc. 5.00% 2031 | | | 10 | | | | 8 | |
| Kimberly-Clark Corp. 3.10% 2030 | | | 110 | | | | 103 | |
| Kinder Morgan, Inc. 3.60% 2051 | | | 1,500 | | | | 1,108 | |
| Kinetik Holdings LP 5.875% 20302 | | | 60 | | | | 57 | |
| Kronos Acquisition Holdings, Inc. 5.00% 20262 | | | 85 | | | | 73 | |
| Kronos Acquisition Holdings, Inc. 7.00% 20272 | | | 140 | | | | 105 | |
| Labl Escrow Issuer, LLC 10.50% 20272 | | | 45 | | | | 39 | |
| Labl, Inc. 8.25% 20292 | | | 170 | | | | 129 | |
| Lamb Weston Holdings, Inc. 4.875% 20282 | | | 65 | | | | 61 | |
| Lamb Weston Holdings, Inc. 4.125% 20302 | | | 110 | | | | 96 | |
| Lamb Weston Holdings, Inc. 4.375% 20322 | | | 15 | | | | 13 | |
| Las Vegas Sands Corp. 3.20% 2024 | | | 25 | | | | 24 | |
| LCM Investments Holdings II, LLC 4.875% 20292 | | | 39 | | | | 30 | |
| Ligado Networks, LLC 15.50% PIK 20232,8 | | | 245 | | | | 134 | |
| Lima Metro Line 2 Finance, Ltd. 5.875% 2034 | | | 472 | | | | 467 | |
| Lima Metro Line 2 Finance, Ltd. 5.875% 20342 | | | 289 | | | | 285 | |
| Limited Brands, Inc. 6.625% 20302 | | | 70 | | | | 61 | |
| Limited Brands, Inc. 6.875% 2035 | | | 40 | | | | 33 | |
| Lindblad Expeditions, LLC 6.75% 20272 | | | 5 | | | | 4 | |
| Lloyds Banking Group PLC 1.627% 2027 (1-year UST Yield Curve Rate T Note Constant Maturity + 0.85% on 5/11/2026)1 | | | 7,000 | | | | 6,230 | |
| LPL Holdings, Inc. 4.625% 20272 | | | 220 | | | | 206 | |
| LPL Holdings, Inc. 4.375% 20312 | | | 85 | | | | 73 | |
| 192 | American Funds Insurance Series |
Capital World Bond Fund (continued)
| Bonds, notes & other debt instruments (continued) | | Principal amount
(000) | | | Value
(000) | |
| U.S. dollars (continued) | | | | | | | | |
| LSB Industries, Inc. 6.25% 20282 | | USD | 95 | | | $ | 84 | |
| LSC Communications, Inc. 8.75% 20232,5,9,10 | | | 430 | | | | 4 | |
| LSF9 Atlantis Holdings, LLC / Victra Finance Corp. 7.75% 20262 | | | 60 | | | | 51 | |
| Magallanes, Inc. 4.279% 20322 | | | 917 | | | | 820 | |
| Magallanes, Inc. 5.05% 20422 | | | 1,928 | | | | 1,643 | |
| Mallinckrodt PLC 10.00% 20252 | | | 720 | | | | 695 | |
| Masco Corp. 1.50% 2028 | | | 791 | | | | 664 | |
| Mastercard, Inc. 2.00% 2031 | | | 600 | | | | 506 | |
| Meituan Dianping 2.125% 2025 | | | 1,730 | | | | 1,560 | |
| Meituan Dianping 3.05% 20302 | | | 3,095 | | | | 2,306 | |
| Mercer International, Inc. 5.125% 2029 | | | 105 | | | | 90 | |
| Methanex Corp. 5.125% 2027 | | | 55 | | | | 49 | |
| Mexico City Airport Trust 5.50% 2047 | | | 432 | | | | 298 | |
| Midas OpCo Holdings, LLC 5.625% 20292 | | | 120 | | | | 97 | |
| Mineral Resources, Ltd. 8.00% 20272 | | | 40 | | | | 39 | |
| Mineral Resources, Ltd. 8.50% 20302 | | | 25 | | | | 25 | |
| MISC Capital Two (Labuan), Ltd. 3.75% 20272 | | | 3,236 | | | | 3,043 | |
| Mohegan Gaming & Entertainment 8.00% 20262 | | | 135 | | | | 115 | |
| Molina Healthcare, Inc. 3.875% 20302 | | | 75 | | | | 64 | |
| MoneyGram International, Inc. 5.375% 20262 | | | 50 | | | | 48 | |
| Morgan Stanley 1.593% 2027 (USD-SOFR + 0.879% on 5/4/2026)1 | | | 2,164 | | | | 1,925 | |
| Morgan Stanley 1.928% 2032 (USD-SOFR + 1.02% on 4/28/2031)1 | | | 1,396 | | | | 1,108 | |
| Mozart Debt Merger Sub, Inc. 5.25% 20292 | | | 155 | | | | 128 | |
| MPLX LP 2.65% 2030 | | | 837 | | | | 699 | |
| MPLX LP 5.50% 2049 | | | 1,900 | | | | 1,767 | |
| MSCI, Inc. 3.625% 20312 | | | 150 | | | | 124 | |
| MSCI, Inc. 3.875% 20312 | | | 215 | | | | 184 | |
| Murphy Oil USA, Inc. 4.75% 2029 | | | 48 | | | | 43 | |
| Nabors Industries, Inc. 7.375% 20272 | | | 55 | | | | 52 | |
| National Financial Partners Corp. 6.875% 20282 | | | 145 | | | | 120 | |
| Nationstar Mortgage Holdings, Inc. 5.125% 20302 | | | 135 | | | | 101 | |
| Navient Corp. 5.00% 2027 | | | 45 | | | | 37 | |
| Navient Corp. 4.875% 2028 | | | 145 | | | | 114 | |
| NCL Corp., Ltd. 5.875% 20272 | | | 80 | | | | 69 | |
| NCR Corp. 5.00% 20282 | | | 50 | | | | 42 | |
| NCR Corp. 5.125% 20292 | | | 175 | | | | 148 | |
| Neiman Marcus Group, LLC 7.125% 20262 | | | 190 | | | | 176 | |
| Nestlé Holdings, Inc. 1.50% 20282 | | | 4,330 | | | | 3,797 | |
| Netflix, Inc. 4.875% 2028 | | | 45 | | | | 42 | |
| Netflix, Inc. 4.875% 20302 | | | 225 | | | | 206 | |
| New Fortress Energy, Inc. 6.75% 20252 | | | 50 | | | | 47 | |
| New Fortress Energy, Inc. 6.50% 20262 | | | 460 | | | | 417 | |
| New York Life Global Funding 1.20% 20302 | | | 2,725 | | | | 2,151 | |
| Newcrest Finance Pty, Ltd. 3.25% 20302 | | | 909 | | | | 804 | |
| Newell Brands, Inc. 5.625% 20361 | | | 80 | | | | 69 | |
| Newell Rubbermaid, Inc. 4.70% 2026 | | | 80 | | | | 76 | |
| News Corp. 5.125% 20322 | | | 25 | | | | 22 | |
| Nexstar Broadcasting, Inc. 4.75% 20282 | | | 95 | | | | 82 | |
| Nexstar Escrow Corp. 5.625% 20272 | | | 115 | | | | 105 | |
| NGL Energy Operating, LLC 7.50% 20262 | | | 200 | | | | 181 | |
| NGL Energy Partners LP 7.50% 2023 | | | 200 | | | | 181 | |
| Niagara Mohawk Power Corp. 3.508% 20242 | | | 180 | | | | 177 | |
| Nielsen Finance, LLC and Nielsen Finance Co. 5.625% 20282 | | | 180 | | | | 168 | |
| Nielsen Finance, LLC and Nielsen Finance Co. 4.75% 20312 | | | 50 | | | | 45 | |
| Northern Oil and Gas, Inc. 8.125% 20282 | | | 190 | | | | 179 | |
| NorthRiver Midstream Finance LP 5.625% 20262 | | | 105 | | | | 95 | |
| Nova Chemicals Corp. 5.25% 20272 | | | 20 | | | | 17 | |
| Novelis Corp. 3.25% 20262 | | | 15 | | | | 13 | |
| Novelis Corp. 4.75% 20302 | | | 115 | | | | 96 | |
| Novelis Corp. 3.875% 20312 | | | 20 | | | | 15 | |
| NuStar Logistics, LP 5.625% 2027 | | | 80 | | | | 72 | |
| Oasis Midstream Partners LP / OMP Finance Corp. 8.00% 20292 | | | 100 | | | | 93 | |
| American Funds Insurance Series | 193 |
Capital World Bond Fund (continued)
| Bonds, notes & other debt instruments (continued) | | Principal amount
(000) | | | Value
(000) | |
| U.S. dollars (continued) | | | | | | | | |
| Oasis Petroleum, Inc. 6.375% 20262 | | USD | 35 | | | $ | 32 | |
| Occidental Petroleum Corp. 5.875% 2025 | | | 200 | | | | 200 | |
| Occidental Petroleum Corp. 6.375% 2028 | | | 194 | | | | 197 | |
| Occidental Petroleum Corp. 6.125% 2031 | | | 35 | | | | 36 | |
| State of Ohio, Turnpike and Infrastructure Commission, Turnpike Rev. Ref. Bonds (Infrastructure Projects), Series 2020-A, 3.216% 2048 | | | 1,410 | | | | 1,103 | |
| Oleoducto Central SA 4.00% 20272 | | | 2,535 | | | | 2,119 | |
| Oleoducto Central SA 4.00% 2027 | | | 630 | | | | 527 | |
| ONEOK, Inc. 5.20% 2048 | | | 858 | | | | 763 | |
| Open Text Corp. 3.875% 20282 | | | 25 | | | | 22 | |
| Option Care Health, Inc. 4.375% 20292 | | | 25 | | | | 21 | |
| Oracle Corp. 2.65% 2026 | | | 2,327 | | | | 2,149 | |
| Oracle Corp. 3.25% 2027 | | | 1,880 | | | | 1,736 | |
| Oracle Corp. 3.60% 2050 | | | 980 | | | | 683 | |
| Oracle Corp. 3.95% 2051 | | | 22 | | | | 16 | |
| Orange SA 9.00% 20311 | | | 2,434 | | | | 3,144 | |
| Owens & Minor, Inc. 6.625% 20302 | | | 20 | | | | 18 | |
| Oxford Finance, LLC / Oxford Finance Co-Issuer II, Inc. 6.375% 20272 | | | 30 | | | | 29 | |
| Pacific Gas and Electric Co. 2.10% 2027 | | | 9,935 | | | | 8,337 | |
| Pacific Gas and Electric Co. 4.65% 2028 | | | 542 | | | | 503 | |
| Pacific Gas and Electric Co. 3.30% 2040 | | | 6,850 | | | | 4,733 | |
| Pacific Gas and Electric Co. 3.50% 2050 | | | 931 | | | | 624 | |
| Pakistan (Islamic Republic of) 5.625% 2022 | | | 6,900 | | | | 6,486 | |
| Panama (Republic of) 3.75% 20262 | | | 465 | | | | 452 | |
| Panther BF Aggregator 2, LP 6.25% 20262 | | | 44 | | | | 42 | |
| Panther BF Aggregator 2, LP 8.50% 20272 | | | 85 | | | | 82 | |
| Park Intermediate Holdings, LLC 4.875% 20292 | | | 65 | | | | 56 | |
| Parkland Corp. 4.625% 20302 | | | 40 | | | | 33 | |
| Party City Holdings, Inc. 8.75% 20262 | | | 5 | | | | 3 | |
| Peru (Republic of) 2.392% 2026 | | | 500 | | | | 465 | |
| Petróleos Mexicanos 4.625% 2023 | | | 1,200 | | | | 1,176 | |
| Petróleos Mexicanos 6.875% 2025 | | | 660 | | | | 619 | |
| Petróleos Mexicanos 6.875% 2026 | | | 1,480 | | | | 1,336 | |
| Petróleos Mexicanos 6.50% 2027 | | | 1,493 | | | | 1,299 | |
| Petróleos Mexicanos 6.84% 2030 | | | 681 | | | | 538 | |
| Petróleos Mexicanos 5.95% 2031 | | | 2,361 | | | | 1,734 | |
| Petróleos Mexicanos 6.70% 2032 | | | 779 | | | | 596 | |
| Petróleos Mexicanos 6.75% 2047 | | | 122 | | | | 76 | |
| Petróleos Mexicanos 7.69% 2050 | | | 55 | | | | 37 | |
| Petróleos Mexicanos 6.95% 2060 | | | 201 | | | | 124 | |
| PG&E Corp. 5.00% 2028 | | | 15 | | | | 13 | |
| PG&E Corp. 5.25% 2030 | | | 125 | | | | 103 | |
| PGT Innovations, Inc. 4.375% 20292 | | | 5 | | | | 4 | |
| Philip Morris International, Inc. 2.10% 2030 | | | 634 | | | | 520 | |
| Pilgrim’s Pride Corp. 5.875% 20272 | | | 25 | | | | 24 | |
| Post Holdings, Inc. 5.625% 20282 | | | 25 | | | | 24 | |
| Post Holdings, Inc. 4.625% 20302 | | | 444 | | | | 375 | |
| Power Financial Corp., Ltd. 3.35% 2031 | | | 1,870 | | | | 1,554 | |
| Procter & Gamble Company 3.00% 2030 | | | 338 | | | | 319 | |
| PT Indonesia Asahan Aluminium Tbk 5.71% 2023 | | | 960 | | | | 974 | |
| PT Indonesia Asahan Aluminium Tbk 5.45% 20302 | | | 500 | | | | 470 | |
| Qatar Petroleum 3.125% 20412 | | | 2,895 | | | | 2,278 | |
| Radiology Partners, Inc. 9.25% 20282 | | | 190 | | | | 143 | |
| Range Resources Corp. 8.25% 2029 | | | 50 | | | | 51 | |
| Range Resources Corp. 4.75% 20302 | | | 65 | | | | 58 | |
| Raptor Acquisition Corp. 4.875% 20262 | | | 180 | | | | 158 | |
| Real Hero Merger Sub 2, Inc. 6.25% 20292 | | | 25 | | | | 19 | |
| Realogy Corp. 5.75% 20292 | | | 135 | | | | 103 | |
| Realogy Corp. 5.25% 20302 | | | 130 | | | | 97 | |
| Reynolds American, Inc. 4.45% 2025 | | | 2,115 | | | | 2,105 | |
| RLJ Lodging Trust, LP 4.00% 20292 | | | 25 | | | | 21 | |
| Rockcliff Energy II, LLC 5.50% 20292 | | | 25 | | | | 23 | |
| 194 | American Funds Insurance Series |
Capital World Bond Fund (continued)
| Bonds, notes & other debt instruments (continued) | | Principal amount
(000) | | | Value
(000) | |
| U.S. dollars (continued) | | | | | | | | |
| Roller Bearing Company of America, Inc. 4.375% 20292 | | USD | 20 | | | $ | 17 | |
| Royal Caribbean Cruises, Ltd. 11.50% 20252 | | | 57 | | | | 59 | |
| Royal Caribbean Cruises, Ltd. 5.375% 20272 | | | 40 | | | | 29 | |
| RP Escrow Issuer, LLC 5.25% 20252 | | | 95 | | | | 82 | |
| Russian Federation 4.25% 20275 | | | 1,400 | | | | 385 | |
| Ryan Specialty Group, LLC 4.375% 20302 | | | 45 | | | | 39 | |
| Sally Holdings, LLC and Sally Capital, Inc. 5.625% 2025 | | | 33 | | | | 31 | |
| Santander Holdings USA, Inc. 3.244% 2026 | | | 3,750 | | | | 3,520 | |
| Scentre Group 3.50% 20252 | | | 210 | | | | 204 | |
| Scentre Group 3.75% 20272 | | | 110 | | | | 106 | |
| Scientific Games Corp. 7.00% 20282 | | | 40 | | | | 38 | |
| Scientific Games Corp. 7.25% 20292 | | | 75 | | | | 70 | |
| Scientific Games Holdings LP 6.625% 20302 | | | 46 | | | | 39 | |
| SCIH Salt Holdings, Inc. 4.875% 20282 | | | 115 | | | | 96 | |
| Scotts Miracle-Gro Co. 4.50% 2029 | | | 90 | | | | 74 | |
| Scotts Miracle-Gro Co. 4.375% 2032 | | | 55 | | | | 42 | |
| Sealed Air Corp. 5.00% 20292 | | | 40 | | | | 37 | |
| ServiceNow, Inc. 1.40% 2030 | | | 1,830 | | | | 1,434 | |
| Silgan Holdings, Inc. 4.125% 2028 | | | 80 | | | | 72 | |
| Simmons Foods, Inc. 4.625% 20292 | | | 160 | | | | 136 | |
| Singapore Airlines, Ltd. 3.375% 2029 | | | 3,710 | | | | 3,379 | |
| Sirius XM Radio, Inc. 4.00% 20282 | | | 120 | | | | 104 | |
| Sirius XM Radio, Inc. 3.875% 20312 | | | 90 | | | | 72 | |
| SkyMiles IP, Ltd. 4.75% 20282 | | | 25 | | | | 24 | |
| SM Energy Co. 6.50% 2028 | | | 45 | | | | 41 | |
| Sonic Automotive, Inc. 4.625% 20292 | | | 85 | | | | 66 | |
| Sonic Automotive, Inc. 4.875% 20312 | | | 20 | | | | 15 | |
| Southern California Edison Co. 2.85% 2029 | | | 200 | | | | 177 | |
| Southwestern Energy Co. 5.95% 20251 | | | 110 | | | | 109 | |
| Southwestern Energy Co. 7.75% 2027 | | | 20 | | | | 20 | |
| Southwestern Energy Co. 8.375% 2028 | | | 30 | | | | 32 | |
| Southwestern Energy Co. 5.375% 2030 | | | 135 | | | | 124 | |
| Southwestern Energy Co. 4.75% 2032 | | | 25 | | | | 21 | |
| Sprint Corp. 7.625% 2026 | | | 130 | | | | 137 | |
| Square, Inc. 3.50% 20312 | | | 30 | | | | 24 | |
| Sri Lanka (Democratic Socialist Republic of) 5.75% 20235 | | | 2,890 | | | | 938 | |
| Stellantis Finance US, Inc. 1.711% 20272 | | | 1,900 | | | | 1,654 | |
| Stellantis Finance US, Inc. 2.691% 20312 | | | 225 | | | | 178 | |
| Stericycle, Inc. 3.875% 20292 | | | 180 | | | | 147 | |
| Studio City Finance, Ltd. 6.00% 20252 | | | 200 | | | | 127 | |
| Summit Midstream Holdings / Summit Midstream Finance Corp. 8.50% 20262 | | | 55 | | | | 50 | |
| Sunoco LP 4.50% 2029 | | | 90 | | | | 74 | |
| Sunoco LP 4.50% 20302 | | | 35 | | | | 28 | |
| Surgery Center Holdings 10.00% 20272 | | | 175 | | | | 170 | |
| SVB Financial Group 4.70% junior subordinated perpetual bonds (5-year UST Yield Curve Rate T Note Constant Maturity + 3.064% on 11/15/2031)1 | | | 12 | | | | 9 | |
| Swiss Re Finance (Luxembourg) SA 5.00% 2049 (5-year UST Yield Curve Rate T Note Constant Maturity + 3.582% on 4/2/2029)1,2 | | | 800 | | | | 759 | |
| Talen Energy Corp. 7.25% 20272,5 | | | 205 | | | | 202 | |
| Teekay Offshore Partners LP 8.50% 20232,9,10 | | | 555 | | | | 505 | |
| Tencent Holdings, Ltd. 3.24% 20502 | | | 3,450 | | | | 2,385 | |
| Tenet Healthcare Corp. 4.875% 20262 | | | 280 | | | | 259 | |
| Tenet Healthcare Corp. 6.125% 20282 | | | 25 | | | | 21 | |
| Tenet Healthcare Corp. 6.125% 20302 | | | 15 | | | | 14 | |
| Teva Pharmaceutical Finance Co. BV 6.00% 2024 | | | 4,600 | | | | 4,542 | |
| Teva Pharmaceutical Finance Co. BV 7.125% 2025 | | | 3,710 | | | | 3,626 | |
| State of Texas, Grand Parkway Transportation Corp., Grand Parkway System Toll Rev. Ref. Bonds, Series 2020-B, 3.236% 2052 | | | 1,780 | | | | 1,430 | |
| T-Mobile US, Inc. 2.40% 2029 | | | 1,079 | | | | 933 | |
| Toronto-Dominion Bank 1.25% 2026 | | | 2,836 | | | | 2,520 | |
| Toyota Motor Credit Corp. 3.375% 2030 | | | 453 | | | | 427 | |
| American Funds Insurance Series | 195 |
Capital World Bond Fund (continued)
| Bonds, notes & other debt instruments (continued) | | Principal amount
(000) | | | Value
(000) | |
| U.S. dollars (continued) | | | | | | | | |
| TransDigm, Inc. 6.25% 20262 | | USD | 65 | | | $ | 63 | |
| TransDigm, Inc. 5.50% 2027 | | | 35 | | | | 30 | |
| Transocean Guardian, Ltd. 5.875% 20242 | | | 29 | | | | 27 | |
| Transocean Poseidon, Ltd. 6.875% 20272 | | | 122 | | | | 107 | |
| Treehouse Park Improvement Association No.1 - Anleihen 9.75% 20332,9,10 | | | 100 | | | | 89 | |
| Triumph Group, Inc. 6.25% 20242 | | | 35 | | | | 31 | |
| Turkey (Republic of) 6.25% 2022 | | | 1,880 | | | | 1,878 | |
| Turkey (Republic of) 6.35% 2024 | | | 2,220 | | | | 2,058 | |
| Twitter, Inc. 5.00% 20302 | | | 35 | | | | 33 | |
| U.S. Treasury 0.125% 2022 | | | 12,340 | | | | 12,262 | |
| U.S. Treasury 0.125% 2023 | | | 12,320 | | | | 12,148 | |
| U.S. Treasury 2.625% 2023 | | | 6,900 | | | | 6,898 | |
| U.S. Treasury 1.875% 2024 | | | 4,515 | | | | 4,409 | |
| U.S. Treasury 2.50% 2024 | | | 8,430 | | | | 8,356 | |
| U.S. Treasury 0.25% 2025 | | | 30,740 | | | | 28,155 | |
| U.S. Treasury 2.875% 2025 | | | 5,400 | | | | 5,368 | |
| U.S. Treasury 2.875% 2025 | | | 1,969 | | | | 1,962 | |
| U.S. Treasury 0.375% 2026 | | | 28,740 | | | | 26,131 | |
| U.S. Treasury 0.50% 2026 | | | 7,453 | | | | 6,794 | |
| U.S. Treasury 0.75% 2026 | | | 4,361 | | | | 3,970 | |
| U.S. Treasury 0.875% 2026 | | | 11,098 | | | | 10,135 | |
| U.S. Treasury 1.125% 2026 | | | 1,698 | | | | 1,565 | |
| U.S. Treasury 2.50% 2027 | | | 2,260 | | | | 2,205 | |
| U.S. Treasury 2.625% 202712 | | | 52,903 | | | | 51,897 | |
| U.S. Treasury 1.625% 2029 | | | 10,760 | | | | 9,792 | |
| U.S. Treasury 1.375% 203112 | | | 15,793 | | | | 13,683 | |
| U.S. Treasury 1.125% 2040 | | | 9,170 | | | | 6,363 | |
| U.S. Treasury 1.75% 2041 | | | 6,050 | | | | 4,584 | |
| U.S. Treasury 1.875% 204112 | | | 18,740 | | | | 14,646 | |
| U.S. Treasury 2.375% 2042 | | | 2,872 | | | | 2,425 | |
| U.S. Treasury 3.00% 2048 | | | 5,045 | | | | 4,751 | |
| U.S. Treasury 2.00% 205112 | | | 13,505 | | | | 10,394 | |
| U.S. Treasury 2.25% 205212 | | | 34,362 | | | | 28,155 | |
| U.S. Treasury Inflation-Protected Security 0.125% 20223 | | | 10,733 | | | | 10,774 | |
| U.S. Treasury Inflation-Protected Security 0.125% 20243,12 | | | 62,331 | | | | 62,967 | |
| U.S. Treasury Inflation-Protected Security 0.50% 20243 | | | 13,220 | | | | 13,411 | |
| U.S. Treasury Inflation-Protected Security 0.625% 20243 | | | 14,907 | | | | 15,154 | |
| U.S. Treasury Inflation-Protected Security 0.125% 20513 | | | 4,152 | | | | 3,173 | |
| UBS Group AG 1.008% 2024, (5-year UST Yield Curve Rate T Note Constant Maturity + 0.83% on 7/30/2023)1,2 | | | 1,950 | | | | 1,889 | |
| UKG, Inc., Term Loan B, (3-month USD-LIBOR + 3.25%) 4.212% 20266,7 | | | 60 | | | | 56 | |
| UKG, Inc., Term Loan, (3-month USD-LIBOR + 5.25%) 6.212% 20276,7 | | | 75 | | | | 70 | |
| Ukraine 7.75% 20229 | | | 6,210 | | | | 3,105 | |
| Ukraine 7.75% 2024 | | | 1,570 | | | | 406 | |
| Ukraine 6.876% 2029 | | | 1,269 | | | | 314 | |
| Uniform Mortgage-Backed Security 2.50% 20524,11 | | | 13,030 | | | | 11,708 | |
| Uniform Mortgage-Backed Security 3.00% 20524,11 | | | 9,500 | | | | 8,841 | |
| Uniform Mortgage-Backed Security 3.00% 20524,11 | | | 790 | | | | 736 | |
| Uniform Mortgage-Backed Security 3.50% 20524,11 | | | 7,450 | | | | 7,159 | |
| Uniform Mortgage-Backed Security 4.00% 20524,11 | | | 7,105 | | | | 6,997 | |
| Uniform Mortgage-Backed Security 4.50% 20524,11 | | | 8,900 | | | | 8,917 | |
| Uniform Mortgage-Backed Security 4.50% 20524,11 | | | 1,560 | | | | 1,560 | |
| Uniform Mortgage-Backed Security 5.00% 20524,11 | | | 5,100 | | | | 5,193 | |
| Uniform Mortgage-Backed Security 5.00% 20524,11 | | | 500 | | | | 508 | |
| United Rentals, Inc. 4.875% 2028 | | | 30 | | | | 28 | |
| Univision Communications, Inc. 4.50% 20292 | | | 235 | | | | 197 | |
| Univision Communications, Inc. 7.375% 20302 | | | 25 | | | | 24 | |
| US Foods, Inc. 4.625% 20302 | | | 35 | | | | 30 | |
| Valvoline, Inc. 3.625% 20312 | | | 85 | | | | 68 | |
| Venator Materials Corp. 5.75% 20252 | | | 140 | | | | 112 | |
| Venator Materials Corp. 9.50% 20252 | | | 185 | | | | 186 | |
| Venture Global Calcasieu Pass, LLC 3.875% 20292 | | | 100 | | | | 88 | |
| 196 | American Funds Insurance Series |
Capital World Bond Fund (continued)
| Bonds, notes & other debt instruments (continued) | | Principal amount
(000) | | | Value
(000) | |
| U.S. dollars (continued) | | | | | | | | |
| Venture Global Calcasieu Pass, LLC 4.125% 20312 | | USD | 125 | | | $ | 107 | |
| Venture Global Calcasieu Pass, LLC 3.875% 20332 | | | 65 | | | | 54 | |
| Verizon Communications, Inc. 3.15% 2030 | | | 575 | | | | 523 | |
| Verizon Communications, Inc. 2.55% 2031 | | | 2,100 | | | | 1,797 | |
| VICI Properties LP 4.375% 2025 | | | 1,563 | | | | 1,529 | |
| VICI Properties LP 4.625% 20292 | | | 15 | | | | 13 | |
| VICI Properties LP / VICI Note Co., Inc. 3.75% 20272 | | | 100 | | | | 88 | |
| VICI Properties LP / VICI Note Co., Inc. 4.125% 20302 | | | 375 | | | | 324 | |
| Volkswagen Group of America Finance, LLC 4.625% 20252 | | | 1,070 | | | | 1,070 | |
| VZ Secured Financing BV 5.00% 20322 | | | 200 | | | | 166 | |
| W. R. Grace Holdings, LLC 5.625% 20292 | | | 20 | | | | 15 | |
| Warner Music Group 3.75% 20292 | | | 150 | | | | 126 | |
| Warrior Met Coal, Inc. 7.875% 20282 | | | 185 | | | | 177 | |
| WASH Multifamily Acquisition, Inc. 5.75% 20262 | | | 195 | | | | 184 | |
| WEA Finance, LLC 3.75% 20242 | | | 535 | | | | 517 | |
| Weatherford International, Ltd. 11.00% 20242 | | | 12 | | | | 12 | |
| Weatherford International, Ltd. 6.50% 20282 | | | 65 | | | | 58 | |
| Weatherford International, Ltd. 8.625% 20302 | | | 60 | | | | 50 | |
| Wells Fargo & Company 3.526% 2028 (USD-SOFR + 1.51% on 3/24/2027)1 | | | 5,788 | | | | 5,487 | |
| WESCO Distribution, Inc. 7.125% 20252 | | | 180 | | | | 180 | |
| WESCO Distribution, Inc. 7.25% 20282 | | | 195 | | | | 193 | |
| Western Global Airlines, LLC 10.375% 20252 | | | 15 | | | | 14 | |
| Western Midstream Operating, LP 3.60% 2025 (3.35% on 8/1/2022)1 | | | 85 | | | | 78 | |
| Western Midstream Operating, LP 4.75% 2028 | | | 65 | | | | 59 | |
| Westpac Banking Corp. 2.894% 2030 (5-year UST Yield Curve Rate T Note Constant Maturity + 1.35% on 2/4/2025)1 | | | 2,900 | | | | 2,751 | |
| WeWork Companies, LLC 5.00% 20252 | | | 50 | | | | 32 | |
| Williams Companies, Inc. 3.50% 2030 | | | 763 | | | | 688 | |
| Williams Companies, Inc. 2.60% 2031 | | | 130 | | | | 109 | |
| Wyndham Destinations, Inc. 6.625% 20262 | | | 65 | | | | 62 | |
| Wynn Las Vegas, LLC and Wynn Capital Corp. 4.25% 20232 | | | 38 | | | | 37 | |
| Xcel Energy, Inc. 3.35% 2026 | | | 2,581 | | | | 2,495 | |
| Yahoo Holdings, Inc., Term Loan B, (1-month USD-LIBOR + 5.50%) 7.166% 20276,7 | | | 150 | | | | 142 | |
| Ziggo Bond Co. BV 5.125% 20302 | | | 200 | | | | 157 | |
| Ziggo Bond Finance BV 4.875% 20302 | | | 300 | | | | 255 | |
| ZipRecruiter, Inc. 5.00% 20302 | | | 25 | | | | 21 | |
| | | | | | | | 794,211 | |
| | | | | | | | | |
| Total bonds, notes & other debt instruments (cost: $1,783,653,000) | | | | | | | 1,518,719 | |
| | | | | | | | | |
| Preferred securities 0.00% | | Shares | | | | |
| U.S. dollars 0.00% | | | | |
| ACR III LSC Holdings, LLC, Series B, preferred shares2,9,10,13 | | | 48 | | | | 15 | |
| | | | | | | | | |
| Total preferred securities (cost: $49,000) | | | | | | | 15 | |
| | | | | | | | | |
| Common stocks 0.02% | | | | | | | | |
| U.S. dollars 0.02% | | | | | | | | |
| Diamond Offshore Drilling, Inc.13 | | | 36,338 | | | | 214 | |
| Diamond Offshore Drilling, Inc.2,13 | | | 12,700 | | | | 75 | |
| Bighorn Permian Resources, LLC9,10,13 | | | 531 | | | | 3 | |
| Constellation Oil Services Holding SA, Class B-19,10,13 | | | 1,214,969 | | | | — | 14 |
| | | | | | | | | |
| Total common stocks (cost: $727,000) | | | | | | | 292 | |
| American Funds Insurance Series | 197 |
Capital World Bond Fund (continued)
| Short-term securities 6.33% | | Shares | | | Value
(000) | |
| Money market investments 6.33% | | | | |
| Capital Group Central Cash Fund 1.38%15,16 | | | 1,001,946 | | | $ | 100,175 | |
| | | | | | | | | |
| Total short-term securities (cost: $100,186,000) | | | | | | | 100,175 | |
| Total investment securities 102.37% (cost: $1,884,615,000) | | | | | | | 1,619,201 | |
| Other assets less liabilities (2.37)% | | | | | | | (37,485 | ) |
| | | | | | | | | |
| Net assets 100.00% | | | | | | $ | 1,581,716 | |
Futures contracts
| Contracts | | Type | | Number of
contracts | | Expiration | | Notional
amount
(000) | | | Value and
unrealized
(depreciation)
appreciation
at 6/30/2022
(000) | |
| 90 Day Eurodollar Futures | | Long | | 47 | | December 2022 | | USD | 11,316 | | | | $ | (334 | ) |
| 2 Year U.S. Treasury Note Futures | | Short | | 190 | | September 2022 | | | (39,903 | ) | | | | 46 | |
| 5 Year Euro-Bobl Futures | | Long | | 192 | | September 2022 | | | 24,988 | | | | | (262 | ) |
| 5 Year U.S. Treasury Note Futures | | Long | | 798 | | September 2022 | | | 89,575 | | | | | (398 | ) |
| 10 Year Euro-Bund Futures | | Long | | 183 | | September 2022 | | | 28,532 | | | | | 508 | |
| 10 Year Italy Government Bond Futures | | Short | | 178 | | September 2022 | | | (22,966 | ) | | | | 31 | |
| 10 Year Japanese Government Bond Futures | | Long | | 6 | | September 2022 | | | 6,572 | | | | | 36 | |
| 10 Year Ultra U.S. Treasury Note Futures | | Short | | 59 | | September 2022 | | | (7,515 | ) | | | | 108 | |
| 10 Year U.S. Treasury Note Futures | | Short | | 194 | | September 2022 | | | (22,995 | ) | | | | 94 | |
| 10 Year UK Gilt Futures | | Long | | 48 | | September 2022 | | | 6,660 | | | | | 110 | |
| 20 Year U.S. Treasury Bond Futures | | Long | | 172 | | September 2022 | | | 23,843 | | | | | (319 | ) |
| 30 Year Euro-Buxl Futures | | Long | | 69 | | September 2022 | | | 11,827 | | | | | (852 | ) |
| 30 Year Ultra U.S. Treasury Bond Futures | | Long | | 11 | | September 2022 | | | 1,698 | | | | | (51 | ) |
| | | | | | | | | | | | | | $ | (1,283 | ) |
Forward currency contracts
| Contract amount | | | | | | Unrealized
appreciation
(depreciation) | |
Currency purchased
(000) | | Currency sold
(000) | | Counterparty | | Settlement
date | | at 6/30/2022
(000) | |
| BRL | | 110,886 | | USD | | 19,160 | | Citibank | | 7/1/2022 | | | $ | 2,021 | |
| SEK | | 23,400 | | USD | | 2,378 | | JPMorgan Chase | | 7/7/2022 | | | | (90 | ) |
| USD | | 6,267 | | CAD | | 7,881 | | UBS AG | | 7/11/2022 | | | | 145 | |
| USD | | 2,060 | | HUF | | 754,350 | | Bank of America | | 7/11/2022 | | | | 70 | |
| USD | | 1,713 | | AUD | | 2,380 | | JPMorgan Chase | | 7/11/2022 | | | | 70 | |
| JPY | | 623,410 | | USD | | 4,606 | | BNP Paribas | | 7/11/2022 | | | | (9 | ) |
| JPY | | 137,850 | | USD | | 1,028 | | Morgan Stanley | | 7/11/2022 | | | | (12 | ) |
| PLN | | 4,470 | | USD | | 1,038 | | HSBC Bank | | 7/11/2022 | | | | (42 | ) |
| DKK | | 17,400 | | USD | | 2,502 | | Bank of America | | 7/11/2022 | | | | (49 | ) |
| PLN | | 20,540 | | EUR | | 4,453 | | BNP Paribas | | 7/11/2022 | | | | (94 | ) |
| HUF | | 2,533,310 | | EUR | | 6,465 | | Citibank | | 7/11/2022 | | | | (96 | ) |
| USD | | 3,299 | | BRL | | 16,000 | | HSBC Bank | | 7/12/2022 | | | | 253 | |
| USD | | 1,347 | | BRL | | 6,470 | | Citibank | | 7/12/2022 | | | | 115 | |
| BRL | | 22,470 | | USD | | 4,297 | | Citibank | | 7/12/2022 | | | | (19 | ) |
| USD | | 14,381 | | DKK | | 100,190 | | Standard Chartered Bank | | 7/13/2022 | | | | 252 | |
| USD | | 4,002 | | MXN | | 78,910 | | BNP Paribas | | 7/13/2022 | | | | 87 | |
| USD | | 1,435 | | NZD | | 2,240 | | Standard Chartered Bank | | 7/13/2022 | | | | 36 | |
| GBP | | 7,340 | | USD | | 9,194 | | Morgan Stanley | | 7/13/2022 | | | | (257 | ) |
| 198 | American Funds Insurance Series |
Capital World Bond Fund (continued)
Forward currency contracts (continued)
| Contract amount | | | | | | Unrealized
appreciation | |
Currency
purchased
(000) | | Currency sold
(000) | | Counterparty | | Settlement
date | | (depreciation)
at 6/30/2022
(000) | |
| CAD | | 20,253 | | USD | | 15,658 | | UBS AG | | 7/15/2022 | | | $ | 76 | |
| MYR | | 11,360 | | USD | | 2,580 | | Standard Chartered Bank | | 7/15/2022 | | | | 3 | |
| USD | | 6,307 | | MYR | | 27,740 | | Standard Chartered Bank | | 7/15/2022 | | | | — | 14 |
| MYR | | 6,300 | | USD | | 1,432 | | HSBC Bank | | 7/15/2022 | | | | — | 14 |
| MYR | | 10,080 | | USD | | 2,291 | | Standard Chartered Bank | | 7/15/2022 | | | | — | 14 |
| CNH | | 151,257 | | USD | | 22,369 | | Citibank | | 7/18/2022 | | | | 227 | |
| CZK | | 47,290 | | EUR | | 1,900 | | UBS AG | | 7/18/2022 | | | | 5 | |
| EUR | | 6,804 | | PLN | | 31,970 | | Goldman Sachs | | 7/20/2022 | | | | 27 | |
| PLN | | 1,550 | | USD | | 344 | | BNP Paribas | | 7/20/2022 | | | | 1 | |
| USD | | 358 | | COP | | 1,453,260 | | Citibank | | 7/22/2022 | | | | 10 | |
| EUR | | 4,670 | | USD | | 4,897 | | JPMorgan Chase | | 7/25/2022 | | | | 5 | |
| DKK | | 20,510 | | EUR | | 2,757 | | BNP Paribas | | 7/25/2022 | | | | 1 | |
| PLN | | 18,110 | | EUR | | 3,878 | | Goldman Sachs | | 7/25/2022 | | | | (44 | ) |
| USD | | 11,532 | | MXN | | 232,306 | | Citibank | | 7/27/2022 | | | | 38 | |
| CNH | | 61,490 | | USD | | 9,175 | | UBS AG | | 7/27/2022 | | | | 10 | |
| CHF | | 800 | | USD | | 837 | | UBS AG | | 7/27/2022 | | | | 3 | |
| JPY | | 798,810 | | USD | | 5,895 | | BNP Paribas | | 7/27/2022 | | | | 2 | |
| EUR | | 17,853 | | DKK | | 132,800 | | JPMorgan Chase | | 7/27/2022 | | | | (1 | ) |
| EUR | | 2,540 | | USD | | 2,678 | | BNP Paribas | | 7/27/2022 | | | | (11 | ) |
| ZAR | | 26,060 | | USD | | 1,628 | | JPMorgan Chase | | 7/27/2022 | | | | (30 | ) |
| EUR | | 25,150 | | USD | | 26,516 | | UBS AG | | 7/27/2022 | | | | (112 | ) |
| JPY | | 7,317,238 | | USD | | 54,441 | | UBS AG | | 7/27/2022 | | | | (422 | ) |
| USD | | 5,920 | | AUD | | 8,270 | | Citibank | | 7/29/2022 | | | | 210 | |
| USD | | 2,167 | | IDR | | 32,232,353 | | Citibank | | 8/4/2022 | | | | 14 | |
| KRW | | 13,728,070 | | USD | | 10,657 | | Citibank | | 8/5/2022 | | | | 1 | |
| BRL | | 140,966 | | USD | | 24,130 | | Citibank | | 8/10/2022 | | | | 2,465 | |
| USD | | 11,219 | | BRL | | 63,000 | | JPMorgan Chase | | 8/10/2022 | | | | (667 | ) |
| USD | | 13,967 | | BRL | | 77,966 | | Citibank | | 8/10/2022 | | | | (742 | ) |
| USD | | 5,044 | | HUF | | 1,807,090 | | Bank of America | | 1/20/2023 | | | | 433 | |
| USD | | 5,215 | | CZK | | 124,020 | | Morgan Stanley | | 1/20/2023 | | | | 75 | |
| CZK | | 124,020 | | USD | | 5,572 | | Goldman Sachs | | 1/20/2023 | | | | (433 | ) |
| HUF | | 1,807,090 | | USD | | 5,518 | | Bank of America | | 1/20/2023 | | | | (908 | ) |
| PLN | | 24,520 | | USD | | 5,912 | | BNP Paribas | | 2/2/2023 | | | | (598 | ) |
| | | | | | | | | | | | | | $ | 2,019 | |
Swap contracts
Interest rate swaps
Centrally cleared interest rate swaps
| Receive | | Pay | | | | Notional | | | Value at | | Upfront
premium | | Unrealized
(depreciation)
appreciation | |
| Rate | | Payment
frequency | | Rate | | Payment
frequency | | Expiration
date | | amount
(000) | | | 6/30/2022
(000) | | paid
(000) | | at 6/30/2022
(000) | |
| 1.2475% | | Semi-annual | | 3-month NZD-BBR-FRA | | Quarterly | | 8/20/2023 | | NZD | 4,428 | | | $ | (80 | ) | | $ | — | | | $ | (80 | ) |
| 1.234974% | | Semi-annual | | 3-month NZD-BBR-FRA | | Quarterly | | 8/20/2023 | | | 37,736 | | | | (683 | ) | | | — | | | | (683 | ) |
| 1.2375% | | Semi-annual | | 3-month NZD-BBR-FRA | | Quarterly | | 8/26/2023 | | | 13,908 | | | | (258 | ) | | | — | | | | (258 | ) |
| 1.264% | | Semi-annual | | 3-month NZD-BBR-FRA | | Quarterly | | 8/27/2023 | | | 34,764 | | | | (638 | ) | | | — | | | | (638 | ) |
| 1.26% | | Semi-annual | | 3-month NZD-BBR-FRA | | Quarterly | | 8/30/2023 | | | 5,734 | | | | (106 | ) | | | — | | | | (106 | ) |
| 1.28% | | Semi-annual | | 3-month NZD-BBR-FRA | | Quarterly | | 8/31/2023 | | | 5,734 | | | | (106 | ) | | | — | | | | (106 | ) |
| 1.30% | | Semi-annual | | 3-month NZD-BBR-FRA | | Quarterly | | 9/3/2023 | | | 6,295 | | | | (116 | ) | | | — | | | | (116 | ) |
| 1.4975% | | Semi-annual | | 3-month NZD-BBR-FRA | | Quarterly | | 9/21/2023 | | | 11,830 | | | | (215 | ) | | | — | | | | (215 | ) |
| 1.445% | | Semi-annual | | 3-month NZD-BBR-FRA | | Quarterly | | 9/28/2023 | | | 11,817 | | | | (223 | ) | | | — | | | | (223 | ) |
| American Funds Insurance Series | 199 |
Capital World Bond Fund (continued)
Swap contracts (continued)
Interest rate swaps (continued)
Centrally cleared interest rate swaps (continued)
| Receive | | Pay | | | | Notional | | | Value at | | Upfront
premium | | Unrealized
(depreciation)
appreciation | |
| Rate | | Payment
frequency | | Rate | | Payment
frequency | | Expiration
date | | amount
(000) | | | 6/30/2022
(000) | | paid
(000) | | at 6/30/2022
(000) | |
| 1.4475% | | Semi-annual | | 3-month NZD-BBR-FRA | | Quarterly | | 9/29/2023 | | NZD | 12,043 | | | $ | (228 | ) | | $ | — | | | $ | (228 | ) |
| 1.4475% | | Semi-annual | | 3-month NZD-BBR-FRA | | Quarterly | | 9/30/2023 | | | 12,093 | | | | (229 | ) | | | — | | | | (229 | ) |
| 1.5125% | | Semi-annual | | 3-month NZD-BBR-FRA | | Quarterly | | 10/14/2023 | | | 10,675 | | | | (203 | ) | | | — | | | | (203 | ) |
| 1.53% | | Semi-annual | | 3-month NZD-BBR-FRA | | Quarterly | | 10/14/2023 | | | 12,176 | | | | (230 | ) | | | — | | | | (230 | ) |
| 1.5625% | | Semi-annual | | 3-month NZD-BBR-FRA | | Quarterly | | 10/15/2023 | | | 12,163 | | | | (226 | ) | | | — | | | | (226 | ) |
| 1.59% | | Semi-annual | | 3-month NZD-BBR-FRA | | Quarterly | | 10/18/2023 | | | 12,163 | | | | (224 | ) | | | — | | | | (224 | ) |
| 1.62% | | Semi-annual | | 3-month NZD-BBR-FRA | | Quarterly | | 10/19/2023 | | | 13,521 | | | | (246 | ) | | | — | | | | (246 | ) |
| 2.2525% | | Semi-annual | | 3-month NZD-BBR-FRA | | Quarterly | | 11/8/2023 | | | 17,111 | | | | (235 | ) | | | — | | | | (235 | ) |
| 2.24% | | Semi-annual | | 3-month NZD-BBR-FRA | | Quarterly | | 11/8/2023 | | | 17,111 | | | | (237 | ) | | | — | | | | (237 | ) |
| 2.20% | | Semi-annual | | 3-month NZD-BBR-FRA | | Quarterly | | 11/9/2023 | | | 1,440 | | | | (20 | ) | | | — | | | | (20 | ) |
| 2.495% | | Annual | | SONIA | | Annual | | 5/5/2024 | | GBP | 21,230 | | | | (98 | ) | | | — | | | | (98 | ) |
| 2.42% | | Annual | | SONIA | | Annual | | 5/5/2024 | | | 42,400 | | | | (232 | ) | | | — | | | | (232 | ) |
| 2.363% | | Annual | | SONIA | | Annual | | 5/11/2024 | | | 40,870 | | | | (248 | ) | | | — | | | | (248 | ) |
| 2.9588% | | Annual | | SONIA | | Annual | | 6/9/2024 | | | 26,900 | | | | 33 | | | | — | | | | 33 | |
| 6.255% | | 28-day | | 28-day MXN-TIIE | | 28-day | | 5/22/2026 | | MXN | 47,800 | | | | (222 | ) | | | — | | | | (222 | ) |
| 6.19% | | 28-day | | 28-day MXN-TIIE | | 28-day | | 5/22/2026 | | | 48,400 | | | | (230 | ) | | | — | | | | (230 | ) |
| 6.16% | | 28-day | | 28-day MXN-TIIE | | 28-day | | 6/9/2026 | | | 58,800 | | | | (285 | ) | | | — | | | | (285 | ) |
| 6.5375% | | 28-day | | 28-day MXN-TIIE | | 28-day | | 6/17/2026 | | | 14,000 | | | | (59 | ) | | | — | | | | (59 | ) |
| 6.50% | | 28-day | | 28-day MXN-TIIE | | 28-day | | 6/17/2026 | | | 13,900 | | | | (60 | ) | | | — | | | | (60 | ) |
| 6.47% | | 28-day | | 28-day MXN-TIIE | | 28-day | | 6/17/2026 | | | 14,200 | | | | (62 | ) | | | — | | | | (62 | ) |
| 6.55% | | 28-day | | 28-day MXN-TIIE | | 28-day | | 6/17/2026 | | | 43,000 | | | | (181 | ) | | | — | | | | (181 | ) |
| 6.55% | | 28-day | | 28-day MXN-TIIE | | 28-day | | 6/18/2026 | | | 14,100 | | | | (59 | ) | | | — | | | | (59 | ) |
| 6.50% | | 28-day | | 28-day MXN-TIIE | | 28-day | | 6/18/2026 | | | 27,800 | | | | (119 | ) | | | — | | | | (119 | ) |
| 6.59% | | 28-day | | 28-day MXN-TIIE | | 28-day | | 6/25/2026 | | | 38,700 | | | | (161 | ) | | | — | | | | (161 | ) |
| 6.58% | | 28-day | | 28-day MXN-TIIE | | 28-day | | 6/25/2026 | | | 41,600 | | | | (174 | ) | | | — | | | | (174 | ) |
| 6.585% | | 28-day | | 28-day MXN-TIIE | | 28-day | | 6/25/2026 | | | 50,900 | | | | (213 | ) | | | — | | | | (213 | ) |
| 6.64% | | 28-day | | 28-day MXN-TIIE | | 28-day | | 6/25/2026 | | | 62,600 | | | | (256 | ) | | | — | | | | (256 | ) |
| 6.633% | | 28-day | | 28-day MXN-TIIE | | 28-day | | 6/25/2026 | | | 172,500 | | | | (707 | ) | | | — | | | | (707 | ) |
| 6.605% | | 28-day | | 28-day MXN-TIIE | | 28-day | | 7/6/2026 | | | 105,000 | | | | (436 | ) | | | — | | | | (436 | ) |
| 7.59% | | 28-day | | 28-day MXN-TIIE | | 28-day | | 10/29/2026 | | | 28,900 | | | | (75 | ) | | | — | | | | (75 | ) |
| 7.62% | | 28-day | | 28-day MXN-TIIE | | 28-day | | 10/29/2026 | | | 43,375 | | | | (110 | ) | | | — | | | | (110 | ) |
| 7.66% | | 28-day | | 28-day MXN-TIIE | | 28-day | | 10/29/2026 | | | 70,800 | | | | (175 | ) | | | — | | | | (175 | ) |
| 7.64% | | 28-day | | 28-day MXN-TIIE | | 28-day | | 10/29/2026 | | | 70,800 | | | | (177 | ) | | | — | | | | (177 | ) |
| 7.52% | | 28-day | | 28-day MXN-TIIE | | 28-day | | 10/30/2026 | | | 89,445 | | | | (243 | ) | | | — | | | | (243 | ) |
| 7.805% | | 28-day | | 28-day MXN-TIIE | | 28-day | | 2/23/2027 | | | 41,200 | | | | (94 | ) | | | — | | | | (94 | ) |
| 7.82% | | 28-day | | 28-day MXN-TIIE | | 28-day | | 2/24/2027 | | | 41,600 | | | | (94 | ) | | | — | | | | (94 | ) |
| | | | | | | | | | | | | | | $ | (9,240 | ) | | $ | — | | | $ | (9,240 | ) |
Credit default swaps
Centrally cleared credit default swaps on credit indices — buy protection
Reference
index | | Financing
rate paid | | Payment
frequency | | Expiration
date | | Notional
amount
(000) | | Value at
6/30/2022
(000) | | | Upfront
premium
(received)
paid
(000) | | | Unrealized
appreciation
at 6/30/2022
(000) | |
| CDX.NA.HY.38 | | 5.00% | | Quarterly | | 6/20/2027 | | USD 44,076 | | | $ | 1,327 | | | | $ | (959 | ) | | | $ | 2,286 | |
| ITRX.EUR.IG.37 | | 1.00% | | Quarterly | | 6/20/2027 | | EUR 23,820 | | | | 222 | | | | | (300 | ) | | | | 522 | |
| CDX.EM.37 | | 1.00% | | Quarterly | | 6/20/2027 | | USD 13,360 | | | | 1,340 | | | | | 1,134 | | | | | 206 | |
| CDX.NA.IG.38 | | 1.00% | | Quarterly | | 6/20/2027 | | 5 | | | | — | 14 | | | | — | 14 | | | | — | 14 |
| | | | | | | | | | | | $ | 2,889 | | | | $ | (125 | ) | | | $ | 3,014 | |
| 200 | American Funds Insurance Series |
Capital World Bond Fund (continued)
Investments in affiliates16
| | | Value of
affiliate at
1/1/2022
(000) | | | Additions
(000) | | | Reductions
(000) | | | Net
realized
loss
(000) | | | Net
unrealized
depreciation
(000) | | | Value of
affiliate at
6/30/2022
(000) | | | Dividend
income
(000) | |
| Short-term securities 6.33% | | | | | | | | | | | | | | | | | | | | | | | | | | | | |
| Money market investments 6.33% | | | | | | | | | | | | | | | | | | | | | | | | | | | | |
| Capital Group Central Cash Fund 1.38%15 | | $ | 144,080 | | | $ | 438,028 | | | $ | 481,900 | | | $ | (10 | ) | | $ | (23 | ) | | $ | 100,175 | | | $ | 255 | |
| 1 | Step bond; coupon rate may change at a later date. |
| 2 | Acquired in a transaction exempt from registration under Rule 144A of the Securities Act of 1933. May be resold in the U.S. in transactions exempt from registration, normally to qualified institutional buyers. The total value of all such securities was $122,023,000, which represented 7.71% of the net assets of the fund. |
| 3 | Index-linked bond whose principal amount moves with a government price index. |
| 4 | Principal payments may be made periodically. Therefore, the effective maturity date may be earlier than the stated maturity date. |
| 5 | Scheduled interest and/or principal payment was not received. |
| 6 | Loan participations and assignments; may be subject to legal or contractual restrictions on resale. The total value of all such loans was $1,479,000, which represented .09% of the net assets of the fund. |
| 7 | Coupon rate may change periodically. Reference rate and spread are as of the most recent information available. Some coupon rates are determined by the issuer or agent based on current market conditions; therefore, the reference rate and spread are not available. |
| 8 | Payment in kind; the issuer has the option of paying additional securities in lieu of cash. Payment methods and rates are as of the most recent payment when available. |
| 9 | Valued under fair value procedures adopted by authority of the board of trustees. The total value of all such securities was $3,760,000, which represented .24% of the net assets of the fund. |
| 10 | Value determined using significant unobservable inputs. |
| 11 | Purchased on a TBA basis. |
| 12 | All or a portion of this security was pledged as collateral. The total value of pledged collateral was $15,285,000, which represented .97% of the net assets of the fund. |
| 13 | Security did not produce income during the last 12 months. |
| 14 | Amount less than one thousand. |
| 15 | Rate represents the seven-day yield at 6/30/2022. |
| 16 | Part of the same “group of investment companies” as the fund as defined under the Investment Company Act of 1940, as amended. |
| Key to abbreviations |
Assn. = Association AUD = Australian dollars BBR = Bank Base Rate BRL = Brazilian reais CAD = Canadian dollars CHF = Swiss francs CLP = Chilean pesos CME = CME Group CNH = Chinese yuan renminbi CNY = Chinese yuan COP = Colombian pesos CZK = Czech korunas DKK = Danish kroner EUR = Euros EURIBOR = Euro Interbank Offered Rate FRA = Forward Rate Agreement GBP = British pounds HUF = Hungarian forints IDR = Indonesian rupiah INR = Indian rupees JPY = Japanese yen |
KRW = South Korean won LIBOR = London Interbank Offered Rate MXN = Mexican pesos MYR = Malaysian ringgits NOK = Norwegian kroner NZD = New Zealand dollars PEN = Peruvian nuevos soles PLN = Polish zloty Ref. = Refunding Rev. = Revenue RON = Romanian leu RUB = Russian rubles SEK = Swedish kronor SOFR = Secured Overnight Financing Rate SONIA = Sterling Overnight Interbank Average Rate TBA = To be announced TIIE = Equilibrium Interbank Interest Rate UAH = Ukrainian hryvnia USD = U.S. dollars ZAR = South African rand |
Refer to the notes to financial statements.
| American Funds Insurance Series | 201 |
| American High-Income Trust | |
| Investment portfolio June 30, 2022 | unaudited |
| Bonds, notes & other debt instruments 90.36% | | Principal amount
(000) | | | Value
(000) | |
| Corporate bonds, notes & loans 90.27% | | | | | | |
| Energy 14.33% | | | | | | | | |
| Aethon United BR LP / Aethon United Finance Corp. 8.25% 20261 | | USD | 295 | | | $ | 287 | |
| Antero Midstream Partners LP 5.375% 20291 | | | 570 | | | | 512 | |
| Antero Resources Corp. 7.625% 20291 | | | 417 | | | | 425 | |
| Antero Resources Corp. 5.375% 20301 | | | 720 | | | | 658 | |
| Apache Corp. 6.00% 2037 | | | 165 | | | | 152 | |
| Apache Corp. 5.10% 2040 | | | 695 | | | | 589 | |
| Apache Corp. 4.75% 2043 | | | 265 | | | | 207 | |
| Ascent Resources - Utica, LLC 7.00% 20261 | | | 2,040 | | | | 1,900 | |
| Ascent Resources - Utica, LLC 9.00% 20271 | | | 170 | | | | 214 | |
| Ascent Resources - Utica, LLC 8.25% 20281 | | | 271 | | | | 258 | |
| Ascent Resources - Utica, LLC 5.875% 20291 | | | 1,205 | | | | 1,062 | |
| Ascent Resources - Utica, LLC, Term Loan, (3-month USD-LIBOR + 9.00%) 10.00% 20251,2,3 | | | 228 | | | | 241 | |
| Blue Racer Midstream, LLC and Blue Racer Finance Corp. 7.625% 20251 | | | 676 | | | | 640 | |
| Bonanza Creek Energy, Inc. 5.00% 20261 | | | 685 | | | | 616 | |
| California Resources Corp. 7.125% 20261 | | | 390 | | | | 382 | |
| Callon Petroleum Co. 7.50% 20301 | | | 515 | | | | 475 | |
| Centennial Resource Production, LLC 6.875% 20271 | | | 440 | | | | 419 | |
| Cheniere Energy Partners LP 4.50% 2029 | | | 938 | | | | 839 | |
| Cheniere Energy Partners LP 4.00% 2031 | | | 1,523 | | | | 1,299 | |
| Cheniere Energy Partners LP 3.25% 20321 | | | 1,255 | | | | 991 | |
| Cheniere Energy, Inc. 7.00% 2024 | | | 319 | | | | 331 | |
| Cheniere Energy, Inc. 5.875% 2025 | | | 495 | | | | 507 | |
| Cheniere Energy, Inc. 4.625% 2028 | | | 5,356 | | | | 4,841 | |
| Chesapeake Energy Corp. 4.875% 20224 | | | 4,300 | | | | 83 | |
| Chesapeake Energy Corp. 5.50% 20261 | | | 1,000 | | | | 954 | |
| Chesapeake Energy Corp. 5.875% 20291 | | | 1,420 | | | | 1,342 | |
| Chesapeake Energy Corp. 6.75% 20291 | | | 210 | | | | 204 | |
| CNX Midstream Partners LP 4.75% 20301 | | | 280 | | | | 236 | |
| CNX Resources Corp. 7.25% 20271 | | | 1,878 | | | | 1,843 | |
| CNX Resources Corp. 6.00% 20291 | | | 1,425 | | | | 1,334 | |
| Comstock Resources, Inc. 6.75% 20291 | | | 785 | | | | 705 | |
| Comstock Resources, Inc. 5.875% 20301 | | | 770 | | | | 664 | |
| Constellation Oil Services Holding SA 4.00% PIK or 3.00% Cash 20265 | | | 3,077 | | | | 2,569 | |
| Continental Resources, Inc. 5.75% 20311 | | | 365 | | | | 354 | |
| CQP Holdco LP / BIP-V Chinook Holdco, LLC 5.50% 20311 | | | 2,860 | | | | 2,444 | |
| Crestwood Midstream Partners LP 5.75% 2025 | | | 250 | | | | 234 | |
| Crestwood Midstream Partners LP 5.625% 20271 | | | 290 | | | | 259 | |
| Crestwood Midstream Partners LP 6.00% 20291 | | | 575 | | | | 503 | |
| Devon Energy Corp. 5.875% 2028 | | | 202 | | | | 206 | |
| Devon Energy Corp. 4.50% 2030 | | | 493 | | | | 466 | |
| Diamond Foreign Asset Co. / Diamond Finance, LLC 9.00% Cash 20271,3,5 | | | 68 | | | | 67 | |
| Diamond Foreign Asset Co. / Diamond Finance, LLC 9.00% Cash 20273,5 | | | 62 | | | | 61 | |
| DT Midstream, Inc. 4.125% 20291 | | | 1,355 | | | | 1,152 | |
| DT Midstream, Inc. 4.375% 20311 | | | 785 | | | | 660 | |
| Endeavor Energy Resources LP 6.625% 20251 | | | 850 | | | | 855 | |
| Energean Israel Finance, Ltd. 4.50% 20241 | | | 945 | | | | 892 | |
| Energean Israel Finance, Ltd. 4.875% 20261 | | | 1,080 | | | | 957 | |
| Energean PLC 6.50% 20271 | | | 380 | | | | 338 | |
| EnLink Midstream Partners, LLC 5.625% 20281 | | | 660 | | | | 607 | |
| EQM Midstream Partners, LP 4.125% 2026 | | | 127 | | | | 110 | |
| EQM Midstream Partners, LP 6.50% 20271 | | | 2,365 | | | | 2,203 | |
| EQM Midstream Partners, LP 7.50% 20271 | | | 845 | | | | 817 | |
| EQM Midstream Partners, LP 5.50% 2028 | | | 881 | | | | 762 | |
| EQM Midstream Partners, LP 4.50% 20291 | | | 835 | | | | 679 | |
| EQM Midstream Partners, LP 7.50% 20301 | | | 898 | | | | 864 | |
| EQM Midstream Partners, LP 4.75% 20311 | | | 1,645 | | | | 1,317 | |
| EQM Midstream Partners, LP 6.50% 2048 | | | 490 | | | | 375 | |
| EQT Corp. 6.625% 20256 | | | 250 | | | | 258 | |
| EQT Corp. 5.00% 2029 | | | 290 | | | | 281 | |
| EQT Corp. 7.50% 20306 | | | 300 | | | | 323 | |
| 202 | American Funds Insurance Series |
American High-Income Trust (continued)
| Bonds, notes & other debt instruments (continued) | | Principal amount
(000) | | | Value
(000) | |
| Corporate bonds, notes & loans (continued) | | | | | | |
| Energy (continued) | | | | | | | | |
| EQT Corp. 3.625% 20311 | | USD | 500 | | | $ | 433 | |
| Genesis Energy, LP 5.625% 2024 | | | 120 | | | | 113 | |
| Genesis Energy, LP 6.50% 2025 | | | 1,886 | | | | 1,742 | |
| Genesis Energy, LP 6.25% 2026 | | | 320 | | | | 286 | |
| Genesis Energy, LP 8.00% 2027 | | | 2,895 | | | | 2,570 | |
| Genesis Energy, LP 7.75% 2028 | | | 87 | | | | 75 | |
| Harbour Energy PLC 5.50% 20261 | | | 1,545 | | | | 1,391 | |
| Harvest Midstream I, LP 7.50% 20281 | | | 2,167 | | | | 2,039 | |
| Hess Midstream Operations LP 4.25% 20301 | | | 1,300 | | | | 1,091 | |
| Hess Midstream Operations LP 5.50% 20301 | | | 580 | | | | 522 | |
| Hess Midstream Partners LP 5.125% 20281 | | | 687 | | | | 618 | |
| Hilcorp Energy I, LP 6.25% 20281 | | | 145 | | | | 137 | |
| Hilcorp Energy I, LP 5.75% 20291 | | | 815 | | | | 717 | |
| Hilcorp Energy I, LP 6.00% 20301 | | | 715 | | | | 623 | |
| Hilcorp Energy I, LP 6.00% 20311 | | | 630 | | | | 544 | |
| Hilcorp Energy I, LP 6.25% 20321 | | | 535 | | | | 471 | |
| Holly Energy Partners LP / Holly Energy Finance Corp. 6.375% 20271 | | | 220 | | | | 208 | |
| Holly Energy Partners LP / Holly Energy Finance Corp. 5.00% 20281 | | | 260 | | | | 223 | |
| Howard Midstream Energy Partners, LLC 6.75% 20271 | | | 460 | | | | 397 | |
| Independence Energy Finance, LLC 7.25% 20261 | | | 500 | | | | 456 | |
| Kinetik Holdings LP 5.875% 20301 | | | 660 | | | | 630 | |
| Lealand Finance Company BV, Term Loan, (3-month USD-LIBOR + 3.00%) 4.666% 20242,3 | | | 12 | | | | 7 | |
| Lealand Finance Co. BV, Term Loan, (3-month USD-LIBOR + 1.00%) 3.00% PIK and 2.06% Cash 20252,3,5 | | | 153 | | | | 79 | |
| Murphy Oil Corp. 6.875% 2024 | | | 59 | | | | 59 | |
| Murphy Oil Corp. 5.75% 2025 | | | 250 | | | | 248 | |
| Murphy Oil Corp. 6.375% 2028 | | | 415 | | | | 388 | |
| Murphy Oil USA, Inc. 4.75% 2029 | | | 670 | | | | 604 | |
| Murphy Oil USA, Inc. 3.75% 20311 | | | 285 | | | | 243 | |
| Nabors Industries, Inc. 7.375% 20271 | | | 1,470 | | | | 1,398 | |
| Nabors Industries, Ltd. 7.25% 20261 | | | 228 | | | | 203 | |
| Neptune Energy Group Holdings, Ltd. 6.625% 20251 | | | 1,250 | | | | 1,202 | |
| New Fortress Energy, Inc. 6.75% 20251 | | | 1,715 | | | | 1,625 | |
| New Fortress Energy, Inc. 6.50% 20261 | | | 3,725 | | | | 3,381 | |
| NGL Energy Operating, LLC 7.50% 20261 | | | 8,720 | | | | 7,879 | |
| NGL Energy Partners LP 6.125% 2025 | | | 2,054 | | | | 1,562 | |
| Northern Oil and Gas, Inc. 8.125% 20281 | | | 1,815 | | | | 1,713 | |
| NorthRiver Midstream Finance LP 5.625% 20261 | | | 625 | | | | 567 | |
| NuStar Logistics LP 6.00% 2026 | | | 286 | | | | 268 | |
| Oasis Midstream Partners LP / OMP Finance Corp. 8.00% 20291 | | | 1,675 | | | | 1,559 | |
| Oasis Petroleum, Inc. 6.375% 20261 | | | 1,065 | | | | 987 | |
| Occidental Petroleum Corp. 5.875% 2025 | | | 710 | | | | 708 | |
| Occidental Petroleum Corp. 8.00% 2025 | | | 1,400 | | | | 1,476 | |
| Occidental Petroleum Corp. 6.375% 2028 | | | 225 | | | | 228 | |
| Occidental Petroleum Corp. 6.625% 2030 | | | 810 | | | | 836 | |
| Occidental Petroleum Corp. 8.875% 2030 | | | 300 | | | | 345 | |
| Occidental Petroleum Corp. 6.125% 2031 | | | 530 | | | | 538 | |
| Occidental Petroleum Corp. 4.20% 2048 | | | 165 | | | | 129 | |
| Parkland Corp. 4.625% 20301 | | | 835 | | | | 679 | |
| PDC Energy, Inc. 5.75% 2026 | | | 600 | | | | 561 | |
| Petróleos Mexicanos 6.875% 2025 | | | 350 | | | | 328 | |
| Petróleos Mexicanos 8.75% 20291 | | | 782 | | | | 709 | |
| Petrorio Luxembourg SARL 6.125% 20261 | | | 320 | | | | 295 | |
| Range Resources Corp. 4.875% 2025 | | | 362 | | | | 354 | |
| Range Resources Corp. 8.25% 2029 | | | 900 | | | | 919 | |
| Range Resources Corp. 4.75% 20301 | | | 970 | | | | 871 | |
| Rattler Midstream Partners LP 5.625% 20251 | | | 955 | | | | 956 | |
| Rockcliff Energy II, LLC 5.50% 20291 | | | 120 | | | | 109 | |
| Rockies Express Pipeline, LLC 4.95% 20291 | | | 550 | | | | 471 | |
| Sabine Pass Liquefaction, LLC 4.50% 2030 | | | 586 | | | | 562 | |
| American Funds Insurance Series | 203 |
American High-Income Trust (continued)
| Bonds, notes & other debt instruments (continued) | | Principal amount
(000) | | | Value
(000) | |
| Corporate bonds, notes & loans (continued) | | | | | | |
| Energy (continued) | | | | | | |
| Sanchez Energy Corp. 7.25% 20231,4 | | USD | 739 | | | $ | 11 | |
| SM Energy Co. 5.625% 2025 | | | 430 | | | | 407 | |
| Southwestern Energy Co. 5.95% 20256 | | | 215 | | | | 213 | |
| Southwestern Energy Co. 7.75% 2027 | | | 272 | | | | 278 | |
| Southwestern Energy Co. 8.375% 2028 | | | 565 | | | | 596 | |
| Southwestern Energy Co. 5.375% 2029 | | | 340 | | | | 316 | |
| Southwestern Energy Co. 5.375% 2030 | | | 2,470 | | | | 2,277 | |
| Southwestern Energy Co. 4.75% 2032 | | | 1,225 | | | | 1,050 | |
| Suburban Propane Partners LP / Suburban Energy Finance Corp. 5.00% 20311 | | | 335 | | | | 285 | |
| Summit Midstream Holdings / Summit Midstream Finance Corp. 8.50% 20261 | | | 285 | | | | 257 | |
| Sunoco LP 6.00% 2027 | | | 547 | | | | 522 | |
| Sunoco LP 5.875% 2028 | | | 290 | | | | 265 | |
| Sunoco LP 4.50% 2029 | | | 1,680 | | | | 1,388 | |
| Sunoco LP 4.50% 20301 | | | 1,680 | | | | 1,359 | |
| Tallgrass Energy Partners, LP 7.50% 20251 | | | 230 | | | | 223 | |
| Targa Resources Partners LP 6.50% 2027 | | | 133 | | | | 136 | |
| Targa Resources Partners LP 6.875% 2029 | | | 915 | | | | 935 | |
| Targa Resources Partners LP 5.50% 2030 | | | 802 | | | | 767 | |
| Targa Resources Partners LP 4.875% 2031 | | | 695 | | | | 635 | |
| Teekay Offshore Partners LP 8.50% 20231,7,8 | | | 2,009 | | | | 1,828 | |
| Transocean Guardian, Ltd. 5.875% 20241 | | | 288 | | | | 267 | |
| Transocean Poseidon, Ltd. 6.875% 20271 | | | 361 | | | | 318 | |
| Transocean, Inc. 6.125% 20251 | | | 195 | | | | 179 | |
| Transocean, Inc. 7.25% 20251 | | | 500 | | | | 371 | |
| Transocean, Inc. 11.50% 20271 | | | 95 | | | | 89 | |
| USA Compression Partners, LP 6.875% 2026 | | | 359 | | | | 327 | |
| USA Compression Partners, LP 6.875% 2027 | | | 247 | | | | 220 | |
| Venture Global Calcasieu Pass, LLC 4.125% 20311 | | | 2,795 | | | | 2,397 | |
| Venture Global Calcasieu Pass, LLC 3.875% 20331 | | | 650 | | | | 538 | |
| Weatherford International, Ltd. 11.00% 20241 | | | 445 | | | | 449 | |
| Weatherford International, Ltd. 6.50% 20281 | | | 2,130 | | | | 1,915 | |
| Weatherford International, Ltd. 8.625% 20301 | | | 3,220 | | | | 2,678 | |
| Western Gas Partners LP 4.50% 2028 | | | 1,124 | | | | 1,019 | |
| Western Midstream Operating, LP 3.60% 2025 (3.35% on 8/1/2022)6 | | | 369 | | | | 341 | |
| Western Midstream Operating, LP 4.75% 2028 | | | 160 | | | | 146 | |
| Western Midstream Operating, LP 4.55% 2030 (4.30% on 8/1/2022)6 | | | 480 | | | | 417 | |
| Western Midstream Operating, LP 5.75% 2050 (5.50% on 8/1/2022)6 | | | 290 | | | | 234 | |
| | | | | | | | 121,808 | |
| | | | | | | | | |
| Consumer Discretionary 13.79% | | | | | | | | |
| Adient Global Holdings, Ltd. 4.875% 20261 | | | 225 | | | | 198 | |
| Affinity Gaming 6.875% 20271 | | | 200 | | | | 168 | |
| Allied Universal Holdco, LLC 6.625% 20261 | | | 858 | | | | 789 | |
| Allied Universal Holdco, LLC 9.75% 20271 | | | 976 | | | | 829 | |
| Allied Universal Holdco, LLC 4.625% 20281 | | | 490 | | | | 406 | |
| Allied Universal Holdco, LLC 6.00% 20291 | | | 2,790 | | | | 2,034 | |
| Asbury Automotive Group, Inc. 4.50% 2028 | | | 250 | | | | 217 | |
| Asbury Automotive Group, Inc. 4.625% 20291 | | | 1,545 | | | | 1,279 | |
| Asbury Automotive Group, Inc. 5.00% 20321 | | | 355 | | | | 291 | |
| Atlas LuxCo 4 SARL 4.625% 20281 | | | 280 | | | | 227 | |
| Beazer Homes USA, Inc. 5.875% 2027 | | | 540 | | | | 416 | |
| Boyd Gaming Corp. 4.75% 2027 | | | 621 | | | | 563 | |
| Boyd Gaming Corp. 4.75% 20311 | | | 695 | | | | 589 | |
| Boyne USA, Inc. 4.75% 20291 | | | 880 | | | | 763 | |
| Caesars Entertainment, Inc. 6.25% 20251 | | | 1,085 | | | | 1,049 | |
| Caesars Entertainment, Inc. 8.125% 20271 | | | 665 | | | | 644 | |
| Caesars Entertainment, Inc. 4.625% 20291 | | | 3,330 | | | | 2,598 | |
| Caesars Resort Collection, LLC 5.75% 20251 | | | 345 | | | | 331 | |
| Carnival Corp. 7.625% 20261 | | | 1,615 | | | | 1,255 | |
| Carnival Corp. 10.50% 20261 | | | 1,405 | | | | 1,401 | |
| 204 | American Funds Insurance Series |
American High-Income Trust (continued)
| Bonds, notes & other debt instruments (continued) | | Principal amount
(000) | | | Value
(000) | |
| Corporate bonds, notes & loans (continued) | | | | | | |
| Consumer discretionary (continued) | | | | | | |
| Carnival Corp. 4.00% 20281 | | USD | 3,000 | | | $ | 2,471 | |
| Carnival Corp. 6.00% 20291 | | | 825 | | | | 582 | |
| Carnival Corp. 10.50% 20301 | | | 850 | | | | 701 | |
| Carvana Co. 5.625% 20251 | | | 485 | | | | 373 | |
| Carvana Co. 5.50% 20271 | | | 1,091 | | | | 706 | |
| Carvana Co. 5.875% 20281 | | | 904 | | | | 575 | |
| Carvana Co. 4.875% 20291 | | | 1,110 | | | | 633 | |
| CDI Escrow Issuer, Inc. 5.75% 20301 | | | 805 | | | | 734 | |
| CEC Entertainment, Inc. 6.75% 20261 | | | 320 | | | | 282 | |
| Dana, Inc. 4.25% 2030 | | | 200 | | | | 156 | |
| Dana, Inc. 4.50% 2032 | | | 375 | | | | 278 | |
| Dave & Buster’s, Inc. 7.625% 20251 | | | 340 | | | | 336 | |
| Empire Communities Corp. 7.00% 20251 | | | 475 | | | | 376 | |
| Empire Resorts, Inc. 7.75% 20261 | | | 670 | | | | 601 | |
| Everi Holdings, Inc. 5.00% 20291 | | | 95 | | | | 80 | |
| Fertitta Entertainment, Inc. 4.625% 20291 | | | 1,260 | | | | 1,078 | |
| Fertitta Entertainment, Inc. 6.75% 20301 | | | 4,100 | | | | 3,159 | |
| First Student Bidco, Inc. / First Transit Parent, Inc. 4.00% 20291 | | | 2,135 | | | | 1,712 | |
| Ford Motor Co. 2.90% 2029 | | | 225 | | | | 177 | |
| Ford Motor Co. 3.25% 2032 | | | 310 | | | | 233 | |
| Ford Motor Co. 5.291% 2046 | | | 70 | | | | 54 | |
| Ford Motor Credit Company, LLC 3.375% 2025 | | | 1,115 | | | | 1,008 | |
| Ford Motor Credit Company, LLC 5.125% 2025 | | | 3,835 | | | | 3,670 | |
| Ford Motor Credit Company, LLC 2.70% 2026 | | | 750 | | | | 640 | |
| Ford Motor Credit Company, LLC 4.542% 2026 | | | 1,460 | | | | 1,339 | |
| Ford Motor Credit Company, LLC 3.815% 2027 | | | 1,540 | | | | 1,312 | |
| Ford Motor Credit Company, LLC 4.125% 2027 | | | 835 | | | | 738 | |
| Ford Motor Credit Company, LLC 4.271% 2027 | | | 525 | | | | 472 | |
| Ford Motor Credit Company, LLC 4.95% 2027 | | | 370 | | | | 345 | |
| Ford Motor Credit Company, LLC 2.90% 2028 | | | 550 | | | | 444 | |
| Ford Motor Credit Company, LLC 5.113% 2029 | | | 200 | | | | 180 | |
| Ford Motor Credit Company, LLC 4.00% 2030 | | | 920 | | | | 747 | |
| Group 1 Automotive, Inc. 4.00% 20281 | | | 615 | | | | 515 | |
| Hanesbrands, Inc. 4.625% 20241 | | | 1,945 | | | | 1,907 | |
| Hanesbrands, Inc. 4.875% 20261 | | | 1,624 | | | | 1,507 | |
| Hilton Grand Vacations Borrower 5.00% 20291 | | | 591 | | | | 480 | |
| Hilton Worldwide Holdings, Inc. 3.75% 20291 | | | 200 | | | | 170 | |
| Hilton Worldwide Holdings, Inc. 4.875% 2030 | | | 608 | | | | 551 | |
| Hilton Worldwide Holdings, Inc. 4.00% 20311 | | | 1,010 | | | | 842 | |
| International Game Technology PLC 6.50% 20251 | | | 1,383 | | | | 1,379 | |
| International Game Technology PLC 4.125% 20261 | | | 1,165 | | | | 1,057 | |
| International Game Technology PLC 5.25% 20291 | | | 3,570 | | | | 3,240 | |
| Jacobs Entertainment, Inc. 6.75% 20291 | | | 505 | | | | 428 | |
| KB Home 6.875% 2027 | | | 330 | | | | 319 | |
| KB Home 7.25% 2030 | | | 330 | | | | 313 | |
| Kontoor Brands, Inc. 4.125% 20291 | | | 370 | | | | 294 | |
| Las Vegas Sands Corp. 3.20% 2024 | | | 635 | | | | 601 | |
| LCM Investments Holdings II, LLC 4.875% 20291 | | | 1,185 | | | | 905 | |
| Levi Strauss & Co. 3.50% 20311 | | | 430 | | | | 352 | |
| Limited Brands, Inc. 6.625% 20301 | | | 370 | | | | 321 | |
| Limited Brands, Inc. 6.875% 2035 | | | 1,096 | | | | 894 | |
| Limited Brands, Inc. 6.75% 2036 | | | 655 | | | | 525 | |
| Lindblad Expeditions, LLC 6.75% 20271 | | | 205 | | | | 176 | |
| Lithia Motors, Inc. 4.625% 20271 | | | 270 | | | | 248 | |
| Lithia Motors, Inc. 3.875% 20291 | | | 350 | | | | 298 | |
| Lithia Motors, Inc. 4.375% 20311 | | | 315 | | | | 269 | |
| LSF9 Atlantis Holdings, LLC / Victra Finance Corp. 7.75% 20261 | | | 335 | | | | 284 | |
| M.D.C. Holdings, Inc. 6.00% 2043 | | | 573 | | | | 469 | |
| Macy’s Retail Holdings, LLC 5.875% 20301 | | | 145 | | | | 122 | |
| Marriott Ownership Resorts, Inc. 4.50% 20291 | | | 370 | | | | 308 | |
| Melco International Development, Ltd. 4.875% 20251 | | | 440 | | | | 329 | |
| American Funds Insurance Series | 205 |
American High-Income Trust (continued)
| Bonds, notes & other debt instruments (continued) | | Principal amount
(000) | | | Value
(000) | |
| Corporate bonds, notes & loans (continued) | | | | | | |
| Consumer discretionary (continued) | | | | | | |
| Melco International Development, Ltd. 5.75% 20281 | | USD | 1,390 | | | $ | 897 | |
| Melco International Development, Ltd. 5.375% 20291 | | | 1,446 | | | | 875 | |
| Melco Resorts Finance, Ltd. 5.25% 20261 | | | 300 | | | | 212 | |
| Merlin Entertainment 5.75% 20261 | | | 492 | | | | 450 | |
| MGM Resorts International 6.00% 2023 | | | 281 | | | | 281 | |
| MGM Resorts International 5.50% 2027 | | | 401 | | | | 360 | |
| Midwest Gaming Borrower, LLC 4.875% 20291 | | | 180 | | | | 147 | |
| Mohegan Gaming & Entertainment 8.00% 20261 | | | 645 | | | | 550 | |
| Motel 6 Operating LP, Term Loan B, (1-month USD-LIBOR + 5.00%) 6.666% 20262,3 | | | 561 | | | | 552 | |
| NCL Corp., Ltd. 3.625% 20241 | | | 300 | | | | 250 | |
| NCL Corp., Ltd. 5.875% 20261 | | | 825 | | | | 650 | |
| NCL Corp., Ltd. 5.875% 20271 | | | 1,230 | | | | 1,054 | |
| NCL Corp., Ltd. 7.75% 20291 | | | 360 | | | | 276 | |
| Neiman Marcus Group, LLC 7.125% 20261 | | | 2,405 | | | | 2,224 | |
| Newell Brands, Inc. 5.625% 20366 | | | 30 | | | | 26 | |
| Newell Rubbermaid, Inc. 4.875% 2025 | | | 445 | | | | 439 | |
| Panther BF Aggregator 2, LP 6.25% 20261 | | | 140 | | | | 135 | |
| Panther BF Aggregator 2, LP 8.50% 20271 | | | 455 | | | | 441 | |
| Party City Holdings, Inc. 6.625% 20261 | | | 500 | | | | 295 | |
| Party City Holdings, Inc. 8.75% 20261 | | | 3,655 | | | | 2,463 | |
| Penske Automotive Group, Inc. 3.75% 2029 | | | 340 | | | | 284 | |
| PetSmart, Inc. 4.75% 20281 | | | 710 | | | | 616 | |
| PetSmart, Inc. 7.75% 20291 | | | 1,190 | | | | 1,074 | |
| Premier Entertainment Sub, LLC 5.625% 20291 | | | 1,545 | | | | 1,102 | |
| Premier Entertainment Sub, LLC 5.875% 20311 | | | 835 | | | | 581 | |
| QVC, Inc. 4.85% 2024 | | | 75 | | | | 70 | |
| QVC, Inc. 4.75% 2027 | | | 52 | | | | 41 | |
| QVC, Inc. 4.375% 2028 | | | 601 | | | | 446 | |
| Raptor Acquisition Corp. 4.875% 20261 | | | 1,630 | | | | 1,429 | |
| Real Hero Merger Sub 2, Inc. 6.25% 20291 | | | 590 | | | | 448 | |
| Royal Caribbean Cruises, Ltd. 10.875% 20231 | | | 325 | | | | 327 | |
| Royal Caribbean Cruises, Ltd. 11.50% 20251 | | | 1,946 | | | | 2,004 | |
| Royal Caribbean Cruises, Ltd. 4.25% 20261 | | | 1,820 | | | | 1,296 | |
| Royal Caribbean Cruises, Ltd. 5.50% 20261 | | | 715 | | | | 533 | |
| Royal Caribbean Cruises, Ltd. 5.375% 20271 | | | 1,035 | | | | 755 | |
| Royal Caribbean Cruises, Ltd. 3.70% 2028 | | | 270 | | | | 172 | |
| Royal Caribbean Cruises, Ltd. 5.50% 20281 | | | 70 | | | | 49 | |
| Sally Holdings, LLC and Sally Capital, Inc. 5.625% 2025 | | | 280 | | | | 263 | |
| Scientific Games Corp. 8.625% 20251 | | | 1,215 | | | | 1,247 | |
| Scientific Games Corp. 7.00% 20281 | | | 1,525 | | | | 1,433 | |
| Scientific Games Corp. 7.25% 20291 | | | 3,090 | | | | 2,902 | |
| Scientific Games Holdings LP 6.625% 20301 | | | 2,305 | | | | 1,963 | |
| Sonic Automotive, Inc. 4.625% 20291 | | | 1,565 | | | | 1,215 | |
| Sonic Automotive, Inc. 4.875% 20311 | | | 2,180 | | | | 1,643 | |
| Staples, Inc. 7.50% 20261 | | | 421 | | | | 350 | |
| Studio City Co., Ltd. 7.00% 20271 | | | 1,175 | | | | 1,020 | |
| Studio City Finance, Ltd. 6.00% 20251 | | | 690 | | | | 438 | |
| Studio City Finance, Ltd. 5.00% 20291 | | | 1,200 | | | | 621 | |
| Tempur Sealy International, Inc. 4.00% 20291 | | | 630 | | | | 509 | |
| The Gap, Inc. 3.625% 20291 | | | 170 | | | | 120 | |
| The Gap, Inc. 3.875% 20311 | | | 108 | | | | 76 | |
| The Home Co., Inc. 7.25% 20251 | | | 940 | | | | 770 | |
| Travel + Leisure Co. 6.60% 20256 | | | 50 | | | | 49 | |
| Travel + Leisure Co. 6.00% 2027 | | | 205 | | | | 186 | |
| Travel + Leisure Co. 4.50% 20291 | | | 1,280 | | | | 992 | |
| Universal Entertainment Corp. 8.50% 20241 | | | 2,945 | | | | 2,857 | |
| Vail Resorts, Inc. 6.25% 20251 | | | 315 | | | | 315 | |
| VICI Properties LP 4.25% 20261 | | | 462 | | | | 423 | |
| VICI Properties LP 4.625% 20291 | | | 265 | | | | 237 | |
| VICI Properties LP / VICI Note Co., Inc. 5.625% 20241 | | | 447 | | | | 442 | |
| VICI Properties LP / VICI Note Co., Inc. 3.50% 20251 | | | 711 | | | | 666 | |
| 206 | American Funds Insurance Series |
American High-Income Trust (continued)
| Bonds, notes & other debt instruments (continued) | | Principal amount
(000) | | | Value
(000) | |
| Corporate bonds, notes & loans (continued) | | | | | | | | |
| Consumer discretionary (continued) | | | | | | | | |
| VICI Properties LP / VICI Note Co., Inc. 4.625% 20251 | | USD | 900 | | | $ | 858 | |
| VICI Properties LP / VICI Note Co., Inc. 3.75% 20271 | | | 644 | | | | 568 | |
| VICI Properties LP / VICI Note Co., Inc. 3.875% 20291 | | | 1,400 | | | | 1,207 | |
| VICI Properties LP / VICI Note Co., Inc. 4.125% 20301 | | | 873 | | | | 755 | |
| WASH Multifamily Acquisition, Inc. 5.75% 20261 | | | 995 | | | | 940 | |
| Wheel Pros, Inc. 6.50% 20291 | | | 1,280 | | | | 906 | |
| Wheel Pros, Inc., Term Loan, (3-month USD-LIBOR + 4.50%) 6.095% 20282,3 | | | 953 | | | | 791 | |
| Wyndham Destinations, Inc. 6.625% 20261 | | | 695 | | | | 660 | |
| Wyndham Destinations, Inc. 4.625% 20301 | | | 400 | | | | 311 | |
| Wyndham Worldwide Corp. 4.375% 20281 | | | 1,280 | | | | 1,121 | |
| Wynn Las Vegas, LLC and Wynn Capital Corp. 4.25% 20231 | | | 861 | | | | 828 | |
| Wynn Macau, Ltd. 5.125% 20291 | | | 320 | | | | 199 | |
| Wynn Resorts Finance, LLC 7.75% 20251 | | | 494 | | | | 481 | |
| Wynn Resorts Finance, LLC 5.125% 20291 | | | 1,002 | | | | 791 | |
| Yahoo Holdings, Inc., Term Loan B, (1-month USD-LIBOR + 5.50%) 7.166% 20272,3 | | | 995 | | | | 940 | |
| | | | | | | | 117,239 | |
| | | | | | | | | |
| Communication services 12.01% | | | | | | | | |
| Altice France Holding SA 10.50% 20271 | | | 1,650 | | | | 1,388 | |
| Altice France SA 5.125% 20291 | | | 1,677 | | | | 1,271 | |
| Beasley Mezzanine Holdings, LLC 8.625% 20261 | | | 475 | | | | 357 | |
| Brightstar Escrow Corp. 9.75% 20251 | | | 140 | | | | 133 | |
| Cablevision Systems Corp. 5.375% 20281 | | | 457 | | | | 396 | |
| CCO Holdings, LLC and CCO Holdings Capital Corp. 5.50% 20261 | | | 102 | | | | 100 | |
| CCO Holdings, LLC and CCO Holdings Capital Corp. 5.00% 20281 | | | 386 | | | | 358 | |
| CCO Holdings, LLC and CCO Holdings Capital Corp. 5.375% 20291 | | | 360 | | | | 323 | |
| CCO Holdings, LLC and CCO Holdings Capital Corp. 4.50% 20301 | | | 3,179 | | | | 2,650 | |
| CCO Holdings, LLC and CCO Holdings Capital Corp. 4.75% 20301 | | | 3,437 | | | | 2,950 | |
| CCO Holdings, LLC and CCO Holdings Capital Corp. 2.80% 2031 | | | 140 | | | | 112 | |
| CCO Holdings, LLC and CCO Holdings Capital Corp. 4.25% 20311 | | | 3,285 | | | | 2,686 | |
| CCO Holdings, LLC and CCO Holdings Capital Corp. 4.50% 2032 | | | 1,024 | | | | 833 | |
| CCO Holdings, LLC and CCO Holdings Capital Corp. 4.75% 20321 | | | 1,225 | | | | 1,006 | |
| CCO Holdings, LLC and CCO Holdings Capital Corp. 4.50% 20331 | | | 1,230 | | | | 972 | |
| CCO Holdings, LLC and CCO Holdings Capital Corp. 4.25% 20341 | | | 1,960 | | | | 1,521 | |
| Centerfield Media Parent, Inc. 6.625% 20261 | | | 960 | | | | 776 | |
| CenturyLink, Inc. 6.75% 2023 | | | 1,480 | | | | 1,469 | |
| Cinemark USA, Inc. 5.875% 20261 | | | 378 | | | | 338 | |
| Clear Channel Worldwide Holdings, Inc. 7.75% 20281 | | | 570 | | | | 416 | |
| Clear Channel Worldwide Holdings, Inc. 7.50% 20291 | | | 315 | | | | 227 | |
| Cogent Communications Group, Inc. 3.50% 20261 | | | 700 | | | | 645 | |
| Consolidated Communications, Inc. 5.00% 20281 | | | 225 | | | | 180 | |
| CSC Holdings, LLC 6.50% 20291 | | | 600 | | | | 543 | |
| CSC Holdings, LLC 3.375% 20311 | | | 700 | | | | 520 | |
| Diamond Sports Group, LLC 5.375% 20261 | | | 503 | | | | 126 | |
| Diamond Sports Group, LLC 6.625% 20271 | | | 1,056 | | | | 132 | |
| DIRECTV Financing, LLC, Term Loan, (3-month USD-LIBOR + 5.00%) 6.666% 20272,3 | | | 1,739 | | | | 1,608 | |
| DIRECTV Holdings, LLC and DIRECTV Financing Co., Inc. 5.875% 20271 | | | 3,010 | | | | 2,577 | |
| DISH DBS Corp. 5.125% 2029 | | | 570 | | | | 348 | |
| Embarq Corp. 7.995% 2036 | | | 1,637 | | | | 1,233 | |
| Epicor Software Corp., Term Loan, (3-month USD-LIBOR + 7.75%) 9.416% 20282,3 | | | 465 | | | | 454 | |
| Front Range BidCo, Inc. 6.125% 20281 | | | 839 | | | | 608 | |
| Frontier Communications Corp. 5.875% 20271 | | | 1,550 | | | | 1,398 | |
| Frontier Communications Corp. 5.00% 20281 | | | 3,780 | | | | 3,222 | |
| Frontier Communications Corp. 6.75% 20291 | | | 1,990 | | | | 1,642 | |
| Frontier Communications Holdings, LLC 5.875% 2029 | | | 1,390 | | | | 1,072 | |
| Frontier Communications Holdings, LLC 6.00% 20301 | | | 750 | | | | 579 | |
| Frontier Communications Holdings, LLC 8.75% 20301 | | | 900 | | | | 912 | |
| Gray Escrow II, Inc. 5.375% 20311 | | | 925 | | | | 743 | |
| Gray Television, Inc. 5.875% 20261 | | | 203 | | | | 190 | |
| Gray Television, Inc. 7.00% 20271 | | | 828 | | | | 798 | |
| American Funds Insurance Series | 207 |
American High-Income Trust (continued)
| Bonds, notes & other debt instruments (continued) | | Principal amount
(000) | | | Value
(000) | |
| Corporate bonds, notes & loans (continued) | | | | | | |
| Communication services (continued) | | | | | | | | |
| Gray Television, Inc. 4.75% 20301 | | USD | 397 | | | $ | 311 | |
| iHeartCommunications, Inc. 5.25% 20271 | | | 1,995 | | | | 1,710 | |
| iHeartCommunications, Inc. 4.75% 20281 | | | 250 | | | | 206 | |
| Iliad Holding SAS 6.50% 20261 | | | 1,120 | | | | 1,010 | |
| Inmarsat PLC 6.75% 20261 | | | 725 | | | | 654 | |
| Kantar Group, LLC, Term Loan B2, (3-month USD-LIBOR + 4.50%) 6.75% 20262,3 | | | 387 | | | | 360 | |
| Lamar Media Corp. 3.75% 2028 | | | 61 | | | | 54 | |
| Lamar Media Corp. 4.875% 2029 | | | 300 | | | | 271 | |
| Lamar Media Corp. 4.00% 2030 | | | 260 | | | | 219 | |
| Lamar Media Corp. 3.625% 2031 | | | 125 | | | | 103 | |
| Level 3 Financing, Inc. 3.75% 20291 | | | 550 | | | | 426 | |
| Ligado Networks, LLC 15.50% PIK 20231,5 | | | 1,727 | | | | 941 | |
| Ligado Networks, LLC 17.50% PIK 20241,5 | | | 290 | | | | 94 | |
| Live Nation Entertainment, Inc. 3.75% 20281 | | | 425 | | | | 368 | |
| Magallanes, Inc. 4.279% 20321 | | | 298 | | | | 267 | |
| Match Group, Inc. 4.625% 20281 | | | 308 | | | | 280 | |
| Mav Acquisition Corp. 5.75% 20281 | | | 520 | | | | 446 | |
| Midas OpCo Holdings, LLC 5.625% 20291 | | | 3,060 | | | | 2,467 | |
| Netflix, Inc. 4.875% 2028 | | | 310 | | | | 292 | |
| News Corp. 3.875% 20291 | | | 1,620 | | | | 1,403 | |
| News Corp. 5.125% 20321 | | | 1,760 | | | | 1,562 | |
| Nexstar Broadcasting, Inc. 4.75% 20281 | | | 2,270 | | | | 1,951 | |
| Nexstar Escrow Corp. 5.625% 20271 | | | 789 | | | | 722 | |
| Nielsen Finance, LLC and Nielsen Finance Co. 4.50% 20291 | | | 49 | | | | 44 | |
| Qwest Capital Funding, Inc. 6.875% 2028 | | | 860 | | | | 767 | |
| Scripps Escrow II, Inc. 3.875% 20291 | | | 750 | | | | 630 | |
| Sinclair Television Group, Inc. 5.125% 20271 | | | 195 | | | | 165 | |
| Sinclair Television Group, Inc. 4.125% 20301 | | | 1,170 | | | | 930 | |
| Sirius XM Radio, Inc. 3.125% 20261 | | | 1,600 | | | | 1,432 | |
| Sirius XM Radio, Inc. 4.00% 20281 | | | 2,385 | | | | 2,072 | |
| Sirius XM Radio, Inc. 4.125% 20301 | | | 445 | | | | 373 | |
| Sirius XM Radio, Inc. 3.875% 20311 | | | 2,590 | | | | 2,067 | |
| Sprint Corp. 7.625% 2026 | | | 950 | | | | 1,003 | |
| Sprint Corp. 6.875% 2028 | | | 6,606 | | | | 6,966 | |
| Sprint Corp. 8.75% 2032 | | | 4,601 | | | | 5,552 | |
| Summer (BC) BidCo B, LLC 5.50% 20261 | | | 365 | | | | 327 | |
| TEGNA, Inc. 4.625% 2028 | | | 478 | | | | 448 | |
| TEGNA, Inc. 5.00% 2029 | | | 686 | | | | 651 | |
| T-Mobile US, Inc. 2.625% 2026 | | | 1,000 | | | | 909 | |
| T-Mobile US, Inc. 3.375% 2029 | | | 1,550 | | | | 1,361 | |
| T-Mobile US, Inc. 2.875% 2031 | | | 460 | | | | 383 | |
| Twitter, Inc. 5.00% 20301 | | | 1,240 | | | | 1,178 | |
| Univision Communications, Inc. 5.125% 20251 | | | 3,195 | | | | 3,013 | |
| Univision Communications, Inc. 6.625% 20271 | | | 3,050 | | | | 2,910 | |
| Univision Communications, Inc. 4.50% 20291 | | | 4,500 | | | | 3,781 | |
| Univision Communications, Inc. 7.375% 20301 | | | 500 | | | | 489 | |
| Univision Communications, Inc., Term Loan, (3-month USD CME Term + 4.50%) 6.25% 20292,3 | | | 150 | | | | 144 | |
| UPC Broadband Finco BV 4.875% 20311 | | | 650 | | | | 532 | |
| Virgin Media O2 4.25% 20311 | | | 1,975 | | | | 1,593 | |
| Virgin Media Secured Finance PLC 4.50% 20301 | | | 990 | | | | 816 | |
| VMED O2 UK Financing I PLC 4.75% 20311 | | | 200 | | | | 162 | |
| VZ Secured Financing BV 5.00% 20321 | | | 1,860 | | | | 1,548 | |
| Warner Music Group 3.75% 20291 | | | 1,350 | | | | 1,130 | |
| Warner Music Group 3.875% 20301 | | | 780 | | | | 650 | |
| Ziggo Bond Co. BV 5.125% 20301 | | | 419 | | | | 329 | |
| Ziggo Bond Finance BV 4.875% 20301 | | | 1,550 | | | | 1,318 | |
| ZipRecruiter, Inc. 5.00% 20301 | | | 530 | | | | 446 | |
| | | | | | | | 102,048 | |
| 208 | American Funds Insurance Series |
American High-Income Trust (continued)
| Bonds, notes & other debt instruments (continued) | | Principal amount
(000) | | | Value
(000) | |
| Corporate bonds, notes & loans (continued) | | | | | | |
| Health care 9.80% | | | | | | | | |
| AdaptHealth, LLC 5.125% 20301 | | USD | 875 | | | $ | 739 | |
| Avantor Funding, Inc. 4.625% 20281 | | | 2,040 | | | | 1,875 | |
| Avantor Funding, Inc. 3.875% 20291 | | | 500 | | | | 438 | |
| Bausch Health Americas, Inc. 9.25% 20261 | | | 1,334 | | | | 957 | |
| Bausch Health Americas, Inc. 8.50% 20271 | | | 252 | | | | 177 | |
| Bausch Health Companies, Inc. 5.75% 20271 | | | 735 | | | | 610 | |
| Bausch Health Companies, Inc. 6.125% 20271 | | | 880 | | | | 750 | |
| Bausch Health Companies, Inc. 4.875% 20281 | | | 1,940 | | | | 1,522 | |
| Bausch Health Companies, Inc. 5.00% 20281 | | | 1,297 | | | | 694 | |
| Bausch Health Companies, Inc. 7.00% 20281 | | | 553 | | | | 317 | |
| Bausch Health Companies, Inc. 5.00% 20291 | | | 765 | | | | 400 | |
| Bausch Health Companies, Inc. 5.25% 20301 | | | 752 | | | | 391 | |
| Bausch Health Companies, Inc. 5.25% 20311 | | | 2,955 | | | | 1,521 | |
| Catalent Pharma Solutions, Inc. 3.125% 20291 | | | 285 | | | | 234 | |
| Catalent Pharma Solutions, Inc. 3.50% 20301 | | | 720 | | | | 588 | |
| Centene Corp. 4.25% 2027 | | | 389 | | | | 364 | |
| Centene Corp. 2.45% 2028 | | | 3,240 | | | | 2,711 | |
| Centene Corp. 4.625% 2029 | | | 4,305 | | | | 4,027 | |
| Centene Corp. 3.00% 2030 | | | 2,530 | | | | 2,103 | |
| Centene Corp. 3.375% 2030 | | | 642 | | | | 546 | |
| Centene Corp. 2.50% 2031 | | | 1,485 | | | | 1,183 | |
| Centene Corp. 2.625% 2031 | | | 430 | | | | 343 | |
| Charles River Laboratories International, Inc. 4.25% 20281 | | | 561 | | | | 505 | |
| Charles River Laboratories International, Inc. 3.75% 20291 | | | 680 | | | | 591 | |
| Charles River Laboratories International, Inc. 4.00% 20311 | | | 650 | | | | 555 | |
| Community Health Systems, Inc. 5.625% 20271 | | | 1,550 | | | | 1,316 | |
| Community Health Systems, Inc. 6.00% 20291 | | | 653 | | | | 542 | |
| Community Health Systems, Inc. 6.875% 20291 | | | 240 | | | | 156 | |
| Community Health Systems, Inc. 5.25% 20301 | | | 1,305 | | | | 994 | |
| DaVita, Inc. 4.625% 20301 | | | 800 | | | | 626 | |
| Encompass Health Corp. 4.50% 2028 | | | 496 | | | | 426 | |
| Encompass Health Corp. 4.75% 2030 | | | 285 | | | | 239 | |
| Endo DAC / Endo Finance, LLC / Endo Finco 9.50% 20271 | | | 311 | | | | 65 | |
| Endo DAC / Endo Finance, LLC / Endo Finco 6.00% 20281 | | | 2,613 | | | | 209 | |
| Endo International PLC 5.875% 20241 | | | 520 | | | | 398 | |
| Endo Luxembourg Finance Co. I SARL / Endo U.S., Inc. 6.125% 20291 | | | 660 | | | | 500 | |
| Grifols Escrow Issuer SA 4.75% 20281 | | | 630 | | | | 547 | |
| HCA, Inc. 5.875% 2026 | | | 321 | | | | 323 | |
| HCA, Inc. 5.625% 2028 | | | 1,300 | | | | 1,281 | |
| HCA, Inc. 5.875% 2029 | | | 255 | | | | 256 | |
| HCA, Inc. 3.50% 2030 | | | 1,255 | | | | 1,071 | |
| HCA, Inc. 5.50% 2047 | | | 33 | | | | 30 | |
| HCA, Inc. 5.25% 2049 | | | 475 | | | | 410 | |
| HCA, Inc. 4.625% 20521 | | | 233 | | | | 187 | |
| HCA, Inc. 7.50% 2095 | | | 250 | | | | 256 | |
| HealthEquity, Inc. 4.50% 20291 | | | 730 | | | | 640 | |
| IMS Health Holdings, Inc. 5.00% 20261 | | | 823 | | | | 786 | |
| Jazz Securities DAC 4.375% 20291 | | | 1,476 | | | | 1,316 | |
| Mallinckrodt PLC 10.00% 20251 | | | 1,144 | | | | 1,104 | |
| Minerva Merger Sub, Inc. 6.50% 20301 | | | 640 | | | | 534 | |
| Molina Healthcare, Inc. 4.375% 20281 | | | 1,135 | | | | 1,016 | |
| Molina Healthcare, Inc. 3.875% 20301 | | | 2,309 | | | | 1,977 | |
| Molina Healthcare, Inc. 3.875% 20321 | | | 2,115 | | | | 1,778 | |
| Mozart Debt Merger Sub, Inc. 3.875% 20291 | | | 220 | | | | 188 | |
| Mozart Debt Merger Sub, Inc. 5.25% 20291 | | | 1,705 | | | | 1,406 | |
| Option Care Health, Inc. 4.375% 20291 | | | 290 | | | | 249 | |
| Organon Finance 1, LLC 4.125% 20281 | | | 535 | | | | 475 | |
| Organon Finance 1, LLC 5.125% 20311 | | | 240 | | | | 208 | |
| Owens & Minor, Inc. 4.375% 2024 | | | 1,185 | | | | 1,160 | |
| Owens & Minor, Inc. 4.50% 20291 | | | 990 | | | | 810 | |
| Owens & Minor, Inc. 6.625% 20301 | | | 1,075 | | | | 983 | |
| American Funds Insurance Series | 209 |
American High-Income Trust (continued)
| Bonds, notes & other debt instruments (continued) | | Principal amount
(000) | | | Value
(000) | |
| Corporate bonds, notes & loans (continued) | | | | | | |
| Health care (continued) | | | | | | | | |
| Par Pharmaceutical, Inc. 7.50% 20271 | | USD | 4,505 | | | $ | 3,438 | |
| Radiology Partners, Inc. 9.25% 20281 | | | 1,503 | | | | 1,131 | |
| RP Escrow Issuer, LLC 5.25% 20251 | | | 1,015 | | | | 879 | |
| Select Medical Holdings Corp. 6.25% 20261 | | | 554 | | | | 518 | |
| Surgery Center Holdings 10.00% 20271 | | | 416 | | | | 404 | |
| Syneos Health, Inc. 3.625% 20291 | | | 530 | | | | 449 | |
| Team Health Holdings, Inc. 6.375% 20251 | | | 704 | | | | 493 | |
| Team Health Holdings, Inc., Term Loan B, (3-month USD CME Term SOFR + 5.25%) 6.775% 20272,3 | | | 277 | | | | 235 | |
| Tenet Healthcare Corp. 4.625% 2024 | | | 130 | | | | 125 | |
| Tenet Healthcare Corp. 4.875% 20261 | | | 5,130 | | | | 4,737 | |
| Tenet Healthcare Corp. 5.125% 20271 | | | 710 | | | | 640 | |
| Tenet Healthcare Corp. 6.25% 20271 | | | 500 | | | | 461 | |
| Tenet Healthcare Corp. 4.625% 20281 | | | 890 | | | | 776 | |
| Tenet Healthcare Corp. 6.125% 20281 | | | 640 | | | | 550 | |
| Tenet Healthcare Corp. 4.25% 20291 | | | 990 | | | | 837 | |
| Tenet Healthcare Corp. 4.375% 20301 | | | 1,450 | | | | 1,230 | |
| Tenet Healthcare Corp. 6.125% 20301 | | | 610 | | | | 565 | |
| Tenet Healthcare Corp. 6.875% 2031 | | | 100 | | | | 89 | |
| Teva Pharmaceutical Finance Co. BV 6.00% 2024 | | | 3,379 | | | | 3,337 | |
| Teva Pharmaceutical Finance Co. BV 7.125% 2025 | | | 2,209 | | | | 2,159 | |
| Teva Pharmaceutical Finance Co. BV 3.15% 2026 | | | 2,514 | | | | 2,070 | |
| Teva Pharmaceutical Finance Co. BV 4.75% 2027 | | | 570 | | | | 488 | |
| Teva Pharmaceutical Finance Co. BV 6.75% 2028 | | | 2,238 | | | | 2,090 | |
| Teva Pharmaceutical Finance Co. BV 5.125% 2029 | | | 6,555 | | | | 5,417 | |
| Teva Pharmaceutical Finance Co. BV 4.10% 2046 | | | 212 | | | | 133 | |
| Valeant Pharmaceuticals International, Inc. 9.00% 20251 | | | 1,971 | | | | 1,462 | |
| | | | | | | | 83,316 | |
| | | | | | | | | |
| Materials 9.47% | | | | | | | | |
| Alcoa Nederland Holding BV 5.50% 20271 | | | 510 | | | | 484 | |
| Alcoa Nederland Holding BV 4.125% 20291 | | | 430 | | | | 385 | |
| Allegheny Technologies, Inc. 5.875% 2027 | | | 200 | | | | 177 | |
| Allegheny Technologies, Inc. 4.875% 2029 | | | 1,975 | | | | 1,578 | |
| Allegheny Technologies, Inc. 5.125% 2031 | | | 880 | | | | 675 | |
| ArcelorMittal 7.00% 2039 | | | 488 | | | | 493 | |
| ArcelorMittal 6.75% 2041 | | | 755 | | | | 748 | |
| Arconic Corp. 6.00% 20251 | | | 360 | | | | 352 | |
| Arconic Rolled Products Corp. 6.125% 20281 | | | 200 | | | | 187 | |
| Ardagh Group SA 6.50% Cash 20271,5 | | | 422 | | | | 314 | |
| Ardagh Metal Packaging Finance USA, LLC 6.00% 20271 | | | 750 | | | | 744 | |
| Ardagh Metal Packaging Finance USA, LLC 3.25% 20281 | | | 500 | | | | 427 | |
| Ardagh Metal Packaging Finance USA, LLC 4.00% 20291 | | | 650 | | | | 524 | |
| Ardagh Packaging Finance 4.125% 20261 | | | 900 | | | | 764 | |
| Axalta Coating Systems, LLC 4.75% 20271 | | | 460 | | | | 414 | |
| Ball Corp. 2.875% 2030 | | | 160 | | | | 129 | |
| Ball Corp. 3.125% 2031 | | | 810 | | | | 655 | |
| BWAY Parent Co., Inc. 5.50% 20241 | | | 1,329 | | | | 1,272 | |
| Can-Pack SA / Canpack US, LLC 3.875% 20291 | | | 1,960 | | | | 1,532 | |
| Cleveland-Cliffs, Inc. 6.75% 20261 | | | 362 | | | | 360 | |
| Cleveland-Cliffs, Inc. 5.875% 2027 | | | 2,880 | | | | 2,691 | |
| Cleveland-Cliffs, Inc. 7.00% 2027 | | | 297 | | | | 295 | |
| Cleveland-Cliffs, Inc. 4.625% 20291 | | | 1,655 | | | | 1,463 | |
| Cleveland-Cliffs, Inc. 4.875% 20311 | | | 1,990 | | | | 1,759 | |
| Consolidated Energy Finance SA 6.50% 20261 | | | 600 | | | | 554 | |
| Consolidated Energy Finance SA 5.625% 20281 | | | 735 | | | | 592 | |
| Constellium SE 3.75% 20291 | | | 350 | | | | 278 | |
| Crown Holdings, Inc. 5.25% 20301 | | | 240 | | | | 225 | |
| CVR Partners LP 6.125% 20281 | | | 1,125 | | | | 1,007 | |
| Diamond (BC) BV 4.625% 20291 | | | 205 | | | | 164 | |
| 210 | American Funds Insurance Series |
American High-Income Trust (continued)
| Bonds, notes & other debt instruments (continued) | | Principal amount
(000) | | | Value
(000) | |
| Corporate bonds, notes & loans (continued) | | | | | | |
| Materials (continued) | | | | | | |
| Element Solutions, Inc. 3.875% 20281 | | USD | 620 | | | $ | 513 | |
| First Quantum Minerals, Ltd. 7.50% 20251 | | | 3,893 | | | | 3,688 | |
| First Quantum Minerals, Ltd. 6.875% 20261 | | | 2,726 | | | | 2,516 | |
| First Quantum Minerals, Ltd. 6.875% 20271 | | | 5,910 | | | | 5,294 | |
| FMG Resources 4.375% 20311 | | | 585 | | | | 479 | |
| Freeport-McMoRan, Inc. 4.25% 2030 | | | 437 | | | | 398 | |
| Freeport-McMoRan, Inc. 5.45% 2043 | | | 411 | | | | 381 | |
| FXI Holdings, Inc. 7.875% 20241 | | | 4,740 | | | | 4,121 | |
| FXI Holdings, Inc. 12.25% 20261 | | | 5,685 | | | | 5,070 | |
| GPC Merger Sub, Inc. 7.125% 20281 | | | 534 | | | | 429 | |
| Graphic Packaging International, LLC 3.75% 20301 | | | 600 | | | | 509 | |
| Hexion, Inc., Term Loan, (3-month USD CME Term SOFR + 4.50%) 5.924% 20292,3 | | | 455 | | | | 409 | |
| Joseph T. Ryerson & Son, Inc. 8.50% 20281 | | | 133 | | | | 137 | |
| Kaiser Aluminum Corp. 4.625% 20281 | | | 478 | | | | 399 | |
| Labl, Inc. 5.875% 20281 | | | 500 | | | | 405 | |
| Labl, Inc. 8.25% 20291 | | | 1,300 | | | | 984 | |
| LSB Industries, Inc. 6.25% 20281 | | | 1,510 | | | | 1,335 | |
| Mercer International, Inc. 5.125% 2029 | | | 400 | | | | 342 | |
| Methanex Corp. 5.125% 2027 | | | 3,740 | | | | 3,307 | |
| Methanex Corp. 5.25% 2029 | | | 520 | | | | 440 | |
| Methanex Corp. 5.65% 2044 | | | 465 | | | | 329 | |
| Mineral Resources, Ltd. 8.00% 20271 | | | 1,310 | | | | 1,279 | |
| Mineral Resources, Ltd. 8.50% 20301 | | | 1,720 | | | | 1,697 | |
| Neon Holdings, Inc. 10.125% 20261 | | | 840 | | | | 801 | |
| Nova Chemicals Corp. 4.875% 20241 | | | 675 | | | | 643 | |
| Nova Chemicals Corp. 5.00% 20251 | | | 295 | | | | 270 | |
| Nova Chemicals Corp. 5.25% 20271 | | | 2,036 | | | | 1,752 | |
| Nova Chemicals Corp. 4.25% 20291 | | | 2,330 | | | | 1,825 | |
| Novelis Corp. 3.25% 20261 | | | 745 | | | | 631 | |
| Novelis Corp. 4.75% 20301 | | | 1,013 | | | | 844 | |
| Novelis Corp. 3.875% 20311 | | | 1,417 | | | | 1,094 | |
| Olin Corp. 5.625% 2029 | | | 200 | | | | 179 | |
| Olin Corp. 5.00% 2030 | | | 180 | | | | 156 | |
| Olympus Water US Holding Corp. 6.25% 20291 | | | 265 | | | | 185 | |
| Owens-Illinois, Inc. 5.875% 20231 | | | 420 | | | | 416 | |
| Owens-Illinois, Inc. 6.375% 20251 | | | 265 | | | | 253 | |
| Rayonier A.M. Products, Inc. 7.625% 20261 | | | 85 | | | | 74 | |
| SCIH Salt Holdings, Inc. 4.875% 20281 | | | 2,435 | | | | 2,029 | |
| SCIH Salt Holdings, Inc. 6.625% 20291 | | | 1,225 | | | | 970 | |
| SCIL IV, LLC 5.375% 20261 | | | 500 | | | | 401 | |
| Scotts Miracle-Gro Co. 4.50% 2029 | | | 639 | | | | 525 | |
| Scotts Miracle-Gro Co. 4.375% 2032 | | | 455 | | | | 347 | |
| Sealed Air Corp. 4.00% 20271 | | | 316 | | | | 286 | |
| Sealed Air Corp. 5.00% 20291 | | | 440 | | | | 412 | |
| Silgan Holdings, Inc. 4.125% 2028 | | | 377 | | | | 339 | |
| Summit Materials, Inc. 6.50% 20271 | | | 360 | | | | 348 | |
| Summit Materials, Inc. 5.25% 20291 | | | 955 | | | | 835 | |
| Trivium Packaging BV 5.50% 20261 | | | 330 | | | | 313 | |
| Trivium Packaging BV 8.50% 20271 | | | 403 | | | | 378 | |
| Tronox, Ltd. 4.625% 20291 | | | 730 | | | | 589 | |
| Unifrax Escrow Issuer Corp. 5.25% 20281 | | | 234 | | | | 187 | |
| Valvoline, Inc. 4.25% 20301 | | | 353 | | | | 295 | |
| Valvoline, Inc. 3.625% 20311 | | | 620 | | | | 497 | |
| Venator Materials Corp. 5.75% 20251 | | | 3,501 | | | | 2,808 | |
| Venator Materials Corp. 9.50% 20251 | | | 1,155 | | | | 1,161 | |
| W. R. Grace Holdings, LLC 4.875% 20271 | | | 655 | | | | 571 | |
| W. R. Grace Holdings, LLC 5.625% 20291 | | | 440 | | | | 325 | |
| Warrior Met Coal, Inc. 7.875% 20281 | | | 2,170 | | | | 2,071 | |
| | | | | | | | 80,513 | |
| American Funds Insurance Series | 211 |
American High-Income Trust (continued)
| Bonds, notes & other debt instruments (continued) | | Principal amount
(000) | | | Value
(000) | |
| Corporate bonds, notes & loans (continued) | | | | | | |
| Industrials 8.65% | | | | | | | | |
| AAdvantage Loyalty IP, Ltd. 5.50% 20261 | | USD | 990 | | | $ | 913 | |
| ADT Security Corp. 4.125% 20291 | | | 735 | | | | 599 | |
| Allison Transmission Holdings, Inc. 3.75% 20311 | | | 1,235 | | | | 992 | |
| Atkore, Inc. 4.25% 20311 | | | 385 | | | | 320 | |
| Atlantic Aviation FBO, Inc., Term Loan, (3-month USD-LIBOR + 5.75%) 7.416% 20292,3 | | | 2,180 | | | | 2,098 | |
| ATS Automation Tooling Systems, Inc. 4.125% 20281 | | | 275 | | | | 230 | |
| Avis Budget Car Rental, LLC 5.75% 20271 | | | 885 | | | | 788 | |
| Avis Budget Group, Inc. 5.375% 20291 | | | 900 | | | | 750 | |
| Avolon Holdings Funding, Ltd. 5.25% 20241 | | | 660 | | | | 649 | |
| Avolon Holdings Funding, Ltd. 2.528% 20271 | | | 2,098 | | | | 1,712 | |
| BlueLinx Holdings, Inc. 6.00% 20291 | | | 500 | | | | 391 | |
| Bohai Financial Investment Holding Co., Ltd. 4.50% 20231 | | | 132 | | | | 131 | |
| Bombardier, Inc. 7.50% 20241 | | | 474 | | | | 446 | |
| Bombardier, Inc. 7.50% 20251 | | | 1,242 | | | | 1,126 | |
| Bombardier, Inc. 7.125% 20261 | | | 3,425 | | | | 2,835 | |
| Bombardier, Inc. 7.875% 20271 | | | 5,493 | | | | 4,587 | |
| Bombardier, Inc. 6.00% 20281 | | | 2,475 | | | | 1,859 | |
| Bombardier, Inc. 7.45% 20341 | | | 450 | | | | 340 | |
| Builders FirstSource, Inc. 4.25% 20321 | | | 1,230 | | | | 939 | |
| BWX Technologies, Inc. 4.125% 20281 | | | 740 | | | | 660 | |
| BWX Technologies, Inc. 4.125% 20291 | | | 1,005 | | | | 884 | |
| Clarivate Science Holdings Corp. 3.875% 20281 | | | 1,595 | | | | 1,337 | |
| Clarivate Science Holdings Corp. 4.875% 20291 | | | 1,265 | | | | 1,042 | |
| Clean Harbors, Inc. 4.875% 20271 | | | 766 | | | | 702 | |
| CoreLogic, Inc. 4.50% 20281 | | | 4,279 | | | | 3,302 | |
| CoreLogic, Inc., Term Loan, (3-month USD-LIBOR + 6.50%) 8.188% 20292,3 | | | 660 | | | | 485 | |
| Covanta Holding Corp. 5.00% 2030 | | | 1,340 | | | | 1,097 | |
| Covert Mergeco, Inc. 4.875% 20291 | | | 1,295 | | | | 1,055 | |
| Dun & Bradstreet Corp. 5.00% 20291 | | | 1,585 | | | | 1,371 | |
| Garda World Security Corp. 6.00% 20291 | | | 150 | | | | 115 | |
| GFL Environmental, Inc. 3.50% 20281 | | | 1,390 | | | | 1,194 | |
| Global Infrastructure Solutions, Inc. 5.625% 20291 | | | 500 | | | | 391 | |
| Gol Finance SA 8.00% 2026 | | | 200 | | | | 133 | |
| Harsco Corp. 5.75% 20271 | | | 700 | | | | 561 | |
| Herc Holdings, Inc. 5.50% 20271 | | | 200 | | | | 183 | |
| Howmet Aerospace, Inc. 5.95% 2037 | | | 150 | | | | 142 | |
| Icahn Enterprises Finance Corp. 4.75% 2024 | | | 1,080 | | | | 1,011 | |
| JELD-WEN Holding, Inc. 4.875% 20271 | | | 543 | | | | 424 | |
| Labl Escrow Issuer, LLC 6.75% 20261 | | | 450 | | | | 406 | |
| Labl Escrow Issuer, LLC 10.50% 20271 | | | 1,170 | | | | 1,019 | |
| LSC Communications, Inc. 8.75% 20231,4,7,8 | | | 8,933 | | | | 87 | |
| LSC Communications, Inc., Term Loan B, (USD Prime Rate + 4.50%) 7.75% 20222,3,4,7,8 | | | 301 | | | | 3 | |
| Masonite International Corp. 3.50% 20301 | | | 530 | | | | 423 | |
| MasTec, Inc. 4.50% 20281 | | | 460 | | | | 414 | |
| Maxar Technologies, Inc. 7.75% 20271 | | | 345 | | | | 342 | |
| Meritor, Inc. 4.50% 20281 | | | 210 | | | | 202 | |
| Mueller Water Products, Inc. 4.00% 20291 | | | 275 | | | | 240 | |
| Nielsen Finance, LLC and Nielsen Finance Co. 5.625% 20281 | | | 250 | | | | 233 | |
| Nielsen Finance, LLC and Nielsen Finance Co. 5.875% 20301 | | | 1,100 | | | | 1,012 | |
| Nielsen Finance, LLC and Nielsen Finance Co. 4.75% 20311 | | | 511 | | | | 460 | |
| Park River Holdings, Inc. 5.625% 20291 | | | 775 | | | | 484 | |
| PGT Innovations, Inc. 4.375% 20291 | | | 1,125 | | | | 889 | |
| Pitney Bowes, Inc. 6.875% 20271 | | | 600 | | | | 477 | |
| PM General Purchaser, LLC 9.50% 20281 | | | 2,198 | | | | 1,779 | |
| Prime Security Services Borrower, LLC 3.375% 20271 | | | 475 | | | | 393 | |
| Prime Security Services Borrower, LLC 6.25% 20281 | | | 627 | | | | 526 | |
| R.R. Donnelley & Sons Co. 6.125% 20261 | | | 375 | | | | 351 | |
| Roller Bearing Company of America, Inc. 4.375% 20291 | | | 170 | | | | 145 | |
| Sensata Technologies, Inc. 3.75% 20311 | | | 500 | | | | 402 | |
| SkyMiles IP, Ltd. 4.75% 20281 | | | 1,715 | | | | 1,621 | |
| 212 | American Funds Insurance Series |
American High-Income Trust (continued)
| Bonds, notes & other debt instruments (continued) | | Principal amount
(000) | | | Value
(000) | |
| Corporate bonds, notes & loans (continued) | | | | | | |
| Industrials (continued) | | | | | | | | |
| SRS Distribution, Inc. 4.625% 20281 | | USD | 480 | | | $ | 421 | |
| Stericycle, Inc. 5.375% 20241 | | | 1,135 | | | | 1,098 | |
| Stericycle, Inc. 3.875% 20291 | | | 1,360 | | | | 1,114 | |
| The Brink’s Co. 4.625% 20271 | | | 719 | | | | 640 | |
| Titan International, Inc. 7.00% 2028 | | | 750 | | | | 706 | |
| TransDigm, Inc. 6.25% 20261 | | | 1,638 | | | | 1,584 | |
| TransDigm, Inc. 6.375% 2026 | | | 240 | | | | 225 | |
| TransDigm, Inc. 6.875% 2026 | | | 460 | | | | 430 | |
| TransDigm, Inc. 5.50% 2027 | | | 855 | | | | 728 | |
| TransDigm, Inc. 4.625% 2029 | | | 155 | | | | 125 | |
| TransDigm, Inc. 4.875% 2029 | | | 450 | | | | 367 | |
| Triumph Group, Inc. 6.25% 20241 | | | 4,172 | | | | 3,727 | |
| Triumph Group, Inc. 8.875% 20241 | | | 536 | | | | 541 | |
| Triumph Group, Inc. 7.75% 20251 | | | 1,140 | | | | 879 | |
| Uber Technologies, Inc. 8.00% 20261 | | | 498 | | | | 497 | |
| United Airlines Holdings, Inc. 6.50% 20271 | | | 3,795 | | | | 3,741 | |
| United Airlines, Inc. 4.375% 20261 | | | 480 | | | | 425 | |
| United Airlines, Inc. 4.625% 20291 | | | 660 | | | | 562 | |
| United Rentals, Inc. 4.875% 2028 | | | 680 | | | | 644 | |
| United Rentals, Inc. 3.875% 2031 | | | 525 | | | | 444 | |
| United Rentals, Inc. 3.75% 2032 | | | 450 | | | | 370 | |
| Vertical Holdco GMBH 7.625% 20281 | | | 835 | | | | 751 | |
| Vertical U.S. Newco, Inc. 5.25% 20271 | | | 2,055 | | | | 1,836 | |
| WESCO Distribution, Inc. 7.125% 20251 | | | 675 | | | | 675 | |
| WESCO Distribution, Inc. 7.25% 20281 | | | 735 | | | | 729 | |
| Western Global Airlines, LLC 10.375% 20251 | | | 475 | | | | 458 | |
| XPO Logistics, Inc. 6.25% 20251 | | | 136 | | | | 135 | |
| | | | | | | | 73,554 | |
| | | | | | | | | |
| Financials 7.21% | | | | | | | | |
| Advisor Group Holdings, LLC 6.25% 20281 | | | 2,191 | | | | 1,915 | |
| AG Merger Sub II, Inc. 10.75% 20271 | | | 3,800 | | | | 3,763 | |
| Alliant Holdings Intermediate, LLC 6.75% 20271 | | | 1,741 | | | | 1,549 | |
| Alliant Holdings Intermediate, LLC / Alliant Holdings 4.25% 20271 | | | 890 | | | | 771 | |
| Alliant Holdings Intermediate, LLC / Alliant Holdings 5.875% 20291 | | | 1,560 | | | | 1,297 | |
| AmWINS Group, Inc. 4.875% 20291 | | | 1,260 | | | | 1,033 | |
| Aretec Escrow Issuer, Inc. 7.50% 20291 | | | 2,375 | | | | 2,028 | |
| Ascensus, Inc., Term Loan, (3-month USD-LIBOR + 6.50%) 7.50% 20292,3 | | | 1,245 | | | | 1,153 | |
| AssuredPartners, Inc. 8.00% 20271 | | | 437 | | | | 410 | |
| AssuredPartners, Inc. 5.625% 20291 | | | 365 | | | | 293 | |
| BroadStreet Partners, Inc. 5.875% 20291 | | | 575 | | | | 451 | |
| Castlelake Aviation Finance DAC 5.00% 20271 | | | 1,840 | | | | 1,531 | |
| Coinbase Global, Inc. 3.375% 20281 | | | 1,875 | | | | 1,186 | |
| Coinbase Global, Inc. 3.625% 20311 | | | 1,545 | | | | 872 | |
| Compass Diversified Holdings 5.25% 20291 | | | 4,005 | | | | 3,313 | |
| Compass Diversified Holdings 5.00% 20321 | | | 1,330 | | | | 1,031 | |
| Credit Acceptance Corp. 5.125% 20241 | | | 325 | | | | 307 | |
| Digital Currency Group, Inc., Term Loan, (3-month USD-LIBOR + 7.00%) 8.00% 20262,3,7,8 | | | 947 | | | | 838 | |
| Digital Currency Group, Inc., Term Loan, 8.75% 20262,7,8 | | | 1,263 | | | | 1,074 | |
| FS Energy and Power Fund 7.50% 20231 | | | 2,784 | | | | 2,795 | |
| Hightower Holding, LLC 6.75% 20291 | | | 905 | | | | 682 | |
| HUB International, Ltd. 7.00% 20261 | | | 2,310 | | | | 2,177 | |
| HUB International, Ltd. 5.625% 20291 | | | 240 | | | | 199 | |
| Icahn Enterprises Finance Corp. 5.25% 2027 | | | 277 | | | | 246 | |
| Icahn Enterprises Finance Corp. 4.375% 2029 | | | 675 | | | | 547 | |
| Iron Mountain Information Management Services, Inc. 5.00% 20321 | | | 725 | | | | 587 | |
| Ladder Capital Corp. 4.25% 20271 | | | 1,429 | | | | 1,156 | |
| LPL Holdings, Inc. 4.625% 20271 | | | 1,592 | | | | 1,489 | |
| LPL Holdings, Inc. 4.00% 20291 | | | 1,370 | | | | 1,174 | |
| American Funds Insurance Series | 213 |
American High-Income Trust (continued)
| Bonds, notes & other debt instruments (continued) | | Principal amount
(000) | | | Value
(000) | |
| Corporate bonds, notes & loans (continued) | | | | | | |
| Financials (continued) | | | | | | | | |
| LPL Holdings, Inc. 4.375% 20311 | | USD | 1,135 | | | $ | 972 | |
| MGIC Investment Corp. 5.25% 2028 | | | 525 | | | | 471 | |
| MidCap Financial Issuer Trust 6.50% 20281 | | | 750 | | | | 647 | |
| MSCI, Inc. 4.00% 20291 | | | 900 | | | | 800 | |
| MSCI, Inc. 3.625% 20301 | | | 66 | | | | 55 | |
| MSCI, Inc. 3.625% 20311 | | | 1,325 | | | | 1,093 | |
| MSCI, Inc. 3.875% 20311 | | | 1,450 | | | | 1,244 | |
| MSCI, Inc. 3.25% 20331 | | | 945 | | | | 755 | |
| National Financial Partners Corp. 6.875% 20281 | | | 739 | | | | 612 | |
| Navient Corp. 5.50% 2023 | | | 1,429 | | | | 1,419 | |
| Navient Corp. 5.875% 2024 | | | 1,450 | | | | 1,335 | |
| Navient Corp. 6.125% 2024 | | | 1,147 | | | | 1,090 | |
| Navient Corp. 6.75% 2025 | | | 550 | | | | 497 | |
| Navient Corp. 6.75% 2026 | | | 400 | | | | 355 | |
| Navient Corp. 5.00% 2027 | | | 2,883 | | | | 2,375 | |
| Navient Corp. 4.875% 2028 | | | 320 | | | | 251 | |
| Navient Corp. 5.50% 2029 | | | 2,280 | | | | 1,761 | |
| Navient Corp. 5.625% 2033 | | | 1,778 | | | | 1,237 | |
| Onemain Finance Corp. 3.875% 2028 | | | 206 | | | | 158 | |
| OneMain Holdings, Inc. 7.125% 2026 | | | 1,335 | | | | 1,237 | |
| Owl Rock Capital Corp. 3.75% 2025 | | | 600 | | | | 556 | |
| Owl Rock Capital Corp. 3.40% 2026 | | | 290 | | | | 255 | |
| Owl Rock Capital Corp. II 4.625% 20241 | | | 450 | | | | 428 | |
| Owl Rock Capital Corp. III 3.125% 20271 | | | 600 | | | | 513 | |
| Owl Rock Core Income Corp. 4.70% 20271 | | | 800 | | | | 730 | |
| Oxford Finance, LLC / Oxford Finance Co-Issuer II, Inc. 6.375% 20271 | | | 1,893 | | | | 1,816 | |
| Quicken Loans, LLC 3.625% 20291 | | | 455 | | | | 359 | |
| Rocket Mortgage / Rocket Mortgage Co-Issuer, Inc. 2.875% 20261 | | | 520 | | | | 431 | |
| Ryan Specialty Group, LLC 4.375% 20301 | | | 725 | | | | 632 | |
| Springleaf Finance Corp. 6.125% 2024 | | | 367 | | | | 351 | |
| Springleaf Finance Corp. 6.625% 2028 | | | 340 | | | | 304 | |
| Springleaf Finance Corp. 5.375% 2029 | | | 183 | | | | 149 | |
| Starwood Property Trust, Inc. 4.375% 20271 | | | 570 | | | | 496 | |
| | | | | | | | 61,251 | |
| | | | | | | | | |
| Information technology 4.88% | | | | | | | | |
| Almonde, Inc., Term Loan, (3-month USD-LIBOR + 7.25%) 8.489% 20252,3 | | | 3,674 | | | | 3,181 | |
| Applied Systems, Inc., Term Loan, (3-month USD-LIBOR + 5.50%) 6.506% 20252,3 | | | 822 | | | | 797 | |
| Avaya, Inc. 6.125% 20281 | | | 490 | | | | 321 | |
| Black Knight, Inc. 3.625% 20281 | | | 410 | | | | 356 | |
| BMC Software, Inc. 7.125% 20251 | | | 180 | | | | 173 | |
| BMC Software, Inc. 9.125% 20261 | | | 240 | | | | 225 | |
| BMC Software, Inc., Term Loan, (3-month USD-LIBOR + 5.50%) 6.128% 20262,3 | | | 1,220 | | | | 1,136 | |
| Booz Allen Hamilton, Inc. 3.875% 20281 | | | 1,765 | | | | 1,565 | |
| Booz Allen Hamilton, Inc. 4.00% 20291 | | | 880 | | | | 769 | |
| CA Magnum Holdings 5.375% 20261 | | | 220 | | | | 191 | |
| CDK Global, Inc. 7.25% 20291 | | | 1,550 | | | | 1,494 | |
| Ciena Corp. 4.00% 20301 | | | 440 | | | | 380 | |
| CommScope Finance, LLC 6.00% 20261 | | | 430 | | | | 397 | |
| CommScope Finance, LLC 8.25% 20271 | | | 310 | | | | 246 | |
| CommScope Technologies, LLC 6.00% 20251 | | | 380 | | | | 329 | |
| CommScope Technologies, LLC 5.00% 20271 | | | 220 | | | | 163 | |
| Condor Merger Sub, Inc. 7.375% 20301 | | | 850 | | | | 693 | |
| Diebold Nixdorf AG, Term Loan B, (3-month USD-LIBOR + 2.75%) 4.00% 20232,3 | | | 1,631 | | | | 1,384 | |
| Diebold Nixdorf, Inc. 9.375% 20251 | | | 7,304 | | | | 5,116 | |
| Diebold, Inc. 8.50% 2024 | | | 1,301 | | | | 678 | |
| Elastic NV 4.125% 20291 | | | 350 | | | | 293 | |
| Entegris Escrow Corp. 4.75% 20291 | | | 790 | | | | 737 | |
| Fair Isaac Corp. 4.00% 20281 | | | 1,695 | | | | 1,505 | |
| Gartner, Inc. 4.50% 20281 | | | 2,098 | | | | 1,930 | |
| 214 | American Funds Insurance Series |
American High-Income Trust (continued)
| Bonds, notes & other debt instruments (continued) | | Principal amount
(000) | | | Value
(000) | |
| Corporate bonds, notes & loans (continued) | | | | | | |
| Information technology (continued) | | | | | | | | |
| Gartner, Inc. 3.75% 20301 | | USD | 450 | | | $ | 384 | |
| GoDaddy Operating Co. 5.25% 20271 | | | 390 | | | | 358 | |
| GoDaddy Operating Co. 3.50% 20291 | | | 210 | | | | 177 | |
| Imola Merger Corp. 4.75% 20291 | | | 300 | | | | 252 | |
| MicroStrategy, Inc. 6.125% 20281 | | | 385 | | | | 307 | |
| MoneyGram International, Inc. 5.375% 20261 | | | 1,575 | | | | 1,502 | |
| NCR Corp. 5.00% 20281 | | | 315 | | | | 268 | |
| NCR Corp. 5.125% 20291 | | | 3,409 | | | | 2,890 | |
| NCR Corp. 5.25% 20301 | | | 116 | | | | 100 | |
| Rocket Software, Inc. 6.50% 20291 | | | 785 | | | | 569 | |
| Sabre GLBL, Inc. 7.375% 20251 | | | 48 | | | | 45 | |
| Sabre Holdings Corp. 9.25% 20251 | | | 338 | | | | 326 | |
| Square, Inc. 2.75% 20261 | | | 2,125 | | | | 1,891 | |
| Square, Inc. 3.50% 20311 | | | 1,675 | | | | 1,338 | |
| Synaptics, Inc. 4.00% 20291 | | | 375 | | | | 305 | |
| UKG, Inc., Term Loan B, (3-month USD-LIBOR + 3.25%) 4.212% 20262,3 | | | 468 | | | | 441 | |
| UKG, Inc., Term Loan, (3-month USD-LIBOR + 5.25%) 6.212% 20272,3 | | | 2,545 | | | | 2,364 | |
| Unisys Corp. 6.875% 20271 | | | 1,795 | | | | 1,570 | |
| VeriSign, Inc. 5.25% 2025 | | | 132 | | | | 133 | |
| Veritas Holdings, Ltd. 7.50% 20251 | | | 1,481 | | | | 1,114 | |
| Viavi Solutions, Inc. 3.75% 20291 | | | 230 | | | | 193 | |
| Xerox Corp. 5.00% 20251 | | | 570 | | | | 531 | |
| Xerox Corp. 5.50% 20281 | | | 435 | | | | 364 | |
| | | | | | | | 41,481 | |
| | | | | | | | | |
| Consumer staples 3.89% | | | | | | | | |
| Albertsons Companies, Inc. 4.625% 20271 | | | 1,060 | | | | 949 | |
| Albertsons Companies, Inc. 5.875% 20281 | | | 190 | | | | 178 | |
| Albertsons Companies, Inc. 3.50% 20291 | | | 2,628 | | | | 2,135 | |
| Albertsons Companies, Inc. 4.875% 20301 | | | 335 | | | | 288 | |
| B&G Foods, Inc. 5.25% 2025 | | | 612 | | | | 565 | |
| B&G Foods, Inc. 5.25% 2027 | | | 1,428 | | | | 1,237 | |
| Central Garden & Pet Co. 4.125% 2030 | | | 1,060 | | | | 871 | |
| Central Garden & Pet Co. 4.125% 20311 | | | 1,005 | | | | 808 | |
| Coty, Inc. 5.00% 20261 | | | 700 | | | | 643 | |
| Coty, Inc. 6.50% 20261 | | | 320 | | | | 296 | |
| Coty, Inc. 4.75% 20291 | | | 875 | | | | 753 | |
| Darling Ingredients, Inc. 5.25% 20271 | | | 689 | | | | 668 | |
| Darling Ingredients, Inc. 6.00% 20301 | | | 950 | | | | 948 | |
| Edgewell Personal Care Co. 5.50% 20281 | | | 275 | | | | 251 | |
| Energizer Holdings, Inc. 4.375% 20291 | | | 545 | | | | 419 | |
| Ingles Markets, Inc. 4.00% 20311 | | | 345 | | | | 299 | |
| Kraft Heinz Company 3.875% 2027 | | | 375 | | | | 363 | |
| Kraft Heinz Company 4.375% 2046 | | | 646 | | | | 539 | |
| Kraft Heinz Company 5.50% 2050 | | | 440 | | | | 423 | |
| Kronos Acquisition Holdings, Inc. 5.00% 20261 | | | 1,816 | | | | 1,555 | |
| Kronos Acquisition Holdings, Inc. 7.00% 20271 | | | 2,890 | | | | 2,171 | |
| Lamb Weston Holdings, Inc. 4.875% 20281 | | | 260 | | | | 245 | |
| Lamb Weston Holdings, Inc. 4.125% 20301 | | | 2,500 | | | | 2,171 | |
| Lamb Weston Holdings, Inc. 4.375% 20321 | | | 810 | | | | 706 | |
| Nestle Skin Health SA, Term Loan B3, (3-month USD-LIBOR + 3.75%) 6.00% 20262,3 | | | 788 | | | | 732 | |
| Performance Food Group, Inc. 5.50% 20271 | | | 570 | | | | 529 | |
| Performance Food Group, Inc. 4.25% 20291 | | | 483 | | | | 404 | |
| Pilgrim’s Pride Corp. 5.875% 20271 | | | 720 | | | | 691 | |
| Post Holdings, Inc. 5.625% 20281 | | | 1,449 | | | | 1,379 | |
| Post Holdings, Inc. 5.50% 20291 | | | 811 | | | | 727 | |
| Post Holdings, Inc. 4.625% 20301 | | | 3,355 | | | | 2,837 | |
| Post Holdings, Inc. 4.50% 20311 | | | 1,350 | | | | 1,108 | |
| Prestige Brands International, Inc. 5.125% 20281 | | | 103 | | | | 96 | |
| American Funds Insurance Series | 215 |
American High-Income Trust (continued)
| Bonds, notes & other debt instruments (continued) | | Principal amount
(000) | | | Value
(000) | |
| Corporate bonds, notes & loans (continued) | | | | | | |
| Consumer staples (continued) | | | | | | | | |
| Prestige Brands International, Inc. 3.75% 20311 | | USD | 1,275 | | | $ | 1,059 | |
| Simmons Foods, Inc. 4.625% 20291 | | | 993 | | | | 841 | |
| TreeHouse Foods, Inc. 4.00% 2028 | | | 1,415 | | | | 1,155 | |
| United Natural Foods, Inc. 6.75% 20281 | | | 1,700 | | | | 1,591 | |
| US Foods, Inc. 4.625% 20301 | | | 460 | | | | 388 | |
| | | | | | | | 33,018 | |
| | | | | | | | | |
| Utilities 3.26% | | | | | | | | |
| AmeriGas Partners LP 5.875% 2026 | | | 275 | | | | 257 | |
| AmeriGas Partners LP 5.75% 2027 | | | 392 | | | | 359 | |
| Calpine Corp. 4.50% 20281 | | | 150 | | | | 136 | |
| Calpine Corp. 5.125% 20281 | | | 518 | | | | 457 | |
| Calpine Corp. 3.75% 20311 | | | 500 | | | | 408 | |
| DPL, Inc. 4.125% 2025 | | | 765 | | | | 708 | |
| Emera, Inc. 6.75% 2076 (3-month USD-LIBOR + 5.44% on 6/15/2026)6 | | | 1,155 | | | | 1,119 | |
| FirstEnergy Corp. 2.25% 2030 | | | 980 | | | | 778 | |
| FirstEnergy Corp. 2.65% 2030 | | | 624 | | | | 516 | |
| FirstEnergy Corp. 7.375% 2031 | | | 337 | | | | 379 | |
| FirstEnergy Corp. 3.40% 2050 | | | 470 | | | | 320 | |
| FirstEnergy Corp., Series C, 5.35% 20476 | | | 475 | | | | 402 | |
| FirstEnergy Transmission, LLC 2.866% 20281 | | | 325 | | | | 275 | |
| FirstEnergy Transmission, LLC 4.55% 20491 | | | 100 | | | | 81 | |
| NextEra Energy Partners LP 4.25% 20241 | | | 122 | | | | 117 | |
| NGL Energy Partners LP 7.50% 2026 | | | 650 | | | | 487 | |
| NRG Energy, Inc. 3.625% 20311 | | | 1,130 | | | | 888 | |
| Pacific Gas and Electric Co. 4.55% 2030 | | | 623 | | | | 554 | |
| Pacific Gas and Electric Co. 3.95% 2047 | | | 500 | | | | 347 | |
| Pacific Gas and Electric Co. 3.50% 2050 | | | 400 | | | | 268 | |
| PG&E Corp. 5.00% 2028 | | | 3,205 | | | | 2,713 | |
| PG&E Corp. 5.25% 2030 | | | 3,040 | | | | 2,507 | |
| PG&E Corp., Term Loan, (3-month USD-LIBOR + 3.00%) 4.688% 20252,3 | | | 250 | | | | 236 | |
| Talen Energy Corp. 10.50% 20261 | | | 2,987 | | | | 1,941 | |
| Talen Energy Corp. 7.25% 20271,4 | | | 4,699 | | | | 4,634 | |
| Talen Energy Corp. 6.625% 20281 | | | 130 | | | | 126 | |
| Talen Energy Corp., Term Loan, (3-month USD CME Term SOFR + 4.75%) 5.949% 20232,3 | | | 3,085 | | | | 3,058 | |
| Talen Energy Corp., Term Loan B, (3-month USD-LIBOR + 3.75%) 5.416% 20262,3,4 | | | 500 | | | | 480 | |
| Talen Energy Supply, LLC 7.625% 20281,4 | | | 489 | | | | 480 | |
| Targa Resources Partners LP 4.00% 2032 | | | 550 | | | | 472 | |
| Venture Global Calcasieu Pass, LLC 3.875% 20291 | | | 1,190 | | | | 1,044 | |
| Vistra Operations Co., LLC 3.55% 20241 | | | 231 | | | | 223 | |
| Vistra Operations Co., LLC 5.625% 20271 | | | 970 | | | | 914 | |
| | | | | | | | 27,684 | |
| | | | | | | | | |
| Real estate 2.98% | | | | | | | | |
| Brookfield Property REIT, Inc. 5.75% 20261 | | | 2,284 | | | | 2,091 | |
| Diversified Healthcare Trust 4.375% 2031 | | | 560 | | | | 382 | |
| Forestar Group, Inc. 3.85% 20261 | | | 465 | | | | 383 | |
| Forestar Group, Inc. 5.00% 20281 | | | 92 | | | | 75 | |
| Howard Hughes Corp. 5.375% 20281 | | | 1,447 | | | | 1,215 | |
| Howard Hughes Corp. 4.125% 20291 | | | 2,043 | | | | 1,579 | |
| Howard Hughes Corp. 4.375% 20311 | | | 2,218 | | | | 1,645 | |
| Iron Mountain, Inc. 4.875% 20271 | | | 1,616 | | | | 1,465 | |
| Iron Mountain, Inc. 5.00% 20281 | | | 367 | | | | 326 | |
| Iron Mountain, Inc. 5.25% 20281 | | | 1,214 | | | | 1,092 | |
| Iron Mountain, Inc. 5.25% 20301 | | | 2,680 | | | | 2,335 | |
| Iron Mountain, Inc. 4.50% 20311 | | | 950 | | | | 779 | |
| Kennedy-Wilson Holdings, Inc. 4.75% 2029 | | | 2,505 | | | | 2,033 | |
| Kennedy-Wilson Holdings, Inc. 4.75% 2030 | | | 2,315 | | | | 1,815 | |
| 216 | American Funds Insurance Series |
American High-Income Trust (continued)
| Bonds, notes & other debt instruments (continued) | | Principal amount
(000) | | | | Value
(000) | |
| Corporate bonds, notes & loans (continued) | | | | | | | | |
| Real estate (continued) | | | | | | | | |
| Kennedy-Wilson Holdings, Inc. 5.00% 2031 | | USD | 2,265 | | | $ | 1,759 | |
| Ladder Capital Corp. 5.25% 20251 | | | 740 | | | | 671 | |
| Ladder Capital Corp. 4.75% 20291 | | | 100 | | | | 77 | |
| Medical Properties Trust, Inc. 5.00% 2027 | | | 638 | | | | 585 | |
| Medical Properties Trust, Inc. 3.50% 2031 | | | 239 | | | | 189 | |
| Park Intermediate Holdings, LLC 4.875% 20291 | | | 820 | | | | 705 | |
| Realogy Corp. 5.75% 20291 | | | 2,028 | | | | 1,541 | |
| Realogy Corp. 5.25% 20301 | | | 922 | | | | 685 | |
| RHP Hotel Properties LP / RHP Finance Corp. 4.50% 20291 | | | 535 | | | | 455 | |
| RLJ Lodging Trust, LP 4.00% 20291 | | | 800 | | | | 659 | |
| WeWork Companies, LLC 5.00% 20251 | | | 1,170 | | | | 757 | |
| | | | | | | | 25,298 | |
| | | | | | | | | |
| Total corporate bonds, notes & loans | | | | | | | 767,210 | |
| | | | | | | | | |
| Mortgage-backed obligations 0.07% | | | | | | | | |
| Collateralized mortgage-backed obligations 0.07% | | | | | | | | |
| Treehouse Park Improvement Association No.1 - Anleihen 9.75% 20331,7,8 | | | 712 | | | | 631 | |
| | | | | | | | | |
| Asset-backed obligations 0.02% | | | | | | | | |
| Castlelake Aircraft Securitization Trust, Series 2017-1R, Class C, 6.50% 20411,9 | | | 248 | | | | 129 | |
| | | | | | | | | |
| Total bonds, notes & other debt instruments (cost: $894,827,000) | | | | | | | 767,970 | |
| | | | | | | | | |
| Convertible bonds & notes 0.06% | | | | | | | | |
| Communication services 0.05% | | | | | | | | |
| DISH DBS Corp., convertible notes, 3.375% 2026 | | | 635 | | | | 430 | |
| | | | | | | | | |
| Energy 0.01% | | | | | | | | |
| Mesquite Energy, Inc., convertible notes, 13.14% Cash 20231,5,7,8 | | | 79 | | | | 79 | |
| | | | | | | | | |
| Total convertible bonds & notes (cost: $719,000) | | | | | | | 509 | |
| | | | | | | | | |
| Convertible stocks 0.09% | | | Shares | | | | | |
| Financials 0.05% | | | | | | | | |
| 2020 Cash Mandatory Exchangeable Trust, convertible preferred shares, 5.25% 20231 | | | 411 | | | | 473 | |
| | | | | | | | | |
| Utilities 0.04% | | | | | | | | |
| PG&E Corp., convertible preferred units, 5.50% 2023 | | | 3,350 | | | | 320 | |
| | | | | | | | | |
| Total convertible stocks (cost: $677,000) | | | | | | | 793 | |
| | | | | | | | | |
| Common stocks 4.61% | | | | | | | | |
| Health care 2.42% | | | | | | | | |
| Rotech Healthcare, Inc.7,8,10,11 | | | 201,793 | | | | 20,582 | |
| | | | | | | | | |
| Energy 1.43% | | | | | | | | |
| Chesapeake Energy Corp. | | | 51,857 | | | | 4,206 | |
| Oasis Petroleum, Inc. | | | 21,768 | | | | 2,648 | |
| Ascent Resources - Utica, LLC, Class A7,8,10,11 | | | 6,297,894 | | | | 1,700 | |
| Denbury, Inc.10 | | | 22,380 | | | | 1,343 | |
| Weatherford International10 | | | 40,159 | | | | 850 | |
| California Resources Corp. | | | 17,202 | | | | 662 | |
| American Funds Insurance Series | 217 |
American High-Income Trust (continued)
| Common stocks (continued) | | | Shares | | | | Value
(000) | |
| Energy (continued) | | | | | | | | |
| Diamond Offshore Drilling, Inc.10 | | | 82,188 | | | $ | 484 | |
| Diamond Offshore Drilling, Inc.1,10 | | | 28,784 | | | | 170 | |
| McDermott International, Ltd.7,8,10 | | | 107,875 | | | | 62 | |
| Mesquite Energy, Inc.7,8,10 | | | 3,558 | | | | 21 | |
| Bighorn Permian Resources, LLC7,8,10 | | | 2,894 | | | | 15 | |
| Constellation Oil Services Holding SA, Class B-17,8,10 | | | 3,449,949 | | | | — | 12 |
| | | | | | | | 12,161 | |
| | | | | | | | | |
| Consumer discretionary 0.34% | | | | | | | | |
| NMG Parent, LLC10 | | | 9,965 | | | | 1,794 | |
| MYT Holding Co., Class B7,8,10 | | | 608,846 | | | | 1,065 | |
| | | | | | | | 2,859 | |
| | | | | | | | | |
| Financials 0.32% | | | | | | | | |
| Jonah Energy Parent, LLC7,8 | | | 38,716 | | | | 2,485 | |
| Navient Corp. | | | 20,000 | | | | 280 | |
| | | | | | | | 2,765 | |
| | | | | | | | | |
| Information technology 0.05% | | | | | | | | |
| MoneyGram International, Inc.10 | | | 41,400 | | | | 414 | |
| | | | | | | | | |
| Communication services 0.05% | | | | | | | | |
| Intelsat SA7,8,10 | | | 8,164 | | | | 220 | |
| iHeartMedia, Inc., Class A10 | | | 22,639 | | | | 179 | |
| | | | | | | | 399 | |
| | | | | | | | | |
| Total common stocks (cost: $15,065,000) | | | | | | | 39,180 | |
| | | | | | | | | |
| Preferred securities 0.31% | | | | | | | | |
| Consumer discretionary 0.27% | | | | | | | | |
| MYT Holdings, LLC, Series A, preferred shares, 10.00% 202910 | | | 2,095,904 | | | | 2,295 | |
| | | | | | | | | |
| Industrials 0.04% | | | | | | | | |
| ACR III LSC Holdings, LLC, Series B, preferred shares1,7,8,10 | | | 1,022 | | | | 326 | |
| | | | | | | | | |
| Total preferred securities (cost: $2,933,000) | | | | | | | 2,621 | |
| | | | | | | | | |
| Rights & warrants 0.19% | | | | | | | | |
| Consumer discretionary 0.15% | | | | | | | | |
| NMG Parent, LLC, warrants, expire 20277,10 | | | 27,111 | | | | 1,293 | |
| | | | | | | | | |
| Energy 0.04% | | | | | | | | |
| Chesapeake Energy Corp., Class B, warrants, expire 202610 | | | 2,867 | | | | 162 | |
| Chesapeake Energy Corp., Class A, warrants, expire 202610 | | | 1,440 | | | | 96 | |
| Chesapeake Energy Corp., Class C, warrants, expire 202610 | | | 1,102 | | | | 58 | |
| | | | | | | | 316 | |
| | | | | | | | | |
| Communication services 0.00% | | | | | | | | |
| Intelsat Jackson Holdings SA (CVR), Series A7,8,10 | | | 855 | | | | 4 | |
| Intelsat Jackson Holdings SA (CVR), Series B7,8,10 | | | 855 | | | | 3 | |
| | | | | | | | 7 | |
| | | | | | | | | |
| Total rights & warrants (cost: $699,000) | | | | | | | 1,616 | |
| 218 | American Funds Insurance Series |
American High-Income Trust (continued)
| Short-term securities 2.60% | | Shares | | | Value
(000) | |
| Money market investments 2.60% | | | | | | |
| Capital Group Central Cash Fund 1.38%13,14 | | | 220,640 | | | $ | 22,060 | |
| | | | | | | | | |
| Total short-term securities (cost: $22,062,000) | | | | | | | 22,060 | |
| Total investment securities 98.22% (cost: $936,982,000) | | | | | | | 834,749 | |
| Other assets less liabilities 1.78% | | | | | | | 15,127 | |
| | | | | | | | | |
| Net assets 100.00% | | | | | | $ | 849,876 | |
Futures contracts
| Contracts | | Type | | Number of
contracts | | Expiration | | Notional
amount
(000) | | | Value and
unrealized
appreciation
at 6/30/2022
(000) | |
| 5 Year U.S. Treasury Note Futures | | Short | | 21 | | September 2022 | | | USD (2,357) | | | | $ | 18 | |
| 10 Year U.S. Treasury Note Futures | | Short | | 17 | | September 2022 | | | (2,015 | ) | | | | 27 | |
| 30 Year Ultra U.S. Treasury Bond Futures | | Short | | 6 | | September 2022 | | | (926 | ) | | | | 28 | |
| | | | | | | | | | | | | | $ | 73 | |
Swap contracts
Credit default swaps
Centrally cleared credit default swaps on credit indices — buy protection
Reference
index | | Financing
rate paid | | Payment
frequency | | Expiration
date | | Notional
amount
(000) | | Value at
6/30/2022
(000) | | | Upfront
premium
paid
(000) | | | Unrealized
appreciation
at 6/30/2022
(000) | |
| CDX.NA.HY.38 | | 5.00% | | Quarterly | | 6/20/2027 | | USD 14,167 | | $ | 427 | | | $ | 6 | | | $ | 421 | |
Investments in affiliates14
| | | Value of affiliate at 1/1/2022 (000) | | | Additions (000) | | | Reductions (000) | | | Net realized loss (000) | | | Net unrealized depreciation (000) | | | Value of affiliate at 6/30/2022 (000) | | | Dividend income (000) | |
| Short-term securities 2.60% | | | | | | | | | | | | | | | | | | | | | | | | | | | | |
| Money market investments 2.60% | | | | | | | | | | | | | | | | | | | | | | | | | | | | |
| Capital Group Central Cash Fund 1.38%13 | | $ | 17,238 | | | $ | 130,229 | | | $ | 125,397 | | | $ | (4 | ) | | $ | (6 | ) | | $ | 22,060 | | | $ | 68 | |
Private placement securities11
| | | Acquisition
date | | Cost
(000) | | | Value
(000) | | | Percent
of net
assets | |
| Rotech Healthcare, Inc. | | 9/26/2013 | | $ | 4,331 | | | $ | 20,582 | | | | 2.42 | % |
| Ascent Resources - Utica, LLC, Class A | | 11/15/2016 | | | 302 | | | | 1,700 | | | | .20 | |
| Total | | | | $ | 4,633 | | | $ | 22,282 | | | | 2.62 | % |
| American Funds Insurance Series | 219 |
American High-Income Trust (continued)
| 1 | Acquired in a transaction exempt from registration under Rule 144A of the Securities Act of 1933. May be resold in the U.S. in transactions exempt from registration, normally to qualified institutional buyers. The total value of all such securities was $566,024,000, which represented 66.60% of the net assets of the fund. |
| 2 | Loan participations and assignments; may be subject to legal or contractual restrictions on resale. The total value of all such loans was $25,280,000, which represented 2.97% of the net assets of the fund. |
| 3 | Coupon rate may change periodically. Reference rate and spread are as of the most recent information available. Some coupon rates are determined by the issuer or agent based on current market conditions; therefore, the reference rate and spread are not available. |
| 4 | Scheduled interest and/or principal payment was not received. |
| 5 | Payment in kind; the issuer has the option of paying additional securities in lieu of cash. Payment methods and rates are as of the most recent payment when available. |
| 6 | Step bond; coupon rate may change at a later date. |
| 7 | Valued under fair value procedures adopted by authority of the board of trustees. The total value of all such securities was $32,316,000, which represented 3.80% of the net assets of the fund. |
| 8 | Value determined using significant unobservable inputs. |
| 9 | Principal payments may be made periodically. Therefore, the effective maturity date may be earlier than the stated maturity date. |
| 10 | Security did not produce income during the last 12 months. |
| 11 | Acquired through a private placement transaction exempt from registration under the Securities Act of 1933. May be subject to legal or contractual restrictions on resale. |
| 12 | Amount less than one thousand. |
| 13 | Rate represents the seven-day yield at 6/30/2022. |
| 14 | Part of the same “group of investment companies” as the fund as defined under the Investment Company Act of 1940, as amended. |
Key to abbreviations
CME = CME Group
CVR = Contingent Value Rights
DAC = Designated Activity Company
LIBOR = London Interbank Offered Rate
REIT = Real Estate Investment Trust
SOFR = Secured Overnight Financing Rate
USD = U.S. dollars
Refer to the notes to financial statements.
| 220 | American Funds Insurance Series |
| American Funds Mortgage Fund | |
| Investment portfolio June 30, 2022 | unaudited |
| Bonds, notes & other debt instruments 94.57% | Principal amount
(000) | | | Value
(000) | |
| Mortgage-backed obligations 74.15% | | | | | | |
| Federal agency mortgage-backed obligations 70.07% | | | | | | | | |
| Fannie Mae Pool #695412 5.00% 20331 | | USD | — | 2 | | $ | — | 2 |
| Fannie Mae Pool #AD3566 5.00% 20351 | | | 2 | | | | 2 | |
| Fannie Mae Pool #256583 5.00% 20361 | | | 33 | | | | 33 | |
| Fannie Mae Pool #AC0794 5.00% 20391 | | | 5 | | | | 5 | |
| Fannie Mae Pool #931768 5.00% 20391 | | | 1 | | | | 2 | |
| Fannie Mae Pool #932606 5.00% 20401 | | | 3 | | | | 3 | |
| Fannie Mae Pool #MA4501 2.00% 20411 | | | 386 | | | | 345 | |
| Fannie Mae Pool #MA4387 2.00% 20411 | | | 20 | | | | 18 | |
| Fannie Mae Pool #AJ1873 4.00% 20411 | | | 7 | | | | 7 | |
| Fannie Mae Pool #AE1248 5.00% 20411 | | | 9 | | | | 9 | |
| Fannie Mae Pool #AE1274 5.00% 20411 | | | 7 | | | | 7 | |
| Fannie Mae Pool #AE1277 5.00% 20411 | | | 5 | | | | 5 | |
| Fannie Mae Pool #AE1283 5.00% 20411 | | | 2 | | | | 3 | |
| Fannie Mae Pool #MA4540 2.00% 20421 | | | 552 | | | | 493 | |
| Fannie Mae Pool #MA4570 2.00% 20421 | | | 125 | | | | 111 | |
| Fannie Mae Pool #AE1290 5.00% 20421 | | | 5 | | | | 6 | |
| Fannie Mae Pool #AT0300 3.50% 20431 | | | 2 | | | | 2 | |
| Fannie Mae Pool #AT3954 3.50% 20431 | | | 2 | | | | 2 | |
| Fannie Mae Pool #AY1829 3.50% 20441 | | | 2 | | | | 2 | |
| Fannie Mae Pool #BJ5015 4.00% 20471 | | | 42 | | | | 42 | |
| Fannie Mae Pool #BH3122 4.00% 20471 | | | 1 | | | | 1 | |
| Fannie Mae Pool #BK6840 4.00% 20481 | | | 28 | | | | 28 | |
| Fannie Mae Pool #BK5232 4.00% 20481 | | | 21 | | | | 21 | |
| Fannie Mae Pool #BK9743 4.00% 20481 | | | 8 | | | | 8 | |
| Fannie Mae Pool #BK9761 4.50% 20481 | | | 5 | | | | 5 | |
| Fannie Mae Pool #CA5496 3.00% 20501,3 | | | 1,287 | | | | 1,212 | |
| Fannie Mae Pool #FM9492 2.50% 20511 | | | 484 | | | | 438 | |
| Fannie Mae Pool #FM9804 2.50% 20511 | | | 262 | | | | 238 | |
| Fannie Mae Pool #FM9694 2.50% 20511 | | | 241 | | | | 219 | |
| Fannie Mae Pool #FM7687 3.00% 20511 | | | 295 | | | | 277 | |
| Fannie Mae Pool #CB0041 3.00% 20511 | | | 220 | | | | 208 | |
| Fannie Mae Pool #FM9976 3.00% 20511 | | | 105 | | | | 99 | |
| Fannie Mae Pool #CB2544 3.00% 20521 | | | 294 | | | | 275 | |
| Fannie Mae Pool #BF0379 3.50% 20591 | | | 156 | | | | 152 | |
| Fannie Mae Pool #BF0497 3.00% 20601 | | | 56 | | | | 53 | |
| Fannie Mae Pool #BF0481 3.50% 20601 | | | 188 | | | | 183 | |
| Freddie Mac Pool #A18781 5.00% 20341,3 | | | 655 | | | | 689 | |
| Freddie Mac Pool #RB5138 2.00% 20411 | | | 106 | | | | 95 | |
| Freddie Mac Pool #RB5148 2.00% 20421 | | | 617 | | | | 547 | |
| Freddie Mac Pool #RB5145 2.00% 20421 | | | 98 | | | | 87 | |
| Freddie Mac Pool #Q15874 4.00% 20431 | | | 1 | | | | 1 | |
| Freddie Mac Pool #760014 2.797% 20451,4 | | | 383 | | | | 381 | |
| Freddie Mac Pool #760012 3.113% 20451,4 | | | 40 | | | | 40 | |
| Freddie Mac Pool #760013 3.202% 20451,4 | | | 25 | | | | 25 | |
| Freddie Mac Pool #760015 2.557% 20471,4 | | | 70 | | | | 69 | |
| Freddie Mac Pool #Q52069 3.50% 20471 | | | 32 | | | | 31 | |
| Freddie Mac Pool #Q47615 3.50% 20471 | | | 19 | | | | 18 | |
| Freddie Mac Pool #Q56599 4.00% 20481 | | | 32 | | | | 32 | |
| Freddie Mac Pool #Q55971 4.00% 20481 | | | 22 | | | | 22 | |
| Freddie Mac Pool #Q56175 4.00% 20481 | | | 19 | | | | 19 | |
| Freddie Mac Pool #Q55970 4.00% 20481 | | | 11 | | | | 11 | |
| Freddie Mac Pool #Q58411 4.50% 20481 | | | 58 | | | | 60 | |
| Freddie Mac Pool #Q58436 4.50% 20481 | | | 31 | | | | 32 | |
| Freddie Mac Pool #Q58378 4.50% 20481 | | | 21 | | | | 21 | |
| Freddie Mac Pool #RA1339 3.00% 20491,3 | | | 1,580 | | | | 1,482 | |
| Freddie Mac Pool #QA2748 3.50% 20491 | | | 21 | | | | 21 | |
| Freddie Mac Pool #SD7550 3.00% 20521 | | | 425 | | | | 401 | |
| Freddie Mac Pool #SD0873 3.50% 20521,3 | | | 1,280 | | | | 1,249 | |
| Freddie Mac, Series K749, Class A2, Multi Family, 2.12% 20291 | | | 131 | | | | 120 | |
| Freddie Mac, Series K143, Class A2, Multi Family, 2.35% 20321 | | | 275 | | | | 246 | |
| Freddie Mac, Series K144, Class A2, Multi Family, 2.45% 20321 | | | 100 | | | | 90 | |
| American Funds Insurance Series | 221 |
American Funds Mortgage Fund (continued)
| Bonds, notes & other debt instruments (continued) | | Principal amount
(000) | | | Value
(000) | |
| Mortgage-backed obligations (continued) | | | | | | |
| Federal agency mortgage-backed obligations (continued) | | | | | | |
| Freddie Mac Seasoned Credit Risk Transfer Trust, Series 2017-2, Class MA, 3.00% 20561 | | USD | 224 | | | $ | 219 | |
| Freddie Mac Seasoned Credit Risk Transfer Trust, Series 2017-2, Class HA, 3.00% 20561,4 | | | 166 | | | | 162 | |
| Freddie Mac Seasoned Credit Risk Transfer Trust, Series 2017-1, Class HA, 3.00% 20561,4 | | | 143 | | | | 139 | |
| Freddie Mac Seasoned Credit Risk Transfer Trust, Series 2017-3, Class HT, 3.25% 20561 | | | 105 | | | | 101 | |
| Freddie Mac Seasoned Credit Risk Transfer Trust, Series 2018-1, Class HT, 3.00% 20571 | | | 117 | | | | 111 | |
| Freddie Mac Seasoned Credit Risk Transfer Trust, Series 2017-4, Class HT, 3.25% 20571,4 | | | 102 | | | | 99 | |
| Freddie Mac Seasoned Credit Risk Transfer Trust, Series 2018-3, Class MA, 3.50% 20571 | | | 160 | | | | 158 | |
| Freddie Mac Seasoned Credit Risk Transfer Trust, Series 2019-2, Class MT, 3.50% 20581 | | | 32 | | | | 31 | |
| Freddie Mac Seasoned Credit Risk Transfer Trust, Series 2019-3, Class MT, 3.50% 20581 | | | 19 | | | | 19 | |
| Freddie Mac Seasoned Loan Structured Transaction Trust, Series 2018-1, Class A1, 3.50% 20281 | | | 331 | | | | 328 | |
| Freddie Mac Seasoned Loan Structured Transaction Trust, Series 2018-2, Class A1, 3.50% 20281 | | | 15 | | | | 15 | |
| Freddie Mac Seasoned Loan Structured Transaction Trust, Series 2022-1, Class A1, 3.50% 20321 | | | 494 | | | | 488 | |
| Government National Mortgage Assn. 2.00% 20521,5 | | | 175 | | | | 155 | |
| Government National Mortgage Assn. 2.50% 20521,5 | | | 407 | | | | 373 | |
| Government National Mortgage Assn. 3.00% 20521,5 | | | 3,033 | | | | 2,860 | |
| Government National Mortgage Assn. 3.50% 20521,5 | | | 378 | | | | 366 | |
| Government National Mortgage Assn. 4.00% 20521,5 | | | 183 | | | | 182 | |
| Government National Mortgage Assn. 4.00% 20521,5 | | | 156 | | | | 156 | |
| Government National Mortgage Assn. 4.50% 20521,5 | | | 3,527 | | | | 3,566 | |
| Government National Mortgage Assn. 5.00% 20521,5 | | | 8,570 | | | | 8,751 | |
| Government National Mortgage Assn. 5.00% 20521,5 | | | 425 | | | | 436 | |
| Government National Mortgage Assn. Pool #AH5894 3.75% 20341 | | | 713 | | | | 728 | |
| Government National Mortgage Assn. Pool #AD0028 3.75% 20381 | | | 551 | | | | 550 | |
| Government National Mortgage Assn. Pool #AH5897 3.75% 20391 | | | 535 | | | | 534 | |
| Government National Mortgage Assn. Pool #004410 4.00% 20391 | | | 56 | | | | 54 | |
| Government National Mortgage Assn. Pool #783690 6.00% 20391 | | | 92 | | | | 101 | |
| Government National Mortgage Assn. Pool #004823 4.00% 20401 | | | 84 | | | | 82 | |
| Government National Mortgage Assn. Pool #005142 4.50% 20411 | | | 12 | | | | 12 | |
| Government National Mortgage Assn. Pool #005104 5.00% 20411 | | | 172 | | | | 178 | |
| Government National Mortgage Assn. Pool #005165 6.50% 20411 | | | 84 | | | | 87 | |
| Government National Mortgage Assn. Pool #MA0366 3.50% 20421 | | | 201 | | | | 190 | |
| Government National Mortgage Assn. Pool #AA5326 3.50% 20421 | | | 135 | | | | 131 | |
| Government National Mortgage Assn. Pool #AD4360 3.50% 20431 | | | 92 | | | | 91 | |
| Government National Mortgage Assn. Pool #AF0140 3.50% 20431 | | | 60 | | | | 59 | |
| Government National Mortgage Assn. Pool #AH5884 4.25% 20441 | | | 1,123 | | | | 1,135 | |
| Government National Mortgage Assn. Pool #AO0409 4.62% 20651 | | | 150 | | | | 150 | |
| Government National Mortgage Assn. Pool #AO0461 4.632% 20651 | | | 76 | | | | 77 | |
| Government National Mortgage Assn. Pool #AN1825 4.633% 20651 | | | 254 | | | | 255 | |
| Government National Mortgage Assn. Pool #AO0385 4.494% 20661 | | | 571 | | | | 574 | |
| Government National Mortgage Assn. Pool #725897 5.20% 20661 | | | 1 | | | | 1 | |
| Uniform Mortgage-Backed Security 2.00% 20521,5 | | | 2,322 | | | | 2,013 | |
| Uniform Mortgage-Backed Security 2.50% 20521,5 | | | 2,106 | | | | 1,892 | |
| Uniform Mortgage-Backed Security 3.50% 20521,5 | | | 4,633 | | | | 4,451 | |
| Uniform Mortgage-Backed Security 4.00% 20521,5 | | | 12,411 | | | | 12,201 | |
| Uniform Mortgage-Backed Security 4.50% 20521,5 | | | 5,220 | | | | 5,230 | |
| 222 | American Funds Insurance Series |
American Funds Mortgage Fund (continued)
| Bonds, notes & other debt instruments (continued) | | Principal amount
(000) | | | Value
(000) | |
| Mortgage-backed obligations (continued) | | | | | | |
| Federal agency mortgage-backed obligations (continued) | | | | | | | | |
| Uniform Mortgage-Backed Security 4.50% 20521,5 | | USD | 245 | | | $ | 245 | |
| Uniform Mortgage-Backed Security 5.00% 20521,5 | | | 4,635 | | | | 4,719 | |
| Uniform Mortgage-Backed Security 5.00% 20521,5 | | | 440 | | | | 447 | |
| | | | | | | | 65,205 | |
| | | | | | | | | |
| Collateralized mortgage-backed obligations (privately originated) 2.37% | | | |
| Cascade Funding Mortgage Trust, Series 2020-HB4, Class A, 0.946% 20301,4,6 | | | 101 | | | | 100 | |
| Cascade Funding Mortgage Trust, Series 2021-HB7, Class A, 1.151% 20311,4,6 | | | 106 | | | | 104 | |
| Cascade Funding Mortgage Trust, Series 2021-HB6, Class A, 0.898% 20361,4,6 | | | 357 | | | | 351 | |
| CIM Trust, Series 2022-R2, Class A1, 3.75% 20611,4,6 | | | 196 | | | | 190 | |
| COLT Funding, LLC, Series 2021-5, Class A1, 1.726% 20661,4,6 | | | 91 | | | | 83 | |
| Credit Suisse Mortgage Trust, Series 2017-RPL3, Class A1, 2.00% 20601,4,6 | | | 171 | | | | 161 | |
| GCAT, Series 2021-NQM6, Class A1, 1.855% 20661,4,6 | | | 107 | | | | 98 | |
| GS Mortgage-Backed Securities Trust, Series 2022-PJ5, Class A4, 2.50% 20521,4,6 | | | 217 | | | | 189 | |
| Mello Warehouse Securitization Trust, Series 2020-2, Class A, (1-month USD-LIBOR + 0.80%) 2.424% 20531,4,6 | | | 27 | | | | 27 | |
| Mello Warehouse Securitization Trust, Series 2021-2, Class A, (1-month USD-LIBOR + 0.75%) 2.374% 20551,4,6 | | | 210 | | | | 207 | |
| Mello Warehouse Securitization Trust, Series 2021-3, Class A, (1-month USD-LIBOR + 0.85%) 2.474% 20551,4,6 | | | 175 | | | | 170 | |
| Mill City Mortgage Trust, Series 15-1, Class M2, 3.631% 20561,4,6 | | | 60 | | | | 60 | |
| Onslow Bay Financial Mortgage Loan Trust, Series 2022-J1, Class A2, 2.50% 20521,4,6 | | | 141 | | | | 121 | |
| Reverse Mortgage Investment Trust, Series 2021-HB1, Class A, 1.259% 20311,4,6 | | | 128 | | | | 123 | |
| Towd Point Mortgage Trust, Series 2015-4, Class M2, 3.75% 20551,4,6 | | | 100 | | | | 99 | |
| Towd Point Mortgage Trust, Series 2015-4, Class M1, 3.75% 20551,4,6 | | | 45 | | | | 45 | |
| Towd Point Mortgage Trust, Series 2016-5, Class A1, 2.50% 20561,4,6 | | | 61 | | | | 61 | |
| Towd Point Mortgage Trust, Series 2017-5, Class A1, 2.224% 20571,4,6 | | | 13 | | | | 13 | |
| | | | | | | | 2,202 | |
| | | | | | | | | |
| Commercial mortgage-backed securities 1.71% | | | | | | | | |
| Boca Commercial Mortgage Trust, Series 2022-BOCA, Class A, (1-month USD CME Term SOFR + 1.767%) 2.27% 20391,4,6 | | | 100 | | | | 98 | |
| BX Trust, Series 2022-CSMO, Class A, (1-month USD CME Term SOFR + 2.11%) 2.865% 20271,4,6 | | | 100 | | | | 99 | |
| BX Trust, Series 2021-VOLT, Class A, (1-month USD-LIBOR + 0.70%) 2.024% 20361,4,6 | | | 100 | | | | 97 | |
| BX Trust, Series 2021-ARIA, Class A, (1-month USD-LIBOR + 0.899%) 2.223% 20361,4,6 | | | 606 | | | | 571 | |
| LUXE Commercial Mortgage Trust, Series 2021-TRIP, Class A, (1-month USD-LIBOR + 1.05%) 2.374% 20381,4,6 | | | 475 | | | | 458 | |
| MHC Commercial Mortgage Trust, CMO, Series 2021-MHC, Class A, (1-month USD-LIBOR + 0.801%) 2.125% 20261,4,6 | | | 273 | | | | 266 | |
| | | | | | | | 1,589 | |
| | | | | | | | | |
| Total mortgage-backed obligations | | | | | | | 68,996 | |
| | | | | | | | | |
| U.S. Treasury bonds & notes 15.26% | | | |
| U.S. Treasury inflation-protected securities 9.74% | | | |
| U.S. Treasury Inflation-Protected Security 0.125% 20237 | | | 693 | | | | 705 | |
| U.S. Treasury Inflation-Protected Security 0.375% 20237 | | | 643 | | | | 654 | |
| U.S. Treasury Inflation-Protected Security 0.625% 20237 | | | 345 | | | | 351 | |
| U.S. Treasury Inflation-Protected Security 0.125% 20247 | | | 638 | | | | 645 | |
| U.S. Treasury Inflation-Protected Security 0.125% 20247 | | | 104 | | | | 105 | |
| U.S. Treasury Inflation-Protected Security 0.50% 20247 | | | 244 | | | | 248 | |
| U.S. Treasury Inflation-Protected Security 0.625% 20243,7 | | | 4,262 | | | | 4,332 | |
| U.S. Treasury Inflation-Protected Security 0.125% 20257 | | | 123 | | | | 123 | |
| U.S. Treasury Inflation-Protected Security 0.125% 20267 | | | 63 | | | | 63 | |
| American Funds Insurance Series | 223 |
American Funds Mortgage Fund (continued)
| Bonds, notes & other debt instruments (continued) | | Principal amount
(000) | | | Value
(000) | |
| U.S. Treasury bonds & notes (continued) | | | | | | |
| U.S. Treasury inflation-protected securities (continued) | | | | | | |
| U.S. Treasury Inflation-Protected Security 0.125% 20317 | | USD | 1,166 | | | $ | 1,106 | |
| U.S. Treasury Inflation-Protected Security 0.75% 20427 | | | 414 | | | | 376 | |
| U.S. Treasury Inflation-Protected Security 1.00% 20497 | | | 373 | | | | 357 | |
| | | | | | | | 9,065 | |
| | | | | | | | | |
| U.S. Treasury 5.52% | | | | | | | | |
| U.S. Treasury 0.875% 2024 | | | 70 | | | | 68 | |
| U.S. Treasury 1.125% 2028 | | | 1,102 | | | | 991 | |
| U.S. Treasury 1.25% 2028 | | | 415 | | | | 373 | |
| U.S. Treasury 1.50% 2028 | | | 150 | | | | 136 | |
| U.S. Treasury 1.25% 2031 | | | 443 | | | | 381 | |
| U.S. Treasury 1.875% 2032 | | | 10 | | | | 9 | |
| U.S. Treasury 2.875% 2032 | | | 550 | | | | 544 | |
| U.S. Treasury 1.875% 20413 | | | 775 | | | | 606 | |
| U.S. Treasury 2.375% 2042 | | | 750 | | | | 633 | |
| U.S. Treasury 3.25% 2042 | | | 250 | | | | 243 | |
| U.S. Treasury 1.625% 2050 | | | 620 | | | | 434 | |
| U.S. Treasury 1.875% 2051 | | | 965 | | | | 721 | |
| | | | | | | | 5,139 | |
| | | | | | | | | |
| Total U.S. Treasury bonds & notes | | | | | | | 14,204 | |
| | | | | | | | | |
| Asset-backed obligations 4.34% | | | | | | | | |
| Ballyrock CLO, Ltd., Series 2019-2A, Class A1AR, (3-month USD-LIBOR + 1.00%) 2.478% 20301,4,6 | | | 250 | | | | 246 | |
| Bankers Healthcare Group Securitization Trust, Series 2021-A, Class A, 1.42% 20331,6 | | | 65 | | | | 61 | |
| Bankers Healthcare Group Securitization Trust, Series 2021-B, Class A, 0.90% 20341,6 | | | 70 | | | | 66 | |
| CF Hippolyta, LLC, Series 2020-1, Class A1, 1.69% 20601,6 | | | 290 | | | | 263 | |
| CF Hippolyta, LLC, Series 2021-1, Class A1, 1.53% 20611,6 | | | 426 | | | | 377 | |
| CPS Auto Receivables Trust, Series 2022-B, Class A, 2.88% 20261,6 | | | 93 | | | | 92 | |
| Exeter Automobile Receivables Trust, Series 2019-3A, Class C, 2.79% 20241,6 | | | 16 | | | | 16 | |
| FirstKey Homes Trust, Series 2022-SFR2, Class A, 4.145% 20391,6 | | | 100 | | | | 98 | |
| Hertz Vehicle Financing III, LLC, Series 2021-1A, Class A, 1.21% 20251,6 | | | 86 | | | | 81 | |
| Navient Student Loan Trust, Series 2021-A, Class A, 0.84% 20691,6 | | | 129 | | | | 118 | |
| Navient Student Loan Trust, Series 2021-C, Class A, 1.06% 20691,6 | | | 235 | | | | 216 | |
| Navient Student Loan Trust, Series 2021-FA, Class A, 1.11% 20701,6 | | | 215 | | | | 189 | |
| Nelnet Student Loan Trust, Series 2021-A, Class APT1, 1.36% 20621,6 | | | 216 | | | | 200 | |
| Nelnet Student Loan Trust, Series 2021-B, Class AFX, 1.42% 20621,6 | | | 784 | | | | 728 | |
| Nelnet Student Loan Trust, Series 2021-C, Class AFL, (1-month USD-LIBOR + 0.74%) 2.335% 20621,4,6 | | | 593 | | | | 579 | |
| New Economy Assets Phase 1 Issuer, LLC, Series 2021-1, Class A1, 1.91% 20611,6 | | | 530 | | | | 463 | |
| Sound Point CLO, Ltd., Series 2015-1RA, Class AR, (3-month USD-LIBOR + 1.08%) 2.124% 20301,4,6 | | | 250 | | | | 247 | |
| | | | | | | | 4,040 | |
| | | | | | | | | |
| Bonds & notes of governments & government agencies outside the U.S. 0.55% | | | |
| CPPIB Capital, Inc. 0.875% 20266 | | | 320 | | | | 290 | |
| Ontario Teachers’ Finance Trust 0.875% 20266 | | | 250 | | | | 225 | |
| | | | | | | | 515 | |
| | | | | | | | | |
| Federal agency bonds & notes 0.27% | | | | | | | | |
| Fannie Mae 0.875% 2030 | | | 300 | | | | 248 | |
| | | | | | | | | |
| Total bonds, notes & other debt instruments (cost: $90,234,000) | | | | | | | 88,003 | |
| 224 | American Funds Insurance Series |
American Funds Mortgage Fund (continued)
| Short-term securities 54.13% | | Weighted
average yield
at acquisition | | | Principal amount
(000) | | | Value
(000) | |
| Federal agency bills & notes 23.46% | | | | | | | | | |
| Fannie Mae 8/31/2022 | | | 1.200 | % | | USD | 4,000 | | | $ | 3,990 | |
| Federal Farm Credit Banks 8/18/2022 | | | 1.140 | | | | 945 | | | | 943 | |
| Federal Home Loan Bank 7/6/2022 | | | 1.360 | | | | 4,000 | | | | 3,999 | |
| Federal Home Loan Bank 7/13/2022 | | | 0.930 | | | | 11,000 | | | | 10,996 | |
| Federal Home Loan Bank 8/12/2022 | | | 1.650 | | | | 900 | | | | 899 | |
| Tennessee Valley Authority 7/6/2022 | | | 1.370 | | | | 1,000 | | | | 1,000 | |
| | | | | | | | | | | | 21,827 | |
| | | | | | | | | | | | | |
| Commercial paper 21.77% | | | | | | | | | | | | |
| Apple, Inc. 8/1/20226 | | | 1.000 | | | | 1,500 | | | | 1,498 | |
| Atlantic Asset Securitization, LLC 7/1/20226 | | | 1.560 | | | | 500 | | | | 500 | |
| BofA Securities, Inc. 8/29/20226 | | | 2.000 | | | | 800 | | | | 797 | |
| BofA Securities, Inc. 9/6/20226 | | | 1.543 | | | | 1,200 | | | | 1,195 | |
| Chariot Funding, LLC 8/10/20226 | | | 1.650 | | | | 1,000 | | | | 998 | |
| CHARTA, LLC 9/8/20226 | | | 1.600 | | | | 2,000 | | | | 1,992 | |
| Coca-Cola Co. 8/9/20226 | | | 1.000 | | | | 1,600 | | | | 1,597 | |
| Eli Lilly and Co. 7/1/20226 | | | 0.900 | | | | 2,000 | | | | 2,000 | |
| Henkel of America, Inc. 7/19/20226 | | | 0.850 | | | | 2,000 | | | | 1,998 | |
| Honeywell International, Inc. 10/17/20226 | | | 2.050 | | | | 2,000 | | | | 1,987 | |
| Linde, Inc. 7/6/2022 | | | 1.590 | | | | 2,000 | | | | 2,000 | |
| Paccar Financial Corp. 7/1/2022 | | | 0.950 | | | | 200 | | | | 200 | |
| Procter & Gamble Co. 7/11/20226 | | | 0.780 | | | | 2,000 | | | | 1,999 | |
| Wal-Mart Stores, Inc. 7/25/20226 | | | 1.543 | | | | 1,000 | | | | 999 | |
| Wal-Mart Stores, Inc. 8/8/20226 | | | 1.650 | | | | 500 | | | | 499 | |
| | | | | | | | | | | | 20,259 | |
| | | | | | | | | | | | | |
| U.S. Treasury bills 8.90% | | | | | | | | | | | | |
| U.S. Treasury 8/16/2022 | | | 1.350 | | | | 550 | | | | 549 | |
| U.S. Treasury 8/18/2022 | | | 1.010 | | | | 5,750 | | | | 5,739 | |
| U.S. Treasury 8/23/2022 | | | 1.430 | | | | 2,000 | | | | 1,996 | |
| | | | | | | | | | | | 8,284 | |
| | | | | | | | | | | | | |
| Total short-term securities (cost: $50,383,000) | | | | | | 50,370 | |
| Total investment securities 148.70% (cost: $140,617,000) | | | | | | 138,373 | |
| Other assets less liabilities (48.70)% | | | | | | | | | | | (45,320 | ) |
| | | | | | | | | | | | | |
| Net assets 100.00% | | | | | | | | | | $ | 93,053 | |
| American Funds Insurance Series | 225 |
American Funds Mortgage Fund (continued)
Futures contracts
| Contracts | | Type | | Number of
contracts | | Expiration | | Notional
amount
(000) | | Value and
unrealized
appreciation
(depreciation)
at 6/30/2022
(000) | |
| 30 Day Federal Funds Futures | | Long | | 42 | | September 2022 | | USD | 17,105 | | | $ | 6 | |
| 3 Month SOFR Futures | | Short | | 12 | | June 2023 | | | (2,899 | ) | | | 3 | |
| 2 Year U.S. Treasury Note Futures | | Short | | 28 | | September 2022 | | | (5,880 | ) | | | (12 | ) |
| 5 Year U.S. Treasury Note Futures | | Long | | 77 | | September 2022 | | | 8,643 | | | | (27 | ) |
| 10 Year Ultra U.S. Treasury Note Futures | | Long | | 60 | | September 2022 | | | 7,643 | | | | (73 | ) |
| 10 Year U.S. Treasury Note Futures | | Long | | 12 | | September 2022 | | | 1,422 | | | | (17 | ) |
| 20 Year U.S. Treasury Bond Futures | | Long | | 12 | | September 2022 | | | 1,664 | | | | 31 | |
| 30 Year Ultra U.S. Treasury Bond Futures | | Long | | 1 | | September 2022 | | | 154 | | | | (5 | ) |
| | | | | | | | | | | | | $ | (94 | ) |
Swap contracts
Interest rate swaps
Centrally cleared interest rate swaps
| | | | | | | | | | | | | | | | | Upfront | | | Unrealized | |
| Receive | | Pay | | | | | Notional | | | Value at | | | premium | | | appreciation | |
| Rate | | Payment
frequency | | Rate | | Payment
frequency | | Expiration
date | | | amount
(000) | | | 6/30/2022
(000) | | | paid
(000) | | | at 6/30/2022
(000) | |
| 3-month USD-LIBOR | | Quarterly | | 0.81% | | Semi-annual | | 7/28/2045 | | | USD | 1,800 | | | $ | 675 | | | $ | 5 | | | $ | 670 | |
| 1 | Principal payments may be made periodically. Therefore, the effective maturity date may be earlier than the stated maturity date. |
| 2 | Amount less than one thousand. |
| 3 | All or a portion of this security was pledged as collateral. The total value of pledged collateral was $673,000, which represented .72% of the net assets of the fund. |
| 4 | Coupon rate may change periodically. Reference rate and spread are as of the most recent information available. Some coupon rates are determined by the issuer or agent based on current market conditions; therefore, the reference rate and spread are not available. For short-term securities, the date of the next scheduled coupon rate change is considered to be the maturity date. |
| 5 | Purchased on a TBA basis. |
| 6 | Acquired in a transaction exempt from registration under Rule 144A or Section 4(2) of the Securities Act of 1933. May be resold in the U.S. in transactions exempt from registration, normally to qualified institutional buyers. The total value of all such securities was $26,405,000, which represented 28.38% of the net assets of the fund. |
| 7 | Index-linked bond whose principal amount moves with a government price index. |
Key to abbreviations
Assn. = Association
CLO = Collateralized Loan Obligations
CME = CME Group
CMO = Collateralized Mortgage Obligations
LIBOR = London Interbank Offered Rate
SOFR = Secured Overnight Financing Rate
TBA = To be announced
USD = U.S. dollars
Refer to the notes to financial statements.
| 226 | American Funds Insurance Series |
| Ultra-Short Bond Fund | |
| Investment portfolio June 30, 2022 | unaudited |
| Short-term securities 98.17% | | Weighted
average yield
at acquisition | | | Principal amount
(000) | | | Value
(000) | |
| Commercial paper 69.40% | | | | | | | | | |
| ANZ New Zealand (International), Ltd. 8/15/20221 | | | 1.400 | % | | USD | 3,700 | | | $ | 3,691 | |
| Bank of Montreal 7/19/20221 | | | 1.600 | | | | 10,500 | | | | 10,491 | |
| BofA Securities, Inc. 8/22/20221 | | | 1.850 | | | | 10,000 | | | | 9,971 | |
| British Columbia (Province of) 7/20/2022 | | | 1.050 | | | | 4,800 | | | | 4,796 | |
| British Columbia (Province of) 8/22/2022 | | | 1.346 | | | | 1,900 | | | | 1,895 | |
| British Columbia (Province of) 8/25/2022 | | | 1.340 | | | | 4,000 | | | | 3,989 | |
| Caisse d’Amortissement de la Dette Sociale 7/13/2022 | | | 1.130 | | | | 2,445 | | | | 2,444 | |
| Caisse d’Amortissement de la Dette Sociale 8/30/2022 | | | 1.938 | | | | 7,000 | | | | 6,976 | |
| Chariot Funding, LLC 7/26/20221 | | | 1.148 | | | | 7,500 | | | | 7,491 | |
| CRC Funding, LLC 9/12/20221 | | | 1.570 | | | | 10,300 | | | | 10,255 | |
| DBS Bank, Ltd. 9/1/20221 | | | 1.570 | | | | 5,000 | | | | 4,982 | |
| DBS Bank, Ltd. 9/22/20221 | | | 2.220 | | | | 4,000 | | | | 3,979 | |
| DNB Bank ASA 7/8/20221 | | | 1.165 | | | | 4,000 | | | | 3,999 | |
| EssilorLuxottica 9/22/20221 | | | 2.200 | | | | 4,100 | | | | 4,081 | |
| Gotham Funding Corp. 7/15/20221 | | | 1.080 | | | | 8,300 | | | | 8,294 | |
| Gotham Funding Corp. 8/30/20221 | | | 1.520 | | | | 3,000 | | | | 2,990 | |
| Hydro-Québec 7/25/20221 | | | 1.550 | | | | 10,500 | | | | 10,489 | |
| ING (U.S.) Funding, LLC 7/26/2022 | | | 1.120 | | | | 7,000 | | | | 6,992 | |
| KfW 8/23/20221 | | | 1.950 | | | | 9,200 | | | | 9,174 | |
| Komatsu Finance America, Inc. 7/21/20221 | | | 1.600 | | | | 3,600 | | | | 3,597 | |
| Liberty Street Funding, LLC 7/28/20221 | | | 1.200 | | | | 3,000 | | | | 2,996 | |
| Liberty Street Funding, LLC 9/22/20221 | | | 2.200 | | | | 5,000 | | | | 4,974 | |
| LMA-Americas, LLC 7/19/20221 | | | 1.180 | | | | 3,700 | | | | 3,697 | |
| Longship Funding, LLC 7/6/20221 | | | 1.180 | | | | 6,000 | | | | 5,998 | |
| Longship Funding, LLC 7/13/20221 | | | 1.310 | | | | 5,000 | | | | 4,997 | |
| LVMH Moët Hennessy Louis Vuitton, Inc. 8/25/20221 | | | 1.900 | | | | 2,100 | | | | 2,094 | |
| LVMH Moët Hennessy Louis Vuitton, Inc. 9/20/20221 | | | 2.000 | | | | 5,600 | | | | 5,574 | |
| Mizuho Bank, Ltd. 7/18/20221 | | | 0.995 | | | | 10,000 | | | | 9,992 | |
| Nederlandse Waterschapsbank NV 7/28/20221 | | | 1.208 | | | | 10,000 | | | | 9,986 | |
| Nestlé Finance International, Ltd. 7/11/20221 | | | 1.200 | | | | 7,000 | | | | 6,997 | |
| Nestlé Finance International, Ltd. 8/31/20221 | | | 1.383 | | | | 4,100 | | | | 4,089 | |
| Novartis Finance Corp. 7/22/20221 | | | 1.590 | | | | 8,000 | | | | 7,992 | |
| Oesterreich Kontrollbank 7/18/2022 | | | 1.600 | | | | 5,800 | | | | 5,795 | |
| Oesterreich Kontrollbank 8/29/2022 | | | 1.909 | | | | 5,000 | | | | 4,984 | |
| Old Line Funding, LLC 7/6/20221 | | | 0.870 | | | | 10,000 | | | | 9,997 | |
| Siemens Capital Co., LLC 7/1/20221 | | | 1.560 | | | | 5,000 | | | | 5,000 | |
| Siemens Capital Co., LLC 7/11/20221 | | | 0.810 | | | | 4,900 | | | | 4,898 | |
| Sumitomo Mitsui Banking Corp. 7/27/20221 | | | 1.600 | | | | 5,000 | | | | 4,994 | |
| Sumitomo Mitsui Trust Bank, Ltd. 8/5/20221 | | | 1.750 | | | | 8,000 | | | | 7,986 | |
| Sumitomo Mitsui Trust Bank, Ltd. 8/26/20221 | | | 1.475 | | | | 2,800 | | | | 2,791 | |
| Swedish Export Credit Corp. 8/8/2022 | | | 1.250 | | | | 10,000 | | | | 9,982 | |
| TotalEnergies Capital Canada, Ltd. 7/1/20221 | | | 1.640 | | | | 11,000 | | | | 11,000 | |
| Toyota Industries Commercial Finance, Inc. 7/26/20221 | | | 1.120 | | | | 7,900 | | | | 7,891 | |
| Toyota Industries Commercial Finance, Inc. 9/6/20221 | | | 1.500 | | | | 3,000 | | | | 2,989 | |
| Toyota Motor Credit Corp. 7/18/2022 | | | 1.240 | | | | 5,000 | | | | 4,996 | |
| United Overseas Bank, Ltd. 7/12/20221 | | | 1.120 | | | | 10,000 | | | | 9,995 | |
| Wal-Mart Stores, Inc. 8/1/20221 | | | 1.630 | | | | 11,000 | | | | 10,984 | |
| | | | | | | | | | | | 294,244 | |
| | | | | | | | | | | | | |
| Federal agency bills & notes 17.61% | | | | | | | | | | | | |
| Federal Home Loan Bank 7/13/2022 | | | 0.861 | | | | 21,600 | | | | 21,592 | |
| Federal Home Loan Bank 7/15/2022 | | | 0.930 | | | | 3,300 | | | | 3,299 | |
| Federal Home Loan Bank 7/27/2022 | | | 0.990 | | | | 8,000 | | | | 7,993 | |
| Federal Home Loan Bank 7/29/2022 | | | 1.030 | | | | 5,000 | | | | 4,996 | |
| Federal Home Loan Bank 8/3/2022 | | | 1.050 | | | | 5,000 | | | | 4,995 | |
| Federal Home Loan Bank 8/17/2022 | | | 1.660 | | | | 15,000 | | | | 14,974 | |
| Federal Home Loan Bank 8/24/2022 | | | 1.630 | | | | 1,900 | | | | 1,896 | |
| American Funds Insurance Series | 227 |
Ultra-Short Bond Fund (continued)
| Short-term securities (continued) | | Weighted
average yield
at acquisition | | | Principal amount
(000) | | | Value
(000) | |
| Federal agency bills & notes (continued) | | | | | | | | | |
| Federal Home Loan Bank 9/2/2022 | | | 1.190 | % | | USD | 5,000 | | | $ | 4,987 | |
| Federal Home Loan Bank 9/28/2022 | | | 1.870 | | | | 5,000 | | | | 4,979 | |
| Federal Home Loan Bank 10/13/2022 | | | 1.907 | | | | 5,000 | | | | 4,974 | |
| | | | | | | | | | | | 74,685 | |
| | | | | | | | | | | | | |
| U.S. Treasury bills 11.16% | | | | | | | | | | | | |
| U.S. Treasury 7/19/2022 | | | 0.678 | | | | 10,000 | | | | 9,995 | |
| U.S. Treasury 7/21/2022 | | | 0.800 | | | | 10,000 | | | | 9,994 | |
| U.S. Treasury 8/2/2022 | | | 1.013 | | | | 3,200 | | | | 3,197 | |
| U.S. Treasury 8/9/2022 | | | 0.942 | | | | 10,000 | | | | 9,987 | |
| U.S. Treasury 9/8/2022 | | | 1.375 | | | | 4,200 | | | | 4,188 | |
| U.S. Treasury 10/18/2022 | | | 1.936 | | | | 10,000 | | | | 9,940 | |
| | | | | | | | | | | | 47,301 | |
| | | | | | | | | | | | | |
| Total short-term securities (cost: $416,305,000) | | | | | | | | | | | 416,230 | |
| Total investment securities 98.17% (cost: $416,305,000) | | | | | | | | | | | 416,230 | |
| Other assets less liabilities 1.83% | | | | | | | | | | | 7,777 | |
| | | | | | | | | | | | | |
| Net assets 100.00% | | | | | | | | | | $ | 424,007 | |
| 1 | Acquired in a transaction exempt from registration under Rule 144A or Section 4(2) of the Securities Act of 1933. May be resold in the U.S. in transactions exempt from registration, normally to qualified institutional buyers. The total value of all such securities was $241,395,000, which represented 56.93% of the net assets of the fund. |
Refer to the notes to financial statements.
| 228 | American Funds Insurance Series |
| U.S. Government Securities Fund | |
| Investment portfolio June 30, 2022 | unaudited |
| Bonds, notes & other debt instruments 91.14% | Principal amount
(000) | | | Value
(000) | |
| Mortgage-backed obligations 46.39% | | | | | | | | |
| Federal agency mortgage-backed obligations 46.39% | | | | | | | | |
| Fannie Mae Pool #695412 5.00% 20331 | | USD | 1 | | | $ | 1 | |
| Fannie Mae Pool #AD3566 5.00% 20351 | | | 6 | | | | 7 | |
| Fannie Mae Pool #MA2746 4.00% 20361 | | | 1,483 | | | | 1,509 | |
| Fannie Mae Pool #MA2588 4.00% 20361 | | | 740 | | | | 753 | |
| Fannie Mae Pool #256860 6.50% 20371 | | | 12 | | | | 13 | |
| Fannie Mae Pool #888698 7.00% 20371 | | | 17 | | | | 18 | |
| Fannie Mae Pool #256828 7.00% 20371 | | | 3 | | | | 3 | |
| Fannie Mae Pool #970343 6.00% 20381 | | | 14 | | | | 15 | |
| Fannie Mae Pool #AC0794 5.00% 20391 | | | 20 | | | | 21 | |
| Fannie Mae Pool #931768 5.00% 20391 | | | 6 | | | | 6 | |
| Fannie Mae Pool #932606 5.00% 20401 | | | 11 | | | | 12 | |
| Fannie Mae Pool #MA4501 2.00% 20411 | | | 3,084 | | | | 2,758 | |
| Fannie Mae Pool #AJ1873 4.00% 20411 | | | 27 | | | | 27 | |
| Fannie Mae Pool #AI1862 5.00% 20411 | | | 404 | | | | 424 | |
| Fannie Mae Pool #AI3510 5.00% 20411 | | | 232 | | | | 242 | |
| Fannie Mae Pool #AJ0704 5.00% 20411 | | | 187 | | | | 196 | |
| Fannie Mae Pool #AJ5391 5.00% 20411 | | | 137 | | | | 144 | |
| Fannie Mae Pool #AE1248 5.00% 20411 | | | 36 | | | | 38 | |
| Fannie Mae Pool #AE1277 5.00% 20411 | | | 18 | | | | 19 | |
| Fannie Mae Pool #AE1283 5.00% 20411 | | | 10 | | | | 10 | |
| Fannie Mae Pool #MA4540 2.00% 20421 | | | 1,422 | | | | 1,271 | |
| Fannie Mae Pool #MA4570 2.00% 20421 | | | 916 | | | | 814 | |
| Fannie Mae Pool #AE1290 5.00% 20421 | | | 22 | | | | 23 | |
| Fannie Mae Pool #AT7161 3.50% 20431 | | | 46 | | | | 45 | |
| Fannie Mae Pool #AT3954 3.50% 20431 | | | 8 | | | | 8 | |
| Fannie Mae Pool #AT0300 3.50% 20431 | | | 7 | | | | 7 | |
| Fannie Mae Pool #AY1829 3.50% 20441 | | | 8 | | | | 8 | |
| Fannie Mae Pool #BE5017 3.50% 20451 | | | 64 | | | | 63 | |
| Fannie Mae Pool #BE8740 3.50% 20471 | | | 62 | | | | 61 | |
| Fannie Mae Pool #BE8742 3.50% 20471 | | | 17 | | | | 17 | |
| Fannie Mae Pool #BH2846 3.50% 20471 | | | 8 | | | | 8 | |
| Fannie Mae Pool #BH2848 3.50% 20471 | | | 7 | | | | 7 | |
| Fannie Mae Pool #BH2847 3.50% 20471 | | | 5 | | | | 5 | |
| Fannie Mae Pool #BJ5015 4.00% 20471 | | | 169 | | | | 169 | |
| Fannie Mae Pool #BH3122 4.00% 20471 | | | 5 | | | | 5 | |
| Fannie Mae Pool #BM3788 3.50% 20481 | | | 3,442 | | | | 3,367 | |
| Fannie Mae Pool #BJ4901 3.50% 20481 | | | 45 | | | | 44 | |
| Fannie Mae Pool #BK6840 4.00% 20481 | | | 111 | | | | 111 | |
| Fannie Mae Pool #BK5232 4.00% 20481 | | | 85 | | | | 85 | |
| Fannie Mae Pool #BK9743 4.00% 20481 | | | 32 | | | | 32 | |
| Fannie Mae Pool #BK9761 4.50% 20481 | | | 20 | | | | 21 | |
| Fannie Mae Pool #CA4151 3.50% 20491 | | | 620 | | | | 607 | |
| Fannie Mae Pool #FM1062 3.50% 20491 | | | 467 | | | | 456 | |
| Fannie Mae Pool #FM1443 3.50% 20491 | | | 345 | | | | 336 | |
| Fannie Mae Pool #BJ8411 3.50% 20491 | | | 122 | | | | 119 | |
| Fannie Mae Pool #FM2179 3.00% 20501 | | | 3,996 | | | | 3,754 | |
| Fannie Mae Pool #FM7687 3.00% 20511 | | | 6,092 | | | | 5,730 | |
| Fannie Mae Pool #FM9976 3.00% 20511 | | | 889 | | | | 841 | |
| Fannie Mae Pool #CB2544 3.00% 20521 | | | 2,473 | | | | 2,317 | |
| Fannie Mae, Series 2001-4, Class GA, 9.00% 20251,2 | | | — | 3 | | | — | 3 |
| Fannie Mae, Series 2001-4, Class NA, 9.00% 20251,2 | | | — | 3 | | | — | 3 |
| Fannie Mae, Series 2014-M1, Class A2, Multi Family, 3.28% 20231,2 | | | 284 | | | | 283 | |
| Fannie Mae, Series 2014-M3, Class A2, Multi Family, 3.501% 20241,2 | | | 509 | | | | 509 | |
| Freddie Mac Pool #1H1354 2.362% 20361,2 | | | 55 | | | | 57 | |
| Freddie Mac Pool #C03518 5.00% 20401 | | | 298 | | | | 315 | |
| Freddie Mac Pool #RB5138 2.00% 20411 | | | 828 | | | | 740 | |
| Freddie Mac Pool #G06459 5.00% 20411 | | | 735 | | | | 775 | |
| Freddie Mac Pool #RB5148 2.00% 20421 | | | 1,884 | | | | 1,671 | |
| Freddie Mac Pool #RB5145 2.00% 20421 | | | 800 | | | | 715 | |
| Freddie Mac Pool #Q19133 3.50% 20431 | | | 34 | | | | 33 | |
| Freddie Mac Pool #Q17696 3.50% 20431 | | | 32 | | | | 31 | |
| American Funds Insurance Series | 229 |
U.S. Government Securities Fund (continued)
| Bonds, notes & other debt instruments (continued) | Principal amount
(000) | | | Value
(000) | |
| Mortgage-backed obligations (continued) | | | | | | | | |
| Federal agency mortgage-backed obligations (continued) | | | | | | | | |
| Freddie Mac Pool #Q23190 4.00% 20431 | | USD | 159 | | | $ | 161 | |
| Freddie Mac Pool #Q15874 4.00% 20431 | | | 3 | | | | 3 | |
| Freddie Mac Pool #Q28558 3.50% 20441 | | | 217 | | | | 214 | |
| Freddie Mac Pool #760014 2.797% 20451,2 | | | 306 | | | | 305 | |
| Freddie Mac Pool #Q52069 3.50% 20471 | | | 87 | | | | 86 | |
| Freddie Mac Pool #Q47615 3.50% 20471 | | | 50 | | | | 49 | |
| Freddie Mac Pool #Q54701 3.50% 20481 | | | 58 | | | | 57 | |
| Freddie Mac Pool #Q54709 3.50% 20481 | | | 58 | | | | 56 | |
| Freddie Mac Pool #Q54700 3.50% 20481 | | | 47 | | | | 46 | |
| Freddie Mac Pool #Q54781 3.50% 20481 | | | 39 | | | | 38 | |
| Freddie Mac Pool #Q54782 3.50% 20481 | | | 38 | | | | 38 | |
| Freddie Mac Pool #Q56590 3.50% 20481 | | | 32 | | | | 31 | |
| Freddie Mac Pool #Q54699 3.50% 20481 | | | 25 | | | | 25 | |
| Freddie Mac Pool #Q54831 3.50% 20481 | | | 18 | | | | 17 | |
| Freddie Mac Pool #Q56589 3.50% 20481 | | | 18 | | | | 17 | |
| Freddie Mac Pool #Q54698 3.50% 20481 | | | 16 | | | | 15 | |
| Freddie Mac Pool #G67711 4.00% 20481 | | | 1,522 | | | | 1,529 | |
| Freddie Mac Pool #Q56599 4.00% 20481 | | | 126 | | | | 127 | |
| Freddie Mac Pool #Q55971 4.00% 20481 | | | 87 | | | | 87 | |
| Freddie Mac Pool #Q56175 4.00% 20481 | | | 75 | | | | 75 | |
| Freddie Mac Pool #Q58411 4.50% 20481 | | | 233 | | | | 238 | |
| Freddie Mac Pool #Q58436 4.50% 20481 | | | 123 | | | | 126 | |
| Freddie Mac Pool #Q58378 4.50% 20481 | | | 83 | | | | 85 | |
| Freddie Mac Pool #ZT0522 4.50% 20481 | | | 23 | | | | 23 | |
| Freddie Mac Pool #RA1463 3.50% 20491 | | | 426 | | | | 417 | |
| Freddie Mac Pool #RA1580 3.50% 20491 | | | 220 | | | | 215 | |
| Freddie Mac Pool #QA0284 3.50% 20491 | | | 214 | | | | 208 | |
| Freddie Mac Pool #QA2748 3.50% 20491 | | | 57 | | | | 56 | |
| Freddie Mac Pool #SD0726 2.50% 20511 | | | 15,079 | | | | 13,686 | |
| Freddie Mac Pool #8D0226 2.522% 20521,2 | | | 519 | | | | 488 | |
| Freddie Mac Pool #SD7550 3.00% 20521 | | | 3,573 | | | | 3,370 | |
| Freddie Mac Pool #SD7553 3.00% 20521 | | | 932 | | | | 877 | |
| Freddie Mac Pool #SD0873 3.50% 20521 | | | 14,959 | | | | 14,603 | |
| Freddie Mac, Series 1567, Class A, (1-month USD-LIBOR + 0.40%) 1.275% 20231,2 | | | 2 | | | | 2 | |
| Freddie Mac, Series K031, Class A1, Multi Family, 2.778% 20221 | | | 27 | | | | 27 | |
| Freddie Mac, Series KS01, Class A2, Multi Family, 2.522% 20231 | | | 304 | | | | 303 | |
| Freddie Mac, Series K029, Class A2, Multi Family, 3.32% 20231 | | | 191 | | | | 191 | |
| Freddie Mac, Series K035, Class A2, Multi Family, 3.458% 20231,2 | | | 2,561 | | | | 2,562 | |
| Freddie Mac, Series K040, Class A2, Multi Family, 3.241% 20241 | | | 1,363 | | | | 1,356 | |
| Freddie Mac Seasoned Credit Risk Transfer Trust, Series 2017-2, Class MA, 3.00% 20561 | | | 4,858 | | | | 4,735 | |
| Freddie Mac Seasoned Credit Risk Transfer Trust, Series 2017-1, Class HA, 3.00% 20561,2 | | | 4,805 | | | | 4,694 | |
| Freddie Mac Seasoned Credit Risk Transfer Trust, Series 2017-2, Class HA, 3.00% 20561,2 | | | 4,419 | | | | 4,315 | |
| Freddie Mac Seasoned Credit Risk Transfer Trust, Series 2017-3, Class MT, 3.00% 20561 | | | 851 | | | | 809 | |
| Freddie Mac Seasoned Credit Risk Transfer Trust, Series 2017-3, Class HT, 3.25% 20561 | | | 344 | | | | 331 | |
| Freddie Mac Seasoned Credit Risk Transfer Trust, Series 2018-1, Class HT, 3.00% 20571 | | | 955 | | | | 904 | |
| Freddie Mac Seasoned Credit Risk Transfer Trust, Series 2017-4, Class HT, 3.25% 20571,2 | | | 1,398 | | | | 1,352 | |
| Freddie Mac Seasoned Credit Risk Transfer Trust, Series 2018-2, Class MT, 3.50% 20571 | | | 4,371 | | | | 4,262 | |
| Freddie Mac Seasoned Credit Risk Transfer Trust, Series 2018-3, Class MA, 3.50% 20571 | | | 554 | | | | 549 | |
| Freddie Mac Seasoned Credit Risk Transfer Trust, Series 2018-2, Class MA, 3.50% 20571 | | | 279 | | | | 277 | |
| Freddie Mac Seasoned Credit Risk Transfer Trust, Series 2019-2, Class MA, 3.50% 20581 | | | 2,308 | | | | 2,284 | |
| 230 | American Funds Insurance Series |
U.S. Government Securities Fund (continued)
| Bonds, notes & other debt instruments (continued) | Principal amount
(000) | | | Value
(000) | |
| Mortgage-backed obligations (continued) | | | | | | | | |
| Federal agency mortgage-backed obligations (continued) | | | | | | | | |
| Freddie Mac Seasoned Credit Risk Transfer Trust, Series 2019-1, Class MT, 3.50% 20581 | | USD | 801 | | | $ | 780 | |
| Freddie Mac Seasoned Credit Risk Transfer Trust, Series 2019-2, Class MT, 3.50% 20581 | | | 763 | | | | 744 | |
| Freddie Mac Seasoned Credit Risk Transfer Trust, Series 2019-1, Class MA, 3.50% 20581 | | | 640 | | | | 633 | |
| Freddie Mac Seasoned Credit Risk Transfer Trust, Series 2019-3, Class MT, 3.50% 20581 | | | 418 | | | | 408 | |
| Freddie Mac Seasoned Credit Risk Transfer Trust, Series 2019-4, Class MA, 3.00% 20591 | | | 1,947 | | | | 1,897 | |
| Freddie Mac Seasoned Loan Structured Transaction Trust, Series 2018-2, Class A1, 3.50% 20281 | | | 19,892 | | | | 19,728 | |
| Freddie Mac Seasoned Loan Structured Transaction Trust, Series 2018-1, Class A1, 3.50% 20281 | | | 4,599 | | | | 4,561 | |
| Freddie Mac Seasoned Loan Structured Transaction Trust, Series 2019-3, Class A1C, 2.75% 20291 | | | 5,264 | | | | 5,060 | |
| Freddie Mac Seasoned Loan Structured Transaction Trust, Series 2020-1, Class A1D, 2.00% 20301 | | | 1,514 | | | | 1,421 | |
| Freddie Mac Seasoned Loan Structured Transaction Trust, Series 2020-1, Class A2D, 2.00% 20301 | | | 435 | | | | 379 | |
| Freddie Mac Seasoned Loan Structured Transaction Trust, Series 2022-1, Class A1, 3.50% 20321 | | | 4,909 | | | | 4,850 | |
| Government National Mortgage Assn. 2.00% 20521,4 | | | 1,395 | | | | 1,239 | |
| Government National Mortgage Assn. 2.50% 20521,4 | | | 4,866 | | | | 4,454 | |
| Government National Mortgage Assn. 3.00% 20521,4 | | | 44,265 | | | | 41,744 | |
| Government National Mortgage Assn. 3.50% 20521,4 | | | 19,527 | | | | 18,952 | |
| Government National Mortgage Assn. 4.00% 20521,4 | | | 13,010 | | | | 12,928 | |
| Government National Mortgage Assn. 4.00% 20521,4 | | | 11,110 | | | | 11,065 | |
| Government National Mortgage Assn. 4.50% 20521,4 | | | 69,578 | | | | 70,356 | |
| Government National Mortgage Assn. 5.00% 20521,4 | | | 56,733 | | | | 57,930 | |
| Government National Mortgage Assn. 5.00% 20521,4 | | | 890 | | | | 912 | |
| Government National Mortgage Assn. Pool #698668 5.50% 20381 | | | 29 | | | | 30 | |
| Government National Mortgage Assn. Pool #700778 5.50% 20381 | | | 21 | | | | 23 | |
| Government National Mortgage Assn. Pool #782365 6.00% 20381 | | | 94 | | | | 103 | |
| Government National Mortgage Assn. Pool #004269 6.50% 20381 | | | 176 | | | | 195 | |
| Government National Mortgage Assn. Pool #698406 5.00% 20391 | | | 198 | | | | 209 | |
| Government National Mortgage Assn. Pool #783690 6.00% 20391 | | | 93 | | | | 101 | |
| Government National Mortgage Assn. Pool #783689 5.50% 20401 | | | 2,875 | | | | 3,137 | |
| Government National Mortgage Assn. Pool #783687 4.50% 20411 | | | 604 | | | | 623 | |
| Government National Mortgage Assn. Pool #783688 5.00% 20411 | | | 920 | | | | 977 | |
| Government National Mortgage Assn. Pool #MA0533 3.00% 20421 | | | 20 | | | | 20 | |
| Uniform Mortgage-Backed Security 2.00% 20371,4 | | | 1,115 | | | | 1,041 | |
| Uniform Mortgage-Backed Security 2.50% 20371,4 | | | 2,245 | | | | 2,144 | |
| Uniform Mortgage-Backed Security 2.00% 20521,4 | | | 11,093 | | | | 9,620 | |
| Uniform Mortgage-Backed Security 3.00% 20521,4 | | | 13,270 | | | | 12,349 | |
| Uniform Mortgage-Backed Security 3.00% 20521,4 | | | 412 | | | | 384 | |
| Uniform Mortgage-Backed Security 3.50% 20521,4 | | | 53,357 | | | | 51,268 | |
| Uniform Mortgage-Backed Security 4.00% 20521,4 | | | 121,875 | | | | 119,806 | |
| Uniform Mortgage-Backed Security 4.00% 20521,4 | | | 16,422 | | | | 16,171 | |
| Uniform Mortgage-Backed Security 4.50% 20521,4 | | | 115,583 | | | | 115,805 | |
| Uniform Mortgage-Backed Security 4.50% 20521,4 | | | 19,267 | | | | 19,268 | |
| Uniform Mortgage-Backed Security 5.00% 20521,4 | | | 45,150 | | | | 45,969 | |
| Uniform Mortgage-Backed Security 5.00% 20521,4 | | | 4,105 | | | | 4,171 | |
| | | | | | | | 761,452 | |
| | | | | | | | | |
| U.S. Treasury bonds & notes 37.21% | | | | | | | | |
| U.S. Treasury inflation-protected securities 28.33% | | | | | | | | |
| U.S. Treasury Inflation-Protected Security 0.125% 20225 | | | 4,860 | | | | 4,879 | |
| U.S. Treasury Inflation-Protected Security 0.125% 20235 | | | 21,316 | | | | 21,692 | |
| U.S. Treasury Inflation-Protected Security 0.375% 20235 | | | 5,367 | | | | 5,464 | |
| U.S. Treasury Inflation-Protected Security 0.625% 20235 | | | 30,184 | | | | 30,714 | |
| American Funds Insurance Series | 231 |
U.S. Government Securities Fund (continued)
| Bonds, notes & other debt instruments (continued) | Principal amount
(000) | | | Value
(000) | |
| U.S. Treasury bonds & notes (continued) | | | | | | | | |
| U.S. Treasury inflation-protected securities (continued) | | | | | | | | |
| U.S. Treasury Inflation-Protected Security 0.125% 20245 | | USD | 74,820 | | | $ | 75,584 | |
| U.S. Treasury Inflation-Protected Security 0.125% 20245 | | | 33,377 | | | | 33,594 | |
| U.S. Treasury Inflation-Protected Security 0.50% 20245 | | | 22,236 | | | | 22,556 | |
| U.S. Treasury Inflation-Protected Security 0.625% 20245 | | | 73,278 | | | | 74,492 | |
| U.S. Treasury Inflation-Protected Security 0.125% 20255 | | | 8,169 | | | | 8,174 | |
| U.S. Treasury Inflation-Protected Security 0.125% 20255 | | | 7,572 | | | | 7,567 | |
| U.S. Treasury Inflation-Protected Security 0.375% 20255 | | | 56,073 | | | | 56,629 | |
| U.S. Treasury Inflation-Protected Security 0.125% 20265 | | | 37,054 | | | | 36,697 | |
| U.S. Treasury Inflation-Protected Security 0.125% 20265 | | | 5,578 | | | | 5,525 | |
| U.S. Treasury Inflation-Protected Security 0.625% 20265 | | | 3,278 | | | | 3,316 | |
| U.S. Treasury Inflation-Protected Security 0.125% 20275 | | | 31,880 | | | | 31,371 | |
| U.S. Treasury Inflation-Protected Security 0.125% 20305 | | | 7,074 | | | | 6,732 | |
| U.S. Treasury Inflation-Protected Security 0.125% 20315 | | | 9,448 | | | | 8,965 | |
| U.S. Treasury Inflation-Protected Security 0.125% 20315 | | | 879 | | | | 834 | |
| U.S. Treasury Inflation-Protected Security 0.125% 20325 | | | 9,616 | | | | 9,100 | |
| U.S. Treasury Inflation-Protected Security 2.125% 20415 | | | 409 | | | | 474 | |
| U.S. Treasury Inflation-Protected Security 0.75% 20425,6 | | | 9,198 | | | | 8,364 | |
| U.S. Treasury Inflation-Protected Security 0.625% 20435 | | | 4,388 | | | | 3,860 | |
| U.S. Treasury Inflation-Protected Security 1.00% 20495 | | | 2,757 | | | | 2,637 | |
| U.S. Treasury Inflation-Protected Security 0.25% 20505 | | | 327 | | | | 256 | |
| U.S. Treasury Inflation-Protected Security 0.125% 20515 | | | 5,851 | | | | 4,471 | |
| U.S. Treasury Inflation-Protected Security 0.125% 20525 | | | 1,459 | | | | 1,125 | |
| | | | | | | | 465,072 | |
| | | | | | | | | |
| U.S. Treasury 8.88% | | | | | | | | |
| U.S. Treasury 2.75% 2025 | | | 43,809 | | | | 43,479 | |
| U.S. Treasury 1.875% 2032 | | | 13,702 | | | | 12,399 | |
| U.S. Treasury 1.125% 2040 | | | 7,000 | | | | 4,857 | |
| U.S. Treasury 1.75% 2041 | | | 2,555 | | | | 1,936 | |
| U.S. Treasury 2.25% 2041 | | | 900 | | | | 748 | |
| U.S. Treasury 2.50% 2046 | | | 5,400 | | | | 4,564 | |
| U.S. Treasury 2.50% 2046 | | | 3,900 | | | | 3,296 | |
| U.S. Treasury 2.875% 2046 | | | 2,700 | | | | 2,455 | |
| U.S. Treasury 2.25% 2049 | | | 1,635 | | | | 1,336 | |
| U.S. Treasury 2.375% 2049 | | | 4,125 | | | | 3,471 | |
| U.S. Treasury 2.875% 2049 | | | 6,300 | | | | 5,849 | |
| U.S. Treasury 1.25% 20506 | | | 29,960 | | | | 18,978 | |
| U.S. Treasury 1.625% 20506 | | | 26,165 | | | | 18,323 | |
| U.S. Treasury 1.875% 2051 | | | 15,220 | | | | 11,373 | |
| U.S. Treasury 1.875% 2051 | | | 3,164 | | | | 2,364 | |
| U.S. Treasury 2.00% 20516 | | | 5,546 | | | | 4,268 | |
| U.S. Treasury 2.25% 20526 | | | 6,946 | | | | 5,691 | |
| U.S. Treasury 2.875% 2052 | | | 350 | | | | 329 | |
| | | | | | | | 145,716 | |
| | | | | | | | | |
| Total U.S. Treasury bonds & notes | | | | | | | 610,788 | |
| | | | | | | | | |
| Federal agency bonds & notes 7.54% | | | | | | | | |
| Export-Import Bank of the United States-Guaranteed, Ethiopian Leasing 2012, LLC 2.646% 2026 | | | 350 | | | | 344 | |
| Fannie Mae 0.625% 20256 | | | 10,000 | | | | 9,347 | |
| Fannie Mae 0.75% 2027 | | | 2,900 | | | | 2,571 | |
| Fannie Mae 0.875% 2030 | | | 8,600 | | | | 7,123 | |
| Fannie Mae 7.125% 2030 | | | 2,000 | | | | 2,522 | |
| Federal Home Loan Bank 3.25% 2028 | | | 6,500 | | | | 6,524 | |
| Federal Home Loan Bank 5.50% 2036 | | | 300 | | | | 362 | |
| Private Export Funding Corp. 3.55% 2024 | | | 3,190 | | | | 3,219 | |
| Private Export Funding Corp. 1.40% 2028 | | | 3,000 | | | | 2,680 | |
| Tennessee Valley Authority 1.875% 2022 | | | 14,017 | | | | 14,015 | |
| Tennessee Valley Authority 0.75% 2025 | | | 3,700 | | | | 3,459 | |
| 232 | American Funds Insurance Series |
U.S. Government Securities Fund (continued)
| Bonds, notes & other debt instruments (continued) | Principal amount
(000) | | | Value
(000) | |
| Federal agency bonds & notes (continued) | | | | | | | | |
| Tennessee Valley Authority 2.875% 2027 | | USD | 5,000 | | | $ | 4,947 | |
| Tennessee Valley Authority 4.65% 2035 | | | 1,780 | | | | 1,913 | |
| Tennessee Valley Authority 5.88% 2036 | | | 875 | | | | 1,057 | |
| Tennessee Valley Authority, Series A, 4.625% 2060 | | | 250 | | | | 272 | |
| TVA Southaven 3.846% 2033 | | | 945 | | | | 904 | |
| U.S. Agency for International Development, Israel (State of), Class 1A, 5.50% 2023 | | | 1,250 | | | | 1,289 | |
| U.S. Agency for International Development, Jordan (Kingdom of) 3.00% 2025 | | | 14,779 | | | | 14,672 | |
| U.S. Agency for International Development, Morocco (Kingdom of) 7.55% 2026 | | | 2,110 | | | | 2,301 | |
| U.S. Department of Housing and Urban Development, Series 2015-A-8, 2.45% 2022 | | | 6,000 | | | | 6,003 | |
| U.S. Department of Housing and Urban Development, Series 2015-A-9, 2.80% 2023 | | | 1,500 | | | | 1,499 | |
| U.S. Department of Housing and Urban Development, Series 2015-A-10, 2.85% 2024 | | | 2,250 | | | | 2,242 | |
| U.S. Department of Housing and Urban Development, Series 2015-A-11, 2.95% 2025 | | | 2,640 | | | | 2,614 | |
| U.S. Department of Housing and Urban Development, Series 2015-A-12, 3.10% 2026 | | | 2,625 | | | | 2,595 | |
| U.S. Department of Housing and Urban Development, Series 2015-A-13, 3.15% 2027 | | | 11,482 | | | | 11,323 | |
| U.S. Department of Housing and Urban Development, Series 2015-A-14, 3.25% 2028 | | | 3,856 | | | | 3,771 | |
| U.S. Department of Housing and Urban Development, Series 2015-A-15, 3.35% 2029 | | | 2,650 | | | | 2,578 | |
| U.S. Department of Housing and Urban Development, Series 2015-A-16, 3.50% 2030 | | | 2,482 | | | | 2,513 | |
| U.S. Department of Housing and Urban Development, Series 2015-A-17, 3.55% 2031 | | | 2,475 | | | | 2,514 | |
| U.S. Department of Housing and Urban Development, Series 2015-A-18, 3.60% 2032 | | | 2,377 | | | | 2,417 | |
| U.S. Department of Housing and Urban Development, Series 2015-A-19, 3.65% 2033 | | | 2,059 | | | | 2,097 | |
| U.S. Department of Housing and Urban Development, Series 2015-A-20, 3.70% 2034 | | | 651 | | | | 664 | |
| U.S. Government-Guaranteed Certificates of Participation, Overseas Private Investment Corp. 3.82% 2032 | | | 768 | | | | 782 | |
| U.S. Government-Guaranteed Certificates of Participation, Overseas Private Investment Corp. 3.938% 2032 | | | 628 | | | | 645 | |
| | | | | | | | 123,778 | |
| | | | | | | | | |
| Total bonds, notes & other debt instruments (cost: $1,551,123,000) | | | | | | | 1,496,018 | |
| Short-term securities 43.70% | | Weighted
average yield
at acquisition | | | | | | | |
| Commercial paper 20.73% | | | | | | | | | | | | |
| Amazon.com, Inc. 7/12/20227 | | | 0.800 | % | | | 15,000 | | | | 14,992 | |
| Apple, Inc. 8/1/20227 | | | 1.000 | | | | 15,000 | | | | 14,979 | |
| Apple, Inc. 8/8/20227 | | | 1.600 | | | | 10,000 | | | | 9,983 | |
| Atlantic Asset Securitization, LLC 7/1/20227 | | | 1.560 | | | | 15,200 | | | | 15,199 | |
| BofA Securities, Inc. 8/22/20227 | | | 1.900 | | | | 5,000 | | | | 4,986 | |
| BofA Securities, Inc. 8/29/20227 | | | 2.000 | | | | 5,000 | | | | 4,983 | |
| BofA Securities, Inc. 9/6/20227 | | | 1.989 | | | | 25,600 | | | | 25,498 | |
| BofA Securities, Inc. 9/7/20227 | | | 1.512 | | | | 7,700 | | | | 7,669 | |
| CAFCO, LLC 10/4/20227 | | | 2.290 | | | | 13,000 | | | | 12,919 | |
| Chariot Funding, LLC 8/10/20227 | | | 1.650 | | | | 7,000 | | | | 6,985 | |
| CHARTA, LLC 9/6/20227 | | | 1.560 | | | | 10,000 | | | | 9,961 | |
| CHARTA, LLC 9/8/20227 | | | 1.600 | | | | 8,000 | | | | 7,968 | |
| Coca-Cola Co. 8/9/20227 | | | 1.000 | | | | 21,600 | | | | 21,561 | |
| Eli Lilly and Co. 7/1/20227 | | | 0.900 | | | | 10,000 | | | | 10,000 | |
| Eli Lilly and Co. 9/6/20227 | | | 1.850 | | | | 10,000 | | | | 9,965 | |
| Henkel of America, Inc. 7/11/20227 | | | 0.880 | | | | 15,000 | | | | 14,993 | |
| Henkel of America, Inc. 7/19/20227 | | | 0.850 | | | | 5,000 | | | | 4,996 | |
| Henkel of America, Inc. 8/9/20227 | | | 1.110 | | | | 15,000 | | | | 14,970 | |
| Honeywell International, Inc. 9/26/20227 | | | 1.450 | | | | 11,350 | | | | 11,295 | |
| Johnson & Johnson 10/17/20227 | | | 1.480 | | | | 5,000 | | | | 4,969 | |
| JPMorgan Securities LLC 7/18/2022 | | | 1.080 | | | | 5,000 | | | | 4,996 | |
| JPMorgan Securities LLC 8/2/2022 | | | 1.400 | | | | 7,000 | | | | 6,989 | |
| Linde, Inc. 7/6/2022 | | | 1.590 | | | | 4,750 | | | | 4,749 | |
| Paccar Financial Corp. 7/1/2022 | | | 0.950 | | | | 5,000 | | | | 5,000 | |
| Paccar Financial Corp. 7/15/2022 | | | 1.600 | | | | 9,000 | | | | 8,994 | |
| Paccar Financial Corp. 7/27/2022 | | | 1.600 | | | | 5,000 | | | | 4,994 | |
| American Funds Insurance Series | 233 |
U.S. Government Securities Fund (continued)
| Short-term securities (continued) | | Weighted
average yield
at acquisition | | Principal amount
(000) | | | Value
(000) | |
| Commercial paper (continued) | | | | | | | | | | | | |
| Paccar Financial Corp. 7/28/2022 | | | 1.600 | % | | USD | 10,000 | | | $ | 9,987 | |
| PepsiCo, Inc. 7/25/20227 | | | 0.720 | | | | 20,000 | | | | 19,978 | |
| Procter & Gamble Co. 7/11/20227 | | | 0.770 | | | | 8,000 | | | | 7,996 | |
| Procter & Gamble Co. 7/21/20227 | | | 0.900 | | | | 10,500 | | | | 10,490 | |
| Wal-Mart Stores, Inc. 7/18/20227 | | | 1.020 | | | | 5,000 | | | | 4,996 | |
| Wal-Mart Stores, Inc. 7/25/20227 | | | 1.298 | | | | 12,800 | | | | 12,786 | |
| Wal-Mart Stores, Inc. 8/8/20227 | | | 1.650 | | | | 4,500 | | | | 4,492 | |
| Wal-Mart Stores, Inc. 8/9/20227 | | | 1.650 | | | | 5,000 | | | | 4,991 | |
| | | | | | | | | | | | 340,309 | |
| | | | | | | | | | | | | |
| Federal agency bills & notes 15.05% | | | | | | | | | | | | |
| Federal Farm Credit Banks 7/20/2022 | | | 1.450 | | | | 25,000 | | | | 24,986 | |
| Federal Home Loan Bank 7/7/2022 | | | 0.830 | | | | 30,000 | | | | 29,995 | |
| Federal Home Loan Bank 7/13/2022 | | | 0.930 | | | | 3,850 | | | | 3,849 | |
| Federal Home Loan Bank 8/12/2022 | | | 1.650 | | | | 5,100 | | | | 5,092 | |
| Federal Home Loan Bank 8/15/2022 | | | 1.159 | | | | 34,500 | | | | 34,442 | |
| Federal Home Loan Bank 8/17/2022 | | | 1.150 | | | | 15,000 | | | | 14,974 | |
| Federal Home Loan Bank 8/18/2022 | | | 1.643 | | | | 15,000 | | | | 14,973 | |
| Federal Home Loan Bank 8/31/2022 | | | 1.190 | | | | 50,000 | | | | 49,872 | |
| Federal Home Loan Bank 9/21/2022 | | | 1.810 | | | | 20,000 | | | | 19,924 | |
| Federal Home Loan Bank 9/28/2022 | | | 1.840 | | | | 10,000 | | | | 9,958 | |
| Tennessee Valley Authority 7/6/2022 | | | 1.370 | | | | 39,000 | | | | 38,994 | |
| | | | | | | | | | | | 247,059 | |
| | | | | | | | | | | | | |
| U.S. Treasury bills 7.92% | | | | | | | | | | | | |
| U.S. Treasury 8/16/2022 | | | 1.350 | | | | 58,450 | | | | 58,351 | |
| U.S. Treasury 8/23/2022 | | | 1.429 | | | | 71,700 | | | | 71,545 | |
| | | | | | | | | | | | 129,896 | |
| | | | | | | | | | | | | |
| Total short-term securities (cost: $717,419,000) | | | | | | | | | | | 717,264 | |
| Total investment securities 134.84% (cost: $2,268,542,000) | | | | | 2,213,282 | |
| Other assets less liabilities (34.84)% | | | | | | | | | | | (571,857 | ) |
| | | | | | | | | | | | | |
| Net assets 100.00% | | | | | | | | | | $ | 1,641,425 | |
| 234 | American Funds Insurance Series |
U.S. Government Securities Fund (continued)
Futures contracts
| Contracts | | Type | | Number of
contracts | | Expiration | | Notional
amount
(000) | | | Value and
unrealized
appreciation
(depreciation)
at 6/30/2022
(000) | |
| 30 Day Federal Funds Futures | | Short | | 36 | | August 2022 | | USD | (14,750 | ) | | | $ | 8 | |
| 30 Day Federal Funds Futures | | Long | | 1,197 | | September 2022 | | | 487,492 | | | | | (175 | ) |
| 30 Day Federal Funds Futures | | Short | | 24 | | February 2023 | | | (9,666 | ) | | | | (7 | ) |
| 90 Day Eurodollar Futures | | Long | | 471 | | December 2022 | | | 113,405 | | | | | (3,235 | ) |
| 3 Month SOFR Futures | | Short | | 22 | | March 2023 | | | (5,317 | ) | | | | (2 | ) |
| 3 Month SOFR Futures | | Short | | 225 | | June 2023 | | | (54,354 | ) | | | | 54 | |
| 90 Day Eurodollar Futures | | Long | | 2,043 | | September 2023 | | | 494,176 | | | | | (12,139 | ) |
| 90 Day Eurodollar Futures | | Short | | 1,261 | | December 2023 | | | (305,493 | ) | | | | 6,654 | |
| 90 Day Eurodollar Futures | | Short | | 1,272 | | December 2024 | | | (308,985 | ) | | | | 4,093 | |
| 2 Year U.S. Treasury Note Futures | | Short | | 2,083 | | September 2022 | | | (437,462 | ) | | | | 202 | |
| 5 Year U.S. Treasury Note Futures | | Long | | 2,568 | | September 2022 | | | 288,258 | | | | | 758 | |
| 10 Year U.S. Treasury Note Futures | | Long | | 826 | | September 2022 | | | 97,907 | | | | | (329 | ) |
| 10 Year Ultra U.S. Treasury Note Futures | | Long | | 693 | | September 2022 | | | 88,271 | | | | | (1,209 | ) |
| 20 Year U.S. Treasury Bond Futures | | Long | | 304 | | September 2022 | | | 42,142 | | | | | (566 | ) |
| 30 Year Ultra U.S. Treasury Bond Futures | | Long | | 42 | | September 2022 | | | 6,482 | | | | | 137 | |
| | | | | | | | | | | | | | $ | (5,756 | ) |
Swap contracts
Interest rate swaps
Centrally cleared interest rate swaps
| Receive | | Pay | | | | Notional | | | Value at | | | Upfront
premium | | | Unrealized
appreciation
(depreciation) | |
| Rate | | Payment
frequency | | Rate | | Payment
frequency | | Expiration
date | | amount
(000) | | | 6/30/2022
(000) | | | paid
(000) | | | at 6/30/2022
(000) | |
| 2.5775% | | Annual | | U.S. EFFR | | Annual | | 7/16/2022 | | USD | 181,639 | | | $ | 81 | | | $ | — | | | $ | 81 | |
| U.S. EFFR | | Annual | | 1.395% | | Annual | | 7/27/2022 | | | 422,500 | | | | 73 | | | | — | | | | 73 | |
| 1.955% | | Annual | | U.S. EFFR | | Annual | | 9/21/2022 | | | 320,100 | | | | (158 | ) | | | — | | | | (158 | ) |
| SOFR | | Annual | | 0.471% | | Annual | | 10/26/2023 | | | 30,500 | | | | 1,004 | | | | — | | | | 1,004 | |
| 0.45801% | | Annual | | SOFR | | Annual | | 10/26/2023 | | | 30,500 | | | | (1,009 | ) | | | — | | | | (1,009 | ) |
| 0.241% | | Annual | | U.S. EFFR | | Annual | | 3/1/2024 | | | 119,400 | | | | (5,441 | ) | | | — | | | | (5,441 | ) |
| U.S. EFFR | | Annual | | 0.11% | | Annual | | 5/18/2024 | | | 97,600 | | | | 2,764 | | | | — | | | | 2,764 | |
| 3.497% | | Annual | | U.S. EFFR | | Annual | | 6/16/2024 | | | 24,000 | | | | 228 | | | | — | | | | 228 | |
| 3.4325% | | Annual | | U.S. EFFR | | Annual | | 6/17/2024 | | | 17,700 | | | | 146 | | | | — | | | | 146 | |
| 3.4585% | | Annual | | U.S. EFFR | | Annual | | 6/17/2024 | | | 3,697 | | | | 32 | | | | — | | | | 32 | |
| U.S. EFFR | | Annual | | 0.126% | | Annual | | 6/25/2025 | | | 20,100 | | | | 1,568 | | | | — | | | | 1,568 | |
| U.S. EFFR | | Annual | | 0.1275% | | Annual | | 6/25/2025 | | | 20,100 | | | | 1,567 | | | | — | | | | 1,567 | |
| U.S. EFFR | | Annual | | 0.106% | | Annual | | 6/30/2025 | | | 22,492 | | | | 1,810 | | | | — | | | | 1,810 | |
| 3-month USD-LIBOR | | Quarterly | | 1.867% | | Semi-annual | | 7/11/2025 | | | 49,400 | | | | 1,763 | | | | — | | | | 1,763 | |
| 2.925% | | Semi-annual | | 3-month USD-LIBOR | | Quarterly | | 2/1/2028 | | | 12,800 | | | | (68 | ) | | | — | | | | (68 | ) |
| 2.91% | | Semi-annual | | 3-month USD-LIBOR | | Quarterly | | 2/1/2028 | | | 16,000 | | | | (96 | ) | | | — | | | | (96 | ) |
| 2.908% | | Semi-annual | | 3-month USD-LIBOR | | Quarterly | | 2/1/2028 | | | 16,000 | | | | (97 | ) | | | — | | | | (97 | ) |
| 2.92% | | Semi-annual | | 3-month USD-LIBOR | | Quarterly | | 2/2/2028 | | | 12,200 | | | | (67 | ) | | | — | | | | (67 | ) |
| U.S. EFFR | | Annual | | 0.5385% | | Annual | | 3/26/2030 | | | 49,000 | | | | 7,537 | | | | — | | | | 7,537 | |
| 0.913% | | Semi-annual | | 3-month USD-LIBOR | | Quarterly | | 6/9/2030 | | | 31,000 | | | | (4,601 | ) | | | — | | | | (4,601 | ) |
| U.S. EFFR | | Annual | | 0.666% | | Annual | | 11/19/2030 | | | 15,500 | | | | 2,417 | | | | — | | | | 2,417 | |
| 3-month USD-LIBOR | | Quarterly | | 2.963% | | Semi-annual | | 2/1/2038 | | | 9,800 | | | | 165 | | | | — | | | | 165 | |
| 3-month USD-LIBOR | | Quarterly | | 2.986% | | Semi-annual | | 2/1/2038 | | | 7,800 | | | | 118 | | | | — | | | | 118 | |
| American Funds Insurance Series | 235 |
U.S. Government Securities Fund (continued)
Swap contracts (continued)
Interest rate swaps (continued)
Centrally cleared interest rate swaps (continued)
| Receive | | Pay | | | | Notional | | | Value at | | | Upfront
premium | | | Unrealized
appreciation
(depreciation) | |
| Rate | | Payment
frequency | | Rate | | Payment
frequency | | Expiration
date | | | amount
(000) | | | | 6/30/2022
(000) | | | | paid
(000) | | | | at 6/30/2022
(000) | |
| 0.833% | | Semi-annual | | 3-month USD-LIBOR | | Quarterly | | 4/3/2040 | | USD | 15,800 | | | $ | (5,026 | ) | | $ | — | | | $ | (5,026 | ) |
| 3-month USD-LIBOR | | Quarterly | | 0.811% | | Semi-annual | | 7/27/2050 | | | 5,110 | | | | 2,095 | | | | — | | | | 2,095 | |
| | | | | | | | | | | | | | | $ | 6,805 | | | $ | — | | | $ | 6,805 | |
| 1 | Principal payments may be made periodically. Therefore, the effective maturity date may be earlier than the stated maturity date. |
| 2 | Coupon rate may change periodically. Reference rate and spread are as of the most recent information available. Some coupon rates are determined by the issuer or agent based on current market conditions; therefore, the reference rate and spread are not available. For short-term securities, the date of the next scheduled coupon rate change is considered to be the maturity date. |
| 3 | Amount less than one thousand. |
| 4 | Purchased on a TBA basis. |
| 5 | Index-linked bond whose principal amount moves with a government price index. |
| 6 | All or a portion of this security was pledged as collateral. The total value of pledged collateral was $16,394,000, which represented 1.00% of the net assets of the fund. |
| 7 | Acquired in a transaction exempt from registration under Rule 144A or Section 4(2) of the Securities Act of 1933. May be resold in the U.S. in transactions exempt from registration, normally to qualified institutional buyers. The total value of all such securities was $294,600,000, which represented 17.95% of the net assets of the fund. |
Key to abbreviations
Assn. = Association
EFFR = Effective Federal Funds Rate
LIBOR = London Interbank Offered Rate
SOFR = Secured Overnight Financing Rate
TBA = To be announced
USD = U.S. dollars
Refer to the notes to financial statements.
| 236 | American Funds Insurance Series |
| Managed Risk Growth Fund | |
| Investment portfolio June 30, 2022 | unaudited |
| Growth funds 84.07% | | Shares | | | Value
(000) | |
| American Funds Insurance Series – Growth Fund, Class 1 | | | 5,168,832 | | | $ | 395,984 | |
| | | | | | | | | |
| Total growth funds (cost: $517,640,000) | | | | | | | 395,984 | |
| | | | | | | | | |
| Fixed income funds 7.60% | | | | | | | | |
| American Funds Insurance Series – The Bond Fund of America, Class 1 | | | 3,607,944 | | | | 35,791 | |
| | | | | | | | | |
| Total fixed income funds (cost: $37,817,000) | | | | | | | 35,791 | |
| | | | | | | | | |
| Short-term securities 4.04% | | | | | | | | |
| State Street Institutional U.S. Government Money Market Fund, Premier Class 0.74%1 | | | 19,039,653 | | | | 19,040 | |
| | | | | | | | | |
| Total short-term securities (cost: $19,040,000) | | | | | | | 19,040 | |
| | | | | | | | | |
| Options purchased 0.09% | | | | | | | | |
| Options purchased* | | | | | | | 424 | |
| | | | | | | | | |
| Total options purchased (cost: $410,000) | | | | | | | 424 | |
| Total investment securities 95.80% (cost: $574,907,000) | | | | | | | 451,239 | |
| Other assets less liabilities 4.20% | | | | | | | 19,773 | |
| | | | | | | | | |
| Net assets 100.00% | | | | | | $ | 471,012 | |
*Options purchased
Put
| Description | | Number of
contracts | | Notional
amount
(000) | | | Exercise
price | | | Expiration
date | | Value at
6/30/2022
(000) | |
| S&P 500 Index | | 25 | | USD | 9,463 | | | $ | 2,375.00 | | | 12/16/2022 | | | $ | 53 | |
| S&P 500 Index | | 15 | | | 5,678 | | | | 2,600.00 | | | 12/16/2022 | | | | 47 | |
| S&P 500 Index | | 25 | | | 9,464 | | | | 2,650.00 | | | 12/16/2022 | | | | 83 | |
| S&P 500 Index | | 70 | | | 26,498 | | | | 2,675.00 | | | 12/16/2022 | | | | 241 | |
| | | | | | | | | | | | | | | | $ | 424 | |
| American Funds Insurance Series | 237 |
Managed Risk Growth Fund (continued)
Futures contracts
| Contracts | | Type | | Number of
contracts | | Expiration | | Notional
amount
(000) | | Value and
unrealized
(depreciation)
appreciation
at 6/30/2022
(000) | |
| 5 Year U.S. Treasury Note Futures | | Long | | 434 | | September 2022 | | USD | 48,717 | | | $ | (105 | ) |
| Nikkei 225 Index Contracts | | Short | | 3 | | September 2022 | | | (583 | ) | | | 36 | |
| Japanese Yen Currency Contracts | | Short | | 7 | | September 2022 | | | (649 | ) | | | 9 | |
| FTSE 100 Index Contracts | | Short | | 23 | | September 2022 | | | (1,994 | ) | | | 1 | |
| British Pound Currency Contracts | | Short | | 28 | | September 2022 | | | (2,135 | ) | | | 50 | |
| Mini MSCI Emerging Market Index Contracts | | Short | | 124 | | September 2022 | | | (6,217 | ) | | | 23 | |
| Russell 2000 Mini Index Contracts | | Short | | 93 | | September 2022 | | | (7,942 | ) | | | 420 | |
| Euro Stoxx 50 Index Contracts | | Short | | 255 | | September 2022 | | | (9,195 | ) | | | 441 | |
| Euro Currency Contracts | | Short | | 76 | | September 2022 | | | (10,011 | ) | | | 209 | |
| S&P Mid 400 E-mini Index Contracts | | Short | | 87 | | September 2022 | | | (19,732 | ) | | | 1,211 | |
| S&P 500 E-mini Index Contracts | | Short | | 1,299 | | September 2022 | | | (246,128 | ) | | | 7,928 | |
| | | | | | | | | | | | | $ | 10,223 | |
Investments in affiliates2
| | | Value of
affiliates at
1/1/2022
(000) | | | Additions
(000) | | | Reductions
(000) | | | Net
realized
gain (loss)
(000) | | | Net
unrealized
(depreciation)
appreciation
(000) | | | Value of
affiliates at
6/30/2022
(000) | | | Dividend
income
(000) | | | Capital gain
distributions
received
(000) | |
| Growth funds 84.07% | | | | | | | | | | | | | | | | | | | | | | | | | | | | | | | | |
| American Funds Insurance Series – Growth Fund, Class 1 | | $ | 504,914 | | | $ | 276,392 | | | $ | 173,037 | | | $ | 49,482 | | | $ | (261,767 | ) | | $ | 395,984 | | | $ | 619 | | | $ | 60,090 | |
| Fixed income funds 7.60% | | | | | | | | | | | | | | | | | | | | | | | | | | | | | | | | |
| American Funds Insurance Series – The Bond Fund of America, Class 1 | | | 59,236 | | | | 33,926 | | | | 51,218 | | | | (6,387 | ) | | | 234 | | | | 35,791 | | | | 225 | | | | 443 | |
| Total 91.67% | | | | | | | | | | | | | | $ | 43,095 | | | $ | (261,533 | ) | | $ | 431,775 | | | $ | 844 | | | $ | 60,533 | |
| 1 | Rate represents the seven-day yield at 6/30/2022. |
| 2 | Part of the same “group of investment companies” as the fund as defined under the Investment Company Act of 1940, as amended. |
Refer to the notes to financial statements.
| 238 | American Funds Insurance Series |
| Managed Risk International Fund | |
| Investment portfolio June 30, 2022 | unaudited |
| Growth funds 84.30% | | Shares | | | Value
(000) | |
| American Funds Insurance Series – International Fund, Class 1 | | | 7,388,186 | | | $ | 112,079 | |
| | | | | | | | | |
| Total growth funds (cost: $139,165,000) | | | | | | | 112,079 | |
| | | | | | | | | |
| Fixed income funds 9.50% | | | | | | | | |
| American Funds Insurance Series – The Bond Fund of America, Class 1 | | | 1,272,621 | | | | 12,624 | |
| | | | | | | | | |
| Total fixed income funds (cost: $13,864,000) | | | | | | | 12,624 | |
| | | | | | | | | |
| Short-term securities 3.12% | | | | | | | | |
| State Street Institutional U.S. Government Money Market Fund, Premier Class 0.74%1 | | | 4,144,493 | | | | 4,144 | |
| | | | | | | | | |
| Total short-term securities (cost: $4,144,000) | | | | | | | 4,144 | |
| | | | | | | | | |
| Options purchased 0.44% | | | | | | | | |
| Options purchased* | | | | | | | 591 | |
| | | | | | | | | |
| Total options purchased (cost: $200,000) | | | | | | | 591 | |
| Total investment securities 97.36% (cost: $157,373,000) | | | | | | | 129,438 | |
| Other assets less liabilities 2.64% | | | | | | | 3,512 | |
| | | | | | | | | |
| Net assets 100.00% | | | | | | $ | 132,950 | |
*Options purchased
Put
| Description | | Number of
contracts | | Notional
amount
(000) | | | Exercise
price | | | Expiration
date | | Value at
6/30/2022
(000) | |
| iShares MSCI EAFE ETF | | 2,050 | | USD | 12,811 | | | $ | 45.00 | | | 12/16/2022 | | | $ | 505 | |
| iShares MSCI EAFE ETF | | 780 | | | 4,874 | | | | 50.00 | | | 12/16/2022 | | | | 75 | |
| iShares MSCI EAFE ETF | | 120 | | | 750 | | | | 53.00 | | | 12/16/2022 | | | | 11 | |
| | | | | | | | | | | | | | | | $ | 591 | |
Futures contracts
| Contracts | | Type | | Number of
contracts | | Expiration | | Notional
amount
(000) | | Value and
unrealized
(depreciation)
appreciation
at 6/30/2022
(000) | |
| 5 Year U.S. Treasury Note Futures | | Long | | 57 | | September 2022 | | USD | 6,398 | | | $ | (48 | ) |
| S&P 500 E-mini Index Contracts | | Short | | 75 | | September 2022 | | | (14,211 | ) | | | 479 | |
| Mini MSCI Emerging Market Index Contracts | | Short | | 545 | | September 2022 | | | (27,323 | ) | | | 187 | |
| MSCI EAFE Index Contracts | | Short | | 381 | | September 2022 | | | (35,368 | ) | | | 470 | |
| | | | | | | | | | | | | $ | 1,088 | |
| American Funds Insurance Series | 239 |
Managed Risk International Fund (continued)
Investments in affiliates2
| | | Value of
affiliates at
1/1/2022
(000) | | | Additions
(000) | | | Reductions
(000) | | | Net
realized
gain (loss)
(000) | | | Net
unrealized
depreciation
(000) | | | Value of
affiliates at
6/30/2022
(000) | | | Dividend
income
(000) | | | Capital gain
distributions
received
(000) | |
| Growth funds 84.30% | | | | | | | | | | | | | | | | | | | | | | | | | | | | | | | | |
| American Funds Insurance Series – International Fund, Class 1 | | $ | 136,987 | | | $ | 65,776 | | | $ | 43,290 | | | $ | 4,856 | | | $ | (52,250 | ) | | $ | 112,079 | | | $ | 570 | | | $ | 16,110 | |
| Fixed income funds 9.50% | | | | | | | | | | | | | | | | | | | | | | | | | | | | | | | | |
| American Funds Insurance Series – The Bond Fund of America, Class 1 | | | 16,071 | | | | 6,973 | | | | 8,612 | | | | (1,234 | ) | | | (574 | ) | | | 12,624 | | | | 82 | | | | 160 | |
| Total 93.80% | | | | | | | | | | | | | | $ | 3,622 | | | $ | (52,824 | ) | | $ | 124,703 | | | $ | 652 | | | $ | 16,270 | |
| 1 | Rate represents the seven-day yield at 6/30/2022. |
| 2 | Part of the same “group of investment companies” as the fund as defined under the Investment Company Act of 1940, as amended. |
Refer to the notes to financial statements.
| 240 | American Funds Insurance Series |
| Managed Risk Washington Mutual Investors Fund | |
| Investment portfolio June 30, 2022 | unaudited |
| Growth-and-income funds 84.30% | | Shares | | | Value
(000) | |
| American Funds Insurance Series – Washington Mutual Investors Fund, Class 1 | | | 22,117,771 | | | $ | 271,164 | |
| | | | | | | | | |
| Total growth-and-income funds (cost: $303,250,000) | | | | | | | 271,164 | |
| | | | | | | | | |
| Fixed income funds 9.49% | | | | | | | | |
| American Funds Insurance Series – U.S. Government Securities Fund, Class 1 | | | 2,829,677 | | | | 30,532 | |
| | | | | | | | | |
| Total fixed income funds (cost: $32,271,000) | | | | | | | 30,532 | |
| | | | | | | | | |
| Short-term securities 2.91% | | | | | | | | |
| State Street Institutional U.S. Government Money Market Fund, Premier Class 0.74%1 | | | 9,354,161 | | | | 9,354 | |
| | | | | | | | | |
| Total short-term securities (cost: $9,354,000) | | | | | | | 9,354 | |
| | | | | | | | | |
| Options purchased 0.26% | | | | | | | | |
| Options purchased* | | | | | | | 842 | |
| | | | | | | | | |
| Total options purchased (cost: $873,000) | | | | | | | 842 | |
| Total investment securities 96.96% (cost: $345,748,000) | | | | | | | 311,892 | |
| Other assets less liabilities 3.04% | | | | | | | 9,777 | |
| | | | | | | | | |
| Net assets 100.00% | | | | | | $ | 321,669 | |
*Options purchased
Put
| Description | | Number of
contracts | | Notional
amount
(000) | | | Exercise
price | | | Expiration
date | | Value at
6/30/2022
(000) | |
| S&P 500 Index | | 175 | | USD | 66,244 | | | $ | 2,500.00 | | | 12/16/2022 | | | $ | 462 | |
| S&P 500 Index | | 15 | | | 5,678 | | | | 2,650.00 | | | 12/16/2022 | | | | 50 | |
| S&P 500 Index | | 45 | | | 17,034 | | | | 2,675.00 | | | 12/16/2022 | | | | 155 | |
| S&P 500 Index | | 45 | | | 17,035 | | | | 2,725.00 | | | 12/16/2022 | | | | 175 | |
| | | | | | | | | | | | | | | | $ | 842 | |
Futures contracts
| Contracts | | Type | | Number of
contracts | | Expiration | | Notional
amount
(000) | | Value and
unrealized
(depreciation)
appreciation
at 6/30/2022
(000) | |
| 5 Year U.S. Treasury Note Futures | | Long | | 196 | | September 2022 | | USD | 22,001 | | | $ | (70 | ) |
| Euro Stoxx 50 Index Contracts | | Short | | 73 | | September 2022 | | | (2,632 | ) | | | 117 | |
| Euro Currency Contracts | | Short | | 22 | | September 2022 | | | (2,898 | ) | | | 60 | |
| S&P Mid 400 E-mini Index Contracts | | Short | | 13 | | September 2022 | | | (2,949 | ) | | | 165 | |
| FTSE 100 Index Contracts | | Short | | 44 | | September 2022 | | | (3,814 | ) | | | 3 | |
| British Pound Currency Contracts | | Short | | 53 | | September 2022 | | | (4,041 | ) | | | 84 | |
| S&P 500 E-mini Index Contracts | | Short | | 725 | | September 2022 | | | (137,369 | ) | | | 3,489 | |
| | | | | | | | | | | | | $ | 3,848 | |
| American Funds Insurance Series | 241 |
Managed Risk Washington Mutual Investors Fund (continued)
Investments in affiliates2
| | | Value of
affiliates at
1/1/2022
(000) | | | Additions
(000) | | | Reductions
(000) | | | Net
realized
gain (loss)
(000) | | | Net
unrealized
(depreciation)
appreciation
(000) | | | Value of
affiliates at
6/30/2022
(000) | | | Dividend
income
(000) | | | Capital gain
distributions
received
(000) | |
| Growth-and-income funds 84.30% | | | | | | | | | | | | | | | | | | | | | | | | | | | | | | | | |
| American Funds Insurance Series – Washington Mutual Investors Fund, Class 1 | | $ | 315,947 | | | $ | 152,592 | | | $ | 96,114 | | | $ | 34,867 | | | $ | (136,128 | ) | | $ | 271,164 | | | $ | 1,303 | | | $ | 61,850 | |
| Fixed income funds 9.49% | | | | | | | | | | | | | | | | | | | | | | | | | | | | | | | | |
| American Funds Insurance Series – U.S. Government Securities Fund, Class 1 | | | 37,066 | | | | 18,005 | | | | 21,805 | | | | (4,107 | ) | | | 1,373 | | | | 30,532 | | | | 156 | | | | — | |
| Total 93.79% | | | | | | | | | | | | | | $ | 30,760 | | | $ | (134,755 | ) | | $ | 301,696 | | | $ | 1,459 | | | $ | 61,850 | |
| 1 | Rate represents the seven-day yield at 6/30/2022. |
| 2 | Part of the same “group of investment companies” as the fund as defined under the Investment Company Act of 1940, as amended. |
Refer to the notes to financial statements.
| 242 | American Funds Insurance Series |
| Managed Risk Growth-Income Fund | |
| Investment portfolio June 30, 2022 | unaudited |
| Growth-and-income funds 79.27% | | Shares | | | Value
(000) | |
| American Funds Insurance Series – Growth-Income Fund, Class 1 | | | 35,443,702 | | | $ | 1,729,298 | |
| | | | | | | | | |
| Total growth-and-income funds (cost: $1,797,473,000) | | | | | | | 1,729,298 | |
| | | | | | | | | |
| Fixed income funds 14.36% | | | | | | | | |
| American Funds Insurance Series – The Bond Fund of America, Class 1 | | | 31,586,778 | | | | 313,341 | |
| | | | | | | | | |
| Total fixed income funds (cost: $350,338,000) | | | | | | | 313,341 | |
| | | | | | | | | |
| Short-term securities 2.61% | | | | | | | | |
| State Street Institutional U.S. Government Money Market Fund, Premier Class 0.74%1 | | | 57,022,564 | | | | 57,023 | |
| | | | | | | | | |
| Total short-term securities (cost: $57,023,000) | | | | | | | 57,023 | |
| | | | | | | | | |
| Options purchased 0.53% | | | | | | | | |
| Options purchased* | | | | | | | 11,543 | |
| | | | | | | | | |
| Total options purchased (cost: $10,612,000) | | | | | | | 11,543 | |
| Total investment securities 96.77% (cost: $2,215,446,000) | | | | | | | 2,111,205 | |
| Other assets less liabilities 3.23% | | | | | | | 70,515 | |
| | | | | | | | | |
| Net assets 100.00% | | | | | | $ | 2,181,720 | |
*Options purchased
Put
| Description | | Number of
contracts | | Notional
amount
(000) | | | Exercise
price | | | Expiration
date | | Value at
6/30/2022
(000) | |
| S&P 500 Index | | 20 | | USD | 7,571 | | | $ | 2,950.00 | | | 9/16/2022 | | | $ | 37 | |
| S&P 500 Index | | 640 | | | 242,264 | | | | 2,975.00 | | | 9/16/2022 | | | | 1,318 | |
| S&P 500 Index | | 170 | | | 64,351 | | | | 3,000.00 | | | 9/16/2022 | | | | 349 | |
| S&P 500 Index | | 14 | | | 5,299 | | | | 3,025.00 | | | 9/16/2022 | | | | 33 | |
| S&P 500 Index | | 100 | | | 37,854 | | | | 2,650.00 | | | 12/16/2022 | | | | 331 | |
| S&P 500 Index | | 500 | | | 189,269 | | | | 2,675.00 | | | 12/16/2022 | | | | 1,721 | |
| S&P 500 Index | | 440 | | | 166,557 | | | | 2,725.00 | | | 12/16/2022 | | | | 1,711 | |
| S&P 500 Index | | 325 | | | 123,025 | | | | 2,800.00 | | | 12/16/2022 | | | | 1,387 | |
| S&P 500 Index | | 100 | | | 37,854 | | | | 2,825.00 | | | 12/16/2022 | | | | 432 | |
| S&P 500 Index | | 200 | | | 75,708 | | | | 2,850.00 | | | 12/16/2022 | | | | 910 | |
| S&P 500 Index | | 450 | | | 170,342 | | | | 2,875.00 | | | 12/16/2022 | | | | 2,300 | |
| S&P 500 Index | | 200 | | | 75,708 | | | | 2,900.00 | | | 12/16/2022 | | | | 1,014 | |
| | | | | | | | | | | | | | | | $ | 11,543 | |
| American Funds Insurance Series | 243 |
Managed Risk Growth-Income Fund (continued)
Futures contracts
| Contracts | | Type | | Number of
contracts | | Expiration | | Notional
amount
(000) | | Value and
unrealized
(depreciation)
appreciation
at 6/30/2022
(000) | |
| 5 Year U.S. Treasury Note Futures | | Long | | 1,458 | | September 2022 | | USD | 163,661 | | | $ | (524 | ) |
| Russell 2000 Mini Index Contracts | | Short | | 53 | | September 2022 | | | (4,526 | ) | | | 222 | |
| Mini MSCI Emerging Market Index Contracts | | Short | | 384 | | September 2022 | | | (19,252 | ) | | | (16 | ) |
| FTSE 100 Index Contracts | | Short | | 304 | | September 2022 | | | (26,352 | ) | | | 54 | |
| Euro Stoxx 50 Index Contracts | | Short | | 764 | | September 2022 | | | (27,550 | ) | | | 1,147 | |
| British Pound Currency Contracts | | Short | | 366 | | September 2022 | | | (27,905 | ) | | | 528 | |
| Euro Currency Contracts | | Short | | 228 | | September 2022 | | | (30,034 | ) | | | 529 | |
| S&P Mid 400 E-mini Index Contracts | | Short | | 289 | | September 2022 | | | (65,545 | ) | | | 3,395 | |
| S&P 500 E-mini Index Contracts | | Short | | 4,111 | | September 2022 | | | (778,932 | ) | | | 21,404 | |
| | | | | | | | | | | | | $ | 26,739 | |
Investments in affiliates2
| | | Value of
affiliates at
1/1/2022
(000) | | | Additions
(000) | | | Reductions
(000) | | | Net
realized
gain (loss)
(000) | | | Net
unrealized
depreciation
(000) | | | Value of
affiliates at
6/30/2022
(000) | | | Dividend
income
(000) | | | Capital gain
distributions
received
(000) | |
| Growth-and-income funds 79.27% | | | | | | | | | | | | | | | | | | | | | | | | | | | | | | | | |
| American Funds Insurance Series – Growth-Income Fund, Class 1 | | $ | 2,125,192 | | | $ | 771,734 | | | $ | 582,441 | | | $ | 127,675 | | | $ | (712,862 | ) | | $ | 1,729,298 | | | $ | 5,619 | | | $ | 175,737 | |
| Fixed income funds 14.36% | | | | | | | | | | | | | | | | | | | | | | | | | | | | | | | | |
| American Funds Insurance Series – The Bond Fund of America, Class 1 | | | 398,789 | | | | 125,918 | | | | 166,983 | | | | (21,794 | ) | | | (22,589 | ) | | | 313,341 | | | | 1,982 | | | | 3,897 | |
| Total 93.63% | | | | | | | | | | | | | | $ | 105,881 | | | $ | (735,451 | ) | | $ | 2,042,639 | | | $ | 7,601 | | | $ | 179,634 | |
| 1 | Rate represents the seven-day yield at 6/30/2022. |
| 2 | Part of the same “group of investment companies” as the fund as defined under the Investment Company Act of 1940, as amended. |
Refer to the notes to financial statements.
| 244 | American Funds Insurance Series |
| Managed Risk Asset Allocation Fund | |
| Investment portfolio June 30, 2022 | unaudited |
| Asset allocation funds 94.58% | | Shares | | | Value
(000) | |
| American Funds Insurance Series – Asset Allocation Fund, Class 1 | | | 98,871,249 | | | $ | 2,167,258 | |
| | | | | | | | | |
| Total asset allocation funds (cost: $2,302,803,000) | | | | | | | 2,167,258 | |
| | | | | | | | | |
| Short-term securities 3.03% | | | | | | | | |
| State Street Institutional U.S. Government Money Market Fund, Premier Class 0.74%1 | | | 69,465,936 | | | | 69,466 | |
| | | | | | | | | |
| Total short-term securities (cost: $69,466,000) | | | | | | | 69,466 | |
| | | | | | | | | |
| Options purchased 0.05% | | | | | | | | |
| Options purchased* | | | | | | | 1,138 | |
| | | | | | | | | |
| Total options purchased (cost: $2,257,000) | | | | | | | 1,138 | |
| Total investment securities 97.66% (cost: $2,374,526,000) | | | | | | | 2,237,862 | |
| Other assets less liabilities 2.34% | | | | | | | 53,610 | |
| | | | | | | | | |
| Net assets 100.00% | | | | | | $ | 2,291,472 | |
*Options purchased
Put
| Description | | Number of
contracts | | Notional
amount
(000) | | | Exercise
price | | | Expiration
date | | Value at
6/30/2022
(000) | |
| S&P 500 Index | | 530 | | USD | 200,625 | | | $ | 2,950.00 | | | 9/16/2022 | | | $ | 975 | |
| S&P 500 Index | | 44 | | | 16,656 | | | | 2,975.00 | | | 9/16/2022 | | | | 91 | |
| S&P 500 Index | | 10 | | | 3,785 | | | | 3,000.00 | | | 9/16/2022 | | | | 21 | |
| S&P 500 Index | | 22 | | | 8,328 | | | | 3,025.00 | | | 9/16/2022 | | | | 51 | |
| | | | | | | | | | | | | | | | $ | 1,138 | |
Futures contracts
| Contracts | | Type | | Number of
contracts | | Expiration | | Notional
amount
(000) | | Value and
unrealized
(depreciation)
appreciation
at 6/30/2022
(000) | |
| 5 Year U.S. Treasury Note Futures | | Long | | 1,133 | | September 2022 | | USD | 127,179 | | | $ | (371 | ) |
| FTSE 100 Index Contracts | | Short | | 90 | | September 2022 | | | (7,802 | ) | | | 12 | |
| British Pound Currency Contracts | | Short | | 108 | | September 2022 | | | (8,234 | ) | | | 184 | |
| Russell 2000 Mini Index Contracts | | Short | | 147 | | September 2022 | | | (12,554 | ) | | | 569 | |
| Mini MSCI Emerging Market Index Contracts | | Short | | 432 | | September 2022 | | | (21,658 | ) | | | 65 | |
| Euro Stoxx 50 Index Contracts | | Short | | 680 | | September 2022 | | | (24,521 | ) | | | 1,065 | |
| Euro Currency Contracts | | Short | | 204 | | September 2022 | | | (26,872 | ) | | | 467 | |
| S&P Mid 400 E-mini Index Contracts | | Short | | 318 | | September 2022 | | | (72,122 | ) | | | 3,725 | |
| S&P 500 E-mini Index Contracts | | Short | | 3,537 | | September 2022 | | | (670,173 | ) | | | 17,854 | |
| | | | | | | | | | | | | $ | 23,570 | |
| American Funds Insurance Series | 245 |
Managed Risk Asset Allocation Fund (continued)
Investments in affiliates2
| | | Value of
affiliate at
1/1/2022
(000) | | | Additions
(000) | | | Reductions
(000) | | | Net
realized
gain
(000) | | | Net
unrealized
depreciation
(000) | | | Value of
affiliate at
6/30/2022
(000) | | | Dividend
income
(000) | | | Capital gain
distributions
received
(000) | |
| Asset allocation funds 94.58% | | | | | | | | | | | | | | | | | | | | | | | | | | | | | | | | |
| American Funds Insurance Series – Asset Allocation Fund, Class 1 | | $ | 2,678,055 | | | $ | 699,143 | | | $ | 565,128 | | | $ | 66,785 | | | $ | (711,597 | ) | | $ | 2,167,258 | | | $ | 9,909 | | | $ | 231,217 | |
| 1 | Rate represents the seven-day yield at 6/30/2022. |
| 2 | Part of the same “group of investment companies” as the fund as defined under the Investment Company Act of 1940, as amended. |
Refer to the notes to financial statements.
| 246 | American Funds Insurance Series |
| Financial statements | |
| | |
Statements of assets and liabilities
at June 30, 2022 | unaudited
(dollars in thousands) |
| | | Global
Growth
Fund | | | Global
Small
Capitalization
Fund | | | Growth
Fund | | | International
Fund | | | New
World
Fund | |
| Assets: | | | | | | | | | | | | | | | | | | | | |
| Investment securities, at value: | | | | | | | | | | | | | | | | | | | | |
| Unaffiliated issuers | | $ | 6,231,978 | | | $ | 2,663,432 | | | $ | 29,568,273 | | | $ | 5,942,975 | | | $ | 2,872,337 | |
| Affiliated issuers | | | 636,913 | | | | 333,160 | | | | 1,575,971 | | | | 932,894 | | | | 318,188 | |
| Cash | | | 709 | | | | 1,957 | | | | 404 | | | | 3,754 | | | | 3,721 | |
| Cash collateral received for securities on loan | | | 2,045 | | | | 8,534 | | | | 8,112 | | | | 7,475 | | | | 840 | |
| Cash collateral pledged for futures contracts | | | — | | | | — | | | | — | | | | — | | | | 161 | |
| Cash collateral pledged for swap contracts | | | — | | | | — | | | | — | | | | — | | | | — | |
| Cash denominated in currencies other than U.S. dollars | | | 2,246 | | | | 815 | | | | 3,703 | | | | 8,968 | | | | 1,489 | |
| Unrealized appreciation on open forward currency contracts | | | — | | | | — | | | | — | | | | — | | | | 40 | |
| Receivables for: | | | | | | | | | | | | | | | | | | | | |
| Sales of investments | | | 1,248 | | | | 12,647 | | | | 15,451 | | | | 6,109 | | | | 15,910 | |
| Sales of fund’s shares | | | 20,636 | | | | 3,605 | | | | 109,002 | | | | 5,552 | | | | 1,756 | |
| Dividends and interest | | | 9,481 | | | | 3,554 | | | | 12,384 | | | | 16,623 | | | | 7,976 | |
| Closed forward currency contracts | | | — | | | | — | | | | — | | | | — | | | | — | |
| Variation margin on futures contracts | | | — | | | | — | | | | — | | | | — | | | | 103 | |
| Variation margin on centrally cleared swap contracts | | | — | | | | — | | | | — | | | | — | | | | — | |
| Securities lending income | | | — | * | | | 8 | | | | 6 | | | | 1 | | | | 1 | |
| Currency translations | | | 704 | | | | 664 | | | | — | | | | 1,493 | | | | 2,322 | |
| Other | | | — | | | | — | * | | | — | | | | — | | | | 60 | |
| | | | 6,905,960 | | | | 3,028,376 | | | | 31,293,306 | | | | 6,925,844 | | | | 3,224,904 | |
| Liabilities: | | | | | | | | | | | | | | | | | | | | |
| Collateral for securities on loan | | | 20,453 | | | | 85,345 | | | | 81,118 | | | | 74,745 | | | | 8,405 | |
| Unrealized depreciation on open forward currency contracts | | | — | | | | — | | | | — | | | | — | | | | 1 | |
| Unrealized depreciation on unfunded commitments | | | — | | | | — | | | | — | | | | — | | | | — | |
| Payables for: | | | | | | | | | | | | | | | | | | | | |
| Purchases of investments | | | 847 | | | | 13,472 | | | | 14,075 | | | | 3,609 | | | | 15,875 | |
| Repurchases of fund’s shares | | | 2,728 | | | | 552 | | | | 5,579 | | | | 4,065 | | | | 1,878 | |
| Investment advisory services | | | 2,110 | | | | 1,496 | | | | 8,385 | | | | 2,802 | | | | 1,373 | |
| Insurance administrative fees | | | 374 | | | | 171 | | | | 1,696 | | | | 253 | | | | 477 | |
| Services provided by related parties | | | 966 | | | | 505 | | | | 4,482 | | | | 945 | | | | 397 | |
| Trustees’ deferred compensation | | | 85 | | | | 57 | | | | 483 | | | | 177 | | | | 41 | |
| Closed forward currency contracts | | | — | | | | — | | | | — | | | | — | | | | — | |
| Variation margin on futures contracts | | | — | | | | — | | | | — | | | | — | | | | 167 | |
| Variation margin on centrally cleared swap contracts | | | — | | | | — | | | | — | | | | — | | | | — | |
| Non-U.S. taxes | | | 7,273 | | | | 7,269 | | | | 1,020 | | | | 25,052 | | | | 6,882 | |
| Other | | | 378 | | | | 258 | | | | 297 | | | | 582 | | | | 409 | |
| | | | 35,214 | | | | 109,125 | | | | 117,135 | | | | 112,230 | | | | 35,905 | |
| Net assets at June 30, 2022 | | $ | 6,870,746 | | | $ | 2,919,251 | | | $ | 31,176,171 | | | $ | 6,813,614 | | | $ | 3,188,999 | |
| | | | | | | | | | | | | | | | | | | | | |
| Net assets consist of: | | | | | | | | | | | | | | | | | | | | |
| Capital paid in on shares of beneficial interest | | $ | 4,728,897 | | | $ | 2,668,735 | | | $ | 20,318,538 | | | $ | 6,622,057 | | | $ | 2,724,606 | |
| Total distributable earnings (accumulated loss) | | | 2,141,849 | | | | 250,516 | | | | 10,857,633 | | | | 191,557 | | | | 464,393 | |
| Net assets at June 30, 2022 | | $ | 6,870,746 | | | $ | 2,919,251 | | | $ | 31,176,171 | | | $ | 6,813,614 | | | $ | 3,188,999 | |
| | | | | | | | | | | | | | | | | | | | | |
| Investment securities on loan, at value | | $ | 27,348 | | | $ | 96,178 | | | $ | 78,405 | | | $ | 71,916 | | | $ | 14,516 | |
| Investment securities, at cost | | | | | | | | | | | | | | | | | | | | |
| Unaffiliated issuers | | | 4,414,385 | | | | 2,498,648 | | | | 20,009,865 | | | | 5,556,442 | | | | 2,462,901 | |
| Affiliated issuers | | | 637,028 | | | | 325,716 | | | | 1,576,195 | | | | 933,018 | | | | 318,233 | |
| Cash denominated in currencies other than U.S. dollars, at cost | | | 2,249 | | | | 815 | | | | 3,703 | | | | 8,960 | | | | 1,489 | |
Refer to the end of the statements of assets and liabilities for footnotes.
Refer to the notes to financial statements.
| American Funds Insurance Series | 247 |
| Financial statements (continued) | |
| | |
Statements of assets and liabilities
at June 30, 2022 (continued) | unaudited
(dollars in thousands) |
| | | Washington
Mutual
Investors
Fund | | | Capital
World Growth
and Income
Fund | | | Growth-
Income
Fund | | | International
Growth
and Income
Fund | | | Capital
Income
Builder | |
| Assets: | | | | | | | | | | | | | | | | | | | | |
| Investment securities, at value: | | | | | | | | | | | | | | | | | | | | |
| Unaffiliated issuers | | $ | 8,932,580 | | | $ | 1,657,279 | | | $ | 30,626,361 | | | $ | 270,057 | | | $ | 1,016,311 | |
| Affiliated issuers | | | 405,537 | | | | 82,938 | | | | 2,302,880 | | | | 22,012 | | | | 132,263 | |
| Cash | | | 1,246 | | | | 136 | | | | 882 | | | | 205 | | | | 1,213 | |
| Cash collateral received for securities on loan | | | 5,562 | | | | 1,544 | | | | 17,836 | | | | 141 | | | | 1,403 | |
| Cash collateral pledged for futures contracts | | | — | | | | — | | | | — | | | | — | | | | — | |
| Cash collateral pledged for swap contracts | | | — | | | | — | | | | — | | | | — | | | | — | |
| Cash denominated in currencies other than U.S. dollars | | | — | | | | 282 | | | | 1 | | | | 551 | | | | 144 | |
| Unrealized appreciation on open forward currency contracts | | | — | | | | — | | | | — | | | | 1 | | | | — | |
| Receivables for: | | | | | | | | | | | | | | | | | | | | |
| Sales of investments | | | 21,819 | | | | 2,415 | | | | — | | | | 1,135 | | | | 60,393 | |
| Sales of fund’s shares | | | 2,005 | | | | 705 | | | | 14,620 | | | | 100 | | | | 4,153 | |
| Dividends and interest | | | 5,767 | | | | 4,918 | | | | 43,557 | | | | 1,824 | | | | 4,117 | |
| Closed forward currency contracts | | | — | | | | — | | | | — | | | | — | | | | — | |
| Variation margin on futures contracts | | | — | | | | — | | | | — | | | | — | | | | 360 | |
| Variation margin on centrally cleared swap contracts | | | — | | | | — | | | | — | | | | — | | | | 68 | |
| Securities lending income | | | 2 | | | | — | * | | | 12 | | | | — | * | | | 1 | |
| Currency translations | | | 1 | | | | 264 | | | | — | | | | — | | | | — | |
| Other | | | — | | | | — | | | | — | | | | 2 | | | | — | |
| | | | 9,374,519 | | | | 1,750,481 | | | | 33,006,149 | | | | 296,028 | | | | 1,220,426 | |
| Liabilities: | | | | | | | | | | | | | | | | | | | | |
| Collateral for securities on loan | | | 55,623 | | | | 15,435 | | | | 178,358 | | | | 1,413 | | | | 14,030 | |
| Unrealized depreciation on open forward currency contracts | | | — | | | | — | | | | — | | | | — | | | | — | |
| Unrealized depreciation on unfunded commitments | | | — | | | | — | | | | — | | | | — | | | | — | |
| Payables for: | | | | | | | | | | | | | | | | | | | | |
| Purchases of investments | | | 9,878 | | | | 3,247 | | | | 29,439 | | | | 1,065 | | | | 106,256 | |
| Repurchases of fund’s shares | | | 6,753 | | | | 377 | | | | 15,313 | | | | 332 | | | | 1,090 | |
| Investment advisory services | | | 1,835 | | | | 540 | | | | 7,120 | | | | 116 | | | | 199 | |
| Insurance administrative fees | | | 707 | | | | 124 | | | | 1,057 | | | | 76 | | | | 343 | |
| Services provided by related parties | | | 1,023 | | | | 297 | | | | 3,648 | | | | 66 | | | | 136 | |
| Trustees’ deferred compensation | | | 99 | | | | 25 | | | | 535 | | | | 14 | | | | 7 | |
| Closed forward currency contracts | | | — | | | | — | | | | — | | | | — | | | | — | |
| Variation margin on futures contracts | | | — | | | | — | | | | — | | | | — | | | | 19 | |
| Variation margin on centrally cleared swap contracts | | | — | | | | — | | | | — | | | | — | | | | 86 | |
| Non-U.S. taxes | | | 110 | | | | 664 | | | | 1,513 | | | | 74 | | | | 613 | |
| Other | | | 12 | | | | 172 | | | | 406 | | | | 132 | | | | 37 | |
| | | | 76,040 | | | | 20,881 | | | | 237,389 | | | | 3,288 | | | | 122,816 | |
| Net assets at June 30, 2022 | | $ | 9,298,479 | | | $ | 1,729,600 | | | $ | 32,768,760 | | | $ | 292,740 | | | $ | 1,097,610 | |
| | | | | | | | | | | | | | | | | | | | | |
| Net assets consist of: | | | | | | | | | | | | | | | | | | | | |
| Capital paid in on shares of beneficial interest | | $ | 7,812,795 | | | $ | 1,591,060 | | | $ | 21,570,621 | | | $ | 319,949 | | | $ | 1,002,592 | |
| Total distributable earnings (accumulated loss) | | | 1,485,684 | | | | 138,540 | | | | 11,198,139 | | | | (27,209 | ) | | | 95,018 | |
| Net assets at June 30, 2022 | | $ | 9,298,479 | | | $ | 1,729,600 | | | $ | 32,768,760 | | | $ | 292,740 | | | $ | 1,097,610 | |
| | | | | | | | | | | | | | | | | | | | | |
| Investment securities on loan, at value | | $ | 81,124 | | | $ | 16,355 | | | $ | 171,950 | | | $ | 2,221 | | | $ | 13,384 | |
| Investment securities, at cost | | | | | | | | | | | | | | | | | | | | |
| Unaffiliated issuers | | | 7,699,509 | | | | 1,516,294 | | | | 21,378,607 | | | | 294,213 | | | | 915,374 | |
| Affiliated issuers | | | 405,592 | | | | 82,945 | | | | 2,303,148 | | | | 22,014 | | | | 137,500 | |
| Cash denominated in currencies other than U.S. dollars, at cost | | | — | | | | 282 | | | | — | * | | | 551 | | | | 144 | |
Refer to the end of the statements of assets and liabilities for footnotes.
Refer to the notes to financial statements.
| 248 | American Funds Insurance Series |
| Financial statements (continued) | |
| | |
Statements of assets and liabilities
at June 30, 2022 (continued) | unaudited
(dollars in thousands) |
| | | Asset
Allocation
Fund | | | American
Funds
Global
Balanced
Fund† | | | The Bond
Fund
of America | | | Capital
World Bond
Fund | | | American
High-Income
Trust | |
| Assets: | | | | | | | | | | | | | | | | | | | | |
| Investment securities, at value: | | | | | | | | | | | | | | | | | | | | |
| Unaffiliated issuers | | $ | 22,412,782 | | | $ | 369,158 | | | $ | 10,721,189 | | | $ | 1,519,026 | | | $ | 812,689 | |
| Affiliated issuers | | | 3,754,317 | | | | 12,688 | | | | 2,002,964 | | | | 100,175 | | | | 22,060 | |
| Cash | | | 2,723 | | | | 87 | | | | 10,237 | | | | 658 | | | | 497 | |
| Cash collateral received for securities on loan | | | 5,530 | | | | 400 | | | | — | | | | — | | | | — | |
| Cash collateral pledged for futures contracts | | | — | | | | — | | | | — | | | | — | | | | 149 | |
| Cash collateral pledged for swap contracts | | | — | | | | — | | | | — | | | | — | | | | 891 | |
| Cash denominated in currencies other than U.S. dollars | | | 662 | | | | 67 | | | | — | * | | | 1,599 | | | | — | * |
| Unrealized appreciation on open forward currency contracts | | | — | | | | 103 | | | | 293 | | | | 6,655 | | | | — | |
| Receivables for: | | | | | | | | | | | | | | | | | | | | |
| Sales of investments | | | 1,188,210 | | | | 8,277 | | | | 2,906,701 | | | | 92,109 | | | | 3,062 | |
| Sales of fund’s shares | | | 3,466 | | | | 384 | | | | 4,586 | | | | 125 | | | | 166 | |
| Dividends and interest | | | 66,983 | | | | 1,673 | | | | 63,679 | | | | 10,132 | | | | 13,847 | |
| Closed forward currency contracts | | | — | | | | 18 | | | | 75 | | | | 32 | | | | — | |
| Variation margin on futures contracts | | | 3,827 | | | | 117 | | | | 11,937 | | | | 2,603 | | | | — | |
| Variation margin on centrally cleared swap contracts | | | 76 | | | | 85 | | | | 1,064 | | | | 1,056 | | | | 33 | |
| Securities lending income | | | 3 | | | | — | * | | | — | | | | — | | | | — | |
| Currency translations | | | 20 | | | | — | | | | 14 | | | | — | | | | — | |
| Other | | | — | | | | — | | | | — | | | | — | | | | 3 | |
| | | | 27,438,599 | | | | 393,057 | | | | 15,722,739 | | | | 1,734,170 | | | | 853,397 | |
| Liabilities: | | | | | | | | | | | | | | | | | | | | |
| Collateral for securities on loan | | | 55,304 | | | | 4,005 | | | | — | | | | — | | | | — | |
| Unrealized depreciation on open forward currency contracts | | | — | | | | 459 | | | | 470 | | | | 4,636 | | | | — | |
| Unrealized depreciation on unfunded commitments | | | 3 | | | | — | | | | — | | | | — | * | | | 1 | |
| Payables for: | | | | | | | | | | | | | | | | | | | | |
| Purchases of investments | | | 2,383,471 | | | | 12,611 | | | | 4,714,650 | | | | 141,486 | | | | 2,409 | |
| Repurchases of fund’s shares | | | 13,987 | | | | 73 | | | | 30,770 | | | | 2,607 | | | | 631 | |
| Investment advisory services | | | 5,603 | | | | 138 | | | | 1,475 | | | | 568 | | | | 193 | |
| Insurance administrative fees | | | 3,473 | | | | 75 | | | | 583 | | | | 37 | | | | 49 | |
| Services provided by related parties | | | 2,651 | | | | 66 | | | | 1,083 | | | | 224 | | | | 156 | |
| Trustees’ deferred compensation | | | 306 | | | | 4 | | | | 126 | | | | 26 | | | | 33 | |
| Closed forward currency contracts | | | — | | | | 4 | | | | 576 | | | | 1,476 | | | | — | |
| Variation margin on futures contracts | | | 5,748 | | | | 51 | | | | 3,238 | | | | 928 | | | | 46 | |
| Variation margin on centrally cleared swap contracts | | | 5 | | | | 12 | | | | 848 | | | | 112 | | | | 2 | |
| Non-U.S. taxes | | | 2,863 | | | | 52 | | | | 12 | | | | 72 | | | | — | |
| Other | | | 180 | | | | 29 | | | | 10 | | | | 282 | | | | 1 | |
| | | | 2,473,594 | | | | 17,579 | | | | 4,753,841 | | | | 152,454 | | | | 3,521 | |
| Net assets at June 30, 2022 | | $ | 24,965,005 | | | $ | 375,478 | | | $ | 10,968,898 | | | $ | 1,581,716 | | | $ | 849,876 | |
| | | | | | | | | | | | | | | | | | | | | |
| Net assets consist of: | | | | | | | | | | | | | | | | | | | | |
| Capital paid in on shares of beneficial interest | | $ | 20,087,583 | | | $ | 332,943 | | | $ | 12,050,340 | | | $ | 1,900,155 | | | $ | 1,195,797 | |
| Total distributable earnings (accumulated loss) | | | 4,877,422 | | | | 42,535 | | | | (1,081,442 | ) | | | (318,439 | ) | | | (345,921 | ) |
| Net assets at June 30, 2022 | | $ | 24,965,005 | | | $ | 375,478 | | | $ | 10,968,898 | | | $ | 1,581,716 | | | $ | 849,876 | |
| | | | | | | | | | | | | | | | | | | | | |
| Investment securities on loan, at value | | $ | 53,318 | | | $ | 3,814 | | | $ | — | | | $ | — | | | $ | — | |
| Investment securities, at cost | | | | | | | | | | | | | | | | | | | | |
| Unaffiliated issuers | | | 18,483,563 | | | | 376,377 | | | | 11,470,544 | | | | 1,784,429 | | | | 914,920 | |
| Affiliated issuers | | | 4,024,178 | | | | 12,688 | | | | 2,003,265 | | | | 100,186 | | | | 22,062 | |
| Cash denominated in currencies other than U.S. dollars, at cost | | | 662 | | | | 67 | | | | — | * | | | 1,567 | | | | — | * |
Refer to the end of the statements of assets and liabilities for footnotes.
Refer to the notes to financial statements.
| American Funds Insurance Series | 249 |
| Financial statements (continued) | |
| | |
Statements of assets and liabilities
at June 30, 2022 (continued) | unaudited
(dollars in thousands) |
| | | American
Funds
Mortgage
Fund | | | Ultra-Short
Bond Fund | | | U.S.
Government
Securities
Fund | | | Managed
Risk
Growth
Fund | | | Managed
Risk
International
Fund | |
| Assets: | | | | | | | | | | | | | | | | | | | | |
| Investment securities, at value: | | | | | | | | | | | | | | | | | | | | |
| Unaffiliated issuers | | $ | 138,373 | | | $ | 416,230 | | | $ | 2,213,282 | | | $ | 19,464 | | | $ | 4,735 | |
| Affiliated issuers | | | — | | | | — | | | | — | | | | 431,775 | | | | 124,703 | |
| Cash | | | 2,771 | | | | 9,108 | | | | 47,433 | | | | — | | | | — | |
| Cash collateral received for securities on loan | | | — | | | | — | | | | — | | | | — | | | | — | |
| Cash collateral pledged for futures contracts | | | — | | | | — | | | | — | | | | 17,380 | | | | 3,515 | |
| Cash collateral pledged for swap contracts | | | — | | | | — | | | | — | | | | — | | | | — | |
| Cash denominated in currencies other than U.S. dollars | | | — | | | | — | | | | — | | | | — | | | | — | |
| Unrealized appreciation on open forward currency contracts | | | — | | | | — | | | | — | | | | — | | | | — | |
| Receivables for: | | | | | | | | | | | | | | | | | | | | |
| Sales of investments | | | 90,181 | | | | — | | | | 816,236 | | | | — | | | | 167 | |
| Sales of fund’s shares | | | 3 | | | | 18 | | | | 1,287 | | | | 332 | | | | — | * |
| Dividends and interest | | | 196 | | | | 9 | | | | 3,874 | | | | 18 | | | | 4 | |
| Closed forward currency contracts | | | — | | | | — | | | | — | | | | — | | | | — | |
| Variation margin on futures contracts | | | 171 | | | | — | | | | 5,437 | | | | 2,853 | | | | 464 | |
| Variation margin on centrally cleared swap contracts | | | — | | | | — | | | | 1,379 | | | | — | | | | — | |
| Securities lending income | | | — | | | | — | | | | — | | | | — | | | | — | |
| Currency translations | | | — | | | | — | | | | — | | | | — | | | | — | |
| Other | | | — | | | | — | | | | — | | | | — | | | | — | |
| | | | 231,695 | | | | 425,365 | | | | 3,088,928 | | | | 471,822 | | | | 133,588 | |
| Liabilities: | | | | | | | | | | | | | | | | | | | | |
| Collateral for securities on loan | | | — | | | | — | | | | — | | | | — | | | | — | |
| Unrealized depreciation on open forward currency contracts | | | — | | | | — | | | | — | | | | — | | | | — | |
| Unrealized depreciation on unfunded commitments | | | — | | | | — | | | | — | | | | — | | | | — | |
| Payables for: | | | | | | | | | | | | | | | | | | | | |
| Purchases of investments | | | 138,358 | | | | — | | | | 1,436,179 | | | | 228 | | | | 334 | |
| Repurchases of fund’s shares | | | 179 | | | | 1,130 | | | | 6,505 | | | | 86 | | | | 177 | |
| Investment advisory services | | | 13 | | | | 88 | | | | 238 | | | | 39 | | | | 11 | |
| Insurance administrative fees | | | 26 | | | | 42 | | | | 132 | | | | 310 | | | | 88 | |
| Services provided by related parties | | | 21 | | | | 86 | | | | 329 | | | | 94 | | | | 27 | |
| Trustees’ deferred compensation | | | 3 | | | | 12 | | | | 45 | | | | 3 | | | | 1 | |
| Closed forward currency contracts | | | — | | | | — | | | | — | | | | — | | | | — | |
| Variation margin on futures contracts | | | 21 | | | | — | | | | 2,583 | | | | 50 | | | | — | |
| Variation margin on centrally cleared swap contracts | | | 20 | | | | — | | | | 1,490 | | | | — | | | | — | |
| Non-U.S. taxes | | | — | | | | — | | | | — | | | | — | | | | — | |
| Other | | | 1 | | | | — | * | | | 2 | | | | — | | | | — | |
| | | | 138,642 | | | | 1,358 | | | | 1,447,503 | | | | 810 | | | | 638 | |
| Net assets at June 30, 2022 | | $ | 93,053 | | | $ | 424,007 | | | $ | 1,641,425 | | | $ | 471,012 | | | $ | 132,950 | |
|
| | | | | | | | | | | | | | | | | | | | | |
| Net assets consist of: | | | | | | | | | | | | | | | | | | | | |
| Capital paid in on shares of beneficial interest | | $ | 99,468 | | | $ | 424,284 | | | $ | 1,766,549 | | | $ | 468,687 | | | $ | 155,472 | |
| Total distributable earnings (accumulated loss) | | | (6,415 | ) | | | (277 | ) | | | (125,124 | ) | | | 2,325 | | | | (22,522 | ) |
| Net assets at June 30, 2022 | | $ | 93,053 | | | $ | 424,007 | | | $ | 1,641,425 | | | $ | 471,012 | | | $ | 132,950 | |
| | | | | | | | | | | | | | | | | | | | | |
| Investment securities on loan, at value | | $ | — | | | $ | — | | | $ | — | | | $ | — | | | $ | — | |
| Investment securities, at cost | | | | | | | | | | | | | | | | | | | | |
| Unaffiliated issuers | | | 140,617 | | | | 416,305 | | | | 2,268,542 | | | | 19,450 | | | | 4,344 | |
| Affiliated issuers | | | — | | | | — | | | | — | | | | 555,457 | | | | 153,029 | |
| Cash denominated in currencies other than U.S. dollars, at cost | | | — | | | | — | | | | — | | | | — | | | | — | |
Refer to the end of the statements of assets and liabilities for footnotes.
Refer to the notes to financial statements.
| 250 | American Funds Insurance Series |
| Financial statements (continued) | |
| | |
Statements of assets and liabilities
at June 30, 2022 (continued) | unaudited
(dollars in thousands) |
| | | Managed Risk
Washington
Mutual
Investors
Fund | | | Managed
Risk
Growth-
Income
Fund | | | Managed
Risk
Asset
Allocation
Fund | |
| Assets: | | | | | | | | | | | | |
| Investment securities, at value: | | | | | | | | | | | | |
| Unaffiliated issuers | | $ | 10,196 | | | $ | 68,566 | | | $ | 70,604 | |
| Affiliated issuers | | | 301,696 | | | | 2,042,639 | | | | 2,167,258 | |
| Cash | | | — | | | | — | | | | — | |
| Cash collateral received for securities on loan | | | — | | | | — | | | | — | |
| Cash collateral pledged for futures contracts | | | 8,656 | | | | 55,400 | | | | 48,020 | |
| Cash collateral pledged for swap contracts | | | — | | | | — | | | | — | |
| Cash denominated in currencies other than U.S. dollars | | | — | | | | — | | | | — | |
| Unrealized appreciation on open forward currency contracts | | | — | | | | — | | | | — | |
| Receivables for: | | | | | | | | | | | | |
| Sales of investments | | | 151 | | | | 17,100 | | | | 833 | |
| Sales of fund’s shares | | | 324 | | | | 82 | | | | 912 | |
| Dividends and interest | | | 9 | | | | 61 | | | | 62 | |
| Closed forward currency contracts | | | — | | | | — | | | | — | |
| Variation margin on futures contracts | | | 1,434 | | | | 9,296 | | | | 7,885 | |
| Variation margin on centrally cleared swap contracts | | | — | | | | — | | | | — | |
| Securities lending income | | | — | | | | — | | | | — | |
| Currency translations | | | — | | | | — | | | | — | |
| Other | | | — | | | | — | | | | — | |
| | | | 322,466 | | | | 2,193,144 | | | | 2,295,574 | |
| Liabilities: | | | | | | | | | | | | |
| Collateral for securities on loan | | | — | | | | — | | | | — | |
| Unrealized depreciation on open forward currency contracts | | | — | | | | — | | | | — | |
| Unrealized depreciation on unfunded commitments | | | — | | | | — | | | | — | |
| Payables for: | | | | | | | | | | | | |
| Purchases of investments | | | 304 | | | | — | | | | 408 | |
| Repurchases of fund’s shares | | | 162 | | | | 9,501 | | | | 1,359 | |
| Investment advisory services | | | 27 | | | | 183 | | | | 192 | |
| Insurance administrative fees | | | 206 | | | | 1,420 | | | | 1,504 | |
| Services provided by related parties | | | 64 | | | | 57 | | | | 473 | |
| Trustees’ deferred compensation | | | 3 | | | | 14 | | | | 29 | |
| Closed forward currency contracts | | | — | | | | — | | | | — | |
| Variation margin on futures contracts | | | 31 | | | | 249 | | | | 137 | |
| Variation margin on centrally cleared swap contracts | | | — | | | | — | | | | — | |
| Non-U.S. taxes | | | — | | | | — | | | | — | |
| Other | | | — | | | | — | | | | — | |
| | | | 797 | | | | 11,424 | | | | 4,102 | |
| Net assets at June 30, 2022 | | $ | 321,669 | | | $ | 2,181,720 | | | $ | 2,291,472 | |
| | | | | | | | | | | | | |
| Net assets consist of: | | | | | | | | | | | | |
| Capital paid in on shares of beneficial interest | | $ | 310,223 | | | $ | 1,998,424 | | | $ | 2,131,911 | |
| Total distributable earnings (accumulated loss) | | | 11,446 | | | | 183,296 | | | | 159,561 | |
| Net assets at June 30, 2022 | | $ | 321,669 | | | $ | 2,181,720 | | | $ | 2,291,472 | |
| | | | | | | | | | | | | |
| Investment securities on loan, at value | | $ | — | | | $ | — | | | $ | — | |
| Investment securities, at cost | | | | | | | | | | | | |
| Unaffiliated issuers | | | 10,227 | | | | 67,635 | | | | 71,723 | |
| Affiliated issuers | | | 335,521 | | | | 2,147,811 | | | | 2,302,803 | |
| Cash denominated in currencies other than U.S. dollars, at cost | | | — | | | | — | | | | — | |
Refer to the end of the statements of assets and liabilities for footnotes.
Refer to the notes to financial statements.
| American Funds Insurance Series | 251 |
| Financial statements (continued) | |
| | |
Statements of assets and liabilities
at June 30, 2022 (continued) | unaudited
(dollars and shares in thousands, except per-share amounts) |
| | | | | Global
Growth
Fund | | | Global
Small
Capitalization
Fund | | | Growth
Fund | | | International
Fund | | | New
World
Fund | |
Shares of beneficial interest issued and outstanding
(no stated par value) — unlimited shares authorized | | | | | | | | | | | | | | | | | | | |
| Class 1: | | Net assets | | $ | 3,071,738 | | | $ | 914,638 | | | $ | 13,552,095 | | | $ | 3,225,915 | | | $ | 1,674,369 | |
| | | Shares outstanding | | | 105,650 | | | | 58,560 | | | | 176,909 | | | | 212,710 | | | | 76,062 | |
| | | Net asset value per share | | $ | 29.07 | | | $ | 15.62 | | | $ | 76.61 | | | $ | 15.17 | | | $ | 22.01 | |
| Class 1A: | | Net assets | | $ | 13,704 | | | $ | 3,963 | | | $ | 173,259 | | | $ | 9,994 | | | $ | 9,456 | |
| | | Shares outstanding | | | 474 | | | | 257 | | | | 2,283 | | | | 663 | | | | 432 | |
| | | Net asset value per share | | $ | 28.92 | | | $ | 15.43 | | | $ | 75.90 | | | $ | 15.08 | | | $ | 21.89 | |
| Class 2: | | Net assets | | $ | 3,232,769 | | | $ | 1,751,492 | | | $ | 14,922,706 | | | $ | 3,195,094 | | | $ | 790,334 | |
| | | Shares outstanding | | | 112,728 | | | | 118,728 | | | | 197,300 | | | | 211,908 | | | | 36,381 | |
| | | Net asset value per share | | $ | 28.68 | | | $ | 14.75 | | | $ | 75.63 | | | $ | 15.08 | | | $ | 21.72 | |
| Class 3: | | Net assets | | | | | | | | | | $ | 197,873 | | | $ | 15,712 | | | | | |
| | | Shares outstanding | | | Not applicable | | | | Not applicable | | | | 2,559 | | | | 1,033 | | | | Not applicable | |
| | | Net asset value per share | | | | | | | | | | $ | 77.33 | | | $ | 15.20 | | | | | |
| Class 4: | | Net assets | | $ | 552,535 | | | $ | 249,158 | | | $ | 2,330,238 | | | $ | 366,899 | | | $ | 714,840 | |
| | | Shares outstanding | | | 19,465 | | | | 16,897 | | | | 31,566 | | | | 24,733 | | | | 33,206 | |
| | | Net asset value per share | | $ | 28.39 | | | $ | 14.75 | | | $ | 73.82 | | | $ | 14.83 | | | $ | 21.53 | |
| | | | | | | | | | | | | | | | | | |
| | | | | Washington
Mutual
Investors
Fund | | | Capital
World Growth
and Income
Fund | | | Growth-
Income
Fund | | | International
Growth
and Income
Fund | | | Capital
Income
Builder | |
| Shares of beneficial interest issued and outstanding (no stated par value) — unlimited shares authorized | | | | | | | | | | | | | | | | | | | |
| Class 1: | | Net assets | | $ | 5,471,389 | | | $ | 551,274 | | | $ | 19,411,798 | | | $ | 12,468 | | | $ | 553,316 | |
| | | Shares outstanding | | | 446,456 | | | | 48,641 | | | | 397,825 | | | | 1,422 | | | | 50,880 | |
| | | Net asset value per share | | $ | 12.26 | | | $ | 11.33 | | | $ | 48.79 | | | $ | 8.77 | | | $ | 10.87 | |
| Class 1A: | | Net assets | | $ | 56,598 | | | $ | 5,728 | | | $ | 27,222 | | | $ | 4,311 | | | $ | 9,489 | |
| | | Shares outstanding | | | 4,660 | | | | 509 | | | | 561 | | | | 505 | | | | 873 | |
| | | Net asset value per share | | $ | 12.15 | | | $ | 11.26 | | | $ | 48.48 | | | $ | 8.54 | | | $ | 10.86 | |
| Class 2: | | Net assets | | $ | 2,775,264 | | | $ | 991,352 | | | $ | 11,635,400 | | | $ | 163,644 | | | $ | 11,854 | |
| | | Shares outstanding | | | 230,859 | | | | 87,806 | | | | 242,284 | | | | 19,183 | | | | 1,091 | |
| | | Net asset value per share | | $ | 12.02 | | | $ | 11.29 | | | $ | 48.02 | | | $ | 8.53 | | | $ | 10.87 | |
| Class 3: | | Net assets | | | | | | | | | | $ | 126,119 | | | | | | | | | |
| | | Shares outstanding | | | Not applicable | | | | Not applicable | | | | 2,581 | | | | Not applicable | | | | Not applicable | |
| | | Net asset value per share | | | | | | | | | | $ | 48.87 | | | | | | | | | |
| Class 4: | | Net assets | | $ | 995,228 | | | $ | 181,246 | | | $ | 1,568,221 | | | $ | 112,317 | | | $ | 522,951 | |
| | | Shares outstanding | | | 83,648 | | | | 16,461 | | | | 33,169 | | | | 13,374 | | | | 48,191 | |
| | | Net asset value per share | | $ | 11.90 | | | $ | 11.01 | | | $ | 47.28 | | | $ | 8.40 | | | $ | 10.85 | |
Refer to the end of the statements of assets and liabilities for footnotes.
Refer to the notes to financial statements.
| 252 | American Funds Insurance Series |
| Financial statements (continued) | |
| | |
Statements of assets and liabilities
at June 30, 2022 (continued) | unaudited
(dollars and shares in thousands, except per-share amounts) |
| | | | | Asset
Allocation
Fund | | | American
Funds
Global
Balanced
Fund† | | | The Bond
Fund
of America | | | Capital
World Bond
Fund | | | American
High-Income
Trust | |
| Shares of beneficial interest issued and outstanding (no stated par value) — unlimited shares authorized | | | | | | | | | | | | | | | | | | | | |
| Class 1: | | Net assets | | $ | 15,266,002 | | | $ | 98,957 | | | $ | 6,877,449 | | | $ | 707,799 | | | $ | 228,487 | |
| | | Shares outstanding | | | 696,452 | | | | 8,074 | | | | 693,170 | | | | 72,900 | | | | 25,889 | |
| | | Net asset value per share | | $ | 21.92 | | | $ | 12.26 | | | $ | 9.92 | | | $ | 9.71 | | | $ | 8.83 | |
| Class 1A: | | Net assets | | $ | 21,109 | | | $ | 2,586 | | | $ | 200,199 | | | $ | 1,204 | | | $ | 1,157 | |
| | | Shares outstanding | | | 968 | | | | 212 | | | | 20,303 | | | | 125 | | | | 132 | |
| | | Net asset value per share | | $ | 21.81 | | | $ | 12.21 | | | $ | 9.86 | | | $ | 9.67 | | | $ | 8.79 | |
| Class 2: | | Net assets | | $ | 4,341,707 | | | $ | 162,176 | | | $ | 3,092,284 | | | $ | 817,261 | | | $ | 540,450 | |
| | | Shares outstanding | | | 200,876 | | | | 13,276 | | | | 316,453 | | | | 84,949 | | | | 62,576 | |
| | | Net asset value per share | | $ | 21.61 | | | $ | 12.22 | | | $ | 9.77 | | | $ | 9.62 | | | $ | 8.64 | |
| Class 3: | | Net assets | | $ | 29,083 | | | | | | | | | | | | | | | $ | 8,556 | |
| | | Shares outstanding | | | 1,326 | | | | Not applicable | | | | Not applicable | | | | Not applicable | | | | 965 | |
| | | Net asset value per share | | $ | 21.94 | | | | | | | | | | | | | | | $ | 8.86 | |
| Class 4: | | Net assets | | $ | 5,307,104 | | | $ | 111,759 | | | $ | 798,966 | | | $ | 55,452 | | | $ | 71,226 | |
| | | Shares outstanding | | | 247,514 | | | | 9,266 | | | | 82,157 | | | | 5,833 | | | | 7,491 | |
| | | Net asset value per share | | $ | 21.44 | | | $ | 12.06 | | | $ | 9.72 | | | $ | 9.51 | | | $ | 9.51 | |
| | | | | | | | | | | | | | | | | | | |
| | | | | American
Funds
Mortgage
Fund | | | Ultra-Short
Bond Fund | | | U.S.
Government
Securities
Fund | | | Managed
Risk
Growth
Fund | | | | Managed
Risk
International
Fund | |
| Shares of beneficial interest issued and outstanding (no stated par value) — unlimited shares authorized | | | | | | | | | | | | | | | | | | | | |
| Class 1: | | Net assets | | $ | 1,111 | | | $ | 46,938 | | | $ | 254,823 | | | | | | | | | |
| | | Shares outstanding | | | 112 | | | | 4,162 | | | | 23,613 | | | | Not applicable | | | | Not applicable | |
| | | Net asset value per share | | $ | 9.91 | | | $ | 11.28 | | | $ | 10.79 | | | | | | | | | |
| Class 1A: | | Net assets | | $ | 1,857 | | | $ | 10 | | | $ | 4,120 | | | | | | | | | |
| | | Shares outstanding | | | 190 | | | | 1 | | | | 384 | | | | Not applicable | | | | Not applicable | |
| | | Net asset value per share | | $ | 9.80 | | | $ | 11.28 | | | $ | 10.75 | | | | | | | | | |
| Class 2: | | Net assets | | $ | 50,207 | | | $ | 297,166 | | | $ | 1,169,880 | | | | | | | | | |
| | | Shares outstanding | | | 5,113 | | | | 27,207 | | | | 109,841 | | | | Not applicable | | | | Not applicable | |
| | | Net asset value per share | | $ | 9.82 | | | $ | 10.92 | | | $ | 10.65 | | | | | | | | | |
| Class 3: | | Net assets | | | | | | $ | 4,774 | | | $ | 7,862 | | | | | | | | | |
| | | Shares outstanding | | | Not applicable | | | | 431 | | | | 727 | | | | Not applicable | | | | Not applicable | |
| | | Net asset value per share | | | | | | $ | 11.06 | | | $ | 10.81 | | | | | | | | | |
| Class 4: | | Net assets | | $ | 39,878 | | | $ | 75,119 | | | $ | 204,740 | | | | | | | | | |
| | | Shares outstanding | | | 4,111 | | | | 6,844 | | | | 19,258 | | | | Not applicable | | | | Not applicable | |
| | | Net asset value per share | | $ | 9.70 | | | $ | 10.98 | | | $ | 10.63 | | | | | | | | | |
| Class P1: | | Net assets | | | | | | | | | | | | | | $ | 9,287 | | | $ | 1,808 | |
| | | Shares outstanding | | | Not applicable | | | | Not applicable | | | | Not applicable | | | | 781 | | | | 209 | |
| | | Net asset value per share | | | | | | | | | | | | | | $ | 11.89 | | | $ | 8.65 | |
| Class P2: | | Net assets | | | | | | | | | | | | | | $ | 461,725 | | | $ | 131,142 | |
| | | Shares outstanding | | | Not applicable | | | | Not applicable | | | | Not applicable | | | | 39,177 | | | | 15,232 | |
| | | Net asset value per share | | | | | | | | | | | | | | $ | 11.79 | | | $ | 8.61 | |
Refer to the end of the statements of assets and liabilities for footnotes.
Refer to the notes to financial statements.
| American Funds Insurance Series | 253 |
| Financial statements (continued) | |
| | |
Statements of assets and liabilities
at June 30, 2022 (continued) | unaudited
(dollars and shares in thousands, except per-share amounts) |
| | | | | Managed Risk
Washington
Mutual
Investors
Fund | | | Managed
Risk
Growth-
Income
Fund | | | Managed
Risk
Asset
Allocation
Fund | |
| Shares of beneficial interest issued and outstanding (no stated par value) — unlimited shares authorized | | | | | | | | | |
| Class P1: | | Net assets | | $ | 2,623 | | | $ | 1,904,828 | | | $ | 6,706 | |
| | | Shares outstanding | | | 226 | | | | 148,869 | | | | 538 | |
| | | Net asset value per share | | $ | 11.58 | | | $ | 12.80 | | | $ | 12.46 | |
| Class P2: | | Net assets | | $ | 319,046 | | | $ | 276,892 | | | $ | 2,284,766 | |
| | | Shares outstanding | | | 27,707 | | | | 21,780 | | | | 188,687 | |
| | | Net asset value per share | | $ | 11.51 | | | $ | 12.71 | | | $ | 12.11 | |
| * | Amount less than one thousand. |
| † | Formerly Global Balanced Fund. |
Refer to the notes to financial statements.
| 254 | American Funds Insurance Series |
| Financial statements (continued) | |
| | |
Statements of operations
for the six months ended June 30, 2022 | unaudited
(dollars in thousands) |
| | | Global
Growth
Fund | | | Global
Small
Capitalization
Fund | | | Growth
Fund | | | International
Fund | | | New
World
Fund | |
| Investment income: | | | | | | | | | | | | | | | | | | | | |
| Income (net of non-U.S. taxes1): | | | | | | | | | | | | | | | | | | | | |
| Dividends: | | | | | | | | | | | | | | | | | | | | |
| Unaffiliated issuers | | $ | 52,619 | | | $ | 15,408 | | | $ | 151,429 | | | $ | 86,055 | | | $ | 36,438 | |
| Affiliated issuers | | | 1,427 | | | | 606 | | | | 3,145 | | | | 1,992 | | | | 640 | |
| | | | 54,046 | | | | 16,014 | | | | 154,574 | | | | 88,047 | | | | 37,078 | |
| Interest from unaffiliated issuers | | | — | | | | 24 | | | | 896 | | | | — | | | | 3,562 | |
| European Union withholding tax reclaims | | | 353 | | | | — | | | | 318 | | | | — | | | | 175 | |
| Interest from European Union withholding tax reclaims | | | 64 | | | | — | | | | 22 | | | | — | | | | 14 | |
| Securities lending income (net of fees) | | | 66 | | | | 983 | | | | 387 | | | | 904 | | | | 148 | |
| | | | 54,529 | | | | 17,021 | | | | 156,197 | | | | 88,951 | | | | 40,977 | |
| Fees and expenses1: | | | | | | | | | | | | | | | | | | | | |
| Investment advisory services | | | 19,510 | | | | 11,933 | | | | 57,724 | | | | 19,156 | | | | 11,907 | |
| Distribution services | | | 5,450 | | | | 2,948 | | | | 26,226 | | | | 5,107 | | | | 2,120 | |
| Insurance administrative services | | | 802 | | | | 367 | | | | 3,580 | | | | 530 | | | | 1,006 | |
| Transfer agent services | | | 1 | | | | — | 2 | | | 3 | | | | 1 | | | | — | 2 |
| Administrative services | | | 1,187 | | | | 522 | | | | 5,575 | | | | 1,169 | | | | 544 | |
| Accounting and administrative services | | | — | | | | — | | | | — | | | | — | | | | — | |
| Reports to shareholders | | | 41 | | | | 24 | | | | 125 | | | | 48 | | | | 16 | |
| Registration statement and prospectus | | | 14 | | | | 10 | | | | 100 | | | | 41 | | | | 10 | |
| Trustees’ compensation | | | 2 | | | | 2 | | | | 12 | | | | 2 | | | | 1 | |
| Auditing and legal | | | 16 | | | | 34 | | | | 33 | | | | 28 | | | | 49 | |
| Custodian | | | 425 | | | | 239 | | | | 210 | | | | 702 | | | | 411 | |
| Other | | | 4 | | | | 28 | | | | 18 | | | | 4 | | | | 27 | |
| Total fees and expenses before waivers/reimbursement | | | 27,452 | | | | 16,107 | | | | 93,606 | | | | 26,788 | | | | 16,091 | |
| Less waivers/reimbursement of fees and expenses: | | | | | | | | | | | | | | | | | | | | |
| Investment advisory services waivers | | | 1,313 | | | | 259 | | | | 1 | | | | — | | | | 2,654 | |
| Miscellaneous fee reimbursement | | | — | | | | — | | | | — | | | | — | | | | — | |
| Total waivers/reimbursement of fees and expenses | | | 1,313 | | | | 259 | | | | 1 | | | | — | | | | 2,654 | |
| Total fees and expenses after waivers/reimbursement | | | 26,139 | | | | 15,848 | | | | 93,605 | | | | 26,788 | | | | 13,437 | |
| Net investment income (loss) | | | 28,390 | | | | 1,173 | | | | 62,592 | | | | 62,163 | | | | 27,540 | |
| Net realized gain (loss) and unrealized depreciation: | | | | | | | | | | | | | | | | | | | | |
| Net realized gain (loss)1 on: | | | | | | | | | | | | | | | | | | | | |
| Investments in: | | | | | | | | | | | | | | | | | | | | |
| Unaffiliated issuers | | | 310,668 | | | | 86,912 | | | | 1,244,591 | | | | (205,118 | ) | | | 56,774 | |
| Affiliated issuers | | | (20 | ) | | | 6 | | | | 1 | | | | 20 | | | | (9 | ) |
| Futures contracts | | | — | | | | — | | | | — | | | | — | | | | 202 | |
| Forward currency contracts | | | — | | | | — | | | | — | | | | — | | | | 298 | |
| Swap contracts | | | — | | | | — | | | | — | | | | — | | | | — | |
| Currency transactions | | | (1,052 | ) | | | (25 | ) | | | 73 | | | | (1,170 | ) | | | 82 | |
| Capital gain distributions received from affiliated issuers | | | — | | | | — | | | | — | | | | — | | | | — | |
| | | | 309,596 | | | | 86,893 | | | | 1,244,665 | | | | (206,268 | ) | | | 57,347 | |
| Net unrealized (depreciation) appreciation1 on: | | | | | | | | | | | | | | | | | | | | |
| Investments in: | | | | | | | | | | | | | | | | | | | | |
| Unaffiliated issuers | | | (3,004,456 | ) | | | (1,445,472 | ) | | | (14,552,959 | ) | | | (1,849,354 | ) | | | (1,088,052 | ) |
| Affiliated issuers | | | (159 | ) | | | (18,993 | ) | | | (420 | ) | | | (230 | ) | | | (61 | ) |
| Futures contracts | | | — | | | | — | | | | — | | | | — | | | | 78 | |
| Forward currency contracts | | | — | | | | — | | | | — | | | | — | | | | 59 | |
| Swap contracts | | | — | | | | — | | | | — | | | | — | | | | — | |
| Currency translations | | | 221 | | | | 520 | | | | (56 | ) | | | 1,077 | | | | 300 | |
| | | | (3,004,394 | ) | | | (1,463,945 | ) | | | (14,553,435 | ) | | | (1,848,507 | ) | | | (1,087,676 | ) |
| Net realized gain (loss) and unrealized depreciation | | | (2,694,798 | ) | | | (1,377,052 | ) | | | (13,308,770 | ) | | | (2,054,775 | ) | | | (1,030,329 | ) |
| Net decrease in net assets resulting from operations | | $ | (2,666,408 | ) | | $ | (1,375,879 | ) | | $ | (13,246,178 | ) | | $ | (1,992,612 | ) | | $ | (1,002,789 | ) |
Refer to the end of the statements of operations for footnotes.
Refer to the notes to financial statements.
| American Funds Insurance Series | 255 |
| Financial statements (continued) | |
| | |
Statements of operations
for the six months ended June 30, 2022 (continued) | unaudited
(dollars in thousands) |
| | | Washington
Mutual
Investors
Fund | | | Capital
World Growth
and Income
Fund | | | Growth-
Income
Fund | | | International
Growth
and Income
Fund | | | Capital
Income
Builder | |
| Investment income: | | | | | | | | | | | | | | | | | | | | |
| Income (net of non-U.S. taxes1): | | | | | | | | | | | | | | | | | | | | |
| Dividends: | | | | | | | | | | | | | | | | | | | | |
| Unaffiliated issuers | | $ | 115,274 | | | $ | 30,016 | | | $ | 300,024 | | | $ | 7,332 | | | $ | 17,853 | |
| Affiliated issuers | | | 823 | | | | 172 | | | | 4,194 | | | | 52 | | | | 587 | |
| | | | 116,097 | | | | 30,188 | | | | 304,218 | | | | 7,384 | | | | 18,440 | |
| Interest from unaffiliated issuers | | | — | | | | 71 | | | | 1,023 | | | | — | | | | 2,310 | |
| European Union withholding tax reclaims | | | — | | | | — | | | | 3,322 | | | | 430 | | | | — | |
| Interest from European Union withholding tax reclaims | | | — | | | | — | | | | 292 | | | | 35 | | | | — | |
| Securities lending income (net of fees) | | | 190 | | | | 103 | | | | 572 | | | | 11 | | | | 50 | |
| | | | 116,287 | | | | 30,362 | | | | 309,427 | | | | 7,860 | | | | 20,800 | |
| Fees and expenses1: | | | | | | | | | | | | | | | | | | | | |
| Investment advisory services | | | 19,627 | | | | 5,497 | | | | 46,863 | | | | 1,023 | | | | 2,446 | |
| Distribution services | | | 5,174 | | | | 1,697 | | | | 18,949 | | | | 383 | | | | 698 | |
| Insurance administrative services | | | 1,479 | | | | 260 | | | | 2,207 | | | | 158 | | | | 695 | |
| Transfer agent services | | | 1 | | | | — | 2 | | | 3 | | | | — | 2 | | | — | 2 |
| Administrative services | | | 1,546 | | | | 297 | | | | 5,574 | | | | 49 | | | | 169 | |
| Accounting and administrative services | | | — | | | | — | | �� | | — | | | | — | | | | — | |
| Reports to shareholders | | | 24 | | | | 13 | | | | 118 | | | | 3 | | | | 4 | |
| Registration statement and prospectus | | | 24 | | | | 3 | | | | 73 | | | | 1 | | | | 1 | |
| Trustees’ compensation | | | 1 | | | | — | 2 | | | 8 | | | | 1 | | | | — | 2 |
| Auditing and legal | | | 7 | | | | 19 | | | | 36 | | | | 20 | | | | 17 | |
| Custodian | | | 174 | | | | 195 | | | | 241 | | | | 1 | | | | 42 | |
| Other | | | 4 | | | | 1 | | | | 17 | | | | — | 2 | | | 1 | |
| Total fees and expenses before waivers/reimbursement | | | 28,061 | | | | 7,982 | | | | 74,089 | | | | 1,639 | | | | 4,073 | |
| Less waivers/reimbursement of fees and expenses: | | | | | | | | | | | | | | | | | | | | |
| Investment advisory services waivers | | | 7,920 | | | | 1,907 | | | | — | | | | 281 | | | | 1,206 | |
| Miscellaneous fee reimbursement | | | — | | | | — | | | | — | | | | — | | | | — | |
| Total waivers/reimbursement of fees and expenses | | | 7,920 | | | | 1,907 | | | | — | | | | 281 | | | | 1,206 | |
| Total fees and expenses after waivers/reimbursement | | | 20,141 | | | | 6,075 | | | | 74,089 | | | | 1,358 | | | | 2,867 | |
| Net investment income (loss) | | | 96,146 | | | | 24,287 | | | | 235,338 | | | | 6,502 | | | | 17,933 | |
| Net realized gain (loss) and unrealized depreciation: | | | | | | | | | | | | | | | | | | | | |
| Net realized gain (loss)1 on: | | | | | | | | | | | | | | | | | | | | |
| Investments in: | | | | | | | | | | | | | | | | | | | | |
| Unaffiliated issuers | | | 164,986 | | | | (23,930 | ) | | | 1,718,892 | | | | (8,722 | ) | | | 10,932 | |
| Affiliated issuers | | | (19 | ) | | | (13 | ) | | | (29 | ) | | | (2 | ) | | | (4 | ) |
| Futures contracts | | | — | | | | — | | | | — | | | | — | | | | (3,291 | ) |
| Forward currency contracts | | | — | | | | — | | | | — | | | | — | | | | 6 | |
| Swap contracts | | | — | | | | — | | | | — | | | | — | | | | 1,590 | |
| Currency transactions | | | (14 | ) | | | 48 | | | | (662 | ) | | | (40 | ) | | | 24 | |
| Capital gain distributions received from affiliated issuers | | | — | | | | — | | | | — | | | | — | | | | — | |
| | | | 164,953 | | | | (23,895 | ) | | | 1,718,201 | | | | (8,764 | ) | | | 9,257 | |
| Net unrealized (depreciation) appreciation1 on: | | | | | | | | | | | | | | | | | | | | |
| Investments in: | | | | | | | | | | | | | | | | | | | | |
| Unaffiliated issuers | | | (1,682,419 | ) | | | (467,259 | ) | | | (10,132,517 | ) | | | (67,920 | ) | | | (135,663 | ) |
| Affiliated issuers | | | (96 | ) | | | (7 | ) | | | (465 | ) | | | (6 | ) | | | (4,757 | ) |
| Futures contracts | | | — | | | | — | | | | — | | | | — | | | | (1,259 | ) |
| Forward currency contracts | | | — | | | | — | | | | — | | | | 1 | | | | (2 | ) |
| Swap contracts | | | — | | | | — | | | | — | | | | — | | | | (39 | ) |
| Currency translations | | | (6 | ) | | | (116 | ) | | | (290 | ) | | | (119 | ) | | | (34 | ) |
| | | | (1,682,521 | ) | | | (467,382 | ) | | | (10,133,272 | ) | | | (68,044 | ) | | | (141,754 | ) |
| Net realized gain (loss) and unrealized depreciation | | | (1,517,568 | ) | | | (491,277 | ) | | | (8,415,071 | ) | | | (76,808 | ) | | | (132,497 | ) |
| Net decrease in net assets resulting from operations | | $ | (1,421,422 | ) | | $ | (466,990 | ) | | $ | (8,179,733 | ) | | $ | (70,306 | ) | | $ | (114,564 | ) |
Refer to the end of the statements of operations for footnotes.
Refer to the notes to financial statements.
| 256 | American Funds Insurance Series |
| Financial statements (continued) | |
| | |
Statements of operations
for the six months ended June 30, 2022 (continued) | unaudited
(dollars in thousands) |
| | | Asset
Allocation
Fund | | | American
Funds
Global
Balanced
Fund3 | | | The Bond
Fund
of America | | | Capital
World Bond
Fund | | | American
High-Income
Trust | |
| Investment income: | | | | | | | | | | | | | | | | | | | | |
| Income (net of non-U.S. taxes1): | | | | | | | | | | | | | | | | | | | | |
| Dividends: | | | | | | | | | | | | | | | | | | | | |
| Unaffiliated issuers | | $ | 200,577 | | | $ | 3,865 | | | $ | — | | | $ | 57 | | | $ | 1,489 | |
| Affiliated issuers | | | 25,018 | | | | 41 | | | | 3,972 | | | | 255 | | | | 68 | |
| | | | 225,595 | | | | 3,906 | | | | 3,972 | | | | 312 | | | | 1,557 | |
| Interest from unaffiliated issuers | | | 88,223 | | | | 1,397 | | | | 171,964 | | | | 24,488 | | | | 26,212 | |
| European Union withholding tax reclaims | | | 32 | | | | — | | | | — | | | | — | | | | — | |
| Interest from European Union withholding tax reclaims | | | 9 | | | | — | | | | — | | | | — | | | | — | |
| Securities lending income (net of fees) | | | 143 | | | | 3 | | | | — | | | | — | | | | — | |
| | | | 314,002 | | | | 5,306 | | | | 175,936 | | | | 24,800 | | | | 27,769 | |
| Fees and expenses1: | | | | | | | | | | | | | | | | | | | | |
| Investment advisory services | | | 36,448 | | | | 1,233 | | | | 20,827 | | | | 4,458 | | | | 2,176 | |
| Distribution services | | | 13,348 | | | | 383 | | | | 5,248 | | | | 1,208 | | | | 874 | |
| Insurance administrative services | | | 7,262 | | | | 158 | | | | 1,128 | | | | 77 | | | | 103 | |
| Transfer agent services | | | 2 | | | | — | 2 | | | 1 | | | | — | 2 | | | — | 2 |
| Administrative services | | | 4,146 | | | | 62 | | | | 1,753 | | | | 265 | | | | 142 | |
| Accounting and administrative services | | | — | | | | — | | | | — | | | | — | | | | — | |
| Reports to shareholders | | | 59 | | | | 3 | | | | 38 | | | | 13 | | | | 11 | |
| Registration statement and prospectus | | | 35 | | | | — | 2 | | | 203 | | | | 3 | | | | 1 | |
| Trustees’ compensation | | | 4 | | | | — | 2 | | | 2 | | | | 1 | | | | — | 2 |
| Auditing and legal | | | 25 | | | | 4 | | | | 9 | | | | 3 | | | | 3 | |
| Custodian | | | 466 | | | | 24 | | | | 41 | | | | 51 | | | | 7 | |
| Other | | | 12 | | | | — | 2 | | | 5 | | | | 1 | | | | 8 | |
| Total fees and expenses before waivers/reimbursement | | | 61,807 | | | | 1,867 | | | | 29,255 | | | | 6,080 | | | | 3,325 | |
| Less waivers/reimbursement of fees and expenses: | | | | | | | | | | | | | | | | | | | | |
| Investment advisory services waivers | | | — | | | | 7 | | | | 11,103 | | | | 611 | | | | 826 | |
| Miscellaneous fee reimbursement | | | — | | | | — | | | | — | | | | — | | | | — | |
| Total waivers/reimbursement of fees and expenses | | | — | | | | 7 | | | | 11,103 | | | | 611 | | | | 826 | |
| Total fees and expenses after waivers/reimbursement | | | 61,807 | | | | 1,860 | | | | 18,152 | | | | 5,469 | | | | 2,499 | |
| Net investment income (loss) | | | 252,195 | | | | 3,446 | | | | 157,784 | | | | 19,331 | | | | 25,270 | |
| Net realized gain (loss) and unrealized depreciation: | | | | | | | | | | | | | | | | | | | | |
| Net realized gain (loss)1 on: | | | | | | | | | | | | | | | | | | | | |
| Investments in: | | | | | | | | | | | | | | | | | | | | |
| Unaffiliated issuers | | | 945,041 | | | | 48,478 | | | | (388,051 | ) | | | (40,223 | ) | | | (13,976 | ) |
| Affiliated issuers | | | (14,361 | ) | | | (2 | ) | | | (83 | ) | | | (10 | ) | | | (4 | ) |
| Futures contracts | | | 52,273 | | | | 367 | | | | (59,525 | ) | | | (3,835 | ) | | | 1,276 | |
| Forward currency contracts | | | — | | | | (537 | ) | | | 1,385 | | | | (15,990 | ) | | | — | |
| Swap contracts | | | 159 | | | | 246 | | | | 28,306 | | | | 2,059 | | | | 326 | |
| Currency transactions | | | 3,697 | | | | (206 | ) | | | 29 | | | | (2,051 | ) | | | — | |
| Capital gain distributions received from affiliated issuers | | | — | | | | — | | | | — | | | | — | | | | — | |
| | | | 986,809 | | | | 48,346 | | | | (417,939 | ) | | | (60,050 | ) | | | (12,378 | ) |
| Net unrealized (depreciation) appreciation1 on: | | | | | | | | | | | | | | | | | | | | |
| Investments in: | | | | | | | | | | | | | | | | | | | | |
| Unaffiliated issuers | | | (5,810,235 | ) | | | (125,952 | ) | | | (1,015,396 | ) | | | (272,356 | ) | | | (139,349 | ) |
| Affiliated issuers | | | (234,524 | ) | | | — | 2 | | | (424 | ) | | | (23 | ) | | | (6 | ) |
| Futures contracts | | | 18,346 | | | | (115 | ) | | | (14,940 | ) | | | (1,107 | ) | | | 284 | |
| Forward currency contracts | | | — | | | | (167 | ) | | | 178 | | | | 1,537 | | | | — | |
| Swap contracts | | | 1,896 | | | | (488 | ) | | | 30,052 | | | | (2,288 | ) | | | 414 | |
| Currency translations | | | (52 | ) | | | (14 | ) | | | (8 | ) | | | 60 | | | | — | |
| | | | (6,024,569 | ) | | | (126,736 | ) | | | (1,000,538 | ) | | | (274,177 | ) | | | (138,657 | ) |
| Net realized gain (loss) and unrealized depreciation | | | (5,037,760 | ) | | | (78,390 | ) | | | (1,418,477 | ) | | | (334,227 | ) | | | (151,035 | ) |
| Net decrease in net assets resulting from operations | | $ | (4,785,565 | ) | | $ | (74,944 | ) | | $ | (1,260,693 | ) | | $ | (314,896 | ) | | $ | (125,765 | ) |
Refer to the end of the statements of operations for footnotes.
Refer to the notes to financial statements.
| American Funds Insurance Series | 257 |
| Financial statements (continued) | |
| | |
Statements of operations
for the six months ended June 30, 2022 (continued) | unaudited
(dollars in thousands) |
| | | American
Funds
Mortgage
Fund | | | Ultra-Short
Bond Fund | | | U.S.
Government
Securities
Fund | | | Managed
Risk
Growth
Fund | | | Managed
Risk
International
Fund | |
| Investment income: | | | | | | | | | | | | | | | | | | | | |
| Income (net of non-U.S. taxes1): | | | | | | | | | | | | | | | | | | | | |
| Dividends: | | | | | | | | | | | | | | | | | | | | |
| Unaffiliated issuers | | $ | — | | | $ | — | | | $ | — | | | $ | 34 | | | $ | 8 | |
| Affiliated issuers | | | — | | | | — | | | | — | | | | 844 | | | | 652 | |
| | | | — | | | | — | | | | — | | | | 878 | | | | 660 | |
| Interest from unaffiliated issuers | | | 886 | | | | 912 | | | | 26,161 | | | | — | | | | — | |
| European Union withholding tax reclaims | | | — | | | | — | | | | — | | | | — | | | | — | |
| Interest from European Union withholding tax reclaims | | | — | | | | — | | | | — | | | | — | | | | — | |
| Securities lending income (net of fees) | | | — | | | | — | | | | — | | | | — | | | | — | |
| | | | 886 | | | | 912 | | | | 26,161 | | | | 878 | | | | 660 | |
| Fees and expenses1: | | | | | | | | | | | | | | | | | | | | |
| Investment advisory services | | | 216 | | | | 554 | | | | 3,040 | | | | 390 | | | | 110 | |
| Distribution services | | | 118 | | | | 410 | | | | 1,861 | | | | 637 | | | | 180 | |
| Insurance administrative services | | | 53 | | | | 77 | | | | 276 | | | | 650 | | | | 183 | |
| Transfer agent services | | | — | 2 | | | — | 2 | | | — | 2 | | | — | 2 | | | — | 2 |
| Administrative services | | | 17 | | | | 56 | | | | 268 | | | | — | | | | — | |
| Accounting and administrative services | | | — | | | | — | | | | — | | | | 27 | | | | 23 | |
| Reports to shareholders | | | 3 | | | | 3 | | | | 11 | | | | 2 | | | | 1 | |
| Registration statement and prospectus | | | — | 2 | | | — | 2 | | | 3 | | | | — | 2 | | | — | 2 |
| Trustees’ compensation | | | — | 2 | | | — | 2 | | | 1 | | | | — | 2 | | | — | 2 |
| Auditing and legal | | | — | 2 | | | — | 2 | | | 1 | | | | — | 2 | | | — | 2 |
| Custodian | | | 6 | | | | — | 2 | | | 10 | | | | 3 | | | | 3 | |
| Other | | | — | 2 | | | — | 2 | | | 1 | | | | — | 2 | | | — | 2 |
| Total fees and expenses before waivers/reimbursement | | | 413 | | | | 1,100 | | | | 5,472 | | | | 1,709 | | | | 500 | |
| Less waivers/reimbursement of fees and expenses: | | | | | | | | | | | | | | | | | | | | |
| Investment advisory services waivers | | | 104 | | | | — | | | | 1,318 | | | | 130 | | | | 37 | |
| Miscellaneous fee reimbursement | | | — | | | | — | | | | — | | | | — | | | | 1 | |
| Total waivers/reimbursement of fees and expenses | | | 104 | | | | — | | | | 1,318 | | | | 130 | | | | 38 | |
| Total fees and expenses after waivers/reimbursement | | | 309 | | | | 1,100 | | | | 4,154 | | | | 1,579 | | | | 462 | |
| Net investment income (loss) | | | 577 | | | | (188 | ) | | | 22,007 | | | | (701 | ) | | | 198 | |
| Net realized gain (loss) and unrealized depreciation: | | | | | | | | | | | | | | | | | | | | |
| Net realized gain (loss)1 on: | | | | | | | | | | | | | | | | | | | | |
| Investments in: | | | | | | | | | | | | | | | | | | | | |
| Unaffiliated issuers | | | (6,398 | ) | | | — | | | | (66,161 | ) | | | (3,451 | ) | | | (910 | ) |
| Affiliated issuers | | | — | | | | — | | | | — | | | | 43,095 | | | | 3,622 | |
| Futures contracts | | | (1,437 | ) | | | — | | | | (24,700 | ) | | | 14,927 | | | | 5,625 | |
| Forward currency contracts | | | — | | | | — | | | | — | | | | — | | | | — | |
| Swap contracts | | | 3,125 | | | | — | | | | 21,128 | | | | — | | | | — | |
| Currency transactions | | | — | | | | — | | | | — | | | | (84 | ) | | | — | 2 |
| Capital gain distributions received from affiliated issuers | | | — | | | | — | | | | — | | | | 60,533 | | | | 16,270 | |
| | | | (4,710 | ) | | | — | | | | (69,733 | ) | | | 115,020 | | | | 24,607 | |
| Net unrealized (depreciation) appreciation1 on: | | | | | | | | | | | | | | | | | | | | |
| Investments in: | | | | | | | | | | | | | | | | | | | | |
| Unaffiliated issuers | | | (3,005 | ) | | | (77 | ) | | | (73,958 | ) | | | 1,424 | | | | 948 | |
| Affiliated issuers | | | — | | | | — | | | | — | | | | (261,533 | ) | | | (52,824 | ) |
| Futures contracts | | | (98 | ) | | | — | | | | (6,365 | ) | | | 11,562 | | | | 1,471 | |
| Forward currency contracts | | | — | | | | — | | | | — | | | | — | | | | — | |
| Swap contracts | | | (1,705 | ) | | | — | | | | (9,288 | ) | | | — | | | | — | |
| Currency translations | | | — | | | | — | | | | — | | | | — | | | | — | |
| | | | (4,808 | ) | | | (77 | ) | | | (89,611 | ) | | | (248,547 | ) | | | (50,405 | ) |
| Net realized gain (loss) and unrealized depreciation | | | (9,518 | ) | | | (77 | ) | | | (159,344 | ) | | | (133,527 | ) | | | (25,798 | ) |
| Net decrease in net assets resulting from operations | | $ | (8,941 | ) | | $ | (265 | ) | | $ | (137,337 | ) | | $ | (134,228 | ) | | $ | (25,600 | ) |
Refer to the end of the statements of operations for footnotes.
Refer to the notes to financial statements.
| 258 | American Funds Insurance Series |
| Financial statements (continued) | |
| | |
Statements of operations
for the six months ended June 30, 2022 (continued) | unaudited
(dollars in thousands) |
| | | Managed Risk
Washington
Mutual
Investors
Fund | | | Managed
Risk
Growth-
Income
Fund | | | Managed
Risk
Asset
Allocation
Fund | |
| Investment income: | | | | | | | | | | | | |
| Income (net of non-U.S. taxes1): | | | | | | | | | | | | |
| Dividends: | | | | | | | | | | | | |
| Unaffiliated issuers | | $ | 19 | | | $ | 133 | | | $ | 139 | |
| Affiliated issuers | | | 1,459 | | | | 7,601 | | | | 9,909 | |
| | | | 1,478 | | | | 7,734 | | | | 10,048 | |
| Interest from unaffiliated issuers | | | — | | | | — | | | | — | |
| European Union withholding tax reclaims | | | — | | | | — | | | | — | |
| Interest from European Union withholding tax reclaims | | | — | | | | — | | | | — | |
| Securities lending income (net of fees) | | | — | | | | — | | | | — | |
| | | | 1,478 | | | | 7,734 | | | | 10,048 | |
| Fees and expenses1: | | | | | | | | | | | | |
| Investment advisory services | | | 255 | | | | 1,785 | | | | 1,883 | |
| Distribution services | | | 423 | | | | 376 | | | | 3,130 | |
| Insurance administrative services | | | 426 | | | | 2,976 | | | | 3,139 | |
| Transfer agent services | | | — | 2 | | | — | 2 | | | — | 2 |
| Administrative services | | | — | | | | — | | | | — | |
| Accounting and administrative services | | | 24 | | | | 45 | | | | 46 | |
| Reports to shareholders | | | 2 | | | | 5 | | | | 6 | |
| Registration statement and prospectus | | | — | 2 | | | 1 | | | | 3 | |
| Trustees’ compensation | | | — | 2 | | | — | 2 | | | — | 2 |
| Auditing and legal | | | — | 2 | | | 2 | | | | 2 | |
| Custodian | | | 3 | | | | 3 | | | | 3 | |
| Other | | | — | 2 | | | 1 | | | | 1 | |
| Total fees and expenses before waivers/reimbursement | | | 1,133 | | | | 5,194 | | | | 8,213 | |
| Less waivers/reimbursement of fees and expenses: | | | | | | | | | | | | |
| Investment advisory services waivers | | | 85 | | | | 596 | | | | 629 | |
| Miscellaneous fee reimbursement | | | — | | | | — | | | | — | |
| Total waivers/reimbursement of fees and expenses | | | 85 | | | | 596 | | | | 629 | |
| Total fees and expenses after waivers/reimbursement | | | 1,048 | | | | 4,598 | | | | 7,584 | |
| Net investment income (loss) | | | 430 | | | | 3,136 | | | | 2,464 | |
| Net realized gain (loss) and unrealized depreciation: | | | | | | | | | | | | |
| Net realized gain (loss)1 on: | | | | | | | | | | | | |
| Investments in: | | | | | | | | | | | | |
| Unaffiliated issuers | | | (2,423 | ) | | | (28,252 | ) | | | (3,697 | ) |
| Affiliated issuers | | | 30,760 | | | | 105,881 | | | | 66,785 | |
| Futures contracts | | | 4,515 | | | | 7,863 | | | | (8,961 | ) |
| Forward currency contracts | | | — | | | | — | | | | — | |
| Swap contracts | | | — | | | | — | | | | — | |
| Currency transactions | | | (41 | ) | | | (269 | ) | | | (189 | ) |
| Capital gain distributions received from affiliated issuers | | | 61,850 | | | | 179,634 | | | | 231,217 | |
| | | | 94,661 | | | | 264,857 | | | | 285,155 | |
| Net unrealized (depreciation) appreciation1 on: | | | | | | | | | | | | |
| Investments in: | | | | | | | | | | | | |
| Unaffiliated issuers | | | 1,000 | | | | 19,619 | | | | 781 | |
| Affiliated issuers | | | (134,755 | ) | | | (735,451 | ) | | | (711,597 | ) |
| Futures contracts | | | 3,951 | | | | 27,427 | | | | 23,811 | |
| Forward currency contracts | | | — | | | | — | | | | — | |
| Swap contracts | | | — | | | | — | | | | — | |
| Currency translations | | | — | | | | — | | | | — | |
| | | | (129,804 | ) | | | (688,405 | ) | | | (687,005 | ) |
| Net realized gain (loss) and unrealized depreciation | | | (35,143 | ) | | | (423,548 | ) | | | (401,850 | ) |
| Net decrease in net assets resulting from operations | | $ | (34,713 | ) | | $ | (420,412 | ) | | $ | (399,386 | ) |
| 1 | Additional information related to non-U.S. taxes and class-specific fees and expenses is included in the notes to financial statements. |
| 2 | Amount less than one thousand. |
| 3 | Formerly Global Balanced Fund. |
Refer to the notes to financial statements.
| American Funds Insurance Series | 259 |
| Financial statements (continued) | |
| | |
| Statements of changes in net assets | (dollars in thousands) |
| | | Global Growth Fund | | | Global Small
Capitalization Fund | | | Growth Fund | |
| | | Six months
ended
June 30,
20221 | | | Year ended
December 31,
2021 | | | Six months
ended
June 30,
20221 | | | Year ended
December 31,
2021 | | | Six months
ended
June 30,
20221 | | | Year ended
December 31,
2021 | |
| Operations: | | | | | | | | | | | | | | | | | | | | | | | | |
| Net investment income (loss) | | $ | 28,390 | | | $ | 36,408 | | | $ | 1,173 | | | $ | (11,335 | ) | | $ | 62,592 | | | $ | 87,664 | |
| Net realized gain (loss) | | | 309,596 | | | | 846,935 | | | | 86,893 | | | | 1,098,836 | | | | 1,244,665 | | | | 5,061,178 | |
| Net unrealized (depreciation) appreciation | | | (3,004,394 | ) | | | 485,952 | | | | (1,463,945 | ) | | | (710,657 | ) | | | (14,553,435 | ) | | | 3,147,345 | |
| Net (decrease) increase in net assets resulting from operations | | | (2,666,408 | ) | | | 1,369,295 | | | | (1,375,879 | ) | | | 376,844 | | | | (13,246,178 | ) | | | 8,296,187 | |
| | | | | | | | | | | | | | | | | | | | | | | | | |
| Distributions paid to shareholders | | | (851,026 | ) | | | (486,343 | ) | | | (1,091,116 | ) | | | (123,155 | ) | | | (5,032,276 | ) | | | (5,437,958 | ) |
| | | | | | | | | | | | | | | | | | | | | | | | | |
| Net capital share transactions | | | 797,600 | | | | 466,658 | | | | 809,325 | | | | (989,509 | ) | | | 4,048,879 | | | | 3,623,473 | |
| | | | | | | | | | | | | | | | | | | | | | | | | |
| Total (decrease) increase in net assets | | | (2,719,834 | ) | | | 1,349,610 | | | | (1,657,670 | ) | | | (735,820 | ) | | | (14,229,575 | ) | | | 6,481,702 | |
| | | | | | | | | | | | | | | | | | | | | | | | | |
| Net assets: | | | | | | | | | | | | | | | | | | | | | | | | |
| Beginning of period | | | 9,590,580 | | | | 8,240,970 | | | | 4,576,921 | | | | 5,312,741 | | | | 45,405,746 | | | | 38,924,044 | |
| End of period | | $ | 6,870,746 | | | $ | 9,590,580 | | | $ | 2,919,251 | | | $ | 4,576,921 | | | $ | 31,176,171 | | | $ | 45,405,746 | |
| | | International Fund | | | New World Fund | | | Washington Mutual
Investors Fund | |
| | | Six months
ended
June 30,
20221 | | | Year ended
December 31,
2021 | | | Six months
ended
June 30,
20221 | | | Year ended
December 31,
2021 | | | Six months
ended
June 30,
20221 | | | Year ended
December 31,
2021 | |
| Operations: | | | | | | | | | | | | | | | | | | | | | | | | |
| Net investment income (loss) | | $ | 62,163 | | | $ | 147,317 | | | $ | 27,540 | | | $ | 32,010 | | | $ | 96,146 | | | $ | 173,016 | |
| Net realized gain (loss) | | | (206,268 | ) | | | 1,273,483 | | | | 57,347 | | | | 318,018 | | | | 164,953 | | | | 2,286,033 | |
| Net unrealized (depreciation) appreciation | | | (1,848,507 | ) | | | (1,501,184 | ) | | | (1,087,676 | ) | | | (136,128 | ) | | | (1,682,521 | ) | | | 81,431 | |
| Net (decrease) increase in net assets resulting from operations | | | (1,992,612 | ) | | | (80,384 | ) | | | (1,002,789 | ) | | | 213,900 | | | | (1,421,422 | ) | | | 2,540,480 | |
| | | | | | | | | | | | | | | | | | | | | | | | | |
| Distributions paid to shareholders | | | (1,046,661 | ) | | | (249,096 | ) | | | (327,173 | ) | | | (185,700 | ) | | | (2,263,981 | ) | | | (166,149 | ) |
| | | | | | | | | | | | | | | | | | | | | | | | | |
| Net capital share transactions | | | 423,534 | | | | (832,025 | ) | | | 71,517 | | | | 176,091 | | | | 1,518,745 | | | | (488,260 | ) |
| | | | | | | | | | | | | | | | | | | | | | | | | |
| Total (decrease) increase in net assets | | | (2,615,739 | ) | | | (1,161,505 | ) | | | (1,258,445 | ) | | | 204,291 | | | | (2,166,658 | ) | | | 1,886,071 | |
| | | | | | | | | | | | | | | | | | | | | | | | | |
| Net assets: | | | | | | | | | | | | | | | | | | | | | | | | |
| Beginning of period | | | 9,429,353 | | | | 10,590,858 | | | | 4,447,444 | | | | 4,243,153 | | | | 11,465,137 | | | | 9,579,066 | |
| End of period | | $ | 6,813,614 | | | $ | 9,429,353 | | | $ | 3,188,999 | | | $ | 4,447,444 | | | $ | 9,298,479 | | | $ | 11,465,137 | |
Refer to the end of the statements of changes in net assets for footnotes.
Refer to the notes to financial statements.
| 260 | American Funds Insurance Series |
| Financial statements (continued) | |
| | |
| Statements of changes in net assets (continued) | (dollars in thousands) |
| | | Capital
World Growth
and Income Fund | | | Growth-Income Fund | | | International Growth
and Income Fund | |
| | | Six months
ended
June 30,
20221 | | | Year ended
December 31,
2021 | | | Six months
ended
June 30,
20221 | | | Year ended
December 31,
2021 | | | Six months
ended
June 30,
20221 | | | Year ended
December 31,
2021 | |
| Operations: | | | | | | | | | | | | | | | | | | | | | | | | |
| Net investment income (loss) | | $ | 24,287 | | | $ | 44,268 | | | $ | 235,338 | | | $ | 480,125 | | | $ | 6,502 | | | $ | 34,510 | |
| Net realized gain (loss) | | | (23,895 | ) | | | 410,057 | | | | 1,718,201 | | | | 3,512,628 | | | | (8,764 | ) | | | 357,845 | |
| Net unrealized (depreciation) appreciation | | | (467,382 | ) | | | (139,980 | ) | | | (10,133,272 | ) | | | 4,888,658 | | | | (68,044 | ) | | | (342,815 | ) |
| Net (decrease) increase in net assets resulting from operations | | | (466,990 | ) | | | 314,345 | | | | (8,179,733 | ) | | | 8,881,411 | | | | (70,306 | ) | | | 49,540 | |
| | | | | | | | | | | | | | | | | | | | | | | | | |
| Distributions paid to shareholders | | | (421,092 | ) | | | (90,172 | ) | | | (3,562,421 | ) | | | (915,114 | ) | | | (145,919 | ) | | | (14,532 | ) |
| | | | | | | | | | | | | | | | | | | | | | | | | |
| Net capital share transactions | | | 234,027 | | | | (14,968 | ) | | | 1,558,429 | | | | (3,505,347 | ) | | | 130,423 | | | | (1,112,349 | ) |
| | | | | | | | | | | | | | | | | | | | | | | | | |
| Total (decrease) increase in net assets | | | (654,055 | ) | | | 209,205 | | | | (10,183,725 | ) | | | 4,460,950 | | | | (85,802 | ) | | | (1,077,341 | ) |
| | | | | | | | | | | | | | | | | | | | | | | | | |
| Net assets: | | | | | | | | | | | | | | | | | | | | | | | | |
| Beginning of period | | | 2,383,655 | | | | 2,174,450 | | | | 42,952,485 | | | | 38,491,535 | | | | 378,542 | | | | 1,455,883 | |
| End of period | | $ | 1,729,600 | | | $ | 2,383,655 | | | $ | 32,768,760 | | | $ | 42,952,485 | | | $ | 292,740 | | | $ | 378,542 | |
| | | Capital Income Builder | | | Asset Allocation Fund | | | American Funds
Global Balanced Fund2 | |
| | | Six months
ended
June 30,
20221 | | | Year ended
December 31,
2021 | | | Six months
ended
June 30,
20221 | | | Year ended
December 31,
2021 | | | Six months
ended
June 30,
20221 | | | Year ended
December 31,
2021 | |
| Operations: | | | | | | | | | | | | | | | | | | | | | | | | |
| Net investment income (loss) | | $ | 17,933 | | | $ | 32,730 | | | $ | 252,195 | | | $ | 496,078 | | | $ | 3,446 | | | $ | 4,583 | |
| Net realized gain (loss) | | | 9,257 | | | | 44,998 | | | | 986,809 | | | | 2,982,523 | | | | 48,346 | | | | 24,122 | |
| Net unrealized (depreciation) appreciation | | | (141,754 | ) | | | 81,302 | | | | (6,024,569 | ) | | | 990,457 | | | | (126,736 | ) | | | 17,602 | |
| Net (decrease) increase in net assets resulting from operations | | | (114,564 | ) | | | 159,030 | | | | (4,785,565 | ) | | | 4,469,058 | | | | (74,944 | ) | | | 46,307 | |
| | | | | | | | | | | | | | | | | | | | | | | | | |
| Distributions paid to shareholders | | | (11,814 | ) | | | (29,764 | ) | | | (2,842,521 | ) | | | (1,541,316 | ) | | | (2,232 | ) | | | (29,247 | ) |
| | | | | | | | | | | | | | | | | | | | | | | | | |
| Net capital share transactions | | | 79,461 | | | | (81,691 | ) | | | 1,887,171 | | | | (1,879,473 | ) | | | (14,722 | ) | | | (4,816 | ) |
| | | | | | | | | | | | | | | | | | | | | | | | | |
| Total (decrease) increase in net assets | | | (46,917 | ) | | | 47,575 | | | | (5,740,915 | ) | | | 1,048,269 | | | | (91,898 | ) | | | 12,244 | |
| | | | | | | | | | | | | | | | | | | | | | | | | |
| Net assets: | | | | | | | | | | | | | | | | | | | | | | | | |
| Beginning of period | | | 1,144,527 | | | | 1,096,952 | | | | 30,705,920 | | | | 29,657,651 | | | | 467,376 | | | | 455,132 | |
| End of period | | $ | 1,097,610 | | | $ | 1,144,527 | | | $ | 24,965,005 | | | $ | 30,705,920 | | | $ | 375,478 | | | $ | 467,376 | |
Refer to the end of the statements of changes in net assets for footnotes.
Refer to the notes to financial statements.
| American Funds Insurance Series | 261 |
| Financial statements (continued) | |
| | |
| Statements of changes in net assets (continued) | (dollars in thousands) |
| | | The Bond Fund
of America | | | Capital World Bond Fund | | | American
High-Income Trust | |
| | | Six months
ended
June 30,
20221 | | | Year ended
December 31,
2021 | | | Six months
ended
June 30,
20221 | | | Year ended
December 31,
2021 | | | Six months
ended
June 30,
20221 | | | Year ended
December 31,
2021 | |
| Operations: | | | | | | | | | | | | | | | | | | | | | | | | |
| Net investment income (loss) | | $ | 157,784 | | | $ | 215,953 | | | $ | 19,331 | | | $ | 42,586 | | | $ | 25,270 | | | $ | 47,176 | |
| Net realized gain (loss) | | | (417,939 | ) | | | 129,232 | | | | (60,050 | ) | | | 16,012 | | | | (12,378 | ) | | | 7,485 | |
| Net unrealized (depreciation) appreciation | | | (1,000,538 | ) | | | (353,151 | ) | | | (274,177 | ) | | | (168,792 | ) | | | (138,657 | ) | | | 21,386 | |
| Net (decrease) increase in net assets resulting from operations | | | (1,260,693 | ) | | | (7,966 | ) | | | (314,896 | ) | | | (110,194 | ) | | | (125,765 | ) | | | 76,047 | |
| | | | | | | | | | | | | | | | | | | | | | | | | |
| Distributions paid to shareholders | | | (192,664 | ) | | | (687,442 | ) | | | (30,830 | ) | | | (91,748 | ) | | | (9,523 | ) | | | (43,416 | ) |
| | | | | | | | | | | | | | | | | | | | | | | | | |
| Net capital share transactions | | | (764,324 | ) | | | 2,474,568 | | | | (157,566 | ) | | | (51,795 | ) | | | (67,271 | ) | | | 152,225 | |
| | | | | | | | | | | | | | | | | | | | | | | | | |
| Total (decrease) increase in net assets | | | (2,217,681 | ) | | | 1,779,160 | | | | (503,292 | ) | | | (253,737 | ) | | | (202,559 | ) | | | 184,856 | |
| | | | | | | | | | | | | | | | | | | | | | | | | |
| Net assets: | | | | | | | | | | | | | | | | | | | | | | | | |
| Beginning of period | | | 13,186,579 | | | | 11,407,419 | | | | 2,085,008 | | | | 2,338,745 | | | | 1,052,435 | | | | 867,579 | |
| End of period | | $ | 10,968,898 | | | $ | 13,186,579 | | | $ | 1,581,716 | | | $ | 2,085,008 | | | $ | 849,876 | | | $ | 1,052,435 | |
| | | American Funds
Mortgage Fund | | | Ultra-Short Bond Fund | | | U.S. Government
Securities Fund | |
| | | Six months
ended
June 30,
20221 | | | Year ended
December 31,
2021 | | | Six months
ended
June 30,
20221 | | | Year ended
December 31,
2021 | | | Six months
ended
June 30,
20221 | | | Year ended
December 31,
2021 | |
| Operations: | | | | | | | | | | | | | | | | | | | | | | | | |
| Net investment income (loss) | | $ | 577 | | | $ | 1,555 | | | $ | (188 | ) | | $ | (1,883 | ) | | $ | 22,007 | | | $ | 26,482 | |
| Net realized gain (loss) | | | (4,710 | ) | | | (90 | ) | | | — | | | | — | 5 | | | (69,733 | ) | | | (5,219 | ) |
| Net unrealized (depreciation) appreciation | | | (4,808 | ) | | | (2,808 | ) | | | (77 | ) | | | (4 | ) | | | (89,611 | ) | | | (36,820 | ) |
| Net (decrease) increase in net assets resulting from operations | | | (8,941 | ) | | | (1,343 | ) | | | (265 | ) | | | (1,887 | ) | | | (137,337 | ) | | | (15,557 | ) |
| | | | | | | | | | | | | | | | | | | | | | | | | |
| Distributions paid to shareholders | | | (499 | ) | | | (13,157 | ) | | | — | | | | — | | | | (7,653 | ) | | | (209,728 | ) |
| | | | | | | | | | | | | | | | | | | | | | | | | |
| Net capital share transactions | | | (231,905 | ) | | | 29,279 | | | | 91,611 | | | | (41,201 | ) | | | (378,884 | ) | | | 236,927 | |
| | | | | | | | | | | | | | | | | | | | | | | | | |
| Total (decrease) increase in net assets | | | (241,345 | ) | | | 14,779 | | | | 91,346 | | | | (43,088 | ) | | | (523,874 | ) | | | 11,642 | |
| | | | | | | | | | | | | | | | | | | | | | | | | |
| Net assets: | | | | | | | | | | | | | | | | | | | | | | | | |
| Beginning of period | | | 334,398 | | | | 319,619 | | | | 332,661 | | | | 375,749 | | | | 2,165,299 | | | | 2,153,657 | |
| End of period | | $ | 93,053 | | | $ | 334,398 | | | $ | 424,007 | | | $ | 332,661 | | | $ | 1,641,425 | | | $ | 2,165,299 | |
Refer to the end of the statements of changes in net assets for footnotes.
Refer to the notes to financial statements.
| 262 | American Funds Insurance Series |
| Financial statements (continued) | |
| | |
| Statements of changes in net assets (continued) | (dollars in thousands) |
| | | Managed Risk
Growth Fund | | | Managed Risk
International Fund | | | Managed Risk
Washington Mutual
Investors Fund | |
| | | Six months
ended
June 30,
20221 | | | Year ended
December 31,
2021 | | | Six months
ended
June 30,
20221 | | | Year ended
December 31,
2021 | | | Six months
ended
June 30,
20221 | | | Year ended
December 31,
2021 | |
| Operations: | | | | | | | | | | | | | | | | | | | | | | | | |
| Net investment income (loss) | | $ | (701 | ) | | $ | (392 | ) | | $ | 198 | | | $ | 2,984 | | | $ | 430 | | | $ | 3,320 | |
| Net realized gain (loss) | | | 115,020 | | | | 93,312 | | | | 24,607 | | | | 654 | | | | 94,661 | | | | 15,848 | |
| Net unrealized (depreciation) appreciation | | | (248,547 | ) | | | (21,491 | ) | | | (50,405 | ) | | | (10,287 | ) | | | (129,804 | ) | | | 38,411 | |
| Net (decrease) increase in net assets resulting from operations | | | (134,228 | ) | | | 71,429 | | | | (25,600 | ) | | | (6,649 | ) | | | (34,713 | ) | | | 57,579 | |
| | | | | | | | | | | | | | | | | | | | | | | | | |
| Distributions paid to shareholders | | | (85,304 | ) | | | (27,384 | ) | | | (3,368 | ) | | | (931 | ) | | | (3,925 | ) | | | (6,019 | ) |
| | | | | | | | | | | | | | | | | | | | | | | | | |
| Net capital share transactions | | | 93,951 | | | | (11,898 | ) | | | 583 | | | | (654 | ) | | | (12,730 | ) | | | (34,883 | ) |
| | | | | | | | | | | | | | | | | | | | | | | | | |
| Total (decrease) increase in net assets | | | (125,581 | ) | | | 32,147 | | | | (28,385 | ) | | | (8,234 | ) | | | (51,368 | ) | | | 16,677 | |
| | | | | | | | | | | | | | | | | | | | | | | | | |
| Net assets: | | | | | | | | | | | | | | | | | | | | | | | | |
| Beginning of period | | | 596,593 | | | | 564,446 | | | | 161,335 | | | | 169,569 | | | | 373,037 | | | | 356,360 | |
| End of period | | $ | 471,012 | | | $ | 596,593 | | | $ | 132,950 | | | $ | 161,335 | | | $ | 321,669 | | | $ | 373,037 | |
| | | Managed Risk
Growth-Income Fund | | | Managed Risk
Asset Allocation Fund | | | | | | | | | |
| | | Six months
ended
June 30,
20221 | | | Year ended
December 31,
2021 | | | Six months
ended
June 30,
20221 | | | Year ended
December 31,
2021 | | | | | | | | | |
| Operations: | | | | | | | | | | | | | | | | | | | | | | | | |
| Net investment income (loss) | | $ | 3,136 | | | $ | 23,938 | | | $ | 2,464 | | | $ | 29,121 | | | | | | | | | |
| Net realized gain (loss) | | | 264,857 | | | | 49,377 | | | | 285,155 | | | | 133,738 | | | | | | | | | |
| Net unrealized (depreciation) appreciation | | | (688,405 | ) | | | 292,194 | | | | (687,005 | ) | | | 169,648 | | | | | | | | | |
| Net (decrease) increase in net assets resulting from operations | | | (420,412 | ) | | | 365,509 | | | | (399,386 | ) | | | 332,507 | | | | | | | | | |
| | | | | | | | | | | | | | | | | | | | | | | | | |
| Distributions paid to shareholders | | | (74,065 | ) | | | (68,168 | ) | | | (121,640 | ) | | | (38,227 | ) | | | | | | | | |
| | | | | | | | | | | | | | | | | | | | | | | | | |
| Net capital share transactions | | | 8,625 | | | | (64,385 | ) | | | (6,522 | ) | | | (254,031 | ) | | | | | | | | |
| | | | | | | | | | | | | | | | | | | | | | | | | |
| Total (decrease) increase in net assets | | | (485,852 | ) | | | 232,956 | | | | (527,548 | ) | | | 40,249 | | | | | | | | | |
| | | | | | | | | | | | | | | | | | | | | | | | | |
| Net assets: | | | | | | | | | | | | | | | | | | | | | | | | |
| Beginning of period | | | 2,667,572 | | | | 2,434,616 | | | | 2,819,020 | | | | 2,778,771 | | | | | | | | | |
| End of period | | $ | 2,181,720 | | | $ | 2,667,572 | | | $ | 2,291,472 | | | $ | 2,819,020 | | | | | | | | | |
| 1 | Unaudited. |
| 2 | Formerly Global Balanced Fund. |
| 3 | Amount less than one thousand. |
Refer to the notes to financial statements.
| American Funds Insurance Series | 263 |
| Notes to financial statements | unaudited |
1. Organization
American Funds Insurance Series (the “series”) is registered under the Investment Company Act of 1940, as amended (the “1940 Act”), as an open-end, diversified management investment company with 34 different funds (“the funds”), including 23 funds in the series covered in this report. The other 11 funds in the series are covered in separate reports. Six funds in the series are covered in the American Funds Insurance Series - Target Date Series report and five funds in the series are covered in the American Funds Insurance Series - Portfolio Series report. The assets of each fund are segregated, with each fund accounted for separately. Capital Research and Management Company (“CRMC”) is the series’ investment adviser. Milliman Financial Risk Management LLC (“Milliman FRM”) is the subadviser for the risk management strategy for eight of the funds (the “managed risk funds”), five of which are covered in this report.
The managed risk funds covered in this report are Managed Risk Growth Fund, Managed Risk International Fund, Managed Risk Washington Mutual Investors Fund, Managed Risk Growth-Income Fund and Managed Risk Asset Allocation Fund. The managed risk funds invest in other funds within the series (the “underlying funds”) and employ Milliman FRM to implement the risk management strategy, which consists of using hedging instruments — primarily exchange-traded options and futures contracts — to attempt to stabilize the volatility of the funds around target volatility levels and reduce the downside exposure of the funds during periods of significant market declines.
Shareholders approved a proposal to reorganize the series from a Massachusetts business trust to a Delaware statutory trust. The series reserved the right to delay implementing the reorganization and has elected to do so.
The investment objective(s) for each fund covered in this report are as follows:
Global Growth Fund — To provide long-term growth of capital.
Global Small Capitalization Fund — To provide long-term growth of capital.
Growth Fund — To provide growth of capital.
International Fund — To provide long-term growth of capital.
New World Fund — To provide long-term capital appreciation.
Washington Mutual Investors Fund — To produce income exceeding the average yield on U.S. stocks generally and to provide an opportunity for growth of principal consistent with sound common stock investing.
Capital World Growth and Income Fund — To provide long-term growth of capital while providing current income.
Growth-Income Fund — To achieve long-term growth of capital and income.
International Growth and Income Fund — To provide long-term growth of capital while providing current income.
Capital Income Builder — The two primary objectives are (1) to provide a level of current income that exceeds the average yield on U.S. stocks generally and (2) to provide a growing stream of income over the years. The secondary objective is to provide growth of capital.
Asset Allocation Fund — To provide high total return (including income and capital gains) consistent with preservation of capital over the long term.
American Funds Global Balanced Fund (formerly Global Balanced Fund) — Seeks the balanced accomplishment of three objectives: long-term growth of capital, conservation of principal and current income.
The Bond Fund of America — To provide as high a level of current income as is consistent with the preservation of capital.
Capital World Bond Fund — To provide, over the long term, a high level of total return consistent with prudent investment management.
American High-Income Trust — The primary objective is to provide a high level of current income. The secondary objective is capital appreciation.
| 264 | American Funds Insurance Series |
American Funds Mortgage Fund — To provide current income and preservation of capital.
Ultra-Short Bond Fund — To provide current income, consistent with the maturity and quality standards applicable to the fund, and preservation of capital and liquidity.
U.S. Government Securities Fund — To provide a high level of current income consistent with prudent investment risk and preservation of capital.
Managed Risk Growth Fund — To provide growth of capital while seeking to manage volatility and provide downside protection.
Managed Risk International Fund — To provide long-term growth of capital while seeking to manage volatility and provide downside protection.
Managed Risk Washington Mutual Investors Fund — To produce income exceeding the average yield on U.S. stocks generally and to provide an opportunity for growth of principal consistent with sound common stock investing, in each case while seeking to manage volatility and provide downside protection.
Managed Risk Growth-Income Fund — To achieve long-term growth of capital and income while seeking to manage volatility and provide downside protection.
Managed Risk Asset Allocation Fund — To provide high total return (including income and capital gains) consistent with preservation of capital over the long term while seeking to manage volatility and provide downside protection.
Each fund in the series, except the managed risk funds, offers either four or five share classes (Classes 1, 1A, 2, 3 or 4); the managed risk funds offer two share classes (Classes P1 and P2). Holders of all share classes of each fund have equal pro rata rights to assets, dividends and liquidation proceeds of each fund held. Each share class of each fund has identical voting rights, except for the exclusive right to vote on matters affecting only its class. Share classes have different fees and expenses (“class-specific fees and expenses”), primarily due to different arrangements for certain distribution expenses. Differences in class-specific fees and expenses will result in differences in net investment income and, therefore, the payment of different per-share dividends by each class of each fund.
2. Significant accounting policies
Each fund is an investment company that applies the accounting and reporting guidance issued in Topic 946 by the U.S. Financial Accounting Standards Board. Each fund’s financial statements have been prepared to comply with U.S. generally accepted accounting principles (“U.S. GAAP”). These principles require the series’ investment adviser to make estimates and assumptions that affect reported amounts and disclosures. Actual results could differ from those estimates. Subsequent events, if any, have been evaluated through the date of issuance in the preparation of the financial statements. The funds follow the significant accounting policies described in this section, as well as the valuation policies described in the next section on valuation.
Cash — Cash may include amounts held in an interest bearing deposit facility.
Security transactions and related investment income — Security transactions are recorded by each fund as of the date the trades are executed with brokers. Realized gains and losses from security transactions are determined based on the specific identified cost of the securities. In the event a security is purchased with a delayed payment date, each fund will segregate liquid assets sufficient to meet their payment obligations. Dividend income is recognized on the ex-dividend date and interest income is recognized on an accrual basis. Market discounts, premiums and original issue discounts on fixed-income securities are amortized daily over the expected life of the security.
Fees and expenses — The fees and expenses of the underlying funds held by the managed risk funds are not included in the fees and expenses reported for each of the managed risk funds; however, they are indirectly reflected in the valuation of each of the underlying funds. These fees are included in the unaudited net effective expense ratios that are provided as additional information in the financial highlights tables.
| American Funds Insurance Series | 265 |
Class allocations — Income, fees and expenses (other than class-specific fees and expenses), realized gains and losses and unrealized appreciation and depreciation are allocated daily among the various share classes of each fund based on their relative net assets. Class-specific fees and expenses, such as distribution expenses, are accrued daily and charged directly to the respective share class of each fund.
Distributions paid to shareholders — Income dividends and capital gain distributions are recorded on each fund’s ex-dividend date.
Currency translation — Assets and liabilities, including investment securities, denominated in currencies other than U.S. dollars are translated into U.S. dollars at the exchange rates supplied by one or more pricing vendors on the valuation date. Purchases and sales of investment securities and income and expenses are translated into U.S. dollars at the exchange rates on the dates of such transactions. The effects of changes in exchange rates on investment securities are included with the net realized gain or loss and net unrealized appreciation or depreciation on investments in the funds’ statements of operations. The realized gain or loss and unrealized appreciation or depreciation resulting from all other transactions denominated in currencies other than U.S. dollars are disclosed separately.
3. Valuation
CRMC, the series’ investment adviser, values the funds’ investments at fair value as defined by U.S. GAAP. The net asset value per share is calculated once daily as of the close of regular trading on the New York Stock Exchange, normally 4 p.m. New York time, each day the New York Stock Exchange is open.
Methods and inputs — The series’ investment adviser uses the following methods and inputs to establish the fair value of each fund’s assets and liabilities. Use of particular methods and inputs may vary over time based on availability and relevance as market and economic conditions evolve.
Equity securities are generally valued at the official closing price of, or the last reported sale price on, the exchange or market on which such securities are traded, as of the close of business on the day the securities are being valued or, lacking any sales, at the last available bid price. Prices for each security are taken from the principal exchange or market on which the security trades. The value of an underlying fund is based on its reported net asset value.
Fixed-income securities, including short-term securities, are generally valued at prices obtained from one or more pricing vendors. Vendors value such securities based on one or more of the inputs described in the following table. The table provides examples of inputs that are commonly relevant for valuing particular classes of fixed-income securities in which the funds are authorized to invest. However, these classifications are not exclusive and any of the inputs may be used to value any other class of fixed-income security.
| Fixed-income class | | Examples of standard inputs |
| All | | Benchmark yields, transactions, bids, offers, quotations from dealers and trading systems, new issues, spreads and other relationships observed in the markets among comparable securities; and proprietary pricing models such as yield measures calculated using factors such as cash flows, financial or collateral performance and other reference data (collectively referred to as “standard inputs”) |
| Corporate bonds, notes & loans; convertible securities | | Standard inputs and underlying equity of the issuer |
| Bonds & notes of governments & government agencies | | Standard inputs and interest rate volatilities |
| Mortgage-backed; asset-backed obligations | | Standard inputs and cash flows, prepayment information, default rates, delinquency and loss assumptions, collateral characteristics, credit enhancements and specific deal information |
| Municipal securities | | Standard inputs and, for certain distressed securities, cash flows or liquidation values using a net present value calculation based on inputs that include, but are not limited to, financial statements and debt contracts |
When the series’ investment adviser deems it appropriate to do so (such as when vendor prices are unavailable or not deemed to be representative), fixed-income securities will be valued in good faith at the mean quoted bid and ask prices that are reasonably and timely available (or bid prices, if ask prices are not available) or at prices for securities of comparable maturity, quality and type.
| 266 | American Funds Insurance Series |
Securities with both fixed-income and equity characteristics, or equity securities traded principally among fixed-income dealers, are generally valued in the manner described for either equity or fixed-income securities, depending on which method is deemed most appropriate by the series’ investment adviser. The Capital Group Central Corporate Bond Fund (“CCBF”), a fund within the Capital Group Central Fund Series II, and Capital Group Central Cash Fund (“CCF”), a fund within the Capital Group Central Fund Series (collectively the “Central Funds”), are each valued based upon a floating net asset value, which fluctuates with changes in the value of each fund’s portfolio securities. The underlying securities are valued based on the policies and procedures in the Central Funds’ statements of additional information. The State Street Institutional U.S. Government Money Market Fund held by the managed risk funds is managed to maintain a $1.00 net asset value per share. The net asset value of each share class of each managed risk fund is calculated based on the reported net asset values of the underlying funds in which each fund invests.
Exchange-traded options and futures are generally valued at the official closing price for options and official settlement price for futures of the exchange or market on which such instruments are traded, as of the close of business on the day such instruments are being valued. Forward currency contracts are valued based on the spot and forward exchange rates obtained from one or more pricing vendors. Interest rate swaps and credit default swaps are generally valued by pricing vendors based on market inputs that include the index and term of index, reset frequency, payer/receiver, currency and pay frequency.
Securities and other assets for which representative market quotations are not readily available or are considered unreliable by the series’ investment adviser are fair valued as determined in good faith under fair value guidelines adopted by authority of the series’ board of trustees as further described. The investment adviser follows fair valuation guidelines, consistent with U.S. Securities and Exchange Commission rules and guidance, to consider relevant principles and factors when making fair value determinations. The investment adviser considers relevant indications of value that are reasonably and timely available to it in determining the fair value to be assigned to a particular security, such as the type and cost of the security; contractual or legal restrictions on resale of the security; relevant financial or business developments of the issuer; actively traded similar or related securities; conversion or exchange rights on the security; related corporate actions; significant events occurring after the close of trading in the security; and changes in overall market conditions. In addition, the closing prices of equity securities and futures that trade in markets outside U.S. time zones may be adjusted to reflect significant events that occur after the close of local trading but before the net asset value of each share class of each fund is determined. Fair valuations and valuations of investments and futures that are not actively trading involve judgment and may differ materially from valuations that would have been used had greater market activity occurred.
Processes and structure — The series’ board of trustees has delegated authority to the series’ investment adviser to make fair value determinations, subject to board oversight. The investment adviser has established a Joint Fair Valuation Committee (the “Fair Valuation Committee”) to administer, implement and oversee the fair valuation process, and to make fair value decisions. The Fair Valuation Committee regularly reviews its own fair value decisions, as well as decisions made under its standing instructions to the investment adviser’s valuation teams. The Fair Valuation Committee reviews changes in fair value measurements from period to period and may, as deemed appropriate, update the fair valuation guidelines to better reflect the results of back testing and address new or evolving issues. The Fair Valuation Committee reports any changes to the fair valuation guidelines to the board of trustees. The series’ board and audit committee also regularly review reports that describe fair value determinations and methods.
The series’ investment adviser has also established a Fixed-Income Pricing Review Group to administer and oversee the fixed-income valuation process, including the use of fixed-income pricing vendors. This group regularly reviews pricing vendor information and market data. Pricing decisions, processes and controls over security valuation are also subject to additional internal reviews facilitated by the investment adviser’s global risk management group.
Classifications — The series’ investment adviser classifies the funds’ assets and liabilities into three levels based on the inputs used to value the assets or liabilities. Level 1 values are based on quoted prices in active markets for identical securities. Level 2 values are based on significant observable market inputs, such as quoted prices for similar securities and quoted prices in inactive markets. Certain securities trading outside the U.S. may transfer between Level 1 and Level 2 due to valuation adjustments resulting from significant market movements following the close of local trading. Level 3 values are based on significant unobservable inputs that reflect the investment adviser’s determination of assumptions that market participants might reasonably use in valuing the securities.
The valuation levels are not necessarily an indication of the risk or liquidity associated with the underlying investment. For example, U.S. government securities are reflected as Level 2 because the inputs used to determine fair value may not always be quoted prices in an active market. The tables on the following pages present the funds’ valuation levels as of June 30, 2022 (dollars in thousands):
| American Funds Insurance Series | 267 |
Global Growth Fund
| | | Investment securities | |
| | | Level 1 | | | Level 2 | | | Level 3 | | | Total | |
| Assets: | | | | | | | | | | | | |
| Common stocks: | | | | | | | | | | | | |
| Information technology | | $ | 1,692,534 | | | $ | — | | | $ | — | | | $ | 1,692,534 | |
| Health care | | | 1,141,809 | | | | — | | | | — | | | | 1,141,809 | |
| Consumer discretionary | | | 1,014,034 | | | | — | | | | — | | | | 1,014,034 | |
| Consumer staples | | | 601,888 | | | | — | | | | — | | | | 601,888 | |
| Financials | | | 591,871 | | | | — | | | | — | * | | | 591,871 | |
| Communication services | | | 323,718 | | | | — | | | | — | | | | 323,718 | |
| Industrials | | | 322,261 | | | | — | | | | — | | | | 322,261 | |
| Energy | | | 210,349 | | | | — | | | | — | * | | | 210,349 | |
| Materials | | | 180,570 | | | | — | | | | — | | | | 180,570 | |
| Real estate | | | 26,276 | | | | — | | | | — | | | | 26,276 | |
| Utilities | | | 9,456 | | | | — | | | | — | | | | 9,456 | |
| Preferred securities | | | 104,021 | | | | — | | | | — | | | | 104,021 | |
| Short-term securities | | | 650,104 | | | | — | | | | — | | | | 650,104 | |
| Total | | $ | 6,868,891 | | | $ | — | | | $ | — | * | | $ | 6,868,891 | |
| * | Amount less than one thousand. |
Global Small Capitalization Fund
| | | Investment securities | |
| | | Level 1 | | | Level 2 | | | Level 3 | | | Total | |
| Assets: | | | | | | | | | | | | |
| Common stocks: | | | | | | | | | | | | |
| Information technology | | $ | 568,036 | | | $ | 25,309 | | | $ | 1,093 | | | $ | 594,438 | |
| Industrials | | | 476,093 | | | | — | | | | — | | | | 476,093 | |
| Consumer discretionary | | | 455,457 | | | | — | | | | — | | | | 455,457 | |
| Health care | | | 430,498 | | | | — | | | | — | | | | 430,498 | |
| Financials | | | 198,106 | | | | 33,624 | | | | — | | | | 231,730 | |
| Materials | | | 109,673 | | | | — | | | | — | | | | 109,673 | |
| Consumer staples | | | 89,696 | | | | — | | | | — | | | | 89,696 | |
| Real estate | | | 61,385 | | | | — | | | | — | | | | 61,385 | |
| Communication services | | | 61,038 | | | | — | | | | — | | | | 61,038 | |
| Utilities | | | 49,053 | | | | — | | | | — | | | | 49,053 | |
| Energy | | | 12,301 | | | | — | | | | 18,936 | | | | 31,237 | |
| Preferred securities | | | 5,942 | | | | — | | | | 20,705 | | | | 26,647 | |
| Rights & warrants | | | — | | | | 13,750 | | | | — | | | | 13,750 | |
| Short-term securities | | | 365,897 | | | | — | | | | — | | | | 365,897 | |
| Total | | $ | 2,883,175 | | | $ | 72,683 | | | $ | 40,734 | | | $ | 2,996,592 | |
The following table reconciles the valuation of the fund’s Level 3 investment securities and related transactions for the six months ended June 30, 2022 (dollars in thousands):
| | | Beginning
value at
1/1/2022 | | | Transfers
into
Level 3* | | | Purchases | | | Sales | | | Net
realized
gain | | | Unrealized
depreciation† | | | Transfers
out of
Level 3* | | | Ending
value at
6/30/2022 | |
| Investment securities | | $ | 44,963 | | | $ | — | | | $ | — | | | $ | — | | | $ | — | | | $ | (4,229 | ) | | $ | — | | | $ | 40,734 | |
| | | | | | | | | | | | | | | | | | | | | | | | | | | | | | | | | |
| Net unrealized depreciation during the period on Level 3 investment securities held at June 30, 2022 | | | $ | (4,229 | ) |
| * | Transfers into or out of Level 3 are based on the beginning market value of the quarter in which they occurred. These transfers are the result of changes in the availability of pricing sources and/or in the observability of significant inputs used in valuing the securities. |
| † | Net unrealized depreciation is included in the related amounts on investments in the fund’s statement of operations. |
| 268 | American Funds Insurance Series |
Unobservable inputs — Valuation of the fund’s Level 3 securities is based on significant unobservable inputs that reflect the investment adviser’s determination of assumptions that market participants might reasonably use in valuing the securities. The following table provides additional information used by the fund’s investment adviser to fair value the fund’s Level 3 securities (dollars in thousands):
| | | Value at
6/30/2022 | | Valuation
techniques | | Unobservable
inputs | | Range
(if applicable) | | Weighted
average* | | Impact to
valuation from
an increase in
input† |
| Common stocks | | $ | 20,029 | | Market comparable companies | | Price/Cash flow multiple | | 6.1x | | 6.1x | | Increase |
| DLOM | | 16% | | 16% | | Decrease |
| EV/Sales multiple | | 7.0x | | 7.0x | | Increase |
| Preferred securities | | | 20,705 | | Transaction price | | N/A | | N/A | | N/A | | N/A |
| | Market comparable companies | | EV/Sales multiple | | 7.0x - 15.2x | | 12.8x | | Increase |
| Net adjustment based on market comparables movement (decrease) | | 34% | | 34% | | Decrease |
| DLOM | | 10% | | 10% | | Decrease |
| | Recent market information | | Net adjustment based on market comparables movement (decrease) | | 75% | | 75% | | Decrease |
| Total | | $ | 40,734 | | | | | | | | | | |
| * | Weighted average is by relative fair value. |
| † | This column represents the directional change in fair value of the Level 3 securities that would result in an increase from the corresponding input. A decrease to the unobservable input would have the opposite effect. Significant increases and decreases in these inputs in isolation could result in significantly higher or lower fair value measurements. |
Key to abbreviations and symbols
DLOM = Discount for lack of marketability
EV = Enterprise value
Growth Fund
| | | Investment securities | |
| | | Level 1 | | | Level 2 | | | Level 3 | | | Total | |
| Assets: | | | | | | | | | | | | |
| Common stocks: | | | | | | | | | | | | |
| Information technology | | $ | 6,394,599 | | | $ | — | | | $ | 6,000 | | | $ | 6,400,599 | |
| Consumer discretionary | | | 5,899,258 | | | | — | | | | — | | | | 5,899,258 | |
| Health care | | | 4,781,239 | | | | — | | | | 44,928 | | | | 4,826,167 | |
| Communication services | | | 4,639,224 | | | | — | | | | — | | | | 4,639,224 | |
| Industrials | | | 2,548,431 | | | | — | | | | — | | | | 2,548,431 | |
| Financials | | | 1,934,608 | | | | — | | | | — | | | | 1,934,608 | |
| Energy | | | 1,548,263 | | | | — | | | | — | | | | 1,548,263 | |
| Materials | | | 803,087 | | | | — | | | | — | | | | 803,087 | |
| Consumer staples | | | 684,760 | | | | — | | | | — | | | | 684,760 | |
| Utilities | | | 131,355 | | | | — | | | | — | | | | 131,355 | |
| Real estate | | | 34,023 | | | | — | | | | — | | | | 34,023 | |
| Preferred securities | | | 21,266 | | | | — | | | | 37,835 | | | | 59,101 | |
| Convertible bonds & notes | | | — | | | | — | | | | 7,084 | | | | 7,084 | |
| Short-term securities | | | 1,628,284 | | | | — | | | | — | | | | 1,628,284 | |
| Total | | $ | 31,048,397 | | | $ | — | | | $ | 95,847 | | | $ | 31,144,244 | |
| American Funds Insurance Series | 269 |
International Fund
| | | Investment securities | |
| | | Level 1 | | | Level 2 | | | Level 3 | | | Total | |
| Assets: | | | | | | | | | | | | |
| Common stocks: | | | | | | | | | | | | |
| Industrials | | $ | 893,966 | | | $ | — | | | $ | — | | | $ | 893,966 | |
| Information technology | | | 769,459 | | | | — | | | | 7,357 | | | | 776,816 | |
| Financials | | | 773,846 | | | | — | | | | — | | | | 773,846 | |
| Health care | | | 753,412 | | | | — | | | | — | | | | 753,412 | |
| Energy | | | 651,793 | | | | — | | | | — | | | | 651,793 | |
| Materials | | | 628,737 | | | | — | | | | — | | | | 628,737 | |
| Consumer discretionary | | | 603,139 | | | | — | | | | — | | | | 603,139 | |
| Consumer staples | | | 305,783 | | | | — | | | | — | | | | 305,783 | |
| Communication services | | | 238,436 | | | | — | | | | — | * | | | 238,436 | |
| Utilities | | | 152,530 | | | | — | | | | — | | | | 152,530 | |
| Real estate | | | 46,413 | | | | — | | | | — | | | | 46,413 | |
| Preferred securities | | | 52,526 | | | | — | | | | 673 | | | | 53,199 | |
| Rights & warrants | | | — | | | | 16,702 | | | | — | | | | 16,702 | |
| Short-term securities | | | 981,097 | | | | — | | | | — | | | | 981,097 | |
| Total | | $ | 6,851,137 | | | $ | 16,702 | | | $ | 8,030 | | | $ | 6,875,869 | |
| * | Amount less than one thousand. |
New World Fund
| | | Investment securities | |
| | | Level 1 | | | Level 2 | | | Level 3 | | | Total | |
| Assets: | | | | | | | | | | | | |
| Common stocks: | | | | | | | | | | | | |
| Information technology | | $ | 499,539 | | | $ | — | | | $ | 588 | | | $ | 500,127 | |
| Financials | | | 381,073 | | | | — | | | | — | * | | | 381,073 | |
| Health care | | | 372,282 | | | | — | | | | — | | | | 372,282 | |
| Consumer discretionary | | | 335,566 | | | | — | | | | — | * | | | 335,566 | |
| Industrials | | | 283,135 | | | | — | | | | — | | | | 283,135 | |
| Materials | | | 247,617 | | | | — | | | | — | * | | | 247,617 | |
| Consumer staples | | | 217,659 | | | | — | | | | — | * | | | 217,659 | |
| Communication services | | | 155,041 | | | | — | | | | — | * | | | 155,041 | |
| Energy | | | 134,793 | | | | 2,515 | | | | — | * | | | 137,308 | |
| Real estate | | | 53,460 | | | | — | | | | — | | | | 53,460 | |
| Utilities | | | 49,418 | | | | — | | | | — | | | | 49,418 | |
| Preferred securities | | | 18,576 | | | | — | | | | 11,241 | | | | 29,817 | |
| Rights & warrants | | | 58 | | | | 668 | | | | — | | | | 726 | |
| Bonds, notes & other debt instruments | | | — | | | | 103,688 | | | | — | | | | 103,688 | |
| Short-term securities | | | 323,608 | | | | — | | | | — | | | | 323,608 | |
| Total | | $ | 3,071,825 | | | $ | 106,871 | | | $ | 11,829 | | | $ | 3,190,525 | |
| | | Other investments† | |
| | | Level 1 | | | Level 2 | | | Level 3 | | | Total | |
| Assets: | | | | | | | | | | | | |
| Unrealized appreciation on futures contracts | | $ | 160 | | | $ | — | | | $ | — | | | $ | 160 | |
| Unrealized appreciation on open forward currency contracts | | | — | | | | 40 | | | | — | | | | 40 | |
| Liabilities: | | | | | | | | | | | | | | | | |
| Unrealized depreciation on futures contracts | | | (118 | ) | | | — | | | | — | | | | (118 | ) |
| Unrealized depreciation on open forward currency contracts | | | — | | | | (1 | ) | | | — | | | | (1 | ) |
| Total | | $ | 42 | | | $ | 39 | | | $ | — | | | $ | 81 | |
| * | Amount less than one thousand. |
| † | Futures contracts and forward currency contracts are not included in the fund’s investment portfolio. |
Washington Mutual Investors Fund
At June 30, 2022, all of the fund’s investment securities were classified as Level 1.
| 270 | American Funds Insurance Series |
Capital World Growth and Income Fund
| | | Investment securities | |
| | | Level 1 | | | Level 2 | | | Level 3 | | | Total | |
| Assets: | | | | | | | | | | | | |
| Common stocks: | | | | | | | | | | | | |
| Information technology | | $ | 292,238 | | | $ | — | | | $ | — | | | $ | 292,238 | |
| Financials | | | 247,908 | | | | — | | | | — | * | | | 247,908 | |
| Health care | | | 228,402 | | | | — | | | | — | | | | 228,402 | |
| Industrials | | | 183,901 | | | | — | | | | — | | | | 183,901 | |
| Consumer discretionary | | | 155,507 | | | | — | | | | — | | | | 155,507 | |
| Consumer staples | | | 131,250 | | | | — | | | | — | | | | 131,250 | |
| Energy | | | 104,884 | | | | 2,338 | | | | — | * | | | 107,222 | |
| Materials | | | 106,750 | | | | — | | | | — | | | | 106,750 | |
| Communication services | | | 93,171 | | | | — | | | | — | * | | | 93,171 | |
| Utilities | | | 50,071 | | | | 478 | | | | — | | | | 50,549 | |
| Real estate | | | 33,321 | | | | — | | | | — | | | | 33,321 | |
| Preferred securities | | | 7,949 | | | | — | | | | — | | | | 7,949 | |
| Convertible stocks | | | 2,354 | | | | — | | | | — | | | | 2,354 | |
| Convertible bonds & notes | | | — | | | | 1,058 | | | | — | | | | 1,058 | |
| Bonds, notes & other debt instruments | | | — | | | | 5,745 | | | | — | | | | 5,745 | |
| Short-term securities | | | 92,892 | | | | — | | | | — | | | | 92,892 | |
| Total | | $ | 1,730,598 | | | $ | 9,619 | | | $ | — | * | | $ | 1,740,217 | |
| * | Amount less than one thousand. |
Growth-Income Fund
| | | Investment securities | |
| | | Level 1 | | | Level 2 | | | Level 3 | | | Total | |
| Assets: | | | | | | | | | | | | |
| Common stocks: | | | | | | | | | | | | |
| Information technology | | $ | 6,492,561 | | | $ | — | | | $ | — | | | $ | 6,492,561 | |
| Health care | | | 4,256,632 | | | | — | | | | — | | | | 4,256,632 | |
| Industrials | | | 3,988,247 | | | | — | | | | — | | | | 3,988,247 | |
| Communication services | | | 3,126,720 | | | | — | | | | — | | | | 3,126,720 | |
| Financials | | | 3,042,614 | | | | — | | | | — | | | | 3,042,614 | |
| Consumer discretionary | | | 2,606,142 | | | | — | | | | — | | | | 2,606,142 | |
| Consumer staples | | | 1,756,134 | | | | — | | | | — | | | | 1,756,134 | |
| Energy | | | 1,690,089 | | | | — | | | | — | | | | 1,690,089 | |
| Utilities | | | 1,037,932 | | | | — | | | | — | | | | 1,037,932 | |
| Materials | | | 966,570 | | | | — | | | | — | | | | 966,570 | |
| Real estate | | | 723,852 | | | | — | | | | — | | | | 723,852 | |
| Convertible stocks | | | 391,787 | | | | — | | | | — | | | | 391,787 | |
| Bonds, notes & other debt instruments | | | — | | | | 6,325 | | | | — | | | | 6,325 | |
| Short-term securities | | | 2,417,903 | | | | 425,733 | | | | — | | | | 2,843,636 | |
| Total | | $ | 32,497,183 | | | $ | 432,058 | | | $ | — | | | $ | 32,929,241 | |
| American Funds Insurance Series | 271 |
International Growth and Income Fund
| | | Investment securities | |
| | | Level 1 | | | Level 2 | | | Level 3 | | | Total | |
| Assets: | | | | | | | | | | | | |
| Common stocks: | | | | | | | | | | | | |
| Financials | | $ | 44,250 | | | $ | — | | | | — | * | | $ | 44,250 | |
| Consumer staples | | | 36,462 | | | | — | | | | — | * | | | 36,462 | |
| Information technology | | | 33,632 | | | | 103 | | | | — | | | | 33,735 | |
| Consumer discretionary | | | 32,879 | | | | — | | | | — | | | | 32,879 | |
| Industrials | | | 31,694 | | | | — | | | | — | | | | 31,694 | |
| Health care | | | 28,992 | | | | — | | | | — | | | | 28,992 | |
| Energy | | | 15,306 | | | | 1,592 | | | | — | * | | | 16,898 | |
| Communication services | | | 14,390 | | | | — | | | | — | * | | | 14,390 | |
| Materials | | | 13,679 | | | | — | | | | — | * | | | 13,679 | |
| Utilities | | | 7,585 | | | | — | | | | — | | | | 7,585 | |
| Real estate | | | 6,674 | | | | — | | | | — | | | | 6,674 | |
| Preferred securities | | | 1,908 | | | | — | | | | — | | | | 1,908 | |
| Short-term securities | | | 22,923 | | | | — | | | | — | | | | 22,923 | |
| Total | | $ | 290,374 | | | $ | 1,695 | | | $ | — | * | | $ | 292,069 | |
| | | Other investments† | |
| | | | Level 1 | | | Level 2 | | | Level 3 | | | Total | |
| Assets: | | | | | | | | | | | | | |
| Unrealized appreciation on open forward currency contracts | | $ | — | | | $ | 1 | | | $ | — | | | $ | 1 | |
| * | Amount less than one thousand. |
| † | Forward currency contracts are not included in the fund’s investment portfolio. |
Capital Income Builder
| | | Investment securities | |
| | | Level 1 | | | Level 2 | | | Level 3 | | | Total | |
| Assets: | | | | | | | | | | | | |
| Common stocks: | | | | | | | | | | | | |
| Financials | | $ | 135,409 | | | $ | — | | | | — | * | | $ | 135,409 | |
| Consumer staples | | | 113,314 | | | | — | | | | — | | | | 113,314 | |
| Health care | | | 95,650 | | | | — | | | | — | | | | 95,650 | |
| Information technology | | | 88,228 | | | | — | | | | — | | | | 88,228 | |
| Utilities | | | 73,457 | | | | 424 | | | | — | | | | 73,881 | |
| Real estate | | | 73,764 | | | | — | | | | — | | | | 73,764 | |
| Industrials | | | 65,600 | | | | — | | | | — | | | | 65,600 | |
| Energy | | | 57,300 | | | | — | | | | — | * | | | 57,300 | |
| Communication services | | | 35,852 | | | | — | | | | — | | | | 35,852 | |
| Consumer discretionary | | | 29,927 | | | | — | | | | — | | | | 29,927 | |
| Materials | | | 29,743 | | | | — | | | | — | | | | 29,743 | |
| Preferred securities | | | 506 | | | | — | | | | — | | | | 506 | |
| Rights & warrants | | | 4 | | | | — | | | | — | | | | 4 | |
| Convertible stocks | | | 7,131 | | | | — | | | | — | | | | 7,131 | |
| Investment funds | | | 28,752 | | | | — | | | | — | | | | 28,752 | |
| Bonds, notes & other debt instruments: | | | | | | | | | | | | | | | | |
| U.S. Treasury bonds & notes | | | — | | | | 103,892 | | | | — | | | | 103,892 | |
| Mortgage-backed obligations | | | — | | | | 68,366 | | | | 88 | | | | 68,454 | |
| Corporate bonds, notes & loans | | | — | | | | 20,102 | | | | — | | | | 20,102 | |
| Asset-backed obligations | | | — | | | | 7,504 | | | | — | | | | 7,504 | |
| Bonds & notes of governments & government agencies | | | | | | | | | | | | | | | | |
| outside the U.S. | | | — | | | | 762 | | | | — | | | | 762 | |
| Municipals | | | — | | | | 240 | | | | — | | | | 240 | |
| Short-term securities | | | 112,559 | | | | — | | | | — | | | | 112,559 | |
| Total | | $ | 947,196 | | | $ | 201,290 | | | $ | 88 | | | $ | 1,148,574 | |
Refer to the next page for footnote.
| 272 | American Funds Insurance Series |
| | | Other investments† | |
| | | Level 1 | | | Level 2 | | | Level 3 | | | Total | |
| Assets: | | | | | | | | | | | | |
| Unrealized appreciation on futures contracts | | $ | 15 | | | $ | — | | | $ | — | | | $ | 15 | |
| Unrealized appreciation on centrally cleared interest rate swaps | | | — | | | | 1,757 | | | | — | | | | 1,757 | |
| Liabilities: | | | | | | | | | | | | | | | | |
| Unrealized depreciation on futures contracts | | | (1,042 | ) | | | — | | | | — | | | | (1,042 | ) |
| Unrealized depreciation on centrally cleared credit default swaps | | | — | | | | (359 | ) | | | — | | | | (359 | ) |
| Total | | $ | (1,027 | ) | | $ | 1,398 | | | $ | — | | | $ | 371 | |
| * | Amount less than one thousand. |
| † | Futures contracts, interest rate swaps and credit default swaps are not included in the fund’s investment portfolio. |
Asset Allocation Fund
| | | Investment securities | |
| | | Level 1 | | | Level 2 | | | Level 3 | | | Total | |
| Assets: | | | | | | | | | | | | |
| Common stocks: | | | | | | | | | | | | |
| Health care | | $ | 2,907,291 | | | $ | — | | | $ | 18,782 | | | $ | 2,926,073 | |
| Information technology | | | 2,577,874 | | | | — | | | | — | | | | 2,577,874 | |
| Financials | | | 2,398,345 | | | | — | | | | 2,061 | | | | 2,400,406 | |
| Consumer discretionary | | | 1,953,699 | | | | — | | | | — | | | | 1,953,699 | |
| Consumer staples | | | 1,478,465 | | | | — | | | | — | | | | 1,478,465 | |
| Industrials | | | 1,406,108 | | | | — | | | | — | | | | 1,406,108 | |
| Communication services | | | 1,270,617 | | | | — | | | | — | | | | 1,270,617 | |
| Materials | | | 1,041,138 | | | | — | | | | — | | | | 1,041,138 | |
| Energy | | | 856,580 | | | | — | | | | 46 | | | | 856,626 | |
| Real estate | | | 561,840 | | | | — | | | | — | | | | 561,840 | |
| Utilities | | | 228,577 | | | | — | | | | — | | | | 228,577 | |
| Preferred securities | | | — | | | | — | | | | 144 | | | | 144 | |
| Rights & warrants | | | — | | | | — | | | | — | * | | | — | * |
| Convertible stocks | | | — | | | | — | | | | 50,000 | | | | 50,000 | |
| Investment funds | | | 1,393,740 | | | | — | | | | — | | | | 1,393,740 | |
| Bonds, notes & other debt instruments: | | | | | | | | | | | | | | | | |
| U.S. Treasury bonds & notes | | | — | | | | 2,010,085 | | | | — | | | | 2,010,085 | |
| Mortgage-backed obligations | | | — | | | | 1,677,030 | | | | — | | | | 1,677,030 | |
| Corporate bonds, notes & loans | | | — | | | | 1,491,998 | | | | 6,038 | | | | 1,498,036 | |
| Asset-backed obligations | | | — | | | | 358,128 | | | | 5,755 | | | | 363,883 | |
| Bonds & notes of governments & government agencies | | | | | | | | | | | | | | | | |
| outside the U.S. | | | — | | | | 38,798 | | | | — | | | | 38,798 | |
| Municipals | | | — | | | | 37,718 | | | | — | | | | 37,718 | |
| Short-term securities | | | 2,396,242 | | | | — | | | | — | | | | 2,396,242 | |
| Total | | $ | 20,470,516 | | | $ | 5,613,757 | | | $ | 82,826 | | | $ | 26,167,099 | |
| | | Other investments† | |
| | | Level 1 | | | Level 2 | | | Level 3 | | | Total | |
| Assets: | | | | | | | | | | | | |
| Unrealized appreciation on futures contracts | | $ | 7,611 | | | $ | — | | | $ | — | | | $ | 7,611 | |
| Unrealized appreciation on centrally cleared credit default swaps | | | — | | | | 1,848 | | | | — | | | | 1,848 | |
| Liabilities: | | | | | | | | | | | | | | | | |
| Unrealized depreciation on futures contracts | | | (3,501 | ) | | | — | | | | — | | | | (3,501 | ) |
| Total | | $ | 4,110 | | | $ | 1,848 | | | $ | — | | | $ | 5,958 | |
| * | Amount less than one thousand. |
| † | Futures contracts and credit default swaps are not included in the fund’s investment portfolio. |
| American Funds Insurance Series | 273 |
American Funds Global Balanced Fund
| | | Investment securities | |
| | | Level 1 | | | Level 2 | | | Level 3 | | | Total | |
| Assets: | | | | | | | | | | | | |
| Common stocks: | | | | | | | | | | | | |
| Financials | | $ | 34,013 | | | $ | — | | | $ | — | | | $ | 34,013 | |
| Health care | | | 29,389 | | | | — | | | | — | | | | 29,389 | |
| Industrials | | | 29,122 | | | | — | | | | — | | | | 29,122 | |
| Information technology | | | 27,928 | | | | — | | | | — | | | | 27,928 | |
| Utilities | | | 20,693 | | | | — | | | | — | | | | 20,693 | |
| Consumer staples | | | 19,214 | | | | — | | | | — | | | | 19,214 | |
| Communication services | | | 13,797 | | | | — | | | | — | | | | 13,797 | |
| Energy | | | 13,157 | | | | — | | | | — | | | | 13,157 | |
| Materials | | | 13,056 | | | | — | | | | — | | | | 13,056 | |
| Consumer discretionary | | | 9,370 | | | | — | | | | — | | | | 9,370 | |
| Real estate | | | 7,949 | | | | — | | | | — | | | | 7,949 | |
| Preferred securities | | | 1,412 | | | | — | | | | — | | | | 1,412 | |
| Convertible stocks | | | 397 | | | | — | | | | — | | | | 397 | |
| Bonds, notes & other debt instruments: | | | | | | | | | | | | | | | | |
| U.S. Treasury bonds & notes | | | — | | | | 54,288 | | | | — | | | | 54,288 | |
| Bonds & notes of governments & government agencies outside the U.S. | | | — | | | | 52,832 | | | | — | | | | 52,832 | |
| Corporate bonds, notes & loans | | | — | | | | 20,236 | | | | — | | | | 20,236 | |
| Mortgage-backed obligations | | | — | | | | 8,956 | | | | — | | | | 8,956 | |
| Asset-backed obligations | | | — | | | | 1,627 | | | | — | | | | 1,627 | |
| Municipals | | | — | | | | 143 | | | | — | | | | 143 | |
| Short-term securities | | | 15,272 | | | | 8,995 | | | | — | | | | 24,267 | |
| Total | | $ | 234,769 | | | $ | 147,077 | | | $ | — | | | $ | 381,846 | |
| | | Other investments* | |
| | | Level 1 | | | Level 2 | | | Level 3 | | | Total | |
| Assets: | | | | | | | | | | | | |
| Unrealized appreciation on futures contracts | | $ | 48 | | | $ | — | | | $ | — | | | $ | 48 | |
| Unrealized appreciation on open forward currency contracts | | | — | | | | 103 | | | | — | | | | 103 | |
| Unrealized appreciation on centrally cleared interest rate swaps | | | — | | | | 7 | | | | — | | | | 7 | |
| Liabilities: | | | | | | | | | | | | | | | | |
| Unrealized depreciation on futures contracts | | | (82 | ) | | | — | | | | — | | | | (82 | ) |
| Unrealized depreciation on open forward currency contracts | | | — | | | | (459 | ) | | | — | | | | (459 | ) |
| Unrealized depreciation on centrally cleared interest rate swaps | | | — | | | | (654 | ) | | | — | | | | (654 | ) |
| Unrealized depreciation on centrally cleared credit default swaps | | | — | | | | (80 | ) | | | — | | | | (80 | ) |
| Total | | $ | (34 | ) | | $ | (1,083 | ) | | $ | — | | | $ | (1,117 | ) |
| * | Futures contracts, forward currency contracts, interest rate swaps and credit default swaps are not included in the fund’s investment portfolio. |
The Bond Fund of America
| | | Investment securities | |
| | | Level 1 | | | Level 2 | | | Level 3 | | | Total | |
| Assets: | | | | | | | | | | | | |
| Bonds, notes & other debt instruments: | | | | | | | | | | | | |
| U.S. Treasury bonds & notes | | $ | — | | | $ | 3,779,119 | | | $ | — | | | $ | 3,779,119 | |
| Corporate bonds, notes & loans | | | — | | | | 3,680,622 | | | | — | | | | 3,680,622 | |
| Mortgage-backed obligations | | | — | | | | 2,445,028 | | | | 1,490 | | | | 2,446,518 | |
| Asset-backed obligations | | | — | | | | 477,724 | | | | 8,337 | | | | 486,061 | |
| Municipals | | | — | | | | 178,538 | | | | — | | | | 178,538 | |
| Bonds & notes of governments & government agencies outside the U.S. | | | — | | | | 138,829 | | | | — | | | | 138,829 | |
| Federal agency bonds & notes | | | — | | | | 11,502 | | | | — | | | | 11,502 | |
| Short-term securities | | | 2,002,964 | | | | — | | | | — | | | | 2,002,964 | |
| Total | | $ | 2,002,964 | | | $ | 10,711,362 | | | $ | 9,827 | | | $ | 12,724,153 | |
| 274 | American Funds Insurance Series |
| | | Other investments* | |
| | | Level 1 | | | Level 2 | | | Level 3 | | | Total | |
| Assets: | | | | | | | | | | | | | | | | |
| Unrealized appreciation on futures contracts | | $ | 11,018 | | | $ | — | | | $ | — | | | $ | 11,018 | |
| Unrealized appreciation on open forward currency contracts | | | — | | | | 293 | | | | — | | | | 293 | |
| Unrealized appreciation on centrally cleared interest rate swaps | | | — | | | | 13,225 | | | | — | | | | 13,225 | |
| Unrealized appreciation on centrally cleared credit default swaps | | | — | | | | 8,754 | | | | — | | | | 8,754 | |
| Liabilities: | | | | | | | | | | | | | | | | |
| Unrealized depreciation on futures contracts | | | (25,935 | ) | | | — | | | | — | | | | (25,935 | ) |
| Unrealized depreciation on open forward currency contracts | | | — | | | | (470 | ) | | | — | | | | (470 | ) |
| Unrealized depreciation on centrally cleared interest rate swaps | | | — | | | | (2,838 | ) | | | — | | | | (2,838 | ) |
| Total | | $ | (14,917 | ) | | $ | 18,964 | | | $ | — | | | $ | 4,047 | |
| * | Futures contracts, forward currency contracts, interest rate swaps and credit default swaps are not included in the fund’s investment portfolio. |
Capital World Bond Fund
| | | Investment securities | |
| | | Level 1 | | | Level 2 | | | Level 3 | | | Total | |
| Assets: | | | | | | | | | | | | | | | | |
| Bonds, notes & other debt instruments: | | | | | | | | | | | | | | | | |
| Euros | | $ | — | | | $ | 269,416 | | | $ | — | | | $ | 269,416 | |
| Japanese yen | | | — | | | | 134,479 | | | | — | | | | 134,479 | |
| Chinese yuan renminbi | | | — | | | | 52,346 | | | | — | | | | 52,346 | |
| British pounds | | | — | | | | 50,066 | | | | — | | | | 50,066 | |
| Canadian dollars | | | — | | | | 38,056 | | | | — | | | | 38,056 | |
| Mexican pesos | | | — | | | | 36,030 | | | | — | | | | 36,030 | |
| Danish kroner | | | — | | | | 33,493 | | | | — | | | | 33,493 | |
| Australian dollars | | | — | | | | 32,740 | | | | — | | | | 32,740 | |
| Colombian pesos | | | — | | | | 15,808 | | | | — | | | | 15,808 | |
| Indonesian rupiah | | | — | | | | 10,794 | | | | — | | | | 10,794 | |
| Malaysian ringgits | | | — | | | | 8,811 | | | | — | | | | 8,811 | |
| Brazilian reais | | | — | | | | 8,573 | | | | — | | | | 8,573 | |
| Chilean pesos | | | — | | | | 7,667 | | | | — | | | | 7,667 | |
| South Korean won | | | — | | | | 7,495 | | | | — | | | | 7,495 | |
| Polish zloty | | | — | | | | 5,053 | | | | — | | | | 5,053 | |
| Russian rubles | | | — | | | | 4,830 | | | | — | | | | 4,830 | |
| South African rand | | | — | | | | 3,073 | | | | — | | | | 3,073 | |
| Peruvian nuevos soles | | | — | | | | 1,382 | | | | — | | | | 1,382 | |
| Indian rupees | | | — | | | | 1,148 | | | | — | | | | 1,148 | |
| Hungarian forints | | | — | | | | 1,032 | | | | — | | | | 1,032 | |
| Romanian leu | | | — | | | | 962 | | | | — | | | | 962 | |
| Ukrainian hryvnia | | | — | | | | 634 | | | | — | | | | 634 | |
| Norwegian kroner | | | — | | | | 620 | | | | — | | | | 620 | |
| U.S. dollars | | | — | | | | 793,574 | | | | 637 | | | | 794,211 | |
| Preferred securities | | | — | | | | — | | | | 15 | | | | 15 | |
| Common stocks | | | 289 | | | | — | | | | 3 | | | | 292 | |
| Short-term securities | | | 100,175 | | | | — | | | | — | | | | 100,175 | |
| Total | | $ | 100,464 | | | $ | 1,518,082 | | | $ | 655 | | | $ | 1,619,201 | |
| American Funds Insurance Series | 275 |
| | | Other investments* | |
| | | Level 1 | | | Level 2 | | | Level 3 | | | Total | |
| Assets: | | | | | | | | | | | | | | | | |
| Unrealized appreciation on futures contracts | | $ | 933 | | | $ | — | | | $ | — | | | $ | 933 | |
| Unrealized appreciation on open forward currency contracts | | | — | | | | 6,655 | | | | — | | | | 6,655 | |
| Unrealized appreciation on centrally cleared interest rate swaps | | | — | | | | 33 | | | | — | | | | 33 | |
| Unrealized appreciation on centrally cleared credit default swaps | | | — | | | | 3,014 | | | | — | | | | 3,014 | |
| Liabilities: | | | | | | | | | | | | | | | | |
| Unrealized depreciation on futures contracts | | | (2,216 | ) | | | — | | | | — | | | | (2,216 | ) |
| Unrealized depreciation on open forward currency contracts | | | — | | | | (4,636 | ) | | | — | | | | (4,636 | ) |
| Unrealized depreciation on centrally cleared interest rate swaps | | | — | | | | (9,273 | ) | | | — | | | | (9,273 | ) |
| Total | | $ | (1,283 | ) | | $ | (4,207 | ) | | $ | — | | | $ | (5,490 | ) |
| * | Futures contracts, forward currency contracts, interest rate swaps and credit default swaps are not included in the fund’s investment portfolio. |
American High-Income Trust
| | | Investment securities | |
| | | Level 1 | | | Level 2 | | | Level 3 | | | Total | |
| Assets: | | | | | | | | | | | | | | | | |
| Bonds, notes & other debt instruments: | | | | | | | | | | | | | | | | |
| Corporate bonds, notes & loans | | $ | — | | | $ | 763,380 | | | $ | 3,830 | | | $ | 767,210 | |
| Mortgage-backed obligations | | | — | | | | — | | | | 631 | | | | 631 | |
| Asset-backed obligations | | | — | | | | 129 | | | | — | | | | 129 | |
| Convertible bonds & notes | | | — | | | | 430 | | | | 79 | | | | 509 | |
| Convertible stocks | | | 320 | | | | 473 | | | | — | | | | 793 | |
| Common stocks | | | 11,236 | | | | 1,794 | | | | 26,150 | | | | 39,180 | |
| Preferred securities | | | — | | | | 2,295 | | | | 326 | | | | 2,621 | |
| Rights & warrants | | | 316 | | | | 1,293 | | | | 7 | | | | 1,616 | |
| Short-term securities | | | 22,060 | | | | — | | | | — | | | | 22,060 | |
| Total | | $ | 33,932 | | | $ | 769,794 | | | $ | 31,023 | | | $ | 834,749 | |
| | | Other investments1 | |
| | | Level 1 | | | Level 2 | | | Level 3 | | | Total | |
| Assets: | | | | | | | | | | | | | | | | |
| Unrealized appreciation on futures contracts | | $ | 73 | | | $ | — | | | $ | — | | | $ | 73 | |
| Unrealized appreciation on centrally cleared credit default swaps | | | — | | | | 421 | | | | — | | | | 421 | |
| Total | | $ | 73 | | | $ | 421 | | | $ | — | | | $ | 494 | |
| 1 | Futures contracts and credit default swaps are not included in the investment portfolio. |
The following table reconciles the valuation of the fund’s Level 3 investment securities and related transactions for the six months ended June 30, 2022 (dollars in thousands):
| | | Beginning
value at
1/1/2022 | | | Transfers
into
Level 32 | | | Purchases | | | Sales | | | Net
realized
gain3 | | |
Unrealized
depreciation3 | | | Transfers
out of
Level 32 | | | Ending
value at
6/30/2022 | |
| Investment securities | | $ | 40,411 | | | $ | — | | | $ | 938 | | | $ | (11,070 | ) | | $ | 879 | | | $ | (135 | ) | | $ | — | | | $ | 31,023 | |
| Net unrealized appreciation during the period on Level 3 investment securities held at June 30, 2022 | | | $ | 1,383 | |
| 2 | Transfers into or out of Level 3 are based on the beginning market value of the quarter in which they occurred. These transfers are the result of changes in the availability of pricing sources and/or in the observability of significant inputs used in valuing the securities. |
| 3 | Net realized gain and unrealized depreciation are included in the related amounts on investments in the fund’s statement of operations. |
| 276 | American Funds Insurance Series |
Unobservable inputs — Valuation of the fund’s Level 3 securities is based on significant unobservable inputs that reflect the investment adviser’s determination of assumptions that market participants might reasonably use in valuing the securities. The following table provides additional information used by the fund’s investment adviser to fair value the fund’s Level 3 securities (dollars in thousands):
| | | Value at
6/30/2022 | | Valuation
techniques | | Unobservable
inputs | | Range
(if applicable) | | Weighted
average* | | Impact to
valuation from
an increase in
input† |
| Bonds, notes & other debt instruments | | $ | 4,461 | | Estimated recovery value | | Expected proceeds | | N/A | | N/A | | N/A |
| | | Vendor price | | N/A | | N/A | | N/A |
| | Yield analysis | | Yield | | 11.7% - 13.4% | | 12.7% | | Decrease |
| | Transaction price | | N/A | | N/A | | N/A | | N/A |
| | | Net adjustment based on market
comparables movement (decrease) | | 10% | | 10% | | Decrease |
Convertible bonds & notes | | | 79 | | Transaction price | | N/A | | N/A | | N/A | | N/A |
| Common stocks | | | 26,150 | | Estimated recovery value | | N/A | | N/A | | N/A | | N/A |
| | | Exchange terms | | N/A | | N/A | | N/A |
| | | Risk discount | | 90% | | 90% | | Decrease |
| | | Net adjustment based on market comparables (decrease) | | 20% | | 20% | | Decrease |
| | Market comparable companies | | EV/EBITDA multiple | | 2.0x - 4.8x | | 3.1x | | Increase |
| | | EV/EBITDA less CapEx multiple | | 10.5x | | 10.5x | | Increase |
| | | DLOM | | 18% | | 18% | | Decrease |
| | Recent market information | | Broker quote | | N/A | | N/A | | N/A |
| | | Quoted price | | N/A | | N/A | | N/A |
| | | Corporate action terms | | N/A | | N/A | | N/A |
| | | DLOM | | 15% | | 15% | | Decrease |
| Preferred securities | | | 326 | | Market comparable companies | | EV/EBITDA multiple | | 3.5x | | 3.5x | | Increase |
| | | DLOM | | 30% | | 30% | | Decrease |
| Rights & warrants | | | 7 | | Recent market information | | Broker quote | | N/A | | N/A | | N/A |
| Total | | $ | 31,023 | | | | | | | | | | |
| * | Weighted average is by relative fair value. |
| † | This column represents the directional change in fair value of the Level 3 securities that would result in an increase from the corresponding input. A decrease to the unobservable input would have the opposite effect. Significant increases and decreases in these inputs in isolation could result in significantly higher or lower fair value measurements. |
Key to abbreviations
CapEx = Capital expenditures
DLOM = Discount for lack of marketability
EBITDA = Earnings before income taxes, depreciation and amortization
EV = Enterprise value
| American Funds Insurance Series | 277 |
American Funds Mortgage Fund
| | | Investment securities | |
| | | Level 1 | | | Level 2 | | | Level 3 | | | Total | |
| Assets: | | | | | | | | | | | | | | | | |
| Bonds, notes & other debt instruments: | | | | | | | | | | | | | | | | |
| Mortgage-backed obligations | | $ | — | | | $ | 68,996 | | | $ | — | | | $ | 68,996 | |
| U.S. Treasury bonds & notes | | | — | | | | 14,204 | | | | — | | | | 14,204 | |
| Asset-backed obligations | | | — | | | | 4,040 | | | | — | | | | 4,040 | |
| Bonds & notes of governments & government agencies outside the U.S. | | | — | | | | 515 | | | | — | | | | 515 | |
| Federal agency bonds & notes | | | — | | | | 248 | | | | — | | | | 248 | |
| Short-term securities | | | — | | | | 50,370 | | | | — | | | | 50,370 | |
| Total | | $ | — | | | $ | 138,373 | | | $ | — | | | $ | 138,373 | |
| | | Other investments* | |
| | | Level 1 | | | Level 2 | | | Level 3 | | | Total | |
| Assets: | | | | | | | | | | | | | | | | |
| Unrealized appreciation on futures contracts | | $ | 40 | | | $ | — | | | $ | — | | | $ | 40 | |
| Unrealized appreciation on centrally cleared interest rate swaps | | | — | | | | 670 | | | | — | | | | 670 | |
| Liabilities: | | | | | | | | | | | | | | | | |
| Unrealized depreciation on futures contracts | | | (134 | ) | | | — | | | | — | | | | (134 | ) |
| Total | | $ | (94 | ) | | $ | 670 | | | $ | — | | | $ | 576 | |
| * | Futures contracts and interest rate swaps are not included in the fund’s investment portfolio. |
Ultra-Short Bond Fund
At June 30, 2022, all of the fund’s investment securities were classified as Level 2.
U.S. Government Securities Fund
| | | Investment securities | |
| | | Level 1 | | | Level 2 | | | Level 3 | | | Total | |
| Assets: | | | | | | | | | | | | | | | | |
| Bonds, notes & other debt instruments: | | | | | | | | | | | | | | | | |
| Mortgage-backed obligations | | $ | — | | | $ | 761,452 | | | $ | — | | | $ | 761,452 | |
| U.S. Treasury bonds & notes | | | — | | | | 610,788 | | | | — | | | | 610,788 | |
| Federal agency bonds & notes | | | — | | | | 123,778 | | | | — | | | | 123,778 | |
| Short-term securities | | | — | | | | 717,264 | | | | — | | | | 717,264 | |
| Total | | $ | — | | | $ | 2,213,282 | | | $ | — | | | $ | 2,213,282 | |
| | | Other investments* | |
| | | Level 1 | | | Level 2 | | | Level 3 | | | Total | |
| Assets: | | | | | | | | | | | | | | | | |
| Unrealized appreciation on futures contracts | | $ | 11,906 | | | $ | — | | | $ | — | | | $ | 11,906 | |
| Unrealized appreciation on centrally cleared interest rate swaps | | | — | | | | 23,368 | | | | — | | | | 23,368 | |
| Liabilities: | | | | | | | | | | | | | | | | |
| Unrealized depreciation on futures contracts | | | (17,662 | ) | | | — | | | | — | | | | (17,662 | ) |
| Unrealized depreciation on centrally cleared interest rate swaps | | | — | | | | (16,563 | ) | | | — | | | | (16,563 | ) |
| Total | | $ | (5,756 | ) | | $ | 6,805 | | | $ | — | | | $ | 1,049 | |
| * | Futures contracts and interest rate swaps are not included in the fund’s investment portfolio. |
Managed Risk Growth Fund
At June 30, 2022, all of the fund’s investments were classified as Level 1.
Managed Risk International Fund
At June 30, 2022, all of the fund’s investments were classified as Level 1.
| 278 | American Funds Insurance Series |
Managed Risk Washington Mutual Investors Fund
At June 30, 2022, all of the fund’s investments were classified as Level 1.
Managed Risk Growth-Income Fund
At June 30, 2022, all of the fund’s investments were classified as Level 1.
Managed Risk Asset Allocation Fund
At June 30, 2022, all of the fund’s investments were classified as Level 1.
4. Risk factors
Investing in the funds may involve certain risks including, but not limited to, those described below.
Market conditions — The prices of, and the income generated by, the common stocks, bonds and other securities held by a fund may decline — sometimes rapidly or unpredictably — due to various factors, including events or conditions affecting the general economy or particular industries; overall market changes; local, regional or global political, social or economic instability; governmental, governmental agency or central bank responses to economic conditions; and currency exchange rate, interest rate and commodity price fluctuations. These risks may be heightened in the case of smaller capitalization stocks.
Economies and financial markets throughout the world are highly interconnected. Economic, financial or political events, trading and tariff arrangements, wars, terrorism, cybersecurity events, natural disasters, public health emergencies (such as the spread of infectious disease) and other circumstances in one country or region, including actions taken by governmental or quasi-governmental authorities in response to any of the foregoing, could have impacts on global economies or markets. As a result, whether or not a fund invests in securities of issuers located in or with significant exposure to the countries affected, the value and liquidity of a fund’s investments may be negatively affected by developments in other countries and regions.
Issuer risks — The prices of, and the income generated by, securities held by a fund may decline in response to various factors directly related to the issuers of such securities, including reduced demand for an issuer’s goods or services, poor management performance, major litigation, investigations or other controversies related to the issuer, changes in government regulations affecting the issuer or its competitive environment and strategic initiatives such as mergers, acquisitions or dispositions and the market response to any such initiatives.
Investing in income-oriented stocks — The value of a fund’s securities and income provided by a fund may be reduced by changes in the dividend policies of, and the capital resources available for dividend payments at, the companies in which the fund invests.
Investing in growth-oriented stocks — Growth-oriented common stocks and other equity-type securities (such as preferred stocks, convertible preferred stocks and convertible bonds) may involve larger price swings and greater potential for loss than other types of investments. These risks may be even greater in the case of smaller capitalization stocks.
Investing in small companies — Investing in smaller companies may pose additional risks. For example, it is often more difficult to value or dispose of small company stocks and more difficult to obtain information about smaller companies than about larger companies. Furthermore, smaller companies often have limited product lines, operating histories, markets and/or financial resources, may be dependent on one or a few key persons for management, and can be more susceptible to losses. Moreover, the prices of their stocks may be more volatile than stocks of larger, more established companies, particularly during times of market turmoil.
Investing outside the U.S. — Securities of issuers domiciled outside the U.S., or with significant operations or revenues outside the U.S., may lose value because of adverse political, social, economic or market developments (including social instability, regional conflicts, terrorism and war) in the countries or regions in which the issuers operate or generate revenue. These securities may also lose value due to changes in foreign currency exchange rates against the U.S. dollar and/or currencies of other countries. Issuers of these securities may be more susceptible to actions of foreign governments, such as nationalization, currency blockage or the imposition of price controls or punitive taxes, each of which could adversely impact the value of these securities. Securities markets in certain countries may be more volatile and/or less liquid than those in the U.S. Investments outside the U.S. may also be subject to different accounting and auditing practices and standards and different regulatory, legal and reporting requirements, and may be more difficult to value, than those in the U.S. In addition, the value of investments outside the U.S. may be reduced by foreign taxes, including foreign
| American Funds Insurance Series | 279 |
withholding taxes on interest and dividends. Further, there may be increased risks of delayed settlement of securities purchased or sold by the fund. The risks of investing outside the U.S. may be heightened in connection with investments in emerging markets.
Investing in developing countries — Investing in countries with developing economies and/or markets may involve risks in addition to and greater than those generally associated with investing in developed countries. For instance, developing countries tend to have less developed political, economic and legal systems and accounting and auditing practices and standards than those in developed countries. Accordingly, the governments of these countries may be less stable and more likely to intervene in the market economy, for example, by imposing capital controls, nationalizing a company or industry, placing restrictions on foreign ownership and on withdrawing sale proceeds of securities from the country, and/or imposing punitive taxes that could adversely affect the prices of securities. Information regarding issuers in developing countries may be limited, incomplete or inaccurate, and there may be fewer rights and remedies available to the fund and its shareholders. In addition, the economies of these countries may be dependent on relatively few industries, may have limited access to capital and may be more susceptible to changes in local and global trade conditions and downturns in the world economy. Securities markets in these countries can also be relatively small and have substantially lower trading volumes. As a result, securities issued in these countries may be more volatile and less liquid, and may be more difficult to value, than securities issued in countries with more developed economies and/or markets. Less certainty with respect to security valuations may lead to additional challenges and risks in calculating a fund’s net asset value. Additionally, developing countries are more likely to experience problems with the clearing and settling of trades and the holding of securities by banks, agents and depositories that are less established than those in developed countries.
Investing in emerging markets — Investing in emerging markets may involve risks in addition to and greater than those generally associated with investing in the securities markets of developed countries. For instance, emerging market countries tend to have less developed political, economic and legal systems and accounting and auditing practices and standards than those in developed countries. Accordingly, the governments of these countries may be less stable and more likely to intervene in the market economy, for example, by imposing capital controls, nationalizing a company or industry, placing restrictions on foreign ownership and on withdrawing sale proceeds of securities from the country, and/or imposing punitive taxes that could adversely affect the prices of securities. Information regarding issuers in emerging markets may be limited, incomplete or inaccurate, and there may be fewer rights and remedies available to a fund and its shareholders. In addition, the economies of these countries may be dependent on relatively few industries, may have limited access to capital and may be more susceptible to changes in local and global trade conditions and downturns in the world economy. Securities markets in these countries can also be relatively small and have substantially lower trading volumes. As a result, securities issued in these countries may be more volatile and less liquid, and may be more difficult to value, than securities issued in countries with more developed economies and/or markets. Less certainty with respect to security valuations may lead to additional challenges and risks in calculating a fund’s net asset value. Additionally, emerging markets are more likely to experience problems with the clearing and settling of trades and the holding of securities by banks, agents and depositories that are less established than those in developed countries.
Investing in debt instruments — The prices of, and the income generated by, bonds and other debt securities held by a fund may be affected by factors such as the interest rates, maturities and credit ratings of these securities.
Rising interest rates will generally cause the prices of bonds and other debt securities to fall. A general rise in interest rates may cause investors to sell debt securities on a large scale, which could also adversely affect the price and liquidity of debt securities and could also result in increased redemptions from a fund. Falling interest rates may cause an issuer to redeem, call or refinance a debt security before its stated maturity, which may result in a fund failing to recoup the full amount of its initial investment and having to reinvest the proceeds in lower yielding securities. Longer maturity debt securities generally have greater sensitivity to changes in interest rates and may be subject to greater price fluctuations than shorter maturity debt securities.
Bonds and other debt securities are also subject to credit risk, which is the possibility that the credit strength of an issuer or guarantor will weaken or be perceived to be weaker, and/or an issuer of a debt security will fail to make timely payments of principal or interest and the security will go into default. A downgrade or default affecting any of a fund’s securities could cause the value of a fund’s shares to decrease. Lower quality debt securities generally have higher rates of interest and may be subject to greater price fluctuations than higher quality debt securities. Credit risk is gauged, in part, by the credit ratings of the debt securities in which a fund invests. However, ratings are only the opinions of the rating agencies issuing them and are not guarantees as to credit quality or an evaluation of market risk. The fund’s investment adviser relies on its own credit analysts to research issuers and issues in seeking to assess credit and default risks.
| 280 | American Funds Insurance Series |
Investing in lower rated debt instruments — Lower rated bonds and other lower rated debt securities generally have higher rates of interest and involve greater risk of default or price declines due to changes in the issuer’s creditworthiness than those of higher quality debt securities. The market prices of these securities may fluctuate more than the prices of higher quality debt securities and may decline significantly in periods of general economic difficulty. These risks may be increased with respect to investments in junk bonds.
Investing in derivatives — The use of derivatives involves a variety of risks, which may be different from, or greater than, the risks associated with investing in traditional securities, such as stocks and bonds. Changes in the value of a derivative may not correlate perfectly with, and may be more sensitive to market events than, the underlying asset, rate or index, and a derivative instrument may expose a fund to losses in excess of its initial investment. Derivatives may be difficult to value, difficult for a fund to buy or sell at an opportune time or price and difficult, or even impossible, to terminate or otherwise offset. A fund’s use of derivatives may result in losses to the fund, and investing in derivatives may reduce a fund’s returns and increase a fund’s price volatility. A fund’s counterparty to a derivative transaction (including, if applicable, the fund’s clearing broker, the derivatives exchange or the clearinghouse) may be unable or unwilling to honor its financial obligations in respect of the transaction. In certain cases, the fund may be hindered or delayed in exercising remedies against or closing out derivative instruments with a counterparty, which may result in additional losses.
Currency — The prices of, and the income generated by, many debt securities held by a fund may also be affected by changes in relative currency values. If the U.S. dollar appreciates against foreign currencies, the value in U.S. dollars of a fund’s securities denominated in such currencies would generally fall and vice versa.
Investing in mortgage-related and other asset-backed securities — Mortgage-related securities, such as mortgage-backed securities, and other asset-backed securities, include debt obligations that represent interests in pools of mortgages or other income-bearing assets, such as residential mortgage loans, home equity loans, mortgages on commercial buildings, consumer loans and equipment leases. While such securities are subject to the risks associated with investments in debt instruments generally (for example, credit, extension and interest rate risks), they are also subject to other and different risks. Mortgage-backed and other asset-backed securities are subject to changes in the payment patterns of borrowers of the underlying debt, potentially increasing the volatility of the securities and a fund’s net asset value. When interest rates fall, borrowers are more likely to refinance or prepay their debt before its stated maturity. This may result in a fund having to reinvest the proceeds in lower yielding securities, effectively reducing a fund’s income. Conversely, if interest rates rise and borrowers repay their debt more slowly than expected, the time in which the mortgage-backed and other asset-backed securities are paid off could be extended, reducing a fund’s cash available for reinvestment in higher yielding securities. Mortgage-backed securities are also subject to the risk that underlying borrowers will be unable to meet their obligations and the value of property that secures the mortgages may decline in value and be insufficient, upon foreclosure, to repay the associated loans. Investments in asset-backed securities are subject to similar risks.
Investing in future delivery contracts — A fund may enter into contracts, such as to-be-announced contracts and mortgage dollar rolls, that involve a fund selling mortgage-related securities and simultaneously contracting to repurchase similar securities for delivery at a future date at a predetermined price. This can increase a fund’s market exposure, and the market price of the securities that the fund contracts to repurchase could drop below their purchase price. While a fund can preserve and generate capital through the use of such contracts by, for example, realizing the difference between the sale price and the future purchase price, the income generated by the fund may be reduced by engaging in such transactions. In addition, these transactions increase the turnover rate of a fund.
Investing in inflation-linked bonds — The values of inflation-linked bonds generally fluctuate in response to changes in real interest rates — i.e., rates of interest after factoring in inflation. A rise in real interest rates may cause the prices of inflation-linked securities to fall, while a decline in real interest rates may cause the prices to increase. Inflation-linked bonds may experience greater losses than other debt securities with similar durations when real interest rates rise faster than nominal interest rates. There can be no assurance that the value of an inflation-linked security will be directly correlated to changes in interest rates; for example, if interest rates rise for reasons other than inflation, the increase may not be reflected in the security’s inflation measure.
Investing in inflation-linked bonds may also reduce a fund’s distributable income during periods of deflation. If prices for goods and services decline throughout the economy, the principal and income on inflation-linked securities may decline and result in losses to a fund.
Investing in securities backed by the U.S. government — Securities backed by the U.S. Treasury or the full faith and credit of the U.S. government are guaranteed only as to the timely payment of interest and principal when held to maturity. Accordingly, the current market values for these securities will fluctuate with changes in interest rates and the credit rating of the U.S. government. Securities issued by U.S. government-sponsored entities and federal agencies and instrumentalities that are not backed by the full faith and credit of the U.S. government are neither issued nor guaranteed by the U.S. government.
| American Funds Insurance Series | 281 |
Investing in repurchase agreements — Upon entering into a repurchase agreement, a fund purchases a security from a bank or broker-dealer, which simultaneously commits to repurchase the security within a specified time at the fund’s cost with interest. The security purchased by the fund constitutes collateral for the seller’s repurchase obligation. If the party agreeing to repurchase should default, the fund may seek to sell the security it holds as collateral. The fund may incur a loss if the value of the collateral securing the repurchase obligation falls below the repurchase price. The fund may also incur disposition costs and encounter procedural delays in connection with liquidating the collateral.
Interest rate risk — The values and liquidity of the securities held by a fund may be affected by changing interest rates. For example, the values of these securities may decline when interest rates rise and increase when interest rates fall. Longer maturity debt securities generally have greater sensitivity to changes in interest rates and may be subject to greater price fluctuations than shorter maturity debt securities. A fund may invest in variable and floating rate securities. When a fund holds variable or floating rate securities, a decrease in market interest rates will adversely affect the income received from such securities and the net asset value of a fund’s shares. Although the values of such securities are generally less sensitive to interest rate changes than those of other debt securities, the value of variable and floating rate securities may decline if their interest rates do not rise as quickly, or as much, as market interest rates. Conversely, floating rate securities will not generally increase in value if interest rates decline. During periods of extremely low short-term interest rates, a fund may not be able to maintain a positive yield and, given the current low interest rate environment, risks associated with rising rates are currently heightened.
Credit and liquidity support — Changes in the credit quality of banks and financial institutions providing credit and liquidity support features with respect to securities held by a fund could cause the values of these securities to decline.
Asset allocation — A fund’s percentage allocation to equity securities, debt securities and money market instruments could cause the fund to underperform relative to relevant benchmarks and other funds with similar investment objectives.
Nondiversification risk — As nondiversified funds, certain funds have the ability to invest a larger percentage of their assets in the securities of a smaller number of issuers than diversified funds. Although the funds do not intend to limit their investments to the securities of a small number of issuers, if they were to do so, poor performance by a single large holding could adversely impact the funds’ investment results more than if the funds were invested in a larger number of issuers.
Liquidity risk — Certain fund holdings may be or may become difficult or impossible to sell, particularly during times of market turmoil. Liquidity may be impacted by the lack of an active market for a holding, legal or contractual restrictions on resale, or the reduced number and capacity of market participants to make a market in such holding. Market prices for less liquid or illiquid holdings may be volatile, and reduced liquidity may have an adverse impact on the market price of such holdings. Additionally, the sale of less liquid or illiquid holdings may involve substantial delays (including delays in settlement) and additional costs and the fund may be unable to sell such holdings when necessary to meet its liquidity needs or may be forced to sell at a loss.
Management — The investment adviser to the funds actively manages the funds’ investments. Consequently, the funds are subject to the risk that the methods and analyses, including models, tools and data, employed by the investment adviser in this process may be flawed or incorrect and may not produce the desired results. This could cause the funds to lose value or their investment results to lag relevant benchmarks or other funds with similar objectives.
Investing in the managed risk funds may involve additional risks including, but not limited to, those described below.
Fund structure — The managed risk funds invest in underlying funds and incur expenses related to those underlying funds. In addition, investors in the managed risk funds will incur fees to pay for certain expenses related to the operations of the managed risk funds. An investor holding the underlying fund directly would incur lower overall expenses but would not receive the benefit of the managed risk strategy. Additionally, in accordance with an exemption under the Investment Company Act of 1940, as amended, the investment adviser considers only proprietary funds when selecting underlying investment options and allocations. This means that the fund’s investment adviser did not, nor does it expect to, consider any unaffiliated funds as underlying investment options for the fund. This strategy could raise certain conflicts of interest when choosing underlying investments for the fund, including the selection of funds that result in greater compensation to the adviser or funds with relatively lower historical investment results. The investment adviser has policies and procedures designed to mitigate material conflicts of interest that may arise in connection with its management of the fund.
| 282 | American Funds Insurance Series |
Management — The managed risk funds are subject to the risk that the managed risk strategy or the methods employed by the subadviser in implementing the managed risk strategy may not produce the desired results. This could cause the managed risk funds to lose value or their investment results to lag relevant benchmarks or other funds with similar objectives.
Underlying fund risks — Because the managed risk funds’ investments consist of investments in underlying funds, the managed risk funds’ risks are directly related to the risks of the respective underlying fund in which each managed risk fund invests. For this reason, it is important to understand the risks associated with investing both in the managed risk fund and in each of the underlying funds.
Investing in options and futures contracts — In addition to the risks generally associated with investing in derivative instruments, options and futures contracts are subject to the creditworthiness of the clearing organizations, exchanges and, in the case of futures, futures commission merchants with which a fund transacts. While both options and futures contracts are generally liquid instruments, under certain market conditions, options and futures may be deemed to be illiquid. For example, a fund may be temporarily prohibited from closing out its position in an options or futures contract if intraday price change limits or limits on trading volume imposed by the applicable exchange are triggered. If a fund is unable to close out a position on an options or futures contract, the fund would remain subject to the risk of adverse price movements until the fund is able to close out the position in question. The ability of a fund to successfully utilize options and futures contracts may depend in part upon the ability of the fund’s investment adviser or subadviser to accurately forecast interest rates and other economic factors and to assess and predict the impact of such economic factors on the options and futures in which the fund invests. If the investment adviser or subadviser incorrectly forecasts economic developments or incorrectly predicts the impact of such developments on the options and futures in which it invests, a fund could be exposed to the risk of loss. Whereas the risk of loss on a put option purchased by the fund is limited to the initial cost of the option, the amount of a potential loss on a futures contract could greatly exceed the relatively small initial amount invested in entering the futures position.
Hedging — There may be imperfect or even negative correlation between the prices of the options and futures contracts in which a fund invests and the prices of the underlying securities or indexes which the fund seeks to hedge. For example, options and futures contracts may not provide an effective hedge because changes in options and futures contract prices may not track those of the underlying securities or indexes they are intended to hedge. In addition, there are significant differences between the securities market, on the one hand, and the options and futures markets, on the other, that could result in an imperfect correlation between the markets, causing a given hedge not to achieve its objectives. The degree of imperfection of correlation depends on circumstances such as variations in speculative market demand for options and futures, including technical influences in options and futures trading, and differences between the financial instruments being hedged and the instruments underlying the standard contracts available for trading. A decision as to whether, when and how to hedge involves the exercise of skill and judgment, and even a well-conceived hedge may be unsuccessful to some degree because of market behavior or unexpected interest rate trends. In addition, the fund’s investment in exchange-traded options and futures and their resulting costs could limit the fund’s gains in rising markets relative to those of the underlying funds, or to those of unhedged funds in general.
Short positions — The fund may suffer losses from short positions in futures contracts. Losses from short positions in futures contracts occur when the underlying index increases in value. As the underlying index increases in value, the holder of the short position in the corresponding futures contract is required to pay the difference in value of the futures contract resulting from the increase in the index on a daily basis. Losses from a short position in an index futures contract could potentially be very large if the value of the underlying index rises dramatically in a short period of time.
5. Certain investment techniques
Securities lending — Some of the funds have entered into securities lending transactions in which the funds earn income by lending investment securities to brokers, dealers or other institutions. Each transaction involves three parties: the fund, acting as the lender of the securities, a borrower, and a lending agent that acts as an intermediary.
Securities lending transactions are entered into by the fund under the securities lending agreement with the lending agent. The lending agent facilitates the exchange of securities between the lender and the borrower, generally provides protection from borrower default, marks to market the value of collateral daily, secures additional collateral from the borrower if it falls below preset terms, and may reinvest the collateral on behalf of the fund according to agreed parameters. The lending agent has indemnified the fund against losses resulting from borrower default. Although risk is mitigated by the collateral and indemnification, the fund could experience a delay in recovering its securities and a potential loss of income or value if the borrower fails to return the securities, collateral investments decline in value or the lending agent fails to perform.
| American Funds Insurance Series | 283 |
The borrower is required to post highly liquid assets, such as cash or U.S. government securities, as collateral for the loan in an amount at least equal to the value of the securities loaned. Investments made with cash collateral are recognized as assets in the fund’s investment portfolio. The same amount is recorded as a liability in the fund’s statement of assets and liabilities. While securities are on loan, the fund will continue to receive the equivalent of the interest, dividends or other distributions paid by the issuer, as well as a portion of the interest on the investment of the collateral. Additionally, although the fund does not have the right to vote on securities while they are on loan, the fund has a right to consent on corporate actions and a right to recall loaned securities to vote on proposals affecting them. The borrower is obligated to return the loaned security at the conclusion of the loan or, during the pendency of the loan, on demand from the fund.
The following table presents the value of the securities on loan, the type and value of collateral received and the value of the investment securities purchased, if any, from the cash collateral received by each fund (dollars in thousands):
| | | | | | Collateral received | | | |
| Funds | | Value of
investment
securities
on loan | | | Cash | | | U.S. government
securities | | | Value of
investment
securities
purchased | |
| Global Growth Fund | | $ | 27,348 | | | $ | 20,453 | | | $ | 8,325 | | | $ | 18,408 | |
| Global Small Capitalization Fund | | | 96,178 | | | | 85,345 | | | | 17,353 | | | | 76,811 | |
| Growth Fund | | | 78,405 | | | | 81,118 | | | | — | | | | 73,006 | |
| International Fund | | | 71,916 | | | | 74,745 | | | | — | | | | 67,270 | |
| New World Fund | | | 14,516 | | | | 8,405 | | | | 7,205 | | | | 7,565 | |
| Washington Mutual Investors Fund | | | 81,124 | | | | 55,623 | | | | 27,526 | | | | 50,061 | |
| Capital World Growth and Income Fund | | | 16,355 | | | | 15,435 | | | | 1,643 | | | | 13,891 | |
| Growth-Income Fund | | | 171,950 | | | | 178,358 | | | | — | | | | 160,522 | |
| International Growth and Income Fund | | | 2,221 | | | | 1,413 | | | | 953 | | | | 1,272 | |
| Capital Income Builder | | | 13,384 | | | | 14,030 | | | | — | | | | 12,627 | |
| Asset Allocation Fund | | | 53,318 | | | | 55,304 | | | | — | | | | 49,774 | |
| American Funds Global Balanced Fund | | | 3,814 | | | | 4,005 | | | | — | | | | 3,605 | |
Investment securities purchased from cash collateral are disclosed in the investment portfolio as short-term securities. Securities received as collateral, if any, are not recognized as fund assets. The contractual maturity of collateral received under the securities lending agreement is classified as overnight and continuous.
Index-linked bonds — Some of the funds have invested in index-linked bonds, which are fixed-income securities whose principal value is periodically adjusted to a government price index. Over the life of an index-linked bond, interest is paid on the adjusted principal value. Increases or decreases in the principal value of index-linked bonds are recorded as interest income in the fund’s statement of operations.
Mortgage dollar rolls — Some of the funds have entered into mortgage dollar roll transactions in which the fund sells a mortgage-backed security to a counterparty and simultaneously enters into an agreement with the same counterparty to buy back a similar security on a specific future date at a predetermined price. Mortgage dollar rolls are accounted for as purchase and sale transactions, which may increase the funds’ portfolio turnover rates.
Loan transactions — Some of the funds have entered into loan transactions in which the fund acquires a loan either through an agent, by assignment from another holder, or as a participation interest in another holder’s portion of a loan. The loan is often administered by a financial institution that acts as agent for the holders of the loan, and the fund may be required to receive approval from the agent and/or borrower prior to the sale of the investment. The loan’s interest rate and maturity date may change based on the terms of the loan, including potential early payments of principal.
Short-term securities — The managed risk funds hold shares of State Street Institutional U.S. Government Money Market Fund, a cash management vehicle offered and managed by State Street Bank and Trust Company.
| 284 | American Funds Insurance Series |
Unfunded commitments — Asset Allocation Fund, Capital World Bond Fund and American High-Income Trust have participated in transactions that involve unfunded commitments, which may obligate each fund to purchase new or additional bonds and/or purchase additional shares of the applicable issuer if certain contingencies are met. As of June 30, 2022, the maximum exposure from these unfunded commitments for Asset Allocation Fund, Capital World Bond Fund and American High-Income Trust was $187,000, $63,000 and $1,796,000, respectively, which would represent less than 0.01%, less than 0.01% and 0.21%, respectively, of the net assets of each fund should such commitments become due. Unrealized depreciation on these unfunded commitments for Asset Allocation Fund, Capital World Bond Fund and American High-Income Trust was $3,000, less than $1,000 and $1,000, respectively, which is disclosed as unrealized depreciation on unfunded commitments in each fund’s statement of assets and liabilities and is included in net unrealized depreciation on investments in unaffiliated issuers in each fund’s statement of operations.
Options contracts — The managed risk funds have entered into options contracts, which give the holder of the option, in return for a premium payment, the right to buy from (in the case of a call) or sell to (in the case of a put) the writer of the option, the security underlying the option (or the cash value of the index underlying the option) at a specified price. As part of their managed risk strategy, the funds will at times purchase put options on equity indexes in standardized contracts traded on foreign or domestic securities exchanges, boards of trade, or similar entities. By purchasing a put option on an equity index, the funds obtain the right (but not the obligation) to sell the cash value of the index underlying the option at a specified exercise price, and in return for this right, the funds pay the current market price, or the option premium, for the option.
The funds may terminate their position in a put option by allowing the option to expire or by exercising the option. If the option is allowed to expire, the funds will lose the entire premium. If the option is exercised, the funds complete the sale of the underlying instrument (or delivers the cash value of the index underlying the option) at the exercise price. The funds may also terminate a put option position by entering into opposing close-out transactions in advance of the option expiration date.
Premiums paid on options purchased, as well as the daily fluctuation in market value, are included in investment securities from unaffiliated issuers in each fund’s statement of assets and liabilities. Realized gains or losses are recorded at the time the option contract is closed or expires. Net realized gains or losses and net unrealized appreciation or depreciation from options contracts are recorded in investments in unaffiliated issuers in each fund’s statement of operations.
Futures contracts — Some of the funds have entered into futures contracts, which provide for the future sale by one party and purchase by another party of a specified amount of a specific financial instrument for a specified price, date, time and place designated at the time the contract is made. Futures contracts are used to strategically manage the fund’s interest rate sensitivity by increasing or decreasing the duration of the fund or a portion of the fund’s portfolio. For the managed risk funds, futures contracts are used to strategically manage portfolio volatility and downside equity risk.
Upon entering into futures contracts, and to maintain the fund’s open positions in futures contracts, the fund is required to deposit with a futures broker, known as a futures commission merchant (“FCM”), in a segregated account in the name of the FCM an amount of cash, U.S. government securities or other liquid securities, known as initial margin. The margin required for a particular futures contract is set by the exchange on which the contract is traded to serve as collateral, and may be significantly modified from time to time by the exchange during the term of the contract.
On a daily basis, each fund pays or receives variation margin based on the increase or decrease in the value of the futures contracts and records variation margin on futures contracts in each fund’s statement of assets and liabilities. Futures contracts may involve a risk of loss in excess of the variation margin shown on each fund’s statement of assets and liabilities. Each fund records realized gains or losses at the time the futures contract is closed or expires. Net realized gains or losses and net unrealized appreciation or depreciation from futures contracts are recorded in each fund’s statement of operations.
Forward currency contracts — Some of the funds have entered into forward currency contracts, which represent agreements to exchange currencies on specific future dates at predetermined rates. The series’ investment adviser uses forward currency contracts to manage the fund’s exposure to changes in exchange rates. Upon entering into these contracts, risks may arise from the potential inability of counterparties to meet the terms of their contracts and from possible movements in exchange rates.
On a daily basis, the series’ investment adviser values forward currency contracts based on the applicable exchange rates and records unrealized appreciation or depreciation for open forward currency contracts in each fund’s statement of assets and liabilities. Realized gains or losses are recorded at the time the forward contract is closed or offset by another contract with the same broker for the same settlement date and currency. Closed forward currency contracts that have not reached their settlement date are included in the respective receivables or payables for closed forward currency contracts in each fund’s statement of assets and liabilities. Net realized
| American Funds Insurance Series | 285 |
gains or losses from closed forward currency contracts and net unrealized appreciation or depreciation from open forward currency contracts are recorded in each fund’s statement of operations.
Swap contracts — Some of the funds have entered into swap agreements, which are two-party contracts entered into primarily by institutional investors for a specified time period. In a typical swap transaction, two parties agree to exchange the returns earned or realized from one or more underlying assets or rates of return. Swap agreements can be traded on a swap execution facility (SEF) and cleared through a central clearinghouse (cleared), traded over-the-counter (OTC) and cleared, or traded bilaterally and not cleared. Because clearing interposes a central clearinghouse as the ultimate counterparty to each participant’s swap, and margin is required to be exchanged under the rules of the clearinghouse, central clearing is intended to decrease (but not eliminate) counterparty risk relative to uncleared bilateral swaps. To the extent the funds enter into bilaterally negotiated swap transactions, the funds will enter into swap agreements only with counterparties that meet certain credit standards and subject to agreed collateralized procedures. The term of a swap can be days, months or years and certain swaps may be less liquid than others.
Upon entering into a centrally cleared swap contract, the funds are required to deposit cash, U.S. government securities or other liquid securities, which is known as initial margin. Generally, the initial margin required for a particular swap is set and held as collateral by the clearinghouse on which the contract is cleared. The amount of initial margin required may be significantly modified from time to time by the clearinghouse during the term of the contract.
On a daily basis, interest accruals related to the exchange of future payments are recorded as a receivable and payable in the funds’ statement of assets and liabilities for centrally cleared swaps and as unrealized appreciation or depreciation in the funds’ statement of assets and liabilities for bilateral swaps. For centrally cleared swaps, the fund also pays or receives a variation margin based on the increase or decrease in the value of the swaps, including accrued interest as applicable, and records variation margin in the statement of assets and liabilities. The funds record realized gains and losses on both the net accrued interest and any gain or loss recognized at the time the swap is closed or expires. Net realized gains or losses, as well as any net unrealized appreciation or depreciation, from swaps are recorded in the funds’ statement of operations.
Swap agreements can take different forms. Some of the funds have entered into the following types of swap agreements:
Interest rate swaps — Some of the funds have entered into interest rate swaps, which seek to manage the interest rate sensitivity of the fund by increasing or decreasing the duration of the funds or a portion of the funds’ portfolio. An interest rate swap is an agreement between two parties to exchange or swap payments based on changes in an interest rate or rates. Typically, one interest rate is fixed and the other is variable based on a designated short-term interest rate such as the Secured Overnight Financing Rate (SOFR), prime rate or other benchmark. In other types of interest rate swaps, known as basis swaps, the parties agree to swap variable interest rates based on different designated short-term interest rates. Interest rate swaps generally do not involve the delivery of securities or other principal amounts. Rather, cash payments are exchanged by the parties based on the application of the designated interest rates to a notional amount, which is the predetermined dollar principal of the trade upon which payment obligations are computed. Accordingly, the funds’ current obligation or right under the swap agreement is generally equal to the net amount to be paid or received under the swap agreement based on the relative value of the position held by each party.
| 286 | American Funds Insurance Series |
Credit default swap indices — Some of the funds have entered into centrally cleared credit default swap indices, including CDX and iTraxx indices (collectively referred to as “CDSIs”), in order to assume exposure to a diversified portfolio of credits or to hedge against existing credit risks. A CDSI is based on a portfolio of credit default swaps with similar characteristics, such as credit default swaps on high-yield bonds. In a typical CDSI transaction, one party (the protection buyer) is obligated to pay the other party (the protection seller) a stream of periodic payments over the term of the contract. If a credit event, such as a default or restructuring, occurs with respect to any of the underlying reference obligations, the protection seller must pay the protection buyer the loss on those credits.
The funds may enter into a CDSI transaction as either protection buyer or protection seller. If the funds are protection buyers, they would pay the counterparty a periodic stream of payments over the term of the contract and would not recover any of those payments if no credit events were to occur with respect to any of the underlying reference obligations. However, if a credit event did occur, the funds, as protection buyers, would have the right to deliver the referenced debt obligations or a specified amount of cash, depending on the terms of the applicable agreement, and to receive the par value of such debt obligations from the counterparty protection seller. As protection sellers, the funds would receive fixed payments throughout the term of the contract if no credit events were to occur with respect to any of the underlying reference obligations. If a credit event were to occur, however, the value of any deliverable obligation received by the funds, coupled with the periodic payments previously received by the funds, may be less than the full notional value that the funds, as a protection seller, pays to the counterparty protection buyer, effectively resulting in a loss of value to the funds. Furthermore, as protection sellers, the funds would effectively add leverage to their portfolio because it would have investment exposure to the notional amount of the swap transaction.
The following table presents the average month-end notional amounts of options contracts purchased, futures contracts, forward currency contracts, interest rate swaps and credit default swaps while held for each fund (dollars in thousands):
| | | Options
contracts
purchased | | Futures
contracts | | Forward
currency
contracts | | Interest
rate
swaps | | Credit
default
swaps | |
| New World Fund | | Not applicable | | $ 25,832 | | $ 4,557 | | Not applicable | | Not applicable | |
| International Growth and Income Fund | | Not applicable | | Not applicable | | 446 | | Not applicable | | Not applicable | |
| Capital Income Builder | | Not applicable | | 59,371 | | 98 | * | $ 23,038 | | $ 4,064 | |
| Asset Allocation Fund | | Not applicable | | 2,047,465 | | Not applicable | | Not applicable | | 107,883 | |
| American Funds Global Balanced Fund | | Not applicable | | 13,454 | | 25,586 | | 25,429 | | 3,760 | |
| The Bond Fund of America | | Not applicable | | 3,268,480 | | 116,690 | | 419,574 | | 113,829 | |
| Capital World Bond Fund | | Not applicable | | 310,776 | | 507,433 | | 345,658 | | 56,655 | |
| American High-Income Trust | | Not applicable | | 35,005 | | Not applicable | | Not applicable | | 13,999 | |
| American Funds Mortgage Fund | | Not applicable | | 27,578 | | Not applicable | | 25,975 | | Not applicable | |
| U.S. Government Securities Fund | | Not applicable | | 2,474,234 | | Not applicable | | 1,677,964 | | Not applicable | |
| Managed Risk Growth Fund | | $ 487,262 | | 136,263 | | Not applicable | | Not applicable | | Not applicable | |
| Managed Risk International Fund | | 120,077 | | 15,697 | | Not applicable | | Not applicable | | Not applicable | |
| Managed Risk Washington Mutual Investors Fund | | 347,908 | | 40,418 | | Not applicable | | Not applicable | | Not applicable | |
| Managed Risk Growth-Income Fund | | 3,860,312 | | 264,330 | | Not applicable | | Not applicable | | Not applicable | |
| Managed Risk Asset Allocation Fund | | 656,342 | | 299,621 | | Not applicable | | Not applicable | | Not applicable | |
| * | No contracts were held at the end of the reporting period; amount represents the average month-end notional amount of contracts while they were held. |
| American Funds Insurance Series | 287 |
The following tables identify the location and fair value amounts on each fund’s statement of assets and liabilities and/or the effect on each fund’s statement of operations resulting from each fund’s use of options, futures contracts, forward currency contracts, interest rate swaps and/or credit default swaps as of, or for the six months ended June 30, 2022 (dollars in thousands):
New World Fund
| | | | | Assets | | | Liabilities | |
| Contracts | | Risk type | | Location on statement of
assets and liabilities | | Value | | | Location on statement of
assets and liabilities | | Value | |
| Futures | | Interest | | Unrealized appreciation* | | $ | 160 | | | Unrealized depreciation* | | $ | 118 | |
| Forward currency | | Currency | | Unrealized appreciation on open forward currency contracts | | | 40 | | | Unrealized depreciation on open forward currency contracts | | | 1 | |
| | | | | | | $ | 200 | | | | | $ | 119 | |
| | | | | | | | | | | | | | | |
| | | | | Net realized gain | | | Net unrealized appreciation | |
| Contracts | | Risk type | | Location on statement of
operations | | Value | | | Location on statement of
operations | | Value | |
| Futures | | Interest | | Net realized gain on futures contracts | | $ | 202 | | | Net unrealized appreciation on futures contracts | | $ | 78 | |
| Forward currency | | Currency | | Net realized gain on forward currency contracts | | | 298 | | | Net unrealized appreciation on forward currency contracts | | | 59 | |
| | | | | | | $ | 500 | | | | | $ | 137 | |
| | | | | | | | | | | | | | | |
| International Growth and Income Fund | | | | | | | | | |
| | | | | | | | | | | | | | | |
| | | | | Assets | | | Liabilities | |
| Contracts | | Risk type | | Location on statement of
assets and liabilities | | Value | | | Location on statement of
assets and liabilities | | Value | |
| Forward currency | | Currency | | Unrealized appreciation on open forward currency contracts | | $ | 1 | | | Unrealized depreciation on open forward currency contracts | | $ | — | |
| | | | | | | | | | | | | | | |
| | | | | Net realized gain | | | Net unrealized appreciation | |
| Contracts | | Risk type | | Location on statement of
operations | | Value | | | Location on statement of
operations | | Value | |
| Forward currency | | Currency | | Net realized gain on forward currency contracts | | $ | — | | | Net unrealized appreciation on forward currency contracts | | $ | 1 | |
| | | | | | | | | | | | | | | |
| Capital Income Builder | | | | | | | | | |
| | | | | | | | | | | | | | | |
| | | | | Assets | | | Liabilities | |
| | | | | Location on statement of | | | | | | Location on statement of | | | | |
| Contracts | | Risk type | | assets and liabilities | | Value | | | assets and liabilities | | Value | |
| Futures | | Interest | | Unrealized appreciation* | | $ | 15 | | | Unrealized depreciation* | | $ | 1,042 | |
| Swap (centrally cleared) | | Interest | | Unrealized appreciation* | | | 1,757 | | | Unrealized depreciation* | | | — | |
| Swap (centrally cleared) | | Credit | | Unrealized appreciation* | | | — | | | Unrealized depreciation* | | | 359 | |
| | | | | | | $ | 1,772 | | | | | $ | 1,401 | |
Refer to the end of the tables for footnotes.
| 288 | American Funds Insurance Series |
| | | | | Net realized (loss) gain | | | Net unrealized (depreciation) appreciation | |
| Contracts | | Risk type | | Location on statement of
operations | | Value | | | Location on statement of
operations | | Value | |
| Futures | | Interest | | Net realized loss on futures contracts | | $ | (3,291 | ) | | Net unrealized depreciation on futures contracts | | $ | (1,259 | ) |
| Forward currency | | Currency | | Net realized gain on forward currency contracts | | | 6 | | | Net unrealized depreciation on forward currency contracts | | | (2 | ) |
| Swap | | Interest | | Net realized gain on swap contracts | | | 1,702 | | | Net unrealized appreciation on swap contracts | | | 306 | |
| Swap | | Credit | | Net realized loss on swap contracts | | | (112 | ) | | Net unrealized depreciation on swap contracts | | | (345 | ) |
| | | | | | | $ | (1,695 | ) | | | | $ | (1,300 | ) |
| | | | | | | | | | |
| Asset Allocation Fund | | | | | | | | | |
| | | | | | | | | | |
| | | | | Assets | | | Liabilities | |
| Contracts | | Risk type | | Location on statement of
assets and liabilities | | Value | | | Location on statement of
assets and liabilities | | Value | |
| Futures | | Interest | | Unrealized appreciation* | | $ | 7,611 | | | Unrealized depreciation* | | $ | 3,501 | |
| Swap (centrally cleared) | | Credit | | Unrealized appreciation* | | | 1,848 | | | Unrealized depreciation* | | | — | |
| | | | | | | $ | 9,459 | | | | | $ | 3,501 | |
| | | | | | | | | |
| | | | | Net realized gain | | | Net unrealized appreciation | |
| Contracts | | Risk type | | Location on statement of
operations | | Value | | | Location on statement of
operations | | Value | |
| Futures | | Interest | | Net realized gain on futures contracts | | $ | 52,273 | | | Net unrealized appreciation on futures contracts | | $ | 18,346 | |
| Swap | | Credit | | Net realized gain on swap contracts | | | 159 | | | Net unrealized appreciation on swap contracts | | | 1,896 | |
| | | | | | | $ | 52,432 | | | | | $ | 20,242 | |
| | | | | | | | | | | | | | | |
| American Funds Global Balanced Fund | | | | | | | | | |
| | | | | | | | | | | | | |
| | | | | Assets | | | Liabilities | |
| Contracts | | Risk type | | Location on statement of
assets and liabilities | | Value | | | Location on statement of
assets and liabilities | | Value | |
| Futures | | Interest | | Unrealized appreciation* | | $ | 48 | | | Unrealized depreciation* | | $ | 82 | |
| Forward currency | | Currency | | Unrealized appreciation on open forward currency contracts | | | 103 | | | Unrealized depreciation on open forward currency contracts | | | 459 | |
| Forward currency | | Currency | | Receivables for closed forward currency contracts | | | 18 | | | Payables for closed forward currency contracts | | | 4 | |
| Swap (centrally cleared) | | Interest | | Unrealized appreciation* | | | 7 | | | Unrealized depreciation* | | | 654 | |
| Swap (centrally cleared) | | Credit | | Unrealized appreciation* | | | — | | | Unrealized depreciation* | | | 80 | |
| | | | | | | $ | 176 | | | | | $ | 1,279 | |
Refer to the end of the tables for footnotes.
| American Funds Insurance Series | 289 |
| | | | | Net realized gain (loss) | | | Net unrealized depreciation | |
| Contracts | | Risk type | | Location on statement of
operations | | Value | | | Location on statement of
operations | | Value | |
| Futures | | Interest | | Net realized gain on futures contracts | | $ | 367 | | | Net unrealized depreciation on futures contracts | | $ | (115 | ) |
| Forward currency | | Currency | | Net realized loss on forward currency contracts | | | (537 | ) | | Net unrealized depreciation on forward currency contracts | | | (167 | ) |
| Swap | | Interest | | Net realized gain on swap contracts | | | 198 | | | Net unrealized depreciation on swap contracts | | | (410 | ) |
| Swap | | Credit | | Net realized gain on swap contracts | | | 48 | | | Net unrealized depreciation on swap contracts | | | (78 | ) |
| | | | | | | $ | 76 | | | | | $ | (770 | ) |
| | |
| The Bond Fund of America | |
| | |
| | | | | Assets | | | Liabilities | |
| Contracts | | Risk type | | Location on statement of
assets and liabilities | | Value | | | Location on statement of
assets and liabilities | | Value | |
| Futures | | Interest | | Unrealized appreciation* | | $ | 11,018 | | | Unrealized depreciation* | | $ | 25,935 | |
| Forward currency | | Currency | | Unrealized appreciation on open forward currency contracts | | | 293 | | | Unrealized depreciation on open forward currency contracts | | | 470 | |
| Forward currency | | Currency | | Receivables for closed forward currency contracts | | | 75 | | | Payables for closed forward currency contracts | | | 576 | |
| Swap (centrally cleared) | | Interest | | Unrealized appreciation* | | | 13,225 | | | Unrealized depreciation* | | | 2,838 | |
| Swap (centrally cleared) | | Credit | | Unrealized appreciation* | | | 8,754 | | | Unrealized depreciation* | | | — | |
| | | | | | | $ | 33,365 | | | | | $ | 29,819 | |
| | |
| | | | | Net realized (loss) gain | | | Net unrealized (depreciation) appreciation | |
| Contracts | | Risk type | | Location on statement of
operations | | Value | | | Location on statement of
operations | | Value | |
| Futures | | Interest | | Net realized loss on futures contracts | | $ | (59,525 | ) | | Net unrealized depreciation on futures contracts | | $ | (14,940 | ) |
| Forward currency | | Currency | | Net realized gain on forward currency contracts | | | 1,385 | | | Net unrealized appreciation on forward currency contracts | | | 178 | |
| Swap | | Interest | | Net realized gain on swap contracts | | | 25,750 | | | Net unrealized appreciation on swap contracts | | | 21,372 | |
| Swap | | Credit | | Net realized gain on swap contracts | | | 2,556 | | | Net unrealized appreciation on swap contracts | | | 8,680 | |
| | | | | | | $ | (29,834 | ) | | | | $ | 15,290 | |
Refer to the end of the tables for footnotes.
| 290 | American Funds Insurance Series |
Capital World Bond Fund
| | | | | Assets | | | Liabilities | |
| Contracts | | Risk type | | Location on statement of
assets and liabilities | Value | | | Location on statement of
assets and liabilities | | Value | |
| Futures | | Interest | | Unrealized appreciation* | | $ | 933 | | | Unrealized depreciation* | | $ | 2,216 | |
| Forward currency | | Currency | | Unrealized appreciation on open forward currency contracts | | | 6,655 | | | Unrealized depreciation on open forward currency contracts | | | 4,636 | |
| Forward currency | | Currency | | Receivables for closed forward currency contracts | | | 32 | | | Payables for closed forward currency contracts | | | 1,476 | |
| Swap (centrally cleared) | | Interest | | Unrealized appreciation* | | | 33 | | | Unrealized depreciation* | | | 9,273 | |
| Swap (centrally cleared) | | Credit | | Unrealized appreciation* | | | 3,014 | | | Unrealized depreciation* | | | — | |
| | | | | | | $ | 10,667 | | | | | $ | 17,601 | |
| | | | | | | | | | | | | | | |
| | | | | Net realized (loss) gain | | | Net unrealized (depreciation) appreciation | |
| Contracts | | Risk type | | Location on statement of
operations | Value | | | Location on statement of
operations | Value | |
| Futures | | Interest | | Net realized loss on futures contracts | | $ | (3,835 | ) | | Net unrealized depreciation on futures contracts | | $ | (1,107 | ) |
| Forward currency | | Currency | | Net realized loss on forward currency contracts | | | (15,990 | ) | | Net unrealized appreciation on forward currency contracts | | | 1,537 | |
| Swap | | Interest | | Net realized gain on swap contracts | | | 1,384 | | | Net unrealized depreciation on swap contracts | | | (5,384 | ) |
| Swap | | Credit | | Net realized gain on swap contracts | | | 675 | | | Net unrealized appreciation on swap contracts | | | 3,096 | |
| | | | | | | $ | (17,766 | ) | | | | $ | (1,858 | ) |
| | |
| American High-Income Trust | |
| | |
| | | | | Assets | | | Liabilities | |
| | | | | Location on statement of | | | | | Location on statement of | | | |
| Contracts | | Risk type | | assets and liabilities | | Value | | | assets and liabilities | | Value | |
| Futures | | Interest | | Unrealized appreciation* | | $ | 73 | | | Unrealized depreciation* | | $ | — | |
| Swap (centrally cleared) | | Credit | | Unrealized appreciation* | | | 421 | | | Unrealized depreciation* | | | — | |
| | | | | | | $ | 494 | | | | | $ | — | |
| | | | | | | | | | | | | | | |
| | | | | Net realized gain | | | Net unrealized appreciation | |
| | | | | Location on statement of | | | | | | Location on statement of | | | | |
| Contracts | | Risk type | | operations | | Value | | | operations | | Value | |
| Futures | | Interest | | Net realized gain on futures contracts | | $ | 1,276 | | | Net unrealized appreciation on futures contracts | | $ | 284 | |
| Swap | | Credit | | Net realized gain on swap contracts | | | 326 | | | Net unrealized appreciation on swap contracts | | | 414 | |
| | | | | | | $ | 1,602 | | | | | $ | 698 | |
Refer to the end of the tables for footnotes.
| American Funds Insurance Series | 291 |
American Funds Mortgage Fund
| | | | | Assets | | | Liabilities | |
| | | | | Location on statement of | | | | Location on statement of | | | |
| Contracts | | Risk type | | assets and liabilities | | Value | | | assets and liabilities | | Value | |
| Futures | | Interest | | Unrealized appreciation* | | $ | 40 | | | Unrealized depreciation* | | $ | 134 | |
| Swap (centrally cleared) | | Interest | | Unrealized appreciation* | | | 670 | | | Unrealized depreciation* | | | — | |
| | | | | | | $ | 710 | | | | | $ | 134 | |
| | | | | | | | | | | | | | | |
| | | | | Net realized (loss) gain | | | Net unrealized depreciation | |
| | | | | Location on statement of | | | | | Location on statement of | | | | |
| Contracts | | Risk type | | operations | | Value | | | operations | | Value | |
| Futures | | Interest | | Net realized loss on futures contracts | | $ | (1,437 | ) | | Net unrealized depreciation on futures contracts | | $ | (98 | ) |
| Swap | | Interest | | Net realized gain on swap contracts | | | 3,125 | | | Net unrealized depreciation on swap contracts | | | (1,705 | ) |
| | | | | | | $ | 1,688 | | | | | $ | (1,803 | ) |
| | | | | | | | | | | | | | | |
| U.S. Government Securities Fund | | | | | | | | | |
| | | | | | | | | | | | | | | |
| | | | | Assets | | | Liabilities | |
| | | | | Location on statement of | | | | | Location on statement of | | | | |
| Contracts | | Risk type | | assets and liabilities | | Value | | | assets and liabilities | | Value | |
| Futures | | Interest | | Unrealized appreciation* | | $ | 11,906 | | | Unrealized depreciation* | | $ | 17,662 | |
| Swap (centrally cleared) | | Interest | | Unrealized appreciation* | | | 23,368 | | | Unrealized depreciation* | | | 16,563 | |
| | | | | | | $ | 35,274 | | | | | $ | 34,225 | |
| | | | | | | | | | | | | | | |
| | | | | Net realized (loss) gain | | | Net unrealized depreciation | |
| | | | | Location on statement of | | | | | Location on statement of | | | | |
| Contracts | | Risk type | | operations | | Value | | | operations | | Value | |
| Futures | | Interest | | Net realized loss on futures contracts | | $ | (24,700 | ) | | Net unrealized depreciation on futures contracts | | $ | (6,365 | ) |
| Swap | | Interest | | Net realized gain on swap contracts | | | 21,128 | | | Net unrealized depreciation on swap contracts | | | (9,288 | ) |
| | | | | | | $ | (3,572 | ) | | | | $ | (15,653 | ) |
| | | | | | | | | | | | | | | |
| Managed Risk Growth Fund | | | | | | | | |
| | | | | | | | | | | | | | | |
| | | | | Assets | | | Liabilities | |
| | | | | Location on statement of | | | | | Location on statement of | | | | |
| Contracts | | Risk type | | assets and liabilities | | Value | | | assets and liabilities | | Value | |
| Options purchased | | Equity | | Investment securities from unaffiliated issuers† | | $ | 424 | | | Investment securities from unaffiliated issuers† | | $ | — | |
| Futures | | Currency | | Unrealized appreciation* | | | 268 | | | Unrealized depreciation* | | | — | |
| Futures | | Equity | | Unrealized appreciation* | | | 10,060 | | | Unrealized depreciation* | | | — | |
| Futures | | Interest | | Unrealized appreciation* | | | — | | | Unrealized depreciation* | | | (105 | ) |
| | | | | | | $ | 10,752 | | | | | $ | (105 | ) |
Refer to the end of the tables for footnotes.
| 292 | American Funds Insurance Series |
| | | | | Net realized (loss) gain | | | Net unrealized appreciation (depreciation) | |
| | | | | Location on statement of | | | | Location on statement of | | | |
| Contracts | | Risk type | | operations | | Value | | | operations | | Value | |
| Options purchased | | Equity | | Net realized loss on investments in unaffiliated issuers | | $ | (3,451 | ) | | Net unrealized appreciation on investments in unaffiliated issuers | | $ | 1,424 | |
| Futures | | Currency | | Net realized gain on futures contracts | | | 612 | | | Net unrealized appreciation on futures contracts | | | 292 | |
| Futures | | Equity | | Net realized gain on futures contracts | | | 24,631 | | | Net unrealized appreciation on futures contracts | | | 11,276 | |
| Futures | | Interest | | Net realized loss on futures contracts | | | (10,316 | ) | | Net unrealized depreciation on futures contracts | | | (6 | ) |
| | | | | | | $ | 11,476 | | | | | $ | 12,986 | |
| | | | | | | | | | | | | | | |
| Managed Risk International Fund | | | | | | | | | |
| | | | | | | | | | | | | | | |
| | | | | Assets | | | Liabilities | |
| | | | | Location on statement of | | | | | Location on statement of | | | | |
| Contracts | | Risk type | | assets and liabilities | | Value | | | assets and liabilities | | Value | |
| Options purchased | | Equity | | Investment securities from unaffiliated issuers† | | $ | 591 | | | Investment securities from unaffiliated issuers† | | $ | — | |
| Futures | | Currency | | Unrealized appreciation* | | | — | | | Unrealized depreciation* | | | — | |
| Futures | | Equity | | Unrealized appreciation* | | | 1,136 | | | Unrealized depreciation* | | | — | |
| Futures | | Interest | | Unrealized appreciation* | | | — | | | Unrealized depreciation* | | | (48 | ) |
| | | | | | | $ | 1,727 | | | | | $ | (48 | ) |
| | | | | | | | | | | | | | | |
| | | | | Net realized (loss) gain | | | Net unrealized appreciation | |
| | | | | Location on statement of | | | | | Location on statement of | | | | |
| Contracts | | Risk type | | operations | | Value | | | operations | | Value | |
| Options purchased | | Equity | | Net realized loss on investments in unaffiliated issuers | | $ | (910 | ) | | Net unrealized appreciation on investments in unaffiliated issuers | | $ | 948 | |
| Futures | | Currency | | Net realized gain on futures contracts | | | — | | | Net unrealized appreciation on futures contracts | | | — | |
| Futures | | Equity | | Net realized gain on futures contracts | | | 7,974 | | | Net unrealized appreciation on futures contracts | | | 22 | |
| Futures | | Interest | | Net realized loss on futures contracts | | | (2,349 | ) | | Net unrealized appreciation on futures contracts | | | 1,449 | |
| | | | | | | $ | 4,715 | | | | | $ | 2,419 | |
| | | | | | | | | | | | | | | |
| Managed Risk Washington Mutual Investors Fund | | | | |
| | | | | | | | | | | | | | | |
| | | | | Assets | | | Liabilities | |
| | | | | Location on statement of | | | | | Location on statement of | | | | |
| Contracts | | Risk type | | assets and liabilities | | Value | | | assets and liabilities | | Value | |
| Options purchased | | Equity | | Investment securities from unaffiliated issuers† | | $ | 842 | | | Investment securities from unaffiliated issuers† | | $ | — | |
| Futures | | Currency | | Unrealized appreciation* | | | 144 | | | Unrealized depreciation* | | | — | |
| Futures | | Equity | | Unrealized appreciation* | | | 3,774 | | | Unrealized depreciation* | | | — | |
| Futures | | Interest | | Unrealized appreciation* | | | — | | | Unrealized depreciation* | | | (70 | ) |
| | | | | | | $ | 4,760 | | | | | $ | (70 | ) |
Refer to the end of the tables for footnotes.
| American Funds Insurance Series | 293 |
| | | | | Net realized (loss) gain | | | Net unrealized appreciation (depreciation) | |
| | | | | Location on statement of | | | | Location on statement of | | | |
| Contracts | | Risk type | | operations | | Value | | | operations | | Value | |
| Options purchased | | Equity | | Net realized loss on investments in unaffiliated issuers | | $ | (2,423 | ) | | Net unrealized appreciation on investments in unaffiliated issuers | | $ | 1,000 | |
| Futures | | Currency | | Net realized gain on futures contracts | | | 186 | | | Net unrealized appreciation on futures contracts | | | 149 | |
| Futures | | Equity | | Net realized gain on futures contracts | | | 9,391 | | | Net unrealized appreciation on futures contracts | | | 3,844 | |
| Futures | | Interest | | Net realized loss on futures contracts | | | (5,062 | ) | | Net unrealized depreciation on futures contracts | | | (42 | ) |
| | | | | | | $ | 2,092 | | | | | $ | 4,951 | |
| | | | | | | | | | | | | | | |
| Managed Risk Growth-Income Fund | | | | |
| | | | | | | | | | | | | | | |
| | | | | Assets | | | Liabilities | |
| | | | | Location on statement of | | | | | Location on statement of | | | | |
| Contracts | | Risk type | | assets and liabilities | | Value | | | assets and liabilities | | Value | |
| Options purchased | | Equity | | Investment securities from unaffiliated issuers† | | $ | 11,543 | | | Investment securities from unaffiliated issuers† | | $ | — | |
| Futures | | Currency | | Unrealized appreciation* | | | 1,057 | | | Unrealized depreciation* | | | — | |
| Futures | | Equity | | Unrealized appreciation* | | | 26,222 | | | Unrealized depreciation* | | | (16 | ) |
| Futures | | Interest | | Unrealized appreciation* | | | — | | | Unrealized depreciation* | | | (524 | ) |
| | | | | | | $ | 38,822 | | | | | $ | (540 | ) |
| | | | | | | | | | | | | | | |
| | | | | Net realized (loss) gain | | | Net unrealized appreciation (depreciation) | |
| | | | | Location on statement of | | | | | Location on statement of | | | |
| Contracts | | Risk type | | operations | | Value | | | operations | | Value | |
| Options purchased | | Equity | | Net realized loss on investments in unaffiliated issuers | | $ | (28,252 | ) | | Net unrealized appreciation on investments in unaffiliated issuers | | $ | 19,619 | |
| Futures | | Currency | | Net realized gain on futures contracts | | | 1,821 | | | Net unrealized appreciation on futures contracts | | | 1,066 | |
| Futures | | Equity | | Net realized gain on futures contracts | | | 41,017 | | | Net unrealized appreciation on futures contracts | | | 26,824 | |
| Futures | | Interest | | Net realized loss on futures contracts | | | (34,975 | ) | | Net unrealized depreciation on futures contracts | | | (463 | ) |
| | | | | | | $ | (20,389 | ) | | | | $ | 47,046 | |
| | | | | | | | | | | | | | | |
| Managed Risk Asset Allocation Fund | | | | |
| | | | | | | | | | | | | | | |
| | | | | Assets | | | Liabilities | |
| | | | | Location on statement of | | | | | Location on statement of | | | | |
| Contracts | | Risk type | | assets and liabilities | | Value | | | assets and liabilities | | Value | |
| Options purchased | | Equity | | Investment securities from unaffiliated issuers† | | $ | 1,138 | | | Investment securities from unaffiliated issuers† | | $ | — | |
| Futures | | Currency | | Unrealized appreciation* | | | 651 | | | Unrealized depreciation* | | | — | |
| Futures | | Equity | | Unrealized appreciation* | | | 23,290 | | | Unrealized depreciation* | | | — | |
| Futures | | Interest | | Unrealized appreciation* | | | — | | | Unrealized depreciation* | | | (371 | ) |
| | | | | | | $ | 25,079 | | | | | $ | (371 | ) |
Refer to the end of the tables for footnotes.
| 294 | American Funds Insurance Series |
| | | | | Net realized (loss) gain | | | Net unrealized appreciation (depreciation) |
| Contracts | | Risk type | | Location on statement of
operations | | Value | | | Location on statement of
operations | | Value | |
Options purchased
|
| Equity
|
| Net realized loss on investments in unaffiliated issuers |
| $
| (3,697
| )
|
| Net unrealized appreciation on
investments in unaffiliated issuers |
| $
| 781
|
|
Futures
|
| Currency
|
| Net realized gain on futures
contracts |
|
| 1,188
|
|
| Net unrealized appreciation on
futures contracts |
|
| 660
|
|
Futures
|
| Equity
|
| Net realized gain on futures
contracts |
|
| 28,524
|
|
| Net unrealized appreciation on
futures contracts |
|
| 23,415
|
|
Futures
|
| Interest
|
| Net realized loss on futures
contracts |
|
| (38,673
| )
|
| Net unrealized depreciation on
futures contracts |
|
| (264
| )
|
| | | | | | | $ | (12,658 | ) | | | | $ | 24,592 | |
| * | Includes cumulative appreciation/depreciation on futures contracts, centrally cleared interest rate swaps and/or centrally cleared credit default swaps as reported in the applicable table following each fund’s investment portfolio. Only current day’s variation margin is reported within each fund’s statement of assets and liabilities. |
| † | Includes options purchased as reported in the fund’s investment portfolio. |
Collateral — Some funds either receive or pledge highly liquid assets, such as cash or U.S. government securities, as collateral due to securities lending and/or their use of futures contracts, forward currency contracts, interest rate swaps, credit default swaps and/or future delivery contracts. For securities lending, each participating fund receives collateral in exchange for lending investment securities. The lending agent may reinvest collateral from securities lending transactions according to agreed parameters. For futures contracts, centrally cleared interest rate swaps and centrally cleared credit default swaps, the program calls for each participating fund to pledge collateral for initial and variation margin by contract. For forward currency contracts, the program calls for each participating fund to either receive or pledge collateral based on the net gain or loss on unsettled contracts by counterparty. For future delivery contracts, the program calls for each participating fund to either receive or pledge collateral based on the net gain or loss on unsettled contracts by certain counterparties. The purpose of the collateral is to cover potential losses that could occur in the event that either party cannot meet its contractual obligation. Non-cash collateral pledged by each participating fund, if any, is disclosed in each fund’s investment portfolio, and cash collateral pledged by each participating fund, if any, is held in a segregated account with the fund’s custodian, which is reflected as pledged cash collateral in each fund’s statement of assets and liabilities.
Rights of offset — Funds that hold forward currency contracts have enforceable master netting agreements with certain counterparties, where amounts payable by each party to the other in the same currency (with the same settlement date and with the same counter-party) are settled net of each party’s payment obligation. If an early termination date occurs under these agreements following an event of default or termination event, all obligations of each party to its counterparty are settled net through a single payment in a single currency (“close-out netting”). For financial reporting purposes, the funds do not offset financial assets and financial liabilities that are subject to these master netting arrangements in the statements of assets and liabilities.
The following tables present each fund’s forward currency contracts by counterparty that are subject to master netting agreements but that are not offset in the funds’ statements of assets and liabilities. The net amount column shows the impact of offsetting on the funds’ statement of assets and liabilities as of June 30, 2022, if close-out netting was exercised (dollars in thousands):
New World Fund
| | | Gross amounts
recognized in the | | | Gross amounts not offset in the
statement of assets and liabilities and
subject to a master netting agreement | | | | |
Counterparty | | statement of assets
and liabilities | | | Available
to offset | | | Non-cash
collateral* | | | Cash
collateral* | | | Net
amount | |
| Assets: | | | | | | | | | | | | | | | | | | | | |
| Standard Chartered Bank | | $ | 35 | | | $ | — | | | $ | — | | | $ | — | | | $ | 35 | |
| UBS AG | | | 5 | | | | — | | | | — | | | | — | | | | 5 | |
| Total | | $ | 40 | | | $ | — | | | $ | — | | | $ | — | | | $ | 40 | |
| Liabilities: | | | | | | | | | | | | | | | | | | | | |
| Citibank | | $ | 1 | | | $ | — | | | $ | — | | | $ | — | | | $ | 1 | |
Refer to the end of the tables for footnote.
| American Funds Insurance Series | 295 |
International Growth and Income Fund
| | | Gross amounts
recognized in the | | | Gross amounts not offset in the
statement of assets and liabilities and
subject to a master netting agreement | | | | |
Counterparty | | statement of assets
and liabilities | | | Available
to offset | | | Non-cash
collateral* | | | Cash
collateral* | | | Net
amount | |
| Assets: | | | | | | | | | | | | | | | | | | | | |
| JPMorgan Chase | | $ | 1 | | | $ | — | | | $ | — | | | $ | — | | | $ | 1 | |
American Funds Global Balanced Fund
| | | Gross amounts
recognized in the | | | Gross amounts not offset in the
statement of assets and liabilities and
subject to a master netting agreement | | | | |
Counterparty | | statement of assets
and liabilities | | | Available
to offset | | | Non-cash
collateral* | | | Cash
collateral* | | | Net
amount | |
| Assets: | | | | | | | | | | | | | | | | | | | | |
| Bank of America | | $ | 20 | | | $ | (20 | ) | | $ | — | | | $ | — | | | $ | — | |
| Barclays Bank PLC | | | 11 | | | | — | | | | — | | | | — | | | | 11 | |
| BNP Paribas | | | 1 | | | | (1 | ) | | | — | | | | — | | | | — | |
| Citibank | | | 74 | | | | (1 | ) | | | — | | | | — | | | | 73 | |
| Morgan Stanley | | | 14 | | | | (14 | ) | | | — | | | | — | | | | — | |
| Standard Chartered Bank | | | 1 | | | | (1 | ) | | | — | | | | — | | | | — | |
| Total | | $ | 121 | | | $ | (37 | ) | | $ | — | | | $ | — | | | $ | 84 | |
| Liabilities: | | | | | | | | | | | | | | | | | | | | |
| Bank of America | | $ | 44 | | | $ | (20 | ) | | $ | — | | | $ | — | | | $ | 24 | |
| Bank of New York Mellon | | | 1 | | | | — | | | | — | | | | — | | | | 1 | |
| BNP Paribas | | | 282 | | | | (1 | ) | | | — | | | | — | | | | 281 | |
| Citibank | | | 1 | | | | (1 | ) | | | — | | | | — | | | | — | |
| HSBC Bank | | | 14 | | | | — | | | | — | | | | — | | | | 14 | |
| JPMorgan Chase | | | 3 | | | | — | | | | — | | | | — | | | | 3 | |
| Morgan Stanley | | | 23 | | | | (14 | ) | | | — | | | | — | | | | 9 | |
| Standard Chartered Bank | | | 95 | | | | (1 | ) | | | — | | | | — | | | | 94 | |
| Total | | $ | 463 | | | $ | (37 | ) | | $ | — | | | $ | — | | | $ | 426 | |
The Bond Fund of America
| | | Gross amounts
recognized in the | | | Gross amounts not offset in the
statement of assets and liabilities and
subject to a master netting agreement | | | | |
Counterparty | | statement of assets
and liabilities | | | Available
to offset | | | Non-cash
collateral* | | | Cash
collateral* | | | Net
amount | |
| Assets: | | | | | | | | | | | | | | | | | | | | |
| Bank of America | | $ | 96 | | | $ | — | | | $ | — | | | $ | — | | | $ | 96 | |
| Bank of New York Mellon | | | 65 | | | | — | | | | — | | | | — | | | | 65 | |
| Citibank | | | 94 | | | | (94 | ) | | | — | | | | — | | | | — | |
| Standard Chartered Bank | | | 11 | | | | — | | | | — | | | | — | | | | 11 | |
| UBS AG | | | 102 | | | | (30 | ) | | | — | | | | — | | | | 72 | |
| Total | | $ | 368 | | | $ | (124 | ) | | $ | — | | | $ | — | | | $ | 244 | |
| Liabilities: | | | | | | | | | | | | | | | | | | | | |
| Citibank | | $ | 648 | | | $ | (94 | ) | | $ | (554 | ) | | $ | — | | | $ | — | |
| JPMorgan Chase | | | 323 | | | | — | | | | (323 | ) | | | — | | | | — | |
| Morgan Stanley | | | 45 | | | | — | | | | — | | | | — | | | | 45 | |
| UBS AG | | | 30 | | | | (30 | ) | | | — | | | | — | | | | — | |
| Total | | $ | 1,046 | | | $ | (124 | ) | | $ | (877 | ) | | $ | — | | | $ | 45 | |
Refer to the end of the tables for footnote.
| 296 | American Funds Insurance Series |
Capital World Bond Fund
| | | Gross amounts
recognized in the | | | Gross amounts not offset in the
statement of assets and liabilities and
subject to a master netting agreement | | | | |
| Counterparty | | statement of assets
and liabilities | | | Available
to offset | | | Non-cash
collateral* | | | Cash
collateral* | | | Net
amount | |
| Assets: | | | | | | | | | | | | | | | | | | | | |
| Bank of America | | $ | 503 | | | $ | (503 | ) | | $ | — | | | $ | — | | | $ | — | |
| BNP Paribas | | | 91 | | | | (91 | ) | | | — | | | | — | | | | — | |
| Citibank | | | 5,133 | | | | (2,333 | ) | | | — | | | | (2,800 | ) | | | — | |
| Goldman Sachs | | | 27 | | | | (27 | ) | | | — | | | | — | | | | — | |
| HSBC Bank | | | 253 | | | | (42 | ) | | | — | | | | (211 | ) | | | — | |
| JPMorgan Chase | | | 75 | | | | (75 | ) | | | — | | | | — | | | | — | |
| Morgan Stanley | | | 75 | | | | (75 | ) | | | — | | | | — | | | | — | |
| Standard Chartered Bank | | | 291 | | | | — | | | | — | | | | (291 | ) | | | — | |
| UBS AG | | | 239 | | | | (239 | ) | | | — | | | | — | | | | — | |
| Total | | $ | 6,687 | | | $ | (3,385 | ) | | $ | — | | | $ | (3,302 | ) | | $ | — | |
| Liabilities: | | | | | | | | | | | | | | | | | | | | |
| Bank of America | | $ | 957 | | | $ | (503 | ) | | $ | (364 | ) | | $ | — | | | $ | 90 | |
| BNP Paribas | | | 712 | | | | (91 | ) | | | (585 | ) | | | — | | | | 36 | |
| Citibank | | | 2,333 | | | | (2,333 | ) | | | — | | | | — | | | | — | |
| Goldman Sachs | | | 477 | | | | (27 | ) | | | (450 | ) | | | — | | | | — | |
| HSBC Bank | | | 42 | | | | (42 | ) | | | — | | | | — | | | | — | |
| JPMorgan Chase | | | 788 | | | | (75 | ) | | | (659 | ) | | | — | | | | 54 | |
| Morgan Stanley | | | 269 | | | | (75 | ) | | | (194 | ) | | | — | | | | — | |
| UBS AG | | | 534 | | | | (239 | ) | | | (295 | ) | | | — | | | | — | |
| Total | | $ | 6,112 | | | $ | (3,385 | ) | | $ | (2,547 | ) | | $ | — | | | $ | 180 | |
| * | Collateral is shown on a settlement basis. |
6. Taxation and distributions
Federal income taxation — Each fund complies with the requirements under Subchapter M of the Internal Revenue Code applicable to regulated investment companies and intends to distribute substantially all of its net taxable income and net capital gains each year. The funds are not subject to income taxes to the extent such distributions are made. Therefore, no federal income tax provision is required.
As of and during the period ended June 30, 2022, none of the funds had a liability for any unrecognized tax benefits. Each fund recognizes interest and penalties, if any, related to unrecognized tax benefits as income tax expense in their respective statements of operations. During the period, none of the funds incurred any significant interest or penalties.
Each fund’s tax returns are generally not subject to examination by federal, state and, if applicable, non-U.S. tax authorities after the expiration of each jurisdiction’s statute of limitations, which is typically three years after the date of filing but can be extended in certain jurisdictions.
Non-U.S. taxation — Dividend and interest income, if any, are recorded net of non-U.S. taxes paid. The funds may file withholding tax reclaims in certain jurisdictions to recover a portion of amounts previously withheld. As a result of rulings from European courts, the funds filed for additional reclaims related to prior years. These reclaims are recorded when the amount is known and there are no significant uncertainties on collectability. During the six months ended June 30, 2022, some of the funds recognized reclaims (net of fees and the effect of realized gain or loss from currency translations) and interest related to European court rulings as follows (dollars in thousands):
| Fund | | Reclaims | | | Fees | | | Interest | |
| Global Growth Fund | | $ | 353 | | | $ | 634 | | | $ | 64 | |
| Growth Fund | | | 318 | | | | 22 | | | | 22 | |
| New World Fund | | | 175 | | | | 99 | | | | 14 | |
| Growth-Income Fund | | | 3,322 | | | | 472 | | | | 292 | |
| International Growth and Income Fund | | | 430 | | | | 104 | | | | 35 | |
| Asset Allocation Fund | | | 32 | | | | 106 | | | | 9 | |
| American Funds Insurance Series | 297 |
The reclaims and interest are included in each fund’s statements of operations. Gains realized by the funds on the sale of securities in certain countries, if any, may be subject to non-U.S. taxes. If applicable, the funds record an estimated deferred tax liability based on unrealized gains to provide for potential non-U.S. taxes payable upon the sale of these securities.
Distributions — Distributions determined on a tax basis may differ from net investment income and net realized gains for financial reporting purposes. These differences are due primarily to different treatment for items such as currency gains and losses; short-term capital gains and losses; capital losses related to sales of certain securities within 30 days of purchase; unrealized appreciation of certain investments in securities outside the U.S.; cost of investments sold; paydowns on fixed-income securities; net capital losses; net operating losses; non-U.S. taxes on capital gains; amortization of premiums and discounts and income on certain investments. The fiscal year in which amounts are distributed may differ from the year in which the net investment income and net realized gains are recorded by the funds for financial reporting purposes.
Additional tax basis disclosures for each fund are as follows (dollars in thousands):
| | | Global
Growth
Fund | | | Global
Small
Capitalization
Fund | | | Growth
Fund | | | International
Fund | | | New
World
Fund | | | Washington
Mutual
Investors
Fund | |
| As of December 31, 2021: | | | | | | | | | | | | | | | | | | | | | | | | |
| Undistributed ordinary income | | $ | 35,090 | | | $ | 155,910 | | | $ | 575,141 | | | $ | 91,536 | | | $ | 79,588 | | | $ | 436,702 | |
| Undistributed long-term capital gains | | | 815,909 | | | | 935,195 | | | | 4,457,096 | | | | 955,085 | | | | 247,561 | | | | 1,827,154 | |
| As of June 30, 2022: | | | | | | | | | | | | | | | | | | | | | | | | |
| Gross unrealized appreciation on investments | | | 2,448,406 | | | | 597,292 | | | | 12,379,772 | | | | 1,198,573 | | | | 706,493 | | | | 1,823,766 | |
| Gross unrealized depreciation on investments | | | (638,501 | ) | | | (427,229 | ) | | | (2,828,654 | ) | | | (840,515 | ) | | | (322,914 | ) | | | (598,946 | ) |
| Net unrealized appreciation (depreciation) on investments | | | 1,809,905 | | | | 170,063 | | | | 9,551,118 | | | | 358,058 | | | | 383,579 | | | | 1,224,820 | |
| Cost of investments | | | 5,058,986 | | | | 2,826,529 | | | | 21,593,126 | | | | 6,517,811 | | | | 2,807,027 | | | | 8,113,297 | |
| | | | | | | | | | | | | | | | | | | | | | | | | |
| | | | Capital World
Growth and
Income Fund | | | | Growth-
Income
Fund | | | | International
Growth
and Income
Fund | | | | Capital
Income
Builder | | | | Asset
Allocation
Fund | | | | American
Funds
Global
Balanced
Fund | |
| As of December 31, 2021: | | | | | | | | | | | | | | | | | | | | | | | | |
| Undistributed ordinary income | | $ | 66,586 | | | $ | 578,031 | | | $ | 753 | | | $ | 7,363 | | | $ | 333,342 | | | $ | 282 | |
| Late year ordinary loss deferral* | | | — | | | | — | | | | — | | | | — | | | | — | | | | (110 | ) |
| Undistributed long-term capital gains | | | 354,484 | | | | 2,984,322 | | | | 145,163 | | | | — | | | | 2,509,013 | | | | 1,947 | |
| Capital loss carryforward† | | | — | | | | — | | | | — | | | | (20,560 | ) | | | — | | | | — | |
| As of June 30, 2022: | | | | | | | | | | | | | | | | | | | | | | | | |
| Gross unrealized appreciation on investments | | | 376,239 | | | | 10,839,281 | | | | 28,959 | | | | 149,820 | | | | 5,492,943 | | | | 24,473 | |
| Gross unrealized depreciation on investments | | | (237,923 | ) | | | (1,593,886 | ) | | | (53,837 | ) | | | (56,954 | ) | | | (1,818,032 | ) | | | (33,439 | ) |
| Net unrealized appreciation (depreciation) on investments | | | 138,316 | | | | 9,245,395 | | | | (24,878 | ) | | | 92,866 | | | | 3,674,911 | | | | (8,966 | ) |
| Cost of investments | | | 1,601,901 | | | | 23,683,846 | | | | 316,947 | | | | 1,055,905 | | | | 22,499,906 | | | | 389,620 | |
Refer to the end of the tables for footnotes.
| 298 | American Funds Insurance Series |
| | | The Bond
Fund of
America | | | Capital
World
Bond
Fund | | | American
High-Income
Trust | | | American
Funds
Mortgage
Fund | | | Ultra-Short
Bond
Fund | | | U.S.
Government
Securities
Fund | |
| As of December 31, 2021: | | | | | | | | | | | | | | | | | | | | | | | | |
| Undistributed ordinary income | | $ | 95,270 | | | $ | 4,353 | | | $ | 9,517 | | | $ | 499 | | | $ | — | | | $ | 7,641 | |
| Undistributed long-term capital gains | | | 97,219 | | | | 26,459 | | | | — | | | | — | | | | — | | | | — | |
| Capital loss carryforward† | | | — | | | | — | | | | (247,812 | ) | | | (496 | ) | | | (1 | ) | | | (14,302 | ) |
| As of June 30, 2022: | | | | | | | | | | | | | | | | | | | | | | | | |
| Gross unrealized appreciation on investments | | | 59,647 | | | | 13,030 | | | | 23,164 | | | | 1,110 | | | | 14 | | | | 40,623 | |
| Gross unrealized depreciation on investments | | | (807,938 | ) | | | (286,726 | ) | | | (133,062 | ) | | | (2,819 | ) | | | (89 | ) | | | (96,426 | ) |
| Net unrealized appreciation (depreciation) on investments | | | (748,291 | ) | | | (273,696 | ) | | | (109,898 | ) | | | (1,709 | ) | | | (75 | ) | | | (55,803 | ) |
| Cost of investments | | | 13,481,793 | | | | 1,887,532 | | | | 945,135 | | | | 140,652 | | | | 416,305 | | | | 2,270,134 | |
| | | | | | | | | | | | | | | | | | | | | | | | | |
| | | Managed
Risk
Growth
Fund | | | Managed
Risk
International
Fund | | | Managed
Risk
Washington
Mutual
Investors
Fund | | | Managed
Risk
Growth-
Income
Fund | | | Managed
Risk
Asset
Allocation
Fund | | | | | |
| As of December 31, 2021: | | | | | | | | | | | | | | | | | | | | | | | | |
| Undistributed ordinary income | | $ | 1,846 | | | $ | 3,367 | | | $ | 3,923 | | | $ | 23,113 | | | $ | 34,460 | | | | | |
| Undistributed long-term capital gains | | | 83,454 | | | | — | | | | — | | | | 50,937 | | | | 87,163 | | | | | |
| Capital loss carryforward† | | | — | | | | (12,234 | ) | | | (23,718 | ) | | | — | | | | — | | | | | |
| As of June 30, 2022: | | | | | | | | | | | | | | | | | | | | | | | | |
| Gross unrealized appreciation on investments | | | 10,369 | | | | 1,527 | | | | 3,992 | | | | 29,568 | | | | 23,941 | | | | | |
| Gross unrealized depreciation on investments | | | (129,403 | ) | | | (35,664 | ) | | | (53,343 | ) | | | (150,797 | ) | | | (159,840 | ) | | | | |
| Net unrealized appreciation (depreciation) on investments | | | (119,034 | ) | | | (34,137 | ) | | | (49,351 | ) | | | (121,229 | ) | | | (135,899 | ) | | | | |
| Cost of investments | | | 580,496 | | | | 164,663 | | | | 365,091 | | | | 2,259,173 | | | | 2,397,331 | | | | | |
| * | This deferral is considered incurred in the subsequent year. |
| † | Each fund’s capital loss carryforward will be used to offset any capital gains realized by the fund in the current year or in subsequent years. Funds with a capital loss carryforward will not make distributions from capital gains while a capital loss carryforward remains. |
Distributions paid by each fund were characterized for tax purposes as follows (dollars in thousands):
Global Growth Fund
| | | Six months ended June 30, 2022 | | | Year ended December 31, 2021 | |
| Share class | | Ordinary
income | | | Long-term
capital gains | | | Total
distributions
paid | | | Ordinary
income | | | Long-term
capital gains | | | Total
distributions
paid | |
| Class 1 | | $ | 16,651 | | | $ | 361,119 | | | $ | 377,770 | | | $ | 23,870 | | | $ | 193,074 | | | $ | 216,944 | |
| Class 1A | | | 67 | | | | 1,617 | | | | 1,684 | | | | 55 | | | | 645 | | | | 700 | |
| Class 2 | | | 15,933 | | | | 386,947 | | | | 402,880 | | | | 15,210 | | | | 221,402 | | | | 236,612 | |
| Class 4 | | | 2,452 | | | | 66,240 | | | | 68,692 | | | | 1,339 | | | | 30,748 | | | | 32,087 | |
|
| Total | | $ | 35,103 | | | $ | 815,923 | | | $ | 851,026 | | | $ | 40,474 | | | $ | 445,869 | | | $ | 486,343 | |
| American Funds Insurance Series | 299 |
Global Small Capitalization Fund
| | | Six months ended June 30, 2022 | | | Year ended December 31, 2021 | |
| Share class | | Ordinary
income | | | Long-term
capital gains | | | Total
distributions
paid | | | Ordinary
income | | | Long-term
capital gains | | | Total
distributions
paid | |
| Class 1 | | $ | 47,544 | | | $ | 285,173 | | | $ | 332,717 | | | $ | — | | | $ | 55,655 | | | $ | 55,655 | |
| Class 1A | | | 209 | | | | 1,252 | | | | 1,461 | | | | — | | | | 39 | | | | 39 | |
| Class 2 | | | 94,748 | | | | 568,298 | | | | 663,046 | | | | — | | | | 60,246 | | | | 60,246 | |
| Class 4 | | | 13,417 | | | | 80,475 | | | | 93,892 | | | | — | | | | 7,215 | | | | 7,215 | |
| Total | | $ | 155,918 | | | $ | 935,198 | | | $ | 1,091,116 | | | $ | — | | | $ | 123,155 | | | $ | 123,155 | |
| | | | | | | | | | | | | | | | | | | | | | | | | |
| Growth Fund | | | | | | | | | | | | | | | | | | |
| | | | | | | | | | | | | | | | | | | | | | | | | |
| | | Six months ended June 30, 2022 | | | Year ended December 31, 2021 | |
| Share class | | Ordinary
income | | | Long-term
capital gains | | | Total
distributions
paid | | | Ordinary
income | | | Long-term
capital gains | | | Total
distributions
paid | |
| Class 1 | | $ | 252,019 | | | $ | 1,912,725 | | | $ | 2,164,744 | | | $ | 181,380 | | | $ | 2,073,422 | | | $ | 2,254,802 | |
| Class 1A | | | 3,042 | | | | 23,411 | | | | 26,453 | | | | 701 | | | | 9,031 | | | | 9,732 | |
| Class 2 | | | 274,301 | | | | 2,152,577 | | | | 2,426,878 | | | | 167,439 | | | | 2,610,409 | | | | 2,777,848 | |
| Class 3 | | | 3,618 | | | | 28,163 | | | | 31,781 | | | | 2,435 | | | | 35,107 | | | | 37,542 | |
| Class 4 | | | 42,175 | | | | 340,245 | | | | 382,420 | | | | 17,483 | | | | 340,551 | | | | 358,034 | |
| Total | | $ | 575,155 | | | $ | 4,457,121 | | | $ | 5,032,276 | | | $ | 369,438 | | | $ | 5,068,520 | | | $ | 5,437,958 | |
| | | | | | | | | | | | | | | | | | | | | | | | | |
| International Fund | | | | | | | | | | | | | | | | | | | | |
| | | | | | | | | | | | | | | | | | | | | | | | | |
| | | Six months ended June 30, 2022 | | | Year ended December 31, 2021 | |
| Share class | | Ordinary
income | | | Long-term
capital gains | | | Total
distributions
paid | | | Ordinary
income | | | Long-term
capital gains | | | Total
distributions
paid | |
| Class 1 | | $ | 44,035 | | | $ | 448,918 | | | $ | 492,953 | | | $ | 131,730 | | | $ | — | | | $ | 131,730 | |
| Class 1A | | | 133 | | | | 1,398 | | | | 1,531 | | | | 281 | | | | — | | | | 281 | |
| Class 2 | | | 42,435 | | | | 450,228 | | | | 492,663 | | | | 105,815 | | | | — | | | | 105,815 | |
| Class 3 | | | 209 | | | | 2,195 | | | | 2,404 | | | | 545 | | | | — | | | | 545 | |
| Class 4 | | | 4,760 | | | | 52,350 | | | | 57,110 | | | | 10,725 | | | | — | | | | 10,725 | |
| Total | | $ | 91,572 | | | $ | 955,089 | | | $ | 1,046,661 | | | $ | 249,096 | | | $ | — | | | $ | 249,096 | |
| | | | | | | | | | | | | | | | | | | | | | | | | |
| New World Fund | | | | | | | | | | | | | | | | | | | | |
| | | | | | | | | | | | | | | | | | | | | | | | | |
| | | Six months ended June 30, 2022 | | | Year ended December 31, 2021 | |
| Share class | | Ordinary
income | | | Long-term
capital gains | | | Total
distributions
paid | | | Ordinary
income | | | Long-term
capital gains | | | Total
distributions
paid | |
| Class 1 | | $ | 42,143 | | | $ | 129,123 | | | $ | 171,266 | | | $ | 26,785 | | | $ | 78,257 | | | $ | 105,042 | |
| Class 1A | | | 232 | | | | 724 | | | | 956 | | | | 77 | | | | 273 | | | | 350 | |
| Class 2 | | | 19,672 | | | | 61,661 | | | | 81,333 | | | | 9,450 | | | | 36,498 | | | | 45,948 | |
| Class 4 | | | 17,555 | | | | 56,063 | | | | 73,618 | | | | 5,794 | | | | 28,566 | | | | 34,360 | |
| Total | | $ | 79,602 | | | $ | 247,571 | | | $ | 327,173 | | | $ | 42,106 | | | $ | 143,594 | | | $ | 185,700 | |
| 300 | American Funds Insurance Series |
Washington Mutual Investors Fund
| | | | | | | | | | | | | | | | | | | |
| | | Six months ended June 30, 2022 | | | Year ended December 31, 2021 | |
| Share class | | Ordinary
income | | | Long-term
capital gains | | | Total
distributions
paid | | | Ordinary
income | | | Long-term
capital gains | | | Total
distributions
paid | |
| Class 1 | | $ | 256,710 | | | $ | 1,068,126 | | | $ | 1,324,836 | | | $ | 104,666 | | | $ | — | | | $ | 104,666 | |
| Class 1A | | | 2,492 | | | | 10,665 | | | | 13,157 | | | | 2,211 | | | | — | | | | 2,211 | |
| Class 2 | | | 131,174 | | | | 551,636 | | | | 682,810 | | | | 46,652 | | | | — | | | | 46,652 | |
| Class 4 | | | 46,410 | | | | 196,768 | | | | 243,178 | | | | 12,620 | | | | — | | | | 12,620 | |
| Total | | $ | 436,786 | | | $ | 1,827,195 | | | $ | 2,263,981 | | | $ | 166,149 | | | $ | — | | | $ | 166,149 | |
| | | | | | | | | | | | | | | | | | | | | | | | | |
| Capital World Growth and Income Fund | | | | | | | | | | | | | | | | | |
| | | | | | | | | | | | | | | | | | | | | | | | | |
| | | Six months ended June 30, 2022 | | | Year ended December 31, 2021 | |
| Share class | | Ordinary
income | | | Long-term
capital gains | | | Total
distributions
paid | | | Ordinary
income | | | Long-term
capital gains | | | Total
distributions
paid | |
| Class 1 | | $ | 20,817 | | | $ | 109,599 | | | $ | 130,416 | | | $ | 14,543 | | | $ | 16,997 | | | $ | 31,540 | |
| Class 1A | | | 223 | | | | 1,188 | | | | 1,411 | | | | 99 | | | | 67 | | | | 166 | |
| Class 2 | | | 38,548 | | | | 205,827 | | | | 244,375 | | | | 20,948 | | | | 29,988 | | | | 50,936 | |
| Class 4 | | | 7,015 | | | | 37,875 | | | | 44,890 | | | | 3,094 | | | | 4,436 | | | | 7,530 | |
| Total | | $ | 66,603 | | | $ | 354,489 | | | $ | 421,092 | | | $ | 38,684 | | | $ | 51,488 | | | $ | 90,172 | |
| | | | | | | | | | | | | | | | | | | | | | | | | |
| Growth-Income Fund | | | | | | | | | | | | | | | | | | | | |
| | | | | | | | | | | | | | | | | | | | | | | | | |
| | | Six months ended June 30, 2022 | | | Year ended December 31, 2021 | |
| Share class | | Ordinary
income | | | Long-term
capital gains | | | Total
distributions
paid | | | Ordinary
income | | | Long-term
capital gains | | | Total
distributions
paid | |
| Class 1 | | $ | 344,468 | | | $ | 1,754,172 | | | $ | 2,098,640 | | | $ | 328,564 | | | $ | 239,575 | | | $ | 568,139 | |
| Class 1A | | | 472 | | | | 2,464 | | | | 2,936 | | | | 308 | | | | 185 | | | | 493 | |
| Class 2 | | | 204,025 | | | | 1,071,265 | | | | 1,275,290 | | | | 164,258 | | | | 145,765 | | | | 310,023 | |
| Class 3 | | | 2,195 | | | | 11,428 | | | | 13,623 | | | | 1,864 | | | | 1,578 | | | | 3,442 | |
| Class 4 | | | 26,915 | | | | 145,017 | | | | 171,932 | | | | 16,599 | | | | 16,418 | | | | 33,017 | |
| Total | | $ | 578,075 | | | $ | 2,984,346 | | | $ | 3,562,421 | | | $ | 511,593 | | | $ | 403,521 | | | $ | 915,114 | |
| | | | | | | | | | | | | | | | | | | | | | | | | |
| International Growth and Income Fund | | | | | | | | | | | | | | | |
| | | | | | | | | | | | | | | | | | | | | | | | | |
| | | Six months ended June 30, 2022 | | | Year ended December 31, 2021 | |
| Share class | | Ordinary
income | | | Long-term
capital gains | | | Total
distributions
paid | | | Ordinary
income | | | Long-term
capital gains | | | Total
distributions
paid | |
| Class 1 | | $ | 16 | | | $ | 6,104 | | | $ | 6,120 | | | $ | 4,585 | | | $ | — | | | $ | 4,585 | |
| Class 1A | | | 12 | | | | 2,108 | | | | 2,120 | | | | 140 | | | | — | | | | 140 | |
| Class 2 | | | 459 | | | | 81,276 | | | | 81,735 | | | | 6,218 | | | | — | | | | 6,218 | |
| Class 4 | | | 267 | | | | 55,677 | | | | 55,944 | | | | 3,589 | | | | — | | | | 3,589 | |
| Total | | $ | 754 | | | $ | 145,165 | | | $ | 145,919 | | | $ | 14,532 | | | $ | — | | | $ | 14,532 | |
| | | | | | | | | | | | | | | | | | | | | | | | | |
| Capital Income Builder | | | | | | | | | | | | | | | | | | | | |
| | | | | | | | | | | | | | | | | | | | | | | | | |
| | | Six months ended June 30, 2022 | | | Year ended December 31, 2021 | |
| Share class | | Ordinary
income | | | Long-term
capital gains | | | Total
distributions
paid | | | Ordinary
income | | | Long-term
capital gains | | | Total
distributions
paid | |
| Class 1 | | $ | 6,604 | | | $ | — | | | $ | 6,604 | | | $ | 16,222 | | | $ | — | | | $ | 16,222 | |
| Class 1A | | | 99 | | | | — | | | | 99 | | | | 218 | | | | — | | | | 218 | |
| Class 2 | | | 129 | | | | — | | | | 129 | | | | 315 | | | | — | | | | 315 | |
| Class 4 | | | 4,982 | | | | — | | | | 4,982 | | | | 13,009 | | | | — | | | | 13,009 | |
| Total | | $ | 11,814 | | | $ | — | | | $ | 11,814 | | | $ | 29,764 | | | $ | — | | | $ | 29,764 | |
| American Funds Insurance Series | 301 |
| Asset Allocation Fund | | | | | | | | | | | | | |
| | | | | | | | | | | | | | | | | | | |
| | | Six months ended June 30, 2022 | | | Year ended December 31, 2021 | |
| Share class | | Ordinary
income | | | Long-term
capital gains | | | Total
distributions
paid | | | Ordinary
income | | | Long-term
capital gains | | | Total
distributions
paid | |
| Class 1 | | $ | 207,234 | | | $ | 1,525,081 | | | $ | 1,732,315 | | | $ | 424,814 | | | $ | 579,353 | | | $ | 1,004,167 | |
| Class 1A | | | 275 | | | | 2,098 | | | | 2,373 | | | | 423 | | | | 457 | | | | 880 | |
| Class 2 | | | 57,602 | | | | 440,697 | | | | 498,299 | | | | 108,045 | | | | 154,751 | | | | 262,796 | |
| Class 3 | | | 385 | | | | 2,914 | | | | 3,299 | | | | 717 | | | | 976 | | | | 1,693 | |
| Class 4 | | | 67,986 | | | | 538,249 | | | | 606,235 | | | | 107,752 | | | | 164,028 | | | | 271,780 | |
| Total | | $ | 333,482 | | | $ | 2,509,039 | | | $ | 2,842,521 | | | $ | 641,751 | | | $ | 899,565 | | | $ | 1,541,316 | |
| | | | | | | | | | | | | | | | | | | | | | | | | |
| American Funds Global Balanced Fund | | | | | | | | | | | | | | |
| | | | | | | | | | | | | | | | | | | | | | | | | |
| | | Six months ended June 30, 2022 | | | Year ended December 31, 2021 | |
| Share class | | Ordinary
income | | | Long-term
capital gains | | | Total
distributions
paid | | | Ordinary
income | | | Long-term
capital gains | | | Total
distributions
paid | |
| Class 1 | | $ | 72 | | | $ | 498 | | | $ | 570 | | | $ | 1,680 | | | $ | 6,058 | | | $ | 7,738 | |
| Class 1A | | | 2 | | | | 13 | | | | 15 | | | | 45 | | | | 189 | | | | 234 | |
| Class 2 | | | 123 | | | | 850 | | | | 973 | | | | 2,431 | | | | 10,638 | | | | 13,069 | |
| Class 4 | | | 85 | | | | 589 | | | | 674 | | | | 1,305 | | | | 6,901 | | | | 8,206 | |
| Total | | $ | 282 | | | $ | 1,950 | | | $ | 2,232 | | | $ | 5,461 | | | $ | 23,786 | | | $ | 29,247 | |
| | | | | | | | | | | | | | | | | | | | | | | | | |
| The Bond Fund of America | | | | | | | | | | | | | | | | | | | |
| | | | | | | | | | | | | | | | | | | | | | | | | |
| | | | Six months ended June 30, 2022 | | | | Year ended December 31, 2021 | |
| Share class | | Ordinary
income | | | Long-term
capital gains | | | Total
distributions
paid | | | Ordinary
income | | | Long-term
capital gains | | | Total
distributions
paid | |
| Class 1 | | $ | 60,944 | | | $ | 60,668 | | | $ | 121,612 | | | $ | 301,454 | | | $ | 133,858 | | | $ | 435,312 | |
| Class 1A | | | 1,716 | | | | 1,700 | | | | 3,416 | | | | 408 | | | | 193 | | | | 601 | |
| Class 2 | | | 26,337 | | | | 27,763 | | | | 54,100 | | | | 138,464 | | | | 69,578 | | | | 208,042 | |
| Class 4 | | | 6,423 | | | | 7,113 | | | | 13,536 | | | | 28,710 | | | | 14,777 | | | | 43,487 | |
| Total | | $ | 95,420 | | | $ | 97,244 | | | $ | 192,664 | | | $ | 469,036 | | | $ | 218,406 | | | $ | 687,442 | |
| | | | | | | | | | | | | | | | | | | | | | | | | |
| Capital World Bond Fund | | | | | | | | | | | | | | | | | | | |
| | | | | | | | | | | | | | | | | | | | | | | | | |
| | | Six months ended June 30, 2022 | | | Year ended December 31, 2021 | |
| Share class | | Ordinary
income | | | Long-term
capital gains | | | Total
distributions
paid | | | Ordinary
income | | | Long-term
capital gains | | | Total
distributions
paid | |
| Class 1 | | $ | 2,151 | | | $ | 11,752 | | | $ | 13,903 | | | $ | 34,401 | | | $ | 10,279 | | | $ | 44,680 | |
| Class 1A | | | 3 | | | | 20 | | | | 23 | | | | 34 | | | | 7 | | | | 41 | |
| Class 2 | | | 2,087 | | | | 13,752 | | | | 15,839 | | | | 33,715 | | | | 10,855 | | | | 44,570 | |
| Class 4 | | | 120 | | | | 945 | | | | 1,065 | | | | 1,845 | | | | 612 | | | | 2,457 | |
| Total | | $ | 4,361 | | | $ | 26,469 | | | $ | 30,830 | | | $ | 69,995 | | | $ | 21,753 | | | $ | 91,748 | |
| 302 | American Funds Insurance Series |
| American High-Income Trust | | | | | | | | | | | | | |
| | | | | | | | | | | | | | | | | | | |
| | | Six months ended June 30, 2022 | | | Year ended December 31, 2021 | |
| Share class | | Ordinary
income | | | Long-term
capital gains | | | Total
distributions
paid | | | Ordinary
income | | | Long-term
capital gains | | | Total
distributions
paid | |
| Class 1 | | $ | 2,597 | | | $ | — | | | $ | 2,597 | | | $ | 11,054 | | | $ | — | | | $ | 11,054 | |
| Class 1A | | | 12 | | | | — | | | | 12 | | | | 59 | | | | — | | | | 59 | |
| Class 2 | | | 6,029 | | | | — | | | | 6,029 | | | | 28,636 | | | | — | | | | 28,636 | |
| Class 3 | | | 95 | | | | — | | | | 95 | | | | 429 | | | | — | | | | 429 | |
| Class 4 | | | 790 | | | | — | | | | 790 | | | | 3,238 | | | | — | | | | 3,238 | |
| Total | | $ | 9,523 | | | $ | — | | | $ | 9,523 | | | $ | 43,416 | | | $ | — | | | $ | 43,416 | |
| | | | | | | | | | | | | | | | | | | | | | | | | |
| American Funds Mortgage Fund | | | | | | | | | | | | | | | | |
| | | | | | | | | | | | | | | | | | | | | | | | | |
| | | Six months ended June 30, 2022 | | | Year ended December 31, 2021 | |
| Share class | | Ordinary
income | | | Long-term
capital gains | | | Total
distributions
paid | | | Ordinary
income | | | Long-term
capital gains | | | Total
distributions
paid | |
| Class 1 | | $ | — | | | $ | — | | | $ | — | | | $ | 6,294 | | | $ | 3,087 | | | $ | 9,381 | |
| Class 1A | | | 9 | | | | — | | | | 9 | | | | 39 | | | | 18 | | | | 57 | |
| Class 2 | | | 283 | | | | — | | | | 283 | | | | 1,448 | | | | 784 | | | | 2,232 | |
| Class 4 | | | 207 | | | | — | | | | 207 | | | | 936 | | | | 551 | | | | 1,487 | |
| Total | | $ | 499 | | | $ | — | | | $ | 499 | | | $ | 8,717 | | | $ | 4,440 | | | $ | 13,157 | |
| | | | | | | | | | | | | | | | | | | | | | | | | |
| U.S. Government Securities Fund | | | | | | | | | | | | | | | | |
| | | | | | | | | | | | | | | | | | | | | | | | | |
| | | Six months ended June 30, 2022 | | | Year ended December 31, 2021 | |
| Share class | | Ordinary
income | | | Long-term
capital gains | | | Total
distributions
paid | | | Ordinary
income | | | Long-term
capital gains | | | Total
distributions
paid | |
| Class 1 | | $ | 1,291 | | | $ | — | | | $ | 1,291 | | | $ | 30,987 | | | $ | 9,355 | | | $ | 40,342 | |
| Class 1A | | | 17 | | | | — | | | | 17 | | | | 389 | | | | 129 | | | | 518 | |
| Class 2 | | | 5,451 | | | | — | | | | 5,451 | | | | 108,143 | | | | 36,124 | | | | 144,267 | |
| Class 3 | | | 39 | | | | — | | | | 39 | | | | 714 | | | | 234 | | | | 948 | |
| Class 4 | | | 855 | | | | — | | | | 855 | | | | 17,596 | | | | 6,057 | | | | 23,653 | |
| Total | | $ | 7,653 | | | $ | — | | | $ | 7,653 | | | $ | 157,829 | | | $ | 51,899 | | | $ | 209,728 | |
| | | | | | | | | | | | | | | | | | | | | | | | | |
| Managed Risk Growth Fund | | | | | | | | | | | | | | | | |
| | | | | | | | | | | | | | | | | | | | | | | | | |
| | | Six months ended June 30, 2022 | | | Year ended December 31, 2021 | |
| Share class | | Ordinary
income | | | Long-term
capital gains | | | Total
distributions
paid | | | Ordinary
income | | | Long-term
capital gains | | | Total
distributions
paid | |
| Class P1 | | $ | 41 | | | $ | 1,634 | | | $ | 1,675 | | | $ | 106 | | | $ | 409 | | | $ | 515 | |
| Class P2 | | | 1,808 | | | | 81,821 | | | | 83,629 | | | | 3,159 | | | | 23,710 | | | | 26,869 | |
| Total | | $ | 1,849 | | | $ | 83,455 | | | $ | 85,304 | | | $ | 3,265 | | | $ | 24,119 | | | $ | 27,384 | |
| | | | | | | | | | | | | | | | | | | | | | | | | |
| Managed Risk International Fund | | | | | | | | | | | | | | | | |
| | | | | | | | | | | | | | | | | | | | | | | | | |
| | | Six months ended June 30, 2022 | | | Year ended December 31, 2021 | |
| Share class | | Ordinary
income | | | Long-term
capital gains | | | Total
distributions
paid | | | Ordinary
income | | | Long-term
capital gains | | | Total
distributions
paid | |
| Class P1 | | $ | 52 | | | $ | — | | | $ | 52 | | | $ | 14 | | | $ | — | | | $ | 14 | |
| Class P2 | | | 3,316 | | | | — | | | | 3,316 | | | | 917 | | | | — | | | | 917 | |
| Total | | $ | 3,368 | | | $ | — | | | $ | 3,368 | | | $ | 931 | | | $ | — | | | $ | 931 | |
| American Funds Insurance Series | 303 |
| Managed Risk Washington Mutual Investors Fund |
| | | | | | | | | | | | | | | | | | | |
| | | Six months ended June 30, 2022 | | | Year ended December 31, 2021 | |
| Share class | | Ordinary
income | | | Long-term
capital gains | | | Total
distributions
paid | | | Ordinary
income | | | Long-term
capital gains | | | Total
distributions
paid | |
| Class P1 | | $ | 33 | | | $ | — | | | $ | 33 | | | $ | 40 | | | $ | — | | | $ | 40 | |
| Class P2 | | | 3,892 | | | | — | | | | 3,892 | | | | 5,979 | | | | — | | | | 5,979 | |
| Total | | $ | 3,925 | | | $ | — | | | $ | 3,925 | | | $ | 6,019 | | | $ | — | | | $ | 6,019 | |
| | | | | | | | | | | | | | | | | | | | | | | | | |
| Managed Risk Growth-Income Fund | | | | | | | | | | | | | | | | | | | |
| | | | | | | | | | | | | | | | | | | | | | | | | |
| | | Six months ended June 30, 2022 | | | Year ended December 31, 2021 | |
| Share class | | Ordinary
income | | | Long-term
capital gains | | | Total
distributions
paid | | | Ordinary
income | | | Long-term
capital gains | | | Total
distributions
paid | |
| Class P1 | | $ | 20,311 | | | $ | 44,484 | | | $ | 64,795 | | | $ | 30,716 | | | $ | 29,380 | | | $ | 60,096 | |
| Class P2 | | | 2,809 | | | | 6,461 | | | | 9,270 | | | | 3,713 | | | | 4,359 | | | | 8,072 | |
| Total | | $ | 23,120 | | | $ | 50,945 | | | $ | 74,065 | | | $ | 34,429 | | | $ | 33,739 | | | $ | 68,168 | |
| | | | | | | | | | | | | | | | | | | | | | | | | |
| Managed Risk Asset Allocation Fund | | | | | | | | | | | | | | | | |
| | | | | | | | | | | | | | | | | | | | | | | | | |
| | | Six months ended June 30, 2022 | | | Year ended December 31, 2021 | |
| Share class | | Ordinary
income | | | Long-term
capital gains | | | Total
distributions
paid | | | Ordinary
income | | | Long-term
capital gains | | | Total
distributions
paid | |
| Class P1 | | $ | 104 | | | $ | 254 | | | $ | 358 | | | $ | 114 | | | $ | — | | | $ | 114 | |
| Class P2 | | | 34,364 | | | | 86,918 | | | | 121,282 | | | | 38,113 | | | | — | | | | 38,113 | |
| Total | | $ | 34,468 | | | $ | 87,172 | | | $ | 121,640 | | | $ | 38,227 | | | $ | — | | | $ | 38,227 | |
7. Fees and transactions
CRMC, the series’ investment adviser, is the parent company of American Funds Distributors®, Inc. (“AFD”), the distributor of the series’ shares, and American Funds Service Company® (“AFS”), the series’ transfer agent. CRMC, AFD and AFS are considered related parties to the series.
Investment advisory services — The series has an investment advisory and service agreement with CRMC that provides for monthly fees accrued daily. These fees are based on annual rates that generally decrease as net asset levels increase. CRMC receives investment advisory fees from the underlying funds held by the managed risk funds, which are included in the unaudited net effective expense ratios that are provided as additional information in the financial highlights tables. Subadvisory fees for the managed risk funds are paid by CRMC to Milliman FRM. The managed risk funds are not responsible for paying any subadvisory fees.
| 304 | American Funds Insurance Series |
The series’ board of trustees approved a revised investment advisory and services agreement effective May 1, 2022. The revised agreement provides investment advisory services fees based on revised annual rates and net asset levels for some of the funds. The following table discloses the annual rates and net asset levels before and after the revised contract became effective:
| | | Prior to May 1, 2022 | | | Effective May 1, 2022 |
| | | | | | | | | Net asset levels | | | | | | | | | Net asset levels |
| | | Rates | | | (in billions) | | | Rates | | | (in billions) |
| Fund | | | Beginning
with | | | | Ending
with | | | | Up to | | | | In excess
of | | | | Beginning
with | | | | Ending
with | | | | Up to | | | | In excess
of | |
| Global Growth Fund | | | .690 | % | | | .445 | % | | $ | .6 | | | $ | 8.0 | | | | .475 | % | | | .435 | % | | $ | 15.0 | | | $ | 15.0 | |
| Global Small Capitalization Fund | | | .800 | | | | .635 | | | | .6 | | | | 5.0 | | | | .647 | | | | .615 | | | | 15.0 | | | | 15.0 | |
| Growth Fund | | | .500 | | | | .280 | | | | .6 | | | | 34.0 | | | | .500 | | | | .275 | | | | .6 | | | | 44.0 | |
| International Fund | | | .690 | | | | .430 | | | | .5 | | | | 21.0 | | | | .478 | | | | .430 | | | | 15.0 | | | | 21.0 | |
| New World Fund | | | .850 | | | | .580 | | | | .5 | | | | 4.0 | | | | .577 | | | | .510 | | | | 15.0 | | | | 15.0 | |
| Washington Mutual Investors Fund | | | .500 | | | | .350 | | | | .6 | | | | 10.5 | | | | .374 | | | | .350 | | | | 15.0 | | | | 15.0 | |
| Capital World Growth and Income Fund | | | .690 | | | | .480 | | | | .6 | | | | 3.0 | | | | .475 | | | | .435 | | | | 15.0 | | | | 15.0 | |
| Growth-Income Fund | | | .500 | | | | .219 | | | | .6 | | | | 34.0 | | | | .500 | | | | .217 | | | | .6 | | | | 44.0 | |
| International Growth and Income Fund | | | .690 | | | | .500 | | | | .5 | | | | 1.5 | | | | .478 | | | | .450 | | | | 15.0 | | | | 15.0 | |
| Capital Income Builder | | | .500 | | | | .410 | | | | .6 | | | | 1.0 | | | | .357 | | | | .330 | | | | 15.0 | | | | 15.0 | |
| Asset Allocation Fund | | | .500 | | | | .240 | | | | .6 | | | | 21.0 | | | | .500 | | | | .236 | | | | .6 | | | | 34.0 | |
| American Funds Global Balanced Fund | | | .660 | | | | .510 | | | | .5 | | | | 1.0 | | | | .446 | | | | .420 | | | | 15.0 | | | | 15.0 | |
| The Bond Fund of America | | | .480 | | | | .320 | | | | .6 | | | | 13.0 | | | | .352 | | | | .320 | | | | 15.0 | | | | 15.0 | |
| Capital World Bond Fund | | | .570 | | | | .450 | | | | 1.0 | | | | 3.0 | | | | .431 | | | | .360 | | | | 15.0 | | | | 15.0 | |
| American High-Income Trust | | | .500 | | | | .420 | | | | .6 | | | | 2.0 | | | | .404 | | | | .386 | | | | 15.0 | | | | 15.0 | |
| American Funds Mortgage Fund | | | .420 | | | | .290 | | | | .6 | | | | 3.0 | | | | .295 | | | | .280 | | | | 15.0 | | | | 15.0 | |
| Ultra-Short Bond Fund | | | .320 | | | | .270 | | | | 1.0 | | | | 2.0 | | | | .257 | | | | .242 | | | | 15.0 | | | | 15.0 | |
| U.S. Government Securities Fund | | | .420 | | | | .290 | | | | .6 | | | | 3.0 | | | | .295 | | | | .280 | | | | 15.0 | | | | 15.0 | |
Investment advisory services waivers — CRMC is waiving a portion of its investment advisory services fees for some of the funds. During the six months ended June 30, 2022, CRMC waived $1,000 in fees for Growth Fund in advance of the revised investment advisory and service agreement that became effective May 1, 2022. CRMC also waived a portion of its investment advisory services fees for the following funds based on the rates listed:
| Fund | | Waiver rates prior to
May 1, 2022 | | | Waiver rates effective
May 1, 2022 | |
| Global Growth Fund | | | Not applicable | | | | .11 | % |
| Global Small Capitalization Fund | | | Not applicable | | | | .05 | |
| New World Fund | | | .18 | % | | | .07 | |
| Washington Mutual Investors Fund | | | .16 | | | | .11 | |
| Capital World Growth and Income Fund | | | .23 | | | | .14 | |
| International Growth and Income Fund | | | .14 | | | | .01 | |
| Capital Income Builder | | | .25 | | | | .14 | |
| American Funds Global Balanced Fund | | | Not applicable | | | | .01 | |
| The Bond Fund of America | | | .19 | | | | .19 | |
| Capital World Bond Fund | | | .10 | | | | .10 | |
| American High-Income Trust | | | .19 | | | | .14 | |
| American Funds Mortgage Fund | | | .21 | | | | .12 | |
| U.S. Government Securities Fund | | | .16 | | | | .12 | |
| Managed Risk Growth Fund | | | .05 | | | | .05 | |
| Managed Risk International Fund | | | .05 | | | | .05 | |
| Managed Risk Washington Mutual Investors Fund | | | .05 | | | | .05 | |
| Managed Risk Growth-Income Fund | | | .05 | | | | .05 | |
| Managed Risk Asset Allocation Fund | | | .05 | | | | .05 | |
The waiver rates for each fund, except Growth Fund, will be in effect through at least May 1, 2023, and may only be modified or terminated with the approval of the series’ board. For the six months ended June 30, 2022, total investment advisory services fees waived by CRMC were $30,987,000. CRMC does not intend to recoup these waivers. Investment advisory fees in each fund’s statement of operations are presented gross of any waivers from CRMC.
| American Funds Insurance Series | 305 |
The range of rates, net asset levels and the current annualized rates of average daily net assets for each fund before and after any investment advisory services waivers, if applicable, are as follows:
| | | | | | | | | | | | | | | For the | | | For the | |
| | | | | | | | | | | | | | | six months | | | six months | |
| | | | | | | | | Net asset level | | | ended | | | ended | |
| | | Rates | | | (in billions) | | | June 30, | | | June 30, | |
| | | Beginning | | | Ending | | | | | | In excess | | | 2022, | | | 2022, | |
| Fund | | with | | | with | | | Up to | | | of | | | before waiver | | | after waiver | |
| Global Growth Fund | | | .475 | % | | | .435 | % | | $ | 15.0 | | | $ | 15.0 | | | | .493 | % | | | .460 | % |
| Global Small Capitalization Fund | | | .647 | | | | .615 | | | | 15.0 | | | | 15.0 | | | | .686 | | | | .671 | |
| Growth Fund | | | .500 | | | | .275 | | | | .6 | | | | 44.0 | | | | .311 | | | | .311 | |
| International Fund | | | .478 | | | | .430 | | | | 15.0 | | | | 21.0 | | | | .492 | | | | .492 | |
| New World Fund | | | .577 | | | | .510 | | | | 15.0 | | | | 15.0 | | | | .656 | | | | .510 | |
| Washington Mutual Investors Fund | | | .374 | | | | .350 | | | | 15.0 | | | | 15.0 | | | | .381 | | | | .227 | |
| Capital World Growth and Income Fund | | | .475 | | | | .435 | | | | 15.0 | | | | 15.0 | | | | .556 | | | | .363 | |
| Growth-Income Fund | | | .500 | | | | .217 | | | | .6 | | | | 44.0 | | | | .252 | | | | .252 | |
| International Growth and Income Fund | | | .478 | | | | .450 | | | | 15.0 | | | | 15.0 | | | | .624 | | | | .453 | |
| Capital Income Builder | | | .357 | | | | .330 | | | | 15.0 | | | | 15.0 | | | | .433 | | | | .220 | |
| Asset Allocation Fund | | | .500 | | | | .236 | | | | .6 | | | | 34.0 | | | | .264 | | | | .264 | |
| American Funds Global Balanced Fund | | | .446 | | | | .420 | | | | 15.0 | | | | 15.0 | | | | .593 | | | | .590 | |
| The Bond Fund of America | | | .352 | | | | .320 | | | | 15.0 | | | | 15.0 | | | | .356 | | | | .166 | |
| Capital World Bond Fund | | | .431 | | | | .360 | | | | 15.0 | | | | 15.0 | | | | .505 | | | | .436 | |
| American High-Income Trust | | | .404 | | | | .386 | | | | 15.0 | | | | 15.0 | | | | .459 | | | | .285 | |
| American Funds Mortgage Fund | | | .295 | | | | .280 | | | | 15.0 | | | | 15.0 | | | | .385 | | | | .200 | |
| Ultra-Short Bond Fund | | | .257 | | | | .242 | | | | 15.0 | | | | 15.0 | | | | .297 | | | | .297 | |
| U.S. Government Securities Fund | | | .295 | | | | .280 | | | | 15.0 | | | | 15.0 | | | | .340 | | | | .193 | |
| Managed Risk Growth Fund | | | .150 | | | | | | | | all | | | | | | | | .150 | | | | .100 | |
| Managed Risk International Fund | | | .150 | | | | | | | | all | | | | | | | | .150 | | | | .100 | |
| Managed Risk Washington Mutual Investors Fund | | | .150 | | | | | | | | all | | | | | | | | .150 | | | | .100 | |
| Managed Risk Growth-Income Fund | | | .150 | | | | | | | | all | | | | | | | | .150 | | | | .100 | |
| Managed Risk Asset Allocation Fund | | | .150 | | | | | | | | all | | | | | | | | .150 | | | | .100 | |
Class-specific fees and expenses —Expenses that are specific to individual share classes are accrued directly to the respective share class. The principal class-specific fees and expenses are further described below:
Distribution services — The series has plans of distribution for all share classes except Class 1. Under the plans, the board of trustees approves certain categories of expenses that are used to finance activities primarily intended to sell fund shares. The plans provide for payments to pay service fees to firms that have entered into agreements with the series. These payments, based on an annualized percentage of average daily net assets, range from 0.18% to 0.50% as noted in the table below. In some cases, the board of trustees has limited the amounts that may be paid to less than the maximum allowed by the plans.
| Share class | | Currently approved limits | | Plan limits |
| Class 1A | | | 0.00 | % | | | 0.25 | % |
| Class 2 | | | 0.25 | | | | 0.25 | |
| Class 3 | | | 0.18 | | | | 0.18 | |
| Class 4 | | | 0.25 | | | | 0.25 | |
| Class P1 | | | 0.00 | | | | 0.25 | |
| Class P2 | | | 0.25 | | | | 0.50 | |
| 306 | American Funds Insurance Series |
Insurance administrative services — The series has an insurance administrative services plan for Class 1A, 4, P1 and P2 shares. Under the plan, these share classes pay 0.25% of each insurance company’s respective average daily net assets in each share class to compensate the insurance companies for services provided to their separate accounts and contractholders for which the shares of the fund are beneficially owned as underlying investments of such contractholders’ annuities. These services include, but are not limited to, maintenance, shareholder communications and transactional services. The insurance companies are not related parties to the series.
Transfer agent services — The series has a shareholder services agreement with AFS under which the funds compensate AFS for providing transfer agent services to all of the funds’ share classes. These services include recordkeeping, shareholder communications and transaction processing. In addition, the managed risk funds reimburse AFS for amounts paid to third parties for performing transfer agent services on behalf of fund shareholders.
Administrative services — The series has an administrative services agreement with CRMC under which each fund compensates CRMC for providing administrative services to all of the funds’ share classes except Class P1 and P2 shares. Administrative services are provided by CRMC and its affiliates to help assist third parties providing non-distribution services to fund shareholders. These services include providing in-depth information on each fund and market developments that impact fund investments. Administrative services also include, but are not limited to, coordinating, monitoring and overseeing third parties that provide services to fund shareholders. The agreement provides each fund, other than the managed risk funds, the ability to charge an administrative services fee at the annual rate of 0.05% of average daily net assets attributable to each share class. Currently each fund, other than the managed-risk funds, pays CRMC an administrative services fee at the annual rate of 0.03% of average daily net assets of each share class for CRMC’s provision of administrative services. For the managed risk funds, CRMC receives administrative services fees at an annual rate of 0.03% of average daily net assets from Class 1 shares of the underlying funds for administrative services provided to the series.
Accounting and administrative services — The managed risk funds have a subadministration agreement with Bank of New York Mellon (“BNY Mellon”) under which the fund compensates BNY Mellon for providing accounting and administrative services to each of the managed risk funds’ share classes. These services include, but are not limited to, fund accounting (including calculation of net asset value), financial reporting and tax services. BNY Mellon is not a related party to the managed risk funds.
Class-specific expenses under the agreements described above were as follows (dollars in thousands):
| Global Growth Fund | | | | | | | | | |
| | | | | | | | | | |
| Share class | | Distribution
services | | | Insurance
administrative
services | | | Administrative
services | |
| Class 1 | | | Not applicable | | | | Not applicable | | | | $531 | |
| Class 1A | | | $— | | | | $19 | | | | 2 | |
| Class 2 | | | 4,667 | | | | Not applicable | | | | 560 | |
| Class 4 | | | 783 | | | | 783 | | | | 94 | |
| Total class-specific expenses | | | $5,450 | | | | $802 | | | | $1,187 | |
| | | | | | | | | | | | | |
| Global Small Capitalization Fund | | | | | | | | | |
| | | | | | | | | | |
| Share class | | Distribution
services | | | Insurance
administrative
services | | | Administrative
services | |
| Class 1 | | | Not applicable | | | | Not applicable | | | | $167 | |
| Class 1A | | | $— | | | | $6 | | | | 1 | |
| Class 2 | | | 2,587 | | | | Not applicable | | | | 311 | |
| Class 4 | | | 361 | | | | 361 | | | | 43 | |
| Total class-specific expenses | | | $2,948 | | | | $367 | | | | $522 | |
| | | | | | | | | | | | | |
| Growth Fund | | | | | | | | | | | | |
| | | | | | | | | | | | | |
| Share class | | Distribution
services | | | Insurance
administrative
services | | | Administrative
services | |
| Class 1 | | | Not applicable | | | | Not applicable | | | | $2,397 | |
| Class 1A | | | $— | | | | $167 | | | | 20 | |
| Class 2 | | | 22,593 | | | | Not applicable | | | | 2,711 | |
| Class 3 | | | 221 | | | | Not applicable | | | | 37 | |
| Class 4 | | | 3,412 | | | | 3,413 | | | | 410 | |
| Total class-specific expenses | | | $26,226 | | | | $3,580 | | | | $5,575 | |
| | | | | | | | | | |
| International Fund | | | | | | | | | | | | |
| | | | | | | | | | | | | |
| Share class | | Distribution
services | | | Insurance
administrative
services | | | Administrative
services | |
| Class 1 | | | Not applicable | | | | Not applicable | | | | $553 | |
| Class 1A | | | $— | | | | $14 | | | | 2 | |
| Class 2 | | | 4,574 | | | | Not applicable | | | | 549 | |
| Class 3 | | | 17 | | | | Not applicable | | | | 3 | |
| Class 4 | | | 516 | | | | 516 | | | | 62 | |
| Total class-specific expenses | | | $5,107 | | | | $530 | | | | $1,169 | |
| American Funds Insurance Series | 307 |
| New World Fund | | | | | | | | | |
| | | | | | | | | | |
| Share class | | Distribution
services | | | Insurance
administrative
services | | | Administrative
services | |
| Class 1 | | | Not applicable | | | | Not applicable | | | | $288 | |
| Class 1A | | | $— | | | | $13 | | | | 2 | |
| Class 2 | | | 1,127 | | | | Not applicable | | | | 135 | |
| Class 4 | | | 993 | | | | 993 | | | | 119 | |
| Total class-specific expenses | | | $2,120 | | | | $1,006 | | | | $544 | |
| | | | | | | | | | | | | |
| Washington Mutual Investors Fund | | | | | | | | | |
| | | | | | | | | | |
| Share class | | Distribution
services | | | Insurance
administrative
services | | | Administrative
services | |
| Class 1 | | | Not applicable | | | | Not applicable | | | | $905 | |
| Class 1A | | | $— | | | | $167 | | | | 20 | |
| Class 2 | | | 3,862 | | | | Not applicable | | | | 464 | |
| Class 4 | | | 1,312 | | | | 1,312 | | | | 157 | |
| Total class-specific expenses | | | $5,174 | | | | $1,479 | | | | $1,546 | |
| | | | | | | | | | | | | |
| Capital World Growth and Income Fund | | | | | | | | | | | | |
| | | | | | | | | | | | | |
| Share class | | Distribution
services | | | Insurance
administrative
services | | | Administrative
services | |
| Class 1 | | | Not applicable | | | | Not applicable | | | | $92 | |
| Class 1A | | | $— | | | | $8 | | | | 1 | |
| Class 2 | | | 1,445 | | | | Not applicable | | | | 174 | |
| Class 4 | | | 252 | | | | 252 | | | | 30 | |
| Total class-specific expenses | | | $1,697 | | | | $260 | | | | $297 | |
| | | | | | | | | | | | | |
| Growth-Income Fund | | | | | | | | | | | | |
| | | | | | | | | | | | | |
| Share class | | Distribution
services | | | Insurance
administrative
services | | | Administrative
services | |
| Class 1 | | | Not applicable | | | | Not applicable | | | | $3,290 | |
| Class 1A | | | $— | | | | $37 | | | | 4 | |
| Class 2 | | | 16,649 | | | | Not applicable | | | | 1,998 | |
| Class 3 | | | 130 | | | | Not applicable | | | | 22 | |
| Class 4 | | | 2,170 | | | | 2,170 | | | | 260 | |
| Total class-specific expenses | | | $18,949 | | | | $2,207 | | | | $5,574 | |
| | | | | | | | | | | | | |
| International Growth and Income Fund | | | | | | | | | | | | |
| | | | | | | | | | | | | |
| Share class | | Distribution
services | | | Insurance
administrative
services | | | Administrative
services | |
| Class 1 | | | Not applicable | | | | Not applicable | | | | $2 | |
| Class 1A | | | $— | | | | $6 | | | | 1 | |
| Class 2 | | | 231 | | | | Not applicable | | | | 28 | |
| Class 4 | | | 152 | | | | 152 | | | | 18 | |
| Total class-specific expenses | | | $383 | | | | $158 | | | | $49 | |
| | | | | | | | | | | | | |
| Capital Income Builder | | | | | | | | | | | | |
| | | | | | | | | | | | | |
| Share class | | Distribution
services | | | Insurance
administrative
services | | | Administrative
services | |
| Class 1 | | | Not applicable | | | | Not applicable | | | | $84 | |
| Class 1A | | | $— | | | | $12 | | | | 1 | |
| Class 2 | | | 15 | | | | Not applicable | | | | 2 | |
| Class 4 | | | 683 | | | | 683 | | | | 82 | |
| Total class-specific expenses | | | $698 | | | | $695 | | | | $169 | |
| | | | | | | | | | | | | |
| Asset Allocation Fund | | | | | | | | | | | | |
| | | | | | | | | | | | | |
| Share class | | Distribution
services | | | Insurance
administrative
services | | | Administrative
services | |
| Class 1 | | | Not applicable | | | | Not applicable | | | | $2,539 | |
| Class 1A | | | $— | | | | $28 | | | | 4 | |
| Class 2 | | | 6,085 | | | | Not applicable | | | | 730 | |
| Class 3 | | | 29 | | | | Not applicable | | | | 5 | |
| Class 4 | | | 7,234 | | | | 7,234 | | | | 868 | |
| Total class-specific expenses | | | $13,348 | | | | $7,262 | | | | $4,146 | |
| | | | | | | | | | | | | |
| American Funds Global Balanced Fund | | | | | | | | | | | | |
| | | | | | | | | | | | | |
| Share class | | Distribution
services | | | Insurance
administrative
services | | | Administrative
services | |
| Class 1 | | | Not applicable | | | | Not applicable | | | | $16 | |
| Class 1A | | | $— | | | | $4 | | | | — | * |
| Class 2 | | | 229 | | | | Not applicable | | | | 28 | |
| Class 4 | | | 154 | | | | 154 | | | | 18 | |
| Total class-specific expenses | | | $383 | | | | $158 | | | | $62 | |
Refer to the end of the tables for footnote.
| 308 | American Funds Insurance Series |
| The Bond Fund of America | | | | | | | | | |
| | | | | | | | | | |
| Share class | | Distribution
services | | | Insurance
administrative
services | | | Administrative
services | |
| Class 1 | | | Not applicable | | | | Not applicable | | | | $1,113 | |
| Class 1A | | | $— | | | | $88 | | | | 10 | |
| Class 2 | | | 4,207 | | | | Not applicable | | | | 505 | |
| Class 4 | | | 1,041 | | | | 1,040 | | | | 125 | |
| Total class-specific expenses | | | $5,248 | | | | $1,128 | | | | $1,753 | |
| | | | | | | | | | | | | |
| Capital World Bond Fund | | | | | | | | | | | | |
| | | | | | | | | | | | | |
| Share class | | Distribution
services | | | Insurance
administrative
services | | | Administrative
services | |
| Class 1 | | | Not applicable | | | | Not applicable | | | | $120 | |
| Class 1A | | | $— | | | | $2 | | | | — | * |
| Class 2 | | | 1,133 | | | | Not applicable | | | | 136 | |
| Class 4 | | | 75 | | | | 75 | | | | 9 | |
| Total class-specific expenses | | | $1,208 | | | | $77 | | | | $265 | |
| | | | | | | | | | | | | |
| American High-Income Trust | | | | | | | | | | | | |
| | | | | | | | | | | | | |
| Share class | | Distribution
services | | | Insurance
administrative
services | | | Administrative
services | |
| Class 1 | | | Not applicable | | | | Not applicable | | | | $37 | |
| Class 1A | | | $— | | | | $1 | | | | — | * |
| Class 2 | | | 763 | | | | Not applicable | | | | 92 | |
| Class 3 | | | 9 | | | | Not applicable | | | | 1 | |
| Class 4 | | | 102 | | | | 102 | | | | 12 | |
| Total class-specific expenses | | | $874 | | | | $103 | | | | $142 | |
| | | | | | | | | | | | | |
| American Funds Mortgage Fund | | | | | | | | | | | | |
| | | | | | | | | | | | | |
| Share class | | Distribution
services | | | Insurance
administrative
services | | | Administrative
services | |
| Class 1 | | | Not applicable | | | | Not applicable | | | | $3 | |
| Class 1A | | | $— | | | | $2 | | | | — | * |
| Class 2 | | | 67 | | | | Not applicable | | | | 8 | |
| Class 4 | | | 51 | | | | 51 | | | | 6 | |
| Total class-specific expenses | | | $118 | | | | $53 | | | | $17 | |
| | | | | | | | | | | | | |
| Ultra-Short Bond Fund | | | | | | | | | | | | |
| | | | | | | | | | | | | |
| Share class | | Distribution
services | | | Insurance
administrative
services | | | Administrative
services | |
| Class 1 | | | Not applicable | | | | Not applicable | | | | $7 | |
| Class 1A | | | $— | | | | $— | | | | — | * |
| Class 2 | | | 329 | | | | Not applicable | | | | 39 | |
| Class 3 | | | 4 | | | | Not applicable | | | | 1 | |
| Class 4 | | | 77 | | | | 77 | | | | 9 | |
| Total class-specific expenses | | | $410 | | | | $77 | | | | $56 | |
| | | | | | | | | | | | | |
| U.S. Government Securities Fund | | | | | | | | | | | | |
| | | | | | | | | | | | | |
| Share class | | Distribution
services | | | Insurance
administrative
services | | | Administrative
services | |
| Class 1 | | | Not applicable | | | | Not applicable | | | | $44 | |
| Class 1A | | | $— | | | | $5 | | | | 1 | |
| Class 2 | | | 1,582 | | | | Not applicable | | | | 190 | |
| Class 3 | | | 8 | | | | Not applicable | | | | 1 | |
| Class 4 | | | 271 | | | | 271 | | | | 32 | |
| Total class-specific expenses | | | $1,861 | | | | $276 | | | | $268 | |
| | | | | | | | | | | | | |
| Managed Risk Growth Fund | | | | | | | | | | | | |
| | | | | | | | | | | | | |
| Share class | | Distribution
services | | | Insurance
administrative
services | | | | | |
| Class P1 | | | Not applicable | | | | $13 | | | | | |
| Class P2 | | | $637 | | | | 637 | | | | | |
| Total class-specific expenses | | | $637 | | | | $650 | | | | | |
| | | | | | | | | | | | | |
| Managed Risk International Fund | | | | | | | | | | | | |
| | | | | | | | | | | | | |
| Share class | | Distribution
services | | | Insurance
administrative
services | | | | | |
| Class P1 | | | Not applicable | | | | $3 | | | | | |
| Class P2 | | | $180 | | | | 180 | | | | | |
| Total class-specific expenses | | | $180 | | | | $183 | | | | | |
Refer to the end of the tables for footnote.
| American Funds Insurance Series | 309 |
| Managed Risk Washington Mutual Investors Fund | | | | | | | | | |
| | | | | | | | | | |
| Share class | | Distribution
services | | | Insurance
administrative
services | | | | | |
| Class P1 | | | Not applicable | | | | $3 | | | | | |
| Class P2 | | | $423 | | | | 423 | | | | | |
| Total class-specific expenses | | | $423 | | | | $426 | | | | | |
| | | | | | | | | | | | | |
| Managed Risk Growth-Income Fund | | | | | | | | | | | | |
| | | | | | | | | | | | | |
| Share class | | Distribution
services | | | Insurance
administrative
services | | | | | |
| Class P1 | | | Not applicable | | | | $2,600 | | | | | |
| Class P2 | | | $376 | | | | 376 | | | | | |
| Total class-specific expenses | | | $376 | | | | $2,976 | | | | | |
| | | | | | | | | | | | | |
| Managed Risk Asset Allocation Fund | | | | | | | | | | | | |
| | | | | | | | | | | | | |
| Share class | | Distribution
services | | | Insurance
administrative
services | | | | | |
| Class P1 | | | Not applicable | | | | $9 | | | | | |
| Class P2 | | | $3,130 | | | | 3,130 | | | | | |
| Total class-specific expenses | | | $3,130 | | | | $3,139 | | | | | |
| | * | Amount less than one thousand. |
Miscellaneous fee reimbursements — CRMC reimbursed a portion of miscellaneous fees and expenses for Managed Risk International Fund. This reimbursement may be adjusted or discontinued by CRMC, subject to any restrictions in the series’ prospectus. For the six months ended June 30, 2022, total fees and expenses reimbursed by CRMC were $1,000. CRMC may recoup all or a portion of these reimbursements during the current fiscal year. Fees and expenses in each fund’s statement of operations are presented gross of any reimbursements from CRMC.
| 310 | American Funds Insurance Series |
Trustees’ deferred compensation — Trustees who are unaffiliated with CRMC may elect to defer the cash payment of part or all of their compensation. These deferred amounts, which remain as liabilities of the funds, are treated as if invested in one or more of the American Funds. These amounts represent general, unsecured liabilities of the funds and vary according to the total returns of the selected funds. Trustees’ compensation, shown on the accompanying financial statements, reflects current fees (either paid in cash or deferred) and a net decrease in the value of the deferred amounts as follows (dollars in thousands):
| | | | | | Decrease in value of | | | Total trustees’ | |
| Fund | | Current fees | | | deferred amounts | | | compensation | |
| Global Growth Fund | | $ | 12 | | | $ | (10 | ) | | $ | 2 | |
| Global Small Capitalization Fund | | | 6 | | | | (4 | ) | | | 2 | |
| Growth Fund | | | 59 | | | | (47 | ) | | | 12 | |
| International Fund | | | 12 | | | | (10 | ) | | | 2 | |
| New World Fund | | | 6 | | | | (5 | ) | | | 1 | |
| Washington Mutual Investors Fund | | | 15 | | | | (14 | ) | | | 1 | |
| Capital World Growth and Income Fund | | | 3 | | | | (3 | ) | | | — | * |
| Growth-Income Fund | | | 56 | | | | (48 | ) | | | 8 | |
| International Growth and Income Fund | | | 1 | | | | — | * | | | 1 | |
| Capital Income Builder | | | 2 | | | | (2 | ) | | | — | * |
| Asset Allocation Fund | | | 41 | | | | (37 | ) | | | 4 | |
| American Funds Global Balanced Fund | | | 1 | | | | (1 | ) | | | — | * |
| The Bond Fund of America | | | 18 | | | | (16 | ) | | | 2 | |
| Capital World Bond Fund | | | 3 | | | | (2 | ) | | | 1 | |
| American High-Income Trust | | | 1 | | | | (1 | ) | | | — | * |
| American Funds Mortgage Fund | | | — | * | | | — | * | | | — | * |
| Ultra-Short Bond Fund | | | — | * | | | — | * | | | — | * |
| U.S. Government Securities Fund | | | 3 | | | | (2 | ) | | | 1 | |
| Managed Risk Growth Fund | | | 1 | | | | (1 | ) | | | — | * |
| Managed Risk International Fund | | | — | * | | | — | * | | | — | * |
| Managed Risk Washington Mutual Investors Fund | | | — | * | | | — | * | | | — | * |
| Managed Risk Growth-Income Fund | | | 3 | | | | (3 | ) | | | — | * |
| Managed Risk Asset Allocation Fund | | | 3 | | | | (3 | ) | | | — | * |
| * | Amount less than one thousand. |
Affiliated officers and trustees — Officers and certain trustees of the series are or may be considered to be affiliated with CRMC, AFD and AFS. No affiliated officers or trustees received any compensation directly from any fund in the series.
Investments in CCBF and CCF — Some of the funds hold shares of CCBF, a corporate bond fund, and/or CCF, an institutional prime money market fund ,which are both managed by CRMC. CCBF seeks to provide maximum total return consistent with capital preservation and prudent risk management by investing primarily in corporate debt instruments. CCBF is used as an investment vehicle for some of the funds’ corporate bond investments. CCF invests in high-quality, short-term money market instruments. CCF is used as the primary investment vehicle for some of the funds’ short-term investments. Both CCBF and CCF shares are only available for purchase by CRMC, its affiliates, and other funds managed by CRMC or its affiliates, and are not available to the public. CRMC does not receive an investment advisory services fee from either CCBF or CCF.
Security transactions with related funds — The funds may purchase from, or sell securities to, other CRMC-managed funds (or funds managed by certain affiliates of CRMC) under procedures adopted by the fund’s board of trustees. The funds involved in such transactions are considered related by virtue of having a common investment adviser (or affiliated investment advisers), common trustees and/or common officers. When such transactions occur, each transaction is executed at the current market price of the security and no brokerage commissions or fees are paid in accordance with Rule 17a-7 of the 1940 Act.
| American Funds Insurance Series | 311 |
The following table presents purchase and sale transactions between each fund and related funds, and net realized loss or gain from such sales, if any, as of June 30, 2022 (dollars in thousands):
| | | | | | | | | Net | |
| | | | | | | | | realized | |
| Fund | | Purchases | | | Sales | | | (loss) gain | |
| Global Growth Fund | | $ | 24,133 | | | $ | 58,043 | | | $ | (17,383 | ) |
| Global Small Capitalization Fund | | | 46,217 | | | | 22,871 | | | | 6,008 | |
| Growth Fund | | | 142,908 | | | | 202,076 | | | | 50,416 | |
| International Fund | | | 32,016 | | | | 108,702 | | | | (19,737 | ) |
| New World Fund | | | 22,145 | | | | 39,739 | | | | 2,871 | |
| Washington Mutual Investors Fund | | | 58,558 | | | | 50,125 | | | | (7,063 | ) |
| Capital World Growth and Income Fund | | | 20,398 | | | | 24,276 | | | | (47 | ) |
| Growth-Income Fund | | | 234,608 | | | | 237,623 | | | | 40,250 | |
| International Growth and Income Fund | | | 1,956 | | | | 2,147 | | | | (112 | ) |
| Capital Income Builder | | | 6,219 | | | | 6,738 | | | | 754 | |
| Asset Allocation Fund | | | 170,065 | | | | 89,729 | | | | (1,046 | ) |
| American Funds Global Balanced Fund | | | 2,516 | | | | 2,384 | | | | 390 | |
| The Bond Fund of America | | | 1,289 | | | | 4,841 | | | | (631 | ) |
| Capital World Bond Fund | | | 58 | | | | 8,678 | | | | (127 | ) |
| American High-Income Trust | | | 57 | | | | 15,977 | | | | (14 | ) |
8. Indemnifications
The series’ organizational documents provide board members and officers with indemnification against certain liabilities or expenses in connection with the performance of their duties to the series. In the normal course of business, the series may also enter into contracts that provide general indemnifications. Each fund’s maximum exposure under these arrangements is unknown since it is dependent on future claims that may be made against the series. The risk of material loss from such claims is considered remote. Insurance policies are also available to the series’ board members and officers.
9. Committed line of credit
Global Small Capitalization Fund, New World Fund and American High-Income Trust participate with other funds managed by CRMC in a $1.5 billion credit facility (the “line of credit”) to be utilized for temporary purposes to fund shareholder redemptions. Each fund has agreed to pay commitment fees on its pro-rata portion of the line of credit, which are reflected in other expenses in each fund’s statement of operations. None of the funds borrowed on this line of credit at any time during the six months ended June 30, 2022.
| 312 | American Funds Insurance Series |
10. Capital share transactions
Capital share transactions in each fund were as follows (dollars and shares in thousands):
Global Growth Fund
| | | Sales* | | | Reinvestments of
distributions | | | Repurchases* | | | Net increase
(decrease) | |
| Share class | | Amount | | | Shares | | | Amount | | | Shares | | | Amount | | | Shares | | | Amount | | | Shares | |
| | | | | | | | | | | | | | | | | | | | | | | | | | | | | | | | | |
| Six months ended June 30, 2022 | | | | | | | | | | | | | | | | | |
| | | | | | | | | | | | | | | | | | | | | | | | | | | | | | | | | |
| Class 1 | | $ | 273,862 | | | | 7,524 | | | $ | 377,769 | | | | 11,989 | | | $ | (284,167 | ) | | | (7,787 | ) | | $ | 367,464 | | | | 11,726 | |
| Class 1A | | | 1,562 | | | | 43 | | | | 1,684 | | | | 53 | | | | (642 | ) | | | (17 | ) | | | 2,604 | | | | 79 | |
| Class 2 | | | 69,775 | | | | 1,930 | | | | 402,881 | | | | 12,959 | | | | (133,903 | ) | | | (3,589 | ) | | | 338,753 | | | | 11,300 | |
| Class 4 | | | 57,684 | | | | 1,572 | | | | 68,692 | | | | 2,232 | | | | (37,597 | ) | | | (1,036 | ) | | | 88,779 | | | | 2,768 | |
| Total net increase (decrease) | | $ | 402,883 | | | | 11,069 | | | $ | 851,026 | | | | 27,233 | | | $ | (456,309 | ) | | | (12,429 | ) | | $ | 797,600 | | | | 25,873 | |
| | | | | | | | | | | | | | | | | | | | | | | | | | | | | | | | | |
| Year ended December 31, 2021 | | | | | | | | | | | | | | | | | |
| | | | | | | | | | | | | | | | | | | | | | | | | | | | | | | | | |
| Class 1 | | $ | 683,154 | | | | 15,421 | | | $ | 216,944 | | | | 5,062 | | | $ | (307,264 | ) | | | (6,960 | ) | | $ | 592,834 | | | | 13,523 | |
| Class 1A | | | 6,731 | | | | 151 | | | | 700 | | | | 17 | | | | (2,591 | ) | | | (58 | ) | | | 4,840 | | | | 110 | |
| Class 2 | | | 69,770 | | | | 1,607 | | | | 236,612 | | | | 5,601 | | | | (588,817 | ) | | | (13,514 | ) | | | (282,435 | ) | | | (6,306 | ) |
| Class 4 | | | 167,855 | | | | 3,876 | | | | 32,087 | | | | 766 | | | | (48,523 | ) | | | (1,127 | ) | | | 151,419 | | | | 3,515 | |
| Total net increase (decrease) | | $ | 927,510 | | | | 21,055 | | | $ | 486,343 | | | | 11,446 | | | $ | (947,195 | ) | | | (21,659 | ) | | $ | 466,658 | | | | 10,842 | |
Global Small Capitalization Fund
| | | Sales* | | | Reinvestments of
distributions | | | Repurchases* | | | Net (decrease)
increase | |
| Share class | | Amount | | | Shares | | | Amount | | | Shares | | | Amount | | | Shares | | | Amount | | | Shares | |
| | | | | | | | | | | | | | | | | | | | | | | | | | | | | | | | | |
| Six months ended June 30, 2022 | | | | | | | | | | | | | | | | | |
| | | | | | | | | | | | | | | | | | | | | | | | | | | | | | | | | |
| Class 1 | | $ | 111,112 | | | | 4,411 | | | $ | 331,498 | | | | 19,030 | | | $ | (458,899 | ) | | | (14,826 | ) | | $ | (16,289 | ) | | | 8,615 | |
| Class 1A | | | 666 | | | | 23 | | | | 1,461 | | | | 85 | | | | (95 | ) | | | (4 | ) | | | 2,032 | | | | 104 | |
| Class 2 | | | 88,158 | | | | 3,511 | | | | 663,046 | | | | 40,307 | | | | (40,790 | ) | | | (1,629 | ) | | | 710,414 | | | | 42,189 | |
| Class 4 | | | 40,538 | | | | 1,605 | | | | 93,892 | | | | 5,707 | | | | (21,262 | ) | | | (857 | ) | | | 113,168 | | | | 6,455 | |
| Total net increase (decrease) | | $ | 240,474 | | | | 9,550 | | | $ | 1,089,897 | | | | 65,129 | | | $ | (521,046 | ) | | | (17,316 | ) | | $ | 809,325 | | | | 57,363 | |
| | | | | | | | | | | | | | | | | | | | | | | | | | | | | | | | | |
| Year ended December 31, 2021 | | | | | | | | | | | | | | | | | |
| | | | | | | | | | | | | | | | | | | | | | | | | | | | | | | | | |
| Class 1 | | $ | 216,763 | | | | 6,235 | | | $ | 55,510 | | | | 1,581 | | | $ | (1,077,292 | ) | | | (31,128 | ) | | $ | (805,019 | ) | | | (23,312 | ) |
| Class 1A | | | 4,095 | | | | 118 | | | | 39 | | | | 1 | | | | (153 | ) | | | (4 | ) | | | 3,981 | | | | 115 | |
| Class 2 | | | 59,596 | | | | 1,785 | | | | 60,246 | | | | 1,778 | | | | (374,611 | ) | | | (11,071 | ) | | | (254,769 | ) | | | (7,508 | ) |
| Class 4 | | | 89,704 | | | | 2,662 | | | | 7,215 | | | | 212 | | | | (30,621 | ) | | | (901 | ) | | | 66,298 | | | | 1,973 | |
| Total net increase (decrease) | | $ | 370,158 | | | | 10,800 | | | $ | 123,010 | | | | 3,572 | | | $ | (1,482,677 | ) | | | (43,104 | ) | | $ | (989,509 | ) | | | (28,732 | ) |
Refer to the end of the tables for footnote.
| American Funds Insurance Series | 313 |
Growth Fund
| | | Sales* | | | Reinvestments of
distributions | | | Repurchases* | | | Net increase
(decrease) | |
| Share class | | Amount | | | Shares | | | Amount | | | Shares | | | Amount | | | Shares | | | Amount | | | Shares | |
| | | | | | | | | | | | | | | | | | | | | | | | | | | | | | | | | |
| Six months ended June 30, 2022 | | | | | | | | | | | | | | | | | |
| | | | | | | | | | | | | | | | | | | | | | | | | | | | | | | | | |
| Class 1 | | $ | 1,418,602 | | | | 14,319 | | | $ | 2,160,726 | | | | 25,260 | | | $ | (1,966,844 | ) | | | (17,733 | ) | | $ | 1,612,484 | | | | 21,846 | |
| Class 1A | | | 115,655 | | | | 1,164 | | | | 26,453 | | | | 312 | | | | (12,579 | ) | | | (146 | ) | | | 129,529 | | | | 1,330 | |
| Class 2 | | | 329,809 | | | | 3,246 | | | | 2,426,880 | | | | 28,730 | | | | (942,383 | ) | | | (8,773 | ) | | | 1,814,306 | | | | 23,203 | |
| Class 3 | | | 732 | | | | 8 | | | | 31,781 | | | | 368 | | | | (17,151 | ) | | | (161 | ) | | | 15,362 | | | | 215 | |
| Class 4 | | | 219,002 | | | | 2,173 | | | | 382,419 | | | | 4,638 | | | | (124,223 | ) | | | (1,212 | ) | | | 477,198 | | | | 5,599 | |
| Total net increase (decrease) | | $ | 2,083,800 | | | | 20,910 | | | $ | 5,028,259 | | | | 59,308 | | | $ | (3,063,180 | ) | | | (28,025 | ) | | $ | 4,048,879 | | | | 52,193 | |
| | | | | | | | | | | | | | | | | | | | | | | | | | | | | | | | | |
| Year ended December 31, 2021 | | | | | | | | | | | | | | | | | |
| | | | | | | | | | | | | | | | | | | | | | | | | | | | | | | | | |
| Class 1 | | $ | 2,916,865 | | | | 22,963 | | | $ | 2,251,516 | | | | 19,653 | | | $ | (2,207,142 | ) | | | (17,684 | ) | | $ | 2,961,239 | | | | 24,932 | |
| Class 1A | | | 68,640 | | | | 560 | | | | 9,733 | | | | 86 | | | | (25,312 | ) | | | (198 | ) | | | 53,061 | | | | 448 | |
| Class 2 | | | 432,245 | | | | 3,495 | | | | 2,777,848 | | | | 24,558 | | | | (3,289,822 | ) | | | (26,755 | ) | | | (79,729 | ) | | | 1,298 | |
| Class 3 | | | 1,972 | | | | 15 | | | | 37,541 | | | | 326 | | | | (37,449 | ) | | | (298 | ) | | | 2,064 | | | | 43 | |
| Class 4 | | | 553,762 | | | | 4,582 | | | | 358,034 | | | | 3,232 | | | | (224,958 | ) | | | (1,864 | ) | | | 686,838 | | | | 5,950 | |
| Total net increase (decrease) | | $ | 3,973,484 | | | | 31,615 | | | $ | 5,434,672 | | | | 47,855 | | | $ | (5,784,683 | ) | | | (46,799 | ) | | $ | 3,623,473 | | | | 32,671 | |
International Fund
| | | Sales* | | | Reinvestments of
distributions | | | Repurchases* | | | Net (decrease)
increase | |
| Share class | | Amount | | | Shares | | | Amount | | | Shares | | | Amount | | | Shares | | | Amount | | | Shares | |
| | | | | | | | | | | | | | | | | | | | | | | | | | | | | | | | | |
| Six months ended June 30, 2022 | | | | | | | | | | | | | | | | | |
| | | | | | | | | | | | | | | | | | | | | | | | | | | | | | | | | |
| Class 1 | | $ | 189,487 | | | | 9,858 | | | $ | 492,954 | | | | 29,203 | | | $ | (776,461 | ) | | | (35,444 | ) | | $ | (94,020 | ) | | | 3,617 | |
| Class 1A | | | 1,330 | | | | 67 | | | | 1,531 | | | | 91 | | | | (279 | ) | | | (15 | ) | | | 2,582 | | | | 143 | |
| Class 2 | | | 121,066 | | | | 6,076 | | | | 492,662 | | | | 29,343 | | | | (172,369 | ) | | | (8,901 | ) | | | 441,359 | | | | 26,518 | |
| Class 3 | | | 46 | | | | 2 | | | | 2,404 | | | | 142 | | | | (724 | ) | | | (37 | ) | | | 1,726 | | | | 107 | |
| Class 4 | | | 44,120 | | | | 2,249 | | | | 57,111 | | | | 3,457 | | | | (29,344 | ) | | | (1,562 | ) | | | 71,887 | | | | 4,144 | |
| Total net increase (decrease) | | $ | 356,049 | | | | 18,252 | | | $ | 1,046,662 | | | | 62,236 | | | $ | (979,177 | ) | | | (45,959 | ) | | $ | 423,534 | | | | 34,529 | |
| | | | | | | | | | | | | | | | | | | | | | | | | | | | | | | | | |
| Year ended December 31, 2021 | | | | | | | | | | | | | | | | | |
| | | | | | | | | | | | | | | | | | | | | | | | | | | | | | | | | |
| Class 1 | | $ | 366,681 | | | | 15,339 | | | $ | 131,729 | | | | 5,782 | | | $ | (1,253,303 | ) | | | (51,135 | ) | | $ | (754,893 | ) | | | (30,014 | ) |
| Class 1A | | | 4,570 | | | | 192 | | | | 281 | | | | 13 | | | | (2,479 | ) | | | (103 | ) | | | 2,372 | | | | 102 | |
| Class 2 | | | 264,867 | | | | 11,161 | | | | 105,815 | | | | 4,673 | | | | (502,502 | ) | | | (20,818 | ) | | | (131,820 | ) | | | (4,984 | ) |
| Class 3 | | | 125 | | | | 5 | | | | 546 | | | | 24 | | | | (3,534 | ) | | | (146 | ) | | | (2,863 | ) | | | (117 | ) |
| Class 4 | | | 95,888 | | | | 4,069 | | | | 10,725 | | | | 480 | | | | (51,434 | ) | | | (2,169 | ) | | | 55,179 | | | | 2,380 | |
| Total net increase (decrease) | | $ | 732,131 | | | | 30,766 | | | $ | 249,096 | | | | 10,972 | | | $ | (1,813,252 | ) | | | (74,371 | ) | | $ | (832,025 | ) | | | (32,633 | ) |
Refer to the end of the tables for footnote.
| 314 | American Funds Insurance Series |
New World Fund
| | | Sales* | | | Reinvestments of
distributions | | | Repurchases* | | | Net (decrease)
increase | |
| Share class | | Amount | | | Shares | | | Amount | | | Shares | | | Amount | | | Shares | | | Amount | | | Shares | |
| | | | | | | | | | | | | | | | | | | | | | | | | | | | | | | | | |
| Six months ended June 30, 2022 | | | | | | | | | | | | | | | | | |
| | | | | | | | | | | | | | | | | | | | | | | | | | | | | | | | | |
| Class 1 | | $ | 45,979 | | | | 1,663 | | | $ | 171,266 | | | | 7,136 | | | $ | (285,724 | ) | | | (9,475 | ) | | $ | (68,479 | ) | | | (676 | ) |
| Class 1A | | | 1,018 | | | | 36 | | | | 956 | | | | 41 | | | | (427 | ) | | | (16 | ) | | | 1,547 | | | | 61 | |
| Class 2 | | | 43,469 | | | | 1,599 | | | | 81,333 | | | | 3,433 | | | | (89,598 | ) | | | (3,176 | ) | | | 35,204 | | | | 1,856 | |
| Class 4 | | | 102,955 | | | | 3,913 | | | | 73,618 | | | | 3,136 | | | | (73,328 | ) | | | (2,849 | ) | | | 103,245 | | | | 4,200 | |
| Total net increase (decrease) | | $ | 193,421 | | | | 7,211 | | | $ | 327,173 | | | | 13,746 | | | $ | (449,077 | ) | | | (15,516 | ) | | $ | 71,517 | | | | 5,441 | |
| | | | | | | | | | | | | | | | | | | | | | | | | | | | | | | | | |
| Year ended December 31, 2021 | | | | | | | | | | | | | | | | | |
| | | | | | | | | | | | | | | | | | | | | | | | | | | | | | | | | |
| Class 1 | | $ | 180,001 | | | | 5,517 | | | $ | 104,795 | | | | 3,183 | | | $ | (165,865 | ) | | | (5,053 | ) | | $ | 118,931 | | | | 3,647 | |
| Class 1A | | | 14,137 | | | | 436 | | | | 350 | | | | 11 | | | | (21,114 | ) | | | (642 | ) | | | (6,627 | ) | | | (195 | ) |
| Class 2 | | | 82,347 | | | | 2,547 | | | | 45,947 | | | | 1,410 | | | | (159,868 | ) | | | (4,915 | ) | | | (31,574 | ) | | | (958 | ) |
| Class 4 | | | 135,084 | | | | 4,224 | | | | 34,360 | | | | 1,061 | | | | (74,083 | ) | | | (2,295 | ) | | | 95,361 | | | | 2,990 | |
| Total net increase (decrease) | | $ | 411,569 | | | | 12,724 | | | $ | 185,452 | | | | 5,665 | | | $ | (420,930 | ) | | | (12,905 | ) | | $ | 176,091 | | | | 5,484 | |
Washington Mutual Investors Fund
| | | Sales* | | | Reinvestments of
distributions | | | Repurchases* | | | Net increase
(decrease) | |
| Share class | | Amount | | | Shares | | | Amount | | | Shares | | | Amount | | | Shares | | | Amount | | | Shares | |
| | | | | | | | | | | | | | | | | | | | | | | | | | | | | | | | | |
| Six months ended June 30, 2022 | | | | | | | | | | | | | | | | | |
| | | | | | | | | | | | | | | | | | | | | | | | | | | | | | | | | |
| Class 1 | | $ | 170,655 | | | | 10,953 | | | $ | 1,318,644 | | | | 99,146 | | | $ | (631,285 | ) | | | (37,687 | ) | | $ | 858,014 | | | | 72,412 | |
| Class 1A | | | 27,315 | | | | 1,793 | | | | 13,158 | | | | 997 | | | | (122,921 | ) | | | (7,521 | ) | | | (82,448 | ) | | | (4,731 | ) |
| Class 2 | | | 23,873 | | | | 1,497 | | | | 682,809 | | | | 52,323 | | | | (246,841 | ) | | | (15,113 | ) | | | 459,841 | | | | 38,707 | |
| Class 4 | | | 140,004 | | | | 8,625 | | | | 243,178 | | | | 18,822 | | | | (99,844 | ) | | | (6,147 | ) | | | 283,338 | | | | 21,300 | |
| Total net increase (decrease) | | $ | 361,847 | | | | 22,868 | | | $ | 2,257,789 | | | | 171,288 | | | $ | (1,100,891 | ) | | | (66,468 | ) | | $ | 1,518,745 | | | | 127,688 | |
| | | | | | | | | | | | | | | | | | | | | | | | | | | | | | | | | |
| Year ended December 31, 2021 | | | | | | | | | | | | | | | | | |
| | | | | | | | | | | | | | | | | | | | | | | | | | | | | | | | | |
| Class 1 | | $ | 740,227 | | | | 42,419 | | | $ | 104,068 | | | | 6,017 | | | $ | (1,150,862 | ) | | | (70,448 | ) | | $ | (306,567 | ) | | | (22,012 | ) |
| Class 1A | | | 128,020 | | | | 7,779 | | | | 2,211 | | | | 129 | | | | (4,020 | ) | | | (244 | ) | | | 126,211 | | | | 7,664 | |
| Class 2 | | | 51,950 | | | | 3,263 | | | | 46,652 | | | | 2,739 | | | | (508,810 | ) | | | (31,581 | ) | | | (410,208 | ) | | | (25,579 | ) |
| Class 4 | | | 156,222 | | | | 9,709 | | | | 12,620 | | | | 746 | | | | (66,538 | ) | | | (4,145 | ) | | | 102,304 | | | | 6,310 | |
| Total net increase (decrease) | | $ | 1,076,419 | | | | 63,170 | | | $ | 165,551 | | | | 9,631 | | | $ | (1,730,230 | ) | | | (106,418 | ) | | $ | (488,260 | ) | | | (33,617 | ) |
Capital World Growth and Income Fund
| | | Sales* | | | Reinvestments of
distributions | | | Repurchases* | | | Net increase
(decrease) | |
| Share class | | Amount | | | Shares | | | Amount | | | Shares | | | Amount | | | Shares | | | Amount | | | Shares | |
| | | | | | | | | | | | | | | | | | | | | | | | | | | | | | | | | |
| Six months ended June 30, 2022 | | | | | | | | | | | | | | | | | |
| | | | | | | | | | | | | | | | | | | | | | | | | | | | | | | | | |
| Class 1 | | $ | 156,039 | | | | 10,673 | | | $ | 126,337 | | | | 10,011 | | | $ | (271,686 | ) | | | (16,130 | ) | | $ | 10,690 | | | | 4,554 | |
| Class 1A | | | 1,016 | | | | 61 | | | | 1,412 | | | | 112 | | | | (206 | ) | | | (13 | ) | | | 2,222 | | | | 160 | |
| Class 2 | | | 8,074 | | | | 517 | | | | 244,375 | | | | 19,426 | | | | (80,834 | ) | | | (5,060 | ) | | | 171,615 | | | | 14,883 | |
| Class 4 | | | 15,715 | | | | 1,031 | | | | 44,890 | | | | 3,658 | | | | (11,105 | ) | | | (711 | ) | | | 49,500 | | | | 3,978 | |
| Total net increase (decrease) | | $ | 180,844 | | | | 12,282 | | | $ | 417,014 | | | | 33,207 | | | $ | (363,831 | ) | | | (21,914 | ) | | $ | 234,027 | | | | 23,575 | |
| | | | | | | | | | | | | | | | | | | | | | | | | | | | | | | | | |
| Year ended December 31, 2021 | | | | | | | | | | | | | | | | | |
| | | | | | | | | | | | | | | | | | | | | | | | | | | | | | | | | |
| Class 1 | | $ | 171,552 | | | | 9,531 | | | $ | 30,555 | | | | 1,698 | | | $ | (117,328 | ) | | | (6,578 | ) | | $ | 84,779 | | | | 4,651 | |
| Class 1A | | | 4,092 | | | | 231 | | | | 166 | | | | 9 | | | | (605 | ) | | | (34 | ) | | | 3,653 | | | | 206 | |
| Class 2 | | | 21,440 | | | | 1,205 | | | | 50,935 | | | | 2,838 | | | | (216,241 | ) | | | (12,206 | ) | | | (143,866 | ) | | | (8,163 | ) |
| Class 4 | | | 49,326 | | | | 2,833 | | | | 7,530 | | | | 427 | | | | (16,390 | ) | | | (939 | ) | | | 40,466 | | | | 2,321 | |
| Total net increase (decrease) | | $ | 246,410 | | | | 13,800 | | | $ | 89,186 | | | | 4,972 | | | $ | (350,564 | ) | | | (19,757 | ) | | $ | (14,968 | ) | | | (985 | ) |
Refer to the end of the tables for footnote.
| American Funds Insurance Series | 315 |
Growth-Income Fund
| | | Sales* | | | Reinvestments of
distributions | | | Repurchases* | | | Net increase
(decrease) | |
| Share class | | Amount | | | Shares | | | Amount | | | Shares | | | Amount | | | Shares | | | Amount | | | Shares | |
| | | | | | | | | | | | | | | | | | | | | | | | | | | | | | | | | |
| Six months ended June 30, 2022 | | | | | | | | | | | | | | | | | |
| | | | | | | | | | | | | | | | | | | | | | | | | | | | | | | | | |
| Class 1 | | $ | 983,994 | | | | 17,287 | | | $ | 2,096,076 | | | | 38,989 | | | $ | (2,268,124 | ) | | | (37,172 | ) | | $ | 811,946 | | | | 19,104 | |
| Class 1A | | | 2,189 | | | | 36 | | | | 2,936 | | | | 55 | | | | (670 | ) | | | (11 | ) | | | 4,455 | | | | 80 | |
| Class 2 | | | 66,467 | | | | 1,141 | | | | 1,275,290 | | | | 24,099 | | | | (803,795 | ) | | | (13,518 | ) | | | 537,962 | | | | 11,722 | |
| Class 3 | | | 362 | | | | 7 | | | | 13,623 | | | | 253 | | | | (8,613 | ) | | | (141 | ) | | | 5,372 | | | | 119 | |
| Class 4 | | | 105,911 | | | | 1,821 | | | | 171,931 | | | | 3,299 | | | | (79,148 | ) | | | (1,352 | ) | | | 198,694 | | | | 3,768 | |
| Total net increase (decrease) | | $ | 1,158,923 | | | | 20,292 | | | $ | 3,559,856 | | | | 66,695 | | | $ | (3,160,350 | ) | | | (52,194 | ) | | $ | 1,558,429 | | | | 34,793 | |
| | | | | | | | | | | | | | | | | | | | | | | | | | | | | | | | | |
| Year ended December 31, 2021 | | | | | | | | | | | | | | | | | |
| | | | | | | | | | | | | | | | | | | | | | | | | | | | | | | | | |
| Class 1 | | $ | 778,306 | | | | 12,603 | | | $ | 567,351 | | | | 8,928 | | | $ | (3,472,494 | ) | | | (56,343 | ) | | $ | (2,126,837 | ) | | | (34,812 | ) |
| Class 1A | | | 14,065 | | | | 224 | | | | 493 | | | | 8 | | | | (2,433 | ) | | | (39 | ) | | | 12,125 | | | | 193 | |
| Class 2 | | | 143,239 | | | | 2,361 | | | | 310,023 | | | | 4,964 | | | | (2,027,406 | ) | | | (33,135 | ) | | | (1,574,144 | ) | | | (25,810 | ) |
| Class 3 | | | 1,007 | | | | 16 | | | | 3,442 | | | | 54 | | | | (23,575 | ) | | | (379 | ) | | | (19,126 | ) | | | (309 | ) |
| Class 4 | | | 302,016 | | | | 4,995 | | | | 33,018 | | | | 536 | | | | (132,399 | ) | | | (2,191 | ) | | | 202,635 | | | | 3,340 | |
| Total net increase (decrease) | | $ | 1,238,633 | | | | 20,199 | | | $ | 914,327 | | | | 14,490 | | | $ | (5,658,307 | ) | | | (92,087 | ) | | $ | (3,505,347 | ) | | | (57,398 | ) |
International Growth and Income Fund
| | | Sales* | | | Reinvestments of
distributions | | | Repurchases* | | | Net (decrease)
increase | |
| Share class | | Amount | | | Shares | | | Amount | | | Shares | | | Amount | | | Shares | | | Amount | | | Shares | |
| | | | | | | | | | | | | | | | | | | | | | | | | | | | | | | | | |
| Six months ended June 30, 2022 | | | | | | | | | | | | | | | | | |
| | | | | | | | | | | | | | | | | | | | | | | | | | | | | | | | | |
| Class 1 | | $ | 1,807 | | | | 106 | | | $ | 6,120 | | | | 644 | | | $ | (16,055 | ) | | | (867 | ) | | $ | (8,128 | ) | | | (117 | ) |
| Class 1A | | | 559 | | | | 34 | | | | 2,120 | | | | 228 | | | | (778 | ) | | | (44 | ) | | | 1,901 | | | | 218 | |
| Class 2 | | | 4,942 | | | | 323 | | | | 81,734 | | | | 8,827 | | | | (12,548 | ) | | | (849 | ) | | | 74,128 | | | | 8,301 | |
| Class 4 | | | 13,542 | | | | 835 | | | | 55,945 | | | | 6,134 | | | | (6,965 | ) | | | (454 | ) | | | 62,522 | | | | 6,515 | |
| Total net increase (decrease) | | $ | 20,850 | | | | 1,298 | | | $ | 145,919 | | | | 15,833 | | | $ | (36,346 | ) | | | (2,214 | ) | | $ | 130,423 | | | | 14,917 | |
| | | | | | | | | | | | | | | | | | | | | | | | | | | | | | | | | |
| Year ended December 31, 2021 | | | | | | | | | | | | | | | | | |
| | | | | | | | | | | | | | | | | | | | | | | | | | | | | | | | | |
| Class 1 | | $ | 48,015 | | | | 2,368 | | | $ | 4,294 | | | | 210 | | | $ | (1,169,382 | ) | | | (59,936 | ) | | $ | (1,117,073 | ) | | | (57,358 | ) |
| Class 1A | | | 2,986 | | | | 152 | | | | 141 | | | | 7 | | | | (561 | ) | | | (28 | ) | | | 2,566 | | | | 131 | |
| Class 2 | | | 8,004 | | | | 401 | | | | 6,218 | | | | 322 | | | | (29,755 | ) | | | (1,507 | ) | | | (15,533 | ) | | | (784 | ) |
| Class 4 | | | 27,229 | | | | 1,381 | | | | 3,589 | | | | 188 | | | | (13,127 | ) | | | (671 | ) | | | 17,691 | | | | 898 | |
| Total net increase (decrease) | | $ | 86,234 | | | | 4,302 | | | $ | 14,242 | | | | 727 | | | $ | (1,212,825 | ) | | | (62,142 | ) | | $ | (1,112,349 | ) | | | (57,113 | ) |
Refer to the end of the tables for footnote.
| 316 | American Funds Insurance Series |
Capital Income Builder
| | | Sales* | | | Reinvestments of
distributions | | | Repurchases* | | | Net increase
(decrease) | |
| Share class | | Amount | | | Shares | | | Amount | | | Shares | | | Amount | | | Shares | | | Amount | | | Shares | |
| | | | | | | | | | | | | | | | | | | | | | | | | | | | | | | | | |
| Six months ended June 30, 2022 | | | | | | | | | | | | | | | | | |
| | | | | | | | | | | | | | | | | | | | | | | | | | | | | | | | | |
| Class 1 | | $ | 105,918 | | | | 9,131 | | | $ | 6,605 | | | | 574 | | | $ | (59,641 | ) | | | (5,118 | ) | | $ | 52,882 | | | | 4,587 | |
| Class 1A | | | 1,472 | | | | 127 | | | | 99 | | | | 9 | | | | (506 | ) | | | (44 | ) | | | 1,065 | | | | 92 | |
| Class 2 | | | 1,275 | | | | 109 | | | | 129 | | | | 11 | | | | (694 | ) | | | (59 | ) | | | 710 | | | | 61 | |
| Class 4 | | | 73,501 | | | | 6,361 | | | | 4,982 | | | | 434 | | | | (53,679 | ) | | | (4,680 | ) | | | 24,804 | | | | 2,115 | |
| Total net increase (decrease) | | $ | 182,166 | | | | 15,728 | | | $ | 11,815 | | | | 1,028 | | | $ | (114,520 | ) | | | (9,901 | ) | | $ | 79,461 | | | | 6,855 | |
| | | | | | | | | | | | | | | | | | | | | | | | | | | | | | | | | |
| Year ended December 31, 2021 | | | | | | | | | | | | | | | | | |
| | | | | | | | | | | | | | | | | | | | | | | | | | | | | | | | | |
| Class 1 | | $ | 107,711 | | | | 9,192 | | | $ | 16,222 | | | | 1,379 | | | $ | (252,397 | ) | | | (21,377 | ) | | $ | (128,464 | ) | | | (10,806 | ) |
| Class 1A | | | 2,434 | | | | 206 | | | | 218 | | | | 19 | | | | (451 | ) | | | (39 | ) | | | 2,201 | | | | 186 | |
| Class 2 | | | 5,007 | | | | 428 | | | | 315 | | | | 27 | | | | (1,572 | ) | | | (134 | ) | | | 3,750 | | | | 321 | |
| Class 4 | | | 70,040 | | | | 6,029 | | | | 13,009 | | | | 1,105 | | | | (42,227 | ) | | | (3,629 | ) | | | 40,822 | | | | 3,505 | |
| Total net increase (decrease) | | $ | 185,192 | | | | 15,855 | | | $ | 29,764 | | | | 2,530 | | | $ | (296,647 | ) | | | (25,179 | ) | | $ | (81,691 | ) | | | (6,794 | ) |
Asset Allocation Fund
| | | Sales* | | | Reinvestments of
distributions | | | Repurchases* | | | Net increase
(decrease) | |
| Share class | | Amount | | | Shares | | | Amount | | | Shares | | | Amount | | | Shares | | | Amount | | | Shares | |
| | | | | | | | | | | | | | | | | | | | | | | | | | | | | | | | | |
| Six months ended June 30, 2022 | | | | | | | | | | | | | | | | | |
| | | | | | | | | | | | | | | | | | | | | | | | | | | | | | | | | |
| Class 1 | | $ | 695,260 | | | | 27,254 | | | $ | 1,732,314 | | | | 73,497 | | | $ | (1,348,858 | ) | | | (51,932 | ) | | $ | 1,078,716 | | | | 48,819 | |
| Class 1A | | | 1,613 | | | | 60 | | | | 2,373 | | | | 101 | | | | (702 | ) | | | (26 | ) | | | 3,284 | | | | 135 | |
| Class 2 | | | 35,471 | | | | 1,372 | | | | 498,300 | | | | 21,432 | | | | (320,105 | ) | | | (12,327 | ) | | | 213,666 | | | | 10,477 | |
| Class 3 | | | 97 | | | | 4 | | | | 3,299 | | | | 140 | | | | (1,639 | ) | | | (63 | ) | | | 1,757 | | | | 81 | |
| Class 4 | | | 183,834 | | | | 7,102 | | | | 606,235 | | | | 26,278 | | | | (200,321 | ) | | | (7,744 | ) | | | 589,748 | | | | 25,636 | |
| Total net increase (decrease) | | $ | 916,275 | | | | 35,792 | | | $ | 2,842,521 | | | | 121,448 | | | $ | (1,871,625 | ) | | | (72,092 | ) | | $ | 1,887,171 | | | | 85,148 | |
| | | | | | | | | | | | | | | | | | | | | | | | | | | | | | | | | |
| Year ended December 31, 2021 | | | | | | | | | | | | | | | | | |
| | | | | | | | | | | | | | | | | | | | | | | | | | | | | | | | | |
| Class 1 | | $ | 1,077,099 | | | | 38,077 | | | $ | 1,004,165 | | | | 35,557 | | | $ | (4,395,063 | ) | | | (151,941 | ) | | $ | (2,313,799 | ) | | | (78,307 | ) |
| Class 1A | | | 8,925 | | | | 315 | | | | 880 | | | | 31 | | | | (1,749 | ) | | | (63 | ) | | | 8,056 | | | | 283 | |
| Class 2 | | | 117,974 | | | | 4,243 | | | | 262,797 | | | | 9,420 | | | | (649,009 | ) | | | (23,286 | ) | | | (268,238 | ) | | | (9,623 | ) |
| Class 3 | | | 1,030 | | | | 36 | | | | 1,693 | | | | 60 | | | | (2,340 | ) | | | (83 | ) | | | 383 | | | | 13 | |
| Class 4 | | | 687,105 | | | | 24,820 | | | | 271,781 | | | | 9,809 | | | | (264,761 | ) | | | (9,619 | ) | | | 694,125 | | | | 25,010 | |
| Total net increase (decrease) | | $ | 1,892,133 | | | | 67,491 | | | $ | 1,541,316 | | | | 54,877 | | | $ | (5,312,922 | ) | | | (184,992 | ) | | $ | (1,879,473 | ) | | | (62,624 | ) |
Refer to the end of the tables for footnote.
| American Funds Insurance Series | 317 |
American Funds Global Balanced Fund
| | | Sales* | | | Reinvestments of
distributions | | | Repurchases* | | | Net (decrease)
increase | |
| Share class | | Amount | | | Shares | | | Amount | | | Shares | | | Amount | | | Shares | | | Amount | | | Shares | |
| | | | | | | | | | | | | | | | | | | | | | | | | | | | | | | | | |
| Six months ended June 30, 2022 | | | | | | | | | | | | | | | | | |
| | | | | | | | | | | | | | | | | | | | | | | | | | | | | | | | | |
| Class 1 | | $ | 16,606 | | | | 1,287 | | | $ | 570 | | | | 43 | | | $ | (19,200 | ) | | | (1,441 | ) | | $ | (2,024 | ) | | | (111 | ) |
| Class 1A | | | 141 | | | | 11 | | | | 15 | | | | 1 | | | | (749 | ) | | | (54 | ) | | | (593 | ) | | | (42 | ) |
| Class 2 | | | 1,967 | | | | 144 | | | | 973 | | | | 74 | | | | (14,390 | ) | | | (1,068 | ) | | | (11,450 | ) | | | (850 | ) |
| Class 4 | | | 5,702 | | | | 425 | | | | 674 | | | | 53 | | | | (7,031 | ) | | | (529 | ) | | | (655 | ) | | | (51 | ) |
| Total net increase (decrease) | | $ | 24,416 | | | | 1,867 | | | $ | 2,232 | | | | 171 | | | $ | (41,370 | ) | | | (3,092 | ) | | $ | (14,722 | ) | | | (1,054 | ) |
| | | | | | | | | | | | | | | | | | | | | | | | | | | | | | | | | |
| Year ended December 31, 2021 | | | | | | | | | | | | | | | | | |
| | | | | | | | | | | | | | | | | | | | | | | | | | | | | | | | | |
| Class 1 | | $ | 9,259 | | | | 623 | | | $ | 7,739 | | | | 533 | | | $ | (40,506 | ) | | | (2,798 | ) | | $ | (23,508 | ) | | | (1,642 | ) |
| Class 1A | | | 925 | | | | 63 | | | | 233 | | | | 16 | | | | (252 | ) | | | (17 | ) | | | 906 | | | | 62 | |
| Class 2 | | | 5,621 | | | | 383 | | | | 13,069 | | | | 902 | | | | (27,137 | ) | | | (1,828 | ) | | | (8,447 | ) | | | (543 | ) |
| Class 4 | | | 28,503 | | | | 1,957 | | | | 8,206 | | | | 572 | | | | (10,476 | ) | | | (713 | ) | | | 26,233 | | | | 1,816 | |
| Total net increase (decrease) | | $ | 44,308 | | | | 3,026 | | | $ | 29,247 | | | | 2,023 | | | $ | (78,371 | ) | | | (5,356 | ) | | $ | (4,816 | ) | | | (307 | ) |
The Bond Fund of America
| | | Sales* | | | Reinvestments of
distributions | | | Repurchases* | | | Net (decrease)
increase | |
| Share class | | Amount | | | Shares | | | Amount | | | Shares | | | Amount | | | Shares | | | Amount | | | Shares | |
| | | | | | | | | | | | | | | | | | | | | | | | | | | | | | | | | |
| Six months ended June 30, 2022 | | | | | | | | | | | | | | | | | |
| | | | | | | | | | | | | | | | | | | | | | | | | | | | | | | | | |
| Class 1 | | $ | 588,890 | | | | 56,026 | | | $ | 120,763 | | | | 12,016 | | | $ | (1,465,423 | ) | | | (137,787 | ) | | $ | (755,770 | ) | | | (69,745 | ) |
| Class 1A | | | 195,922 | | | | 19,339 | | | | 3,416 | | | | 342 | | | | (4,771 | ) | | | (475 | ) | | | 194,567 | | | | 19,206 | |
| Class 2 | | | 22,979 | | | | 2,184 | | | | 54,100 | | | | 5,465 | | | | (292,960 | ) | | | (28,458 | ) | | | (215,881 | ) | | | (20,809 | ) |
| Class 4 | | | 54,487 | | | | 5,274 | | | | 13,536 | | | | 1,373 | | | | (55,263 | ) | | | (5,377 | ) | | | 12,760 | | | | 1,270 | |
| Total net increase (decrease) | | $ | 862,278 | | | | 82,823 | | | $ | 191,815 | | | | 19,196 | | | $ | (1,818,417 | ) | | | (172,097 | ) | | $ | (764,324 | ) | | | (70,078 | ) |
| | | | | | | | | | | | | | | | | | | | | | | | | | | | | | | | | |
| Year ended December 31, 2021 | | | | | | | | | | | | | | | | | |
| | | | | | | | | | | | | | | | | | | | | | | | | | | | | | | | | |
| Class 1 | | $ | 2,441,954 | | | | 212,866 | | | $ | 432,376 | | | | 38,456 | | | $ | (737,146 | ) | | | (64,100 | ) | | $ | 2,137,184 | | | | 187,222 | |
| Class 1A | | | 5,329 | | | | 464 | | | | 601 | | | | 54 | | | | (2,565 | ) | | | (223 | ) | | | 3,365 | | | | 295 | |
| Class 2 | | | 204,371 | | | | 17,879 | | | | 208,042 | | | | 18,765 | | | | (302,247 | ) | | | (26,735 | ) | | | 110,166 | | | | 9,909 | |
| Class 4 | | | 240,539 | | | | 21,228 | | | | 43,487 | | | | 3,939 | | | | (60,173 | ) | | | (5,327 | ) | | | 223,853 | | | | 19,840 | |
| Total net increase (decrease) | | $ | 2,892,193 | | | | 252,437 | | | $ | 684,506 | | | | 61,214 | | | $ | (1,102,131 | ) | | | (96,385 | ) | | $ | 2,474,568 | | | | 217,266 | |
Capital World Bond Fund
| | | Sales* | | | Reinvestments of
distributions | | | Repurchases* | | | Net (decrease)
increase | |
| Share class | | Amount | | | Shares | | | Amount | | | Shares | | | Amount | | | Shares | | | Amount | | | Shares | |
| | | | | | | | | | | | | | | | | | | | | | | | | | | | | | | | | |
| Six months ended June 30, 2022 | | | | | | | | | | | | | | | | | |
| | | | | | | | | | | | | | | | | | | | | | | | | | | | | | | | | |
| Class 1 | | $ | 33,410 | | | | 3,197 | | | $ | 13,903 | | | | 1,397 | | | $ | (171,939 | ) | | | (15,483 | ) | | $ | (124,626 | ) | | | (10,889 | ) |
| Class 1A | | | 156 | | | | 14 | | | | 24 | | | | 3 | | | | (232 | ) | | | (23 | ) | | | (52 | ) | | | (6 | ) |
| Class 2 | | | 21,292 | | | | 1,992 | | | | 15,838 | | | | 1,606 | | | | (71,774 | ) | | | (6,686 | ) | | | (34,644 | ) | | | (3,088 | ) |
| Class 4 | | | 5,188 | | | | 483 | | | | 1,065 | | | | 109 | | | | (4,497 | ) | | | (433 | ) | | | 1,756 | | | | 159 | |
| Total net increase (decrease) | | $ | 60,046 | | | | 5,686 | | | $ | 30,830 | | | | 3,115 | | | $ | (248,442 | ) | | | (22,625 | ) | | $ | (157,566 | ) | | | (13,824 | ) |
| | | | | | | | | | | | | | | | | | | | | | | | | | | | | | | | | |
| Year ended December 31, 2021 | | | | | | | | | | | | | | | | | |
| | | | | | | | | | | | | | | | | | | | | | | | | | | | | | | | | |
| Class 1 | | $ | 129,119 | | | | 10,361 | | | $ | 44,414 | | | | 3,661 | | | $ | (305,638 | ) | | | (24,399 | ) | | $ | (132,105 | ) | | | (10,377 | ) |
| Class 1A | | | 1,155 | | | | 95 | | | | 40 | | | | 3 | | | | (261 | ) | | | (21 | ) | | | 934 | | | | 77 | |
| Class 2 | | | 83,201 | | | | 6,733 | | | | 44,570 | | | | 3,700 | | | | (58,585 | ) | | | (4,813 | ) | | | 69,186 | | | | 5,620 | |
| Class 4 | | | 19,357 | | | | 1,604 | | | | 2,457 | | | | 206 | | | | (11,624 | ) | | | (951 | ) | | | 10,190 | | | | 859 | |
| Total net increase (decrease) | | $ | 232,832 | | | | 18,793 | | | $ | 91,481 | | | | 7,570 | | | $ | (376,108 | ) | | | (30,184 | ) | | $ | (51,795 | ) | | | (3,821 | ) |
Refer to the end of the tables for footnote.
| 318 | American Funds Insurance Series |
American High-Income Trust
| | | Sales* | | | Reinvestments of
distributions | | | Repurchases* | | | Net (decrease)
increase | |
| Share class | | Amount | | | Shares | | | Amount | | | Shares | | | Amount | | | Shares | | | Amount | | | Shares | |
| | | | | | | | | | | | | | | | | | | | | | | | | | | | | | | | | |
| Six months ended June 30, 2022 | | | | | | | | | | | | | | | | | |
| | | | | | | | | | | | | | | | | | | | | | | | | | | | | | | | | |
| Class 1 | | $ | 25,635 | | | | 2,628 | | | $ | 2,539 | | | | 271 | | | $ | (42,117 | ) | | | (4,252 | ) | | $ | (13,943 | ) | | | (1,353 | ) |
| Class 1A | | | 193 | | | | 20 | | | | 13 | | | | 2 | | | | (315 | ) | | | (33 | ) | | | (109 | ) | | | (11 | ) |
| Class 2 | | | 4,926 | | | | 503 | | | | 6,028 | | | | 658 | | | | (56,861 | ) | | | (6,042 | ) | | | (45,907 | ) | | | (4,881 | ) |
| Class 3 | | | 211 | | | | 22 | | | | 95 | | | | 10 | | | | (747 | ) | | | (78 | ) | | | (441 | ) | | | (46 | ) |
| Class 4 | | | 30,907 | | | | 2,971 | | | | 790 | | | | 78 | | | | (38,568 | ) | | | (3,737 | ) | | | (6,871 | ) | | | (688 | ) |
| Total net increase (decrease) | | $ | 61,872 | | | | 6,144 | | | $ | 9,465 | | | | 1,019 | | | $ | (138,608 | ) | | | (14,142 | ) | | $ | (67,271 | ) | | | (6,979 | ) |
| | | | | | | | | | | | | | | | | | | | | | | | | | | | | | | | | |
| Year ended December 31, 2021 | | | | | | | | | | | | | | | | | |
| | | | | | | | | | | | | | | | | | | | | | | | | | | | | | | | | |
| Class 1 | | $ | 160,559 | | | | 15,547 | | | $ | 10,757 | | | | 1,060 | | | $ | (19,514 | ) | | | (1,906 | ) | | $ | 151,802 | | | | 14,701 | |
| Class 1A | | | 915 | | | | 89 | | | | 59 | | | | 5 | | | | (548 | ) | | | (53 | ) | | | 426 | | | | 41 | |
| Class 2 | | | 20,019 | | | | 2,003 | | | | 28,636 | | | | 2,874 | | | | (66,675 | ) | | | (6,630 | ) | | | (18,020 | ) | | | (1,753 | ) |
| Class 3 | | | 908 | | | | 88 | | | | 429 | | | | 42 | | | | (1,328 | ) | | | (129 | ) | | | 9 | | | | 1 | |
| Class 4 | | | 143,656 | | | | 13,002 | | | | 3,238 | | | | 295 | | | | (128,886 | ) | | | (11,648 | ) | | | 18,008 | | | | 1,649 | |
| Total net increase (decrease) | | $ | 326,057 | | | | 30,729 | | | $ | 43,119 | | | | 4,276 | | | $ | (216,951 | ) | | | (20,366 | ) | | $ | 152,225 | | | | 14,639 | |
American Funds Mortgage Fund
| | | Sales* | | | Reinvestments of
distributions | | | Repurchases* | | | Net (decrease)
increase | |
| Share class | | Amount | | | Shares | | | Amount | | | Shares | | | Amount | | | Shares | | | Amount | | | Shares | |
| | | | | | | | | | | | | | | | | | | | | | | | | | | | | | | | | |
| Six months ended June 30, 2022 | | | | | | | | | | | | | | | | | |
| | | | | | | | | | | | | | | | | | | | | | | | | | | | | | | | | |
| Class 1 | | $ | 755 | | | | 75 | | | $ | — | | | | — | | | $ | (229,051 | ) | | | (21,714 | ) | | $ | (228,296 | ) | | | (21,639 | ) |
| Class 1A | | | 501 | | | | 50 | | | | 10 | | | | 1 | | | | (733 | ) | | | (70 | ) | | | (222 | ) | | | (19 | ) |
| Class 2 | | | 1,372 | | | | 135 | | | | 282 | | | | 29 | | | | (5,292 | ) | | | (524 | ) | | | (3,638 | ) | | | (360 | ) |
| Class 4 | | | 3,710 | | | | 369 | | | | 207 | | | | 21 | | | | (3,666 | ) | | | (364 | ) | | | 251 | | | | 26 | |
| Total net increase (decrease) | | $ | 6,338 | | | | 629 | | | $ | 499 | | | | 51 | | | $ | (238,742 | ) | | | (22,672 | ) | | $ | (231,905 | ) | | | (21,992 | ) |
| | | | | | | | | | | | | | | | | | | | | | | | | | | | | | | | | |
| Year ended December 31, 2021 | | | | | | | | | | | | | | | | | |
| | | | | | | | | | | | | | | | | | | | | | | | | | | | | | | | | |
| Class 1 | | $ | 35,679 | | | | 3,267 | | | $ | 9,382 | | | | 880 | | | $ | (27,270 | ) | | | (2,517 | ) | | $ | 17,791 | | | | 1,630 | |
| Class 1A | | | 1,498 | | | | 139 | | | | 57 | | | | 5 | | | | (436 | ) | | | (40 | ) | | | 1,119 | | | | 104 | |
| Class 2 | | | 6,415 | | | | 588 | | | | 2,232 | | | | 210 | | | | (5,928 | ) | | | (547 | ) | | | 2,719 | | | | 251 | |
| Class 4 | | | 11,056 | | | | 1,029 | | | | 1,486 | | | | 142 | | | | (4,892 | ) | | | (457 | ) | | | 7,650 | | | | 714 | |
| Total net increase (decrease) | | $ | 54,648 | | | | 5,023 | | | $ | 13,157 | | | | 1,237 | | | $ | (38,526 | ) | | | (3,561 | ) | | $ | 29,279 | | | | 2,699 | |
Refer to the end of the tables for footnote.
| American Funds Insurance Series | 319 |
Ultra-Short Bond Fund
| | | Sales* | | | Reinvestments of
distributions | | | Repurchases* | | | Net increase
(decrease) | |
| Share class | | Amount | | | Shares | | | Amount | | | Shares | | | Amount | | | Shares | | | Amount | | | Shares | |
| | | | | | | | | | | | | | | | | | | | | | | | | | | | | | | | | |
| Six months ended June 30, 2022 | | | | | | | | | | | | | | | | | |
| | | | | | | | | | | | | | | | | | | | | | | | | | | | | | | | | |
| Class 1 | | $ | 25,739 | | | | 2,284 | | | $ | — | | | | — | | | $ | (15,830 | ) | | | (1,405 | ) | | $ | 9,909 | | | | 879 | |
| Class 1A | | | — | | | | — | | | | — | | | | — | | | | — | | | | — | | | | — | | | | — | |
| Class 2 | | | 79,687 | | | | 7,297 | | | | — | | | | — | | | | (27,286 | ) | | | (2,498 | ) | | | 52,401 | | | | 4,799 | |
| Class 3 | | | 601 | | | | 54 | | | | — | | | | — | | | | (444 | ) | | | (40 | ) | | | 157 | | | | 14 | |
| Class 4 | | | 54,443 | | | | 4,957 | | | | — | | | | — | | | | (25,299 | ) | | | (2,303 | ) | | | 29,144 | | | | 2,654 | |
| Total net increase (decrease) | | $ | 160,470 | | | | 14,592 | | | $ | — | | | | — | | | $ | (68,859 | ) | | | (6,246 | ) | | $ | 91,611 | | | | 8,346 | |
| | | | | | | | | | | | | | | | | | | | | | | | | | | | | | | | | |
| Year ended December 31, 2021 | | | | | | | | | | | | | | | | | |
| | | | | | | | | | | | | | | | | | | | | | | | | | | | | | | | | |
| Class 1 | | $ | 16,242 | | | | 1,439 | | | $ | — | | | | — | | | $ | (22,707 | ) | | | (2,011 | ) | | $ | (6,465 | ) | | | (572 | ) |
| Class 1A | | | — | | | | — | | | | — | | | | — | | | | — | | | | — | | | | — | | | | — | |
| Class 2 | | | 86,233 | | | | 7,864 | | | | — | | | | — | | | | (127,622 | ) | | | (11,640 | ) | | | (41,389 | ) | | | (3,776 | ) |
| Class 3 | | | 1,253 | | | | 113 | | | | — | | | | — | | | | (915 | ) | | | (83 | ) | | | 338 | | | | 30 | |
| Class 4 | | | 35,704 | | | | 3,232 | | | | — | | | | — | | | | (29,389 | ) | | | (2,660 | ) | | | 6,315 | | | | 572 | |
| Total net increase (decrease) | | $ | 139,432 | | | | 12,648 | | | $ | — | | | | — | | | $ | (180,633 | ) | | | (16,394 | ) | | $ | (41,201 | ) | | | (3,746 | ) |
U.S. Government Securities Fund
| | | Sales* | | | Reinvestments of
distributions | | | Repurchases* | | | Net (decrease)
increase | |
| Share class | | Amount | | | Shares | | | Amount | | | Shares | | | Amount | | | Shares | | | Amount | | | Shares | |
| | | | | | | | | | | | | | | | | | | | | | | | | | | | | | | | | |
| Six months ended June 30, 2022 | | | | | | | | | | | | | | | | | |
| | | | | | | | | | | | | | | | | | | | | | | | | | | | | | | | | |
| Class 1 | | $ | 32,067 | | | | 2,893 | | | $ | 1,246 | | | | 115 | | | $ | (276,213 | ) | | | (24,133 | ) | | $ | (242,900 | ) | | | (21,125 | ) |
| Class 1A | | | 936 | | | | 87 | | | | 18 | | | | 2 | | | | (1,271 | ) | | | (114 | ) | | | (317 | ) | | | (25 | ) |
| Class 2 | | | 22,317 | | | | 2,011 | | | | 5,450 | | | | 508 | | | | (146,774 | ) | | | (13,315 | ) | | | (119,007 | ) | | | (10,796 | ) |
| Class 3 | | | — | | | | — | | | | 39 | | | | 3 | | | | (1,145 | ) | | | (105 | ) | | | (1,106 | ) | | | (102 | ) |
| Class 4 | | | 35,614 | | | | 3,229 | | | | 855 | | | | 80 | | | | (52,023 | ) | | | (4,705 | ) | | | (15,554 | ) | | | (1,396 | ) |
| Total net increase (decrease) | | $ | 90,934 | | | | 8,220 | | | $ | 7,608 | | | | 708 | | | $ | (477,426 | ) | | | (42,372 | ) | | $ | (378,884 | ) | | | (33,444 | ) |
| | | | | | | | | | | | | | | | | | | | | | | | | | | | | | | | | |
| Year ended December 31, 2021 | | | | | | | | | | | | | | | | | |
| | | | | | | | | | | | | | | | | | | | | | | | | | | | | | | | | |
| Class 1 | | $ | 213,039 | | | | 17,786 | | | $ | 38,963 | | | | 3,337 | | | $ | (115,497 | ) | | | (9,263 | ) | | $ | 136,505 | | | | 11,860 | |
| Class 1A | | | 4,388 | | | | 354 | | | | 518 | | | | 44 | | | | (3,192 | ) | | | (265 | ) | | | 1,714 | | | | 133 | |
| Class 2 | | | 91,122 | | | | 7,303 | | | | 144,267 | | | | 12,514 | | | | (129,818 | ) | | | (10,810 | ) | | | 105,571 | | | | 9,007 | |
| Class 3 | | | 1,023 | | | | 86 | | | | 948 | | | | 81 | | | | (1,549 | ) | | | (126 | ) | | | 422 | | | | 41 | |
| Class 4 | | | 87,885 | | | | 7,227 | | | | 23,653 | | | | 2,055 | | | | (118,823 | ) | | | (9,719 | ) | | | (7,285 | ) | | | (437 | ) |
| Total net increase (decrease) | | $ | 397,457 | | | | 32,756 | | | $ | 208,349 | | | | 18,031 | | | $ | (368,879 | ) | | | (30,183 | ) | | $ | 236,927 | | | | 20,604 | |
Managed Risk Growth Fund
| | | Sales* | | | Reinvestments of
distributions | | | Repurchases* | | | Net increase
(decrease) | |
| Share class | | Amount | | | Shares | | | Amount | | | Shares | | | Amount | | | Shares | | | Amount | | | Shares | |
| | | | | | | | | | | | | | | | | | | | | | | | | | | | | | | | | |
| Six months ended June 30, 2022 | | | | | | | | | | | | | | | | | |
| | | | | | | | | | | | | | | | | | | | | | | | | | | | | | | | | |
| Class P1 | | $ | 900 | | | | 57 | | | $ | 1,675 | | | | 136 | | | $ | (1,511 | ) | | | (90 | ) | | $ | 1,064 | | | | 103 | |
| Class P2 | | | 24,583 | | | | 1,567 | | | | 83,629 | | | | 6,872 | | | | (15,325 | ) | | | (974 | ) | | | 92,887 | | | | 7,465 | |
| Total net increase (decrease) | | $ | 25,483 | | | | 1,624 | | | $ | 85,304 | | | | 7,008 | | | $ | (16,836 | ) | | | (1,064 | ) | | $ | 93,951 | | | | 7,568 | |
| | | | | | | | | | | | | | | | | | | | | | | | | | | | | | | | | |
| Year ended December 31, 2021 | | | | | | | | | | | | | | | | | |
| | | | | | | | | | | | | | | | | | | | | | | | | | | | | | | | | |
| Class P1 | | $ | 3,593 | | | | 199 | | | $ | 515 | | | | 30 | | | $ | (3,079 | ) | | | (172 | ) | | $ | 1,029 | | | | 57 | |
| Class P2 | | | 39,055 | | | | 2,202 | | | | 26,869 | | | | 1,558 | | | | (78,851 | ) | | | (4,405 | ) | | | (12,927 | ) | | | (645 | ) |
| Total net increase (decrease) | | $ | 42,648 | | | | 2,401 | | | $ | 27,384 | | | | 1,588 | | | $ | (81,930 | ) | | | (4,577 | ) | | $ | (11,898 | ) | | | (588 | ) |
Refer to the end of the tables for footnote.
| 320 | American Funds Insurance Series |
Managed Risk International Fund
| | | Sales* | | | Reinvestments of
distributions | | | Repurchases* | | | Net increase
(decrease) | |
| Share class | | Amount | | | Shares | | | Amount | | | Shares | | | Amount | | | Shares | | | Amount | | | Shares | |
| | | | | | | | | | | | | | | | | | | | | | | | | | | | | | | | | |
| Six months ended June 30, 2022 | | | | | | | | | | | | | | | | | |
| | | | | | | | | | | | | | | | | | | | | | | | | | | | | | | | | |
| Class P1 | | $ | 373 | | | | 38 | | | $ | 52 | | | | 6 | | | $ | (64 | ) | | | (7 | ) | | $ | 361 | | | | 37 | |
| Class P2 | | | 4,344 | | | | 441 | | | | 3,316 | | | | 369 | | | | (7,438 | ) | | | (802 | ) | | | 222 | | | | 8 | |
| Total net increase (decrease) | | $ | 4,717 | | | | 479 | | | $ | 3,368 | | | | 375 | | | $ | (7,502 | ) | | | (809 | ) | | $ | 583 | | | | 45 | |
| | | | | | | | | | | | | | | | | | | | | | | | | | | | | | | | | |
| Year ended December 31, 2021 | | | | | | | | | | | | | | | | | |
| | | | | | | | | | | | | | | | | | | | | | | | | | | | | | | | | |
| Class P1 | | $ | 887 | | | | 80 | | | $ | 14 | | | | 1 | | | $ | (531 | ) | | | (48 | ) | | $ | 370 | | | | 33 | |
| Class P2 | | | 12,803 | | | | 1,181 | | | | 917 | | | | 80 | | | | (14,744 | ) | | | (1,323 | ) | | | (1,024 | ) | | | (62 | ) |
| Total net increase (decrease) | | $ | 13,690 | | | | 1,261 | | | $ | 931 | | | | 81 | | | $ | (15,275 | ) | | | (1,371 | ) | | $ | (654 | ) | | | (29 | ) |
Managed Risk Washington Mutual Investors Fund
| | | Sales* | | | Reinvestments of
distributions | | | Repurchases* | | | Net increase
(decrease) | |
| Share class | | Amount | | | Shares | | | Amount | | | Shares | | | Amount | | | Shares | | | Amount | | | Shares | |
| | | | | | | | | | | | | | | | | | | | | | | | | | | | | | | | | |
| Six months ended June 30, 2022 | | | | | | | | | | | | | | | | | |
| | | | | | | | | | | | | | | | | | | | | | | | | | | | | | | | | |
| Class P1 | | $ | 561 | | | | 45 | | | $ | 33 | | | | 3 | | | $ | (149 | ) | | | (12 | ) | | $ | 445 | | | | 36 | |
| Class P2 | | | 8,641 | | | | 718 | | | | 3,892 | | | | 331 | | | | (25,708 | ) | | | (2,107 | ) | | | (13,175 | ) | | | (1,058 | ) |
| Total net increase (decrease) | | $ | 9,202 | | | | 763 | | | $ | 3,925 | | | | 334 | | | $ | (25,857 | ) | | | (2,119 | ) | | $ | (12,730 | ) | | | (1,022 | ) |
| | | | | | | | | | | | | | | | | | | | | | | | | | | | | | | | | |
| Year ended December 31, 2021 | | | | | | | | | | | | | | | | | |
| | | | | | | | | | | | | | | | | | | | | | | | | | | | | | | | | |
| Class P1 | | $ | 971 | | | | 80 | | | $ | 40 | | | | 3 | | | $ | (343 | ) | | | (29 | ) | | $ | 668 | | | | 54 | |
| Class P2 | | | 9,743 | | | | 800 | | | | 5,979 | | | | 487 | | | | (51,273 | ) | | | (4,254 | ) | | | (35,551 | ) | | | (2,967 | ) |
| Total net increase (decrease) | | $ | 10,714 | | | | 880 | | | $ | 6,019 | | | | 490 | | | $ | (51,616 | ) | | | (4,283 | ) | | $ | (34,883 | ) | | | (2,913 | ) |
Managed Risk Growth-Income Fund
| | | Sales* | | | Reinvestments of
distributions | | | Repurchases* | | | Net increase
(decrease) | |
| Share class | | Amount | | | Shares | | | Amount | | | Shares | | | Amount | | | Shares | | | Amount | | | Shares | |
| | | | | | | | | | | | | | | | | | | | | | | | | | | | | | | | | |
| Six months ended June 30, 2022 | | | | | | | | | | | | | | | | | |
| | | | | | | | | | | | | | | | | | | | | | | | | | | | | | | | | |
| Class P1 | | $ | 23,539 | | | | 1,621 | | | $ | 64,795 | | | | 4,909 | | | $ | (79,453 | ) | | | (5,668 | ) | | $ | 8,881 | | | | 862 | |
| Class P2 | | | 7,369 | | | | 526 | | | | 9,270 | | | | 707 | | | | (16,895 | ) | | | (1,186 | ) | | | (256 | ) | | | 47 | |
| Total net increase (decrease) | | $ | 30,908 | | | | 2,147 | | | $ | 74,065 | | | | 5,616 | | | $ | (96,348 | ) | | | (6,854 | ) | | $ | 8,625 | | | | 909 | |
| | | | | | | | | | | | | | | | | | | | | | | | | | | | | | | | | |
| Year ended December 31, 2021 | | | | | | | | | | | | | | | | | |
| | | | | | | | | | | | | | | | | | | | | | | | | | | | | | | | | |
| Class P1 | | $ | 64,192 | | | | 4,303 | | | $ | 60,096 | | | | 4,023 | | | $ | (175,764 | ) | | | (11,680 | ) | | $ | (51,476 | ) | | | (3,354 | ) |
| Class P2 | | | 14,838 | | | | 1,008 | | | | 8,072 | | | | 546 | | | | (35,819 | ) | | | (2,404 | ) | | | (12,909 | ) | | | (850 | ) |
| Total net increase (decrease) | | $ | 79,030 | | | | 5,311 | | | $ | 68,168 | | | | 4,569 | | | $ | (211,583 | ) | | | (14,084 | ) | | $ | (64,385 | ) | | | (4,204 | ) |
Refer to the end of the tables for footnote.
| American Funds Insurance Series | 321 |
Managed Risk Asset Allocation Fund
| | | Sales* | | | Reinvestments of
distributions | | | Repurchases* | | | Net increase
(decrease) | |
| Share class | | Amount | | | Shares | | | Amount | | | Shares | | | Amount | | | Shares | | | Amount | | | Shares | |
| | | | | | | | | | | | | | | | | | | | | | | | | | | | | | | | | |
| Six months ended June 30, 2022 | | | | | | | | | | | | | | | | | |
| | | | | | | | | | | | | | | | | | | | | | | | | | | | | | | | | |
| Class P1 | | $ | 1,091 | | | | 75 | | | $ | 358 | | | | 28 | | | $ | (503 | ) | | | (38 | ) | | $ | 946 | | | | 65 | |
| Class P2 | | | 22,719 | | | | 1,679 | | | | 121,282 | | | | 9,734 | | | | (151,469 | ) | | | (11,117 | ) | | | (7,468 | ) | | | 296 | |
| Total net increase (decrease) | | $ | 23,810 | | | | 1,754 | | | $ | 121,640 | | | | 9,762 | | | $ | (151,972 | ) | | | (11,155 | ) | | $ | (6,522 | ) | | | 361 | |
| | | | | | | | | | | | | | | | | | | | | | | | | | | | | | | | | |
| Year ended December 31, 2021 | | | | | | | | | | | | | | | | | |
| | | | | | | | | | | | | | | | | | | | | | | | | | | | | | | | | |
| Class P1 | | $ | 2,097 | | | | 141 | | | $ | 114 | | | | 8 | | | $ | (899 | ) | | | (60 | ) | | $ | 1,312 | | | | 89 | |
| Class P2 | | | 57,616 | | | | 4,016 | | | | 38,113 | | | | 2,632 | | | | (351,072 | ) | | | (24,507 | ) | | | (255,343 | ) | | | (17,859 | ) |
| Total net increase (decrease) | | $ | 59,713 | | | | 4,157 | | | $ | 38,227 | | | | 2,640 | | | $ | (351,971 | ) | | | (24,567 | ) | | $ | (254,031 | ) | | | (17,770 | ) |
| * | Includes exchanges between share classes of the fund. |
11. Investment transactions and other disclosures
The following tables present additional information for each fund for the six months ended June 30, 2022 (dollars in thousands):
| | | Global
Growth
Fund | | | Global
Small
Capitalization
Fund | | | Growth
Fund | | | International
Fund | | | New
World
Fund | | | Washington
Mutual
Investors
Fund | |
| Purchases of investment securities* | | $ | 1,154,889 | | | $ | 697,701 | | | $ | 5,277,855 | | | $ | 1,394,817 | | | $ | 674,899 | | | $ | 1,517,355 | |
| Sales of investment securities* | | | 1,459,238 | | | | 808,215 | | | | 6,270,787 | | | | 1,901,645 | | | | 1,028,529 | | | | 2,244,236 | |
| Non-U.S. taxes paid on dividend income | | | 3,431 | | | | 1,482 | | | | 4,572 | | | | 6,393 | | | | 2,310 | | | | 1,348 | |
| Non-U.S. taxes paid on interest income | | | — | | | | — | | | | — | | | | — | | | | 3 | | | | — | |
| Non-U.S. taxes paid on realized gains | | | — | | | | 3,797 | | | | — | | | | 6,690 | | | | 3,410 | | | | — | |
| Non-U.S. taxes provided on unrealized appreciation | | | 6,621 | | | | 8,204 | | | | — | | | | 23,665 | | | | 6,335 | | | | — | |
| | | | | | | | | | | | | | | | | | | | | | | | | |
| | | Capital
World
Growth
and Income
Fund | | | Growth-
Income
Fund | | | International
Growth
and Income
Fund | | | Capital
Income
Builder | | | Asset
Allocation
Fund | | | American
Funds
Global
Balanced
Fund | |
| Purchases of investment securities* | | $ | 422,513 | | | $ | 5,568,260 | | | $ | 80,130 | | | $ | 543,114 | | | $ | 12,982,950 | | | $ | 297,140 | |
| Sales of investment securities* | | | 590,784 | | | | 8,817,687 | | | | 89,338 | | | | 495,788 | | | | 14,028,613 | | | | 305,662 | |
| Non-U.S. taxes paid on dividend income | | | 1,636 | | | | 5,405 | | | | 12 | | | | 1,063 | | | | 5,427 | | | | 246 | |
| Non-U.S. taxes paid on interest income | | | — | | | | — | | | | — | | | | — | | | | — | | | | 8 | |
| Non-U.S. taxes paid on realized gains | | | 68 | | | | — | | | | 51 | | | | 6 | | | | — | | | | 6 | |
| Non-U.S. taxes provided on unrealized appreciation | | | 383 | | | | — | | | | — | | | | 444 | | | | 1,820 | | | | — | |
| | | | | | | | | | | | | | | | | | | | | | | | | |
| | | The Bond
Fund
of America | | | Capital
World Bond
Fund | | | American
High-Income
Trust | | | American
Funds
Mortgage
Fund | | | Ultra-Short
Bond
Fund | | | U.S.
Government
Securities
Fund | |
| Purchases of investment securities* | | $ | 18,309,219 | | | $ | 826,744 | | | $ | 193,187 | | | $ | 700,738 | | | $ | — | | | $ | 4,089,958 | |
| Sales of investment securities* | | | 17,477,848 | | | | 1,121,381 | | | | 237,197 | | | | 812,455 | | | | — | | | | 3,674,672 | |
| Non-U.S. taxes paid on interest income | | | 9 | | | | 172 | | | | — | | | | — | | | | — | | | | — | |
| Non-U.S. taxes paid on realized gains | | | — | | | | 326 | | | | — | | | | — | | | | — | | | | — | |
| Non-U.S. taxes provided on unrealized appreciation | | | — | | | | 117 | | | | — | | | | — | | | | — | | | | — | |
Refer to the end of the table for footnote.
| 322 | American Funds Insurance Series |
| | | Managed
Risk
Growth
Fund | | | Managed
Risk
International
Fund | | | Managed
Risk
Washington
Mutual
Investors
Fund | | | Managed
Risk
Growth-
Income
Fund | | | Managed
Risk
Asset
Allocation
Fund | | | | | |
| Purchases of investment securities* | | $ | 310,318 | | | $ | 72,749 | | | $ | 170,597 | | | $ | 897,652 | | | $ | 699,143 | | | | | |
| Sales of investment securities* | | | 224,255 | | | | 51,902 | | | | 117,919 | | | | 749,424 | | | | 565,128 | | | | | |
| * | Excludes short-term securities and U.S. government obligations, if any. |
12. Ownership concentration
At June 30, 2022, American Funds Insurance Series - Portfolio Series - Managed Risk Growth and Income Portfolio held 18% and 18% of the outstanding shares of American Funds Insurance Series - Capital World Growth and Income Fund and American Funds Insurance Series - Capital Income Builder, respectively. In addition, American Funds Insurance Series - Portfolio Series - Managed Risk Global Allocation Portfolio held 26% of the outstanding shares of American Funds Insurance Series - American Funds Global Balanced Fund.
| American Funds Insurance Series | 323 |
Financial highlights
| | | | | | (Loss) income from
investment operations1 | | | Dividends and distributions | | | | | | | | | | | | | | | | | | | |
| Year ended | | Net asset
value,
beginning
of year | | | Net
investment
income | | | Net (losses)
gains on
securities
(both
realized and
unrealized) | | | Total from
investment
operations | | | Dividends
(from net
investment
income) | | | Distributions
(from capital
gains) | | | Total
dividends
and
distributions | | | Net asset
value,
end
of year | | | Total return2 | | | Net assets,
end of year
(in millions) | | | Ratio of
expenses to
average net
assets before
waivers3 | | | Ratio of
expenses to
average net
assets after
waivers2,3 | | | Ratio of
net income
to average
net assets2 | |
| | | | | | | | | | | | | | | | | | | | | | | | | | | | | | | | | | | | | | | | |
| Global Growth Fund |
| |
| Class 1: | | | | | | | | | | | | | | | | | | | | | | | | | | | | | | | | | | | | | | | | | | | | | | | | | | | | |
| 6/30/20224,5 | | $ | 45.46 | | | $ | .16 | | | $ | (12.50 | ) | | $ | (12.34 | ) | | $ | (.08 | ) | | $ | (3.97 | ) | | $ | (4.05 | ) | | $ | 29.07 | | | | (27.84 | )%6 | | $ | 3,072 | | | | .54 | %7 | | | .50 | %7 | | | .88 | %7 |
| 12/31/2021 | | | 41.16 | | | | .25 | | | | 6.48 | | | | 6.73 | | | | (.26 | ) | | | (2.17 | ) | | | (2.43 | ) | | | 45.46 | | | | 16.72 | | | | 4,270 | | | | .55 | | | | .54 | | | | .56 | |
| 12/31/2020 | | | 32.57 | | | | .20 | | | | 9.56 | | | | 9.76 | | | | (.21 | ) | | | (.96 | ) | | | (1.17 | ) | | | 41.16 | | | | 30.79 | | | | 3,309 | | | | .56 | | | | .56 | | | | .59 | |
| 12/31/2019 | | | 25.74 | | | | .32 | | | | 8.60 | | | | 8.92 | | | | (.41 | ) | | | (1.68 | ) | | | (2.09 | ) | | | 32.57 | | | | 35.61 | | | | 2,515 | | | | .56 | | | | .56 | | | | 1.07 | |
| 12/31/2018 | | | 30.51 | | | | .29 | | | | (2.65 | ) | | | (2.36 | ) | | | (.28 | ) | | | (2.13 | ) | | | (2.41 | ) | | | 25.74 | | | | (8.81 | ) | | | 1,942 | | | | .55 | | | | .55 | | | | .98 | |
| 12/31/2017 | | | 24.05 | | | | .26 | | | | 7.30 | | | | 7.56 | | | | (.26 | ) | | | (.84 | ) | | | (1.10 | ) | | | 30.51 | | | | 31.80 | | | | 2,010 | | | | .55 | | | | .55 | | | | .94 | |
| Class 1A: | | | | | | | | | | | | | | | | | | | | | | | | | | | | | | | | | | | | | | | | | | | | | | | | | | | | |
| 6/30/20224,5 | | | 45.28 | | | | .12 | | | | (12.44 | ) | | | (12.32 | ) | | | (.07 | ) | | | (3.97 | ) | | | (4.04 | ) | | | 28.92 | | | | (27.91 | )6 | | | 14 | | | | .79 | 7 | | | .75 | 7 | | | .64 | 7 |
| 12/31/2021 | | | 41.02 | | | | .14 | | | | 6.46 | | | | 6.60 | | | | (.17 | ) | | | (2.17 | ) | | | (2.34 | ) | | | 45.28 | | | | 16.45 | | | | 18 | | | | .80 | | | | .79 | | | | .33 | |
| 12/31/2020 | | | 32.47 | | | | .12 | | | | 9.52 | | | | 9.64 | | | | (.13 | ) | | | (.96 | ) | | | (1.09 | ) | | | 41.02 | | | | 30.49 | | | | 12 | | | | .81 | | | | .81 | | | | .34 | |
| 12/31/2019 | | | 25.69 | | | | .25 | | | | 8.55 | | | | 8.80 | | | | (.34 | ) | | | (1.68 | ) | | | (2.02 | ) | | | 32.47 | | | | 35.22 | | | | 8 | | | | .81 | | | | .81 | | | | .83 | |
| 12/31/2018 | | | 30.46 | | | | .23 | | | | (2.66 | ) | | | (2.43 | ) | | | (.21 | ) | | | (2.13 | ) | | | (2.34 | ) | | | 25.69 | | | | (9.02 | ) | | | 5 | | | | .80 | | | | .80 | | | | .77 | |
| 12/31/20174,8 | | | 24.50 | | | | .11 | | | | 6.94 | | | | 7.05 | | | | (.25 | ) | | | (.84 | ) | | | (1.09 | ) | | | 30.46 | | | | 29.13 | 6 | | | 2 | | | | .80 | 7 | | | .80 | 7 | | | .39 | 7 |
| Class 2: | | | | | | | | | | | | | | | | | | | | | | | | | | | | | | | | | | | | | | | | | | | | | | | | | | | | |
| 6/30/20224,5 | | | 44.94 | | | | .11 | | | | (12.33 | ) | | | (12.22 | ) | | | (.07 | ) | | | (3.97 | ) | | | (4.04 | ) | | | 28.68 | | | | (27.91 | )6 | | | 3,233 | | | | .79 | 7 | | | .75 | 7 | | | .62 | 7 |
| 12/31/2021 | | | 40.72 | | | | .13 | | | | 6.41 | | | | 6.54 | | | | (.15 | ) | | | (2.17 | ) | | | (2.32 | ) | | | 44.94 | | | | 16.42 | | | | 4,559 | | | | .80 | | | | .80 | | | | .30 | |
| 12/31/2020 | | | 32.24 | | | | .12 | | | | 9.44 | | | | 9.56 | | | | (.12 | ) | | | (.96 | ) | | | (1.08 | ) | | | 40.72 | | | | 30.47 | | | | 4,387 | | | | .81 | | | | .81 | | | | .34 | |
| 12/31/2019 | | | 25.50 | | | | .24 | | | | 8.51 | | | | 8.75 | | | | (.33 | ) | | | (1.68 | ) | | | (2.01 | ) | | | 32.24 | | | | 35.28 | | | | 3,895 | | | | .81 | | | | .81 | | | | .83 | |
| 12/31/2018 | | | 30.24 | | | | .22 | | | | (2.63 | ) | | | (2.41 | ) | | | (.20 | ) | | | (2.13 | ) | | | (2.33 | ) | | | 25.50 | | | | (9.04 | ) | | | 3,306 | | | | .80 | | | | .80 | | | | .73 | |
| 12/31/2017 | | | 23.85 | | | | .19 | | | | 7.23 | | | | 7.42 | | | | (.19 | ) | | | (.84 | ) | | | (1.03 | ) | | | 30.24 | | | | 31.47 | | | | 4,012 | | | | .80 | | | | .80 | | | | .69 | |
| Class 4: | | | | | | | | | | | | | | | | | | | | | | | | | | | | | | | | | | | | | | | | | | | | | | | | | | | | |
| 6/30/20224,5 | | | 44.57 | | | | .07 | | | | (12.23 | ) | | | (12.16 | ) | | | (.05 | ) | | | (3.97 | ) | | | (4.02 | ) | | | 28.39 | | | | (27.99 | )6 | | | 552 | | | | 1.04 | 7 | | | 1.00 | 7 | | | .38 | 7 |
| 12/31/2021 | | | 40.45 | | | | .03 | | | | 6.35 | | | | 6.38 | | | | (.09 | ) | | | (2.17 | ) | | | (2.26 | ) | | | 44.57 | | | | 16.14 | | | | 744 | | | | 1.05 | | | | 1.04 | | | | .07 | |
| 12/31/2020 | | | 32.05 | | | | .03 | | | | 9.38 | | | | 9.41 | | | | (.05 | ) | | | (.96 | ) | | | (1.01 | ) | | | 40.45 | | | | 30.17 | | | | 533 | | | | 1.06 | | | | 1.06 | | | | .09 | |
| 12/31/2019 | | | 25.39 | | | | .17 | | | | 8.45 | | | | 8.62 | | | | (.28 | ) | | | (1.68 | ) | | | (1.96 | ) | | | 32.05 | | | | 34.87 | | | | 382 | | | | 1.06 | | | | 1.06 | | | | .57 | |
| 12/31/2018 | | | 30.13 | | | | .14 | | | | (2.60 | ) | | | (2.46 | ) | | | (.15 | ) | | | (2.13 | ) | | | (2.28 | ) | | | 25.39 | | | | (9.24 | ) | | | 249 | | | | 1.05 | | | | 1.05 | | | | .47 | |
| 12/31/2017 | | | 23.81 | | | | .10 | | | | 7.22 | | | | 7.32 | | | | (.16 | ) | | | (.84 | ) | | | (1.00 | ) | | | 30.13 | | | | 31.11 | | | | 211 | | | | 1.05 | | | | 1.05 | | | | .37 | |
Refer to the end of the tables for footnotes.
| 324 | American Funds Insurance Series |
Financial highlights (continued)
| | | | | | (Loss) income from
investment operations1 | | | Dividends and distributions | | | | | | | | | | | | | | | | | | | |
| Year ended | | Net asset
value,
beginning
of year | | | Net
investment
income
(loss) | | | Net (losses)
gains on
securities
(both
realized and
unrealized) | | | Total from
investment
operations | | | Dividends
(from net
investment
income) | | | Distributions
(from capital
gains) | | | Total
dividends
and
distributions | | | Net asset
value,
end
of year | | | Total return2 | | | Net assets,
end of year
(in millions) | | | Ratio of
expenses to
average net
assets before
waivers3 | | | Ratio of
expenses to
average net
assets after
waivers2,3 | | | Ratio of
net income
(loss)
to average
net assets2 | |
| | | | | | | | | | | | | | | | | | | | | | | | | | | | | | | | | | | | | | | | |
| Global Small Capitalization Fund |
| | | | | | | | | | | | | | | | | | | | | | | | | | | | | | | | | | | | | | | | | | | | | | | | | | | | | |
| Class 1: | | | | | | | | | | | | | | | | | | | | | | | | | | | | | | | | | | | | | | | | | | | | | | | | | | | | |
| 6/30/20224,5 | | $ | 34.17 | | | $ | .03 | | | $ | (10.08 | ) | | $ | (10.05 | ) | | $ | — | | | $ | (8.50 | ) | | $ | (8.50 | ) | | $ | 15.62 | | | | (31.99 | )%6 | | $ | 915 | | | | .74 | %7 | | | .72 | %7 | | | .24 | %7 |
| 12/31/2021 | | | 32.64 | | | | (.02 | ) | | | 2.32 | | | | 2.30 | | | | — | | | | (.77 | ) | | | (.77 | ) | | | 34.17 | | | | 6.98 | | | | 1,707 | | | | .74 | | | | .74 | | | | (.07 | ) |
| 12/31/2020 | | | 26.80 | | | | (.01 | ) | | | 7.49 | | | | 7.48 | | | | (.05 | ) | | | (1.59 | ) | | | (1.64 | ) | | | 32.64 | | | | 30.04 | | | | 2,391 | | | | .75 | | | | .75 | | | | (.06 | ) |
| 12/31/2019 | | | 21.75 | | | | .12 | | | | 6.61 | | | | 6.73 | | | | (.10 | ) | | | (1.58 | ) | | | (1.68 | ) | | | 26.80 | | | | 31.84 | | | | 2,050 | | | | .75 | | | | .75 | | | | .48 | |
| 12/31/2018 | | | 25.38 | | | | .11 | | | | (2.51 | ) | | | (2.40 | ) | | | (.09 | ) | | | (1.14 | ) | | | (1.23 | ) | | | 21.75 | | | | (10.31 | ) | | | 1,453 | | | | .73 | | | | .73 | | | | .42 | |
| 12/31/2017 | | | 20.24 | | | | .12 | | | | 5.17 | | | | 5.29 | | | | (.15 | ) | | | — | | | | (.15 | ) | | | 25.38 | | | | 26.22 | | | | 1,639 | | | | .73 | | | | .73 | | | | .54 | |
| Class 1A: | | | | | | | | | | | | | | | | | | | | | | | | | | | | | | | | | | | | | | | | | | | | | | | | | | | | |
| 6/30/20224,5 | | | 33.93 | | | | — | 9 | | | (10.00 | ) | | | (10.00 | ) | | | — | | | | (8.50 | ) | | | (8.50 | ) | | | 15.43 | | | | (32.05 | )6 | | | 4 | | | | .99 | 7 | | | .97 | 7 | | | .02 | 7 |
| 12/31/2021 | | | 32.49 | | | | (.07 | ) | | | 2.28 | | | | 2.21 | | | | — | | | | (.77 | ) | | | (.77 | ) | | | 33.93 | | | | 6.73 | | | | 5 | | | | .99 | | | | .99 | | | | (.21 | ) |
| 12/31/2020 | | | 26.74 | | | | (.09 | ) | | | 7.48 | | | | 7.39 | | | | (.05 | ) | | | (1.59 | ) | | | (1.64 | ) | | | 32.49 | | | | 29.72 | | | | 1 | | | | .99 | | | | .99 | | | | (.33 | ) |
| 12/31/2019 | | | 21.71 | | | | .05 | | | | 6.61 | | | | 6.66 | | | | (.05 | ) | | | (1.58 | ) | | | (1.63 | ) | | | 26.74 | | | | 31.56 | | | | 1 | | | | .99 | | | | .99 | | | | .22 | |
| 12/31/2018 | | | 25.36 | | | | .05 | | | | (2.52 | ) | | | (2.47 | ) | | | (.04 | ) | | | (1.14 | ) | | | (1.18 | ) | | | 21.71 | | | | (10.56 | ) | | | — | 10 | | | .98 | | | | .98 | | | | .21 | |
| 12/31/20174,8 | | | 20.70 | | | | .08 | | | | 4.71 | | | | 4.79 | | | | (.13 | ) | | | — | | | | (.13 | ) | | | 25.36 | | | | 23.19 | 6 | | | — | 10 | | | .96 | 7 | | | .96 | 7 | | | .35 | 7 |
| Class 2: | | | | | | | | | | | | | | | | | | | | | | | | | | | | | | | | | | | | | | | | | | | | | | | | | | | | |
| 6/30/20224,5 | | | 32.94 | | | | — | 9 | | | (9.69 | ) | | | (9.69 | ) | | | — | | | | (8.50 | ) | | | (8.50 | ) | | | 14.75 | | | | (32.09 | )6 | | | 1,751 | | | | .99 | 7 | | | .97 | 7 | | | .01 | 7 |
| 12/31/2021 | | | 31.56 | | | | (.10 | ) | | | 2.25 | | | | 2.15 | | | | — | | | | (.77 | ) | | | (.77 | ) | | | 32.94 | | | | 6.74 | | | | 2,521 | | | | .99 | | | | .99 | | | | (.30 | ) |
| 12/31/2020 | | | 26.02 | | | | (.08 | ) | | | 7.25 | | | | 7.17 | | | | (.04 | ) | | | (1.59 | ) | | | (1.63 | ) | | | 31.56 | | | | 29.72 | | | | 2,653 | | | | 1.00 | | | | 1.00 | | | | (.31 | ) |
| 12/31/2019 | | | 21.16 | | | | .05 | | | | 6.43 | | | | 6.48 | | | | (.04 | ) | | | (1.58 | ) | | | (1.62 | ) | | | 26.02 | | | | 31.52 | | | | 2,363 | | | | 1.00 | | | | 1.00 | | | | .22 | |
| 12/31/2018 | | | 24.72 | | | | .04 | | | | (2.44 | ) | | | (2.40 | ) | | | (.02 | ) | | | (1.14 | ) | | | (1.16 | ) | | | 21.16 | | | | (10.55 | ) | | | 2,056 | | | | .98 | | | | .98 | | | | .17 | |
| 12/31/2017 | | | 19.72 | | | | .06 | | | | 5.04 | | | | 5.10 | | | | (.10 | ) | | | — | | | | (.10 | ) | | | 24.72 | | | | 25.89 | | | | 2,551 | | | | .98 | | | | .98 | | | | .27 | |
| Class 4: | | | | | | | | | | | | | | | | | | | | | | | | | | | | | | | | | | | | | | | | | | | | | | | | | | | | |
| 6/30/20224,5 | | | 32.96 | | | | (.03 | ) | | | (9.68 | ) | | | (9.71 | ) | | | — | | | | (8.50 | ) | | | (8.50 | ) | | | 14.75 | | | | (32.13 | )6 | | | 249 | | | | 1.24 | 7 | | | 1.22 | 7 | | | (.23 | )7 |
| 12/31/2021 | | | 31.67 | | | | (.18 | ) | | | 2.24 | | | | 2.06 | | | | — | | | | (.77 | ) | | | (.77 | ) | | | 32.96 | | | | 6.43 | | | | 344 | | | | 1.24 | | | | 1.24 | | | | (.53 | ) |
| 12/31/2020 | | | 26.16 | | | | (.14 | ) | | | 7.27 | | | | 7.13 | | | | (.03 | ) | | | (1.59 | ) | | | (1.62 | ) | | | 31.67 | | | | 29.39 | | | | 268 | | | | 1.25 | | | | 1.25 | | | | (.56 | ) |
| 12/31/2019 | | | 21.28 | | | | (.01 | ) | | | 6.47 | | | | 6.46 | | | | — | 9 | | | (1.58 | ) | | | (1.58 | ) | | | 26.16 | | | | 31.24 | | | | 206 | | | | 1.25 | | | | 1.25 | | | | (.04 | ) |
| 12/31/2018 | | | 24.91 | | | | (.02 | ) | | | (2.46 | ) | | | (2.48 | ) | | | (.01 | ) | | | (1.14 | ) | | | (1.15 | ) | | | 21.28 | | | | (10.80 | ) | | | 146 | | | | 1.24 | | | | 1.24 | | | | (.08 | ) |
| 12/31/2017 | | | 19.91 | | | | — | 9 | | | 5.09 | | | | 5.09 | | | | (.09 | ) | | | — | | | | (.09 | ) | | | 24.91 | | | | 25.62 | | | | 125 | | | | 1.23 | | | | 1.23 | | | | — | 11 |
Refer to the end of the tables for footnotes.
| American Funds Insurance Series | 325 |
Financial highlights (continued)
| | | | | | (Loss) income from
investment operations1 | | | Dividends and distributions | | | | | | | | | | | | | | | | |
| Year ended | | Net asset
value,
beginning
of year | | | Net
investment
income
(loss) | | | Net (losses)
gains on
securities
(both
realized and
unrealized) | | | Total from
investment
operations | | | Dividends
(from net
investment
income) | | | Distributions
(from capital
gains) | | | Total
dividends
and
distributions | | | Net asset
value,
end
of year | | | Total return | | | Net assets,
end of year
(in millions) | | | Ratio of
expenses
to average
net assets3 | | | Ratio of
net income
(loss)
to average
net assets | |
| | | | | | | | | | | | | | | | | | | | | | | | | | | | | | | | | | | | | |
| Growth Fund |
| | | | | | | | | | | | | | | | | | | | | | | | | | | | | | | | | | | | | | | | | | | | | | | | | |
| Class 1: | | | | | | | | | | | | | | | | | | | | | | | | | | | | | | | | | | | | | | | | | | | | | | | | |
| 6/30/20224,5 | | $ | 127.58 | | | $ | .26 | | | $ | (36.77 | ) | | $ | (36.51 | ) | | $ | (.15 | ) | | $ | (14.31 | ) | | $ | (14.46 | ) | | $ | 76.61 | | | | (29.80 | )%6 | | $ | 13,552 | | | | .34 | %7 | | | .50 | %7 |
| 12/31/2021 | | | 120.22 | | | | .46 | | | | 24.29 | | | | 24.75 | | | | (.58 | ) | | | (16.81 | ) | | | (17.39 | ) | | | 127.58 | | | | 22.30 | | | | 19,783 | | | | .34 | | | | .37 | |
| 12/31/2020 | | | 81.22 | | | | .43 | | | | 41.28 | | | | 41.71 | | | | (.53 | ) | | | (2.18 | ) | | | (2.71 | ) | | | 120.22 | | | | 52.45 | | | | 15,644 | | | | .35 | | | | .46 | |
| 12/31/2019 | | | 69.96 | | | | .83 | | | | 19.63 | | | | 20.46 | | | | (.76 | ) | | | (8.44 | ) | | | (9.20 | ) | | | 81.22 | | | | 31.11 | | | | 10,841 | | | | .35 | | | | 1.09 | |
| 12/31/2018 | | | 77.85 | | | | .64 | | | | .25 | | | | .89 | | | | (.54 | ) | | | (8.24 | ) | | | (8.78 | ) | | | 69.96 | | | | (.01 | ) | | | 8,474 | | | | .34 | | | | .81 | |
| 12/31/2017 | | | 67.29 | | | | .55 | | | | 17.89 | | | | 18.44 | | | | (.55 | ) | | | (7.33 | ) | | | (7.88 | ) | | | 77.85 | | | | 28.62 | | | | 8,100 | | | | .35 | | | | .75 | |
| Class 1A: | | | | | | | | | | | | | | | | | | | | | | | | | | | | | | | | | | | | | | | | | | | | | | | | |
| 6/30/20224,5 | | | 126.70 | | | | .16 | | | | (36.53 | ) | | | (36.37 | ) | | | (.12 | ) | | | (14.31 | ) | | | (14.43 | ) | | | 75.90 | | | | (29.89 | )6 | | | 173 | | | | .59 | 7 | | | .31 | 7 |
| 12/31/2021 | | | 119.59 | | | | .16 | | | | 24.11 | | | | 24.27 | | | | (.35 | ) | | | (16.81 | ) | | | (17.16 | ) | | | 126.70 | | | | 21.97 | | | | 121 | | | | .59 | | | | .13 | |
| 12/31/2020 | | | 80.92 | | | | .20 | | | | 41.05 | | | | 41.25 | | | | (.40 | ) | | | (2.18 | ) | | | (2.58 | ) | | | 119.59 | | | | 52.07 | | | | 60 | | | | .60 | | | | .21 | |
| 12/31/2019 | | | 69.77 | | | | .65 | | | | 19.55 | | | | 20.20 | | | | (.61 | ) | | | (8.44 | ) | | | (9.05 | ) | | | 80.92 | | | | 30.79 | | | | 18 | | | | .60 | | | | .85 | |
| 12/31/2018 | | | 77.74 | | | | .47 | | | | .24 | | | | .71 | | | | (.44 | ) | | | (8.24 | ) | | | (8.68 | ) | | | 69.77 | | | | (.26 | ) | | | 10 | | | | .59 | | | | .60 | |
| 12/31/20174,8 | | | 68.84 | | | | .35 | | | | 16.38 | | | | 16.73 | | | | (.50 | ) | | | (7.33 | ) | | | (7.83 | ) | | | 77.74 | | | | 25.47 | 6 | | | 3 | | | | .59 | 7 | | | .47 | 7 |
| Class 2: | | | | | | | | | | | | | | | | | | | | | | | | | | | | | | | | | | | | | | | | | | | | | | | | |
| 6/30/20224,5 | | | 126.28 | | | | .13 | | | | (36.38 | ) | | | (36.25 | ) | | | (.09 | ) | | | (14.31 | ) | | | (14.40 | ) | | | 75.63 | | | | (29.90 | )6 | | | 14,923 | | | | .59 | 7 | | | .25 | 7 |
| 12/31/2021 | | | 119.18 | | | | .15 | | | | 24.03 | | | | 24.18 | | | | (.27 | ) | | | (16.81 | ) | | | (17.08 | ) | | | 126.28 | | | | 21.97 | | | | 21,986 | | | | .59 | | | | .12 | |
| 12/31/2020 | | | 80.57 | | | | .19 | | | | 40.89 | | | | 41.08 | | | | (.29 | ) | | | (2.18 | ) | | | (2.47 | ) | | | 119.18 | | | | 52.10 | | | | 20,594 | | | | .60 | | | | .21 | |
| 12/31/2019 | | | 69.48 | | | | .63 | | | | 19.47 | | | | 20.10 | | | | (.57 | ) | | | (8.44 | ) | | | (9.01 | ) | | | 80.57 | | | | 30.77 | | | | 15,885 | | | | .60 | | | | .83 | |
| 12/31/2018 | | | 77.35 | | | | .44 | | | | .27 | | | | .71 | | | | (.34 | ) | | | (8.24 | ) | | | (8.58 | ) | | | 69.48 | | | | (.25 | ) | | | 13,701 | | | | .59 | | | | .55 | |
| 12/31/2017 | | | 66.92 | | | | .37 | | | | 17.76 | | | | 18.13 | | | | (.37 | ) | | | (7.33 | ) | | | (7.70 | ) | | | 77.35 | | | | 28.28 | | | | 15,716 | | | | .60 | | | | .50 | |
| Class 3: | | | | | | | | | | | | | | | | | | | | | | | | | | | | | | | | | | | | | | | | | | | | | | | | |
| 6/30/20224,5 | | | 128.68 | | | | .17 | | | | (37.10 | ) | | | (36.93 | ) | | | (.11 | ) | | | (14.31 | ) | | | (14.42 | ) | | | 77.33 | | | | (29.88 | )6 | | | 198 | | | | .52 | 7 | | | .31 | 7 |
| 12/31/2021 | | | 121.13 | | | | .24 | | | | 24.47 | | | | 24.71 | | | | (.35 | ) | | | (16.81 | ) | | | (17.16 | ) | | | 128.68 | | | | 22.07 | | | | 302 | | | | .52 | | | | .19 | |
| 12/31/2020 | | | 81.84 | | | | .26 | | | | 41.56 | | | | 41.82 | | | | (.35 | ) | | | (2.18 | ) | | | (2.53 | ) | | | 121.13 | | | | 52.20 | | | | 279 | | | | .53 | | | | .28 | |
| 12/31/2019 | | | 70.44 | | | | .69 | | | | 19.77 | | | | 20.46 | | | | (.62 | ) | | | (8.44 | ) | | | (9.06 | ) | | | 81.84 | | | | 30.86 | | | | 213 | | | | .53 | | | | .90 | |
| 12/31/2018 | | | 78.32 | | | | .50 | | | | .26 | | | | .76 | | | | (.40 | ) | | | (8.24 | ) | | | (8.64 | ) | | | 70.44 | | | | (.18 | ) | | | 187 | | | | .52 | | | | .62 | |
| 12/31/2017 | | | 67.67 | | | | .42 | | | | 17.98 | | | | 18.40 | | | | (.42 | ) | | | (7.33 | ) | | | (7.75 | ) | | | 78.32 | | | | 28.39 | | | | 212 | | | | .53 | | | | .57 | |
| Class 4: | | | | | | | | | | | | | | | | | | | | | | | | | | | | | | | | | | | | | | | | | | | | | | | | |
| 6/30/20224,5 | | | 123.79 | | | | — | 9 | | | (35.61 | ) | | | (35.61 | ) | | | (.05 | ) | | | (14.31 | ) | | | (14.36 | ) | | | 73.82 | | | | (29.98 | )6 | | | 2,330 | | | | .84 | 7 | | | — | 7,11 |
| 12/31/2021 | | | 117.24 | | | | (.15 | ) | | | 23.59 | | | | 23.44 | | | | (.08 | ) | | | (16.81 | ) | | | (16.89 | ) | | | 123.79 | | | | 21.69 | | | | 3,214 | | | | .84 | | | | (.13 | ) |
| 12/31/2020 | | | 79.41 | | | | (.04 | ) | | | 40.24 | | | | 40.20 | | | | (.19 | ) | | | (2.18 | ) | | | (2.37 | ) | | | 117.24 | | | | 51.71 | | | | 2,347 | | | | .85 | | | | (.04 | ) |
| 12/31/2019 | | | 68.64 | | | | .44 | | | | 19.19 | | | | 19.63 | | | | (.42 | ) | | | (8.44 | ) | | | (8.86 | ) | | | 79.41 | | | | 30.44 | | | | 1,513 | | | | .85 | | | | .59 | |
| 12/31/2018 | | | 76.56 | | | | .24 | | | | .28 | | | | .52 | | | | (.20 | ) | | | (8.24 | ) | | | (8.44 | ) | | | 68.64 | | | | (.50 | ) | | | 1,076 | | | | .84 | | | | .31 | |
| 12/31/2017 | | | 66.41 | | | | .18 | | | | 17.61 | | | | 17.79 | | | | (.31 | ) | | | (7.33 | ) | | | (7.64 | ) | | | 76.56 | | | | 27.99 | | | | 954 | | | | .85 | | | | .25 | |
Refer to the end of the tables for footnotes.
| 326 | American Funds Insurance Series |
Financial highlights (continued)
| | | | | | (Loss) income from
investment operations1 | | | Dividends and distributions | | | | | | | | | | | | | | | | |
| Year ended | | Net asset
value,
beginning
of year | | | Net
investment
income | | | Net (losses)
gains on
securities
(both
realized and
unrealized) | | | Total from
investment
operations | | | Dividends
(from net
investment
income) | | | Distributions
(from capital
gains) | | | Total
dividends
and
distributions | | | Net asset
value,
end
of year | | | Total return | | | Net assets,
end of year
(in millions) | | | Ratio of
expenses
to average
net assets3 | | | Ratio of
net income
to average
net assets | |
| | | | | | | | | | | | | | | | | | | | | | | | | | | | | | | | | | | | | |
| International Fund |
| | | | | | | | | | | | | | | | | | | | | | | | | | | | | | | | | | | | | | | | | | | | | | | | | |
| Class 1: | | | | | | | | | | | | | | | | | | | | | | | | | | | | | | | | | | | | | | | | | | | | | | | | |
| 6/30/20224,5 | | $ | 22.70 | | | $ | .17 | | | $ | (5.01 | ) | | $ | (4.84 | ) | | $ | (.09 | ) | | $ | (2.60 | ) | | $ | (2.69 | ) | | $ | 15.17 | | | | (22.53 | )%6 | | $ | 3,226 | | | | .54 | %7 | | | 1.73 | %7 |
| 12/31/2021 | | | 23.64 | | | | .38 | | | | (.67 | ) | | | (.29 | ) | | | (.65 | ) | | | — | | | | (.65 | ) | | | 22.70 | | | | (1.23 | ) | | | 4,747 | | | | .55 | | | | 1.57 | |
| 12/31/2020 | | | 20.86 | | | | .14 | | | | 2.82 | | | | 2.96 | | | | (.18 | ) | | | — | | | | (.18 | ) | | | 23.64 | | | | 14.28 | | | | 5,652 | | | | .55 | | | | .71 | |
| 12/31/2019 | | | 17.66 | | | | .30 | | | | 3.74 | | | | 4.04 | | | | (.34 | ) | | | (.50 | ) | | | (.84 | ) | | | 20.86 | | | | 23.21 | | | | 5,353 | | | | .54 | | | | 1.54 | |
| 12/31/2018 | | | 21.71 | | | | .34 | | | | (2.97 | ) | | | (2.63 | ) | | | (.40 | ) | | | (1.02 | ) | | | (1.42 | ) | | | 17.66 | | | | (12.94 | ) | | | 4,811 | | | | .53 | | | | 1.62 | |
| 12/31/2017 | | | 16.82 | | | | .26 | | | | 5.16 | | | | 5.42 | | | | (.30 | ) | | | (.23 | ) | | | (.53 | ) | | | 21.71 | | | | 32.46 | | | | 5,014 | | | | .53 | | | | 1.33 | |
| Class 1A: | | | | | | | | | | | | | | | | | | | | | | | | | | | | | | | | | | | | | | | | | | | | | | | | |
| 6/30/20224,5 | | | 22.61 | | | | .15 | | | | (5.00 | ) | | | (4.85 | ) | | | (.08 | ) | | | (2.60 | ) | | | (2.68 | ) | | | 15.08 | | | | (22.66 | )6 | | | 10 | | | | .79 | 7 | | | 1.53 | 7 |
| 12/31/2021 | | | 23.55 | | | | .33 | | | | (.67 | ) | | | (.34 | ) | | | (.60 | ) | | | — | | | | (.60 | ) | | | 22.61 | | | | (1.47 | ) | | | 12 | | | | .80 | | | | 1.39 | |
| 12/31/2020 | | | 20.80 | | | | .08 | | | | 2.81 | | | | 2.89 | | | | (.14 | ) | | | — | | | | (.14 | ) | | | 23.55 | | | | 13.96 | | | | 10 | | | | .80 | | | | .43 | |
| 12/31/2019 | | | 17.62 | | | | .25 | | | | 3.72 | | | | 3.97 | | | | (.29 | ) | | | (.50 | ) | | | (.79 | ) | | | 20.80 | | | | 22.90 | | | | 7 | | | | .79 | | | | 1.27 | |
| 12/31/2018 | | | 21.67 | | | | .27 | | | | (2.93 | ) | | | (2.66 | ) | | | (.37 | ) | | | (1.02 | ) | | | (1.39 | ) | | | 17.62 | | | | (13.11 | ) | | | 5 | | | | .78 | | | | 1.32 | |
| 12/31/20174,8 | | | 17.17 | | | | .09 | | | | 4.93 | | | | 5.02 | | | | (.29 | ) | | | (.23 | ) | | | (.52 | ) | | | 21.67 | | | | 29.46 | 6 | | | 2 | | | | .77 | 7 | | | .43 | 7 |
| Class 2: | | | | | | | | | | | | | | | | | | | | | | | | | | | | | | | | | | | | | | | | | | | | | | | | |
| 6/30/20224,5 | | | 22.60 | | | | .15 | | | | (4.99 | ) | | | (4.84 | ) | | | (.08 | ) | | | (2.60 | ) | | | (2.68 | ) | | | 15.08 | | | | (22.63 | )6 | | | 3,195 | | | | .79 | 7 | | | 1.50 | 7 |
| 12/31/2021 | | | 23.54 | | | | .33 | | | | (.68 | ) | | | (.35 | ) | | | (.59 | ) | | | — | | | | (.59 | ) | | | 22.60 | | | | (1.49 | ) | | | 4,190 | | | | .80 | | | | 1.35 | |
| 12/31/2020 | | | 20.78 | | | | .09 | | | | 2.80 | | | | 2.89 | | | | (.13 | ) | | | — | | | | (.13 | ) | | | 23.54 | | | | 13.97 | | | | 4,481 | | | | .80 | | | | .46 | |
| 12/31/2019 | | | 17.60 | | | | .25 | | | | 3.72 | | | | 3.97 | | | | (.29 | ) | | | (.50 | ) | | | (.79 | ) | | | 20.78 | | | | 22.88 | | | | 4,311 | | | | .79 | | | | 1.29 | |
| 12/31/2018 | | | 21.63 | | | | .29 | | | | (2.95 | ) | | | (2.66 | ) | | | (.35 | ) | | | (1.02 | ) | | | (1.37 | ) | | | 17.60 | | | | (13.13 | ) | | | 3,875 | | | | .78 | | | | 1.40 | |
| 12/31/2017 | | | 16.76 | | | | .22 | | | | 5.13 | | | | 5.35 | | | | (.25 | ) | | | (.23 | ) | | | (.48 | ) | | | 21.63 | | | | 32.14 | | | | 4,422 | | | | .78 | | | | 1.10 | |
| Class 3: | | | | | | | | | | | | | | | | | | | | | | | | | | | | | | | | | | | | | | | | | | | | | | | | |
| 6/30/20224,5 | | | 22.76 | | | | .15 | | | | (5.03 | ) | | | (4.88 | ) | | | (.08 | ) | | | (2.60 | ) | | | (2.68 | ) | | | 15.20 | | | | (22.64 | )6 | | | 16 | | | | .72 | 7 | | | 1.56 | 7 |
| 12/31/2021 | | | 23.69 | | | | .34 | | | | (.67 | ) | | | (.33 | ) | | | (.60 | ) | | | — | | | | (.60 | ) | | | 22.76 | | | | (1.39 | ) | | | 21 | | | | .73 | | | | 1.41 | |
| 12/31/2020 | | | 20.92 | | | | .10 | | | | 2.81 | | | | 2.91 | | | | (.14 | ) | | | — | | | | (.14 | ) | | | 23.69 | | | | 14.00 | | | | 25 | | | | .73 | | | | .53 | |
| 12/31/2019 | | | 17.70 | | | | .27 | | | | 3.75 | | | | 4.02 | | | | (.30 | ) | | | (.50 | ) | | | (.80 | ) | | | 20.92 | | | | 23.05 | | | | 25 | | | | .72 | | | | 1.37 | |
| 12/31/2018 | | | 21.75 | | | | .31 | | | | (2.98 | ) | | | (2.67 | ) | | | (.36 | ) | | | (1.02 | ) | | | (1.38 | ) | | | 17.70 | | | | (13.10 | ) | | | 24 | | | | .71 | | | | 1.48 | |
| 12/31/2017 | | | 16.85 | | | | .23 | | | | 5.17 | | | | 5.40 | | | | (.27 | ) | | | (.23 | ) | | | (.50 | ) | | | 21.75 | | | | 32.23 | | | | 31 | | | | .71 | | | | 1.17 | |
| Class 4: | | | | | | | | | | | | | | | | | | | | | | | | | | | | | | | | | | | | | | | | | | | | | | | | |
| 6/30/20224,5 | | | 22.31 | | | | .12 | | | | (4.93 | ) | | | (4.81 | ) | | | (.07 | ) | | | (2.60 | ) | | | (2.67 | ) | | | 14.83 | | | | (22.78 | )6 | | | 367 | | | | 1.04 | 7 | | | 1.26 | 7 |
| 12/31/2021 | | | 23.25 | | | | .27 | | | | (.67 | ) | | | (.40 | ) | | | (.54 | ) | | | — | | | | (.54 | ) | | | 22.31 | | | | (1.71 | ) | | | 459 | | | | 1.05 | | | | 1.13 | |
| 12/31/2020 | | | 20.54 | | | | .04 | | | | 2.76 | | | | 2.80 | | | | (.09 | ) | | | — | | | | (.09 | ) | | | 23.25 | | | | 13.66 | | | | 423 | | | | 1.05 | | | | .21 | |
| 12/31/2019 | | | 17.40 | | | | .20 | | | | 3.69 | | | | 3.89 | | | | (.25 | ) | | | (.50 | ) | | | (.75 | ) | | | 20.54 | | | | 22.67 | | | | 379 | | | | 1.04 | | | | 1.03 | |
| 12/31/2018 | | | 21.42 | | | | .23 | | | | (2.93 | ) | | | (2.70 | ) | | | (.30 | ) | | | (1.02 | ) | | | (1.32 | ) | | | 17.40 | | | | (13.41 | ) | | | 295 | | | | 1.03 | | | | 1.13 | |
| 12/31/2017 | | | 16.64 | | | | .11 | | | | 5.16 | | | | 5.27 | | | | (.26 | ) | | | (.23 | ) | | | (.49 | ) | | | 21.42 | | | | 31.89 | | | | 289 | | | | 1.03 | | | | .55 | |
Refer to the end of the tables for footnotes.
| American Funds Insurance Series | 327 |
Financial highlights (continued)
| | | | | | (Loss) income from
investment operations1 | | | Dividends and distributions | | | | | | | | | | | | | | | | | | | |
| Year ended | | Net asset
value,
beginning
of year | | | Net
investment
income | | | Net (losses)
gains on
securities
(both
realized and
unrealized) | | | Total from
investment
operations | | | Dividends
(from net
investment
income) | | | Distributions
(from capital
gains) | | | Total
dividends
and
distributions | | | Net asset
value,
end
of year | | | Total return2 | | | Net assets,
end of year
(in millions) | | | Ratio of
expenses to
average net
assets before
waivers3 | | | Ratio of
expenses to
average net
assets after
waivers2,3 | | | Ratio of
net income
to average
net assets2 | |
| | | | | | | | | | | | | | | | | | | | | | | | | | | | | | | | | | | | | | | | |
| New World Fund |
| | | | | | | | | | | | | | | | | | | | | | | | | | | | | | | | | | | | | | | | | | | | | | | | | | | | | |
| Class 1: | | | | | | | | | | | | | | | | | | | | | | | | | | | | | | | | | | | | | | | | | | | | | | | | | | | | |
| 6/30/20224,5 | | $ | 31.83 | | | $ | .23 | | | $ | (7.57 | ) | | $ | (7.34 | ) | | $ | (.14 | ) | | $ | (2.34 | ) | | $ | (2.48 | ) | | $ | 22.01 | | | | (23.72 | )%6 | | $ | 1,674 | | | | .71 | %7 | | | .57 | %7 | | | 1.68 | %7 |
| 12/31/2021 | | | 31.59 | | | | .29 | | | | 1.38 | | | | 1.67 | | | | (.36 | ) | | | (1.07 | ) | | | (1.43 | ) | | | 31.83 | | | | 5.16 | | | | 2,443 | | | | .74 | | | | .56 | | | | .88 | |
| 12/31/2020 | | | 25.84 | | | | .15 | | | | 5.93 | | | | 6.08 | | | | (.06 | ) | | | (.27 | ) | | | (.33 | ) | | | 31.59 | | | | 23.89 | | | | 2,309 | | | | .76 | | | | .64 | | | | .58 | |
| 12/31/2019 | | | 20.98 | | | | .28 | | | | 5.79 | | | | 6.07 | | | | (.29 | ) | | | (.92 | ) | | | (1.21 | ) | | | 25.84 | | | | 29.47 | | | | 2,129 | | | | .76 | | | | .76 | | | | 1.18 | |
| 12/31/2018 | | | 25.30 | | | | .27 | | | | (3.65 | ) | | | (3.38 | ) | | | (.27 | ) | | | (.67 | ) | | | (.94 | ) | | | 20.98 | | | | (13.83 | ) | | | 1,702 | | | | .77 | | | | .77 | | | | 1.11 | |
| 12/31/2017 | | | 19.72 | | | | .26 | | | | 5.59 | | | | 5.85 | | | | (.27 | ) | | | — | | | | (.27 | ) | | | 25.30 | | | | 29.73 | | | | 2,050 | | | | .77 | | | | .77 | | | | 1.14 | |
| Class 1A: | | | | | | | | | | | | | | | | | | | | | | | | | | | | | | | | | | | | | | | | | | | | | | | | | | | | |
| 6/30/20224,5 | | | 31.70 | | | | .20 | | | | (7.55 | ) | | | (7.35 | ) | | | (.12 | ) | | | (2.34 | ) | | | (2.46 | ) | | | 21.89 | | | | (23.82 | )6 | | | 10 | | | | .96 | 7 | | | .82 | 7 | | | 1.46 | 7 |
| 12/31/2021 | | | 31.43 | | | | .17 | | | | 1.41 | | | | 1.58 | | | | (.24 | ) | | | (1.07 | ) | | | (1.31 | ) | | | 31.70 | | | | 4.90 | | | | 12 | | | | .99 | | | | .81 | | | | .54 | |
| 12/31/2020 | | | 25.74 | | | | .07 | | | | 5.92 | | | | 5.99 | | | | (.03 | ) | | | (.27 | ) | | | (.30 | ) | | | 31.43 | | | | 23.63 | | | | 18 | | | | 1.01 | | | | .87 | | | | .26 | |
| 12/31/2019 | | | 20.92 | | | | .22 | | | | 5.76 | | | | 5.98 | | | | (.24 | ) | | | (.92 | ) | | | (1.16 | ) | | | 25.74 | | | | 29.11 | | | | 4 | | | | 1.01 | | | | 1.01 | | | | .92 | |
| 12/31/2018 | | | 25.25 | | | | .21 | | | | (3.64 | ) | | | (3.43 | ) | | | (.23 | ) | | | (.67 | ) | | | (.90 | ) | | | 20.92 | | | | (14.02 | ) | | | 2 | | | | 1.02 | | | | 1.02 | | | | .91 | |
| 12/31/20174,8 | | | 20.14 | | | | .13 | | | | 5.24 | | | | 5.37 | | | | (.26 | ) | | | — | | | | (.26 | ) | | | 25.25 | | | | 26.72 | 6 | | | 1 | | | | 1.00 | 7 | | | 1.00 | 7 | | | .53 | 7 |
| Class 2: | | | | | | | | | | | | | | | | | | | | | | | | | | | | | | | | | | | | | | | | | | | | | | | | | | | | |
| 6/30/20224,5 | | | 31.48 | | | | .19 | | | | (7.49 | ) | | | (7.30 | ) | | | (.12 | ) | | | (2.34 | ) | | | (2.46 | ) | | | 21.72 | | | | (23.84 | )6 | | | 790 | | | | .96 | 7 | | | .82 | 7 | | | 1.44 | 7 |
| 12/31/2021 | | | 31.25 | | | | .20 | | | | 1.38 | | | | 1.58 | | | | (.28 | ) | | | (1.07 | ) | | | (1.35 | ) | | | 31.48 | | | | 4.92 | | | | 1,086 | | | | .99 | | | | .81 | | | | .63 | |
| 12/31/2020 | | | 25.59 | | | | .08 | | | | 5.87 | | | | 5.95 | | | | (.02 | ) | | | (.27 | ) | | | (.29 | ) | | | 31.25 | | | | 23.58 | | | | 1,109 | | | | 1.01 | | | | .89 | | | | .34 | |
| 12/31/2019 | | | 20.79 | | | | .22 | | | | 5.73 | | | | 5.95 | | | | (.23 | ) | | | (.92 | ) | | | (1.15 | ) | | | 25.59 | | | | 29.15 | | | | 981 | | | | 1.01 | | | | 1.01 | | | | .93 | |
| 12/31/2018 | | | 25.07 | | | | .20 | | | | (3.61 | ) | | | (3.41 | ) | | | (.20 | ) | | | (.67 | ) | | | (.87 | ) | | | 20.79 | | | | (14.04 | ) | | | 843 | | | | 1.02 | | | | 1.02 | | | | .85 | |
| 12/31/2017 | | | 19.54 | | | | .20 | | | | 5.55 | | | | 5.75 | | | | (.22 | ) | | | — | | | | (.22 | ) | | | 25.07 | | | | 29.44 | | | | 1,055 | | | | 1.02 | | | | 1.02 | | | | .89 | |
| Class 4: | | | | | | | | | | | | | | | | | | | | | | | | | | | | | | | | | | | | | | | | | | | | | | | | | | | | |
| 6/30/20224,5 | | | 31.24 | | | | .16 | | | | (7.42 | ) | | | (7.26 | ) | | | (.11 | ) | | | (2.34 | ) | | | (2.45 | ) | | | 21.53 | | | | (23.89 | )6 | | | 715 | | | | 1.21 | 7 | | | 1.07 | 7 | | | 1.21 | 7 |
| 12/31/2021 | | | 31.04 | | | | .12 | | | | 1.36 | | | | 1.48 | | | | (.21 | ) | | | (1.07 | ) | | | (1.28 | ) | | | 31.24 | | | | 4.63 | | | | 906 | | | | 1.24 | | | | 1.06 | | | | .38 | |
| 12/31/2020 | | | 25.47 | | | | .02 | | | | 5.83 | | | | 5.85 | | | | (.01 | ) | | | (.27 | ) | | | (.28 | ) | | | 31.04 | | | | 23.29 | | | | 807 | | | | 1.26 | | | | 1.14 | | | | .08 | |
| 12/31/2019 | | | 20.71 | | | | .16 | | | | 5.70 | | | | 5.86 | | | | (.18 | ) | | | (.92 | ) | | | (1.10 | ) | | | 25.47 | | | | 28.82 | | | | 646 | | | | 1.26 | | | | 1.26 | | | | .67 | |
| 12/31/2018 | | | 24.99 | | | | .14 | | | | (3.59 | ) | | | (3.45 | ) | | | (.16 | ) | | | (.67 | ) | | | (.83 | ) | | | 20.71 | | | | (14.25 | ) | | | 464 | | | | 1.27 | | | | 1.27 | | | | .61 | |
| 12/31/2017 | | | 19.51 | | | | .14 | | | | 5.52 | | | | 5.66 | | | | (.18 | ) | | | — | | | | (.18 | ) | | | 24.99 | | | | 29.06 | | | | 427 | | | | 1.27 | | | | 1.27 | | | | .61 | |
Refer to the end of the tables for footnotes.
| 328 | American Funds Insurance Series |
Financial highlights (continued)
| | | | | | (Loss) income from
investment operations1 | | | Dividends and distributions | | | | | | | | | | | | | | | | | | | |
| Year ended | | Net asset
value,
beginning
of year | | | Net
investment
income | | | Net (losses)
gains on
securities
(both
realized and
unrealized) | | | Total from
investment
operations | | | Dividends
(from net
investment
income) | | | Distributions
(from capital
gains) | | | Total
dividends
and
distributions | | | Net asset
value,
end
of year | | | Total return2 | | | Net assets,
end of year
(in millions) | | | Ratio of
expenses to
average net
assets before
waivers3 | | | Ratio of
expenses to
average net
assets after
waivers2,3 | | | Ratio of
net income
to average
net assets2 | |
| | | | | | | | | | | | | | | | | | | | | | | | | | | | | | | | | | | | | | | | |
| Washington Mutual Investors Fund |
| | | | | | | | | | | | | | | | | | | | | | | | | | | | | | | | | | | | | | | | | | | | | | | | | | | | | |
| Class 1: | | | | | | | | | | | | | | | | | | | | | | | | | | | | | | | | | | | | | | | | | | | | | | | | | | | | |
| 6/30/20224,5 | | $ | 18.09 | | | $ | .16 | | | $ | (2.19 | ) | | $ | (2.03 | ) | | $ | (.08 | ) | | $ | (3.72 | ) | | $ | (3.80 | ) | | $ | 12.26 | | | | (12.88 | )%6 | | $ | 5,471 | | | | .42 | %7 | | | .26 | %7 | | | 2.00 | %7 |
| 12/31/2021 | | | 14.35 | | | | .29 | | | | 3.73 | | | | 4.02 | | | | (.28 | ) | | | — | | | | (.28 | ) | | | 18.09 | | | | 28.12 | | | | 6,766 | | | | .42 | | | | .31 | | | | 1.79 | |
| 12/31/2020 | | | 13.56 | | | | .25 | | | | .95 | | | | 1.20 | | | | (.26 | ) | | | (.15 | ) | | | (.41 | ) | | | 14.35 | | | | 9.04 | | | | 5,684 | | | | .43 | | | | .43 | | | | 2.00 | |
| 12/31/2019 | | | 12.38 | | | | .30 | | | | 2.25 | | | | 2.55 | | | | (.30 | ) | | | (1.07 | ) | | | (1.37 | ) | | | 13.56 | | | | 21.66 | | | | 5,559 | | | | .42 | | | | .42 | | | | 2.28 | |
| 12/31/2018 | | | 14.96 | | | | .31 | | | | (1.44 | ) | | | (1.13 | ) | | | (.31 | ) | | | (1.14 | ) | | | (1.45 | ) | | | 12.38 | | | | (8.45 | ) | | | 4,810 | | | | .41 | | | | .41 | | | | 2.13 | |
| 12/31/2017 | | | 13.53 | | | | .32 | | | | 1.96 | | | | 2.28 | | | | (.32 | ) | | | (.53 | ) | | | (.85 | ) | | | 14.96 | | | | 17.30 | | | | 5,581 | | | | .41 | | | | .41 | | | | 2.27 | |
| Class 1A: | | | | | | | | | | | | | | | | | | | | | | | | | | | | | | | | | | | | | | | | | | | | | | | | | | | | |
| 6/30/20224,5 | | | 17.96 | | | | .14 | | | | (2.17 | ) | | | (2.03 | ) | | | (.06 | ) | | | (3.72 | ) | | | (3.78 | ) | | | 12.15 | | | | (12.98 | )6 | | | 57 | | | | .67 | 7 | | | .51 | 7 | | | 1.64 | 7 |
| 12/31/2021 | | | 14.28 | | | | .27 | | | | 3.67 | | | | 3.94 | | | | (.26 | ) | | | — | | | | (.26 | ) | | | 17.96 | | | | 27.70 | | | | 169 | | | | .67 | | | | .53 | | | | 1.62 | |
| 12/31/2020 | | | 13.51 | | | | .23 | | | | .93 | | | | 1.16 | | | | (.24 | ) | | | (.15 | ) | | | (.39 | ) | | | 14.28 | | | | 8.79 | | | | 25 | | | | .67 | | | | .67 | | | | 1.78 | |
| 12/31/2019 | | | 12.35 | | | | .26 | | | | 2.24 | | | | 2.50 | | | | (.27 | ) | | | (1.07 | ) | | | (1.34 | ) | | | 13.51 | | | | 21.35 | | | | 9 | | | | .67 | | | | .67 | | | | 2.03 | |
| 12/31/2018 | | | 14.94 | | | | .26 | | | | (1.42 | ) | | | (1.16 | ) | | | (.29 | ) | | | (1.14 | ) | | | (1.43 | ) | | | 12.35 | | | | (8.67 | ) | | | 3 | | | | .66 | | | | .66 | | | | 1.84 | |
| 12/31/20174,8 | | | 13.75 | | | | .28 | | | | 1.75 | | | | 2.03 | | | | (.31 | ) | | | (.53 | ) | | | (.84 | ) | | | 14.94 | | | | 15.21 | 6 | | | 1 | | | | .65 | 7 | | | .65 | 7 | | | 2.01 | 7 |
| Class 2: | | | | | | | | | | | | | | | | | | | | | | | | | | | | | | | | | | | | | | | | | | | | | | | | | | | | |
| 6/30/20224,5 | | | 17.83 | | | | .14 | | | | (2.16 | ) | | | (2.02 | ) | | | (.07 | ) | | | (3.72 | ) | | | (3.79 | ) | | | 12.02 | | | | (13.01 | )6 | | | 2,775 | | | | .67 | 7 | | | .51 | 7 | | | 1.74 | 7 |
| 12/31/2021 | | | 14.15 | | | | .25 | | | | 3.67 | | | | 3.92 | | | | (.24 | ) | | | — | | | | (.24 | ) | | | 17.83 | | | | 27.78 | | | | 3,426 | | | | .67 | | | | .56 | | | | 1.54 | |
| 12/31/2020 | | | 13.39 | | | | .22 | | | | .91 | | | | 1.13 | | | | (.22 | ) | | | (.15 | ) | | | (.37 | ) | | | 14.15 | | | | 8.68 | | | | 3,082 | | | | .68 | | | | .68 | | | | 1.75 | |
| 12/31/2019 | | | 12.24 | | | | .26 | | | | 2.22 | | | | 2.48 | | | | (.26 | ) | | | (1.07 | ) | | | (1.33 | ) | | | 13.39 | | | | 21.38 | | | | 3,093 | | | | .67 | | | | .67 | | | | 2.03 | |
| 12/31/2018 | | | 14.80 | | | | .27 | | | | (1.42 | ) | | | (1.15 | ) | | | (.27 | ) | | | (1.14 | ) | | | (1.41 | ) | | | 12.24 | | | | (8.66 | ) | | | 2,850 | | | | .66 | | | | .66 | | | | 1.88 | |
| 12/31/2017 | | | 13.39 | | | | .28 | | | | 1.94 | | | | 2.22 | | | | (.28 | ) | | | (.53 | ) | | | (.81 | ) | | | 14.80 | | | | 17.04 | | | | 3,551 | | | | .66 | | | | .66 | | | | 2.02 | |
| Class 4: | | | | | | | | | | | | | | | | | | | | | | | | | | | | | | | | | | | | | | | | | | | | | | | | | | | | |
| 6/30/20224,5 | | | 17.71 | | | | .12 | | | | (2.15 | ) | | | (2.03 | ) | | | (.06 | ) | | | (3.72 | ) | | | (3.78 | ) | | | 11.90 | | | | (13.13 | )6 | | | 995 | | | | .92 | 7 | | | .76 | 7 | | | 1.50 | 7 |
| 12/31/2021 | | | 14.06 | | | | .21 | | | | 3.65 | | | | 3.86 | | | | (.21 | ) | | | — | | | | (.21 | ) | | | 17.71 | | | | 27.51 | | | | 1,104 | | | | .92 | | | | .81 | | | | 1.30 | |
| 12/31/2020 | | | 13.31 | | | | .19 | | | | .91 | | | | 1.10 | | | | (.20 | ) | | | (.15 | ) | | | (.35 | ) | | | 14.06 | | | | 8.47 | | | | 788 | | | | .93 | | | | .93 | | | | 1.51 | |
| 12/31/2019 | | | 12.19 | | | | .23 | | | | 2.20 | | | | 2.43 | | | | (.24 | ) | | | (1.07 | ) | | | (1.31 | ) | | | 13.31 | | | | 21.03 | | | | 621 | | | | .92 | | | | .92 | | | | 1.78 | |
| 12/31/2018 | | | 14.77 | | | | .23 | | | | (1.42 | ) | | | (1.19 | ) | | | (.25 | ) | | | (1.14 | ) | | | (1.39 | ) | | | 12.19 | | | | (8.92 | ) | | | 368 | | | | .91 | | | | .91 | | | | 1.62 | |
| 12/31/2017 | | | 13.39 | | | | .25 | | | | 1.93 | | | | 2.18 | | | | (.27 | ) | | | (.53 | ) | | | (.80 | ) | | | 14.77 | | | | 16.70 | | | | 247 | | | | .91 | | | | .91 | | | | 1.76 | |
Refer to the end of the tables for footnotes.
| American Funds Insurance Series | 329 |
Financial highlights (continued)
| | | | | | (Loss) income from
investment operations1 | | | Dividends and distributions | | | | | | | | | | | | | | | | | | | |
| Year ended | | Net asset
value,
beginning
of year | | | Net
investment
income | | | Net (losses)
gains on
securities
(both
realized and
unrealized) | | | Total from
investment
operations | | | Dividends
(from net
investment
income) | | | Distributions
(from capital
gains) | | | Total
dividends
and
distributions | | | Net asset
value,
end
of year | | | Total return2 | | | Net assets,
end of year
(in millions) | | | Ratio of
expenses to
average net
assets before
waivers3 | | | Ratio of
expenses to
average net
assets after
waivers2,3 | | | Ratio of
net income
to average
net assets2 | |
| | | | | | | | | | | | | | | | | | | | | | | | | | | | | | | | | | | | | | | | |
| Capital World Growth and Income Fund |
| | | | | | | | | | | | | | | | | | | | | | | | | | | | | | | | | | | | | | | | | | | | | | | | | | | | | |
| Class 1: | | | | | | | | | | | | | | | | | | | | | | | | | | | | | | | | | | | | | | | | | | | | | | | | | | | | |
| 6/30/20224,5 | | $ | 18.42 | | | $ | .21 | | | $ | (3.76 | ) | | $ | (3.55 | ) | | $ | (.09 | ) | | $ | (3.45 | ) | | $ | (3.54 | ) | | $ | 11.33 | | | | (21.20 | )%6 | | $ | 551 | | | | .61 | %7 | | | .42 | %7 | | | 2.67 | %7 |
| 12/31/2021 | | | 16.67 | | | | .38 | | | | 2.10 | | | | 2.48 | | | | (.33 | ) | | | (.40 | ) | | | (.73 | ) | | | 18.42 | | | | 15.03 | | | | 812 | | | | .63 | | | | .47 | | | | 2.14 | |
| 12/31/2020 | | | 15.92 | | | | .22 | | | | 1.14 | | | | 1.36 | | | | (.23 | ) | | | (.38 | ) | | | (.61 | ) | | | 16.67 | | | | 9.03 | | | | 657 | | | | .66 | | | | .66 | | | | 1.49 | |
| 12/31/2019 | | | 13.02 | | | | .31 | | | | 3.67 | | | | 3.98 | | | | (.32 | ) | | | (.76 | ) | | | (1.08 | ) | | | 15.92 | | | | 31.39 | | | | 625 | | | | .65 | | | | .65 | | | | 2.08 | |
| 12/31/2018 | | | 15.81 | | | | .29 | | | | (1.62 | ) | | | (1.33 | ) | | | (.28 | ) | | | (1.18 | ) | | | (1.46 | ) | | | 13.02 | | | | (9.36 | ) | | | 492 | | | | .63 | | | | .63 | | | | 1.94 | |
| 12/31/2017 | | | 13.02 | | | | .35 | | | | 3.06 | | | | 3.41 | | | | (.36 | ) | | | (.26 | ) | | | (.62 | ) | | | 15.81 | | | | 26.40 | | | | 485 | | | | .63 | | | | .63 | | | | 2.43 | |
| Class 1A: | | | | | | | | | | | | | | | | | | | | | | | | | | | | | | | | | | | | | | | | | | | | | | | | | | | | |
| 6/30/20224,5 | | | 18.34 | | | | .19 | | | | (3.73 | ) | | | (3.54 | ) | | | (.09 | ) | | | (3.45 | ) | | | (3.54 | ) | | | 11.26 | | | | (21.28 | )6 | | | 6 | | | | .86 | 7 | | | .67 | 7 | | | 2.47 | 7 |
| 12/31/2021 | | | 16.62 | | | | .37 | | | | 2.06 | | | | 2.43 | | | | (.31 | ) | | | (.40 | ) | | | (.71 | ) | | | 18.34 | | | | 14.71 | | | | 7 | | | | .88 | | | | .70 | | | | 2.08 | |
| 12/31/2020 | | | 15.88 | | | | .18 | | | | 1.13 | | | | 1.31 | | | | (.19 | ) | | | (.38 | ) | | | (.57 | ) | | | 16.62 | | | | 8.78 | | | | 2 | | | | .90 | | | | .90 | | | | 1.23 | |
| 12/31/2019 | | | 13.00 | | | | .26 | | | | 3.68 | | | | 3.94 | | | | (.30 | ) | | | (.76 | ) | | | (1.06 | ) | | | 15.88 | | | | 31.04 | | | | 2 | | | | .90 | | | | .90 | | | | 1.77 | |
| 12/31/2018 | | | 15.81 | | | | .26 | | | | (1.63 | ) | | | (1.37 | ) | | | (.26 | ) | | | (1.18 | ) | | | (1.44 | ) | | | 13.00 | | | | (9.62 | ) | | | 1 | | | | .88 | | | | .88 | | | | 1.74 | |
| 12/31/20174,8 | | | 13.21 | | | | .18 | | | | 3.03 | | | | 3.21 | | | | (.35 | ) | | | (.26 | ) | | | (.61 | ) | | | 15.81 | | | | 24.54 | 6 | | | — | 10 | | | .84 | 7 | | | .84 | 7 | | | 1.20 | 7 |
| Class 2: | | | | | | | | | | | | | | | | | | | | | | | | | | | | | | | | | | | | | | | | | | | | | | | | | | | | |
| 6/30/20224,5 | | | 18.38 | | | | .19 | | | | (3.74 | ) | | | (3.55 | ) | | | (.09 | ) | | | (3.45 | ) | | | (3.54 | ) | | | 11.29 | | | | (21.30 | )6 | | | 992 | | | | .86 | 7 | | | .67 | 7 | | | 2.39 | 7 |
| 12/31/2021 | | | 16.63 | | | | .33 | | | | 2.11 | | | | 2.44 | | | | (.29 | ) | | | (.40 | ) | | | (.69 | ) | | | 18.38 | | | | 14.78 | | | | 1,340 | | | | .88 | | | | .73 | | | | 1.85 | |
| 12/31/2020 | | | 15.89 | | | | .18 | | | | 1.13 | | | | 1.31 | | | | (.19 | ) | | | (.38 | ) | | | (.57 | ) | | | 16.63 | | | | 8.73 | | | | 1,349 | | | | .91 | | | | .91 | | | | 1.23 | |
| 12/31/2019 | | | 12.99 | | | | .27 | | | | 3.68 | | | | 3.95 | | | | (.29 | ) | | | (.76 | ) | | | (1.05 | ) | | | 15.89 | | | | 31.14 | | | | 1,366 | | | | .90 | | | | .90 | | | | 1.84 | |
| 12/31/2018 | | | 15.78 | | | | .26 | | | | (1.63 | ) | | | (1.37 | ) | | | (.24 | ) | | | (1.18 | ) | | | (1.42 | ) | | | 12.99 | | | | (9.63 | ) | | | 1,228 | | | | .88 | | | | .88 | | | | 1.70 | |
| 12/31/2017 | | | 13.00 | | | | .31 | | | | 3.05 | | | | 3.36 | | | | (.32 | ) | | | (.26 | ) | | | (.58 | ) | | | 15.78 | | | | 26.06 | | | | 1,538 | | | | .88 | | | | .88 | | | | 2.11 | |
| Class 4: | | | | | | | | | | | | | | | | | | | | | | | | | | | | | | | | | | | | | | | | | | | | | | | | | | | | |
| 6/30/20224,5 | | | 18.04 | | | | .17 | | | | (3.67 | ) | | | (3.50 | ) | | | (.08 | ) | | | (3.45 | ) | | | (3.53 | ) | | | 11.01 | | | | (21.40 | )6 | | | 181 | | | | 1.11 | 7 | | | .92 | 7 | | | 2.17 | 7 |
| 12/31/2021 | | | 16.35 | | | | .29 | | | | 2.06 | | | | 2.35 | | | | (.26 | ) | | | (.40 | ) | | | (.66 | ) | | | 18.04 | | | | 14.46 | | | | 225 | | | | 1.13 | | | | .97 | | | | 1.65 | |
| 12/31/2020 | | | 15.63 | | | | .14 | | | | 1.12 | | | | 1.26 | | | | (.16 | ) | | | (.38 | ) | | | (.54 | ) | | | 16.35 | | | | 8.55 | | | | 166 | | | | 1.16 | | | | 1.16 | | | | .97 | |
| 12/31/2019 | | | 12.81 | | | | .23 | | | | 3.61 | | | | 3.84 | | | | (.26 | ) | | | (.76 | ) | | | (1.02 | ) | | | 15.63 | | | | 30.73 | | | | 145 | | | | 1.15 | | | | 1.15 | | | | 1.56 | |
| 12/31/2018 | | | 15.60 | | | | .21 | | | | (1.60 | ) | | | (1.39 | ) | | | (.22 | ) | | | (1.18 | ) | | | (1.40 | ) | | | 12.81 | | | | (9.89 | ) | | | 95 | | | | 1.13 | | | | 1.13 | | | | 1.43 | |
| 12/31/2017 | | | 12.89 | | | | .22 | | | | 3.08 | | | | 3.30 | | | | (.33 | ) | | | (.26 | ) | | | (.59 | ) | | | 15.60 | | | | 25.83 | | | | 79 | | | | 1.14 | | | | 1.14 | | | | 1.49 | |
Refer to the end of the tables for footnotes.
| 330 | American Funds Insurance Series |
Financial highlights (continued)
| | | | | | (Loss) income from
investment operations1 | | | Dividends and distributions | | | | | | | | | | | | | | | | |
| Year ended | | Net asset
value,
beginning
of year | | | Net
investment
income | | | Net (losses)
gains on
securities
(both
realized and
unrealized) | | | Total from
investment
operations | | | Dividends
(from net
investment
income) | | | Distributions
(from capital
gains) | | | Total
dividends
and
distributions | | | Net asset
value,
end
of year | | | Total return | | | Net assets,
end of year
(in millions) | | | Ratio of
expenses
to average
net assets3 | | | Ratio of
net income
to average
net assets | |
| | | | | | | | | | | | | | | | | | | | | | | | | | | | | | | | | | | | | |
| Growth-Income Fund |
| | | | | | | | | | | | | | | | | | | | | | | | | | | | | | | | | | | | | | | | | | | | | | | | | |
| Class 1: | | | | | | | | | | | | | | | | | | | | | | | | | | | | | | | | | | | | | | | | | | | | | | | | |
| 6/30/20224,5 | | $ | 67.35 | | | $ | .41 | | | $ | (13.13 | ) | | $ | (12.72 | ) | | $ | (.18 | ) | | $ | (5.66 | ) | | $ | (5.84 | ) | | $ | 48.79 | | | | (19.68 | )%6 | | $ | 19,412 | | | | .28 | %7 | | | 1.38 | %7 |
| 12/31/2021 | | | 55.38 | | | | .79 | | | | 12.64 | | | | 13.43 | | | | (.86 | ) | | | (.60 | ) | | | (1.46 | ) | | | 67.35 | | | | 24.42 | | | | 25,507 | | | | .29 | | | | 1.28 | |
| 12/31/2020 | | | 50.71 | | | | .75 | | | | 6.02 | | | | 6.77 | | | | (.80 | ) | | | (1.30 | ) | | | (2.10 | ) | | | 55.38 | | | | 13.81 | | | | 22,903 | | | | .29 | | | | 1.52 | |
| 12/31/2019 | | | 45.39 | | | | 1.00 | | | | 10.40 | | | | 11.40 | | | | (.92 | ) | | | (5.16 | ) | | | (6.08 | ) | | | 50.71 | | | | 26.46 | | | | 21,057 | | | | .29 | | | | 2.05 | |
| 12/31/2018 | | | 50.22 | | | | .84 | | | | (1.25 | ) | | | (.41 | ) | | | (.84 | ) | | | (3.58 | ) | | | (4.42 | ) | | | 45.39 | | | | (1.55 | ) | | | 16,783 | | | | .28 | | | | 1.65 | |
| 12/31/2017 | | | 44.41 | | | | .81 | | | | 8.89 | | | | 9.70 | | | | (.78 | ) | | | (3.11 | ) | | | (3.89 | ) | | | 50.22 | | | | 22.68 | | | | 15,765 | | | | .28 | | | | 1.69 | |
| Class 1A: | | | | | | | | | | | | | | | | | | | | | | | | | | | | | | | | | | | | | | | | | | | | | | | | |
| 6/30/20224,5 | | | 67.02 | | | | .34 | | | | (13.06 | ) | | | (12.72 | ) | | | (.16 | ) | | | (5.66 | ) | | | (5.82 | ) | | | 48.48 | | | | (19.78 | )6 | | | 27 | | | | .53 | 7 | | | 1.14 | 7 |
| 12/31/2021 | | | 55.16 | | | | .65 | | | | 12.55 | | | | 13.20 | | | | (.74 | ) | | | (.60 | ) | | | (1.34 | ) | | | 67.02 | | | | 24.08 | | | | 32 | | | | .53 | | | | 1.04 | |
| 12/31/2020 | | | 50.54 | | | | .63 | | | | 5.99 | | | | 6.62 | | | | (.70 | ) | | | (1.30 | ) | | | (2.00 | ) | | | 55.16 | | | | 13.55 | | | | 16 | | | | .54 | | | | 1.28 | |
| 12/31/2019 | | | 45.28 | | | | .89 | | | | 10.36 | | | | 11.25 | | | | (.83 | ) | | | (5.16 | ) | | | (5.99 | ) | | | 50.54 | | | | 26.14 | | | | 11 | | | | .54 | | | | 1.82 | |
| 12/31/2018 | | | 50.15 | | | | .72 | | | | (1.25 | ) | | | (.53 | ) | | | (.76 | ) | | | (3.58 | ) | | | (4.34 | ) | | | 45.28 | | | | (1.78 | ) | | | 7 | | | | .53 | | | | 1.43 | |
| 12/31/20174,8 | | | 45.39 | | | | .67 | | | | 7.96 | | | | 8.63 | | | | (.76 | ) | | | (3.11 | ) | | | (3.87 | ) | | | 50.15 | | | | 19.83 | 6 | | | 2 | | | | .52 | 7 | | | 1.41 | 7 |
| Class 2: | | | | | | | | | | | | | | | | | | | | | | | | | | | | | | | | | | | | | | | | | | | | | | | | |
| 6/30/20224,5 | | | 66.44 | | | | .33 | | | | (12.94 | ) | | | (12.61 | ) | | | (.15 | ) | | | (5.66 | ) | | | (5.81 | ) | | | 48.02 | | | | (19.79 | )6 | | | 11,636 | | | | .53 | 7 | | | 1.13 | 7 |
| 12/31/2021 | | | 54.66 | | | | .63 | | | | 12.45 | | | | 13.08 | | | | (.70 | ) | | | (.60 | ) | | | (1.30 | ) | | | 66.44 | | | | 24.10 | | | | 15,319 | | | | .54 | | | | 1.03 | |
| 12/31/2020 | | | 50.08 | | | | .62 | | | | 5.93 | | | | 6.55 | | | | (.67 | ) | | | (1.30 | ) | | | (1.97 | ) | | | 54.66 | | | | 13.54 | | | | 14,012 | | | | .54 | | | | 1.27 | |
| 12/31/2019 | | | 44.90 | | | | .87 | | | | 10.27 | | | | 11.14 | | | | (.80 | ) | | | (5.16 | ) | | | (5.96 | ) | | | 50.08 | | | | 26.14 | | | | 13,586 | | | | .53 | | | | 1.80 | |
| 12/31/2018 | | | 49.71 | | | | .71 | | | | (1.23 | ) | | | (.52 | ) | | | (.71 | ) | | | (3.58 | ) | | | (4.29 | ) | | | 44.90 | | | | (1.79 | ) | | | 12,035 | | | | .53 | | | | 1.40 | |
| 12/31/2017 | | | 44.00 | | | | .68 | | | | 8.80 | | | | 9.48 | | | | (.66 | ) | | | (3.11 | ) | | | (3.77 | ) | | | 49.71 | | | | 22.38 | | | | 13,930 | | | | .53 | | | | 1.45 | |
| Class 3: | | | | | | | | | | | | | | | | | | | | | | | | | | | | | | | | | | | | | | | | | | | | | | | | |
| 6/30/20224,5 | | | 67.48 | | | | .36 | | | | (13.15 | ) | | | (12.79 | ) | | | (.16 | ) | | | (5.66 | ) | | | (5.82 | ) | | | 48.87 | | | | (19.75 | )6 | | | 126 | | | | .46 | 7 | | | 1.20 | 7 |
| 12/31/2021 | | | 55.49 | | | | .68 | | | | 12.65 | | | | 13.33 | | | | (.74 | ) | | | (.60 | ) | | | (1.34 | ) | | | 67.48 | | | | 24.18 | | | | 166 | | | | .47 | | | | 1.10 | |
| 12/31/2020 | | | 50.81 | | | | .66 | | | | 6.02 | | | | 6.68 | | | | (.70 | ) | | | (1.30 | ) | | | (2.00 | ) | | | 55.49 | | | | 13.60 | | | | 154 | | | | .47 | | | | 1.34 | |
| 12/31/2019 | | | 45.47 | | | | .91 | | | | 10.43 | | | | 11.34 | | | | (.84 | ) | | | (5.16 | ) | | | (6.00 | ) | | | 50.81 | | | | 26.24 | | | | 156 | | | | .46 | | | | 1.87 | |
| 12/31/2018 | | | 50.29 | | | | .75 | | | | (1.25 | ) | | | (.50 | ) | | | (.74 | ) | | | (3.58 | ) | | | (4.32 | ) | | | 45.47 | | | | (1.72 | ) | | | 140 | | | | .46 | | | | 1.47 | |
| 12/31/2017 | | | 44.47 | | | | .72 | | | | 8.90 | | | | 9.62 | | | | (.69 | ) | | | (3.11 | ) | | | (3.80 | ) | | | 50.29 | | | | 22.47 | | | | 168 | | | | .46 | | | | 1.52 | |
| Class 4: | | | | | | | | | | | | | | | | | | | | | | | | | | | | | | | | | | | | | | | | | | | | | | | | |
| 6/30/20224,5 | | | 65.57 | | | | .26 | | | | (12.76 | ) | | | (12.50 | ) | | | (.13 | ) | | | (5.66 | ) | | | (5.79 | ) | | | 47.28 | | | | (19.88 | )6 | | | 1,568 | | | | .78 | 7 | | | .89 | 7 |
| 12/31/2021 | | | 53.99 | | | | .48 | | | | 12.28 | | | | 12.76 | | | | (.58 | ) | | | (.60 | ) | | | (1.18 | ) | | | 65.57 | | | | 23.80 | | | | 1,928 | | | | .79 | | | | .79 | |
| 12/31/2020 | | | 49.52 | | | | .49 | | | | 5.85 | | | | 6.34 | | | | (.57 | ) | | | (1.30 | ) | | | (1.87 | ) | | | 53.99 | | | | 13.25 | | | | 1,407 | | | | .79 | | | | 1.02 | |
| 12/31/2019 | | | 44.47 | | | | .74 | | | | 10.18 | | | | 10.92 | | | | (.71 | ) | | | (5.16 | ) | | | (5.87 | ) | | | 49.52 | | | | 25.86 | | | | 1,216 | | | | .79 | | | | 1.56 | |
| 12/31/2018 | | | 49.31 | | | | .58 | | | | (1.23 | ) | | | (.65 | ) | | | (.61 | ) | | | (3.58 | ) | | | (4.19 | ) | | | 44.47 | | | | (2.05 | ) | | | 899 | | | | .78 | | | | 1.15 | |
| 12/31/2017 | | | 43.73 | | | | .56 | | | | 8.73 | | | | 9.29 | | | | (.60 | ) | | | (3.11 | ) | | | (3.71 | ) | | | 49.31 | | | | 22.08 | | | | 827 | | | | .78 | | | | 1.19 | |
Refer to the end of the tables for footnotes.
| American Funds Insurance Series | 331 |
Financial highlights (continued)
| | | | | | (Loss) income from
investment operations1 | | | Dividends and distributions | | | | | | | | | | | | | | | | | | | |
| Year ended | | Net asset
value,
beginning
of year | | | Net
investment
income | | | Net (losses)
gains on
securities
(both
realized and
unrealized) | | | Total from
investment
operations | | | Dividends
(from net
investment
income) | | | Distributions
(from capital
gains) | | | Total
dividends
and
distributions | | | Net asset
value,
end
of year | | | Total return2 | | | Net assets,
end of year
(in millions) | | | Ratio of
expenses to
average net
assets before
waivers3 | | | Ratio of
expenses to
average net
assets after
waivers2,3 | | | Ratio of
net income
to average
net assets2 | |
| | | | | | | | | | | | | | | | | | | | | | | | | | | | | | | | | | | | | | | | |
| International Growth and Income Fund |
| | | | | | | | | | | | | | | | | | | | | | | | | | | | | | | | | | | | | | | | | | | | | | | | | | | | | |
| Class 1: | | | | | | | | | | | | | | | | | | | | | | | | | | | | | | | | | | | | | | | | | | | | | | | | | | | | |
| 6/30/20224,5 | | $ | 19.62 | | | $ | .31 | | | $ | (3.44 | ) | | $ | (3.13 | ) | | $ | (.02 | ) | | $ | (7.70 | ) | | $ | (7.72 | ) | | $ | 8.77 | | | | (19.00 | )%6 | | $ | 13 | | | | .68 | %7 | | | .51 | %7 | | | 3.85 | %7 |
| 12/31/2021 | | | 19.01 | | | | .54 | | | | .53 | | | | 1.07 | | | | (.46 | ) | | | — | | | | (.46 | ) | | | 19.62 | | | | 5.64 | | | | 30 | | | | .67 | | | | .67 | | | | 2.70 | |
| 12/31/2020 | | | 18.18 | | | | .27 | | | | .85 | | | | 1.12 | | | | (.29 | ) | | | — | | | | (.29 | ) | | | 19.01 | | | | 6.24 | | | | 1,120 | | | | .68 | | | | .68 | | | | 1.70 | |
| 12/31/2019 | | | 15.35 | | | | .46 | | | | 3.03 | | | | 3.49 | | | | (.47 | ) | | | (.19 | ) | | | (.66 | ) | | | 18.18 | | | | 23.06 | | | | 1,140 | | | | .66 | | | | .66 | | | | 2.73 | |
| 12/31/2018 | | | 17.72 | | | | .45 | | | | (2.39 | ) | | | (1.94 | ) | | | (.43 | ) | | | — | | | | (.43 | ) | | | 15.35 | | | | (11.00 | ) | | | 1,034 | | | | .65 | | | | .65 | | | | 2.62 | |
| 12/31/2017 | | | 14.48 | | | | .46 | | | | 3.20 | | | | 3.66 | | | | (.42 | ) | | | — | | | | (.42 | ) | | | 17.72 | | | | 25.31 | | | | 1,121 | | | | .66 | | | | .66 | | | | 2.75 | |
| Class 1A: | | | | | | | | | | | | | | | | | | | | | | | | | | | | | | | | | | | | | | | | | | | | | | | | | | | | |
| 6/30/20224,5 | | | 19.39 | | | | .31 | | | | (3.42 | ) | | | (3.11 | ) | | | (.04 | ) | | | (7.70 | ) | | | (7.74 | ) | | | 8.54 | | | | (19.14 | )6 | | | 4 | | | | .92 | 7 | | | .75 | 7 | | | 3.96 | 7 |
| 12/31/2021 | | | 18.97 | | | | .50 | | | | .52 | | | | 1.02 | | | | (.60 | ) | | | — | | | | (.60 | ) | | | 19.39 | | | | 5.39 | | | | 6 | | | | .94 | | | | .92 | | | | 2.50 | |
| 12/31/2020 | | | 18.15 | | | | .22 | | | | .85 | | | | 1.07 | | | | (.25 | ) | | | — | | | | (.25 | ) | | | 18.97 | | | | 5.98 | | | | 3 | | | | .93 | | | | .93 | | | | 1.38 | |
| 12/31/2019 | | | 15.33 | | | | .41 | | | | 3.04 | | | | 3.45 | | | | (.44 | ) | | | (.19 | ) | | | (.63 | ) | | | 18.15 | | | | 22.76 | | | | 2 | | | | .91 | | | | .91 | | | | 2.41 | |
| 12/31/2018 | | | 17.70 | | | | .41 | | | | (2.39 | ) | | | (1.98 | ) | | | (.39 | ) | | | — | | | | (.39 | ) | | | 15.33 | | | | (11.24 | ) | | | 2 | | | | .90 | | | | .90 | | | | 2.35 | |
| 12/31/20174,8 | | | 14.69 | | | | .34 | | | | 3.08 | | | | 3.42 | | | | (.41 | ) | | | — | | | | (.41 | ) | | | 17.70 | | | | 23.36 | 6 | | | 2 | | | | .91 | 7 | | | .91 | 7 | | | 1.99 | 7 |
| Class 2: | | | | | | | | | | | | | | | | | | | | | | | | | | | | | | | | | | | | | | | | | | | | | | | | | | | | |
| 6/30/20224,5 | | | 19.38 | | | | .32 | | | | (3.43 | ) | | | (3.11 | ) | | | (.04 | ) | | | (7.70 | ) | | | (7.74 | ) | | | 8.53 | | | | (19.16 | )6 | | | 164 | | | | .92 | 7 | | | .75 | 7 | | | 4.03 | 7 |
| 12/31/2021 | | | 18.95 | | | | .48 | | | | .53 | | | | 1.01 | | | | (.58 | ) | | | — | | | | (.58 | ) | | | 19.38 | | | | 5.37 | | | | 211 | | | | .93 | | | | .92 | | | | 2.44 | |
| 12/31/2020 | | | 18.12 | | | | .23 | | | | .85 | | | | 1.08 | | | | (.25 | ) | | | — | | | | (.25 | ) | | | 18.95 | | | | 6.01 | | | | 221 | | | | .93 | | | | .93 | | | | 1.43 | |
| 12/31/2019 | | | 15.30 | | | | .42 | | | | 3.02 | | | | 3.44 | | | | (.43 | ) | | | (.19 | ) | | | (.62 | ) | | | 18.12 | | | | 22.76 | | | | 257 | | | | .91 | | | | .91 | | | | 2.49 | |
| 12/31/2018 | | | 17.66 | | | | .41 | | | | (2.38 | ) | | | (1.97 | ) | | | (.39 | ) | | | — | | | | (.39 | ) | | | 15.30 | | | | (11.23 | ) | | | 230 | | | | .90 | | | | .90 | | | | 2.38 | |
| 12/31/2017 | | | 14.43 | | | | .43 | | | | 3.17 | | | | 3.60 | | | | (.37 | ) | | | — | | | | (.37 | ) | | | 17.66 | | | | 25.03 | | | | 276 | | | | .91 | | | | .91 | | | | 2.60 | |
| Class 4: | | | | | | | | | | | | | | | | | | | | | | | | | | | | | | | | | | | | | | | | | | | | | | | | | | | | |
| 6/30/20224,5 | | | 19.23 | | | | .30 | | | | (3.39 | ) | | | (3.09 | ) | | | (.04 | ) | | | (7.70 | ) | | | (7.74 | ) | | | 8.40 | | | | (19.24 | )6 | | | 112 | | | | 1.17 | 7 | | | 1.00 | 7 | | | 3.88 | 7 |
| 12/31/2021 | | | 18.82 | | | | .44 | | | | .51 | | | | .95 | | | | (.54 | ) | | | — | | | | (.54 | ) | | | 19.23 | | | | 5.09 | | | | 132 | | | | 1.18 | | | | 1.17 | | | | 2.21 | |
| 12/31/2020 | | | 18.01 | | | | .19 | | | | .83 | | | | 1.02 | | | | (.21 | ) | | | — | | | | (.21 | ) | | | 18.82 | | | | 5.73 | | | | 112 | | | | 1.18 | | | | 1.18 | | | | 1.19 | |
| 12/31/2019 | | | 15.22 | | | | .37 | | | | 3.01 | | | | 3.38 | | | | (.40 | ) | | | (.19 | ) | | | (.59 | ) | | | 18.01 | | | | 22.47 | | | | 101 | | | | 1.16 | | | | 1.16 | | | | 2.18 | |
| 12/31/2018 | | | 17.58 | | | | .36 | | | | (2.36 | ) | | | (2.00 | ) | | | (.36 | ) | | | — | | | | (.36 | ) | | | 15.22 | | | | (11.46 | ) | | | 71 | | | | 1.15 | | | | 1.15 | | | | 2.10 | |
| 12/31/2017 | | | 14.38 | | | | .37 | | | | 3.18 | | | | 3.55 | | | | (.35 | ) | | | — | | | | (.35 | ) | | | 17.58 | | | | 24.72 | | | | 63 | | | | 1.16 | | | | 1.16 | | | | 2.24 | |
Refer to the end of the tables for footnotes.
| 332 | American Funds Insurance Series |
Financial highlights (continued)
| | | | | | (Loss) income from
investment operations1 | | | Dividends and distributions | | | | | | | | | | | | | | | | | | | |
| Year ended | | Net asset
value,
beginning
of year | | | Net
investment
income | | | Net (losses)
gains on
securities
(both
realized and
unrealized) | | | Total from
investment
operations | | | Dividends
(from net
investment
income) | | | Distributions
(from capital
gains) | | | Total
dividends
and
distributions | | | Net asset
value,
end
of year | | | Total return2 | | | Net assets,
end of year
(in millions) | | | Ratio of
expenses to
average net
assets before
waivers3 | | | Ratio of
expenses to
average net
assets after
waivers2,3 | | | Ratio of
net income
to average
net assets2 | |
| | | | | | | | | | | | | | | | | | | | | | | | | | | | | | | | | | | | | | | | |
| Capital Income Builder |
| | | | | | | | | | | | | | | | | | | | | | | | | | | | | | | | | | | | | | | | | | | | | | | | | | | | | |
| Class 1: | | | | | | | | | | | | | | | | | | | | | | | | | | | | | | | | | | | | | | | | | | | | | | | | | | | | |
| 6/30/20224,5 | | $ | 12.17 | | | $ | .20 | | | $ | (1.37 | ) | | $ | (1.17 | ) | | $ | (.13 | ) | | $ | — | | | $ | (.13 | ) | | $ | 10.87 | | | | (9.64 | )%6 | | $ | 553 | | | | .47 | %7 | | | .26 | %7 | | | 3.43 | %7 |
| 12/31/2021 | | | 10.87 | | | | .37 | | | | 1.28 | | | | 1.65 | | | | (.35 | ) | | | — | | | | (.35 | ) | | | 12.17 | | | | 15.31 | | | | 563 | | | | .53 | | | | .27 | | | | 3.19 | |
| 12/31/2020 | | | 10.73 | | | | .31 | | | | .15 | | | | .46 | | | | (.32 | ) | | | — | | | | (.32 | ) | | | 10.87 | | | | 4.64 | | | | 621 | | | | .53 | | | | .35 | | | | 3.07 | |
| 12/31/2019 | | | 9.37 | | | | .32 | | | | 1.36 | | | | 1.68 | | | | (.32 | ) | | | — | | | | (.32 | ) | | | 10.73 | | | | 18.16 | | | | 533 | | | | .53 | | | | .53 | | | | 3.17 | |
| 12/31/2018 | | | 10.40 | | | | .31 | | | | (1.00 | ) | | | (.69 | ) | | | (.32 | ) | | | (.02 | ) | | | (.34 | ) | | | 9.37 | | | | (6.77 | ) | | | 317 | | | | .54 | | | | .54 | | | | 3.08 | |
| 12/31/2017 | | | 9.46 | | | | .32 | | | | .93 | | | | 1.25 | | | | (.31 | ) | | | — | | | | (.31 | ) | | | 10.40 | | | | 13.29 | | | | 254 | | | | .54 | | | | .54 | | | | 3.21 | |
| Class 1A: | | | | | | | | | | | | | | | | | | | | | | | | | | | | | | | | | | | | | | | | | | | | | | | | | | | | |
| 6/30/20224,5 | | | 12.15 | | | | .18 | | | | (1.35 | ) | | | (1.17 | ) | | | (.12 | ) | | | — | | | | (.12 | ) | | | 10.86 | | | | (9.68 | )6 | | | 10 | | | | .72 | 7 | | | .51 | 7 | | | 3.17 | 7 |
| 12/31/2021 | | | 10.86 | | | | .34 | | | | 1.27 | | | | 1.61 | | | | (.32 | ) | | | — | | | | (.32 | ) | | | 12.15 | | | | 14.95 | | | | 10 | | | | .78 | | | | .52 | | | | 2.94 | |
| 12/31/2020 | | | 10.72 | | | | .28 | | | | .16 | | | | .44 | | | | (.30 | ) | | | — | | | | (.30 | ) | | | 10.86 | | | | 4.38 | | | | 6 | | | | .78 | | | | .60 | | | | 2.81 | |
| 12/31/2019 | | | 9.36 | | | | .29 | | | | 1.37 | | | | 1.66 | | | | (.30 | ) | | | — | | | | (.30 | ) | | | 10.72 | | | | 17.90 | | | | 6 | | | | .78 | | | | .78 | | | | 2.84 | |
| 12/31/2018 | | | 10.39 | | | | .28 | | | | (.99 | ) | | | (.71 | ) | | | (.30 | ) | | | (.02 | ) | | | (.32 | ) | | | 9.36 | | | | (7.01 | ) | | | 2 | | | | .79 | | | | .79 | | | | 2.82 | |
| 12/31/20174,8 | | | 9.57 | | | | .27 | | | | .84 | | | | 1.11 | | | | (.29 | ) | | | — | | | | (.29 | ) | | | 10.39 | | | | 11.72 | 6 | | | 1 | | | | .79 | 7 | | | .79 | 7 | | | 2.63 | 7 |
| Class 2: | | | | | | | | | | | | | | | | | | | | | | | | | | | | | | | | | | | | | | | | | | | | | | | | | | | | |
| 6/30/20224,5 | | | 12.16 | | | | .18 | | | | (1.35 | ) | | | (1.17 | ) | | | (.12 | ) | | | — | | | | (.12 | ) | | | 10.87 | | | | (9.67 | )6 | | | 12 | | | | .72 | 7 | | | .51 | 7 | | | 3.17 | 7 |
| 12/31/2021 | | | 10.87 | | | | .34 | | | | 1.27 | | | | 1.61 | | | | (.32 | ) | | | — | | | | (.32 | ) | | | 12.16 | | | | 14.94 | | | | 13 | | | | .78 | | | | .52 | | | | 2.93 | |
| 12/31/2020 | | | 10.72 | | | | .29 | | | | .16 | | | | .45 | | | | (.30 | ) | | | — | | | | (.30 | ) | | | 10.87 | | | | 4.48 | | | | 8 | | | | .78 | | | | .60 | | | | 2.83 | |
| 12/31/2019 | | | 9.36 | | | | .30 | | | | 1.35 | | | | 1.65 | | | | (.29 | ) | | | — | | | | (.29 | ) | | | 10.72 | | | | 17.89 | | | | 6 | | | | .78 | | | | .78 | | | | 2.91 | |
| 12/31/2018 | | | 10.40 | | | | .28 | | | | (1.00 | ) | | | (.72 | ) | | | (.30 | ) | | | (.02 | ) | | | (.32 | ) | | | 9.36 | | | | (7.08 | ) | | | 4 | | | | .79 | | | | .79 | | | | 2.83 | |
| 12/31/2017 | | | 9.46 | | | | .29 | | | | .93 | | | | 1.22 | | | | (.28 | ) | | | — | | | | (.28 | ) | | | 10.40 | | | | 13.04 | | | | 1 | | | | .79 | | | | .79 | | | | 2.82 | |
| Class 4: | | | | | | | | | | | | | | | | | | | | | | | | | | | | | | | | | | | | | | | | | | | | | | | | | | | | |
| 6/30/20224,5 | | | 12.14 | | | | .17 | | | | (1.35 | ) | | | (1.18 | ) | | | (.11 | ) | | | — | | | | (.11 | ) | | | 10.85 | | | | (9.81 | )6 | | | 523 | | | | .98 | 7 | | | .76 | 7 | | | 2.91 | 7 |
| 12/31/2021 | | | 10.85 | | | | .31 | | | | 1.27 | | | | 1.58 | | | | (.29 | ) | | | — | | | | (.29 | ) | | | 12.14 | | | | 14.68 | | | | 559 | | | | 1.03 | | | | .77 | | | | 2.69 | |
| 12/31/2020 | | | 10.71 | | | | .26 | | | | .15 | | | | .41 | | | | (.27 | ) | | | — | | | | (.27 | ) | | | 10.85 | | | | 4.11 | | | | 462 | | | | 1.03 | | | | .85 | | | | 2.55 | |
| 12/31/2019 | | | 9.35 | | | | .27 | | | | 1.36 | | | | 1.63 | | | | (.27 | ) | | | — | | | | (.27 | ) | | | 10.71 | | | | 17.62 | | | | 454 | | | | 1.03 | | | | 1.03 | | | | 2.68 | |
| 12/31/2018 | | | 10.38 | | | | .26 | | | | (1.00 | ) | | | (.74 | ) | | | (.27 | ) | | | (.02 | ) | | | (.29 | ) | | | 9.35 | | | | (7.25 | ) | | | 352 | | | | 1.04 | | | | 1.04 | | | | 2.58 | |
| 12/31/2017 | | | 9.45 | | | | .27 | | | | .92 | | | | 1.19 | | | | (.26 | ) | | | — | | | | (.26 | ) | | | 10.38 | | | | 12.65 | | | | 338 | | | | 1.04 | | | | 1.04 | | | | 2.72 | |
Refer to the end of the tables for footnotes.
| American Funds Insurance Series | 333 |
Financial highlights (continued)
| | | | | | (Loss) income from
investment operations1 | | | Dividends and distributions | | | | | | | | | | | | | | | | |
| Year ended | | Net asset
value,
beginning
of year | | | Net
investment
income | | | Net (losses)
gains on
securities
(both
realized and
unrealized) | | | Total from
investment
operations | | | Dividends
(from net
investment
income) | | | Distributions
(from capital
gains) | | | Total
dividends
and
distributions | | | Net asset
value,
end
of year | | | Total return | | | Net assets,
end of year
(in millions) | | | Ratio of
expenses
to average
net assets3 | | | Ratio of
net income
to average
net assets | |
| | | | | | | | | | | | | | | | | | | | | | | | | | | | | | | | | | | | | | | | | | | | |
| Asset Allocation Fund | | | | | | | | | | | | | | | | | | | | | | | | | | | | | | | | | | | | | | | | | | | |
| | | | | | | | | | | | | | | | | | | | | | | | | | | | | | | | | | | | | | | | | | | | |
| Class 1: | | | | | | | | | | | | | | | | | | | | | | | | | | | | | | | | | | | | | | | | | | | | | | | | |
| 6/30/20224,5 | | $ | 29.08 | | | $ | .26 | | | $ | (4.66 | ) | | $ | (4.40 | ) | | $ | (.11 | ) | | $ | (2.65 | ) | | $ | (2.76 | ) | | $ | 21.92 | | | | (15.78 | )%6 | | $ | 15,266 | | | | .30 | %7 | | | 1.97 | %7 |
| 12/31/2021 | | | 26.50 | | | | .48 | | | | 3.54 | | | | 4.02 | | | | (.50 | ) | | | (.94 | ) | | | (1.44 | ) | | | 29.08 | | | | 15.40 | | | | 18,836 | | | | .30 | | | | 1.71 | |
| 12/31/2020 | | | 24.05 | | | | .43 | | | | 2.59 | | | | 3.02 | | | | (.46 | ) | | | (.11 | ) | | | (.57 | ) | | | 26.50 | | | | 12.71 | | | | 19,238 | | | | .30 | | | | 1.80 | |
| 12/31/2019 | | | 21.29 | | | | .51 | | | | 3.94 | | | | 4.45 | | | | (.50 | ) | | | (1.19 | ) | | | (1.69 | ) | | | 24.05 | | | | 21.54 | | | | 17,730 | | | | .29 | | | | 2.21 | |
| 12/31/2018 | | | 23.71 | | | | .48 | | | | (1.43 | ) | | | (.95 | ) | | | (.44 | ) | | | (1.03 | ) | | | (1.47 | ) | | | 21.29 | | | | (4.35 | ) | | | 14,627 | | | | .28 | | | | 2.04 | |
| 12/31/2017 | | | 21.68 | | | | .44 | | | | 3.06 | | | | 3.50 | | | | (.41 | ) | | | (1.06 | ) | | | (1.47 | ) | | | 23.71 | | | | 16.51 | | | | 16,556 | | | | .29 | | | | 1.90 | |
| Class 1A: | | | | | | | | | | | | | | | | | | | | | | | | | | | | | | | | | | | | | | | | | | | | | | | | |
| 6/30/20224,5 | | | 28.97 | | | | .23 | | | | (4.64 | ) | | | (4.41 | ) | | | (.10 | ) | | | (2.65 | ) | | | (2.75 | ) | | | 21.81 | | | | (15.88 | )6 | | | 21 | | | | .55 | 7 | | | 1.74 | 7 |
| 12/31/2021 | | | 26.42 | | | | .42 | | | | 3.52 | | | | 3.94 | | | | (.45 | ) | | | (.94 | ) | | | (1.39 | ) | | | 28.97 | | | | 15.13 | | | | 24 | | | | .55 | | | | 1.49 | |
| 12/31/2020 | | | 23.99 | | | | .37 | | | | 2.58 | | | | 2.95 | | | | (.41 | ) | | | (.11 | ) | | | (.52 | ) | | | 26.42 | | | | 12.43 | | | | 14 | | | | .55 | | | | 1.56 | |
| 12/31/2019 | | | 21.26 | | | | .45 | | | | 3.92 | | | | 4.37 | | | | (.45 | ) | | | (1.19 | ) | | | (1.64 | ) | | | 23.99 | | | | 21.19 | | | | 11 | | | | .54 | | | | 1.95 | |
| 12/31/2018 | | | 23.69 | | | | .42 | | | | (1.42 | ) | | | (1.00 | ) | | | (.40 | ) | | | (1.03 | ) | | | (1.43 | ) | | | 21.26 | | | | (4.58 | ) | | | 7 | | | | .53 | | | | 1.82 | |
| 12/31/20174,8 | | | 21.97 | | | | .39 | | | | 2.78 | | | | 3.17 | | | | (.39 | ) | | | (1.06 | ) | | | (1.45 | ) | | | 23.69 | | | | 14.78 | 6 | | | 4 | | | | .53 | 7 | | | 1.69 | 7 |
| Class 2: | | | | | | | | | | | | | | | | | | | | | | | | | | | | | | | | | | | | | | | | | | | | | | | | |
| 6/30/20224,5 | | | 28.74 | | | | .22 | | | | (4.60 | ) | | | (4.38 | ) | | | (.10 | ) | | | (2.65 | ) | | | (2.75 | ) | | | 21.61 | | | | (15.91 | )6 | | | 4,342 | | | | .55 | 7 | | | 1.72 | 7 |
| 12/31/2021 | | | 26.21 | | | | .41 | | | | 3.49 | | | | 3.90 | | | | (.43 | ) | | | (.94 | ) | | | (1.37 | ) | | | 28.74 | | | | 15.10 | | | | 5,473 | | | | .55 | | | | 1.46 | |
| 12/31/2020 | | | 23.79 | | | | .37 | | | | 2.56 | | | | 2.93 | | | | (.40 | ) | | | (.11 | ) | | | (.51 | ) | | | 26.21 | | | | 12.46 | | | | 5,242 | | | | .55 | | | | 1.55 | |
| 12/31/2019 | | | 21.08 | | | | .45 | | | | 3.89 | | | | 4.34 | | | | (.44 | ) | | | (1.19 | ) | | | (1.63 | ) | | | 23.79 | | | | 21.23 | | | | 5,154 | | | | .54 | | | | 1.96 | |
| 12/31/2018 | | | 23.49 | | | | .41 | | | | (1.41 | ) | | | (1.00 | ) | | | (.38 | ) | | | (1.03 | ) | | | (1.41 | ) | | | 21.08 | | | | (4.60 | ) | | | 4,668 | | | | .53 | | | | 1.78 | |
| 12/31/2017 | | | 21.49 | | | | .37 | | | | 3.04 | | | | 3.41 | | | | (.35 | ) | | | (1.06 | ) | | | (1.41 | ) | | | 23.49 | | | | 16.23 | | | | 5,480 | | | | .54 | | | | 1.64 | |
|
| Class 3: | | | | | | | | | | | | | | | | | | | | | | | | | | | | | | | | | | | | | | | | | | | | | | | | |
| 6/30/20224,5 | | | 29.12 | | | | .24 | | | | (4.67 | ) | | | (4.43 | ) | | | (.10 | ) | | | (2.65 | ) | | | (2.75 | ) | | | 21.94 | | | | (15.89 | )6 | | | 29 | | | | .48 | 7 | | | 1.79 | 7 |
| 12/31/2021 | | | 26.53 | | | | .43 | | | | 3.55 | | | | 3.98 | | | | (.45 | ) | | | (.94 | ) | | | (1.39 | ) | | | 29.12 | | | | 15.22 | | | | 36 | | | | .48 | | | | 1.53 | |
| 12/31/2020 | | | 24.08 | | | | .39 | | | | 2.59 | | | | 2.98 | | | | (.42 | ) | | | (.11 | ) | | | (.53 | ) | | | 26.53 | | | | 12.50 | | | | 33 | | | | .48 | | | | 1.62 | |
| 12/31/2019 | | | 21.32 | | | | .47 | | | | 3.93 | | | | 4.40 | | | | (.45 | ) | | | (1.19 | ) | | | (1.64 | ) | | | 24.08 | | | | 21.30 | | | | 32 | | | | .47 | | | | 2.02 | |
| 12/31/2018 | | | 23.73 | | | | .43 | | | | (1.41 | ) | | | (.98 | ) | | | (.40 | ) | | | (1.03 | ) | | | (1.43 | ) | | | 21.32 | | | | (4.49 | ) | | | 29 | | | | .46 | | | | 1.85 | |
| 12/31/2017 | | | 21.70 | | | | .39 | | | | 3.07 | | | | 3.46 | | | | (.37 | ) | | | (1.06 | ) | | | (1.43 | ) | | | 23.73 | | | | 16.29 | | | | 38 | | | | .47 | | | | 1.72 | |
| Class 4: | | | | | | | | | | | | | | | | | | | | | | | | | | | | | | | | | | | | | | | | | | | | | | | | |
| 6/30/20224,5 | | | 28.56 | | | | .19 | | | | (4.57 | ) | | | (4.38 | ) | | | (.09 | ) | | | (2.65 | ) | | | (2.74 | ) | | | 21.44 | | | | (16.01 | )6 | | | 5,307 | | | | .80 | 7 | | | 1.48 | 7 |
| 12/31/2021 | | | 26.06 | | | | .34 | | | | 3.47 | | | | 3.81 | | | | (.37 | ) | | | (.94 | ) | | | (1.31 | ) | | | 28.56 | | | | 14.84 | | | | 6,337 | | | | .80 | | | | 1.22 | |
| 12/31/2020 | | | 23.67 | | | | .31 | | | | 2.54 | | | | 2.85 | | | | (.35 | ) | | | (.11 | ) | | | (.46 | ) | | | 26.06 | | | | 12.16 | | | | 5,131 | | | | .80 | | | | 1.30 | |
| 12/31/2019 | | | 20.99 | | | | .39 | | | | 3.87 | | | | 4.26 | | | | (.39 | ) | | | (1.19 | ) | | | (1.58 | ) | | | 23.67 | | | | 20.92 | | | | 4,493 | | | | .79 | | | | 1.71 | |
| 12/31/2018 | | | 23.40 | | | | .35 | | | | (1.40 | ) | | | (1.05 | ) | | | (.33 | ) | | | (1.03 | ) | | | (1.36 | ) | | | 20.99 | | | | (4.83 | ) | | | 3,594 | | | | .78 | | | | 1.54 | |
| 12/31/2017 | | | 21.43 | | | | .32 | | | | 3.02 | | | | 3.34 | | | | (.31 | ) | | | (1.06 | ) | | | (1.37 | ) | | | 23.40 | | | | 15.91 | | | | 3,582 | | | | .79 | | | | 1.40 | |
Refer to the end of the tables for footnotes.
| 334 | American Funds Insurance Series |
Financial highlights (continued)
| | | | (Loss) income from
investment operations1 | | | Dividends and distributions | | | | | | | | | | | | | | | | | | |
| Year ended | | Net asset
value,
beginning
of year | | | Net
investment
income | | | Net (losses)
gains on
securities
(both
realized and
unrealized) | | | Total from
investment
operations | | | Dividends
(from net
investment
income) | | | Distributions
(from capital
gains) | | | Total
dividends
and
distributions | | | Net asset
value,
end
of year | | | Total return2 | | | Net assets,
end of year
(in millions) | | | Ratio of
expenses to
average net
assets before
waivers3 | | | Ratio of
expenses to
average net
assets after
waivers2,3 | | | Ratio of
net income
to average
net assets2 | |
| | | | | | | | | | | | | | | | | | | | | | | | | | | | | | | | | | | | | | | | | | | | | | | | | | | | | |
| American Funds Global Balanced Fund | | | | | | | | | | | | | | | | | | | | | | | | | | | | | | | | | | | | | | | | | |
| | | | | | | | | | | | | | | | | | | | | | | | | | | | | | | | | | | | | | | | | | | | | | | | | | | | | |
| Class 1: | | | | | | | | | | | | | | | | | | | | | | | | | | | | | | | | | | | | | | | | | | | | | | | | | | | | |
| 6/30/20224,5 | | $ | 14.73 | | | $ | .13 | | | $ | (2.53 | ) | | $ | (2.40 | ) | | $ | — | | | $ | (.07 | ) | | $ | (.07 | ) | | $ | 12.26 | | | | (16.31 | )%6 | | $ | 99 | | | | .64 | %7 | | | .63 | %7 | | | 1.92 | %7 |
| 12/31/2021 | | | 14.19 | | | | .18 | | | | 1.37 | | | | 1.55 | | | | (.19 | ) | | | (.82 | ) | | | (1.01 | ) | | | 14.73 | | | | 11.05 | | | | 120 | | | | .73 | | | | .73 | | | | 1.24 | |
| 12/31/2020 | | | 13.51 | | | | .17 | | | | 1.24 | | | | 1.41 | | | | (.19 | ) | | | (.54 | ) | | | (.73 | ) | | | 14.19 | | | | 10.53 | | | | 139 | | | | .72 | | | | .72 | | | | 1.29 | |
| 12/31/2019 | | | 11.67 | | | | .24 | | | | 2.17 | | | | 2.41 | | | | (.20 | ) | | | (.37 | ) | | | (.57 | ) | | | 13.51 | | | | 20.79 | | | | 134 | | | | .72 | | | | .72 | | | | 1.88 | |
| 12/31/2018 | | | 12.75 | | | | .23 | | | | (.96 | ) | | | (.73 | ) | | | (.20 | ) | | | (.15 | ) | | | (.35 | ) | | | 11.67 | | | | (5.81 | ) | | | 110 | | | | .72 | | | | .72 | | | | 1.82 | |
| 12/31/2017 | | | 11.08 | | | | .21 | | | | 1.99 | | | | 2.20 | | | | (.15 | ) | | | (.38 | ) | | | (.53 | ) | | | 12.75 | | | | 19.91 | | | | 93 | | | | .72 | | | | .72 | | | | 1.68 | |
| Class 1A: | | | | | | | | | | | | | | | | | | | | | | | | | | | | | | | | | | | | | | | | | | | | | | | | | | | | |
| 6/30/20224,5 | | | 14.70 | | | | .11 | | | | (2.53 | ) | | | (2.42 | ) | | | — | | | | (.07 | ) | | | (.07 | ) | | | 12.21 | | | | (16.48 | )6 | | | 2 | | | | .89 | 7 | | | .89 | 7 | | | 1.63 | 7 |
| 12/31/2021 | | | 14.16 | | | | .15 | | | | 1.36 | | | | 1.51 | | | | (.15 | ) | | | (.82 | ) | | | (.97 | ) | | | 14.70 | | | | 10.83 | | | | 4 | | | | .98 | | | | .98 | | | | 1.02 | |
| 12/31/2020 | | | 13.49 | | | | .14 | | | | 1.23 | | | | 1.37 | | | | (.16 | ) | | | (.54 | ) | | | (.70 | ) | | | 14.16 | | | | 10.25 | | | | 3 | | | | .97 | | | | .97 | | | | 1.03 | |
| 12/31/2019 | | | 11.65 | | | | .21 | | | | 2.17 | | | | 2.38 | | | | (.17 | ) | | | (.37 | ) | | | (.54 | ) | | | 13.49 | | | | 20.54 | | | | 2 | | | | .97 | | | | .97 | | | | 1.63 | |
| 12/31/2018 | | | 12.74 | | | | .18 | | | | (.94 | ) | | | (.76 | ) | | | (.18 | ) | | | (.15 | ) | | | (.33 | ) | | | 11.65 | | | | (6.03 | ) | | | 2 | | | | .98 | | | | .98 | | | | 1.44 | |
| 12/31/20174,8 | | | 11.18 | | | | .16 | | | | 1.92 | | | | 2.08 | | | | (.14 | ) | | | (.38 | ) | | | (.52 | ) | | | 12.74 | | | | 18.71 | 6 | | | — | 10 | | | .94 | 7 | | | .94 | 7 | | | 1.27 | 7 |
| Class 2: | | | | | | | | | | | | | | | | | | | | | | | | | | | | | | | | | | | | | | | | | | | | | | | | | | | | |
| 6/30/20224,5 | | | 14.70 | | | | .11 | | | | (2.52 | ) | | | (2.41 | ) | | | — | | | | (.07 | ) | | | (.07 | ) | | | 12.22 | | | | (16.41 | )6 | | | 162 | | | | .89 | 7 | | | .89 | 7 | | | 1.66 | 7 |
| 12/31/2021 | | | 14.16 | | | | .15 | | | | 1.36 | | | | 1.51 | | | | (.15 | ) | | | (.82 | ) | | | (.97 | ) | | | 14.70 | | | | 10.79 | | | | 208 | | | | .98 | | | | .98 | | | | 1.01 | |
| 12/31/2020 | | | 13.48 | | | | .14 | | | | 1.23 | | | | 1.37 | | | | (.15 | ) | | | (.54 | ) | | | (.69 | ) | | | 14.16 | | | | 10.30 | | | | 208 | | | | .97 | | | | .97 | | | | 1.03 | |
| 12/31/2019 | | | 11.65 | | | | .21 | | | | 2.16 | | | | 2.37 | | | | (.17 | ) | | | (.37 | ) | | | (.54 | ) | | | 13.48 | | | | 20.44 | | | | 207 | | | | .97 | | | | .97 | | | | 1.64 | |
| 12/31/2018 | | | 12.72 | | | | .20 | | | | (.96 | ) | | | (.76 | ) | | | (.16 | ) | | | (.15 | ) | | | (.31 | ) | | | 11.65 | | | | (6.01 | ) | | | 185 | | | | .97 | | | | .97 | | | | 1.57 | |
| 12/31/2017 | | | 11.06 | | | | .18 | | | | 1.98 | | | | 2.16 | | | | (.12 | ) | | | (.38 | ) | | | (.50 | ) | | | 12.72 | | | | 19.57 | | | | 210 | | | | .96 | | | | .96 | | | | 1.43 | |
| Class 4: | | | | | | | | | | | | | | | | | | | | | | | | | | | | | | | | | | | | | | | | | | | | | | | | | | | | |
| 6/30/20224,5 | | | 14.53 | | | | .09 | | | | (2.49 | ) | | | (2.40 | ) | | | — | | | | (.07 | ) | | | (.07 | ) | | | 12.06 | | | | (16.53 | )6 | | | 112 | | | | 1.14 | 7 | | | 1.13 | 7 | | | 1.42 | 7 |
| 12/31/2021 | | | 14.02 | | | | .11 | | | | 1.34 | | | | 1.45 | | | | (.12 | ) | | | (.82 | ) | | | (.94 | ) | | | 14.53 | | | | 10.46 | | | | 135 | | | | 1.23 | | | | 1.23 | | | | .77 | |
| 12/31/2020 | | | 13.36 | | | | .10 | | | | 1.22 | | | | 1.32 | | | | (.12 | ) | | | (.54 | ) | | | (.66 | ) | | | 14.02 | | | | 10.00 | | | | 105 | | | | 1.22 | | | | 1.22 | | | | .78 | |
| 12/31/2019 | | | 11.55 | | | | .18 | | | | 2.14 | | | | 2.32 | | | | (.14 | ) | | | (.37 | ) | | | (.51 | ) | | | 13.36 | | | | 20.21 | | | | 94 | | | | 1.22 | | | | 1.22 | | | | 1.37 | |
| 12/31/2018 | | | 12.63 | | | | .17 | | | | (.96 | ) | | | (.79 | ) | | | (.14 | ) | | | (.15 | ) | | | (.29 | ) | | | 11.55 | | | | (6.31 | ) | | | 69 | | | | 1.22 | | | | 1.22 | | | | 1.34 | |
| 12/31/2017 | | | 11.00 | | | | .13 | | | | 1.99 | | | | 2.12 | | | | (.11 | ) | | | (.38 | ) | | | (.49 | ) | | | 12.63 | | | | 19.38 | | | | 51 | | | | 1.22 | | | | 1.22 | | | | 1.07 | |
Refer to the end of the tables for footnotes.
| American Funds Insurance Series | 335 |
Financial highlights (continued)
| | | | (Loss) income from
investment operations1 | | | Dividends and distributions | | | | | | | | | | | | | | | | | | |
| Year ended | | Net asset
value,
beginning
of year | | | Net
investment
income | | | Net (losses)
gains on
securities
(both
realized and
unrealized) | | | Total from
investment
operations | | | Dividends
(from net
investment
income) | | | Distributions
(from capital
gains) | | | Total
dividends
and
distributions | | | Net asset
value,
end
of year | | | Total return2 | | | Net assets,
end of year
(in millions) | | | Ratio of
expenses to
average net
assets before
waivers3 | | | Ratio of
expenses to
average net
assets after
waivers2,3 | | | Ratio of
net income
to average
net assets2 | |
| | | | | | | | | | | | | | | | | | | | | | | | | | | | | | | | | | | | | | | | |
| The Bond Fund of America | | | | | | | | | | | | | | | | | | | | | | | | | | | | | |
| | | | | | | |
| Class 1: | | | | | | | | | | | | | | | | | | | | | | | | | | | | | | | | | | | | | | | | | | | | | | | | | | | | |
| 6/30/20224,5 | | $ | 11.21 | | | $ | .15 | | | $ | (1.26 | ) | | $ | (1.11 | ) | | $ | (.06 | ) | | $ | (.12 | ) | | $ | (.18 | ) | | $ | 9.92 | | | | (9.96 | )%6 | | $ | 6,878 | | | | .39 | %7 | | | .20 | %7 | | | 2.80 | %7 |
| 12/31/2021 | | | 11.89 | | | | .21 | | | | (.23 | ) | | | (.02 | ) | | | (.19 | ) | | | (.47 | ) | | | (.66 | ) | | | 11.21 | | | | (.14 | ) | | | 8,555 | | | | .39 | | | | .26 | | | | 1.84 | |
| 12/31/2020 | | | 11.17 | | | | .23 | | | | .87 | | | | 1.10 | | | | (.27 | ) | | | (.11 | ) | | | (.38 | ) | | | 11.89 | | | | 9.96 | | | | 6,844 | | | | .40 | | | | .40 | | | | 2.00 | |
| 12/31/2019 | | | 10.47 | | | | .30 | | | | .71 | | | | 1.01 | | | | (.31 | ) | | | — | | | | (.31 | ) | | | 11.17 | | | | 9.70 | | | | 6,481 | | | | .39 | | | | .39 | | | | 2.76 | |
| 12/31/2018 | | | 10.82 | | | | .29 | | | | (.35 | ) | | | (.06 | ) | | | (.28 | ) | | | (.01 | ) | | | (.29 | ) | | | 10.47 | | | | (.45 | ) | | | 5,962 | | | | .38 | | | | .38 | | | | 2.70 | |
| 12/31/2017 | | | 10.80 | | | | .24 | | | | .18 | | | | .42 | | | | (.24 | ) | | | (.16 | ) | | | (.40 | ) | | | 10.82 | | | | 3.88 | | | | 6,434 | | | | .38 | | | | .38 | | | | 2.19 | |
| Class 1A: | | | | | | | | | | | | | | | | | | | | | | | | | | | | | | | | | | | | | | | | | | | | | | | | | | | | |
| 6/30/20224,5 | | | 11.16 | | | | .16 | | | | (1.28 | ) | | | (1.12 | ) | | | (.06 | ) | | | (.12 | ) | | | (.18 | ) | | | 9.86 | | | | (10.09 | )6 | | | 200 | | | | .63 | 7 | | | .44 | 7 | | | 3.12 | 7 |
| 12/31/2021 | | | 11.84 | | | | .18 | | | | (.23 | ) | | | (.05 | ) | | | (.16 | ) | | | (.47 | ) | | | (.63 | ) | | | 11.16 | | | | (.36 | ) | | | 12 | | | | .64 | | | | .51 | | | | 1.59 | |
| 12/31/2020 | | | 11.13 | | | | .20 | | | | .87 | | | | 1.07 | | | | (.25 | ) | | | (.11 | ) | | | (.36 | ) | | | 11.84 | | | | 9.68 | | | | 9 | | | | .65 | | | | .65 | | | | 1.74 | |
| 12/31/2019 | | | 10.45 | | | | .27 | | | | .71 | | | | .98 | | | | (.30 | ) | | | — | | | | (.30 | ) | | | 11.13 | | | | 9.36 | | | | 7 | | | | .64 | | | | .64 | | | | 2.48 | |
| 12/31/2018 | | | 10.80 | | | | .26 | | | | (.33 | ) | | | (.07 | ) | | | (.27 | ) | | | (.01 | ) | | | (.28 | ) | | | 10.45 | | | | (.60 | ) | | | 3 | | | | .63 | | | | .63 | | | | 2.50 | |
| 12/31/20174,8 | | | 10.82 | | | | .22 | | | | .15 | | | | .37 | | | | (.23 | ) | | | (.16 | ) | | | (.39 | ) | | | 10.80 | | | | 3.46 | 6 | | | 1 | | | | .62 | 7 | | | .62 | 7 | | | 2.01 | 7 |
| Class 2: | | | | | | | | | | | | | | | | | | | | | | | | | | | | | | | | | | | | | | | | | | | | | | | | | | | | |
| 6/30/20224,5 | | | 11.06 | | | | .13 | | | | (1.25 | ) | | | (1.12 | ) | | | (.05 | ) | | | (.12 | ) | | | (.17 | ) | | | 9.77 | | | | (10.14 | )6 | | | 3,092 | | | | .64 | 7 | | | .45 | 7 | | | 2.56 | 7 |
| 12/31/2021 | | | 11.73 | | | | .18 | | | | (.22 | ) | | | (.04 | ) | | | (.16 | ) | | | (.47 | ) | | | (.63 | ) | | | 11.06 | | | | (.31 | ) | | | 3,729 | | | | .64 | | | | .52 | | | | 1.57 | |
| 12/31/2020 | | | 11.02 | | | | .20 | | | | .86 | | | | 1.06 | | | | (.24 | ) | | | (.11 | ) | | | (.35 | ) | | | 11.73 | | | | 9.73 | | | | 3,840 | | | | .65 | | | | .65 | | | | 1.75 | |
| 12/31/2019 | | | 10.34 | | | | .27 | | | | .70 | | | | .97 | | | | (.29 | ) | | | — | | | | (.29 | ) | | | 11.02 | | | | 9.36 | | | | 3,561 | | | | .64 | | | | .64 | | | | 2.51 | |
| 12/31/2018 | | | 10.69 | | | | .26 | | | | (.34 | ) | | | (.08 | ) | | | (.26 | ) | | | (.01 | ) | | | (.27 | ) | | | 10.34 | | | | (.71 | ) | | | 3,524 | | | | .63 | | | | .63 | | | | 2.45 | |
| 12/31/2017 | | | 10.67 | | | | .21 | | | | .18 | | | | .39 | | | | (.21 | ) | | | (.16 | ) | | | (.37 | ) | | | 10.69 | | | | 3.67 | | | | 3,966 | | | | .63 | | | | .63 | | | | 1.94 | |
| Class 4: | | | | | | | | | | | | | | | | | | | | | | | | | | | | | | | | | | | | | | | | | | | | | | | | | | | | |
| 6/30/20224,5 | | | 11.01 | | | | .12 | | | | (1.24 | ) | | | (1.12 | ) | | | (.05 | ) | | | (.12 | ) | | | (.17 | ) | | | 9.72 | | | | (10.22 | )6 | | | 799 | | | | .89 | 7 | | | .70 | 7 | | | 2.32 | 7 |
| 12/31/2021 | | | 11.69 | | | | .15 | | | | (.22 | ) | | | (.07 | ) | | | (.14 | ) | | | (.47 | ) | | | (.61 | ) | | | 11.01 | | | | (.59 | ) | | | 891 | | | | .89 | | | | .76 | | | | 1.34 | |
| 12/31/2020 | | | 11.00 | | | | .17 | | | | .85 | | | | 1.02 | | | | (.22 | ) | | | (.11 | ) | | | (.33 | ) | | | 11.69 | | | | 9.38 | | | | 714 | | | | .90 | | | | .90 | | | | 1.48 | |
| 12/31/2019 | | | 10.33 | | | | .24 | | | | .70 | | | | .94 | | | | (.27 | ) | | | — | | | | (.27 | ) | | | 11.00 | | | | 9.08 | | | | 502 | | | | .89 | | | | .89 | | | | 2.25 | |
| 12/31/2018 | | | 10.68 | | | | .23 | | | | (.33 | ) | | | (.10 | ) | | | (.24 | ) | | | (.01 | ) | | | (.25 | ) | | | 10.33 | | | | (.89 | ) | | | 366 | | | | .88 | | | | .88 | | | | 2.22 | |
| 12/31/2017 | | | 10.70 | | | | .19 | | | | .16 | | | | .35 | | | | (.21 | ) | | | (.16 | ) | | | (.37 | ) | | | 10.68 | | | | 3.29 | | | | 297 | | | | .88 | | | | .88 | | | | 1.72 | |
Refer to the end of the tables for footnotes.
| 336 | American Funds Insurance Series |
Financial highlights (continued)
| | | | (Loss) income from
investment operations1 | | | Dividends and distributions | | | | | | | | | | | | | | | | | | |
| Year ended | | Net asset
value,
beginning
of year | | | Net
investment
income | | | Net (losses)
gains on
securities
(both
realized and
unrealized) | | | Total from
investment
operations | | | Dividends
(from net
investment
income) | | | Distributions
(from capital
gains) | | | Total
dividends
and
distributions | | | Net asset
value,
end
of year | | | Total return2 | | | Net assets,
end of year
(in millions) | | | Ratio of
expenses to
average net
assets before
waivers3 | | | Ratio of
expenses to
average net
assets after
waivers2,3 | | | Ratio of
net income
to average
net assets2 | |
| | | | | | | | | | | | | | | | | | | | | | | | | | | | | | | | | | | | | | | | | | | | | | | | | | | | | |
| Capital World Bond Fund | | | | | | | | | | | | | | | | | | | | | | | | | | | | | | | | | | | | | | | | | | |
| | | | | | | | | | | | | | | | | | | | | | | | | | | | | | | | | | | | | | | | | | | | | | | | | | | | | |
| Class 1: | | | | | | | | | | | | | | | | | | | | | | | | | | | | | | | | | | | | | | | | | | | | | | | | | | | | |
| 6/30/20224,5 | | $ | 11.79 | | | $ | .12 | | | $ | (2.01 | ) | | $ | (1.89 | ) | | $ | (.03 | ) | | $ | (.16 | ) | | $ | (.19 | ) | | $ | 9.71 | | | | (16.05 | )%6 | | $ | 708 | | | | .54 | %7 | | | .47 | %7 | | | 2.33 | %7 |
| 12/31/2021 | | | 12.94 | | | | .25 | | | | (.85 | ) | | | (.60 | ) | | | (.24 | ) | | | (.31 | ) | | | (.55 | ) | | | 11.79 | | | | (4.73 | ) | | | 988 | | | | .60 | | | | .50 | | | | 2.06 | |
| 12/31/2020 | | | 12.12 | | | | .26 | | | | .95 | | | | 1.21 | | | | (.18 | ) | | | (.21 | ) | | | (.39 | ) | | | 12.94 | | | | 10.17 | | | | 1,219 | | | | .59 | | | | .52 | | | | 2.08 | |
| 12/31/2019 | | | 11.42 | | | | .31 | | | | .61 | | | | .92 | | | | (.22 | ) | | | — | | | | (.22 | ) | | | 12.12 | | | | 8.08 | | | | 1,077 | | | | .58 | | | | .58 | | | | 2.60 | |
| 12/31/2018 | | | 11.88 | | | | .30 | | | | (.44 | ) | | | (.14 | ) | | | (.28 | ) | | | (.04 | ) | | | (.32 | ) | | | 11.42 | | | | (1.14 | ) | | | 1,015 | | | | .57 | | | | .57 | | | | 2.56 | |
| 12/31/2017 | | | 11.22 | | | | .28 | | | | .52 | | | | .80 | | | | (.07 | ) | | | (.07 | ) | | | (.14 | ) | | | 11.88 | | | | 7.11 | | | | 1,273 | | | | .56 | | | | .56 | | | | 2.37 | |
| Class 1A: | | | | | | | | | | | | | | | | | | | | | | | | | | | | | | | | | | | | | | | | | | | | | | | | | | | | |
| 6/30/20224,5 | | | 11.76 | | | | .11 | | | | (2.02 | ) | | | (1.91 | ) | | | (.02 | ) | | | (.16 | ) | | | (.18 | ) | | | 9.67 | | | | (16.22 | )6 | | | 1 | | | | .79 | 7 | | | .72 | 7 | | | 2.08 | 7 |
| 12/31/2021 | | | 12.91 | | | | .23 | | | | (.85 | ) | | | (.62 | ) | | | (.22 | ) | | | (.31 | ) | | | (.53 | ) | | | 11.76 | | | | (4.88 | ) | | | 1 | | | | .85 | | | | .75 | | | | 1.85 | |
| 12/31/2020 | | | 12.10 | | | | .23 | | | | .95 | | | | 1.18 | | | | (.16 | ) | | | (.21 | ) | | | (.37 | ) | | | 12.91 | | | | 9.89 | | | | 1 | | | | .83 | | | | .76 | | | | 1.83 | |
| 12/31/2019 | | | 11.41 | | | | .28 | | | | .60 | | | | .88 | | | | (.19 | ) | | | — | | | | (.19 | ) | | | 12.10 | | | | 7.75 | | | | 1 | | | | .83 | | | | .83 | | | | 2.35 | |
| 12/31/2018 | | | 11.87 | | | | .27 | | | | (.43 | ) | | | (.16 | ) | | | (.26 | ) | | | (.04 | ) | | | (.30 | ) | | | 11.41 | | | | (1.29 | ) | | | 1 | | | | .82 | | | | .82 | | | | 2.36 | |
| 12/31/20174,8 | | | 11.22 | | | | .26 | | | | .52 | | | | .78 | | | | (.06 | ) | | | (.07 | ) | | | (.13 | ) | | | 11.87 | | | | 7.00 | 6 | | | — | 10 | | | .72 | 7 | | | .72 | 7 | | | 2.27 | 7 |
| Class 2: | | | | | | | | | | | | | | | | | | | | | | | | | | | | | | | | | | | | | | | | | | | | | | | | | | | | |
| 6/30/20224,5 | | | 11.70 | | | | .11 | | | | (2.01 | ) | | | (1.90 | ) | | | (.02 | ) | | | (.16 | ) | | | (.18 | ) | | | 9.62 | | | | (16.21 | )6 | | | 817 | | | | .79 | 7 | | | .72 | 7 | | | 2.09 | 7 |
| 12/31/2021 | | | 12.84 | | | | .22 | | | | (.84 | ) | | | (.62 | ) | | | (.21 | ) | | | (.31 | ) | | | (.52 | ) | | | 11.70 | | | | (4.92 | ) | | | 1,030 | | | | .85 | | | | .75 | | | | 1.82 | |
| 12/31/2020 | | | 12.03 | | | | .22 | | | | .95 | | | | 1.17 | | | | (.15 | ) | | | (.21 | ) | | | (.36 | ) | | | 12.84 | | | | 9.90 | | | | 1,058 | | | | .84 | | | | .77 | | | | 1.83 | |
| 12/31/2019 | | | 11.34 | | | | .28 | | | | .60 | | | | .88 | | | | (.19 | ) | | | — | | | | (.19 | ) | | | 12.03 | | | | 7.77 | | | | 1,002 | | | | .83 | | | | .83 | | | | 2.35 | |
| 12/31/2018 | | | 11.79 | | | | .27 | | | | (.43 | ) | | | (.16 | ) | | | (.25 | ) | | | (.04 | ) | | | (.29 | ) | | | 11.34 | | | | (1.33 | ) | | | 1,032 | | | | .82 | | | | .82 | | | | 2.32 | |
| 12/31/2017 | | | 11.14 | | | | .25 | | | | .51 | | | | .76 | | | | (.04 | ) | | | (.07 | ) | | | (.11 | ) | | | 11.79 | | | | 6.86 | | | | 1,164 | | | | .81 | | | | .81 | | | | 2.12 | |
| Class 4: | | | | | | | | | | | | | | | | | | | | | | | | | | | | | | | | | | | | | | | | | | | | | | | | | | | | |
| 6/30/20224,5 | | | 11.57 | | | | .10 | | | | (1.98 | ) | | | (1.88 | ) | | | (.02 | ) | | | (.16 | ) | | | (.18 | ) | | | 9.51 | | | | (16.26 | )6 | | | 56 | | | | 1.04 | 7 | | | .97 | 7 | | | 1.84 | 7 |
| 12/31/2021 | | | 12.71 | | | | .19 | | | | (.84 | ) | | | (.65 | ) | | | (.18 | ) | | | (.31 | ) | | | (.49 | ) | | | 11.57 | | | | (5.18 | ) | | | 66 | | | | 1.10 | | | | 1.00 | | | | 1.57 | |
| 12/31/2020 | | | 11.92 | | | | .19 | | | | .94 | | | | 1.13 | | | | (.13 | ) | | | (.21 | ) | | | (.34 | ) | | | 12.71 | | | | 9.62 | | | | 61 | | | | 1.09 | | | | 1.02 | | | | 1.58 | |
| 12/31/2019 | | | 11.24 | | | | .24 | | | | .60 | | | | .84 | | | | (.16 | ) | | | — | | | | (.16 | ) | | | 11.92 | | | | 7.54 | | | | 49 | | | | 1.08 | | | | 1.08 | | | | 2.09 | |
| 12/31/2018 | | | 11.70 | | | | .24 | | | | (.43 | ) | | | (.19 | ) | | | (.23 | ) | | | (.04 | ) | | | (.27 | ) | | | 11.24 | | | | (1.61 | ) | | | 40 | | | | 1.07 | | | | 1.07 | | | | 2.09 | |
| 12/31/2017 | | | 11.08 | | | | .22 | | | | .51 | | | | .73 | | | | (.04 | ) | | | (.07 | ) | | | (.11 | ) | | | 11.70 | | | | 6.63 | | | | 31 | | | | 1.06 | | | | 1.06 | | | | 1.89 | |
Refer to the end of the tables for footnotes.
| American Funds Insurance Series | 337 |
Financial highlights (continued)
| | | | (Loss) income from
investment operations1 | | | Dividends and distributions | | | | | | | | | | | | | | | | | | |
| Year ended | | Net asset
value,
beginning
of year | | | Net
investment
income | | | Net (losses)
gains on
securities
(both
realized and
unrealized) | | | Total from
investment
operations | | | Dividends
(from net
investment
income) | | | Distributions
(from capital
gains) | | | Total
dividends
and
distributions | | | Net asset
value,
end
of year | | | Total return2 | | | Net assets,
end of year
(in millions) | | | Ratio of
expenses to
average net
assets before
waivers3 | | | Ratio of
expenses to
average net
assets after
waivers2,3 | | | Ratio of
net income
to average
net assets2 | |
| | | | | | | | | | | | | | | | | | | | | | | | | | | | | | | | | | | | | | | | | | | | | | | | | | | | | |
| American High-Income Trust | | | | | | | | | | | | | | | | | | | | | | | | | | | | | | | | | | | | | | | | | | |
| | | | | | | | | | | | | | | | | | | | | | | | | | | | | | | | | | | | | | | | | | | | | | | | | | | | | |
| Class 1: | | | | | | | | | | | | | | | | | | | | | | | | | | | | | | | | | | | | | | | | | | | | | | | | | | | | |
| 6/30/20224,5 | | $ | 10.19 | | | $ | .27 | | | $ | (1.53 | ) | | $ | (1.26 | ) | | $ | (.10 | ) | | $ | — | | | $ | (.10 | ) | | $ | 8.83 | | | | (12.42 | )%6 | | $ | 229 | | | | .49 | %7 | | | .32 | %7 | | | 5.55 | %7 |
| 12/31/2021 | | | 9.80 | | | | .51 | | | | .34 | | | | .85 | | | | (.46 | ) | | | — | | | | (.46 | ) | | | 10.19 | | | | 8.74 | | | | 278 | | | | .53 | | | | .37 | | | | 4.95 | |
| 12/31/2020 | | | 9.87 | | | | .61 | | | | .17 | | | | .78 | | | | (.85 | ) | | | — | | | | (.85 | ) | | | 9.80 | | | | 8.21 | | | | 123 | | | | .52 | | | | .52 | | | | 6.46 | |
| 12/31/2019 | | | 9.34 | | | | .67 | | | | .52 | | | | 1.19 | | | | (.66 | ) | | | — | | | | (.66 | ) | | | 9.87 | | | | 12.85 | | | | 525 | | | | .51 | | | | .51 | | | | 6.71 | |
| 12/31/2018 | | | 10.19 | | | | .64 | | | | (.84 | ) | | | (.20 | ) | | | (.65 | ) | | | — | | | | (.65 | ) | | | 9.34 | | | | (2.15 | ) | | | 501 | | | | .50 | | | | .50 | | | | 6.32 | |
| 12/31/2017 | | | 10.18 | | | | .63 | | | | .10 | | | | .73 | | | | (.72 | ) | | | — | | | | (.72 | ) | | | 10.19 | | | | 7.25 | | | | 632 | | | | .49 | | | | .49 | | | | 5.98 | |
| Class 1A: | | | | | | | | | | | | | | | | | | | | | | | | | | | | | | | | | | | | | | | | | | | | | | | | | | | | |
| 6/30/20224,5 | | | 10.16 | | | | .25 | | | | (1.52 | ) | | | (1.27 | ) | | | (.10 | ) | | | — | | | | (.10 | ) | | | 8.79 | | | | (12.60 | )6 | | | 1 | | | | .75 | 7 | | | .57 | 7 | | | 5.27 | 7 |
| 12/31/2021 | | | 9.78 | | | | .49 | | | | .33 | | | | .82 | | | | (.44 | ) | | | — | | | | (.44 | ) | | | 10.16 | | | | 8.42 | | | | 1 | | | | .78 | | | | .64 | | | | 4.75 | |
| 12/31/2020 | | | 9.86 | | | | .56 | | | | .20 | | | | .76 | | | | (.84 | ) | | | — | | | | (.84 | ) | | | 9.78 | | | | 7.94 | | | | 1 | | | | .78 | | | | .78 | | | | 5.85 | |
| 12/31/2019 | | | 9.33 | | | | .65 | | | | .51 | | | | 1.16 | | | | (.63 | ) | | | — | | | | (.63 | ) | | | 9.86 | | | | 12.61 | | | | 1 | | | | .75 | | | | .75 | | | | 6.47 | |
| 12/31/2018 | | | 10.18 | | | | .62 | | | | (.84 | ) | | | (.22 | ) | | | (.63 | ) | | | — | | | | (.63 | ) | | | 9.33 | | | | (2.35 | ) | | | 1 | | | | .75 | | | | .75 | | | | 6.11 | |
| 12/31/20174,8 | | | 10.28 | | | | .60 | | | | .02 | | | | .62 | | | | (.72 | ) | | | — | | | | (.72 | ) | | | 10.18 | | | | 6.02 | 6 | | | — | 10 | | | .72 | 7 | | | .72 | 7 | | | 5.74 | 7 |
| Class 2: | | | | | | | | | | | | | | | | | | | | | | | | | | | | | | | | | | | | | | | | | | | | | | | | | | | | |
| 6/30/20224,5 | | | 9.98 | | | | .25 | | | | (1.49 | ) | | | (1.24 | ) | | | (.10 | ) | | | — | | | | (.10 | ) | | | 8.64 | | | | (12.52 | )6 | | | 540 | | | | .75 | 7 | | | .57 | 7 | | | 5.28 | 7 |
| 12/31/2021 | | | 9.61 | | | | .48 | | | | .33 | | | | .81 | | | | (.44 | ) | | | — | | | | (.44 | ) | | | 9.98 | | | | 8.42 | | | | 673 | | | | .78 | | | | .65 | | | | 4.80 | |
| 12/31/2020 | | | 9.70 | | | | .55 | | | | .19 | | | | .74 | | | | (.83 | ) | | | — | | | | (.83 | ) | | | 9.61 | | | | 7.94 | | | | 665 | | | | .78 | | | | .78 | | | | 5.88 | |
| 12/31/2019 | | | 9.19 | | | | .64 | | | | .50 | | | | 1.14 | | | | (.63 | ) | | | — | | | | (.63 | ) | | | 9.70 | | | | 12.55 | | | | 667 | | | | .76 | | | | .76 | | | | 6.45 | |
| 12/31/2018 | | | 10.03 | | | | .61 | | | | (.83 | ) | | | (.22 | ) | | | (.62 | ) | | | — | | | | (.62 | ) | | | 9.19 | | | | (2.34 | ) | | | 661 | | | | .75 | | | | .75 | | | | 6.07 | |
| 12/31/2017 | | | 10.04 | | | | .59 | | | | .10 | | | | .69 | | | | (.70 | ) | | | — | | | | (.70 | ) | | | 10.03 | | | | 6.89 | | | | 776 | | | | .74 | | | | .74 | | | | 5.72 | |
| Class 3: | | | | | | | | | | | | | | | | | | | | | | | | | | | | | | | | | | | | | | | | | | | | | | | | | | | | |
| 6/30/20224,5 | | | 10.24 | | | | .26 | | | | (1.54 | ) | | | (1.28 | ) | | | (.10 | ) | | | — | | | | (.10 | ) | | | 8.86 | | | | (12.58 | )6 | | | 9 | | | | .68 | 7 | | | .50 | 7 | | | 5.35 | 7 |
| 12/31/2021 | | | 9.84 | | | | .50 | | | | .34 | | | | .84 | | | | (.44 | ) | | | — | | | | (.44 | ) | | | 10.24 | | | | 8.60 | | | | 10 | | | | .71 | | | | .58 | | | | 4.86 | |
| 12/31/2020 | | | 9.92 | | | | .57 | | | | .19 | | | | .76 | | | | (.84 | ) | | | — | | | | (.84 | ) | | | 9.84 | | | | 7.93 | | | | 10 | | | | .71 | | | | .71 | | | | 5.94 | |
| 12/31/2019 | | | 9.38 | | | | .66 | | | | .52 | | | | 1.18 | | | | (.64 | ) | | | — | | | | (.64 | ) | | | 9.92 | | | | 12.70 | | | | 10 | | | | .69 | | | | .69 | | | | 6.52 | |
| 12/31/2018 | | | 10.23 | | | | .63 | | | | (.85 | ) | | | (.22 | ) | | | (.63 | ) | | | — | | | | (.63 | ) | | | 9.38 | | | | (2.33 | ) | | | 10 | | | | .68 | | | | .68 | | | | 6.14 | |
| 12/31/2017 | | | 10.22 | | | | .61 | | | | .10 | | | | .71 | | | | (.70 | ) | | | — | | | | (.70 | ) | | | 10.23 | | | | 7.02 | | | | 12 | | | | .67 | | | | .67 | | | | 5.79 | |
| Class 4: | | | | | | | | | | | | | | | | | | | | | | | | | | | | | | | | | | | | | | | | | | | | | | | | | | | | |
| 6/30/20224,5 | | | 10.99 | | | | .26 | | | | (1.65 | ) | | | (1.39 | ) | | | (.09 | ) | | | — | | | | (.09 | ) | | | 9.51 | | | | (12.68 | )6 | | | 71 | | | | .99 | 7 | | | .82 | 7 | | | 5.03 | 7 |
| 12/31/2021 | | | 10.54 | | | | .50 | | | | .36 | | | | .86 | | | | (.41 | ) | | | — | | | | (.41 | ) | | | 10.99 | | | | 8.18 | | | | 90 | | | | 1.03 | | | | .89 | | | | 4.52 | |
| 12/31/2020 | | | 10.56 | | | | .57 | | | | .22 | | | | .79 | | | | (.81 | ) | | | — | | | | (.81 | ) | | | 10.54 | | | | 7.74 | | | | 69 | | | | 1.03 | | | | 1.03 | | | | 5.58 | |
| 12/31/2019 | | | 9.96 | | | | .67 | | | | .54 | | | | 1.21 | | | | (.61 | ) | | | — | | | | (.61 | ) | | | 10.56 | | | | 12.27 | | | | 63 | | | | 1.01 | | | | 1.01 | | | | 6.21 | |
| 12/31/2018 | | | 10.82 | | | | .63 | | | | (.90 | ) | | | (.27 | ) | | | (.59 | ) | | | — | | | | (.59 | ) | | | 9.96 | | | | (2.64 | ) | | | 31 | | | | 1.00 | | | | 1.00 | | | | 5.83 | |
| 12/31/2017 | | | 10.79 | | | | .61 | | | | .10 | | | | .71 | | | | (.68 | ) | | | — | | | | (.68 | ) | | | 10.82 | | | | 6.63 | | | | 34 | | | | .99 | | | | .99 | | | | 5.46 | |
Refer to the end of the tables for footnotes.
| 338 | American Funds Insurance Series |
Financial highlights (continued)
| | | | (Loss) income from
investment operations1 | | | Dividends and distributions | | | | | | | | | | | | | | | | | | |
| Year ended | | Net asset
value,
beginning
of year | | | Net
investment
income | | | Net (losses)
gains on
securities
(both
realized and
unrealized) | | | Total from
investment
operations | | | Dividends
(from net
investment
income) | | | Distributions
(from capital
gains) | | | Total
dividends
and
distributions | | | Net asset
value,
end
of year | | | Total return2 | | | Net assets,
end of year
(in millions) | | | Ratio of
expenses to
average net
assets before
waivers | | | Ratio of
expenses to
average net
assets after
waivers2 | | | Ratio of
net income
to average
net assets2 | |
| | | | | | | | | | | | | | | | | | | | | | | | | | | | | | | | | | | | | | | | | | | | | | | | | | | | | |
| American Funds Mortgage Fund | | | | | | | | | | | | | | | | | | | | | | | | | | | | | | | | | | | | | | | | | | |
| | | | | | | | | | | | | | | | | | | | | | | | | | | | | | | | | | | | | | | | | | | | | | | | | | | | | |
| Class 1: | | | | | | | | | | | | | | | | | | | | | | | | | | | | | | | | | | | | | | | | | | | | | | | | | | | | |
| 6/30/20224,5 | | $ | 10.63 | | | $ | .03 | | | $ | (.75 | ) | | $ | (.72 | ) | | $ | — | | | $ | — | | | $ | — | | | $ | 9.91 | | | | (6.77 | )%6 | | $ | 1 | | | | .45 | %7 | | | .24 | %7 | | | .56 | %7 |
| 12/31/2021 | | | 11.11 | | | | .06 | | | | (.09 | ) | | | (.03 | ) | | | (.08 | ) | | | (.37 | ) | | | (.45 | ) | | | 10.63 | | | | (.32 | ) | | | 231 | | | | .49 | | | | .29 | | | | .58 | |
| 12/31/2020 | | | 10.56 | | | | .10 | | | | .64 | | | | .74 | | | | (.17 | ) | | | (.02 | ) | | | (.19 | ) | | | 11.11 | | | | 6.98 | | | | 224 | | | | .48 | | | | .36 | | | | .93 | |
| 12/31/2019 | | | 10.30 | | | | .24 | | | | .30 | | | | .54 | | | | (.28 | ) | | | — | | | | (.28 | ) | | | 10.56 | | | | 5.30 | | | | 210 | | | | .47 | | | | .47 | | | | 2.26 | |
| 12/31/2018 | | | 10.47 | | | | .20 | | | | (.14 | ) | | | .06 | | | | (.23 | ) | | | — | | | | (.23 | ) | | | 10.30 | | | | .58 | | | | 209 | | | | .48 | | | | .48 | | | | 1.97 | |
| 12/31/2017 | | | 10.56 | | | | .16 | | | | — | 9 | | | .16 | | | | (.18 | ) | | | (.07 | ) | | | (.25 | ) | | | 10.47 | | | | 1.47 | | | | 265 | | | | .47 | | | | .47 | | | | 1.52 | |
| Class 1A: | | | | | | | | | | | | | | | | | | | | | | | | | | | | | | | | | | | | | | | | | | | | | | | | | | | | |
| 6/30/20224,5 | | | 10.59 | | | | .06 | | | | (.80 | ) | | | (.74 | ) | | | (.05 | ) | | | — | | | | (.05 | ) | | | 9.80 | | | | (6.94 | )6 | | | 2 | | | | .68 | 7 | | | .50 | 7 | | | 1.21 | 7 |
| 12/31/2021 | | | 11.08 | | | | .04 | | | | (.10 | ) | | | (.06 | ) | | | (.06 | ) | | | (.37 | ) | | | (.43 | ) | | | 10.59 | | | | (.47 | ) | | | 2 | | | | .74 | | | | .54 | | | | .33 | |
| 12/31/2020 | | | 10.55 | | | | .07 | | | | .63 | | | | .70 | | | | (.15 | ) | | | (.02 | ) | | | (.17 | ) | | | 11.08 | | | | 6.63 | | | | 1 | | | | .73 | | | | .59 | | | | .61 | |
| 12/31/2019 | | | 10.28 | | | | .22 | | | | .30 | | | | .52 | | | | (.25 | ) | | | — | | | | (.25 | ) | | | 10.55 | | | | 5.09 | | | | 1 | | | | .71 | | | | .71 | | | | 2.04 | |
| 12/31/2018 | | | 10.46 | | | | .18 | | | | (.14 | ) | | | .04 | | | | (.22 | ) | | | — | | | | (.22 | ) | | | 10.28 | | | | .36 | | | | 1 | | | | .73 | | | | .73 | | | | 1.77 | |
| 12/31/20174,8 | | | 10.55 | | | | .14 | | | | — | 9 | | | .14 | | | | (.16 | ) | | | (.07 | ) | | | (.23 | ) | | | 10.46 | | | | 1.31 | 6 | | | — | 10 | | | .70 | 7 | | | .70 | 7 | | | 1.38 | 7 |
| Class 2: | | | | | | | | | | | | | | | | | | | | | | | | | | | | | | | | | | | | | | | | | | | | | | | | | | | | |
| 6/30/20224,5 | | | 10.61 | | | | .06 | | | | (.80 | ) | | | (.74 | ) | | | (.05 | ) | | | — | | | | (.05 | ) | | | 9.82 | | | | (6.93 | )6 | | | 50 | | | | .68 | 7 | | | .50 | 7 | | | 1.21 | 7 |
| 12/31/2021 | | | 11.09 | | | | .04 | | | | (.10 | ) | | | (.06 | ) | | | (.05 | ) | | | (.37 | ) | | | (.42 | ) | | | 10.61 | | | | (.57 | ) | | | 58 | | | | .74 | | | | .54 | | | | .33 | |
| 12/31/2020 | | | 10.54 | | | | .08 | | | | .63 | | | | .71 | | | | (.14 | ) | | | (.02 | ) | | | (.16 | ) | | | 11.09 | | | | 6.72 | | | | 58 | | | | .73 | | | | .60 | | | | .68 | |
| 12/31/2019 | | | 10.28 | | | | .21 | | | | .31 | | | | .52 | | | | (.26 | ) | | | — | | | | (.26 | ) | | | 10.54 | | | | 5.04 | | | | 56 | | | | .72 | | | | .72 | | | | 2.01 | |
| 12/31/2018 | | | 10.45 | | | | .18 | | | | (.15 | ) | | | .03 | | | | (.20 | ) | | | — | | | | (.20 | ) | | | 10.28 | | | | .32 | | | | 57 | | | | .73 | | | | .73 | | | | 1.72 | |
| 12/31/2017 | | | 10.54 | | | | .14 | | | | (.01 | ) | | | .13 | | | | (.15 | ) | | | (.07 | ) | | | (.22 | ) | | | 10.45 | | | | 1.22 | | | | 63 | | | | .72 | | | | .72 | | | | 1.27 | |
| Class 4: | | | | | | | | | | | | | | | | | | | | | | | | | | | | | | | | | | | | | | | | | | | | | | | | | | | | |
| 6/30/20224,5 | | | 10.49 | | | | .05 | | | | (.79 | ) | | | (.74 | ) | | | (.05 | ) | | | — | | | | (.05 | ) | | | 9.70 | | | | (7.05 | )6 | | | 40 | | | | .93 | 7 | | | .75 | 7 | | | .97 | 7 |
| 12/31/2021 | | | 10.97 | | | | .01 | | | | (.09 | ) | | | (.08 | ) | | | (.03 | ) | | | (.37 | ) | | | (.40 | ) | | | 10.49 | | | | (.78 | ) | | | 43 | | | | .99 | | | | .79 | | | | .08 | |
| 12/31/2020 | | | 10.44 | | | | .04 | | | | .63 | | | | .67 | | | | (.12 | ) | | | (.02 | ) | | | (.14 | ) | | | 10.97 | | | | 6.38 | | | | 37 | | | | .98 | | | | .85 | | | | .41 | |
| 12/31/2019 | | | 10.19 | | | | .18 | | | | .31 | | | | .49 | | | | (.24 | ) | | | — | | | | (.24 | ) | | | 10.44 | | | | 4.80 | | | | 28 | | | | .97 | | | | .97 | | | | 1.71 | |
| 12/31/2018 | | | 10.38 | | | | .15 | | | | (.15 | ) | | | — | 9 | | | (.19 | ) | | | — | | | | (.19 | ) | | | 10.19 | | | | .07 | | | | 24 | | | | .98 | | | | .98 | | | | 1.49 | |
| 12/31/2017 | | | 10.48 | | | | .11 | | | | — | 9 | | | .11 | | | | (.14 | ) | | | (.07 | ) | | | (.21 | ) | | | 10.38 | | | | .97 | | | | 12 | | | | .97 | | | | .97 | | | | 1.03 | |
Refer to the end of the tables for footnotes.
| American Funds Insurance Series | 339 |
Financial highlights (continued)
| | | | | | Income (loss) from
investment operations1 | | | Dividends and distributions | | | | | | | | | | | | | | | | |
| Year ended | | Net asset
value,
beginning
of year | | | Net
investment
income
(loss) | | | Net gains
(losses) on
securities
(both
realized and
unrealized) | | | Total from
investment
operations | | | Dividends
(from net
investment
income) | | | Distributions
(from capital
gains) | | | Total
dividends
and
distributions | | | Net asset
value,
end
of year | | | Total return | | | Net assets,
end of year
(in millions) | | | Ratio of
expenses
to average
net assets | | | Ratio of
net income
(loss)
to average
net assets | |
| | | | | | | | | | | | | | | | | | | | | | | | | | | | | | | | | | | | | | | | | | | | | | | | | |
| Ultra-Short Bond Fund | | | | | | | | | | | | | | | | | | | | | | | | | | | | | | | | | | | | | | |
| | | | | | | | | | | | | | | | | | | | | | | | | | | | | | | | | | | | | | | | | | | | | | | | | |
| Class 1: | | | | | | | | | | | | | | | | | | | | | | | | | | | | | | | | | | | | | | | | | | | | | | | | |
| 6/30/20224,5 | | $ | 11.27 | | | $ | .01 | | | $ | — | 9 | | $ | .01 | | | $ | — | | | $ | — | | | $ | — | | | $ | 11.28 | | | | .09 | %6 | | $ | 47 | | | | .33 | %7 | | | .15 | %7 |
| 12/31/2021 | | | 11.31 | | | | (.03 | ) | | | (.01 | ) | | | (.04 | ) | | | — | | | | — | | | | — | | | | 11.27 | | | | (.35 | ) | | | 37 | | | | .37 | | | | (.28 | ) |
| 12/31/2020 | | | 11.30 | | | | .02 | | | | .02 | | | | .04 | | | | (.03 | ) | | | — | | | | (.03 | ) | | | 11.31 | | | | .34 | | | | 44 | | | | .37 | | | | .16 | |
| 12/31/2019 | | | 11.31 | | | | .22 | | | | — | 9 | | | .22 | | | | (.23 | ) | | | — | | | | (.23 | ) | | | 11.30 | | | | 1.92 | | | | 30 | | | | .36 | | | | 1.92 | |
| 12/31/2018 | | | 11.29 | | | | .18 | | | | — | 9 | | | .18 | | | | (.16 | ) | | | — | | | | (.16 | ) | | | 11.31 | | | | 1.58 | | | | 37 | | | | .35 | | | | 1.60 | |
| 12/31/2017 | | | 11.27 | | | | .08 | | | | (.01 | ) | | | .07 | | | | (.05 | ) | | | — | | | | (.05 | ) | | | 11.29 | | | | .66 | | | | 37 | | | | .35 | | | | .68 | |
| Class 1A: | | | | | | | | | | | | | | | | | | | | | | | | | | | | | | | | | | | | | | | | | | | | | | | | |
| 6/30/20224,5 | | | 11.28 | | | | .01 | | | | (.01 | ) | | | — | | | | — | | | | — | | | | — | | | | 11.28 | | | | .00 | 6 | | | — | 10 | | | .33 | 7 | | | .14 | 7 |
| 12/31/2021 | | | 11.31 | | | | (.03 | ) | | | — | 9 | | | (.03 | ) | | | — | | | | — | | | | — | | | | 11.28 | | | | (.27 | ) | | | — | 10 | | | .36 | | | | (.28 | ) |
| 12/31/2020 | | | 11.30 | | | | .03 | | | | .01 | | | | .04 | | | | (.03 | ) | | | — | | | | (.03 | ) | | | 11.31 | | | | .32 | | | | — | 10 | | | .35 | | | | .26 | |
| 12/31/2019 | | | 11.31 | | | | .22 | | | | — | 9 | | | .22 | | | | (.23 | ) | | | — | | | | (.23 | ) | | | 11.30 | | | | 1.92 | | | | — | 10 | | | .37 | | | | 1.90 | |
| 12/31/2018 | | | 11.29 | | | | .18 | | | | — | 9 | | | .18 | | | | (.16 | ) | | | — | | | | (.16 | ) | | | 11.31 | | | | 1.58 | | | | — | 10 | | | .35 | | | | 1.60 | |
| 12/31/20174,8 | | | 11.27 | | | | .08 | | | | — | 9 | | | .08 | | | | (.06 | ) | | | — | | | | (.06 | ) | | | 11.29 | | | | .67 | 6 | | | — | 10 | | | .34 | 7 | | | .69 | 7 |
| Class 2: | | | | | | | | | | | | | | | | | | | | | | | | | | | | | | | | | | | | | | | | | | | | | | | | |
| 6/30/20224,5 | | | 10.93 | | | | — | 9 | | | (.01 | ) | | | (.01 | ) | | | — | | | | — | | | | — | | | | 10.92 | | | | (.09 | )6 | | | 297 | | | | .58 | 7 | | | (.09 | )7 |
| 12/31/2021 | | | 10.99 | | | | (.06 | ) | | | — | 9 | | | (.06 | ) | | | — | | | | — | | | | — | | | | 10.93 | | | | (.55 | ) | | | 245 | | | | .62 | | | | (.53 | ) |
| 12/31/2020 | | | 11.01 | | | | — | 9 | | | — | 9 | | | — | 9 | | | (.02 | ) | | | — | | | | (.02 | ) | | | 10.99 | | | | .03 | | | | 288 | | | | .62 | | | | (.05 | ) |
| 12/31/2019 | | | 11.03 | | | | .18 | | | | — | 9 | | | .18 | | | | (.20 | ) | | | — | | | | (.20 | ) | | | 11.01 | | | | 1.62 | | | | 230 | | | | .61 | | | | 1.66 | |
| 12/31/2018 | | | 11.01 | | | | .15 | | | | — | 9 | | | .15 | | | | (.13 | ) | | | — | | | | (.13 | ) | | | 11.03 | | | | 1.36 | | | | 247 | | | | .60 | | | | 1.34 | |
| 12/31/2017 | | | 10.99 | | | | .05 | | | | — | 9 | | | .05 | | | | (.03 | ) | | | — | | | | (.03 | ) | | | 11.01 | | | | .46 | | | | 249 | | | | .60 | | | | .42 | |
| Class 3: | | | | | | | | | | | | | | | | | | | | | | | | | | | | | | | | | | | | | | | | | | | | | | | | |
| 6/30/20224,5 | | | 11.07 | | | | — | 9 | | | (.01 | ) | | | (.01 | ) | | | — | | | | — | | | | — | | | | 11.06 | | | | (.09 | )6 | | | 5 | | | | .51 | 7 | | | (.04 | )7 |
| 12/31/2021 | | | 11.12 | | | | (.05 | ) | | | — | 9 | | | (.05 | ) | | | — | | | | — | | | | — | | | | 11.07 | | | | (.45 | ) | | | 5 | | | | .55 | | | | (.46 | ) |
| 12/31/2020 | | | 11.13 | | | | — | 9 | | | .02 | | | | .02 | | | | (.03 | ) | | | — | | | | (.03 | ) | | | 11.12 | | | | .13 | | | | 4 | | | | .55 | | | | .03 | |
| 12/31/2019 | | | 11.14 | | | | .20 | | | | — | 9 | | | .20 | | | | (.21 | ) | | | — | | | | (.21 | ) | | | 11.13 | | | | 1.76 | | | | 3 | | | | .54 | | | | 1.74 | |
| 12/31/2018 | | | 11.12 | | | | .16 | | | | (.01 | ) | | | .15 | | | | (.13 | ) | | | — | | | | (.13 | ) | | | 11.14 | | | | 1.38 | | | | 4 | | | | .53 | | | | 1.42 | |
| 12/31/2017 | | | 11.10 | | | | .06 | | | | — | 9 | | | .06 | | | | (.04 | ) | | | — | | | | (.04 | ) | | | 11.12 | | | | .54 | | | | 4 | | | | .53 | | | | .50 | |
| Class 4: | | | | | | | | | | | | | | | | | | | | | | | | | | | | | | | | | | | | | | | | | | | | | | | | |
| 6/30/20224,5 | | | 11.00 | | | | (.02 | ) | | | — | 9 | | | (.02 | ) | | | — | | | | — | | | | — | | | | 10.98 | | | | (.18 | )6 | | | 75 | | | | .83 | 7 | | | (.33 | )7 |
| 12/31/2021 | | | 11.08 | | | | (.09 | ) | | | .01 | | | | (.08 | ) | | | — | | | | — | | | | — | | | | 11.00 | | | | (.72 | ) | | | 46 | | | | .87 | | | | (.79 | ) |
| 12/31/2020 | | | 11.13 | | | | (.04 | ) | | | .01 | | | | (.03 | ) | | | (.02 | ) | | | — | | | | (.02 | ) | | | 11.08 | | | | (.25 | ) | | | 40 | | | | .87 | | | | (.35 | ) |
| 12/31/2019 | | | 11.15 | | | | .16 | | | | — | 9 | | | .16 | | | | (.18 | ) | | | — | | | | (.18 | ) | | | 11.13 | | | | 1.40 | | | | 22 | | | | .86 | | | | 1.40 | |
| 12/31/2018 | | | 11.13 | | | | .12 | | | | .01 | | | | .13 | | | | (.11 | ) | | | — | | | | (.11 | ) | | | 11.15 | | | | 1.14 | | | | 18 | | | | .86 | | | | 1.11 | |
| 12/31/2017 | | | 11.12 | | | | .02 | | | | — | 9 | | | .02 | | | | (.01 | ) | | | — | | | | (.01 | ) | | | 11.13 | | | | .16 | | | | 15 | | | | .85 | | | | .19 | |
Refer to the end of the tables for footnotes.
| 340 | American Funds Insurance Series |
Financial highlights (continued)
| | | | | | (Loss) income from
investment operations1 | | | Dividends and distributions | | | | | | | | | | | | | | | | | | | |
| Year ended | | Net asset
value,
beginning
of year | | | Net
investment
income | | | Net (losses)
gains on
securities
(both
realized and
unrealized) | | | Total from
investment
operations | | | Dividends
(from net
investment
income) | | | Distributions
(from capital
gains) | | | Total
dividends
and
distributions | | | Net asset
value,
end
of year | | | Total return2 | | | Net assets,
end of year
(in millions) | | | Ratio of
expenses to
average net
assets before
waivers | | | Ratio of
expenses to
average net
assets after
waivers2 | | | Ratio of
net income
to average
net assets2 | |
| | | | | | | | | | | | | | | | | | | | | | | | | | | | | | | | | | | | | | | | | | | | | | | | | | | | | |
| U.S. Government Securities Fund | | | | | | | | | | | | | | | | | | | | | | | | | | | | | | | | | | | | | |
| | | | | | | | | | | | | | | | | | | | | | | | | | | | | | | | | | | | | | | | | | | | | | | | | | | | | |
| Class 1: | | | | | | | | | | | | | | | | | | | | | | | | | | | | | | | | | | | | | | | | | | | | | | | | | | | | |
| 6/30/20224,5 | | $ | 11.67 | | | $ | .15 | | | $ | (.98 | ) | | $ | (.83 | ) | | $ | (.05 | ) | | $ | — | | | $ | (.05 | ) | | $ | 10.79 | | | | (7.08 | )%6 | | $ | 255 | | | | .37 | %7 | | | .23 | %7 | | | 2.64 | %7 |
| 12/31/2021 | | | 13.04 | | | | .18 | | | | (.26 | ) | | | (.08 | ) | | | (.18 | ) | | | (1.11 | ) | | | (1.29 | ) | | | 11.67 | | | | (.44 | ) | | | 522 | | | | .39 | | | | .29 | | | | 1.50 | |
| 12/31/2020 | | | 12.34 | | | | .16 | | | | 1.07 | | | | 1.23 | | | | (.26 | ) | | | (.27 | ) | | | (.53 | ) | | | 13.04 | | | | 10.09 | | | | 429 | | | | .38 | | | | .38 | | | | 1.21 | |
| 12/31/2019 | | | 11.94 | | | | .25 | | | | .43 | | | | .68 | | | | (.28 | ) | | | — | | | | (.28 | ) | | | 12.34 | | | | 5.69 | | | | 1,418 | | | | .37 | | | | .37 | | | | 2.07 | |
| 12/31/2018 | | | 12.08 | | | | .24 | | | | (.13 | ) | | | .11 | | | | (.25 | ) | | | — | | | | (.25 | ) | | | 11.94 | | | | .91 | | | | 1,445 | | | | .36 | | | | .36 | | | | 2.02 | |
| 12/31/2017 | | | 12.05 | | | | .21 | | | | .01 | | | | .22 | | | | (.19 | ) | | | — | | | | (.19 | ) | | | 12.08 | | | | 1.83 | | | | 1,558 | | | | .36 | | | | .36 | | | | 1.68 | |
| Class 1A: | | | | | | | | | | | | | | | | | | | | | | | | | | | | | | | | | | | | | | | | | | | | | | | | | | | | |
| 6/30/20224,5 | | | 11.63 | | | | .14 | | | | (.97 | ) | | | (.83 | ) | | | (.05 | ) | | | — | | | | (.05 | ) | | | 10.75 | | | | (7.15 | )6 | | | 4 | | | | .62 | 7 | | | .48 | 7 | | | 2.47 | 7 |
| 12/31/2021 | | | 13.00 | | | | .16 | | | | (.26 | ) | | | (.10 | ) | | | (.16 | ) | | | (1.11 | ) | | | (1.27 | ) | | | 11.63 | | | | (.65 | ) | | | 5 | | | | .64 | | | | .53 | | | | 1.28 | |
| 12/31/2020 | | | 12.32 | | | | .09 | | | | 1.10 | | | | 1.19 | | | | (.24 | ) | | | (.27 | ) | | | (.51 | ) | | | 13.00 | | | | 9.75 | | | | 4 | | | | .64 | | | | .64 | | | | .69 | |
| 12/31/2019 | | | 11.93 | | | | .22 | | | | .43 | | | | .65 | | | | (.26 | ) | | | — | | | | (.26 | ) | | | 12.32 | | | | 5.42 | | | | 2 | | | | .62 | | | | .62 | | | | 1.82 | |
| 12/31/2018 | | | 12.08 | | | | .22 | | | | (.14 | ) | | | .08 | | | | (.23 | ) | | | — | | | | (.23 | ) | | | 11.93 | | | | .70 | | | | 1 | | | | .61 | | | | .61 | | | | 1.82 | |
| 12/31/20174,8 | | | 12.05 | | | | .18 | | | | .03 | | | | .21 | | | | (.18 | ) | | | — | | | | (.18 | ) | | | 12.08 | | | | 1.73 | 6 | | | — | 10 | | | .58 | 7 | | | .58 | 7 | | | 1.53 | 7 |
| Class 2: | | | | | | | | | | | | | | | | | | | | | | | | | | | | | | | | | | | | | | | | | | | | | | | | | | | | |
| 6/30/20224,5 | | | 11.53 | | | | .13 | | | | (.96 | ) | | | (.83 | ) | | | (.05 | ) | | | — | | | | (.05 | ) | | | 10.65 | | | | (7.21 | )6 | | | 1,170 | | | | .62 | 7 | | | .48 | 7 | | | 2.46 | 7 |
| 12/31/2021 | | | 12.89 | | | | .15 | | | | (.25 | ) | | | (.10 | ) | �� | | (.15 | ) | | | (1.11 | ) | | | (1.26 | ) | | | 11.53 | | | | (.62 | ) | | | 1,391 | | | | .64 | | | | .54 | | | | 1.24 | |
| 12/31/2020 | | | 12.21 | | | | .09 | | | | 1.10 | | | | 1.19 | | | | (.24 | ) | | | (.27 | ) | | | (.51 | ) | | | 12.89 | | | | 9.80 | | | | 1,439 | | | | .64 | | | | .64 | | | | .73 | |
| 12/31/2019 | | | 11.82 | | | | .22 | | | | .42 | | | | .64 | | | | (.25 | ) | | | — | | | | (.25 | ) | | | 12.21 | | | | 5.31 | | | | 1,343 | | | | .62 | | | | .62 | | | | 1.82 | |
| 12/31/2018 | | | 11.96 | | | | .21 | | | | (.14 | ) | | | .07 | | | | (.21 | ) | | | — | | | | (.21 | ) | | | 11.82 | | | | .73 | | | | 1,323 | | | | .61 | | | | .61 | | | | 1.77 | |
| 12/31/2017 | | | 11.93 | | | | .17 | | | | .02 | | | | .19 | | | | (.16 | ) | | | — | | | | (.16 | ) | | | 11.96 | | | | 1.59 | | | | 1,473 | | | | .61 | | | | .61 | | | | 1.43 | |
| Class 3: | | | | | | | | | | | | | | | | | | | | | | | | | | | | | | | | | | | | | | | | | | | | | | | | | | | | |
| 6/30/20224,5 | | | 11.70 | | | | .14 | | | | (.98 | ) | | | (.84 | ) | | | (.05 | ) | | | — | | | | (.05 | ) | | | 10.81 | | | | (7.18 | )6 | | | 8 | | | | .55 | 7 | | | .41 | 7 | | | 2.53 | 7 |
| 12/31/2021 | | | 13.07 | | | | .16 | | | | (.26 | ) | | | (.10 | ) | | | (.16 | ) | | | (1.11 | ) | | | (1.27 | ) | | | 11.70 | | | | (.62 | ) | | | 9 | | | | .57 | | | | .47 | | | | 1.31 | |
| 12/31/2020 | | | 12.37 | | | | .10 | | | | 1.12 | | | | 1.22 | | | | (.25 | ) | | | (.27 | ) | | | (.52 | ) | | | 13.07 | | | | 9.91 | | | | 10 | | | | .57 | | | | .57 | | | | .78 | |
| 12/31/2019 | | | 11.97 | | | | .23 | | | | .43 | | | | .66 | | | | (.26 | ) | | | — | | | | (.26 | ) | | | 12.37 | | | | 5.49 | | | | 9 | | | | .55 | | | | .55 | | | | 1.88 | |
| 12/31/2018 | | | 12.11 | | | | .22 | | | | (.14 | ) | | | .08 | | | | (.22 | ) | | | — | | | | (.22 | ) | | | 11.97 | | | | .71 | | | | 9 | | | | .54 | | | | .54 | | | | 1.84 | |
| 12/31/2017 | | | 12.07 | | | | .18 | | | | .03 | | | | .21 | | | | (.17 | ) | | | — | | | | (.17 | ) | | | 12.11 | | | | 1.72 | | | | 10 | | | | .54 | | | | .54 | | | | 1.50 | |
| Class 4: | | | | | | | | | | | | | | | | | | | | | | | | | | | | | | | | | | | | | | | | | | | | | | | | | | | | |
| 6/30/20224,5 | | | 11.52 | | | | .12 | | | | (.97 | ) | | | (.85 | ) | | | (.04 | ) | | | — | | | | (.04 | ) | | | 10.63 | | | | (7.35 | )6 | | | 204 | | | | .87 | 7 | | | .73 | 7 | | | 2.22 | 7 |
| 12/31/2021 | | | 12.88 | | | | .12 | | | | (.25 | ) | | | (.13 | ) | | | (.12 | ) | | | (1.11 | ) | | | (1.23 | ) | | | 11.52 | | | | (.88 | ) | | | 238 | | | | .89 | | | | .79 | | | | .98 | |
| 12/31/2020 | | | 12.22 | | | | .05 | | | | 1.10 | | | | 1.15 | | | | (.22 | ) | | | (.27 | ) | | | (.49 | ) | | | 12.88 | | | | 9.48 | | | | 272 | | | | .89 | | | | .89 | | | | .42 | |
| 12/31/2019 | | | 11.84 | | | | .19 | | | | .42 | | | | .61 | | | | (.23 | ) | | | — | | | | (.23 | ) | | | 12.22 | | | | 5.14 | | | | 124 | | | | .87 | | | | .87 | | | | 1.56 | |
| 12/31/2018 | | | 11.98 | | | | .18 | | | | (.12 | ) | | | .06 | | | | (.20 | ) | | | — | | | | (.20 | ) | | | 11.84 | | | | .50 | | | | 91 | | | | .86 | | | | .86 | | | | 1.53 | |
| 12/31/2017 | | | 11.96 | | | | .14 | | | | .01 | | | | .15 | | | | (.13 | ) | | | — | | | | (.13 | ) | | | 11.98 | | | | 1.28 | | | | 62 | | | | .86 | | | | .86 | | | | 1.18 | |
Refer to the end of the tables for footnotes.
| American Funds Insurance Series | 341 |
Financial highlights (continued)
| | | | | | (Loss) income from
investment operations1 | | | Dividends and distributions | | | | | | | | | | | | Ratio of
expenses | | | Ratio of
expenses | | | | | | | |
| Year ended | | Net asset
value,
beginning
of year | | | Net
investment
(loss)
income | | | Net (losses)
gains on
securities
(both
realized and
unrealized) | | | Total from
investment
operations | | | Dividends
(from net
investment
income) | | | Distributions
(from capital
gains) | | | Total
dividends
and
distributions | | | Net asset
value, end
of year | | | Total return2 | | | Net assets,
end of year
(in millions) | | | to average
net assets
before
waivers/
reimburse-
ments12 | | | to average
net assets
after
waivers/
reimburse-
ments2,12 | | | Net
effective
expense
ratio2,5,13 | | | Ratio of
net (loss)
income
to average
net assets2 | |
| | | | | | | | | | | | | | | | | | | | | | | | | | | | | | | | | | | | | | | | | | | |
| Managed Risk Growth Fund | | | | | | | | | | | | | | | | | | | | | | |
| | | | | | | | | | | | | | | | | | | | | | | |
| Class P1: | | | | | | | | | | | | | | | | | | | | | | | | | | | | | | | | | | | | | | | | | | | | | | | | | | | | | | | | |
| 6/30/20224,5 | | $ | 18.53 | | | $ | — | 9 | | $ | (4.04 | ) | | $ | (4.04 | ) | | $ | (.06 | ) | | $ | (2.54 | ) | | $ | (2.60 | ) | | $ | 11.89 | | | | (22.20 | )%6 | | $ | 9 | | | | .41 | %7 | | | .36 | %7 | | | .68 | %7 | | | (.02 | )%7 |
| 12/31/2021 | | | 17.25 | | | | .04 | | | | 2.16 | | | | 2.20 | | | | (.18 | ) | | | (.74 | ) | | | (.92 | ) | | | 18.53 | | | | 13.08 | | | | 13 | | | | .41 | | | | .36 | | | | .69 | | | | .19 | |
| 12/31/2020 | | | 13.78 | | | | .07 | | | | 4.20 | | | | 4.27 | | | | (.12 | ) | | | (.68 | ) | | | (.80 | ) | | | 17.25 | | | | 32.45 | | | | 11 | | | | .42 | | | | .37 | | | | .72 | | | | .49 | |
| 12/31/2019 | | | 12.30 | | | | .15 | | | | 2.44 | | | | 2.59 | | | | (.19 | ) | | | (.92 | ) | | | (1.11 | ) | | | 13.78 | | | | 22.01 | | | | 6 | | | | .42 | | | | .37 | | | | .73 | | | | 1.19 | |
| 12/31/2018 | | | 13.22 | | | | .11 | | | | (.04 | ) | | | .07 | | | | (.10 | ) | | | (.89 | ) | | | (.99 | ) | | | 12.30 | | | | (.04 | )14 | | | 3 | | | | .42 | 14 | | | .37 | 14 | | | .71 | 14 | | | .82 | 14 |
| 12/31/2017 | | | 10.71 | | | | .08 | | | | 2.70 | | | | 2.78 | | | | (.07 | ) | | | (.20 | ) | | | (.27 | ) | | | 13.22 | | | | 26.23 | 14 | | | 2 | | | | .42 | 14 | | | .36 | 14 | | | .70 | 14 | | | .69 | 14 |
| Class P2: | | | | | | | | | | | | | | | | | | | | | | | | | | | | | | | | | | | | | | | | | | | | | | | | | | | | | | | | |
| 6/30/20224,5 | | | 18.42 | | | | (.02 | ) | | | (4.01 | ) | | | (4.03 | ) | | | (.06 | ) | | | (2.54 | ) | | | (2.60 | ) | | | 11.79 | | | | (22.32 | )6 | | | 462 | | | | .66 | 7 | | | .61 | 7 | | | .93 | 7 | | | (.28 | )7 |
| 12/31/2021 | | | 17.11 | | | | (.01 | ) | | | 2.16 | | | | 2.15 | | | | (.10 | ) | | | (.74 | ) | | | (.84 | ) | | | 18.42 | | | | 12.89 | | | | 584 | | | | .67 | | | | .62 | | | | .95 | | | | (.07 | ) |
| 12/31/2020 | | | 13.71 | | | | .03 | | | | 4.16 | | | | 4.19 | | | | (.11 | ) | | | (.68 | ) | | | (.79 | ) | | | 17.11 | | | | 32.03 | | | | 554 | | | | .67 | | | | .62 | | | | .97 | | | | .20 | |
| 12/31/2019 | | | 12.21 | | | | .09 | | | | 2.45 | | | | 2.54 | | | | (.12 | ) | | | (.92 | ) | | | (1.04 | ) | | | 13.71 | | | | 21.74 | | | | 434 | | | | .68 | | | | .63 | | | | .99 | | | | .73 | |
| 12/31/2018 | | | 13.14 | | | | .06 | | | | (.04 | ) | | | .02 | | | | (.06 | ) | | | (.89 | ) | | | (.95 | ) | | | 12.21 | | | | (.37 | ) | | | 340 | | | | .68 | | | | .63 | | | | .97 | | | | .46 | |
| 12/31/2017 | | | 10.64 | | | | .04 | | | | 2.70 | | | | 2.74 | | | | (.04 | ) | | | (.20 | ) | | | (.24 | ) | | | 13.14 | | | | 25.99 | | | | 286 | | | | .69 | | | | .63 | | | | .97 | | | | .34 | |
| | | | | | | | | | | | | | | | | | | | | | | | | | | | | | | | | | | | | | | | | | | | | | | | | | | | | | | | | |
| Managed Risk International Fund | | | | | | | | | | | | | | | | | | | | | | | | | | | | | | | | | | | | |
| | | | | | | | | | | | | | | | | | | | | | | | | | | | | | | | | | | | | | | | | | | | | | | | | | | | | | | | | |
| Class P1: | | | | | | | | | | | | | | | | | | | | | | | | | | | | | | | | | | | | | | | | | | | | | | | | | | | | | | | | |
| 6/30/20224,5 | | $ | 10.55 | | | $ | .03 | | | $ | (1.67 | ) | | $ | (1.64 | ) | | $ | (.26 | ) | | $ | — | | | $ | (.26 | ) | | $ | 8.65 | | | | (15.68 | )%6,14 | | $ | 2 | | | | .42 | %7,14 | | | .37 | %7,14 | | | .87 | %7,14 | | | .60 | %7,14 |
| 12/31/2021 | | | 11.07 | | | | .24 | | | | (.67 | ) | | | (.43 | ) | | | (.09 | ) | | | — | | | | (.09 | ) | | | 10.55 | | | | (3.92 | )14 | | | 2 | | | | .44 | 14 | | | .36 | 14 | | | .87 | 14 | | | 2.12 | 14 |
| 12/31/2020 | | | 11.01 | | | | .08 | | | | .22 | | | | .30 | | | | (.16 | ) | | | (.08 | ) | | | (.24 | ) | | | 11.07 | | | | 3.13 | 14 | | | 2 | | | | .43 | 14 | | | .35 | 14 | | | .86 | 14 | | | .82 | 14 |
| 12/31/2019 | | | 9.82 | | | | .17 | | | | 1.54 | | | | 1.71 | | | | (.20 | ) | | | (.32 | ) | | | (.52 | ) | | | 11.01 | | | | 17.91 | 14 | | | 1 | | | | .41 | 14 | | | .33 | 14 | | | .84 | 14 | | | 1.64 | 14 |
| 12/31/2018 | | | 11.25 | | | | .32 | | | | (1.44 | ) | | | (1.12 | ) | | | (.26 | ) | | | (.05 | ) | | | (.31 | ) | | | 9.82 | | | | (10.11 | )14 | | | — | 10 | | | .33 | 14 | | | .28 | 14 | | | .77 | 14 | | | 3.02 | 14 |
| 12/31/2017 | | | 8.89 | | | | .11 | | | | 2.47 | | | | 2.58 | | | | (.10 | ) | | | (.12 | ) | | | (.22 | ) | | | 11.25 | | | | 29.28 | 14 | | | — | 10 | | | .28 | 14 | | | .20 | 14 | | | .69 | 14 | | | 1.13 | 14 |
| Class P2: | | | | | | | | | | | | | | | | | | | | | | | | | | | | | | | | | | | | | | | | | | | | | | | | | | | | | | | | |
| 6/30/20224,5 | | | 10.48 | | | | .01 | | | | (1.66 | ) | | | (1.65 | ) | | | (.22 | ) | | | — | | | | (.22 | ) | | | 8.61 | | | | (15.83 | )6 | | | 131 | | | | .69 | 7 | | | .64 | 7 | | | 1.14 | 7 | | | .27 | 7 |
| 12/31/2021 | | | 10.99 | | | | .20 | | | | (.65 | ) | | | (.45 | ) | | | (.06 | ) | | | — | | | | (.06 | ) | | | 10.48 | | | | (4.13 | ) | | | 160 | | | | .71 | | | | .63 | | | | 1.14 | | | | 1.79 | |
| 12/31/2020 | | | 10.92 | | | | .04 | | | | .23 | | | | .27 | | | | (.12 | ) | | | (.08 | ) | | | (.20 | ) | | | 10.99 | | | | 2.80 | | | | 168 | | | | .71 | | | | .63 | | | | 1.14 | | | | .42 | |
| 12/31/2019 | | | 9.76 | | | | .13 | | | | 1.55 | | | | 1.68 | | | | (.20 | ) | | | (.32 | ) | | | (.52 | ) | | | 10.92 | | | | 17.64 | | | | 165 | | | | .71 | | | | .63 | | | | 1.14 | | | | 1.21 | |
| 12/31/2018 | | | 11.15 | | | | .16 | | | | (1.32 | ) | | | (1.16 | ) | | | (.18 | ) | | | (.05 | ) | | | (.23 | ) | | | 9.76 | | | | (10.50 | ) | | | 151 | | | | .69 | | | | .64 | | | | 1.13 | | | | 1.49 | |
| 12/31/2017 | | | 8.83 | | | | .11 | | | | 2.41 | | | | 2.52 | | | | (.08 | ) | | | (.12 | ) | | | (.20 | ) | | | 11.15 | | | | 28.69 | | | | 148 | | | | .71 | | | | .63 | | | | 1.12 | | | | 1.03 | |
| | | | | | | | | | | | | | | | | | | | | | | | | | | | | | | | | | | | | | | | | | |
| Managed Risk Washington Mutual Investors Fund | | | | | | | | | | | | | | | | | | | | | | | | | | | | | | | | | | | | | | | | | |
| | | | | | | | | | | | | | | | | | | | | | | | | | | | | | | | | | | | | | | | | | |
| Class P1: | | | | | | | | | | | | | | | | | | | | | | | | | | | | | | | | | | | | | | | | | | | | | | | | | | | | | | | | |
| 6/30/20224,5 | | $ | 12.95 | | | $ | .04 | | | $ | (1.26 | ) | | $ | (1.22 | ) | | $ | (.15 | ) | | $ | — | | | $ | (.15 | ) | | $ | 11.58 | | | | (9.45 | )%6,14 | | $ | 3 | | | | .40 | %7,14 | | | .35 | %7,14 | | | .74 | %7,14 | | | .60 | %7,14 |
| 12/31/2021 | | | 11.24 | | | | .16 | | | | 1.79 | | | | 1.95 | | | | (.24 | ) | | | — | | | | (.24 | ) | | | 12.95 | | | | 17.46 | 14 | | | 2 | | | | .41 | 14 | | | .36 | 14 | | | .77 | 14 | | | 1.33 | 14 |
| 12/31/2020 | | | 12.01 | | | | .18 | | | | (.35 | ) | | | (.17 | ) | | | (.26 | ) | | | (.34 | ) | | | (.60 | ) | | | 11.24 | | | | (.93 | )14 | | | 2 | | | | .40 | 14 | | | .35 | 14 | | | .76 | 14 | | | 1.66 | 14 |
| 12/31/2019 | | | 11.28 | | | | .25 | | | | 1.28 | | | | 1.53 | | | | (.20 | ) | | | (.60 | ) | | | (.80 | ) | | | 12.01 | | | | 14.14 | 14 | | | 1 | | | | .38 | 14 | | | .33 | 14 | | | .74 | 14 | | | 2.14 | 14 |
| 12/31/2018 | | | 13.04 | | | | .40 | | | | (1.27 | ) | | | (.87 | ) | | | (.45 | ) | | | (.44 | ) | | | (.89 | ) | | | 11.28 | | | | (6.99 | )14 | | | — | 10 | | | .33 | 14 | | | .28 | 14 | | | .67 | 14 | | | 3.21 | 14 |
| 12/31/2017 | | | 11.67 | | | | .19 | | | | 1.59 | | | | 1.78 | | | | (.22 | ) | | | (.19 | ) | | | (.41 | ) | | | 13.04 | | | | 15.48 | 14 | | | — | 10 | | | .30 | 14 | | | .25 | 14 | | | .64 | 14 | | | 1.59 | 14 |
| Class P2: | | | | | | | | | | | | | | | | | | | | | | | | | | | | | | | | | | | | | | | | | | | | | | | | | | | | | | | | |
| 6/30/20224,5 | | | 12.88 | | | | .02 | | | | (1.25 | ) | | | (1.23 | ) | | | (.14 | ) | | | — | | | | (.14 | ) | | | 11.51 | | | | (9.56 | )6 | | | 319 | | | | .67 | 7 | | | .62 | 7 | | | 1.01 | 7 | | | .25 | 7 |
| 12/31/2021 | | | 11.18 | | | | .11 | | | | 1.79 | | | | 1.90 | | | | (.20 | ) | | | — | | | | (.20 | ) | | | 12.88 | | | | 17.11 | | | | 371 | | | | .68 | | | | .62 | | | | 1.03 | | | | .91 | |
| 12/31/2020 | | | 11.91 | | | | .13 | | | | (.33 | ) | | | (.20 | ) | | | (.19 | ) | | | (.34 | ) | | | (.53 | ) | | | 11.18 | | | | (1.25 | ) | | | 355 | | | | .68 | | | | .63 | | | | 1.04 | | | | 1.18 | |
| 12/31/2019 | | | 11.21 | | | | .18 | | | | 1.31 | | | | 1.49 | | | | (.19 | ) | | | (.60 | ) | | | (.79 | ) | | | 11.91 | | | | 13.88 | | | | 365 | | | | .68 | | | | .63 | | | | 1.04 | | | | 1.62 | |
| 12/31/2018 | | | 12.96 | | | | .19 | | | | (1.10 | ) | | | (.91 | ) | | | (.40 | ) | | | (.44 | ) | | | (.84 | ) | | | 11.21 | | | | (7.38 | ) | | | 336 | | | | .68 | | | | .63 | | | | 1.02 | | | | 1.49 | |
| 12/31/2017 | | | 11.61 | | | | .17 | | | | 1.55 | | | | 1.72 | | | | (.18 | ) | | | (.19 | ) | | | (.37 | ) | | | 12.96 | | | | 15.03 | | | | 367 | | | | .68 | | | | .63 | | | | 1.02 | | | | 1.43 | |
Refer to the end of the tables for footnotes.
| 342 | American Funds Insurance Series |
Financial highlights (continued)
| | | | | | (Loss) income from
investment operations1 | | | Dividends and distributions | | | | | | | | | | | | Ratio of
expenses | | | Ratio of
expenses | | | | | | | |
| Year ended | | Net asset
value,
beginning
of year | | | Net
investment
(loss)
income | | | Net (losses)
gains on
securities
(both
realized and
unrealized) | | | Total from
investment
operations | | | Dividends
(from net
investment
income) | | | Distributions
(from capital
gains) | | | Total
dividends
and
distributions | | | Net asset
value, end
of year | | | Total return2 | | | Net assets,
end of year
(in millions) | | | to average
net assets
before
waivers/
reimburse-
ments12 | | | to average
net assets
after
waivers/
reimburse-
ments2,12 | | | Net
effective
expense
ratio2,5,13 | | | Ratio of
net (loss)
income
to average
net assets2 | |
| | | | | | | | | | | | | | | | | | | | | | | | | | | | | | | | | | | | | | | | | | | | | | | | | | | | | | | | | |
| Managed Risk Growth-Income Fund | | | | | | | | | | | | | | | | | | | | | | | | | | | | | | | | | | | | |
| | | | | | | | | | | | | | | | | | | | | | | | | | | | | | | | | | | | | | | | | | | | | | | | | | | | | | | | | |
| Class P1: | | | | | | | | | | | | | | | | | | | | | | | | | | | | | | | | | | | | | | | | | | | | | | | | | | | | | | | | |
| 6/30/20224,5 | | $ | 15.73 | | | $ | .02 | | | $ | (2.50 | ) | | $ | (2.48 | ) | | $ | (.14 | ) | | $ | (.31 | ) | | $ | (.45 | ) | | $ | 12.80 | | | | (15.87 | )%6 | | $ | 1,905 | | | | .41 | %7 | | | .36 | %7 | | | .64 | %7 | | | .30 | %7 |
| 12/31/2021 | | | 14.01 | | | | .14 | | | | 1.99 | | | | 2.13 | | | | (.21 | ) | | | (.20 | ) | | | (.41 | ) | | | 15.73 | | | | 15.32 | | | | 2,328 | | | | .41 | | | | .36 | | | | .66 | | | | .96 | |
| 12/31/2020 | | | 13.76 | | | | .17 | | | | 1.08 | | | | 1.25 | | | | (.26 | ) | | | (.74 | ) | | | (1.00 | ) | | | 14.01 | | | | 9.85 | | | | 2,120 | | | | .41 | | | | .36 | | | | .66 | | | | 1.24 | |
| 12/31/2019 | | | 11.73 | | | | .22 | | | | 2.01 | | | | 2.23 | | | | (.10 | ) | | | (.10 | ) | | | (.20 | ) | | | 13.76 | | | | 19.14 | | | | 1,987 | | | | .42 | | | | .37 | | | | .67 | | | | 1.71 | |
| 12/31/2018 | | | 12.66 | | | | (.02 | ) | | | (.15 | ) | | | (.17 | ) | | | (.19 | ) | | | (.57 | ) | | | (.76 | ) | | | 11.73 | | | | (1.66 | ) | | | 1,662 | | | | .40 | | | | .35 | | | | .64 | | | | (.20 | ) |
| 12/31/2017 | | | 11.07 | | | | .19 | | | | 2.03 | | | | 2.22 | | | | (.13 | ) | | | (.50 | ) | | | (.63 | ) | | | 12.66 | | | | 20.64 | 14 | | | 2 | | | | .44 | 14 | | | .37 | 14 | | | .66 | 14 | | | 1.61 | 14 |
| Class P2: | | | | | | | | | | | | | | | | | | | | | | | | | | | | | | | | | | | | | | | | | | | | | | | | | | | | | | | | |
| 6/30/20224,5 | | | 15.64 | | | | — | 9 | | | (2.49 | ) | | | (2.49 | ) | | | (.13 | ) | | | (.31 | ) | | | (.44 | ) | | | 12.71 | | | | (16.01 | )6 | | | 277 | | | | .66 | 7 | | | .61 | 7 | | | .89 | 7 | | | .04 | 7 |
| 12/31/2021 | | | 13.93 | | | | .10 | | | | 1.98 | | | | 2.08 | | | | (.17 | ) | | | (.20 | ) | | | (.37 | ) | | | 15.64 | | | | 15.05 | | | | 340 | | | | .66 | | | | .61 | | | | .91 | | | | .70 | |
| 12/31/2020 | | | 13.69 | | | | .14 | | | | 1.07 | | | | 1.21 | | | | (.23 | ) | | | (.74 | ) | | | (.97 | ) | | | 13.93 | | | | 9.58 | | | | 315 | | | | .66 | | | | .61 | | | | .91 | | | | 1.02 | |
| 12/31/2019 | | | 11.67 | | | | .19 | | | | 2.00 | | | | 2.19 | | | | (.07 | ) | | | (.10 | ) | | | (.17 | ) | | | 13.69 | | | | 18.84 | | | | 283 | | | | .67 | | | | .62 | | | | .92 | | | | 1.47 | |
| 12/31/2018 | | | 12.58 | | | | .16 | | | | (.36 | ) | | | (.20 | ) | | | (.14 | ) | | | (.57 | ) | | | (.71 | ) | | | 11.67 | | | | (1.97 | ) | | | 230 | | | | .69 | | | | .64 | | | | .93 | | | | 1.25 | |
| 12/31/2017 | | | 11.02 | | | | .13 | | | | 2.05 | | | | 2.18 | | | | (.12 | ) | | | (.50 | ) | | | (.62 | ) | | | 12.58 | | | | 20.40 | | | | 206 | | | | .70 | | | | .63 | | | | .92 | | | | 1.08 | |
| | | | | | | | | | | | | | | | | | | | | | | | | | | | | | | | | | | | | | | | | | | | | | | | | | | | | | | | | |
| Managed Risk Asset Allocation Fund | | | | | | | | | | | | | | | | | | | | | | | | | | | | | | | | | | | | |
| | | | | | | | | | | | | | | | | | | | | | | | | | | | | | | | | | | | | | | | | | | | | | | | | | | | | | | | | |
| Class P1: | | | | | | | | | | | | | | | | | | | | | | | | | | | | | | | | | | | | | | | | | | | | | | | | | | | | | | | | |
| 6/30/20224,5 | | $ | 15.33 | | | $ | .03 | | | $ | (2.22 | ) | | $ | (2.19 | ) | | $ | (.20 | ) | | $ | (.48 | ) | | $ | (.68 | ) | | $ | 12.46 | | | | (14.40 | )%6 | | $ | 7 | | | | .41 | %7 | | | .36 | %7 | | | .64 | %7 | | | .48 | %7 |
| 12/31/2021 | | | 13.84 | | | | .21 | | | | 1.55 | | | | 1.76 | | | | (.27 | ) | | | — | | | | (.27 | ) | | | 15.33 | | | | 12.82 | | | | 7 | | | | .41 | | | | .36 | | | | .66 | | | | 1.43 | |
| 12/31/2020 | | | 13.81 | | | | .25 | | | | .51 | | | | .76 | | | | (.21 | ) | | | (.52 | ) | | | (.73 | ) | | | 13.84 | | | | 6.10 | | | | 5 | | | | .41 | | | | .36 | | | | .66 | | | | 1.91 | |
| 12/31/2019 | | | 12.23 | | | | .26 | | | | 1.92 | | | | 2.18 | | | | (.03 | ) | | | (.57 | ) | | | (.60 | ) | | | 13.81 | | | | 18.25 | | | | 2 | | | | .41 | | | | .36 | | | | .65 | | | | 2.01 | |
| 12/31/2018 | | | 13.59 | | | | .22 | | | | (.80 | ) | | | (.58 | ) | | | (.25 | ) | | | (.53 | ) | | | (.78 | ) | | | 12.23 | | | | (4.63 | ) | | | 2 | | | | .37 | | | | .32 | | | | .59 | | | | 1.67 | |
| 12/31/2017 | | | 12.02 | | | | .19 | | | | 1.60 | | | | 1.79 | | | | (.10 | ) | | | (.12 | ) | | | (.22 | ) | | | 13.59 | | | | 15.06 | | | | 1,656 | | | | .43 | | | | .38 | | | | .66 | | | | 1.45 | |
| Class P2: | | | | | | | | | | | | | | | | | | | | | | | | | | | | | | | | | | | | | | | | | | | | | | | | | | | | | | | | |
| 6/30/20224,5 | | | 14.93 | | | | .01 | | | | (2.16 | ) | | | (2.15 | ) | | | (.19 | ) | | | (.48 | ) | | | (.67 | ) | | | 12.11 | | | | (14.50 | )6 | | | 2,285 | | | | .66 | 7 | | | .61 | 7 | | | .89 | 7 | | | .20 | 7 |
| 12/31/2021 | | | 13.45 | | | | .15 | | | | 1.53 | | | | 1.68 | | | | (.20 | ) | | | — | | | | (.20 | ) | | | 14.93 | | | | 12.50 | | | | 2,812 | | | | .66 | | | | .61 | | | | .91 | | | | 1.03 | |
| 12/31/2020 | | | 13.46 | | | | .15 | | | | .56 | | | | .71 | | | | (.20 | ) | | | (.52 | ) | | | (.72 | ) | | | 13.45 | | | | 5.88 | | | | 2,773 | | | | .66 | | | | .61 | | | | .91 | | | | 1.15 | |
| 12/31/2019 | | | 12.22 | | | | .19 | | | | 1.93 | | | | 2.12 | | | | (.31 | ) | | | (.57 | ) | | | (.88 | ) | | | 13.46 | | | | 17.98 | | | | 2,830 | | | | .66 | | | | .61 | | | | .90 | | | | 1.51 | |
| 12/31/2018 | | | 13.55 | | | | .17 | | | | (.79 | ) | | | (.62 | ) | | | (.18 | ) | | | (.53 | ) | | | (.71 | ) | | | 12.22 | | | | (4.89 | ) | | | 2,541 | | | | .62 | | | | .57 | | | | .84 | | | | 1.27 | |
| 12/31/2017 | | | 12.01 | | | | .15 | | | | 1.61 | | | | 1.76 | | | | (.10 | ) | | | (.12 | ) | | | (.22 | ) | | | 13.55 | | | | 14.80 | | | | 2,798 | | | | .68 | | | | .63 | | | | .91 | | | | 1.13 | |
Refer to the end of the tables for footnotes.
| American Funds Insurance Series | 343 |
Financial highlights (continued)
| Portfolio turnover rate for all share classes | | Six months ended | | Year ended December 31, |
| excluding mortgage dollar roll transactions15,16 | | June 30, 20224,5,6 | | 2021 | | | 2020 | | | 2019 | | | 2018 | | | 2017 | |
| Capital Income Builder | | | 24 | % | | | 60 | % | | | 110 | % | | | 44 | % | | | 42 | % | | | 59 | % |
| Asset Allocation Fund | | | 20 | | | | 45 | | | | 49 | | | | 47 | | | | 34 | | | | 39 | |
| American Funds Global Balanced Fund | | | 86 | | | | 36 | | | | 68 | | | | 60 | | | | 30 | | | | 28 | |
| The Bond Fund of America | | | 39 | | | | 87 | | | | 72 | | | | 146 | | | | 98 | | | | 153 | |
| Capital World Bond Fund | | | 45 | | | | 64 | | | | 88 | | | | 110 | | | | 78 | | | | 74 | |
| American Funds Mortgage Fund | | | 16 | | | | 38 | | | | 123 | | | | 84 | | | | 60 | | | | 98 | |
| U.S. Government Securities Fund | | | 31 | | | | 126 | | | | 112 | | | | 103 | | | | 76 | | | | 120 | |
| | | | | | | | | | | | | | | | | | | | | | | | | |
| Portfolio turnover rate for all share classes | | Six months ended | | Year ended December 31, |
| including mortgage dollar roll transactions15,16 | | June 30, 20224,5,6 | | 2021 | | | 2020 | | | 2019 | | | 2018 | | | 2017 | |
| Global Growth Fund | | | 15 | % | | | 18 | % | | | 17 | % | | | 14 | % | | | 25 | % | | | 31 | % |
| Global Small Capitalization Fund | | | 21 | | | | 29 | | | | 38 | | | | 50 | | | | 43 | | | | 33 | |
| Growth Fund | | | 14 | | | | 25 | | | | 32 | | | | 21 | | | | 35 | | | | 24 | |
| International Fund | | | 20 | | | | 44 | | | | 40 | | | | 32 | | | | 29 | | | | 29 | |
| New World Fund | | | 20 | | | | 43 | | | | 70 | | | | 38 | | | | 58 | | | | 56 | |
| Washington Mutual Investors Fund | | | 15 | | | | 90 | | | | 40 | | | | 37 | | | | 49 | | | | 34 | |
| Capital World Growth and Income Fund | | | 22 | | | | 85 | | | | 36 | | | | 29 | | | | 49 | | | | 41 | |
| Growth-Income Fund | | | 16 | | | | 24 | | | | 33 | | | | 27 | | | | 39 | | | | 27 | |
| International Growth and Income Fund | | | 26 | | | | 41 | | | | 56 | | | | 28 | | | | 38 | | | | 51 | |
| Capital Income Builder | | | 51 | | | | 93 | | | | 184 | | | | 72 | | | | 98 | | | | 88 | |
| Asset Allocation Fund | | | 54 | | | | 124 | | | | 145 | | | | 79 | | | | 86 | | | | 85 | |
| American Funds Global Balanced Fund | | | 92 | | | | 39 | | | | 86 | | | | 74 | | | | 51 | | | | 41 | |
| The Bond Fund of America | | | 190 | | | | 456 | | | | 461 | | | | 373 | | | | 514 | | | | 502 | |
| Capital World Bond Fund | | | 72 | | | | 91 | | | | 145 | | | | 159 | | | | 125 | | | | 105 | |
| American High-Income Trust | | | 21 | | | | 56 | | | | 78 | | | | 58 | | | | 67 | | | | 78 | |
| American Funds Mortgage Fund | | | 634 | | | | 975 | | | | 1143 | | | | 350 | | | | 811 | | | | 680 | |
| Ultra-Short Bond Fund | | | — | 17 | | | — | 17 | | | — | 17 | | | — | 17 | | | — | 17 | | | — | 17 |
| U.S. Government Securities Fund | | | 297 | | | | 433 | | | | 867 | | | | 277 | | | | 446 | | | | 551 | |
| Managed Risk Growth Fund | | | 45 | | | | 32 | | | | 80 | | | | 10 | | | | 7 | | | | 25 | |
| Managed Risk International Fund | | | 37 | | | | 24 | | | | 71 | | | | 8 | | | | 8 | | | | 25 | |
| Managed Risk Washington Mutual Investors Fund | | | 36 | | | | 16 | | | | 101 | | | | 13 | | | | 11 | | | | 32 | |
| Managed Risk Growth-Income Fund | | | 33 | | | | 13 | | | | 38 | | | | 6 | | | | 14 | | | | 26 | |
| Managed Risk Asset Allocation Fund | | | 23 | | | | 5 | | | | 30 | | | | 8 | | | | 12 | | | | 1 | |
| 1 | | Based on average shares outstanding. |
| 2 | | This column reflects the impact of certain waivers/reimbursements from CRMC. During some of the years shown, CRMC waived a portion of investment advisory services fees on some funds, including each of the managed risk funds. In addition, during some of the years shown, CRMC reimbursed a portion of miscellaneous fees and expenses for some of the managed risk funds. |
| 3 | | Ratios do not include expenses of any Central Funds. The fund indirectly bears its proportionate share of the expenses of any Central Funds, if applicable. |
| 4 | | Based on operations for a period that is less than a full year. |
| 5 | | Unaudited. |
| 6 | | Not annualized. |
| 7 | | Annualized. |
| 8 | | Class 1A shares began investment operations on January 6, 2017. |
| 9 | | Amount less than $.01. |
| 10 | | Amount less than $1 million. |
| 11 | | Amount less than .01%. |
| 12 | | This column does not include expenses of the underlying funds in which each fund invests. |
| 13 | | This column reflects the net effective expense ratios for each fund and class, which include each class’s expense ratio combined with the weighted average net expense ratio of the underlying funds for the periods presented. Refer to the expense example for further information regarding fees and expenses. |
| 14 | | All or a significant portion of assets in this class consisted of seed capital invested by CRMC and/or its affiliates. Certain fees (including, where applicable, fees for distribution services) are not charged or accrued on these seed capital assets. If such fees were paid by the fund on seed capital assets, fund expenses would have been higher and net income and total return would have been lower. |
| 15 | | Refer to Note 5 for further information on mortgage dollar rolls. |
| 16 | | Rates do not include the fund’s portfolio activity with respect to any Central Funds, if applicable. |
| 17 | | Amount is either less than 1% or there is no turnover. |
Refer to the notes to financial statements.
| 344 | American Funds Insurance Series |
The funds in American Funds Insurance Series serve as the underlying investment vehicle for various insurance products. As an owner of an insurance contract that invests in one of the funds in the series, you incur two types of costs: (1) transaction costs, such as initial sales charges on purchase payments and contingent deferred sales charges on redemptions (loads), and (2) ongoing costs, including management fees, distribution and service (12b-1) fees, and other expenses. Additional fees are charged by the insurance companies related to the various benefits they provide. This example is intended to help you understand your ongoing costs (in dollars) of investing in the underlying funds so you can compare these costs with the ongoing costs of investing in other mutual funds that serve a similar function in other annuity products. The example is based on an investment of $1,000 invested at the beginning of the period and held for the entire six-month period (January 1, 2022, through June 30, 2022).
Actual expenses:
The first line of each share class in the tables on the following pages provides information about actual account values and actual expenses. You may use the information in this line, together with the amount you invested, to estimate the expenses that you paid over the period. Simply divide your account value by $1,000 (for example, an $8,600 account value divided by $1,000 = 8.6), then multiply the result by the number in the first line under the heading titled “Expenses paid during period” to estimate the expenses you paid on your account during this period.
Hypothetical example for comparison purposes:
The second line of each share class in the tables on the following pages provides information about hypothetical account values and hypothetical expenses based on the actual expense ratio for the share class and an assumed rate of return of 5.00% per year before expenses, which is not the actual return of the share class. The hypothetical account values and expenses may not be used to estimate the actual ending account balance or expenses you paid for the period. You may use this information to compare the ongoing costs of investing in the fund and other funds. To do so, compare this 5.00% hypothetical example with the 5.00% hypothetical examples that appear in the shareholder reports of the other funds.
Notes:
Additional fees are charged by the insurance companies related to the various benefits they provide. You can estimate the impact of these fees by adding the amount of the fees to the total estimated expenses you paid on your account during the period as calculated above. In addition, your ending account value would be lower by the amount of these fees.
Note that the expenses shown in the tables on the following pages are meant to highlight your ongoing costs only and do not reflect any transactional costs. Therefore, the second line of each share class in the tables is useful in comparing ongoing costs only and will not help you determine the relative total costs of owning different funds. In addition, if these transactional costs were included, your costs would have been higher.
| American Funds Insurance Series | 345 |
Expense example (continued)
| | | Beginning
account value
1/1/2022 | | | Ending
account value
6/30/2022 | | | Expenses
paid during
period1 | | | Annualized
expense
ratio | |
| Global Growth Fund | | | | | | | | | | | | | | | | |
| Class 1 – actual return | | $ | 1,000.00 | | | $ | 721.63 | | | $ | 2.13 | | | | .50 | % |
| Class 1 – assumed 5% return | | | 1,000.00 | | | | 1,022.32 | | | | 2.51 | | | | .50 | |
| Class 1A – actual return | | | 1,000.00 | | | | 720.89 | | | | 3.20 | | | | .75 | |
| Class 1A – assumed 5% return | | | 1,000.00 | | | | 1,021.08 | | | | 3.76 | | | | .75 | |
| Class 2 – actual return | | | 1,000.00 | | | | 720.93 | | | | 3.20 | | | | .75 | |
| Class 2 – assumed 5% return | | | 1,000.00 | | | | 1,021.08 | | | | 3.76 | | | | .75 | |
| Class 4 – actual return | | | 1,000.00 | | | | 720.06 | | | | 4.26 | | | | 1.00 | |
| Class 4 – assumed 5% return | | | 1,000.00 | | | | 1,019.84 | | | | 5.01 | | | | 1.00 | |
| Global Small Capitalization Fund | | | | | | | | | | | | | | | | |
| Class 1 – actual return | | $ | 1,000.00 | | | $ | 680.14 | | | $ | 3.00 | | | | .72 | % |
| Class 1 – assumed 5% return | | | 1,000.00 | | | | 1,021.22 | | | | 3.61 | | | | .72 | |
| Class 1A – actual return | | | 1,000.00 | | | | 679.46 | | | | 4.04 | | | | .97 | |
| Class 1A – assumed 5% return | | | 1,000.00 | | | | 1,019.98 | | | | 4.86 | | | | .97 | |
| Class 2 – actual return | | | 1,000.00 | | | | 679.13 | | | | 4.04 | | | | .97 | |
| Class 2 – assumed 5% return | | | 1,000.00 | | | | 1,019.98 | | | | 4.86 | | | | .97 | |
| Class 4 – actual return | | | 1,000.00 | | | | 678.74 | | | | 5.08 | | | | 1.22 | |
| Class 4 – assumed 5% return | | | 1,000.00 | | | | 1,018.74 | | | | 6.11 | | | | 1.22 | |
| Growth Fund | | | | | | | | | | | | | | | | |
| Class 1 – actual return | | $ | 1,000.00 | | | $ | 701.98 | | | $ | 1.43 | | | | .34 | % |
| Class 1 – assumed 5% return | | | 1,000.00 | | | | 1,023.11 | | | | 1.71 | | | | .34 | |
| Class 1A – actual return | | | 1,000.00 | | | | 701.09 | | | | 2.49 | | | | .59 | |
| Class 1A – assumed 5% return | | | 1,000.00 | | | | 1,021.87 | | | | 2.96 | | | | .59 | |
| Class 2 – actual return | | | 1,000.00 | | | | 701.01 | | | | 2.49 | | | | .59 | |
| Class 2 – assumed 5% return | | | 1,000.00 | | | | 1,021.87 | | | | 2.96 | | | | .59 | |
| Class 3 – actual return | | | 1,000.00 | | | | 701.15 | | | | 2.19 | | | | .52 | |
| Class 3 – assumed 5% return | | | 1,000.00 | | | | 1,022.22 | | | | 2.61 | | | | .52 | |
| Class 4 – actual return | | | 1,000.00 | | | | 700.18 | | | | 3.54 | | | | .84 | |
| Class 4 – assumed 5% return | | | 1,000.00 | | | | 1,020.63 | | | | 4.21 | | | | .84 | |
| International Fund | | | | | | | | | | | | | | | | |
| Class 1 – actual return | | $ | 1,000.00 | | | $ | 774.70 | | | $ | 2.38 | | | | .54 | % |
| Class 1 – assumed 5% return | | | 1,000.00 | | | | 1,022.12 | | | | 2.71 | | | | .54 | |
| Class 1A – actual return | | | 1,000.00 | | | | 773.42 | | | | 3.47 | | | | .79 | |
| Class 1A – assumed 5% return | | | 1,000.00 | | | | 1,020.88 | | | | 3.96 | | | | .79 | |
| Class 2 – actual return | | | 1,000.00 | | | | 773.69 | | | | 3.47 | | | | .79 | |
| Class 2 – assumed 5% return | | | 1,000.00 | | | | 1,020.88 | | | | 3.96 | | | | .79 | |
| Class 3 – actual return | | | 1,000.00 | | | | 773.59 | | | | 3.17 | | | | .72 | |
| Class 3 – assumed 5% return | | | 1,000.00 | | | | 1,021.22 | | | | 3.61 | | | | .72 | |
| Class 4 – actual return | | | 1,000.00 | | | | 772.17 | | | | 4.57 | | | | 1.04 | |
| Class 4 – assumed 5% return | | | 1,000.00 | | | | 1,019.64 | | | | 5.21 | | | | 1.04 | |
| New World Fund | | | | | | | | | | | | | | | | |
| Class 1 – actual return | | $ | 1,000.00 | | | $ | 762.76 | | | $ | 2.49 | | | | .57 | % |
| Class 1 – assumed 5% return | | | 1,000.00 | | | | 1,021.97 | | | | 2.86 | | | | .57 | |
| Class 1A – actual return | | | 1,000.00 | | | | 761.75 | | | | 3.58 | | | | .82 | |
| Class 1A – assumed 5% return | | | 1,000.00 | | | | 1,020.73 | | | | 4.11 | | | | .82 | |
| Class 2 – actual return | | | 1,000.00 | | | | 761.59 | | | | 3.58 | | | | .82 | |
| Class 2 – assumed 5% return | | | 1,000.00 | | | | 1,020.73 | | | | 4.11 | | | | .82 | |
| Class 4 – actual return | | | 1,000.00 | | | | 761.06 | | | | 4.67 | | | | 1.07 | |
| Class 4 – assumed 5% return | | | 1,000.00 | | | | 1,019.49 | | | | 5.36 | | | | 1.07 | |
Refer to the end of the tables for footnotes.
| 346 | American Funds Insurance Series |
Expense example (continued)
| | | Beginning
account value
1/1/2022 | | | Ending
account value
6/30/2022 | | | Expenses
paid during
period1 | | | Annualized
expense
ratio | |
| Washington Mutual Investors Fund | | | | | | | | | | | | | | | | |
| Class 1 – actual return | | $ | 1,000.00 | | | $ | 871.16 | | | $ | 1.21 | | | | .26 | % |
| Class 1 – assumed 5% return | | | 1,000.00 | | | | 1,023.51 | | | | 1.30 | | | | .26 | |
| Class 1A – actual return | | | 1,000.00 | | | | 870.17 | | | | 2.36 | | | | .51 | |
| Class 1A – assumed 5% return | | | 1,000.00 | | | | 1,022.27 | | | | 2.56 | | | | .51 | |
| Class 2 – actual return | | | 1,000.00 | | | | 869.85 | | | | 2.36 | | | | .51 | |
| Class 2 – assumed 5% return | | | 1,000.00 | | | | 1,022.27 | | | | 2.56 | | | | .51 | |
| Class 4 – actual return | | | 1,000.00 | | | | 868.65 | | | | 3.52 | | | | .76 | |
| Class 4 – assumed 5% return | | | 1,000.00 | | | | 1,021.03 | | | | 3.81 | | | | .76 | |
| Capital World Growth and Income Fund | | | | | | | | | | | | | | | |
| Class 1 – actual return | | $ | 1,000.00 | | | $ | 787.96 | | | $ | 1.86 | | | | .42 | % |
| Class 1 – assumed 5% return | | | 1,000.00 | | | | 1,022.71 | | | | 2.11 | | | | .42 | |
| Class 1A – actual return | | | 1,000.00 | | | | 787.16 | | | | 2.97 | | | | .67 | |
| Class 1A – assumed 5% return | | | 1,000.00 | | | | 1,021.47 | | | | 3.36 | | | | .67 | |
| Class 2 – actual return | | | 1,000.00 | | | | 787.04 | | | | 2.97 | | | | .67 | |
| Class 2 – assumed 5% return | | | 1,000.00 | | | | 1,021.47 | | | | 3.36 | | | | .67 | |
| Class 4 – actual return | | | 1,000.00 | | | | 786.00 | | | | 4.07 | | | | .92 | |
| Class 4 – assumed 5% return | | | 1,000.00 | | | | 1,020.23 | | | | 4.61 | | | | .92 | |
| Growth-Income Fund | | | | | | | | | | | | | | | | |
| Class 1 – actual return | | $ | 1,000.00 | | | $ | 803.18 | | | $ | 1.25 | | | | .28 | % |
| Class 1 – assumed 5% return | | | 1,000.00 | | | | 1,023.41 | | | | 1.40 | | | | .28 | |
| Class 1A – actual return | | | 1,000.00 | | | | 802.25 | | | | 2.37 | | | | .53 | |
| Class 1A – assumed 5% return | | | 1,000.00 | | | | 1,022.17 | | | | 2.66 | | | | .53 | |
| Class 2 – actual return | | | 1,000.00 | | | | 802.13 | | | | 2.37 | | | | .53 | |
| Class 2 – assumed 5% return | | | 1,000.00 | | | | 1,022.17 | | | | 2.66 | | | | .53 | |
| Class 3 – actual return | | | 1,000.00 | | | | 802.49 | | | | 2.06 | | | | .46 | |
| Class 3 – assumed 5% return | | | 1,000.00 | | | | 1,022.51 | | | | 2.31 | | | | .46 | |
| Class 4 – actual return | | | 1,000.00 | | | | 801.21 | | | | 3.48 | | | | .78 | |
| Class 4 – assumed 5% return | | | 1,000.00 | | | | 1,020.93 | | | | 3.91 | | | | .78 | |
| International Growth and Income Fund | | | | | | | | | | | | | | | | |
| Class 1 – actual return | | $ | 1,000.00 | | | $ | 810.03 | | | $ | 2.29 | | | | .51 | % |
| Class 1 – assumed 5% return | | | 1,000.00 | | | | 1,022.27 | | | | 2.56 | | | | .51 | |
| Class 1A – actual return | | | 1,000.00 | | | | 808.58 | | | | 3.36 | | | | .75 | |
| Class 1A – assumed 5% return | | | 1,000.00 | | | | 1,021.08 | | | | 3.76 | | | | .75 | |
| Class 2 – actual return | | | 1,000.00 | | | | 808.41 | | | | 3.36 | | | | .75 | |
| Class 2 – assumed 5% return | | | 1,000.00 | | | | 1,021.08 | | | | 3.76 | | | | .75 | |
| Class 4 – actual return | | | 1,000.00 | | | | 807.59 | | | | 4.48 | | | | 1.00 | |
| Class 4 – assumed 5% return | | | 1,000.00 | | | | 1,019.84 | | | | 5.01 | | | | 1.00 | |
| Capital Income Builder | | | | | | | | | | | | | | | | |
| Class 1 – actual return | | $ | 1,000.00 | | | $ | 903.64 | | | $ | 1.23 | | | | .26 | % |
| Class 1 – assumed 5% return | | | 1,000.00 | | | | 1,023.51 | | | | 1.30 | | | | .26 | |
| Class 1A – actual return | | | 1,000.00 | | | | 903.17 | | | | 2.41 | | | | .51 | |
| Class 1A – assumed 5% return | | | 1,000.00 | | | | 1,022.27 | | | | 2.56 | | | | .51 | |
| Class 2 – actual return | | | 1,000.00 | | | | 903.26 | | | | 2.41 | | | | .51 | |
| Class 2 – assumed 5% return | | | 1,000.00 | | | | 1,022.27 | | | | 2.56 | | | | .51 | |
| Class 4 – actual return | | | 1,000.00 | | | | 901.95 | | | | 3.58 | | | | .76 | |
| Class 4 – assumed 5% return | | | 1,000.00 | | | | 1,021.03 | | | | 3.81 | | | | .76 | |
Refer to the end of the tables for footnotes.
| American Funds Insurance Series | 347 |
Expense example (continued)
| | | Beginning
account value
1/1/2022 | | | Ending
account value
6/30/2022 | | | Expenses
paid during
period1 | | | Annualized
expense
ratio | |
| Asset Allocation Fund | | | | | | | | | | | | | | | | |
| Class 1 – actual return | | $ | 1,000.00 | | | $ | 842.19 | | | $ | 1.37 | | | | .30 | % |
| Class 1 – assumed 5% return | | | 1,000.00 | | | | 1,023.31 | | | | 1.51 | | | | .30 | |
| Class 1A – actual return | | | 1,000.00 | | | | 841.23 | | | | 2.51 | | | | .55 | |
| Class 1A – assumed 5% return | | | 1,000.00 | | | | 1,022.07 | | | | 2.76 | | | | .55 | |
| Class 2 – actual return | | | 1,000.00 | | | | 840.91 | | | | 2.51 | | | | .55 | |
| Class 2 – assumed 5% return | | | 1,000.00 | | | | 1,022.07 | | | | 2.76 | | | | .55 | |
| Class 3 – actual return | | | 1,000.00 | | | | 841.06 | | | | 2.19 | | | | .48 | |
| Class 3 – assumed 5% return | | | 1,000.00 | | | | 1,022.41 | | | | 2.41 | | | | .48 | |
| Class 4 – actual return | | | 1,000.00 | | | | 839.89 | | | | 3.65 | | | | .80 | |
| Class 4 – assumed 5% return | | | 1,000.00 | | | | 1,020.83 | | | | 4.01 | | | | .80 | |
| American Funds Global Balanced Fund | | | | | | | | | | | | | | | | |
| Class 1 – actual return | | $ | 1,000.00 | | | $ | 836.93 | | | $ | 2.87 | | | | .63 | % |
| Class 1 – assumed 5% return | | | 1,000.00 | | | | 1,021.67 | | | | 3.16 | | | | .63 | |
| Class 1A – actual return | | | 1,000.00 | | | | 835.23 | | | | 4.05 | | | | .89 | |
| Class 1A – assumed 5% return | | | 1,000.00 | | | | 1,020.38 | | | | 4.46 | | | | .89 | |
| Class 2 – actual return | | | 1,000.00 | | | | 835.91 | | | | 4.05 | | | | .89 | |
| Class 2 – assumed 5% return | | | 1,000.00 | | | | 1,020.38 | | | | 4.46 | | | | .89 | |
| Class 4 – actual return | | | 1,000.00 | | | | 834.67 | | | | 5.14 | | | | 1.13 | |
| Class 4 – assumed 5% return | | | 1,000.00 | | | | 1,019.19 | | | | 5.66 | | | | 1.13 | |
| The Bond Fund of America | | | | | | | | | | | | | | | | |
| Class 1 – actual return | | $ | 1,000.00 | | | $ | 900.38 | | | $ | .94 | | | | .20 | % |
| Class 1 – assumed 5% return | | | 1,000.00 | | | | 1,023.80 | | | | 1.00 | | | | .20 | |
| Class 1A – actual return | | | 1,000.00 | | | | 899.08 | | | | 2.07 | | | | .44 | |
| Class 1A – assumed 5% return | | | 1,000.00 | | | | 1,022.61 | | | | 2.21 | | | | .44 | |
| Class 2 – actual return | | | 1,000.00 | | | | 898.60 | | | | 2.12 | | | | .45 | |
| Class 2 – assumed 5% return | | | 1,000.00 | | | | 1,022.56 | | | | 2.26 | | | | .45 | |
| Class 4 – actual return | | | 1,000.00 | | | | 897.76 | | | | 3.29 | | | | .70 | |
| Class 4 – assumed 5% return | | | 1,000.00 | | | | 1,021.32 | | | | 3.51 | | | | .70 | |
| Capital World Bond Fund | | | | | | | | | | | | | | | | |
| Class 1 – actual return | | $ | 1,000.00 | | | $ | 839.53 | | | $ | 2.14 | | | | .47 | % |
| Class 1 – assumed 5% return | | | 1,000.00 | | | | 1,022.46 | | | | 2.36 | | | | .47 | |
| Class 1A – actual return | | | 1,000.00 | | | | 837.83 | | | | 3.28 | | | | .72 | |
| Class 1A – assumed 5% return | | | 1,000.00 | | | | 1,021.22 | | | | 3.61 | | | | .72 | |
| Class 2 – actual return | | | 1,000.00 | | | | 837.85 | | | | 3.28 | | | | .72 | |
| Class 2 – assumed 5% return | | | 1,000.00 | | | | 1,021.22 | | | | 3.61 | | | | .72 | |
| Class 4 – actual return | | | 1,000.00 | | | | 837.41 | | | | 4.42 | | | | .97 | |
| Class 4 – assumed 5% return | | | 1,000.00 | | | | 1,019.98 | | | | 4.86 | | | | .97 | |
| American High-Income Trust | | | | | | | | | | | | | | | | |
| Class 1 – actual return | | $ | 1,000.00 | | | $ | 875.82 | | | $ | 1.49 | | | | .32 | % |
| Class 1 – assumed 5% return | | | 1,000.00 | | | | 1,023.21 | | | | 1.61 | | | | .32 | |
| Class 1A – actual return | | | 1,000.00 | | | | 873.98 | | | | 2.65 | | | | .57 | |
| Class 1A – assumed 5% return | | | 1,000.00 | | | | 1,021.97 | | | | 2.86 | | | | .57 | |
| Class 2 – actual return | | | 1,000.00 | | | | 874.79 | | | | 2.65 | | | | .57 | |
| Class 2 – assumed 5% return | | | 1,000.00 | | | | 1,021.97 | | | | 2.86 | | | | .57 | |
| Class 3 – actual return | | | 1,000.00 | | | | 874.18 | | | | 2.32 | | | | .50 | |
| Class 3 – assumed 5% return | | | 1,000.00 | | | | 1,022.32 | | | | 2.51 | | | | .50 | |
| Class 4 – actual return | | | 1,000.00 | | | | 873.17 | | | | 3.81 | | | | .82 | |
| Class 4 – assumed 5% return | | | 1,000.00 | | | | 1,020.73 | | | | 4.11 | | | | .82 | |
Refer to the end of the tables for footnotes.
| 348 | American Funds Insurance Series |
Expense example (continued)
| | | Beginning
account value
1/1/2022 | | | Ending
account value
6/30/2022 | | | Expenses
paid during
period1 | | | Annualized
expense
ratio | |
| American Funds Mortgage Fund | | | | | | | | | | | | | | | | |
| Class 1 – actual return | | $ | 1,000.00 | | | $ | 932.26 | | | $ | 1.15 | | | | .24 | % |
| Class 1 – assumed 5% return | | | 1,000.00 | | | | 1,023.60 | | | | 1.20 | | | | .24 | |
| Class 1A – actual return | | | 1,000.00 | | | | 930.57 | | | | 2.39 | | | | .50 | |
| Class 1A – assumed 5% return | | | 1,000.00 | | | | 1,022.32 | | | | 2.51 | | | | .50 | |
| Class 2 – actual return | | | 1,000.00 | | | | 930.65 | | | | 2.39 | | | | .50 | |
| Class 2 – assumed 5% return | | | 1,000.00 | | | | 1,022.32 | | | | 2.51 | | | | .50 | |
| Class 4 – actual return | | | 1,000.00 | | | | 929.47 | | | | 3.59 | | | | .75 | |
| Class 4 – assumed 5% return | | | 1,000.00 | | | | 1,021.08 | | | | 3.76 | | | | .75 | |
| Ultra-Short Bond Fund | | | | | | | | | | | | | | | | |
| Class 1 – actual return | | $ | 1,000.00 | | | $ | 1,000.89 | | | $ | 1.64 | | | | .33 | % |
| Class 1 – assumed 5% return | | | 1,000.00 | | | | 1,023.16 | | | | 1.66 | | | | .33 | |
| Class 1A – actual return | | | 1,000.00 | | | | 999.99 | | | | 1.64 | | | | .33 | |
| Class 1A – assumed 5% return | | | 1,000.00 | | | | 1,023.16 | | | | 1.66 | | | | .33 | |
| Class 2 – actual return | | | 1,000.00 | | | | 999.08 | | | | 2.87 | | | | .58 | |
| Class 2 – assumed 5% return | | | 1,000.00 | | | | 1,021.92 | | | | 2.91 | | | | .58 | |
| Class 3 – actual return | | | 1,000.00 | | | | 999.09 | | | | 2.53 | | | | .51 | |
| Class 3 – assumed 5% return | | | 1,000.00 | | | | 1,022.27 | | | | 2.56 | | | | .51 | |
| Class 4 – actual return | | | 1,000.00 | | | | 998.18 | | | | 4.11 | | | | .83 | |
| Class 4 – assumed 5% return | | | 1,000.00 | | | | 1,020.68 | | | | 4.16 | | | | .83 | |
| U.S. Government Securities Fund | | | | | | | | | | | | | | | | |
| Class 1 – actual return | | $ | 1,000.00 | | | $ | 929.18 | | | $ | 1.10 | | | | .23 | % |
| Class 1 – assumed 5% return | | | 1,000.00 | | | | 1,023.65 | | | | 1.15 | | | | .23 | |
| Class 1A – actual return | | | 1,000.00 | | | | 928.52 | | | | 2.30 | | | | .48 | |
| Class 1A – assumed 5% return | | | 1,000.00 | | | | 1,022.41 | | | | 2.41 | | | | .48 | |
| Class 2 – actual return | | | 1,000.00 | | | | 927.90 | | | | 2.29 | | | | .48 | |
| Class 2 – assumed 5% return | | | 1,000.00 | | | | 1,022.41 | | | | 2.41 | | | | .48 | |
| Class 3 – actual return | | | 1,000.00 | | | | 928.21 | | | | 1.96 | | | | .41 | |
| Class 3 – assumed 5% return | | | 1,000.00 | | | | 1,022.76 | | | | 2.06 | | | | .41 | |
| Class 4 – actual return | | | 1,000.00 | | | | 926.54 | | | | 3.49 | | | | .73 | |
| Class 4 – assumed 5% return | | | 1,000.00 | | | | 1,021.17 | | | | 3.66 | | | | .73 | |
Refer to the end of the tables for footnotes.
| American Funds Insurance Series | 349 |
Expense example (continued)
| | | Beginning
account value
1/1/2022 | | | Ending
account value
6/30/2022 | | | Expenses
paid during
period1,2 | | | Annualized
expense ratio2 | | | Effective
expenses paid
during period3 | | | Effective
annualized
expense ratio4 | |
| Managed Risk Growth Fund | | | | | | | | | | | | | | | | | | | | | | | | |
| Class P1 – actual return | | $ | 1,000.00 | | | $ | 778.05 | | | $ | 1.59 | | | | .36 | % | | $ | 3.00 | | | | .68 | % |
| Class P1 – assumed 5% return | | | 1,000.00 | | | | 1,023.01 | | | | 1.81 | | | | .36 | | | | 3.41 | | | | .68 | |
| Class P2 – actual return | | | 1,000.00 | | | | 776.82 | | | | 2.69 | | | | .61 | | | | 4.10 | | | | .93 | |
| Class P2 – assumed 5% return | | | 1,000.00 | | | | 1,021.77 | | | | 3.06 | | | | .61 | | | | 4.66 | | | | .93 | |
| Managed Risk International Fund | | | | | | | | | | | | | | | | | | | | | |
| Class P1 – actual return | | $ | 1,000.00 | | | $ | 843.21 | | | $ | 1.69 | | | | .37 | % | | $ | 3.98 | | | | .87 | % |
| Class P1 – assumed 5% return | | | 1,000.00 | | | | 1,022.96 | | | | 1.86 | | | | .37 | | | | 4.36 | | | | .87 | |
| Class P2 – actual return | | | 1,000.00 | | | | 841.68 | | | | 2.92 | | | | .64 | | | | 5.21 | | | | 1.14 | |
| Class P2 – assumed 5% return | | | 1,000.00 | | | | 1,021.62 | | | | 3.21 | | | | .64 | | | | 5.71 | | | | 1.14 | |
| Managed Risk Washington Mutual Investors Fund | | | | | | | | | | | | | | | | | |
| Class P1 – actual return | | $ | 1,000.00 | | | $ | 905.49 | | | $ | 1.65 | | | | .35 | % | | $ | 3.50 | | | | .74 | % |
| Class P1 – assumed 5% return | | | 1,000.00 | | | | 1,023.06 | | | | 1.76 | | | | .35 | | | | 3.71 | | | | .74 | |
| Class P2 – actual return | | | 1,000.00 | | | | 904.43 | | | | 2.93 | | | | .62 | | | | 4.77 | | | | 1.01 | |
| Class P2 – assumed 5% return | | | 1,000.00 | | | | 1,021.72 | | | | 3.11 | | | | .62 | | | | 5.06 | | | | 1.01 | |
| Managed Risk Growth-Income Fund | | | | | | | | | | | | | | | | | | | | | |
| Class P1 – actual return | | $ | 1,000.00 | | | $ | 841.25 | | | $ | 1.64 | | | | .36 | % | | $ | 2.92 | | | | .64 | % |
| Class P1 – assumed 5% return | | | 1,000.00 | | | | 1,023.01 | | | | 1.81 | | | | .36 | | | | 3.21 | | | | .64 | |
| Class P2 – actual return | | | 1,000.00 | | | | 839.91 | | | | 2.78 | | | | .61 | | | | 4.06 | | | | .89 | |
| Class P2 – assumed 5% return | | | 1,000.00 | | | | 1,021.77 | | | | 3.06 | | | | .61 | | | | 4.46 | | | | .89 | |
| Managed Risk Asset Allocation Fund | | | | | | | | | | | | | | | | | | | | | |
| Class P1 – actual return | | $ | 1,000.00 | | | $ | 855.99 | | | $ | 1.66 | | | | .36 | % | | $ | 2.95 | | | | .64 | % |
| Class P1 – assumed 5% return | | | 1,000.00 | | | | 1,023.01 | | | | 1.81 | | | | .36 | | | | 3.21 | | | | .64 | |
| Class P2 – actual return | | | 1,000.00 | | | | 855.00 | | | | 2.81 | | | | .61 | | | | 4.09 | | | | .89 | |
| Class P2 – assumed 5% return | | | 1,000.00 | | | | 1,021.77 | | | | 3.06 | | | | .61 | | | | 4.46 | | | | .89 | |
| 1 | The “expenses paid during period” are equal to the “annualized expense ratio,” multiplied by the average account value over the period, multiplied by the number of days in the period, and divided by 365 (to reflect the one-half year period). |
| 2 | The “expenses paid during period” and “annualized expense ratio” do not include the expenses of the underlying funds in which each fund invests. |
| 3 | The “effective expenses paid during period” are equal to the “effective annualized expense ratio,” multiplied by the average account value over the period, multiplied by the number of days in the period, and divided by 365 (to reflect the period). |
| 4 | The “effective annualized expense ratio” reflects the net annualized expense ratio of the class plus the class’s pro-rata share of the weighted average expense ratio of the underlying funds in which it invests. |
| 350 | American Funds Insurance Series |
Approval of Investment Advisory and Service Agreement — American Funds Insurance Series
The series’ board has approved the continuation of the series’ Investment Advisory and Service Agreement (the “agreement”) with Capital Research and Management Company (“CRMC”) for an additional one-year term through April 30, 2023. The agreement was amended to lower the current fee schedule resulting in an overall lower advisory fee for Global Growth Fund, Global Small Capitalization Fund, International Fund, New World Fund, Washington Mutual Investors Fund, Capital World Growth and Income Fund, International Growth and Income Fund, Capital Income Builder, American Funds Global Balanced Fund, The Bond Fund of America, Capital World Bond Fund, American High-Income Trust, American Funds Mortgage Fund, Ultra-Short Bond Fund and U.S. Government Securities Fund and to add additional advisory fee breakpoints for Growth Fund when the fund’s net assets exceed $44 billion, for Growth-Income Fund when the fund’s net assets exceed $44 billion, and for Asset Allocation Fund when the fund’s net assets exceed $34 billion. The board approved the agreement following the recommendation of the series’ Contracts Committee (the “committee”), which is composed of all the series’ independent board members. The board and the committee determined in the exercise of their business judgment that the advisory fee structure for each fund within the series was fair and reasonable in relation to the services provided, and that approving the agreement was in the best interests of each fund and its shareholders.
In reaching this decision, the board and the committee took into account their interactions with CRMC as well as information furnished to them throughout the year and otherwise provided to them, as well as information prepared specifically in connection with their review of the agreement, and were advised by their independent counsel with respect to the matters considered. They considered the following factors,among others, but did not identify any single issue or particular piece of information that, in isolation, was the controlling factor, and each board and committee member did not necessarily attribute the same weight to each factor.
1. Nature, extent and quality of services
The board and the committee considered the depth and quality of CRMC’s investment management process, including its global research capabilities; the experience, capability and integrity of its senior management and other personnel; the low turnover rates of its key personnel; the overall financial strength and stability of CRMC and the Capital Group organization; the resources and systems CRMC devotes to investment management (the manner in which each fund’s assets are managed, including liquidity management), financial, investment operations, compliance, trading, proxy voting, shareholder communications, and other services; and the ongoing evolution of CRMC’s organizational structure designed to maintain and strengthen these qualities. The board and the committee also considered the nature, extent and quality of administrative and shareholder services provided by CRMC to the funds under the agreement and other agreements, as well as the benefits to each fund’s shareholders from investing in a fund that is part of a large family of funds. The board and the committee considered the risks assumed by CRMC in providing services to the funds,including operational, business, financial, reputational, regulatory and litigation risks. The board and the committee concluded that the nature, extent and quality of the services provided by CRMC have benefited and should continue to benefit each fund and its shareholders.
2. Investment results
The board and the committee considered the investment results of each fund in light of its objectives. They compared each fund’s investment results with those of other funds (including funds that currently form the basis of the Lipper index for the category in which each fund is included),and data such as relevant market and fund indexes over various periods (including each fund’s lifetime) through September 30, 2021. They generally placed greater emphasis on investment results over longer term periods. On the basis of this evaluation and the board’s and the committee’s ongoing review of investment results, and considering the relative market conditions during certain reporting periods, the board and the committee concluded that each fund’s investment results have been satisfactory for renewal of the agreement, and that CRMC’s record in managing the funds indicated that its continued management should benefit each fund and its shareholders.
3. Advisory fees and total expenses
The board and the committee compared the advisory fees and total expense levels of each fund to those of other relevant funds. They observed that the advisory fees and total expenses of each fund generally compared favorably to those of other similar funds included in the comparable Lipper category. The board and the committee also considered the breakpoint discounts in each fund’s advisory fee structure that reduce the level of fees charged by CRMC to the fund as fund assets increase. The board also
| American Funds Insurance Series | 351 |
considered and approved the amended fee schedule to the agreement that lowered the current fee schedule and resulted in an overall lower advisory fee. The board noted that there would be no diminution in services provided as a result of the lower advisory fee for certain funds.
In addition, the board and committee reviewed information regarding the effective advisory fees charged to non-mutual fund clients by CRMC and its affiliates. They noted that, to the extent there were differences between the advisory fees paid by each fund and the advisory fees paid by those clients,the differences appropriately reflected the investment, operational, regulatory and market differences between advising the funds and the other clients. The board and the committee concluded that each fund’s cost structure was fair and reasonable in relation to the services provided, as well as in relation to the risks assumed by the adviser in sponsoring and managing each fund, and that each fund’s shareholders receive reasonable value in return for the advisory fees and other amounts paid to CRMC by the funds.
4. Ancillary benefits
The board and the committee considered a variety of other benefits that CRMC and its affiliates receive as a result of CRMC’s relationship with the series and other American Funds, including fees for administrative services provided to certain share classes; fees paid to CRMC’s affiliated transfer agent; sales charges and distribution fees received and retained by the series’ principal underwriter, an affiliate of CRMC; and possible ancillary benefits to CRMC and its institutional management affiliates in managing other investment vehicles. The board and the committee reviewed CRMC’s portfolio trading practices, noting that through December 31, 2018, CRMC benefited from research obtained with commissions from portfolio transactions made on behalf of each fund, and since that time has undertaken to bear the cost of obtaining such research. The board and the committee took these ancillary benefits into account in evaluating the reasonableness of the other amounts paid to CRMC by the funds.
5. Adviser financial information
The board and the committee reviewed information regarding CRMC’s costs of providing services to the American Funds, including personnel, systems and resources of investment, compliance, trading, accounting and other administrative operations. They considered CRMC’s costs and related cost allocation methodology as well as its track record of investing in technology, infrastructure and staff to maintain and expand services and capabilities, respond to industry and regulatory developments, and attract and retain qualified personnel. They noted information regarding the compensation structure for CRMC’s investment professionals. They reviewed information on the profitability of the investment adviser and its affiliates. The board and the committee also compared CRMC’s profitability and compensation data to the reported results and data of several large, publicly held investment management companies. The board and the committee noted the competitiveness and cyclicality of both the mutual fund industry and the capital markets, and the importance in that environment of CRMC’s long-term profitability for maintaining its independence,company culture and management continuity. They further considered the breakpoint discounts in the funds’ advisory fee structure and CRMC’s sharing of potential economies of scale, or efficiencies, through breakpoints and other fee reductions and costs voluntarily absorbed. The board and the committee concluded that each fund’s advisory fee structure reflected a reasonable sharing of benefits between CRMC and the funds’ shareholders.
| 352 | American Funds Insurance Series |
Approval of Investment Advisory and Service Agreement and Subadvisory Agreement — American Funds Insurance Series Managed Risk Funds
The series’ board has approved the continuation of the series’ Investment Advisory and Service Agreement (the “advisory agreement”) with Capital Research and Management Company (“CRMC”) with respect to the Managed Risk Funds for an additional one-year term through April 30, 2023. The board has also approved the series’ Subadvisory Agreement (the “subadvisory agreement”) with CRMC and Milliman Financial Risk Management LLC (“Milliman FRM”) with respect to these funds for the same term. The advisory and subadvisory agreements are jointly referred to below as the “agreements.” The board approved the agreements following the recommendation of the series’ Contracts Committee (the “committee”), which is composed of all the series’ independent board members. The board and the committee determined in the exercise of their business judgment that the advisory fee structure for each fund within the series was fair and reasonable in relation to the services provided, and that approving the agreements was in the best interests of each fund and its shareholders.
In reaching this decision, the board and the committee took into account their interactions with CRMC and Milliman FRM as well as information furnished to them throughout the year and otherwise provided to them, as well as information prepared specifically in connection with their review of the agreements, and were advised by their independent counsel with respect to the matters considered. They considered the following factors,among others, but did not identify any single issue or particular piece of information that, in isolation, was the controlling factor, and each board and committee member did not necessarily attribute the same weight to each factor.
1. Nature, extent and quality of services
The board and the committee considered the depth and quality of CRMC’s investment management process, including its global research capabilities; the experience, capability and integrity of its senior management and other personnel; the low turnover rates of its key personnel; the overall financial strength and stability of CRMC and the Capital Group organization; the resources and systems CRMC devotes to investment management (the manner in which each fund’s assets are managed, including liquidity management), financial, investment operations, compliance, trading, proxy voting, shareholder communications, and other services; and the ongoing evolution of CRMC’s organizational structure designed to maintain and strengthen these qualities. The board and the committee also considered the nature, extent and quality of the oversight of Milliman FRM’s services provided by CRMC, administrative and shareholder services provided by CRMC to the funds under the advisory agreement and other agreements, as well as the benefits to each fund’s shareholders from investing in a fund that is part of a large family of funds. The board and the committee considered the risks assumed by CRMC in providing services to the funds,including operational, business, financial, reputational, regulatory and litigation risks. The board and the committee concluded that the nature, extent and quality of the services provided by CRMC have benefited and should continue to benefit each fund and its shareholders.
The board and the committee also considered the depth and quality of Milliman FRM’s investment management process, including its experience in applying the Milliman Managed Risk Strategy to other funds in the series and risk management services for other clients; the experience, capability and integrity of its senior management and other personnel; and the services provided to each fund under the subadvisory agreement. The board and the committee concluded that the nature, extent and quality of the services provided by Milliman FRM have benefited and should continue to benefit each fund and its shareholders.
2. Investment results
The board and the committee considered the investment results of each fund in light of its objectives. They compared each fund’s investment results with those of other funds (including funds that currently form the basis of the Lipper index for the category in which each fund is included),and data such as relevant market and fund indexes over various periods (including each fund’s lifetime) through September 30, 2021. They generally placed greater emphasis on investment results over longer term periods. The board and the committee also considered the volatility of the funds compared with the S&P 500 Managed Risk indexes and those of a group of funds with volatility management strategies identified by management over various periods (including each fund’s lifetime) through September 30, 2021. On the basis of this evaluation and the board’s and the committee’s ongoing review of investment results, and considering the relative market conditions during certain reporting periods, the board and the committee concluded that each fund’s investment results and the results of the services provided by CRMC and Milliman FRM have been satisfactory for renewal of the agreements, and that CRMC’s and Milliman FRM’s record in managing the funds indicated that their continued management should benefit each fund and its shareholders.
| American Funds Insurance Series | 353 |
3. Advisory fees and total expenses
The board and the committee compared the advisory fees and total expense levels of each fund to those of other relevant funds. The board and the committee noted CRMC’s waiver of a portion of the advisory fee payable by each fund under the advisory agreement, CRMC’s commitment not to remove the waiver without board approval and CRMC’s agreement to pay the fees due to Milliman FRM under the subadvisory agreement. They observed that each fund’s advisory fees and total expenses generally compared favorably to those of other similar funds included in the comparable Lipper category.
The board and the committee also considered the breakpoint discounts in each underlying fund’s advisory fee structure that reduce the level of fees charged by CRMC to the underlying fund as its assets increase. In addition, they reviewed information regarding the effective advisory fees charged to non-mutual fund clients by CRMC and its affiliates. They noted that, to the extent there were differences between the advisory fees paid by each fund and the advisory fees paid by those clients,the differences appropriately reflected the investment, operational, regulatory and market differences between advising the funds and the other clients. They also reviewed the fees paid to Milliman FRM by other funds which it advised or subadvised. The board and the committee concluded that each fund’s cost structure was fair and reasonable in relation to the services that CRMC provided, directly and through Milliman FRM, as well as in relation to the risks assumed by the adviser in sponsoring and managing each fund, and that each fund’s shareholders receive reasonable value in return for the advisory fees and other amounts paid to CRMC (and indirectly to Milliman FRM) by the funds.
4. Ancillary benefits
The board and the committee considered a variety of other benefits that CRMC and its affiliates receive as a result of CRMC’s relationship with the series and the other American Funds, including fees for administrative services provided to certain share classes; fees paid to CRMC’s affiliated transfer agent; sales charges and distribution fees received and retained by the series’ principal underwriter, an affiliate of CRMC; and possible ancillary benefits to CRMC and its institutional management affiliates in managing other investment vehicles. The board and the committee reviewed CRMC’s portfolio trading practices, noting that through December 31, 2018, CRMC benefited from research obtained with commissions from portfolio transactions made on behalf of each fund, and since that time has undertaken to bear the cost of obtaining such research. The board and the committee also reviewed similar ancillary benefits received by Milliman FRM as a result of its relationship with the series. The board and the committee took these ancillary benefits into account in evaluating the reasonableness of the advisory fees and other amounts paid to CRMC (and indirectly to Milliman FRM) by each fund.
| 354 | American Funds Insurance Series |
5. Adviser financial information
The board and the committee reviewed information regarding CRMC’s costs of providing services to the American Funds, including personnel, systems and resources of investment, compliance, trading, accounting and other administrative operations. They considered CRMC’s costs and related cost allocation methodology as well as its track record of investing in technology, infrastructure and staff to maintain and expand services and capabilities, respond to industry and regulatory developments, and attract and retain qualified personnel. They noted information regarding the compensation structure for CRMC’s investment professionals. They reviewed information on the profitability of the investment adviser and its affiliates. The board and the committee also compared CRMC’s profitability and compensation data to the reported results and data of several large, publicly held investment management companies. The board and the committee noted the competitiveness and cyclicality of both the mutual fund industry and the capital markets, and the importance in that environment of CRMC’s long-term profitability for maintaining its independence,company culture and management continuity. They further considered the breakpoint discounts in the funds’ advisory fee structure and CRMC’s sharing of potential economies of scale, or efficiencies, through breakpoints and other fee reductions and costs voluntarily absorbed. The board and the committee concluded that each fund’s advisory fee structure reflected a reasonable sharing of benefits between CRMC and the funds’ shareholders.
| American Funds Insurance Series | 355 |
This page was intentionally left blank.
| 356 | American Funds Insurance Series |
This page was intentionally left blank.
| American Funds Insurance Series | 357 |
This page was intentionally left blank.
| 358 | American Funds Insurance Series |
This page was intentionally left blank.
| American Funds Insurance Series | 359 |
Office of the series
333 South Hope Street
Los Angeles, CA 90071-1406
Investment adviser
Capital Research and Management Company
333 South Hope Street
Los Angeles, CA 90071-1406
Investment subadviser
Milliman Financial Risk Management LLC
(Managed Risk Funds only)
71 South Wacker Drive, 31st Floor
Chicago, IL 60606-4637
Custodian of assets
State Street Bank and Trust Company
One Lincoln Street
Boston, MA 02111-2900
Counsel
Morgan, Lewis & Bockius LLP
One Federal Street
Boston, MA 02110-1726
Independent registered public accounting firm
PricewaterhouseCoopers LLP
601 South Figueroa Street
Los Angeles, CA 90017-3874
| 360 | American Funds Insurance Series |
Investors should carefully consider investment objectives, risks, charges and expenses. This and other important information is contained in the series prospectuses and summary prospectuses, which can be obtained from your financial professional and should be read carefully before investing. You may also call American Funds Service Company (AFS) at (800) 421-4225 or visit the Capital Group website at capitalgroup.com/afis.
“American Funds Proxy Voting Procedures and Principles” — which describes how we vote proxies relating to portfolio securities — is available on the Capital Group website or upon request by calling AFS. The series files its proxy voting record with the U.S. Securities and Exchange Commission (SEC) for the 12 months ended June 30 by August 31. The proxy voting record is available free of charge on the SEC website at sec.gov and on the Capital Group website.
American Funds Insurance Series files a complete list of its portfolio holdings with the SEC for the first and third quarters of each fiscal year on Form NPORT-P. This filing is available free of charge on the SEC website and on our website.
This report is for the information of American Funds Insurance Series investors, but it also may be used as sales literature when preceded or accompanied by the current prospectuses or summary prospectuses for American Funds Insurance Series and the prospectus for the applicable insurance contract, which give details about charges, expenses, investment objectives and operating policies of the series. If used as sales material after September 30, 2022, this report must be accompanied by a statistical update for the most recently completed calendar quarter.
Fund attribution data was produced using FactSet, a third-party software system, based on daily portfolios. Securities in their initial period of acquisition may not be included in this analysis. The analysis includes equity investments only and excludes forward contracts and fixed income investments, if applicable. It does not account for buy-and-sell transactions that might have occurred intraday. As a result, average portfolio weight percentages are approximate, and the actual average portfolio weight percentages might be higher or lower. Data elements, such as pricing, income, market cap, etc., were provided by FactSet. The indexes provided for attribution are based on FactSet’s methodology. The indexes are broad-based market benchmarks and may not be used by Capital Group® as the sole comparative index for the funds. Capital Group believes the software and information from FactSet to be reliable. However, Capital Group cannot be responsible for inaccuracies, incomplete information or updating of information by FactSet.
Hedge instruments, including exchange-traded futures contracts and exchange-traded put options, may not provide an effective hedge of the underlying securities because changes in the prices of such instruments may not track those of the securities they are intended to hedge. In addition, the managed risk strategy may not effectively protect the funds from market declines and will limit the funds’ participation in market gains. The use of the managed risk strategy could cause the funds’ returns to lag those of the underlying funds in certain market conditions.
BLOOMBERG® is a trademark and service mark of Bloomberg Finance L.P. and its affiliates (collectively “Bloomberg”). Bloomberg or Bloomberg’s licensors own all proprietary rights in the Bloomberg Indices. Neither Bloomberg nor Bloomberg’s licensors approves or endorses this material, or guarantees the accuracy or completeness of any information herein, or makes any warranty, express or implied, as to the results to be obtained therefrom and, to the maximum extent allowed by law, neither shall have any liability or responsibility for injury or damages arising in connection therewith. MSCI has not approved, reviewed or produced this report, makes no express or implied warranties or representations and is not liable whatsoever for any data in the report. You may not redistribute the MSCI data or use it as a basis for other indices or investment products. The S&P 500 is a product of S&P Dow Jones Indices LLC and/or its affiliates and has been licensed for use by Capital Group. Copyright © 2022 S&P Dow Jones Indices LLC, a division of S&P Global, and/or its affiliates. All rights reserved. Redistribution or reproduction in whole or in part is prohibited without written permission of S&P Dow Jones Indices LLC.
American Funds Distributors, Inc., member FINRA.
The Capital Advantage®
Since 1931, Capital Group, home of American Funds, has helped investors pursue long-term investment success. Our consistent approach — in combination with The Capital SystemSM — has resulted in superior outcomes.
Aligned with investor success
We base our decisions on a long-term perspective, which we believe aligns our goals with the interests of our clients. American Funds Insurance Series portfolio managers average 28 years of investment industry experience, including 23 years at our company, reflecting a career commitment to our long-term approach.1
The Capital System
The Capital System combines individual accountability with teamwork. Funds using The Capital System are divided into portions that are managed independently by investment professionals with diverse backgrounds, ages and investment approaches. An extensive global research effort is the backbone of our system.
American Funds Insurance Series’ superior outcomes
American Funds Insurance Series equity funds have beaten their comparable Lipper indexes in 89% of 10-year periods and 100% of 20-year periods.2 Our fixed income funds have helped investors achieve diversification through attention to correlation between bonds and equities.3 We strive to keep management fees competitive. Over the past 20 years, most funds’ fees have been below industry averages.4
| | 1 | Portfolio manager experience as of the American Funds Insurance Series prospectus dated May 1, 2022. |
| | 2 | Based on Class 1 share results for rolling calendar-year periods starting the first full calendar year after each fund’s inception through December 31, 2021. Periods covered are the shorter of the fund’s lifetime or since the inception date of the comparable Lipper index or average. The comparable Lipper indexes are: Capital World Funds Index (Global Growth Fund, Capital World Growth and Income Fund), Growth Funds Index (Growth Fund), International Funds Index (International Fund), Emerging Markets Funds Index (New World Fund), Growth & Income Funds Index (Washington Mutual Investors Fund, Growth and Income Fund) and Balanced Funds Index (Asset Allocation Fund). The Lipper Global Small-/Mid-Cap Funds Average was used for Global Small Capitalization Fund. Lipper source: Refinitiv Lipper. There have been periods when the fund has lagged the index. |
| | 3 | Based on Class 1 share results as of December 31, 2021. Three of our five fixed income funds showed a three-year correlation below 0.3. Standard & Poor’s 500 Index was used as an equity market proxy. Correlation based on monthly total returns. Correlation is a statistical measure of how two securities move in relation to each other. A correlation ranges from –1 to 1. A positive correlation close to 1 implies that as one security moves, either up or down, the other security will move in “lockstep,” in the same direction. A negative correlation close to –1 indicates that the securities have moved in the opposite direction. |
| | 4 | Based on management fees for the 20-year period ended December 31, 2021, versus comparable Lipper categories, excluding funds of funds. |
All Capital Group trademarks mentioned are owned by The Capital Group Companies, Inc., an affiliated company or fund. All other company and product names mentioned are the property of their respective companies.

| (b) | Not applicable to this filing. |
Item 2. Code of Ethics.
Not applicable to this filing.
Item 3. Audit Committee Financial Expert.
Not applicable to this filing.
Item 4. Principal Accountant Fees and Services.
Not applicable to this filing.
Item 5. Audit Committee of Listed Registrants.
Not applicable to this filing.
Item 6. Investments.
| (a) | Please see portfolio of investments contained in the Reports to Stockholders included under Item 1 of this form N-CSR. |
| (b) | Not applicable to this filing. |
Item 7. Disclosure of Proxy Voting Policies and Procedures for Closed-End Management Investment Companies.
Not applicable to this filing.
Item 8. Portfolio Managers of Closed-End Management Investment Companies.
Not applicable to this filing.
Item 9. Purchases of Equity Securities by Closed-End Management Investment Company and Affiliated Purchasers.
Not applicable to this filing.
Item 10. Submission of Matters to a Vote of Security Holders.
Not applicable to this filing.
Item 11. Controls and Procedures.
(a) The Registrant’s Principal Executive Officer and Principal Financial Officer have concluded that the Registrant’s disclosure controls and procedures (as defined in Rule 30a-3(c) under the Investment Company Act of 1940, as amended (the “1940 Act”) (17 CFR 270.30a-3(c))) are effective, as of a date within 90 days of the filing date of this Form N-CSR, to provide reasonable assurance that the information required to be disclosed by the Registrant on Form N-CSR is recorded, processed, summarized, and reported within the time periods specified in the SEC’s rules and forms, based on their evaluation of these disclosure controls and procedures required by Rule 30a-3(b) under the 1940 Act (17 CFR 270.30a-3(b)) and Rules 13a-15(b) or 15d-15(b) under the Securities Exchange Act of 1934 (17 CFR 240.13a-15(b) or 240.15d-15(b)).
(b) There were no changes in the Registrant’s internal control over financial reporting (as defined in Rule 30a-3(d) under the 1940 Act (17 CFR 270.30a-3(d))) that occurred during the period covered by this report that has materially affected, or is reasonably likely to materially affect, the Registrant’s internal control over financial reporting.
Item 12. Disclosure of Securities Lending Activities for Closed-End Management Investment Companies
Not applicable to this filing.
Item 13. Exhibits.
(a)(1) Code of Ethics (Item 2) is not applicable to this filing.
(a)(2) Certifications of the Principal Executive Officer and Principal Financial Officer of the Registrant as required by Rule 30a-2(a) under the 1940 Act (17 CFR 270.30a-2(a)) are attached hereto as Exhibit 99CERT.
(a)(3) Not applicable to this filing.
(a)(4) Not applicable to this filing.
(b)(1) Certifications pursuant to Section 906 of the Sarbanes-Oxley Act of 2002 as required by Rule 30a-2(b), under the 1940 Act (17 CFR 270.30a-2(b)), Rule 15d-14(b) under the Securities Exchange Act of 1934 (17 CFR 240.15d-14(b)) and Section 1350 of Chapter 63 of Title 18 of the United States Code (18 U.S.C. 1350) are attached hereto as Exhibit 99.906CERT.
(b)(2) Certifications pursuant to Sections 302 and 906 of the Sarbanes-Oxley Act of 2002 as required by Rule 30a-2, under the 1940 Act (17 CFR 270.30a-2), and, as applicable, Rule 15d-14(b) under the Securities Exchange Act of 1934 (17 CFR 240.15d-14(b)) and Section 1350 of Chapter 63 of Title 18 of the United States Code (18 U.S.C. 1350) are attached hereto as Exhibit 99.906CERT.
SIGNATURES |
| |
| Pursuant to the requirements of the Securities Exchange Act of 1934 and the Investment Company Act of 1940, the registrant has duly caused this report to be signed on its behalf by the undersigned, thereunto duly authorized. |
| | |
| (Registrant) | | MML Series Investment Fund | |
| | |
| By (Signature and Title) | /s/ Paul LaPiana | |
| | | Paul LaPiana, President and Principal Executive Officer | |
| Date | 8/23/2022 | |
| | |
Pursuant to the requirements of the Securities Exchange Act of 1934 and the Investment Company Act of 1940, this report has been signed below by the following persons on behalf of the registrant and in the capacities and on the dates indicated. |
| | |
| By (Signature and Title) | /s/ Paul LaPiana | |
| | | Paul LaPiana, President and Principal Executive Officer | |
| | |
| Date | 8/23/2022 | |
| | |
| By (Signature and Title) | /s/ Renee Hitchcock | |
| | | Renée Hitchcock, Treasurer and Principal Financial Officer | |
| | |
| Date | 8/23/2022 | |
| | | | | |