Exhibit 99.2

2nd Quarter Presentation
March 2, 2011

1
Participants
Steven E. Nielsen President & Chief Executive Officer H. Andrew DeFerrari Chief Financial Officer Richard B. Vilsoet General Counsel |

2
Forward-Looking Statements and Non-
GAAP Information
GAAP Information
Forward-Looking Statements and Non-
GAAP Information
GAAP Information
Fiscal 2011 second quarter results are unaudited. This presentation contains “forward-looking
statements” which are statements relating to future events, future financial performance,
strategies, expectations, and competitive environment. Words such as “believe,” “expect,”
“anticipate,” “estimate,” “intend,” “forecast,” “may,” “should,” “could,” “project” and similar
expressions, as well as statements in future tense, identify forward looking statements. You
should not read forward looking statements as a guarantee of future performance or results.
They will not necessarily be accurate indications of whether or at what time such performance or
results will be achieved. Forward looking statements are based on information available at the
time those statements are made and/or management’s good faith belief at that time with respect
to future events. Such statements are subject to risks and uncertainties that could cause actual
performance or results to differ materially from those expressed in or suggested by the forward
looking statements. Important factors that could cause such differences include, but are not
limited to factors described under Item 1A, “Risk Factors” of the Company’s Annual Report on
Form 10-K for the year ended July 31, 2010, and other risks outlined in the Company’s periodic
filings with the Securities and Exchange Commission (“SEC”). The forward-looking statements in
this presentation are expressly qualified in their entirety by this cautionary statement. Except as
required by law, the Company may not update forward-looking statements even though its
situation may change in the future.
This presentation includes certain “Non-GAAP” financial measures as defined by SEC rules. As
required by the SEC we have provided a reconciliation of those measures to the most directly
comparable GAAP measures on the Regulation G slides included on slides 12 through 14 of this
presentation.
required by the SEC we have provided a reconciliation of those measures to the most directly
comparable GAAP measures on the Regulation G slides included on slides 12 through 14 of this
presentation.

3
Q2-2011 Overview
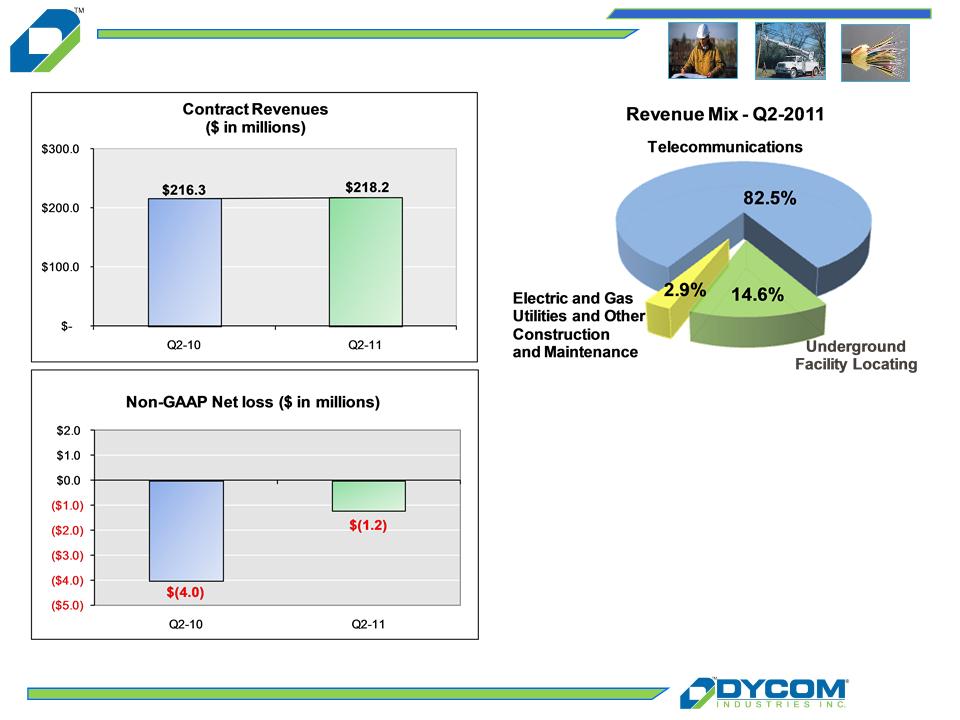
n Contract revenue of $218.2 million, increased year-over year but
declined organically 1.6% after adjusting for revenues from acquired
companies
declined organically 1.6% after adjusting for revenues from acquired
companies
n Non-GAAP loss of $0.03 per share compared to a loss of $0.10 per
share in the prior year
share in the prior year
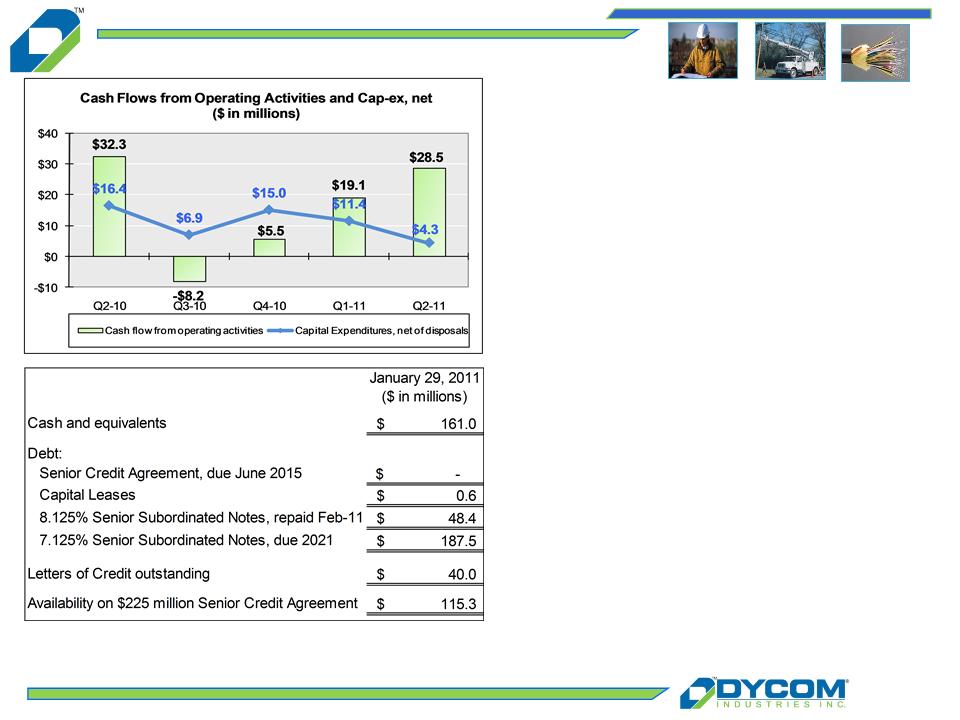
n Capital expenditures, net of proceeds totaled $4.3 million and are
expected to range from $45 million to $50 million for the full fiscal year
expected to range from $45 million to $50 million for the full fiscal year
n Strong liquidity and operating cash flows
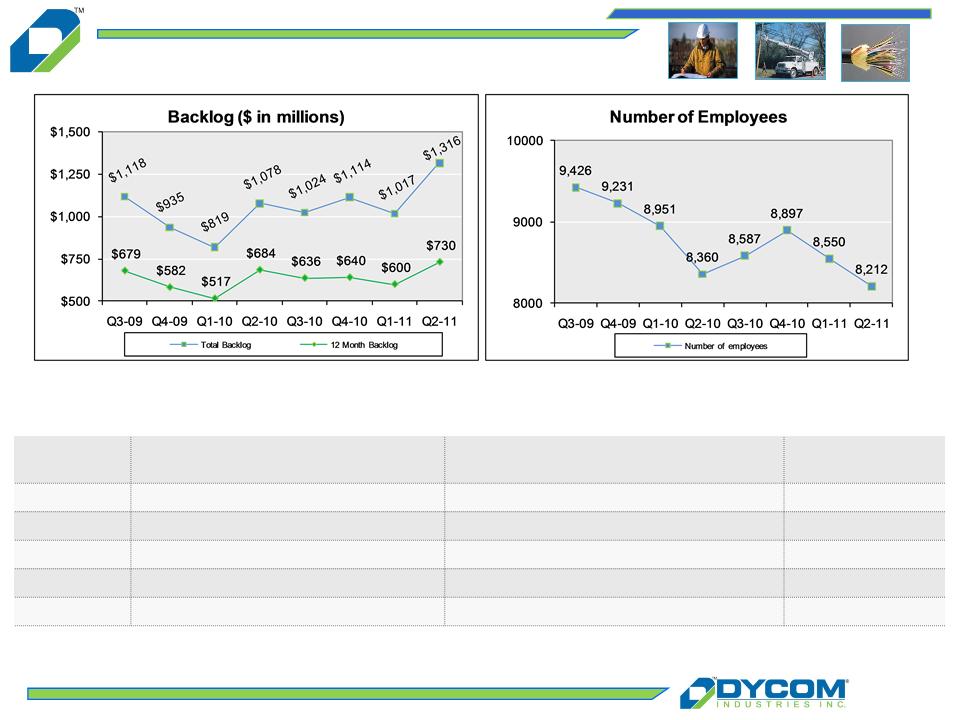
n Backlog increased by $299 million from substantial contract awards
Note: See “Regulation G Disclosure” slides 12-13 for a reconciliation of GAAP to Non-GAAP financial measures.

4
Q2-2011 Transactions
n M & A Activity
NeoCom Solutions, Inc.
Ø Acquired in December 2010 for $27.5 million in cash
Ø Provider of construction and maintenance services to the wireless industry
Ø Dycom’s first meaningful participation directly in the wireless communications industry
Communication Services, LLC
Ø Acquired in November 2010 for $9.7 million in total consideration
Ø Provider of construction and maintenance services to the rural telephone industry
n Financing Activities
Share repurchases
Ø 291,500 shares repurchased for $3.2 million, or $10.99 per share
Debt Refinance
Ø $187.5 million face value of new 10-year 7.125% senior subordinated notes issued in Q2-
11
11
Ø Repurchase of existing 8.125% notes completed in February
Ø Lowered interest rate on outstanding borrowings, extended debt maturities on a cost
effective basis until 2021 and secured over $41 million in incremental capital
effective basis until 2021 and secured over $41 million in incremental capital
5
Revenue Summary
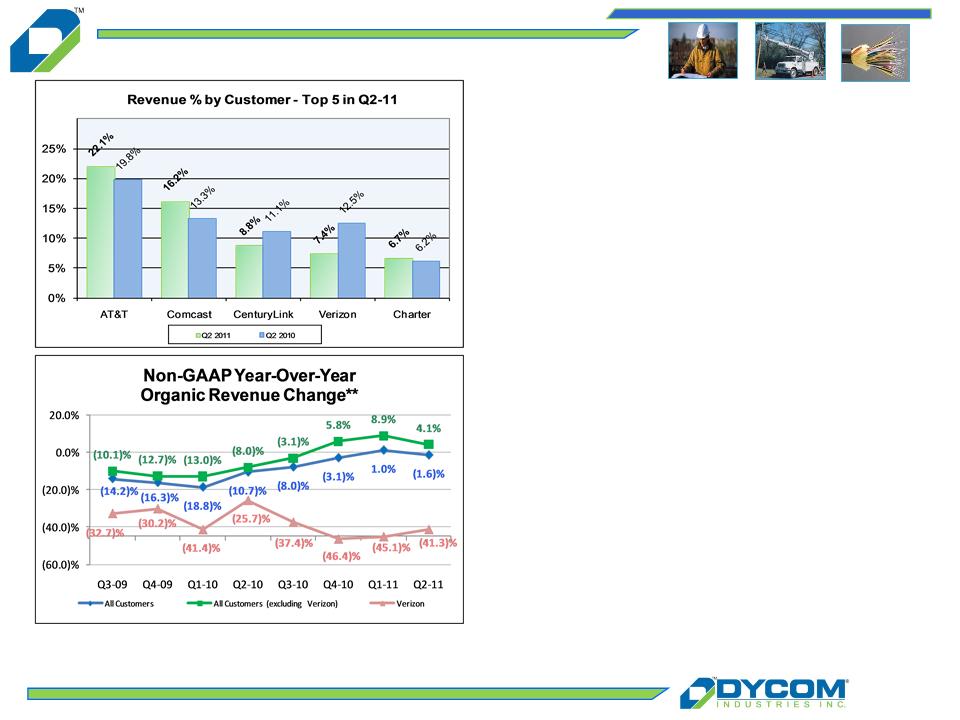
n Top 5 customers from Q2-11 represented
61.1% of revenue in Q2-11 and 62.9% of
revenue in Q2-10
61.1% of revenue in Q2-11 and 62.9% of
revenue in Q2-10
n Contract revenue from non-Top 5
customers increased by 5.7%, with
growth from rural telecommunication
customers
customers increased by 5.7%, with
growth from rural telecommunication
customers
n Communication Services and NeoCom
contributed aggregate revenues of $5.3
million since acquisition
contributed aggregate revenues of $5.3
million since acquisition
n Excluding Verizon and revenue from
acquired businesses, organic growth at
4.1% in Q2-11 for all other customers on
a combined basis
acquired businesses, organic growth at
4.1% in Q2-11 for all other customers on
a combined basis
* For comparison purposes, CenturyLink includes combined revenues from CenturyTel, Inc. and Embarq Corporation for each period presented.
Note: See “Regulation G Disclosure” slide 12 for a reconciliation of GAAP to Non-GAAP financial measures.
** Organic revenue change excludes revenue from acquired businesses in Q2-11, storm restoration work in Q3-09, Q2-09 and Q1-09 and excludes the impact of an additional week in
Q4-10 to adjust for our 52/53 week fiscal calendar.
Q4-10 to adjust for our 52/53 week fiscal calendar.
6
Backlog and Awards
Current Awards and Extensions
Customers | Area | Description | Approximate Term (in years) |
nVerizon | Maryland | Construction and maintenance services | 6 |
nComcast | Colorado | Construction and maintenance services | 1 |
nAT&T | Alabama, North Carolina, Tennessee | Construction and maintenance services | 3 |
nWindstream | Kentucky | Construction and maintenance services | 3 |
nAT&T | California | Locating services | 3 |
7
Summary Results
Fully Diluted EPS - Non-GAAP | |
Q2-10 | Q2-11 |
$(0.10) | $(0.03) |
Note: See “Regulation G Disclosure” slides 12-13 for a reconciliation of GAAP to Non-GAAP financial measures.
0.9%
Total change
(1.6)%
Organic change

8
Selected Information
(a) See “Regulation G Disclosure” slides 13-14 for a reconciliation of GAAP to Non-GAAP financial measures.
(b) Amounts may not foot due to rounding.
Q2-11 | Q2-10 | Change (b) | |||
($ in millions) | |||||
Contract Revenues | $218.2 | $216.3 | $1.9 | §Cost of earned revenues as a percentage of revenue decreased primarily as a result of improved labor efficiency | |
Cost of Earned Revenues | $181.6 83.2% | $180.9 83.6% | $0.7 (0.4)% | ||
General & Administrative - - Non-GAAP (a) | $21.6 10.0% | $23.9 11.0% | $(2.3) (1.0)% | §G&A declined substantially from reduced payroll and professional fees | |
Depreciation & Amortization | $15.8 7.2% | $15.5 7.2% | $0.3 0.1% | §Depreciation and amortization increased primarily from the impact of the acquisitions of Communication Services and NeoCom Solutions | |
Interest expense | $3.8 1.7% | $3.5 1.6% | $0.2 0.1% | §Increased interest expense from higher debt balances outstanding | |
Other Income, Net | $2.2 1.0% | $0.9 0.4% | $1.3 0.6% | §Other income, net increased as more assets were sold in the current period at better prices | |
§Non-GAAP effective tax rate of 42.1% for the six months ended January 29, 2011 | |||||
9
Cash Flow and Liquidity
n Solid operating cash flows
n Combined days sales outstanding on trade
receivables and net unbilled revenues were
62 days in Q2-11 (a)
receivables and net unbilled revenues were
62 days in Q2-11 (a)
n Capital expenditures, net of disposals at
$4.3 million
$4.3 million
n Issuance of $187.5 million 7.125% senior
subordinated notes due 2021
subordinated notes due 2021
n Repurchase of remaining 8.125% senior
subordinated notes completed in February
2011
subordinated notes completed in February
2011
n 291,500 shares repurchased for
approximately $3.2 million, or $10.99 per
share, during Q2-11
approximately $3.2 million, or $10.99 per
share, during Q2-11
(a) Days sales outstanding is calculated as the summation of current accounts receivable, plus costs and estimated earnings in excess of billings, less
billings in excess of costs and estimated earnings, divided by average revenue per day during the respective quarter.
billings in excess of costs and estimated earnings, divided by average revenue per day during the respective quarter.

10
Summary
n Beginning to the feel the effects of an improving environment
n Notable contract awards which meaningfully increased backlog
n At the forefront of evolving industry opportunities including those
generated by rural broadband initiatives
generated by rural broadband initiatives
n Encouraged by deployment of new technologies by cable operators
which enable them to increase the effective bandwidth of their
networks
which enable them to increase the effective bandwidth of their
networks
n Responding to an increasing number of industry participants
aggressively extending or deploying fiber networks to provide
wireless backhaul services
aggressively extending or deploying fiber networks to provide
wireless backhaul services

11
Looking Ahead
n Organic revenue grows modestly reflecting increased opportunities
offset in part by a shift away from technician intensive services
offset in part by a shift away from technician intensive services
n Margins and earnings increase faster than revenues
n Continued solid and growing cash flows dedicated to accretive
acquisition opportunities and share repurchases as valuation and
projected returns direct
acquisition opportunities and share repurchases as valuation and
projected returns direct
n Confidence that trends will be improving for a sustained period
supports patience with respect to any individual quarterly result
supports patience with respect to any individual quarterly result
Q3 - 2011:
n Revenues which grow slightly year over year on an organic basis
n Margins which improve year over year
n Pre-tax loss on debt extinguishment of approximately $2.6 million
relating to the remaining repurchase of our 8.125% senior
subordinated notes
relating to the remaining repurchase of our 8.125% senior
subordinated notes
n Non-GAAP earnings which continue to improve year over year
12
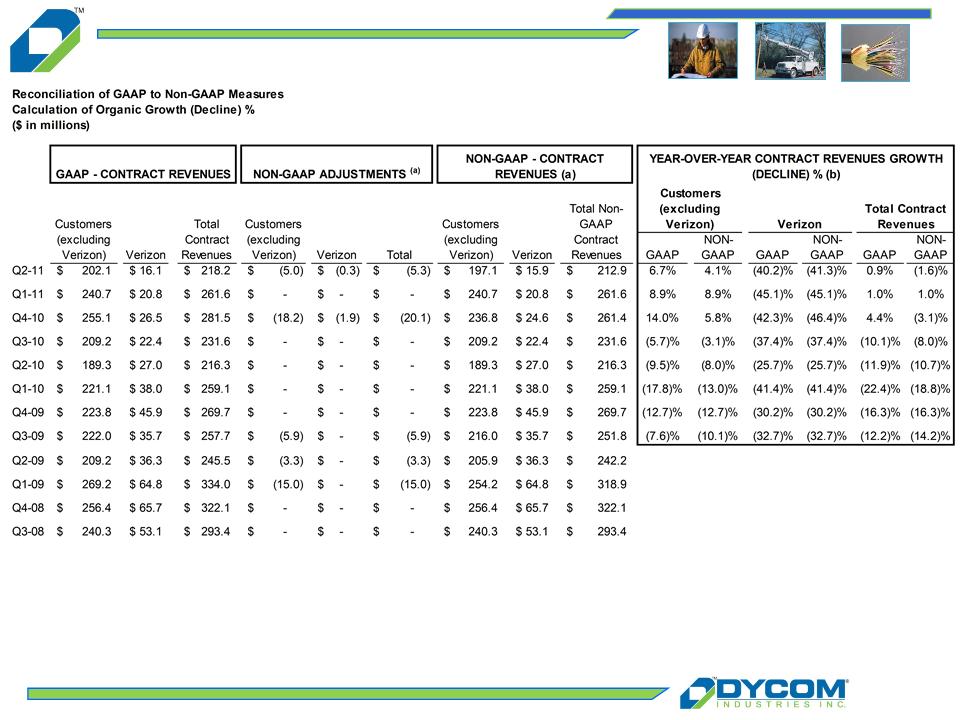
Appendix: Regulation G Disclosure
Amounts may not foot due to rounding.
(a) Non-GAAP adjustments in Q2-11 reflect revenues from businesses acquired during Q2-11. Non-GAAP adjustments in Q4-10 result from the Company’s 52/53
week fiscal year. The Q4-10 Non-GAAP adjustments reflect the impact of the additional week in Q4-10 and are calculated by dividing contract revenues by 14 weeks.
The result, representing one week of contract revenues, is subtracted from the GAAP-contract revenues to calculate 13 weeks of revenue for Q4-10 on a Non-GAAP
basis for comparison purposes. The Non-GAAP adjustments in Q3-09, Q2-09, and Q1-09 reflect storm restoration revenues recognized during those periods.
(b) Year-over-year growth (decline) percentage is calculated as follows: (i) revenues in the quarterly period less (ii) revenues in the comparative prior year quarter
period; divided by (ii) revenues in the comparative prior year quarter period.
period; divided by (ii) revenues in the comparative prior year quarter period.
13
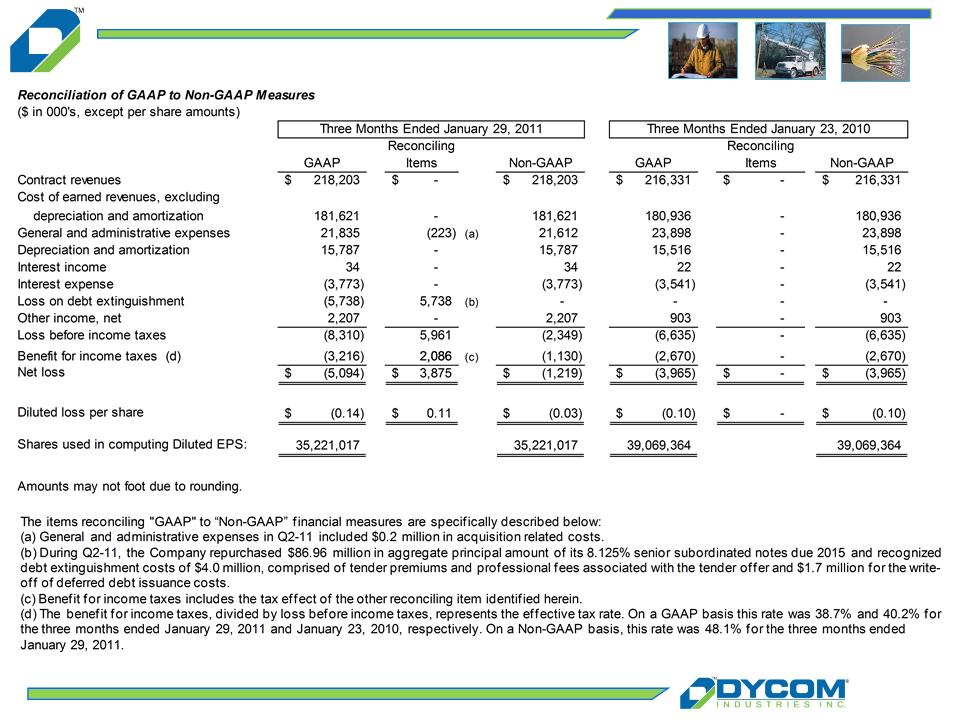
Appendix: Regulation G Disclosure
14
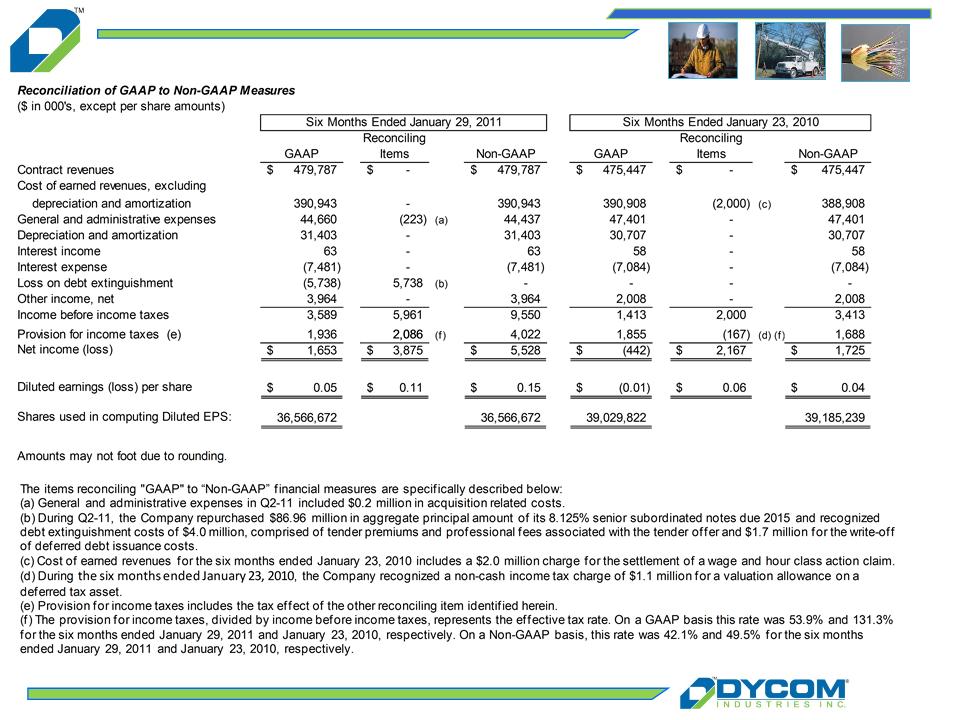
Appendix: Regulation G Disclosure

2nd Quarter Presentation
March 2, 2011