Exhibit 99-1

D.A. Davidson
10th Annual Engineering &
Construction Conference
September 20-21, 2011
10th Annual Engineering &
Construction Conference
September 20-21, 2011

1
Forward-Looking Statements and Non-GAAP
Information
Information
Forward-Looking Statements and
Non-GAAP Information
This presentation contains “forward-looking statements” which are statements relating to future events, future
financial performance, strategies, expectations, and competitive environment. All statements, other than
statements of historical facts, contained in this presentation, including statements regarding our future financial
position, future revenue, prospects, plans and objectives of management, are forward-looking statements.
Words such as “believe,” “expect,” “anticipate,” “estimate,” “intend,” “forecast,” “may,” “should,” “could,” “project,”
“looking ahead” and similar expressions, as well as statements in future tense, identify forward-looking
statements. You should not read forward-looking statements as a guarantee of future performance or results.
They will not necessarily be accurate indications of whether or at what time such performance or results will be
achieved. Forward-looking statements are based on information available at the time those statements are
made and/or management’s good faith belief at that time with respect to future events. Such statements are
subject to risks and uncertainties that could cause actual performance or results to differ materially from those
expressed in or suggested by the forward-looking statements. Important factors that could cause such
differences include, but are not limited to factors described under Item 1A, “Risk Factors” of the Company’s
Annual Report on Form 10-K for the year ended July 30, 2011, and other risks outlined in the Company’s
periodic filings with the Securities and Exchange Commission (“SEC”). The forward-looking statements in this
presentation are expressly qualified in their entirety by this cautionary statement. Except as required by law, the
Company may not update forward-looking statements even though its situation may change in the future.
This presentation includes certain “Non-GAAP” financial measures as defined by SEC rules. We believe that the
presentation of certain Non-GAAP financial measures provides information that is useful to investors because it
allows for a more direct comparison of our performance for the period with our performance in the comparable
prior-year periods. As required by the SEC, we have provided a reconciliation of those measures to the most
directly comparable GAAP measures on the Regulation G slides included at the end of this presentation. We
caution that Non-GAAP financial measures should be considered in addition to, but not as a substitute for, our
reported GAAP results.

2
Positioned for strong equity returns
n A leading supplier of specialty contracting services to
telecommunication providers nationwide
telecommunication providers nationwide
n Telecommunications networks fundamental to economic progress
n End market opportunities driving organic growth, margin expansion
and increased earnings potential
and increased earnings potential
Ø Wireless backhaul
Ø Rural fiber networks
Ø Fiber deployments to businesses
Ø Wireless network upgrades
Ø FTTx deployments
n Capital allocation strategy designed to produce strong equity returns

3
Nationwide Footprint and Significant
Resources
Resources
n Headquartered in Palm Beach Gardens, Florida
n Nationwide footprint
} Operates in 48 states and in Canada
} 31 operating subsidiaries and hundreds of field offices
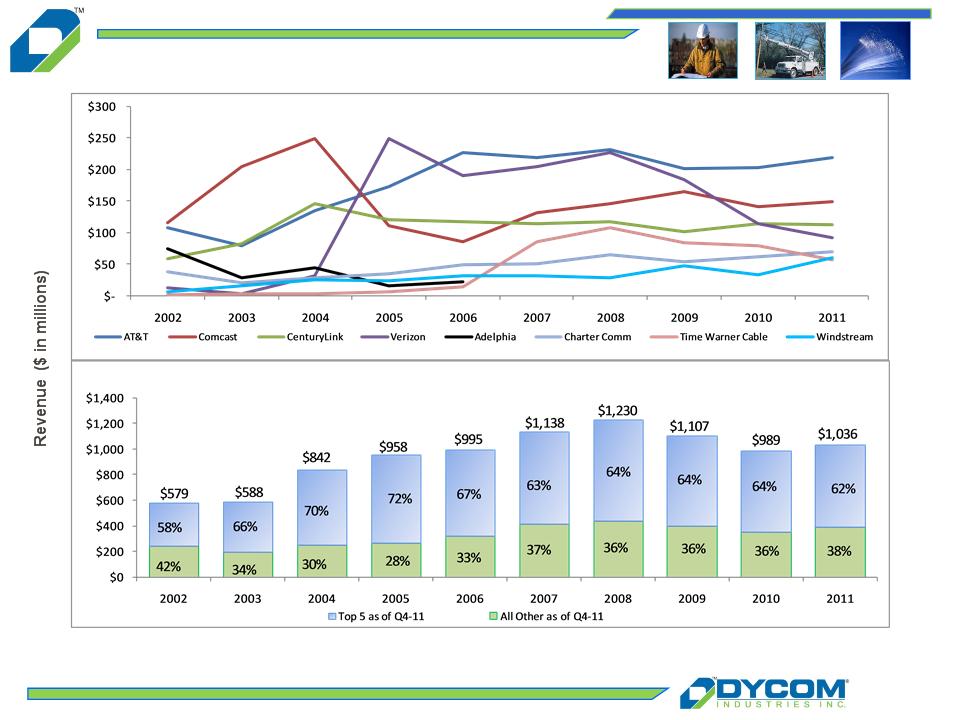
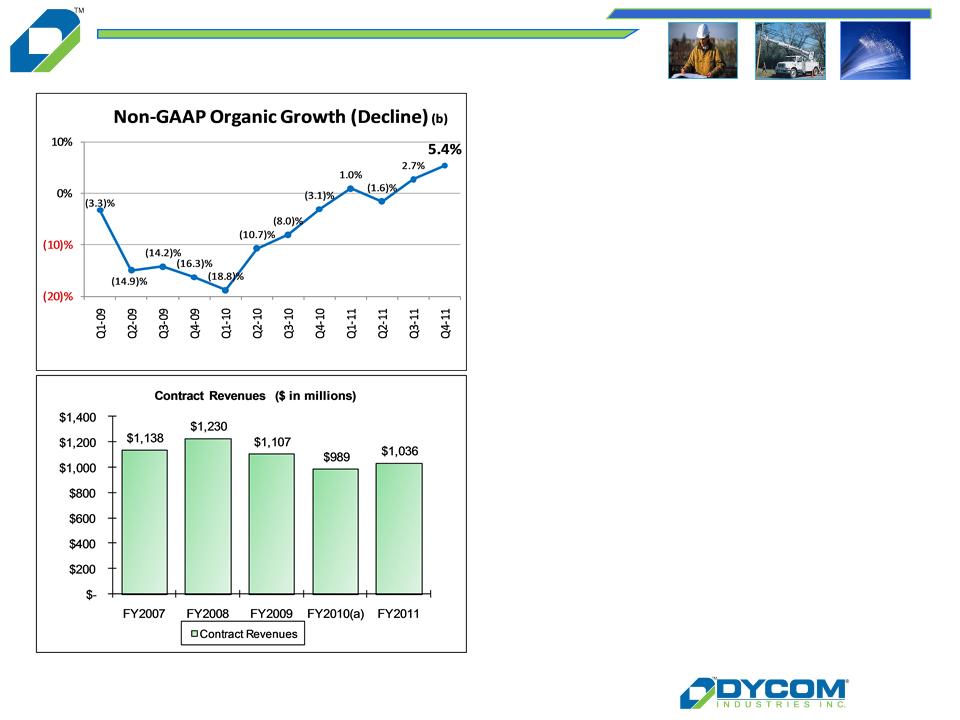
n Fiscal 2011 revenues of $1.036 billion grew organically 3.5% year over year, and
over 10% growth in Q4-11, including storm work of approximately $14 million
over 10% growth in Q4-11, including storm work of approximately $14 million
n Strong financial profile
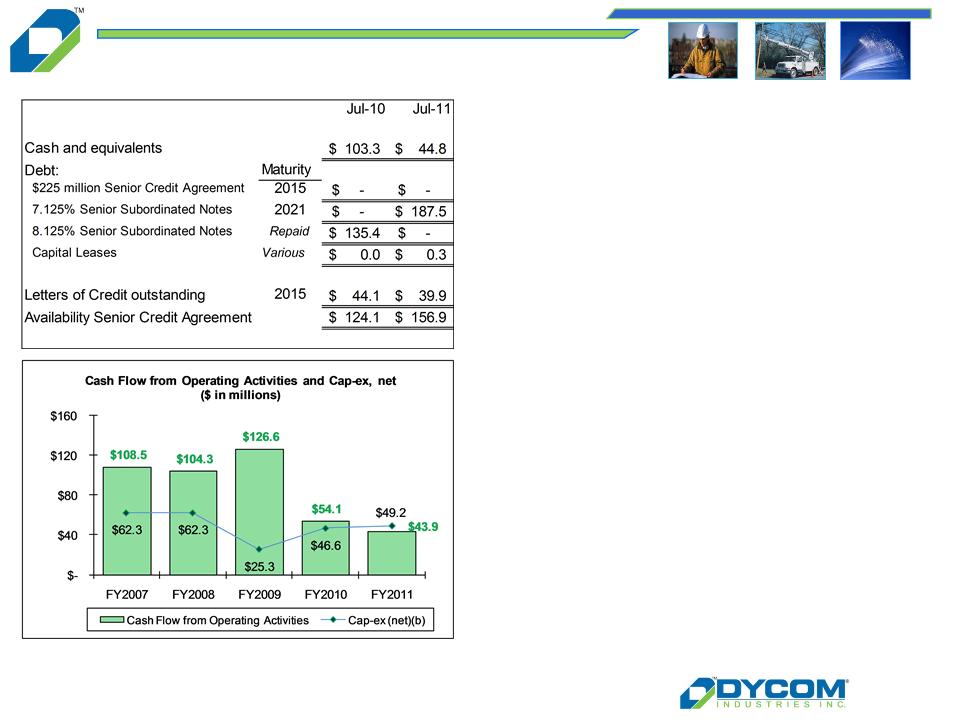
} Cash and equivalents $44.8 million at July 30, 2011
} Availability on revolving credit agreement of $156.9 million at July 30, 2011
} 7.125% Senior Subordinated Notes due 2021
n Over 8,300 employees
Note: See “Regulation G Disclosure” slides for a reconciliation of GAAP to Non-GAAP financial measures.
4
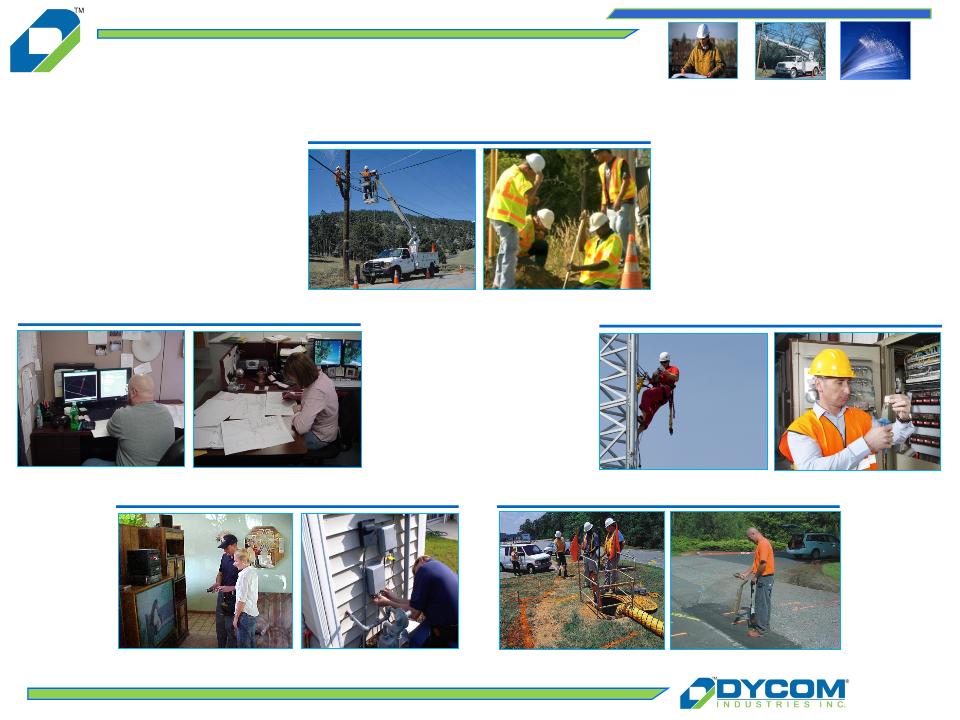
Services Crucial to Customer Success
Engineering
Underground Facility Locating
Outside Plant & Equipment Installation
Premise Equipment Installation
Wireless Services
5
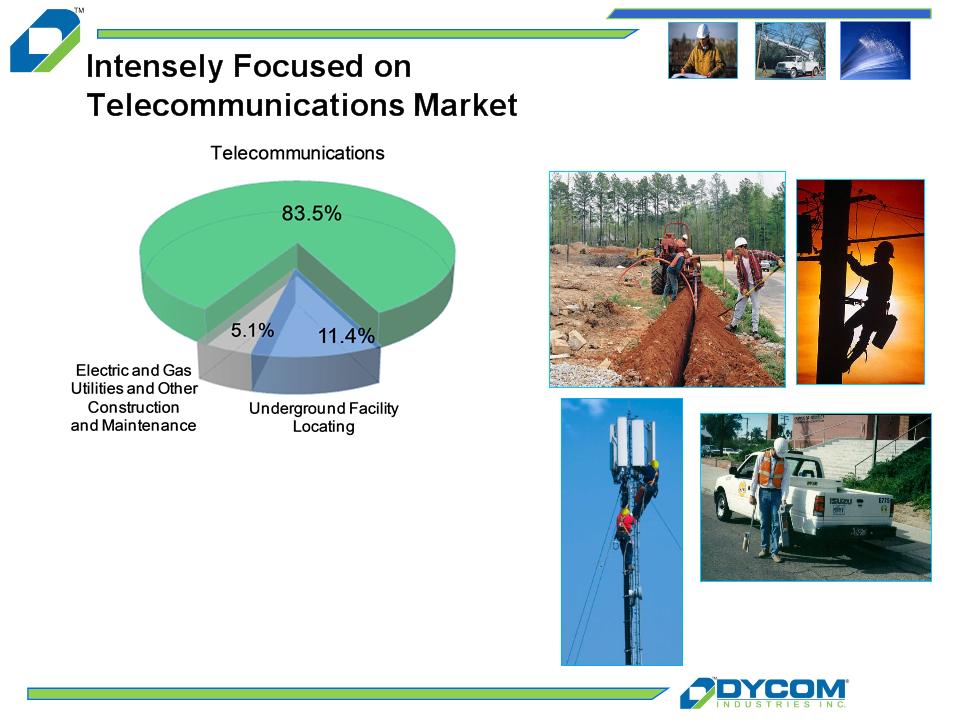
Contract Revenue $303.7 million
Quarter Ended July 30, 2011
6
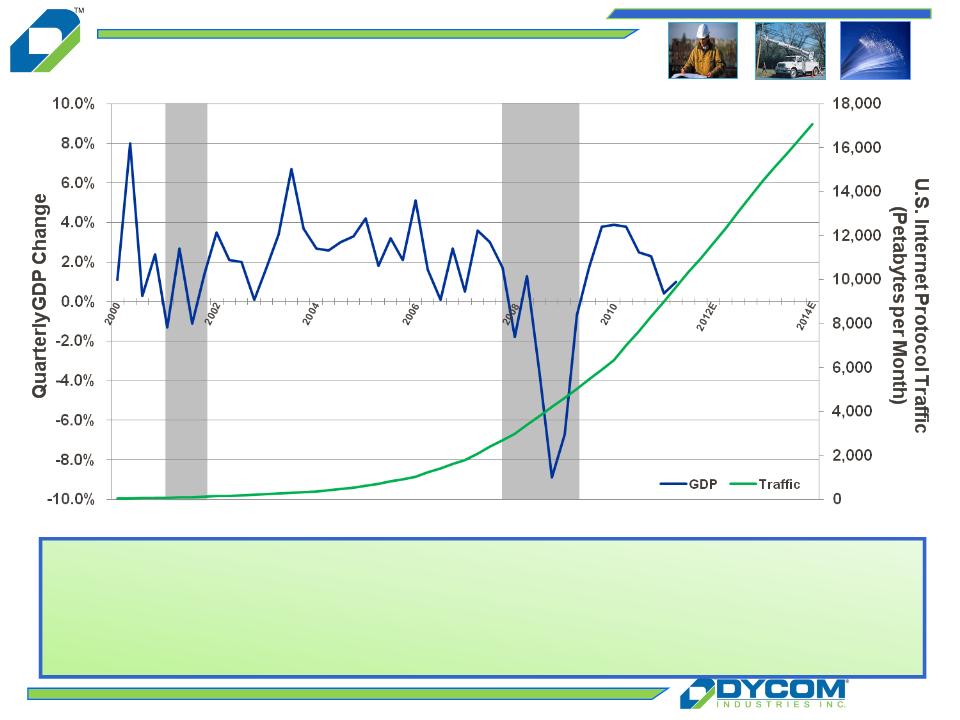
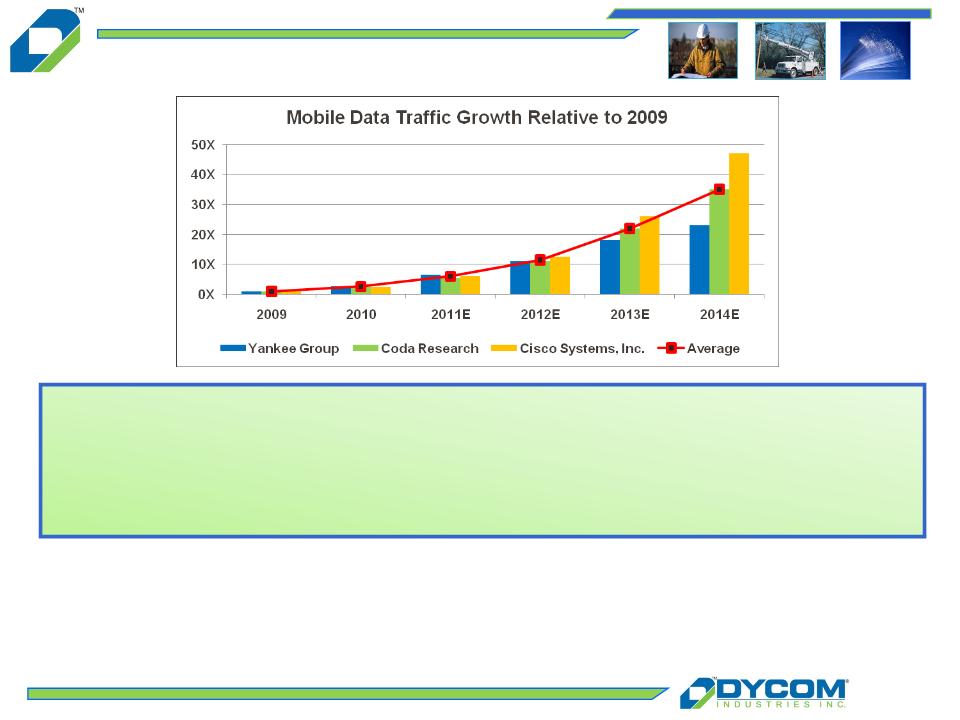
Strong Secular Trend
Sources: U.S. Telecom, The Broadband Association
Cisco Visual Networking Index
U.S. National Bureau of Economic Analysis
“When the stability of an entire economy depends on the speed, intelligence, quality
of service, robustness and security of its Internet backbone, will a just good network
be good enough?”
of service, robustness and security of its Internet backbone, will a just good network
be good enough?”
John Chambers, Chairman and CEO, Cisco, Inc. - May 2011
7
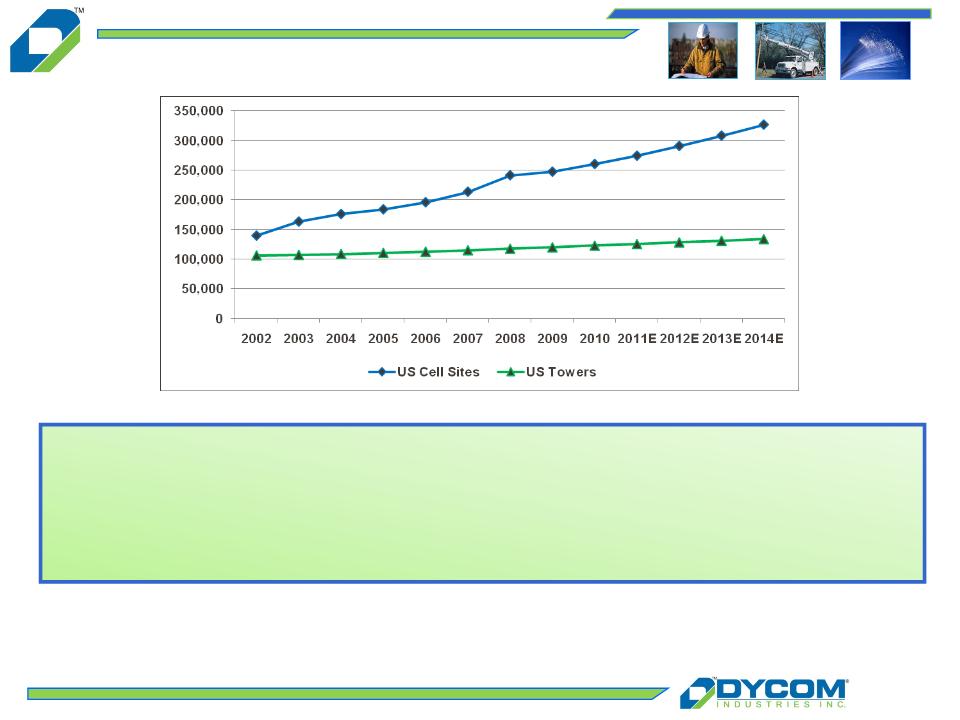
Key Driver: Wireless Backhaul
“The returns associated with cell backhaul are very attractive, and they’re very
attractive with a single tenant. As you can imagine, once you have that fat pipe up to
that tower, there are multiple tenants that you can upsell to.”
attractive with a single tenant. As you can imagine, once you have that fat pipe up to
that tower, there are multiple tenants that you can upsell to.”
Mike Lovett, President and CEO, Charter Communications, Inc. - May 2011
•Very attractive returns to our customers
•Telephone, cable and other companies aggressively deploying fiber to
provide wireless backhaul services
provide wireless backhaul services
•Continues to provide significant growth opportunities

8
Key Driver: Rural Fiber Networks
The American Recovery and Reinvestment Act
(ARRA) provided the Department of Commerce’s
National Telecommunications and Information
Administration (NTIA) and the U.S. Department of
Agriculture’s Rural Utilities Service (RUS) with
$7.2 billion to expand broadband services in the
United States.
(ARRA) provided the Department of Commerce’s
National Telecommunications and Information
Administration (NTIA) and the U.S. Department of
Agriculture’s Rural Utilities Service (RUS) with
$7.2 billion to expand broadband services in the
United States.
Cumulatively, total Federal expenditures have now exceeded $280 million
(approximately seven percent of the total [NTIA] funds awarded) and have
been matched by recipient funds of more than $130 million.
(approximately seven percent of the total [NTIA] funds awarded) and have
been matched by recipient funds of more than $130 million.
NTIA BTOP Quarterly Program Status Report - June 2011
•Demand has absorbed significant industry capacity
•Dycom currently working on dozens of projects in eighteen states
•Meaningfully increased exposure to rural service providers
9
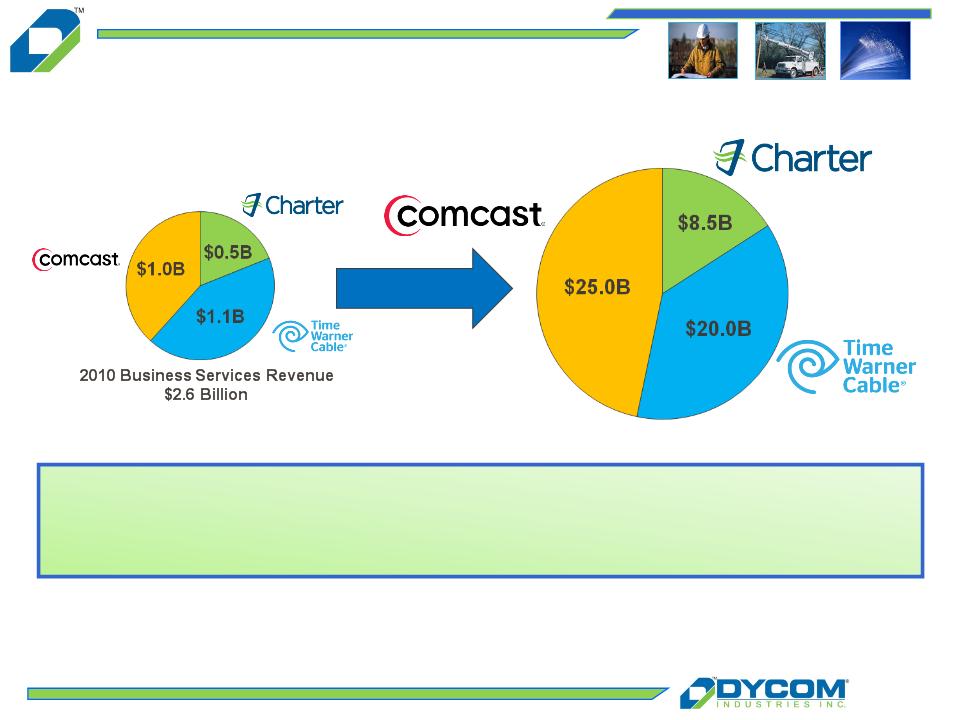
Key Driver: Fiber to Businesses
Addressable Business Services Market
$53.5 Billion
•Emerging as an industry battleground
•Multi-year cap-ex trajectory provides visible revenue opportunities
•Leverages Dycom’s existing cable engineering and construction resources
The small and medium business market reachable by every U.S. cable
company is $50 to $70 billion.
company is $50 to $70 billion.
Craig Moffett, Analyst, Sanford C. Bernstein & Co. - September 2010
Sources: Company Filings
Company Transcripts
10
Key Driver: Wireless Network Upgrades
“I would tell you that the range that we have for wireless CapEx - and really for the Company
as a whole -- is sort of in this mid-teens as a percentage of revenue. And with the technology
curves that we have coming in our business, I don't think you're going to be way below that or
whatever at any point in time.”
Pete Ritcher, SVP and CFO of Mobility and Consumer Markets, AT&T, Inc. - August 2011
•Wireless network spending increasing faster than overall spending
•Dycom entered wireless market via NeoCom acquisition in December 2010
•Strong growth opportunities as industry migrates from 3G to 4G technologies
Sources: CTIA
Collins Stewart, LLC
11
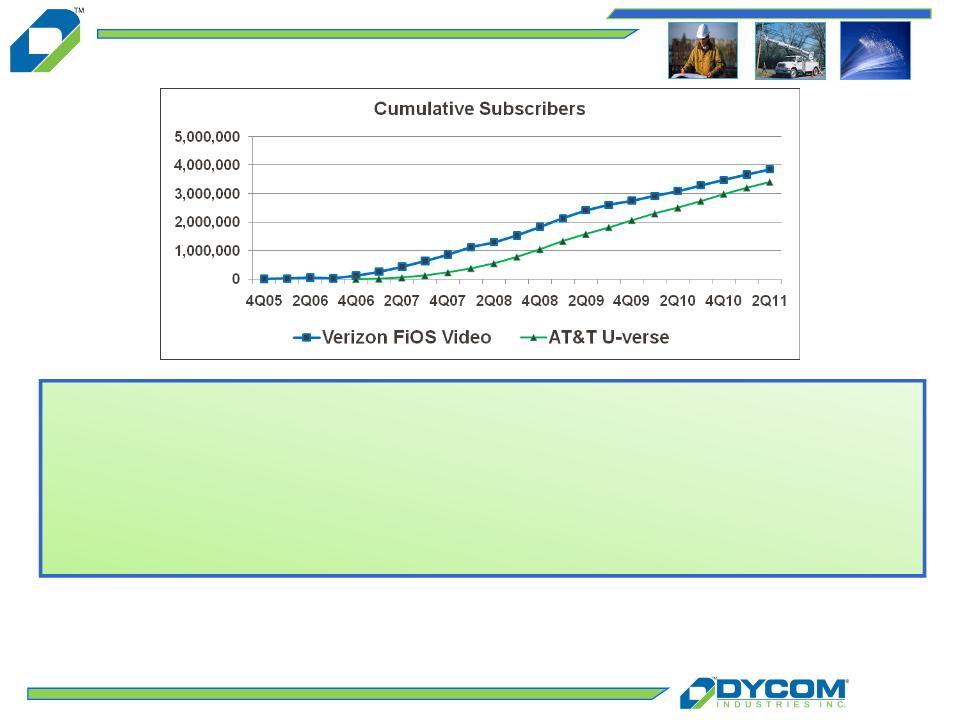
Key Driver: FTTx Deployments
“…we’ll continue to push fiber closer to the customers. Yes, we’re using the fiber to the tower
build to try to shorten the loops and get fiber to nodes at the same time, so that when you open
the trench once and take fiber out to the tower, you’re also trying to get some of the adjacent
areas as well. And I think just by being real smart with the capital and really continuing to push
fiber deeper and deeper into the network, you know, we’ll be successful over time competing
and delivering the speeds that our customers require.”
Stewart Ewing, EVP and CFO, CenturyLink, Inc. - August 2011
•A key competitive response by telephone companies to cable MSO’s
•CenturyLink, Dycom’s 3rd largest customer, just beginning scale deployments
•Dycom is leveraging prior, extensive FTTx experience with Verizon and AT&T
Sources: Company Filings

12
Why Dycom?
n Established customer relationships and reputation
n Broad geographic coverage
n Scale to satisfy customer time and service requirements
n Access to capital
n Responsive, local business units
13
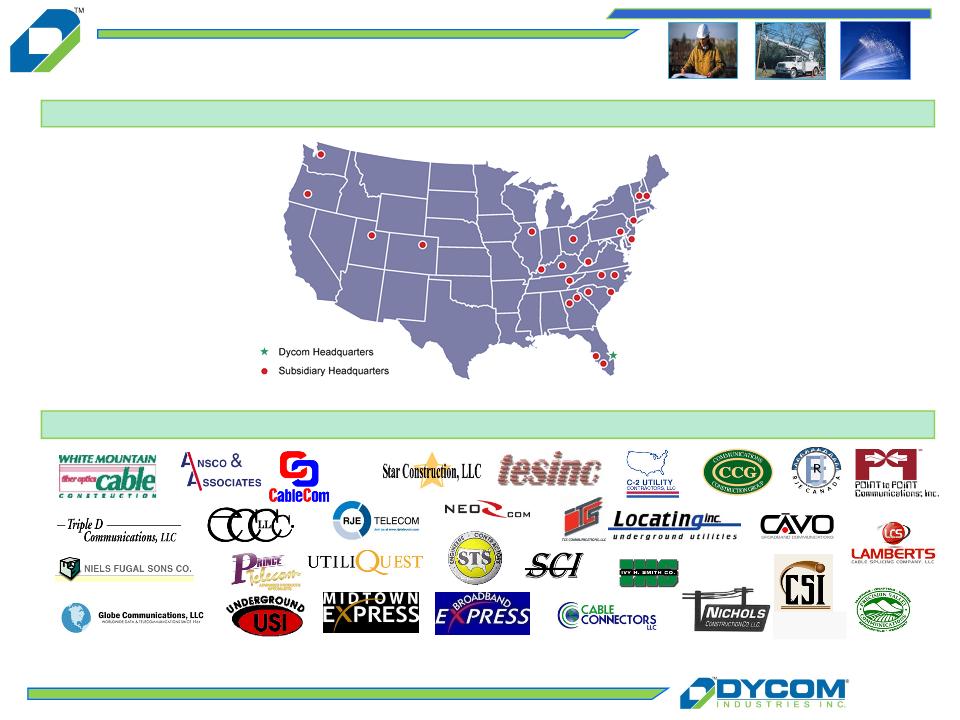
Subsidiaries
Dycom’s Nationwide Presence
Local Credibility, National Capability

14
Focused on High Value Profitable Growth
n Positioned in front of emerging technology trends
which drive capital spending
which drive capital spending
n Deliberately targeting high quality, long-term industry
leaders which generate the vast majority of the
industry’s profitable opportunities
leaders which generate the vast majority of the
industry’s profitable opportunities
n Selectively acquiring businesses which complement
our existing footprint and enhance our customer
relationships
our existing footprint and enhance our customer
relationships
n Leveraging our scale and expertise to expand margins
through best practices
through best practices
15
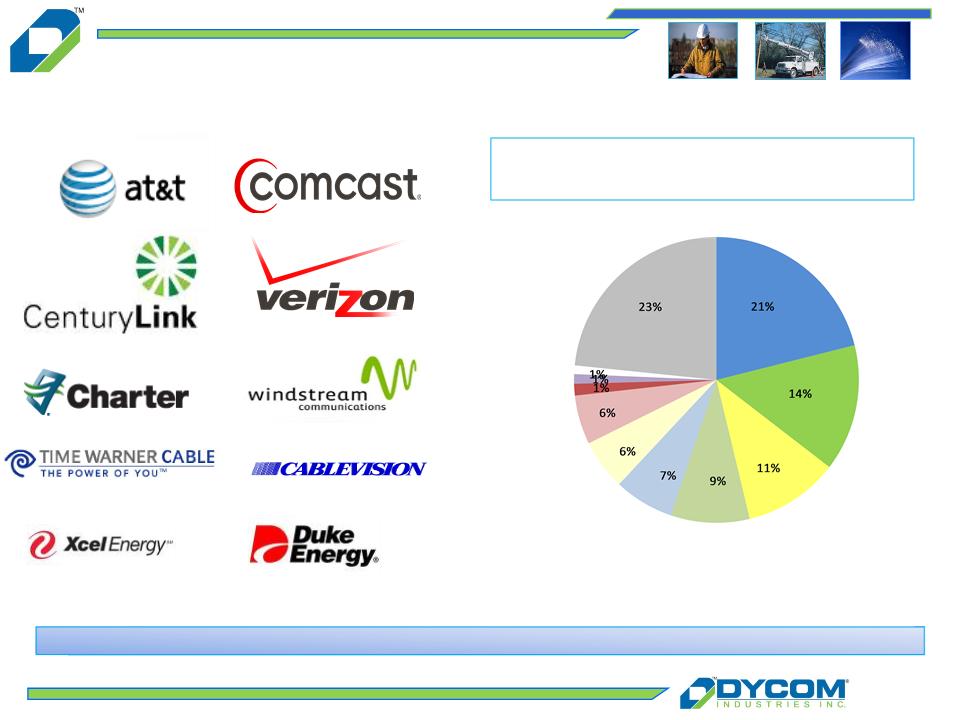
Blue-chip, predominantly investment grade clients comprise the vast majority of revenue
Well Established Customers
Fiscal Year Ended July 30, 2011
Customer Revenue Breakdown
Comcast
AT&T
CenturyLink
Verizon
Windstream
Cablevision
Charter
Xcel Energy
Time Warner
Cable
Other
Duke Energy
16
Durable Customer Relationships
For comparison purposes, when customers have been combined through acquisition or merger, their revenues have been combined for all periods.
17
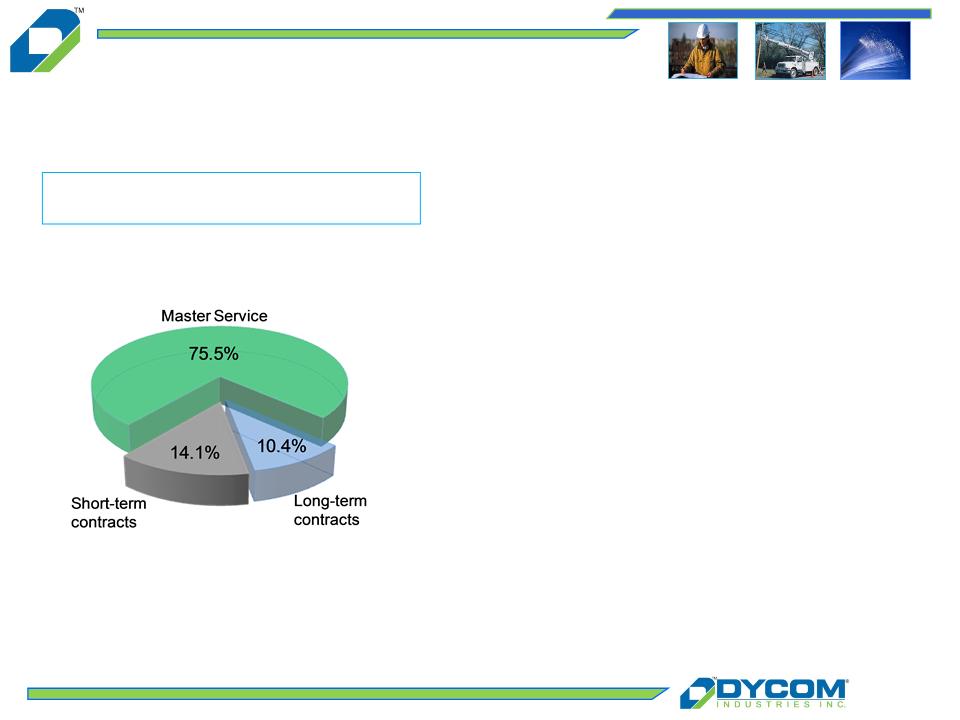
n Master Service Agreements (MSA’s)
} Multi-year, multi-million dollar
arrangements covering thousands of
individual work orders
arrangements covering thousands of
individual work orders
} Generally exclusive requirement
contracts
contracts
n Long-term contracts relate to specific
projects with terms in excess of one year from
the contract date
projects with terms in excess of one year from
the contract date
n As of July 30, 2011, Dycom was party to
approximately 200 MSA’s and other
arrangements with customers that extend
for periods of one or more years
for periods of one or more years
n Short-term contracts relate to spot market
requirements
requirements
n Significant majority of contracts are based on
units of delivery
units of delivery
Revenue By Contract Type
Fiscal Year Ended July 30, 2011
Fiscal Year Ended July 30, 2011
Anchored by Long-Term Agreements
18
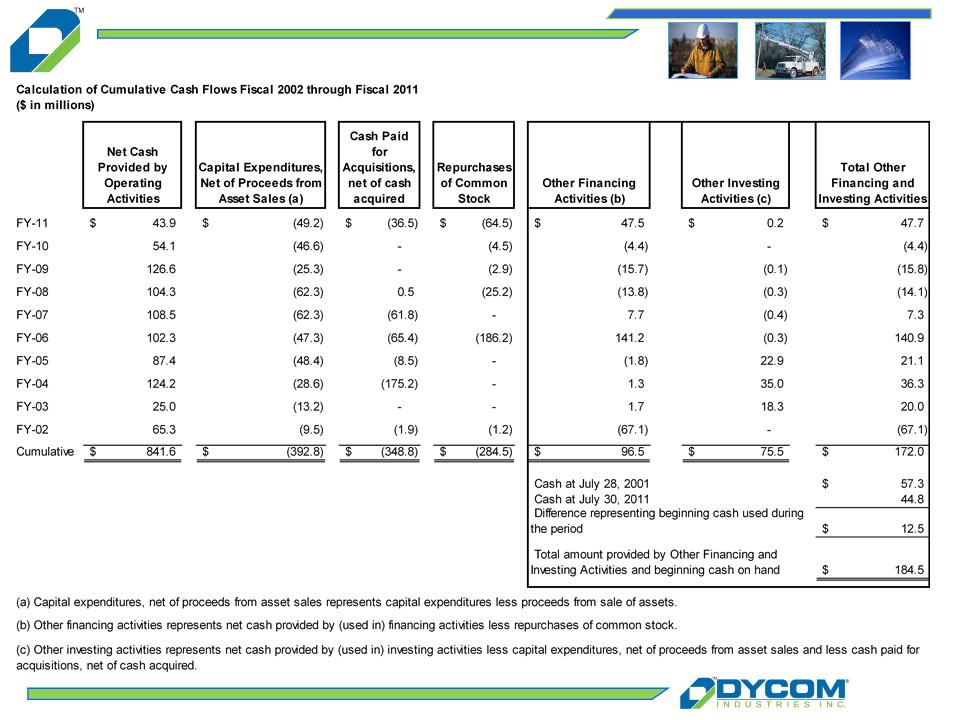
Robust Cash Flow - Investing for Growth
$842 million
Cash flow from operations
Cash flow from operations
$184 million
provided by other financing and investing activities and beginning cash on hand
$349 million
Business
acquisitions
Business
acquisitions
$393 million
Capital
expenditures,
net
expenditures,
net
$284 million
Share
repurchases
Share
repurchases
Cumulative Cash Flows Fiscal 2002 - Fiscal 2011
Note: Amounts hereon represent cumulative cash flow amounts for fiscal 2002 - fiscal 2011;
See “Regulation G Disclosure” a summary of amounts.
See “Regulation G Disclosure” a summary of amounts.

19
Capital Allocated to Maximize
Shareholder Returns
Shareholder Returns
n Organic growth, robust free cash flow and renewed confidence in
industry outlook promotes capital allocation strategy to further
expand shareholder returns
industry outlook promotes capital allocation strategy to further
expand shareholder returns
n Acquisitions of NeoCom Solutions and Communication Services in
FY 2011 supplement organic growth and contribute to equity returns
FY 2011 supplement organic growth and contribute to equity returns
n Share repurchases of 13.9% of outstanding shares in fiscal 2011
creates incremental shareholder value and reduces equity claims on
future earnings
creates incremental shareholder value and reduces equity claims on
future earnings

Financial Update

21
nOrganic revenue growth trends improving
nMargins and earnings are expanding
nStrong balance sheet
nSolid cash flows and liquidity
nCapital structure designed to produce strong equity returns
Financial Overview
22
Organic Growth Returning
n Organic revenue growth has
increased since Q1-2010 reflecting
improved operating environment
and new contract awards
increased since Q1-2010 reflecting
improved operating environment
and new contract awards
n Organic growth accelerated in the
second half of FY 2011
second half of FY 2011
n NeoCom Solutions and
Communication Services
contributed aggregate revenues of
$33.8 million in FY 2011
Communication Services
contributed aggregate revenues of
$33.8 million in FY 2011
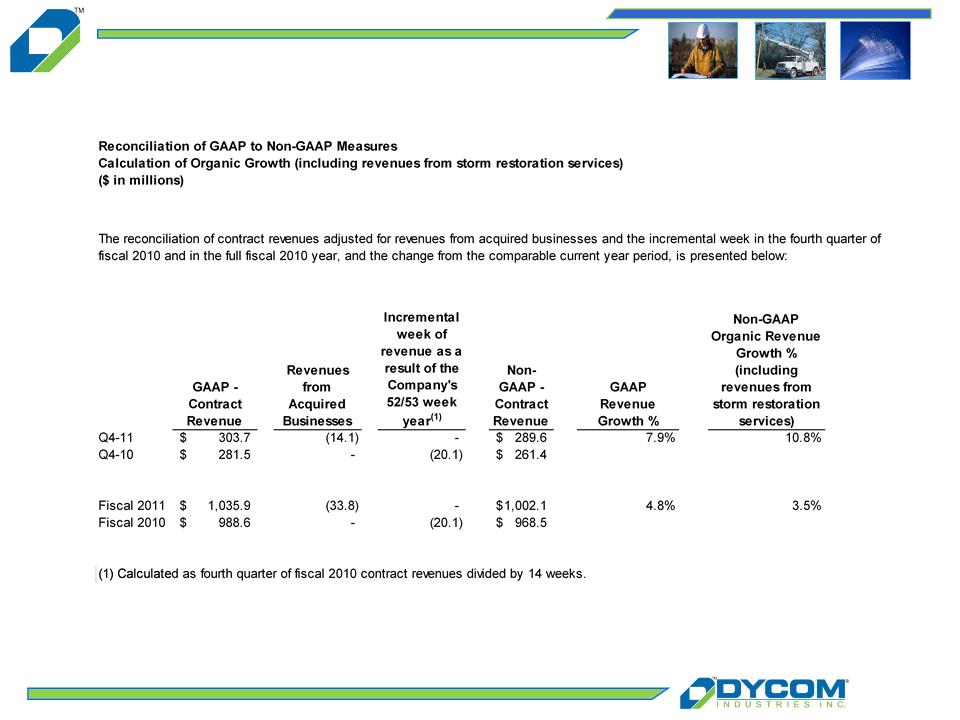
Note: See “Regulation G Disclosure” slides for a reconciliation of GAAP to Non-GAAP financial measures.
(a)Fiscal 2010 includes an incremental week as the result of our 52/53 week fiscal year.
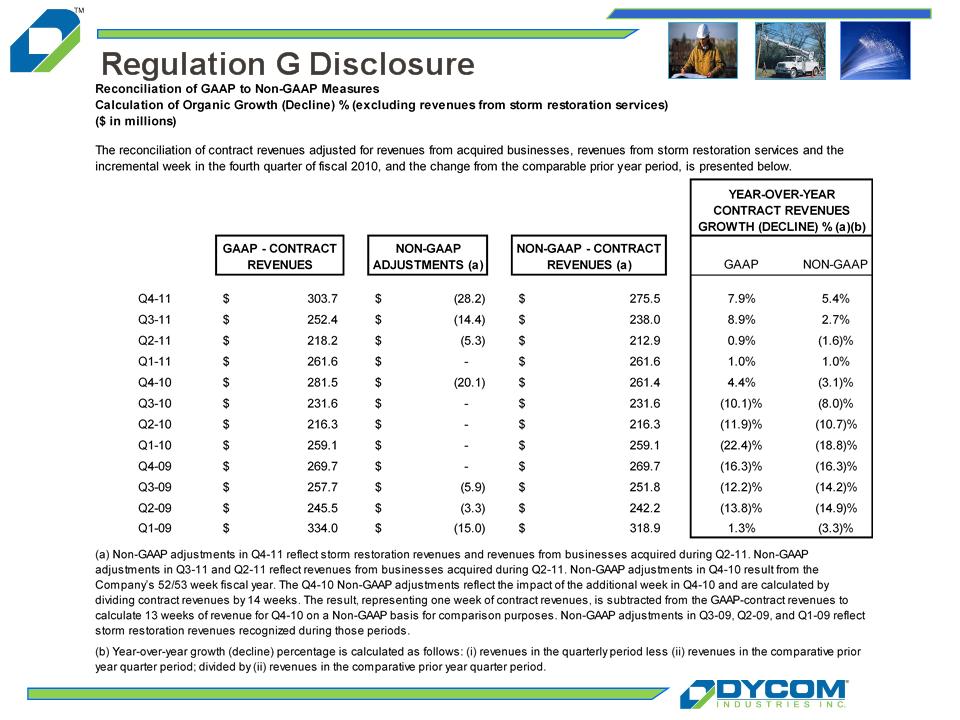
(b)Quarterly organic revenue percentage excludes storm restoration services, revenues from acquired businesses
and is adjusted for the additional week in Q4-10 as a result of our 52/53 week fiscal year.
and is adjusted for the additional week in Q4-10 as a result of our 52/53 week fiscal year.
23
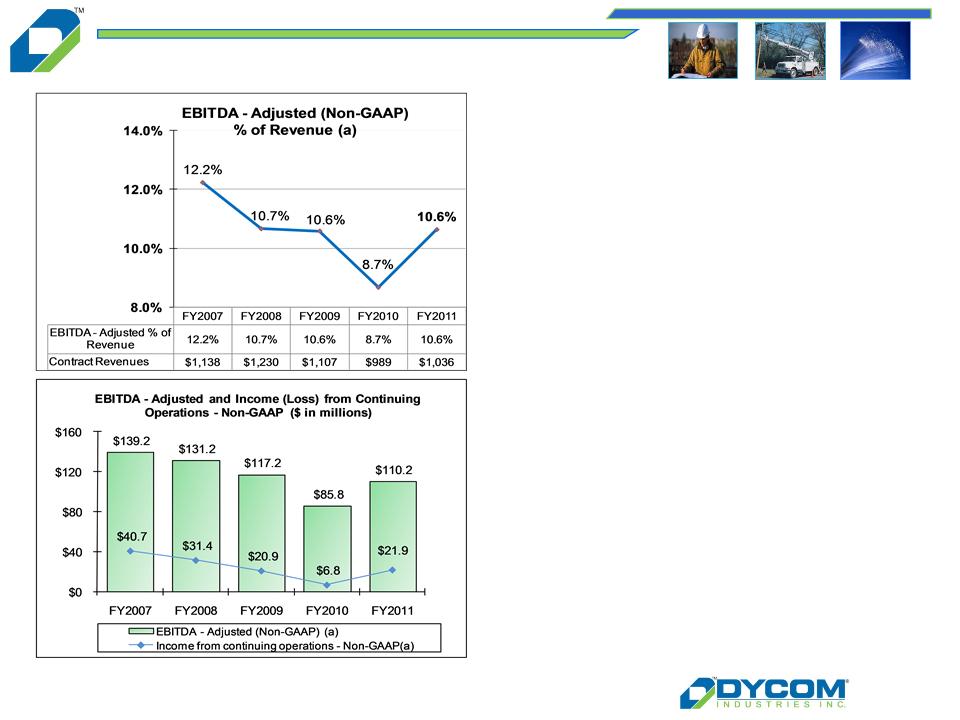
Margins and Earnings Expanding
n FY 2011 EBITDA -Adjusted
grew, driven by higher
revenues and improved cost
structure
grew, driven by higher
revenues and improved cost
structure
n Margins and earnings grew
at a higher rate than
revenue growth
at a higher rate than
revenue growth
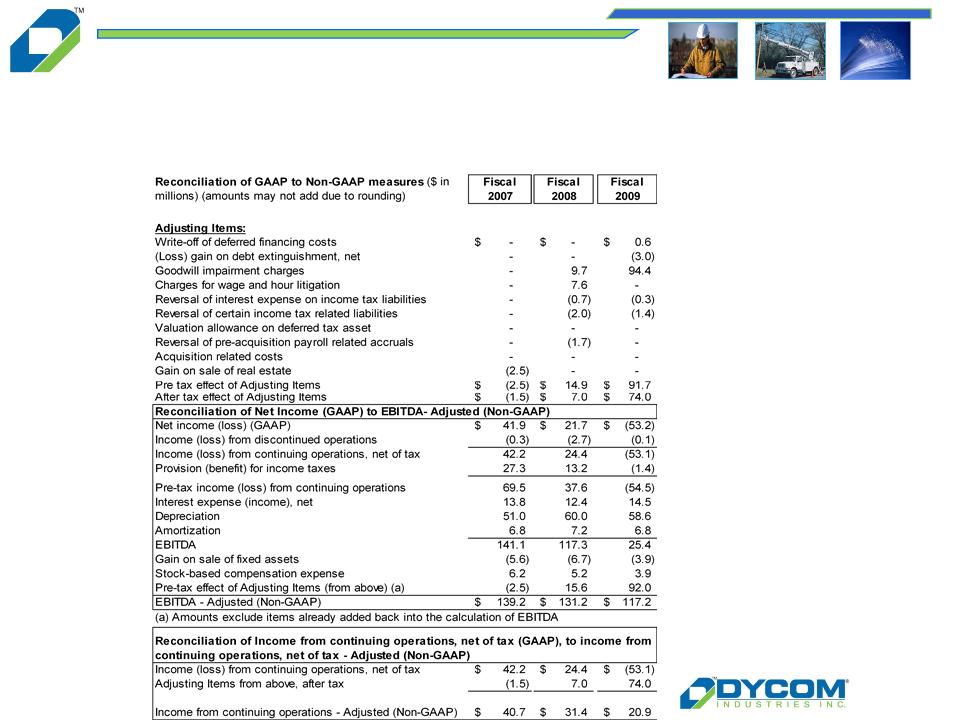
Note: See “Regulation G Disclosure” slides for a reconciliation of GAAP to Non-GAAP financial measures.
(a)The amounts and percentages for EBITDA - Adjusted and amounts for Income from continuing operations -Non-
GAAP are Non-GAAP financial measures adjusted to exclude certain items.
GAAP are Non-GAAP financial measures adjusted to exclude certain items.
24
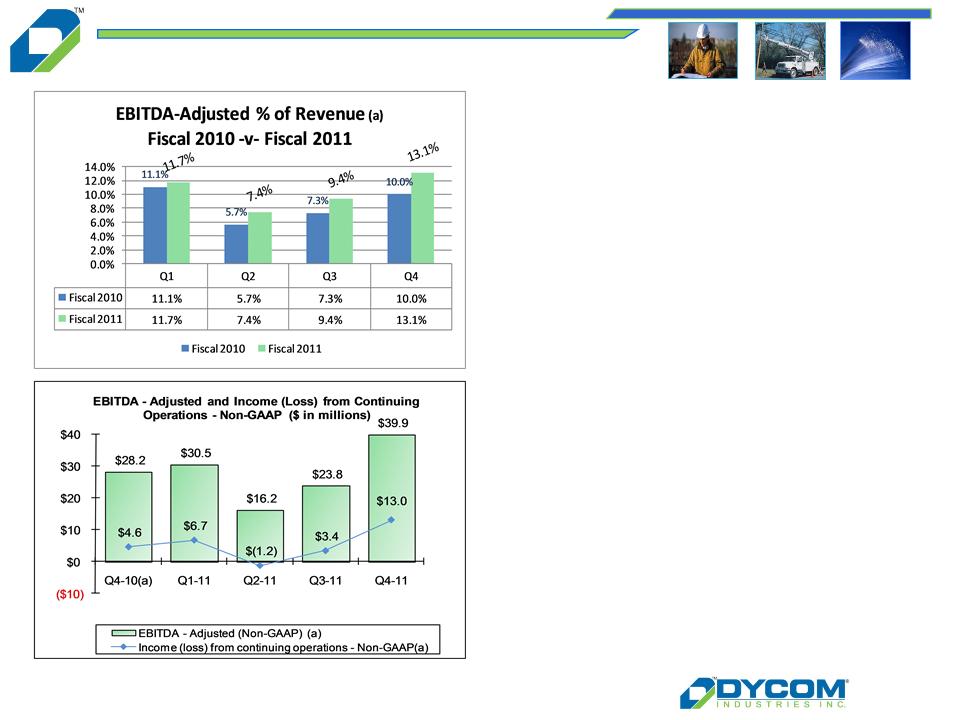
Accelerating through Q3 and Q4
n Growth in EBITDA-Adjusted %
expanded during FY 2011 and
improved each quarterly period
expanded during FY 2011 and
improved each quarterly period
n EBITDA -Adjusted growth
contributes to bottom line
expansion
contributes to bottom line
expansion
n Net income of $13.0 million,$0.38
per share in Q4-2011, represents
highest quarterly earnings per
share since the October 2000
quarter
per share in Q4-2011, represents
highest quarterly earnings per
share since the October 2000
quarter
Note: See “Regulation G Disclosure” slides for a reconciliation of GAAP to Non-GAAP financial measures.
(a)The amounts and percentages for EBITDA - Adjusted and amounts for Income from continuing operations -Non-
GAAP are Non-GAAP financial measures adjusted to exclude certain items.
GAAP are Non-GAAP financial measures adjusted to exclude certain items.
25
Strong Balance Sheet, Solid Cash Flow
n Financial profile positioned to address
emerging industry opportunities
emerging industry opportunities
} Fiscal 2021 maturity of Senior
Subordinated Notes
Subordinated Notes
} Net debt to EBITDA-Adjusted of 1.3x
suitable for growth (a)
suitable for growth (a)
} Increasing availability on Senior Credit
Agreement
Agreement
n Solid operating cash flows
Note: See “Regulation G Disclosure” slides for a reconciliation of GAAP to Non-GAAP financial measures.
(a)The ratio of Net debt to EBITDA-Adjusted is a Non-GAAP financial measure adjusted to exclude certain items.
(b)Capital expenditures are presented net of proceeds from the sale of assets.
26
Strategy for Success
Organic
Growth
Growth
Lower Share Count
Higher
Equity
Returns
Equity
Returns

Supplemental schedules
Regulation G Disclosures
28
Regulation G Disclosure
29
30
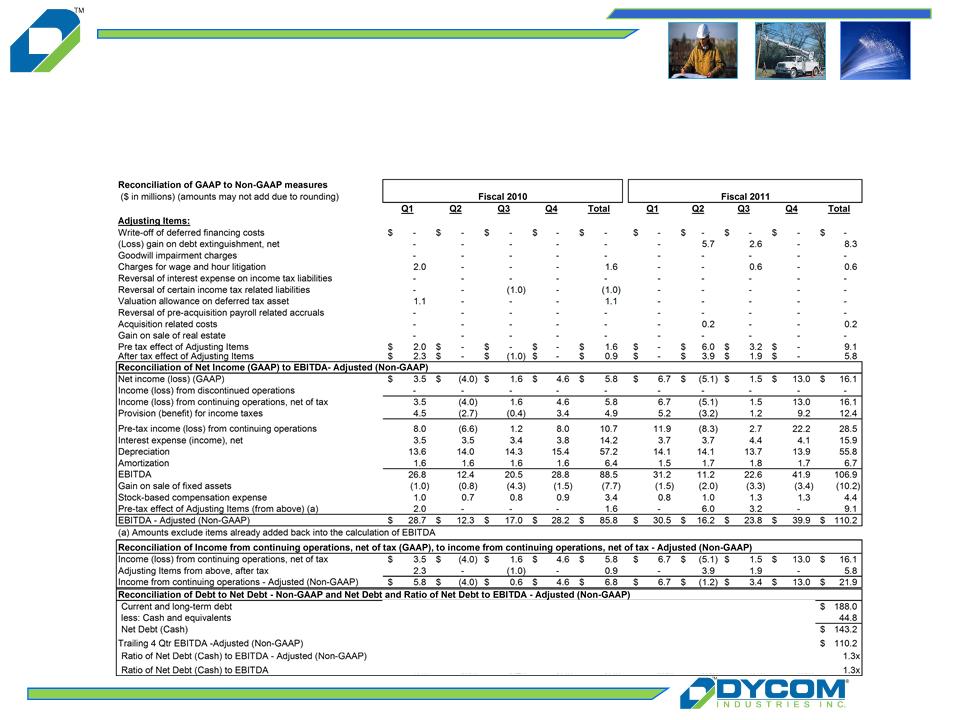
Regulation G Disclosure
The below table presents the Non-GAAP financial measures of EBITDA and Adjusted EBITDA for the respective periods. EBITDA and Adjusted EBITDA are Non-GAAP financial measures within the meaning of Regulation G
promulgated by the Securities and Exchange Commission. The Company defines EBITDA as earnings before interest, taxes, depreciation and amortization, and defines Adjusted EBITDA as earnings before interest, taxes,
depreciation and amortization, gain on sale of fixed assets, stock-based compensation expense and Adjusting items. The Company believes these Non-GAAP financial measures provide information that is useful to the Company’s
investors. The Company believes that this information is helpful in understanding period-over-period operating results separate and apart from items that may, or could, have a disproportionate positive or negative impact on the
Company’s results of operations in any particular period. Additionally, the Company uses these Non-GAAP financial measures to evaluate its past performance and prospects for future performance. EBITDA and Adjusted EBITDA
are not recognized terms under GAAP and do not purport to be an alternative to net income, operating cash flows, or a measure of earnings. Because all companies do not use identical calculations, this presentation of Non-GAAP
financial measures may not be comparable to other similarly titled measures of other companies. These tables present a reconciliation of EBITDA and Adjusted EBITDA to the most directly comparable GAAP measure.
31
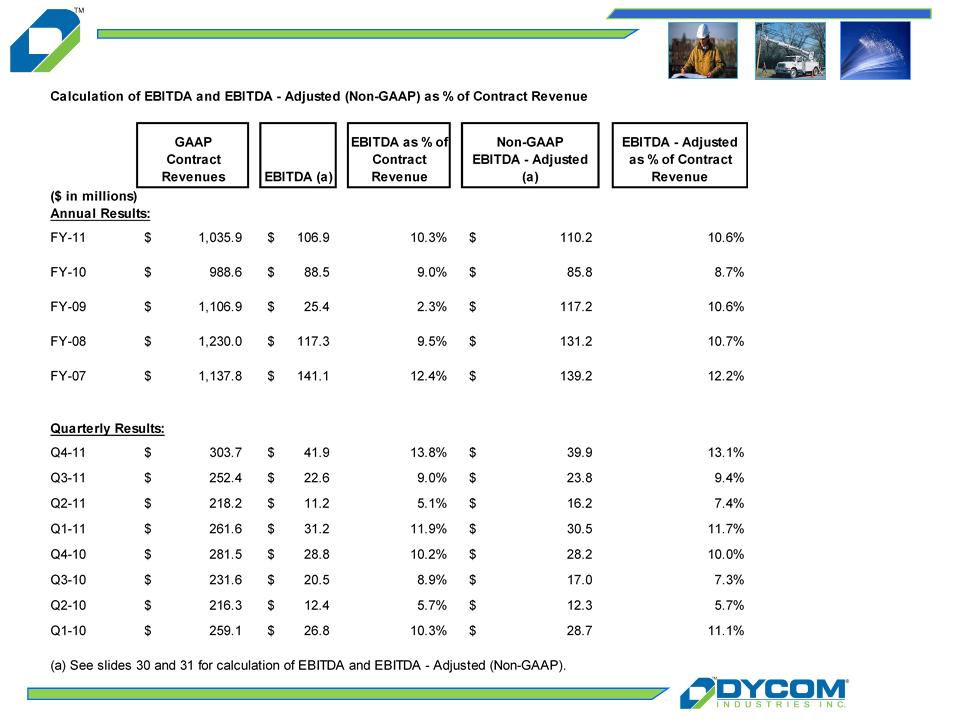
Regulation G Disclosure
The below table presents the Non-GAAP financial measures of EBITDA and Adjusted EBITDA for the respective periods. EBITDA and Adjusted EBITDA are Non-GAAP financial measures within the meaning of Regulation G
promulgated by the Securities and Exchange Commission. The Company defines EBITDA as earnings before interest, taxes, depreciation and amortization, and defines Adjusted EBITDA as earnings before interest, taxes,
depreciation and amortization, gain on sale of fixed assets, stock-based compensation expense and Adjusting items. The Company believes these Non-GAAP financial measures provide information that is useful to the Company’s
investors. The Company believes that this information is helpful in understanding period-over-period operating results separate and apart from items that may, or could, have a disproportionate positive or negative impact on the
Company’s results of operations in any particular period. Additionally, the Company uses these Non-GAAP financial measures to evaluate its past performance and prospects for future performance. EBITDA and Adjusted EBITDA
are not recognized terms under GAAP and do not purport to be an alternative to net income, operating cash flows, or a measure of earnings. Because all companies do not use identical calculations, this presentation of Non-GAAP
financial measures may not be comparable to other similarly titled measures of other companies. These tables present a reconciliation of EBITDA and Adjusted EBITDA to the most directly comparable GAAP measure.
promulgated by the Securities and Exchange Commission. The Company defines EBITDA as earnings before interest, taxes, depreciation and amortization, and defines Adjusted EBITDA as earnings before interest, taxes,
depreciation and amortization, gain on sale of fixed assets, stock-based compensation expense and Adjusting items. The Company believes these Non-GAAP financial measures provide information that is useful to the Company’s
investors. The Company believes that this information is helpful in understanding period-over-period operating results separate and apart from items that may, or could, have a disproportionate positive or negative impact on the
Company’s results of operations in any particular period. Additionally, the Company uses these Non-GAAP financial measures to evaluate its past performance and prospects for future performance. EBITDA and Adjusted EBITDA
are not recognized terms under GAAP and do not purport to be an alternative to net income, operating cash flows, or a measure of earnings. Because all companies do not use identical calculations, this presentation of Non-GAAP
financial measures may not be comparable to other similarly titled measures of other companies. These tables present a reconciliation of EBITDA and Adjusted EBITDA to the most directly comparable GAAP measure.
32
Regulation G Disclosure
33
Regulation G Disclosure

D.A. Davidson
10th Annual Engineering &
Construction Conference
September 20-21, 2011
10th Annual Engineering &
Construction Conference
September 20-21, 2011