Exhibit 99.2
Review of Acquisition of
Quanta Services’ Telecommunications
Infrastructure Services Subsidiaries
Fiscal 2013
1st Quarter Presentation
November 20, 2012
2
Participants
Steven E. Nielsen President & Chief Executive Officer Timothy R. Estes Chief Operating Officer H. Andrew DeFerrari Chief Financial Officer Richard B. Vilsoet General Counsel |
3
Forward-Looking Statements and
Non-GAAP Information
Forward-Looking Statements and
Non-GAAP Information
Fiscal 2013 first quarter results are unaudited. This presentation contains “forward-looking statements” which are statements
relating to future events, including a proposed acquisition, future financial performance, strategies, expectations, and the
competitive environment. All statements, other than statements of historical facts, contained in this presentation, including
statements regarding the Company’s future financial position, future revenue, prospects, plans and objectives of
management, are forward-looking statements. Additionally, forward -looking statements include statements of expectations
regarding the proposed acquisition, including expected benefits and synergies of the transaction, future financial and
operating results, future opportunities for the combined businesses and other statements regarding events or developments
that the Company believes or anticipates will or may occur in the future as a result of the transaction. Words such as
“believe,” “expect,” “anticipate,” “estimate,” “intend,” “forecast,” “may,” “should,” “could,” “project,” “looking ahead” and similar
expressions, as well as statements in future tense, identify forward-looking statements. You should not read forward looking
statements as a guarantee of future performance or results. They will not necessarily be accurate indications of whether or
at what time such performance or results will be achieved. Forward-looking statements are based on information available
at the time those statements are made and/or management’s good faith belief at that time with respect to future
events, including the Company’s ability to consummate the proposed acquisition. Such statements are subject to risks and
uncertainties that could cause actual performance or results to differ materially from those expressed in or suggested by the
forward-looking statements. Important factors that could cause such differences include, but are not limited to factors
described under Item 1A, “Risk Factors” of the Company’s Annual Report on Form 10-K for the year ended July 28, 2012,
and other risks outlined in the Company’s periodic filings with the Securities and Exchange Commission (“SEC”). The
forward-looking statements in this presentation are expressly qualified in their entirety by this cautionary statement. Except
as required by law, the Company may not update forward-looking statements even though its situation may change in the
future.
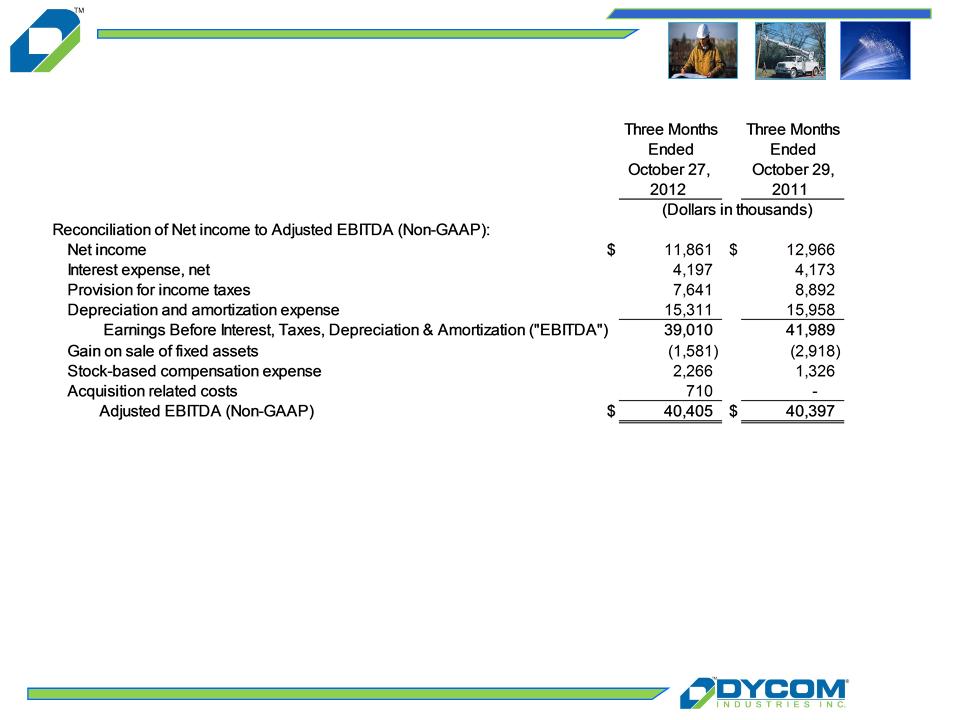
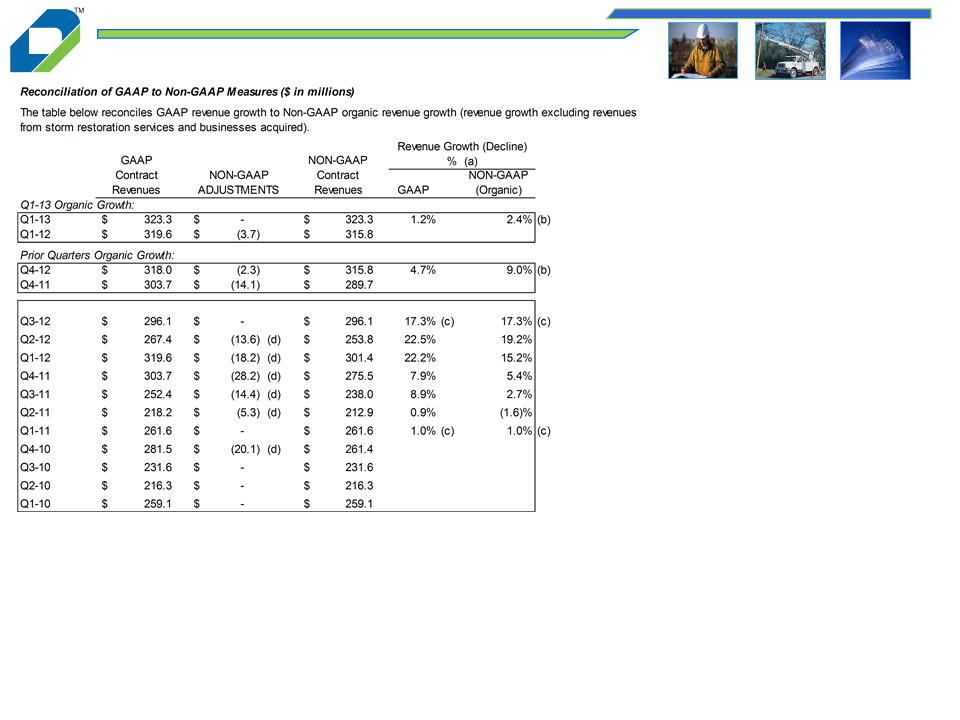
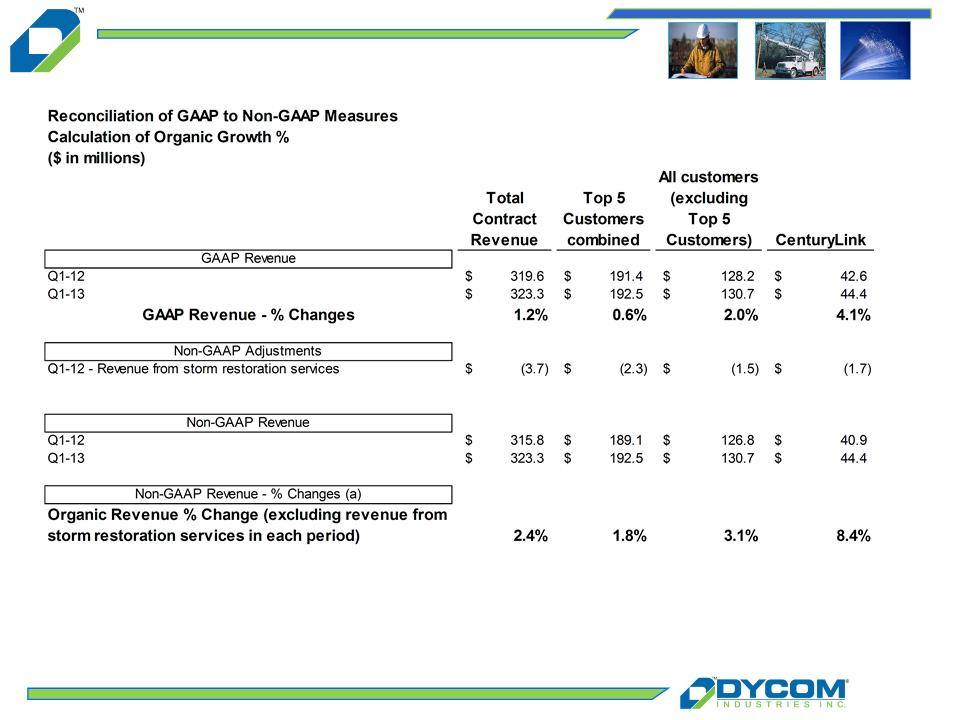
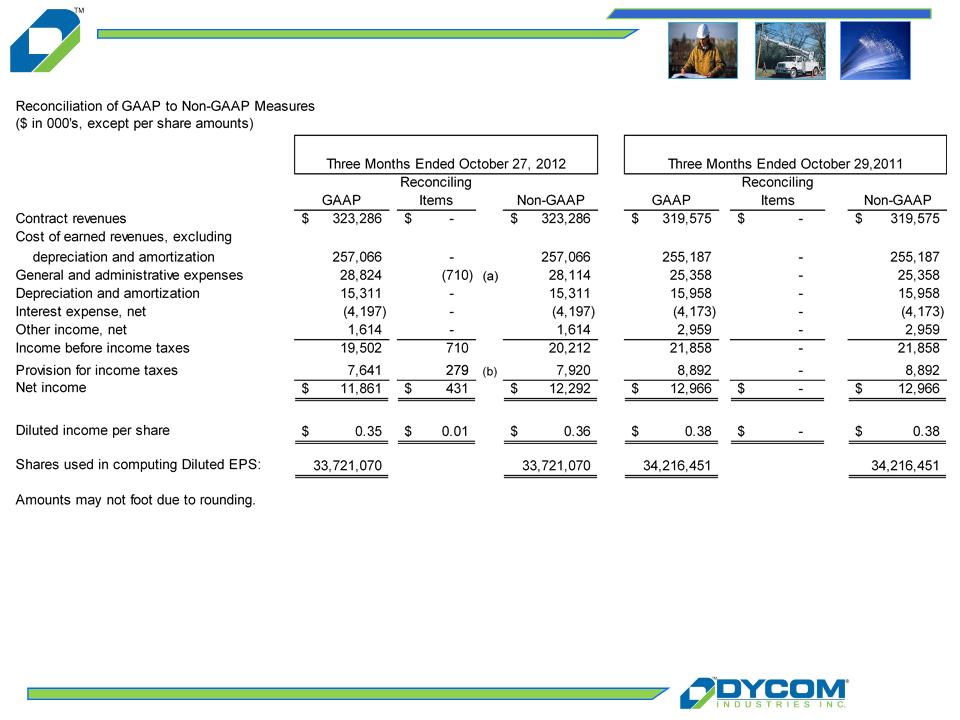
This presentation includes certain “Non-GAAP” financial measures as defined by SEC rules. We believe that the
presentation of certain Non-GAAP financial measures provides information that is useful to investors because it allows for a
more direct comparison of our performance for the period with our performance in the comparable prior-year periods. As
required by the SEC, we have provided a reconciliation of those measures to the most directly comparable GAAP measures
on the Regulation G slides included as slides 19 through 22 of this presentation. We caution that Non-GAAP financial
measures should be considered in addition to, but not as a substitute for, our reported GAAP results.
4
Overview of the Transaction
n Purchase price of approximately $275 million, subject to
adjustments for working capital and other specified items
n Subsidiaries acquired represent substantially all of Quanta’s
domestic telecommunications infrastructure services operations
n Financed through a new $400 million senior secured credit facility
n Expected to close by December 31, 2012
5
Strategic Rationale
n Strengthens our customer base, geographic scope, and technical
service offerings
service offerings
n Reinforces our rural engineering and construction capabilities,
wireless construction resources, and broadband construction
competencies
wireless construction resources, and broadband construction
competencies
n Creates scale as industry announcements indicate customer
expenditures will be growing
n Attractive financing environment drives strong investment returns
n Experienced management team with solid industry reputation
6
Nationwide Operations
Well-known subsidiaries strengthen Dycom’s geographic reach
Operating Headquarter Locations
Subsidiaries
7
Dycom Pro Forma Customer Mix
Note: Dycom financials reflect July 2012 fiscal year end. Quanta’s telecommunications infrastructure services subsidiaries reflects trailing twelve months ended September 30, 2012.
Transaction strengthens existing customer relationships and diversifies customer base
Revenue: | $1.2 billion | $0.5 billion | $1.7 billion |
8
Financing and Liquidity
n Financing to be provided by a new, five-year $400 million senior
secured credit facility
} $125 million term loan A
} Revolver borrowings
n Terms and covenants that reflect a larger combined business
n Ample cash flows expected to reduce borrowings in the near to
intermediate term
intermediate term
n Acquisition structured to produce attractive tax benefits
n Strong balance sheet and ample liquidity
9
Looking Ahead
n Revenue from acquired subsidiaries for calendar year 2013
expected to range from $400 million to $450 million
n One-time transaction and integration costs of approximately $12
million to $15 million
n Excluding one-time costs, currently expecting $0.05 to $0.10 per
share of earnings accretion on an annual basis, after non-cash
amortization expense
share of earnings accretion on an annual basis, after non-cash
amortization expense
n Pleased to grow our company with a strong complementary
management team and dedicated employees
Dycom Fiscal 2013
1st Quarter Results
11
Q1-2013 Overview
n Contract revenue of $323.3 million as compared to $319.6 million in the prior
year quarter
year quarter
n Contract revenue grew organically 2.4%, excluding storm restoration services
of $3.7 million in Q1-12
n Adjusted EBITDA of $40.4 million at 12.5% of revenue in Q1-13
n Non-GAAP Net income of $0.36 per share diluted compared to $0.38 per
share diluted in Q1-12
n Repurchased 1,047,000 common shares at an average price of $14.52 per
share during the quarter
See “Regulation G Disclosure” slides 19-22 for a reconciliation of GAAP to Non-GAAP financial measures.
12
Note: See “Regulation G Disclosure” slides 19-22 for reconciliation of GAAP to Non-GAAP financial measures.
n Top 5 customers represented 59.6% of revenue in
Q1-13 and 59.9% in Q1-12
Ø CenturyLink, Dycom’s largest customer, grew
organically 8.4% year over year
Ø Windstream, Dycom’s fifth largest customer, grew
in excess of 47% year over year
n Organic revenue growth of 2.4%, excluding revenue from
storm restoration services in each period
Ø Revenue from Top 5 customers up 1.8%
organically
organically
Ø Combined revenue from other customers up 3.1%
organically
organically
13
Backlog and Awards
Current Awards and Extensions
Customers | Description | Area | Approximate Term (in years) |
nAT&T | Construction and Maintenance Services | South Carolina | 3 |
nCharter Communications | Construction and Maintenance Services | Alabama | 1 |
nTime Warner Cable | Underground Facility Locating | California | 1 |
nQuestar Gas | Pipeline Construction Projects | Utah | 1 |
nVarious | Rural broadband | Kentucky, Georgia, North Carolina, Missouri | 1 |
14
Summary Results
($ in millions, except per share data) | Q1-12 | Q1-13 |
Net Income-Non GAAP | $ 13.0 | $ 12.3 |
Fully Diluted EPS- Non-GAAP | $0.38 | $0.36 |
Organic revenue growth of 2.4%, after adjusting for storm work
in Q1-12
in Q1-12
Adjusted EBITDA remains strong at $40.4 million
Non-GAAP EPS of $0.36 per common share diluted
Revenue from Telecommunications customers 86.3% of total
Note: The organic revenue percentage of 2.4% excludes storm restoration
services of $3.7 million in Q1-12. Non-GAAP net income for Q1-13
excludes $0.7 million of pre-tax acquisition related costs. See “Regulation G
Disclosure” slides 19-22 for a reconciliation of GAAP to Non GAAP
financial measures.
services of $3.7 million in Q1-12. Non-GAAP net income for Q1-13
excludes $0.7 million of pre-tax acquisition related costs. See “Regulation G
Disclosure” slides 19-22 for a reconciliation of GAAP to Non GAAP
financial measures.
15
Selected Information
(a) Amounts may not foot due to rounding.
(b) Percentages disclosed under the financial amounts for Q1-13 and Q1-12 represent the percentage of contract revenues for the applicable
period.
period.
(c) Excludes $0.7 million in acquisition related costs.
Q1-13
Q1-12
Change (a)
($ in millions)(b)
Contract Revenues
$
323.3
$
319.6
$
3.7
Cost of Earned Revenues
$
257.1
79.5%
$
255.2
79.9%
$
1.9
General & Administrative-
Non-GAAP(c)
Non-GAAP(c)
$
28.1
8.7%
$
25.4
7.9%
$
2.8
Depreciation &
Amortization
Amortization
$
15.3
4.7%
$
16.0
5.0%
$
(0.6)
Interest Expense, net
$
4.2
1.3%
$
4.2
1.3%
$
-
Other Income, net
$
1.6
0.5%
$
3.0
0.9%
$
(1.3)
Net Income-Non-GAAP
$
12.3
3.8%
$
13.0
4.1%
$
(0.7)
Adjusted EBITDA - Non-
GAAP
GAAP
$
40.4
12.5%
$
40.4
12.6%
$
-
Organic Revenue growth of 2.4%,
excluding revenues from storm restoration services
in Q1-12
excluding revenues from storm restoration services
in Q1-12
nGrowth within existing contracts
nRural broadband projects
Adjusted EBITDA of $40.4 million
nGrowth in operations
nMargin Improvement
Note: See “Regulation G Disclosure” slides 19-22 for a reconciliation of GAAP to Non-GAAP financial measures.
16
Cash Flow and Liquidity
Strong Operating Cash Flows
nCash flow of $27.7 million during the quarter
nCapital expenditures, net of disposals, of
$10.5 million
$10.5 million
Balance Sheet Strength
nAmple liquidity from cash on hand of $54.7
million and $180.9 million of availability under
Senior Credit Agreement as of October 27,
2012
million and $180.9 million of availability under
Senior Credit Agreement as of October 27,
2012
nRepurchased 1,047,000 shares of common
stock at an average price of $14.52 per share
during Q1-13
stock at an average price of $14.52 per share
during Q1-13
17
Summary
n Firm end market opportunities
} Industry participants aggressively extending or deploying
fiber networks to provide wireless backhaul services
} Broadband stimulus funding network construction for rural
service providers
service providers
} Cable operators continuing to deploy fiber to small and
medium businesses
medium businesses
} Wireless carriers upgrading from 3G to 4G technologies
} Telephone companies deploying FTTX to enable video
offerings
offerings
n Increased market share as our customers consolidate vendor
relationships and reward scale
18
Looking Ahead
(Excludes effects of announced acquisition for revenues and
operating results)
operating results)
n Revenue trends which are improving year over year, excluding storm restoration services
n Margins, general and administrative expenses and other income in-line with previous
expectations
expectations
n Subject to our pending acquisition, strong cash flows dedicated to debt repayment
n Confident that solid operations will continue for a sustained period
Q2 - 2013:
n Revenues which are slightly up year over year, after excluding approximately $9 million of
expected storm restoration revenues during Q2-2013
n Gross margins up 75 to 100 basis points year over year
n General and administrative expense which declines slightly on a sequential basis reflecting
lower performance-based incentive compensation
n Depreciation and amortization which is slightly down on a sequential basis
n Other income which decreases sequentially by approximately $0.8 million from Q1-13
19
Appendix: Regulation G Disclosure
The above table presents the Non-GAAP financial measure of Adjusted EBITDA for the three months ended October 27, 2012 and October 29, 2011
and a reconciliation of Adjusted EBITDA to the most directly comparable GAAP measure. Adjusted EBITDA is a Non-GAAP financial measure within
the meaning of Regulation G promulgated by the Securities and Exchange Commission. The Company defines Adjusted EBITDA as earnings before
interest, taxes, depreciation and amortization, gain on sale of fixed assets, stock-based compensation expense, and acquisition-related costs. The
Company believes this Non-GAAP financial measure provides information that is useful to the Company’s investors. The Company believes that this
information is helpful in understanding period-over-period operating results separate and apart from items that may, or could, have a disproportionate
positive or negative impact on the Company’s results of operations in any particular period. Additionally, the Company uses this Non-GAAP financial
measure to evaluate its past performance and prospects for future performance. Adjusted EBITDA is not a recognized term under GAAP and does not
purport to be an alternative to net income, operating cash flows, or a measure of earnings. Because all companies do not use identical calculations,
this presentation of Non-GAAP financial measures may not be comparable to other similarly titled measures of other companies.
20
(a) Year-over-year growth (decline) percentage is calculated as follows: (i) revenues in the quarterly period less (ii) revenues in the comparative prior year quarter
period; divided by (ii) revenues in the comparative prior year quarter period.
(b) Q1-13 organic growth excludes storm restoration revenues of $3.7 million in Q1-12 . Q4-12 organic growth excludes storm restoration revenues of $2.3 million in Q4
-12 and $14.1 million in Q4-11.
(c) For Q3-12, GAAP and Non-GAAP revenue growth percentages are the same as revenues from business acquired in 2011 were included for the full quarter in each
period and there were no other Non-GAAP adjustments in either period. For Q1-11, GAAP and Non-GAAP revenue growth percentages are the same as there were no
Non-GAAP adjustments in either period.
period and there were no other Non-GAAP adjustments in either period. For Q1-11, GAAP and Non-GAAP revenue growth percentages are the same as there were no
Non-GAAP adjustments in either period.
(d) Non-GAAP adjustments in Q2-12, Q3-11 and Q2-11 reflect revenues from businesses acquired during Q2-11. Non-GAAP adjustments in Q1-12 reflect storm
restoration revenues ($3.7 million) and revenues from businesses acquired during Q2-11 ($14.5 million). Non-GAAP adjustments in Q4-11 for fiscal 2011 fourth
quarter year-over-year organic growth reflects storm restoration revenues ($14.1 million) and revenues from businesses acquired during Q2-11 ($14.1 million). Non-
GAAP adjustments in Q4-10 result from the Company’s 52/53 week fiscal year. The Q4-10 Non-GAAP adjustments reflect the impact of the additional week in Q4-10
and are calculated by dividing contract revenues by 14 weeks. The result, representing one week of contract revenues, is subtracted from the GAAP-contract revenues
to calculate 13 weeks of revenue for Q4-10 on a Non-GAAP basis for comparison purposes.
Appendix: Regulation G Disclosure
Amounts may not foot due to rounding.
21
Appendix: Regulation G Disclosure
(a) Year-over-year growth percentage is calculated as follows: (i) revenues in the quarterly period less (ii) revenues in the comparative prior year quarter period; divided
by (ii) revenues in the comparative prior year quarter period.
Amounts may not foot due to rounding.
22
Appendix: Regulation G Disclosure
The items reconciling "GAAP" to “Non-GAAP” financial measures are specifically described below:
(a) Acquisition related costs.
(b) Provision for income taxes includes the tax effect of the other reconciling items identified herein.
Review of Acquisition of
Quanta Services’ Telecommunications
Infrastructure Services Subsidiaries
Fiscal 2013
1st Quarter Presentation
November 20, 2012