
Fiscal 2013 2nd Quarter Presentation February 27, 2013 Exhibit 99.2
2 Participants Steven E. Nielsen President & Chief Executive Officer Timothy R. Estes Chief Operating Officer H. Andrew DeFerrari Chief Financial Officer Richard B. Vilsoet General Counsel
3 Forward-Looking Statements and Non-GAAP Information Fiscal 2013 second quarter results are unaudited. This presentation contains “forward-looking statements” which are statements relating to future events, future financial performance, strategies, expectations, and the competitive environment. All statements, other than statements of historical facts, contained in this presentation, including statements regarding the Company’s future financial position, future revenue, prospects, plans and objectives of management, are forward-looking statements. Additionally, forward–looking statements may include statements of expectations regarding our recent acquisition of the businesses of the telecommunications infrastructure services subsidiaries of Quanta Services, Inc., including expected benefits and synergies of the transaction, future financial and operating results and future opportunities for the combined businesses, and other statements regarding events or developments that the Company believes or anticipates will or may occur in the future as a result of the recently completed acquisition. Words such as “outlook,” “believe,” “expect,” “anticipate,” “estimate,” “intend,” “forecast,” “may,” “should,” “could,” “project,” “looking ahead” and similar expressions, as well as statements in future tense, identify forward-looking statements. You should not read forward looking statements as a guarantee of future performance or results. They will not necessarily be accurate indications of whether or at what time such performance or results will be achieved. Forward-looking statements are based on information available at the time those statements are made and/or management’s good faith belief at that time with respect to future events. Such statements are subject to risks and uncertainties that could cause actual performance or results to differ materially from those expressed in or suggested by the forward-looking statements. Important factors that could cause such differences include, but are not limited to factors described under Item 1A, “Risk Factors” of the Company’s Annual Report on Form 10-K for the year ended July 28, 2012, and other risks outlined in the Company’s periodic filings with the Securities and Exchange Commission (“SEC”). The forward-looking statements in this presentation are expressly qualified in their entirety by this cautionary statement. Except as required by law, the Company may not update forward-looking statements even though its situation may change in the future. This presentation includes certain “Non-GAAP” financial measures as defined by SEC rules. We believe that the presentation of certain Non-GAAP financial measures provides information that is useful to investors because it allows for a more direct comparison of our performance for the period with our performance in the comparable prior-year periods. As required by the SEC, we have provided a reconciliation of those measures to the most directly comparable GAAP measures on the Regulation G slides included as slides 16 through 20 of this presentation. We caution that Non-GAAP financial measures should be considered in addition to, but not as a substitute for, our reported GAAP results.
4 Q2-2013 Overview Contract revenue of $369.3 million as compared to $267.4 million in the prior year quarter, growing organically 3.5%, after excluding revenues from acquired subsidiaries of $75.9 million and storm restoration services of $16.7 million Adjusted EBITDA of $37.2 million,10.1% of revenue Excluding interest expense, pre-tax results from acquired businesses were approximately $0.8 million after approximately $6.1 million of non-cash depreciation and amortization expense Non-GAAP Net income of $0.15 per share diluted compared to $0.10 per share diluted in Q2-12 Strong operating cash flow of $63.5 million facilitated debt reduction of $70 million which was incurred to fund the acquisition of Quanta Services’ domestic telecom infrastructure services subsidiaries during the quarter See “Regulation G Disclosure” slides 16-20 for a reconciliation of GAAP to Non-GAAP financial measures.
5 Q2-2013 Transactions Acquisition Acquired substantially all of Quanta’s domestic telecommunications infrastructure services operations in December 2012 Purchase price of $275 million Adjustment for working capital and other items totaling approximately $45 million in additional consideration Structured to produce attractive cash tax benefits Strengthens our customer base, geographic scope, and technical service offerings Reinforces our rural engineering and construction capabilities, wireless construction resources, and broadband construction competencies Creates scale as industry announcements indicate customer expenditures will be growing Financing Activities New, five year $400 million Credit Agreement $275 million revolving credit facility – $20 million outstanding at end of Q2-13 $125 million term loan outstanding – begins to amortize on an annual basis in Q3-13 Attractively priced to lower effective borrowing cost Matures in December 2017 Senior Subordinated Notes Issued add-on of $90.0 million face value to existing 7.125% senior subordinated notes at a price of 104.25 Matures in January 2021
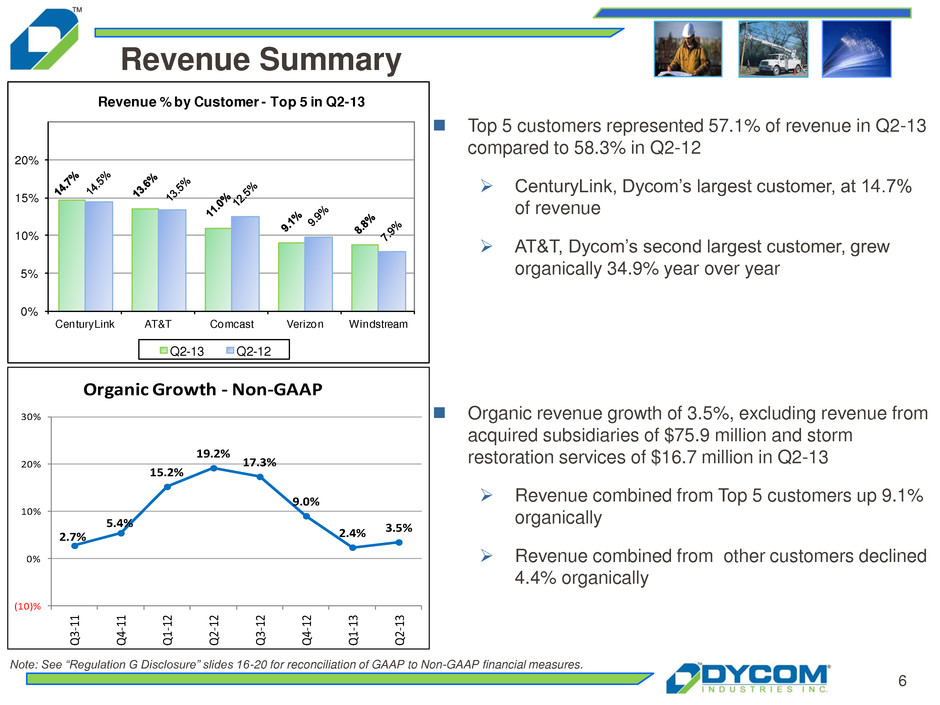
6 Revenue Summary Top 5 customers represented 57.1% of revenue in Q2-13 compared to 58.3% in Q2-12 CenturyLink, Dycom’s largest customer, at 14.7% of revenue AT&T, Dycom’s second largest customer, grew organically 34.9% year over year Organic revenue growth of 3.5%, excluding revenue from acquired subsidiaries of $75.9 million and storm restoration services of $16.7 million in Q2-13 Revenue combined from Top 5 customers up 9.1% organically Revenue combined from other customers declined 4.4% organically 0% 5% 10% 15% 20% CenturyLink AT&T Comcast Verizon Windstream Revenue % by Customer - Top 5 in Q2-13 Q2-13 Q2-12 2.7% 5.4% 15.2% 19.2% 17.3% 9.0% 2.4% 3.5% (10)% 0% 10% 20% 30% Q3 -1 1 Q4 -1 1 Q1 -1 2 Q2 -1 2 Q3 -1 2 Q4 -1 2 Q1 -1 3 Q2 -1 3 Organic Growth - Non-GAAP Note: See “Regulation G Disclosure” slides 16-20 for reconciliation of GAAP to Non-GAAP financial measures.
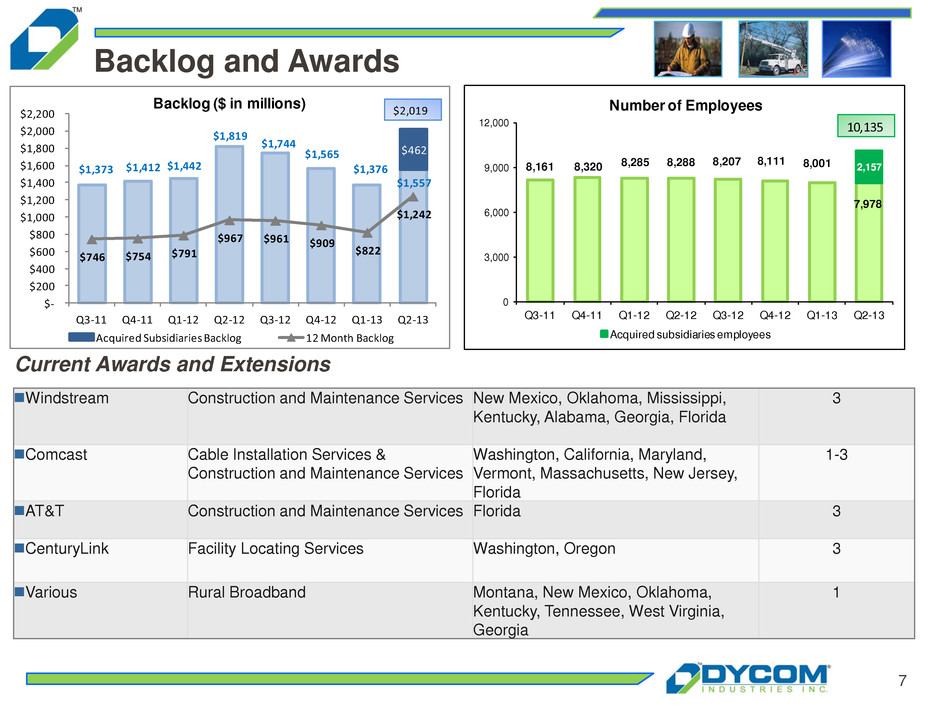
7 Backlog and Awards Current Awards and Extensions Windstream Construction and Maintenance Services New Mexico, Oklahoma, Mississippi, Kentucky, Alabama, Georgia, Florida 3 Comcast Cable Installation Services & Construction and Maintenance Services Washington, California, Maryland, Vermont, Massachusetts, New Jersey, Florida 1-3 AT&T Construction and Maintenance Services Florida 3 CenturyLink Facility Locating Services Washington, Oregon 3 Various Rural Broadband Montana, New Mexico, Oklahoma, Kentucky, Tennessee, West Virginia, Georgia 1 8,161 8,320 8,285 8,288 8,207 8,111 8,001 7,978 2,157 0 3,000 6,000 9,000 12,000 Q3-11 Q4-11 Q1-12 Q2-12 Q3-12 Q4-12 Q1-13 Q2-13 Number of Employees Acquired subsidiaries employees 10,135 $1,373 $1,412 $1,442 $1,819 $1,744 $1,565 $1,376 $1,557 $462 $746 $754 $791 $967 $961 $909 $822 $1,242 $- $200 $400 $600 $800 $1,000 $1,200 $1,400 $1,600 $1,800 $2,000 $2,200 Q3-11 Q4-11 Q1-12 Q2-12 Q3-12 Q4-12 Q1-13 Q2-13 Backlog ($ in millions) Acquired Subsidiaries Backlog 12 Month Backlog $2,019
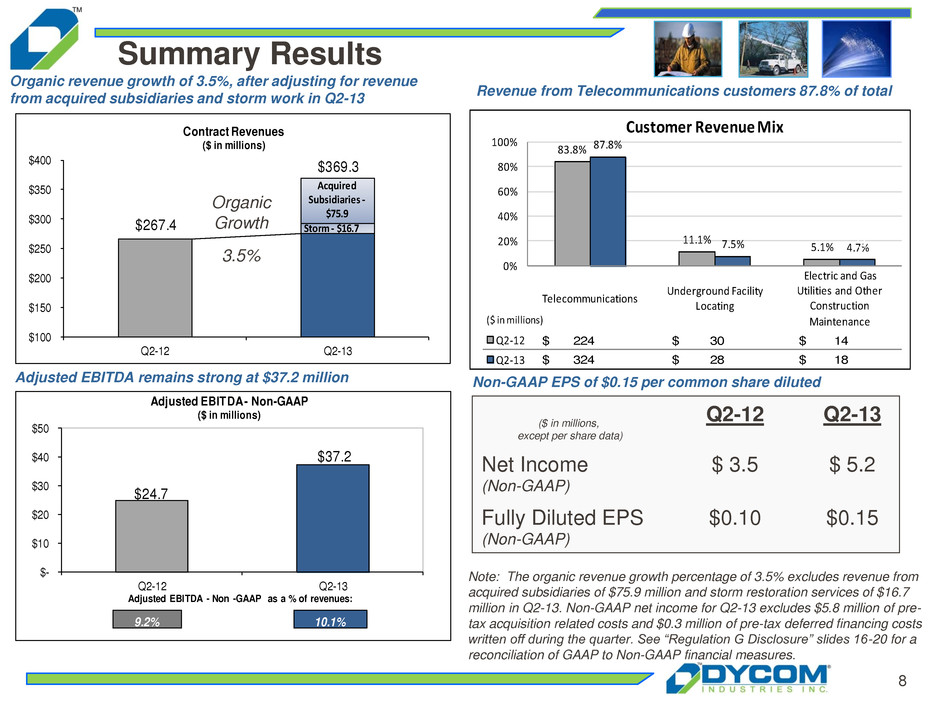
8 $267.4 $100 $150 $200 $250 $300 $350 $400 Q2-12 Q2-13 Contract Revenues ($ in millions) $369.3 Storm - $16.7 Acquired Subsidiaries - $75.9 $24.7 $37.2 $- $10 $20 $30 $40 $50 Q2-12 Q2-13 Adjusted EBITDA - Non-GAAP ($ in millions) Adjusted EBITDA - Non -GAAP as a % of revenues: 9.2% 10.1% Summary Results ($ in millions, except per share data) Q2-12 Q2-13 Net Income (Non-GAAP) $ 3.5 $ 5.2 Fully Diluted EPS (Non-GAAP) $0.10 $0.15 Organic revenue growth of 3.5%, after adjusting for revenue from acquired subsidiaries and storm work in Q2-13 Adjusted EBITDA remains strong at $37.2 million Non-GAAP EPS of $0.15 per common share diluted Revenue from Telecommunications customers 87.8% of total Note: The organic revenue growth percentage of 3.5% excludes revenue from acquired subsidiaries of $75.9 million and storm restoration services of $16.7 million in Q2-13. Non-GAAP net income for Q2-13 excludes $5.8 million of pre- tax acquisition related costs and $0.3 million of pre-tax deferred financing costs written off during the quarter. See “Regulation G Disclosure” slides 16-20 for a reconciliation of GAAP to Non-GAAP financial measures. 264$ 34$ 21$ 279$ 33$ 11$ Organic Growth 3.5% 83.8% 11.1% 5.1% 87.8% 7.5% 4.7% 0% 20% 40% 60% 80% 100% Telecommunications Underground Facility Locating Electric and Gas Utilities and Other Construction Maintenance Q2-12 83.8% 11.1% 5.1% Q2-13 87.8% 7.5% 4.7% Customer Revenue Mix $ 1 8 5 $6 ($ in millions) 2 4$ 30$ 14$ 324$ 28$ 18$
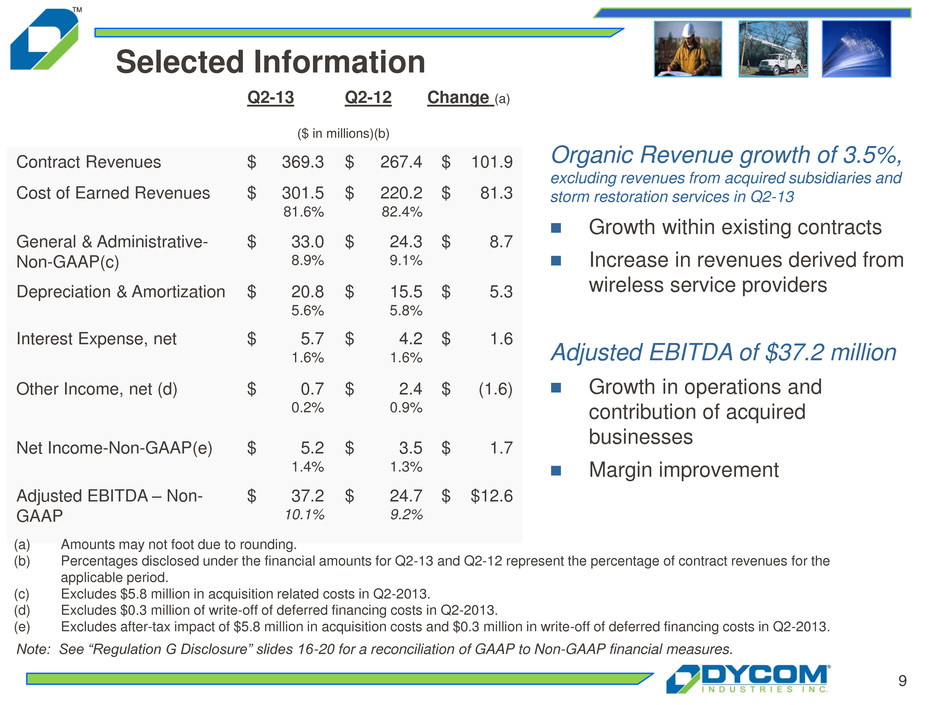
9 Selected Information Q2-13 Q2-12 Change (a) ($ in millions)(b) Contract Revenues $ 369.3 $ 267.4 $ 101.9 Cost of Earned Revenues $ 301.5 81.6% $ 220.2 82.4% $ 81.3 General & Administrative- Non-GAAP(c) $ 33.0 8.9% $ 24.3 9.1% $ 8.7 Depreciation & Amortization $ 20.8 5.6% $ 15.5 5.8% $ 5.3 Interest Expense, net $ 5.7 1.6% $ 4.2 1.6% $ 1.6 Other Income, net (d) $ 0.7 0.2% $ 2.4 0.9% $ (1.6) Net Income-Non-GAAP(e) $ 5.2 1.4% $ 3.5 1.3% $ 1.7 Adjusted EBITDA – Non- GAAP $ 37.2 10.1% $ 24.7 9.2% $ $12.6 Organic Revenue growth of 3.5%, excluding revenues from acquired subsidiaries and storm restoration services in Q2-13 Growth within existing contracts Increase in revenues derived from wireless service providers Adjusted EBITDA of $37.2 million Growth in operations and contribution of acquired businesses Margin improvement Note: See “Regulation G Disclosure” slides 16-20 for a reconciliation of GAAP to Non-GAAP financial measures. (a) Amounts may not foot due to rounding. (b) Percentages disclosed under the financial amounts for Q2-13 and Q2-12 represent the percentage of contract revenues for the applicable period. (c) Excludes $5.8 million in acquisition related costs in Q2-2013. (d) Excludes $0.3 million of write-off of deferred financing costs in Q2-2013. (e) Excludes after-tax impact of $5.8 million in acquisition costs and $0.3 million in write-off of deferred financing costs in Q2-2013.
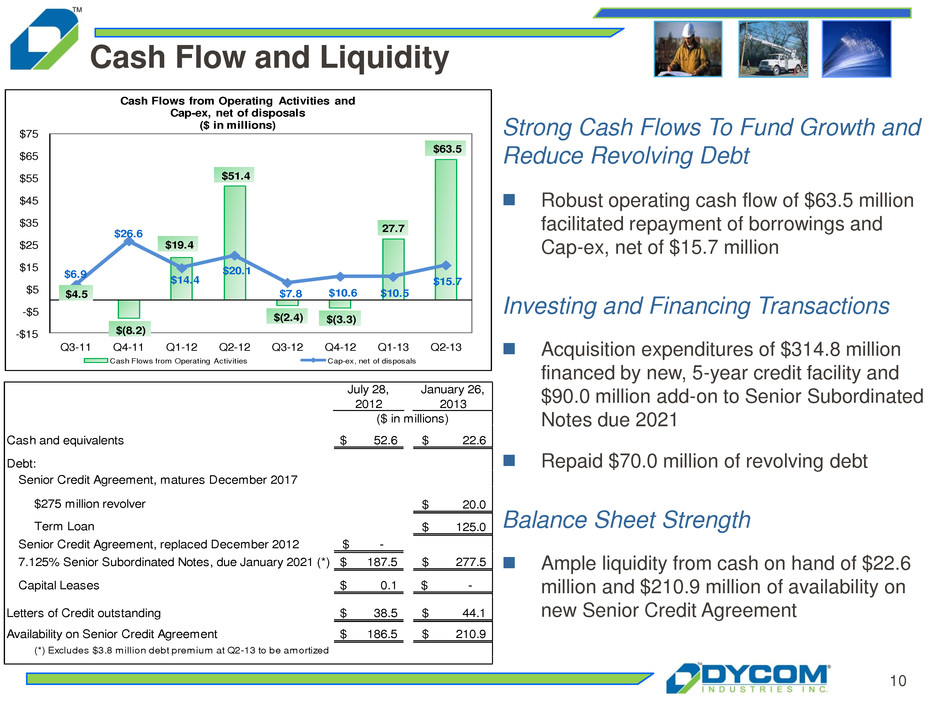
10 Cash Flow and Liquidity Strong Cash Flows To Fund Growth and Reduce Revolving Debt Robust operating cash flow of $63.5 million facilitated repayment of borrowings and Cap-ex, net of $15.7 million Investing and Financing Transactions Acquisition expenditures of $314.8 million financed by new, 5-year credit facility and $90.0 million add-on to Senior Subordinated Notes due 2021 Repaid $70.0 million of revolving debt Balance Sheet Strength Ample liquidity from cash on hand of $22.6 million and $210.9 million of availability on new Senior Credit Agreement $4.5 $(8.2) $19.4 $51.4 $(2.4) $(3.3) 27.7 $63.5 $6.9 $26.6 $14.4 $20.1 $7.8 $10.6 $10.5 $15.7 -$15 -$5 $5 $15 $25 $35 $45 $55 $65 $75 Q3-11 Q4-11 Q1-12 Q2-12 Q3-12 Q4-12 Q1-13 Q2-13 Cash Flows from Operating Activities and Cap-ex, net of disposals ($ in millions) Cash Flows from Operating Activities Cap-ex, net of disposals July 28, 2012 January 26, 2013 52.6$ 22.6$ $275 million revolver 20.0$ Term Loan 125.0$ -$ 87.5$ 277.5$ 0.1$ -$ 38.5$ 44.1$ 186.5$ 210.9$ (*) Excludes $3.8 million debt premium at Q2-13 to be amortized 7.125% Senior Subordinated Notes, due January 2021 (*) Capital Leases Letters of Credit outstanding Availability on Senior Cre it Agreement ($ in millions) Senior Credit Agreement, matures December 2017 Cash and equivalents Debt: Senior Credit Agre ment, replaced December 2012
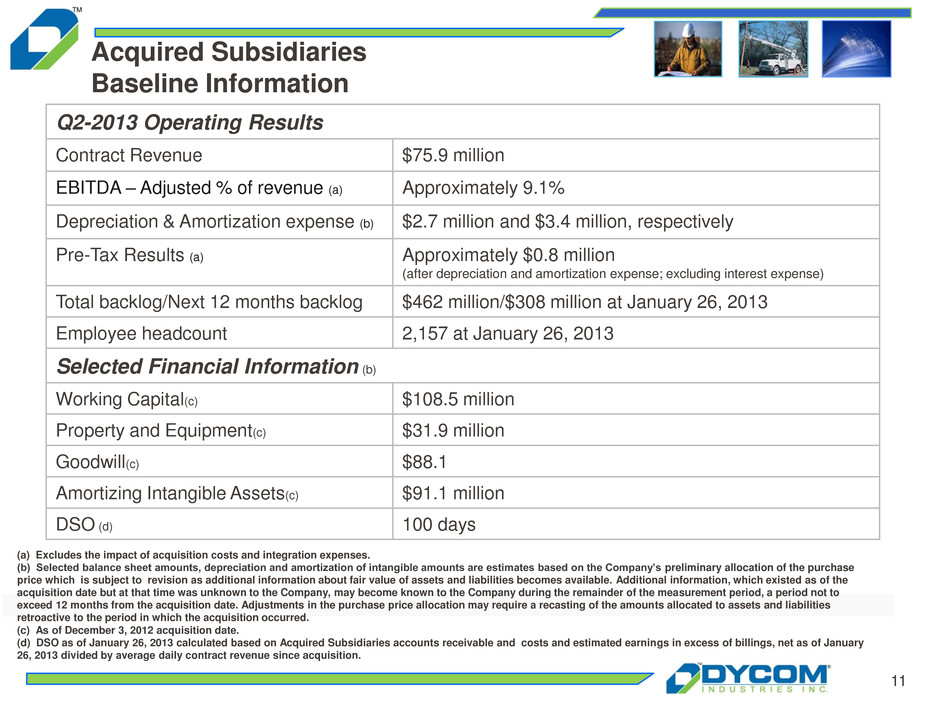
11 Acquired Subsidiaries Baseline Information Q2-2013 Operating Results Contract Revenue $75.9 million EBITDA – Adjusted % of revenue (a) Approximately 9.1% Depreciation & Amortization expense (b) $2.7 million and $3.4 million, respectively Pre-Tax Results (a) Approximately $0.8 million (after depreciation and amortization expense; excluding interest expense) Total backlog/Next 12 months backlog $462 million/$308 million at January 26, 2013 Employee headcount 2,157 at January 26, 2013 Selected Financial Information (b) Working Capital(c) $108.5 million Property and Equipment(c) $31.9 million Goodwill(c) $88.1 Amortizing Intangible Assets(c) $91.1 million DSO (d) 100 days (a) Excludes the impact of acquisition costs and integration expenses. (b) Selected balance sheet amounts, depreciation and amortization of intangible amounts are estimates based on the Company’s preliminary allocation of the purchase price which is subject to revision as additional information about fair value of assets and liabilities becomes available. Additional information, which existed as of the acquisition date but at that time was unknown to the Company, may become known to the Company during the remainder of the measurement period, a period not to exceed 12 months from the acquisition date. Adjustments in the purchase price allocation may require a recasting of the amounts allocated to assets and liabilities retroactive to the period in which the acquisition occurred. (c) As of December 3, 2012 acquisition date. (d) DSO as of January 26, 2013 calculated based on Acquired Subsidiaries accounts receivable and costs and estimated earnings in excess of billings, net as of January 26, 2013 divided by average daily contract revenue since acquisition.
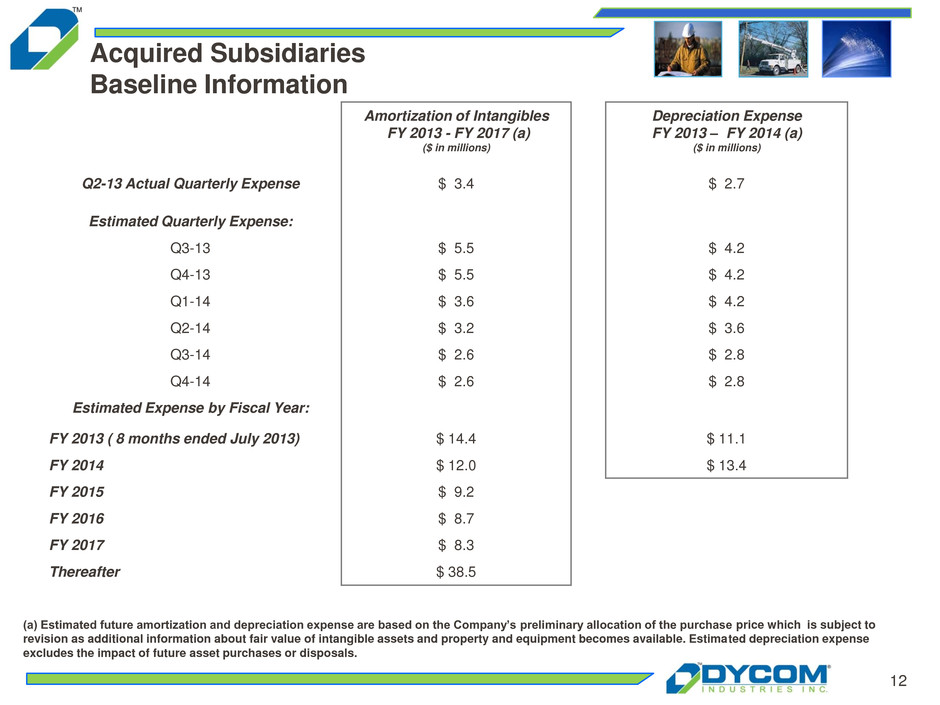
12 Acquired Subsidiaries Baseline Information (a) Estimated future amortization and depreciation expense are based on the Company’s preliminary allocation of the purchase price which is subject to revision as additional information about fair value of intangible assets and property and equipment becomes available. Estimated depreciation expense excludes the impact of future asset purchases or disposals. Amortization of Intangibles FY 2013 - FY 2017 (a) ($ in millions) Depreciation Expense FY 2013 – FY 2014 (a) ($ in millions) Q2-13 Actual Quarterly Expense $ 3.4 $ 2.7 Estimated Quarterly Expense: Q3-13 $ 5.5 $ 4.2 Q4-13 $ 5.5 $ 4.2 Q1-14 $ 3.6 $ 4.2 Q2-14 $ 3.2 $ 3.6 Q3-14 $ 2.6 $ 2.8 Q4-14 $ 2.6 $ 2.8 Estimated Expense by Fiscal Year: FY 2013 ( 8 months ended July 2013) $ 14.4 $ 11.1 FY 2014 $ 12.0 $ 13.4 FY 2015 $ 9.2 FY 2016 $ 8.7 FY 2017 $ 8.3 Thereafter $ 38.5
13 Summary Firm end market opportunities Industry participants aggressively extending or deploying fiber networks to provide wireless backhaul services Cable operators continuing to deploy fiber to small and medium businesses Wireless carriers upgrading from 3G to 4G technologies Telephone companies deploying FTTX to enable video offerings Increased market share as our customers consolidate vendor relationships and reward scale
14 Looking Ahead Improving legacy revenue and margin trends as wireless services continue to grow, cable construction strengthens and a significant customer continues to reaccelerate its capital expenditures Stable performance from acquired subsidiaries with real opportunities to improve margins through integration activities offset in part by significant depreciation and amortization expense during Q3 and Q4 2013 Strong cash flows dedicated to funding growth and debt repayment Confident that solid operations will continue for a sustained period
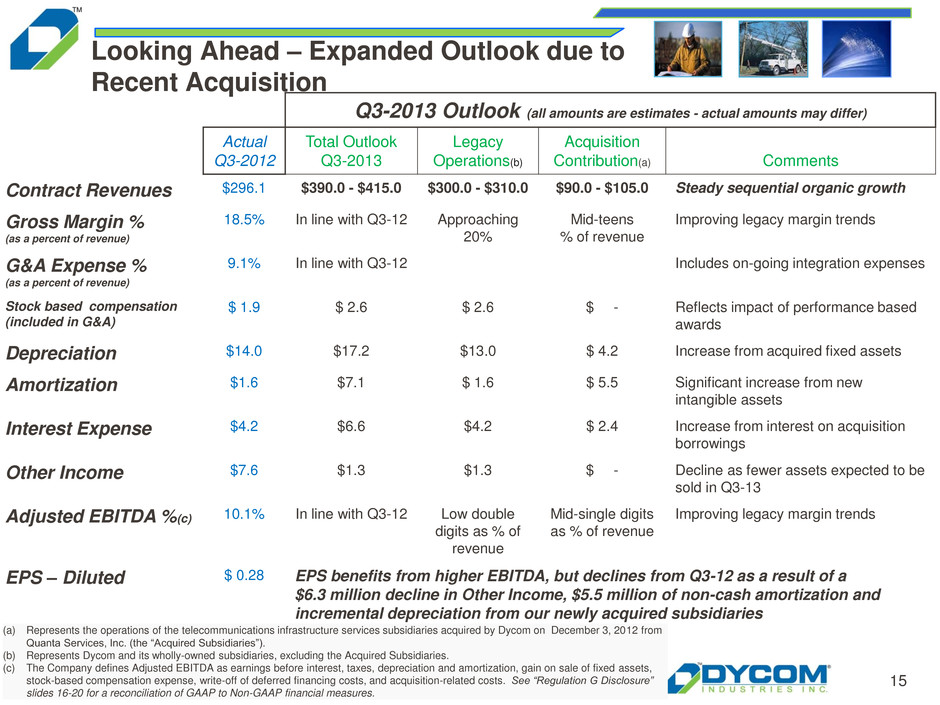
15 Looking Ahead – Expanded Outlook due to Recent Acquisition Q3-2013 Outlook (all amounts are estimates - actual amounts may differ) Actual Q3-2012 Total Outlook Q3-2013 Legacy Operations(b) Acquisition Contribution(a) Comments Contract Revenues $296.1 $390.0 - $415.0 $300.0 - $310.0 $90.0 - $105.0 Steady sequential organic growth Gross Margin % (as a percent of revenue) 18.5% In line with Q3-12 Approaching 20% Mid-teens % of revenue Improving legacy margin trends G&A Expense % (as a percent of revenue) 9.1% In line with Q3-12 Includes on-going integration expenses Stock based compensation (included in G&A) $ 1.9 $ 2.6 $ 2.6 $ - Reflects impact of performance based awards Depreciation $14.0 $17.2 $13.0 $ 4.2 Increase from acquired fixed assets Amortization $1.6 $7.1 $ 1.6 $ 5.5 Significant increase from new intangible assets Interest Expense $4.2 $6.6 $4.2 $ 2.4 Increase from interest on acquisition borrowings Other Income $7.6 $1.3 $1.3 $ - Decline as fewer assets expected to be sold in Q3-13 Adjusted EBITDA %(c) 10.1% In line with Q3-12 Low double digits as % of revenue Mid-single digits as % of revenue Improving legacy margin trends EPS – Diluted $ 0.28 EPS benefits from higher EBITDA, but declines from Q3-12 as a result of a $6.3 million decline in Other Income, $5.5 million of non-cash amortization and incremental depreciation from our newly acquired subsidiaries (a) Represents the operations of the telecommunications infrastructure services subsidiaries acquired by Dycom on December 3, 2012 from Quanta Services, Inc. (the “Acquired Subsidiaries”). (b) Represents Dycom and its wholly-owned subsidiaries, excluding the Acquired Subsidiaries. (c) The Company defines Adjusted EBITDA as earnings before interest, taxes, depreciation and amortization, gain on sale of fixed assets, stock-based compensation expense, write-off of deferred financing costs, and acquisition-related costs. See “Regulation G Disclosure” slides 16-20 for a reconciliation of GAAP to Non-GAAP financial measures.
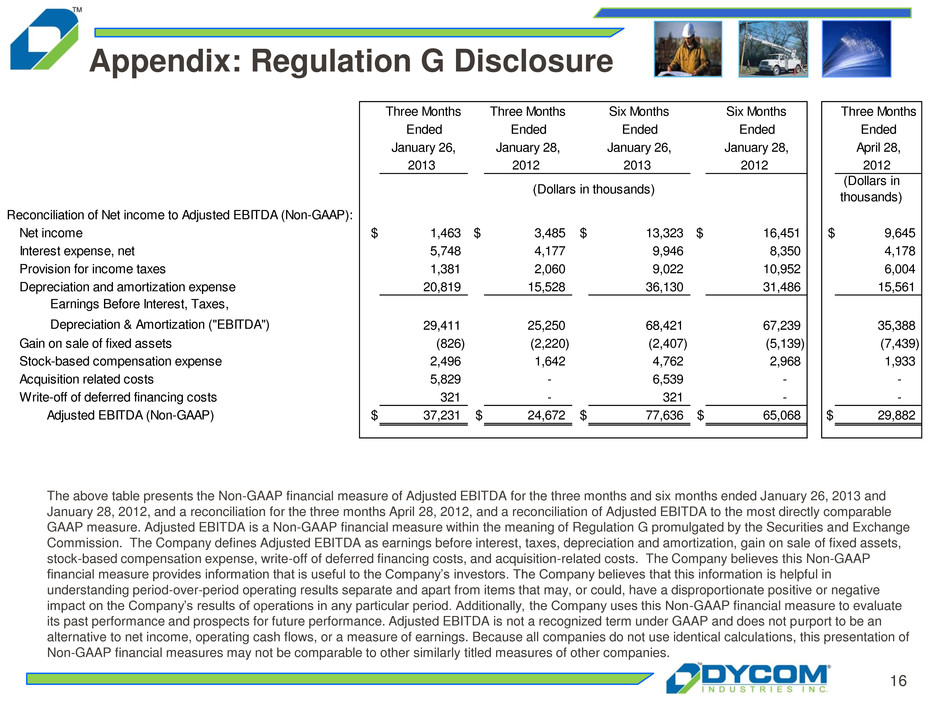
16 Appendix: Regulation G Disclosure The above table presents the Non-GAAP financial measure of Adjusted EBITDA for the three months and six months ended January 26, 2013 and January 28, 2012, and a reconciliation for the three months April 28, 2012, and a reconciliation of Adjusted EBITDA to the most directly comparable GAAP measure. Adjusted EBITDA is a Non-GAAP financial measure within the meaning of Regulation G promulgated by the Securities and Exchange Commission. The Company defines Adjusted EBITDA as earnings before interest, taxes, depreciation and amortization, gain on sale of fixed assets, stock-based compensation expense, write-off of deferred financing costs, and acquisition-related costs. The Company believes this Non-GAAP financial measure provides information that is useful to the Company’s investors. The Company believes that this information is helpful in understanding period-over-period operating results separate and apart from items that may, or could, have a disproportionate positive or negative impact on the Company’s results of operations in any particular period. Additionally, the Company uses this Non-GAAP financial measure to evaluate its past performance and prospects for future performance. Adjusted EBITDA is not a recognized term under GAAP and does not purport to be an alternative to net income, operating cash flows, or a measure of earnings. Because all companies do not use identical calculations, this presentation of Non-GAAP financial measures may not be comparable to other similarly titled measures of other companies. Three Months Three Months Six Months Six Months Three Months Ended Ended Ended Ended Ended January 26, January 28, January 26, January 28, April 28, 2013 2012 2013 2012 2012 Reconciliation of Net income to Adjusted EBITDA (Non-GAAP): Net income $ 1,463 $ 3,485 $ 13,323 $ 16,451 $ 9,645 Interest expense, net 5,748 4,177 9,946 8,350 4,178 Provision for income taxes 1,381 2,060 9,022 10,952 6,004 Depreciation and amortization expense 20,819 15,528 36,130 31,486 15,561 Earnings Before Interest, Taxes, Depreciation & Amortization ("EBITDA") 29,411 25,250 68,421 67,239 35,388 Gain on sale of fixed assets (826) (2,220) (2,407) (5,139) (7,439) Stock-based compensation expense 2,496 1,642 4,762 2,968 1,933 Acquisition related costs 5,829 - 6,539 - - Write-off of deferred financing costs 321 - 321 - - Adjusted EBITDA (Non-GAAP) $ 37,231 $ 24,672 $ 77,636 $ 65,068 $ 29,882 (Dollars in thousands) (Dollars in thousands)
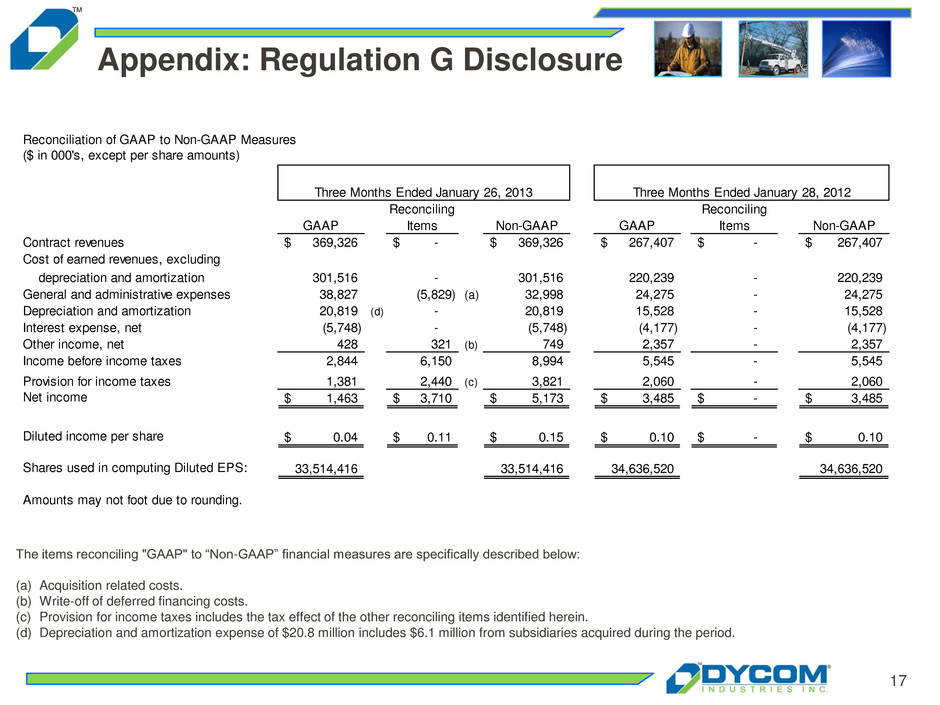
17 Appendix: Regulation G Disclosure The items reconciling "GAAP" to “Non-GAAP” financial measures are specifically described below: (a) Acquisition related costs. (b) Write-off of deferred financing costs. (c) Provision for income taxes includes the tax effect of the other reconciling items identified herein. (d) Depreciation and amortization expense of $20.8 million includes $6.1 million from subsidiaries acquired during the period. ($ in 000's, except per share amounts) GAAP Reconciling Items Non-GAAP GAAP Reconciling Items Non-GAAP Contract revenues 369,326$ -$ 369,326$ 267,407$ -$ 267,407$ Cost of earned revenues, excluding depreciation and amortization 301,516 - 301,516 220,239 - 220,239 General and administrative expenses 38,827 (5,829) (a) 32,998 24,275 - 24,275 Depreciation and amortization 20,819 (d) - 20,819 15,528 - 15,528 Interest expense, net (5,748) - (5,748) (4,177) - (4,177) Other income, net 428 321 (b) 749 2,357 - 2,357 Income before income taxes 2,844 6,150 8,994 5,545 - 5,545 Provision for income taxes 1,381 2,440 (c) 3,821 2,060 - 2,060 Net income 1,463$ 3,710$ 5,173$ 3,485$ -$ 3,485$ Diluted income per share 0.04$ 0.11$ 0.15$ 0.10$ -$ 0.10$ Shares used in computing Diluted EPS: 33,514,416 33,514,416 34,636,520 34,636,520 Amounts may not foot due to rounding. Reconciliation of GAAP to Non-GAAP Measures Three Months Ended January 26, 2013 Three Months Ended January 28, 2012
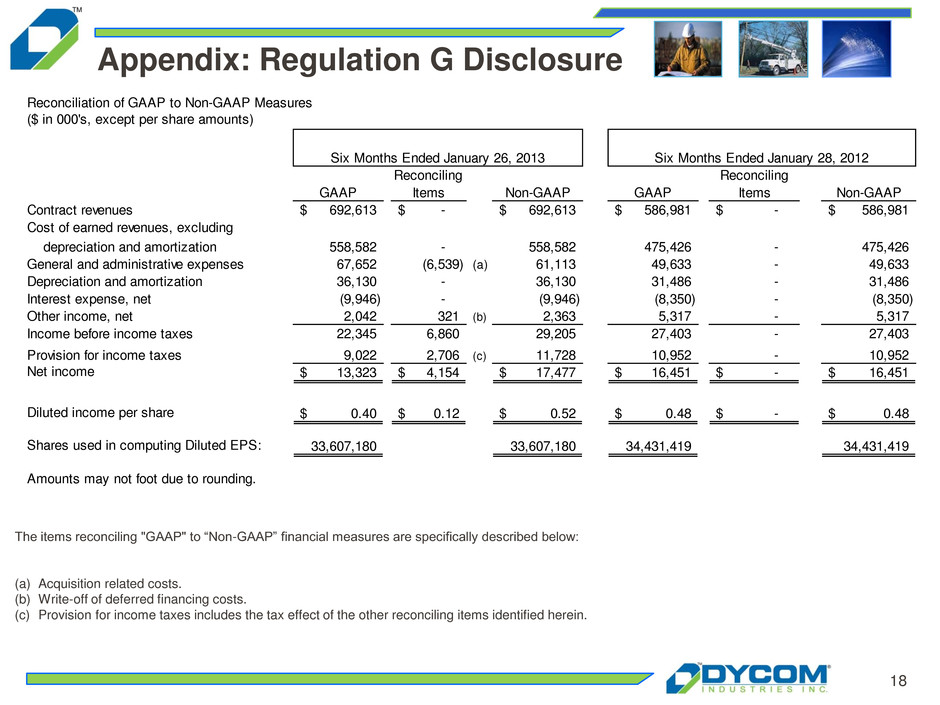
18 Appendix: Regulation G Disclosure The items reconciling "GAAP" to “Non-GAAP” financial measures are specifically described below: (a) Acquisition related costs. (b) Write-off of deferred financing costs. (c) Provision for income taxes includes the tax effect of the other reconciling items identified herein. ($ in 000's, except per share amounts) GAAP Reconciling Items Non-GAAP GAAP Reconciling Items Non-GAAP Contract revenues 692,613$ -$ 692,613$ 586,981$ -$ 586,981$ Cost of earned revenues, excluding depreciation and amortization 558,582 - 558,582 475,426 - 475,426 General and administrative expenses 67,652 (6,539) (a) 61,113 49,633 - 49,633 Depreciation and amortization 36,130 - 36,130 31,486 - 31,486 Interest expense, net (9,946) - (9,946) (8,350) - (8,350) Other income, net 2,042 321 (b) 2,363 5,317 - 5,317 Income before income taxes 22,345 6,860 29,205 27,403 - 27,403 Provision for income taxes 9,022 2,706 (c) 11,728 10,952 - 10,952 Net income 13,323$ 4,154$ 17,477$ 16,451$ -$ 16,451$ Diluted income per share 0.40$ 0.12$ 0.52$ 0.48$ -$ 0.48$ Shares used in computing Diluted EPS: 33,607,180 33,607,180 34,431,419 34,431,419 Reconciliation of GAAP to Non-GAAP Measures Six Months Ended January 26, 2013 Six Months Ended January 28, 2012 Amounts may not foot due to rounding.
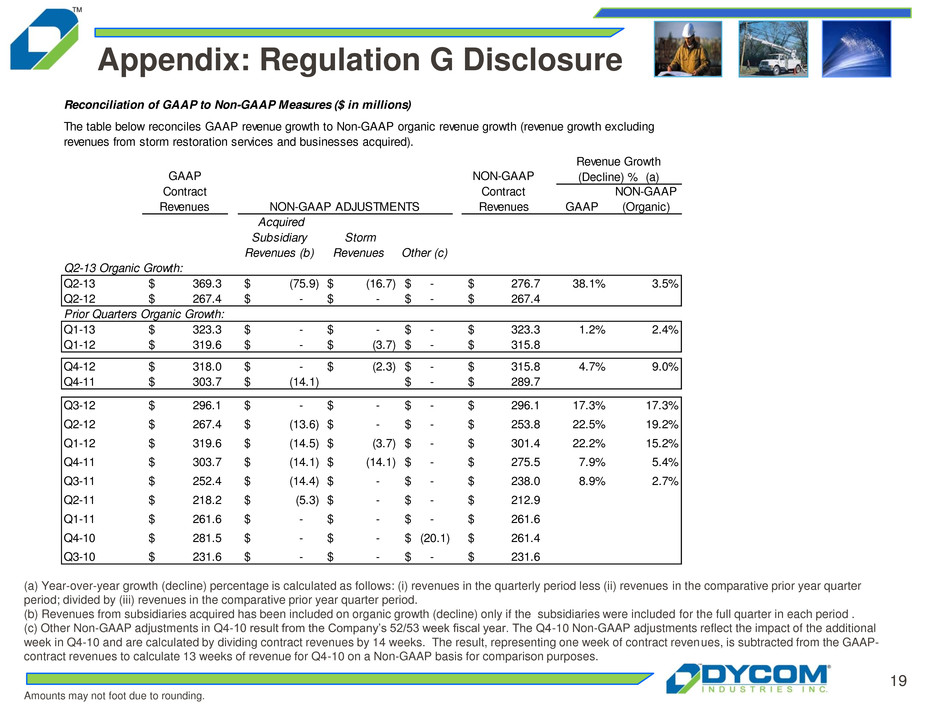
19 (a) Year-over-year growth (decline) percentage is calculated as follows: (i) revenues in the quarterly period less (ii) revenues in the comparative prior year quarter period; divided by (iii) revenues in the comparative prior year quarter period. (b) Revenues from subsidiaries acquired has been included on organic growth (decline) only if the subsidiaries were included for the full quarter in each period . (c) Other Non-GAAP adjustments in Q4-10 result from the Company’s 52/53 week fiscal year. The Q4-10 Non-GAAP adjustments reflect the impact of the additional week in Q4-10 and are calculated by dividing contract revenues by 14 weeks. The result, representing one week of contract revenues, is subtracted from the GAAP- contract revenues to calculate 13 weeks of revenue for Q4-10 on a Non-GAAP basis for comparison purposes. Appendix: Regulation G Disclosure Amounts may not foot due to rounding. Reconciliation of GAAP to Non-GAAP Measures ($ in millions) GAAP NON-GAAP (Organic) Acquired Subsidiary Revenues (b) Storm Revenues Other (c) Q2-13 Organic Growth: Q2-13 369.3$ (75.9)$ (16.7)$ -$ 276.7$ 38.1% 3.5% Q2-12 267.4$ -$ -$ -$ 267.4$ Prior Quarters Organic Growth: Q1-13 323.3$ -$ -$ -$ 323.3$ 1.2% 2.4% Q1-12 319.6$ -$ (3.7)$ -$ 315.8$ Q4-12 318.0$ -$ (2.3)$ -$ 315.8$ 4.7% 9.0% Q4-11 303.7$ (14.1)$ -$ 289.7$ Q3-12 296.1$ -$ -$ -$ 296.1$ 17.3% 17.3% Q2-12 267.4$ (13.6)$ -$ -$ 253.8$ 22.5% 19.2%2-11 218.2$ (5.3)$ 212.9$ Q1-12 319.6$ (14.5)$ (3.7)$ -$ 301.4$ 22.2% 15.2%261.6$ -$ 261.6$ Q4-11 303.7$ (14.1)$ (14.1)$ -$ 275.5$ 7.9% 5.4%4-10 281.5$ (20.1)$ 261.4$ 11.6 9.9 Q3-11 252.4$ (14.4)$ -$ -$ 238.0$ 8.9% 2.7%4-09 231.6$ -$ 231.6$ Q2-11 218.2$ (5.3)$ -$ -$ 212.9$ 0.9% (1.6)%4-09 216.3$ -$ 216.3$ Q1-11 261.6$ -$ -$ -$ 261.6$ 1.0% (c) 1.0% (c)4-09 259.1$ -$ 259.1$ Q4-10 281.5$ -$ -$ (20.1)$ 261.4$ 4.4% (3.1)%4-09 269.7$ -$ 269.7$ Q3-10 231.6$ -$ -$ -$ 231.6$ (10.1)% (8.0)%Q3-09 257.7$ (5.9)$ 251.8$ NON-GAAP Contract Revenues Revenue Growth (Decline) % (a)GAAP Contract Revenues The table below reconciles GAAP revenue growth to Non-GAAP organic revenue growth (revenue growth excluding revenues from storm restoration services and businesses acquired). NON-GAAP ADJUSTMENTS
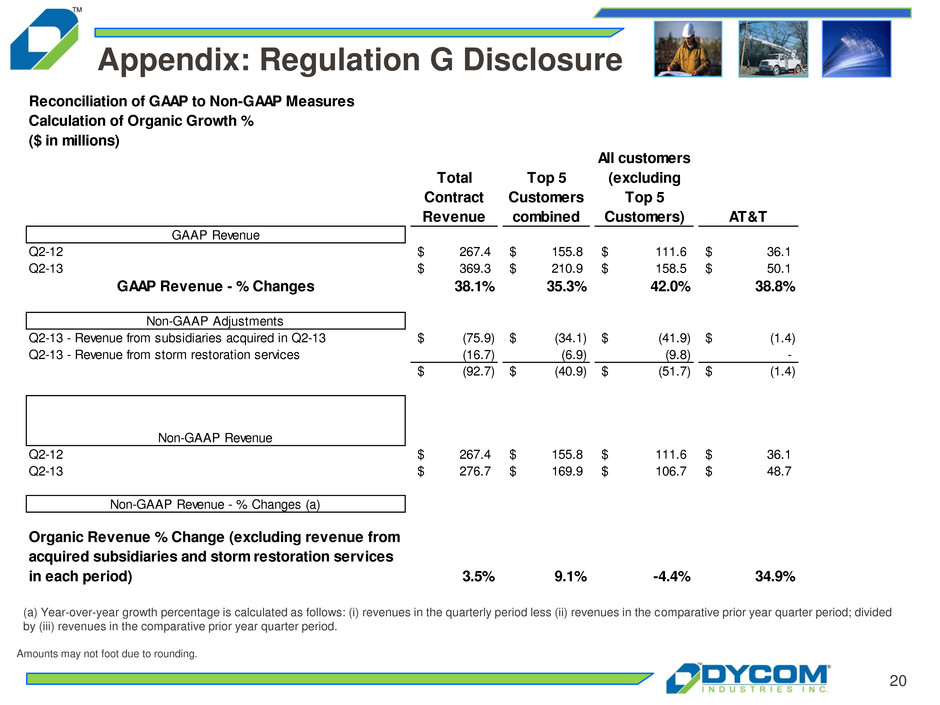
20 Appendix: Regulation G Disclosure (a) Year-over-year growth percentage is calculated as follows: (i) revenues in the quarterly period less (ii) revenues in the comparative prior year quarter period; divided by (iii) revenues in the comparative prior year quarter period. Amounts may not foot due to rounding. Reconciliation of GAAP to Non-GAAP Measures Calculation of Organic Growth % ($ in millions) Total Contract Revenue Top 5 Customers combined All customers (excluding Top 5 Customers) AT&T GAAP Revenue Q2-12 267.4$ 155.8$ 111.6$ 36.1$ Q2-13 369.3$ 210.9$ 158.5$ 50.1$ GAAP Revenue - % Changes 38.1% 35.3% 42.0% 38.8% Non-GAAP Adjustments Q2-13 - Revenue from subsidiaries acquired in Q2-13 (75.9)$ (34.1)$ (41.9)$ (1.4)$ Q2-13 - Revenue from storm restoration services (16.7) (6.9) (9.8) - Q1-13 - Revenue from storm restoration services (92.7)$ (40.9)$ (51.7)$ (1.4)$ Non-GAAP Revenue Q2-12 267.4$ 155.8$ 111.6$ 36.1$ Q2-13 276.7$ 169.9$ 106.7$ 48.7$ Non-GAAP Revenue - % Changes (a) Organic Revenue % Change (excluding revenue from acquired subsidiaries and storm restoration services in each period) 3.5% 9.1% -4.4% 34.9%

Fiscal 2013 2nd Quarter Presentation February 27, 2013


