Investor Presentation November 2022 1
Important Information Caution Concerning Forward-Looking Statements This presentation contains forward-looking statements within the meaning of the 1995 Private Securities Litigation Reform Act. These forward-looking statements include those related to the outlook for the quarter ending January 28, 2023, including, but not limited to, those statements found under the “Outlook” section of this presentation. Forward-looking statements are based on management’s expectations, estimates and projections, are made solely as of the date these statements are made, and are subject to both known and unknown risks and uncertainties that may cause the actual results and occurrences discussed in these forward-looking statements to differ materially from those referenced or implied in the forward-looking statements contained in this presentation. The most significant of these known risks and uncertainties are described in the Company’s Form 10-K, Form 10-Q, and Form 8-K reports (including all amendments to those reports) and include the duration and severity of a pandemic caused by COVID-19, our ability to comply with various COVID-19 legal and contractual requirements and the impacts that those requirements may have on our workforce and our ability to perform our work, vaccination rates in the areas where we operate, any worsening of the pandemic caused by increasing infection rates triggered by new variants, future economic conditions and trends including the potential impacts of an inflationary economic environment, customer capital budgets and spending priorities, the availability and cost of materials, equipment and labor necessary to perform our work, the adequacy of the Company’s insurance and other reserves and allowances for doubtful accounts, whether the carrying value of the Company’s assets may be impaired, the future impact of any acquisitions or dispositions, adjustments and cancellations of the Company’s projects, the impact to the Company’s backlog from project cancellations or postponements, the impact of the COVID-19 pandemic, the impact of varying climate and weather conditions, the anticipated outcome of other contingent events, including litigation or regulatory actions involving the Company, the adequacy of our liquidity, the availability of financing to address our financial needs, the Company’s ability to generate sufficient cash to service its indebtedness, the impact of restrictions imposed by the Company’s credit agreement, and other risks and uncertainties detailed from time to time in the Company’s filings with the Securities and Exchange Commission. The Company does not undertake any obligation to update its forward-looking statements. Non-GAAP Financial Measures This presentation includes certain “Non-GAAP” financial measures as defined by Regulation G of the SEC. As required by the SEC, an explanation of the Non- GAAP financial measures and a reconciliation of those measures to the most directly comparable GAAP financial measures are provided in the Company’s Form 8-K filed with the SEC on November 22, 2022 and on the Company’s Investor Center website at https://ir.dycomind.com. Non-GAAP financial measures should be considered in addition to, but not as a substitute for, the Company’s reported GAAP results. 2
Dycom Overview • Leading supplier of specialty contracting services to telecommunication providers throughout the US • Intensely focused on the telecommunications market providing our customers with critical network infrastructure that is fundamental to economic progress • Durable customer relationships with well established, leading telecommunication providers that span decades • Anchored by Master Service Agreements (MSAs) and other long-term contracts • Solid financial profile that positions us well to benefit from future growth opportunities 3
Financial Overview Fiscal 2022 Annual Operating Performance • Contract Revenues of $3.131 billion • Non-GAAP Adjusted EBITDA of $244.3 million, or 7.8% of contract revenues Backlog and Headcount as of October 29, 2022 (Q3 2023) • Total Backlog of $6.116 billion • Employee headcount of 15,167 Liquidity as of October 29, 2022 (Q3 2023) • Ample liquidity of $444.3 million • Sound credit metrics and no near term debt maturities 4

Strong Secular Trend 5 • The monthly weighted average data consumed by subscribers in 3Q-22 was 495.5 GB, up 14% from 3Q-21 • 87% of these subscribers are provisioned at speeds of 100+ Mbps • The gigabit subscriber tier in 3Q-22 reached 15.44%, up over 35% from a year ago Accelerating Bandwidth Usage and Speed Tier GrowthAverage Upload Consumption Per Subscriber - John Stratton, Executive Chairman of the Board, Frontier Communications, November 2022 Data usage and download/upload speeds continue to increase as consumer behavior moves to streaming, video conferencing, and connected devices Source: OpenVault Broadband Industry Reports “The long-term trends in our business remain extremely encouraging. Our industry thesis is based on the view that the significant growth in data consumption that we've seen over the past 2 decades will continue to ramp up, tripling over the next 4 years alone. We're confident that fiber is best positioned to meet the long-term demand for data consumption. ” 13% 87% 0% 10% 20% 30% 40% 50% 60% 70% 80% 90% 100% Provisioned Speed Tiers of Broadband Subscribers < 100 Mbps 100+ Mbps 434.9 495.5 400 410 420 430 440 450 460 470 480 490 500 510 G ig a b yt e s Weighted Average Data Consumed per Month 3Q 21 3Q 22 16 25 28 32 - 5 10 15 20 25 30 35 3Q 19 3Q 20 3Q 21 3Q 22 G ig a b yt e s

Industry Update The effort to deploy high-capacity fiber networks continues to meaningfully broaden the set of opportunities for our industry • Major industry participants are constructing or upgrading significant wireline networks across broad sections of the country • High-capacity fiber networks are increasingly viewed as the most cost effective technology, enabling multiple revenue streams from a single investment • Fiber network deployment opportunities are increasing in rural America; federal and state support programs for the construction of communications networks in unserved and underserved areas across the country are unprecedented Macroeconomic conditions, including those impacting the cost of capital, may influence the execution of some industry plans, increasing the likelihood that demand could fluctuate amongst customers and result in a wider range of potential outcomes moving into next year Our scale and financial strength position us well to take advantage of these opportunities to deliver valuable services to our customers, including integrated planning, engineering and design, procurement and construction and maintenance services 6
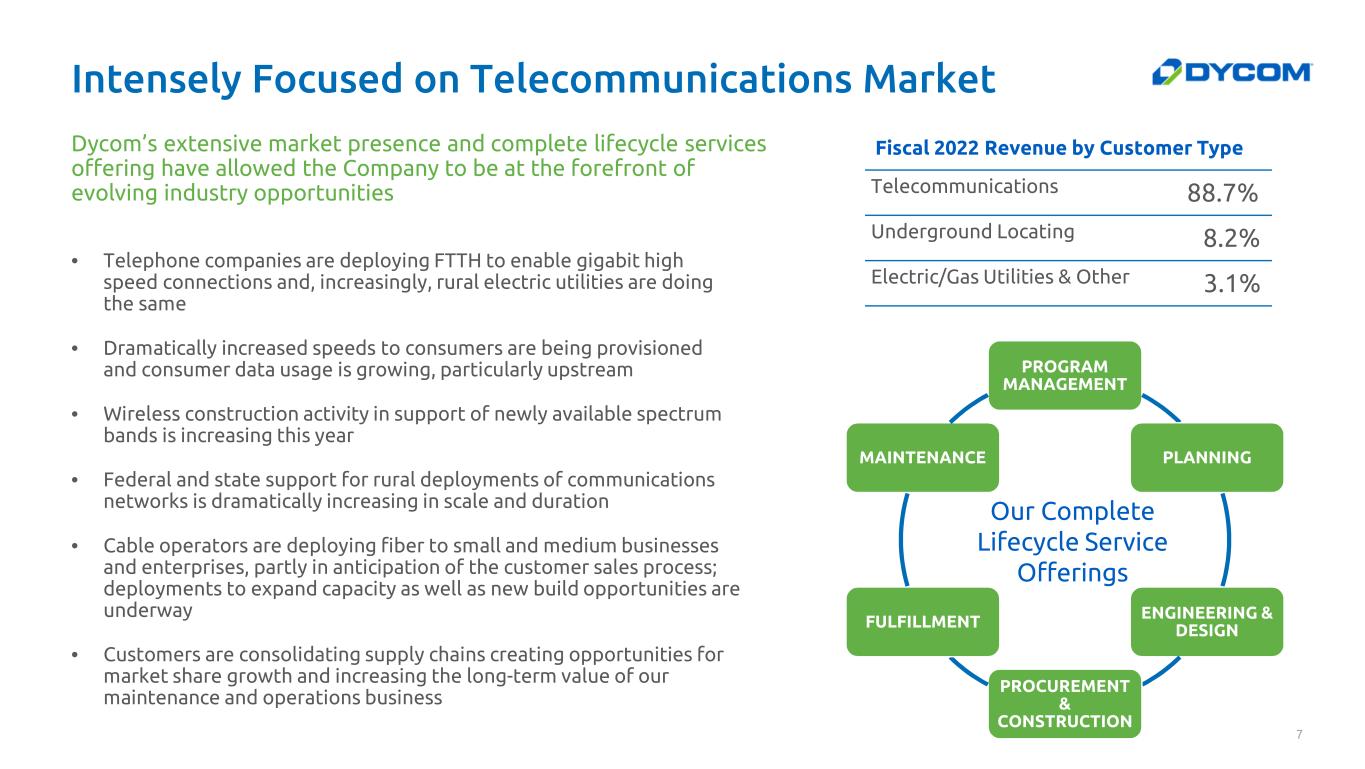
Intensely Focused on Telecommunications Market Dycom’s extensive market presence and complete lifecycle services offering have allowed the Company to be at the forefront of evolving industry opportunities • Telephone companies are deploying FTTH to enable gigabit high speed connections and, increasingly, rural electric utilities are doing the same • Dramatically increased speeds to consumers are being provisioned and consumer data usage is growing, particularly upstream • Wireless construction activity in support of newly available spectrum bands is increasing this year • Federal and state support for rural deployments of communications networks is dramatically increasing in scale and duration • Cable operators are deploying fiber to small and medium businesses and enterprises, partly in anticipation of the customer sales process; deployments to expand capacity as well as new build opportunities are underway • Customers are consolidating supply chains creating opportunities for market share growth and increasing the long-term value of our maintenance and operations business 7 PROGRAM MANAGEMENT PLANNING ENGINEERING & DESIGN PROCUREMENT & CONSTRUCTION FULFILLMENT MAINTENANCE Fiscal 2022 Revenue by Customer Type Telecommunications 88.7% Underground Locating 8.2% Electric/Gas Utilities & Other 3.1% Our Complete Lifecycle Service Offerings
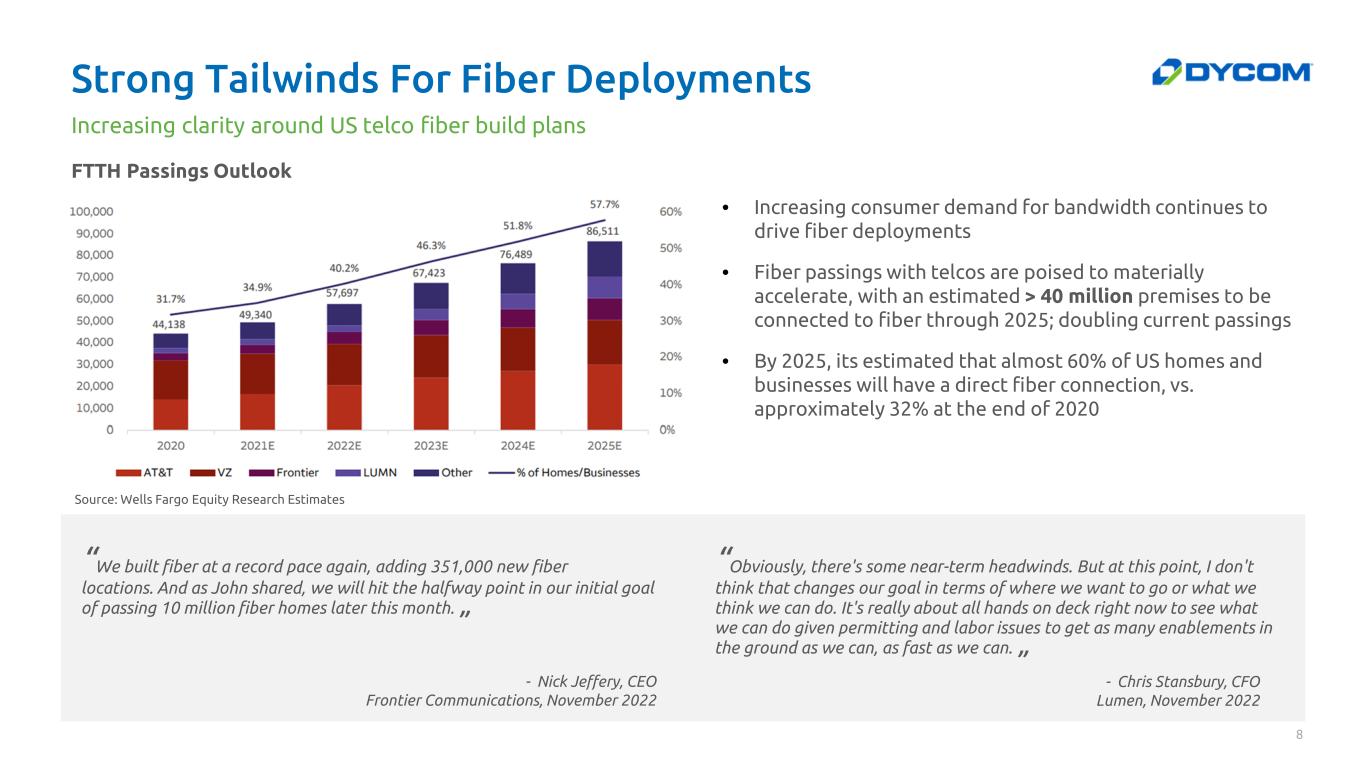
“Obviously, there's some near-term headwinds. But at this point, I don't think that changes our goal in terms of where we want to go or what we think we can do. It's really about all hands on deck right now to see what we can do given permitting and labor issues to get as many enablements in the ground as we can, as fast as we can. ” Strong Tailwinds For Fiber Deployments 8 FTTH Passings Outlook • Increasing consumer demand for bandwidth continues to drive fiber deployments • Fiber passings with telcos are poised to materially accelerate, with an estimated > 40 million premises to be connected to fiber through 2025; doubling current passings • By 2025, its estimated that almost 60% of US homes and businesses will have a direct fiber connection, vs. approximately 32% at the end of 2020 Increasing clarity around US telco fiber build plans “We built fiber at a record pace again, adding 351,000 new fiber locations. And as John shared, we will hit the halfway point in our initial goal of passing 10 million fiber homes later this month. ” - Nick Jeffery, CEO Frontier Communications, November 2022 Source: Wells Fargo Equity Research Estimates - Chris Stansbury, CFO Lumen, November 2022
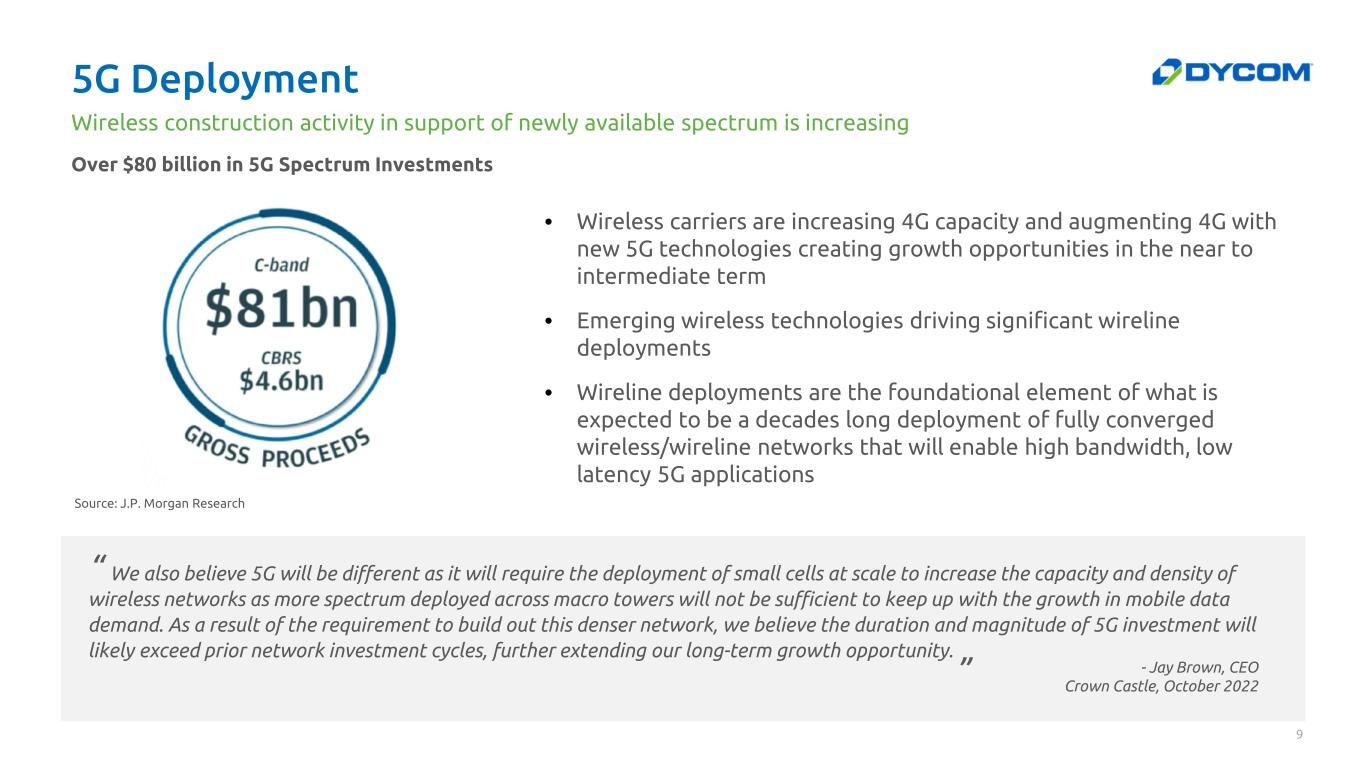
5G Deployment 9 Over $80 billion in 5G Spectrum Investments • Wireless carriers are increasing 4G capacity and augmenting 4G with new 5G technologies creating growth opportunities in the near to intermediate term • Emerging wireless technologies driving significant wireline deployments • Wireline deployments are the foundational element of what is expected to be a decades long deployment of fully converged wireless/wireline networks that will enable high bandwidth, low latency 5G applications Wireless construction activity in support of newly available spectrum is increasing “ We also believe 5G will be different as it will require the deployment of small cells at scale to increase the capacity and density of wireless networks as more spectrum deployed across macro towers will not be sufficient to keep up with the growth in mobile data demand. As a result of the requirement to build out this denser network, we believe the duration and magnitude of 5G investment will likely exceed prior network investment cycles, further extending our long-term growth opportunity. ” - Jay Brown, CEO Crown Castle, October 2022 Source: J.P. Morgan Research

Local Credibility, National Capability Nationwide footprint with 15,167 employees as of October 29, 2022 10 Operating Subsidiaries

Durable Customer Relationships 11 4 Quarters Ended Jan 20182 Trailing Twelve Months (TTM) Customer Contract Revenues 1

Anchored by Long-Term Agreements 12 FY 2022 Revenue by Contract Type Backlog3 • Dycom is party to hundreds of MSA’s and other agreements with customers that extend for periods of one or more years • Generally multiple agreements maintained with each customer • Master Service Agreements (MSA’s) are multi-year, multi-million dollar arrangements covering thousands of individual work orders generally with exclusive requirements; majority of contracts are based on units of delivery • Backlog at $6.116 billion as of Q3 2023
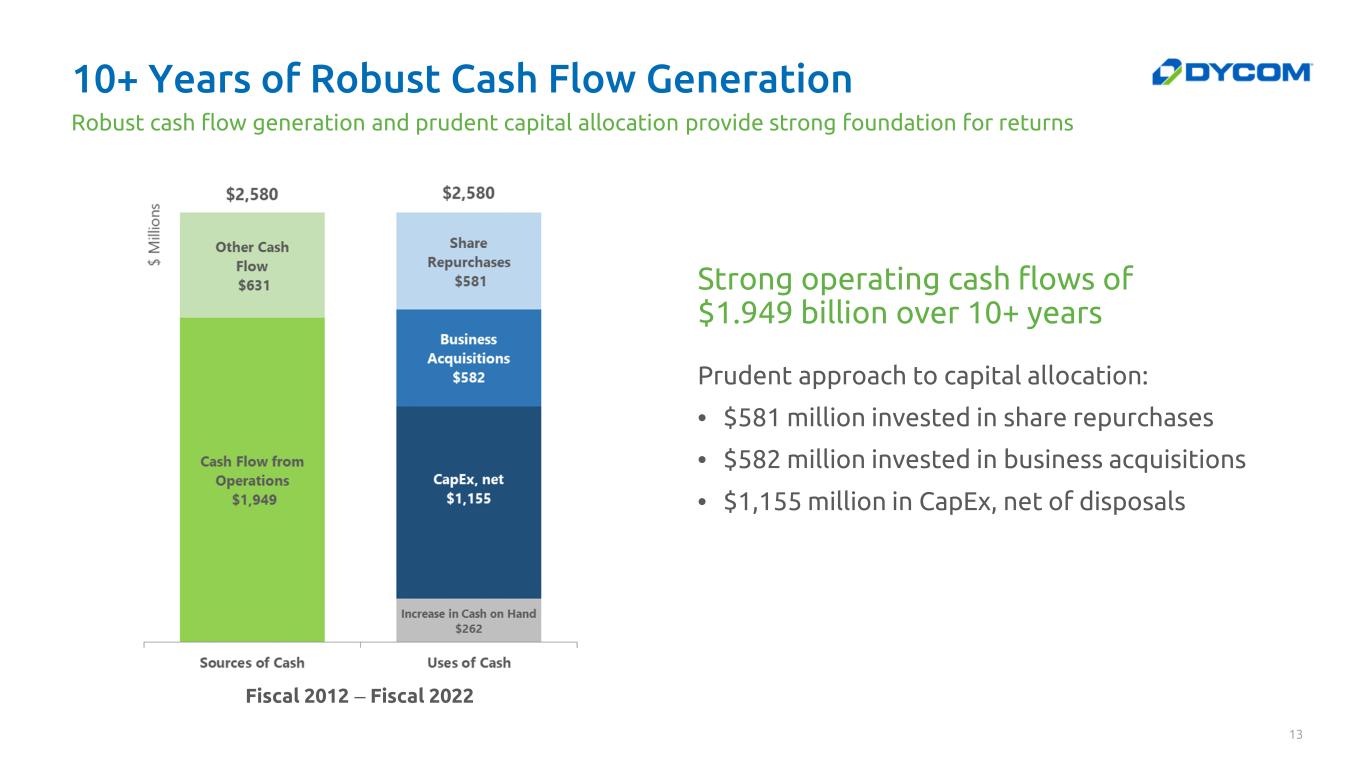
10+ Years of Robust Cash Flow Generation 13 Prudent approach to capital allocation: • $581 million invested in share repurchases • $582 million invested in business acquisitions • $1,155 million in CapEx, net of disposals Robust cash flow generation and prudent capital allocation provide strong foundation for returns Fiscal 2012 – Fiscal 2022 Strong operating cash flows of $1.949 billion over 10+ years

Capital Allocated to Maximize Returns Invest in Organic Growth • Focus on organic growth opportunities through strategic capital investments in the business Pursue Complementary Acquisitions • Selectively acquire businesses that further strengthen our customer relationships, geographic scope, and technical service offerings Shares Repurchases • Repurchased 26.7 million shares for approximately $893 million from fiscal 2006 through October 29, 2022 (Q3 2023) • As of October 29, 2022, $121.5 million authorization available for share repurchases through August 2023 14 Dycom is committed to maximizing long term returns through prudent capital allocation

Committed to Sustainability 15 People Safety Environment Employees are our most important resource and are at the heart of everything we do. We strive every day to create the right environment for them to grow their skills, work collaboratively, and deliver our services at the highest quality to our customers. We strive to ensure the highest level of protection for our employees, customers, and the community in which we operate by fostering an instinctually safe culture. Working together, we strive to continually reduce our environmental impact by embracing advancements in sustainable technologies optimized by core business practices and a highly skilled workforce. We believe that addressing sustainability risks and opportunities through our corporate strategy and operations allows us to best serve our stakeholders
16

Quarterly Trends 17
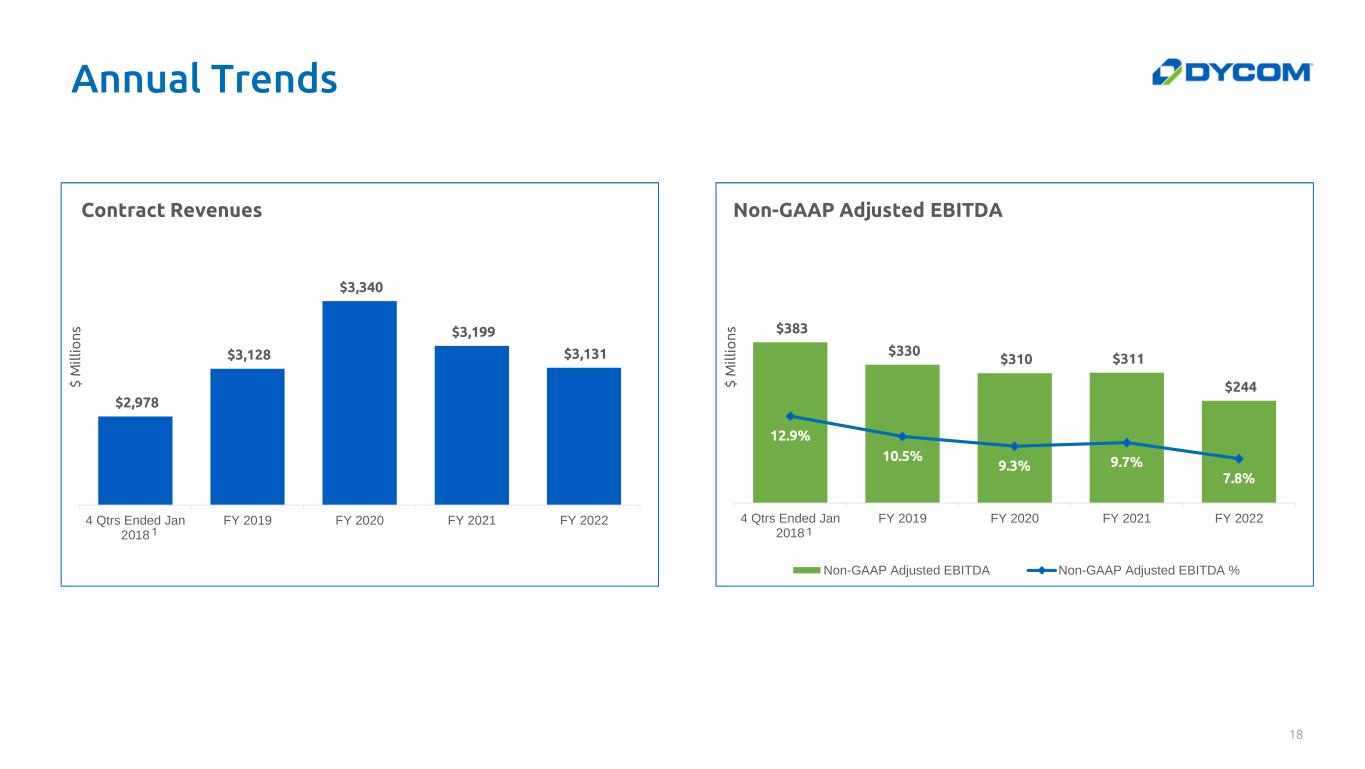
Annual Trends 18 $2,978 $3,128 $3,340 $3,199 $3,131 4 Qtrs Ended Jan 2018 FY 2019 FY 2020 FY 2021 FY 2022 Contract Revenues $ M il li o n s $383 $330 $310 $311 $244 12.9% 10.5% 9.3% 9.7% 7.8% 4 Qtrs Ended Jan 2018 FY 2019 FY 2020 FY 2021 FY 2022 Non-GAAP Adjusted EBITDA Non-GAAP Adjusted EBITDA Non-GAAP Adjusted EBITDA % $ M il li o n s 1 1
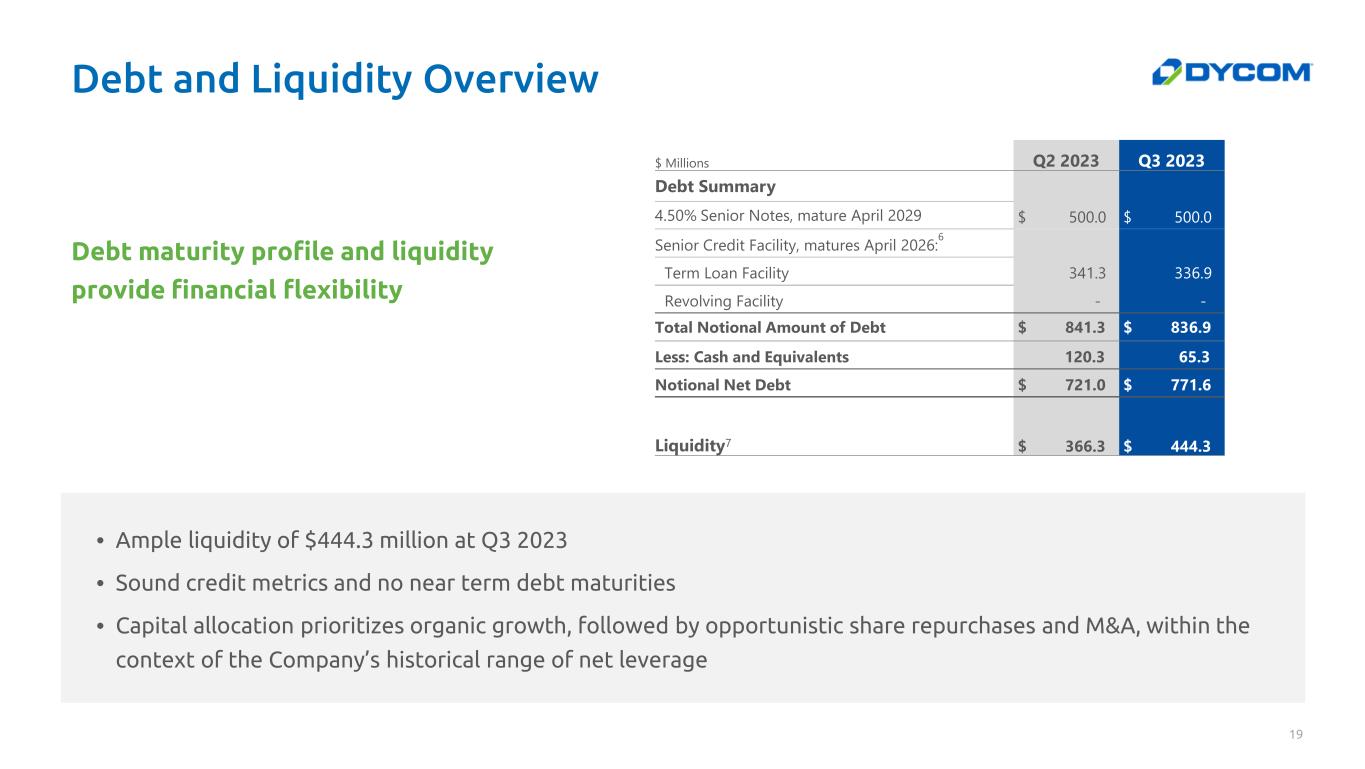
Debt and Liquidity Overview Debt maturity profile and liquidity provide financial flexibility 19 • Ample liquidity of $444.3 million at Q3 2023 • Sound credit metrics and no near term debt maturities • Capital allocation prioritizes organic growth, followed by opportunistic share repurchases and M&A, within the context of the Company’s historical range of net leverage $ Millions Q2 2023 Q3 2023 Debt Summary 4.50% Senior Notes, mature April 2029 $ 500.0 $ 500.0 Senior Credit Facility, matures April 2026: 6 Term Loan Facility 341.3 336.9 Revolving Facility - - Total Notional Amount of Debt $ 841.3 $ 836.9 Less: Cash and Equivalents 120.3 65.3 Notional Net Debt $ 721.0 $ 771.6 Liquidity7 $ 366.3 $ 444.3

Cash Flow Overview 20 Operating Cash Flow $ Millions Q3 2022 Q3 2023 Cash Flow Summary Operating cash flow $ 104.3 $ (4.5) Capital expenditures, net of disposals $ (44.1) $ (49.2) Repayments on Senior Credit Facility $ - $ (4.4) Extinguishment of 2021 Convertible Notes $ (58.3) $ - Other financing & investing activities, net $ (0.2) $ 3.1 Days Sales Oustanding ("DSO") Q2 2023 Q3 2023 Total DSO8 107 1124 Qtrs Ended Q3 2023 • Operating cash flow used to support strong organic growth during fiscal 2023 • Capital expenditures, net of disposals, for fiscal 2023 expected to range from $165 million to $175 million, a decrease compared to the low end of $180 million in the outlook previously provided
21
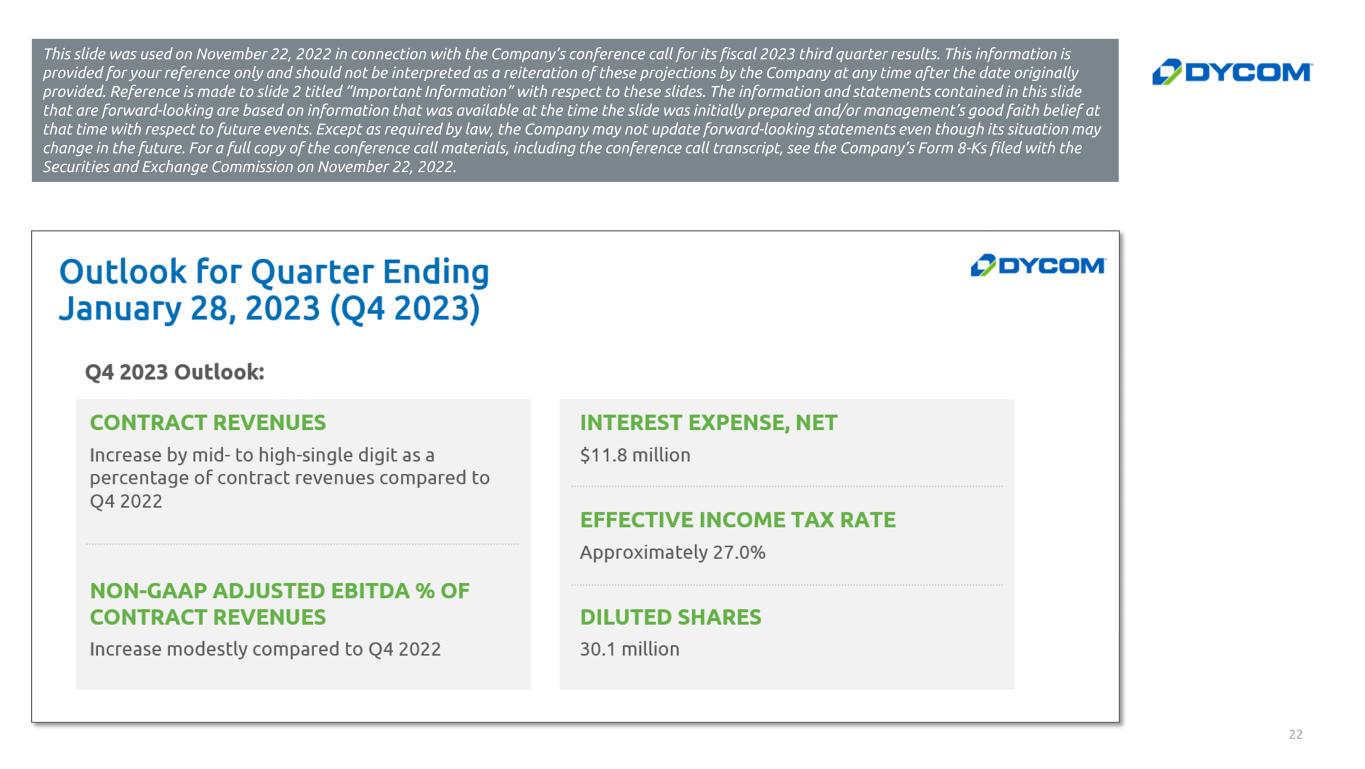
22 This slide was used on November 22, 2022 in connection with the Company’s conference call for its fiscal 2023 third quarter results. This information is provided for your reference only and should not be interpreted as a reiteration of these projections by the Company at any time after the date originally provided. Reference is made to slide 2 titled “Important Information” with respect to these slides. The information and statements contained in this slide that are forward-looking are based on information that was available at the time the slide was initially prepared and/or management’s good faith belief at that time with respect to future events. Except as required by law, the Company may not update forward-looking statements even though its situation may change in the future. For a full copy of the conference call materials, including the conference call transcript, see the Company’s Form 8-Ks filed with the Securities and Exchange Commission on November 22, 2022.
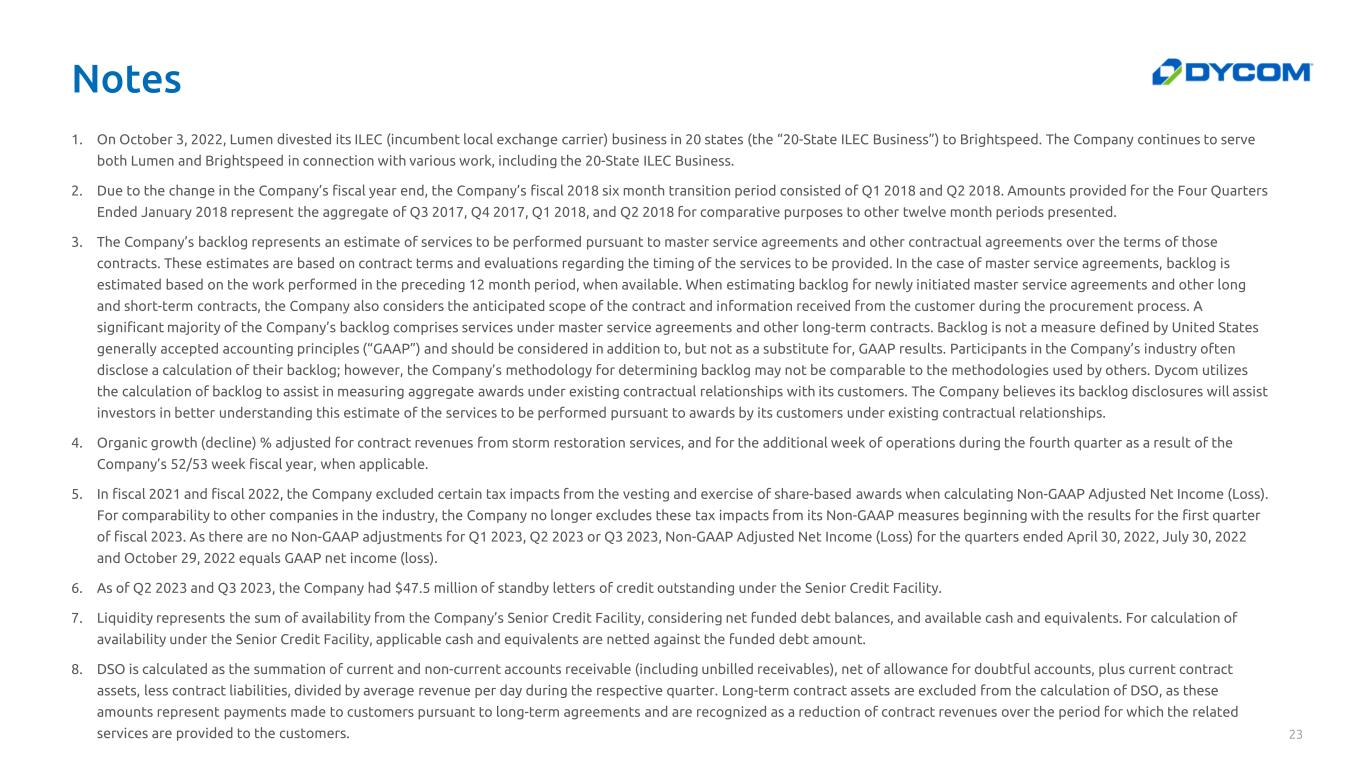
Notes 1. On October 3, 2022, Lumen divested its ILEC (incumbent local exchange carrier) business in 20 states (the “20-State ILEC Business”) to Brightspeed. The Company continues to serve both Lumen and Brightspeed in connection with various work, including the 20-State ILEC Business. 2. Due to the change in the Company’s fiscal year end, the Company’s fiscal 2018 six month transition period consisted of Q1 2018 and Q2 2018. Amounts provided for the Four Quarters Ended January 2018 represent the aggregate of Q3 2017, Q4 2017, Q1 2018, and Q2 2018 for comparative purposes to other twelve month periods presented. 3. The Company’s backlog represents an estimate of services to be performed pursuant to master service agreements and other contractual agreements over the terms of those contracts. These estimates are based on contract terms and evaluations regarding the timing of the services to be provided. In the case of master service agreements, backlog is estimated based on the work performed in the preceding 12 month period, when available. When estimating backlog for newly initiated master service agreements and other long and short-term contracts, the Company also considers the anticipated scope of the contract and information received from the customer during the procurement process. A significant majority of the Company’s backlog comprises services under master service agreements and other long-term contracts. Backlog is not a measure defined by United States generally accepted accounting principles (“GAAP”) and should be considered in addition to, but not as a substitute for, GAAP results. Participants in the Company’s industry often disclose a calculation of their backlog; however, the Company’s methodology for determining backlog may not be comparable to the methodologies used by others. Dycom utilizes the calculation of backlog to assist in measuring aggregate awards under existing contractual relationships with its customers. The Company believes its backlog disclosures will assist investors in better understanding this estimate of the services to be performed pursuant to awards by its customers under existing contractual relationships. 4. Organic growth (decline) % adjusted for contract revenues from storm restoration services, and for the additional week of operations during the fourth quarter as a result of the Company’s 52/53 week fiscal year, when applicable. 5. In fiscal 2021 and fiscal 2022, the Company excluded certain tax impacts from the vesting and exercise of share-based awards when calculating Non-GAAP Adjusted Net Income (Loss). For comparability to other companies in the industry, the Company no longer excludes these tax impacts from its Non-GAAP measures beginning with the results for the first quarter of fiscal 2023. As there are no Non-GAAP adjustments for Q1 2023, Q2 2023 or Q3 2023, Non-GAAP Adjusted Net Income (Loss) for the quarters ended April 30, 2022, July 30, 2022 and October 29, 2022 equals GAAP net income (loss). 6. As of Q2 2023 and Q3 2023, the Company had $47.5 million of standby letters of credit outstanding under the Senior Credit Facility. 7. Liquidity represents the sum of availability from the Company’s Senior Credit Facility, considering net funded debt balances, and available cash and equivalents. For calculation of availability under the Senior Credit Facility, applicable cash and equivalents are netted against the funded debt amount. 8. DSO is calculated as the summation of current and non-current accounts receivable (including unbilled receivables), net of allowance for doubtful accounts, plus current contract assets, less contract liabilities, divided by average revenue per day during the respective quarter. Long-term contract assets are excluded from the calculation of DSO, as these amounts represent payments made to customers pursuant to long-term agreements and are recognized as a reduction of contract revenues over the period for which the related services are provided to the customers. 23
The people connecting America® 24


