
| Presentation September 2007 |
| Forward-Looking Statements and Non-GAAP Information This presentation contains forward-looking statements within the meaning of the Private Securities Litigation Reform Act of 1995. The words "believe," "expect," "anticipate," "estimate," "intend," "forecast," "may," "project", "outlook" and similar expressions identify forward-looking statements. These forward-looking statements are based on management's current expectations, estimates and projections and speak only as of the date of this presentation. Forward-looking statements are subject to known and unknown risks and uncertainties that may cause actual results in the future to differ materially from the results projected or implied in any forward-looking statements contained in this presentation. The factors that could affect future results and could cause these results to differ materially from those expressed in the forward-looking statements include, but are not limited to, those described under Item 1A, "Risk Factors" of the Company's Annual Report on Form 10-K for the year ended July 28, 2007, and other risks outlined in the Company's periodic filings with the Securities and Exchange Commission ("SEC"). Except as required by law, the Company may not update forward-looking statements even though its situation may change in the future. This presentation includes certain "non-GAAP" financial measures as defined by SEC rules. As required by the SEC we have provided a reconciliation of those measures to the most directly comparable GAAP measures on the Regulation G slides included at the end of this presentation. |
| Dycom Industries Introduction Leading provider of specialty contracting services. These services include engineering, construction, maintenance and installation services to telecommunications providers, underground locating services to various utilities including telecommunications providers, and other construction and maintenance services to electric utilities and others. Telecommunications industry dynamics driving growth potential Significant participant in a large, but fragmented industry, which offers acquisition opportunities Significant portion of revenues from multi-year Master Service Agreements Experienced management team operating through a decentralized, customer- focused organizational structure Strong financial resources |
| Through internal growth and selective acquisitions, Dycom will be the leading provider of comprehensive, integrated engineering, construction and maintenance services to major telecommunications service providers throughout the United States. Mission Statement |
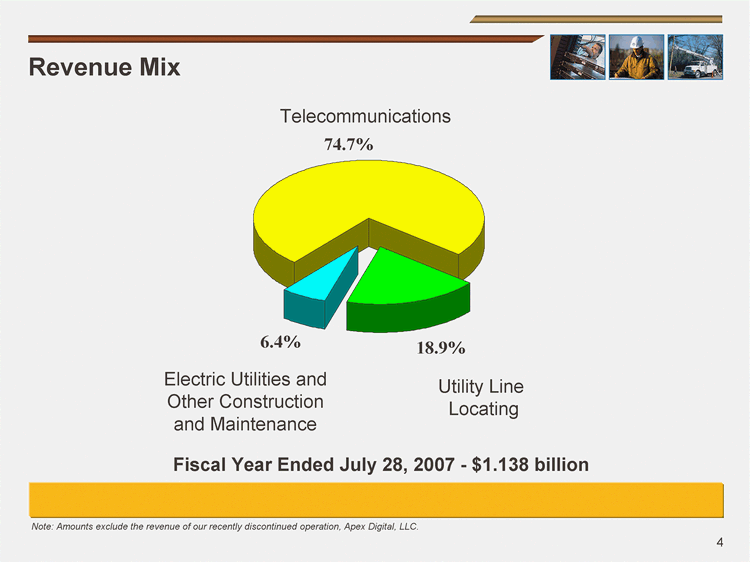
| Revenue Mix FY 2007 Telecommunications 0.747 Utility Line Locating 0.189 Electric Utilities and Other Customers 0.064 Fiscal Year Ended July 28, 2007 - $1.138 billion Note: Amounts exclude the revenue of our recently discontinued operation, Apex Digital, LLC. Telecommunications Utility Line Locating Electric Utilities and Other Construction and Maintenance |
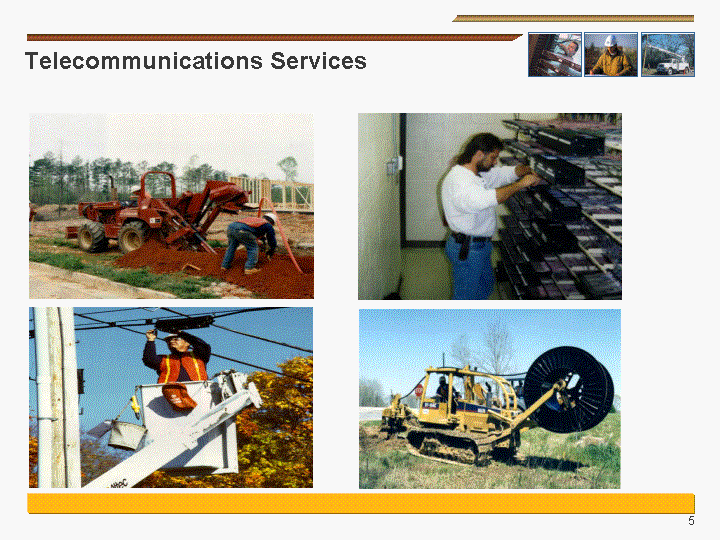
| Telecommunications Services |

| Utility Locating Engineering |
| Headquartered in Palm Beach Gardens, Florida FY 2007 revenues of $1.138 billion, 15.1% organic growth in most recent quarter Strong financial profile Shareholders' equity $444.6 million Committed Bank Facility - $215.2 million available at July 28, 2007 Operating Cash Flow in excess of $108 million last fiscal year Nationwide footprint Operates in 48 states and to a limited extent in Canada 30 operating subsidiaries and hundreds of field offices 10,899 employees Listed on the NYSE under the ticker: DY Executive Summary At a Glance Dycom is a leading telecommunications infrastructure provider in the United States Note: Organic growth rate for Q4 2007 reflects growth in revenue from Q4 2006 to Q4 2007 excluding revenue from businesses acquired subsequent to Q3 2006 and excluding revenue for hurricane restoration services of $0.25 million earned in Q4 2006 -See "Regulation G Disclosure" slide for a reconciliation of non-GAAP financial measure. |
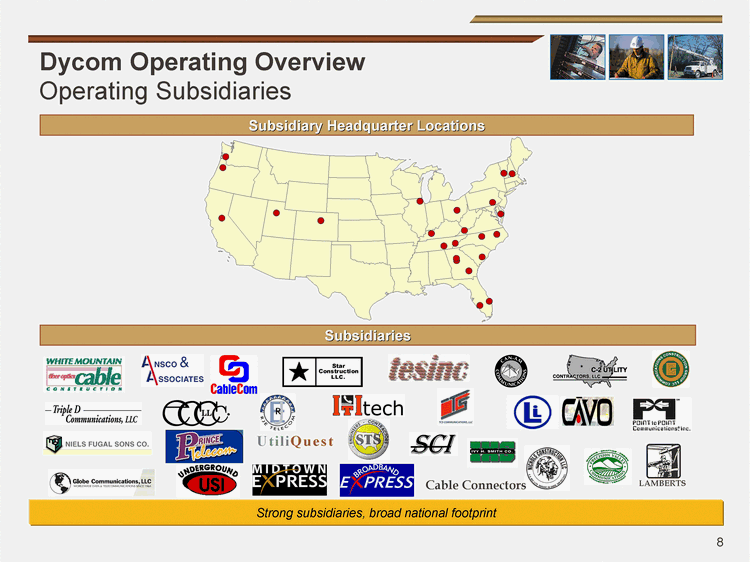
| Strong subsidiaries, broad national footprint Operating Subsidiaries Subsidiaries Cable Connectors UtiliQuest Subsidiary Headquarter Locations LAMBERTS Dycom Operating Overview |
| Industry Developments . . . Telephone/cable industry convergence now a reality. Each industries' growth strategies rely on securing customers from the other Network bandwidth expansion an imperative Telephone companies regardless of size or geographic location acknowledge the crucial need to expand network capacity Cable responding to match telephone and to facilitate new products such as VOIP and high definition television Action/reaction dynamic constantly increasing available bandwidth to consumers Product bundles key to telephone/cable company business success Decrease churn Differentiate cable and telephone companies from satellite video providers Provide increased revenue growth opportunities needed to offset market share erosion |
| . . . And Opportunities Increased capital spending Telephone company deployments of Fiber to the Premise and Fiber to the Node networks Cable company bandwidth expansion to 860 mhz. and 1 ghz. Customer premise equipment deployments for cable companies provisioning voice services and telephone companies provisioning video Renewed focus on network reliability and availability as subscribers demand better service levels Continued outsourcing as time to market and installation quality crucial for new product launches |
| Telecom Capital Spending Capex Commentary Renewed capital spending growth in wireline reflects burgeoning demand for voice, data and video transmission RBOCs will continue to constitute the vast majority of U.S. fixed line investment Approximately two-thirds of the RBOCs' capital budgets are expected to be from fiber initiatives Carriers are shifting capital spending to address growth needs and increased competition from cable companies Dycom is well positioned to benefit as telcos seek to upgrade networks "So I would expect that you'll see some more push, particularly from Comcast, with their ramp-up, which is really the entire reason we have spent a lot of time and money on FiOS, because we think, from what we can tell, you really need the triple play to be able to combat that and be in the marketplace." Doreen Toben, Verizon - EVP, CFO |
| Cable Capital Spending Capex Commentary Spending outlook improving as some bandwidth expansion necessary Capital expenditures increasing as new product offerings, such as VOIP and HDTV, gain traction and former Adelphia properties require enhancements Ongoing plant and network enhancements are critical as cable operators begin to offer services that require greater reliability Network capacity and reliability increasingly crucial as cable companies compete with traditional telecom firms Cable spending outlook is improving "Our momentum in CDV continues. We now serve more than 3 million customers with CDV, having done that in really only two years. The growth will continue." "Today, we're able to deliver our three services and scale to more than 38 million homes in our markets, and that's a competitive timing advantage that we believe we can continue to leverage. To do that, we're reinvesting capital to drive new services faster and build new businesses, like small and medium-size business" Brian Roberts, Comcast - Chairman and CEO |
| "Dig Safe" laws in all 50 states require owners of underground utilities to identify and mark their facilities prior to excavation Regulate telephone, cable, power, gas, water and sewer utilities Seek to minimize network outages, protect job-site workers, and safeguard the general public Locates often required as a condition for permit issuance on residential and commercial construction projects Generally an outsourced activity by telecom companies and cable operators Work generated by excavators through "800 number" call centers High volume business as survey must be completed within 48 - 72 hours Suppliers engaged under long-term contracts to provide labor services to owners of underground utilities Regulatory backdrop promotes predictable, stable workflow Driven by regional macro-economic factors such as new construction Limited correlation to telecom and cable capital spending decisions Utility Locating Services |
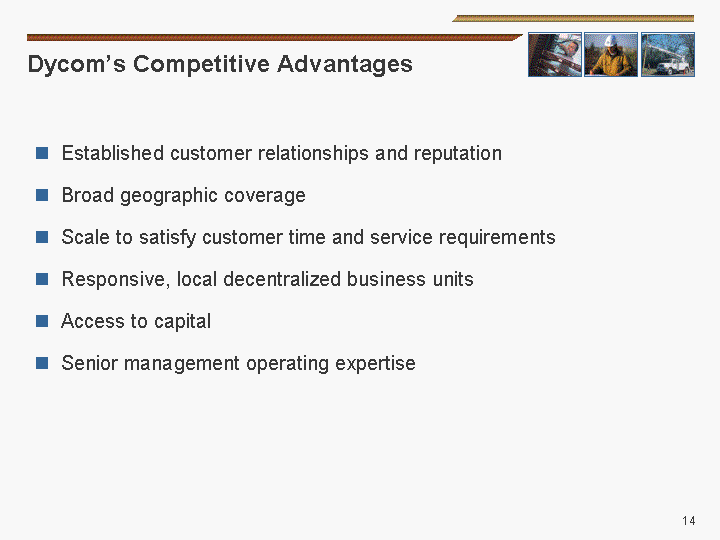
| Dycom's Competitive Advantages Established customer relationships and reputation Broad geographic coverage Scale to satisfy customer time and service requirements Responsive, local decentralized business units Access to capital Senior management operating expertise |
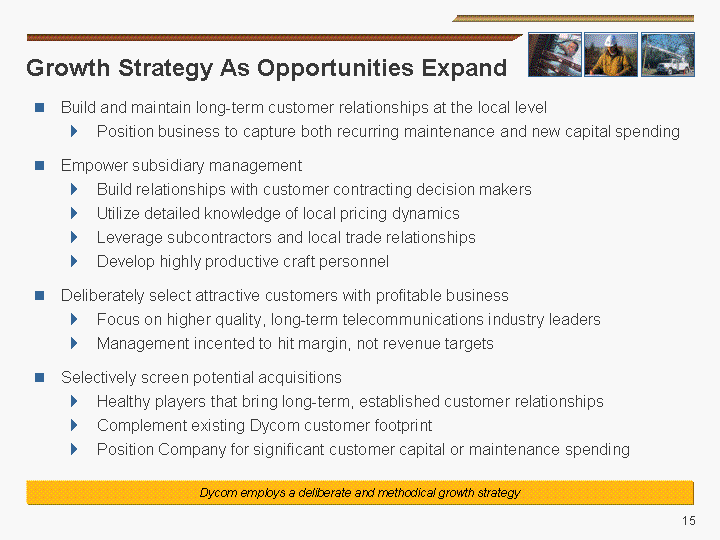
| Dycom employs a deliberate and methodical growth strategy Growth Strategy As Opportunities Expand Build and maintain long-term customer relationships at the local level Position business to capture both recurring maintenance and new capital spending Empower subsidiary management Build relationships with customer contracting decision makers Utilize detailed knowledge of local pricing dynamics Leverage subcontractors and local trade relationships Develop highly productive craft personnel Deliberately select attractive customers with profitable business Focus on higher quality, long-term telecommunications industry leaders Management incented to hit margin, not revenue targets Selectively screen potential acquisitions Healthy players that bring long-term, established customer relationships Complement existing Dycom customer footprint Position Company for significant customer capital or maintenance spending |
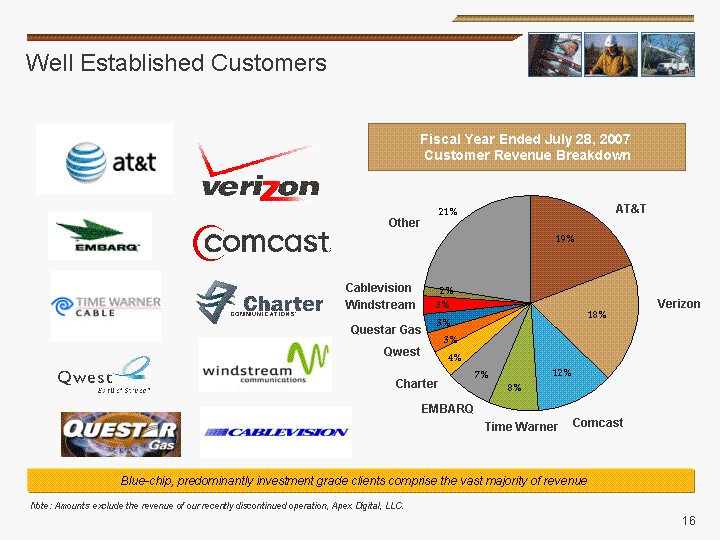
| AT&T Total 218805233 Verizon-combined 204049344 Comcast Corporation Total 131995646 Time Warner 85386853 Embarq Total 78886724 Charter Communications 49947304 Qwest 32762072 Questar Gas 32182229 Windstream Total 31819890 Cablevision 17485840 All Other 254490906 Blue-chip, predominantly investment grade clients comprise the vast majority of revenue Other Comcast Charter Questar Gas Windstream AT&T EMBARQ Well Established Customers Fiscal Year Ended July 28, 2007 Customer Revenue Breakdown Qwest Verizon Time Warner Note: Amounts exclude the revenue of our recently discontinued operation, Apex Digital, LLC. Cablevision |
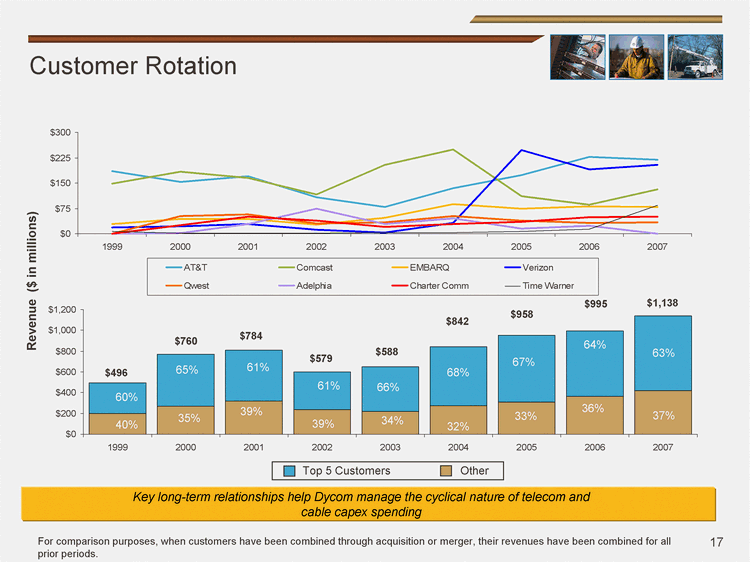
| Other Top 5 1999 200.4 295.6 2000 272.4 496 2001 318.6 488 2002 235.7 367 2003 222.9 429 2004 272.6 569.7 2005 309.5 644.4 2006 362.5 632.5 2007 418.7 719.1 AT&T Comcast EMBARQ Verizon Qwest Adelphia Charter Comm Time Warner 1999 186 148 29 19 0 0 0 7 2000 153 183 43 22 52 2 26 2 2001 171 165 43 28 57 29 51 1 2002 108 116 27 12 31 74 38 2 2003 79 204 48 3 34 29 21 3 2004 135 249 88 32 53 45 29 4 2005 173 111 74 248 38 16 35 7 2006 227 86 81 190 32 23 49 14 2007 219 132 79 204 33 0 50 85 Customer Rotation Key long-term relationships help Dycom manage the cyclical nature of telecom and cable capex spending Revenue ($ in millions) $958 $842 $588 $579 $784 $760 $496 Top 5 Customers Other 60% 40% 65% 35% 61% 39% 61% 68% 32% 67% 33% 64% 36% $995 37% 63% $1,138 34% 66% For comparison purposes, when customers have been combined through acquisition or merger, their revenues have been combined for all prior periods. 39% |
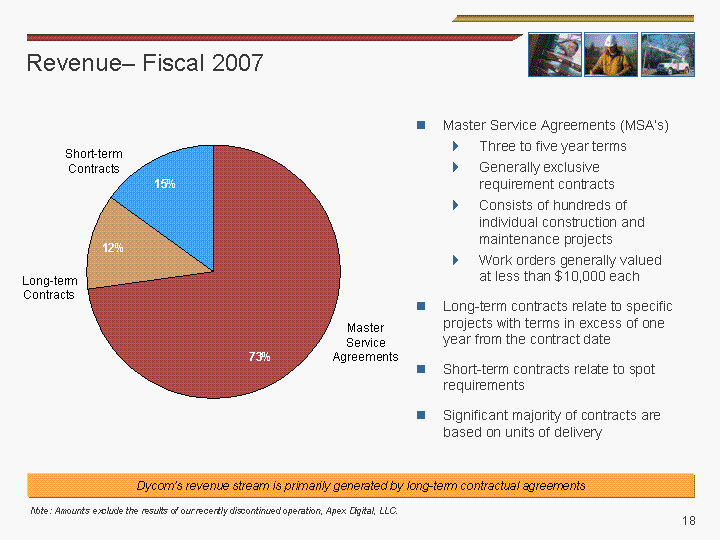
| Revenue- Fiscal 2007 Dycom's revenue stream is primarily generated by long-term contractual agreements MSA 0.7277 LT Contracts 0.1213 ST Contracts 0.151 Long-term Contracts Short-term Contracts Master Service Agreements Master Service Agreements (MSA's) Three to five year terms Generally exclusive requirement contracts Consists of hundreds of individual construction and maintenance projects Work orders generally valued at less than $10,000 each Long-term contracts relate to specific projects with terms in excess of one year from the contract date Short-term contracts relate to spot requirements Significant majority of contracts are based on units of delivery Note: Amounts exclude the results of our recently discontinued operation, Apex Digital, LLC. |
| Multi-year, multi-million dollar agreements and other arrangements with customers which generally encompass thousands of individual work authorizations Party to approximately 200 of these agreements with over 100 customers as of July 28, 2007 MSA's and other long-term contracts typically generate revenues between $3 - $50 million over their terms Historically initiated through competitive bidding process Have trended towards securing or extending agreements on a negotiated basis MSA's and Other Long-term Contracts Operating Overview |
| Senior Management Operating Overview Seasoned management team with 60 years of Company and industry specific experience |

| Financial Summary |
| Centralize activities which yield synergistic benefits Treasury Tax Risk management Capital asset procurement Decentralize financial operations to provide solid support and flexibility at operating unit level Maintain financial resources to support internal growth and acquisition opportunities Financial Strategy |
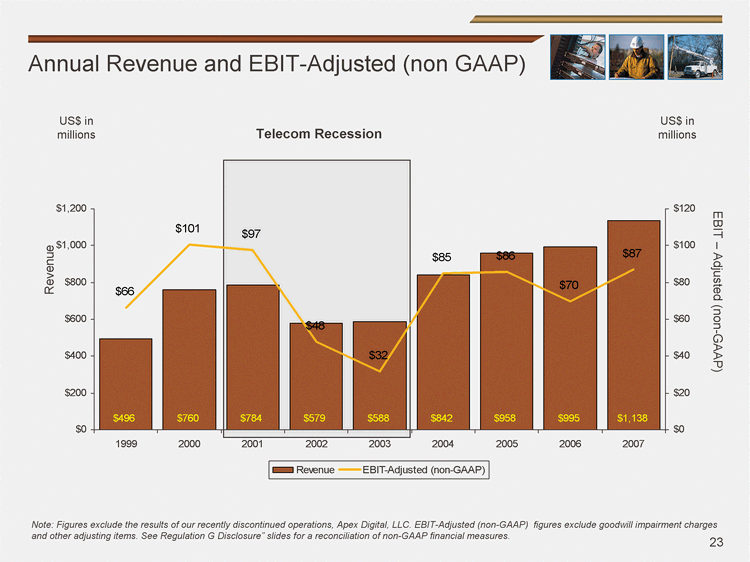
| EBIT-Adjusted (non-GAAP) Revenue 1999 66.2 496 2000 100.5 760.4 2001 97.4 783.9 2002 47.9 578.5 2003 31.8 587.7 2004 85.1 842.3 2005 85.6 958 2006 69.8 995 2007 87 1137.8 Annual Revenue and EBIT-Adjusted (non GAAP) US$ in millions Telecom Recession US$ in millions Revenue EBIT - Adjusted (non-GAAP) Note: Figures exclude the results of our recently discontinued operations, Apex Digital, LLC. EBIT-Adjusted (non-GAAP) figures exclude goodwill impairment charges and other adjusting items. See Regulation G Disclosure" slides for a reconciliation of non-GAAP financial measures. |
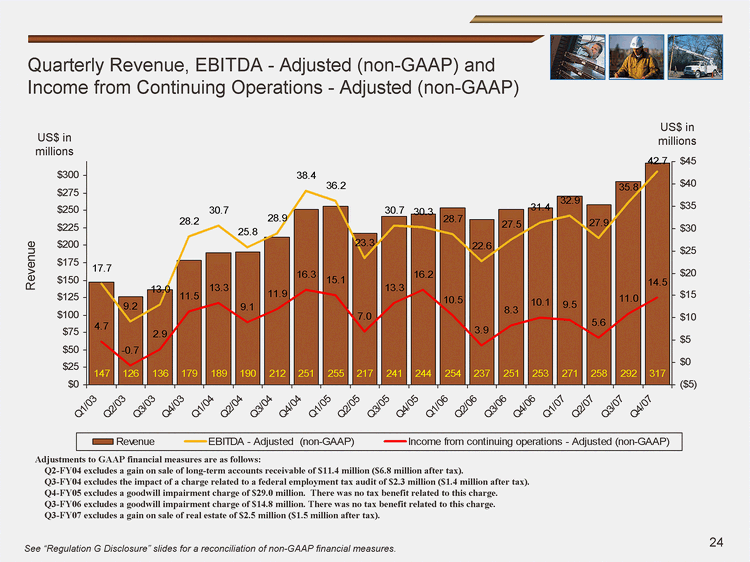
| EBITDA - Adjusted (non-GAAP) Revenue Income from continuing operations - Adjusted (non-GAAP) Q1/03 17.7 146.9 4.7 Q2/03 9.2 126.4 -0.7 Q3/03 13 135.7 2.9 Q4/03 28.2 178.7 11.5 Q1/04 30.7 188.9 13.3 Q2/04 25.8 190.1 9.1 Q3/04 28.9 211.9 11.9 Q4/04 38.4 251.4 16.3 Q1/05 36.2 255.4 15.1 Q2/05 23.3 217.1 7 Q3/05 30.7 241.1 13.3 Q4/05 30.3 244.4 16.2 Q1/06 28.7 253.6 10.5 Q2/06 22.6 237.1 3.9 Q3/06 27.5 251.1 8.3 Q4/06 31.4 253.2 10.1 Q1/07 32.9 270.6 9.5 Q2/07 27.9 258.3 5.6 Q3/07 35.8 291.6 11 Q4/07 42.7 317.3 14.5 Quarterly Revenue, EBITDA - Adjusted (non-GAAP) and Income from Continuing Operations - Adjusted (non-GAAP) US$ in millions US$ in millions Revenue Adjustments to GAAP financial measures are as follows: Q2-FY04 excludes a gain on sale of long-term accounts receivable of $11.4 million ($6.8 million after tax). Q3-FY04 excludes the impact of a charge related to a federal employment tax audit of $2.3 million ($1.4 million after tax). Q4-FY05 excludes a goodwill impairment charge of $29.0 million. There was no tax benefit related to this charge. Q3-FY06 excludes a goodwill impairment charge of $14.8 million. There was no tax benefit related to this charge. Q3-FY07 excludes a gain on sale of real estate of $2.5 million ($1.5 million after tax). See "Regulation G Disclosure" slides for a reconciliation of non-GAAP financial measures. |
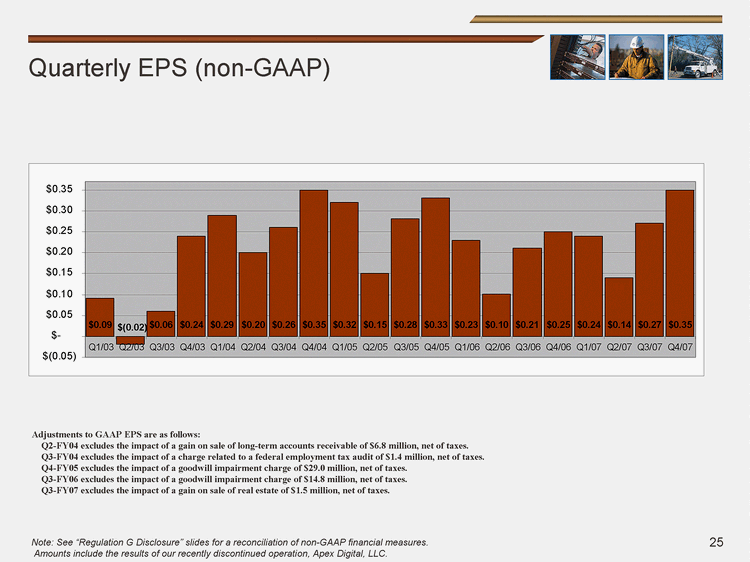
| Quarterly EPS (non-GAAP) Note: See "Regulation G Disclosure" slides for a reconciliation of non-GAAP financial measures. Amounts include the results of our recently discontinued operation, Apex Digital, LLC. Adjustments to GAAP EPS are as follows: Q2-FY04 excludes the impact of a gain on sale of long-term accounts receivable of $6.8 million, net of taxes. Q3-FY04 excludes the impact of a charge related to a federal employment tax audit of $1.4 million, net of taxes. Q4-FY05 excludes the impact of a goodwill impairment charge of $29.0 million, net of taxes. Q3-FY06 excludes the impact of a goodwill impairment charge of $14.8 million, net of taxes. Q3-FY07 excludes the impact of a gain on sale of real estate of $1.5 million, net of taxes. |
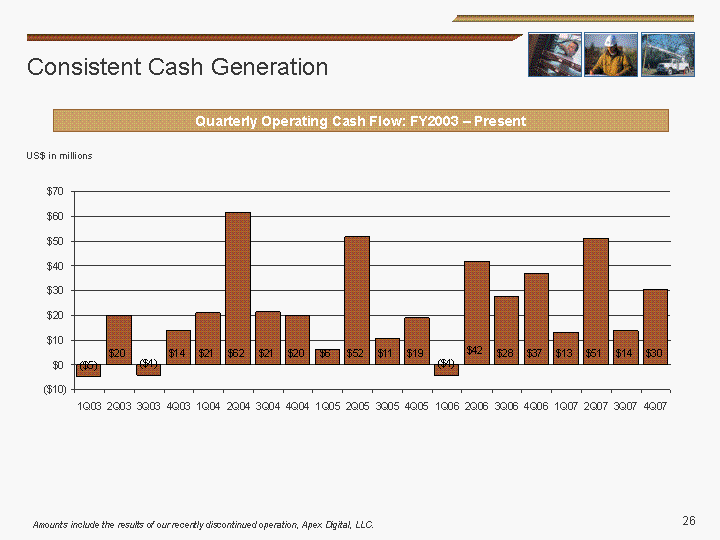
| Q CF 1Q03 -4.7 1Q03 2Q03 20.1 2Q03 3Q03 -4 3Q03 4Q03 13.9 4Q03 1Q04 21.2 1Q04 2Q04 61.7 2Q04 3Q04 21.3 3Q04 4Q04 19.9 4Q04 1Q05 6.3 1Q05 2Q05 51.8 2Q05 3Q05 10.6 3Q05 4Q05 18.8 1Q06 -4.2 2Q06 41.8 3Q06 27.5 4Q06 37 1Q07 13 2Q07 51 3Q07 13.8 4Q07 30.2 Consistent Cash Generation Quarterly Operating Cash Flow: FY2003 - Present US$ in millions Amounts include the results of our recently discontinued operation, Apex Digital, LLC. |
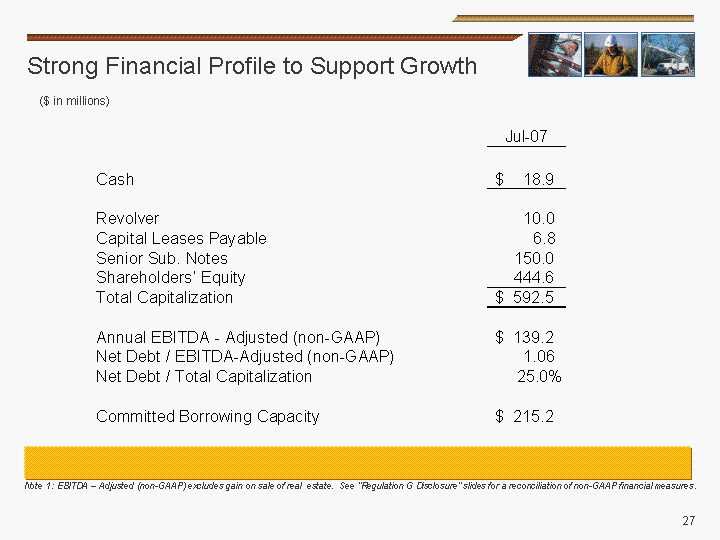
| Strong Financial Profile to Support Growth Note 1: EBITDA - Adjusted (non-GAAP) excludes gain on sale of real estate. See "Regulation G Disclosure" slides for a reconciliation of non-GAAP financial measures. ($ in millions) |
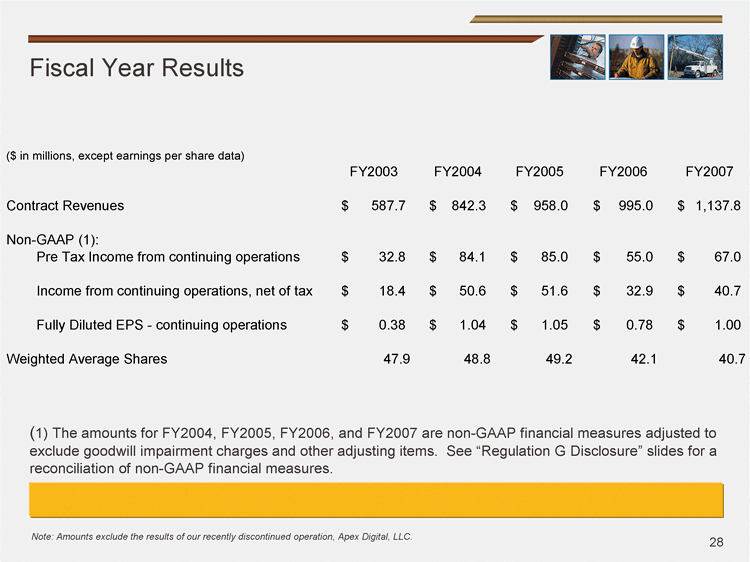
| Fiscal Year Results (1) The amounts for FY2004, FY2005, FY2006, and FY2007 are non-GAAP financial measures adjusted to exclude goodwill impairment charges and other adjusting items. See "Regulation G Disclosure" slides for a reconciliation of non-GAAP financial measures. Note: Amounts exclude the results of our recently discontinued operation, Apex Digital, LLC. |
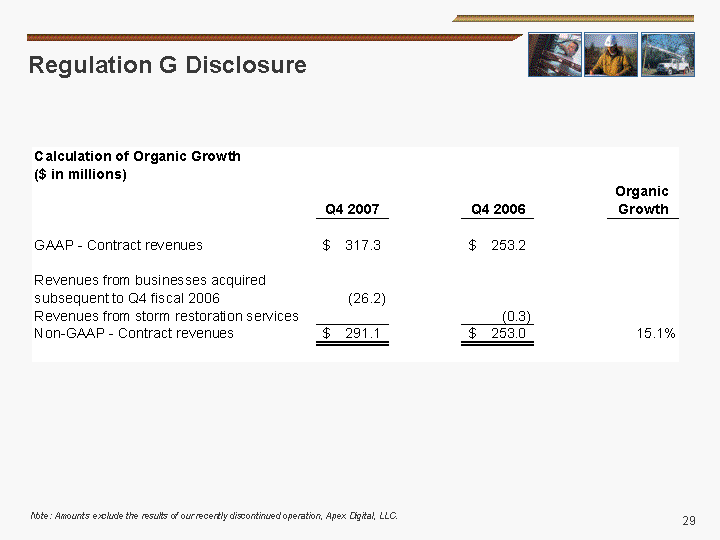
| Regulation G Disclosure Regulation G Disclosure Note: Amounts exclude the results of our recently discontinued operation, Apex Digital, LLC. |
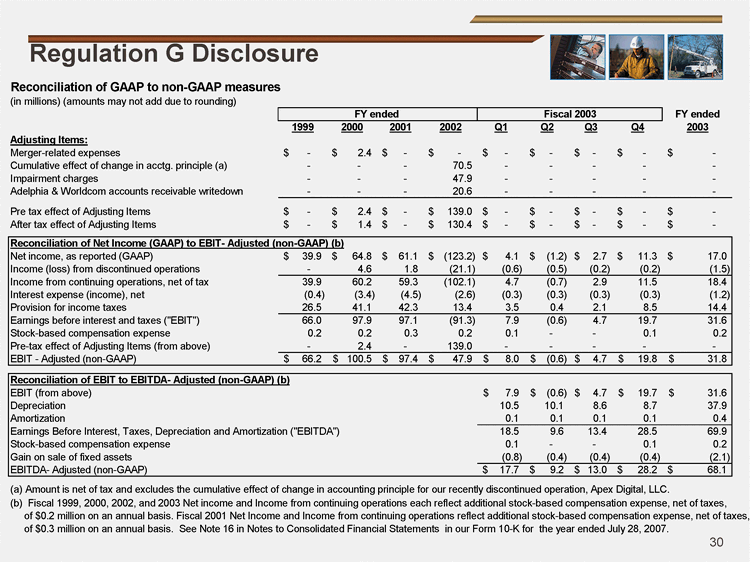
| Regulation G Disclosure |
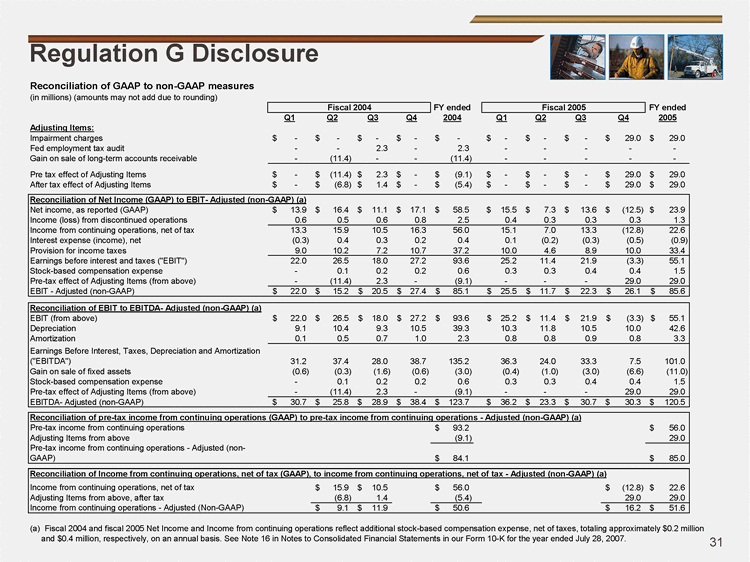
| Regulation G Disclosure |
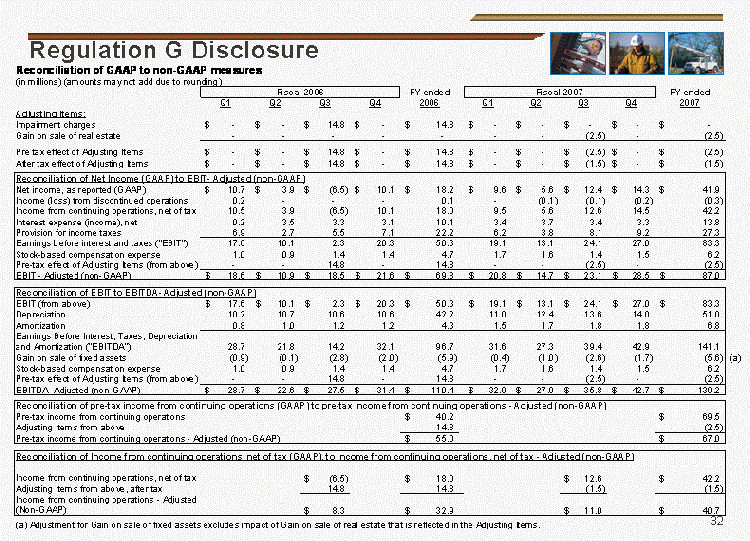
| Regulation G Disclosure |
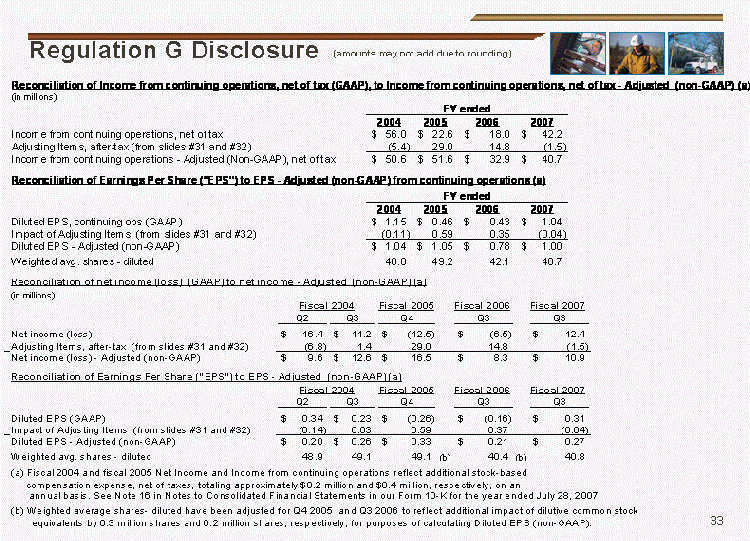
| Regulation G Disclosure (amounts may not add due to rounding) |

| Presentation September 2007 |