Exhibit 99.2
®
2nd Quarter Fiscal 2010
Results Presentation
February 24, 2010
1
Participants
Steven E. Nielsen
President & Chief Executive Officer
H. Andrew DeFerrari
Chief Financial Officer Richard B. Vilsoet
General Counsel |
Forward-Looking Statements and Non-GAAP Information This presentation contains forward-looking statements within the meaning of the Private Securities Litigation Reform Act of 1995, including statements with respect to the Company’s fiscal 2010 third quarter results. The words “believe,” “expect,” “anticipate,” “estimate,” “intend,” “forecast,” “may,” “should”, “could”, “project,” “outlook” and similar expressions identify forward-looking statements. These forward-looking statements are based on management’s current expectations, estimates and projections and speak only as of the date of this presentation. Forward-looking statements are subject to known and unknown risks and uncertainties that may cause actual results in the future to differ materially from the results projected or implied in any forward-looking statements contained in this presentation. The factors that could affect future results and could cause these results to differ materially from those expressed in the forward-looking statements include, but are not limited to, those described under Item 1A, “Risk Factors” of the Company’s Annual Report on Form 10-K for the year ended July 25, 2009, and other risks outlined in the Company’s periodic filings with the Securities and Exchange Commission (“SEC”). Except as required by law, the Company may not update forward-looking statements even though its situation may change in the future. This presentation includes certain “Non-GAAP” financial measures as defined by SEC rules. As required by the SEC we have provided a reconciliation of those measures to the most directly comparable GAAP measures on the Regulation G slides included at slides 10 & 11 of this presentation.
3
Q2-2010 Overview
n Q2-10 results of $(0.10) per share
n Revenue of $216.3 million in Q2-10 declined sequentially by
16.5%; Year over year decline was 11.9%.
n Solid contract awards and extensions secured during the
quarter
n Strong operating cash flows during the quarter
n Net cash position at January 23, 2010
4
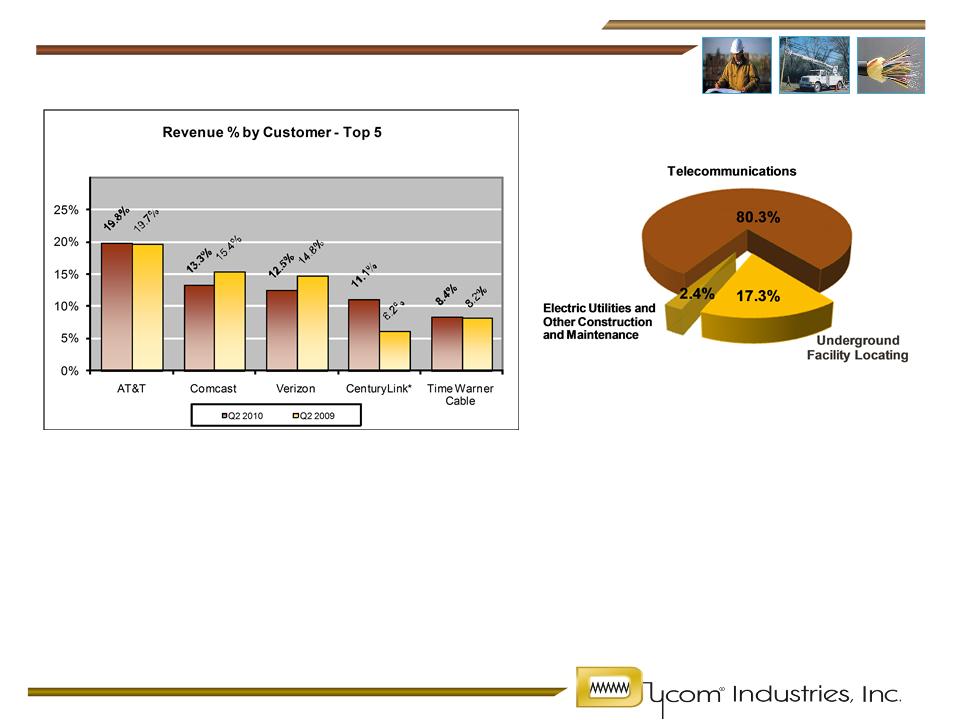
Revenue by Customer
n Top 5 customers represented 65.1% of revenue in Q2-10 and 64.3% of revenue
in Q2-09
n Overall revenue decline was 11.9%, with top 5 customers down approximately
10.8% and all other customers down approximately 13.9%. Q2-09 included $3.3
million in storm work.
* For comparison purposes, CenturyLink includes combined revenues from CenturyTel, Inc. and Embarq Corporation for each period presented.
5
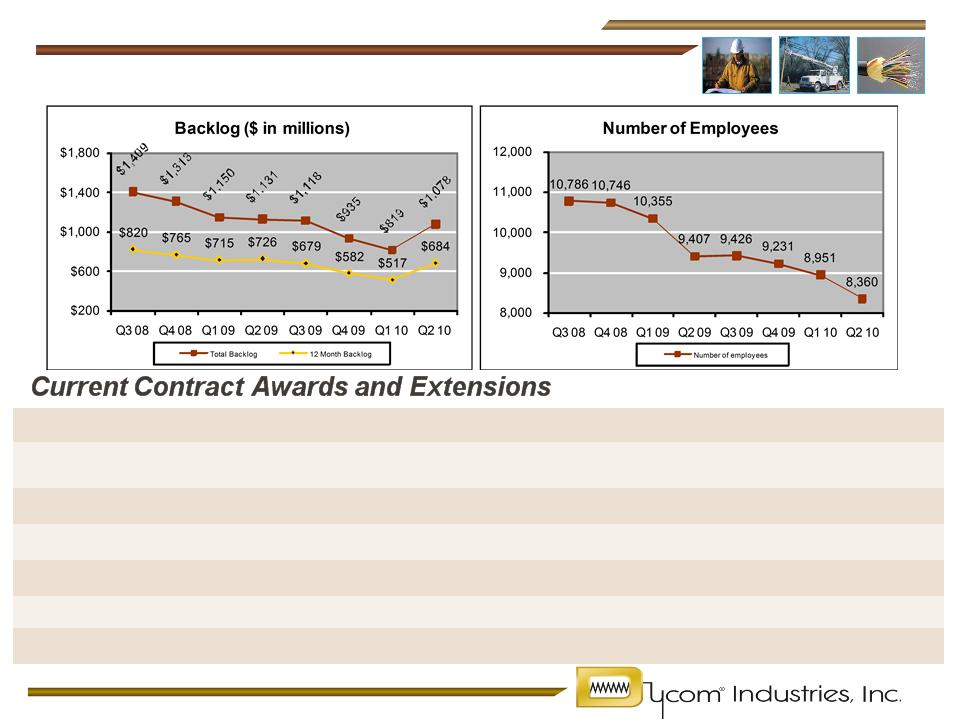
Backlog and Employees
Customer | Area | Description | Term (in years) |
nAT&T | Central Florida | Master Service Agreement | 3 |
nComcast | California | Master Service Agreement | 3 |
nVerizon | Northeast | Other Long-Term Agreement | 1 |
nComcast | Nationally | Various Long-Term Agreements | 1 |
nCharter | Nationally | Various Long-Term Agreements | 1 |
nAT&T | Georgia | Locating | 3 |
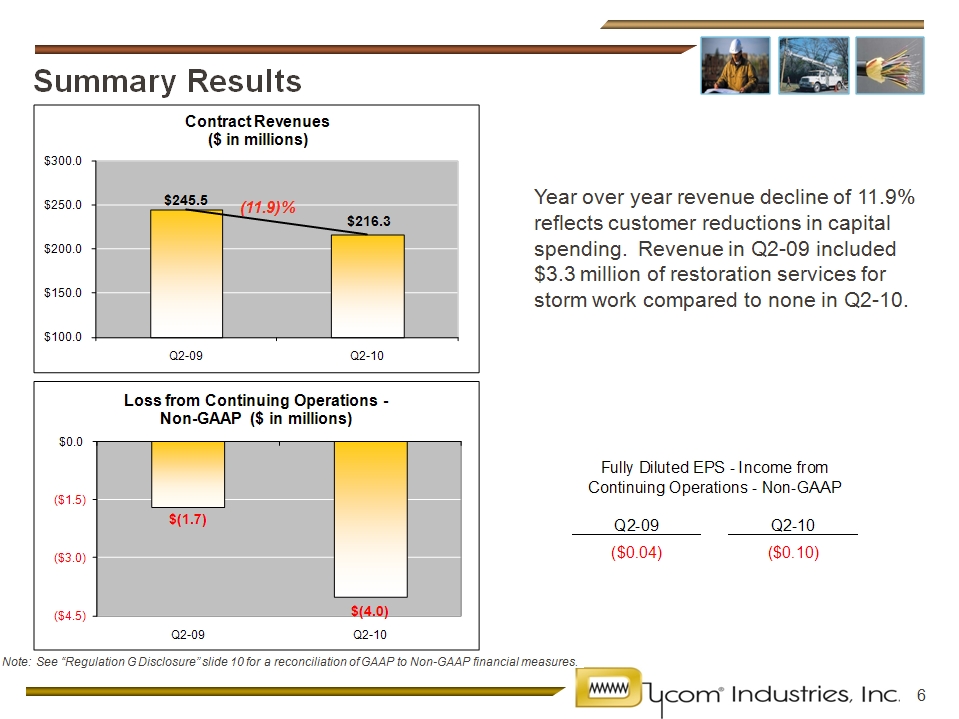
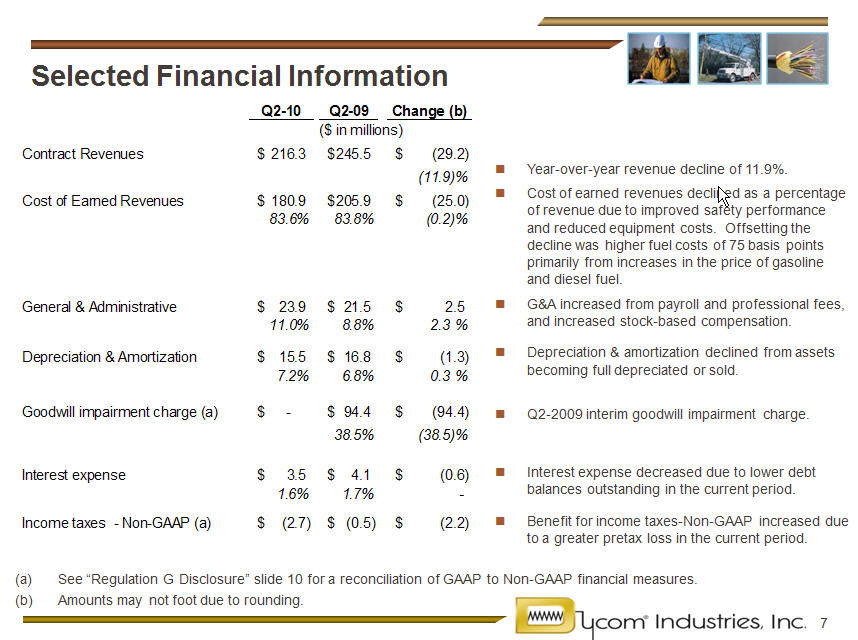
Summary Results Year over year revenue decline of 11.9% reflects customer reductions in capital spending. Revenue in Q2-09 included $3.3 million of restoration services for storm work compared to none in Q2-10.Note: See “Regulation G Disclosure” slide 10 for a reconciliation of GAAP to Non-GAAP financial measures.
8
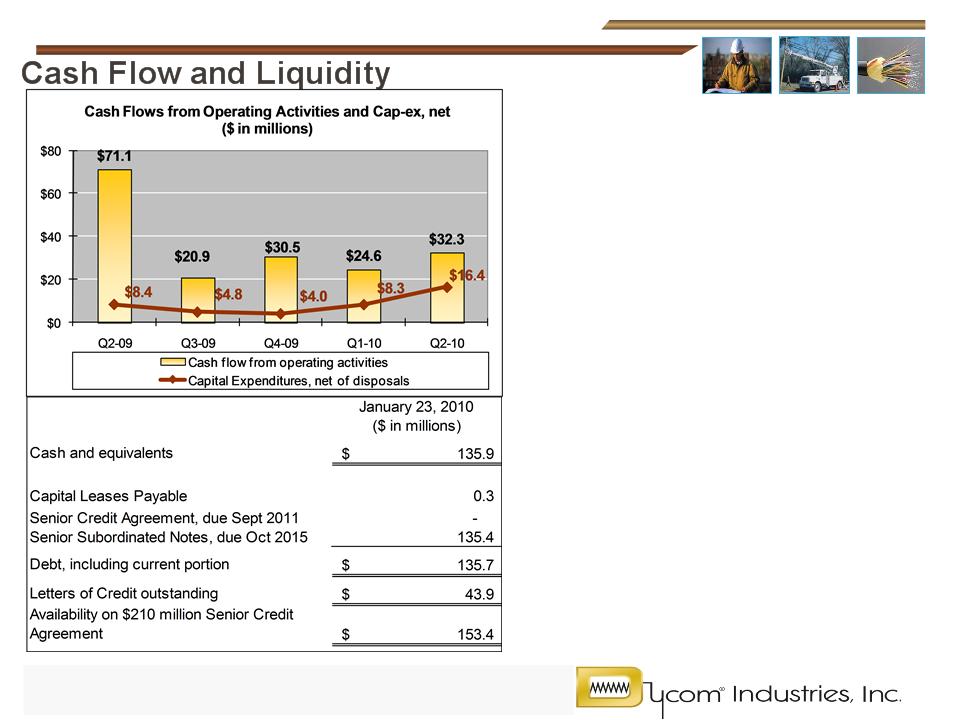
n Cash flow from operations was strong at $32.3
million for Q2-10.
n Combined days sales outstanding on trade
receivables and net unbilled revenues were 56
days in Q2-10 and 60 days in Q1-10 (a).
n Capital expenditures, net of disposals at $16.4
million reflecting the replacement cycle of our
assets and new opportunities.
n Total cash less debt was $0.2 million at the end
of Q2-10 compared to net debt of $(15.5) million
as of Q1-10.
n In compliance with debt covenants as of
January 23, 2010.
(a) Days sales outstanding is calculated as the summation of current accounts receivable,
plus costs and estimated earnings in excess of billings, less billings in excess of costs and
estimated earnings, divided by average revenue per day during the respective quarter.
9
Summary
n Challenging economic environment
n Solid customer relationships
n At the forefront of evolving industry opportunities including those resulting from
industry mergers and acquisitions
n Growing market share as customers consolidate vendors
n Encouraged by deployment of new technologies by cable operators
n Strong cash flows support working capital needs and capital investment
n Looking ahead to the third quarter of fiscal 2010 we expect:
} Revenues which increase sequentially due to seasonality but still reflect
slow customer activity and weather impacts
} Margins which improve but are pressured by poor weather during the
beginning of the quarter
} Earnings per share that improve sequentially and are near breakeven to a
slight profit
10
Appendix: Regulation G Disclosure
11
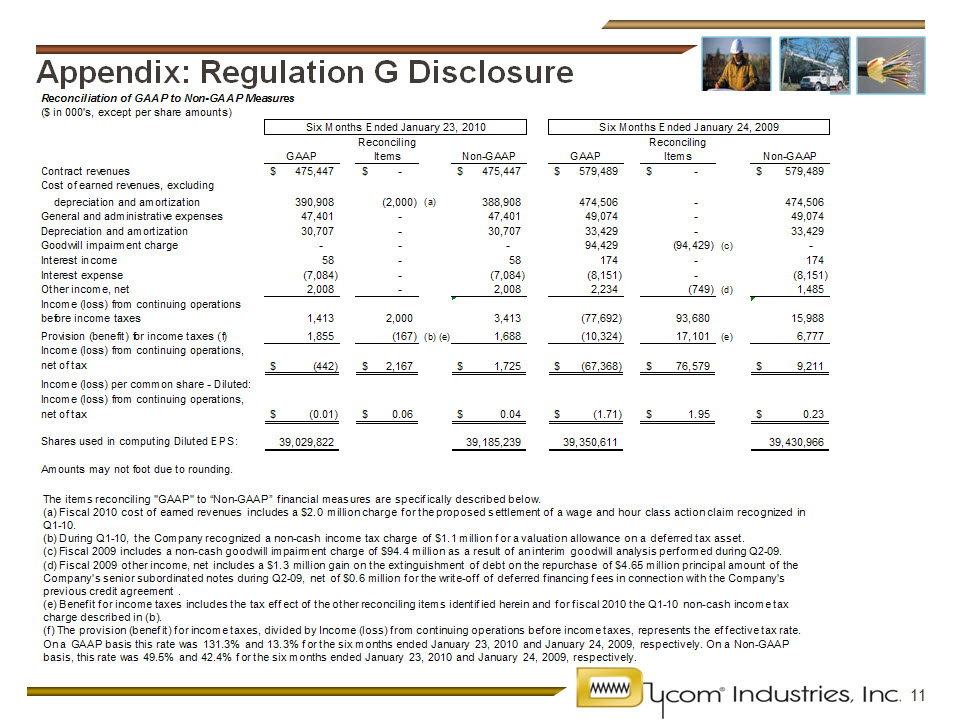
Appendix: Regulation G Disclosure
®
2nd Quarter Fiscal 2010
Results Presentation
February 24, 2010