 $90 million add-on to 7.125% Senior Subordinated Notes November 2012 Exhibit 99.1 |
 1 Cautionary Statement about Forward- Looking Statements & Confidential Information This presentation contains “forward-looking statements” which are statements relating to future events, including a proposed acquisition, future financial performance, strategies, expectations, and the competitive environment. All statements, other than statements of historical facts, contained in this presentation, including statements regarding the Company’s future financial position, future revenue, prospects, plans and objectives of management, are forward-looking statements. Additionally, forward – looking statements include statements of expectations regarding the proposed acquisition, including expected benefits and synergies of the transaction, future financial and operating results, future opportunities for the combined businesses and other statements regarding events or developments that the Company believes or anticipates will or may occur in the future as a result of the transaction. Words such as “believe,” “expect,” “anticipate,” “estimate,” “intend,” “forecast,” “may,” “should,” “could,” “project,” “looking ahead” and similar expressions, as well as statements in future tense, identify forward-looking statements. You should not read forward looking statements as a guarantee of future performance or results. They will not necessarily be accurate indications of whether or at what time such performance or results will be achieved. Forward-looking statements are based on information available at the time those statements are made and/or management’s good faith belief at that time with respect to future events, including the Company’s ability to consummate the proposed acquisition. Such statements are subject to risks and uncertainties that could cause actual performance or results to differ materially from those expressed in or suggested by the forward-looking statements. Important factors that could cause such differences include, but are not limited to factors described under Item 1A, “Risk Factors” of the Company’s Annual Report on Form 10-K for the year ended July 28, 2012, and other risks outlined in the Company’s periodic filings with the Securities and Exchange Commission (“SEC”). The forward-looking statements in this presentation are expressly qualified in their entirety by this cautionary statement. Except as required by law, the Company may not update forward-looking statements even though its situation may change in the future. This presentation includes certain "non-GAAP" financial measures as defined by SEC rules. |
 2 Transaction Overview Appendix Financial Summary Business Overview Target Overview Credit Strengths Agenda |
 3 Dycom Industries, Inc. (the “Company”) is a leading provider of specialty contracting services in the United States for telecommunications, underground facility locating and electric and gas utilities customers On November 19 , Dycom announced that it signed a definitive agreement to acquire substantially all of Quanta Services’ (the “Seller”) domestic telecommunications infrastructure services subsidiaries (collectively, the “Target”) for total consideration of $275 million plus related transaction adjustments Dycom intends to fund the acquisition with a combination of: Pro forma for the acquisition and financing, Dycom will have secured leverage of 1.1x and total leverage of 2.7x based on LTM Pro Forma 2012 Adjusted EBITDA of $179.5 million 1 Executive Summary 1 PF numbers reflect Dycom FY2012 (28-Jul-2012) and Target LTM 30-Sep-2012 results. PF amounts and calculations herein derived from PF financial information filed The transaction is expected to close, subject to customary closing conditions, in December $90 million add-on to the Company’s existing 7.125% Senior Subordinated Notes due in 2021 $201 million of borrowings under a new 5-year senior secured credit facility comprised of a $275 million Revolving Credit Facility, of which $76 million will be drawn at close of the acquisition, and a $125 million Term Loan A by Dycom on Form 8-K on 28-Nov-2012. th |
 4 Strengthens our customer base, geographic scope and technical service offerings Reinforces our rural engineering and construction capabilities, wireless construction resources and broadband construction competencies Creates scale as industry announcements indicate customer expenditures will be growing Experienced management team with solid industry reputation For the LTM period ended September 30, 2012, Target generated $535 million of sales Acquisition Rationale |
 5 Sources and Uses Pro Forma Capitalization Sources, Uses and PF Capitalization 1 2 Excludes $7.0 million in acquisition related costs and $6.9 million in debt issuance costs to be paid on or subsequent to the date of the acquisition. 3 PF amounts and calculations herein derived from PF financial information filed by Dycom on Form 8-K on 28-Nov-2012. 4 PF cash reflects $1.8 million in estimated debt premiums from the notes offered hereby. 5 Effective upon closing of the acquisition. Sources of Funds Uses of Funds $275mm Revolver $76.0 Purchase Price 1 $311.8 New Term Loan A 125.0 New Senior Sub. Notes 90.0 Cash on Balance Sheet 20.8 Total Sources $311.8 Total Uses 2 $311.8 Note: Adjusted EBITDA reflects Dycom results for the fiscal year ended 28-Jul-2012 and Target results for the LTM ended 30-Sep-2012. Does not reflect Dycom Adjusted EBITDA for the quarter ended 27-Oct-2012 of $40.405 million which compares to Dycom's prior year Adjusted EBITDA for the quarter ended 29-Oct-2011 of $40.397 million. 3 10/27/12 PF xPF Adj. ($ in millions) Amount xAdj. EBITDA Change Amount EBITDA Coupon Maturity Cash and Equivalents 4 $ 54.7 $(19.0) $ 35.7 New $275mm Revolver 5 0.0 0.0x 76.0 76.0 0.4x L+200 bps Dec-17 New Term Loan A 5 0.0 0.0x 125.0 125.0 1.1x L+200 bps Dec-17 Total Secured Debt $ 0.1 0.0x $ 201.1 1.1x Senior Subordinated Notes 187.5 1.4x 0.0 187.5 2.2x 7.125% Jan-21 New Add-On Senior Subordinated Notes 0.0 0.0x 90.0 90.0 2.7x 7.125% Jan-21 Total Debt $ 187.6 1.4x $ 478.6 2.7x LTM Adj. EBITDA $ 135.5 $ 179.5 Includes purchase price of $275 million and estimated amount for working capital adjustments and other payments to Seller based on balances as of September 30, 2012. |
 6 New Senior Subordinated Notes Issuer Dycom Investments, Inc., a direct wholly-owned subsidiary of Dycom Industries, Inc. (same as existing) Guarantors Dycom Industries, Inc. and its existing and future subsidiaries that guarantee any credit facility of Dycom Industries, Inc. Add-on Amount $90 million add-on to existing 7.125% notes due 2021 Ranking Senior Subordinated Notes (same as existing) Maturity January 15, 2021 Coupon 7.125% Indicative Price TBD Indicative Yield TBD Non-Call Period Non-Callable until January 2016 Equity Clawback Beginning in 2014, up to 35% of the Notes may be redeemed with the proceeds of an equity issuance at 107.125 Optional Redemption Callable at 103.563 in 2016, ratably declining to par thereafter Customary Make Whole Call during the Non-Call Period Mandatory Repayment Put option upon change of control at 101% of principal plus unpaid and accrued interest Covenants Standard and customary high yield incurrence covenants which mirror existing subordinated notes; limit Company’s ability to: — Incur additional indebtedness — Pay dividends — Make loans and investments — Sell assets and incur liens Summary Terms and Conditions |
 7 Transaction Overview Appendix Financial Summary Business Overview Target Overview Credit Strengths Agenda |
 8 Dycom Introduction A leading supplier of specialty contracting services to telecommunication providers nationwide Telecommunications networks are fundamental to economic progress Significant end market opportunities include wireless backhaul, rural fiber networks, fiber deployments to businesses, wireless network upgrades, and FTTx deployments Significant portion of revenues from multi-year Master Service Agreements Experienced management team operates through a decentralized, customer-focused organizational structure Strong cash flows and liquidity |
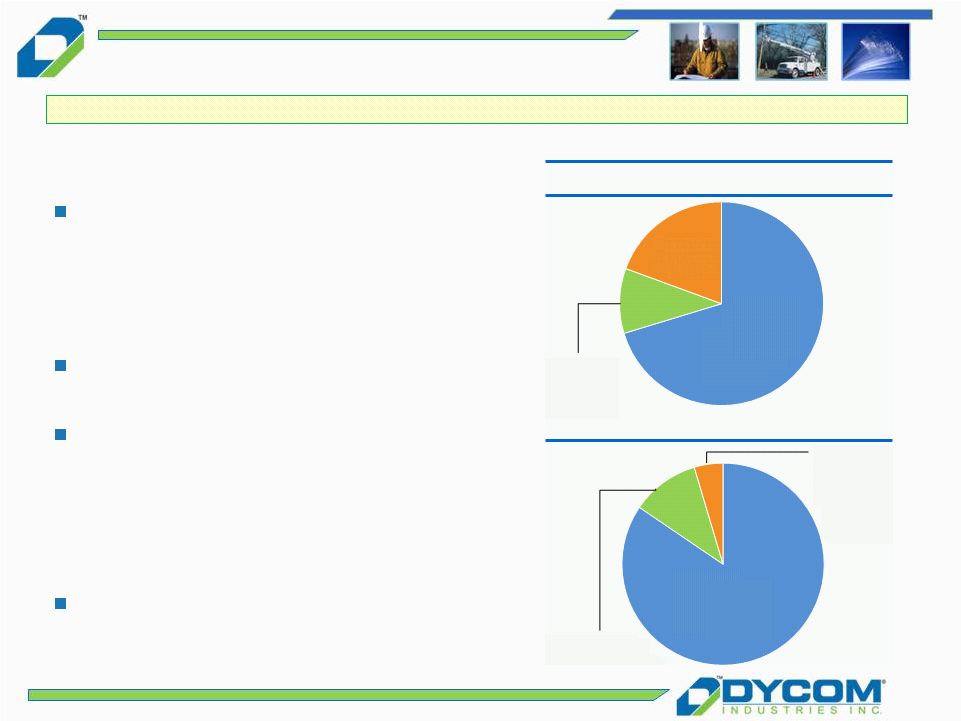 9 Nationwide footprint — Operates in 48 states and in Canada — 31 operating subsidiaries and hundreds of field offices Fiscal 2012 revenues of $1,201.1 million grew organically 15.4% year over year Strong financial profile — Cash and equivalents $54.7 million at October 27, 2012 — Shareholders’ equity $392.0 million at October 27, 2012 8,001 employees as of October 27, 2012 Dycom Overview (Standalone) Dycom is a leading telecommunications infrastructure provider in the United States Revenue by Contract Type Revenue by Customer Type Master Service Agreements 70.3% Long-term Contracts 10.3% Short-term Contracts 19.4% Fiscal 2012 Telecom 84.5% Electric and Gas Utilities and Other 4.6% Underground Facility 10.9% Locating |
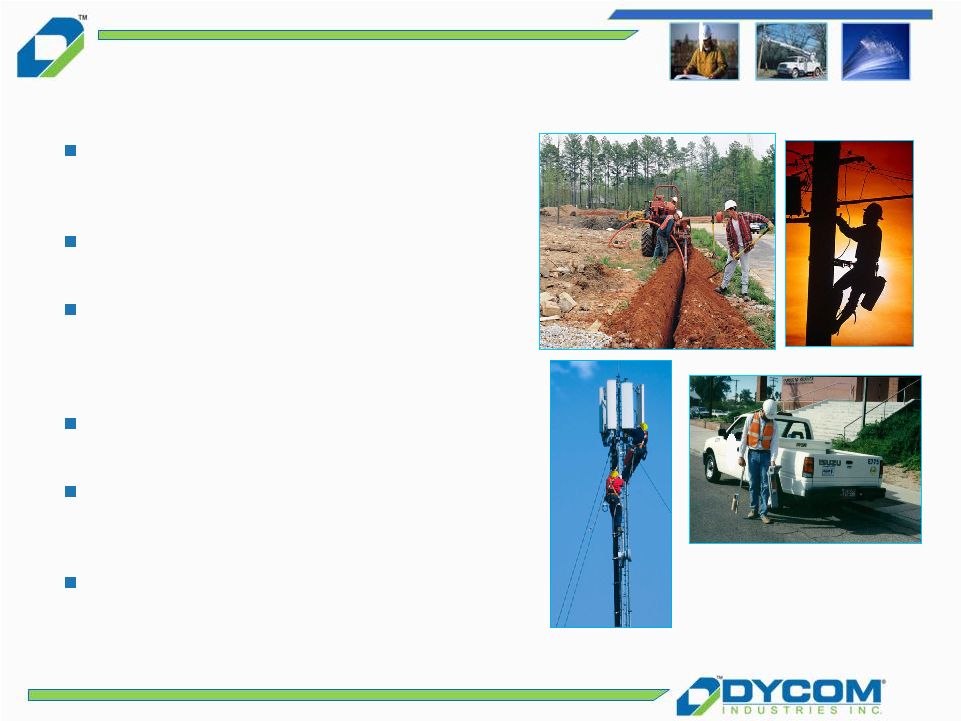
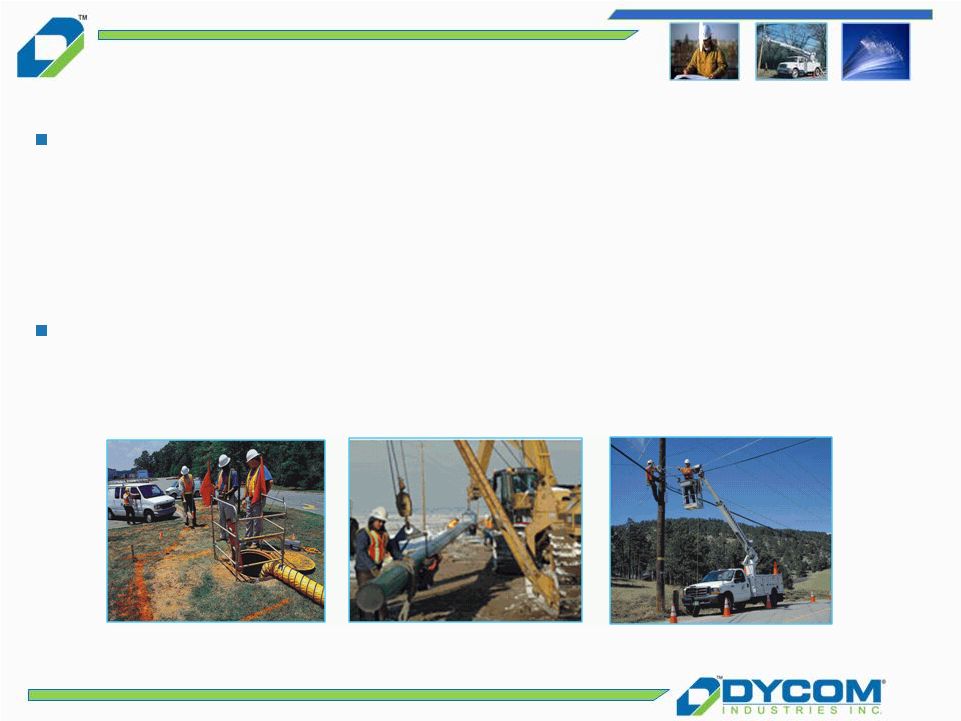
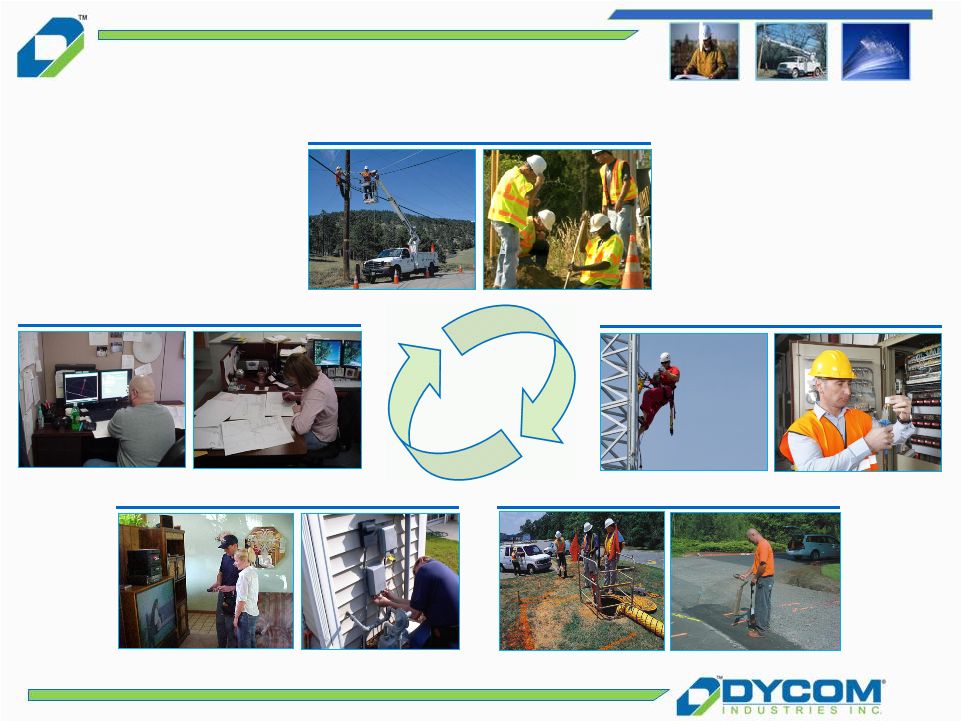 10 Services Crucial to Customer Success Engineering Underground Facility Locating Outside Plant & Equipment Installation Premise Equipment Installation Wireless Services |
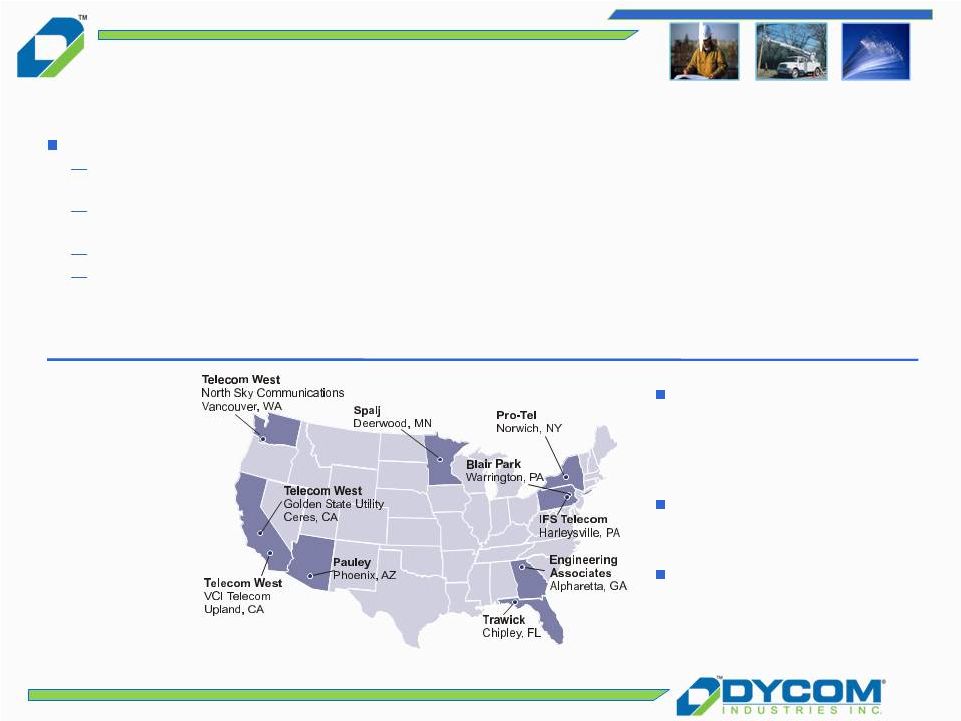
 Dycom Operating Overview Broad national footprint and strong local subsidiaries allow Dycom to go to market as both a national and local provider Dycom’s Nationwide Presence Subsidiaries Dycom has field locations well beyond the subsidiary headquarters depicted which enable the Company to extend its coverage footprint Dycom Headquarters Subsidiary Headquarters 11 |
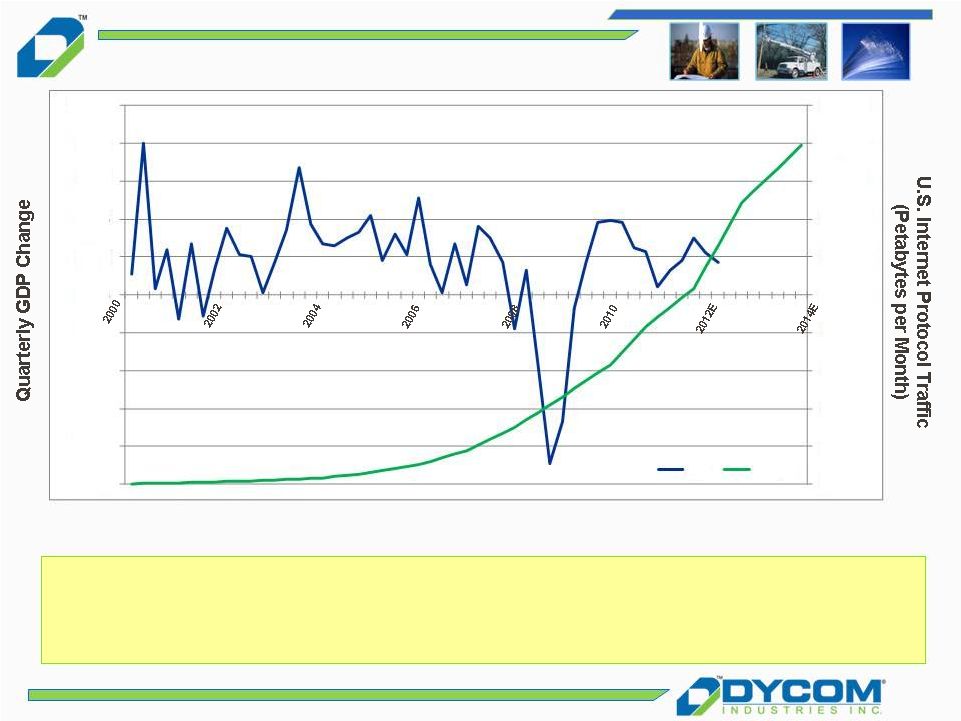 12 Sources: U.S. Telecom, The Broadband Association Cisco Visual Networking Index U.S. National Bureau of Economic Analysis “When the stability of an entire economy depends on the speed, intelligence, quality of service, robustness and security of its Internet backbone, will a just good network be good enough?” John Chambers, Chairman and CEO, Cisco, Inc. Strong Secular Trend 0 2,000 4,000 6,000 8,000 10,000 12,000 14,000 16,000 18,000 20,000 -10.0% -8.0% -6.0% -4.0% - 2.0% 0.0% 2.0% 4.0% 6.0% 8.0% 10.0% GDP Traffic |
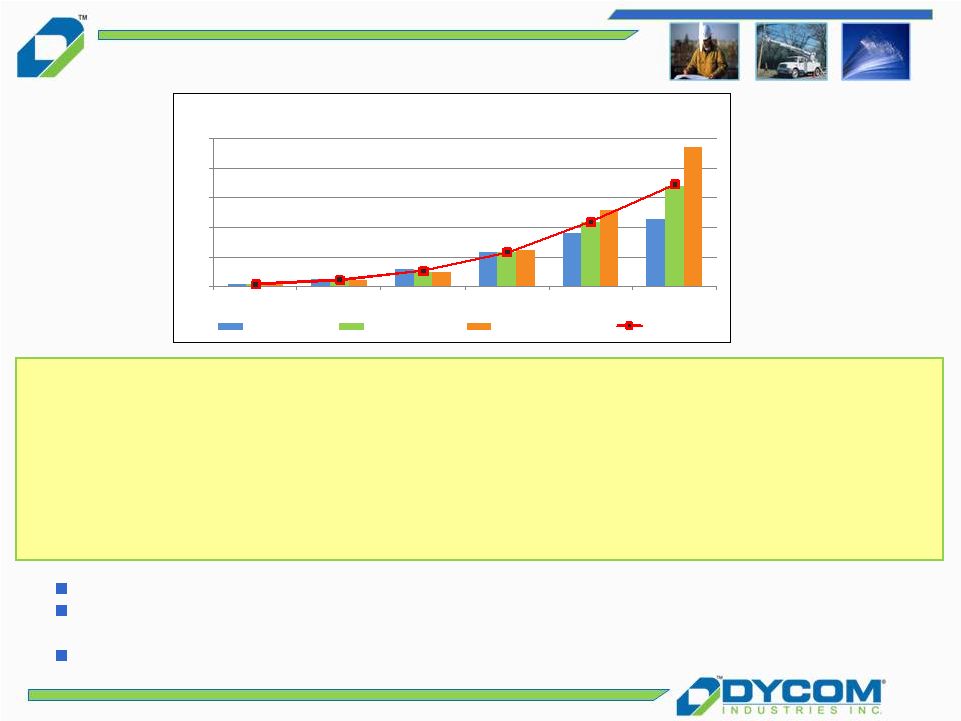 13 “Our third key strategic initiative is investing in fiber builds to as many towers in our service area as economically feasible. This initiative supports anticipated long-term growth in data transport, much of which is driven by wireless data traffic. And expands our addressable customer footprint by enabling fiber access points to other strategic locations where viable, along these routes. During second quarter, we completed approximately 1,350 fiber builds. This is in line with expectations. And we continue to anticipate completing 4,000 to 5,000 builds in 2012, as fiber-to-the-tower construction continues to ramp up through the remainder of the year.” Glen Post III, CEO & President, CenturyLink, Inc. - August 2012 Very attractive returns to our customers Telephone, cable and other companies aggressively deploying fiber to provide wireless backhaul services Continues to provide significant growth opportunities Sources: FCC OBI Technical Paper 6, Mobile Broadband: The Benefits of Additional Spectrum Key Driver: Wireless Backhaul 0X 10X 20X 30X 40X 50X 2009 2010 2011 2012E 2013E 2014E Mobile Data Traffic Growth Relative to 2009 Yankee Group Coda Research Cisco Systems, Inc. Average |
 14 The American Recovery and Reinvestment Act (ARRA) provided the Department of Commerce’s National Telecommunications and Information Administration (NTIA) and the U.S. Department of Agriculture’s Rural Utilities Service (RUS) with $7.2 billion to expand broadband services in the United States. Cumulatively, total Federal expenditures have now exceeded $2.1 billion and have been matched by recipient funds of more than $820 million. NTIA BTOP Quarterly Program Status Report – September 2012 Demand has absorbed significant industry capacity Meaningfully increased exposure to rural service providers Key Driver: Rural Fiber Networks |
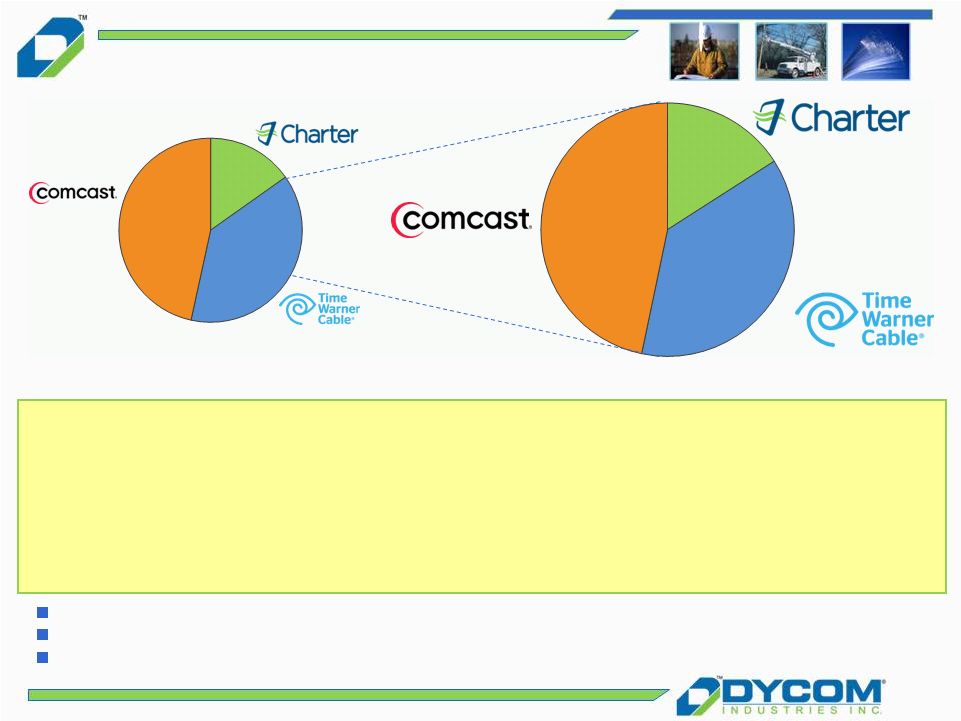 15 2011 Business Services Revenue $3.9 Billion Current Addressable Business Services Market ~$53.5 Billion Emerging as an industry battleground Multi-year cap-ex trajectory provides visible revenue opportunities Leverages Dycom’s existing cable engineering and construction resources “…so give or take $700 million a year I think is the number for capital spending for business services. [….] That $700 million is powering a business that grew 40% the last several years and is on pace to be a couple billion dollar plus business a year from zero and we can go into the medium-size and sell backhaul and Metro Ethernet businesses. So first answer is we would love to put more capital at the business services if we can continue to get 30% IRRs or whatever as we've been historically getting. It is a 50% margin business, fantastic.” Brian Roberts, Chairman and CEO, Comcast Corporation – June 2012 Sources: Company Filings, Company Transcripts Key Driver: Fiber to Business $25.0B $8.5B $20.0B $0.6B $1.5B $1.8B |
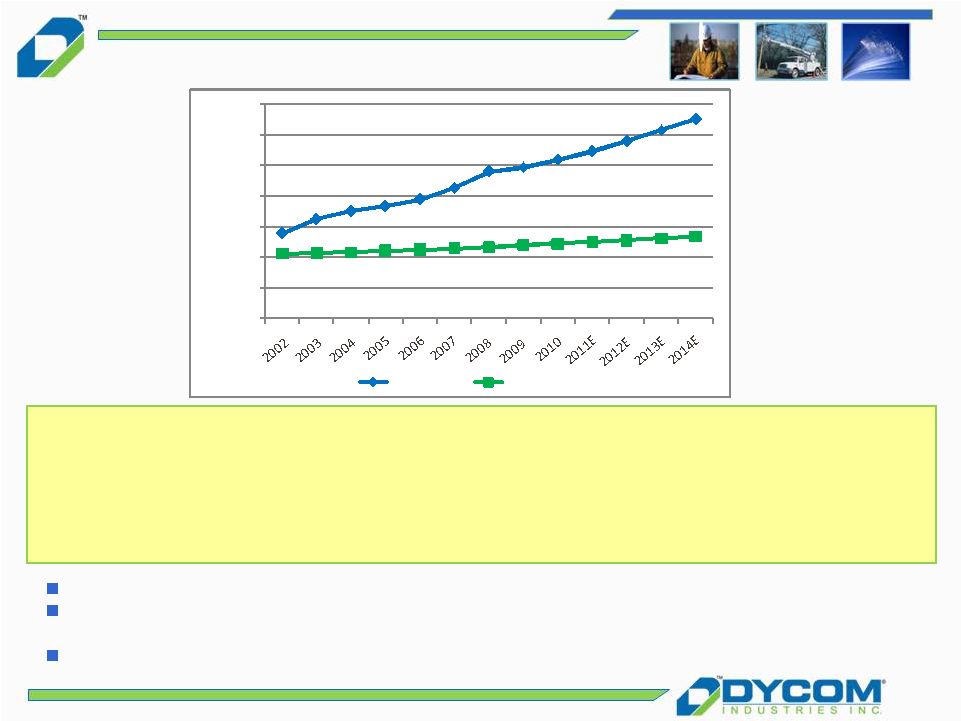 16 “…We've had a volume surge that is hard to explain what's transpired. The last five years we've had literally in the mobile Internet traffic going across our network it's been a 20,000 percent increase in traffic, and we're seeing no signs of that slowing anytime soon. In fact, we're on a pace this year that it grows another 75 percent, and our current planning assumption is that that just continues for the next five years after this year.” Randall Stephenson, CEO, AT&T – July 2012 Wireless network spending increasing faster than overall spending Entered wireless market via NeoCom acquisition in December 2010 and is further expanding its wireless services to key customers Strong growth opportunities as industry migrates from 3G to 4G technologies Sources: CTIA, Collins Stewart, LLC Key Driver: Wireless Network Upgrades - 50,000 100,000 150,000 200,000 250,000 300,000 350,000 US cell sites US Towers |
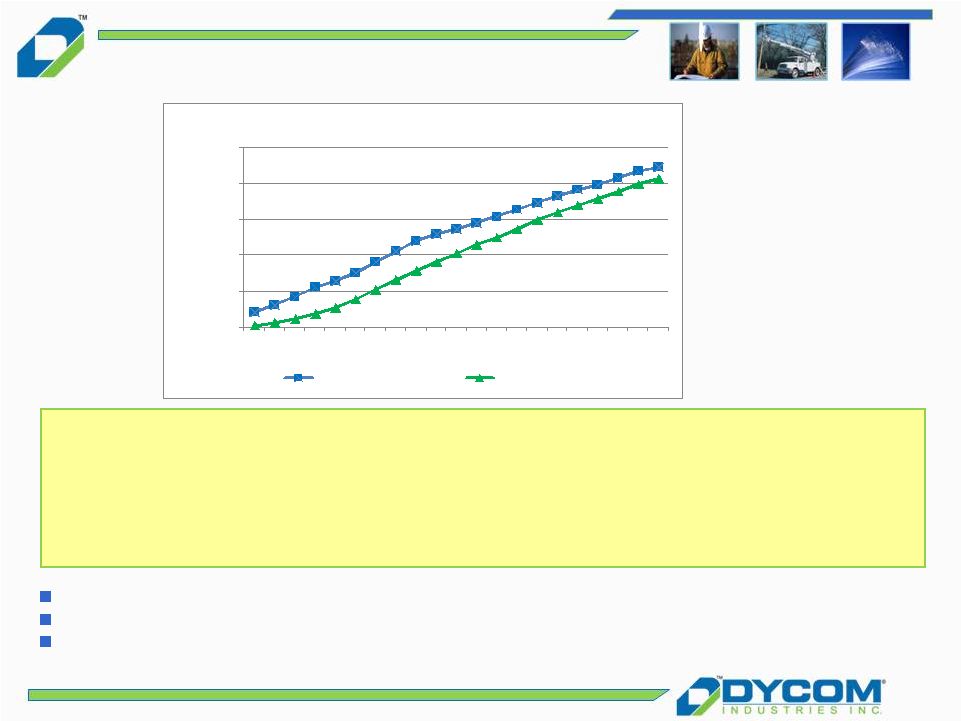 17 0 1,000,000 2,000,000 3,000,000 4,000,000 5,000,000 2Q 07 4Q 07 2Q 08 4Q 08 2Q 09 4Q 09 2Q 10 4Q 10 2Q 11 4Q 11 2Q 12 Cumulative Subscribers Verizon FiOS Video AT&T U-Verse "We feel good about the success we've had in the IP broadband and U-verse platform, and we believe that we can further grow the business with additional investments to maximize technology improvements and our improved operating scale. As Randall said, we plan to expand IP broadband to reach 57 million total customer locations or 75% of all customer locations in our 22-state serving area. We have a high level of confidence that we can execute this plan and achieve our growth targets by simply extending our current track record." John Stankey, Group President and Chief Strategy Officer, AT&T - November 2012 A key competitive response by telephone companies to cable MSO’s CenturyLink just beginning scale deployments Dycom is leveraging prior, extensive FTTx experience with Verizon and AT&T Source: Company Filings Key Driver: FTTx Deployments |
 18 Agenda Transaction Overview Appendix Financial Summary Business Overview Target Overview Credit Strengths |
 19 Target provides network services and solutions for the telecommunications and cable television industries, including: Geographic Footprint – Subsidiary Headquarters Source: Company Filings. Target Overview Target has complimentary geographies to Dycom that both enhance current footprint and expand presence in certain markets Target has a strong rural footprint that diversifies the combined business profile Target has field locations well beyond the subsidiary headquarters depicted Design, installation, repair and maintenance of fiber optic, copper and coaxial cable networks used for video, data and voice transmission Design, installation and upgrade of wireless communications networks, including towers, switching systems and "backhaul" links from wireless systems to voice, data and video networks Cable locating, splicing and testing of fiber optic networks and residential installation of fiber optic cabling Emergency restoration services, particularly for infrastructure damaged by inclement weather |
 20 Agenda Transaction Overview Appendix Financial Summary Business Overview Target Overview Credit Strengths |
 21 Long-standing relationship with blue chip customers Stable revenue base Breadth of service offering to meet customer requirements Variable and scalable operating structure Operating model focused on cash flow generation Proven and experienced management team Key Credit Highlights |
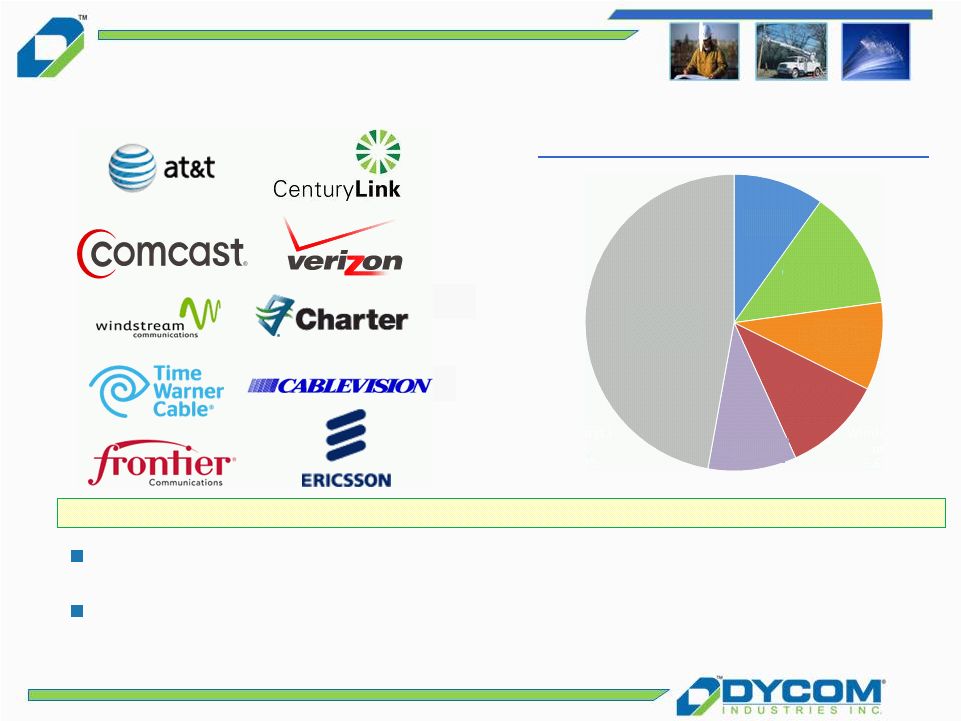 22 Dycom has established relationships with many leading telephone companies, cable television multiple system operators and electric utility companies Target further strengthens customer base by a combination of enhanced presence with existing customers and further diversity with new customers Blue Chip Customer Base Blue chip, predominantly investment grade, clients comprise the vast majority of revenue Dycom Pro Forma Customer Mix Note: PF numbers reflect Dycom FY2012 (28-Jul-2012) and Target LTM 30-Sep-2012 results. AT&T 9.9% Comcast 9.5% Verizon 10.8% Other 47.2% Windstream 9.6% CenturyLink 12.9% |
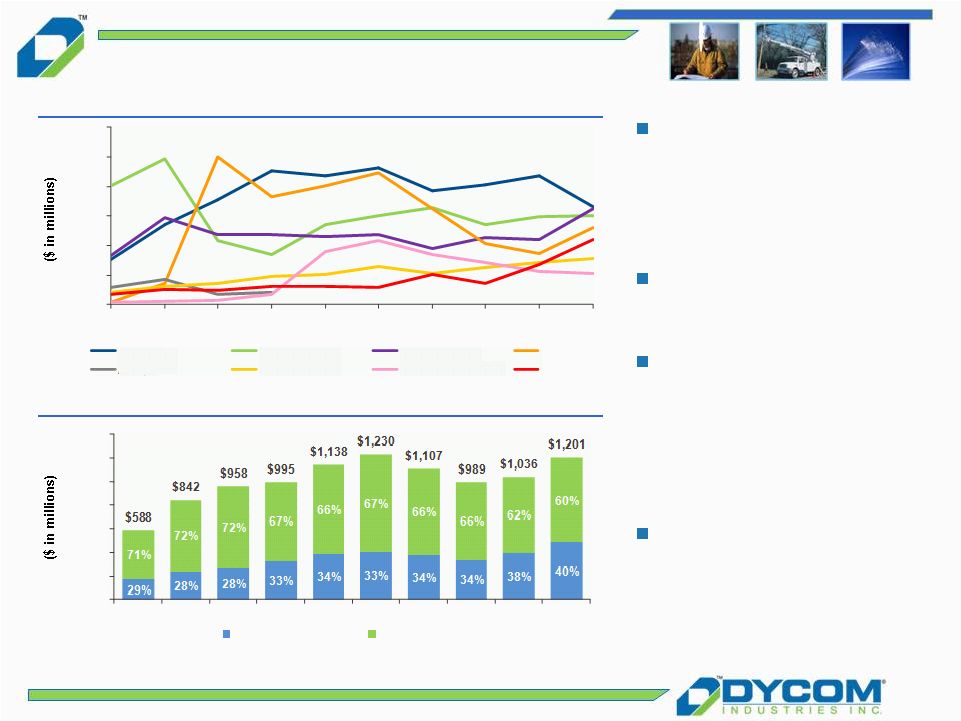 23 Durable Customer Relationships Developed and maintained strong, long-term relationships that help manage cyclical nature of telecom and cable capex spending Significant number of these customer relationships span decades The Company’s decentralized operations create multiple points of contact with customers, numerous individual relationships, and numerous contract opportunities per customer Pro forma, Top 5 customers account for 52.9% of revenue (a) vs. 59.6% of revenue for Dycom standalone in 2012 Revenue by Customer 1 Revenue (Top 5 Customers) 1 1 Numbers reflect Dycom standalone. (a) Pro forma numbers reflect combination of Dycom last twelve months ended October 27, 2012 and Target last twelve months ended September 30, 2012. $0 $50 $100 $150 $200 $250 $300 2003 2004 2005 2006 2007 2008 2009 2010 2011 2012 $0 $200 $400 $600 $800 $1,000 $1,200 $1,400 2003 2004 2005 2006 2007 2008 2009 2010 2011 2012 Other Customers Top 5 Customers AT&T Comcast CenturyLink Verizon Adelphia CharterComm Time Warner Cable Windstream |
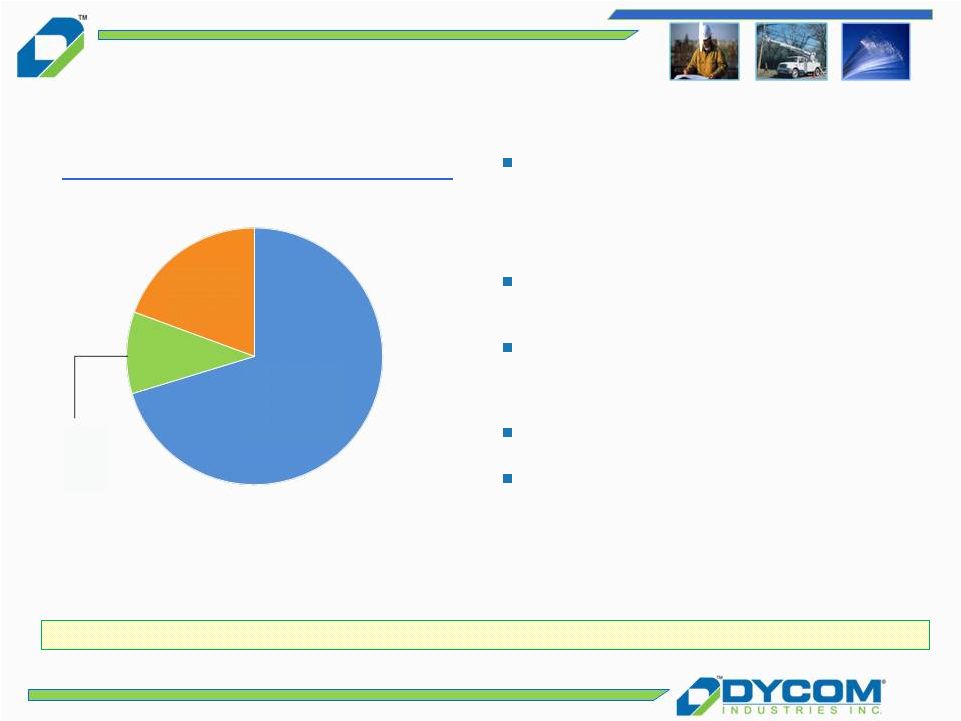 24 Stable Revenue Base Master Service Agreements (MSAs) Long-term contracts relate to specific projects with terms in excess of one year from the contract date Dycom is party to numerous MSAs and other arrangements with customers that extend for periods of one or more years and generally has multiple agreements with each customer Short-term contracts relate to spot market requirements Significant majority of contracts are based on units of delivery Dycom’s revenue stream is primarily generated by long-term contractual agreements Fiscal 2012 Revenue by Contract Type 1 1 Numbers reflect Dycom standalone. Master Service Agreements 70.3% Long -term Contracts 10.3% Short-term Contracts 19.4% — Multi-year, multi-million dollar arrangements covering thousands of individual work orders — Generally exclusive requirement contracts that extend for one or more years |
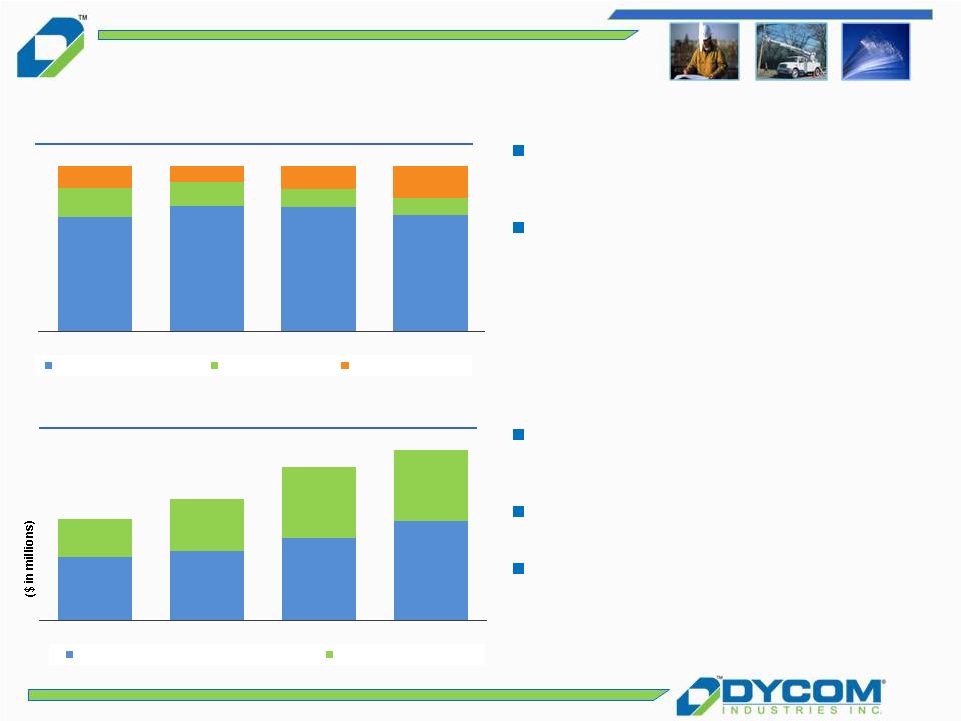 25 MSA and other long-term contracts represent 80% or greater of total contract revenues in recent periods Increase in short-term contracts in fiscal 2012 from broadband stimulus spending Stable Revenue Base Historical Revenue by Contract Type Historical Backlog 1 Numbers reflect Dycom standalone. 69.5% 76.0% 75.5% 70.3% 17.2% 14.6% 10.4% 10.3% 13.3% 9.4% 14.1% 19.4% 0.0% 20.0% 40.0% 60.0% 80.0% 100.0% FY2009 FY2010 FY2011 FY2012 Master Service Agreements Long-Term Contracts Short-Term Contracts Backlog comprised of the estimated uncompleted portion of services to be performed under job-specific contracts Significant backlog growth in recent 3 year period from new contract awards As of October 27, 2012, total backlog and backlog to be completed in next 12 months at $1.376 billion and $822 million, respectively $582 $640 $754 $909 $353 $474 $658 $656 $935 $1,114 $1,412 $1,565 $0 $400 $800 $1,200 $1,600 FY2009 FY2010 FY2011 FY2012 Backlog to be Completed in Next 12 Months Backlog > 12 Months 1 1 |
 26 Breadth of Service Offering Leading provider of services in a fragmented industry, with breadth and scope of operations to support national customer base — As a service provider operating on a national basis, Dycom benefits from its customers trending towards a consolidated vendor base with broad service capabilities — Strong balance sheet and scale enable the Company to compete for large contracts which further enhance the depth of Dycom’s customer relationships Despite its national scale, Dycom has decentralized operations that reflect the importance of relationships at the local and regional level |
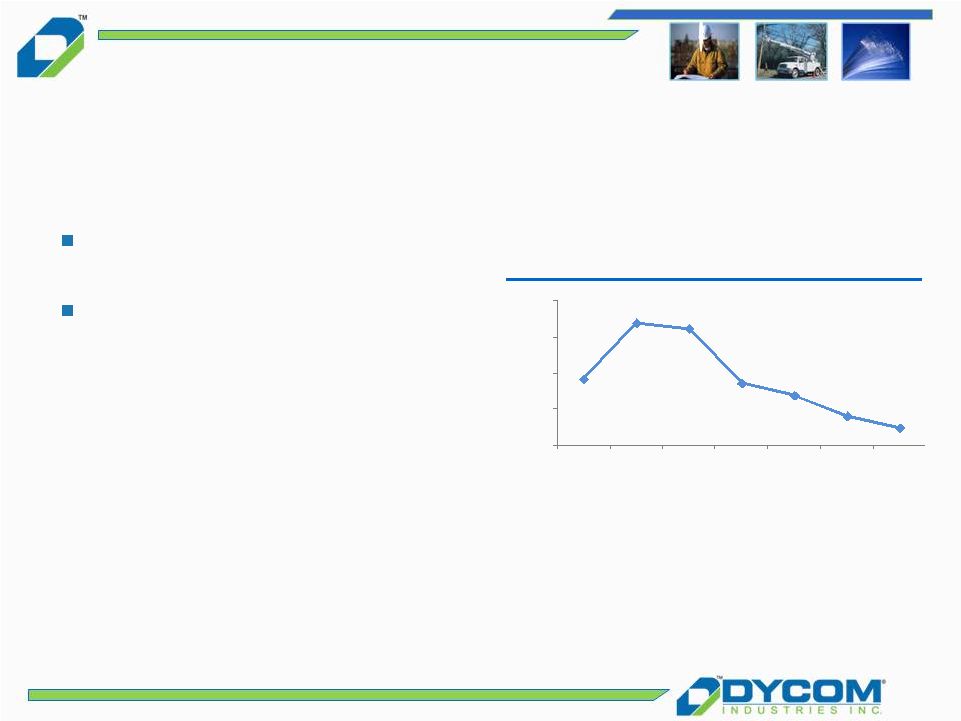 27 Variable and Scalable Operating Structure Scalable business model provides operating flexibility Highly variable cost structure allows for efficient responses to changes in the business environment as largest direct cost is labor — Cost of labor managed by flexing the size of the workforce and level of subcontractors — Significant amount of project-related inventory provided by customers Number of Employees 1 1 Numbers reflected for Dycom standalone. 9,352 10,899 10,746 9,231 8,897 8,320 8,001 7,500 8,500 9,500 10,500 11,500 2006 2007 2008 2009 2010 2011 2012 |
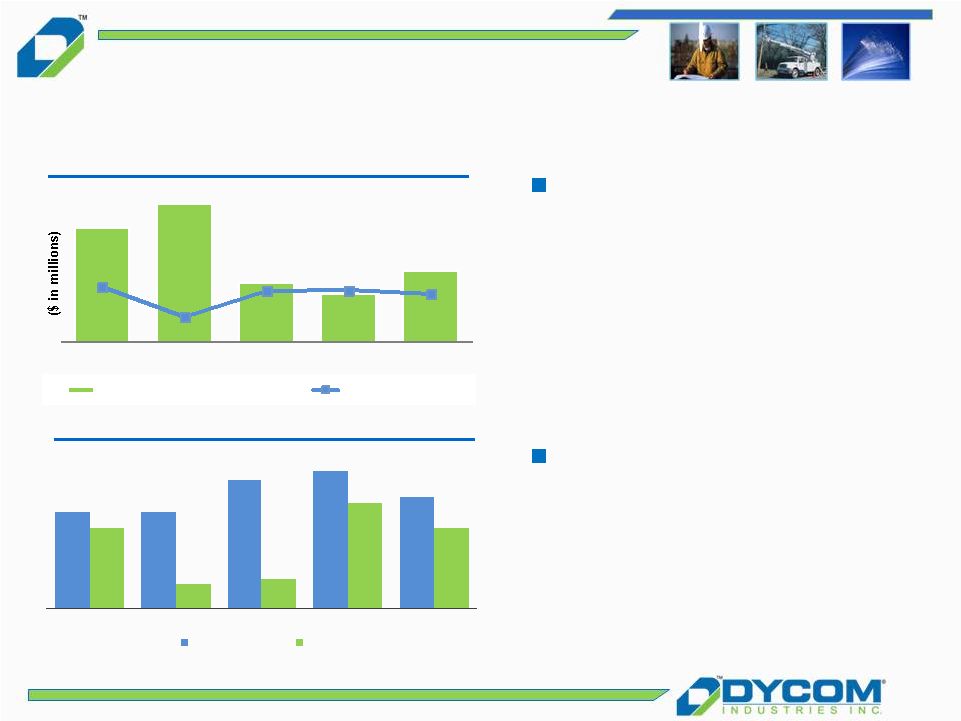 28 Operating Model Focused on Cash Flow Generation Solid cash flow from operations and prudent management of capital expenditures has provided strong liquidity position Note: Leverage and Net Leverage excludes L/C’s. 1 Numbers reflect Dycom standalone. Capital expenditures are net of proceeds from disposals of assets. Cash from Operations and Capex 1 Leverage 1 1.2x 1.2x 1.6x 1.7x 1.4x 1.0x 0.3x 0.4x 1.3x 1.0x 0.0x 0.5x 1.0x 1.5x 2.0x FY2008 FY2009 FY2010 FY2011 FY2012 Leverage Net Leverage Low historical and net leverage contribute to strong balance sheet and provide capacity for strategic expansion $104 $127 $54 $44 $65 5.1% 2.3% 4.7% 4.7% 4.4% 0.00% 2.00% 4.00% 6.00% 8.00% 10.00% 12.00% 14.00% 0 20 40 60 80 100 120 140 FY2008 FY2009 FY2010 FY2011 FY2012 Cash Flow from Operating Activities Capex % of Revenue |
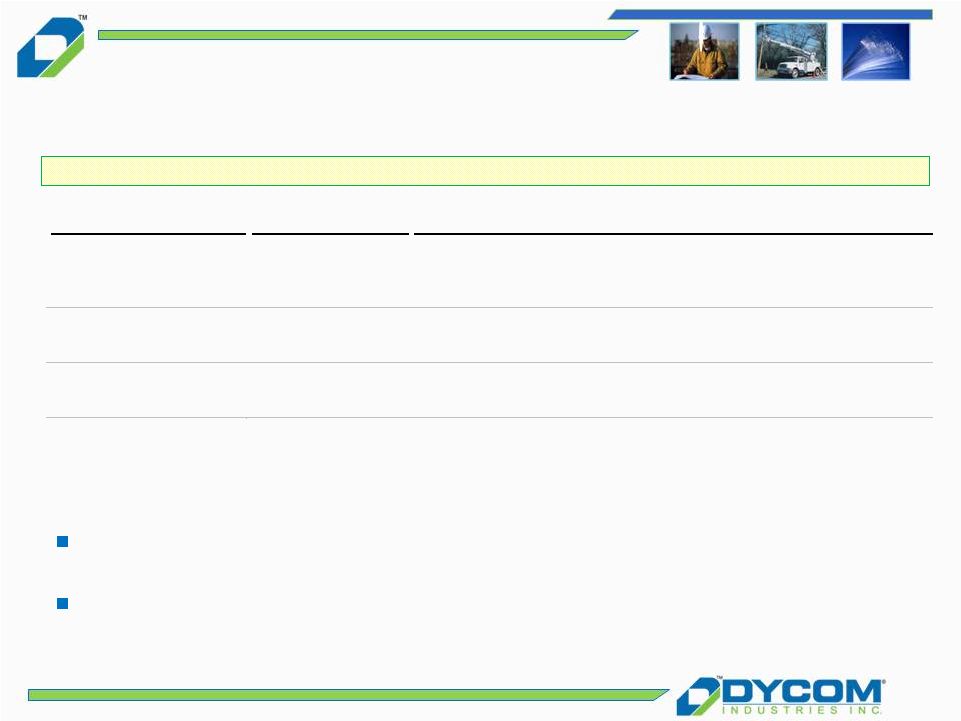 29 Proven and Experienced Senior Management Team Executive Industry Tenure Comment Steven E. Nielsen President & CEO 27 years 19 years with Dycom; prior experience with Henkels & McCoy Timothy R. Estes EVP & COO 39 years 18 years with Dycom; prior experience with BellSouth H. Andrew DeFerrari Sr. VP & CFO 8 years 8 years with Dycom; prior experience with Ernst & Young Richard B. Vilsoet General Counsel 7 years 7 Years with Dycom as external counsel; prior experience with Shearman & Sterling Seasoned management team with several decades of combined industry experience Dycom’s executive management team has successfully navigated multiple business cycles with the Company emerging stronger and poised for continued stability Subsidiary management has cultivated and maintained deep and sustained relationships with decision-makers and local service providers in their respective locales over time |
 30 Agenda Transaction Overview Appendix Financial Summary Business Overview Target Overview Credit Strengths |
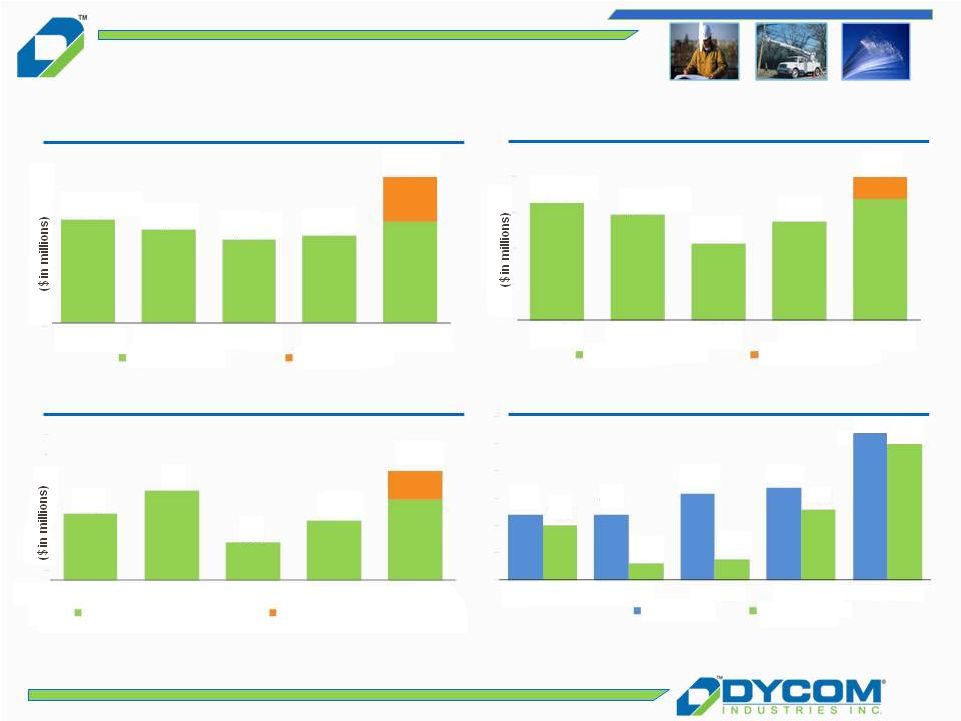 31 Historical and Pro Forma Financials Revenue Adjusted EBITDA Adjusted EBITDA less Capex 2 Leverage $131 $117 $86 $110 FY2008 FY2009 FY2010 FY2011 PF 2012¹ Dycom Adj. EBITDA Target Adj. EBITDA $179 $1,230 $1,107 $989 $1,036 FY2008 FY2009 FY2010 FY2011 PF 2012¹ Dycom Revenue Target Revenue $1,736 $69 $92 $39 $61 FY2008 FY2009 FY2010 FY2011 PF 2012¹ Dycom Adj. EBITDA - Capex Target Adj. EBITDA - Capex $113 1.2x 1.2x 1.6x 1.7x 2.7x 1.0x 0.3x 0.4x 1.3x 2.5x FY2008 FY2009 FY2010 FY2011 PF 2012¹ Leverage Net Leverage 1 2 PF numbers reflect Dycom FY2012 (28-Jul-2012) and Target LTM 30-Sep-2012 results. PF amounts and calculations herein derived from PF financial information filed by Dycom on Form 8-K on 28-Nov-2012. Pro forma 2012 capital expenditures net of proceeds from disposals of $24.8 million for Dycom FY2012 and $1.1 million for Target for LTM September 30, 2012. |
 32 Agenda Transaction Overview Appendix Financial Summary Business Overview Target Overview Credit Strengths |
 33 Adjusted EBITDA Reconciliation Pro Forma LTM 2 Fiscal Year Ended 2 ($ in millions) July 28, 2012 October 27, 2012 July 28, 2012 July 30, 2011 July 31, 2010 July 25, 2009 July 26, 2008 Net Income from continuing operations $40.2 $38.3 $39.4 $16.1 $5.8 $(53.2) $24.4 Interest expense, net 28.9 16.7 16.7 15.9 14.2 14.5 12.4 Income tax provision 25.7 23.9 25.2 12.4 4.9 (1.4) 13.2 Depreciation and amortization 86.5 62.0 62.7 62.5 63.6 65.4 67.2 EBITDA $181.3 $141.0 $144.0 $106.9 $88.5 $25.4 $117.3 Gain on sale of assets (15.7) (14.1) (15.4) (10.2) (7.7) (3.9) (6.7) Stock-Based Compensation 7.0 7.9 7.0 4.4 3.4 3.9 5.2 Charges for certain litigation matters - - - 0.6 1.6 - 7.6 Loss on extinguishment of debt, net - - - 8.3 - (3.0) - Acquisition related costs - 0.7 - 0.2 - - - Write-off of deferred financing costs - - - - - 0.6 - Goodwill impairment charges - - - - - 94.4 9.7 Reversal of pre-acquisition related accrual - - - - - - (1.7) Target Management Fees 3 6.9 - - - - - - Adjusted EBITDA $179.5 $135.5 $135.5 $110.2 $85.8 $117.2 $131.2 Total Debt $ 478.6 $ 187.6 $ 187.6 $ 187.8 $ 135.4 $ 136.3 $ 153.4 Net Debt $ 442.9 $ 132.8 $ 135.0 $ 143.0 $ 32.1 $ 31.6 $ 131.3 Total Debt / Adjusted EBITDA 2.7 x 1.4 x 1.4 x 1.7 x 1.6 x 1.2 x 1.2 x Net Debt / Adjusted EBITDA 2.5 x 1.0 x 1.0 x 1.3 x 0.4 x 0.3 x 1.0 x 1 1 PF numbers reflect Dycom FY2012 (28-Jul-2012) and Target LTM 30-Sep-2012 results. PF amounts and calculations herein derived from PF financial information filed by Dycom on 2 Numbers reflect Dycom standalone. 3 Target Management Fees adjusted herein represent other corporate charges of Target from the seller which would not have existed on a pro forma basis and will not continue upon the consummation of the Acquisition. Form 8-K on 28-Nov-2012. |