UNITED STATES SECURITIES AND EXCHANGE COMMISSION
Washington, D.C. 20549
FORM 10-K
| | þ | ANNUAL REPORT PURSUANT TO SECTION 13 OR 15(d) OF THE SECURITIES EXCHANGE ACT OF 1934 |
For the fiscal year ended June 30, 2012
OR
| | ¨ | TRANSITION REPORT PURSUANT TO SECTION 13 OR 15(d) OF THE SECURITIES EXCHANGE ACT OF 1934 |
For the transition period from to
Commission File Number 0-07491
MOLEX INCORPORATED
(Exact name of registrant as specified in its charter)
| | |
| Delaware | | 36-2369491 |
(State or other jurisdiction of incorporation or organization) | | (I.R.S. Employer Identification No.) |
2222 Wellington Court, Lisle, Illinois 60532
(Address of principal executive offices)
Registrant’s telephone number, including area code:
(630) 969-4550
SECURITIES REGISTERED PURSUANT TO SECTION 12(b) OF THE ACT
| | |
Title of each class | | Name of each exchange on which registered |
Common Stock, par value $0.05 Class A Common Stock, par value $0.05 | | The Nasdaq Stock Market, LLC The Nasdaq Stock Market, LLC |
SECURITIES REGISTERED PURSUANT TO SECTION 12(g) OF THE ACT: None
Indicate by check mark if the registrant is a well-known seasoned issuer, as defined in Rule 405 of the Securities Act. Yes þ No ¨
Indicate by check mark if the registrant is not required to file reports pursuant to Section 13 or Section 15(d) of the Act. Yes ¨ No þ
Indicate by check mark whether the registrant (1) has filed all reports required to be filed by Section 13 or 15 (d) of the Securities Exchange Act of 1934 during the preceding 12 months (or for such shorter period that the registrant was required to file such reports), and (2) has been subject to such filing requirements for the past 90 days. Yes þ No ¨
Indicate by check mark whether the registrant has submitted electronically and posted on its corporate web site, if any, every Interactive Data File required to be submitted and posted pursuant to Rule 405 of Regulation S-T (§ 232.405 of this chapter) during the preceding 12 months (or for such shorter period that the registrant was required to submit and post such files). Yes þ No ¨
Indicate by check mark if disclosure of delinquent filers pursuant to Item 405 of Regulation S-K (Section 229.405 of this chapter) is not contained herein, and will not be contained, to the best of registrant’s knowledge, in definitive proxy or information statements incorporated by reference in Part III of this Form 10-K or any amendment to this Form 10-K. þ
Indicate by check mark whether the registrant is a large accelerated filer, an accelerated filer, a non-accelerated filer, or a smaller reporting company. See definitions of “large accelerated filer,” “accelerated filer” and “smaller reporting company” in Rule 12b-2 of the Exchange Act.
| | | | | | |
| Large accelerated filer þ | | Accelerated filer ¨ | | Non-accelerated filer ¨ | | Smaller reporting company ¨ |
| | | | (Do not check if a smaller reporting company) | | |
Indicate by check mark whether the registrant is a shell company (as defined in Rule 12b-2 of the Act). Yes ¨ No þ
The aggregate market value of the voting and non-voting shares held by non-affiliates as of the last business day of the registrant’s most recently completed second fiscal quarter was approximately $2.6 billion (based on the closing price of these shares on the NASDAQ Global Select Market on December 31, 2011).
On July 25, 2012, the following numbers of shares of the Company’s common stock were outstanding:
| | | | |
Common Stock | | | 95,560,076 | |
Class A Common Stock | | | 80,873,472 | |
Class B Common Stock | | | 94,255 | |
DOCUMENTS INCORPORATED BY REFERENCE
Portions of the Proxy Statement for the Annual Meeting of Stockholders, to be held on October 26, 2012, are incorporated by reference into Part III of this annual report on Form 10-K.
TABLE OF CONTENTS
Molex Web Site
We make available through our web site at www.molex.com our annual report on Form 10-K, quarterly reports on Form 10-Q, current reports on Form 8-K and all amendments to those reports as soon as reasonably practicable after such material is electronically filed with the Securities and Exchange Commission (SEC).
Information relating to corporate governance at Molex, including our Code of Business Conduct and Ethics, information concerning executive officers, directors and Board committees (including committee charters), and transactions in Molex securities by directors and officers, is available on or through our web site at www.molex.com under the “Investors” caption.
We are not including the information on our web site as a part of, or incorporating it by reference into, this annual report on Form 10-K.
2
PART I
Molex Incorporated (together with its subsidiaries, except where the context otherwise requires, “we,” “us” and “our”) was incorporated in the state of Delaware in 1972 and originated from an enterprise established in 1938.
We are one of the world’s largest manufacturers of electronic connectors in terms of net revenue. Our net revenue was $3.5 billion for fiscal 2012. We operated 40 manufacturing locations in 16 countries, and employed 34,226 people in 42 countries as of June 30, 2012.
Our core business is the manufacture and sale of electronic components. Our products are used by a large number of leading original equipment manufacturers (OEMs) throughout the world. We design, manufacture and sell more than 100,000 products, including terminals, connectors, planar cables, cable assemblies, interconnection systems, backplanes, integrated products and mechanical and electronic switches.
The Connector Industry
The global connector industry is competitive and estimated to represent approximately $48 billion in net revenue for calendar year 2011. The industry has grown at a compounded annual rate of 5.4% over the past 20 years.
The connector industry is characterized by rapid advances in technology and new product development. These advances have been substantially driven by the increased functionality of applications in which our products are used. There is a constant demand for new product solutions and innovations in the technology industry. Our product life cycles tend to mirror the life span of our customers’ products although many of our products are designed into subsequent applications. Consumer and mobile products have relatively short product life cycles while automotive and industrial products are typically longer.
Industry trends that we deem particularly relevant include:
| | • | | Globalization. Synergistic opportunities exist for the industry to design, manufacture and sell electronic products in different countries around the world in an efficient and seamless process. For example, our customers’ products may be designed in Japan, manufactured in China and sold in multiple geographies. |
| | • | | Convergence of products. Traditionally separate products developed for consumer electronics, infotech and telecommunications markets are converging, resulting in electronic devices offering broad-based functionality. |
| | • | | Increasing electronics content. Consumer demand for advanced product features, convenience and connectivity is increasing electronic content in end devices. For example, electronic content in automobiles is increasing due to proliferation in infotainment, telematics and safety systems. |
| | • | | Increasing storage and bandwidth requirements. The global demand and use of streaming information such as audio and video require electronic components to have increased storage capacity and high-speed retrieval capabilities. Increasing internet traffic is taxing existing network infrastructure, resulting in equipment upgrades and capacity additions. |
| | • | | Product size reduction. High-density, micro-miniature technologies originally developed for consumer product applications are expanding to markets such as infotech and telecommunications, leading to smaller devices and greater mobility. |
| | • | | Consolidating supply base. Generally, global OEMs are consolidating their supply chain by selecting global companies possessing broad product lines for the majority of their connector requirements. |
3
| | • | | Price erosion. Due to rapidly evolving innovation in the technology industry, our customers’ experience pressure to reduce their prices to meet customer expectations. As a result, component suppliers are generally expected to lower prices. |
| | • | | Competitive market. There are a large number of competitors in the connector industry increasing the level of competition worldwide. We believe that the 10 largest connector suppliers, as measured by net revenue, represent approximately 54% of the worldwide market and exhibit a faster growth rate than their smaller competitors. |
| | • | | Rising input costs. Input costs, including commodity prices and employee costs in developing countries continue to increase and affect gross margin. |
Markets and Products
The approximate percentage of our net revenue by market for fiscal 2012 is summarized below:
| | | | |
| Markets | | Percentage of Fiscal 2012 Net Revenue | | Primary End Use Products Supported by Molex |
Telecommunications | | 23% | | Mobile phones, networking equipment, switches and transmission equipment |
Infotech | | 26% | | Desktop, tablet and notebook computers, peripheral equipment, servers and storage |
Consumer | | 18% | | Digital electronics, cameras, televisions, gaming systems, acoustics and major appliances |
Industrial | | 13% | | Factory automation, food and beverage equipment, alternative energy and electrical lighting and cables |
Automotive | | 17% | | Powertrain, body electronics, safety electronics, sensors, infotainment, telematics and lighting |
Other (includes Medical, Military and Aerospace) | | 3% | | Electronic and electrical devices for a variety of products |
Telecommunications. In the telecommunications market, we believe our key strengths include high-speed optical signal product lines, backplane connector systems and power distribution products. For mobile phones, we provide micro-miniature connectors, SIM and SD card sockets, keypads, electromechanical subassemblies and internal antennas.
We released several new products for the telecommunications market in fiscal 2012 including:
| | • | | NeoScale™ High-Speed Mezzanine System delivers the market’s cleanest signal integrity at 28+ Gbps and features a high-speed triad wafer design with Solder-Charge Technology™ for customized printed circuit boards routing in high-density system applications; |
| | • | | SC, SC/APC and Duplex Connectors, Adapters and Cable Assemblies were developed to meet the challenges of the infotech and telecommunications’ industries, including compatibility with many standard cable sizes and fiber types, adhering to industry mechanical and environmental standards; |
| | • | | DDR3 DIMM Sockets, DDR3 DIMM Memory Module Sockets increase data bandwidth and performance for demanding memory applications in desktop, personal and notebook computers, and servers; and |
4
| | • | | Milli-Grid™ is based on a 2.00mm by 2.00mm (.079” by .079”) grid pattern offering complete design flexibility for wire-to-board, board-to-board and cable-to-board connections in personal computers, entertainment, telecommunications and other electronic industries. |
Infotech. In the infotech market, our key strengths include our high-speed signal product line, storage input/output (I/O) products, standards committee leadership, global coordination and strong relationships with OEMs and contract manufacturers.
We manufacture power, optical and signal connectors and cables for fast end-to-end data transfer, linking disk drives, controllers, servers, switches and storage enclosures. For example, our family of small form-factor pluggable products offers end-users both fiber optic and copper connectivity and more efficient storage area network management. Our ongoing involvement in industry committees contributes to the development of new standards for the connectors and cables that transport data.
We hold a strong position in the infotech market with respect to the connectors used in servers, the segment of this market that accounts for the largest volume of our connector purchases. We offer a large variety of products for power distribution, signal integrity, processor and memory applications. We are also a leading designer in the industry for storage devices.
We participate in the tablet market with a wide range of customers, largely using wire-to-board, board-to-board and flexible printed circuit connectors developed for mobile phones and smartphones.
We released several new products for the infotech market in fiscal 2012 including:
| | • | | ZXP® zSFP+™ Interconnect System is the first complete ZXP® zSFP+™ Interconnect System for 25 Gbps serial channels, delivering signal integrity with electromagnetic interference protection for next-generation ethernet and Fibre Channel applications; |
| | • | | VersaBeam™ POD Cable Assemblies mates to Avago parallel optical modules, optimizing airflow and cable management for next generation applications in emerging high-speed data and computer markets and meets Telcordia GR-1435 specifications; |
| | • | | Impact™ 100 Ohm Orthogonal (Direct) Backplane Connector System improves system airflow and reduces performance constraints by eliminating backplane and midplane connections with our Impact™ Orthogonal Direct connector system, ideal for next-generation data and telecommunication equipment with rates up to 25 Gbps; and |
| | • | | Premo-Flex™ FFC and Etched Polyimide Jumpers, Premo-Flex™ FFC and etched polyimide jumpers, available in a variety of pitches, cable lengths and thicknesses and high-temperature ratings up to +105°C deliver durable, ultra flexible, competitively priced solutions for PCB connections in virtually any industry. |
Consumer. In the consumer market, we believe our key strengths include micro-miniature connector engineering and manufacturing capabilities, breadth of our high wattage product line and cable and wire application equipment.
We design and manufacture many of the world’s smallest connectors for home and portable audio, digital still and video cameras, DVD players and recorders, as well as devices that combine multiple functions. Our micro-miniature products support customer needs for increased power, speed and functionality, but with decreased weight and space requirements. We provide industry leadership with advanced interconnection products that help enhance the performance of video and still cameras, DVD players, portable music players, PDAs and hybrid devices that combine multiple capabilities into a single unit.
We are a leading connector source and preferred supplier to computer game makers. In addition, we provide components for gaming machines.
5
We released several new products for the consumer market in fiscal 2012 including:
| | • | | MobliquA™ antenna technology supports small-volume antenna designs without compromising efficiency and provides standard or custom solutions for an unlimited range of wireless applications and includes with superior bandwidth enhancing capability; |
| | • | | FFC-FPC (SMT), our microminiature SMT FFC/FPC connectors include features to meet a wide variety of space and application-specific needs; |
| | • | | micro-SIM Card Sockets, operate in push-push and push-pull styles that offer excellent electrical reliability and maximum space savings; and |
| | • | | SlimStack™ 0.40mm Pitch Board-to-Board Connectors, are low profile, ultra-narrow-width connectors manufactured in various stack heights for space savings and design flexibility, ideal for tight packaging applications such as mobile phones. |
Industrial. In the industrial market, we believe our key strengths include our industrial communications and networking technology, breadth of our power and signal product lines, distribution partnerships and global presence.
Our extensive industrial product line includes network interface cards, software for industrial networks and custom or industry standard cord sets. We offer a complete line of Woodhead® electrical solutions designed to support optimal worker safety and performance for today’s harsh duty environments. Our industry-leading solutions support the needs of industries such as factory automation, commercial construction, utility, petrochemical and food and beverage. In addition, we offer I/O connectors deployed in a variety of industrial production equipment on the factory floor, including:
| | • | | automated assembly equipment; |
| | • | | conveyors and material handling equipment; |
| | • | | packaging equipment; and |
We released several new products for the industrial market in fiscal 2012 including:
| | • | | Brad® Ultra-Lock® (M12) EX Connection System for Zone 2 Hazardous Locations achieve non-arcing connections in a one-step installation process with the Brad® Ultra-Lock® (M12) EX Connection System, designed for industrial automation use in Class I, Division 2 and Zone 2 hazardous areas; |
| | • | | Brad® Micro-Change® (M12) Connectors, Rugged Micro-Change® connectors and receptacles provide a high-pin-density M12 solution and can be used in harsh commercial and industrial environments; and |
| | • | | SolarSpec™ Junction Box and Cable Assemblies, Innovative SolarSpec™ products deliver solutions to the solar market and provide value to module manufacturers, installers and distributors. |
Automotive. In the automotive market, we believe our strengths include our wide range of products and extensive research and development capabilities that include rapid prototyping and high volume production support. Our automotive products are designed for every system in today’s connected vehicle: infotainment and navigation, powertrain, safety and chassis and body electronics. In addition to advanced electronics, we provide standard product offerings such as HSAutoLinkTM, MX150TM, STAC64TM, CMC, MX123TM and Squib.
We released several new products for the automotive market in fiscal 2012 including:
| | • | | Mini50™ Unsealed Connection Systems achieve space savings over traditional USCAR 0.64mm connectors with smaller terminals to fit more low-current electrical circuits in interior, unsealed, transportation-vehicle environments; |
6
| | • | | Mizu-P25™ Miniature Waterproof Connectors provides superior levels of dustproof and waterproof protection along with space savings; |
| | • | | Automotive Sensor Interconnects reduce the package size in automotive sensor applications which allow automakers to achieve greater competitive advantage; and |
| | • | | S8 Automotive Bulb Sockets simplify assembly and include a patented individual wire seal design that provides easy attachment during the crimping process. |
Other. Medical electronics is a growing market for our connectors, switch and assembly products. We provide both connectors and custom integrated systems for diagnostic and therapeutic equipment used in hospitals, including x-ray, magnetic resonance imaging and dialysis machines. Military electronics is also one of our focus markets. There is a range of electronic applications for our products in the commercial-off-the-shelf segment of this market. Products originally developed for the infotech, telecommunications and automotive markets are used in an increasing number of military applications. We are also expanding into non-connector markets, such as Solid State Lighting. Our Solid State Lighting business focuses on producing solutions that accelerate the adoption of LED lighting in general illumination, including LED holders and packaged LED/electronics products.
We released several new products for these other markets in fiscal 2012 including:
| | • | | MediSpec™ Hybrid Circular MT Cable Assemblies and Receptacles provide high-performance, mixed optical and electrical signaling to streamline the amount of connectors required in medical systems; |
| | • | | Tight-Jacketed Cable LC and SC Connectors reduce optical micro bends and fiber breakage and are designed for synchronized plug-and-cable movement in tight, outer-jacket cable commonly deployed in rugged military and industrial applications; and |
| | • | | LED Array Holder for Sharp Zenigata (COB) Arrays simplify the installation process for small-fixture applications and reduce installation time with compression contacts that eliminate hand soldering. |
Business Objectives and Strategies
One of our business objectives is to develop or improve our leadership position in each of our primary markets by increasing our overall position as a preferred supplier and improving our competitiveness on a global scale.
We believe that our success in achieving net revenue growth exceeding the connector market growth rate throughout our history is the result of the following key strengths:
| | • | | broad and deep technological knowledge of microelectronic devices and techniques, power sources, coatings and materials; |
| | • | | strong intellectual property portfolio that underlies many key products; |
| | • | | high product quality standards, backed with stringent systems designed to ensure consistent performance, that meet or surpass customers’ expectations; |
| | • | | strong technical collaboration with customers; |
| | • | | extensive experience with advanced development, engineering, and new product development processes; |
| | • | | broad geographical presence in developed and developing markets; |
| | • | | continuous effort to develop an efficient, low-cost manufacturing footprint; and |
| | • | | a broad range of products both for specific and standard applications. |
7
We serve our customers by continuing to focus on the following strategies:
| | • | | Concentrate on core markets. We focus on markets where we have the expertise, qualifications and leadership position to sustain a competitive advantage. We have been an established supplier of interconnect solutions for 73 years. We are a principal supplier of connector components to the telecommunications, infotech, consumer, industrial and automotive electronics markets. |
| | • | | Grow through the development and release of new products. We invest strategically in the tools and resources to develop and market new products and to expand existing product lines through innovation. New products are essential to enable our customers to advance their solutions and their market leadership positions. |
| | • | | Strategic investments in selected adjacencies. We continuously review and prioritize opportunities for adjacent markets for our technologies. A subset of these are becoming priorities for us and are pursued to expand our available market. |
| | • | | Optimize manufacturing and supply chain. We analyze the design and manufacturing patterns of our customers along with our own supply chain economics to help ensure that our manufacturing operations are of sufficient scale and are located strategically to minimize production costs and maximize customer service. |
| | • | | Leverage financial strength. We use our expected cash flow from operations and strong balance sheet to invest aggressively in new product development, to pursue synergistic acquisitions, to align manufacturing capacity with customer requirements and to pursue productivity improvements. We invested approximately 6.5% and 5.2% of fiscal 2012 net revenue in capital expenditures and research and development activities, respectively. |
Our global organizational structure consists of three product-focused divisions and one worldwide sales and marketing organization. The structure enables us to work effectively as a global team to meet customer needs as well as leverage our design expertise and our low-cost production centers around the world. The worldwide sales and marketing organization structure enhances our ability to sell any product, to any customer, anywhere in the world.
Competition
We compete with many companies in each of our product categories and global industries. These competitors include Amphenol Corporation, Delphi Automotive PLC, Hirose Electronic Co., Ltd, Hon Hai Precision Industry Co., Ltd., Japan Aviation Electronics Industry, Ltd., Japan Solderless Terminal Ltd. and TE Connectivity Ltd. We also compete with a significant number of smaller competitors who compete in specific geographies and industries. The identity and significance of competitors may change over time. We believe that the 10 largest connector suppliers, as measured by net revenue, represent approximately 54% of the worldwide market. Many of these companies offer products in some, but not all, of the markets and regions we serve.
Our products compete to varying degrees on the basis of quality, price, availability, performance and brand recognition. We also compete on the basis of customer service. Our ability to compete also depends on continually providing innovative new product solutions and worldwide support for our customers.
Customers and Sales Channels
We sell products directly to OEMs, contract manufacturers and distributors. Our customer base includes global companies and no single customer accounted for more than 10% of our net revenue in fiscal 2012, 2011 or 2010.
Many of our customers operate in more than one geographic region of the world and we have developed a global footprint to service these customers. We are engaged in significant operations in foreign countries. Our net revenue originating outside the United States was approximately 74% in fiscal 2012.
8
In fiscal 2012, the approximate share of net revenue by geographic region follows:
| | • | | 60% of net revenue originated in Asia-Pacific (China, including Hong Kong and Taiwan, India, Indonesia, Japan, Korea, Malaysia, the Philippines, Singapore and Thailand). Approximately 32% and 14% of net revenue in fiscal 2012 was derived from operations in China and Japan, respectively. |
| | • | | 26% of net revenue originated in the Americas. |
| | • | | 14% of net revenue originated in Europe. |
Most of our sales in international markets are made by foreign sales subsidiaries. In countries with low sales volumes, sales are made through various representatives and distributors. A discussion of market risk associated with changes in foreign currency exchange rates can be found in Management’s Discussion and Analysis of Financial Condition and Results of Operations and Risk Factors.
We sell our products primarily through our own sales organization with a presence in most major connector markets worldwide. To complement our own sales force, we work with a network of distributors to serve a broader customer base and provide a wide variety of supply chain tools and capabilities. Sales through distributors represented approximately 25% of our net revenue in fiscal 2012.
We seek to provide each customer one-to-one service tailored to their business needs. Our engineers work collaboratively with customers to develop products for specific applications. We provide customers the benefit of state-of-the-art technology for engineering, design and prototyping, supported by development centers throughout the world. In addition, most customers have a single Molex customer service contact and a specific field salesperson to provide technical product and application expertise.
Our sales force around the world has access to our global information systems to provide 24/7 visibility on orders, pricing, contracts, shipping, inventory and customer programs. We offer a self-service environment for our customers through our web site at www.molex.com, so that customers can access our entire product line, download drawings or 3D models, obtain price quotes, order samples and track delivery.
Information regarding our operations by reporting segment appears in Note 21 of the Notes to Consolidated Financial Statements.
Research and Development
We remain committed to investing in world-class technology development, particularly in the design and manufacture of connectors and interconnect systems. Our research and development activities are directed toward developing technology innovations, primarily high-speed signal integrity, miniaturization, higher power delivery, optical signal delivery and sealed harsh environment connectors that we believe will deliver the next generation of products. We continue to invest in new manufacturing processes, improve existing products and reduce costs. We believe that we are well positioned in the technology industry to help drive innovation and promote industry standards that will yield innovative and improved products for customers.
We incurred total research and development costs of $181.1 million in fiscal 2012, $170.1 million in fiscal 2011 and $154.0 million in fiscal 2010. We believe this investment, approximating 5.2% of net revenue, is among the highest levels relative to the largest participants in the industry and helps us achieve a competitive advantage.
We strive to provide customers with the most advanced interconnection products through intellectual property development and participation in industry standards committees. Our engineers are active in many of these committees, helping to give us a voice in shaping the technologies of the future. In fiscal 2012, we commercialized 229 new products and received 319 patents.
9
We perform a majority of our design and development of connector products in the United States and Japan, but have additional product development capabilities in various locations, including China, Germany, Ireland, Korea and Singapore.
Manufacturing
Our core manufacturing expertise includes molding, stamping, plating and assembly operations. We use state of the art plastic injection molding machines and metal stamping and forming presses. We have created new processes to meet the ongoing challenge of manufacturing smaller connectors. We continue to utilize our proprietary plated plastic technology, which provides excellent shielding performance while eliminating secondary manufacturing processes in applications such as mobile phone antennas.
We also have expertise in printed circuit card, flexible circuit and harness assembly for our integrated products operations, which build devices that leverage our connector content. We operate low-cost manufacturing centers in China, India, Malaysia, Mexico, Poland, the Philippines, Thailand and Vietnam to reduce our manufacturing costs and align our footprint with our customers’ needs.
Continuous improvements achieved through a global lean/six sigma program have reduced our manufacturing costs and improved our quality and delivery. Our trend of fewer but larger factories, such as our one million square foot facility in Chengdu, China, provides increasing economies of scale and efficiencies.
Raw Materials
The principal raw materials that we purchase for the manufacture of our products include plastic resins for molding, metal alloys (primarily copper based) for stamping and gold and palladium salts for use in the plating process. We also purchase molded and stamped components and connector assemblies. Most materials and components used in our products are available from several sources. To achieve economies of scale, we concentrate purchases from a limited number of suppliers, and therefore in the short term may be dependent upon certain suppliers to meet performance and quality specifications and delivery schedules. We use financial instruments to hedge the volatility of commodity material costs. We anticipate that our raw material expenditures as a percentage of sales may increase due to growth in our integrated products business and increases in certain commodity costs.
Backlog
The backlog of unfilled orders as of June 30, 2012 was approximately $416.4 million compared with backlog of $418.5 million as of June 30, 2011. Substantially all of these orders are scheduled for delivery within 12 months. The majority of orders are shipped within 30 days of acceptance.
Employees
As of June 30, 2012, we had 34,226 people working for us worldwide. Approximately 70% of these people were located in low labor cost countries. We believe that we have strong relations with our employees.
Acquisitions and Investments
Our strategy to provide a broad range of connectors requires a wide variety of technologies, products and capabilities. The rapid pace of technological development in the connector industry and the specialized expertise required in different markets make it difficult for a single company to organically develop all of the required products. Though a significant majority of our growth has come from internally developed products, we will seek to make future acquisitions or investments where we believe we can stimulate the development of, or acquire, new technologies and products to further our strategic objectives and strengthen our existing businesses. Information regarding our acquisitions appears in Note 5 of the Notes to Consolidated Financial Statements.
10
Intellectual Property
Patents, trade secrets and trademarks and other proprietary rights (collectively, Intellectual Property) are important to our business. We own an extensive portfolio of U.S. and foreign patents and trademarks. In addition, we are a licensee of various third-party patents and trademarks. We review third-party Intellectual Property in an effort to avoid infringements of third-party Intellectual Property rights and to identify desirable third-party Intellectual Property rights to license to advance our business objectives. We also review our competitors’ products to identify infringements of our Intellectual Property rights and to identify licensing opportunities for our Intellectual Property rights. We believe that our Intellectual Property is important to our business, but do not consider ourselves materially dependent upon any particular piece of Intellectual Property.
Environmental, Health & Safety (EHS) Matters
We are committed to achieving high standards of environmental quality and product safety, and strive to provide a safe and healthy workplace for our employees, contractors and the communities in which we do business. We have EHS policies and disciplines that are applied to our operations. We closely monitor the environmental laws and regulations in the countries in which we operate and believe we are in compliance in all material respects with federal, state and local regulations pertaining to environmental protection.
All major Molex manufacturing sites are certified to the International Organization for Standardization 14001 environmental management system standard, which requires that a broad range of environmental processes and policies be in place to minimize environmental impact, maintain compliance with environmental regulations and communicate effectively with interested stakeholders. In addition, many sites globally are Occupational Health and Safety Assessment Series 18001 certified Occupational Health and Safety Management Systems, which is intended to manage occupational health and safety risks and drive continual health and safety improvement within our operations. Our corporate social responsibility auditing program includes not only compliance components, but also modules on business risk, environmental excellence and management systems. We have internal processes that focus on minimizing and properly managing hazardous materials used in our facilities and products. We monitor regulatory and resource trends and set short and long-term targets to continually improve our environmental performance.
The manufacture, assembly and testing of our products are subject to a broad array of laws and regulations, including restrictions on the use of hazardous materials. We have a program for compliance with the European Union Restriction on Certain Hazardous Substances Directive (RoHS) and similar laws.
11
Executive Officers
Our executive officers as of July 27, 2012 are set forth in the table below.
| | | | | | | | | | |
Name | | Positions Held with Registrant During the Last Five Years | | Age | | | Year
Employed | |
Frederick A. Krehbiel(a) | | Co-Chairman (1999-present); Chief Executive Officer (2004-2005); Co-Chief Executive Officer (1999-2001). | | | 71 | | | | 1965(b | ) |
John H. Krehbiel, Jr.(a) | | Co-Chairman (1999-present); Co-Chief Executive Officer (1999-2001). | | | 75 | | | | 1959(b | ) |
Martin P. Slark | | Vice-Chairman and Chief Executive Officer (2005-present); President and Chief Operating Officer (2001-2005). | | | 57 | | | | 1976 | |
Liam McCarthy | | President and Chief Operating Officer (2005-present); Vice President of Operations, Europe (2000-2005). | | | 56 | | | | 1976 | |
David D. Johnson | | Executive Vice President, Treasurer and Chief Financial Officer (2005-present). | | | 56 | | | | 2005 | |
Graham C. Brock | | Executive Vice President (2005-present) and President, Global Sales & Marketing (2006-present) and Regional President, Europe (2005). | | | 58 | | | | 1976 | |
James E. Fleischhacker | | Executive Vice President (2001-present), Technology & Innovation (2012-present); President, Global Commercial Products Division (2009-2012); President Global Transportation Products Division
(2007-2009). | | | 68 | | | | 1984 | |
Katsumi Hirokawa | | Executive Vice President (2005-present) and President, Global Micro Products Division (2007-present); Vice President and President, Asia-Pacific North
(2005-2007). | | | 65 | | | | 1995 | |
J. Michael Nauman | | Executive Vice President and President, Global Integrated Products Division (2009-present); Senior Vice President and President, Global Integrated Products Division (2007-2009); President, Integrated Products Division, Americas Region (2005-2007). | | | 50 | | | | 1994 | |
Joseph Nelligan | | Senior Vice President, (2011-present); President, Commercial Products Division (2012-present); Vice President, Product Development and Commercialization, Commercial Products Division (2009-2011); Vice President, Global Industry Group — Datacom (2007-2009). | | | 48 | | | | 1984 | |
Gary J. Matula | | Senior Vice President, Information Systems and Chief Information Officer (2008-present); Vice President, Information Systems and Chief Information Officer (2004-2008). | | | 57 | | | | 1984 | |
Timothy I. Ruff | | Senior Vice President, Business Development and Corporate Strategy (2012-present); Vice President Sales and Marketing, Americas (2006-2011). | | | 47 | | | | 1988 | |
Ana G. Rodriguez | | Senior Vice President, Global Human Resources (2008-present); Vice President, Co-General Counsel and Secretary (2007-2008). | | | 44 | | | | 2005 | |
12
| (a) | John H. Krehbiel, Jr. and Frederick A. Krehbiel (the Krehbiel Family) are brothers. The members of the Krehbiel Family may be considered to be “control persons” of Molex. The other executive officers listed above have no relationship, family or otherwise, to the Krehbiel Family, Molex or each other. |
| (b) | Includes period employed by our predecessor company. |
Code of Business Conduct and Ethics
We have adopted a Code of Business Conduct and Ethics applicable to all employees, officers and directors. The Code of Business Conduct incorporates our policies and guidelines designed to deter wrongdoing and to promote honest and ethical conduct and compliance with applicable laws and regulations. We have also adopted a Code of Ethics for Senior Financial Management applicable to our Chief Executive Officer, Chief Financial Officer, Chief Accounting Officer and other senior financial managers. The Code of Ethics sets out our expectations that financial management produce full, fair, accurate, timely and understandable disclosure in our filings with the Securities and Exchange Commission (the SEC) and other public communications. We intend to post any amendments to or waivers from these codes of conduct on our web site.
The full text of these codes of conduct is published on the investor relations page of our web site at www.molex.com.
Available Information
We file with the SEC our annual report on Form 10-K, quarterly reports on Form 10-Q, current reports on Form 8-K and all amendments to those reports, proxy statements and registration statements. You may read and copy any material we file with the SEC at the SEC’s Public Reference Room at 100 F Street, NE, Washington, D.C. 20549. You may also obtain information on the operation of the Public Reference Room by calling the SEC at 1-800-SEC-0330. In addition, the SEC maintains an internet site at http://www.sec.gov that contains reports, proxy and information statements, and other information regarding issuers, including us, that file electronically. We make available free of charge on or through our website at www.molex.com our annual reports on Form 10-K, quarterly reports on Form 10-Q, current reports on Form 8-K and amendments to these reports filed or furnished pursuant to Section 13(a) or 15(d) of the Exchange Act as soon as reasonably practicable after we file these materials with the SEC.
Cautionary Statement Regarding Forward-Looking Statements
This Annual Report on Form 10-K and other documents we file with the SEC contain forward-looking statements that are based on current expectations, estimates, forecasts and projections about our future performance, business, beliefs, and management’s assumptions. In addition, we, or others on our behalf, may make forward-looking statements in press releases or written statements, or in our communications and discussions with investors and analysts in the normal course of business through meetings, web casts, phone calls, and conference calls. Words such as “expect,” “anticipate,” “outlook,” “forecast,” “could,” “project,” “intend,” “plan,” “continue,” “believe,” “seek,” “estimate,” “should,” “may,” “assume,” “potential,” variations of such words and similar expressions are intended to identify such forward-looking statements. These statements are not guarantees of future performance and involve certain risks, uncertainties, and assumptions that are difficult to predict. We describe our respective risks, uncertainties, and assumptions that could affect the outcome or results of operations below.
We have based our forward-looking statements on our management’s beliefs and assumptions based on information available to management at the time the statements are made. We caution you that actual outcomes and results may differ materially from what is expressed, implied, or forecast by our forward-looking statements. Reference is made in particular to forward-looking statements regard-
13
ing growth strategies, industry trends, global economic conditions, success of customers, cost of raw materials, value of inventory, availability of credit, currency exchange rates, labor costs, protection of intellectual property, cost reduction initiatives, acquisition synergies, manufacturing strategies, product development introduction and sales, regulatory changes, competitive strengths, natural disasters, unauthorized access to data, government investigations and outcomes of legal proceedings. Except as required under the federal securities laws, we do not have any intention or obligation to update publicly any forward-looking statements after the distribution of this report, whether as a result of new information, future events, changes in assumptions, or otherwise.
Risk Factors
You should carefully consider the risks described below. These risks are not the only ones facing our company. Additional risks and uncertainties not presently known to us or that we currently believe to be immaterial may also impair our business operations. If any of the following risks occur, our business, financial condition or operating results could be materially adversely affected.
Risks Relating to Our Business
We may be adversely affected by a prolonged economic downturn or economic uncertainty.
Our business and operating results have been and will continue to be affected by global economic conditions. When global economic conditions deteriorate or economic uncertainty increases, our customers or potential customers may experience deterioration of their businesses, which may result in the delay or cancellation of plans to purchase our products. Our sensitivity to economic cycles and any related fluctuation in the businesses of our customers or potential customers may have a material adverse effect on our financial condition, results of operations or cash flows.
We may see a negative effect on our business due to disruptions in financial markets.
Economic downturns and economic uncertainty generally affect global credit markets. Financial markets in the United States, Europe and Asia have been experiencing volatility in security prices, limited liquidity and credit availability, rating downgrades of certain investments and declining valuation of others. While these conditions have not yet impaired our ability to access credit markets and finance our operations, there is no assurance that there will not be deterioration in financial markets and confidence in developed economies. The tightening of credit in financial markets may adversely affect the ability of our customers and suppliers to obtain financing of significant purchases and operations and this can in turn have a material adverse effect on our business and results of operations.
We are dependent on the success of our customers.
We are dependent on the continued growth, viability and financial stability of our customers. Our customers generally are OEMs in the telecommunications, infotech, automotive, consumer and industrial markets. These markets are subject to rapid technological change, vigorous competition and short product life cycles and cyclical and reduced consumer demand patterns. When our customers are adversely affected by these factors, we may be similarly affected.
For example, the telecommunications market, which accounted for approximately 23% of our net revenue in fiscal 2012, has historically experienced periods of robust capital expenditure followed by periods of retrenchment and consolidation. The infotech market, which accounted for 26% of our net revenue in fiscal 2012, has fluctuated seasonally and is subject to variations in enterprise spending depending on current economic and credit conditions. Periodic downturns in our customers’ industries can significantly reduce demand for certain of our products, which could have a material adverse effect on our financial condition, results of operations and cash flows.
14
We are subject to continuing pressure to lower our prices.
Over the past several years, we have experienced, and we expect to continue to experience, pressure to lower our prices. In the last two years, we have experienced annual price erosion averaging from 2% to 3% of net revenue. In order to maintain our margins, we must continue to reduce our costs by similar amounts. Continuing pressure to reduce our prices could have a material adverse effect on our financial condition, results of operations and cash flows.
We face rising costs of commodity materials.
The cost and availability of certain commodity materials used to manufacture our products, such as plastic resins, copper-based metal alloys, gold and palladium salts, molded and stamped components and connector assemblies, are critical to our success. The prices of many of these raw materials, including copper and gold, has increased in recent years, and continues to fluctuate. Gold, which made up approximately 16% of our material cost in fiscal 2012, has increased in price approximately 52% since fiscal 2010. In addition, many of these commodity materials are produced in a limited number of regions around the world or are only available from a limited number of suppliers. Volatility in the prices and shortages of such materials may result in increased costs and lower operating margins if we are unable to pass such increased costs through to our customers. Some of our competitors may be less dependent on these commodity materials and have less exposure to these volatile commodity costs. Our results of operations, financial condition and cash flows may be materially and adversely affected if we have difficulty obtaining these commodity materials, the quality of available commodity materials deteriorates, or there are continued significant price increases for these commodity materials. We use financial instruments to hedge the volatility of commodity material costs. The success of our hedging program depends on accurate forecasting of transaction activity in the various commodity materials. We could experience unanticipated commodity materials or hedge gains or losses if these forecasts are inaccurate during periods of volatility.
We face intense competition in our markets.
Our markets are highly competitive and we expect that both direct and indirect competition will increase in the future. Our overall competitive position depends on a number of factors including the price, quality and performance of our products, the level of customer service, the development of new technology and our ability to participate in emerging markets. A relative decline in our competitive position in these areas could have a material adverse effect on our financial condition. Within each of our markets, we encounter direct competition from other electronic components manufacturers and suppliers ranging in size from large, diversified manufacturers to small, highly specialized manufacturers. Competition may intensify from various U.S. and non-U.S. competitors and new market entrants, some of which may be our current customers. Our markets have continued to become increasingly concentrated and globalized in recent years, and our major competitors have significant financial resources and technological capabilities. Moreover, our competitive position is increasingly dependent upon being a socially responsible citizen and any inability to meet our customers’ expectations may result in a loss of business and market share to competitors. Increased competition may result in price reductions, reduced margins or loss of market share, any of which could materially and adversely affect our business, operating results and financial condition.
We are dependent on new products.
We expect that a significant portion of our future net revenue will continue to be derived from sales of newly introduced products. Rapidly changing technology, evolving industry standards and changes in customer needs characterize the market for our products. If we fail to modify or improve our products in response to changes in technology, industry standards or customer needs, our products could rapidly become less competitive or obsolete. We must continue to make investments in research and development in order to timely develop new products, enhance existing products and achieve market acceptance for such products. As a result of our need to make these investments in research and
15
development, our operating results could be materially affected if our net revenue falls below expectations. Moreover, there is no assurance that development stage products will be successfully completed or, if developed, will achieve significant customer acceptance.
We may need to license new technologies to respond to technological change and these licenses may not be available to us on terms that we can accept or may materially change the gross profit margin that we are able to obtain on our products. We may not succeed in adapting our products to new technologies as they emerge. Development and manufacturing schedules for technology products are difficult to predict, and there is no assurance that we will achieve timely initial customer shipments of new products. The timely availability of these products in volume and their acceptance by customers are important to our future success.
We face manufacturing challenges.
The volume and timing of sales to our customers may vary due to: variation in demand for our customers’ products; our customers’ attempts to manage their inventory; design changes; changes in our customers’ manufacturing strategy; and consolidations among or acquisitions of customers. Due in part to these factors, many of our customers do not commit to long-term production schedules. Our inability to forecast the level of customer orders with certainty makes it difficult to schedule production and maximize utilization of manufacturing capacity.
Our industry must provide increasingly rapid product turnaround for its customers. We generally do not obtain firm, long-term purchase commitments from our customers and we continue to experience reduced lead-times in customer orders. Customers may cancel their orders, change production quantities or delay production for a number of reasons and such actions could negatively affect our operating results. In addition, we make significant operating decisions based on our estimate of customer requirements. The short-term nature of our customers’ commitments and the possibility of rapid changes in demand for their products reduce our ability to accurately estimate the future requirements of those customers.
We rely on third-party suppliers for the components used in our products, and we rely on third-party manufacturers to manufacture certain of our assemblies and finished products. Our results of operations, financial condition, and cash flows could be adversely affected if our third-party suppliers lack sufficient quality control or if there are significant changes in their financial or business condition. If our third-party suppliers fail to deliver products, parts, and components of sufficient quality on time and at reasonable prices, we could have difficulties fulfilling our orders, sales and profits could decline, and our commercial reputation could be damaged.
From time to time, we have underutilized our manufacturing lines. This excess capacity means we incur increased fixed costs in our products relative to the net revenue we generate, which could have an adverse effect on our results of operations, particularly during economic downturns. If we are unable to improve utilization levels for these manufacturing lines and correctly manage capacity, the increased expense levels will have an adverse effect on our business, financial condition and results of operations. In addition, some of our manufacturing lines are located in China or other foreign countries that are subject to a number of additional risks and uncertainties, including increasing labor costs and political, social and economic instability.
We are dependent on independent distributors to sell and market our products.
Sales through independent distributors accounted for approximately 25% of our net revenue in fiscal 2012. Although we have entered into written agreements with most of the distributors, the agreements are nonexclusive and generally may be terminated by either party upon written notice. The distributors are not within our control, are not obligated to purchase products from us, and may also sell other lines of products. We do not assure you that these distributors will continue their current relationships with us or that they will not give higher priority to the sale of other products, which could include products of competitors. A reduction in sales efforts or discontinuance of sales of our products
16
by the distributors would lead to reduced sales and could materially adversely affect our financial condition, results of operations and business. Selling through indirect channels such as distributors may limit our contact with the ultimate customers and our ability to assure customer satisfaction.
We face industry consolidation.
Many of the industries to which we sell our products, as well as many of the industries from which we buy materials, have become increasingly concentrated in recent years, including the telecommunications, infotech, automotive and consumer electronics industries. Consolidation of customers may lead to decreased product purchases from us. In addition, as our customers buy in larger volumes, their volume buying power has increased, and they may be able to negotiate more favorable pricing and find alternative sources from which to purchase. Our materials suppliers similarly have increased their ability to negotiate favorable pricing. These trends may adversely affect the profit margins of our products, particularly for commodity components.
We face the possibility that our gross margins may decline.
In response to changes in product mix, competitive pricing pressures, increased sales discounts, introductions of new competitive products, product enhancements by our competitors, increases in manufacturing or labor costs or other operating expenses, we may experience declines in prices, gross margins and profitability. To maintain our gross margins we must maintain or increase current shipment volumes, develop and introduce new products and product enhancements and reduce the costs to produce our products. If we are unable to accomplish this, our net revenue, gross profit and operating results may be below our expectations and those of investors and analysts.
We face risks associated with inventory.
The value of our inventory may decline as a result of surplus inventory, price reductions or technological obsolescence. The life cycles of some of our products can be very short compared with the development cycle, which may result in excess or obsolete inventory or equipment that we may need to write off. We must identify the right product mix and maintain sufficient inventory on hand to meet customer orders. Failure to do so could adversely affect our net revenue and operating results. However, if circumstances change (for example, an unexpected shift in market demand, pricing or customer defaults) there could be a material effect on the net realizable value of our inventory. We maintain an inventory valuation reserve account against diminution in the value or salability of our inventory. However, there is no guaranty that these arrangements will be sufficient to avoid write-offs in excess of our reserves in all circumstances.
We may encounter problems associated with our global operations.
For fiscal year 2012, approximately 74% of our net revenue came from international sales, including 32% and 14% in China and Japan, respectively. In addition, a significant portion of our operations consists of manufacturing activities outside of the United States, including approximately 21% and 30% in China and Japan, respectively. Our ability to sell our products and conduct our operations globally is subject to a number of risks. Local economic, political and labor conditions in each country could adversely affect demand for our products and services or disrupt our operations in these markets. We may also experience reduced intellectual property protection or longer and more challenging collection cycles as a result of different customary business practices in certain countries, including China where we do business. Additionally, we face the following risks:
| | • | | international business conditions including the relationships between the United States and other governments; |
| | • | | unexpected changes in laws, regulations, trade, monetary or fiscal policy, including interest rates, foreign currency exchange rates and changes in the rate of inflation in the United States and other foreign countries; |
17
| | • | | tariffs, quotas, customs and other import or export restrictions and other trade barriers; |
| | • | | difficulties in staffing and management; |
| | • | | language and cultural barriers, including those related to employment regulation; |
| | • | | disruption of our supply chain as a result of natural disasters; and |
| | • | | potentially adverse tax consequences. |
We are exposed to fluctuations in currency exchange rates.
We face substantial exposure to movements in non-U.S. currency exchange rates because a significant portion of our business is conducted outside the United States. This may harm our results of operations, and any measures that we may implement to reduce the effect of volatile currencies and other risks of our global operations may not be effective. Approximately 64% of our net revenue for fiscal year 2012 was invoiced in currencies other than the U.S. dollar, and we expect net revenue and manufacturing costs from non-U.S. markets to continue to represent a significant portion of our operating results. Price increases caused by currency exchange rate fluctuations may make our products less competitive or have an adverse effect on our margins. Our international net revenue and expenses generally are derived from sales and operations in currencies other than the U.S. dollar. Accordingly, when the U.S. dollar strengthens in relation to the currencies of the countries in which we sell our products, our U.S. dollar reported net revenue and income will decrease. Currency exchange rate fluctuations may also disrupt the business of our suppliers by making their purchases of raw materials more expensive and more difficult to finance. We mitigate a portion of our foreign currency exchange rate risk principally through the establishment of local production facilities in the markets we serve. This creates a “natural hedge” since purchases and sales within a specific country are both denominated in the same currency and therefore no exposure exists to hedge with a foreign exchange forward or option contract (collectively, “foreign exchange contracts”). Natural hedges exist in most countries in which we operate, although the percentage of natural offsets, as compared with offsets that need to be hedged by foreign exchange contracts, will vary from country to country. To reduce our exposure to fluctuations in currency exchange rates when natural hedges are not effective, we may use financial instruments to hedge U.S. dollar and other currency commitments and cash flows arising from trade accounts receivable, trade accounts payable and fixed purchase obligations.
If these hedging activities are not successful or we change or reduce these hedging activities in the future, we may experience significant unexpected expenses from fluctuations in exchange rates or financial instruments which become ineffective. The success of our hedging program depends on accurate forecasts of transaction activity in the various currencies. To the extent that these forecasts are over or understated during periods of currency volatility, we could experience unanticipated currency or hedge gains or losses.
We may find that our products have quality issues.
The fabrication of the products we manufacture is a complex and precise process. Our customers specify quality, performance and reliability standards. If flaws in either the design or manufacture of our products were to occur, we could experience a rate of failure in our products that could result in significant delays in shipment and product re-work or replacement costs. Although we engage in extensive product quality programs and processes, these may not be sufficient to avoid product failures, which could cause any of the following to occur and negatively affect our financial condition and results of operations:
| | • | | incur increased costs such as warranty expense and costs associated with customer support; |
| | • | | experience delays, cancellations or rescheduling of orders for our products; |
18
| | • | | experience increased product returns or discounts; or |
If we fail to manage our growth effectively or to integrate successfully any future acquisition, our business could be harmed.
We expect to continue to make investments in companies, products and technologies through acquisitions. While we believe that such acquisitions are an integral part of our long-term strategy, there are risks and uncertainties related to acquiring companies. Such risks and uncertainties include:
| | • | | successfully identifying and completing transactions; |
| | • | | difficulty in integrating acquired operations, technology and products or realizing cost savings or other anticipated benefits from integration; |
| | • | | retaining customers and existing contracts; |
| | • | | retaining the key employees of the acquired operation; |
| | • | | potential disruption of our or the acquired company’s ongoing business; |
| | • | | charges for impairment of long-term assets; |
| | • | | unanticipated expenses related to integration; and |
| | • | | potential unknown liabilities associated with the acquired company. |
In addition, if we were to undertake a substantial acquisition for cash, the acquisition would likely need to be financed in part through additional financing from banks, through public offerings or private placements of debt or equity securities, or other arrangements. This acquisition financing might decrease our ratio of earnings to fixed charges and adversely affect other leverage measures. Any necessary acquisition financing may not be available to us on acceptable terms if and when required. If we undertake an acquisition by issuing equity securities or equity-linked securities, the issued securities would have a dilutive effect on the interests of the holders of our stock.
We depend on our key employees and face competition in hiring and retaining qualified employees.
Our future success depends partly on the continued contribution of our key employees, including executive, engineering, sales, marketing, manufacturing and administrative personnel. We face intense competition for key personnel in several of our product and geographic markets. Our future success depends in large part on our continued ability to hire, assimilate and retain key employees, including qualified engineers and other highly skilled personnel needed to compete and develop successful new products. We may not be as successful as competitors at recruiting, assimilating and retaining highly skilled personnel.
We are subject to various laws and government regulations.
We are subject to a wide and ever-changing variety of U.S. and foreign laws and regulations, compliance with which may require substantial expense. Of particular note are laws and regulations restricting the use of certain chemical substances in the production of electronic equipment. Failure to comply with these requirements could result in fines or suspension of sales.
In addition, some environmental laws impose liability, sometimes without fault, for investigating or cleaning up contamination on or emanating from our currently or formerly owned, leased or operated property, as well as for damages to property or natural resources and for personal injury arising out of such contamination.
19
We rely on our intellectual property rights.
We rely on a combination of patents, copyrights, trademarks and trade secrets and confidentiality provisions to establish and protect our proprietary rights. To this end, we hold rights to a number of patents and registered trademarks and regularly file applications to attempt to protect our rights in new technology and trademarks. Even if approved, our patents or trademarks may be successfully challenged by others or otherwise become invalidated for a variety of reasons. Also, to the extent a competitor is able to reproduce or otherwise capitalize on our intellectual property, it may be difficult, expensive or impossible for us to obtain necessary legal protection.
Third parties may claim that we are infringing their intellectual property rights. Such claims could have an adverse effect on our business and financial condition. From time to time we receive letters alleging infringement of patents. Litigation concerning patents or other intellectual property is costly and time consuming. We may seek licenses from such parties, but they could refuse to grant us a license or demand commercially unreasonable terms. Such infringement claims could also cause us to incur substantial liabilities and to suspend or permanently cease the manufacture and sale of affected products.
Our Information Technology (“IT”) systems could be breached.
We face certain security threats relating to the confidentiality and integrity of our IT systems. Despite implementation of security measures, our IT systems may be vulnerable to damage from computer viruses, cyber attacks and other unauthorized access and these security breaches could result in a disruption to our operations. A material network breach of our IT systems could involve the theft of our and our customers’ intellectual property or trade secrets which may be used by competitors to develop competing products. To the extent that any security breach results in a loss or damage to data, or inappropriate disclosure of confidential or proprietary information, it could cause significant damage to our reputation, affect our customer relations, lead to claims against us, increase our costs to protect against future damage and could result in a material adverse effect on our business and financial position.
We could suffer significant business interruptions.
Our operations and those of our suppliers and customers may be vulnerable to interruption by natural disasters such as earthquakes, tsunamis, typhoons, or floods, or other disasters such as fires, explosions, acts of terrorism or war, disease or failures of our management information or other systems due to internal or external causes. If a business interruption occurs, our business could be materially and adversely affected.
A decline in the market value of our pension plans’ investment portfolios could adversely affect our results of operations, financial condition and cash flows.
Concerns about deterioration in the global economy, together with the credit crisis, have caused significant volatility in interest rates and equity prices, which could decrease the value of our pension plans’ investment portfolios. A decrease in the value of our pension plans’ investment portfolios could have an adverse effect on our results of operations, financial condition and cash flows.
We may have exposure to income tax rate fluctuations and to additional tax liabilities, which could negatively affect our financial position.
As a corporation with operations both in the United States and abroad, we are subject to income taxes in the United States and various foreign jurisdictions. Our effective tax rate is subject to significant fluctuation from one period to the next because the income tax rates for each year are a function of a number of factors, including the following:
| | • | | the effects of a mix of earnings among countries with a broad range of statutory tax rates; |
| | • | | changes in the valuation of deferred tax assets and liabilities; |
20
| | • | | changes in assessment of tax exposures; and |
| | • | | changes in tax laws or the interpretation of these laws. |
Changes in the mix of these items and other items may cause our effective tax rate to fluctuate between periods, which could have a material adverse effect on our results of operations and financial condition.
In addition, if we encounter a significant need for liquidity domestically or at a particular location that we cannot fulfill through borrowings, equity offerings, or other internal or external sources, we may experience unfavorable tax and earnings consequences due to cash transfers. These adverse consequences would occur, for example, if the transfer of cash into the United States is taxed and no offsetting foreign tax credit is available to offset the U.S. tax liability, resulting in lower earnings. Foreign exchange ceilings imposed by local governments and the sometimes lengthy approval processes that foreign governments require for international cash transfers may delay our internal cash transfers from time to time.
We are also subject to non-income taxes, such as payroll, sales, use, value-added, net worth, property and goods and services taxes, in both the United States and various foreign jurisdictions.
Significant judgment is required in determining our provision for income taxes and other tax liabilities. Although we believe our tax estimates are reasonable, we are regularly under audit by tax authorities with respect to both income and non-income taxes and may have exposure to additional tax liabilities as a result of these audits. Unfavorable audit findings and tax rulings may result in payment of taxes, fines and penalties for prior periods and higher tax rates in future periods, which may have a material adverse effect on our results of operations and financial condition.
An adverse outcome in a litigation proceeding may result in a material adverse effect on our financial position.
We are currently a party to various legal proceedings which may divert financial and management resources. If one or more unfavorable final outcomes were to occur, our financial position could be materially and adversely affected.
Covenants in our debt instruments may adversely affect us if we are determined not to be in compliance.
Our unregistered, private placement of debt (the Private Placement) and three-year revolving credit facility in the United States (the U.S. Credit Facility) contain representations and covenants with which we are required to be in compliance. Although we believe none of these covenants are restrictive to our operations, our ability to meet these representations and/or covenants can be affected by events beyond our control, and we do not assure you that we will continue to comply. A breach of any of these representations and/or covenants could result in a default giving the lender(s) the right to declare all amounts outstanding thereunder to be immediately due and payable and our lender(s) could terminate commitments to extend further credit. If the lender(s) accelerate the repayment of borrowings, we do not assure you that we will have sufficient assets to repay our affected indebtedness. In addition, acceleration of any debt obligation under any of our material debt instruments may permit the lender(s) under other material debt instruments to accelerate payment of amounts outstanding.
Our certificate of incorporation and bylaws include antitakeover provisions, which may deter or prevent a takeover attempt.
Some provisions of our certificate of incorporation and bylaws may deter or prevent a takeover attempt, including a takeover that might result in a premium over the market price for our Common Stock and Class A Common Stock. Our governing documents establish a classified board, require stockholders to give advance notice prior to the annual meeting if they want to nominate a candidate
21
for director or present a proposal, and contain a number of provisions subject to supermajority vote. In addition, the Board may issue up to 25,000,000 shares of preferred stock without action by our stockholders, which could be used to make it more difficult and costly to acquire our company.
| Item 1B. | Unresolved Staff Comments |
None.
We own and lease manufacturing, design, warehousing, sales and administrative space in locations around the world. The leases are of varying terms with expirations ranging from fiscal 2012 through fiscal 2021. The leases in aggregate are not considered material to the financial position of Molex.
As of June 30, 2012, we owned or leased a total of approximately 9.7 million square feet of facility space worldwide. We have vacated several buildings in France, Germany and Slovakia and are holding these buildings and related assets for sale. We own 91% of our manufacturing, design, warehouse and office space and lease the remaining 9%. Our manufacturing plants are equipped with machinery, most of which we own and which, in part, we developed to meet the special requirements of our manufacturing processes. We believe that our buildings, machinery and equipment are well maintained and adequate for our current needs.
Our principal executive offices are located at 2222 Wellington Court, Lisle, Illinois, United States of America. We own 40 manufacturing locations, of which 15 are located in North America and 25 are located in other countries. A listing of the locations of our principal manufacturing facilities by geographic region is presented below:
| | • | | Americas: Mexico and United States |
| | • | | Asia-Pacific: China, India, Japan, Korea, Malaysia, the Philippines, Singapore, Taiwan, Thailand and Vietnam |
| | • | | Europe: Ireland, Italy and Poland |
Currently, we are involved in a number of legal proceedings. For a discussion of contingencies related to legal proceedings, see Note 20 of the Notes to Consolidated Financial Statements, which is hereby incorporated by reference.
| Item 4. | Mining Safety Disclosures — Not Applicable |
22
PART II
| Item 5. | Market for Registrant’s Common Equity, Related Stockholder Matters and Issuer Purchases of Equity Securities |
Molex Incorporated is traded on the NASDAQ Global Select Market and on the London Stock Exchange and trades under the symbols MOLX for Common Stock and MOLXA for Class A Common Stock. Molex Class B Common Stock is not publicly traded.
The number of stockholders of record at June 30, 2012 was 1,883 for Common Stock, 5,150 for Class A Common Stock and 13 for Class B Common Stock.
The following table presents quarterly stock prices for the fiscal years ended June 30:
| | | | | | | | | | | | | | | | | | | | |
| | | | | | 2012 | | | 2011 | |
| | | Quarter | | | Low — High | | | Low — High | |
Common Stock | | | 1st | | | $ | 18.62 | | | $ | 26.63 | | | $ | 17.65 | | | $ | 21.10 | |
| | | 2nd | | | | 19.09 | | | | 25.88 | | | | 20.18 | | | | 23.02 | |
| | | 3rd | | | | 24.35 | | | | 28.38 | | | | 23.01 | | | | 28.22 | |
| | | 4th | | | | 22.19 | | | | 28.28 | | | | 24.22 | | | | 27.95 | |
| | | |
| | | | | | 2012 | | | 2011 | |
| | | Quarter | | | Low — High | | | Low — High | |
Class A Common Stock | | | 1st | | | $ | 15.83 | | | $ | 22.18 | | | $ | 15.03 | | | $ | 17.79 | |
| | | 2nd | | | | 15.85 | | | | 21.39 | | | | 16.87 | | | | 19.08 | |
| | | 3rd | | | | 20.10 | | | | 23.62 | | | | 19.20 | | | | 23.47 | |
| | | 4th | | | | 18.96 | | | | 23.55 | | | | 20.22 | | | | 23.32 | |
Cash dividends on common stock have been paid every year since 1977. The following table presents quarterly dividends declared per share of Common Stock, Class A Common Stock and Class B Common Stock for the fiscal years ended June 30:
| | | | | | | | |
| | | 2012 | | | 2011 | |
Quarter ended: | | | | | | | | |
September 30 | | $ | 0.2000 | | | $ | 0.1525 | |
December 31 | | | 0.2000 | | | | 0.1750 | |
March 31 | | | 0.2000 | | | | 0.1750 | |
June 30 | | | 0.2200 | | | | 0.2000 | |
| | | | | | | | |
Total | | $ | 0.8200 | | | $ | 0.7025 | |
| | | | | | | | |
23
During the quarter ended June 30, 2012, 24,020 shares of Class A Common Stock were transferred to us from certain employees to pay either the purchase price and/or withholding taxes on the vesting of restricted stock or the exercise of stock options. The aggregate market value of the shares transferred totaled $0.5 million. Share purchases of Molex Common and/or Class A Common Stock for the quarter ended June 30, 2012 were as follows (in thousands, except price per share data):
| | | | | | | | | | | | |
| | | Total Number
of Shares
Purchased* | | | Average Price
Paid per Share | | | Total Number
of Shares
Purchased as
Part of Publicly
Announced Plan | |
April 1 — April 30 | | | | | | | | | | | | |
Common Stock | | | — | | | $ | — | | | | — | |
Class A Common Stock | | | 516 | | | $ | 22.37 | | | | — | |
May 1 — May 31 | | | | | | | | | | | | |
Common Stock | | | — | | | $ | — | | | | — | |
Class A Common Stock | | | — | | | $ | — | | | | — | |
June 1 — June 30 | | | | | | | | | | | | |
Common Stock | | | — | | | $ | — | | | | — | |
Class A Common Stock | | | 18 | | | $ | 18.97 | | | | — | |
| | | | | | | | | | | | |
Total | | | 534 | | | $ | 22.24 | | | | — | |
| | | | | | | | | | | | |
| * | The shares purchased represent shares withheld to pay taxes due upon vesting of restricted stock or exercise of employee stock options. |
Descriptions of our Common Stock appear under the caption “Molex Stock” in our 2012 Proxy Statement and in Note 17 of the Notes to Consolidated Financial Statements.
24
Performance Graph
The performance graph set forth below shows the value of an investment of $100 on June 30, 2007 in each of Molex Common Stock, Molex Class A Common Stock, the S&P 500 Index and a Peer Group Index. The Peer Group Index includes 50 companies (including Molex) classified in the Global Sub-industry Classifications “Electronic Equipment and Instruments,” “Electronic Manufacturing Services” and “Technology Distributors.” All values assume reinvestment of the pre-tax value of dividends paid by Molex and the companies included in these indices, and are calculated as of June 30 each year. The historical stock price performance of Molex’s Common Stock and Class A Common Stock is not necessarily indicative of future stock price performance.
Comparison of Five-Year Cumulative Total Return
(Value of Investment of $100 on June 30, 2007)
Among Molex Incorporated, the S&P 500 Index
and a Peer Group
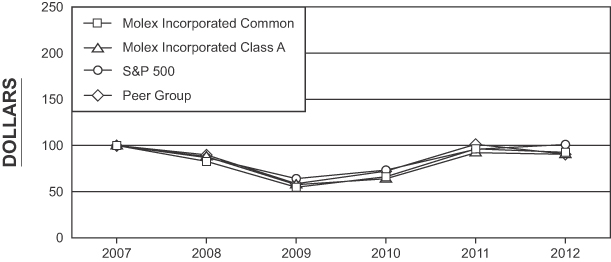
| | | | | | | | | | | | | | | | | | | | | | | | |
| | | 06/30/07 | | | 06/30/08 | | | 06/30/09 | | | 06/30/10 | | | 06/30/11 | | | 06/30/12 | |
Molex Incorporated Common | | | 100.00 | | | | 82.78 | | | | 54.78 | | | | 66.17 | | | | 96.33 | | | | 92.61 | |
Molex Incorporated Class A | | | 100.00 | | | | 87.91 | | | | 57.55 | | | | 63.96 | | | | 92.18 | | | | 90.45 | |
S&P 500 | | | 100.00 | | | | 86.88 | | | | 64.10 | | | | 73.35 | | | | 95.87 | | | | 101.09 | |
Peer Group | | | 100.00 | | | | 89.85 | | | | 58.65 | | | | 72.21 | | | | 101.31 | | | | 90.58 | |
25
| Item 6. | Selected Financial Data |
Molex Incorporated
Five-Year Financial Highlights Summary
(in thousands, except per share data)
| | | | | | | | | | | | | | | | | | | | |
| | | 2012 | | | 2011 | | | 2010 | | | 2009 | | | 2008 | |
Operations: | | | | | | | | | | | | | | | | | | | | |
Net revenue | | $ | 3,489,189 | | | $ | 3,587,334 | | | $ | 3,007,207 | | | $ | 2,581,841 | | | $ | 3,328,347 | |
Gross profit | | | 1,068,463 | | | | 1,088,137 | | | | 892,623 | | | | 656,177 | | | | 1,014,235 | |
Income (loss) from operations | | | 399,472 | | | | 430,199 | | | | 137,802 | | | | (348,881 | ) | | | 313,233 | |
Income (loss) before income taxes | | | 400,267 | | | | 429,939 | | | | 131,489 | | | | (321,573 | ) | | | 333,931 | |
Net income (loss)(1) | | | 281,377 | | | | 298,808 | | | | 76,930 | | | | (322,036 | ) | | | 215,720 | |
Earnings (loss) per share: | | | | | | | | | | | | | | | | | | | | |
Basic | | $ | 1.60 | | | $ | 1.71 | | | $ | 0.44 | | | $ | (1.84 | ) | | $ | 1.20 | |
Diluted | | | 1.59 | | | | 1.70 | | | | 0.44 | | | | (1.84 | ) | | | 1.19 | |
Net income (loss) percent of net revenue | | | 8.1 | % | | | 8.3 | % | | | 2.6 | % | | | (12.5 | )% | | | 6.5 | % |
Capital expenditures | | $ | 227,101 | | | $ | 262,246 | | | $ | 229,477 | | | $ | 177,943 | | | $ | 234,626 | |
Financial Position: | | | | | | | | | | | | | | | | | | | | |
Current assets | | $ | 2,079,238 | | | $ | 2,055,345 | | | $ | 1,775,821 | | | $ | 1,507,058 | | | $ | 1,841,472 | |
Current liabilities | | | 886,857 | | | | 882,047 | | | | 912,696 | | | | 884,893 | | | | 817,803 | |
Working capital(2) | | | 1,192,381 | | | | 1,173,298 | | | | 863,125 | | | | 622,165 | | | | 1,023,669 | |
Current ratio(3) | | | 2.3 | | | | 2.3 | | | | 1.9 | | | | 1.7 | | | | 2.3 | |
Property, plant and equipment, net | | $ | 1,150,549 | | | $ | 1,168,448 | | | $ | 1,055,144 | | | $ | 1,080,417 | | | $ | 1,172,395 | |
Total assets | | | 3,611,503 | | | | 3,597,852 | | | | 3,236,578 | | | | 3,011,586 | | | | 3,667,272 | |
Long-term debt | | | 150,032 | | | | 222,794 | | | | 183,434 | | | | 30,311 | | | | 146,333 | |
Stockholders’ equity | | | 2,441,264 | | | | 2,368,266 | | | | 1,985,131 | | | | 1,961,252 | | | | 2,576,216 | |
Dividends declared per share | | $ | 0.82 | | | $ | 0.70 | | | $ | 0.61 | | | $ | 0.61 | | | $ | 0.45 | |
Average common shares outstanding: | | | | | | | | | | | | | | | | | | | | |
Basic | | | 175,980 | | | | 174,812 | | | | 173,803 | | | | 174,598 | | | | 180,474 | |
Diluted | | | 177,382 | | | | 175,943 | | | | 174,660 | | | | 174,598 | | | | 181,395 | |
| (1) | Operating results include the following by year (in thousands): |
| | | | | | | | | | | | | | | | | | | | |
| | | 2012 | | | 2011 | | | 2010 | | | 2009 | | | 2008 | |
After-tax restructuring costs and asset impairments | | $ | — | | | $ | — | | | $ | 92,835 | | | $ | 111,798 | | | $ | 20,988 | |
Goodwill impairments | | | — | | | | — | | | | — | | | | 264,140 | | | | — | |
After-tax net unauthorized activities in Japan | | | 7,172 | | | | 9,221 | | | | 17,128 | | | | 1,712 | | | | 3,007 | |
See Notes 3 and 6 of the Notes to Consolidated Financial Statements for a discussion of unauthorized activities in Japan, restructuring costs and asset impairments, respectively.
| (2) | Working capital is defined as current assets minus current liabilities. |
| (3) | Current ratio is defined as current assets divided by current liabilities. |
26
| Item 7. | Management’s Discussion and Analysis of Financial Condition and Results of Operations |
The following Management’s Discussion and Analysis of Financial Condition and Results of Operations contains forward-looking statements relating to future events or the future financial performance of Molex, which involve risks and uncertainties. Our actual results could differ materially from those anticipated in these forward-looking statements. Please see the discussion regarding forward-looking statements included under Item 1A, “Risk Factors” for a discussion of the uncertainties, risks and assumptions associated with these statements.
The following discussion should be read in conjunction with our consolidated financial statements and the related notes and other financial information appearing elsewhere in this Annual Report on Form 10-K. All references to fiscal years relate to the fiscal year ended June 30.
Overview
Our Business
Our core business is the manufacture and sale of electronic components. Our products are used by a large number of leading original equipment manufacturers (OEMs) throughout the world. We design, manufacture and sell more than 100,000 different products including terminals, connectors, planar cables, cable assemblies, interconnection systems, backplanes, integrated products and mechanical and electronic switches in 40 manufacturing locations in 16 countries. We also provide manufacturing services to integrate specific components into a customer’s product.
We have two global product segments: Connector and Custom & Electrical.
| | • | | The Connector segment designs and manufactures products for high-speed, high-density, high signal-integrity applications as well as fine-pitch, low-profile connectors for the consumer and commercial markets. It also designs and manufactures products that withstand environments such as heat, cold, dust, dirt, liquid and vibration for automotive and other transportation applications. |
| | • | | The Custom & Electrical segment designs and manufactures integrated and customizable electronic components, including connectors, across all industries that provide original, differentiated solutions to customer requirements. It also leverages expertise in the use of signal, power and interface technology in industrial automation and other harsh environment applications. |
We sell our products in five primary markets. Our connectors, interconnecting devices and assemblies are used principally in the telecommunications, infotech, consumer, industrial and automotive markets. Our products are used in a wide range of applications including notebook computers, computer peripheral equipment, mobile products such as smartphones and tablets, digital electronics such as cameras and televisions, gaming systems, automobile engine control units and adaptive braking systems, factory automation and diagnostic equipment.
27
Net revenue by market can fluctuate based on various factors including economic conditions, new technologies within the industry, composition of customers and changes in their net revenue or inventory levels and new products or model changes that we or our customers introduce. The following table sets forth, for fiscal 2012, 2011 and 2010, the percentage relationship to net revenue of our sales by primary markets:
| | | | | | | | | | | | |
| | | 2012 | | | 2011 | | | 2010 | |
Telecommunications | | | 23 | % | | | 25 | % | | | 25 | % |
Infotech | | | 26 | | | | 23 | | | | 22 | |
Consumer | | | 18 | | | | 19 | | | | 20 | |
Industrial | | | 13 | | | | 15 | | | | 14 | |
Automotive | | | 17 | | | | 15 | | | | 16 | |
Other | | | 3 | | | | 3 | | | | 3 | |
| | | | | | | | | | | | |
Total | | | 100 | % | | | 100 | % | | | 100 | % |
| | | | | | | | | | | | |
The following table sets forth, for fiscal 2012, 2011 and 2010, the percentage relationship to net revenue of our sales by geographic region:
| | | | | | | | | | | | |
| | | 2012 | | | 2011 | | | 2010 | |
Americas | | | 26.2 | % | | | 24.3 | % | | | 24.4 | % |
Asia-Pacific | | | 60.0 | | | | 61.3 | | | | 59.8 | |
Europe | | | 13.8 | | | | 14.4 | | | | 15.8 | |
| | | | | | | | | | | | |
Total | | | 100.0 | % | | | 100.0 | % | | | 100.0 | % |
| | | | | | | | | | | | |
The following table sets forth, for fiscal 2012, 2011 and 2010, the percentage relationship to net revenue of our sales by reporting segment:
| | | | | | | | | | | | |
| | | 2012 | | | 2011 | | | 2010 | |
Connector | | | 70.5 | % | | | 72.5 | % | | | 72.4 | % |
Custom & Electrical | | | 29.5 | | | | 27.5 | | | | 27.5 | |
Corporate & Other | | | — | | | | — | | | | 0.1 | |
| | | | | | | | | | | | |
Total | | | 100.0 | % | | | 100.0 | % | | | 100.0 | % |
| | | | | | | | | | | | |
We sell our products directly to OEMs and to their contract manufacturers and suppliers and, to a lesser extent, through distributors worldwide. Many of our customers are multi-national corporations that manufacture their products in multiple operations in several countries.
In fiscal 2012, 60.0% of our net revenue was derived from sales in the Asia-Pacific region, representing slower net revenue growth in the Asia-Pacific region and a decrease from 61.3% of net revenue in fiscal 2011. In prior years, we experienced faster net revenue growth in Asia, particularly in China, than in the Americas and Europe. We continue to expand our manufacturing operations in lower cost regions. Approximately 56.9% of our manufacturing capacity is in lower cost areas such as China, Eastern Europe and Mexico. In addition, reduced trade barriers and improved supply chain logistics have reduced our need to duplicate regional manufacturing capabilities. For these reasons, we have consolidated multiple plants of modest size and established a strategy of operating fewer, larger and more integrated facilities in select locations. We believe that our business is positioned to benefit from this strategy.
Business Environment
The market in which we operate is highly fragmented with a limited number of large companies and a significant number of smaller companies making electronic connectors. We are one of the
28
world’s largest manufacturers of electronic connectors. We believe that our global presence and our ability to design and manufacture our products throughout the world and to service our customers globally is a key advantage for us. Our growth has come primarily from new products that we develop, often in collaboration with our customers.
The markets in which we compete are highly competitive. Our financial results may be influenced by the following factors: our ability to successfully execute our business strategy; competition for customers; raw material prices; product and price competition; economic conditions in various geographic regions; foreign currency exchange rates; interest rates; changes in technology; fluctuations in customer demand; patent and intellectual property issues; availability of credit and general market liquidity; natural disasters; litigation results; investigations and legal proceedings and regulatory developments. Our ability to execute our business strategy successfully will require that we meet a number of challenges, including our ability to accurately forecast sales demand and calibrate manufacturing to such demand, manage volatile raw material costs, develop, manufacture and successfully market new and enhanced products and product lines, control operating costs, and attract, motivate and retain key personnel to manage our operational, financial and management information systems. Our sales are also dependent on end markets impacted by consumer, industrial and infrastructure spending, and our operating results can be adversely affected by reduced demand in these end markets.
Non-GAAP Financial Measures
Organic net revenue growth, which is included in Management’s Discussion and Analysis, is a non-GAAP financial measure. The tables presented in Results of Operations provide reconciliations of U.S. GAAP reported net revenue growth (the most directly comparable GAAP financial measure) to organic net revenue growth.
We believe organic net revenue growth provides useful information to investors because it reflects the underlying growth from the ongoing activities of our business and provides investors with a view of our operations from management’s perspective. We use organic net revenue growth to monitor and evaluate performance, since it is an important measure of the underlying results of our operations. It excludes items that are not completely under management’s control, such as the impact of changes in foreign currency exchange rates, and items that do not reflect the underlying growth of the company, such as acquisition activity. Management uses organic net revenue growth together with GAAP measures, such as net revenue and operating income in its decision making processes related to the operations of our reporting segments and our overall company. Because organic net revenue growth calculations may vary among other companies, organic net sales growth amounts presented below may not be comparable with similar measures of other companies.
Unauthorized Activities in Japan
As we previously reported in our fiscal 2010 Annual Report on Form 10-K, we launched an investigation into unauthorized activities at Molex Japan Co., Ltd. in April 2010. We learned that an individual working in Molex Japan’s finance group obtained unauthorized loans from third-party lenders, that included in at least one instance the attempted unauthorized pledge of Molex Japan facilities as security, in Molex Japan’s name that were used to cover losses resulting from unauthorized trading, including margin trading, in Molex Japan’s name. We also learned that the individual misappropriated funds from Molex Japan’s accounts to cover losses from unauthorized trading. The individual admitted to forging documentation in arranging and concealing the transactions. We retained outside legal counsel, and they retained forensic accountants, to investigate the matter. The investigation has been completed. Based on our consultation with legal counsel in Japan and the information learned from the investigation, we intend to vigorously contest the enforceability of the outstanding unauthorized loans and any attempt by the lender to obtain payment.
As previously reported in our Annual Report on Form 10-K for the year ended June 30, 2010, based on the results of the completed investigation, we recorded for accounting purposes an accrued
29
liability for the effect of unauthorized activities pending the resolution of these matters including the legal proceedings reported in Note 20 of the Notes to Consolidated Financial Statements.
We believe these unauthorized activities and related losses occurred from at least as early as 1988 through 2010. The accrued liability for these unauthorized activities was $184.2 million as of June 30, 2012, including $18.4 million in cumulative foreign currency translation, which was recorded as a component of accumulated other comprehensive income. To the extent we prevail in not having to pay all or any portion of the unauthorized loans ($165.8 million), we would recognize a gain. In addition, we have a contingent liability of $58.1 million for other loan-related expenses, interest expense and delay damages on the outstanding unauthorized loans.
Unauthorized activities in Japan for fiscal years ended June 30, 2012 and 2011 represent investigative and legal fees.
Financial Highlights
Net revenue and income from operations for fiscal 2012 decreased slightly compared with fiscal 2011 due primarily to global economic uncertainty and lower end customer demand. Net revenue for fiscal 2012 of $3.5 billion decreased $98.1 million, or 2.8%, from fiscal 2011. Organic net revenue decreased $168.4 million, or 4.7%, in fiscal 2012 compared with fiscal 2011. Income from operations for fiscal 2012 of $399.5 million decreased $30.7 million, or 7.1%, compared with fiscal 2011. We recognized net income of $281.4 million in fiscal 2012 compared with net income of $298.8 million in fiscal 2011. Fiscal 2012 results include a net loss on unauthorized activities in Japan of $11.3 million ($7.2 million after-tax). Fiscal 2011 results include a net loss on unauthorized activities in Japan of $14.5 million ($9.2 million after-tax).
Results of Operations
The following table sets forth, for fiscal 2012, 2011 and 2010, certain consolidated statements of operations data as a percentage of net revenue (dollars in thousands):
| | | | | | | | | | | | | | | | | | | | | | | | |
| | | 2012 | | | Percentage of
Net Revenue | | | 2011 | | | Percentage of
Net Revenue | | | 2010 | | | Percentage of
Net Revenue | |
Net revenue | | $ | 3,489,189 | | | | 100.0 | % | | $ | 3,587,334 | | | | 100.0 | % | | $ | 3,007,207 | | | | 100.0 | % |
Cost of sales | | | 2,420,726 | | | | 69.4 | % | | | 2,499,197 | | | | 69.7 | % | | | 2,114,584 | | | | 70.3 | % |
| | | | | | | | | | | | | | | | | | | | | | | | |
Gross profit | | | 1,068,463 | | | | 30.6 | % | | | 1,088,137 | | | | 30.3 | % | | | 892,623 | | | | 29.7 | % |
Selling, general & administrative | | | 657,732 | | | | 18.9 | % | | | 643,462 | | | | 17.9 | % | | | 610,784 | | | | 20.3 | % |
Restructuring costs and asset impairments | | | — | | | | — | % | | | — | | | | — | % | | | 117,139 | | | | 3.9 | % |
Unauthorized activities in Japan | | | 11,259 | | | | 0.3 | % | | | 14,476 | | | | 0.4 | % | | | 26,898 | | | | 0.9 | % |
Goodwill impairments | | | — | | | | — | % | | | — | | | | — | % | | | — | | | | — | % |
| | | | | | | | | | | | | | | | | | | | | | | | |
Income from operations | | | 399,472 | | | | 11.4 | % | | | 430,199 | | | | 12.0 | % | | | 137,802 | | | | 4.6 | % |
Other income (expense), net | | | 795 | | | | — | % | | | (260 | ) | | | — | % | | | (6,313 | ) | | | (0.2 | )% |
| | | | | | | | | | | | | | | | | | | | | | | | |
Income before income taxes | | | 400,267 | | | | 11.5 | % | | | 429,939 | | | | 12.0 | % | | | 131,489 | | | | 4.4 | % |
Income taxes | | | 118,890 | | | | 3.4 | % | | | 131,131 | | | | 3.7 | % | | | 54,559 | | | | 1.8 | % |
| | | | | | | | | | | | | | | | | | | | | | | | |
Net income | | $ | 281,377 | | | | 8.1 | % | | $ | 298,808 | | | | 8.3 | % | | $ | 76,930 | | | | 2.6 | % |
| | | | | | | | | | | | | | | | | | | | | | | | |
30
Net Revenue
The following table provides an analysis of the change in net revenue compared with the prior fiscal year (in thousands):
| | | | | | | | |
| | | 2012 | | | 2011 | |
Net revenue for prior year | | $ | 3,587,334 | | | $ | 3,007,207 | |
Components of net revenue increase: | | | | | | | | |
Organic net revenue change | | | (168,385 | ) | | | 488,123 | |
Currency translation | | | 57,777 | | | | 82,742 | |
Acquisitions | | | 12,463 | | | | 9,262 | |
| | | | | | | | |
Total change in net revenue from prior year | | | (98,145 | ) | | | 580,127 | |
| | | | | | | | |
Net revenue for current year | | $ | 3,489,189 | | | $ | 3,587,334 | |
| | | | | | | | |
Organic net revenue change as a percentage of net revenue for prior year | | | (4.7 | )% | | | 16.2 | % |
Net revenue decreased during fiscal 2012 compared with fiscal 2011 as end customer demand slowed due to global economic uncertainties. The decrease in net revenue was partially offset by currency translation due to a general weakening of the U.S. dollar against most currencies except the euro. We completed asset acquisitions of a specialty wire and cable company during the second quarter of fiscal 2012 and an active optical cable business during the third quarter of fiscal 2011.
The increase in net revenue attributed to currency translation in fiscal 2011 compared with fiscal 2010 was principally due to a stronger Japanese yen and weaker U.S. dollar against most currencies except the euro. The following tables show the effect on the change in geographic net revenue from foreign currency translations to the U.S. dollar (in thousands):
| | | | | | | | | | | | | | | | | | | | | | | | |
| | | June 30, 2012 | | | June 30, 2011 | |
| | | Local
Currency | | | Currency
Translation | | | Net
Change | | | Local
Currency | | | Currency
Translation | | | Net
Change | |
Americas | | $ | 40,202 | | | $ | 157 | | | $ | 40,359 | | | $ | 136,321 | | | $ | 1,073 | | | $ | 137,394 | |
Asia-Pacific | | | (160,831 | ) | | | 58,963 | | | | (101,868 | ) | | | 301,824 | | | | 96,776 | | | | 398,600 | |
Europe | | | (34,758 | ) | | | (1,343 | ) | | | (36,101 | ) | | | 59,427 | | | | (15,107 | ) | | | 44,320 | |
Corporate & Other | | | (535 | ) | | | — | | | | (535 | ) | | | (187 | ) | | | — | | | | (187 | ) |
| | | | | | | | | | | | | | | | | | | | | | | | |
Net change | | $ | (155,922 | ) | | $ | 57,777 | | | $ | (98,145 | ) | | $ | 497,385 | | | $ | 82,742 | | | $ | 580,127 | |
| | | | | | | | | | | | | | | | | | | | | | | | |
The change in net revenue by geographic region on a local currency basis as of June 30 follows:
| | | | | | | | |
| | | 2012 | | | 2011 | |
Americas | | | 4.6 | % | | | 18.5 | % |
Asia-Pacific | | | (7.3 | ) | | | 21.0 | |
Europe | | | (6.7 | ) | | | 12.5 | |
| | | | | | | | |
Total | | | (4.3 | )% | | | 16.5 | % |
| | | | | | | | |
Net revenue declined in fiscal 2012 compared with fiscal 2011 primarily due to the Asia-Pacific and Europe regions. Slower economic growth in China and uncertainties about economic stability in Europe led to net revenue declines in those regions during fiscal 2012. In prior years, we experienced faster net revenue growth in Asia, particularly China, than the other regions. Net revenue in fiscal 2011 increased in all three regions compared with fiscal 2010 as overall customer demand improved over the prior year.
Net revenue in fiscal 2012 declined compared with fiscal 2011 as global economic uncertainty affected end demand, particularly in our consumer, telecommunications and industrial markets, and
31
our customers managed inventory lower. The decline in net revenue in fiscal 2012 was partially offset by increased demand in our infotech and automotive markets. Net revenue increased across all five primary markets in fiscal 2011 compared with fiscal 2010 as customer demand improved over the prior year. The following table sets forth, for fiscal 2012 and 2011, changes in net revenue from each of our five primary product markets from the prior fiscal year:
| | | | | | | | |
| | | 2012 | | | 2011 | |
Telecommunications | | | (10 | )% | | | 21 | % |
Infotech | | | 5 | | | | 24 | |
Consumer | | | (6 | ) | | | 12 | |
Industrial | | | (9 | ) | | | 23 | |
Automotive | | | 7 | | | | 16 | |
Telecommunications market net revenue decreased in fiscal 2012 compared with fiscal 2011 due to decreases in demand for certain mobile products, partially offset by increased infrastructure spending on networking. Telecommunications market net revenue increased in fiscal 2011 compared with fiscal 2010 due to higher infrastructure spending and increased demand for mobile products, including higher demand for smartphones and our customers’ introduction of smartphone models with higher connector content.
Infotech market net revenue increased in fiscal 2012 compared with fiscal 2011 due to increased content and demand for tablet devices and servers, partially offset by slower demand for notebook computers. Infotech market net revenue increased in fiscal 2011 compared with fiscal 2010 primarily due to increased content and demand for servers, data storage, notebook computers and tablet devices.
Consumer market net revenue decreased in fiscal 2012 compared with fiscal 2011 due to economic uncertainty leading to lower demand in home entertainment, including lower demand for our components in televisions, and supply chain disruptions caused by the floods in Thailand during the second quarter of fiscal 2012. Decreases in consumer market net revenue were partially offset by increased net revenue in gaming equipment. Consumer market net revenue increased in fiscal 2011 compared with fiscal 2010 primarily due to increased demand for our components in televisions, digital cameras and home appliances, as well as expansion into the non-connector audio accessories market, partially offset by reduced demand in gaming equipment.
Industrial market net revenue decreased in fiscal 2012 compared with fiscal 2011 due to softening demand for semiconductor and production equipment from our customers’ decreased production, companies’ reluctance to invest in automation projects or deferral of projects in the current economic environment and relatively high levels of inventory in the distribution channel. Industrial market net revenue in fiscal 2011 increased compared with fiscal 2010 due to higher demand for our connectors in semiconductor and other production equipment as our customers increased production to meet demand.
Automotive market net revenue increased in fiscal 2012 compared with fiscal 2011 due to higher global automobile production, particularly in North America and Japan, and increasing electronic content in automobiles, such as navigational and entertainment systems, mobile communication and products to improve fuel efficiency. Automotive market net revenue for fiscal 2011 increased compared with fiscal 2010 due to increased automobile production levels in the United States and China.
Gross Profit
We measure gross profit as net revenue less cost of sales. Cost of sales includes manufacturing costs, such as materials, direct and indirect labor, and factory overhead. Our gross margins are primarily affected by the following factors: product mix; volume; cost reduction efforts; competitive pricing pressure; commodity costs and currency fluctuations.
32
The following table sets forth gross profit and gross margin for fiscal 2012, 2011 and 2010 (dollars in thousands):
| | | | | | | | | | | | |
| | | 2012 | | | 2011 | | | 2010 | |
Gross profit | | $ | 1,068,463 | | | $ | 1,088,137 | | | $ | 892,623 | |
Gross margin | | | 30.6 | % | | | 30.3 | % | | | 29.7 | % |
The decrease in gross profit during fiscal 2012 was due to lower net revenue. Despite the lower net revenue, gross margin improved during fiscal 2012 due to a favorable mix of product sales and rigorous control over costs, including reduced freight expense.
The increase in gross profit and gross margin during fiscal 2011 was primarily due to increased net revenue. Gross margins have improved over time due to lower costs resulting from our restructuring program. The improvements in gross margin were partially offset by the impact of price erosion and material price increases.
A significant portion of our material cost consists of copper and gold costs. We purchased approximately 20 million pounds of copper and 108,000 troy ounces of gold in fiscal 2012 compared with approximately 22 million pounds of copper and 125,000 troy ounces of gold in fiscal 2011 and approximately 23 million pounds of copper and 112,000 troy ounces of gold in fiscal 2010.
The following table sets forth the average prices of copper and gold we purchased in fiscal 2012, 2011 and 2010:
| | | | | | | | | | | | |
| | | 2012 | | | 2011 | | | 2010 | |
Copper (price per pound) | | $ | 3.73 | | | $ | 3.88 | | | $ | 3.04 | |
Gold (price per troy ounce) | | | 1,670.00 | | | | 1,363.00 | | | | 1,096.00 | |
Generally, we are able to pass through to our customers only a small a portion of the changes in the cost of copper and gold. However, we mitigated the impact of the change in copper and gold prices by hedging with call options a portion of our projected net global purchases of copper and gold. The hedges reduced cost of sales by $6.7 million, $7.1 million and $5.1 million in fiscal 2012, 2011 and 2010, respectively.
In addition to commodity costs, the following table sets forth, for fiscal 2012, 2011 and 2010 the effects of certain significant impacts on gross profit from the prior year (in thousands):
| | | | | | | | | | | | |
| | | 2012 | | | 2011 | | | 2010 | |
Price erosion | | $ | (66,270 | ) | | $ | (102,563 | ) | | $ | (139,232 | ) |
Currency translation | | | 21,951 | | | | 37,958 | | | | 23,928 | |
Currency transaction | | | (35,099 | ) | | | (57,763 | ) | | | (22,076 | ) |
Price erosion measures the reduction in prices of our products year over year, which reduces our gross profit. Price erosion as a percent of net revenue was 1.9%, 2.8% and 4.5% in fiscal 2012, 2011 and 2010, respectively. Price erosion decreased in fiscal 2012 and 2011 compared with the prior year periods due primarily to the implementation of pricing software that provides enhanced visibility to recoverable costs and improved detail of profit margin by product.
The increase in gross profit due to currency translation gains in fiscal 2012 was primarily due to a general weakening of the U.S. dollar against most currencies except the euro. The increase in gross profit due to currency translation gains in fiscal 2011 was primarily due to a stronger Japanese yen against other currencies and a weaker U.S. dollar against most currencies except the euro. The increase in gross profit due to currency translation gains in fiscal 2010 was primarily due to stronger Asian currencies.
Certain products we manufacture in Japan and Europe are sold in other regions of the world at selling prices primarily denominated in or closely linked to the U.S. dollar. As a result, changes in currency exchange rates may affect our cost of sales reported in U.S. dollars without a corresponding
33
effect on net revenue. The decrease in gross profit due to currency transactions in fiscal 2012 and 2011 was primarily due to a stronger Japanese yen and a weaker U.S. dollar against most currencies. The decrease in gross profit due to currency transactions in fiscal 2010 was primarily due to a general weakening of the U.S. dollar against other currencies except the euro.
Operating Expenses
The following table sets forth our operating expenses for fiscal 2012, 2011 and 2010 (dollars in thousands):
| | | | | | | | | | | | |
| | | 2012 | | | 2011 | | | 2010 | |
Selling, general & administrative | | $ | 657,732 | | | $ | 643,462 | | | $ | 610,784 | |
Selling, general & administrative as a percentage of net revenue | | | 18.9 | % | | | 17.9 | % | | | 20.3 | % |
Restructuring costs and asset impairments | | | — | | | | — | | | | 117,139 | |
Unauthorized activities in Japan | | | 11,259 | | | | 14,476 | | | | 26,898 | |
Selling, General & Administrative Expenses
Selling, general and administrative expenses increased $14.3 million and $32.7 million in fiscal 2012 and fiscal 2011 compared with the prior year periods, respectively. Selling, general and administrative expenses increased primarily due to foreign currency translation and investments in research and development to penetrate new markets, acquire new customers and drive future growth. The impact of currency translation increased selling, general and administrative expenses by approximately $9.0 million for fiscal 2012 compared with fiscal 2011 and increased selling, general and administrative expenses by approximately $12.7 million for fiscal 2011 compared with fiscal 2010. Selling, general, and administrative expenses in fiscal 2012 were reduced by $8.0 million for property insurance proceeds for damages from the earthquake and tsunami in Japan that occurred during the third quarter of fiscal 2011. Selling, general and administrative expenses decreased as a percentage of net revenue in fiscal 2011 compared with fiscal 2010 primarily due to efforts to control spending as net revenue increased from the prior year.
Research and development expenditures, which are classified as selling, general and administrative expenses, were $181.1 million, or 5.2% of net revenue, for fiscal 2012 compared with $170.1 million, or 4.7% of net revenue, for fiscal 2011 and $154.0 million, or 5.1% of net revenue, for fiscal 2010. Research and development expense increased in fiscal 2012 and 2011 compared with the prior year periods as we made strategic investments in developing future technology innovations.
Restructuring Costs and Asset Impairments
Restructuring costs and asset impairments consist of the following (in thousands):
| | | | |
| | | 2010 | |
Severance costs | | $ | 79,609 | |
Asset impairments | | | 37,296 | |
| | | | |
Restructuring costs | | | 116,905 | |
Intangible asset impairments | | | 234 | |
| | | | |
Total restructuring charges and asset impairments | | $ | 117,139 | |
| | | | |
During fiscal 2007, we undertook a multi-year restructuring plan designed to reduce costs and to improve return on invested capital in connection with a new global organization that was effective July 1, 2007. A majority of the plan related to facilities located in North America, Europe and Japan and, in general, the movement of manufacturing activities at these plants to other lower-cost facilities. We completed our restructuring program on June 30, 2010.
34
In fiscal 2010, we recognized net restructuring costs related to employee severance and benefit arrangements for approximately 1,000 employees, resulting in a charge of $79.6 million. A large part of these employee terminations resulted from plant closings in Europe. We recognized asset impairment charges of $37.3 million to write-down assets to fair value less the cost to sell.
The timing of the cash expenditures associated with these charges does not necessarily correspond to the period in which the accounting charge is taken. For additional information concerning the status of our restructuring programs see Note 6 of the Notes to Consolidated Financial Statements.
Unauthorized Activities in Japan
Unauthorized activities in Japan for fiscal 2012 and 2011 represent investigative and legal fees. See Note 3 of the Notes to Consolidated Financial Statements for accounting treatment of the accrual for unauthorized activities in Japan.
Other Income (Expense), net
Other income (expense) consists primarily of net interest expense, investment income, and currency exchange gains or losses. We recorded other income of $0.8 million during fiscal 2012 compared with $0.3 million of other expense during fiscal 2011. Fluctuations in other income (expense) are primarily due to changes in currency gains and losses.
Effective Tax Rate
The effective tax rate for the fiscal years ended June 30, follows:
| | | | | | | | | | | | |
| | | 2012 | | | 2011 | | | 2010 | |
Effective tax rate | | | 29.7 | % | | | 30.5 | % | | | 41.5 | % |
The effective tax rate was 29.7%, 30.5% and 41.5% for fiscal 2012, 2011 and 2010, respectively. The effective tax rate for fiscal 2010 was higher than fiscal 2012 and 2011 due to (1) income tax expense recorded during the year of $7.7 million, due primarily to the reversal of an estimated tax benefit resulting from a significant number of employee stock options that expired unexercised, (2) a charge due to legislation passed during fiscal 2010 which includes a provision that reduces the deductibility, for Federal income tax purposes, of retiree prescription drug benefits to the extent they are reimbursed under Medicare Part D, (3) tax losses generated in non-U.S. jurisdictions for which no tax benefit has been recognized, and (4) additional U.S. tax cost to repatriate earnings from non-US subsidiaries during the year.
Deferred tax assets and liabilities are recognized based on differences between the financial statement and tax bases of assets and liabilities using presently enacted tax rates. We had net deferred tax assets of $160.8 million at June 30, 2012.
Results by Product Segment
Connector. The following table sets forth the change in net revenue for the Connector segment for fiscal 2012 and 2011 (dollars in thousands):
| | | | | | | | |
| | | 2012 | | | 2011 | |
Net revenue for prior year | | $ | 2,600,469 | | | $ | 2,177,014 | |
Components of net revenue increase: | | | | | | | | |
Organic net revenue change | | | (194,483 | ) | | | 350,905 | |
Currency translation | | | 53,983 | | | | 72,550 | |
| | | | | | | | |
Total change in net revenue from prior year | | | (140,500 | ) | | | 423,455 | |
| | | | | | | | |
Net revenue for current year | | $ | 2,459,969 | | | $ | 2,600,469 | |
| | | | | | | | |
Organic net revenue change as a percentage of net revenue for prior year | | | (7.5 | )% | | | 16.1 | % |
35
The Connector segment sells primarily to the telecommunications, infotech, consumer and automotive markets, which are discussed above. Segment organic net revenue decreased during fiscal 2012 compared with the prior year period due to slower customer demand, particularly in the telecommunications and consumer markets, partially offset by increased net revenue in the automotive market. Segment organic net revenue increased in fiscal 2011 compared with the prior year periods due to increased demand in all of the Connector segment’s primary markets, partially offset by price erosion. Price erosion, which is generally higher in the Connector segment compared with our other segments, was 2.9% and 3.3% in fiscal 2012 and 2011, respectively.
The following table sets forth information on income from operations and operating margins for the Connector segment for fiscal 2012, 2011 and 2010 (dollars in thousands):
| | | | | | | | | | | | |
| | | 2012 | | | 2011 | | | 2010 | |
Income from operations | | $ | 344,387 | | | $ | 396,233 | | | $ | 123,980 | |
Operating margin | | | 14.0 | % | | | 15.2 | % | | | 5.7 | % |
Connector segment income from operations declined in fiscal 2012 compared with fiscal 2011 primarily due to lower net revenue and higher gold and resin costs. We adjusted prices to partially offset rising material costs and minimize the impact of price erosion on gross profit and gross margin. Lower production levels due to decreasing customer demand also led to lower absorption of our fixed costs. Selling, general and administrative expenses for fiscal 2012 were consistent with fiscal 2011 as insurance proceeds for damages related to the earthquake and tsunami in Japan principally offset increases in investments in research and development and foreign currency translation. Foreign currency translation increased selling, general and administrative expenses $14.6 million during fiscal 2012 compared with fiscal 2011 primarily due to a weakening of the U.S. dollar against most currencies except the euro.
Connector segment income from operations increased in fiscal 2011 compared with fiscal 2010 primarily due to increased net revenue and completion of our restructuring program on June 30, 2010. Gross margins were positively impacted from lower costs from our restructuring program, which has improved margins over time. Connector segment income from operations also improved in fiscal 2011 due to controlled selling, general and administrative costs in a period of increased net revenue. Selling, general and administrative expenses were $368.4 million, or 14.2% of net revenue, for fiscal 2011 compared with $347.6 million, or 16.0% of net revenue, for fiscal 2010, due to efficiencies gained from restructuring and specific cost-containment actions.
Custom & Electrical. The following table sets forth net revenue for fiscal 2012 and 2011 (dollars in thousands):
| | | | | | | | |
| | | 2012 | | | 2011 | |
Net revenue for prior year | | $ | 985,120 | | | $ | 828,905 | |
Components of net revenue increase: | | | | | | | | |
Organic net revenue change | | | 26,774 | | | | 136,757 | |
Currency translation | | | 3,783 | | | | 10,196 | |
Acquisitions | | | 12,463 | | | | 9,262 | |
| | | | | | | | |
Total change in net revenue from prior year | | | 43,020 | | | | 156,215 | |
| | | | | | | | |
Net revenue for current year | | $ | 1,028,140 | | | $ | 985,120 | |
| | | | | | | | |
Organic net revenue change growth as a percentage of net revenue for prior year | | | 2.7 | % | | | 16.5 | % |
The Custom & Electrical segment sells primarily to the industrial, telecommunications and infotech markets. Custom & Electrical segment net revenue exceeded $1.0 billion in fiscal 2012 and organic net revenue increased in fiscal 2012 compared with fiscal 2011 due to increased demand in the infotech market. Segment organic net revenue increased in fiscal 2011 compared with fiscal 2010 due to
36
increased demand in all of the segment’s primary markets. We completed asset acquisitions of a specialty wire and cable company during the second quarter of fiscal 2012 and an active optical cable business during the third quarter of fiscal 2011.
The following table sets forth income from operations and operating margins for the Custom & Electrical segment for fiscal 2012, 2011 and 2010 (dollars in thousands):
| | | | | | | | | | | | |
| | | 2012 | | | 2011 | | | 2010 | |
Income from operations | | $ | 172,803 | | | $ | 154,370 | | | $ | 111,083 | |
Operating margin | | | 16.8 | % | | | 15.7 | % | | | 13.4 | % |
Custom & Electrical segment income from operations increased during fiscal 2012 compared with fiscal 2011 due to increased net revenue, favorable mix of product sales and higher absorption, partially offset by increased investments in our global sales and marketing organization and research and development to penetrate new markets, acquire customers and drive future growth. Selling, general and administrative expenses decreased as a percent of net revenue in fiscal 2012 compared with fiscal 2011 as costs were controlled despite the increase in net revenue.
Custom & Electrical segment income from operations increased in fiscal 2011 compared with fiscal 2010 primarily due to increased net revenue and completion of our restructuring program on June 30, 2010. Gross margins were positively impacted from lower costs from our restructuring program, which has improved margins over time. Income from operations also improved in fiscal 2011 due to controlled selling, general and administrative costs in a period of increased net revenue. Selling, general and administrative expenses were $169.6 million, or 17.2% of net revenue, for fiscal 2011 compared with $168.5 million, or 20.2% of net revenue, for fiscal 2010, due to efficiencies gained from restructuring and specific cost-containment actions.
Financial Condition and Liquidity
We fund capital projects and working capital needs principally out of operating cash flows and cash reserves. Cash, cash equivalents and marketable securities totaled $652.2 million and $546.5 million at June 30, 2012 and 2011, respectively. Cash, cash equivalents and marketable securities as of June 30, 2012 included approximately $617.9 million in non-U.S. accounts, including $209.1 million in countries where we may experience administrative delays in withdrawing and transferring cash to U.S. accounts. Transferring cash, cash equivalents or marketable securities to U.S. accounts from non-U.S. accounts could subject us to additional U.S. repatriation income tax. The primary source of our cash flow is generated by operations. Principal uses of cash are capital expenditures, dividend payments and business investments. Our long-term financing strategy is to primarily rely on internal sources of funds for investing in plant, equipment and acquisitions.
On August 18, 2011, we issued senior notes totaling $150.0 million through a private placement of debt (the Private Placement). The Private Placement consists of three $50.0 million series notes: Series A with an interest rate of 2.91% matures on August 18, 2016; Series B with an interest rate of 3.59% matures on August 18, 2018; and Series C with an interest rate of 4.28% matures on August 18, 2021. The Note Purchase Agreement requires us to maintain financial covenants pertaining to, among other things, our consolidated leverage and interest rate coverage. As of June 30, 2012, we were in compliance with these covenants.
In June 2009, we entered into a $195.0 million unsecured, three-year revolving credit facility in the United States that was initially scheduled to mature in June 2012 (the “U.S. Credit Facility”). We amended the U.S. Credit Facility in January 2010, September 2010 and March 2011. In connection with the September 2010 amendment, we increased the credit line on the U.S. Credit Facility to $270.0 million. In March 2011, we amended the credit facility to increase the credit line to $350.0 million and extend the term to March 2016.
Total debt, including obligations under capital leases totaled $255.0 million and $342.6 million at June 30, 2012 and 2011, respectively. We had available lines of credit totaling $444.4 million at
37
June 30, 2012, including $350.0 million available under the U.S. Credit Facility as of June 30, 2012. The U.S. Credit Facility also requires us to maintain financial covenants pertaining to, among other things, our consolidated leverage and fixed charge coverage. As of June 30, 2012, we were in compliance with these covenants. Additionally, we have three unsecured borrowing agreements in Japan totaling ¥8.0 billion ($100.2 million) as of June 30, 2012, with weighted average fixed interest rates of 1.8%. See Note 13 of the Notes to Consolidated Financial Statements.
Cash Flows
Below is a table setting forth the key lines of our Consolidated Statements of Cash Flows (in thousands):
| | | | | | | | | | | | |
| | | 2012 | | | 2011 | | | 2010 | |
Cash provided from operating activities | | $ | 573,719 | | | $ | 466,151 | | | $ | 250,579 | |
Cash used for investing activities | | | (227,695 | ) | | | (270,709 | ) | | | (216,871 | ) |
Cash used for financing activities | | | (226,282 | ) | | | (77,191 | ) | | | (83,236 | ) |
Effect of exchange rate changes on cash | | | (14,924 | ) | | | 37,996 | | | | 1,173 | |
| | | | | | | | | | | | |
Net increase (decrease) in cash and cash equivalents | | $ | 104,818 | | | $ | 156,247 | | | $ | (48,355 | ) |
| | | | | | | | | | | | |
Operating Activities
Cash provided from operating activities in fiscal 2012 increased by $107.6 million from the prior year due primarily to a $144.5 million decrease in working capital needs in fiscal 2012 as receivables decreased due to improved collections and lower net revenue. Working capital is defined as current assets minus current liabilities. Net inventory levels were controlled, but increased slightly from fiscal 2011 excluding the impact of foreign currency exchange.
Cash provided from operating activities in fiscal 2011 increased $215.6 million from fiscal 2010 due primarily to an increase in net income in fiscal 2011 compared with fiscal 2010 and completion of our restructuring program on June 30, 2010.
Investing Activities
Cash used for investing activities decreased by $43.0 million due to decreased investment in capital expenditures in fiscal 2012 compared with fiscal 2011, $11.0 million of proceeds from the sale of an investment during fiscal 2012 and $8.0 million of insurance proceeds for damages from the earthquake and tsunami in Japan. The decrease was partially offset by net purchases of marketable securities in fiscal 2012 compared with net sales of marketable securities in fiscal 2011.
Capital expenditures decreased $35.1 million during fiscal 2012 due to project delays related to lower demand and production. Capital expenditures increased $32.8 million during fiscal 2011 compared with fiscal 2010 as demand and production increased.
We had $2.4 million in net purchases of marketable securities during fiscal 2012 compared with $3.6 million in net sales of marketable securities during fiscal 2011. We had $25.5 million net purchases of marketable securities in fiscal 2010. Our marketable securities generally have a term of less than one year. Our investments in marketable securities are primarily based on our uses of cash in operating, other investing and financing activities.
Financing Activities
Cash used for financing activities increased $149.1 million during fiscal 2012 compared with fiscal 2011 primarily due to net payments on the revolving credit facility and long-term debt compared with net borrowings in fiscal 2011 and an increase in quarterly cash dividends paid during fiscal 2012.
38
We issued senior notes totaling $150.0 million in fiscal 2012. Proceeds were used to pay down a portion of our $350.0 million unsecured, five-year revolving U.S. Credit Facility. Net payments against the U.S. Credit Facility during the twelve months ended June 30, 2012 were $185.0 million compared to net borrowings of $85.0 million in the prior year period. There were no outstanding borrowings against the U.S. Credit Facility as of June 30, 2012.
We increased our cash dividend during the fourth quarter of fiscal 2011 to $0.20 per share, an increase of 14.3% from the previous quarterly cash dividend of $0.175 per share. The increase was effective to shareholders of record on June 30, 2011. During fiscal 2011, we increased our quarterly cash dividend to $0.175 per share, an increase of 14.8% from the previous quarterly cash dividend of $0.1525 per share in fiscal 2010. The increase was effective to shareholders of record on December 31, 2010.
Additionally, we increased our cash dividend again during the fourth quarter of fiscal 2012 to $0.22 per share, which was effective to shareholders of record on June 30, 2012.
Sources of Liquidity
We believe we have sufficient cash balances, cash flow and available credit lines to support our planned growth. As part of our growth strategy, we may, in the future, acquire other companies in the same or complementary lines of business, and pursue other business ventures. The timing and size of any new business ventures or acquisitions we complete may affect our cash requirements and debt balances. To the extent we are required to pay all or any portion of the unauthorized loans in Molex Japan, our cash requirements may also be affected.
Total debt consisted of the following at June 30:
| | | | | | | | | | | | | | | | |
| | | Average
Interest
Rate | | | Calendar
Year
Maturity | | | 2012 | | | 2011 | |
Long-term debt: | | | | | | | | | | | | | | | | |
Private Placement | | | 2.91 - 4.28 | % | | | 2016 - 2021 | | | $ | 150,000 | | | $ | — | |
U.S. Credit Facility | | | 1.75 | % | | | 2016 | | | | — | | | | 185,000 | |
Unsecured bonds and term loans | | | 1.31 - 1.65 | % | | | 2012 - 2013 | | | | 37,556 | | | | 89,342 | |
Mortgages, industrial development bonds and other debt | | | Varies | | | | 2012 - 2013 | | | | 1,091 | | | | 1,528 | |
| | | | | | | | | | | | | | | | |
Total long-term debt | | | | | | | | | | | 188,647 | | | | 275,870 | |
Less current portion of long-term debt: | | | | | | | | | | | | | | | | |
Unsecured bonds and term loans | | | 1.31 - 1.65 | % | | | | | | | 37,556 | | | | 52,156 | |
Mortgages, industrial development bonds and other debt | | | Varies | | | | | | | | 1,059 | | | | 920 | |
| | | | | | | | | | | | | | | | |
Long-term debt, less current portion | | | | | | | | | | | 150,032 | | | | 222,794 | |
Short-term borrowings | | | | | | | | | | | | | | | | |
Overdraft loan | | | 1.98 | % | | | 2012 | | | | 62,645 | | | | 62,060 | |
Other short-term borrowings | | | Varies | | | | | | | | 3,673 | | | | 4,628 | |
| | | | | | | | | | | | | | | | |
Total short-term borrowings | | | | | | | | | | | 66,318 | | | | 66,688 | |
| | | | | | | | | | | | | | | | |
Total debt | | | | | | | | | | $ | 254,965 | | | $ | 342,558 | |
| | | | | | | | | | | | | | | | |
On August 18, 2011, we issued senior notes totaling $150.0 million through an unregistered, private placement of debt (the Private Placement). The Private Placement consists of three $50.0 million series notes: Series A with an interest rate of 2.91% matures on August 18, 2016; Series B with an interest rate of 3.59% matures on August 18, 2018; and Series C with an interest rate of 4.28% matures on August 18, 2021. The Note Purchase Agreement contains customary covenants regarding
39
liens, debt, substantial asset sales and mergers. The Note Purchase Agreement also requires us to maintain financial covenants pertaining to, among other things, our consolidated leverage and interest rate coverage. As of June 30, 2012, we were in compliance with these covenants and the balance of the senior notes was $150.0 million.
In June 2009, we entered into a $195.0 million unsecured, three-year revolving credit facility in the United States, amended in January 2010, September 2010 and March 2011, that was initially scheduled to mature in June 2012 (the U.S. Credit Facility). In connection with the September 2010 amendment, we increased the credit line on the U.S. Credit Facility to $270.0 million. In March 2011, we further amended the U.S. Credit Facility to increase the credit line to $350.0 million and extend the term to March 2016. Borrowings under the U.S. Credit Facility bear interest at a fluctuating interest rate (based on London InterBank Offered Rate) plus an applicable percentage based on our consolidated leverage. The applicable percentage was 150 basis points as of June 30, 2012. The instrument governing the U.S. Credit Facility contains customary covenants regarding liens, debt, substantial asset sales and mergers, dividends and investments. The U.S. Credit Facility also requires us to maintain financial covenants pertaining to, among other things, our consolidated leverage and fixed charge coverage. As of June 30, 2012, we were in compliance with these covenants and had no outstanding borrowings.
In March 2012, Molex Japan renewed a ¥5.0 billion overdraft loan, with a six month term and an interest rate of approximately 1.98%. At June 30, 2012, the balance of the overdraft loan, which requires full repayment by the end of the term if not renewed, approximated $62.6 million.
In March 2010, Molex Japan entered into a ¥3.0 billion syndicated term loan for three years, with interest rates equivalent to six month Tokyo InterBank Offered Rate (TIBOR) plus 75 basis points and scheduled principal payments of ¥0.5 billion every six months (Syndicated Term Loan). At June 30, 2012, the balance of the syndicated term loan approximated $12.5 million, which is classified as current.
In September 2009, Molex Japan issued unsecured bonds totaling ¥10.0 billion with a term of three years, an interest rate of approximately 1.65% and scheduled principal payments of ¥1.6 billion every six months. At June 30, 2012, the outstanding balance of the unsecured bonds approximated $25.1 million, which is classified as current.
Certain assets, including land, buildings and equipment, secure a portion of our long-term debt. Principal payments on long-term debt obligations are due as follows as of June 30, 2012 (in thousands):
| | | | |
Year one | | $ | 38,615 | |
Year two | | | 32 | |
Year three | | | — | |
Year four | | | — | |
Year five | | | 50,000 | |
Thereafter | | | 100,000 | |
| | | | |
Total long-term debt obligations | | $ | 188,647 | |
| | | | |
We had available lines of credit totaling $444.4 million at June 30, 2012, including $350.0 million available on the U.S. Credit Facility. The lines of credit expire between 2012 and 2016.
40
Contractual Obligations and Commercial Commitments
The following table summarizes our significant contractual obligations at June 30, 2012, and the effect such obligations are expected to have on liquidity and cash flows in future periods (in thousands):
| | | | | | | | | | | | | | | | | | | | |
| | | Total | | | Less Than
1 Year | | | 1-3
Years | | | 4-5
Years | | | More Than
5 Years | |
Operating lease obligations | | $ | 40,711 | | | $ | 16,017 | | | $ | 15,452 | | | $ | 7,384 | | | $ | 1,858 | |
Capital lease obligations | | | 7,990 | | | | 4,156 | | | | 3,764 | | | | 70 | | | | — | |
Other long-term liabilities | | | 15,879 | | | | 3,370 | | | | 3,944 | | | | 9 | | | | 8,556 | |
Debt obligations(1) | | | 250,809 | | | | 100,777 | | | | 32 | | | | 50,000 | | | | 100,000 | |
| | | | | | | | | | | | | | | | | | | | |
Total | | $ | 315,389 | | | $ | 124,320 | | | $ | 23,192 | | | $ | 57,463 | | | $ | 110,414 | |
| | | | | | | | | | | | | | | | | | | | |
| (1) | Total does not include contractual obligations recorded on the balance sheet as current liabilities for certain purchase obligations, as discussed below. Debt obligations do not include interest payments. |
Contractual obligations for purchases of goods or services are defined as agreements that are enforceable and legally binding on us and that specify all significant terms, including fixed or minimum quantities to be purchased; fixed, minimum or variable price provisions; and the approximate timing of the transaction. Our purchase orders are based on current manufacturing needs and are fulfilled by vendors within short time horizons. In addition, some purchase orders represent authorizations to purchase rather than binding agreements. We do not generally have significant agreements for the purchase of raw materials or other goods specifying minimum quantities and set prices that exceed expected requirements for three months. Agreements for outsourced services generally contain clauses allowing for cancellation without significant penalty, and are therefore not included in the table above.
The expected timing of payments of the obligations above is estimated based on current information. Timing of payments and actual amounts paid may be different, depending on the time of receipt of goods or services, or changes to agreed-upon amounts for some obligations.
Off-Balance Sheet Arrangements
We do not have material exposure to any off-balance sheet arrangements. We do not have any unconsolidated special purpose entities.
Critical Accounting Estimates
Our accounting and financial reporting policies are in conformity with U.S. generally accepted accounting principles (GAAP). The preparation of financial statements in conformity with GAAP requires our management to make estimates and assumptions that affect the reported amounts of assets and liabilities, the disclosure of contingent assets and liabilities at the date of the financial statements, and the reported amounts of net revenue and expenses during the reporting period.
Significant accounting policies are summarized in Note 2 of the Notes to Consolidated Financial Statements. Noted here are a number of policies that require significant judgments or estimates.
Revenue Recognition
Our revenue recognition policies are in accordance with Accounting Standards Codification (ASC) 605-10, Revenue Recognition, as issued by the SEC and other applicable guidance.
We recognize net revenue upon shipment of product and transfer of ownership to the customer. Contracts and customer purchase orders generally are used to determine the existence of an
41
arrangement. Shipping documents, proof of delivery and customer acceptance (when applicable) are used to verify delivery. We assess whether an amount due from a customer is fixed and determinable based on the terms of the agreement with the customer, including, but not limited to, the payment terms associated with the transaction. The impact of judgments and estimates on net revenue recognition is minimal. A reserve for estimated returns is established at the time of sale based on historical return experience to cover returns of defective product and is recorded as a reduction of net revenue.
Income Taxes
We recognize liabilities for uncertain tax positions based on the two-step process prescribed within ASC 740-10, Accounting for Income Taxes. The first step is to evaluate the tax position for recognition by determining if the weight of available evidence indicates that it is more likely than not that the position will be sustained on audit, including resolution of related appeals or litigation processes, if any. The second step requires us to estimate and measure the tax benefit as the largest amount that is more than 50% likely to be realized upon ultimate settlement. It is inherently difficult and subjective to estimate such amounts, as this requires us to determine the probability of various possible outcomes. We re-evaluate these uncertain tax positions on a quarterly basis. This evaluation is based on factors including, but not limited to, changes in facts or circumstances, changes in tax law, effectively settled issues under audit and new audit activity. Such a change in recognition or measurement would result in the recognition of a tax benefit or an additional charge to the tax provision in the period.
Deferred tax assets and liabilities are recognized based on differences between the financial statement and tax bases of assets and liabilities using presently enacted tax rates. We have net deferred tax assets of $160.8 million at June 30, 2012.
We periodically assess the carrying value of our deferred tax assets based upon our ability to generate sufficient future taxable income in certain tax jurisdictions. If we determine that we will not be able to realize all or part of our deferred tax assets in the future, a valuation allowance is established in the period such determination is made. We have determined that it is unlikely that we will realize a net deferred asset in the future relating to certain non-U.S. net operating losses. The cumulative valuation allowance relating to net operating losses is approximately $50.3 million at June 30, 2012.
We have operations in countries around the world that are subject to income and other similar taxes in these countries. The estimation of the income tax amounts that we record involves the interpretation of complex tax laws and regulations, evaluation of tax audit findings and assessment of how foreign taxes may affect domestic taxes. Although we believe our tax accruals are adequate, differences may occur in the future depending on the resolution of pending and new tax matters. Subsidiaries with historical net operating losses were able to utilize $23.5 million of these losses during fiscal 2012.
Provision is made for U.S. taxes on undistributed earnings of foreign subsidiaries and related companies to the extent that such earnings are not deemed to be permanently invested.
Inventory
Inventories are valued at the lower of first-in, first-out (FIFO) cost or market value. FIFO inventories recorded in our consolidated balance sheet are adjusted for an allowance covering inventories determined to be slow-moving or excess. The allowance for slow-moving and excess inventories is maintained at an amount management considers appropriate based on factors such as historical usage of the product, open sales orders and future sales forecasts. If our sales forecast for specific products is greater than actual demand and we fail to reduce manufacturing output accordingly, we could be required to write down additional inventory, which would have a negative impact on gross margin and operating results. Such factors require judgment, and changes in any of these factors could result in changes to this allowance.
42
Pension Plans
The costs and obligations of our defined benefit pension plans are dependent on actuarial assumptions. The three critical assumptions used, all of which impact the net periodic pension expense (income) and two of which impact the pension benefit obligation (PBO), are the discount rate, expected return on plan assets and rate of compensation increase. The discount rate is determined based on high-quality fixed income investments that match the duration of expected benefit payments. The discount rate used to determine the present value of our future U.S. pension obligations is based on a yield curve constructed from a portfolio of high quality corporate debt securities with various maturities. Each year’s expected future benefit payments are discounted to their present value at the appropriate yield curve rate, thereby generating the overall discount rate for U.S. pension obligations. The discount rates for our foreign pension plans are selected by using a yield curve approach or by reference to high quality corporate bond rates in those countries that have developed corporate bond markets. In those countries where developed corporate bond markets do not exist, the discount rates are selected by reference to local government bond rates with a premium added to reflect the additional risk for corporate bonds. The expected return on plan assets represents a forward projection of the average rate of earnings expected on the pension assets. We have estimated this rate based on historical returns of similarly diversified portfolios. The rate of compensation increase represents the long-term assumption for expected increases to salaries for pay-related plans. These key assumptions are evaluated annually. Changes in these assumptions can result in different expense and liability amounts. For additional information concerning the assumptions see Note 12 of the Notes to Consolidated Financial Statements.
The effects of the indicated increase and decrease in selected assumptions for our pension plans as of June 30, 2012, assuming no changes in benefit levels and no amortization of gains or losses, is shown below (in thousands):
| | | | | | | | | | | | | | | | |
| | | Increase (Decrease)
in PBO | | | Increase (Decrease)
in Pension Expense | |
| | | U.S. Plan | | | Int’l Plans | | | U.S. Plan | | | Int’l Plans | |
Discount rate change: | | | | | | | | | | | | | | | | |
Increase 50 basis points | | $ | (6,510 | ) | | $ | (11,684 | ) | | $ | 17 | | | $ | (143 | ) |
Decrease 50 basis points | | | 7,343 | | | | 13,211 | | | | (35 | ) | | | 114 | |
Expected rate of return change: | | | | | | | | | | | | | | | | |
Increase 100 basis points | | | N/A | | | | N/A | | | | 704 | | | | 753 | |
Decrease 100 basis points | | | N/A | | | | N/A | | | | (704 | ) | | | (753 | ) |
Other Postretirement Benefits
We have retiree health care plans that cover the majority of our U.S. employees. There are no significant postretirement health care benefit plans outside of the US. The health care cost trend rate assumption has a significant effect on the amount of the accumulated postretirement benefit obligation (APBO) and retiree health care benefit expense. The effects of the indicated increase and decrease in the assumed healthcare cost trend rates for our retiree healthcare plans as of June 30, 2012, assuming no change in benefit levels is shown below (in thousands):
| | | | | | | | |
| | | Increase (Decrease)
Total Annual Service
and Interest Cost | | | Increase (Decrease)
in APBO | |
Increase 100 basis points: | | $ | 589 | | | $ | 4,534 | |
Decrease 100 basis points: | | | (481 | ) | | | (3,736 | ) |
Stock Options
We use the Black-Scholes option-pricing model to estimate the fair value of each option grant as of the date of grant. Expected volatilities are based on historical volatility of our common stock. We
43
estimate the expected life of the option using historical data pertaining to option exercises. Separate groups of employees that have similar historical exercise behavior are considered separately for estimating the expected life. The risk-free interest rate is based on U.S. Treasury yields in effect at the time of grant.
Fair Value of Financial Assets and Liabilities
The following table summarizes our financial assets and liabilities which are measured at fair value on a recurring basis and subject to the disclosure requirements of ASC 820-10, Fair Value Measurements and Disclosures, as of June 30, 2012 (in thousands):
| | | | | | | | | | | | | | | | |
| | | Total
Measured
at Fair
Value | | | Quoted Prices
in Active
Markets for
Identical
Assets
(Level 1) | | | Significant
Other
Observable
Inputs
(Level 2) | | | Significant
Unobservable
Inputs
(Level 3) | |
Available for sale and trading securities | | $ | 29,651 | | | $ | 29,651 | | | $ | — | | | $ | — | |
Derivative financial instruments, net | | | 7,029 | | | | — | | | | 7,029 | | | | — | |
We determine the fair value of our available for sale securities based on quoted market prices (Level 1). We generally use derivatives for hedging purposes pursuant to ASC 815-10, which are valued based on Level 2 inputs in the ASC 820-10 fair value hierarchy. The fair value of our financial instruments is determined by a mark to market valuation based on forward curves using observable market prices. The carrying value of our long-term debt approximates fair value.
Goodwill
Goodwill is recorded when the purchase price paid for an acquisition exceeds the estimated fair value of the net identified tangible and intangible assets acquired.
We perform an annual goodwill impairment analysis as of May 31, or earlier if indicators of potential impairment exist. In assessing the recoverability of goodwill, we review both quantitative as well as qualitative factors to support our assumptions with regard to fair value. Our impairment review process compares the estimated fair value of the reporting unit in which goodwill resides to our carrying value. Reporting units may be operating segments as a whole or an operation one level below an operating segment, referred to as a component. Components are defined as operations for which discrete financial information is available and reviewed by segment management.
The fair value of a reporting unit is estimated using a discounted cash flow model for the evaluation of impairment. The expected future cash flows are generally based on management’s estimates and are determined by looking at numerous factors including projected economic conditions and customer demand, net revenue and margins, changes in competition, operating costs and new products introduced. In determining fair value, we make certain judgments. If these estimates or their related assumptions change in the future as a result of changes in strategy or market conditions, we may be required to record an impairment charge.
Although we believe our assumptions in determining the projected cash flows are reasonable, changes in those estimates could affect the evaluation.
Other-Than-Temporary Impairments (OTTI)
For available-for-sale securities, we presume an OTTI decline in value if the quoted market price of the security is 20% or more below the investment’s cost basis for a continuous period of six months or more. However, the presumption of an OTTI decline in value may be overcome if there is persuasive evidence indicating that the decline is temporary in nature. For investments accounted for under the equity method, we evaluate all known quantitative and qualitative factors in addition to quoted market
44
prices in determining whether an OTTI decline in value exists. Factors that we consider important in evaluating for a potential OTTI, include historical operating performance, future financial projections, business plans for new products or concepts and strength of balance sheet.
Impairment of Long-Lived Assets
In accordance with ASC 360, Accounting for the Impairment or Disposal of Long-Lived Assets, we assess the impairment of long-lived assets, other than goodwill and trade names, including property and equipment, and identifiable intangible assets subject to amortization, whenever events or changes in circumstances indicate the carrying value may not be recoverable. Factors we consider important, which could trigger an impairment review, include significant changes in the manner of our use of the asset, changes in historical trends in operating performance, changes in projected operating performance, and significant negative economic trends.
Contingencies
In accordance with ASC 450, Contingencies, we analyze whether it is probable that an asset has been impaired or a liability has been incurred, and whether the amount of loss can be reasonably estimated. If the loss contingency is both probable and reasonably estimable, we accrue for costs associated with the loss contingency. We expense associated legal fees as incurred. If no accrual is made but the loss contingency is reasonably possible, we disclose the nature of the contingency and the related estimate of possible loss or range of loss if such an estimate can be made. Loss contingencies include, but are not limited to, possible losses related to legal proceedings and regulatory compliance matters. Liabilities established to provide for contingencies are adjusted as further information develops, circumstances change, or contingencies are resolved.
New Accounting Pronouncements
In June 2011, the Financial Accounting Standards Board (the FASB) issued Accounting Standards Update (ASU) No. 2011-05, Comprehensive Income (Topic 220). This new guidance requires the components of net income and other comprehensive income to be either presented in one continuous statement, referred to as the statement of comprehensive income, or in two separate, but consecutive statements. This new guidance eliminates the current option to report other comprehensive income and its components in the statement of stockholders’ equity. While the new guidance changes the presentation of comprehensive income, there are no changes to the components that are recognized in net income or other comprehensive income under current accounting guidance. This new guidance is effective for us for the quarter ended September 30, 2012 and will amend our presentation of the components of comprehensive income.
In July 2012, the FASB issued updated guidance on the periodic testing of intangible assets for impairment. This guidance will allow companies to assess qualitative factors to determine if it is more-likely-than-not that the indefinite-lived intangible asset might be impaired and whether it is necessary to perform the quantitative impairment test as required under current guidance. This new guidance is effective for us beginning July 1, 2013, with early adoption permitted. This new guidance will not have a material impact on our consolidated financial statements.
| Item 7A. | Quantitative and Qualitative Disclosures About Market Risk |
We are subject to market risk associated with changes in foreign currency exchange rates, interest rates and certain commodity prices.
We mitigate our foreign currency exchange rate risk principally through the establishment of local production facilities in the markets we serve. This creates a “natural hedge” since purchases and sales within a specific country are both denominated in the same currency limiting the need to hedge with a
45
foreign exchange forward or option contract (collectively, “foreign exchange contracts”). Natural hedges exist in most countries in which we operate, although the percentage of natural offsets, as compared with offsets that need to be hedged by foreign exchange contracts, will vary from country to country.
We also monitor our foreign currency exposure in each country and implement strategies to respond to changing economic and political environments. Examples of these strategies include the prompt payment of intercompany balances utilizing a global netting system, the establishment of contra-currency accounts in several international subsidiaries, development of natural hedges and use of foreign exchange contracts to protect or preserve the value of cash flows. See Note 16 of the Notes to Consolidated Financial Statements for discussion of the foreign exchange contracts in use at June 30, 2012, 2011 and 2010.
We have implemented a formalized treasury risk management policy that describes the procedures and controls over derivative financial and commodity instruments. Under the policy, we do not use derivative financial or commodity instruments for speculative or trading purposes, and the use of such instruments is subject to strict approval levels by senior management. Typically, the use of derivative instruments is limited to hedging activities related to specific foreign currency cash flows, net receivable and payable balances and call options on certain commodities. See Note 16 of the Notes to Consolidated Financial Statements for discussion of the derivative instruments in use at June 30, 2012, 2011 and 2010.
The translation of the financial statements of the non-North American operations is impacted by fluctuations in foreign currency exchange rates. Consolidated net revenue and income from operations were impacted by the translation of our international financial statements into U.S. dollars resulting in increased net revenue of $57.8 million and increased income from operations of $12.9 million for fiscal 2012, compared with the estimated results for fiscal 2011 using the average rates for 2011.
Our $14.8 million of marketable securities at June 30, 2012 are principally invested in time deposits.
Interest rate exposure is generally limited to our marketable securities, U.S. Credit Facility and Syndicated Term Loan. We do not actively manage the risk of interest rate fluctuations. Our marketable securities mature in less than 12 months. We had no outstanding borrowings on the U.S. Credit Facility with an interest rate of approximately 1.75% at June 30, 2012. The balance of our Syndicated Term Loan was approximately $12.5 million with an interest rate of approximately 1.31% at June 30, 2012.
Due to the nature of our operations, net revenue from specific customers or products fluctuates over time, but our broad base of customers in several markets mitigates the concentration risk relating to any one customer or product. Approximately 32% and 14% of net revenue in fiscal 2012 was derived from operations from China and Japan, respectively.
We monitor the environmental laws and regulations in the countries in which we operate. We have implemented an environmental program to reduce the generation of potentially hazardous materials during our manufacturing process and believe we continue to meet or exceed local government regulations.
46
| Item 8. | Consolidated Financial Statements and Supplementary Data |
Molex Incorporated
Index to Consolidated Financial Statements
47
Molex Incorporated
Consolidated Balance Sheets
(in thousands)
| | | | | | | | |
| | | June 30, | |
| | | 2012 | | | 2011 | |
| ASSETS | |
Current assets: | | | | | | | | |
Cash and cash equivalents | | $ | 637,417 | | | $ | 532,599 | |
Marketable securities | | | 14,830 | | | | 13,947 | |
Accounts receivable, less allowances of $37,876 at June 30, 2012 and $42,297 at June 30, 2011 | | | 751,279 | | | | 811,449 | |
Inventories | | | 531,825 | | | | 535,953 | |
Deferred income taxes | | | 110,789 | | | | 129,158 | |
Other current assets | | | 33,098 | | | | 32,239 | |
| | | | | | | | |
Total current assets | | | 2,079,238 | | | | 2,055,345 | |
Property, plant and equipment, net | | | 1,150,549 | | | | 1,168,448 | |
Goodwill | | | 160,986 | | | | 149,452 | |
Non-current deferred income taxes | | | 50,038 | | | | 38,178 | |
Other assets | | | 170,692 | | | | 186,429 | |
| | | | | | | | |
Total assets | | $ | 3,611,503 | | | $ | 3,597,852 | |
| | | | | | | | |
|
| LIABILITIES AND STOCKHOLDERS’ EQUITY | |
Current liabilities: | | | | | | | | |
Current portion of long-term debt and short-term borrowings | | $ | 104,933 | | | $ | 119,764 | |
Accounts payable | | | 355,491 | | | | 359,812 | |
Accrued expenses: | | | | | | | | |
Salaries, commissions and bonuses | | | 89,404 | | | | 90,913 | |
Restructuring | | | 10,250 | | | | 14,049 | |
Accrual for unauthorized activities in Japan | | | 184,177 | | | | 182,460 | |
Other | | | 112,381 | | | | 112,666 | |
Income taxes payable | | | 30,221 | | | | 2,383 | |
| | | | | | | | |
Total current liabilities | | | 886,857 | | | | 882,047 | |
Other non-current liabilities | | | 18,174 | | | | 23,879 | |
Accrued pension and other postretirement benefits | | | 115,176 | | | | 100,866 | |
Long-term debt | | | 150,032 | | | | 222,794 | |
| | | | | | | | |
Total liabilities | | | 1,170,239 | | | | 1,229,586 | |
Commitments and contingencies | | | | | | | | |
Stockholders’ equity: | | | | | | | | |
Common Stock, $0.05 par value; 200,000 shares authorized; 112,204 shares issued at June 30, 2012 and 2011 | | | 5,610 | | | | 5,610 | |
Class A Common Stock, $0.05 par value; 200,000 shares authorized; 114,910 shares issued at June 30, 2012 and 113,400 shares issued at June 30, 2011 | | | 5,746 | | | | 5,670 | |
Class B Common Stock, $0.05 par value; 146 shares authorized; 94 shares issued at June 30, 2012 and 2011 | | | 5 | | | | 5 | |
Paid-in capital | | | 711,394 | | | | 674,494 | |
Retained earnings | | | 2,545,070 | | | | 2,408,083 | |
Treasury stock (Common Stock, 16,644 shares at June 30, 2012 and 2011; Class A Common Stock, 34,074 shares at June 30, 2012 and 33,712 shares at June 30, 2011), at cost | | | (1,112,956 | ) | | | (1,106,039 | ) |
Accumulated other comprehensive income | | | 286,395 | | | | 380,443 | |
| | | | | | | | |
Total stockholders’ equity | | | 2,441,264 | | | | 2,368,266 | |
| | | | | | | | |
Total liabilities and stockholders’ equity | | $ | 3,611,503 | | | $ | 3,597,852 | |
| | | | | | | | |
See accompanying notes to consolidated financial statements.
48
Molex Incorporated
Consolidated Statements of Income
(in thousands, except per share data)
| | | | | | | | | | | | |
| | | Years Ended June 30, | |
| | | 2012 | | | 2011 | | | 2010 | |
Net revenue | | $ | 3,489,189 | | | $ | 3,587,334 | | | $ | 3,007,207 | |
Cost of sales | | | 2,420,726 | | | | 2,499,197 | | | | 2,114,584 | |
| | | | | | | | | | | | |
Gross profit | | | 1,068,463 | | | | 1,088,137 | | | | 892,623 | |
Selling, general and administrative | | | 657,732 | | | | 643,462 | | | | 610,784 | |
Restructuring costs and asset impairments | | | — | | | | — | | | | 117,139 | |
Unauthorized activities in Japan | | | 11,259 | | | | 14,476 | | | | 26,898 | |
| | | | | | | | | | | | |
Total operating expenses | | | 668,991 | | | | 657,938 | | | | 754,821 | |
| | | | | | | | | | | | |
Income from operations | | | 399,472 | | | | 430,199 | | | | 137,802 | |
Interest (expense) income, net | | | (5,360 | ) | | | (5,708 | ) | | | (5,416 | ) |
Other income (expense) | | | 6,155 | | | | 5,448 | | | | (897 | ) |
| | | | | | | | | | | | |
Total other income (expense) | | | 795 | | | | (260 | ) | | | (6,313 | ) |
| | | | | | | | | | | | |
Income before income taxes | | | 400,267 | | | | 429,939 | | | | 131,489 | |
Income taxes | | | 118,890 | | | | 131,131 | | | | 54,559 | |
| | | | | | | | | | | | |
Net income | | $ | 281,377 | | | $ | 298,808 | | | $ | 76,930 | |
| | | | | | | | | | | | |
Earnings per share: | | | | | | | | | | | | |
Basic | | $ | 1.60 | | | $ | 1.71 | | | $ | 0.44 | |
Diluted | | $ | 1.59 | | | $ | 1.70 | | | $ | 0.44 | |
Average common shares outstanding: | | | | | | | | | | | | |
Basic | | | 175,980 | | | | 174,812 | | | | 173,803 | |
Diluted | | | 177,382 | | | | 175,943 | | | | 174,660 | |
See accompanying notes to consolidated financial statements.
49
Molex Incorporated
Consolidated Statements of Cash Flows
(in thousands)
| | | | | | | | | | | | |
| | | Years Ended June 30, | |
| | | 2012 | | | 2011 | | | 2010 | |
Operating activities: | | | | | | | | | | | | |
Net income | | $ | 281,377 | | | $ | 298,808 | | | $ | 76,930 | |
Add (deduct) non-cash items included in net income: | | | | | | | | | | | | |
Depreciation and amortization | | | 236,974 | | | | 242,171 | | | | 238,666 | |
Asset write-downs included in restructuring costs | | | — | | | | — | | | | 37,296 | |
Loss on investments | | | — | | | | — | | | | 558 | |
Deferred income taxes | | | 10,236 | | | | 37,514 | | | | (16,965 | ) |
Loss on sale of property, plant and equipment | | | 2,580 | | | | 4,843 | | | | 4,092 | |
Share-based compensation | | | 23,335 | | | | 22,461 | | | | 27,034 | |
Other non-cash items | | | (20,561 | ) | | | (22,554 | ) | | | 20,577 | |
Changes in assets and liabilities: | | | | | | | | | | | | |
Accounts receivable | | | 44,161 | | | | (16,401 | ) | | | (208,051 | ) |
Inventories | | | (5,338 | ) | | | (25,916 | ) | | | (117,701 | ) |
Accounts payable | | | 312 | | | | (63,984 | ) | | | 115,869 | |
Other current assets and liabilities | | | (10,246 | ) | | | (9,298 | ) | | | 14,559 | |
Other assets and liabilities | | | 10,889 | | | | (1,493 | ) | | | 57,715 | |
| | | | | | | | | | | | |
Cash provided from operating activities | | | 573,719 | | | | 466,151 | | | | 250,579 | |
| | | | | | | | | | | | |
Investing activities: | | | | | | | | | | | | |
Capital expenditures | | | (227,101 | ) | | | (262,246 | ) | | | (229,477 | ) |
Proceeds from sales of property, plant and equipment | | | 3,444 | | | | 1,804 | | | | 3,014 | |
Proceeds from sales or maturities of marketable securities | | | 12,496 | | | | 11,936 | | | | 44,373 | |
Purchases of marketable securities | | | (14,934 | ) | | | (8,328 | ) | | | (18,890 | ) |
Acquisitions | | | (24,000 | ) | | | (18,847 | ) | | | (10,097 | ) |
Other investing activities | | | 22,400 | | | | 4,972 | | | | (5,794 | ) |
| | | | | | | | | | | | |
Cash used for investing activities | | | (227,695 | ) | | | (270,709 | ) | | | (216,871 | ) |
| | | | | | | | | | | | |
Financing activities: | | | | | | | | | | | | |
Proceeds from revolving credit facility | | | 75,000 | | | | 105,000 | | | | 154,000 | |
Payments on revolving credit facility | | | (260,000 | ) | | | (20,000 | ) | | | (79,000 | ) |
Proceeds from short-term loans and current portion of long-term debt | | | — | | | | 57,620 | | | | — | |
Payments on short-term loans and current portion of long-term debt | | | (53,748 | ) | | | (60,270 | ) | | | — | |
Proceeds from issuance of long-term debt | | | 150,000 | | | | — | | | | 32,647 | |
Payments on long-term debt | | | (575 | ) | | | (48,356 | ) | | | (87,787 | ) |
Cash dividends paid | | | (140,638 | ) | | | (114,410 | ) | | | (105,984 | ) |
Exercise of stock options | | | 7,873 | | | | 7,269 | | | | 4,008 | |
Other financing activities | | | (4,194 | ) | | | (4,044 | ) | | | (1,120 | ) |
| | | | | | | | | | | | |
Cash used for financing activities | | | (226,282 | ) | | | (77,191 | ) | | | (83,236 | ) |
Effect of exchange rate changes on cash | | | (14,924 | ) | | | 37,996 | | | | 1,173 | |
| | | | | | | | | | | | |
Net increase (decrease) in cash and cash equivalents | | | 104,818 | | | | 156,247 | | | | (48,355 | ) |
Cash and cash equivalents, beginning of year | | | 532,599 | | | | 376,352 | | | | 424,707 | |
| | | | | | | | | | | | |
Cash and cash equivalents, end of year | | $ | 637,417 | | | $ | 532,599 | | | $ | 376,352 | |
| | | | | | | | | | | | |
Supplemental cash flow information: | | | | | | | | | | | | |
Interest paid | | $ | 6,272 | | | $ | 5,830 | | | $ | 6,262 | |
Income taxes paid | | $ | 77,787 | | | $ | 98,117 | | | $ | 43,319 | |
See accompanying notes to consolidated financial statements.
50
Molex Incorporated
Consolidated Statements of Stockholders’ Equity
(in thousands)
| | | | | | | | | | | | |
| | | Years Ended June 30, | |
| | | 2012 | | | 2011 | | | 2010 | |
Common stock | | $ | 11,361 | | | $ | 11,285 | | | $ | 11,207 | |
| | | | | | | | | | | | |
Paid-in capital: | | | | | | | | | | | | |
Beginning balance | | $ | 674,494 | | | $ | 638,796 | | | $ | 601,459 | |
Stock-based compensation | | | 23,335 | | | | 22,461 | | | | 27,034 | |
Exercise of stock options | | | 10,598 | | | | 11,372 | | | | 9,012 | |
Issuance of stock awards | | | 2,143 | | | | 1,865 | | | | 1,291 | |
Other | | | 824 | | | | — | | | | — | |
| | | | | | | | | | | | |
Ending balance | | $ | 711,394 | | | $ | 674,494 | | | $ | 638,796 | |
| | | | | | | | | | | | |
Retained earnings: | | | | | | | | | | | | |
Beginning balance | | $ | 2,408,083 | | | $ | 2,232,445 | | | $ | 2,261,594 | |
Net income | | | 281,377 | | | | 298,808 | | | | 76,930 | |
Dividends | | | (144,398 | ) | | | (122,913 | ) | | | (106,079 | ) |
Other | | | 8 | | | | (257 | ) | | | — | |
| | | | | | | | | | | | |
Ending balance | | $ | 2,545,070 | | | $ | 2,408,083 | | | $ | 2,232,445 | |
| | | | | | | | | | | | |
Treasury stock: | | | | | | | | | | | | |
Beginning balance | | $ | (1,106,039 | ) | | $ | (1,098,087 | ) | | $ | (1,089,322 | ) |
Exercise of stock options | | | (6,917 | ) | | | (7,952 | ) | | | (8,765 | ) |
| | | | | | | | | | | | |
Ending balance | | $ | (1,112,956 | ) | | $ | (1,106,039 | ) | | $ | (1,098,087 | ) |
| | | | | | | | | | | | |
Accumulated other comprehensive income: | | | | | | | | | | | | |
Beginning balance | | $ | 380,443 | | | $ | 200,770 | | | $ | 176,383 | |
Foreign currency translation adjustments | | | (65,056 | ) | | | 147,772 | | | | 35,482 | |
Pension adjustments, net of tax | | | (23,344 | ) | | | 29,935 | | | | (12,459 | ) |
Unrealized derivative instrument (loss) gain, net of tax | | | (4,676 | ) | | | 152 | | | | 135 | |
Unrealized investment (loss) gain, net of tax | | | (972 | ) | | | 1,814 | | | | 1,229 | |
| | | | | | | | | | | | |
Ending balance | | $ | 286,395 | | | $ | 380,443 | | | $ | 200,770 | |
| | | | | | | | | | | | |
Total stockholders’ equity | | $ | 2,441,264 | | | $ | 2,368,266 | | | $ | 1,985,131 | |
| | | | | | | | | | | | |
Comprehensive income: | | | | | | | | | | | | |
Net income | | $ | 281,377 | | | $ | 298,808 | | | $ | 76,930 | |
Foreign currency translation adjustments | | | (65,056 | ) | | | 147,772 | | | | 35,482 | |
Pension adjustments, net of tax | | | (23,344 | ) | | | 29,935 | | | | (12,459 | ) |
Unrealized derivative instrument (loss) gain, net of tax | | | (4,676 | ) | | | 152 | | | | 135 | |
Unrealized investment (loss) gain, net of tax | | | (972 | ) | | | 1,814 | | | | 1,229 | |
| | | | | | | | | | | | |
Total comprehensive income | | $ | 187,329 | | | $ | 478,481 | | | $ | 101,317 | |
| | | | | | | | | | | | |
See accompanying notes to consolidated financial statements.
51
Molex Incorporated
Notes to Consolidated Financial Statements
| 1. | Organization and Basis of Presentation |
Molex Incorporated (together with its subsidiaries, except where the context otherwise requires, “we,” “us” and “our”) manufactures electronic components, including electrical and fiber optic interconnection products and systems, switches and integrated products in 40 manufacturing locations in 16 countries.
| 2. | Summary of Significant Accounting Policies |
Principles of Consolidation
The consolidated financial statements include the accounts of Molex Incorporated and our majority-owned subsidiaries. All material intercompany balances and transactions are eliminated in consolidation. Equity investments in which we exercise significant influence but do not control and are not the primary beneficiary are accounted for using the equity method. Investments in which we are not able to exercise significant influence over the investee are accounted for under the cost method.
Use of Estimates
The preparation of consolidated financial statements in conformity with accounting principles generally accepted in the United States requires the use of estimates and assumptions related to the reporting of assets, liabilities, net revenue, expenses and related disclosures. Actual results could differ from these estimates. Material subsequent events are evaluated and disclosed through the report issuance date.
Currency Translation
Assets and liabilities of international entities are translated at period-end exchange rates and income and expenses are translated using weighted-average exchange rates for the period. Translation adjustments are included as a component of accumulated other comprehensive income.
Cash and Cash Equivalents
We consider all liquid investments with original maturities of three months or less to be cash equivalents.
Marketable Securities
Marketable securities consist primarily of time deposits held at non-U.S. local banks. We generally hold these instruments for a period of greater than three months, but no longer than 12 months. Marketable securities are classified as available-for-sale securities.
No mark-to-market adjustments were required during fiscal 2012, 2011 or 2010 because the carrying value of the securities approximated market value. We did not liquidate any available-for-sale securities prior to maturity in fiscal 2012, 2011 or 2010.
Accounts Receivable
In the normal course of business, we extend credit to customers that satisfy pre-defined credit criteria. We believe that we have little concentration of credit risk due to the diversity of our customer base. Accounts receivable are shown net of allowances and anticipated discounts on the Consolidated Balance Sheets. An allowance for doubtful accounts is determined through analysis of the aging of accounts receivable at the date of the consolidated financial statements, assessments of collectability
52
Molex Incorporated
Notes to Consolidated Financial Statements — (Continued)
based on historical trends and an evaluation of the impact of current and projected economic conditions. We monitor the collectability of our accounts receivable on an ongoing basis by analyzing the aging of our accounts receivable, assessing the credit worthiness of our customers and evaluating the impact of reasonably likely changes in economic conditions that may impact credit risks. Our accounts receivable are not collateralized.
Inventories
Inventories are valued at the lower of first-in, first-out cost or market value.
Property, Plant and Equipment
Property, plant and equipment are reported at cost less accumulated depreciation. Depreciation is primarily recorded on a straight-line basis for consolidated financial statement reporting purposes and using a combination of accelerated and straight-line methods for tax purposes.
The estimated useful lives are as follows:
| | | | |
Buildings | | | 25 — 40 years | |
Machinery and equipment | | | 3 — 10 years | |
Molds and dies | | | 3 — 4 years | |
We perform reviews for impairment of long-lived assets whenever adverse events or circumstances indicate that the carrying value of an asset may not be recoverable. When indicators of impairment are present, we evaluate the carrying value of the long-lived assets in relation to the operating performance and future undiscounted cash flows of the underlying assets. We adjust the net book value of the underlying assets to fair value if the sum of the expected undiscounted future cash flows is less than book value.
Goodwill
Goodwill is recorded when the purchase price paid for an acquisition exceeds the estimated fair value of the net identified tangible and intangible assets acquired. We perform an annual review in the fourth quarter of each fiscal year, or more frequently if indicators of potential impairment exist, to determine if the carrying value of the recorded goodwill is impaired. The impairment review process compares the fair value of the reporting unit in which goodwill resides to its carrying value. Reporting units may be operating segments as a whole or an operation one level below an operating segment, referred to as a component.
Our goodwill impairment reviews require a two-step process. The first step of the review compares the estimated fair value of the reporting unit against its aggregate carrying value, including goodwill. We estimate the fair value of our reporting units using the income and market methods of valuation, which includes the use of estimated discounted cash flows. Based on this analysis, if we determine the carrying value of the segment exceeds its fair value, then we complete the second step to determine the fair value of net assets in the segment and quantify the amount of goodwill impairment.
Other-Than-Temporary Impairments (OTTI)
For available-for-sale securities, we presume an OTTI decline in value if the quoted market price of the security is 20% or more below the investment’s cost basis for a continuous period of six months or more. However, the presumption of an OTTI decline in value may be overcome if there is persuasive evidence indicating that the decline is temporary in nature. For investments accounted for under the
53
Molex Incorporated
Notes to Consolidated Financial Statements — (Continued)
equity method, we evaluate all known quantitative and qualitative factors in addition to quoted market prices in determining whether an OTTI decline in value exists. Factors that we consider important in evaluating whether a potential OTTI exists, include historical operating performance, future financial projections, business plans for new products or concepts and strength of balance sheet.
Pension and Other Postretirement Plan Benefits
Pension and other postretirement plan benefits are expensed as employees earn such benefits. The recognition of expense is significantly impacted by estimates made by management such as discount rates used to value certain liabilities, expected return on assets and future healthcare costs. We use third-party specialists to assist management in appropriately measuring the expense associated with pension and other postretirement plan benefits.
Revenue Recognition
We recognize net revenue when in the normal course of our business the following conditions are met: (i) a purchase order has been received from the customer with a corresponding order acknowledgement sent to the customer confirming delivery, price and payment terms, (ii) product has been shipped (FOB origin) or delivered (FOB destination) and title has clearly transferred to the customer or customer carrier, (iii) the price to the buyer is fixed and determinable for sales with an estimate of allowances made based on historical experience and (iv) there is reasonable assurance of collectability.
We record net revenue on a consignment sale when a customer has taken title of product which is stored in either the customer’s warehouse or that of a third party.
From time to time, we will discontinue or obsolete products that we have formerly sold. When this is done, an accrual for estimated returns is established at the time of the announcement of product discontinuation or obsolescence.
We typically warrant that our products will conform to Molex specifications and that our products will be free from material defects in materials and manufacturing, and generally limit our liability to the replacement of defective parts or the cash value of replacement parts. We will not accept returned goods unless the customer makes a claim in writing and management authorizes the return. Returns result primarily from defective products or shipping discrepancies. A reserve for estimated returns is established at the time of sale based on historical return experience and is recorded as a reduction of net revenue.
We provide certain distributors with an inventory allowance for returns or scrap equal to a percentage of qualified purchases. At the time of sale, we record as a reduction of net revenue a reserve for estimated inventory allowances based on a fixed percentage of sales that we authorized to distributors.
From time to time we, in our sole discretion, will grant price allowances to customers. At the time of sale, we record as a reduction of net revenue a reserve for estimated price allowances based on historical allowances authorized and approved solely at our discretion.
Other allowances include customer quantity and price discrepancies. At the time of sale, we record as a reduction of net revenue a reserve for other allowances based on historical experience. We believe we can reasonably and reliably estimate the amounts of future allowances.
Shipping and Handling Costs
Shipping and handling costs are expensed as incurred and included in cost of sales.
54
Molex Incorporated
Notes to Consolidated Financial Statements — (Continued)
Research and Development
Costs incurred in connection with the development of new products and applications are charged to operations as incurred. Research and development costs are included in selling, general and administrative expenses and totaled $181.1 million, $170.1 million and $154.0 million in fiscal 2012, 2011 and 2010, respectively.
Advertising
Advertising costs are charged to operations as incurred and are included in selling, general and administrative expenses.
Income Taxes
Deferred tax assets and liabilities are recognized based on differences between the financial statement and tax bases of assets and liabilities using presently enacted tax rates. We have operations that are subject to income and other similar taxes in foreign countries. The estimation of the income tax amounts that we record involves the interpretation of complex tax laws and regulations, evaluation of tax audit findings and assessment of the impact foreign taxes may have on domestic taxes. A valuation allowance is provided to offset deferred tax assets if, based on available evidence, it is more likely than not that some or all of the deferred tax assets will not be realized.
Provision is made for taxes on undistributed earnings of foreign subsidiaries and related companies to the extent that such earnings are not deemed to be permanently invested.
Derivative Instruments and Hedging Activities
We use derivative instruments to manage our foreign exchange and commodity cost exposures. All derivative instruments are recognized at fair value in other current assets or liabilities.
We use derivative instruments to offset the impact of exchange rate volatility on certain assets and liabilities, including intercompany receivables and payables denominated in non-functional currencies. These instruments have not been designated as hedges, and the gains or losses on these derivatives, along with the offsetting losses or gains due to the fluctuation of exchange rates on the underlying foreign currency denominated assets and liabilities, are recognized in other income (expense).
We also use derivative instruments to hedge the variability of gold and copper costs. These instruments are designated as cash flow hedges. Gains and losses of the effective hedges are recorded as a component of accumulated other comprehensive income and reclassified to cost of sales during the period the commodity is used in production and the underlying product is sold.
Derivative instruments may give rise to counterparty credit risk. To mitigate this risk, our counterparties are required to have investment grade credit ratings.
Stock-Based Compensation
We have granted nonqualified and incentive stock options and restricted stock to our directors, officers and employees under our stock plans pursuant to the terms of such plans. We measure stock-based compensation expense based on the fair value of the award on the date of grant. We recognize compensation expense for the fair value of restricted stock grants issued based on the closing stock price on the date of grant. Compensation expense recognized on shares issued under our Employee Stock Purchase Plan is based on the value of an option to purchase shares of our stock at a 15 percent discount to the stock price.
55
Molex Incorporated
Notes to Consolidated Financial Statements — (Continued)
Contingencies
In accordance with ASC 450, Contingencies, we analyze whether it is probable that an asset has been impaired or a liability has been incurred, and whether the amount of loss can be reasonably estimated. If the loss contingency is both probable and reasonably estimable, we accrue for costs associated with the loss contingency. We expense associated legal fees as incurred. If no accrual is made but the loss contingency is reasonably possible, we disclose the nature of the contingency and the related estimate of possible loss or range of loss if such an estimate can be made. Loss contingencies include, but are not limited to, possible losses related to legal proceedings and regulatory compliance matters. Liabilities established to provide for contingencies are adjusted as further information develops, circumstances change, or contingencies are resolved.
Accounting Changes
New Accounting Pronouncements
In June 2011, the Financial Accounting Standards Board (the FASB) issued Accounting Standards Update (ASU) No. 2011-05, Comprehensive Income (Topic 220). This new guidance requires the components of net income and other comprehensive income to be either presented in one continuous statement, referred to as the statement of comprehensive income, or in two separate, but consecutive statements. This new guidance eliminates the current option to report other comprehensive income and its components in the statement of stockholders’ equity. While the new guidance changes the presentation of comprehensive income, there are no changes to the components that are recognized in net income or other comprehensive income under current accounting guidance. This new guidance is effective for us for the quarter ended September 30, 2012 and will amend our presentation of the components of comprehensive income.
In July 2012, the FASB issued updated guidance on the periodic testing of intangible assets for impairment. This guidance will allow companies to assess qualitative factors to determine if it is more-likely-than-not that the indefinite-lived intangible asset might be impaired and whether it is necessary to perform the quantitative impairment test as required under current guidance. This new guidance is effective for us beginning July 1, 2013, with early adoption permitted. This new guidance will not have a material impact on our consolidated financial statements.
| 3. | Unauthorized Activities in Japan |
As we previously reported in our fiscal 2010 Annual Report on Form 10-K, we launched an investigation into unauthorized activities at Molex Japan Co., Ltd. in April 2010. We learned that an individual working in Molex Japan’s finance group obtained unauthorized loans from third-party lenders, that included in at least one instance the attempted unauthorized pledge of Molex Japan facilities as security, in Molex Japan’s name that were used to cover losses resulting from unauthorized trading, including margin trading, in Molex Japan’s name. We also learned that the individual misappropriated funds from Molex Japan’s accounts to cover losses from unauthorized trading. The individual admitted to forging documentation in arranging and concealing the transactions. We retained outside legal counsel, and they retained forensic accountants, to investigate the matter. The investigation has been completed. Based on our consultation with legal counsel in Japan and the information learned from the investigation, we intend to vigorously contest the enforceability of the outstanding unauthorized loans and any attempt by the lender to obtain payment.
As previously reported in our Annual Report on Form 10-K for the year ended June 30, 2010, based on the results of the completed investigation, we recorded for accounting purposes an accrued liability for the effect of unauthorized activities pending the resolution of these matters including the legal proceedings reported in Note 20.
56
Molex Incorporated
Notes to Consolidated Financial Statements — (Continued)
We believe these unauthorized activities and related losses occurred from at least as early as 1988 through 2010. The accrued liability for these unauthorized activities was $184.2 million as of June 30, 2012, including $18.4 million in cumulative foreign currency translation, which was recorded as a component of accumulated other comprehensive income. To the extent we prevail in not having to pay all or any portion of the unauthorized loans ($165.8 million), we would recognize a gain. In addition, we have a contingent liability of $58.1 million for other loan-related expenses, interest expense and delay damages on the outstanding unauthorized loans.
Unauthorized activities in Japan for fiscal years ended June 30, 2012 and 2011 represent investigative and legal fees.
Basic earnings per share (EPS) is computed by dividing net income by the weighted-average number of common shares outstanding during the year. Diluted EPS is computed by dividing net income by the weighted-average number of common shares and dilutive common shares outstanding, which includes stock options, during the year. A reconciliation of the basic average common shares outstanding to diluted average common shares outstanding as of June 30 follows (in thousands, except per share data):
| | | | | | | | | | | | |
| | | 2012 | | | 2011 | | | 2010 | |
Net income | | $ | 281,377 | | | $ | 298,808 | | | $ | 76,930 | |
| | | | | | | | | | | | |
Basic average common shares outstanding | | | 175,980 | | | | 174,812 | | | | 173,803 | |
Effect of dilutive stock options | | | 1,402 | | | | 1,131 | | | | 857 | |
| | | | | | | | | | | | |
Diluted average common shares outstanding | | | 177,382 | | | | 175,943 | | | | 174,660 | |
| | | | | | | | | | | | |
Earnings per share: | | | | | | | | | | | | |
Basic | | $ | 1.60 | | | $ | 1.71 | | | $ | 0.44 | |
Diluted | | $ | 1.59 | | | $ | 1.70 | | | $ | 0.44 | |
Excluded from the computations above were anti-dilutive shares of 2.7 million, 5.6 million and 7.2 million in fiscal 2012, 2011 and 2010, respectively.
During the second quarter of fiscal 2012, we completed an asset purchase of a specialty wire and cable company for $24.0 million and recorded goodwill of $12.3 million. The purchase price allocation for this acquisition is complete.
During the third quarter of fiscal 2011, we completed an asset acquisition of an active optical cable business for $24.6 million and recorded goodwill of $14.6 million. The purchase price includes contingent consideration of up to $5.8 million payable through fiscal 2014 upon the seller meeting certain criteria.
During the second quarter of fiscal 2010, we completed an asset purchase of a company in China for $10.1 million and recorded goodwill of $2.2 million.
57
Molex Incorporated
Notes to Consolidated Financial Statements — (Continued)
| 6. | Restructuring Costs and Asset Impairments |
Restructuring costs and asset impairments consist of the following at June 30, 2010 (in thousands):
| | | | |
Severance costs | | $ | 79,609 | |
Asset impairments | | | 37,296 | |
| | | | |
Restructuring costs | | | 116,905 | |
Intangible asset impairments | | | 234 | |
| | | | |
Total restructuring charges and asset impairments | | $ | 117,139 | |
| | | | |
Molex Restructuring Plans
During fiscal 2007, we undertook a multi-year restructuring plan designed to reduce costs and to improve return on invested capital in connection with a new global organization that was effective July 1, 2007. A majority of the plan related to facilities located in North America, Europe and Japan and, in general, the movement of manufacturing activities at these plants to other lower-cost facilities. We completed our restructuring program on June 30, 2010.
In fiscal 2010, we recognized net restructuring costs related to employee severance and benefit arrangements for approximately 1,000 employees, resulting in a charge of $79.6 million. A large part of these employee terminations resulted from plant closings in Europe. We recognized asset impairment charges of $37.3 million to write-down assets to fair value less the cost to sell.
A summary of the restructuring charges and asset impairments by reportable segment for the fiscal year ended June 30, 2010 follows (in thousands):
| | | | |
Connector: | | | | |
Severance costs | | $ | 64,311 | |
Asset impairments | | | 35,962 | |
Other | | | — | |
| | | | |
Total | | $ | 100,273 | |
| | | | |
Custom & Electrical: | | | | |
Severance costs | | $ | 11,233 | |
Asset impairments | | | 1,001 | |
Other | | | — | |
| | | | |
Total | | $ | 12,234 | |
| | | | |
Corporate and Other: | | | | |
Severance costs | | $ | 4,065 | |
Asset impairments | | | 333 | |
Other | | | 234 | |
| | | | |
Total | | $ | 4,632 | |
| | | | |
Total: | | | | |
Severance costs | | $ | 79,609 | |
Asset impairments | | | 37,296 | |
Other | | | 234 | |
| | | | |
Total | | $ | 117,139 | |
| | | | |
58
Molex Incorporated
Notes to Consolidated Financial Statements — (Continued)
Changes in the accrued severance balance are summarized as follows (in thousands):
| | | | |
Balance at June 30, 2009 | | $ | 69,884 | |
Charges to expense | | | 79,609 | |
Cash payments | | | (117,911 | ) |
Non-cash related costs | | | (4,684 | ) |
| | | | |
Balance at June 30, 2010 | | $ | 26,898 | |
Charges to expense | | | — | |
Cash payments | | | (15,128 | ) |
Non-cash related costs | | | 2,279 | |
| | | | |
Balance at June 30, 2011 | | $ | 14,049 | |
Charges to expense | | | — | |
Cash payments | | | (2,590 | ) |
Non-cash related costs | | | (1,209 | ) |
| | | | |
Balance at June 30, 2012 | | $ | 10,250 | |
| | | | |
Inventories, less allowances of $38.1 million at June 30, 2012 and $41.4 million at June 30, 2011, consisted of the following (in thousands):
| | | | | | | | |
| | | 2012 | | | 2011 | |
Raw materials | | $ | 84,536 | | | $ | 91,362 | |
Work in progress | | | 145,610 | | | | 143,888 | |
Finished goods | | | 301,679 | | | | 300,703 | |
| | | | | | | | |
Total inventories | | $ | 531,825 | | | $ | 535,953 | |
| | | | | | | | |
| 8. | Property, Plant and Equipment |
At June 30, property, plant and equipment consisted of the following (in thousands):
| | | | | | | | |
| | | 2012 | | | 2011 | |
Land and improvements | | $ | 74,116 | | | $ | 73,755 | |
Buildings and leasehold improvements | | | 821,068 | | | | 787,092 | |
Machinery and equipment | | | 1,834,835 | | | | 1,833,221 | |
Molds and dies | | | 781,009 | | | | 807,179 | |
Construction in progress | | | 105,798 | | | | 86,832 | |
| | | | | | | | |
Total | | | 3,616,826 | | | | 3,588,079 | |
Accumulated depreciation | | | (2,466,277 | ) | | | (2,419,631 | ) |
| | | | | | | | |
Net property, plant and equipment | | $ | 1,150,549 | | | $ | 1,168,448 | |
| | | | | | | | |
Depreciation expense for property, plant and equipment was $231.3 million, $236.6 million and $232.6 million in fiscal 2012, 2011 and 2010, respectively.
59
Molex Incorporated
Notes to Consolidated Financial Statements — (Continued)
At June 30, changes to goodwill were as follows (in thousands):
| | | | | | | | |
| | | 2012 | | | 2011 | |
Beginning balance | | $ | 413,592 | | | $ | 396,050 | |
Additions | | | 12,256 | | | | 14,615 | |
Foreign currency translation | | | (722 | ) | | | 2,927 | |
| | | | | | | | |
Goodwill | | | 425,126 | | | | 413,592 | |
Accumulated impairment losses | | | (264,140 | ) | | | (264,140 | ) |
| | | | | | | | |
Goodwill, net of impairment losses | | $ | 160,986 | | | $ | 149,452 | |
| | | | | | | | |
| 10. | Other Intangible Assets |
All of our intangible assets other than goodwill are included in other assets. Assets with indefinite lives represent acquired trade names. The value of these indefinite-lived intangible assets was $4.3 million at June 30, 2012 and June 30, 2011.
The components of finite-lived intangible assets at June 30 are summarized as follows (in thousands):
| | | | | | | | | | | | | | | | | | | | | | | | |
| | | 2012 | | | 2011 | |
| | | Gross
Carrying
Amount | | | Accumulated
Amortization | | | Net
Carrying
Amount | | | Gross
Carrying
Amount | | | Accumulated
Amortization | | | Net
Carrying
Amount | |
Customer-related | | $ | 34,532 | | | $ | (9,681 | ) | | $ | 24,851 | | | $ | 32,555 | | | $ | (7,731 | ) | | $ | 24,824 | |
Technology-based | | | 27,041 | | | | (18,086 | ) | | | 8,955 | | | | 26,795 | | | | (15,697 | ) | | | 11,098 | |
License fees | | | 10,036 | | | | (7,989 | ) | | | 2,047 | | | | 8,491 | | | | (6,597 | ) | | | 1,894 | |
| | | | | | | | | | | | | | | | | | | | | | | | |
Total | | $ | 71,609 | | | $ | (35,756 | ) | | $ | 35,853 | | | $ | 67,841 | | | $ | (30,025 | ) | | $ | 37,816 | |
| | | | | | | | | | | | | | | | | | | | | | | | |
We estimate that we have no significant residual value related to our intangible assets.
During fiscal year 2012 and 2011, we recorded additions to intangible assets of $3.8 million and $4.0 million, respectively. The components of intangible assets acquired during fiscal 2012 and 2011 were as follows (in thousands):
| | | | | | | | | | | | | | | | |
| | | 2012 | | | 2011 | |
| | | Gross
Carrying
Amount | | | Weighted
Average
Life | | | Gross
Carrying
Amount | | | Weighted
Average
Life | |
Customer-related | | $ | 2,200 | | | | 10.0 years | | | $ | 900 | | | | 7.0 years | |
Technology-based | | | 1,600 | | | | 8.0 years | | | | 3,114 | | | | 9.0 years | |
| | | | | | | | | | | | | | | | |
Total | | $ | 3,800 | | | | | | | $ | 4,014 | | | | | |
| | | | | | | | | | | | | | | | |
60
Molex Incorporated
Notes to Consolidated Financial Statements — (Continued)
Acquired intangibles are generally amortized on a straight-line basis over weighted average lives. Intangible assets amortization expense was $5.7 million for fiscal year 2012, $5.3 million for fiscal year 2011 and $6.3 million for fiscal year 2010. The estimated future amortization expense related to intangible assets as of June 30, 2012 is as follows (in thousands):
| | | | |
2013 | | $ | 5,199 | |
2014 | | | 4,181 | |
2015 | | | 4,033 | |
2016 | | | 3,399 | |
2017 | | | 3,133 | |
Thereafter | | | 15,908 | |
| | | | |
Total | | $ | 35,853 | |
| | | | |
Income before income taxes for fiscal years ended June 30, is summarized as follows (in thousands):
| | | | | | | | | | | | |
| | | 2012 | | | 2011 | | | 2010 | |
United States | | $ | 158,993 | | | $ | 198,349 | | | $ | 21,985 | |
International | | | 241,274 | | | | 231,590 | | | | 109,504 | |
| | | | | | | | | | | | |
Income before income taxes | | $ | 400,267 | | | $ | 429,939 | | | $ | 131,489 | |
| | | | | | | | | | | | |
The components of income tax expense (benefit) for fiscal years ended June 30, follows (in thousands):
| | | | | | | | | | | | |
| | | 2012 | | | 2011 | | | 2010 | |
Current: | | | | | | | | | | | | |
U.S. federal | | $ | 51,081 | | | $ | 63,630 | | | $ | 13,658 | |
State | | | 2,773 | | | | 4,501 | | | | 1,553 | |
International | | | 54,800 | | | | 25,486 | | | | 41,053 | |
| | | | | | | | | | | | |
Total current | | $ | 108,654 | | | $ | 93,617 | | | $ | 56,264 | |
| | | | | | | | | | | | |
Deferred: | | | | | | | | | | | | |
U.S. federal | | $ | 4,489 | | | $ | 14,764 | | | $ | (6,499 | ) |
State | | | — | | | | — | | | | (1,460 | ) |
International | | | 5,747 | | | | 22,750 | | | | 6,254 | |
| | | | | | | | | | | | |
Total deferred | | | 10,236 | | | | 37,514 | | | | (1,705 | ) |
| | | | | | | | | | | | |
Total income tax expense | | $ | 118,890 | | | $ | 131,131 | | | $ | 54,559 | |
| | | | | | | | | | | | |
61
Molex Incorporated
Notes to Consolidated Financial Statements — (Continued)
Our effective tax rate differs from the U.S. federal income tax rate for the years ended June 30, as follows:
| | | | | | | | | | | | |
| | | 2012 | | | 2011 | | | 2010 | |
U.S. federal income tax rate | | | 35.0 | % | | | 35.0 | % | | | 35.0 | % |
Permanent tax exemptions | | | (1.8 | ) | | | (2.0 | ) | | | (11.9 | ) |
U.S. tax on foreign earnings | | | (0.2 | ) | | | 1.2 | | | | 4.4 | |
Provision for tax contingencies | | | — | | | | (0.4 | ) | | | (2.6 | ) |
Valuation allowance | | | (2.9 | ) | | | (1.6 | ) | | | 11.0 | |
Reduction of benefit from share-based payments | | | 0.8 | | | | 1.1 | | | | 5.9 | |
Change in health care legislation | | | — | | | | — | | | | 2.7 | |
State income taxes, net of federal tax benefit | | | 0.5 | | | | 0.7 | | | | 0.3 | |
Foreign tax rates less than U.S. federal tax rate (net) | | | (1.8 | ) | | | (4.7 | ) | | | (3.2 | ) |
Other | | | 0.1 | | | | 1.2 | | | | (0.1 | ) |
| | | | | | | | | | | | |
Effective tax rate | | | 29.7 | % | | | 30.5 | % | | | 41.5 | % |
| | | | | | | | | | | | |
The effective tax rate was 29.7%, 30.5% and 41.5% for fiscal 2012, 2011 and 2010, respectively. The effective tax rate for fiscal 2010 was higher than fiscal 2011 and 2012 due to: (1) income tax expense recorded during fiscal 2010 of $7.7 million, due primarily to the reversal of an estimated tax benefit resulting from a significant number of employee stock options that expired unexercised, (2) a charge due to legislation passed during the year which includes a provision that reduces the deductibility, for Federal income tax purposes, of retiree prescription drug benefits to the extent they are reimbursed under Medicare Part D, (3) tax losses generated in non-U.S. jurisdictions for which no tax benefit has been recognized, and (4) additional U.S. tax cost to repatriate earning from non-U.S. subsidiaries during the year.
At June 30, 2012, we had approximately $175.0 million of non-U.S. net operating loss carryforwards. Approximately 81.6% of the non-U.S. net operating losses can be carried forward indefinitely. The remaining losses have expiration dates over the next five to ten years.
A valuation allowance is provided when it is more likely than not that some portion of the deferred tax asset will not be realized. As of June 30, 2012 and 2011, we recorded valuation allowances of $50.3 million and $67.3 million, respectively, against the non-U.S. net operating loss carryforward deferred tax assets.
During the year, we recorded a capital loss deferred tax asset of $44.0 million. As of June 30, 2012, we recorded a valuation allowance of $44.0 million as it is more likely than not the deferred tax asset will not be realized.
62
Molex Incorporated
Notes to Consolidated Financial Statements — (Continued)
The components of net deferred tax assets and liabilities as of June 30 are as follows (in thousands):
| | | | | | | | |
| | | 2012 | | | 2011 | |
Deferred tax assets: | | | | | | | | |
Pension and other postretirement liabilities | | $ | 25,028 | | | $ | 26,242 | |
Stock option and other benefits | | | 23,001 | | | | 19,099 | |
Capitalized research and development | | | 1,007 | | | | 3,942 | |
Foreign tax credits | | | 6,612 | | | | 4,111 | |
Net operating loss carryforwards | | | 52,505 | | | | 70,916 | |
Depreciation and amortization | | | — | | | | 4,265 | |
Inventory | | | 20,161 | | | | 10,143 | |
Restructuring | | | 3,652 | | | | 4,625 | |
Accrual for unauthorized activities in Japan | | | 78,182 | | | | 77,559 | |
Allowance for doubtful accounts | | | 7,842 | | | | 9,540 | |
Patents | | | 5,488 | | | | 5,701 | |
Severance | | | 2,088 | | | | 7,725 | |
Capital loss | | | 44,040 | | | | — | |
Other, net | | | 34,321 | | | | 33,665 | |
| | | | | | | | |
Total deferred tax assets before valuation allowance | | | 303,927 | | | | 277,533 | |
Valuation allowance | | | (102,878 | ) | | | (71,858 | ) |
| | | | | | | | |
Total deferred tax assets | | | 201,049 | | | | 205,675 | |
Deferred tax liabilities: | | | | | | | | |
Investments | | | (32,182 | ) | | | (35,206 | ) |
Depreciation and amortization | | | (7,972 | ) | | | — | |
Other, net | | | (68 | ) | | | (3,133 | ) |
| | | | | | | | |
Total deferred tax liabilities | | | (40,222 | ) | | | (38,339 | ) |
| | | | | | | | |
Total net deferred tax assets | | $ | 160,827 | | | $ | 167,336 | |
| | | | | | | | |
The net deferred tax amounts reported in the consolidated balance sheet as of June 30 are as follows (in thousands):
| | | | | | | | |
| | | 2012 | | | 2011 | |
Net deferred taxes: | | | | | | | | |
Current asset | | $ | 110,789 | | | $ | 129,158 | |
Non-current asset | | | 50,038 | | | | 38,178 | |
| | | | | | | | |
Total | | $ | 160,827 | | | $ | 167,336 | |
| | | | | | | | |
We have not provided for U.S. deferred income taxes or foreign withholding taxes on approximately $1.2 billion of undistributed earnings of certain non-U.S. subsidiaries as of June 30, 2012. These earnings are intended to be permanently invested. It is not practicable to estimate the additional income taxes that would be paid if the permanently reinvested earnings were distributed.
We are currently benefitting from preferential income tax treatment in jurisdictions including Singapore, China, Thailand, the Philippines, Mexico, Poland and Vietnam. As a result of such tax incentives, our tax expense was reduced by approximately $7.3 million during fiscal 2012. The expiration of various
63
Molex Incorporated
Notes to Consolidated Financial Statements — (Continued)
tax holidays is scheduled in whole or in part during fiscal 2013 through fiscal 2019. Many of these holidays may be extended when certain conditions are met or terminated if we fail to satisfy certain requirements, which could have an unfavorable tax rate impact.
We are subject to tax in U.S. federal, state and foreign tax jurisdictions. It is reasonably possible that the amount of unrecognized tax benefits, that is, the aggregate tax effect of differences between tax return positions and the benefits recognized in our financial statements, will change over the next twelve months; however, we do not expect significant changes during that time. The balance of unrecognized tax benefits as of June 30 follows (in thousands):
| | | | | | | | | | | | |
| | | 2012 | | | 2011 | | | 2010 | |
Unrecognized tax benefits | | $ | 16,987 | | | $ | 18,375 | | | $ | 20,142 | |
Portion that, if recognized, would reduce tax expense and effective tax rate | | | 16,987 | | | | 18,375 | | | | 20,142 | |
A reconciliation of the beginning and ending amounts of unrecognized tax benefits follows (in thousands):
| | | | |
Balance as of June 30, 2010 | | $ | 20,142 | |
Additions based on tax positions related to the current year | | | — | |
Additions for tax positions of prior years | | | 3,111 | |
Reductions for tax positions of prior years | | | (1,080 | ) |
Reductions due to lapse of applicable statute of limitations | | | (3,798 | ) |
| | | | |
Balance as of June 30, 2011 | | $ | 18,375 | |
Additions based on tax positions related to the current year | | | 1,764 | |
Additions for tax positions of prior years | | | — | |
Reductions for tax positions of prior years | | | (2,874 | ) |
Reductions due to lapse of applicable statute of limitations | | | (278 | ) |
| | | | |
Balance at June 30, 2012 | | $ | 16,987 | |
| | | | |
The examination of U.S. federal income tax returns for 2007, 2008 and 2009 were completed during fiscal 2012. The tax years 2010 through 2012 remain open to examination by all major taxing jurisdictions to which we are subject.
It is our practice to recognize interest or penalties related to income tax matters in tax expense. As of June 30, 2012, there were no material interest or penalty amounts to accrue.
| 12. | Profit Sharing, Pension and Post Retirement Medical Benefit Plans |
Profit Sharing Plans
We provide discretionary savings and other defined contribution plans covering substantially all of our U.S. employees and certain employees in international subsidiaries. Employer contributions to these plans of $24.7 million, $16.4 million and $9.4 million were charged to operations during fiscal 2012, 2011 and 2010, respectively. Effective January 1, 2011, U.S. defined contribution plans were merged into a 401(k) plan with a non-discretionary base company contribution and the opportunity for discretionary savings and employer matching contributions.
64
Molex Incorporated
Notes to Consolidated Financial Statements — (Continued)
Pension Plans
We sponsor and/or contribute to pension plans, including defined benefit plans, covering substantially all U.S. plant hourly employees and certain employees in non-U.S. subsidiaries. The benefits are primarily based on years of service and the employees’ compensation for certain periods during their last years of employment. Our pension obligations are measured as of June 30 for all plans. We amended a defined benefit pension plan in the U.S. to close participation and freeze benefit accruals under the plan, effective December 31, 2010, reducing the pension liability by $11.8 million. Non-U.S. plans are primarily in Germany, Ireland, Japan, Korea and Taiwan.
Post Retirement Medical Benefit Plans
We have retiree health care plans that cover the majority of our U.S. employees. Employees hired before January 1, 1994 may become eligible for these benefits if they reach age 55, with age plus years of service equal to 70. Employees hired after January 1, 1994 may become eligible for these benefits if they reach age 60, with age plus years of service equal to 80. The cost of retiree health care is accrued over the period in which the employees become eligible for such benefits. We continue to fund benefit costs primarily as claims are paid. We discontinued the plans in January 2009 for all employees who were not within 10 years of qualifying. There are no significant postretirement health care benefit plans outside of the United States.
The postretirement medical benefit plan includes an actuarial gain for fiscal 2012 which resulted from our decision to enroll in an Employee Group Waiver Plan (EGWP) beginning January 1, 2013. Participation in the EGWP allows us to offer substantially the same postretirement benefits to eligible participants while increasing subsidy reimbursements we receive from the U.S. government. This reduced the postretirement medical benefit liability by approximately $12.0 million as of June 30, 2012.
Benefit Obligation and Plan Assets
The accumulated benefit obligations as of June 30, were as follows (in thousands):
| | | | | | | | | | | | | | | | | | | | | | | | |
| | | U.S. Pension
Benefits | | | Non-U.S. Pension
Benefits | | | Postretirement
Medical Benefits | |
| | | 2012 | | | 2011 | | | 2012 | | | 2011 | | | 2012 | | | 2011 | |
Accumulated benefit obligation | | $ | 80,826 | | | $ | 66,028 | | | $ | 141,225 | | | $ | 119,740 | | | $ | 29,083 | | | $ | 41,168 | |
65
Molex Incorporated
Notes to Consolidated Financial Statements — (Continued)
The changes in the benefit obligations and plan assets for the plans described above were as follows (in thousands):
| | | | | | | | | | | | | | | | | | | | | | | | |
| | | U.S. Pension
Benefits | | | Non-U.S. Pension
Benefits | | | Postretirement
Medical Benefits | |
| | | 2012 | | | 2011 | | | 2012 | | | 2011 | | | 2012 | | | 2011 | |
Change in projected benefit obligation: | | | | | | | | | | | | | | | | | | | | | | | | |
Beginning benefit obligation | | $ | 71,429 | | | $ | 71,775 | | | $ | 130,897 | | | $ | 127,140 | | | $ | 41,168 | | | $ | 45,402 | |
Service cost | | | — | | | | 1,487 | | | | 7,008 | | | | 6,075 | | | | 1,094 | | | | 1,369 | |
Interest cost | | | 4,130 | | | | 3,934 | | | | 4,377 | | | | 4,198 | | | | 2,344 | | | | 2,469 | |
Plan participants’ contributions | | | — | | | | — | | | | — | | | | — | | | | 1,040 | | | | 848 | |
Actuarial loss (gain) | | | 11,729 | | | | 2,322 | | | | 20,910 | | | | (18,340 | ) | | | (14,638 | ) | | | (7,174 | ) |
Plan amendment | | | — | | | | — | | | | — | | | | 263 | | | | — | | | | — | |
Special termination benefits | | | — | | | | — | | | | — | | | | — | | | | 8 | | | | 23 | |
Actual expenses | | | — | | | | — | | | | (102 | ) | | | (77 | ) | | | — | | | | — | |
Effect of curtailment or settlement | | | — | | | | (5,772 | ) | | | — | | | | (2,107 | ) | | | — | | | | — | |
Other | | | — | | | | — | | | | 1,902 | | | | — | | | | — | | | | — | |
Benefits paid to plan participants | | | (1,949 | ) | | | (2,317 | ) | | | (3,648 | ) | | | (2,686 | ) | | | (1,933 | ) | | | (1,769 | ) |
Changes in foreign currency | | | — | | | | — | | | | (7,867 | ) | | | 16,431 | | | | — | | | | — | |
| | | | | | | | | | | | | | | | | | | | | | | | |
Ending projected benefit obligation | | $ | 85,339 | | | $ | 71,429 | | | $ | 153,477 | | | $ | 130,897 | | | $ | 29,083 | | | $ | 41,168 | |
| | | | | | | | | | | | | | | | | | | | | | | | |
| | | | | | | | | | | | | | | | | | | | | | | | |
| | | U.S. Pension
Benefits | | | Non-U.S. Pension
Benefits | | | Postretirement
Medical Benefits | |
| | | 2012 | | | 2011 | | | 2012 | | | 2011 | | | 2012 | | | 2011 | |
Change in plan assets: | | | | | | | | | | | | | | | | | | | | | | | | |
Beginning fair value of plan assets | | $ | 70,761 | | | $ | 56,762 | | | $ | 71,867 | | | $ | 51,928 | | | $ | — | | | $ | — | |
Actual return on plan assets | | | (27 | ) | | | 13,806 | | | | 3,474 | | | | 2,081 | | | | — | | | | — | |
Employer contributions | | | 1,050 | | | | 2,510 | | | | 16,859 | | | | 14,072 | | | | 893 | | | | 921 | |
Settlements | | | — | | | | — | | | | — | | | | (2,107 | ) | | | — | | | | — | |
Actual expenses | | | — | | | | — | | | | (102 | ) | | | (77 | ) | | | — | | | | — | |
Plan participants’ contributions | | | — | | | | — | | | | — | | | | — | | | | 1,040 | | | | 848 | |
Benefits paid to plan participants | | | (1,949 | ) | | | (2,317 | ) | | | (3,648 | ) | | | (2,686 | ) | | | (1,933 | ) | | | (1,769 | ) |
Changes in foreign currency | | | — | | | | — | | | | (5,566 | ) | | | 8,656 | | | | — | | | | — | |
| | | | | | | | | | | | | | | | | | | | | | | | |
Ending fair value of plan assets | | $ | 69,835 | | | $ | 70,761 | | | $ | 82,884 | | | $ | 71,867 | | | $ | — | | | $ | — | |
| | | | | | | | | | | | | | | | | | | | | | | | |
The funded status, the amount by which plan assets exceed (or are less than) the projected benefit obligation, was as follows at June 30 (in thousands):
| | | | | | | | | | | | | | | | | | | | | | | | |
| | | U.S. Pension
Benefits | | | Non-U.S. Pension
Benefits | | | Postretirement
Medical Benefits | |
| | | 2012 | | | 2011 | | | 2012 | | | 2011 | | | 2012 | | | 2011 | |
Funded Status | | $ | (15,504 | ) | | $ | (668 | ) | | $ | (70,593 | ) | | $ | (59,030 | ) | | $ | (29,083 | ) | | $ | (41,168 | ) |
66
Molex Incorporated
Notes to Consolidated Financial Statements — (Continued)
The amounts recognized in the consolidated balance sheets were as follows (in thousands):
| | | | | | | | | | | | | | | | | | | | | | | | |
| | | U.S. Pension
Benefits | | | Non-U.S. Pension
Benefits | | | Postretirement
Medical Benefits | |
| | | 2012 | | | 2011 | | | 2012 | | | 2011 | | | 2012 | | | 2011 | |
Accrued pension and other post retirement benefits | | $ | (15,504 | ) | | $ | (668 | ) | | $ | (70,593 | ) | | $ | (59,030 | ) | | $ | (29,083 | ) | | $ | (41,168 | ) |
Accumulated other comprehensive income | | | 27,138 | | | | 9,843 | | | | 46,868 | | | | 30,889 | | | | (14,471 | ) | | | (1,571 | ) |
| | | | | | | | | | | | | | | | | | | | | | | | |
Net amount recognized | | $ | 11,634 | | | $ | 9,175 | | | $ | (23,725 | ) | | $ | (28,141 | ) | | $ | (43,554 | ) | | $ | (42,739 | ) |
| | | | | | | | | | | | | | | | | | | | | | | | |
The amounts comprising accumulated other comprehensive income before taxes were as follows (in thousands):
| | | | | | | | | | | | | | | | | | | | | | | | |
| | | U.S. Pension
Benefits | | | Non-U.S. Pension
Benefits | | | Postretirement
Medical Benefits | |
| | | 2012 | | | 2011 | | | 2012 | | | 2011 | | | 2012 | | | 2011 | |
Net transition liability | | $ | — | | | $ | — | | | $ | 56 | | | $ | 99 | | | $ | — | | | $ | — | |
Net actuarial (gain) loss | | | 27,138 | | | | 9,843 | | | | 44,577 | | | | 28,316 | | | | (8,189 | ) | | | 6,776 | |
Net prior service costs (credit) | | | — | | | | — | | | | 2,235 | | | | 2,474 | | | | (6,282 | ) | | | (8,347 | ) |
| | | | | | | | | | | | | | | | | | | | | | | | |
Defined benefit plans, net | | $ | 27,138 | | | $ | 9,843 | | | $ | 46,868 | | | $ | 30,889 | | | $ | (14,471 | ) | | $ | (1,571 | ) |
| | | | | | | | | | | | | | | | | | | | | | | | |
The net gain recognized in other comprehensive income was $20.4 million in fiscal 2012.
Assumptions
Weighted average actuarial assumptions used to determine benefit obligations for the plans were as follows:
| | | | | | | | | | | | | | | | | | | | | | | | |
| | | U.S. Pension
Benefits | | | Non-U.S. Pension
Benefits | | | Postretirement
Medical Benefits | |
| | | 2012 | | | 2011 | | | 2012 | | | 2011 | | | 2012 | | | 2011 | |
Discount rate | | | 4.8 | % | | | 5.9 | % | | | 2.9 | % | | | 3.5 | % | | | 4.8 | % | | | 5.8 | % |
Rate of compensation increase | | | 3.5 | % | | | 3.5 | % | | | 3.2 | % | | | 3.1 | % | | | — | | | | — | |
Health care cost trend | | | — | | | | — | | | | — | | | | — | | | | 8.5 | % | | | 8.5 | % |
Ultimate health care cost trend | | | — | | | | — | | | | — | | | | — | | | | 5.0 | % | | | 5.0 | % |
Years of ultimate rate | | | — | | | | — | | | | — | | | | — | | | | 2019 | | | | 2018 | |
For the postretirement medical benefit plan, a one-percentage point change in the assumed health care cost trend rates would have the following effect (in thousands):
| | | | | | | | | | | | |
| | | 2012 | | | 2011 | | | 2010 | |
Effect on total service and interest cost: | | | | | | | | | | | | |
Increase 100 basis points | | $ | 589 | | | $ | 676 | | | $ | 539 | |
Decrease 100 basis points | | | (481 | ) | | | (553 | ) | | | (449 | ) |
Effect on benefit obligation: | | | | | | | | | | | | |
Increase 100 basis points | | $ | 4,534 | | | $ | 6,827 | | | $ | 6,778 | |
Decrease 100 basis points | | | (3,736 | ) | | | (5,621 | ) | | | (5,955 | ) |
67
Molex Incorporated
Notes to Consolidated Financial Statements — (Continued)
Weighted-average actuarial assumptions used to determine costs for the plans were as follows:
| | | | | | | | | | | | | | | | | | | | | | | | | | | | | | | | | | | | |
| | | U.S. Pension
Benefits | | | Non-U.S.
Pension Benefits | | | Postretirement
Medical Benefits | |
| | | 2012 | | | 2011 | | | 2010 | | | 2012 | | | 2011 | | | 2010 | | | 2012 | | | 2011 | | | 2010 | |
Discount rate | | | 5.9 | % | | | 5.7 | % | | | 7.0 | % | | | 3.5 | % | | | 3.1 | % | | | 3.8 | % | | | 5.8 | % | | | 5.5 | % | | | 6.9 | % |
Expected return on plan assets | | | 8.0 | % | | | 8.3 | % | | | 8.3 | % | | | 3.6 | % | | | 4.6 | % | | | 5.6 | % | | | — | | | | — | | | | — | |
Rate of compensation increase | | | 3.5 | % | | | 3.5 | % | | | 3.5 | % | | | 3.1 | % | | | 3.1 | % | | | 3.4 | % | | | — | | | | — | | | | — | |
Health care cost trend | | | — | | | | — | | | | — | | | | — | | | | — | | | | — | | | | 8.5 | % | | | 8.5 | % | | | 8.5 | % |
Ultimate health care cost trend | | | — | | | | — | | | | — | | | | — | | | | — | | | | — | | | | 5.0 | % | | | 5.0 | % | | | 5.0 | % |
Years of ultimate rate | | | — | | | | — | | | | — | | | | — | | | | — | | | | — | | | | 2018 | | | | 2018 | | | | 2017 | |
The discount rate is determined based on high-quality fixed income investments that match the duration of expected benefit payments. The discount rate used to determine the present value of our future U.S. pension obligations is based on a yield curve constructed from a portfolio of high quality corporate debt securities with various maturities. Each year’s expected future benefit payments are discounted to their present value at the appropriate yield curve rate, thereby generating the overall discount rate for U.S. pension obligations. The discount rates for our foreign pension plans are selected by using a yield curve approach or by reference to high quality corporate bond rates in those countries that have developed corporate bond markets. In those countries where developed corporate bond markets do not exist, the discount rates are selected by reference to local government bond rates with a premium added to reflect the additional risk for corporate bonds. The expected return on plan assets noted above represents a forward projection of the average rate of earnings expected on the pension assets. We estimated this rate based on historical returns of similarly diversified portfolios. The rate of compensation increase represents the long-term assumption for expected increases to salaries for pay-related plans.
Net Periodic Benefit Cost
The components of net periodic benefit cost for our plans consist of the following for the years ended June 30 (in thousands):
| | | | | | | | | | | | | | | | | | | | | | | | | | | | | | | | | | | | |
| | | U.S. Pension Benefits | | | Non-U.S. Pension Benefits | | | Postretirement
Medical Benefits | |
| | | 2012 | | | 2011 | | | 2010 | | | 2012 | | | 2011 | | | 2010 | | | 2012 | | | 2011 | | | 2010 | |
Service cost | | $ | — | | | $ | 1,487 | | | $ | 2,521 | | | $ | 7,008 | | | $ | 6,075 | | | $ | 5,441 | | | $ | 1,094 | | | $ | 1,369 | | | $ | 1,082 | |
Interest cost | | | 4,130 | | | | 3,934 | | | | 3,799 | | | | 4,377 | | | | 4,198 | | | | 4,183 | | | | 2,344 | | | | 2,469 | | | | 2,486 | |
Expected return on plan assets | | | (5,632 | ) | | | (5,057 | ) | | | (4,497 | ) | | | (2,992 | ) | | | (2,738 | ) | | | (2,627 | ) | | | — | | | | — | | | | — | |
Amortization of prior service cost | | | — | | | | 1 | | | | 3 | | | | 266 | | | | 244 | | | | 224 | | | | (2,065 | ) | | | (2,065 | ) | | | (2,065 | ) |
Amortization of unrecognized transition obligation | | | — | | | | — | | | | — | | | | 40 | | | | 40 | | | | 37 | | | | — | | | | — | | | | — | |
Recognized actuarial losses | | | 93 | | | | 745 | | | | 1,010 | | | | 1,071 | | | | 2,172 | | | | 1,691 | | | | 327 | | | | 1,331 | | | | 702 | |
Curtailment or settlement loss (gain) | | | — | | | | 10 | | | | 82 | | | | — | | | | 419 | | | | (2,006 | ) | | | 8 | | | | 23 | | | | 70 | |
| | | | | | | | | | | | | | | | | | | | | | | | | | | | | | | | | | | | |
Net periodic benefit cost | | $ | (1,409 | ) | | $ | 1,120 | | | $ | 2,918 | | | $ | 9,770 | | | $ | 10,410 | | | $ | 6,943 | | | $ | 1,708 | | | $ | 3,127 | | | $ | 2,275 | |
| | | | | | | | | | | | | | | | | | | | | | | | | | | | | | | | | | | | |
The amount of accumulated other comprehensive income that was reclassified as a component of net period benefit cost in fiscal 2012 was $0.3 million. The amount in accumulated other comprehensive income that is expected to be recognized as a component of net periodic benefit cost in fiscal 2013 is $0.3 million.
68
Molex Incorporated
Notes to Consolidated Financial Statements — (Continued)
Plan Assets
Our overall investment strategy for the assets in the pension funds is to achieve a balance between the goals of growing plan assets and keeping risks at a reasonable level over a long-term investment horizon. In order to reduce unnecessary risk, the pension funds are diversified across several asset classes with a focus on total return. The target U.S. pension asset allocation is 67% public equity investments and 33% fixed income investments. The fair value of our pension plan assets at June 30, 2012 by asset category are as follows:
| | | | | | | | | | | | | | | | |
| | | Total
Measured
at Fair
Value | | | Quoted Prices
in Active
Markets for
Identical
Assets
(Level 1) | | | Significant
Other
Observable
Inputs
(Level 2) | | | Significant
Unobservable
Inputs
(Level 3) | |
U.S. Plans: | | | | | | | | | | | | | | | | |
Cash and marketable securities | | $ | 155 | | | $ | 155 | | | $ | — | | | $ | — | |
Equity | | | | | | | | | | | | | | | | |
Domestic large-cap | | | 15,425 | | | | 15,425 | | | | — | | | | — | |
Domestic mid-cap growth | | | 15,423 | | | | 15,423 | | | | — | | | | — | |
International large-cap | | | 14,182 | | | | 14,182 | | | | — | | | | — | |
Other | | | 2,007 | | | | 2,007 | | | | — | | | | — | |
Fixed Income | | | | | | | | | | | | | | | | |
Corporate bonds | | | 22,643 | | | | 22,643 | | | | — | | | | — | |
| | | | | | | | | | | | | | | | |
Total U.S. Plans | | | 69,835 | | | | 69,835 | | | | — | | | | — | |
Non-U.S. Plans: | | | | | | | | | | | | | | | | |
Cash and marketable securities | | $ | 10,551 | | | $ | 10,551 | | | $ | — | | | $ | — | |
Equity | | | | | | | | | | | | | | | | |
Domestic large-cap | | | 12,294 | | | | — | | | | 12,294 | | | | — | |
International large-cap | | | 14,428 | | | | 3,353 | | | | 11,075 | | | | — | |
Other | | | 6,051 | | | | 6,051 | | | | — | | | | — | |
Fixed Income | | | | | | | | | | | | | | | | |
International government bond funds | | | 27,316 | | | | 20,959 | | | | 6,357 | | | | — | |
Other | | | 2,982 | | | | 2,982 | | | | — | | | | — | |
Real estate property | | | 1,170 | | | | — | | | | — | | | | 1,170 | |
Other | | | 8,092 | | | | — | | | | — | | | | 8,092 | |
| | | | | | | | | | | | | | | | |
Total Non-U.S. Plans | | | 82,884 | | | | 43,896 | | | | 29,726 | | | | 9,262 | |
| | | | | | | | | | | | | | | | |
Total | | $ | 152,719 | | | $ | 113,731 | | | $ | 29,726 | | | $ | 9,262 | |
| | | | | | | | | | | | | | | | |
69
Molex Incorporated
Notes to Consolidated Financial Statements — (Continued)
The fair value of our pension plan assets at June 30, 2011 by asset category are as follows:
| | | | | | | | | | | | | | | | |
| | | Total
Measured
at Fair
Value | | | Quoted Prices
in Active
Markets for
Identical
Assets
(Level 1) | | | Significant
Other
Observable
Inputs
(Level 2) | | | Significant
Unobservable
Inputs
(Level 3) | |
U.S. Plans: | | | | | | | | | | | | | | | | |
Cash and marketable securities | | $ | 307 | | | $ | 307 | | | $ | — | | | $ | — | |
Equity | | | | | | | | | | | | | | | | |
Domestic large-cap | | | 14,672 | | | | 14,672 | | | | — | | | | — | |
Domestic mid-cap growth | | | 15,653 | | | | 15,653 | | | | — | | | | — | |
International large-cap | | | 16,767 | | | | 16,767 | | | | — | | | | — | |
Emerging markets growth | | | 2,218 | | | | 2,218 | | | | — | | | | — | |
Fixed Income | | | | | | | | | | | | | | | | |
Domestic bond funds | | | 21,144 | | | | 21,144 | | | | — | | | | — | |
| | | | | | | | | | | | | | | | |
Total U.S. Plans | | | 70,761 | | | | 70,761 | | | | — | | | | — | |
Non-U.S. Plans: | | | | | | | | | | | | | | | | |
Cash and marketable securities | | $ | 5,131 | | | $ | 5,131 | | | $ | — | | | $ | — | |
Equity | | | | | | | | | | | | | | | | |
Domestic large-cap | | | 12,064 | | | | 12,064 | | | | — | | | | — | |
International large-cap | | | 16,635 | | | | 16,635 | | | | — | | | | — | |
Other | | | 3,883 | | | | 3,883 | | | | — | | | | — | |
Fixed Income | | | | | | | | | | | | | | | | |
International government bond funds | | | 23,265 | | | | 23,625 | | | | — | | | | — | |
Other | | | 778 | | | | 778 | | | | — | | | | — | |
Real estate | | | 1,687 | | | | — | | | | 1,687 | | | | — | |
Other | | | 8,424 | | | | 24 | | | | 8,400 | | | | — | |
| | | | | | | | | | | | | | | | |
Total Non-U.S. Plans | | | 71,867 | | | | 62,140 | | | | 10,087 | | | | — | |
| | | | | | | | | | | | | | | | |
Total | | | 142,628 | | | | 132,901 | | | | 10,087 | | | | — | |
| | | | | | | | | | | | | | | | |
The following table summarizes the changes in Level 3 pension benefits plan assets measured at fair value on a recurring basis for the period ended June 30, 2012 (in thousands):
| | | | | | | | | | | | | | | | | | | | | | | | |
| | | Fair Value at
July 1,
2011 | | | Return
on plan
assets | | | Net
purchases/
sales | | | Net transfers
into/(out of)
level 3 | | | Reclassifications | | | Fair Value at
June 30,
2012 | |
Asset Category | | | | | | | | | | | | | | | | | | | | | | | | |
Real estate property | | $ | — | | | $ | (295 | ) | | $ | (8 | ) | | $ | 1,473 | | | $ | — | | | $ | 1,170 | |
Other | | | — | | | | — | | | | — | | | | — | | | | 8,092 | | | | 8,092 | |
Funding Expectations
Expected funding for the U.S. pension plan and other postretirement benefit plans for fiscal 2013 is approximately $2.0 million and $1.0 million, respectively. Expected funding for the non-U.S. plans during fiscal 2013 is approximately $16.4 million.
70
Molex Incorporated
Notes to Consolidated Financial Statements — (Continued)
Estimated Future Benefit Payments
The total benefits to be paid from the U.S. and non-U.S. pension plans and other postretirement benefit plans are not expected to exceed $16.0 million in any year through 2022.
Significant Concentrations of Risk.
Significant concentrations of risk in our plan assets relate to equity and interest rate risk. In order to ensure assets are sufficient to pay benefits, a portion of plan assets is allocated to equity investments that are expected over time to earn higher returns with more volatility than fixed income investments which more closely match pension liabilities. Within equities, risk is mitigated by constructing a portfolio that is broadly diversified by geography, market capitalization, manager mandate size, investment style and process.
In order to minimize asset volatility relative to the liabilities, a portion of plan assets are allocated to fixed income investments that are exposed to interest rate risk. Rate increases generally will result in a decline in fixed income assets while reducing the present value of the liabilities. Conversely, rate decreases will increase fixed income assets, partially offsetting the related increase in the liabilities.
Remeasurement/Curtailment
In fiscal 2011, we amended a defined benefit pension plan in the U.S. and remeasured the pension liability, resulting in an $11.8 million reduction in the liability as recorded in other comprehensive income.
In fiscal 2010, we recognized a $3.8 million pension curtailment gain related to a plant closing in Europe and $1.8 million pension curtailment loss related to a plant closing in Japan.
Multiemployer Pension Plan
In Japan, we participate in the Kanagawaken Densetsu Pension Fund, a multiemployer defined benefit pension plan. The most recent financial statements as of March 31, 2011 disclosed the plan was funded between 65% and 80%. This plan is not currently subject to collective bargaining agreements or a funding improvement plan. Our contributions to the plan, which represent more than 5% of total contributions to the plan, were approximately $5.5 million, $5.0 million and $4.1 million during fiscal 2012, 2011 and 2010, respectively.
71
Molex Incorporated
Notes to Consolidated Financial Statements — (Continued)
Total debt consisted of the following at June 30 (dollars in thousands):
| | | | | | | | | | | | | | | | |
| | | Average
Interest
Rate | | | Calendar
Year
Maturity | | | 2012 | | | 2011 | |
Long-term debt: | | | | | | | | | | | | | | | | |
Private Placement | | | 2.91 - 4.28 | % | | | 2016 - 2012 | | | $ | 150,000 | | | $ | — | |
U.S. Credit Facility | | | 1.75 | % | | | 2016 | | | | — | | | | 185,000 | |
Unsecured bonds and term loans | | | 1.31 - 1.65 | % | | | 2012 - 2013 | | | | 37,556 | | | | 89,342 | |
Mortgages, industrial development bonds and other debt | | | Varies | | | | 2012 - 2013 | | | | 1,091 | | | | 1,528 | |
| | | | | | | | | | | | | | | | |
Total long-term debt | | | | | | | | | | | 188,647 | | | | 275,870 | |
Less current portion of long-term debt: | | | | | | | | | | | | | | | | |
Unsecured bonds and term loans | | | 1.31 - 1.65 | % | | | | | | | 37,556 | | | | 52,156 | |
Mortgages, industrial development bonds and other debt | | | Varies | | | | | | | | 1,059 | | | | 920 | |
| | | | | | | | | | | | | | | | |
Long-term debt, less current portion | | | | | | | | | | | 150,032 | | | | 222,794 | |
Short-term borrowings | | | | | | | | | | | | | | | | |
Overdraft loan | | | 1.98 | % | | | 2012 | | | | 62,645 | | | | 62,060 | |
Other short-term borrowings | | | Varies | | | | | | | | 3,673 | | | | 4,628 | |
| | | | | | | | | | | | | | | | |
Total short-term borrowings | | | | | | | | | | | 66,318 | | | | 66,688 | |
| | | | | | | | | | | | | | | | |
Total debt | | | | | | | | | | $ | 254,965 | | | $ | 342,558 | |
| | | | | | | | | | | | | | | | |
On August 18, 2011, we issued senior notes totaling $150.0 million through an unregistered, private placement of debt (the Private Placement). The Private Placement consists of three $50.0 million series notes: Series A with an interest rate of 2.91% matures on August 18, 2016; Series B with an interest rate of 3.59% matures on August 18, 2018; and Series C with an interest rate of 4.28% matures on August 18, 2021. The Note Purchase Agreement contains customary covenants regarding liens, debt, substantial asset sales and mergers. The Note Purchase Agreement also requires us to maintain financial covenants pertaining to, among other things, our consolidated leverage and interest rate coverage. As of June 30, 2012, we were in compliance with these covenants and the balance of the senior notes was $150.0 million.
In June 2009, we entered into a $195.0 million unsecured, three-year revolving credit facility in the United States, amended in January 2010, September 2010 and March 2011, that was initially scheduled to mature in June 2012 (the U.S. Credit Facility). In connection with the September 2010 amendment, we increased the credit line on the U.S. Credit Facility to $270.0 million. In March 2011, we further amended the U.S. Credit Facility to increase the credit line to $350.0 million and extend the term to March 2016. Borrowings under the U.S. Credit Facility bear interest at a fluctuating interest rate (based on London InterBank Offered Rate) plus an applicable percentage based on our consolidated leverage. The applicable percentage was 150 basis points as of June 30, 2012. The instrument governing the U.S. Credit Facility contains customary covenants regarding liens, debt, substantial asset sales and mergers, dividends and investments. The U.S. Credit Facility also requires us to maintain financial covenants pertaining to, among other things, our consolidated leverage and fixed charge coverage. As of June 30, 2012, we were in compliance with these covenants and had no outstanding borrowings.
72
Molex Incorporated
Notes to Consolidated Financial Statements — (Continued)
In March 2012, Molex Japan renewed a ¥5.0 billion overdraft loan, with a six month term and an interest rate of approximately 1.98%. At June 30, 2012, the balance of the overdraft loan, which requires full repayment by the end of the term if not renewed, approximated $62.6 million.
In March 2010, Molex Japan entered into a ¥3.0 billion syndicated term loan for three years, with interest rates equivalent to six month Tokyo InterBank Offered Rate (TIBOR) plus 75 basis points and scheduled principal payments of ¥0.5 billion every six months (Syndicated Term Loan). At June 30, 2012, the balance of the syndicated term loan approximated $12.5 million, which is classified as current.
In September 2009, Molex Japan issued unsecured bonds totaling ¥10.0 billion with a term of three years, an interest rate of approximately 1.65% and scheduled principal payments of ¥1.6 billion every six months. At June 30, 2012, the outstanding balance of the unsecured bonds approximated $25.1 million, which is classified as current.
Certain assets, including land, buildings and equipment, secure a portion of our long-term debt. Principal payments on long-term debt obligations are due as follows as of June 30, 2012 (in thousands):
| | | | |
Year one | | $ | 38,615 | |
Year two | | | 32 | |
Year three | | | — | |
Year four | | | — | |
Year five | | | 50,000 | |
Thereafter | | | 100,000 | |
| | | | |
Total long-term debt obligations | | $ | 188,647 | |
| | | | |
We had available lines of credit totaling $444.4 million at June 30, 2012, including $350.0 million available on the U.S. Credit Facility. The lines of credit expire between 2012 and 2016.
We rent certain facilities and equipment under operating lease arrangements. Some of the leases have renewal options. Future minimum lease payments are presented below (in thousands):
| | | | |
Year ending June 30: | | | | |
2013 | | $ | 16,017 | |
2014 | | | 9,873 | |
2015 | | | 5,579 | |
2016 | | | 4,194 | |
2017 | | | 3,190 | |
2018 and thereafter | | | 1,858 | |
| | | | |
Total lease payments | | $ | 40,711 | |
| | | | |
Rental expense was $17.6 million, $16.6 million and $13.5 million in fiscal 2012, 2011 and 2010, respectively.
73
Molex Incorporated
Notes to Consolidated Financial Statements — (Continued)
| 15. | Fair Value Measurements |
In accordance with ASC 820-10, fair value measurements are classified under the following hierarchy:
| | • | | Level 1: Observable inputs such as quoted prices for identical assets or liabilities in active markets. |
| | • | | Level 2: Observable inputs other than quoted prices substantiated by market data and observable, either directly or indirectly for the asset or liability. This includes quoted prices for similar assets or liabilities in active markets. |
| | • | | Level 3: Unobservable inputs that are supported by little or no market activity and that are significant to the fair value of the assets and liabilities. |
The following table summarizes our financial assets and liabilities which are measured at fair value on a recurring basis and subject to the disclosure requirements of ASC 820-10 as of June 30, 2012 (in thousands):
| | | | | | | | | | | | | | | | |
| | | Total
Measured
at Fair
Value | | | Quoted Prices
in Active
Markets for
Identical
Assets
(Level 1) | | | Significant
Other
Observable
Inputs
(Level 2) | | | Significant
Unobservable
Inputs
(Level 3) | |
Available-for-sale and trading securities | | $ | 29,651 | | | $ | 29,651 | | | $ | — | | | $ | — | |
Derivative financial instruments, net | | | 7,029 | | | | — | | | | 7,029 | | | | — | |
We determine the fair value of our available-for-sale securities based on quoted market prices (Level 1). We generally use derivatives for hedging purposes pursuant to ASC 815-10, which are valued based on Level 2 inputs in the ASC 820 fair value hierarchy. The fair value of our derivative financial instruments is determined by a mark-to-market valuation based on forward curves using observable market prices.
| 16. | Derivative Instruments and Hedging Activities |
We use derivative instruments to manage our foreign exchange and commodity cost exposures. All derivative instruments are recognized at fair value in other current assets or liabilities.
Derivatives Not Designated as Hedging Instruments
We use one-month foreign currency forward contracts (forward contracts) to offset the impact of exchange rate volatility on certain assets and liabilities, including intercompany receivables and payables denominated in non-functional currencies. These forward contracts have not been designated as hedges, and the gains or losses on these forward contracts, along with the offsetting losses or gains due to the fluctuation of exchange rates on the underlying foreign currency denominated assets and liabilities, are recognized in other income (expense). The notional amounts of the forward contracts were $223.3 million and $175.6 million at June 30, 2012 and 2011, respectively, with corresponding fair values of a $2.6 million asset at June 30, 2012 and $2.7 asset at June 30, 2011.
Cash Flow Hedges
We use derivatives in the form of call options to hedge the variability of gold and copper costs. These derivative instruments are designated as cash flow hedges and hedge approximately 60% of our planned gold and copper purchases. Gains and losses of the effective hedges are recorded as a
74
Molex Incorporated
Notes to Consolidated Financial Statements — (Continued)
component of accumulated other comprehensive income (AOCI) and reclassified to cost of sales during the period the commodity is sold. The fair values of the call options were $4.4 million, $7.8 million and $5.4 million at June 30, 2012, 2011 and 2010, respectively.
For the fiscal years ending June 30, 2012, 2011 and 2010, the impact to AOCI and earnings from cash flow hedges before taxes follows (in thousands):
| | | | | | | | | | | | |
| | | 2012 | | | 2011 | | | 2010 | |
Unrealized (loss) gain recognized in AOCI | | $ | (7,197 | ) | | $ | 231 | | | $ | 2,092 | |
Realized gain reclassified into earnings | | | 6,707 | | | | 7,119 | | | | 5,081 | |
At June 30, 2012, $7.2 million is expected to be reclassified from AOCI to cost of sales within the next 12 months.
The shares of Common Stock, Class A Common Stock and Class B Common Stock are identical except as to voting rights. Class A Common Stock has no voting rights except in limited circumstances. So long as more than 50% of the authorized number of shares of Class B Common Stock continues to be outstanding, all matters submitted to a vote of the stockholders, other than the election of directors, must be approved by a majority of the Class B Common Stock, voting as a class, and by a majority of the Common Stock, voting as a class. During such period, holders of a majority of the Class B Common Stock could veto corporate action, other than the election of directors, which requires stockholder approval. There are 25 million shares of preferred stock authorized, none of which were issued or outstanding during the three years ended June 30, 2012.
The Class B Common Stock can be converted into Common Stock on a share-for-share basis at any time at the option of the holder. The authorized Class A Common Stock would automatically convert into Common Stock on a share-for-share basis at the discretion of the Board of Directors upon the occurrence of certain events. Upon such conversion, the voting interests of the holders of Common Stock and Class B Common Stock would be diluted. Our Class B Common Stock outstanding has remained at 94,255 shares during the three years ended June 30, 2012.
The holders of the Common Stock, Class A Common Stock and Class B Common Stock participate equally, share-for-share, in any dividends that may be paid thereon if, as and when declared by the Board of Directors or in any assets available upon our liquidation or dissolution.
75
Molex Incorporated
Notes to Consolidated Financial Statements — (Continued)
Changes in common stock for the years ended June 30 follows (in thousands):
| | | | | | | | | | | | | | | | | | | | | | | | |
| | | Common Stock | | | Class A
Common Stock | | | Treasury Stock | |
| | | Shares | | | Amount | | | Shares | | | Amount | | | Shares | | | Amount | |
Outstanding at June 30, 2009 | | | 112,204 | | | $ | 5,610 | | | | 110,468 | | | $ | 5,523 | | | | (49,433 | ) | | $ | (1,089,322 | ) |
| | | | | | | | | | | | | | | | | | | | | | | | |
Exercise of stock options | | | — | | | | — | | | | 1,293 | | | | 65 | | | | (509 | ) | | | (8,765 | ) |
Issuance of stock awards | | | — | | | | — | | | | 1 | | | | — | | | | — | | | | — | |
Other | | | — | | | | — | | | | 77 | | | | 4 | | | | — | | | | — | |
| | | | | | | | | | | | | | | | | | | | | | | | |
Outstanding at June 30, 2010 | | | 112,204 | | | $ | 5,610 | | | | 111,839 | | | $ | 5,592 | | | | (49,942 | ) | | $ | (1,098,087 | ) |
Exercise of stock options | | | — | | | | — | | | | 1,484 | | | | 74 | | | | (414 | ) | | | (7,952 | ) |
Issuance of stock awards | | | — | | | | — | | | | 1 | | | | — | | | | — | | | | — | |
Other | | | — | | | | — | | | | 76 | | | | 4 | | | | — | | | | — | |
| | | | | | | | | | | | | | | | | | | | | | | | |
Outstanding at June 30, 2011 | | | 112,204 | | | $ | 5,610 | | | | 113,400 | | | $ | 5,670 | | | | (50,356 | ) | | $ | (1,106,039 | ) |
Exercise of stock options | | | — | | | | — | | | | 1,435 | | | | 71 | | | | (362 | ) | | | (6,917 | ) |
Other | | | — | | | | — | | | | 75 | | | | 5 | | | | — | | | | — | |
| | | | | | | | | | | | | | | | | | | | | | | | |
Outstanding at June 30, 2012 | | | 112,204 | | | $ | 5,610 | | | | 114,910 | | | $ | 5,746 | | | | (50,718 | ) | | $ | (1,112,956 | ) |
| | | | | | | | | | | | | | | | | | | | | | | | |
| 18. | Accumulated Other Comprehensive Income |
The components of accumulated other comprehensive income for the fiscal years ended June 30 follows (in thousands):
| | | | | | | | |
| | | 2012 | | | 2011 | |
Foreign currency translation adjustments | | $ | 338,099 | | | $ | 403,155 | |
Pension adjustments, net of tax | | | (50,023 | ) | | | (26,679 | ) |
Unrealized (loss) gain on derivative instruments, net of tax | | | (2,783 | ) | | | 1,893 | |
Unrealized gain on investments, net of tax | | | 1,102 | | | | 2,074 | |
| | | | | | | | |
Total | | $ | 286,395 | | | $ | 380,443 | |
| | | | | | | | |
Share-based compensation is comprised of expense related to stock options and stock awards. Share-based compensation cost was $23.3 million, $22.5 million and $27.0 million for fiscal 2012, 2011 and 2010, respectively. The income tax benefits related to share-based compensation were $8.5 million, $8.2 million and $9.9 million for fiscal 2012, 2011 and 2010, respectively.
Stock Options
For fiscal 2012, 2011 and 2010, stock options that we grant to employees who are not executive officers (“non-officer employees”) are options to purchase Class A Common Stock at an exercise price that is 100% of the fair market value of the stock on the grant date. These grants generally vest 25% per year beginning the first anniversary date of the grant with a term of 10 years.
Prior to fiscal 2009, stock options granted to non-officer employees were options to purchase Class A Common Stock at an exercise price that was generally 50% of the fair market value of the stock on the grant date. These grants generally vest 25% per year beginning the first anniversary date of the grant with a term of five years. Discounted stock options to U.S.-based non-officer employees are automatically exercised on the vesting date.
76
Molex Incorporated
Notes to Consolidated Financial Statements — (Continued)
The stock options that are approved for grant to executive officers and directors are generally options to purchase Class A Common Stock at an exercise price that is 100% of the fair market value of the stock on the grant date. These grants generally vest 25% per year beginning the first anniversary date of the award with a term of 10 years. The total number of shares authorized for stock option grants to employees, executive officers and directors is 30.0 million.
Stock option transactions are summarized as follows (exercise price represents a weighted-average, shares in thousands):
| | | | | | | | |
| | | Shares | | | Exercise
Price | |
Outstanding at June 30, 2009 | | | 10,818 | | | $ | 19.83 | |
Granted | | | 1,095 | | | | 15.98 | |
Exercised | | | (829 | ) | | | 12.76 | |
Forfeited or expired | | | (2,186 | ) | | | 22.56 | |
| | | | | | | | |
Outstanding at June 30, 2010 | | | 8,898 | | | $ | 19.27 | |
Granted | | | 2,871 | | | | 18.34 | |
Exercised | | | (929 | ) | | | 12.32 | |
Forfeited or expired | | | (1,027 | ) | | | 23.42 | |
| | | | | | | | |
Outstanding at June 30, 2011 | | | 9,813 | | | $ | 18.96 | |
Granted | | | 2,087 | | | | 16.01 | |
Exercised | | | (821 | ) | | | 13.17 | |
Forfeited or expired | | | (951 | ) | | | 28.35 | |
| | | | | | | | |
Outstanding at June 30, 2012 | | | 10,128 | | | $ | 17.94 | |
| | | | | | | | |
Exercisable at June 30, 2012 | | | 4,511 | | | $ | 19.66 | |
| | | | | | | | |
At June 30, 2012, exercisable options had an aggregate intrinsic value of $11.5 million with a weighted-average remaining contractual life of 3.9 years. In addition, there were 5.4 million options expected to vest, after consideration of expected forfeitures, with an aggregate intrinsic value of $20.7 million. Total options outstanding had an aggregate intrinsic value of $33.0 million with a weighted-average remaining contractual life of 6.1 years. The total intrinsic value of options exercised during fiscal 2012, 2011 and 2010 was $6.6 million, $7.8 million and $4.2 million, respectively.
77
Molex Incorporated
Notes to Consolidated Financial Statements — (Continued)
We use the Black-Scholes option-pricing model to estimate the fair value of each option grant as of the date of grant. Expected volatilities are based on historical volatility of our common stock. We estimate the expected life of the option using historical data pertaining to option exercises. Separate groups of employees that have similar historical exercise behavior are considered separately for estimating the expected life. The risk-free interest rate is based on U.S. Treasury yields in effect at the time of grant. The estimated weighted-average fair values of and related assumptions for options granted were as follows:
| | | | | | | | | | | | |
| | | 2012 | | | 2011 | | | 2010 | |
Weighted-average fair value of options granted: | | | | | | | | | | | | |
At market value of underlying stock | | $ | 3.20 | | | $ | 4.33 | | | $ | 4.49 | |
At less than market value of underlying stock | | | n/a | | | $ | n/a | | | $ | n/a | |
Assumptions: | | | | | | | | | | | | |
Dividend yield | | | 5.02 | % | | | 3.49 | % | | | 3.82 | % |
Expected volatility | | | 36.76 | % | | | 35.76 | % | | | 35.62 | % |
Risk-free interest rate | | | 1.32 | % | | | 1.80 | % | | | 3.70 | % |
Expected life of option (years) | | | 5.93 | | | | 6.53 | | | | 7.94 | |
At June 30, 2012, there were options outstanding to purchase 10.1 million shares of Class A Common Stock.
Stock Awards
Stock awards are generally comprised of stock units that are convertible into shares of Class A Common Stock. Generally, these grants vest 25% per year over four years beginning the first anniversary date of the award. Stock awards transactions are summarized as follows (shares in thousands):
| | | | | | | | |
| | | Shares | | | Fair
Value | |
Nonvested shares at June 30, 2009 | | | 1,296 | | | $ | 21.03 | |
Granted | | | 587 | | | | 15.97 | |
Vested | | | (464 | ) | | | 22.14 | |
Forfeited | | | (48 | ) | | | 23.97 | |
| | | | | | | | |
Nonvested shares at June 30, 2010 | | | 1,371 | | | $ | 18.47 | |
Granted | | | 1,003 | | | | 17.52 | |
Vested | | | (555 | ) | | | 20.08 | |
Forfeited | | | (5 | ) | | | 15.63 | |
| | �� | | | | | | |
Nonvested shares at June 30, 2011 | | | 1,814 | | | $ | 17.45 | |
Granted | | | 1,063 | | | | 16.20 | |
Vested | | | (614 | ) | | | 17.85 | |
Forfeited | | | (1 | ) | | | 22.58 | |
| | | | | | | | |
Nonvested shares at June 30, 2012 | | | 2,262 | | | $ | 16.75 | |
| | | | | | | | |
At June 30, 2012, there was $45.8 million of total unrecognized compensation cost related to the above nonvested stock awards. We expect to recognize the cost of these stock awards over a weighted-average period of 2.7 years. The total fair value of shares vested during fiscal 2012, 2011 and 2010 was $11.0 million, $11.2 million and $10.2 million, respectively.
78
Molex Incorporated
Notes to Consolidated Financial Statements — (Continued)
Directors’ Deferred Compensation Plan
Our non-employee directors are eligible to participate in a deferred compensation plan under which they may elect on a yearly basis to defer all or a portion of the following year’s compensation. A participant may elect to have the deferred amount (a) accrue interest during each calendar quarter at a rate equal to the average six month Treasury Bill rate in effect at the beginning of each calendar quarter, or (b) credited as stock “units” whereby each unit is equal to one share of Common Stock. The cumulative amount that is deferred for each participating director is subject to the claims of our general creditors.
If a non-employee director elects to have his or her compensation deferred as stock units, the compensation earned for a given quarter is converted to stock units at the closing price of common stock on the date the compensation would otherwise be paid. Stock units are distributed in shares of common stock.
We are currently a party to various legal proceedings, claims and investigations including those disclosed below. While management presently believes that the ultimate outcome of these proceedings, individually and in the aggregate, will not materially adversely affect our financial position, legal proceedings are subject to inherent uncertainties, and unfavorable rulings or other events could occur. If one or more unfavorable final outcomes were to occur, then our business could be materially and adversely affected.
Employment and Benefits Litigation
In 2009, Molex Automotive SARL (MAS), decided to close a facility it operated in Villemur-sur-Tarn, France. MAS submitted a social plan to MAS’s labor representatives providing for payments to approximately 280 terminated employees. This social plan was adopted by MAS in 2009 and payments were made to those employees until September 2010. In September 2010, former employees of MAS who were covered under the social plan filed suit against MAS and AGS (a state fund for wage guarantee) in the Toulouse Labor Court, requesting additional compensation. The total amount sought by the former employees is approximately€24.0 million ($30.4 million). Molex International initiated liquidation of MAS, and pursuant to a court proceeding, a liquidator was appointed in November 2010. One of the liquidator’s responsibilities is to assess and respond to the lawsuits involving MAS. In June 2011, the former employees of MAS noticed Molex Incorporated (Molex) as a defendant to the Toulouse Labor Court proceedings. In their court submission, the former employees claim that Molex was a co-employer of the former employees and thus jointly liable for any additional compensation the court awards. The former employees also claim that there was no economic justification for their dismissal, that MAS decided to close the facility before it consulted with the employees and their representatives and that MAS did not adequately comply with its obligation to assist the terminated employees in obtaining alternative employment. The liquidator has filed a submission on behalf of MAS and argues that the dismissal was economically justified, that the former employees have not proven the damages they are seeking but nonetheless Molex was co-employer and thus liable for any additional payments that may be awarded to the former employees. AGS filed its submission, adopting essentially the same substantive position as the liquidator on the dismissal of the former employees but arguing that Molex was the employer.
Molex filed its briefs in reply on January 6, 2012 arguing the plaintiff’s claims be dismissed. In the reply briefs, Molex argued it was not the co-employer of the plaintiffs and the court should find that it lacks jurisdiction over Molex to hear the dispute. In the alternative, Molex argued there was no breach of the information consultation process with the employees and their representatives, the dismissals
79
Molex Incorporated
Notes to Consolidated Financial Statements — (Continued)
were valid and based on economic grounds, MAS complied with its redeployment obligations and the court dismiss the claims for damages. Molex also argued if the court were to award compensation, then any judgment against Molex be several but not jointly with MAS, and the amount awarded to plaintiffs not exceed six months’ salary, approximately€2.0 million ($2.5 million).
On February 24, 2012, the five former employees who fall within the executive section submitted a reply brief and requested a postponement of the March 5, 2012 court date. The court granted the request and rescheduled separate court dates in 2012 for each plaintiff as follows: June 25, July 9, September 24, October 8 and December 17. On June 25, 2012, one plaintiff withdrew his claims against Molex and on July 9, 2012, the court adjourned to consider whether it has jurisdiction over Molex and is expected to issue a decision on November 5, 2012.
On April 5, 2012, the Toulouse Labor Court held a hearing for the other 190 employees who fall within the industry section. The parties presented their arguments regarding whether the court has jurisdiction over Molex.
On June 28, 2012, the Toulouse Labor Court ruled it has jurisdiction over Molex and on July 12, 2012, Molex filed 190 appeals (one for each plaintiff) with the Toulouse Appellate Court contesting jurisdiction.
On March 29, 2012, Molex received notice that the liquidator filed an action against Molex in the Commercial Court of Paris claiming Molex is responsible for the liabilities of MAS that remain as a result of the liquidation. The liquidator alleged that Molex acted as de facto manager of MAS and mismanaged MAS. Although the liabilities are currently estimated at€1.9 million ($2.4 million), future liabilities of MAS may also include any amounts successfully awarded to plaintiffs’ in their lawsuits against MAS (described above). Molex intends to file a brief opposing the liquidator’s claims before the next court date, September 10, 2012.
We intend to vigorously contest the attempt by the former employees to seek additional compensation from Molex, and the liquidator’s attempt to hold Molex responsible for the liabilities of MAS.
Molex Japan Co., Ltd
As we previously reported in our fiscal 2010 Annual Report on Form 10-K, we launched an investigation into unauthorized activities at Molex Japan Co., Ltd. in April 2010. We learned that an individual working in Molex Japan’s finance group obtained unauthorized loans from third party lenders, that included in at least one instance the attempted unauthorized pledge of Molex Japan facilities as security, in Molex Japan’s name that were used to cover losses resulting from unauthorized trading, including margin trading, in Molex Japan’s name. We also learned that the individual misappropriated funds from Molex Japan’s accounts to cover losses from unauthorized trading. The individual admitted to forging documentation in arranging and concealing the transactions. We retained outside legal counsel, and they retained forensic accountants, to investigate the matter. The investigation has been completed.
On August 31, 2010, Mizuho Bank (Mizuho), which holds the unauthorized loans, filed a complaint in Tokyo District Court requesting the court to find Molex Japan liable for the payment of the outstanding unauthorized loans and to enter a judgment for such payment. Mizuho is claiming payment of outstanding principal borrowings of ¥3 billion ($37.6 million), ¥5 billion ($62.6 million), ¥5 billion ($62.6 million) and ¥2 billion ($25.1 million), other loan-related expenses of approximately ¥106 million ($1.3 million) and interest and delay damages of approximately ¥4.6 billion ($58.1 million) as of June 30, 2012. On October 13, 2010, Molex Japan filed a written answer requesting the court to dismiss the complaint and subsequently both parties have submitted additional briefs and witness statements. In May 2012, the court received witness testimony after which it scheduled a final hearing on September 5, 2012 and
80
Molex Incorporated
Notes to Consolidated Financial Statements — (Continued)
requested final briefs by the end of August. We intend to vigorously contest the enforceability of the outstanding unauthorized loans and any attempt by the lender to obtain payment. See Note 3 of the Notes to Consolidated Financial Statements for accounting treatment of the accrual for unauthorized activities in Japan.
As we reported on April 29, 2011, the SEC has informed us that the SEC has issued a formal order of private investigation in connection with the unauthorized activities in Molex Japan. We are fully cooperating with the SEC’s investigation.
| 21. | Segment and Related Information |
We have two global product reportable segments: Connector and Custom & Electrical. The reportable segments represent an aggregation of three operating segments.
| | • | | The Connector segment designs and manufactures products for high-speed, high-density, high signal-integrity applications as well as fine-pitch, low-profile connectors for the consumer and commercial markets. It also designs and manufactures products that withstand environments such as heat, cold, dust, dirt, liquid and vibration for automotive and other transportation applications. |
| | • | | The Custom & Electrical segment designs and manufactures integrated and customizable electronic components across all industries that provide original, differentiated solutions to customer requirements. It also leverages expertise in the use of signal, power and interface technology in industrial automation and other harsh environment applications. |
Information by segment for the years ended June 30 is summarized as follows (in thousands):
| | | | | | | | | | | | | | | | |
| | | Connector | | | Custom &
Electrical | | | Corporate
& Other | | | Total | |
2012: | | | | | | | | | | | | | | | | |
Net revenue from external customers | | $ | 2,459,969 | | | $ | 1,028,140 | | | $ | 1,080 | | | $ | 3,489,189 | |
Income (loss) from operations(1) | | | 344,387 | | | | 172,803 | | | | (117,718 | ) | | | 399,472 | |
Depreciation & amortization | | | 193,561 | | | | 27,495 | | | | 15,918 | | | | 236,974 | |
Capital expenditures | | | 191,789 | | | | 21,353 | | | | 13,959 | | | | 227,101 | |
2011: | | | | | | | | | | | | | | | | |
Net revenue from external customers | | $ | 2,600,469 | | | $ | 985,120 | | | $ | 1,745 | | | $ | 3,587,334 | |
Income (loss) from operations(1) | | | 396,233 | | | | 154,370 | | | | (120,404 | ) | | | 430,199 | |
Depreciation & amortization | | | 197,173 | | | | 28,607 | | | | 16,391 | | | | 242,171 | |
Capital expenditures | | | 225,608 | | | | 24,065 | | | | 12,573 | | | | 262,246 | |
2010: | | | | | | | | | | | | | | | | |
Net revenue from external customers | | $ | 2,177,014 | | | $ | 828,905 | | | $ | 1,288 | | | $ | 3,007,207 | |
Income (loss) from operations(1) | | | 123,980 | | | | 111,083 | | | | (97,261 | ) | | | 137,802 | |
Depreciation & amortization | | | 189,937 | | | | 33,421 | | | | 15,308 | | | | 238,666 | |
Capital expenditures | | | 203,095 | | | | 15,678 | | | | 10,704 | | | | 229,477 | |
81
Molex Incorporated
Notes to Consolidated Financial Statements — (Continued)
| (1) | Operating results include the following charges (in thousands): |
| | | | | | | | | | | | | | | | |
| | | Connector | | | Custom &
Electrical | | | Corporate
& Other | | | Total | |
Fiscal 2012: | | | | | | | | | | | | | | | | |
Unauthorized activities in Japan (Note 3) | | $ | — | | | $ | — | | | $ | 11,259 | | | $ | 11,259 | |
Fiscal 2011: | | | | | | | | | | | | | | | | |
Unauthorized activities in Japan (Note 3) | | $ | — | | | $ | — | | | $ | 14,476 | | | $ | 14,476 | |
Fiscal 2010: | | | | | | | | | | | | | | | | |
Restructuring costs and asset Impairments (Note 6) | | $ | 100,273 | | | $ | 12,234 | | | $ | 4,398 | | | $ | 116,905 | |
Unauthorized activities in Japan (Note 3) | | | — | | | | — | | | | 26,898 | | | | 26,898 | |
Corporate & Other includes expenses primarily related to corporate operations that are not allocated to segments such as executive management, human resources, legal, finance and information technology. We also include in Corporate & Other the assets of certain plants that are not specific to a particular division.
Customer net revenue and net property, plant and equipment by significant countries are summarized as follows (in thousands):
| | | | | | | | | | | | |
| | | 2012 | | | 2011 | | | 2010 | |
Customer net revenue: | | | | | | | | | | | | |
United States | | $ | 893,142 | | | $ | 849,521 | | | $ | 568,839 | |
Japan | | | 492,958 | | | | 563,496 | | | | 541,126 | |
China | | | 1,128,339 | | | | 1,133,561 | | | | 833,759 | |
Net property, plant and equipment: | | | | | | | | | | | | |
United States | | $ | 270,226 | | | $ | 202,291 | | | $ | 271,018 | |
Japan | | | 287,959 | | | | 288,498 | | | | 264,477 | |
China | | | 317,477 | | | | 301,672 | | | | 274,642 | |
Segment assets, which are comprised of accounts receivable, inventory and fixed assets, are summarized as follows for the years ended June 30 (in thousands):
| | | | | | | | | | | | | | | | |
| | | Connector | | | Custom &
Electrical | | | Corporate
& Other | | | Total | |
2012 | | $ | 1,846,636 | | | $ | 479,318 | | | $ | 107,699 | | | $ | 2,433,653 | |
2011 | | $ | 1,913,675 | | | $ | 503,443 | | | $ | 98,732 | | | $ | 2,515,850 | |
The reconciliation of segment assets to consolidated total assets at June 30 follows (in thousands):
| | | | | | | | |
| | | 2012 | | | 2011 | |
Segment assets | | $ | 2,433,653 | | | $ | 2,515,850 | |
Other current assets | | | 796,134 | | | | 707,943 | |
Other non-current assets | | | 381,716 | | | | 374,059 | |
| | | | | | | | |
Consolidated total assets | | $ | 3,611,503 | | | $ | 3,597,852 | |
| | | | | | | | |
82
Molex Incorporated
Notes to Consolidated Financial Statements — (Continued)
22. Quarterly Financial Information| 22. | Quarterly Financial Information (Unaudited) |
The following is a condensed summary of our unaudited quarterly results of operations and quarterly earnings per share data for fiscal 2012 (in thousands, except per share data):
| | | | | | | | | | | | | | | | |
| | | First
Quarter | | | Second
Quarter | | | Third
Quarter | | | Fourth
Quarter | |
Net revenue | | $ | 935,985 | | | $ | 857,598 | | | $ | 837,080 | | | $ | 858,526 | |
Gross profit | | | 292,728 | | | | 262,937 | | | | 255,176 | | | | 257,622 | |
Net income | | | 80,517 | | | | 64,016 | | | | 64,883 | | | | 71,961 | |
Basic earnings per share | | | 0.46 | | | | 0.36 | | | | 0.37 | | | | 0.41 | |
Diluted earnings per share | | | 0.46 | | | | 0.36 | | | | 0.36 | | | | 0.40 | |
Fourth quarter net income includes a $6.0 million pre-tax benefit of insurance proceeds for damages from the earthquake and tsunami in Japan that occurred during the third quarter of fiscal 2011.
The following is a condensed summary of our unaudited quarterly results of operations and quarterly earnings per share data for fiscal 2011 (in thousands, except per share data):
| | | | | | | | | | | | | | | | |
| | | First
Quarter | | | Second
Quarter | | | Third
Quarter | | | Fourth
Quarter | |
Net revenue | | $ | 897,672 | | | $ | 901,465 | | | $ | 874,531 | | | $ | 913,666 | |
Gross profit | | | 275,076 | | | | 271,045 | | | | 260,614 | | | | 281,402 | |
Net income | | | 75,104 | | | | 78,283 | | | | 68,145 | | | | 77,276 | |
Basic earnings per share | | | 0.43 | | | | 0.45 | | | | 0.39 | | | | 0.44 | |
Diluted earnings per share | | | 0.43 | | | | 0.45 | | | | 0.39 | | | | 0.44 | |
83
REPORT OF INDEPENDENT REGISTERED PUBLIC ACCOUNTING FIRM
The Board of Directors and Stockholders of Molex Incorporated
We have audited the accompanying consolidated balance sheets of Molex Incorporated as of June 30, 2012 and 2011, and the related consolidated statements of income, stockholders’ equity, and cash flows for each of the three years in the period ended June 30, 2012. Our audits also included the financial statement schedule listed in the Index of Part IV, Item 15. These financial statements and schedule are the responsibility of the Company’s management. Our responsibility is to express an opinion on these financial statements and schedule based on our audits.
We conducted our audits in accordance with the standards of the Public Company Accounting Oversight Board (United States). Those standards require that we plan and perform the audit to obtain reasonable assurance about whether the financial statements are free of material misstatement. An audit includes examining, on a test basis, evidence supporting the amounts and disclosures in the financial statements. An audit also includes assessing the accounting principles used and significant estimates made by management, as well as evaluating the overall financial statement presentation. We believe that our audits provide a reasonable basis for our opinion.
In our opinion, the consolidated financial statements referred to above present fairly, in all material respects, the consolidated financial position of Molex Incorporated at June 30, 2012 and 2011, and the consolidated results of its operations and its cash flows for each of the three years in the period ended June 30, 2012, in conformity with U.S. generally accepted accounting principles. Also, in our opinion, the related financial statement schedule, when considered in relation to the basic financial statements taken as a whole, presents fairly in all material respects the information set forth therein.
We also have audited, in accordance with the standards of the Public Company Accounting Oversight Board (United States), the effectiveness of Molex Incorporated’s internal control over financial reporting as of June 30, 2012, based on criteria established in Internal Control — Integrated Framework issued by the Committee of Sponsoring Organizations of the Treadway Commission and our report dated August 9, 2012 expressed an unqualified opinion thereon.
/s/ Ernst & Young LLP
Chicago, Illinois
August 9, 2012
84
REPORT OF INDEPENDENT REGISTERED PUBLIC ACCOUNTING FIRM
The Board of Directors and Stockholders of Molex Incorporated
We have audited Molex Incorporated’s internal control over financial reporting as of June 30, 2012, based on criteria established in Internal Control — Integrated Framework issued by the Committee of Sponsoring Organizations of the Treadway Commission (the COSO criteria). Molex Incorporated’s management is responsible for maintaining effective internal control over financial reporting, and for its assessment of the effectiveness of internal control over financial reporting included in the accompanying Management’s Report on Internal Control Over Financial Reporting. Our responsibility is to express an opinion on the company’s internal control over financial reporting based on our audit.
We conducted our audit in accordance with the standards of the Public Company Accounting Oversight Board (United States). Those standards require that we plan and perform the audit to obtain reasonable assurance about whether effective internal control over financial reporting was maintained in all material respects. Our audit included obtaining an understanding of internal control over financial reporting, assessing the risk that a material weakness exists, testing and evaluating the design and operating effectiveness of internal control based on the assessed risk, and performing such other procedures as we considered necessary in the circumstances. We believe that our audit provides a reasonable basis for our opinion.
A company’s internal control over financial reporting is a process designed to provide reasonable assurance regarding the reliability of financial reporting and the preparation of financial statements for external purposes in accordance with generally accepted accounting principles. A company’s internal control over financial reporting includes those policies and procedures that (1) pertain to the maintenance of records that, in reasonable detail, accurately and fairly reflect the transactions and dispositions of the assets of the company; (2) provide reasonable assurance that transactions are recorded as necessary to permit preparation of financial statements in accordance with generally accepted accounting principles, and that receipts and expenditures of the company are being made only in accordance with authorizations of management and directors of the company; and (3) provide reasonable assurance regarding prevention or timely detection of unauthorized acquisition, use, or disposition of the company’s assets that could have a material effect on the financial statements.
Because of its inherent limitations, internal control over financial reporting may not prevent or detect misstatements. Also, projections of any evaluation of effectiveness to future periods are subject to the risk that controls may become inadequate because of changes in conditions, or that the degree of compliance with the policies or procedures may deteriorate.
In our opinion, Molex Incorporated maintained, in all material respects, effective internal control over financial reporting as of June 30, 2012, based on the COSO criteria.
We also have audited, in accordance with the standards of the Public Company Accounting Oversight Board (United States), the consolidated balance sheets of Molex Incorporated as of June 30, 2012 and 2011, and the related consolidated statements of income, stockholders’ equity, and cash flows for each of the three years in the period ended June 30, 2012 and our report dated August 9, 2012 expressed an unqualified opinion thereon.
/s/ Ernst & Young LLP
Chicago, Illinois
August 9, 2012
85
| Item 9. | Changes in and Disagreements with Accountants on Accounting and Financial Disclosure |
None.
| Item 9A. | Controls and Procedures |
Attached as exhibits to this Form 10-K are certifications of our Chief Executive Officer (CEO) and Chief Financial Officer (CFO), which are required in accordance with Rule 13a-14 under the Securities Exchange Act of 1934, as amended (the Exchange Act). This “Controls and Procedures” section includes information concerning the controls and controls evaluation referred to in the certifications. Immediately preceding Part II, Item 9 of this Form 10-K is the report of Ernst & Young LLP, our independent registered public accounting firm, regarding its audit of our internal control over financial reporting and of management’s assessment of internal control over financial reporting set forth below in this section. This section should be read in conjunction with the certifications and the Ernst & Young LLP report for a more complete understanding of the topics presented.
Evaluation of Disclosure Controls and Procedures
We conducted an evaluation (pursuant to Rule 13a-15(b) of the Securities Exchange Act of 1934 (the “Exchange Act”)), under the supervision and with the participation of management, including the Chief Executive Officer and Chief Financial Officer, of the effectiveness of the Company’s disclosure controls and procedures (as defined in Rule 13a-15(e) of the Exchange Act) as of the end of the period covered by this report.
These disclosure controls and procedures are designed to ensure that information required to be disclosed in our reports that are filed or submitted under the Exchange Act is recorded, processed, summarized and reported within the time periods specified in the Securities and Exchange Commission’s rules and forms. Our disclosure controls and procedures include, without limitation, controls and procedures designed to ensure that this information is accumulated and communicated to management, including the principal executive and principal financial officers, or persons performing similar functions, as appropriate, to allow timely decisions regarding required disclosure.
Based on the evaluation, the Chief Executive Officer and Chief Financial Officer have concluded that these disclosure controls and procedures were effective as of the end of the period covered by this annual report.
Management’s Report on Internal Control Over Financial Reporting
Our management is responsible for establishing and maintaining an adequate system of internal control over financial reporting as required by the Sarbanes-Oxley Act of 2002 and as defined in Exchange Act Rule 13a-15(f). A control system can provide only reasonable, not absolute, assurance that the objectives of the control system are met.
Our management assessed the effectiveness of our internal control over financial reporting as of June 30, 2012. Under management’s supervision, an evaluation of the design and effectiveness of our internal control over financial reporting was conducted based on the framework in Internal Control — Integrated Framework issued by the Committee of Sponsoring Organizations of the Treadway Commission (COSO). Based on this evaluation, management concluded that our internal control over financial reporting was effective as of June 30, 2012.
Immediately preceding Part II, Item 9 of this Form 10-K is the report of Ernst & Young LLP, our independent registered public accounting firm, regarding its audit of our internal control over financial reporting. This section should be read in conjunction with the certifications and the Ernst & Young LLP report for a more complete understanding of the topics presented.
86
Changes in Internal Control Over Financial Reporting
There were no changes in our internal control over financial reporting that occurred during our most recently completed fiscal quarter that have materially affected, or are reasonably likely to materially affect, our internal control over financial reporting.
Inherent Limitations on Effectiveness of Controls
Our management, including the CEO and CFO, do not expect that our disclosure controls or our internal control over financial reporting will prevent or detect all error and all fraud. A control system, no matter how well designed and operated, can provide only reasonable, not absolute, assurance that the control system’s objectives will be met. The design of a control system must reflect the fact that there are resource constraints, and the benefits of controls must be considered relative to their costs. Further, because of the inherent limitations in all control systems, no evaluation of controls can provide absolute assurance that misstatements due to error or fraud will not occur or that all control issues and instances of fraud, if any, will be detected. These inherent limitations include the realities that judgments in decision-making can be faulty and that breakdowns can occur because of simple error or mistake. Controls can also be circumvented by the individual acts of some persons, by intentionally falsified documentation, by collusion of two or more individuals within Molex or third parties, or by management override of the controls. The design of any system of controls is based in part on certain assumptions about the likelihood of future events, and there can be no assurance that any design will succeed in achieving its stated goals under all potential future conditions. Projections of any evaluation of controls effectiveness to future periods are subject to risks. Over time, controls may become inadequate because of changes in conditions or deterioration in the degree of compliance with policies or procedures.
| Item 9B. | Other Information |
None.
87
PART III
| Item 10. | Directors, Executive Officers and Corporate Governance |
Code of Business Conduct and Ethics
We have adopted a Code of Business Conduct and Ethics applicable to all employees, officers and directors. The Code of Business Conduct incorporates our policies and guidelines designed to deter wrongdoing and to promote honest and ethical conduct and compliance with applicable laws and regulations. We have also adopted a Code of Ethics for Senior Financial Management applicable to our Chief Executive Officer, Chief Financial Officer, Chief Accounting Officer and other senior financial managers. The Code of Ethics sets out our expectations that financial management produce full, fair, accurate, timely and understandable disclosure in our filings with the SEC and other public communications. We intend to post any amendments to or waivers from the Codes on our web site at www.molex.com.
The full text of each Code is published on the investor relations page of our web site at www.molex.com.
The information under the captions “Item 1 — Election of Directors,” “Board Independence,” “Board and Committee Information,” “Board Leadership Structure,” “Corporate Governance Principles,” “Risk Oversight” and “Section 16(a) Beneficial Ownership Reporting Compliance” in our 2012 Proxy Statement for the Annual Meeting of Stockholders (“2012 Proxy Statement”) is incorporated herein by reference. The information called for by Item 401 of Regulation S-K relating to the Executive Officers is furnished in Part I, Item 1 of this Form 10-K and is also incorporated herein by reference in this section.
| Item 11. | Executive Compensation |
The information under the captions “Compensation Discussion and Analysis,” “Compensation of Directors,” “Report of the Compensation Committee” and “Executive Compensation” in our 2012 Proxy Statement is incorporated herein by reference.
| Item 12. | Security Ownership of Certain Beneficial Owners and Management and Related Stockholder Matters |
The information under the captions “Security Ownership of Directors and Executive Officers” and “Security Ownership of More than 5% Shareholders” in our 2012 Proxy Statement is incorporated herein by reference.
We currently maintain equity compensation plans that provide for the issuance of Molex stock to directors, executive officers and other employees. The following table sets forth information regarding outstanding options and shares available for future issuance under these plans as of June 30, 2012.
Equity Compensation Plan Information
| | | | | | | | | | | | | | | | | | | | | | | | |
| | | (a)
Number of shares
to be issued upon
exercise of outstanding
options | | | (b)
Weighted-average
exercise price
of outstanding
options | | | (c)
Number of securities
remaining available
for future issuance
under equity
compensation plans
(excluding shares
reflected in column (a)) | |
Plan Category | | Common
Stock | | | Class A
Stock | | | Common
Stock | | | Class A
Stock | | | Common
Stock | | | Class A
Stock | |
Equity compensation plans approved by stockholders | | | — | | | | 10,128,308 | | | $ | — | | | $ | 17.94 | | | | — | | | | 7,324,988 | |
Equity compensation plans not approved by stockholders | | | — | | | | — | | | | — | | | | — | | | | — | | | | — | |
88
| Item 13. | Certain Relationships and Related Transactions, and Director Independence |
The information under the captions “Corporate Governance — Board Independence,” and “Transactions with Related Persons,” in our 2012 Proxy Statement is incorporated herein by reference.
| Item 14. | Principal Accountant Fees and Services |
The information under the captions “Audit Matters — Independent Auditor’s Fees” and “Audit Matters — Policy on Audit Committee Pre-Approval of Services” in our 2012 Proxy Statement is incorporated herein by reference.
89
PART IV
| Item 15. | Exhibits and Financial Statement Schedules |
1. Financial Statements: See Item 8.
2. Financial Statement Schedule: See Schedule II — Valuation and Qualifying Accounts.
All other schedules are omitted because they are inapplicable, not required under the instructions, or the information is included in the consolidated financial statements or notes thereto.
Separate financial statements for the Company’s unconsolidated affiliated companies, accounted for by the equity method, have been omitted because they are not significant subsidiaries.
3. Exhibits: Exhibits listed on the accompanying Index to Exhibits are filed or incorporated herein as part of this annual report on Form 10-K.
90
ScheduleMolex Incorporated
Valuation and Qualifying AccountsSchedule II — Valuation and Qualifying Accounts
For the Years Ended June 30, 2012, 2011 and 2010
(in thousands)
| | | | | | | | | | | | | | | | | | | | |
| | | Balance at
Beginning
of Period | | | Charges
to Income | | | Write-Offs | | | Other/
Currency
Translation | | | Balance at
End
of Period | |
Receivable Reserves: | | | | | | | | | | | | | | | | | | | | |
Year ended 2012: | | | | | | | | | | | | | | | | | | | | |
Allowance for doubtful accounts | | $ | 3,634 | | | $ | 2,493 | | | $ | (1,642 | ) | | $ | — | | | $ | 4,485 | |
Returns and customer rebates | | | 38,663 | | | | 52,170 | | | | (58,827 | ) | | | 1,385 | | | | 33,391 | |
| | | | | | | | | | | | | | | | | | | | |
Total | | $ | 42,297 | | | $ | 54,663 | | | $ | (60,469 | ) | | $ | 1,385 | | | $ | 37,876 | |
| | | | | |
Year ended 2011: | | | | | | | | | | | | | | | | | | | | |
Allowance for doubtful accounts | | $ | 2,511 | | | $ | 2,012 | | | $ | (889 | ) | | $ | — | | | $ | 3,634 | |
Returns and customer rebates | | | 41,139 | | | | 81,170 | | | | (81,155 | ) | | | (2,491 | ) | | | 38,663 | |
| | | | | | | | | | | | | | | | | | | | |
Total | | $ | 43,650 | | | $ | 83,182 | | | $ | (82,044 | ) | | $ | (2,491 | ) | | $ | 42,297 | |
| | | | | |
Year ended 2010: | | | | | | | | | | | | | | | | | | | | |
Allowance for doubtful accounts | | $ | 3,572 | | | $ | (654 | ) | | $ | (407 | ) | | $ | — | | | $ | 2,511 | |
Returns and customer rebates | | | 29,021 | | | | 86,633 | | | | (75,602 | ) | | | 1,087 | | | | 41,139 | |
| | | | | | | | | | | | | | | | | | | | |
Total | | $ | 32,593 | | | $ | 85,979 | | | $ | (76,009 | ) | | $ | 1,087 | | | $ | 43,650 | |
Inventory Reserves: | | | | | | | | | | | | | | | | | | | | |
| | | | | |
Year ended 2012: | | | | | | | | | | | | | | | | | | | | |
Slow and excess | | $ | 37,695 | | | $ | 15,823 | | | $ | (18,077 | ) | | $ | (907 | ) | | $ | 34,534 | |
Other | | | 3,696 | | | | 306 | | | | — | | | | (420 | ) | | | 3,582 | |
| | | | | | | | | | | | | | | | | | | | |
Total | | $ | 41,391 | | | $ | 16,129 | | | $ | (18,077 | ) | | $ | (1,327 | ) | | $ | 38,116 | |
| | | | | |
Year ended 2011: | | | | | | | | | | | | | | | | | | | | |
Slow and excess | | $ | 35,019 | | | $ | 17,700 | | | $ | (19,022 | ) | | $ | 3,998 | | | $ | 37,695 | |
Other | | | 4,145 | | | | — | | | | — | | | | (449 | ) | | | 3,696 | |
| | | | | | | | | | | | | | | | | | | | |
Total | | $ | 39,164 | | | $ | 17,700 | | | $ | (19,022 | ) | | $ | 3,549 | | | $ | 41,391 | |
| | | | | |
Year ended 2010: | | | | | | | | | | | | | | | | | | | | |
Slow and excess | | $ | 38,181 | | | $ | 8,697 | | | $ | (12,168 | ) | | $ | 309 | | | $ | 35,019 | |
Other | | | 2,871 | | | | 1,462 | | | | — | | | | (188 | ) | | | 4,145 | |
| | | | | | | | | | | | | | | | | | | | |
Total | | $ | 41,052 | | | $ | 10,159 | | | $ | (12,168 | ) | | $ | 121 | | | $ | 39,164 | |
| | | | | |
Deferred tax asset valuation allowance: | | | | | | | | | | | | | | | | | | | | |
Year ended 2012 | | $ | 71,858 | | | $ | 40,841 | | | $ | (8,229 | ) | | $ | (1,592 | ) | | $ | 102,878 | |
Year ended 2011 | | $ | 80,935 | | | $ | 2,510 | | | $ | (9,572 | ) | | $ | (2,015 | ) | | $ | 71,858 | |
Year ended 2010 | | $ | 77,399 | | | $ | 14,443 | | | $ | (4,601 | ) | | $ | (6,306 | ) | | $ | 80,935 | |
91
Molex Incorporated
Index of Exhibits
| | | | |
Exhibit
Number | | Description | | Location |
3.1 | | Certificate of Incorporation (as amended and restated) | | Incorporated by reference to Exhibit 3.1 to our annual report on Form 10-K for the year ended June 30, 2000. (File No. 000-07491) |
3.2 | | By-laws (as amended and restated) | | Incorporated by reference to Exhibit 3.2 to our Form 8-K filed on February 3, 2011. (File No. 000-07491) |
4.1 | | Instruments defining rights of security holders | | See Exhibit 3.1 |
4.2 | | Note Purchase Agreement dated August 18, 2011 among Molex Incorporated and the Purchasers named therein | | Incorporated by reference to Exhibit 4.1 to our Form 8-K filed on August 24, 2011. (File No. 000-07491) |
10.1 | | Foreign Service Employees Policies and Procedures | | Incorporated by reference to Exhibit 10.15 to our quarterly report on Form 10-Q for the period ended March 31, 2005. (File No. 000-07491) |
10.2 | | Employment Offer Letter to David D. Johnson | | Incorporated by reference to Exhibit 10.18 to our quarterly report on Form 10-Q for the period ended March 31, 2005. (File No. 000-07491) |
10.3 | | Deferred Compensation Agreement between Molex and Frederick A. Krehbiel | | Incorporated by reference to Exhibit 10.12 to our quarterly report on Form 10-Q for the period ended March 31, 2005. (File No. 000-07491) |
10.4 | | Deferred Compensation Agreement between Molex and John H. Krehbiel, Jr. | | Incorporated by reference to Exhibit 10.13 to our quarterly report on Form 10-Q for the period ended March 31, 2005. (File No. 000-07491) |
10.5 | | 2005 Molex Supplemental Executive Retirement Plan, as amended and restated | | Incorporated by reference to Exhibit 10.1 to our quarterly report on Form 10-Q for the period ended December 31, 2010. (File No. 000-07491) |
10.6 | | Summary of Non-Employee Director Compensation | | Filed herewith |
10.7 | | Molex Outside Directors’ Deferred Compensation Plan | | Incorporated by reference to Exhibit 99.1 to our Form 8-K filed on August 1, 2006. (File No. 000-07491) |
10.8 | | 2000 Molex Long-Term Stock Plan, as amended and restated | | Incorporated by reference to Appendix V to our 2007 Proxy Statement. (File No. 000-07491) |
10.9 | | Form of Stock Option Agreement under the 2000 Molex Long-Term Stock Plan | | Incorporated by reference to Exhibit 10.10 to our annual report on Form 10-K for the year ended June 30, 2008. (File No. 000-07491) |
10.10 | | Form of Restricted Stock Agreement under the 2000 Molex Long-Term Stock Plan | | Incorporated by reference to Exhibit 10.11 to our annual report on Form 10-K for the year ended June 30, 2008. (File No. 000-07491) |
10.11 | | 2005 Molex Incentive Stock Option Plan, as amended and restated | | Incorporated by reference to Appendix VI to our 2007 Proxy Statement. (File No. 000-07491) |
10.12 | | Form of Stock Option Agreement under the 2005 Molex Incentive Stock Option Plan | | Incorporated by reference to Exhibit 10.12 to our Form 10-K for the period ended June 30, 2007. (File No. 000-07491) |
92
| | | | |
Exhibit
Number | | Description | | Location |
10.13 | | Molex Incorporated Annual Incentive Plan | | Incorporated by reference to Appendix III to our 2008 Proxy Statement. (File No. 000-07491) |
10.14 | | 2008 Molex Stock Incentive Plan, as amended and restated | | Incorporated by reference to Appendix A to our 2011 Proxy Statement. (File No. 000-07491) |
10.15 | | Separation Agreement between David B. Root and Molex Incorporated dated April 6, 2009. | | Incorporated by reference to Exhibit 10.1 to our Form 8-K filed on April 9, 2009. (File No. 000-07491) |
10.16 | | Credit Agreement dated June 24, 2009 among Molex Incorporated, the Lenders named therein, J.P. Morgan Chase Bank, N.A. as Administrative Agent, Standard Charter Bank as Syndication Agent, The Northern Trust Company as Documentation Agent | | Incorporated by reference to Exhibit 10.1 to our Form 8-K filed on June 30, 2009. (File No. 000-07491) |
10.17 | | Amendment No. 1 to Credit Agreement dated June 24, 2009 among Molex Incorporated, the Lenders named therein, J.P. Morgan Chase Bank, N.A. as Administrative Agent, Standard Charter Bank as Syndication Agent, The Northern Trust Company as Documentation Agent | | Incorporated by reference to Exhibit 10 to our quarterly report on Form 10-Q for the period ended December 31, 2009. (File No. 000-07491) |
10.18 | | Waiver to Credit Agreement dated June 24, 2009 among Molex Incorporated, the Lenders named therein, J.P. Morgan Chase Bank, N.A. as Administrative Agent, Standard Charter Bank as Syndication Agent, The Northern Trust Company as Documentation Agent. | | Incorporated by reference to Exhibit 10.19 to our Form 10-K for the period ended June 30, 2010. (File No. 000-07491) |
10.19 | | Amendment No. 2 to Credit Agreement dated March 25, 2011 among Molex Incorporated, the Lenders named therein, J.P. Morgan Chase Bank, N.A. as Administrative Agent, Standard Charter Bank as Syndication Agent, The Northern Trust Company as Documentation Agent. | | Incorporated by reference to Exhibit 10.1 to our Form 8-K filed on March 30, 2011. (File No. 000-07491) |
10.20 | | Amendment No. 3 to Credit Agreement dated June 28, 2011 among Molex Incorporated, the Lenders named therein, J.P. Morgan Chase Bank, N.A. as Administrative Agent, Standard Charter Bank as Syndication Agent, The Northern Trust Company as Documentation Agent. | | Incorporated by reference to Exhibit 10.20 to our Form 10-K for the year ended June 30, 2011. (File No. 000-07491) |
10.21 | | Retirement and Waiver and Release Agreement between James E. Fleischhacker and Molex Incorporated dated February 22, 2012. | | Incorporated by reference to Exhibit 10.1 to our Form 8-K filed on February 27, 2012. (File No. 000-07491) |
10.22 | | Consulting Agreement between James E. Fleischhacker and Molex Incorporated dated February 22, 2012. | | Incorporated by reference to Exhibit 10.2 to our Form 8-K filed on February 27, 2012. (File No. 000-07491) |
21 | | Subsidiaries of the Company | | Filed herewith |
23 | | Consent of Ernst & Young LLP | | Filed herewith |
31.1 | | Certification by the Chief Executive Officer Pursuant to Section 302 of the Sarbanes-Oxley Act of 2002 | | Filed herewith |
93
| | | | |
Exhibit
Number | | Description | | Location |
31.2 | | Certification by the Chief Financial Officer Pursuant to Section 302 of the Sarbanes-Oxley Act of 2002 | | Filed herewith |
32.1 | | Certification by the Chief Executive Officer Pursuant to 18 U.S.C. Section 1350, as adopted pursuant to Section 906 of the Sarbanes-Oxley Act of 2002 | | Furnished herewith |
32.2 | | Certification by the Chief Financial Officer Pursuant to 18 U.S.C. Section 1350, as adopted pursuant to Section 906 of the Sarbanes-Oxley Act of 2002 | | Furnished herewith |
101.INS | | XBRL Instance Document | | Furnished herewith |
101.SCH | | XBRL Taxonomy Extension Schema Document | | Furnished herewith |
101.CAL | | XBRL Taxonomy Extension Calculation Linkbase Document | | Furnished herewith |
101.LAB | | XBRL Taxonomy Extension Label Linkbase Document | | Furnished herewith |
101.PRE | | XBRL Taxonomy Extension Presentation Linkbase Document | | Furnished herewith |
101.DEF | | XBRL Taxonomy Extension Definition Linkbase Document | | Furnished herewith |
(All other exhibits are either inapplicable or not required.)
94
Signatures
Pursuant to the requirements of Section 13 or 15 (d) of the Securities Exchange Act of 1934, the Company has duly caused this Annual Report to be signed on its behalf by the undersigned, there unto duly authorized.
| | | | | | |
| | | | MOLEX INCORPORATED (Company) |
| | | |
| August 9, 2012 | | Executive Vice President, Treasurer and | | By: | | /s/ DAVID D. JOHNSON |
| | Chief Financial Officer (Principal Financial Officer) | | | | David D. Johnson |
Pursuant to the requirements of the Securities Exchange Act of 1934, this report has been signed below by the following persons on behalf of the registrant and in the capacities and on the dates indicated.
| | | | |
August 9, 2012 | | Co-Chairman of the Board | | /s/ FREDERICK A. KREHBIEL Frederick A. Krehbiel |
| | |
August 9, 2012 | | Co-Chairman of the Board | | /s/ JOHN H. KREHBIEL, JR. John H. Krehbiel, Jr. |
| | |
August 9, 2012 | | Vice Chairman of the Board and Chief
Executive Officer
(Principal Executive Officer) | | /s/ MARTIN P. SLARK Martin P. Slark |
| | |
August 9, 2012 | | Executive Vice President, Treasurer and Chief Financial Officer
(Principal Financial Officer) | | /s/ DAVID D. JOHNSON David D. Johnson |
| | |
August 9, 2012 | | Vice President, Chief Accounting Officer
(Principal Accounting Officer) | | /s/ K. TRAVIS GEORGE K. Travis George |
| | |
August 9, 2012 | | Director | | /s/ FRED L. KREHBIEL Fred L. Krehbiel |
| | |
August 9, 2012 | | Director | | /s/ MICHAEL J. BIRCK Michael J. Birck |
| | |
August 9, 2012 | | Director | | /s/ MICHELLE L. COLLINS Michelle L. Collins |
| | |
August 9, 2012 | | Director | | /s/ EDGAR D. JANNOTTA Edgar D. Jannotta |
| | |
August 9, 2012 | | Director | | /s/ DAVID L. LANDSITTEL David L. Landsittel |
| | |
August 9, 2012 | | Director | | /s/ JOE W. LAYMON Joe W. Laymon |
| | |
August 9, 2012 | | Director | | /s/ DONALD G. LUBIN Donald G. Lubin |
95
| | | | |
August 9, 2012 | | Director | | /s/ JAMES S. METCALF James S. Metcalf |
| | |
August 9, 2012 | | Director | | /s/ ROBERT J. POTTER Robert J. Potter |
| | |
August 9, 2012 | | Director | | /s/ ANIRUDH DHEBAR Anirudh Dhebar |
96