UNITED STATES
SECURITIES AND EXCHANGE COMMISSION
Washington, D.C. 20549
FORM N-CSR
CERTIFIED SHAREHOLDER REPORT OF REGISTERED MANAGEMENT
INVESTMENT COMPANIES
| | |
| Investment Company Act file number: | | 811-02619 |
| |
| Exact name of registrant as specified in charter: | | Prudential Government Money Market Fund, Inc. |
| |
| Address of principal executive offices: | | 655 Broad Street, 17th Floor Newark, New Jersey 07102 |
|
| |
| Name and address of agent for service: | | Andrew R. French 655 Broad Street, 17th Floor Newark, New Jersey 07102 |
|
|
| |
| Registrant’s telephone number, including area code: | | 800-225-1852 |
| |
| Date of fiscal year end: | | 7/31/2020 |
| |
| Date of reporting period: | | 7/31/2020 |
Item 1 – Reports to Stockholders

PGIM GOVERNMENT MONEY MARKET FUND
ANNUAL REPORT
JULY 31, 2020
COMING SOON: PAPERLESS SHAREHOLDER REPORTS
Beginning on January 1, 2021, as permitted by regulations adopted by the Securities and Exchange Commission, paper copies of the Fund’s annual and semiannual shareholder reports will no longer be sent by mail, unless you specifically request paper copies of the reports. Instead, the reports will be made available on the Fund’s website (pgim.com/investments), and you will be notified by mail each time a report is posted and provided with a website link to access the report.
If you already elected to receive shareholder reports electronically, you will not be affected by this change and you need not take any action. You may elect to receive shareholder reports and other communications from the Fund electronically anytime by contacting your financial intermediary (such as a broker-dealer or bank) or, if you are a direct investor, by calling 1-800-225-1852 or by sending an email request to PGIM Investments at shareholderreports@pgim.com.
You may elect to receive all future reports in paper free of charge. If you invest through a financial intermediary, you can contact your financial intermediary or follow instructions included with this notice to elect to continue to receive paper copies of your shareholder reports. If you invest directly with the Fund, you can call 1-800-225-1852 or send an email request to shareholderreports@pgim.com to let the Fund know you wish to continue receiving paper copies of your shareholder reports. Your election to receive reports in paper will apply to all funds held in your account if you invest through your financial intermediary or all funds held with the fund complex if you invest directly with the Fund.

To enroll in e-delivery, go to pgim.com/investments/resource/edelivery
Table of Contents
This report is not authorized for distribution to prospective investors unless preceded or accompanied by a current prospectus.
The views expressed in this report and information about the Fund’s portfolio holdings are for the period covered by this report and are subject to change thereafter.
Mutual funds are distributed by Prudential Investment Management Services LLC (PIMS), member SIPC. PGIM Fixed Income is a unit of PGIM, Inc. (PGIM), a registered investment adviser. PIMS and PGIM are Prudential Financial companies. © 2020 Prudential Financial, Inc. and its related entities. PGIM and the PGIM logo are service marks of Prudential Financial, Inc. and its related entities, registered in many jurisdictions worldwide.
Effective June 26, 2020, all of the issued and outstanding Class B shares of the Fund converted into Class A shares.
| | |
| 2 | | Visit our website at pgim.com/investments |
Letter from the President

Dear Shareholder:
We hope you find the annual report for the PGIM Government Money Market Fund informative and useful. The report covers performance for the 12-month period that ended July 31, 2020.
During the first half of the period, the global economy remained healthy—particularly in the US—fueled by rising corporate profits and strong job growth. The outlook changed dramatically in March as the coronavirus outbreak quickly and substantially shut down economic activity worldwide, leading to significant job losses and a steep decline in global growth and earnings. Responding to this disruption, the Federal Reserve (the Fed) cut the federal funds rate target to near zero and flooded capital markets with liquidity; and Congress passed stimulus bills worth approximately $3 trillion that offered an economic lifeline to consumers and businesses.
While stocks climbed throughout the first half of the period, they fell significantly in March amid a spike in volatility, ending the 11-year-long equity bull market. With stores and factories closing and consumers staying at home to limit the spread of the virus, investors sold stocks on fears that corporate earnings would take a serious hit. As states reopened their economies in the spring and early summer, a strong equity market rally helped large-cap US and emerging market stocks post gains during the period, while US small caps and stocks in developed foreign markets declined.
The bond market overall—including US and global bonds as well as emerging market debt—rose during the period as investors sought safety in fixed income. A significant rally in interest rates pushed the 10-year US Treasury yield down to a record low. In March, the Fed took several aggressive actions to keep the bond markets running smoothly, restarting many of the relief programs that proved to be successful in helping end the global financial crisis in 2008-09.
Regarding your investments with PGIM, we believe it is important to maintain a diversified portfolio of funds consistent with your tolerance for risk, time horizon, and financial goals. Your financial advisor can help you create a diversified investment plan that may include funds covering all the basic asset classes and that reflects your personal investor profile and risk tolerance. However, diversification and asset allocation strategies do not assure a profit or protect against loss in declining markets.
At PGIM Investments, we consider it a great privilege and responsibility to help investors participate in opportunities across global markets while meeting their toughest investment challenges. PGIM is a top-10 global investment manager with more than $1 trillion in assets under management. This scale and investment expertise allow us to deliver actively managed funds and strategies to meet the needs of investors around the globe.
Thank you for choosing our family of funds.
Sincerely,

Stuart S. Parker, President
PGIM Government Money Market Fund
September 15, 2020
| | | | |
| PGIM Government Money Market Fund | | | 3 | |
Your Fund’s Performance (unaudited)
Yields will fluctuate from time to time, and past performance does not guarantee future results. The Fund is subject to periodic adjustments to its expense budget during the fiscal year which may affect its reported 7-day current yield. Current performance may be lower or higher than the past performance data quoted. Although the Fund seeks to preserve the value of your investment at $1 per share, it is possible to lose money by investing in the Fund. For the most recent month-end performance update, call (800) 225-1852 or visit our website at pgim.com/investments.
| | | | | | | | |
|
| Fund Facts as of 7/31/20 |
| | 7-Day
Current Yield (%) | | Net Asset
Value (NAV) ($) | | Weighted Avg.
Maturity (WAM) | | Net Assets
(Millions) ($) |
| Class A | | 0.01 | | 1.00 | | 32 Days | | 442.3
|
| Class C | | 0.01 | | 1.00
| | 32 Days | | 14.5
|
| Class Z | | 0.01 | | 1.00
| | 32 Days | | 90.4
|
| iMoneyNet, Inc. Government & Agency Retail Avg.* | | 0.11 | | N/A | | 43 Days | | N/A |
*iMoneyNet, Inc. regularly reports a 7-day current yield and WAM on Tuesdays. This is based on the data of all funds in the iMoneyNet, Inc. Government & Agency Retail Average category as of July 28, 2020.
The Fund’s manager has voluntarily waived all or a portion of the management fee it is entitled to receive from the Fund in order to maintain a zero or positive net yield for the Fund. This voluntary waiver may be terminated at any time without prior notice. Without the waiver, the Fund’s 7-day yield would have been negative.
| | |
| 4 | | Visit our website at pgim.com/investments |
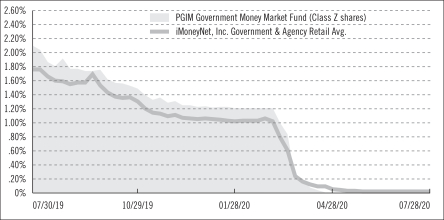
Money Market Fund Yield Comparison
Weighted Average Maturity* (WAM) Comparison
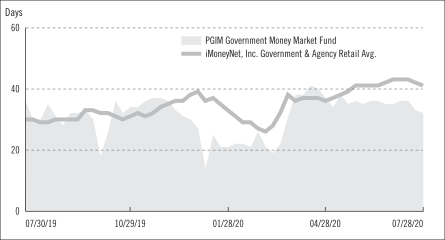
*Weighted Average Maturity is based on the dollar-weighted average length of time until principal payments are expected or until securities reach maturity, taking into account any maturity shortening feature such as a call, refunding, or redemption provision.
The graphs portray weekly 7-day current yields and weekly WAMs for PGIM Government Money Market Fund (Class Z shares—yields only) and the iMoneyNet, Inc. Government & Agency Retail Average every Tuesday from July 30, 2019 to July 28, 2020, the closest dates prior to the beginning and end of the Fund’s reporting period. Note: iMoneyNet, Inc.
| | | | |
| PGIM Government Money Market Fund | | | 5 | |
Your Fund’s Performance (continued)
regularly reports a 7-day current yield and WAM on Tuesdays. As a result, the data portrayed for the Fund at the end of the reporting period in the graphs may not match the data portrayed in the Fund Facts table as of July 31, 2020.
The yield figures take into account applicable sales charges and fees, which are described for each share class in the table below.
| | | | | | |
| | | | |
| | | Class A | | Class C | | Class Z |
| Maximum initial sales charge | | None | | None | | None |
| Contingent deferred sales charge (CDSC) (as a percentage of the lower of the original purchase price or the net asset value at redemption) | | None | | None | | None |
| Annual distribution or distribution and service (12b-1) fees (shown as a percentage of average daily net assets) | | 0.125% | | None | | None |
An investment in the Fund is not insured or guaranteed by the Federal Deposit Insurance Corporation or any other government agency.
Presentation of Fund Holdings as of 7/31/2020
| | | | | | |
| | | |
| Ten Largest Holdings | | Interest Rate | | Maturity Date | | % of Net Assets |
| U.S. Treasury Bills | | 0.128% | | 08/27/2020 | | 4.0% |
| U.S. Treasury Bills | | 0.147% | | 09/03/2020 | | 3.7% |
| U.S. Treasury Bills | | 0.125% | | 10/01/2020 | | 3.5% |
| Federal Home Loan Bank | | 0.333% | | 09/01/2020 | | 3.3% |
| U.S. Treasury Bills | | 0.160% | | 09/24/2020 | | 3.1% |
| U.S. Cash Management Bill | | 0.152% | | 11/10/2020 | | 2.1% |
| U.S. Cash Management Bill | | 0.148% | | 11/03/2020 | | 2.0% |
| Federal Home Loan Bank | | 0.130% | | 09/04/2020 | | 2.0% |
| Federal Home Loan Bank | | 0.185% | | 09/11/2020 | | 2.0% |
| Federal Home Loan Bank | | 0.180% | | 03/04/2021 | | 2.0% |
Holdings reflect only short-term investments and are subject to change.
| | |
| 6 | | Visit our website at pgim.com/investments |
Strategy and Performance Overview
How did the Fund perform?
The seven-day current yield of the PGIM Government Money Market Fund’s Class Z shares began the 12-month reporting period on August 1, 2019 at 1.95% and decreased to 0.01% when the period ended on July 31, 2020.
What were the market conditions?
| | • | | As 2019 progressed, the Federal Reserve (the Fed) delivered a series of 0.25% rate cuts in July, September, and October to the federal funds target rate, which ended the year in a range of 1.50%-1.75%. The cuts came in response to slowing global growth, worsening trade conflicts between the United States and China, and persistently below-target inflation rates. While US gross domestic product (GDP) grew 2.1% in the fourth quarter of 2019 and consumer spending remained strong, the US outlook faced risks from global and domestic headwinds, including weaker economic growth abroad, persistent trade war uncertainties, and global political risks. |
| | • | | At the start of 2020, the global economy appeared poised to stabilize and perhaps even improve, with manufacturing bottoming out across a number of countries and a pipeline of monetary stimulus in place following a global round of central bank easing in the second half of 2019. The optimism generated by the US-China trade deal, a positive turn in the global tech cycle, and central banks’ bias to ease further, if needed, shifted perceived economic risks from being skewed to the downside to being more balanced, as possible upside risks came into view. In January, news about a new coronavirus originating in China hit headlines, with person-to-person transmission reported on January 20 marking a turning point. Financial markets then witnessed a dramatic turn of events, perhaps best exemplified by the sharp drop in US Treasury yields. |
| | • | | With the economy decelerating rapidly and financial markets selling off sharply due to the pandemic and related lockdowns, the Fed reacted by cutting its federal funds target rate by 0.50% on March 3 and then by another 1.00% on March 15, leaving it in a range of 0.00%-0.25%. It quickly deployed—and then moved beyond—its playbook from the global financial crisis in 2008-09, reopening its swap lines, unleashing unlimited quantitative easing purchases, and injecting huge quantities of liquidity into the markets. Specific to money market funds, the Fed created the Money Market Mutual Fund Liquidity Facility to help meet redemptions and enhance market functioning. For its part, Congress approved $2.5 trillion of spending and tax breaks to provide help for the unemployed, cash to many households, and resources for small businesses. |
| | • | | The economy sustained an historic contraction through the first half of 2020, with GDP declining at an annualized rate of 5% and 32.9%, respectively, in the first and second quarters. In response, short-term US Treasury yields declined sharply. The yield on the three-month Treasury bill stood at 2.07% on July 31, 2019, declined gradually throughout the reporting period, and dropped substantially more when the pandemic |
| | | | |
| PGIM Government Money Market Fund | | | 7 | |
Strategy and Performance Overview (continued)
| | began, to end the period at 0.09%. The six-month Treasury bill dropped from 2.08% to 0.10% during that same time. The London Interbank Offered Rate (LIBOR) curve flattened in July as the three-month rate fell 5 basis points (bps) to 0.25%, while the one-year rate fell 9 bps to 0.45%. (One basis point equals 0.01%.) |
How was the Fund managed during the reporting period?
| | • | | The Fund invests in cash, government securities, and/or repurchase agreements that are fully collateralized with cash or government securities. The main sectors include US Treasury bills, fixed and floating-rate agency notes, agency discount notes, and repurchase agreements. |
| | • | | Early in the reporting period, the Fund maintained a cautious yet tactical stance on interest rate risk. The Fund’s weighted average maturity (WAM) was shortened in anticipation of expected Fed activity during August 2019 and September 2019, but it was extended and remained longer than the peer group average for the majority of the remainder of the period in anticipation of an extended period of low interest rates. The Fund’s Weighted Average Life (WAL) remained extended through floating rate securities throughout the period. |
| | • | | The Fund tactically shifted between LIBOR-based/Secured Overnight Financing Rate (SOFR) floating-rate securities and LIBOR-based/SOFR-based fixed-rate securities, as well as between agency securities versus US Treasury securities and repurchase agreements. These shifts were driven by the relative spreads between these securities. |
Current outlook
While financial market functioning has largely been restored by the Fed’s aggressive actions, the economy is still operating at a level well below its pre-COVID-19 pace. At the conclusion of its July 20, 2020 meeting, the Fed reiterated its intent to provide monetary support for as long as is needed for what is expected to be a long, drawn-out recovery. The Fed has already given guidance that the federal funds rate is expected to remain at its current near-zero level until the economy is well on its way to achieving the Fed’s inflation and employment mandates. While the Fed’s much-anticipated Policy Framework Review, previously expected to be released around June 2020, was sidelined by the crisis, Fed Chairman Jerome Powell provided a preview in his press conference, noting it would likely simply codify much of what the Fed has already been doing. Thus, the federal funds rate is expected to stay at its current level for at least the next several years.
| | |
| 8 | | Visit our website at pgim.com/investments |
Fees and Expenses (unaudited)
As a shareholder of the Fund, you incur two types of costs: (1) transaction costs, including sales charges (loads) on purchase payments and redemptions, as applicable, and (2) ongoing costs, including management fees, distribution and/or service (12b-1) fees, and other Fund expenses, as applicable. This example is intended to help you understand your ongoing costs (in dollars) of investing in the Fund and to compare these costs with the ongoing costs of investing in other mutual funds.
The example is based on an investment of $1,000 held through the six-month period ended July 31, 2020. The example is for illustrative purposes only; you should consult the Fund’s Prospectus for information on initial and subsequent minimum investment requirements.
Actual Expenses
The first line for each share class in the table on the following page provides information about actual account values and actual expenses. You may use the information on this line, together with the amount you invested, to estimate the expenses that you paid over the period. Simply divide your account value by $1,000 (for example, an $8,600 account value ÷ $1,000 = 8.6), then multiply the result by the number on the first line under the heading “Expenses Paid During the Six-Month Period” to estimate the expenses you paid on your account during this period.
Hypothetical Example for Comparison Purposes
The second line for each share class in the table on the following page provides information about hypothetical account values and hypothetical expenses based on the Fund’s actual expense ratio and an assumed rate of return of 5% per year before expenses, which is not the Fund’s actual return. The hypothetical account values and expenses may not be used to estimate the actual ending account balance or expenses you paid for the period. You may use this information to compare the ongoing costs of investing in the Fund and other funds. To do so, compare this 5% hypothetical example with the 5% hypothetical examples that appear in the shareholder reports of the other funds.
The Fund’s transfer agent may charge additional fees to holders of certain accounts that are not included in the expenses shown in the table on the following page. These fees apply to individual retirement accounts (IRAs) and Section 403(b) accounts. As of the close of the six-month period covered by the table, IRA fees included an annual maintenance fee of $15 per account (subject to a maximum annual maintenance fee of $25 for all accounts held by the same shareholder). Section 403(b) accounts are charged an annual $25 fiduciary maintenance fee. Some of the fees may vary in amount, or may be waived, based on your total account balance or the number of PGIM funds, including the Fund, that you own. You should consider the additional fees that were charged to your Fund account over the six-month period when you estimate the total ongoing expenses paid over the period
| | | | |
| PGIM Government Money Market Fund | | | 9 | |
Fees and Expenses (continued)
and the impact of these fees on your ending account value, as these additional expenses are not reflected in the information provided in the expense table. Additional fees have the effect of reducing investment returns.
Please note that the expenses shown in the table are meant to highlight your ongoing costs only and do not reflect any transactional costs such as sales charges (loads). Therefore, the second line for each share class in the table is useful in comparing ongoing costs only and will not help you determine the relative total costs of owning different funds. In addition, if these transactional costs were included, your costs would have been higher.
| | | | | | | | | | | | | | | | | | |
| | | | |
PGIM
Government
Money Market Fund | | Beginning Account
Value
February 1, 2020 | | | Ending Account
Value
July 31, 2020 | | | Annualized
Expense Ratio
Based on the
Six-Month Period | | | Expenses Paid
During the
Six-Month Period* | |
Class A | | Actual | | $ | 1,000.00 | | | $ | 1,001.20 | | | | 0.36 | % | | $ | 1.79 | |
| | Hypothetical | | $ | 1,000.00 | | | $ | 1,023.07 | | | | 0.36 | % | | $ | 1.81 | |
| Class C | | Actual | | $ | 1,000.00 | | | $ | 1,001.20 | | | | 0.33 | % | | $ | 1.64 | |
| | Hypothetical | | $ | 1,000.00 | | | $ | 1,023.22 | | | | 0.33 | % | | $ | 1.66 | |
| Class Z | | Actual | | $ | 1,000.00 | | | $ | 1,001.60 | | | | 0.29 | % | | $ | 1.44 | |
| | | Hypothetical | | $ | 1,000.00 | | | $ | 1,023.42 | | | | 0.29 | % | | $ | 1.46 | |
*Fund expenses (net of fee waivers or subsidies, if any) for each share class are equal to the annualized expense ratio for each share class (provided in the table), multiplied by the average account value over the period, multiplied by the 182 days in the six-month period ended July 31, 2020, and divided by the 366 days in the Fund's fiscal year ended July 31, 2020 (to reflect the six-month period). Expenses presented in the table include the expenses of any underlying portfolios in which the Fund may invest.
| | |
| 10 | | Visit our website at pgim.com/investments |
Schedule of Investments
as of July 31, 2020
| | | | | | | | | | | | | | |
| | | | | |
| | | Description | | | | | | Principal
Amount (000)# | | | Value | |
| | | | | |
| | SHORT-TERM INVESTMENTS 100.0% | | | | | | | | | | | | |
| | | | | |
| | REPURCHASE AGREEMENTS(m) 2.7% | | | | | | | | | | | | |
| | Bank of America Securities, Inc.,
0.10%, dated 07/31/20, due 08/03/20 in the amount of $4,802,040 | | | | | | | 4,802 | | | $ | 4,802,000 | |
| | Credit Agricole Corporate & Investment Bank,
0.10%, dated 07/27/20, due 08/03/20 in the amount of $10,000,194 | | | | | | | 10,000 | | | | 10,000,000 | |
| | | | | | | | | | | | | | |
| | | | | |
| | TOTAL REPURCHASE AGREEMENTS
(amortized cost $14,802,000) | | | | | | | | | | | 14,802,000 | |
| | | | | | | | | | | | | | |
| | | | | |
| | | | | Interest Rate | | Maturity Date | | | | | | |
| | | | | |
| | U.S. GOVERNMENT AGENCY OBLIGATIONS 60.0% | | | | | | | | | | | | |
| | Federal Farm Credit Bank, Secured Overnight Financing Rate + 0.040% (Cap N/A, Floor 0.000%) | | 0.140%(c) | | 02/09/21 | | | 6,000 | | | | 6,000,000 | |
| | Federal Farm Credit Bank, 1 Month LIBOR + (0.015)% (Cap N/A, Floor 0.000%) | | 0.141(c) | | 09/01/20 | | | 3,000 | | | | 3,000,390 | |
| | Federal Farm Credit Bank, 1 Month LIBOR + 0.000% (Cap N/A, Floor 0.000%) | | 0.172(c) | | 09/25/20 | | | 3,500 | | | | 3,499,913 | |
| | Federal Farm Credit Bank, Secured Overnight Financing Rate + 0.080% (Cap N/A, Floor 0.000%) | | 0.180(c) | | 01/14/21 | | | 1,000 | | | | 1,000,000 | |
| | Federal Farm Credit Bank, 1 Month LIBOR + 0.010% (Cap N/A, Floor 0.000%) | | 0.188(c) | | 08/12/20 | | | 4,000 | | | | 3,999,994 | |
| | Federal Farm Credit Bank, Secured Overnight Financing Rate + 0.105% (Cap N/A, Floor 0.000%) | | 0.205(c) | | 01/15/21 | | | 6,000 | | | | 6,000,000 | |
| | Federal Farm Credit Bank, Secured Overnight Financing Rate + 0.110% (Cap N/A, Floor 0.000%) | | 0.210(c) | | 05/18/21 | | | 6,000 | | | | 6,000,000 | |
| | Federal Farm Credit Bank, Secured Overnight Financing Rate + 0.110% (Cap N/A, Floor 0.000%) | | 0.210(c) | | 07/08/21 | | | 5,000 | | | | 4,999,644 | |
| | Federal Farm Credit Bank, 1 Month LIBOR + 0.110% (Cap N/A, Floor 0.000%) | | 0.282(c) | | 03/25/21 | | | 4,500 | | | | 4,499,618 | |
| | Federal Home Loan Bank | | 0.119(s) | | 10/21/20 | | | 6,000 | | | | 5,998,393 | |
| | Federal Home Loan Bank | | 0.121(s) | | 08/21/20 | | | 5,000 | | | | 4,999,664 | |
| | Federal Home Loan Bank | | 0.124(s) | | 10/16/20 | | | 5,000 | | | | 4,998,691 | |
| | Federal Home Loan Bank, Secured Overnight Financing Rate + 0.030% (Cap N/A, Floor 0.000%) | | 0.130(c) | | 09/04/20 | | | 11,000 | | | | 11,000,000 | |
| | Federal Home Loan Bank, 3 Month LIBOR + (0.120)% (Cap N/A, Floor 0.000%) | | 0.131(c) | | 11/03/20 | | | 5,000 | | | | 5,000,181 | |
| | Federal Home Loan Bank | | 0.138(s) | | 10/09/20 | | | 5,000 | | | | 4,998,678 | |
See Notes to Financial Statements.
| | | | |
| PGIM Government Money Market Fund | | | 11 | |
Schedule of Investments (continued)
as of July 31, 2020
| | | | | | | | | | | | | | |
| | | | | |
| | | Description | | Interest
Rate | | Maturity
Date | | Principal
Amount
(000)# | | | Value | |
| | | | | |
| | U.S. GOVERNMENT AGENCY OBLIGATIONS (Continued) | | | | | | | | | | | | |
| | Federal Home Loan Bank, Secured Overnight Financing Rate + 0.040% (Cap N/A, Floor 0.000%) | | 0.140%(c) | | 08/25/20 | | | 4,000 | | | $ | 4,000,025 | |
| | Federal Home Loan Bank | | 0.140(s) | | 10/14/20 | | | 5,000 | | | | 4,998,561 | |
| | Federal Home Loan Bank | | 0.145 | | 09/22/20 | | | 5,000 | | | | 5,000,000 | |
| | Federal Home Loan Bank, Secured Overnight Financing Rate + 0.045% (Cap N/A, Floor 0.000%) | | 0.145(c) | | 09/28/20 | | | 2,000 | | | | 2,000,000 | |
| | Federal Home Loan Bank | | 0.147(s) | | 09/25/20 | | | 2,000 | | | | 1,999,551 | |
| | Federal Home Loan Bank, 1 Month LIBOR + (0.030)% (Cap N/A, Floor 0.000%) | | 0.148(c) | | 08/12/20 | | | 5,500 | | | | 5,499,909 | |
| | Federal Home Loan Bank | | 0.150(s) | | 09/23/20 | | | 5,000 | | | | 4,998,896 | |
| | Federal Home Loan Bank, Secured Overnight Financing Rate + 0.050% (Cap N/A, Floor 0.000%) | | 0.150(c) | | 11/13/20 | | | 5,000 | | | | 5,000,000 | |
| | Federal Home Loan Bank, Secured Overnight Financing Rate + 0.050% (Cap N/A, Floor 0.000%) | | 0.150(c) | | 12/15/20 | | | 5,000 | | | | 5,000,000 | |
| | Federal Home Loan Bank, Secured Overnight Financing Rate + 0.050% (Cap N/A, Floor 0.000%) | | 0.150(c) | | 01/22/21 | | | 9,000 | | | | 8,999,111 | |
| | Federal Home Loan Bank, 1 Month LIBOR + (0.010)% (Cap N/A, Floor 0.000%) | | 0.156(c) | | 04/05/21 | | | 6,000 | | | | 6,000,000 | |
| | Federal Home Loan Bank, Secured Overnight Financing Rate + 0.060% (Cap N/A, Floor 0.000%) | | 0.160(c) | | 02/16/21 | | | 8,000 | | | | 8,000,000 | |
| | Federal Home Loan Bank, 1 Month LIBOR + (0.010)% (Cap N/A, Floor 0.000%) | | 0.163(c) | | 08/28/20 | | | 3,000 | | | | 3,000,058 | |
| | Federal Home Loan Bank | | 0.165(s) | | 09/11/20 | | | 2,250 | | | | 2,249,577 | |
| | Federal Home Loan Bank, Secured Overnight Financing Rate + 0.075% (Cap N/A, Floor 0.000%) | | 0.175(c) | | 06/11/21 | | | 6,000 | | | | 5,992,418 | |
| | Federal Home Loan Bank, 1 Month LIBOR + 0.000% (Cap N/A, Floor 0.000%) | | 0.179(c) | | 09/28/21 | | | 5,000 | | | | 5,000,000 | |
| | Federal Home Loan Bank, Secured Overnight Financing Rate + 0.080% (Cap N/A, Floor 0.000%) | | 0.180(c) | | 03/04/21 | | | 11,000 | | | | 11,000,000 | |
| | Federal Home Loan Bank, 1 Month LIBOR + 0.005% (Cap N/A, Floor 0.000%) | | 0.182(c) | | 08/16/21 | | | 5,000 | | | | 5,000,903 | |
| | Federal Home Loan Bank, Secured Overnight Financing Rate + 0.085% (Cap N/A, Floor 0.000%) | | 0.185(c) | | 09/11/20 | | | 11,000 | | | | 11,000,000 | |
| | Federal Home Loan Bank, 1 Month LIBOR + 0.000% (Cap N/A, Floor 0.000%) | | 0.188(c) | | 05/10/21 | | | 6,000 | | | | 6,000,000 | |
| | Federal Home Loan Bank, Secured Overnight Financing Rate + 0.090% (Cap N/A, Floor 0.000%) | | 0.190(c) | | 11/20/20 | | | 4,000 | | | | 4,000,000 | |
| | Federal Home Loan Bank, Secured Overnight Financing Rate + 0.100% (Cap N/A, Floor 0.000%) | | 0.200(c) | | 09/15/20 | | | 7,000 | | | | 7,000,000 | |
| | Federal Home Loan Bank, Secured Overnight Financing Rate + 0.100% (Cap N/A, Floor 0.000%) | | 0.200(c) | | 12/24/20 | | | 5,000 | | | | 5,000,000 | |
| | Federal Home Loan Bank, Secured Overnight Financing Rate + 0.120% (Cap N/A, Floor 0.000%) | | 0.220(c) | | 10/07/20 | | | 3,000 | | | | 3,000,000 | |
See Notes to Financial Statements.
| | | | | | | | | | | | | | |
| | | | | |
| | | Description | | Interest Rate | | Maturity Date | | Principal
Amount
(000)# | | | Value | |
| | | | | |
| | U.S. GOVERNMENT AGENCY OBLIGATIONS (Continued) | | | | | | | | | | | | |
| | Federal Home Loan Bank, Secured Overnight Financing Rate + 0.120% (Cap N/A, Floor 0.000%) | | 0.220%(c) | | 12/11/20 | | | 5,000 | | | $ | 5,000,000 | |
| | Federal Home Loan Bank, Secured Overnight Financing Rate + 0.160% (Cap N/A, Floor 0.000%) | | 0.260(c) | | 05/07/21 | | | 5,000 | | | | 5,001,940 | |
| | Federal Home Loan Bank | | 0.270(s) | | 09/18/20 | | | 6,000 | | | | 5,997,840 | |
| | Federal Home Loan Bank, Secured Overnight Financing Rate + 0.230% (Cap N/A, Floor 0.000%) | | 0.330(c) | | 09/25/20 | | | 9,000 | | | | 9,000,000 | |
| | Federal Home Loan Bank | | 0.333(s) | | 09/01/20 | | | 18,000 | | | | 17,994,919 | |
| | Federal Home Loan Bank | | 1.750 | | 08/26/20 | | | 2,000 | | | | 1,999,998 | |
| | Federal Home Loan Mortgage Corp. | | 0.120(s) | | 08/19/20 | | | 6,000 | | | | 5,999,640 | |
| | Federal Home Loan Mortgage Corp. | | 0.120(s) | | 10/14/20 | | | 5,000 | | | | 4,998,767 | |
| | Federal Home Loan Mortgage Corp., MTN, Secured Overnight Financing Rate + 0.025% (Cap N/A, Floor 0.000%) | | 0.125(c) | | 02/26/21 | | | 6,000 | | | | 6,000,000 | |
| | Federal Home Loan Mortgage Corp., MTN, Secured Overnight Financing Rate + 0.030% (Cap N/A, Floor 0.000%) | | 0.130(c) | | 01/22/21 | | | 6,000 | | | | 5,997,838 | |
| | Federal Home Loan Mortgage Corp., MTN, Secured Overnight Financing Rate + 0.030% (Cap N/A, Floor 0.000%) | | 0.130(c) | | 02/05/21 | | | 8,000 | | | | 7,997,511 | |
| | Federal Home Loan Mortgage Corp., MTN, Secured Overnight Financing Rate + 0.030% (Cap N/A, Floor 0.000%) | | 0.130(c) | | 02/19/21 | | | 4,000 | | | | 3,999,327 | |
| | Federal Home Loan Mortgage Corp., MTN, Secured Overnight Financing Rate + 0.030% (Cap N/A, Floor 0.000%) | | 0.130(c) | | 02/24/21 | | | 6,000 | | | | 6,000,000 | |
| | Federal Home Loan Mortgage Corp., MTN, Secured Overnight Financing Rate + 0.040% (Cap N/A, Floor 0.000%) | | 0.140(c) | | 09/10/20 | | | 4,500 | | | | 4,500,000 | |
| | Federal Home Loan Mortgage Corp., MTN, Secured Overnight Financing Rate + 0.045% (Cap N/A, Floor 0.000%) | | 0.145(c) | | 08/27/21 | | | 2,000 | | | | 2,000,000 | |
| | Federal Home Loan Mortgage Corp., MTN, Secured Overnight Financing Rate + 0.400% (Cap N/A, Floor 0.000%) | | 0.500(c) | | 10/21/21 | | | 3,000 | | | | 3,000,000 | |
| | Federal National Mortgage Assoc., Secured Overnight Financing Rate + 0.070% (Cap N/A, Floor 0.000%) | | 0.170(c) | | 12/11/20 | | | 6,000 | | | | 5,996,709 | |
| | Federal National Mortgage Assoc., Secured Overnight Financing Rate + 0.075% (Cap N/A, Floor 0.000%) | | 0.175(c) | | 10/30/20 | | | 6,000 | | | | 5,999,851 | |
| | Federal National Mortgage Assoc., Secured Overnight Financing Rate + 0.075% (Cap N/A, Floor 0.000%) | | 0.175(c) | | 06/04/21 | | | 10,000 | | | | 9,998,505 | |
See Notes to Financial Statements.
| | | | |
| PGIM Government Money Market Fund | | | 13 | |
Schedule of Investments (continued)
as of July 31, 2020
| | | | | | | | | | | | | | |
| | | | | |
| | | Description | | Interest Rate | | Maturity Date | | Principal
Amount
(000)# | | | Value | |
| | | | | |
| | U.S. GOVERNMENT AGENCY OBLIGATIONS (Continued) | | | | | | | | | | | | |
| | Federal National Mortgage Assoc., Secured Overnight Financing Rate + 0.120% (Cap N/A, Floor 0.000%) | | 0.220%(c) | | 03/16/21 | | | 5,000 | | | $ | 5,000,000 | |
| | | | | | | | | | | | | | |
| | | | | |
| | TOTAL U.S. GOVERNMENT AGENCY OBLIGATIONS
(amortized cost $328,217,020) | | | | | | | | | | | 328,217,020 | |
| | | | | | | | | | | | | | |
| | | | | |
| | U.S. TREASURY OBLIGATIONS 37.3% | | | | | | | | | | | | |
| | U.S. Cash Management Bill | | 0.142(s) | | 10/13/20 | | | 5,000 | | | | 4,998,560 | |
| | U.S. Cash Management Bill | | 0.148(s) | | 11/03/20 | | | 11,000 | | | | 10,995,757 | |
| | U.S. Cash Management Bill | | 0.150(s) | | 11/24/20 | | | 6,000 | | | | 5,997,125 | |
| | U.S. Cash Management Bill | | 0.152(s) | | 11/10/20 | | | 11,500 | | | | 11,495,104 | |
| | U.S. Cash Management Bill | | 0.156(s) | | 12/08/20 | | | 5,000 | | | | 4,997,205 | |
| | U.S. Cash Management Bill | | 0.165(s) | | 12/01/20 | | | 7,000 | | | | 6,996,086 | |
| | U.S. Cash Management Bill | | 0.190(s) | | 11/17/20 | | | 5,000 | | | | 4,997,150 | |
| | U.S. Treasury Bills | | 0.110(s) | | 10/29/20 | | | 5,000 | | | | 4,998,640 | |
| | U.S. Treasury Bills | | 0.117(s) | | 08/06/20 | | | 6,000 | | | | 5,999,902 | |
| | U.S. Treasury Bills | | 0.123(s) | | 08/13/20 | | | 7,000 | | | | 6,999,713 | |
| | U.S. Treasury Bills | | 0.125(s) | | 10/01/20 | | | 19,000 | | | | 18,995,975 | |
| | U.S. Treasury Bills | | 0.128(s) | | 08/27/20 | | | 22,000 | | | | 21,997,964 | |
| | U.S. Treasury Bills | | 0.130(s) | | 08/25/20 | | | 7,000 | | | | 6,999,393 | |
| | U.S. Treasury Bills | | 0.135(s) | | 09/01/20 | | | 7,000 | | | | 6,999,186 | |
| | U.S. Treasury Bills | | 0.146(s) | | 09/08/20 | | | 9,000 | | | | 8,998,612 | |
| | U.S. Treasury Bills | | 0.147(s) | | 09/03/20 | | | 20,000 | | | | 19,997,312 | |
| | U.S. Treasury Bills | | 0.155(s) | | 11/12/20 | | | 5,000 | | | | 4,997,783 | |
| | U.S. Treasury Bills | | 0.160(s) | | 08/11/20 | | | 5,000 | | | | 4,999,778 | |
| | U.S. Treasury Bills | | 0.160(s) | | 09/10/20 | | | 3,000 | | | | 2,999,467 | |
| | U.S. Treasury Bills | | 0.160(s) | | 09/24/20 | | | 17,000 | | | | 16,995,927 | |
| | U.S. Treasury Bills | | 0.175(s) | | 10/22/20 | | | 5,000 | | | | 4,998,007 | |
| | U.S. Treasury Bills | | 0.178(s) | | 09/17/20 | | | 6,000 | | | | 5,998,606 | |
| | U.S. Treasury Bills | | 0.220(s) | | 10/08/20 | | | 5,000 | | | | 4,997,922 | |
| | U.S. Treasury Bills | | 0.245(s) | | 09/15/20 | | | 6,000 | | | | 5,998,163 | |
| | | | | | | | | | | | | | |
| | | | | |
| | TOTAL U.S. TREASURY OBLIGATIONS
(amortized cost $204,449,337) | | | | | | | | | | | 204,449,337 | |
| | | | | | | | | | | | | | |
| | | | | |
| | TOTAL INVESTMENTS 100.0%
(amortized cost $547,468,357)(d) | | | | | | | | | | | 547,468,357 | |
| | Liabilities in excess of other assets (0.0)% | | | | | | | | | | | (272,226 | ) |
| | | | | | | | | | | | | | |
| | | | | |
| | NET ASSETS 100.0% | | | | | | | | | | $ | 547,196,131 | |
| | | | | | | | | | | | | | |
See Notes to Financial Statements.
Below is a list of the abbreviation(s) used in the annual report:
FNMA—Federal National Mortgage Association
GNMA—Government National Mortgage Association
LIBOR—London Interbank Offered Rate
MTN—Medium Term Note
| # | Principal amount is shown in U.S. dollars unless otherwise stated. |
| (c) | Variable rate instrument. The interest rate shown reflects the rate in effect at July 31, 2020. |
| (d) | The cost of securities for federal income tax purposes is substantially the same as for financial reporting purposes. |
| (m) | Repurchase agreements are collateralized by FNMA (coupon rate 2.000%, maturity date 07/01/50) and GNMA (coupon rate 3.000%, maturity date 06/20/50) with the aggregate value, including accrued interest, of $15,098,041. |
| (s) | Represents zero coupon bond or principal only security. Rate represents yield to maturity at purchase date. |
Fair Value Measurements:
Various inputs are used in determining the value of the Fund’s investments. These inputs are summarized in the three broad levels listed below.
Level 1—unadjusted quoted prices generally in active markets for identical securities.
Level 2—quoted prices for similar securities, interest rates and yield curves, prepayment speeds, foreign currency exchange rates and other observable inputs.
Level 3—unobservable inputs for securities valued in accordance with Board approved fair valuation procedures.
The following is a summary of the inputs used as of July 31, 2020 in valuing such portfolio securities:
| | | | | | | | | | | | |
| | | Level 1 | | | Level 2 | | | Level 3 | |
Investments in Securities | | | | | | | | | | | | |
Assets | | | | | | | | | | | | |
Repurchase Agreements | | | $— | | | $ | 14,802,000 | | | | $— | |
U.S. Government Agency Obligations | | | — | | | | 328,217,020 | | | | — | |
U.S. Treasury Obligations | | | — | | | | 204,449,337 | | | | — | |
| | | |
Total | | | $— | | | $ | 547,468,357 | | | | $— | |
| | | | | | | | | | | | |
Sector Allocations:
The sector allocations of investments and liabilities in excess of other assets shown as a percentage of net assets as of July 31, 2020 were as follows (unaudited):
| | | | |
U.S. Government Agency Obligations | | | 60.0 | % |
U.S. Treasury Obligations | | | 37.3 | |
| | | | |
Repurchase Agreements | | | 2.7 | % |
| | | | |
| | | 100.0 | |
Liabilities in excess of other assets | | | (0.0 | )* |
| | | | |
| |
| | | 100.0 | % |
| | | | |
See Notes to Financial Statements.
| | |
| PGIM Government Money Market Fund | | 15 |
Schedule of Investments (continued)
as of July 31, 2020
Financial Instruments/Transactions—Summary of Offsetting and Netting Arrangements:
The Fund entered into financial instruments/transactions during the reporting period that are either offset in accordance with current requirements or are subject to enforceable master netting arrangements or similar agreements that permit offsetting. The information about offsetting and related netting arrangements for financial instruments/transactions where the legal right to set-off exists is presented in the summary below.
Offsetting of financial instrument/transaction assets and liabilities:
| | | | | | | | | | | | | | | | | |
Description | | Counterparty | | Gross Market Value of
Recognized
Assets/(Liabilities) | | Collateral
Pledged/(Received)(1) | | Net
Amount |
Repurchase Agreements | | Bank of America Securities, Inc. | | | $ | 4,802,000 | | | | $ | (4,802,000 | ) | | | $ | — | |
Repurchase Agreements | | Credit Agricole Corporate & Investment Bank | | | | 10,000,000 | | | | | (10,000,000 | ) | | | | — | |
| | | | | | | | | | | | | | | | | |
| | | | | $ | 14,802,000 | | | | | | | | | | | |
| | | | | | | | | | | | | | | | | |
| (1) | Collateral amount disclosed by the Fund is limited to the market value of financial instruments/transactions. |
See Notes to Financial Statements.
Statement of Assets and Liabilities
as of July 31, 2020
| | | | |
Assets | | | | |
Investments, at amortized cost which approximates fair value | | $ | 547,468,357 | |
Cash | | | 685 | |
Receivable for Fund shares sold | | | 405,543 | |
Interest receivable | | | 69,453 | |
Due from Manager | | | 23,656 | |
| | | | |
Total Assets | | | 547,967,694 | |
| | | | |
| |
Liabilities | | | | |
Payable for Fund shares reacquired | | | 564,674 | |
Transfer agent’s fees and expenses payable | | | 112,697 | |
Affiliated transfer agent fee payable | | | 55,083 | |
Accrued expenses and other liabilities | | | 37,131 | |
Directors’ fees payable | | | 1,427 | |
Dividends payable | | | 551 | |
| | | | |
Total Liabilities | | | 771,563 | |
| | | | |
| |
Net Assets | | $ | 547,196,131 | |
| | | | |
| | | | |
Net assets were comprised of: | | | | |
Common stock, at par ($0.001 par value; 20 billion shares authorized for issuance) | | $ | 547,177 | |
Paid-in capital in excess of par | | | 546,648,755 | |
Total distributable earnings (loss) | | | 199 | |
| | | | |
Net assets, July 31, 2020 | | $ | 547,196,131 | |
| | | | |
See Notes to Financial Statements.
| | | | |
| PGIM Government Money Market Fund | | | 17 | |
Statement of Assets and Liabilities
as of July 31, 2020
| | | | | | | | |
Class A | | | | | | | | |
Net asset value, offering price and redemption price per share, ($442,259,687 ÷ 442,242,932 shares of common stock issued and outstanding) | | $ | 1.00 | | | | | |
| | | | | | | | |
| | |
Class C | | | | | | | | |
Net asset value, offering price and redemption price per share, ($14,537,927 ÷ 14,537,059 shares of common stock issued and outstanding) | | $ | 1.00 | | | | | |
| | | | | | | | |
| | |
Class Z | | | | | | | | |
Net asset value, offering price and redemption price per share, ($90,398,517 ÷ 90,397,223 shares of common stock issued and outstanding) | | $ | 1.00 | | | | | |
| | | | | | | | |
See Notes to Financial Statements.
Statement of Operations
Year Ended July 31, 2020
| | | | | | |
Net Investment Income (Loss) | | | | | | |
Interest income | | $ | 6,099,370 | | | |
| | | | | | |
| | |
Expenses | | | | | | |
Management fee | | | 1,632,727 | | | |
Distribution fee(a) | | | 508,994 | | | |
Transfer agent’s fees and expenses (including affiliated expense of $300,386)(a) | | | 631,785 | | | |
Registration fees(a) | | | 96,369 | | | |
Custodian and accounting fees | | | 88,217 | | | |
Shareholders’ reports | | | 85,819 | | | |
Audit fee | | | 24,596 | | | |
Legal fees and expenses | | | 24,019 | | | |
Directors’ fees | | | 18,010 | | | |
Miscellaneous | | | 17,100 | | | |
| | | | | | |
Total expenses | | | 3,127,636 | | | |
Less: Fee waiver and/or expense reimbursement(a) | | | (530,260 | ) | | |
Distribution fee waiver(a) | | | (169,641 | ) | | |
| | | | | | |
Net expenses | | | 2,427,735 | | | |
| | | | | | |
Net investment income (loss) | | | 3,671,635 | | | |
| | | | | | |
| | |
Realized And Unrealized Gain (Loss) On Investments | | | | | | |
Net realized gain (loss) on investment transactions | | | 47,328 | | | |
| | | | | | |
Net Increase (Decrease) In Net Assets Resulting From Operations | | $ | 3,718,963 | | | |
| | | | | | |
| (a) | Class specific expenses and waivers were as follows: |
| | | | | | | | | | | | | | | | |
| | | Class A | | | Class B | | | Class C | | | Class Z | |
Distribution fee | | | 508,994 | | | | — | | | | — | | | | — | |
Transfer agent’s fees and expenses | | | 567,992 | | | | 24,561 | | | | 12,359 | | | | 26,873 | |
Registration fees | | | 39,802 | | | | 13,900 | | | | 21,600 | | | | 21,067 | |
Fee waiver and/or expense reimbursement | | | (437,571 | ) | | | (11,966 | ) | | | (22,058 | ) | | | (58,665 | ) |
Distribution fee waiver | | | (169,641 | ) | | | — | | | | — | | | | — | |
See Notes to Financial Statements.
| | | | |
| PGIM Government Money Market Fund | | | 19 | |
Statements of Changes in Net Assets
| | | | | | | | |
| |
| | | Year Ended
July 31, | |
| | | 2020 | | | 2019 | |
| | |
Increase (Decrease) in Net Assets | | | | | | | | |
Operations | | | | | | | | |
Net investment income (loss) | | $ | 3,671,635 | | | $ | 8,484,331 | |
Net realized gain (loss) on investment transactions | | | 47,328 | | | | 32,828 | |
| | | | | | | | |
Net increase (decrease) in net assets resulting from operations | | | 3,718,963 | | | | 8,517,159 | |
| | | | | | | | |
Dividends and Distributions | | | | | | | | |
Distributions from distributable earnings | | | | | | | | |
Class A | | | (2,881,544 | ) | | | (6,551,512 | ) |
Class B | | | (68,529 | ) | | | (181,914 | ) |
Class C | | | (56,749 | ) | | | (185,277 | ) |
Class Z | | | (712,490 | ) | | | (1,598,037 | ) |
| | | | | | | | |
| | | (3,719,312 | ) | | | (8,516,740 | ) |
| | | | | | | | |
Fund share transactions (Net of share conversions) (at $1.00 per share) | | | | | | | | |
Net proceeds from shares sold | | | 1,478,889,535 | | | | 1,402,514,601 | |
Net asset value of shares issued in reinvestment of dividends and distributions | | | 3,494,605 | | | | 8,077,464 | |
Cost of shares reacquired | | | (1,379,320,427 | ) | | | (1,454,882,577 | ) |
| | | | | | | | |
Net increase (decrease) in net assets from Fund share transactions | | | 103,063,713 | | | | (44,290,512 | ) |
| | | | | | | | |
Total increase (decrease) | | | 103,063,364 | | | | (44,290,093 | ) |
| | |
Net Assets: | | | | | | | | |
Beginning of year | | | 444,132,767 | | | | 488,422,860 | |
| | | | | | | | |
End of year | | $ | 547,196,131 | | | $ | 444,132,767 | |
| | | | | | | | |
See Notes to Financial Statements.
Notes to Financial Statements
Prudential Government Money Market Fund, Inc. (the “Company”) is registered under the Investment Company Act of 1940, as amended (“1940 Act”), as a diversified, open-end management investment company. The Company consists of one series: PGIM Government Money Market Fund (the “Fund”).
The investment objective of the Fund is maximum current income consistent with stability of capital and the maintenance of liquidity.
The Fund follows the investment company accounting and reporting guidance of the Financial Accounting Standards Board (“FASB”) Accounting Standard Codification (“ASC”) Topic 946 Financial Services — Investment Companies. The following accounting policies conform to U.S. generally accepted accounting principles. The Fund consistently follows such policies in the preparation of its financial statements.
Securities Valuation: The Fund holds securities and other assets and liabilities that are fair valued at the close of each day (generally, 4:00 PM Eastern time) the New York Stock Exchange (“NYSE”) is open for trading. Fair value is the price that would be received to sell an asset or paid to transfer a liability in an orderly transaction between market participants on the measurement date. The Company’s Board of Directors (the “Board”) has adopted valuation procedures for security valuation under which fair valuation responsibilities have been delegated to PGIM Investments LLC (“PGIM Investments” or the “Manager”). Pursuant to the Board’s delegation, the Manager has established a Valuation Committee responsible for supervising the fair valuation of portfolio securities and other assets and liabilities. The valuation procedures permit the Fund to utilize independent pricing vendor services, quotations from market makers, and alternative valuation methods when market quotations are either not readily available or not deemed representative of fair value. A record of the Valuation Committee’s actions is subject to the Board’s review, approval, and ratification at its next regularly scheduled quarterly meeting.
For the fiscal reporting year-end, securities and other assets and liabilities were fair valued at the close of the last U.S. business day. Trading in certain foreign securities may occur when the NYSE is closed (including weekends and holidays). Because such foreign securities trade in markets that are open on weekends and U.S. holidays, the values of some of the Fund’s foreign investments may change on days when investors cannot purchase or redeem Fund shares.
Various inputs determine how the Fund’s investments are valued, all of which are categorized according to the three broad levels (Level 1, 2, or 3) detailed in the Schedule of
| | | | |
| PGIM Government Money Market Fund | | | 21 | |
Notes to Financial Statements (continued)
Investments and referred to herein as the “fair value hierarchy” in accordance with FASB ASC Topic 820 - Fair Value Measurements and Disclosures.
The Fund’s securities of sufficient credit quality are valued using amortized cost method, which approximates fair value. The amortized cost method involves valuing a security at its cost on the date of purchase and thereafter assuming a constant amortization to maturity of the difference between the principal amount due at maturity and cost. These securities are categorized as Level 2 in the fair value hierarchy.
Securities and other assets that cannot be priced according to the methods described above are valued based on pricing methodologies approved by the Board. In the event that unobservable inputs are used when determining such valuations, the securities will be classified as Level 3 in the fair value hierarchy.
When determining the fair value of securities, some of the factors influencing the valuation include: the nature of any restrictions on disposition of the securities; assessment of the general liquidity of the securities; the issuer’s financial condition and the markets in which it does business; the cost of the investment; the size of the holding and the capitalization of the issuer; the prices of any recent transactions or bids/offers for such securities or any comparable securities; any available analyst media or other reports or information deemed reliable by the Manager regarding the issuer or the markets or industry in which it operates. Using fair value to price securities may result in a value that is different from a security’s most recent closing price and from the price used by other unaffiliated mutual funds to calculate their net asset values.
Illiquid Securities: Subject to guidelines adopted by the Board, the Fund may invest up to 5% of its net assets in illiquid securities. Illiquid securities are those that, because of the absence of a readily available market or due to legal or contractual restrictions on resale, may not reasonably be expected to be sold or disposed of in current market conditions in seven calendar days or less without the sale or disposition significantly changing the market value of the investment. The Fund may find it difficult to sell illiquid securities at the time considered most advantageous by its subadviser and may incur transaction costs that would not be incurred in the sale of securities that were freely marketable.
Restricted Securities: Securities acquired in unregistered, private sales from the issuing company or from an affiliate of the issuer are considered restricted as to disposition under federal securities law (“restricted securities”). Such restricted securities are valued pursuant to the valuation procedures noted above. Restricted securities that would otherwise be considered illiquid investments because of legal restrictions on resale to the general public may be traded among qualified institutional buyers under Rule 144A of the Securities Act of 1933. Therefore, these Rule 144A securities, as well as commercial paper that is sold in
private placements under Section 4(2) of the Securities Act of 1933, may be deemed liquid by the Fund’s subadviser under the guidelines adopted by the Board. However, the liquidity of the Fund’s investments in restricted securities could be impaired if trading does not develop or declines.
Repurchase Agreements: The Fund entered into repurchase agreements. In connection with transactions in repurchase agreements with United States financial institutions, it is the Fund’s policy that its custodian or designated subcustodians under triparty repurchase agreements, as the case may be, take possession of the underlying collateral securities, the value of which exceeds the principal amount of the repurchase transactions, including accrued interest. To the extent that any repurchase transaction exceeds one business day, the value of the collateral is marked-to-market on a daily basis to ensure the adequacy of the collateral. If the seller defaults and the value of the collateral declines or, if bankruptcy proceedings are commenced with respect to the seller of the security, realization of the collateral by the Fund may be delayed or limited.
Master Netting Arrangements: The Company, on behalf of the Fund, is subject to various Master Agreements, or netting arrangements, with select counterparties. These are agreements which a subadviser may have negotiated and entered into on behalf of all or a portion of the Fund. A master netting arrangement between the Fund and the counterparty permits the Fund to offset amounts payable by the Fund to the same counterparty against amounts to be received; and by the receipt of collateral from the counterparty by the Fund to cover the Fund’s exposure to the counterparty. However, there is no assurance that such mitigating factors are easily enforceable. In addition to master netting arrangements, the right to set-off exists when all the conditions are met such that each of the parties owes the other determinable amounts, the reporting party has the right to set-off the amount owed with the amount owed by the other party, the reporting party intends to set-off and the right of set-off is enforceable by law. During the reporting period, there was no intention to settle on a net basis and all amounts are presented on a gross basis on the Statement of Assets and Liabilities.
Securities Transactions and Net Investment Income: Securities transactions are recorded on the trade date. Realized gains (losses) from investment and currency transactions are calculated on the specific identification method. Dividend income is recorded on the ex-date, or for certain foreign securities, when the Fund becomes aware of such dividends. Interest income, including amortization of premium and accretion of discount on debt securities, as required, is recorded on the accrual basis. Expenses are recorded on an accrual basis, which may require the use of certain estimates by management that may differ from actual. Net investment income or loss (other than class specific expenses and waivers, which are allocated as noted below) and unrealized and realized gains (losses) are allocated daily to each class of shares based upon the relative proportion of adjusted net assets of each class at the beginning of the day. Class specific expenses and waivers, where applicable, are charged to the respective share classes. Class specific expenses include
| | | | |
| PGIM Government Money Market Fund | | | 23 | |
Notes to Financial Statements (continued)
distribution fees and distribution fee waivers, shareholder servicing fees, transfer agent’s fees and expenses, registration fees and fee waivers and/or expense reimbursements, as applicable.
Taxes: It is the Fund’s policy to continue to meet the requirements of the Internal Revenue Code applicable to regulated investment companies and to distribute all of its taxable net investment income and capital gains, if any, to its shareholders. Therefore, no federal income tax provision is required. Withholding taxes on foreign dividends, interest and capital gains, if any, are recorded, net of reclaimable amounts, at the time the related income is earned.
Dividends and Distributions: The Fund declares daily dividends from net investment income and net realized short-term capital gains, if any, to its shareholders on record at the time of such declaration. Payment of dividends is made monthly. Dividends and distributions to shareholders, which are determined in accordance with federal income tax regulations and which may differ from generally accepted accounting principles, are recorded on the ex-date. Permanent book/tax differences relating to income and gain (loss) are reclassified between total distributable earnings (loss) and paid-in capital in excess of par, as appropriate.
Estimates: The preparation of financial statements requires management to make estimates and assumptions that affect the reported amounts and disclosures in the financial statements. Actual results could differ from those estimates.
The Company, on behalf of the Fund, has a management agreement with the Manager. Pursuant to this agreement, the Manager has responsibility for all investment advisory services and supervises the subadviser’s performance of such services. In addition, under the management agreement, the Manager provides all of the administrative functions necessary for the organization, operation and management of the Fund. The Manager administers the corporate affairs of the Fund and, in connection therewith, furnishes the Fund with office facilities, together with those ordinary clerical and bookkeeping services which are not being furnished by the Fund’s custodian and the Fund’s transfer agent. The Manager is also responsible for the staffing and management of dedicated groups of legal, marketing, compliance and related personnel necessary for the operation of the Fund. The legal, marketing, compliance and related personnel are also responsible for the management and oversight of the various service providers to the Fund, including, but not limited to, the custodian, transfer agent, and accounting agent.
The Manager has entered into a subadvisory agreement with PGIM, Inc., which provides subadvisory services to the Fund through its PGIM Fixed Income unit. The subadvisory agreement provides that PGIM, Inc. will furnish investment advisory services in connection with the management of the Fund. In connection therewith, PGIM, Inc. is obligated to keep certain books and records of the Fund. The Manager pays for the services of PGIM, Inc., the cost of compensation of officers of the Fund, occupancy and certain clerical and bookkeeping costs of the Fund. The Fund bears all other costs and expenses.
The management fee paid to the Manager is accrued daily and payable monthly, at an annual rate of 0.50% of average daily net assets on the first $50 million and 0.30% of average daily net assets in excess of $50 million. The effective management fee rate before any waivers and/or expense reimbursements was 0.32% for the year ended July 31, 2020.
The Company, on behalf of the Fund, has a distribution agreement with Prudential Investment Management Services LLC (“PIMS”), which acts as the distributor of the Class A, Class C and Class Z shares of the Fund. The Fund compensates PIMS for distributing and servicing the Fund’s Class A shares, pursuant to the plans of distribution (the “Distribution Plans”), regardless of expenses actually incurred by PIMS. The distribution fees are accrued daily and payable monthly. No distribution or service fees are paid to PIMS as distributor of Class C and Class Z shares of the Fund.
Pursuant to the Distribution Plans, the Fund compensates PIMS for distribution related activities at an annual rate of up to 0.125% of the average daily net assets of the Class A shares.
In order to support the Fund’s income yield, PIMS and the Manager have voluntarily undertaken to waive the distribution and service (12b-1) fees of Class A shares and to waive/subsidize management fees of the Fund, respectively, such that the 1-day income yield (excluding capital gain (loss)) does not fall below 0.01%. The waivers/subsidies are voluntary and may be modified or terminated at any time. Pursuant to this undertaking, during the year ended July 31, 2020, PIMS has waived $169,641 of Class A’s distribution and service (12b-1) fees and the Manager has waived $530,260 of the Fund’s management fees.
PGIM Investments, PGIM, Inc. and PIMS are indirect, wholly-owned subsidiaries of Prudential Financial, Inc. (“Prudential”).
| 4. | Other Transactions with Affiliates |
Prudential Mutual Fund Services LLC (“PMFS”), an affiliate of PGIM Investments and an indirect, wholly-owned subsidiary of Prudential, serves as the Fund’s transfer agent. Transfer agent’s fees and expenses in the Statement of Operations include certain out-of-pocket expenses paid to non-affiliates, where applicable.
| | | | |
| PGIM Government Money Market Fund | | | 25 | |
Notes to Financial Statements (continued)
The Fund may enter into certain securities purchase or sale transactions under Board approved Rule 17a-7 procedures. Rule 17a-7 is an exemptive rule under the 1940 Act, that subject to certain conditions, permits purchase and sale transactions among affiliated investment companies, or between an investment company and a person that is affiliated solely by reason of having a common (or affiliated) investment adviser, common directors, and/or common officers. Pursuant to the Rule 17a-7 procedures and consistent with guidance issued by the Securities and Exchange Commission (“SEC”), the Company’s Chief Compliance Officer (“CCO”) prepares a quarterly summary of all such transactions for submission to the Board, together with the CCO’s written representation that all such 17a-7 transactions were effected in accordance with the Fund’s Rule 17a-7 procedures. For the year ended July 31, 2020, no 17a-7 transactions were entered into by the Fund.
| 5. | Distributions and Tax Information |
Distributions to shareholders, which are determined in accordance with federal income tax regulations and which may differ from generally accepted accounting principles, are recorded on the ex-date.
For the years ended July 31, 2020 and July 31, 2019, the tax character of dividends paid by the Fund were $3,719,312 and $8,516,740 of ordinary income, respectively.
As of July 31, 2020, the accumulated undistributed earnings on a tax basis was $750 of ordinary income.
The Manager has analyzed the Fund’s tax positions taken on federal, state and local income tax returns for all open tax years and has concluded that no provision for income tax is required in the Fund’s financial statements for the current reporting period. Since tax authorities can examine previously filed tax returns, the Fund’s U.S. federal and state tax returns for each of the four fiscal years up to the most recent fiscal year ended July 31, 2020 are subject to such review.
The Fund offers Class A, Class C and Class Z shares. Class C and Class Z shares are not subject to any distribution and/or service fees and are offered exclusively for sale to a limited group of investors. Effective June 26, 2020, all of the issued and outstanding Class B shares of the Fund converted into Class A shares.
Under certain circumstances, an exchange may be made from specified share classes of the Fund to one or more other share classes of the Fund as presented in the table of transactions in shares of common stock, below.
The Company is authorized to issue 20 billion shares of common stock, $0.001 par value per share, designated as shares of the Fund. The shares are further classified and designated as follows:
| | | | |
Class A | | | 11,000,000,000 | |
Class B | | | 1,000,000,000 | |
Class C | | | 1,000,000,000 | |
Class Z | | | 2,000,000,000 | |
Class T | | | 5,000,000,000 | |
The Fund currently does not have any Class B or Class T shares outstanding.
As of July 31, 2020, Prudential, through its affiliated entities, including affiliated funds (if applicable), owned shares of the Fund as follows:
| | | | |
| | | Number of Shares | | Percentage of
Outstanding Shares |
Class A | | 22,229,936 | | 5.0% |
Class Z | | 5,206,550 | | 5.8% |
At the reporting period end, the number of shareholders holding greater than 5% of the Fund are as follows:
| | | | | | |
| Affiliated | | Unaffiliated |
Number of
Shareholders | | Percentage of
Outstanding Shares | | Number of
Shareholders | | Percentage of
Outstanding Shares |
— | | —% | | 2 | | 49.8% |
Transactions in shares of common stock (at $1 net asset value per share) were as follows:
| | | | | | | | |
Class A | | Shares | | | Amount | |
Year ended July 31, 2020: | | | | | | | | |
Shares sold | | | 1,406,651,169 | | | $ | 1,406,653,514 | |
Shares issued in reinvestment of dividends and distributions | | | 2,664,397 | | | | 2,664,397 | |
Shares reacquired | | | (1,325,646,843 | ) | | | (1,325,646,781 | ) |
| | | | | | | | |
Net increase (decrease) in shares outstanding before conversion | | | 83,668,723 | | | | 83,671,130 | |
Shares issued upon conversion from other share class(es) | | | 10,277,256 | | | | 10,277,256 | |
Shares reacquired upon conversion into other share class(es) | | | (115,701 | ) | | | (115,763 | ) |
| | | | | | | | |
Net increase (decrease) in shares outstanding | | | 93,830,278 | | | $ | 93,832,623 | |
| | | | | | | | |
Year ended July 31, 2019: | | | | | | | | |
Shares sold | | | 1,364,412,279 | | | $ | 1,364,412,283 | |
Shares issued in reinvestment of dividends and distributions | | | 6,132,551 | | | | 6,132,551 | |
Shares reacquired | | | (1,405,597,731 | ) | | | (1,405,597,726 | ) |
| | | | | | | | |
Net increase (decrease) in shares outstanding before conversion | | | (35,052,901 | ) | | | (35,052,892 | ) |
Shares issued upon conversion from other share class(es) | | | 2,535,910 | | | | 2,535,910 | |
Shares reacquired upon conversion into other share class(es) | | | (128,533 | ) | | | (128,538 | ) |
| | | | | | | | |
Net increase (decrease) in shares outstanding | | | (32,645,524 | ) | | $ | (32,645,520 | ) |
| | | | | | | | |
| | | | |
| PGIM Government Money Market Fund | | | 27 | |
Notes to Financial Statements (continued)
| | | | | | | | |
Class B | | Shares | | | Amount | |
Period ended June 26, 2020*: | | | | | | | | |
Shares sold | | | 815,624 | | | $ | 813,176 | |
Shares issued in reinvestment of dividends and distributions | | | 65,905 | | | | 65,905 | |
Shares reacquired | | | (2,062,960 | ) | | | (2,062,878 | ) |
| | | | | | | | |
Net increase (decrease) in shares outstanding before conversion | | | (1,181,431 | ) | | | (1,183,797 | ) |
Shares reacquired upon conversion into other share class(es) | | | (9,634,825 | ) | | | (9,634,907 | ) |
| | | | | | | | |
Net increase (decrease) in shares outstanding | | | (10,816,256 | ) | | $ | (10,818,704 | ) |
| | | | | | | | |
Year ended July 31, 2019: | | | | | | | | |
Shares sold | | | 1,765,734 | | | $ | 1,765,733 | |
Shares issued in reinvestment of dividends and distributions | | | 175,460 | | | | 175,460 | |
Shares reacquired | | | (3,426,470 | ) | | | (3,426,469 | ) |
| | | | | | | | |
Net increase (decrease) in shares outstanding before conversion | | | (1,485,276 | ) | | | (1,485,276 | ) |
Shares reacquired upon conversion into other share class(es) | | | (223,334 | ) | | | (223,334 | ) |
| | | | | | | | |
Net increase (decrease) in shares outstanding | | | (1,708,610 | ) | | $ | (1,708,610 | ) |
| | | | | | | | |
| | |
Class C | | | | | | |
Year ended July 31, 2020: | | | | | | | | |
Shares sold | | | 17,722,800 | | | $ | 17,722,879 | |
Shares issued in reinvestment of dividends and distributions | | | 55,534 | | | | 55,534 | |
Shares reacquired | | | (10,528,728 | ) | | | (10,528,725 | ) |
| | | | | | | | |
Net increase (decrease) in shares outstanding before conversion | | | 7,249,606 | | | | 7,249,688 | |
Shares reacquired upon conversion into other share class(es) | | | (642,346 | ) | | | (642,349 | ) |
| | | | | | | | |
Net increase (decrease) in shares outstanding | | | 6,607,260 | | | $ | 6,607,339 | |
| | | | | | | | |
Year ended July 31, 2019: | | | | | | | | |
Shares sold | | | 12,777,975 | | | $ | 12,777,979 | |
Shares issued in reinvestment of dividends and distributions | | | 177,208 | | | | 177,208 | |
Shares reacquired | | | (12,620,708 | ) | | | (12,620,096 | ) |
| | | | | | | | |
Net increase (decrease) in shares outstanding before conversion | | | 334,475 | | | | 335,091 | |
Shares reacquired upon conversion into other share class(es) | | | (2,311,964 | ) | | | (2,312,576 | ) |
| | | | | | | | |
Net increase (decrease) in shares outstanding | | | (1,977,489 | ) | | $ | (1,977,485 | ) |
| | | | | | | | |
| | | | | | | | |
Class Z | | Shares | | | Amount | |
Year ended July 31, 2020: | | | | | | | | |
Shares sold | | | 53,699,475 | | | $ | 53,699,966 | |
Shares issued in reinvestment of dividends and distributions | | | 708,769 | | | | 708,769 | |
Shares reacquired | | | (41,082,043 | ) | | | (41,082,043 | ) |
| | | | | | | | |
Net increase (decrease) in shares outstanding before conversion | | | 13,326,201 | | | | 13,326,692 | |
Shares issued upon conversion from other share class(es) | | | 115,763 | | | | 115,763 | |
| | | | | | | | |
Net increase (decrease) in shares outstanding | | | 13,441,964 | | | $ | 13,442,455 | |
| | | | | | | | |
Year ended July 31, 2019: | | | | | | | | |
Shares sold | | | 23,558,637 | | | $ | 23,558,606 | |
Shares issued in reinvestment of dividends and distributions | | | 1,592,245 | | | | 1,592,245 | |
Shares reacquired | | | (33,238,286 | ) | | | (33,238,286 | ) |
| | | | | | | | |
Net increase (decrease) in shares outstanding before conversion | | | (8,087,404 | ) | | | (8,087,435 | ) |
Shares issued upon conversion from other share class(es) | | | 139,156 | | | | 139,156 | |
Shares reacquired upon conversion into other share class(es) | | | (10,618 | ) | | | (10,618 | ) |
| | | | | | | | |
Net increase (decrease) in shares outstanding | | | (7,958,866 | ) | | $ | (7,958,897 | ) |
| | | | | | | | |
| * | Effective June 26, 2020, all of the issued and outstanding Class B shares of the Fund converted into Class A shares. |
| 7. | Risks of Investing in the Fund |
The Fund’s risks include, but are not limited to, the risks discussed below. For further information on the Fund’s risks, please refer to the Fund’s Prospectus and Statement of Additional Information.
Large Shareholder and Large Scale Redemption Risk: Certain individuals, accounts, funds (including funds affiliated with the Manager) or institutions, including the Manager and its affiliates, may from time to time own or control a substantial amount of the Fund’s shares. There is no requirement that these entities maintain their investment in the Fund. There is a risk that such large shareholders or that the Fund’s shareholders generally may redeem all or a substantial portion of their investments in the Fund in a short period of time, which could have a significant negative impact on the Fund’s NAV, liquidity, and brokerage costs. Large redemptions could also result in tax consequences to shareholders and impact the Fund’s ability to implement its investment strategy. The Fund’s ability to pursue its investment objective after one or more large scale redemptions may be impaired and, as a result, the Fund may invest a larger portion of its assets in cash or cash equivalents.
LIBOR Risk: Many financial instruments use or may use a floating rate based on the London Interbank Offered Rate, or “LIBOR,” which is the offered rate for short-term Eurodollar deposits between major international banks. On July 27, 2017, the Financial Conduct Authority announced a desire to phase out the use of LIBOR by the end of 2021. There remains uncertainty regarding the future utilization of LIBOR and the nature of any replacement rate. As such, the potential impact of a transition away from LIBOR on the Fund or the financial instruments in which the Fund invest cannot yet be determined. The elimination of LIBOR or changes to other reference rates or any other changes or reforms to the determination or supervision of reference rates could have an adverse impact on the market for, or value of, any securities or payments linked to those reference rates, which
| | | | |
| PGIM Government Money Market Fund | | | 29 | |
Notes to Financial Statements (continued)
may adversely affect the Fund’s performance and/or net asset value. Furthermore, the risks associated with the expected discontinuation of LIBOR and transition may be exacerbated if the work necessary to effect an orderly transition to an alternative reference rate is not completed in a timely manner. Because the usefulness of LIBOR as a benchmark could deteriorate during the transition period, these effects could occur prior to the end of 2021.
Market and Credit Risk: Securities markets may be volatile and the market prices of the Fund’s securities may decline. Securities fluctuate in price based on changes in an issuer’s financial condition and overall market and economic conditions. If the market prices of the securities owned by the Fund fall, the value of an investment in the Fund will decline. Additionally, the Fund may also be exposed to credit risk in the event that an issuer or guarantor fails to perform or that an institution or entity with which the Fund has unsettled or open transactions defaults.
Market Disruption and Geopolitical Risks: International wars or conflicts and geopolitical developments in foreign countries, along with instability in regions such as Asia, Eastern Europe, and the Middle East, possible terrorist attacks in the United States or around the world, public health epidemics such as the outbreak of infectious diseases like the recent outbreak of coronavirus globally or the 2014–2016 outbreak in West Africa of the Ebola virus, and other similar events could adversely affect the U.S. and foreign financial markets, including increases in market volatility, reduced liquidity in the securities markets and government intervention, and may cause further long-term economic uncertainties in the United States and worldwide generally.
U.S. Government and Agency Securities Risk: U.S. Government and agency securities are subject to market risk, interest rate risk and credit risk. Not all U.S. Government securities are insured or guaranteed by the full faith and credit of the U.S. Government; some are only insured or guaranteed by the issuing agency, which must rely on its own resources to repay the debt. In addition, the value of U.S. Government securities may be affected by changes in the credit rating of the U.S. Government.
Financial Highlights
| | | | | | | | | | | | | | | | | | | | |
| |
Class A Shares | |
| | |
| | | Year Ended July 31, | |
| | | | | | |
| | | 2020 | | | 2019 | | | 2018 | | | 2017 | | | 2016 | |
Per Share Operating Performance(a): | | | | | | | | | | | | | | | | | | | | |
Net Asset Value, Beginning of Year | | | $1.00 | | | | $1.00 | | | | $1.00 | | | | $1.00 | | | | $1.00 | |
| Net investment income (loss) and net realized gain (loss) on investment transactions | | | 0.01 | | | | 0.02 | | | | 0.01 | | | | -(b | ) | | | -(b | ) |
Dividends to shareholders | | | (0.01 | ) | | | (0.02 | ) | | | (0.01 | ) | | | -(b | ) | | | -(b | ) |
Net asset value, end of year | | | $1.00 | | | | $1.00 | | | | $1.00 | | | | $1.00 | | | | $1.00 | |
Total Return(c): | | | 0.76 | % | | | 1.69 | % | | | 0.82 | % | | | 0.05 | % | | | 0.01 | % |
| | | | | | | | | | | | | | | | | | | | |
Ratios/Supplemental Data: | | | | | | | | | | | | | | | | | | | | |
Net assets, end of year (000) | | | $442,260 | | | | $348,427 | | | | $381,073 | | | | $433,113 | | | | $504,907 | |
Average net assets (000) | | | $407,195 | | | | $390,207 | | | | $440,589 | | | | $478,071 | | | | $513,050 | |
Ratios to average net assets(d): | | | | | | | | | | | | | | | | | | | | |
Expenses after waivers and/or expense reimbursement | | | 0.49 | % | | | 0.64 | % | | | 0.61 | % | | | 0.56 | % | | | 0.31 | % |
Expenses before waivers and/or expense reimbursement | | | 0.64 | % | | | 0.64 | % | | | 0.61 | % | | | 0.62 | % | | | 0.60 | % |
Net investment income (loss) | | | 0.70 | % | | | 1.67 | % | | | 0.81 | % | | | 0.05 | % | | | 0.01 | % |
| (a) | Calculated based on average shares outstanding during the year. |
| (b) | Less than $0.005 per share. |
| (c) | Total return is calculated assuming a purchase of a share on the first day and a sale on the last day of each year reported and includes reinvestment of dividends and distributions, if any. Total returns may reflect adjustments to conform to generally accepted accounting principles. |
| (d) | Effective August 1, 2017, class specific expenses include transfer agent fees and expenses and registration fees, which are charged to their respective share class. |
See Notes to Financial Statements.
| | | | |
| PGIM Government Money Market Fund | | | 31 | |
Financial Highlights (continued)
| | | | | | | | | | | | | | | | | | | | |
| |
Class C Shares | |
| | |
| | | Year Ended July 31, | |
| | | | | | |
| | | 2020 | | | 2019 | | | 2018 | | | 2017 | | | 2016 | |
Per Share Operating Performance(a): | | | | | | | | | | | | | | | | | | | | |
Net Asset Value, Beginning of Year | | | $1.00 | | | | $1.00 | | | | $1.00 | | | | $1.00 | | | | $1.00 | |
| Net investment income (loss) and net realized gain (loss) on investment transactions | | | 0.01 | | | | 0.02 | | | | 0.01 | | | | -(b | ) | | | -(b | ) |
Dividends to shareholders | | | (0.01 | ) | | | (0.02 | ) | | | (0.01 | ) | | | -(b | ) | | | -(b | ) |
Net asset value, end of year | | | $1.00 | | | | $1.00 | | | | $1.00 | | | | $1.00 | | | | $1.00 | |
Total Return(c): | | | 0.71 | % | | | 1.69 | % | | | 0.84 | % | | | 0.09 | % | | | 0.01 | % |
| | | | | | | | | | | | | | | | | | | | |
Ratios/Supplemental Data: | | | | | | | | | | | | | | | | | | | | |
Net assets, end of year (000) | | | $14,538 | | | | $7,931 | | | | $9,908 | | | | $12,632 | | | | $15,650 | |
Average net assets (000) | | | $10,815 | | | | $10,913 | | | | $11,277 | | | | $14,606 | | | | $19,016 | |
Ratios to average net assets(d): | | | | | | | | | | | | | | | | | | | | |
Expenses after waivers and/or expense reimbursement | | | 0.48 | % | | | 0.65 | % | | | 0.60 | % | | | 0.52 | % | | | 0.31 | % |
Expenses before waivers and/or expense reimbursement | | | 0.68 | % | | | 0.65 | % | | | 0.60 | % | | | 0.52 | % | | | 0.48 | % |
Net investment income (loss) | | | 0.52 | % | | | 1.69 | % | | | 0.81 | % | | | 0.08 | % | | | 0.01 | % |
| (a) | Calculated based on average shares outstanding during the year. |
| (b) | Less than $0.005 per share. |
| (c) | Total return is calculated assuming a purchase of a share on the first day and a sale on the last day of each year reported and includes reinvestment of dividends and distributions, if any. Total returns may reflect adjustments to conform to generally accepted accounting principles. |
| (d) | Effective August 1, 2017, class specific expenses include transfer agent fees and expenses and registration fees, which are charged to their respective share class. |
See Notes to Financial Statements.
| | | | | | | | | | | | | | | | | | | | |
| |
Class Z Shares | |
| | |
| | | Year Ended July 31, | |
| | | | | | |
| | | 2020 | | | 2019 | | | 2018 | | | 2017 | | | 2016 | |
Per Share Operating Performance(a): | | | | | | | | | | | | | | | | | | | | |
Net Asset Value, Beginning of Year | | | $1.00 | | | | $1.00 | | | | $1.00 | | | | $1.00 | | | | $1.00 | |
| Net investment income (loss) and net realized gain (loss) on investment transactions | | | 0.01 | | | | 0.02 | | | | 0.01 | | | | -(b | ) | | | -(b | ) |
Dividends to shareholders | | | (0.01 | ) | | | (0.02 | ) | | | (0.01 | ) | | | -(b | ) | | | -(b | ) |
Net asset value, end of year | | | $1.00 | | | | $1.00 | | | | $1.00 | | | | $1.00 | | | | $1.00 | |
Total Return(c): | | | 0.91 | % | | | 1.91 | % | | | 1.01 | % | | | 0.09 | % | | | 0.01 | % |
| | | | | | | | | | | | | | | | | | | | |
Ratios/Supplemental Data: | | | | | | | | | | | | | | | | | | | | |
Net assets, end of year (000) | | | $90,399 | | | | $76,956 | | | | $84,915 | | | | $88,718 | | | | $110,920 | |
Average net assets (000) | | | $83,610 | | | | $84,238 | | | | $85,131 | | | | $98,278 | | | | $115,952 | |
Ratios to average net assets(d): | | | | | | | | | | | | | | | | | | | | |
Expenses after waivers and/or expense reimbursement | | | 0.36 | % | | | 0.43 | % | | | 0.42 | % | | | 0.52 | % | | | 0.31 | % |
Expenses before waivers and/or expense reimbursement | | | 0.43 | % | | | 0.43 | % | | | 0.42 | % | | | 0.52 | % | | | 0.48 | % |
Net investment income (loss) | | | 0.84 | % | | | 1.89 | % | | | 1.00 | % | | | 0.08 | % | | | 0.01 | % |
| (a) | Calculated based on average shares outstanding during the year. |
| (b) | Less than $0.005 per share. |
| (c) | Total return is calculated assuming a purchase of a share on the first day and a sale on the last day of each year reported and includes reinvestment of dividends and distributions, if any. Total returns may reflect adjustments to conform to generally accepted accounting principles. |
| (d) | Effective August 1, 2017, class specific expenses include transfer agent fees and expenses and registration fees, which are charged to their respective share class. |
See Notes to Financial Statements.
| | | | |
| PGIM Government Money Market Fund | | | 33 | |
Report of Independent Registered Public Accounting Firm
To the Shareholders of PGIM Government Money Market Fund and Board of Directors Prudential Government Money Market Fund, Inc.:
Opinion on the Financial Statements
We have audited the accompanying statement of assets and liabilities of PGIM Government Money Market Fund, a series of Prudential Government Money Market Fund, Inc., (the Fund), including the schedule of investments, as of July 31, 2020, the related statement of operations for the year then ended, the statements of changes in net assets for each of the years in the two-year period then ended, and the related notes (collectively, the financial statements) and the financial highlights for each of the years in the five-year period then ended. In our opinion, the financial statements and financial highlights present fairly, in all material respects, the financial position of the Fund as of July 31, 2020, the results of its operations for the year then ended, the changes in its net assets for each of the years in the two-year period then ended, and the financial highlights for each of the years in the five-year period then ended, in conformity with U.S. generally accepted accounting principles.
Basis for Opinion
These financial statements and financial highlights are the responsibility of the Fund’s management. Our responsibility is to express an opinion on these financial statements and financial highlights based on our audits. We are a public accounting firm registered with the Public Company Accounting Oversight Board (United States) (PCAOB) and are required to be independent with respect to the Fund in accordance with the U.S. federal securities laws and the applicable rules and regulations of the Securities and Exchange Commission and the PCAOB.
We conducted our audits in accordance with the standards of the PCAOB. Those standards require that we plan and perform the audit to obtain reasonable assurance about whether the financial statements and financial highlights are free of material misstatement, whether due to error or fraud. Our audits included performing procedures to assess the risks of material misstatement of the financial statements and financial highlights, whether due to error or fraud, and performing procedures that respond to those risks. Such procedures included examining, on a test basis, evidence regarding the amounts and disclosures in the financial statements and financial highlights. Such procedures also included confirmation of securities owned as of July 31, 2020, by correspondence with the custodian, transfer agent, and brokers, or by other appropriate auditing procedures when replies were not received. Our audits also included evaluating the accounting principles used and significant estimates made by management, as well as evaluating the overall presentation of the financial statements and financial highlights. We believe that our audits provide a reasonable basis for our opinion.

We have served as the auditor of one or more PGIM and/or Prudential Retail investment companies since 2003.
New York, New York
September 16, 2020
Tax Information (unaudited)
For the year ended July 31, 2020, the Fund reports the maximum amount allowable but not less than 99.70% as interest-related dividends in accordance with Section 871(k)(1) and 881(e)(1) of the Internal Revenue Code.
In January 2021, you will be advised on IRS Form 1099-DIV or substitute 1099-DIV as to the federal tax status of the dividends received by you in calendar year 2020.
We are required by Massachusetts, Missouri and Oregon to inform you that dividends which have been derived from interest on federal obligations are not taxable to shareholders provided the Fund meets certain requirements mandated by the respective state’s taxing authorities. We are pleased to report that 84.96% of the dividends paid by the Fund qualify for such deduction.
For more detailed information regarding your state and local taxes, you should contact your tax adviser or the state/local taxing authorities.
| | | | |
| PGIM Government Money Market Fund | | | 35 | |
INFORMATION ABOUT BOARD MEMBERS AND OFFICERS (unaudited)
Information about Board Members and Officers of the Fund is set forth below. Board Members who are not deemed to be “interested persons” of the Fund, as defined in the 1940 Act, are referred to as “Independent Board Members.” Board Members who are deemed to be “interested persons” of the Fund are referred to as “Interested Board Members.” The Board Members are responsible for the overall supervision of the operations of the Fund and perform the various duties imposed on the directors of investment companies by the 1940 Act. The Board in turn elects the Officers, who are responsible for administering the day-to-day operations of the Fund.
| | | | | | |
| Independent Board Members | | | | |
| | | | |
Name Year of Birth Position(s) Portfolios Overseen | | Principal Occupation(s) During Past Five Years | | Other Directorships Held During Past Five Years | | Length of Board Service |
| | | | |
Ellen S. Alberding 1958 Board Member Portfolios Overseen: 95 | | President and Board Member, The Joyce Foundation (charitable foundation) (since 2002); Vice Chair, City Colleges of Chicago (community college system) (2011-2015); Trustee, National Park Foundation (charitable foundation for national park system) (2009-2018); Trustee, Economic Club of Chicago (2009-2016); Trustee, Loyola University (since 2018). | | None. | | Since September 2013 |
| | | | |
Kevin J. Bannon 1952 Board Member Portfolios Overseen: 95 | | Retired; Managing Director (April 2008-May 2015) and Chief Investment Officer (October 2008-November 2013) of Highmount Capital LLC (registered investment adviser); formerly Executive Vice President and Chief Investment Officer (April 1993-August 2007) of Bank of New York Company; President (May 2003-May 2007) of BNY Hamilton Family of Mutual Funds. | | Director of Urstadt Biddle Properties (equity real estate investment trust) (since September 2008). | | Since July 2008 |
PGIM Government Money Market Fund
| | | | | | |
| Independent Board Members | | | | |
| | | | |
Name Year of Birth Position(s) Portfolios Overseen | | Principal Occupation(s) During Past Five Years | | Other Directorships Held During Past Five Years | | Length of Board Service |
| | | | |
Linda W. Bynoe 1952 Board Member Portfolios Overseen: 95 | | President and Chief Executive Officer (since March 1995) and formerly Chief Operating Officer (December 1989-February 1995) of Telemat Limited LLC (formerly, Telemat Ltd). (management consulting); formerly Vice President (January 1985-June 1989) at Morgan Stanley & Co. (broker-dealer). | | Director of Anixter International, Inc. (communication products distributor) (since January 2006–June 2020); Director of Northern Trust Corporation (financial services) (since April 2006); Trustee of Equity Residential (residential real estate) (since December 2009). | | Since March 2005 |
| | | | |
Barry H. Evans 1960 Board Member Portfolios Overseen: 94 | | Retired; formerly President (2005 – 2016), Global Chief Operating Officer (2014–2016), Chief Investment Officer – Global Head of Fixed Income (1998-2014), and various portfolio manager roles (1986-2006), Manulife Asset Management U.S. | | Formerly Director, Manulife Trust Company (2011-2018); formerly Director, Manulife Asset Management Limited (2015-2017); formerly Chairman of the Board of Directors of Manulife Asset Management U.S. (2005-2016); formerly Chairman of the Board, Declaration Investment Management and Research (2008-2016). | | Since September 2017 |
| | | | |
Keith F. Hartstein 1956 Board Member & Independent Chair Portfolios Overseen: 95 | | Executive Committee of the IDC Board of Governors (since October 2019); Retired; Member (since November 2014) of the Governing Council of the Independent Directors Council (IDC) (organization of independent mutual fund directors); formerly President and Chief Executive Officer (2005-2012), Senior Vice President (2004-2005), Senior Vice President of Sales and Marketing (1997-2004), and various executive management positions (1990-1997), John Hancock Funds, LLC (asset management); Chairman, Investment Company Institute’s Sales Force Marketing Committee (2003-2008). | | None. | | Since September 2013 |
Visit our website at pgim.com/investments
| | | | | | |
| Independent Board Members | | | | |
| | | | |
Name Year of Birth Position(s) Portfolios Overseen | | Principal Occupation(s) During Past Five Years | | Other Directorships Held During Past Five Years | | Length of Board Service |
| | | | |
Laurie Simon Hodrick 1962 Board Member Portfolios Overseen: 94 | | A. Barton Hepburn Professor Emerita of Economics in the Faculty of Business, Columbia Business School (since 2018); Visiting Professor of Law, Stanford Law School (since 2015); Visiting Fellow at the Hoover Institution, Stanford University (since 2015); Sole Member, ReidCourt LLC (since 2008) (a consulting firm); formerly A. Barton Hepburn Professor of Economics in the Faculty of Business, Columbia Business School (1996-2017); formerly Managing Director, Global Head of Alternative Investment Strategies, Deutsche Bank (2006-2008). | | Independent Director, Synnex Corporation (since April 2019) (information technology); Independent Director, Kabbage, Inc. (since July 2018) (financial services); Independent Director, Corporate Capital Trust (2017-2018) (a business development company). | | Since September 2017 |
| | | | |
Michael S. Hyland, CFA 1945 Board Member Portfolios Overseen: 95 | | Retired (since February 2005); formerly Senior Managing Director (July 2001-February 2005) of Bear Stearns & Co, Inc.; Global Partner, INVESCO (1999-2001); Managing Director and President of Salomon Brothers Asset Management (1989-1999). | | None. | | Since July 2008 |
| | | | |
Brian K. Reid 1961 Board Member Portfolios Overseen: 94 | | Retired; formerly Chief Economist for the Investment Company Institute (ICI) (2005-2017); formerly Senior Economist and Director of Industry and Financial Analysis at the ICI (1998-2004); formerly Senior Economist, Industry and Financial Analysis at the ICI (1996-1998); formerly Staff Economist at the Federal Reserve Board (1989-1996); Director, ICI Mutual Insurance Company (2012-2017). | | None. | | Since March 2018 |
PGIM Government Money Market Fund
| | | | | | |
| Independent Board Members | | | | |
| | | | |
Name Year of Birth Position(s) Portfolios Overseen | | Principal Occupation(s) During Past Five Years | | Other Directorships Held During Past Five Years | | Length of Board Service |
| | | | |
Grace C. Torres 1959 Board Member Portfolios Overseen: 94 | | Retired; formerly Treasurer and Principal Financial and Accounting Officer of the PGIM Funds, Target Funds, Advanced Series Trust, Prudential Variable Contract Accounts and The Prudential Series Fund (1998-June 2014); Assistant Treasurer (March 1999-June 2014) and Senior Vice President (September 1999-June 2014) of PGIM Investments LLC; Assistant Treasurer (May 2003-June 2014) and Vice President (June 2005-June 2014) of AST Investment Services, Inc.; Senior Vice President and Assistant Treasurer (May 2003-June 2014) of Prudential Annuities Advisory Services, Inc. | | Formerly Director (July 2015-January 2018) of Sun Bancorp, Inc. N.A. and Sun National Bank; Director (since January 2018) of OceanFirst Financial Corp. and OceanFirst Bank. | | Since November 2014 |
| | | | | | |
| Interested Board Members | | | | |
| | | | |
Name Year of Birth Position(s) Portfolios Overseen | | Principal Occupation(s) During Past Five Years | | Other Directorships Held During Past Five Years | | Length of Board Service |
| | | | |
Stuart S. Parker 1962 Board Member & President Portfolios Overseen: 96 | | President of PGIM Investments LLC (formerly known as Prudential Investments LLC) (since January 2012); Executive Vice President of Prudential Investment Management Services LLC (since December 2012); formerly Executive Vice President of Jennison Associates LLC and Head of Retail Distribution of PGIM Investments LLC (June 2005-December 2011). | | None. | | Since January 2012 |
Visit our website at pgim.com/investments
| | | | | | |
| Interested Board Members | | | | |
| | | | |
Name Year of Birth Position(s) Portfolios Overseen | | Principal Occupation(s) During Past Five Years | | Other Directorships Held During Past Five Years | | Length of Board Service |
| | | | |
Scott E. Benjamin 1973 Board Member & Vice President Portfolios Overseen: 96 | | Executive Vice President (since June 2009) of PGIM Investments LLC; Vice President (since June 2012) of Prudential Investment Management Services LLC; Executive Vice President (since September 2009) of AST Investment Services, Inc.; Senior Vice President of Product Development and Marketing, PGIM Investments (since February 2006); formerly Vice President of Product Development and Product Management, PGIM Investments LLC (2003-2006). | | None. | | Since March 2010 |
| | | | |
| Fund Officers(a) | | | | |
| | | |
Name Year of Birth Fund Position | | Principal Occupation(s) During Past Five Years | | Length of Service as Fund Officer |
| | | |
Claudia DiGiacomo 1974 Chief Legal Officer | | Vice President and Corporate Counsel (since January 2005) of Prudential; Chief Legal Officer of PGIM Investments LLC (since August 2020); Chief Legal Officer of Prudential Mutual Fund Services LLC (since August 2020); Chief Legal Officer of PIFM Holdco, LLC (since August 2020); and Corporate Counsel of AST Investment Services, Inc. (since August 2020); formerly Associate at Sidley Austin Brown & Wood LLP (1999-2004). | | Since December 2005 |
| | | |
Dino Capasso 1974 Chief Compliance Officer | | Chief Compliance Officer (July 2019-Present) of PGIM Investments LLC; Chief Compliance Officer (July 2019-Present) of the PGIM Funds, Target Funds, Advanced Series Trust, The Prudential Series Fund, Prudential’s Gibraltar Fund, Inc., PGIM Global High Yield Fund, Inc., and PGIM High Yield Bond Fund, Inc.; Vice President and Deputy Chief Compliance Officer (June 2017-2019) of PGIM Investments LLC; formerly, Senior Vice President and Senior Counsel (January 2016-June 2017), and Vice President and Counsel (February 2012-December 2015) of Pacific Investment Management Company LLC. | | Since March 2018 |
PGIM Government Money Market Fund
| | | | |
| Fund Officers(a) | | | | |
| | | |
Name Year of Birth Fund Position | | Principal Occupation(s) During Past Five Years | | Length of Service as Fund Officer |
| | | |
Andrew R. French 1962 Secretary | | Vice President (since December 2018 - present) of PGIM Investments LLC; Formerly, Vice President and Corporate Counsel (2010-2018) of Prudential; formerly Director and Corporate Counsel (2006-2010) of Prudential; Vice President and Assistant Secretary (since January 2007) of PGIM Investments LLC; Vice President and Assistant Secretary (since January 2007) of Prudential Mutual Fund Services LLC. | | Since October 2006 |
| | | |
Jonathan D. Shain 1958 Assistant Secretary | | Vice President and Corporate Counsel (since August 1998) of Prudential; Vice President and Assistant Secretary (since May 2001) of PGIM Investments LLC; Vice President and Assistant Secretary (since February 2001) of Prudential Mutual Fund Services LLC; formerly Vice President and Assistant Secretary (May 2003-June 2005) of AST Investment Services, Inc. | | Since May 2005 |
| | | |
Diana N. Huffman 1982 Assistant Secretary | | Vice President and Corporate Counsel (since September 2015) of Prudential; Vice President and Assistant Secretary (since August 2020) of PGIM Investments LLC; formerly Associate at Willkie Farr & Gallagher LLP (2009-2015). | | Since March 2019 |
| | | |
Melissa Gonzalez 1980 Assistant Secretary | | Vice President and Corporate Counsel (since September 2018) of Prudential; Vice President and Assistant Secretary (since August 2020) of PGIM Investments LLC; formerly Director and Corporate Counsel (March 2014-September 2018) of Prudential. | | Since March 2020 |
| | | |
Patrick E. McGuinness 1986 Assistant Secretary | | Vice President and Assistant Secretary (since August 2020) of PGIM Investments LLC; Director and Corporate Counsel (since February 2017) of Prudential; and Corporate Counsel (2012 – 2017) of IIL, Inc. | | Since June 2020 |
| | | |
Kelly A. Coyne 1968 Assistant Secretary | | Director, Investment Operations of Prudential Mutual Fund Services LLC (since 2010). | | Since March 2015 |
| | | |
Christian J. Kelly 1975 Treasurer and Principal Financial and Accounting Officer | | Vice President, Head of Fund Administration of PGIM Investments LLC (since November 2018); formerly, Director of Fund Administration of Lord Abbett & Co. LLC (2009-2018), Treasurer and Principal Accounting Officer of the Lord Abbett Family of Funds (2017-2018); Director of Accounting, Avenue Capital Group (2008-2009); Senior Manager, Investment Management Practice of Deloitte & Touche LLP (1998-2007). | | Since January 2019 |
| | | |
Lana Lomuti 1967 Assistant Treasurer | | Vice President (since 2007) and Director (2005-2007), within PGIM Investments Fund Administration; formerly Assistant Treasurer (December 2007-February 2014) of The Greater China Fund, Inc. | | Since April 2014 |
| | | |
Russ Shupak 1973 Assistant Treasurer | | Vice President (since 2017) and Director (2013-2017), within PGIM Investments Fund Administration. | | Since October 2019 |
Visit our website at pgim.com/investments
| | | | |
| Fund Officers(a) | | | | |
| | | |
Name Year of Birth Fund Position | | Principal Occupation(s) During Past Five Years | | Length of Service as Fund Officer |
| | | |
Deborah Conway 1969 Assistant Treasurer | | Vice President (since 2017) and Director (2007-2017), within PGIM Investments Fund Administration. | | Since October 2019 |
| | | |
Elyse M. McLaughlin 1974 Assistant Treasurer | | Vice President (since 2017) and Director (2011-2017), within PGIM Investments Fund Administration. | | Since October 2019 |
| | | |
Charles H. Smith 1973 Anti-Money Laundering Compliance Officer | | Vice President, Corporate Compliance, Anti-Money Laundering Unit (since January 2015) of Prudential; committee member of the American Council of Life Insurers Anti-Money Laundering and Critical Infrastructure Committee (since January 2016); formerly Global Head of Economic Sanctions Compliance at AIG Property Casualty (February 2007-December 2014); Assistant Attorney General at the New York State Attorney General’s Office, Division of Public Advocacy. (August 1998-January 2007). | | Since January 2017 |
(a) Excludes Mr. Parker and Mr. Benjamin, interested Board Members who also serve as President and Vice President, respectively.
Explanatory Notes to Tables:
| ∎ | | Board Members are deemed to be “Interested,” as defined in the 1940 Act, by reason of their affiliation with PGIM Investments LLC and/or an affiliate of PGIM Investments LLC. |
| ∎ | | Unless otherwise noted, the address of all Board Members and Officers is c/o PGIM Investments LLC, 655 Broad Street, Newark, New Jersey 07102-4410. |
| ∎ | | There is no set term of office for Board Members or Officers. The Board Members have adopted a retirement policy, which calls for the retirement of Board Members on December 31 of the year in which they reach the age of 75. |
| ∎ | | “Other Directorships Held” includes all directorships of companies required to register or file reports with the SEC under the 1934 Act (that is, “public companies”) or other investment companies registered under the 1940 Act. |
| ∎ | | “Portfolios Overseen” includes all investment companies managed by PGIM Investments LLC. The investment companies for which PGIM Investments LLC serves as manager include the PGIM Funds, The Prudential Variable Contract Accounts, PGIM ETF Trust, PGIM High Yield Bond Fund, Inc., PGIM Global High Yield Fund, Inc., The Prudential Series Fund, Prudential’s Gibraltar Fund, Inc. and the Advanced Series Trust. |
| ∎ | | As used in the Fund Officers table “Prudential” means The Prudential Insurance Company of America. |
PGIM Government Money Market Fund
Approval of Advisory Agreements
The Fund’s Board of Directors
The Board of Directors (the “Board”) of PGIM Government Money Market Fund (the “Fund”)1 consists of eleven individuals, nine of whom are not “interested persons” of the Fund, as defined in the Investment Company Act of 1940, as amended (the “1940 Act”) (the “Independent Directors”). The Board is responsible for the oversight of the Fund and its operations, and performs the various duties imposed on the directors of investment companies by the 1940 Act. The Independent Directors have retained independent legal counsel to assist them in connection with their duties. The Chair of the Board is an Independent Director. The Board has established four standing committees: the Audit Committee, the Nominating and Governance Committee, and two Investment Committees. Each committee is chaired by, and composed of, Independent Directors.
Annual Approval of the Fund’s Advisory Agreements
As required under the 1940 Act, the Board determines annually whether to renew the Fund’s management agreement with PGIM Investments LLC (“PGIM Investments”) and the Fund’s subadvisory agreement with PGIM, Inc. (“PGIM”) on behalf of its PGIM Fixed Income unit. In considering the renewal of the agreements, the Board, including all of the Independent Directors, met on May 27, 2020 and on June 9-11, 2020 and approved the renewal of the agreements through July 31, 2021, after concluding that the renewal of the agreements was in the best interests of the Fund and its shareholders.
In advance of the meetings, the Board requested and received materials relating to the agreements, and had the opportunity to ask questions and request further information in connection with its consideration. Among other things, the Board considered comparative fee information from PGIM Investments and PGIM. Also, the Board considered comparisons with other mutual funds in relevant Peer Universes and Peer Groups, as is further discussed below.
In approving the agreements, the Board, including the Independent Directors advised by independent legal counsel, considered the factors it deemed relevant, including the nature, quality and extent of services provided by PGIM Investments and the subadviser, the performance of the Fund, the profitability of PGIM Investments and its affiliates, expenses and fees, and the potential for economies of scale that may be shared with the Fund and its shareholders as the Fund’s assets grow. In their deliberations, the Directors did not identify any single factor which alone was responsible for the Board���s decision to approve the agreements with respect to the Fund. In connection with its deliberations, the Board considered information provided by PGIM Investments throughout the year at regular Board
| 1 | PGIM Government Money Market Fund is the sole series of Prudential Government Money Market Fund, Inc. |
| | |
| PGIM Government Money Market Fund |
Approval of Advisory Agreements (continued)
meetings, presentations from portfolio managers and other information, as well as information furnished at or in advance of the meetings on May 27, 2020 and on June 9-11, 2020.
The Directors determined that the overall arrangements between the Fund and PGIM Investments, which serves as the Fund’s investment manager pursuant to a management agreement, and between PGIM Investments and PGIM, which, through its PGIM Fixed Income unit, serves as the Fund’s subadviser pursuant to the terms of a subadvisory agreement with PGIM Investments, are in the best interests of the Fund and its shareholders in light of the services performed, fees charged and such other matters as the Directors considered relevant in the exercise of their business judgment.
The material factors and conclusions that formed the basis for the Directors’ reaching their determinations to approve the continuance of the agreements are separately discussed below.
Nature, Quality and Extent of Services
The Board received and considered information regarding the nature, quality and extent of services provided to the Fund by PGIM Investments and PGIM Fixed Income. The Board noted that PGIM Fixed Income is affiliated with PGIM Investments. The Board considered the services provided by PGIM Investments, including but not limited to the oversight of the subadviser for the Fund, as well as the provision of fund recordkeeping, compliance and other services to the Fund, and PGIM Investments’ role as administrator for the Fund’s liquidity risk management program. With respect to PGIM Investments’ oversight of the subadviser, the Board noted that PGIM Investments’ Strategic Investment Research Group (“SIRG”), which is a business unit of PGIM Investments, is responsible for monitoring and reporting to PGIM Investments’ senior management on the performance and operations of the subadviser. The Board also considered that PGIM Investments pays the salaries of all of the officers and interested Directors of the Fund who are part of Fund management. The Board also considered the investment subadvisory services provided by PGIM Fixed Income, including investment research and security selection, as well as adherence to the Fund’s investment restrictions and compliance with applicable Fund policies and procedures. The Board considered PGIM Investments’ evaluation of the subadviser, as well as PGIM Investments’ recommendation, based on its review of the subadviser, to renew the subadvisory agreement.
The Board considered the qualifications, backgrounds and responsibilities of PGIM Investments’ senior management responsible for the oversight of the Fund and PGIM Fixed Income, and also considered the qualifications, backgrounds and responsibilities of PGIM Fixed Income’s portfolio managers who are responsible for the day-to-day management of the Fund’s portfolio. The Board was provided with information pertaining to PGIM Investments’ and PGIM Fixed Income’s organizational structure, senior management, investment operations, and other relevant information pertaining to both PGIM Investments
| | |
| Visit our website at pgim.com/investments | | |
and PGIM Fixed Income. The Board also noted that it received favorable compliance reports from the Fund’s Chief Compliance Officer (“CCO”) as to both PGIM Investments and PGIM Fixed Income.
The Board concluded that it was satisfied with the nature, extent and quality of the investment management services provided by PGIM Investments and the subadvisory services provided to the Fund by PGIM Fixed Income, and that there was a reasonable basis on which to conclude that the Fund benefits from the services provided by PGIM Investments and PGIM Fixed Income under the management and subadvisory agreements.
Costs of Services and Profits Realized by PGIM Investments
The Board was provided with information on the profitability of PGIM Investments and its affiliates in serving as the Fund’s investment manager. The Board discussed with PGIM Investments the methodology utilized in assembling the information regarding profitability and considered its reasonableness. The Board recognized that it is difficult to make comparisons of profitability from fund management contracts because comparative information is not generally publicly available and is affected by numerous factors, including the structure of the particular adviser, the types of funds it manages, its business mix, numerous assumptions regarding allocations and the adviser’s capital structure and cost of capital. Taking these factors into account, the Board concluded that the profitability of PGIM Investments and its affiliates in relation to the services rendered was not unreasonable.
Economies of Scale
The Board received and discussed information concerning economies of scale that PGIM Investments may realize as the Fund’s assets grow beyond current levels. The Board noted that the management fee schedule for the Fund includes breakpoints, which have the effect of decreasing the fee rate as assets increase. During the course of time, the Board has considered information regarding the launch date of the Fund, the management fees of the Fund compared to those of similarly managed funds and PGIM Investments’ investment in the Fund over time. The Board noted that economies of scale can be shared with the Fund in other ways, including low management fees from inception, additional technological and personnel investments to enhance shareholder services, and maintaining existing expense structures in the face of a rising cost environment. The Board also considered PGIM Investments’ assertion that it continually evaluates the management fee schedule of the Fund and the potential to share economies of scale through breakpoints or fee waivers as asset levels increase.
The Board recognized the inherent limitations of any analysis of economies of scale, stemming largely from the Board’s understanding that most of PGIM Investments’ costs are not specific to individual funds, but rather are incurred across a variety of products and services.
| | |
| PGIM Government Money Market Fund |
Approval of Advisory Agreements (continued)
Other Benefits to PGIM Investments and PGIM Fixed Income
The Board considered potential ancillary benefits that might be received by PGIM Investments, PGIM Fixed Income and their affiliates as a result of their relationship with the Fund. The Board concluded that potential benefits to be derived by PGIM Investments included transfer agency fees received by the Fund’s transfer agent (which is affiliated with PGIM Investments), as well as benefits to its reputation or other intangible benefits resulting from PGIM Investments’ association with the Fund. The Board concluded that the potential benefits to be derived by PGIM Fixed Income included those generally resulting from an increase in assets under management, specifically, potential access to additional research resources and benefits to its reputation. The Board concluded that the benefits derived by PGIM Investments and PGIM Fixed Income were consistent with the types of benefits generally derived by investment managers and subadvisers to mutual funds.
Performance of the Fund / Fees and Expenses
The Board considered certain additional factors and made related conclusions relating to the historical performance of the Fund for the one-, three-, five- and ten-year periods ended December 31, 2019.
The Board also considered the Fund’s actual management fee, as well as the Fund’s net total expense ratio, for the fiscal year ended July 31, 2019. The Board considered the management fee for the Fund as compared to the management fee charged by PGIM Investments to other funds and the fee charged by other advisers to comparable mutual funds in a Peer Group. The actual management fee represents the fee rate actually paid by Fund shareholders and includes any fee waivers or reimbursements. The net total expense ratio for the Fund represents the actual expense ratio incurred by Fund shareholders.
The mutual funds included in the Peer Universe, which was used to consider performance, and the Peer Group, which was used to consider expenses and fees, were objectively determined by Broadridge, an independent provider of mutual fund data. In certain circumstances, PGIM Investments also provided supplemental Peer Universe or Peer Group information, for reasons addressed with the Board. The comparisons placed the Fund in various quartiles over various periods, with the first quartile being the best 25% of the mutual funds (for performance, the best performing mutual funds and, for expenses, the lowest cost mutual funds).
| | |
| Visit our website at pgim.com/investments | | |
The section below summarizes key factors considered by the Board and the Board’s conclusions regarding the Fund’s performance, fees and overall expenses. The table sets forth net performance comparisons (which reflect the impact on performance of fund expenses, or any subsidies, expense caps or waivers that may be applicable) with the Peer Universe, actual management fees with the Peer Group (which reflect the impact of any subsidies or fee waivers), and net total expenses with the Peer Group, each of which were key factors considered by the Board.
| | | | | | | | |
| Net Performance | | 1 Year | | 3 Years | | 5 Years | | 10 Years |
| | | 3rd Quartile | | 3rd Quartile | | 3rd Quartile | | 3rd Quartile |
| Actual Management Fees: 3rd Quartile |
| Net Total Expenses: 2nd Quartile |
| | • | | The Board noted that the Fund underperformed its Peer Universe median over all periods. |
| | • | | The Board considered PGIM Investments’ assertions that longer-term performance has been in line with the Lipper US Government Money Market Funds Universe; and that PGIM Fixed Income has demonstrated strong capabilities investing in short-term fixed income securities within other ultra-short and money market mandates. |
| | • | | The Board concluded that, in light of the above, it would be in the best interests of the Fund and its shareholders to renew the agreements. |
| | • | | The Board concluded that the management fees (including subadvisory fees) and total expenses were reasonable in light of the services provided. |
* * *
After full consideration of these factors, the Board concluded that approval of the agreements was in the best interests of the Fund and its shareholders.
| | |
| PGIM Government Money Market Fund |
| | | | |
| | |
| ∎ MAIL | | ∎ TELEPHONE | | ∎ WEBSITE |
655 Broad Street
Newark, NJ 07102 | | (800) 225-1852 | | pgim.com/investments |
|
| PROXY VOTING |
| The Board of Directors of the Fund has delegated to the Fund’s subadviser the responsibility for voting any proxies and maintaining proxy recordkeeping with respect to the Fund. A description of these proxy voting policies and procedures is available without charge, upon request, by calling (800) 225-1852 or by visiting the Securities and Exchange Commission’s website at sec.gov. Information regarding how the Fund voted proxies relating to portfolio securities during the most recent 12-month period ended June 30 is available on the Fund’s website and on the Commission’s website at sec.gov. |
|
| DIRECTORS |
| Ellen S. Alberding • Kevin J. Bannon • Scott E. Benjamin • Linda W. Bynoe • Barry H. Evans • Keith F. Hartstein • Laurie Simon Hodrick • Michael S. Hyland • Stuart S. Parker • Brian K. Reid • Grace C. Torres |
|
| OFFICERS |
Stuart S. Parker, President • Scott E. Benjamin, Vice President • Christian J. Kelly, Treasurer and Principal Financial and Accounting Officer • Claudia DiGiacomo, Chief Legal Officer • Dino Capasso, Chief Compliance Officer • Charles H. Smith, Anti-Money Laundering Compliance Officer • Andrew R. French, Secretary • Jonathan D. Shain, Assistant Secretary • Melissa Gonzalez, Assistant Secretary • Diana N. Huffman, Assistant Secretary • Kelly A. Coyne, Assistant Secretary • Patrick McGuinness, Assistant Secretary • Lana Lomuti, Assistant Treasurer • Russ Shupak, Assistant Treasurer • Elyse McLaughlin, Assistant Treasurer • Deborah Conway, Assistant Treasurer |
| | | | |
| MANAGER | | PGIM Investments LLC | | 655 Broad Street
Newark, NJ 07102 |
|
| SUBADVISER | | PGIM Fixed Income | | 655 Broad Street
Newark, NJ 07102 |
|
| DISTRIBUTOR | | Prudential Investment Management Services LLC | | 655 Broad Street
Newark, NJ 07102 |
|
| CUSTODIAN | | The Bank of New York Mellon | | 240 Greenwich Street
New York, NY 10286 |
|
| TRANSFER AGENT | | Prudential Mutual Fund Services LLC | | PO Box 9658
Providence, RI 02940 |
|
INDEPENDENT REGISTERED
PUBLIC ACCOUNTING FIRM | | KPMG LLP | | 345 Park Avenue
New York, NY 10154 |
|
| FUND COUNSEL | | Willkie Farr & Gallagher LLP | | 787 Seventh Avenue
New York, NY 10019 |
|
|
| An investor should consider the investment objectives, risks, charges, and expenses of the Fund carefully before investing. The prospectus and summary prospectus contain this and other information about the Fund. An investor may obtain a prospectus and summary prospectus by visiting our website at pgim.com/investments or by calling (800) 225-1852. The prospectus and summary prospectus should be read carefully before investing. |
|
| E-DELIVERY |
| To receive your mutual fund documents online, go to pgim.com/investments/resource/edelivery and enroll. Instead of receiving printed documents by mail, you will receive notification via email when new materials are available. You can cancel your enrollment or change your email address at any time by visiting the website address above. |
|
| SHAREHOLDER COMMUNICATIONS WITH DIRECTORS |
| Shareholders can communicate directly with the Board of Directors by writing to the Chair of the Board, PGIM Government Money Market Fund, PGIM Investments, Attn: Board of Directors, 655 Broad Street, Newark, NJ 07102. Shareholders can communicate directly with an individual Director by writing to that Director at the same address. Communications to the Board or individual Directors are not screened before being delivered to the addressee. |
|
| AVAILABILITY OF PORTFOLIO SCHEDULE |
The Fund files its complete schedule of portfolio holdings with the Securities and Exchange Commission for the first and third quarters of each fiscal year as an exhibit to its reports on Form N-PORT. The Fund’s Form N-PORT filings are available on the Commission’s website at sec.gov. |
|
| The Fund’s Statement of Additional Information contains additional information about the Fund’s Directors and is available without charge, upon request, by calling (800) 225-1852. |
Mutual Funds:
| | | | |
ARE NOT INSURED BY THE FDIC OR ANY
FEDERAL GOVERNMENT AGENCY | | MAY LOSE VALUE | | ARE NOT A DEPOSIT OF OR GUARANTEED
BY ANY BANK OR ANY BANK AFFILIATE |
PGIM GOVERNMENT MONEY MARKET FUND - PURCHASE
| | | | | | |
| SHARE CLASS | | A | | C | | Z |
| NASDAQ | | PBMXX | | N/A | | PMZXX |
| CUSIP | | 74440W409 | | N/A | | 74440W805 |
PGIM GOVERNMENT MONEY MARKET FUND - EXCHANGE
| | | | | | |
| SHARE CLASS | | A | | C | | Z |
| NASDAQ | | MJAXX | | MJCXX | | PMZXX |
| CUSIP | | 74440W102 | | 74440W300 | | 74440W805 |
MF108 E
Item 2 – Code of Ethics — See Exhibit (a)
As of the end of the period covered by this report, the registrant has adopted a code of ethics (the “Section 406 Standards for Investment Companies – Ethical Standards for Principal Executive and Financial Officers”) that applies to the registrant’s Principal Executive Officer and Principal Financial Officer; the registrant’s Principal Financial Officer also serves as the Principal Accounting Officer.
The registrant hereby undertakes to provide any person, without charge, upon request, a copy of the code of ethics. To request a copy of the code of ethics, contact the registrant 800-225-1852, and ask for a copy of the Section 406 Standards for Investment Companies - Ethical Standards for Principal Executive and Financial Officers.
Item 3 – Audit Committee Financial Expert –
The registrant’s Board has determined that Ms. Grace C. Torres, member of the Board’s Audit Committee is an “audit committee financial expert,” and that she is “independent,” for purposes of this item.
Item 4 – Principal Accountant Fees and Services –
(a) Audit Fees
For the fiscal years ended July 31, 2020 and July 31, 2019, KPMG LLP (“KPMG”), the Registrant’s principal accountant, billed the Registrant $24,596 and $24,596 respectively, for professional services rendered for the audit of the Registrant’s annual financial statements or services that are normally provided in connection with statutory and regulatory filings.
(b) Audit-Related Fees
For the fiscal year ended July 31, 2020, fees of $1,418 were billed to the Registrant for services rendered by KPMG in connection with an accounting system conversion and were paid by The Bank of New York Mellon. For the fiscal year ended July 31, 2019, there are no fees to report.
(c) Tax Fees
For the fiscal years ended July 31, 2020 and July 31, 2019: none.
(d) All Other Fees
For the fiscal years ended July 31, 2020 and July 31, 2019: none.
(e) (1) Audit Committee Pre-Approval Policies and Procedures
THE PGIM MUTUAL FUNDS
AUDIT COMMITTEE POLICY
on
Pre-Approval of Services Provided by the Independent
Accountants
The Audit Committee of each PGIM Mutual Fund is charged with the responsibility to monitor the independence of the Fund’s independent accountants. As part of this responsibility, the Audit Committee must pre-approve the independent accounting firm’s engagement to render audit and/or permissible non-audit services, as required by law. In evaluating a proposed engagement of the independent accountants, the Audit Committee will assess the effect that the engagement might reasonably be expected to have on the accountant’s independence. The Committee’s evaluation will be based on:
| | • | | a review of the nature of the professional services expected to be provided, |
| | • | | a review of the safeguards put into place by the accounting firm to safeguard independence, and |
| | • | | periodic meetings with the accounting firm. |
Policy for Audit and Non-Audit Services Provided to the Funds
On an annual basis, the scope of audits for each Fund, audit fees and expenses, and audit-related and non-audit services (and fees proposed in respect thereof) proposed to be performed by the Fund’s independent accountants will be presented by the Treasurer and the independent accountants to the Audit Committee for review and, as appropriate, approval prior to the initiation of such services.
Such presentation shall be accompanied by confirmation by both the Treasurer and the independent accountants that the proposed non-audit services will not adversely affect the independence of the independent accountants. Such proposed non-audit services shall be described in sufficient detail to enable the Audit Committee to assess the appropriateness of such services and fees, and the compatibility of the provision of such services with the auditor’s independence. The Committee shall receive periodic reports on the progress of the audit and other services which are approved by the Committee or by the Committee Chair pursuant to authority delegated in this Policy.
The categories of services enumerated under “Audit Services”, “Audit-related Services”, and “Tax Services” are intended to provide guidance to the Treasurer and the independent accountants as to those categories of services which the Committee believes are generally consistent with the independence of the independent accountants and which the Committee (or the Committee Chair) would expect upon the presentation of specific proposals to pre-approve. The enumerated categories are not intended as an exclusive list of audit, audit-related or tax services, which the Committee (or the Committee Chair) would consider for pre-approval.
Audit Services
The following categories of audit services are considered to be consistent with the role of the Fund’s independent accountants:
| | • | | Annual Fund financial statement audits |
| | • | | Seed audits (related to new product filings, as required) |
| | • | | SEC and regulatory filings and consents |
Audit-related Services
The following categories of audit-related services are considered to be consistent with the role of the Fund’s independent accountants:
| | • | | Accounting consultations |
| | • | | Fund merger support services |
| | • | | Agreed Upon Procedure Reports |
| | • | | Other Internal Control Reports |
Individual audit-related services that fall within one of these categories (except for fund merger support services) and are not presented to the Audit Committee as part of the annual pre-approval process are subject to an authorized pre-approval by the Audit Committee so long as the estimated fee for those services does not exceed $30,000. Any services provided under such pre-approval will be reported to the Audit Committee at its next regular meeting. Should the amount of such services exceed $30,000 any additional fees will be subject to pre-approval by the Committee Chair (or any other Committee member on whom this responsibility has been delegated). Fees related to fund merger support services are subject to a separate authorized
pre-approval by the Audit Committee with fees determined on a per occurrence and merger complexity basis.
Tax Services
The following categories of tax services are considered to be consistent with the role of the Fund’s independent accountants:
| | • | | Tax compliance services related to the filing or amendment of the following: |
| | • | | Federal, state and local income tax compliance; and, |
| | • | | Sales and use tax compliance |
| | • | | Timely RIC qualification reviews |
| | • | | Tax distribution analysis and planning |
| | • | | Tax authority examination services |
| | • | | Tax appeals support services |
| | • | | Accounting methods studies |
| | • | | Fund merger support services |
| | • | | Tax consulting services and related projects |
Individual tax services that fall within one of these categories and are not presented to the Audit Committee as part of the annual pre-approval process are subject to an authorized pre-approval by the Audit Committee so long as the estimated fee for those services does not exceed $30,000. Any services provided under such pre-approval will be reported to the Audit Committee at its next regular meeting. Should the amount of such services exceed $30,000 any additional fees will be subject to pre-approval by the Committee Chair (or any other Committee member on whom this responsibility has been delegated).
Other Non-Audit Services
Certain non-audit services that the independent accountants are legally permitted to render will be subject to pre-approval by the Committee or by one or more Committee members to whom the Committee has delegated this authority and who will report to the full Committee any pre-approval decisions made pursuant to this Policy. Non-audit services presented for pre-approval pursuant to this paragraph will be accompanied by a confirmation from both the Treasurer and the independent accountants that the proposed services will not adversely affect the independence of the independent accountants.
Proscribed Services
The Fund’s independent accountants will not render services in the following categories of non-audit services:
| | • | | Bookkeeping or other services related to the accounting records or financial statements of the Fund |
| | • | | Financial information systems design and implementation |
| | • | | Appraisal or valuation services, fairness opinions, or contribution-in-kind reports |
| | • | | Internal audit outsourcing services |
| | • | | Management functions or human resources |
| | • | | Broker or dealer, investment adviser, or investment banking services |
| | • | | Legal services and expert services unrelated to the audit |
| | • | | Any other service that the Public Company Accounting Oversight Board determines, by regulation, is impermissible. |
Pre-approval of Non-Audit Services Provided to Other Entities Within the PGIM Fund Complex
Certain non-audit services provided to PGIM Investments LLC or any of its affiliates that also provide ongoing services to the PGIM Mutual Funds will be subject to pre-approval by the Audit Committee. The only non-audit services provided to these entities that will require pre-approval are those related directly to the operations and financial reporting of the Funds.
Individual projects that are not presented to the Audit Committee as part of the annual pre-approval process will be subject to pre-approval by the Committee Chair (or any other Committee member on whom this responsibility has been delegated) so long as the estimated fee for those services does not exceed $30,000. Services presented for pre-approval pursuant to this paragraph will be accompanied by a confirmation from both the Treasurer and the independent accountants that the proposed services will not adversely affect the independence of the independent accountants.
Although the Audit Committee will not pre-approve all services provided to PGIM Investments LLC and its affiliates, the Committee will receive an annual report from the Fund’s independent accounting firm showing the aggregate fees for all services provided to PGIM Investments and its affiliates.
(e) (2) Percentage of services referred to in 4(b) – 4(d) that were approved by the audit committee –
For the fiscal year ended July 31, 2020, 100% of the services referred to in Item 4(b) was approved by the audit committee. For the fiscal year ended July 31, 2019: none.
(f) Percentage of hours expended attributable to work performed by other than full time employees of principal accountant if greater than 50%.
The percentage of hours expended on the principal accountant’s engagement to audit the registrant’s financial statements for the most recent fiscal year that were attributed to work performed by persons other than the principal accountant’s full-time, permanent employees was 0%.
(g) Non-Audit Fees
The aggregate non-audit fees billed by KPMG for services rendered to the registrant’s investment adviser and any entity controlling, controlled by, or under common control with the investment adviser that provides ongoing services to the registrant for the fiscal years ended July 31, 2020 and July 31, 2019 was $0 and $0, respectively.
(h) Principal Accountant’s Independence
Not applicable as KPMG has not provided non-audit services to the registrant’s investment adviser and any entity controlling, controlled by, or under common control with the investment adviser that provides ongoing services to the registrant that were not pre-approved pursuant to Rule 2-01(c)(7)(ii) of Regulation S-X.
Item 5 – Audit Committee of Listed Registrants – Not applicable.
Item 6 – Schedule of Investments – The schedule is included as part of the report to shareholders filed under Item 1 of this Form.
Item 7 – Disclosure of Proxy Voting Policies and Procedures for Closed-End Management Investment Companies – Not applicable.
Item 8 – Portfolio Managers of Closed-End Management Investment Companies – Not applicable.
Item 9 – Purchases of Equity Securities by Closed-End Management Investment Company and Affiliated Purchasers – Not applicable.
Item 10 – Submission of Matters to a Vote of Security Holders – There have been no material changes to these procedures.
Item 11 – Controls and Procedures
| | (a) | It is the conclusion of the registrant’s principal executive officer and principal financial officer that the effectiveness of the registrant’s current disclosure controls and procedures (such disclosure controls and procedures having been evaluated within 90 days of the date of this filing) provide reasonable assurance that |
| | the information required to be disclosed by the registrant has been recorded, processed, summarized and reported within the time period specified in the Commission’s rules and forms and that the information required to be disclosed by the registrant has been accumulated and communicated to the registrant’s principal executive officer and principal financial officer in order to allow timely decisions regarding required disclosure. |
| | (b) | There has been no significant change in the registrant’s internal control over financial reporting that occurred during the registrant’s most recent fiscal quarter of the period covered by this report that has materially affected, or is likely to materially affect, the registrant’s internal control over financial reporting. |
Item 12 – Controls and Procedures - Disclosure of Securities Lending Activities for Closed-End Management Investment Companies – Not applicable.
Item 13 – Exhibits
SIGNATURES
Pursuant to the requirements of the Securities Exchange Act of 1934 and the Investment Company Act of 1940, the registrant has duly caused this report to be signed on its behalf by the undersigned, thereunto duly authorized.
| | |
| Registrant: | | Prudential Government Money Market Fund, Inc. |
| |
| By: | | /s/ Andrew R. French |
| | Andrew R. French |
| | Secretary |
| |
| Date: | | September 16, 2020 |
Pursuant to the requirements of the Securities Exchange Act of 1934 and the Investment Company Act of 1940, this report has been signed below by the following persons on behalf of the registrant and in the capacities and on the dates indicated.
| | |
| |
| By: | | /s/ Stuart S. Parker |
| | Stuart S. Parker |
| | President and Principal Executive Officer |
| |
| Date: | | September 16, 2020 |
| |
| By: | | /s/ Christian J. Kelly |
| | Christian J. Kelly |
| | Treasurer and Principal Financial and Accounting Officer |
| |
| Date: | | September 16, 2020 |