
| Table of Contents |
The statement of operationsand supplemental statement of operations provided in this supplemental information package present funds from operations, core funds from operations, adjusted funds from operations, net operating income, EBITDAre and Adjusted EBITDA, which are REIT industry financial measures that are not calculated in accordance with accounting principles generally accepted in the United States. Please see page 18 for a definition of these supplemental performance measures. Please see the supplemental statement of operations reconciliation for a reconciliation of certain captions in the supplemental statement of operations reported in this supplemental information package to the statement of operations as reported in the Company’s filings with the SEC on Form 10-Q.
| As of | As of | |||||||
| December 31, 2017 | September 30, 2017 | |||||||
| (unaudited) | ||||||||
| ASSETS | ||||||||
| Real Estate Investments: | ||||||||
| Land | $ | 193,562,859 | $ | 187,224,819 | ||||
| Buildings and Improvements | 1,290,476,339 | 1,244,691,715 | ||||||
| Total Real Estate Investments | 1,484,039,198 | 1,431,916,534 | ||||||
| Accumulated Depreciation | (179,492,182 | ) | (171,060,478 | ) | ||||
| Real Estate Investments | 1,304,547,016 | 1,260,856,056 | ||||||
| Real Estate Held for Sale | 9,481,407 | 14,606,028 | ||||||
| Cash and Cash Equivalents | 10,755,901 | 10,226,046 | ||||||
| Securities Available for Sale at Fair Value | 130,431,475 | 123,764,770 | ||||||
| Tenant and Other Receivables | 5,385,744 | 1,753,054 | ||||||
| Deferred Rent Receivable | 8,391,569 | 8,049,275 | ||||||
| Prepaid Expenses | 9,125,236 | 5,434,874 | ||||||
| Intangible Assets, net of Accumulated Amortization of $13,554,423 and $13,404,318, respectively | 10,811,664 | 10,010,165 | ||||||
| Capitalized Lease Costs, net of Accumulated Amortization of $3,114,088 and $3,393,187, respectively | 4,161,907 | 4,180,907 | ||||||
| Financing Costs, net of Accumulated Amortization of $713,450 and $619,555, respectively | 781,813 | 875,709 | ||||||
| Other Assets | 5,251,185 | 3,280,871 | ||||||
| TOTAL ASSETS | $ | 1,499,124,917 | $ | 1,443,037,755 | ||||
| LIABILITIES AND SHAREHOLDERS’ EQUITY | ||||||||
| Liabilities: | ||||||||
| Fixed Rate Mortgage Notes Payable, net of Unamortized Debt | ||||||||
| Issuance Costs | $ | 612,651,435 | $ | 591,364,371 | ||||
| Loans Payable | 110,000,000 | 120,091,417 | ||||||
| Accounts Payable and Accrued Expenses | 3,587,862 | 4,450,753 | ||||||
| Other Liabilities | 18,801,819 | 14,265,518 | ||||||
| Total Liabilities | 745,041,116 | 730,172,059 | ||||||
| COMMITMENTS AND CONTINGENCIES | ||||||||
| Shareholders’ Equity: | ||||||||
| 6.125% Series C Cumulative Redeemable Preferred Stock,$0.01 Par Value Per Share: 12,400,000 Shares Authorized as of December 31, 2017 and September 30, 2017 10,879,379 and 9,839,445 Shares Issued and Outstanding as of December 31, 2017 and September 30, 2017, respectively | 271,984,475 | 245,986,125 | ||||||
| Common Stock, $0.01 Par Value Per Share: 192,039,750 Shares Authorized as of December 31, 2017 and September 30, 2017; 77,209,110 and 75,630,521 Shares Issued and Outstanding as of December 31, 2017 and September 30, 2017, respectively | 772,091 | 756,305 | ||||||
| Excess Stock, $0.01 Par Value Per Share: 200,000,000 Shares Authorized as of December 31, 2017 and September 30, 2017; No Shares Issued or Outstanding as of December 31, 2017 and September 30, 2017 | -0- | -0- | ||||||
| Additional Paid-In Capital | 485,469,807 | 459,552,701 | ||||||
| Accumulated Other Comprehensive Income (Loss) | (4,142,572 | ) | 6,570,565 | |||||
| Undistributed Income | -0- | -0- | ||||||
| Total Shareholders’ Equity | 754,083,801 | 712,865,696 | ||||||
| TOTAL LIABILITIES & SHAREHOLDERS’ EQUITY | $ | 1,499,124,917 | $ | 1,443,037,755 | ||||
First Quarter FY 2018 Supplemental of Monmouth Real Estate Investment Corp. Page 3 of 21
Consolidated Statements of Income
(unaudited)
| For The | ||||||||
| Three Months Ended | ||||||||
| 12/31/2017 | 12/31/2016 | |||||||
| INCOME: | ||||||||
| Rental Revenue | $ | 27,692,482 | $ | 23,280,856 | ||||
| Reimbursement Revenue | 5,049,340 | 3,900,755 | ||||||
| Lease Termination Income | 210,261 | -0- | ||||||
| TOTAL INCOME | 32,952,083 | 27,181,611 | ||||||
| EXPENSES: | ||||||||
| Real Estate Taxes | 3,862,663 | 2,906,981 | ||||||
| Operating Expenses | 1,436,241 | 1,294,468 | ||||||
| General & Administrative Expenses | 1,947,032 | 1,442,463 | ||||||
| Acquisition Costs | -0- | 178,526 | ||||||
| Depreciation | 8,483,984 | 6,992,495 | ||||||
| Amortization of Capitalized Lease Costs and Intangible Assets | 538,071 | 447,797 | ||||||
| TOTAL EXPENSES | 16,267,991 | 13,262,730 | ||||||
| OTHER INCOME (EXPENSE): | ||||||||
| Dividend and Interest Income | 2,864,217 | 1,292,151 | ||||||
| Gain on Sale of Securities Transactions | 100,153 | 806,108 | ||||||
| Interest Expense, including Amortization of Financing Costs | (7,405,947 | ) | (6,163,219 | ) | ||||
| TOTAL OTHER INCOME (EXPENSE) | (4,441,577 | ) | (4,064,960 | ) | ||||
| INCOME FROM CONTINUING OPERATIONS | 12,242,515 | 9,853,921 | ||||||
| Gain on Sale of Real Estate Investments | 5,387,886 | -0- | ||||||
| NET INCOME | 17,630,401 | 9,853,921 | ||||||
| Less: Preferred Dividends | 4,316,946 | 3,697,760 | ||||||
| NET INCOME ATTRIBUTABLE TO COMMON SHAREHOLDERS | $ | 13,313,455 | $ | 6,156,161 | ||||
First Quarter FY 2018 Supplemental of Monmouth Real Estate Investment Corp. Page 4 of 21
Net Income, FFO, Core FFO, AFFO, EBITDAre, Adjusted EBITDA and NOI Reconciliations
(unaudited)
| For The | ||||||||
| Three Months Ended | ||||||||
| FFO, Core FFO, AFFO | 12/31/2017 | 12/31/2016 | ||||||
| Net Income Attributable to Common Shareholders | $ | 13,313,455 | $ | 6,156,161 | ||||
| Plus: Depreciation Expense (Excluding Corporate Office Capitalized Costs) | 8,444,507 | 6,953,780 | ||||||
| Plus: Amortization of Intangible Assets | 343,746 | 267,847 | ||||||
| Plus: Amortization of Capitalized Lease Costs | 220,002 | 205,442 | ||||||
| Less: (Gain) / Plus: Loss on Sale of Real Estate Investments | (5,387,886 | ) | 95,336 | |||||
| FFO Attributable to Common Shareholders | 16,933,824 | 13,678,566 | ||||||
| Plus: Acquisition Costs | -0- | 178,526 | ||||||
| Core FFO Attributable to Common Shareholders | 16,933,824 | 13,857,092 | ||||||
| Plus: Depreciation of Corporate Office Capitalized Costs | 39,477 | 38,715 | ||||||
| Plus: Stock Compensation Expense | 130,763 | 100,155 | ||||||
| Plus: Amortization of Financing Costs | 293,894 | 280,913 | ||||||
| Less: Gain on Sale of Securities Transactions | (100,153 | ) | (806,108 | ) | ||||
| Less: Lease Termination Income | (210,261 | ) | -0- | |||||
| Less: Recurring Capital Expenditures | (219,246 | ) | (188,412 | ) | ||||
| Less: Effect of Non-cash U.S. GAAP Straight-line Rent Adjustment | (396,028 | ) | (343,239 | ) | ||||
| AFFO Attributable to Common Shareholders | $ | 16,472,270 | $ | 12,939,116 | ||||
| Three Months Ended | ||||||||
| EBITDAre, Adjusted EBITDA | 12/31/2017 | 12/31/2016 | ||||||
| Net Income Attributable to Common Shareholders | $ | 13,313,455 | $ | 6,156,161 | ||||
| Plus: Preferred Dividends | 4,316,946 | 3,697,760 | ||||||
| Plus: Interest Expense, including Amortization of Financing Costs | 7,405,947 | 6,163,219 | ||||||
| Plus: Depreciation and Amortization | 9,022,055 | 7,440,292 | ||||||
| Less: (Gain) / Plus: Loss on Sale of Real Estate Investments | (5,387,886 | ) | 95,336 | |||||
| EBITDAre | 28,670,517 | 23,552,768 | ||||||
| Plus: Acquisition Costs | -0- | 178,526 | ||||||
| Plus: Net Amortization of Acquired Above and Below Market Lease Revenue | 25,677 | 25,492 | ||||||
| Less: Gain on Sale of Securities Transactions | (100,153 | ) | (806,108 | ) | ||||
| Adjusted EBITDA | $ | 28,596,041 | $ | 22,950,678 | ||||
| Three Months Ended | ||||||||
| Net Operating Income | 12/31/2017 | 12/31/2016 | ||||||
| Net Income Attributable to Common Shareholders | $ | 13,313,455 | $ | 6,156,161 | ||||
| Plus: Preferred Dividends | 4,316,946 | 3,697,760 | ||||||
| Plus: General & Administrative Expenses | 1,947,032 | 1,442,463 | ||||||
| Plus: Acquisition Costs | -0- | 178,526 | ||||||
| Plus: Depreciation | 8,483,984 | 6,992,495 | ||||||
| Plus: Amortization of Capitalized Lease Costs and Intangible Assets | 538,071 | 447,797 | ||||||
| Plus: Interest Expense, including Amortization of Financing Costs | 7,405,947 | 6,163,219 | ||||||
| Less: Dividend and Interest Income | (2,864,217 | ) | (1,292,151 | ) | ||||
| Less: Gain on Sale of Securities Transactions | (100,153 | ) | (806,108 | ) | ||||
| Less: Gain on Sale of Real Estate Investments | (5,387,886 | ) | -0- | |||||
| Less: Lease Termination Income | (210,261 | ) | -0- | |||||
| Net Operating Income – NOI | $ | 27,442,918 | $ | 22,980,162 | ||||
| Three Months Ended | ||||||||
| Components of Net Operating Income Consists of: | 12/31/2017 | 12/31/2016 | ||||||
| Revenues: | ||||||||
| Rental Revenue | $ | 27,692,482 | $ | 23,280,856 | ||||
| Reimbursement Revenue | 5,049,340 | 3,900,755 | ||||||
| Total Rental and Reimbursement Revenue | 32,741,822 | 27,181,611 | ||||||
| Expenses: | ||||||||
| Real Estate Taxes | 3,862,663 | 2,906,981 | ||||||
| Operating Expenses | 1,436,241 | 1,294,468 | ||||||
| Total Real Estate Taxes and Operating Expenses | 5,298,904 | 4,201,449 | ||||||
| Net Operating Income – NOI | $ | 27,442,918 | $ | 22,980,162 | ||||
First Quarter FY 2018 Supplemental of Monmouth Real Estate Investment Corp. Page 5 of 21
(unaudited)
| For The | ||||||||
| Three Months Ended | ||||||||
| 12/31/2017 | 12/31/2016 | |||||||
| Weighted Average Common Shares Outstanding | ||||||||
| Basic | 76,375,400 | 69,686,153 | ||||||
| Diluted | 76,586,782 | 69,829,793 | ||||||
| Net Income Attributable to Common Shareholders | $ | 13,313,455 | $ | 6,156,161 | ||||
| Basic | $ | 0.17 | $ | 0.09 | ||||
| Diluted | 0.17 | 0.09 | ||||||
| Net Operating Income – NOI | $ | 27,442,918 | $ | 22,980,162 | ||||
| Basic | $ | 0.36 | $ | 0.33 | ||||
| Diluted | 0.36 | 0.33 | ||||||
| Funds From Operations – FFO | $ | 16,933,824 | $ | 13,678,566 | ||||
| Basic | $ | 0.22 | $ | 0.20 | ||||
| Diluted | 0.22 | 0.20 | ||||||
| Core Funds From Operations - Core FFO | $ | 16,933,824 | $ | 13,857,092 | ||||
| Basic | $ | 0.22 | $ | 0.20 | ||||
| Diluted | 0.22 | 0.20 | ||||||
| Core FFO Including Gain Over Historic Cost (Undepreciated) on Sale of Real Estate Investments (1) | $ | 18,737,378 | $ | 13,857,092 | ||||
| Basic | $ | 0.25 | $ | 0.20 | ||||
| Diluted | 0.24 | 0.20 | ||||||
| Core FFO Excluding Gain on Sale of Securities Transactions and | $ | 16,623,410 | $ | 13,050,984 | ||||
| Excluding Lease Termination Income | ||||||||
| Basic | $ | 0.22 | $ | 0.19 | ||||
| Diluted | 0.22 | 0.19 | ||||||
| Adjusted Funds From Operations – AFFO | $ | 16,472,270 | $ | 12,939,116 | ||||
| Basic | $ | 0.22 | $ | 0.19 | ||||
| Diluted | 0.22 | 0.19 | ||||||
| Dividends Declared per Common Share | $ | 0.17 | $ | 0.16 | ||||
| Dividend/AFFO Payout Ratio | 77.3 | % | ||||||
| (1) | On December 18, 2017, the Company sold its property located in Kansas City, MO for $4,900,000, with net sale proceeds to the Company of approximately $4,602,000 and on December 22, 2017, the Company sold its property located in Orangeburg, NY for $6,170,000, with net sale proceeds to the Company of approximately $5,898,000. The sale of these two properties resulted in a realized gain of $5,387,886, representing a 105% gain over the depreciated U.S. GAAP basis and a realized net gain on a historic cost (undepreciated) basis of $1,803,554, representing a 21% net gain over the Company’s historic cost basis. |
First Quarter FY 2018 Supplemental of Monmouth Real Estate Investment Corp. Page 6 of 21
(unaudited)
| For The | ||||||||||||||||||||
| Three Months Ended | ||||||||||||||||||||
| 12/31/2017 | 12/31/2016 | Change | Change % | |||||||||||||||||
| Total Square Feet / Total Properties | 19,096,237 / 108 | 16,553,910 / 100 | 2,542,327 | 15.4 | % | |||||||||||||||
| Occupancy Percentage at End of Period | 99.5 | % | 100.0 | % | (50) bps | (0.5 | )% | |||||||||||||
| Same Property Square Feet / Number of Same Properties | 15,562,723 / 95 | |||||||||||||||||||
| Same Property Occupancy Percentage at End of Period | 99.4 | % | 100.0 | % | (60) bps | (0.6 | )% | |||||||||||||
| Same Property Net Operating Income (NOI) (GAAP) | $ | 21,660,991 | $ | 21,961,333 | $ | (300,342 | ) | (1.4 | )% | |||||||||||
| Reversal ofEffect of Non-cashU.S. GAAP Straight-line Rent Adjustment | (246,995 | ) | (320,282 | ) | 73,287 | |||||||||||||||
| Same Property Cash NOI (Cash) | $ | 21,413,996 | $ | 21,641,051 | $ | (227,055 | ) | (1.0 | )% | |||||||||||
Same Property Statistics include all properties owned during the entire periods presented with the exclusion of properties expanded during these periods.
The 1.4% decrease, amounting to $300,342 in Same Property NOI, is mainly due to a $217,364 decrease attributable to a 60 bps decline in the Same Property Occupancy Percentage. The remaining $82,978 decrease in Same Property NOI is a from a decrease in NOI from occupied properties.
The 1.0% decrease, amounting to $227,055 in Same Property Cash NOI, is mainly due to a $220,315 decrease attributable to a 60 bps decline in the Same Property Occupancy Percentage. The remaining $6,740 decrease in Same Property Cash NOI is from a decrease in NOI from occupied properties.
Reconciliation of Same Property NOI to Total NOI
| For The | ||||||||||||||||
| Three Months Ended | ||||||||||||||||
| 12/31/2017 | 12/31/2016 | Change | Change % | |||||||||||||
| Same Property NOI (GAAP) | $ | 21,660,991 | $ | 21,961,333 | $ | (300,342 | ) | (1.4 | )% | |||||||
| NOI of properties purchased subsequent to September 30, 2016 (two properties for fiscal 2018 and ten properties for fiscal 2017) | 5,141,649 | 593,602 | ||||||||||||||
| NOI of properties expanded subsequent to September 30, 2016 (one property for fiscal 2018 and 2017) | 415,786 | 379,115 | ||||||||||||||
| NOI of property sold subsequent to September 30, 2016 (two properties sold during fiscal 2018 and one during fiscal 2017) | 224,492 | 46,112 | ||||||||||||||
| Total NOI | $ | 27,442,918 | $ | 22,980,162 | $ | 4,462,756 | 19.4 | % | ||||||||
First Quarter FY 2018 Supplemental of Monmouth Real Estate Investment Corp. Page 7 of 21
Consolidated Statements of Cash Flows
(unaudited)
| For The | ||||||||
| Three Months Ended | ||||||||
| 12/31/2017 | 12/31/2016 | |||||||
| CASH FLOWS FROM OPERATING ACTIVITIES | ||||||||
| Net Income | $ | 17,630,401 | $ | 9,853,921 | ||||
| Noncash Items Included in Net Income: | ||||||||
| Depreciation & Amortization | 9,315,949 | 7,721,205 | ||||||
| Deferred Straight Line Rent | (396,028 | ) | (343,239 | ) | ||||
| Stock Compensation Expense | 130,763 | 100,155 | ||||||
| Gain on Sale of Securities Transactions | (100,153 | ) | (806,108 | ) | ||||
| (Gain) / Loss on Sale of Real Estate Investments | (5,387,886 | ) | 95,336 | |||||
| Changes in: | ||||||||
| Tenant & Other Receivables | (3,607,013 | ) | (255,461 | ) | ||||
| Prepaid Expenses | (3,690,362 | ) | (2,645,032 | ) | ||||
| Other Assets & Capitalized Lease Costs | (89,641 | ) | (428,282 | ) | ||||
| Accounts Payable, Accrued Expenses & Other Liabilities | 3,284,409 | 860,211 | ||||||
| NET CASH PROVIDED BY OPERATING ACTIVITIES | 17,090,439 | 14,152,706 | ||||||
| CASH FLOWS FROM INVESTING ACTIVITIES | ||||||||
| Purchase of Real Estate & Intangible Assets | (52,500,165 | ) | (56,101,538 | ) | ||||
| Capital Improvements | (1,782,422 | ) | (696,941 | ) | ||||
| Proceeds on Sales of Real Estate | 10,499,704 | 4,125,819 | ||||||
| Return of Deposits on Real Estate | 450,000 | 1,000,000 | ||||||
| Deposits Paid on Acquisitions of Real Estate | (1,350,000 | ) | (820,000 | ) | ||||
| Proceeds from Sale of Securities Available for Sale | 2,435,168 | 3,738,938 | ||||||
| Purchase of Securities Available for Sale | (19,714,857 | ) | (6,396,581 | ) | ||||
| NET CASH USED IN INVESTING ACTIVITIES | (61,962,572 | ) | (55,150,303 | ) | ||||
| CASH FLOWS FROM FINANCING ACTIVITIES | ||||||||
| Net Repayments on Loans Payable | (10,091,417 | ) | (4,790,684 | ) | ||||
| Proceeds from Fixed Rate Mortgage Notes Payable | 33,800,000 | 38,000,000 | ||||||
| Principal Payments on Fixed Rate Mortgage Notes Payable | (12,351,030 | ) | (9,456,016 | ) | ||||
| Financing Costs Paid on Debt | (361,905 | ) | (636,963 | ) | ||||
| Proceeds from the Exercise of Stock Options | 284,800 | -0- | ||||||
| Redemption of 7.625% Series A Preferred Stock | -0- | (53,493,750 | ) | |||||
| Proceeds from At-The-Market Preferred Equity Program, net of offering costs | 25,687,516 | -0- | ||||||
| Proceeds from Issuance of Common Stock in the DRIP, net of Dividend Reinvestments | 22,611,458 | 18,877,487 | ||||||
| Preferred Dividends Paid | (4,080,685 | ) | (3,422,136 | ) | ||||
| Common Dividends Paid, net of Reinvestments | (10,096,749 | ) | (9,107,243 | ) | ||||
| NET CASH PROVIDED BY (USED IN) FINANCING ACTIVITIES | 45,401,988 | (24,029,305 | ) | |||||
| NET INCREASE (DECREASE) IN CASH AND CASH EQUIVALENTS | 529,855 | (65,026,902 | ) | |||||
| CASH AND CASH EQUIVALENTS - BEGINNING OF PERIOD | 10,226,046 | 95,749,508 | ||||||
| CASH AND CASH EQUIVALENTS - END OF PERIOD | $ | 10,755,901 | $ | 30,722,606 | ||||
First Quarter FY 2018 Supplemental of Monmouth Real Estate Investment Corp. Page 8 of 21
| Shares Outstanding | 77,209,110 | 70,536,720 | 75,630,521 | |||||||||
| Market Price Per Share | $ | 17.80 | $ | 15.24 | $ | 16.19 | ||||||
| Equity Market Capitalization | $ | 1,374,322,158 | $ | 1,074,979,613 | $ | 1,224,458,135 | ||||||
| Total Debt | 722,651,435 | 581,574,117 | 711,455,788 | |||||||||
| Total Preferred Stock | 271,984,475 | 192,500,000 | 245,986,125 | |||||||||
| Total Market Capitalization | $ | 2,368,958,068 | $ | 1,849,053,730 | $ | 2,181,900,048 |
| Total Debt | $ | 722,651,435 | $ | 581,574,117 | $ | 711,455,788 | ||||||
| less: Cash and Cash Equivalents | 10,755,901 | 30,722,606 | 10,226,046 | |||||||||
| Net Debt | $ | 711,895,534 | $ | 550,851,511 | $ | 701,229,742 | ||||||
| less: Securities Available for Sale at Fair Value (Securities) | 130,431,475 | 74,321,496 | 123,764,770 | |||||||||
| Net Debt Less Securities | $ | 581,464,059 | $ | 476,530,015 | $ | 577,464,972 |
| Net Debt / Total Undepreciated Book Capitalization | 42.9 | % | 40.9 | % | 43.8 | % | ||||||
| Net Debt / Total Market Capitalization | 30.1 | % | 29.8 | % | 32.1 | % | ||||||
| Net Debt Plus Preferred Stock / Total Market Capitalization | 41.5 | % | 40.2 | % | 43.4 | % | ||||||
| Net Debt Less Securities / Total Undepreciated Book Capitalization | 35.0 | % | 35.4 | % | 36.1 | % | ||||||
| Net Debt Less Securities / Total Market Capitalization | 24.5 | % | 25.8 | % | 26.5 | % | ||||||
| Net Debt Less Securities Plus Preferred Stock / Total Market Capitalization | 36.0 | % | 36.2 | % | 37.7 | % | ||||||
| Weighted Average Interest Rate on Fixed Rate Debt | 4.16 | % | 4.44 | % | 4.18 | % |
First Quarter FY 2018 Supplemental of Monmouth Real Estate Investment Corp. Page 9 of 21
Capital Structure and Leverage Ratios continued
(unaudited)
| For The | Fiscal Year | |||||||||||
| Three Months Ended | Ended | |||||||||||
| 12/31/2017 | 12/31/2016 | 9/30/2017 | ||||||||||
| Net Income | $ | 17,630,401 | $ | 9,853,921 | $ | 40,271,085 | ||||||
| plus: Interest Expense, including Amortization of Financing Costs | 7,405,947 | 6,163,219 | 25,754,121 | |||||||||
| plus: Depreciation and Amortization | 9,022,055 | 7,440,292 | 31,459,749 | |||||||||
| less: (Gain) / plus: Loss on Sale of Real Estate Investments | (5,387,886 | ) | 95,336 | 95,336 | ||||||||
| EBITDAre | 28,670,517 | 23,552,768 | 97,580,291 | |||||||||
| plus: Acquisition Costs | -0- | 178,526 | 178,526 | |||||||||
| plus: Net Amortization of Acquired Above and Below Market Lease Revenue | 25,677 | 25,492 | 101,968 | |||||||||
| less: Gain on Sale of Securities Transactions | (100,153 | ) | (806,108 | ) | (2,311,714 | ) | ||||||
| Adjusted EBITDA | $ | 28,596,041 | $ | 22,950,678 | $ | 95,549,071 | ||||||
| Interest Expense, including Amortization of Financing Costs | $ | 7,405,947 | $ | 6,163,219 | $ | 25,754,121 | ||||||
| Preferred Dividends | 4,316,946 | 3,697,760 | 14,861,686 | |||||||||
| Total Fixed Charges | $ | 11,722,893 | $ | 9,860,979 | $ | 40,615,807 | ||||||
| Interest Coverage | 3.9 x | 3.7 x | 3.7 x | |||||||||
| Fixed Charge Coverage | 2.4 x | 2.3 x | 2.4 x | |||||||||
| Net Debt | $ | 711,895,534 | $ | 550,851,511 | $ | 701,229,742 | ||||||
| Net Debt Less Securities | 581,464,059 | 476,530,015 | 577,464,972 | |||||||||
| Total Preferred Stock | 271,984,475 | 192,500,000 | 245,986,125 | |||||||||
| Annualized Adjusted EBITDA | 114,384,164 | 91,802,712 | 95,549,071 | |||||||||
| Net Debt / Adjusted EBITDA | 6.2 x | 6.0 x | 7.3 x | |||||||||
| Net Debt Less Securities / Adjusted EBITDA | 5.1 x | 5.2 x | 6.0 x | |||||||||
| Net Debt + Preferred Stock / Adjusted EBITDA | 8.6 x | 8.1 x | 9.9 x | |||||||||
| Net Debt Less Securities + Preferred Stock / Adjusted EBITDA | 7.5 x | 7.3 x | 8.6 x | |||||||||
First Quarter FY 2018 Supplemental of Monmouth Real Estate Investment Corp. Page 10 of 21
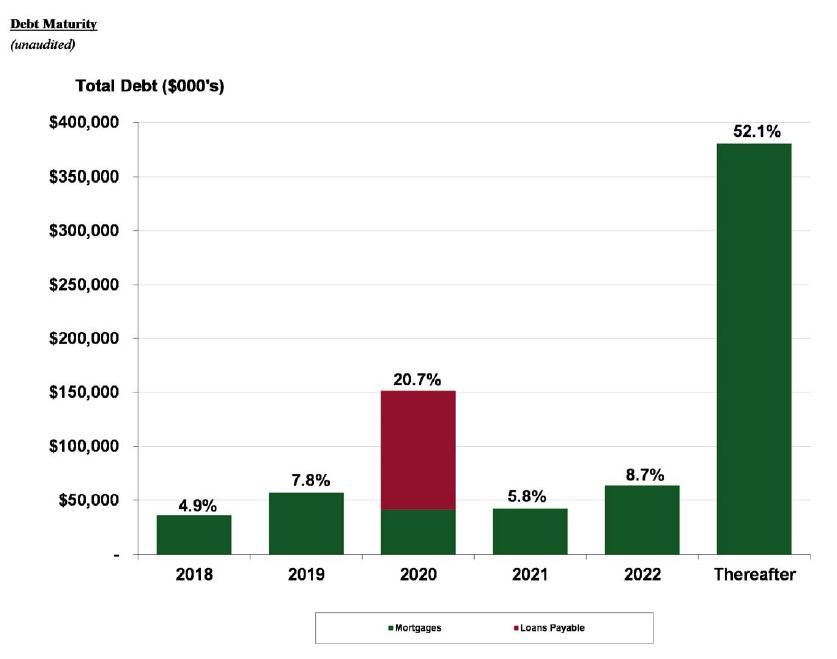
| Loans | % of | |||||||||||||||||
| Fiscal Year Ended | Mortgages | Payable | Total | Total | ||||||||||||||
| 2018 | $ | 35,867,466 | -0- | $ | 35,867,466 | 4.9 | % | |||||||||||
| 2019 | 57,124,164 | -0- | 57,124,164 | 7.8 | % | |||||||||||||
| 2020 | 41,305,075 | 110,000,000 | (B) | 151,305,075 | 20.7 | % | ||||||||||||
| 2021 | 42,244,703 | -0- | 42,244,703 | 5.8 | % | |||||||||||||
| 2022 | 63,657,707 | -0- | 63,657,707 | 8.7 | % | |||||||||||||
| Thereafter | 380,212,422 | -0- | 380,212,422 | 52.1 | % | |||||||||||||
| Total as of 12/31/2017 | (A) | $ | 620,411,537 | $ | 110,000,000 | $ | 730,411,537 | 100.0 | % | |||||||||
| Weighted Average Interest Rate | 4.16 | % | 3.06 | % | 3.99 | % | ||||||||||||
| Weighted Average Term | 11.5 yrs. | 2.75 yrs. | 10.18 yrs. | |||||||||||||||
| (A) | Mortgages does not include unamortized debt issuance costs of $7,760,102. | |
| (B) | Represents the amount drawn down on a line of credit that has a one year extension option, which is not reflected above. |
First Quarter FY 2018 Supplemental of Monmouth Real Estate Investment Corp. Page 11 of 21
(unaudited)
| Property | Square | Occupied Square | % of Occupied | Annual | % of Total Ann. | Rent Persf | Undepreciated | Mortgage | ||||||||||||||||||||||||||||||
| Tenant | Count | Footage | Footage | sf | Rent | Rent | Occup. | Cost | Balance | |||||||||||||||||||||||||||||
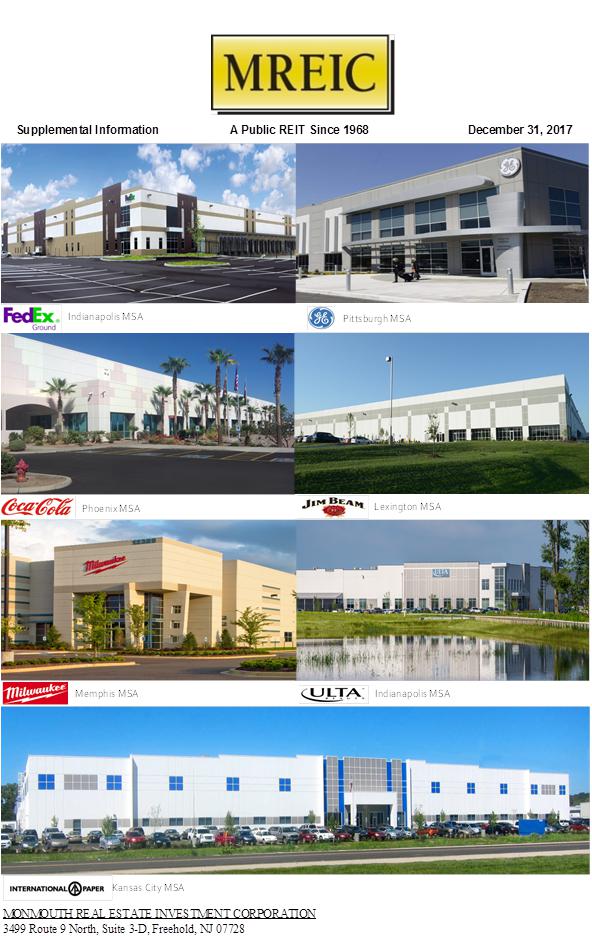
| FedEx Ground Package System, Inc. | 43 | 7,967,706 | 7,967,706 | 41.7 | % | $ | 59,396,000 | 52.3 | % | $ | 7.45 | $ | 811,694,658 | $ | 364,391,221 | |||||||||||||||||||||||
| FedEx Corporation | 16 | 1,544,996 | 1,544,996 | 8.1 | % | 7,997,000 | 7.0 | % | 5.18 | 108,572,968 | 27,507,513 | |||||||||||||||||||||||||||
| Total FedEx | 59 | 9,512,702 | 9,512,702 | 49.8 | % | 67,393,000 | 59.3 | % | 7.08 | 920,267,626 | 391,898,734 | |||||||||||||||||||||||||||
| Milwaukee Electric Tool Corporation | 1 | 861,889 | 861,889 | 4.5 | % | 3,032,000 | 2.7 | % | 3.52 | 36,914,917 | 23,033,196 | |||||||||||||||||||||||||||
| ULTA, Inc. | 1 | 671,354 | 671,354 | 3.5 | % | 2,702,000 | 2.4 | % | 4.02 | 37,512,071 | 21,158,449 | |||||||||||||||||||||||||||
| Jim Beam Brands Company | 1 | 599,840 | 599,840 | 3.1 | % | 2,051,000 | 1.8 | % | 3.42 | 28,000,000 | 17,334,581 | |||||||||||||||||||||||||||
| International Paper Company | 2 | 578,472 | 578,472 | 3.0 | % | 2,592,000 | 2.3 | % | 4.48 | 36,175,718 | 21,654,034 | |||||||||||||||||||||||||||
| TreeHouse Private Brands, Inc. | 1 | 558,600 | 558,600 | 2.9 | % | 2,206,000 | 1.9 | % | 3.95 | 26,807,852 | 15,840,219 | |||||||||||||||||||||||||||
| CBOCS Distribution, Inc. (Cracker Barrel) | 1 | 381,240 | 381,240 | 2.0 | % | 1,447,000 | 1.3 | % | 3.80 | 14,215,126 | 7,390,973 | |||||||||||||||||||||||||||
| Best Buy Warehousing Logistics, Inc. | 1 | 368,060 | 368,060 | 1.9 | % | 1,676,000 | 1.5 | % | 4.55 | 19,600,000 | 9,743,991 | |||||||||||||||||||||||||||
| Coca-Cola | 2 | 323,358 | 323,358 | 1.7 | % | 1,693,000 | 1.5 | % | 5.24 | 20,504,069 | 5,383,270 | |||||||||||||||||||||||||||
| Autoneum North America, Inc. | 1 | 315,560 | 315,560 | 1.7 | % | 1,703,000 | 1.5 | % | 5.40 | 21,040,395 | 15,041,036 | |||||||||||||||||||||||||||
| Science Applications International Corporation | 1 | 302,400 | 302,400 | 1.6 | % | 1,491,000 | 1.3 | % | 4.93 | 13,374,441 | -0- | |||||||||||||||||||||||||||
| Amazon.com Services, Inc. | 1 | 300,000 | 300,000 | 1.6 | % | 1,884,000 | 1.7 | % | 6.28 | 29,878,942 | 19,600,000 | |||||||||||||||||||||||||||
| United Technologies Corporation | 3 | 283,150 | 283,150 | 1.5 | % | 2,264,000 | 2.0 | % | 8.00 | 27,687,512 | 7,043,884 | |||||||||||||||||||||||||||
| Bunzl USA Holdings, Inc. | 2 | 268,778 | 268,778 | 1.4 | % | 1,474,000 | 1.3 | % | 5.48 | 18,379,665 | 12,596,212 | |||||||||||||||||||||||||||
| Woodstream Corporation | (B) | 1 | 256,000 | 256,000 | 1.3 | % | 914,000 | 0.8 | % | 3.57 | 8,899,035 | -0- | ||||||||||||||||||||||||||
| Anda Pharmaceuticals, Inc. | 1 | 234,660 | 234,660 | 1.2 | % | 1,205,000 | 1.1 | % | 5.14 | 14,550,000 | 8,022,373 | |||||||||||||||||||||||||||
| UGN, Inc. | 1 | 232,200 | 232,200 | 1.2 | % | 1,070,000 | 0.9 | % | 4.61 | 12,937,000 | 7,489,353 | |||||||||||||||||||||||||||
| Mickey Thompson Performance Tires and Wheels (Cooper Tire) | 1 | 219,765 | 219,765 | 1.2 | % | 1,501,000 | 1.3 | % | 6.83 | 18,934,065 | 12,598,036 | |||||||||||||||||||||||||||
| Caterpillar Logistics Services, Inc. | (D) | 1 | 218,120 | 218,120 | 1.1 | % | 1,169,000 | 1.0 | % | 5.36 | 14,868,857 | -0- | ||||||||||||||||||||||||||
| Anheuser-Busch, Inc. | 1 | 184,800 | 184,800 | 1.0 | % | 821,000 | 0.7 | % | 4.44 | 12,697,848 | -0- | |||||||||||||||||||||||||||
| Carlisle Tire & Wheel Company | 1 | 179,280 | 179,280 | 0.9 | % | 739,000 | 0.7 | % | 4.12 | 7,232,986 | -0- | |||||||||||||||||||||||||||
| NF&M International, Inc. | (A) | 1 | 174,802 | 174,802 | 0.9 | % | 835,000 | 0.7 | % | 4.78 | 5,399,580 | -0- | ||||||||||||||||||||||||||
| Home Depot USA, Inc. | 1 | 171,200 | 171,200 | 0.9 | % | 997,000 | 0.9 | % | 5.82 | 11,298,367 | -0- | |||||||||||||||||||||||||||
| Victory Packaging, L.P. | 1 | 148,000 | 148,000 | 0.8 | % | 502,000 | 0.4 | % | 3.39 | 5,451,629 | -0- | |||||||||||||||||||||||||||
| Challenger Lifts, Inc. (Snap-On Inc.) | 1 | 137,500 | 137,500 | 0.7 | % | 838,000 | 0.7 | % | 6.09 | 11,304,000 | 6,818,248 | |||||||||||||||||||||||||||
| Altec Industries, Inc. | (B) | 1 | 126,880 | 126,880 | 0.7 | % | 371,000 | 0.3 | % | 2.92 | 4,410,584 | -0- | ||||||||||||||||||||||||||
| General Electric Company | 1 | 125,860 | 125,860 | 0.7 | % | 1,321,000 | 1.2 | % | 10.50 | 19,950,000 | 11,775,354 | |||||||||||||||||||||||||||
| The American Bottling Company (Dr Pepper Snapple) | 2 | 110,080 | 110,080 | 0.6 | % | 743,000 | 0.7 | % | 6.75 | 10,498,031 | 1,781,296 | |||||||||||||||||||||||||||
| Style Crest, Inc. | 1 | 106,507 | 106,507 | 0.6 | % | 387,000 | 0.3 | % | 3.63 | 7,238,613 | -0- | |||||||||||||||||||||||||||
| Pittsburgh Glass Works, LLC | 1 | 102,135 | 102,135 | 0.5 | % | 427,000 | 0.4 | % | 4.18 | 4,245,913 | -0- | |||||||||||||||||||||||||||
| Holland 1916 Inc. | 1 | 95,898 | 95,898 | 0.5 | % | 349,000 | 0.3 | % | 3.64 | 7,397,881 | -0- | |||||||||||||||||||||||||||
| National Oilwell Varco, Inc. | 1 | 91,295 | 91,295 | 0.5 | % | 754,000 | 0.7 | % | 8.26 | 8,163,278 | 2,504,940 | |||||||||||||||||||||||||||
| Joseph T. Ryerson and Son, Inc. | 1 | 89,052 | 89,052 | 0.5 | % | 506,000 | 0.4 | % | 5.68 | 6,977,442 | -0- | |||||||||||||||||||||||||||
| CHEP USA, Inc. | 1 | 83,000 | 83,000 | 0.4 | % | 500,000 | 0.4 | % | 6.02 | 7,405,447 | -0- | |||||||||||||||||||||||||||
| Datatel Resources Corporation | (A) | 1 | 80,856 | 80,856 | 0.4 | % | 61,000 | 0.1 | % | 3.02 | 2,497,617 | -0- | ||||||||||||||||||||||||||
| Sherwin-Williams Company | 2 | 78,887 | 78,887 | 0.4 | % | 643,000 | 0.6 | % | 8.15 | 7,244,128 | -0- | |||||||||||||||||||||||||||
| RGH Enterprises, Inc. (Cardinal Health) | 1 | 75,000 | 75,000 | 0.4 | % | 607,000 | 0.5 | % | 8.09 | 5,525,600 | -0- | |||||||||||||||||||||||||||
| Tampa Bay Grand Prix | 1 | 68,385 | 68,385 | 0.4 | % | 297,000 | 0.3 | % | 4.34 | 5,677,982 | -0- | |||||||||||||||||||||||||||
| Various Tenants at Retail Shopping Center | 1 | 64,220 | 64,220 | 0.3 | % | 795,000 | 0.7 | % | 12.38 | 3,072,882 | -0- | |||||||||||||||||||||||||||
| SOFIVE, Inc. | 1 | 60,400 | 60,400 | 0.3 | % | 558,000 | 0.5 | % | 9.24 | 4,903,589 | 1,703,358 | |||||||||||||||||||||||||||
| Kellogg Sales Company | 1 | 54,812 | 54,812 | 0.3 | % | 329,000 | 0.3 | % | 6.00 | 3,494,108 | -0- | |||||||||||||||||||||||||||
| Siemens Real Estate | 1 | 51,130 | 51,130 | 0.3 | % | 485,000 | 0.4 | % | 9.49 | 4,452,425 | -0- | |||||||||||||||||||||||||||
| Foundation Building Materials, LLC | 1 | 36,270 | 36,270 | 0.2 | % | 172,000 | 0.1 | % | 4.74 | 2,262,079 | -0- | |||||||||||||||||||||||||||
| Graybar Electric Company | 1 | 26,340 | 26,340 | 0.1 | % | 109,000 | 0.1 | % | 4.14 | 1,883,306 | -0- | |||||||||||||||||||||||||||
| Tenant Total as of 12/31/17 | 107 | 19,008,737 | 19,008,737 | 99.5 | % | $ | 113,613,000 | 100.0 | % | $ | 5.99 | $ | 1,491,232,606 | (C) | $ | 620,411,537 | ||||||||||||||||||||||
| Vacant | (E) | 1 | 87,500 | -0- | 0.0 | % | -0- | 0.0 | % | -0- | 5,017,447 | -0- | ||||||||||||||||||||||||||
| Total as of 12/31/17 | 108 | 19,096,237 | 19,008,737 | 99.5 | % | $ | 113,613,000 | 100.0 | % | $ | 5.99 | $ | 1,496,250,053 | $ | 620,411,537 | |||||||||||||||||||||||
| Acquisitions Subsequent to 12/31/17 | ||||||||||||||||||||||||||||||||||||||
| Shaw Industries, Inc. | 1 | 831,764 | 831,764 | 4.4 | % | 3,470,000 | 3.1 | % | 4.17 | |||||||||||||||||||||||||||||
| Pro Forma Total with Acquisitions Subsequent to 12/31/17 | 109 | 19,928,001 | 19,840,501 | 99.6 | % | $ | 117,083,000 | 100.0 | % | $ | 5.91 | |||||||||||||||||||||||||||
| Leasing Activity Subsequent to 12/31/17 | ||||||||||||||||||||||||||||||||||||||
| Rinnai America Corporation | (D) | - | - | - | - | $ | 831,000 | - | 3.81 | |||||||||||||||||||||||||||||
| Pro Forma Total with Acquisitions and Leasing Activity Subsequent to 12/31/17 | 109 | 19,928,001 | 19,840,501 | 99.6 | % | $ | 5.89 | |||||||||||||||||||||||||||||||
(A) NF&M International and Datatel Resources are located at one property and therefore are counted as one property in the Property Count total.
(B) Woodstream Corporation and Altec Industries, Inc. are located at one property and therefore are counted as one property in the Property Count total.
Other than these two properties indicated in footnotes (A) and (B) and the one retail property, all other properties are single-tenant.
(C) Does not include unamortized debt issuance costs of $7,760,102.
(D) Effective December 31, 2017, Caterpillar Logistics Services, Inc. vacated the Company’s 218,120 square foot building, located in Griffin, GA and Rinnai America Corporation took occupancy effective January 1, 2018. The new 3 year lease agreement goes through
December 31, 2020 with an initial annual rent of $807,044, representing $3.70 per square foot, and 3.0% annual increases thereafter.
(E) In contract to sell this vacant property.
First Quarter FY 2018 Supplemental of Monmouth Real Estate Investment Corp. Page 12 of 21
(unaudited)
| Property | Square | Occupied Square | % of Total | Annual | % of Total Ann. | Rent Per sf | Undepreciated | Mortgage | |||||||||||||||||||||||||||||
| State | Count | Footage | Footage | sf | Rent | Rent | Occup. | Cost | Balance | ||||||||||||||||||||||||||||
| Florida | 13 | 1,899,643 | 1,812,143 | 9.9 | % | $ | 13,566,000 | 11.9 | % | 7.49 | $ | 201,285,412 | $ 93,297,620 | ||||||||||||||||||||||||
| Texas | 10 | 1,781,967 | 1,781,967 | 9.3 | % | 14,160,000 | 12.5 | % | 7.95 | 182,228,913 | 82,297,956 | ||||||||||||||||||||||||||
| Ohio | 9 | 1,550,706 | 1,550,706 | 8.1 | % | 8,901,000 | 7.8 | % | 5.74 | 109,644,098 | 43,492,686 | ||||||||||||||||||||||||||
| Kentucky | 3 | 1,295,940 | 1,295,940 | 6.8 | % | 5,095,000 | 4.5 | % | 3.93 | 66,111,852 | 39,993,048 | ||||||||||||||||||||||||||
| Mississippi | 4 | 1,158,889 | 1,158,889 | 6.1 | % | 4,466,000 | 3.9 | % | 3.85 | 55,248,915 | 31,055,569 | ||||||||||||||||||||||||||
| South Carolina | 5 | 1,008,358 | 1,008,358 | 5.3 | % | 6,596,000 | 5.8 | % | 6.54 | 78,930,002 | 31,134,358 | ||||||||||||||||||||||||||
| Indiana | 2 | 999,176 | 999,176 | 5.2 | % | 4,417,000 | 3.9 | % | 4.42 | 63,009,611 | 32,307,692 | ||||||||||||||||||||||||||
| Illinois | 9 | 958,045 | 958,045 | 5.0 | % | 6,117,000 | 5.4 | % | 6.38 | 82,238,327 | 9,002,157 | ||||||||||||||||||||||||||
| North Carolina | 4 | 939,706 | 939,706 | 4.9 | % | 5,663,000 | 5.0 | % | 6.03 | 85,778,185 | 44,512,537 | ||||||||||||||||||||||||||
| Tennessee | 3 | 891,777 | 891,777 | 4.7 | % | 3,093,000 | 2.7 | % | 3.47 | 33,846,631 | 13,071,763 | ||||||||||||||||||||||||||
| Michigan | 4 | 833,054 | 833,054 | 4.4 | % | 5,574,000 | 4.9 | % | 6.69 | 72,976,507 | 27,029,033 | ||||||||||||||||||||||||||
| Kansas | 4 | 813,043 | 813,043 | 4.3 | % | 4,619,000 | 4.1 | % | 5.68 | 60,943,937 | 31,629,388 | ||||||||||||||||||||||||||
| Missouri | 4 | 739,330 | 739,330 | 3.9 | % | 2,813,000 | 2.5 | % | 3.80 | 34,604,640 | 6,758,683 | ||||||||||||||||||||||||||
| Oklahoma | 4 | 614,941 | 614,941 | 3.2 | % | 3,916,000 | 3.4 | % | 6.37 | 54,939,875 | 31,014,639 | ||||||||||||||||||||||||||
| New York | 3 | 518,565 | 518,565 | 2.7 | % | 3,886,000 | 3.4 | % | 7.49 | 51,336,423 | 22,236,366 | ||||||||||||||||||||||||||
| Pennsylvania | 3 | 504,040 | 504,040 | 2.6 | % | 2,868,000 | 2.5 | % | 5.69 | 36,855,847 | 15,322,257 | ||||||||||||||||||||||||||
| Virginia | 5 | 407,265 | 407,265 | 2.1 | % | 2,449,000 | 2.2 | % | 6.01 | 34,515,756 | 4,750,898 | ||||||||||||||||||||||||||
| Colorado | 3 | 363,597 | 363,597 | 1.9 | % | 3,040,000 | 2.7 | % | 8.36 | 42,058,524 | 19,026,153 | ||||||||||||||||||||||||||
| Georgia | 3 | 307,662 | 307,662 | 1.6 | % | 1,791,000 | 1.6 | % | 5.82 | 22,209,941 | 507,691 | ||||||||||||||||||||||||||
| Arizona | 1 | 283,358 | 283,358 | 1.5 | % | 1,361,000 | 1.2 | % | 4.80 | 16,824,226 | 4,326,733 | ||||||||||||||||||||||||||
| Wisconsin | 2 | 238,666 | 238,666 | 1.2 | % | 1,295,000 | 1.1 | % | 5.43 | 15,952,361 | 2,878,741 | ||||||||||||||||||||||||||
| Washington | 1 | 210,445 | 210,445 | 1.1 | % | 1,962,000 | 1.7 | % | 9.32 | 30,228,547 | 18,572,333 | ||||||||||||||||||||||||||
| Louisiana | 1 | 175,315 | 175,315 | 0.9 | % | 1,262,000 | 1.1 | % | 7.20 | 18,410,000 | 11,647,294 | ||||||||||||||||||||||||||
| Maryland | 1 | 148,881 | 148,881 | 0.8 | % | 1,426,000 | 1.3 | % | 9.58 | 14,512,355 | -0- | ||||||||||||||||||||||||||
| New Jersey | 2 | 124,620 | 124,620 | 0.7 | % | 1,353,000 | 1.2 | % | 10.86 | 7,976,471 | 1,703,358 | ||||||||||||||||||||||||||
| Nebraska | 1 | 89,115 | 89,115 | 0.5 | % | 446,000 | 0.4 | % | 5.00 | 5,944,691 | -0- | ||||||||||||||||||||||||||
| Alabama | 1 | 88,653 | 88,653 | 0.5 | % | 605,000 | 0.5 | % | 6.82 | 6,661,819 | 535,648 | ||||||||||||||||||||||||||
| Minnesota | 1 | 60,398 | 60,398 | 0.3 | % | 372,000 | 0.3 | % | 6.16 | 5,220,000 | 2,306,936 | ||||||||||||||||||||||||||
| Connecticut | 1 | 54,812 | 54,812 | 0.3 | % | 329,000 | 0.3 | % | 6.00 | 3,494,108 | -0- | ||||||||||||||||||||||||||
| Iowa | 1 | 36,270 | 36,270 | 0.2 | % | 172,000 | 0.2 | % | 4.74 | 2,262,079 | -0- | ||||||||||||||||||||||||||
| Total as of 12/31/17 | 108 | 19,096,237 | 19,008,737 | 100.0 | % | $ | 113,613,000 | 100.0 | % | $ | 5.99 | $ | 1,496,250,053 | (A) | $ 620,411,537 | ||||||||||||||||||||||
| Acquisitions Subsequent to 12/31/17 | |||||||||||||||||||||||||||||||||||||
| Georgia | 1 | 831,764 | 831,764 | 4.4 | % | 3,470,000 | 3.1 | % | 4.17 | ||||||||||||||||||||||||||||
| Pro Forma Total with Acquisitions Subsequent to 12/31/17 | 109 | 19,928,001 | 19,840,501 | 100.0 | % | $ | 117,083,000 | 100.0 | % | $ | 5.91 | ||||||||||||||||||||||||||
| Leasing Activity Subsequent to 12/31/17 | |||||||||||||||||||||||||||||||||||||
| Georgia | (B) | - | - | - | - | $ | 831,000 | - | 3.81 | ||||||||||||||||||||||||||||
| Pro Forma Total with Acquisitions and Leasing Activity Subsequent to 12/31/17 | 109 | 19,928,001 | 19,840,501 | 100.0 | % | $ | 5.89 | ||||||||||||||||||||||||||||||
| (A) | Does not include unamortized debt issuance costs of $7,760,102. | |
| (B) | Effective December 31, 2017, the former tenant vacated a property located in Georgia and a new tenant entered into a 3 year lease agreement for this property that commenced on January 1, 2018. |
First Quarter FY 2018 Supplemental of Monmouth Real Estate Investment Corp. Page 13 of 21
(unaudited)
| Property | Square | % of Total | Annual | % of Total Ann. | Rent Per sf | Lease Exp. Term in | Undepreciated | Mortgage | ||||||||||||||||||||||||||||||
| Fiscal Year | Count | Footage | sf | Rent | Rent | Occup. | Years | Cost | Balance | |||||||||||||||||||||||||||||
| 2018 | (A) | 8 | 862,272 | 4.6 | % | $ | 5,374,000 | 4.9 | % | $ | 6.23 | 0.4 | $ | 64,217,758 | $ | 2,333,058 | ||||||||||||||||||||||
| 2019 | 9 | 1,370,849 | 7.2 | % | 7,145,000 | 6.3 | % | 5.21 | 1.3 | 81,654,704 | 12,724,674 | |||||||||||||||||||||||||||
| 2020 | 4 | 383,449 | 2.0 | % | 2,129,000 | 1.9 | % | 5.55 | 2.4 | 27,447,899 | -0- | |||||||||||||||||||||||||||
| 2021 | (A) | 8 | 886,468 | 4.6 | % | 4,194,000 | 3.7 | % | 4.73 | 3.5 | 49,741,094 | 8,322,911 | ||||||||||||||||||||||||||
| 2022 | 7 | 1,138,320 | 6.0 | % | 6,419,000 | 5.6 | % | 5.64 | 4.2 | 75,991,657 | 27,031,774 | |||||||||||||||||||||||||||
| 2023 | (A) | 13 | 1,668,804 | 8.7 | % | 9,481,000 | 8.3 | % | 5.68 | 5.5 | 116,766,150 | 24,987,138 | ||||||||||||||||||||||||||
| 2024 | 11 | 1,526,126 | 8.0 | % | 9,804,000 | 8.6 | % | 6.42 | 6.4 | 115,324,385 | 30,515,834 | |||||||||||||||||||||||||||
| 2025 | (A) | 9 | 2,404,478 | 12.6 | % | 12,271,000 | 10.8 | % | 5.10 | 7.4 | 159,811,314 | 78,746,522 | ||||||||||||||||||||||||||
| 2026 | 6 | 912,361 | 4.8 | % | 7,317,000 | 6.4 | % | 8.02 | 8.4 | 98,151,060 | 42,243,867 | |||||||||||||||||||||||||||
| 2027 | 10 | 1,472,852 | 7.7 | % | 9,078,000 | 8.0 | % | 6.16 | 9.5 | 121,991,984 | 42,670,027 | |||||||||||||||||||||||||||
| 2028 | 7 | 1,764,386 | 9.2 | % | 8,227,000 | 7.2 | % | 4.66 | 10.2 | 112,754,104 | 61,409,161 | |||||||||||||||||||||||||||
| 2029 | 2 | 262,613 | 1.4 | % | 1,517,000 | 1.3 | % | 5.78 | 11.5 | 21,954,950 | 9,002,157 | |||||||||||||||||||||||||||
| 2030 | 4 | 1,044,832 | 5.5 | % | 7,403,000 | 6.5 | % | 7.09 | 12.3 | 109,198,468 | 64,934,524 | |||||||||||||||||||||||||||
| 2031 | 3 | 963,269 | 5.0 | % | 7,122,000 | 6.3 | % | 7.39 | 13.3 | 104,367,000 | 67,799,973 | |||||||||||||||||||||||||||
| 2032 | 6 | 1,724,838 | 9.0 | % | 13,131,000 | 11.6 | % | 7.61 | 14.3 | 201,979,345 | 131,849,698 | |||||||||||||||||||||||||||
| 2034 | 1 | 558,600 | 2.9 | % | 2,206,000 | 1.9 | % | 3.95 | 15.8 | 26,807,852 | 15,840,219 | |||||||||||||||||||||||||||
| Various tenants at retail shopping center | 1 | 64,220 | 0.3 | % | 795,000 | 0.7 | % | 12.38 | -0- | 3,072,882 | -0- | |||||||||||||||||||||||||||
| Vacant | 1 | 87,500 | 0.5 | % | -0- | - | -0- | -0- | 5,017,447 | -0- | ||||||||||||||||||||||||||||
| Total as of 12/31/17 | 108 | 19,096,237 | 100.0 | % | $ | 113,613,000 | 100.0 | % | $ | 5.99 | 7.9 | $ | 1,496,250,053 | (B) | $ | 620,411,537 | ||||||||||||||||||||||
| Acquisitions Subsequent to 12/31/17 | ||||||||||||||||||||||||||||||||||||||
| 2027 | 1 | 831,764 | 4.4 | % | 3,470,000 | 3.1 | % | 4.17 | 9.8 | |||||||||||||||||||||||||||||
| Pro Forma Total with Acquisitions Subsequent to 12/31/17 | 109 | 19,928,001 | 100.0 | % | $ | 117,083,000 | 100.0 | % | $ | 5.91 | 8.0 | |||||||||||||||||||||||||||
| Leasing Activity Subsequent to 12/31/17 | ||||||||||||||||||||||||||||||||||||||
| 2021 | (C) | - | - | - | $ | 831,000 | - | 3.81 | 3.0 | |||||||||||||||||||||||||||||
Pro Forma Total with Acquisitions and Leasing Activity Subsequent to 12/31/17 | 109 | 19,928,001 | 100.0 | % | $ | 5.89 | 8.0 | |||||||||||||||||||||||||||||||
| (A) | Included in 2018 is Datatel Resources and included in 2025 is NF&M International which both occupy one property. Included in 2021 is Woodstream Corporation and included in 2023 is Altec Industries which both occupy one property.Other than these two properties and the one retail property, all other properties are single-tenant. | |
| (B) | Does not include unamortized debt issuance costs of $7,760,102. | |
| (C) | Effective December 31, 2017, the former tenant vacated property and a new tenant entered into a 3 year lease agreement for this property that commenced on January 1, 2018. |
First Quarter FY 2018 Supplemental of Monmouth Real Estate Investment Corp. Page 14 of 21
Recent Acquisitions During Fiscal 2018
(unaudited)
| City | Fiscal Year | Square | Annual | Rent Per sf | Lease | Purchase | Initial Mortgage | |||||||||||||||||||||||
| No | Tenant | (MSA) | State | Acquisition | Footage | Rent | Occup. | Expiration | Price | Balance | ||||||||||||||||||||
| 1 | FedEx Corporation | Charleston | SC | 2018 | 121,683 | $ | 1,312,000 | 10.78 | 8/31/2032 | $ | 21,872,170 | $ | 14,200,000 | |||||||||||||||||
| 2 | Amazon.com Services, Inc. | Oklahoma City | OK | 2018 | 300,000 | 1,884,000 | 6.28 | 10/31/2027 | 30,250,000 | 19,600,000 | ||||||||||||||||||||
| Total as of 12/31/17 | 421,683 | $ | 3,196,000 | $ | 7.58 | $ | 52,122,170 | $ | 33,800,000 | |||||||||||||||||||||
| Acquisitions Subsequent to 12/31/17 | ||||||||||||||||||||||||||||||
| 1 | Shaw Industries, Inc. | Savannah | GA | 2018 | 831,764 | 3,470,000 | 4.17 | 9/30/2027 | 57,483,636 | 33,300,000 | ||||||||||||||||||||
| Total Fiscal 2018 | 1,253,447 | $ | 6,666,000 | $ | 5.32 | $ | 109,605,806 | $ | 67,100,000 | |||||||||||||||||||||
First Quarter FY 2018 Supplemental of Monmouth Real Estate Investment Corp. Page 15 of 21
(unaudited)
| Rent | Lease Exp. Term | |||||||||||||||||||||||||||||||||||||
| Fiscal Year | Square | Annual | Per sf | in | Undepreciated | Mortgage | ||||||||||||||||||||||||||||||||
| No | Tenant | City (MSA) | State | Acquisition | Occup. | Footage | Rent | Occup. | Years | Cost | Balance | |||||||||||||||||||||||||||
| 1 | Milwaukee Electric Tool Corporation | Olive Branch (Memphis, TN) | MS | 2013 | 100.0 | % | 861,889 | $ | 3,032,000 | $ | 3.52 | 10.6 | $ | 36,914,917 | $ | 23,033,196 | ||||||||||||||||||||||
| 2 | ULTA, Inc. | Greenwood (Indianapolis) | IN | 2015 | 100.0 | % | 671,354 | 2,702,000 | 4.02 | 7.6 | 37,512,071 | 21,158,449 | ||||||||||||||||||||||||||
| 3 | Jim Beam Brands Company | Frankfort (Lexington) | KY | 2015 | 100.0 | % | 599,840 | 2,051,000 | 3.42 | 7.1 | 28,000,000 | 17,334,581 | ||||||||||||||||||||||||||
| 4 | TreeHouse Private Brands, Inc. | Buckner (Louisville) | KY | 2014 | 100.0 | % | 558,600 | 2,206,000 | 3.95 | 15.8 | 26,807,852 | 15,840,219 | ||||||||||||||||||||||||||
| 5 | FedEx Corporation | Memphis | TN | 2010 | 100.0 | % | 449,900 | 1,327,000 | 2.95 | 1.4 | 14,614,987 | 5,680,790 | ||||||||||||||||||||||||||
| 6 | Woodstream Corporation | (A) | St. Joseph | MO | 2001 | 100.0 | % | 256,000 | 914,000 | 3.57 | 3.8 | 8,899,035 | -0- | |||||||||||||||||||||||||
| Altec Industries, Inc. | (A) | St. Joseph | MO | 2001 | 100.0 | % | 126,880 | 371,000 | 2.92 | 5.2 | 4,410,584 | -0- | ||||||||||||||||||||||||||
| 7 | CBOCS Distribution, Inc. (Cracker Barrel) | Lebanon (Nashville) | TN | 2011 | 100.0 | % | 381,240 | 1,447,000 | 3.80 | 6.5 | 14,215,126 | 7,390,973 | ||||||||||||||||||||||||||
| 8 | Best Buy Warehousing Logistics, Inc. | Streetsboro (Cleveland) | OH | 2012 | 100.0 | % | 368,060 | 1,676,000 | 4.55 | 4.1 | 19,600,000 | 9,743,991 | ||||||||||||||||||||||||||
| 9 | FedEx Ground Package System, Inc. | Concord (Charlotte) | NC | 2017 | 100.0 | % | 354,482 | 2,537,000 | 7.16 | 14.4 | 40,043,145 | 25,858,521 | ||||||||||||||||||||||||||
| 10 | FedEx Ground Package System, Inc. | Mesquite (Dallas) | TX | 2017 | 100.0 | % | 351,874 | 3,195,000 | 9.08 | 14.3 | 49,880,493 | 32,205,267 | ||||||||||||||||||||||||||
| 11 | FedEx Ground Package System, Inc. | Walker (Grand Rapids) | MI | 2017 | 100.0 | % | 343,483 | 2,102,000 | 6.12 | 14.1 | 31,654,986 | 20,268,563 | ||||||||||||||||||||||||||
| 12 | FedEx Ground Package System, Inc. | Hamburg (Buffalo) | NY | 2017 | 100.0 | % | 338,584 | 2,313,000 | 6.83 | 13.3 | 34,850,000 | 22,236,366 | ||||||||||||||||||||||||||
| 13 | FedEx Ground Package System, Inc. | Concord (Charlotte) | NC | 2016 | 100.0 | % | 330,717 | 2,237,000 | 6.76 | 7.6 | 33,044,797 | 18,654,016 | ||||||||||||||||||||||||||
| 14 | FedEx Ground Package System, Inc. | Indianapolis | IN | 2014 | 100.0 | % | 327,822 | 1,715,000 | 5.23 | 9.8 | 25,497,543 | 11,149,242 | ||||||||||||||||||||||||||
| 15 | Autoneum North America, Inc. | Aiken (Augusta, GA) | SC | 2017 | 100.0 | % | 315,560 | 1,703,000 | 5.40 | 14.3 | 21,040,395 | 15,041,036 | ||||||||||||||||||||||||||
| 16 | FedEx Ground Package System, Inc. | Olathe (Kansas City) | KS | 2016 | 100.0 | % | 313,763 | 2,200,000 | 7.01 | 13.4 | 31,737,000 | 20,824,657 | ||||||||||||||||||||||||||
| 17 | FedEx Ground Package System, Inc. | Davenport (Orlando) | FL | 2016 | 100.0 | % | 310,922 | 2,609,000 | 8.39 | 13.3 | 37,780,000 | 24,738,950 | ||||||||||||||||||||||||||
| 18 | FedEx Ground Package System, Inc. | Fort Worth (Dallas) | TX | 2015 | 100.0 | % | 304,608 | 2,373,000 | 7.79 | 12.3 | 35,300,832 | 21,780,193 | ||||||||||||||||||||||||||
| 19 | Science Applications International Corporation | Hanahan (Charleston) | SC | 2005 | 100.0 | % | 302,400 | 1,491,000 | 4.93 | 1.3 | 13,374,441 | -0- | ||||||||||||||||||||||||||
| 20 | Amazon.com Services, Inc. | Oklahoma City | OK | 2018 | 100.0 | % | 300,000 | 1,884,000 | 6.28 | 9.8 | 29,878,942 | 19,600,000 | ||||||||||||||||||||||||||
| 21 | International Paper Company | Kenton | OH | 2017 | 100.0 | % | 298,472 | 1,244,000 | 4.17 | 9.7 | 17,881,607 | 11,905,840 | ||||||||||||||||||||||||||
| 22 | FedEx Ground Package System, Inc. | Jacksonville | FL | 2015 | 100.0 | % | 297,579 | 1,998,000 | 6.71 | 12.0 | 30,732,090 | 17,092,645 | ||||||||||||||||||||||||||
| 23 | Western Container Corp. (Coca-Cola) | Tolleson (Phoenix) | AZ | 2003 | 100.0 | % | 283,358 | 1,361,000 | 4.80 | 9.3 | 16,824,226 | 4,326,733 | ||||||||||||||||||||||||||
| 24 | International Paper Company | Edwardsville (Kansas City) | KS | 2014 | 100.0 | % | 280,000 | 1,348,000 | 4.81 | 5.7 | 18,294,108 | 9,748,194 | ||||||||||||||||||||||||||
| 25 | NF&M International, Inc. | (B) | Monaca (Pittsburgh) | PA | 1988 | 100.0 | % | 174,802 | 835,000 | 4.78 | 7.0 | 5,399,580 | -0- | |||||||||||||||||||||||||
| Datatel Resources Corporation | (B) | Monaca (Pittsburgh) | PA | 1988 | 100.0 | % | 80,856 | 61,000 | 3.02 | - | 2,497,617 | -0- | ||||||||||||||||||||||||||
| 26 | FedEx Ground Package System, Inc. | Orion | MI | 2007 | 100.0 | % | 245,633 | 1,908,000 | 7.77 | 5.5 | 22,885,635 | -0- | ||||||||||||||||||||||||||
| 27 | FedEx Ground Package System, Inc. | Homestead (Miami) | FL | 2017 | 100.0 | % | 237,756 | 2,282,000 | 9.60 | 14.3 | 37,873,120 | 24,276,311 | ||||||||||||||||||||||||||
| 28 | Anda Pharmaceuticals, Inc. | Olive Branch (Memphis, TN) | MS | 2012 | 100.0 | % | 234,660 | 1,205,000 | 5.14 | 4.6 | 14,550,000 | 8,022,373 | ||||||||||||||||||||||||||
| 29 | UGN, Inc. | Monroe (Cincinnati) | OH | 2015 | 100.0 | % | 232,200 | 1,070,000 | 4.61 | 12.2 | 12,937,000 | 7,489,353 | ||||||||||||||||||||||||||
| 30 | FedEx Ground Package System, Inc. | Colorado Springs | CO | 2016 | 100.0 | % | 225,362 | 1,832,000 | 8.13 | 8.1 | 28,500,000 | 17,391,043 | ||||||||||||||||||||||||||
| 31 | Mickey Thompson Performance Tires and Wheels (Cooper Tire) | Stow | OH | 2017 | 100.0 | % | 219,765 | 1,501,000 | 6.83 | 9.7 | 18,934,065 | 12,598,036 | ||||||||||||||||||||||||||
| 32 | Caterpillar Logistics Services, Inc. | (D) | Griffin (Atlanta) | GA | 2006 | 100.0 | % | 218,120 | 1,169,000 | 5.36 | - | 14,868,857 | -0- | |||||||||||||||||||||||||
| 33 | Fedex Ground Package System, Inc. | Ft. Myers | FL | 2017 | 100.0 | % | 213,672 | 1,418,000 | 6.64 | 9.7 | 21,663,635 | 13,839,418 | ||||||||||||||||||||||||||
| 34 | FedEx Ground Package System, Inc. | Burlington (Seattle/Everett) | WA | 2016 | 100.0 | % | 210,445 | 1,962,000 | 9.32 | 12.7 | 30,228,547 | 18,572,333 | ||||||||||||||||||||||||||
| 35 | FedEx Ground Package System, Inc. | Sauget (St. Louis, MO) | IL | 2015 | 100.0 | % | 198,773 | 1,036,000 | 5.21 | 11.4 | 15,204,950 | 9,002,157 | ||||||||||||||||||||||||||
| 36 | Anheuser-Busch, Inc. | Granite City (St. Louis, MO) | IL | 2001 | 100.0 | % | 184,800 | 821,000 | 4.44 | 3.9 | 12,697,848 | -0- | ||||||||||||||||||||||||||
| 37 | Carrier Corporation (United Technologies) | Carrollton (Dallas) | TX | 2010 | 100.0 | % | 184,317 | 1,576,000 | 8.55 | 1.0 | 17,819,203 | 7,043,884 | ||||||||||||||||||||||||||
| 38 | FedEx Ground Package System, Inc. | Spring (Houston) | TX | 2014 | 100.0 | % | 181,176 | 1,581,000 | 8.73 | 6.8 | 19,294,396 | 8,386,918 | ||||||||||||||||||||||||||
| 39 | Carlisle Tire & Wheel Company | Edwardsville (Kansas City) | KS | 2003 | 100.0 | % | 179,280 | 739,000 | 4.12 | 5.6 | 7,232,986 | -0- | ||||||||||||||||||||||||||
| 40 | FedEx Ground Package System, Inc. | Ft. Mill (Charlotte, NC) | SC | 2010 | 100.0 | % | 176,939 | 1,415,000 | 8.00 | 5.8 | 15,413,307 | 1,195,373 | ||||||||||||||||||||||||||
| 41 | FedEx Ground Package System, Inc. | Covington (New Orleans) | LA | 2016 | 100.0 | % | 175,315 | 1,262,000 | 7.20 | 7.5 | 18,410,000 | 11,647,294 | ||||||||||||||||||||||||||
| 42 | FedEx Ground Package System, Inc. | Livonia (Detroit) | MI | 2013 | 100.0 | % | 172,005 | 1,194,000 | 6.94 | 4.2 | 13,762,030 | 6,760,470 | ||||||||||||||||||||||||||
| 43 | Home Depot USA, Inc. | Montgomery (Chicago) | IL | 2004 | 100.0 | % | 171,200 | 997,000 | 5.82 | 2.5 | 11,298,367 | -0- | ||||||||||||||||||||||||||
| 44 | FedEx Ground Package System, Inc. | Tampa | FL | 2004 | 100.0 | % | 170,779 | 1,624,000 | 9.51 | 8.6 | 19,696,227 | 5,723,574 | ||||||||||||||||||||||||||
| 45 | FedEx Ground Package System, Inc. | Edinburg | TX | 2011 | 100.0 | % | 164,207 | 1,097,000 | 6.68 | 8.8 | 12,039,014 | -0- | ||||||||||||||||||||||||||
| 46 | FedEx Ground Package System, Inc. | Lindale (Tyler) | TX | 2015 | 100.0 | % | 163,378 | 725,000 | 4.44 | 6.5 | 9,965,550 | 5,923,745 | ||||||||||||||||||||||||||
| 47 | Bunzl Distribution Midcentral, Inc. | Kansas City | MO | 2015 | 100.0 | % | 158,417 | 752,000 | 4.75 | 3.8 | 9,651,226 | 6,758,683 | ||||||||||||||||||||||||||
| 48 | FedEx Ground Package System, Inc. | Oklahoma City | OK | 2012 | 100.0 | % | 158,340 | 1,048,000 | 6.62 | 7.5 | 12,584,462 | 3,795,814 | ||||||||||||||||||||||||||
| 49 | FedEx Ground Package System, Inc. | Waco | TX | 2012 | 100.0 | % | 150,710 | 1,078,000 | 7.15 | 7.7 | 12,551,368 | 4,453,009 | ||||||||||||||||||||||||||
| 50 | FedEx Ground Package System, Inc. | Beltsville (Washington, DC) | MD | 2001 | 100.0 | % | 148,881 | 1,426,000 | 9.58 | 0.6 | 14,512,355 | -0- | ||||||||||||||||||||||||||
| 51 | Victory Packaging, L.P. | Fayetteville | NC | 1997 | 100.0 | % | 148,000 | 502,000 | 3.39 | 3.2 | 5,451,629 | -0- | ||||||||||||||||||||||||||
| 52 | FedEx Ground Package System, Inc. | El Paso | TX | 2006 | 100.0 | % | 144,149 | 1,345,000 | 9.33 | 5.8 | 12,431,192 | -0- | ||||||||||||||||||||||||||
| 53 | FedEx Ground Package System, Inc. | Cocoa | FL | 2008 | 100.0 | % | 144,138 | 1,112,000 | 7.71 | 6.8 | 14,127,449 | -0- | ||||||||||||||||||||||||||
| 54 | FedEx Ground Package System, Inc. | Cudahy (Milwaukee) | WI | 2001 | 100.0 | % | 139,564 | 827,000 | 5.93 | 9.5 | 9,382,361 | -0- | ||||||||||||||||||||||||||
| 55 | Challenger Lifts, Inc. (Snap-On Inc.) | Louisville | KY | 2016 | 100.0 | % | 137,500 | 838,000 | 6.09 | 8.4 | 11,304,000 | 6,818,248 | ||||||||||||||||||||||||||
| 56 | FedEx Ground Package System, Inc. | Richfield (Cleveland) | OH | 2006 | 100.0 | % | 131,152 | 1,493,000 | 11.38 | 6.8 | 16,435,478 | -0- | ||||||||||||||||||||||||||
| 57 | General Electric Company | Imperial (Pittsburgh) | PA | 2016 | 100.0 | % | 125,860 | 1,321,000 | 10.50 | 8.0 | 19,950,000 | 11,775,354 | ||||||||||||||||||||||||||
| 58 | FedEx Ground Package System, Inc. | Wheeling (Chicago) | IL | 2003 | 100.0 | % | 123,000 | 1,272,000 | 10.34 | 9.4 | 18,537,652 | -0- | ||||||||||||||||||||||||||
| 59 | FedEx Ground Package System, Inc. | Altoona | PA | 2014 | 100.0 | % | 122,522 | 651,000 | 5.31 | 5.7 | 9,008,650 | 3,546,903 | ||||||||||||||||||||||||||
| 60 | FedEx Corporation | Charleston | SC | 2018 | 100.0 | % | 121,683 | 1,312,000 | 10.78 | 14.7 | 21,487,206 | 14,200,000 | ||||||||||||||||||||||||||
| 61 | FedEx Corporation | Mechanicsville (Richmond) | VA | 2001 | 100.0 | % | 112,799 | 541,000 | 4.80 | 5.3 | 7,785,011 | -0- | ||||||||||||||||||||||||||
| 62 | FedEx Corporation | Orlando | FL | 2008 | 100.0 | % | 110,638 | 666,000 | 6.02 | 9.9 | 8,554,432 | 4,035,386 | ||||||||||||||||||||||||||
| 63 | Bunzl Distribution Oklahoma, Inc. | Oklahoma City | OK | 2017 | 100.0 | % | 110,361 | 722,000 | 6.54 | 6.7 | 8,728,439 | 5,837,529 | ||||||||||||||||||||||||||
| 64 | Style Crest, Inc. | Winston-Salem | NC | 2002 | 100.0 | % | 106,507 | 387,000 | 3.63 | 3.2 | 7,238,613 | -0- | ||||||||||||||||||||||||||
| 65 | FedEx Ground Package System, Inc. | Cheektowaga (Buffalo) | NY | 2000 | 100.0 | % | 104,981 | 966,000 | 9.20 | 1.7 | 10,960,823 | -0- | ||||||||||||||||||||||||||
| 66 | FedEx Ground Package System, Inc. | West Chester Twp. (Cincinnati) | OH | 1999 | 100.0 | % | 103,818 | 543,000 | 5.23 | 5.7 | 5,733,686 | 1,755,466 | ||||||||||||||||||||||||||
First Quarter FY 2018 Supplemental of Monmouth Real Estate Investment Corp. Page 16 of 21
Property Table
(unaudited)
| Rent | Lease Exp. Term | |||||||||||||||||||||||||||||||||||||
| Fiscal Year | Square | Annual | Per sf | in | Undepreciated | Mortgage | ||||||||||||||||||||||||||||||||
| No | Tenant | City (MSA) | State | Acquisition | Occup. | Footage | Rent | Occup. | Years | Cost | Balance | |||||||||||||||||||||||||||
| 67 | FedEx Ground Package System, Inc. | Roanoke | VA | 2013 | 100.0 | % | 103,402 | $ | 755,000 | $ | 7.30 | 5.3 | $ | 10,200,000 | $ | 4,750,898 | ||||||||||||||||||||||
| 68 | Pittsburgh Glass Works, LLC | O’ Fallon (St. Louis) | MO | 1994 | 100.0 | % | 102,135 | 427,000 | 4.18 | 0.5 | 4,245,913 | -0- | ||||||||||||||||||||||||||
| 69 | FedEx Ground Package System, Inc. | Green Bay | WI | 2013 | 100.0 | % | 99,102 | 468,000 | 4.72 | 5.4 | 6,570,000 | 2,878,741 | ||||||||||||||||||||||||||
| 70 | Holland 1916 Inc. | Liberty (Kansas City) | MO | 1998 | 100.0 | % | 95,898 | 349,000 | 3.64 | 1.5 | 7,397,881 | -0- | ||||||||||||||||||||||||||
| 71 | FedEx Corporation | Jacksonville | FL | 1999 | 100.0 | % | 95,883 | 518,000 | 5.40 | 1.4 | 6,383,328 | -0- | ||||||||||||||||||||||||||
| 72 | FedEx Corporation | Tampa | FL | 2006 | 100.0 | % | 95,662 | 603,000 | 6.30 | 9.9 | 7,663,663 | 3,591,337 | ||||||||||||||||||||||||||
| 73 | FedEx Ground Package System, Inc. | Hanahan (Charleston) | SC | 2005 | 100.0 | % | 91,776 | 675,000 | 7.35 | 0.6 | 7,614,653 | 697,949 | ||||||||||||||||||||||||||
| 74 | National Oilwell Varco, Inc. | Houston | TX | 2010 | 100.0 | % | 91,295 | 754,000 | 8.26 | 4.8 | 8,163,278 | 2,504,940 | ||||||||||||||||||||||||||
| 75 | FedEx Corporation | Omaha | NE | 1999 | 100.0 | % | 89,115 | 446,000 | 5.00 | 5.8 | 5,944,691 | -0- | ||||||||||||||||||||||||||
| 76 | Joseph T. Ryerson and Son, Inc. | Elgin (Chicago) | IL | 2002 | 100.0 | % | 89,052 | 506,000 | 5.68 | 2.1 | 6,977,442 | -0- | ||||||||||||||||||||||||||
| 77 | FedEx Ground Package System, Inc. | Huntsville | AL | 2005 | 100.0 | % | 88,653 | 605,000 | 6.82 | 8.6 | 6,661,819 | 535,648 | ||||||||||||||||||||||||||
| 78 | Vacant | (E) | Ft. Myers | FL | 2003 | 0.0 | % | 87,500 | -0- | na | - | 5,017,447 | -0- | |||||||||||||||||||||||||
| 79 | CHEP USA, Inc. | Roanoke | VA | 2007 | 100.0 | % | 83,000 | 500,000 | 6.02 | 7.2 | 7,405,447 | -0- | ||||||||||||||||||||||||||
| 80 | FedEx Corporation | Bedford Heights (Cleveland) | OH | 2007 | 100.0 | % | 82,269 | 408,000 | 4.96 | 0.7 | 6,919,836 | -0- | ||||||||||||||||||||||||||
| 81 | RGH Enterprises, Inc. (Cardinal Health) | Halfmoon (Albany) | NY | 2012 | 100.0 | % | 75,000 | 607,000 | 8.09 | 3.9 | 5,525,600 | -0- | ||||||||||||||||||||||||||
| 82 | FedEx Corporation | Schaumburg (Chicago) | IL | 1997 | 100.0 | % | 73,500 | 478,000 | 6.50 | 9.3 | 5,177,940 | -0- | ||||||||||||||||||||||||||
| 83 | FedEx Corporation | Romulus (Detroit) | MI | 1998 | 100.0 | % | 71,933 | 370,000 | 5.14 | 3.4 | 4,673,856 | -0- | ||||||||||||||||||||||||||
| 84 | FedEx Ground Package System, Inc. | Denver | CO | 2005 | 100.0 | % | 69,865 | 564,000 | 8.07 | 0.6 | 6,354,051 | 665,353 | ||||||||||||||||||||||||||
| 85 | Tampa Bay Grand Prix | Tampa | FL | 2005 | 100.0 | % | 68,385 | 297,000 | 4.34 | 2.8 | 5,677,982 | -0- | ||||||||||||||||||||||||||
| 86 | Sherwin-Williams Company | Rockford | IL | 2011 | 100.0 | % | 66,387 | 481,000 | 7.25 | 6.0 | 5,551,227 | -0- | ||||||||||||||||||||||||||
| 87 | FedEx Ground Package System, Inc. | Colorado Springs | CO | 2006 | 100.0 | % | 68,370 | 644,000 | 9.42 | 0.7 | 7,204,472 | 969,757 | ||||||||||||||||||||||||||
| 88 | Various Tenants at Retail Shopping Center | Somerset | NJ | 1970 | 100.0 | % | 64,220 | 795,000 | 12.38 | na | 3,072,882 | -0- | ||||||||||||||||||||||||||
| 89 | The American Bottling Company (Dr Pepper Snapple) | Cincinnati | OH | 2015 | 100.0 | % | 63,840 | 481,000 | 7.53 | 11.8 | 6,750,000 | -0- | ||||||||||||||||||||||||||
| 90 | FedEx Corporation | Chattanooga | TN | 2007 | 100.0 | % | 60,637 | 319,000 | 5.26 | 4.8 | 5,016,518 | -0- | ||||||||||||||||||||||||||
| 91 | SOFIVE, Inc. | Carlstadt (New York, NY) | NJ | 2001 | 100.0 | % | 60,400 | 558,000 | 9.24 | 7.1 | 4,903,589 | 1,703,358 | ||||||||||||||||||||||||||
| 92 | FedEx Ground Package System, Inc. | Stewartville (Rochester) | MN | 2013 | 100.0 | % | 60,398 | 372,000 | 6.16 | 5.4 | 5,220,000 | 2,306,936 | ||||||||||||||||||||||||||
| 93 | Carrier Enterprise, LLC (United Technologies) | Richmond | VA | 2004 | 100.0 | % | 60,000 | 324,000 | 5.40 | 0.9 | 4,768,309 | -0- | ||||||||||||||||||||||||||
| 94 | FedEx Ground Package System, Inc. | Augusta | GA | 2005 | 100.0 | % | 59,358 | 501,000 | 8.44 | 3.5 | 5,363,305 | 507,691 | ||||||||||||||||||||||||||
| 95 | Kellogg Sales Company | Newington (Hartford) | CT | 2001 | 100.0 | % | 54,812 | 329,000 | 6.00 | 2.2 | 3,494,108 | -0- | ||||||||||||||||||||||||||
| 96 | Siemens Real Estate | Lebanon (Cincinnati) | OH | 2012 | 100.0 | % | 51,130 | 485,000 | 9.49 | 1.3 | 4,452,425 | -0- | ||||||||||||||||||||||||||
| 97 | FedEx Corporation | Charlottesville | VA | 1999 | 100.0 | % | 48,064 | 329,000 | 6.85 | 9.7 | 4,356,988 | -0- | ||||||||||||||||||||||||||
| 98 | FedEx Ground Package System, Inc. | Corpus Christi | TX | 2012 | 100.0 | % | 46,253 | 436,000 | 9.43 | 3.7 | 4,783,588 | -0- | ||||||||||||||||||||||||||
| 99 | The American Bottling Company (Dr Pepper Snapple) | Tulsa | OK | 2014 | 100.0 | % | 46,240 | 262,000 | 5.67 | 6.2 | 3,748,031 | 1,781,296 | ||||||||||||||||||||||||||
| 100 | Heartland Coca-Cola Bottling Company, LLC (Coca-Cola) | Topeka | KS | 2009 | 100.0 | % | 40,000 | 332,000 | 8.30 | 3.8 | 3,679,843 | 1,056,537 | ||||||||||||||||||||||||||
| 101 | Collins Aerospace Systems (United Technologies) | Rockford | IL | 2015 | 100.0 | % | 38,833 | 364,000 | 9.37 | 9.5 | 5,100,000 | -0- | ||||||||||||||||||||||||||
| 102 | Foundation Building Materials, LLC | Urbandale (Des Moines) | IA | 1994 | 100.0 | % | 36,270 | 172,000 | 4.74 | 10.0 | 2,262,079 | -0- | ||||||||||||||||||||||||||
| 103 | FedEx Corporation | Richland (Jackson) | MS | 1994 | 100.0 | % | 36,000 | 120,000 | 3.33 | 6.3 | 1,900,691 | -0- | ||||||||||||||||||||||||||
| 104 | FedEx Corporation | Punta Gorda | FL | 2007 | 100.0 | % | 34,624 | 284,000 | 8.20 | 9.5 | 4,133,510 | -0- | ||||||||||||||||||||||||||
| 105 | FedEx Corporation | Lakeland | FL | 2006 | 100.0 | % | 32,105 | 155,000 | 4.83 | 9.9 | 1,982,532 | -0- | ||||||||||||||||||||||||||
| 106 | FedEx Corporation | Augusta | GA | 2006 | 100.0 | % | 30,184 | 121,000 | 4.01 | 4.9 | 1,977,779 | -0- | ||||||||||||||||||||||||||
| 107 | Graybar Electric Company | Ridgeland (Jackson) | MS | 1993 | 100.0 | % | 26,340 | 109,000 | 4.14 | 1.6 | 1,883,306 | -0- | ||||||||||||||||||||||||||
| 108 | Sherwin-Williams Company | Burr Ridge (Chicago) | IL | 1997 | 100.0 | % | 12,500 | 162,000 | 12.96 | 3.8 | 1,692,901 | -0- | ||||||||||||||||||||||||||
| Total as of 12/31/17 | 99.5 | % | 19,096,237 | $ | 113,613,000 | $ | 5.99 | 7.9 | $ | 1,496,250,053 | (C) | $ | 620,411,537 | |||||||||||||||||||||||||
| Acquisitions Subsequent to 12/31/17 | ||||||||||||||||||||||||||||||||||||||
| 109 | Shaw Industries, Inc. | Savannah | GA | 2018 | 100 | % | 831,764 | 3,470,000 | 4.17 | 9.8 | ||||||||||||||||||||||||||||
| Pro Forma Total with Acquisitions Subsequent to 12/31/17 | 99.6 | % | 19,928,001 | $ | 117,083,000 | $ | 5.91 | 8.0 | ||||||||||||||||||||||||||||||
| Leasing Activity Subsequent to 12/31/17 | ||||||||||||||||||||||||||||||||||||||
| Rinnai America Corporation | (D) | Griffin (Atlanta) | GA | 2006 | - | - | $ | 831,000 | 3.81 | 3.0 | ||||||||||||||||||||||||||||
| Pro Forma Total with Acquisitions and Leasing Activity Subsequent to 12/31/17 | 99.6 | % | 19,928,001 | $ | 5.89 | 8.0 | ||||||||||||||||||||||||||||||||
(A) Both tenants occupy one property.
(B) Both tenants occupy one property. Other than these two properties indicated in footnotes (A) and (B) and the one retail property, all other properties are single-tenant.
(C) Does not include unamortized debt issuance costs of $7,760,102.
(D) Effective December 31, 2017, Caterpillar Logistics Services, Inc. vacated the Company’s 218,120 square foot building, located in Griffin, GA and Rinnai America Corporation took occupancy effective January 1, 2018. The new 3 year lease agreement goes through December 31, 2020 with an initial annual rent of $807,044, representing $3.70 per square foot, and 3.0% annual increases thereafter.
(E) In contract to sell this vacant property.
First Quarter FY 2018 Supplemental of Monmouth Real Estate Investment Corp. Page 17 of 21

| Investors and analysts following the real estate industry utilize funds from operations ("FFO"), core funds from operations ("Core FFO"), adjusted funds from operations ("AFFO"), net operating income ("NOI"), Same Property NOI, Same Property Cash NOI, and earnings before interest, taxes, depreciation and amortization for real estate, (“EBITDAre”)& ("Adjusted EBITDA") variously defined, as supplemental performance measures. While the Company believes net income available to common stockholders, as defined by accounting principles generally accepted in the United States of America (U.S. GAAP), is the most appropriate measure, it considers NOI, Same Property NOI, Same Property Cash NOI, EBITDAre, Adjusted EBITDA, FFO, Core FFO and AFFO, given their wide use by and relevance to investors and analysts, appropriate supplemental performance measures. FFO, reflecting the assumption that real estate asset values rise or fall with market conditions, principally adjusts for the effects of U.S. GAAP depreciation and amortization of real estate assets. Core FFO reflects the same assumptions as FFO except that is also adjusts to exclude for the effects of acquisitions costs and costs associated with the redemption of preferred stock. NOI provides a measure of rental operations, and does not factor in depreciation and amortization and non-property specific expenses such as interest expense and general and administrative expenses. EBITDAre and Adjusted EBITDA provides a tool to further evaluate the ability to incur and service debt and to fund dividends and other cash needs. AFFO provides a supplemental tool to evaluate the Company’s performance. In addition, NOI, Same Property NOI, Same Property Cash NOI, EBITDAre, Adjusted EBITDA, FFO, Core FFO and AFFO are commonly used in various ratios, pricing multiples, yields and returns and valuation of calculations used to measure financial position, performance and value. As used herein, the Company calculates the following non-U.S. GAAP measures as follows: |
FFO, as defined by The National Association of Real Estate Investment Trusts (NAREIT), to be equal to net income applicable to common shareholders, as defined by U.S. GAAP, excluding extraordinary items as defined by U.S. GAAP, gains or losses from sales of previously depreciated real estate assets, impairment charges related to depreciable real estate assets, plus certain non-cash items such as real estate asset depreciation and amortization. FFO includes gains and losses realized on securities investments. NAREIT created FFO as a non-U.S. GAAP supplemental measure of REIT operating performance and is used by industry analysts and investors as a supplemental operating performance measure of a REIT.
Core FFO is calculated as FFO plus acquisition costs and costs associated with the Redemption of Preferred Stock.
AFFOis calculated as Core FFO plus amortization of financing costs; stock compensation expense, deprecation of corporate office tenant improvements and non-recurring other expenses, less gain on sale of securities transactions; effects of non-cash U.S. GAAP straight-line rent adjustments and recurring capital expenditures. Recurring capital expenditures are defined as all capital expenditures, excluding capital expenditures related to expansions at our current locations or capital expenditures that are incurred in conjunction with obtaining a new lease or a lease renewal.
NOIfrom property operations is calculated as net income attributable to common shareholders, as defined by U.S. GAAP, plus preferred dividends, costs associated with the redemption of preferred stock, general & administrative expenses, acquisitions costs, depreciation, amortization of capitalized lease costs & intangible assets and interest expense, including amortization of financing costs, less dividend and interest income and gain on sale of securities transactions. The components of NOI consist of recurring rental and reimbursement revenue, less real estate taxes and operating expenses, such as insurance, utilities, and repairs and maintenance and other expenses.
Same Property NOIis calculated as the NOI of all properties owned during the entire periods presented with the exclusion of any properties expanded during the periods presented. Same Property Cash NOIis calculated as the Same Property NOI adjusted to exclude the effect of non-cash U.S. GAAP straight-line rent adjustment for the properties included in the Same Property NOI calculation.
EBITDAre, as defined by NAREIT, is net income attributable to common shareholders, as defined by U.S. GAAP, plus preferred dividends, costs associated with the redemption of preferred stock, interest expense, including amortization of financing costs, depreciation and amortization and plus losses and minus gains on sales of real estate investments.
Adjusted EBITDA is calculated as EBITDAreplus acquisition costs, net amortization of acquired above and below market lease revenue and plus losses and minus gains on sales of securities transactions.
FFO, Core FFO, AFFO, NOI, Same Property NOI, Same Property Cash NOI, EBITDAre and Adjusted EBITDA,do not represent cash generated from operating activities in accordance with U.S. GAAP and are not necessarily indicative of cash available to fund cash needs, including the repayment of principal on debt and payment of dividends and distributions. FFO, Core FFO, AFFO, NOI, Same Property NOI, Same Property Cash NOI, EBITDAre and Adjusted EBITDA should not be considered as substitutes for net income applicable to common shareholders (calculated in accordance with U.S. GAAP) as a measure of results of operations or cash flows (calculated in accordance with U.S. GAAP) as a measure of liquidity. FFO, Core FFO, AFFO, NOI, Same Property NOI, Same Property Cash NOI, EBITDAre and Adjusted EBITDA, as currently calculated by the Company, may not be comparable to similarly titled, but variously calculated, measures of other REITs.
First Quarter FY 2018 Supplemental of Monmouth Real Estate Investment Corp. Page 18 of 21
| FOR IMMEDIATE RELEASE | February 7, 2018 |
| Contact: Susan Jordan | |
| 732-577-9996 |
MONMOUTH REAL ESTATE REPORTS RESULTS FOR
THE FIRST QUARTER ENDED DECEMBER 31, 2017
FREEHOLD, NJ, February 7, 2018........ Monmouth Real Estate Investment Corporation (NYSE:MNR) reported Net Income Attributable to Common Shareholders of $13,313,000 or $0.17 per diluted share for the three months ended December 31, 2017 as compared to $6,156,000 or $0.09 per diluted share for the three months ended December 31, 2016 representing an increase per share of 89%. Approximately $0.07 of the $0.08 per share increase is due to the $5,388,000 realized gain on the sale of two real estate properties sold during the current year quarter. Core Funds from Operations (Core FFO) were $16,934,000 or $0.22 per diluted share for the three months ended December 31, 2017 as compared to $13,857,000 or $0.20 per diluted share for the three months ended December 31, 2016 representing an increase in Core FFO per share of 10%. Adjusted Funds from Operations (AFFO), for the three months ended December 31, 2017 were $16,472,000 or $0.22 per diluted share versus $12,939,000 or $0.19 per diluted share for the three months ended December 31, 2016 representing an increase in AFFO per share of 16%.
A summary of significant financial information for the three months ended December 31, 2017 and 2016 is as follows:
Three Months Ended December 31, | ||||||||
| 2017 | 2016 | |||||||
| Rental Revenue | $ | 27,692,000 | $ | 23,281,000 | ||||
| Reimbursement Revenue | $ | 5,049,000 | $ | 3,901,000 | ||||
| Lease Termination Income | $ | 210,000 | $ | -0- | ||||
| Net Operating Income (NOI) (1) | $ | 27,443,000 | $ | 22,980,000 | ||||
| Total Expenses | $ | 16,268,000 | $ | 13,263,000 | ||||
| Dividend and Interest Income | $ | 2,864,000 | $ | 1,292,000 | ||||
| Gain on Sale of Securities Transactions | $ | 100,000 | $ | 806,000 | ||||
| Gain on Sale of Real Estate Investments | $ | 5,388,000 | $ | -0- | ||||
| Net Income | $ | 17,630,000 | $ | 9,854,000 | ||||
| Net Income Attributable to Common Shareholders | $ | 13,313,000 | $ | 6,156,000 | ||||
| Net Income Attributable to Common Shareholders Per Diluted Common Share | $ | 0.17 | $ | 0.09 | ||||
| Core FFO (1) | $ | 16,934,000 | $ | 13,857,000 | ||||
| Core FFO per Diluted Common Share (1) | $ | 0.22 | $ | 0.20 | ||||
| AFFO (1) | $ | 16,472,000 | $ | 12,939,000 | ||||
| AFFO per Diluted Common Share (1) | $ | 0.22 | $ | 0.19 | ||||
| Dividends Declared per Common Share | $ | 0.17 | $ | 0.16 | ||||
| Weighted Avg. Diluted Common Shares Outstanding | 76,587,000 | 69,830,000 | ||||||
A summary of significant balance sheet information as of December 31, 2017 and September 30, 2017 is as follows:
| December 31, 2017 | September 30, 2017 | |||||||
| Net Real Estate Investments | $ | 1,304,547,000 | $ | 1,260,856,000 | ||||
| Securities Available for Sale at Fair Value | $ | 130,431,000 | $ | 123,765,000 | ||||
| Total Assets | $ | 1,499,125,000 | $ | 1,443,038,000 | ||||
| Fixed Rate Mortgage Notes Payable, net of Unamortized Debt Issuance Costs | $ | 612,651,000 | $ | 591,364,000 | ||||
| Loans Payable | $ | 110,000,000 | $ | 120,091,000 | ||||
| Total Shareholders’ Equity | $ | 754,084,000 | $ | 712,866,000 | ||||
Michael P. Landy, President and CEO, commented on the results for the first quarter of fiscal 2018,
“This was another strong quarter for Monmouth and represents an excellent start to fiscal 2018. We are pleased to report continued growth across multiple fronts. During the quarter we:
| ● | Increased our common stock dividend by 6.25% on October 2, 2017, representing the Company’s second dividend increase in three years |
| ● | Increased our per share AFFO to $0.22, representing a 16% increase over the prior year period and a 5% increase sequentially |
| ● | Increased our Net Operating Income (NOI) 19% over the prior year period |
| ● | Acquired two new Class A built-to-suit properties comprising 422,000 square feet, for an aggregate cost of $52.1 million |
| ● | Subsequent to the quarter end, acquired a new 832,000 square foot Class A building for an aggregate cost of $57.5 million |
First Quarter FY 2018 Supplemental of Monmouth Real Estate Investment Corp. Page 19 of 21
| ● | Sold two properties for net proceeds of $10.5 million which resulted in a realized gain of $1.8 million or approximately 21% over our historic cost basis |
| ● | Increased our gross leasable area (GLA) 15% to 19.1 million square feet over the prior year period. Subsequent to quarter end, our GLA increased to 19.9 million square feet |
| ● | Renewed six of sixteen leases scheduled to expire in Fiscal 2018. These six leases consist of 569,000 square feet and result in a 3.9% increase in GAAP rents and a weighted average lease term of 6.1 years |
| ● | Raised $51.2 million of permanent capital resulting from the issuance of shares of our 6.125% Series C Perpetual Preferred Stock through our ATM Program and our common equity through our dividend reinvestment plan.” |
Mr. Landy stated, “On October 2, we raised our common stock dividend by 6.25% representing our second dividend increase in three years. These two dividend increases total 13%. Following 9% AFFO per-share growth in fiscal 2017, our first quarter fiscal 2018 AFFO per share has increased 16% from the prior year quarter, resulting in a very conservative 77% AFFO dividend payout ratio. Monmouth has maintained or increased its common stock dividend for 26 consecutive years.”
“We’ve put together a high-quality industrial property portfolio that has and will continue to benefit from the opportunities presented by e-commerce and the evolving global supply chain. Our property portfolio is 99.5% occupied, reflecting the mission-critical nature of our properties. Our new annual report is featured on our website and represents an excellent resource for understanding our Company and our future outlook. Please contact Susan Jordan, our Vice President of Investor Relations if you would like to receive a hard copy. We look forward to reporting continued progress throughout the year.”
Monmouth Real Estate Investment Corporation will host its First Quarter FY 2018 Financial Results Webcast and Conference Call on Thursday, February 8, 2018 at 10:00 a.m. Eastern Time. Senior management will discuss the results, current market conditions and future outlook.
The Company’s First Quarter FY 2018 financial results being released herein will be available on the Company’s website at www.mreic.reit in the Investor Relations section, under Filings and Reports.
To participate in theWebcast, select the1Q2018 Webcast and Earnings Call “Link to Webcast” on the homepage of the Company’s website atwww.mreic.reit, in the Highlights section, which is located towards the bottom of the homepage. Interested parties can also participate viaconference call by calling toll free 877-510-5852 (domestically) or 412-902-4138 (internationally).
The replay of the conference call will be available at 12:00 p.m. Eastern Time on Thursday, February 8, 2018. It will be available until May 1, 2018, and can be accessed by dialing toll free 877-344-7529 (domestically) and 412-317-0088 (internationally) and entering the passcode 10114906. A transcript of the call and the webcast replay will be available at the Company’s website on the Investor Relations homepage, www.mreic.reit.
Monmouth Real Estate Investment Corporation, founded in 1968, is one of the oldest public equity REITs in the U.S. The Company specializes in single tenant, net-leased industrial properties, subject to long-term leases, primarily to investment-grade tenants. Monmouth Real Estate is a fully-integrated and self-managed real estate company, whose property portfolio consists of 109 properties containing a total of approximately 19.9 million rentable square feet, geographically diversified across 30 states. In addition, the Company owns a portfolio of REIT securities.
Certain statements included in this press release which are not historical facts may be deemed forward-looking statements within the meaning of the Private Securities Litigation Reform Act of 1995. Any such forward-looking statements are based on the Company’s current expectations and involve various risks and uncertainties. Although the Company believes the expectations reflected in any forward-looking statements are based on reasonable assumptions, the Company can provide no assurance those expectations will be achieved. The risks and uncertainties that could cause actual results or events to differ materially from expectations are contained in the Company’s annual report on Form 10-K and described from time to time in the Company’s other filings with the SEC. The Company undertakes no obligation to publicly update or revise any forward-looking statements whether as a result of new information, future events, or otherwise.
Notes:
(1) Non-U.S. GAAP Information: FFO is defined by the National Association of Real Estate Investment Trusts (“NAREIT”) as net income applicable to common shareholders, excluding gains or losses from sales of depreciable assets, plus real estate-related depreciation and amortization. We define Core FFO as FFO plus acquisition costs and plus costs associated with the Redemption of Preferred Stock. We define AFFO as Core FFO excluding lease termination income, gains or losses on securities transactions, stock based compensation expense, depreciation of corporate office tenant improvements, amortization of deferred financing costs, non-recurring other expense, U.S. GAAP straight-line rent adjustments and less recurring capital expenditures. We define recurring capital expenditures as all capital expenditures, excluding capital expenditures related to expansions at our current locations or capital expenditures that are incurred in conjunction with obtaining a new lease or a lease renewal. We define NOI as recurring rental and reimbursement revenues less real estate and other operating expenses. FFO, Core FFO and AFFO per diluted common share are defined as FFO, Core FFO and AFFO divided by weighted average diluted common shares outstanding. FFO, Core FFO and AFFO per diluted common share, as well as NOI, should be considered as supplemental measures of operating performance used by real estate investment trusts (REITs). FFO, Core FFO and AFFO per diluted common share exclude historical cost depreciation as an expense and may facilitate the comparison of REITs which have different cost basis. However, other REITs may use different methodologies to calculate FFO, Core FFO and AFFO and, accordingly, our FFO, Core FFO and AFFO may not be comparable to all other REITs. The items excluded from FFO, Core FFO and AFFO per diluted common share are significant components in understanding the Company’s financial performance.
FFO, Core FFO and AFFO per diluted common share (A) do not represent cash flow from operations as defined by accounting principles generally accepted in the United States of America; (B) should not be considered as an alternative to net income as a measure of operating performance or to cash flows from operating, investing and financing activities; and (C) are not alternatives to cash flow as a measure of liquidity. FFO, Core FFO and AFFO per diluted common share, as well as NOI, as calculated by the Company, may not be comparable to similarly titled measures reported by other REITs.
First Quarter FY 2018 Supplemental of Monmouth Real Estate Investment Corp. Page20 of 21
The following is a reconciliation of the Company’s U.S. GAAP Net Income to the Company’s FFO, Core FFO and AFFO for the three months ended December 31, 2017 and 2016:
| Three Months Ended | ||||||||
| 12/31/2017 | 12/31/2016 | |||||||
| Net Income Attributable to Common Shareholders | $ | 13,313,000 | $ | 6,156,000 | ||||
| Plus: Depreciation Expense (excluding Corporate Office Capitalized Costs) | 8,445,000 | 6,954,000 | ||||||
| Plus: Amortization of Intangible Assets | 344,000 | 268,000 | ||||||
| Plus: Amortization of Capitalized Lease Costs | 220,000 | 206,000 | ||||||
| Less: (Gain) / Plus: Loss on Sale of Real Estate Investments | (5,388,000 | ) | 95,000 | |||||
| FFO Attributable to Common Shareholders | 16,934,000 | 13,679,000 | ||||||
| Plus: Acquisition Costs | -0- | 178,000 | ||||||
| Core FFO Attributable to Common Shareholders | 16,934,000 | 13,857,000 | ||||||
| Plus: Depreciation of Corporate Office Capitalized Costs | 39,000 | 39,000 | ||||||
| Plus: Stock Compensation Expense | 131,000 | 100,000 | ||||||
| Plus: Amortization of Financing Costs | 294,000 | 281,000 | ||||||
| Less: Gain on Sale of Securities Transactions | (101,000 | ) | (806,000 | ) | ||||
| Less: Lease Termination Income | (210,000 | ) | -0- | |||||
| Less: Recurring Capital Expenditures | (219,000 | ) | (189,000 | ) | ||||
| Less: Effect of Non-cash U.S. GAAP Straight-line Rent Adjustment | (396,000 | ) | (343,000 | ) | ||||
| AFFO Attributable to Common Shareholders | $ | 16,472,000 | $ | 12,939,000 | ||||
The following are the Cash Flows provided (used) by Operating, Investing and Financing Activities for the three months ended December 31, 2017 and 2016:
| Three Months Ended | ||||||||
| 12/31/2017 | 12/31/2016 | |||||||
| Operating Activities | $ | 17,090,000 | $ | 14,153,000 | ||||
| Investing Activities | (61,963,000 | ) | (55,150,000 | ) | ||||
| Financing Activities | 45,402,000 | (24,029,000 | ) | |||||
# # # # #
First Quarter FY 2018 Supplemental of Monmouth Real Estate Investment Corp. Page 21 of 21