
Table of Contents
The statement of operations and supplemental statement of operations provided in this supplemental information package present funds from operations (FFO), core funds from operations (Core FFO), adjusted funds from operations (AFFO), net operating income (NOI), EBITDAre and Adjusted EBITDA, which are REIT industry financial measures that are not calculated in accordance with accounting principles generally accepted in the United States. Please see page 23 for a definition of these supplemental performance measures. Please see the supplemental statement of operations reconciliation for a reconciliation of certain captions in the supplemental statement of operations reported in this supplemental information package to the statement of operations as reported in the Company’s filings with the SEC on Form 10-K.
Consolidated Balance Sheets
| | | As of | | | As of | |
| | September 30, 2018 | | | September 30, 2017 | |
| ASSETS | | | | | | |
| Real Estate Investments: | | | | | | | | |
| Land | | $ | 224,719,083 | | | $ | 187,224,819 | |
| Buildings and Improvements | | | 1,494,859,336 | | | | 1,244,691,715 | |
| Total Real Estate Investments | | | 1,719,578,419 | | | | 1,431,916,534 | |
| Accumulated Depreciation | | | (207,065,634 | ) | | | (171,086,083 | ) |
| Real Estate Investments | | | 1,512,512,785 | | | | 1,260,830,451 | |
| | | | | | | | | |
| Real Estate Held for Sale | | | -0- | | | | 14,631,633 | |
| Cash and Cash Equivalents | | | 9,324,585 | | | | 10,226,046 | |
| Securities Available for Sale at Fair Value | | | 154,920,545 | | | | 123,764,770 | |
| Tenant and Other Receivables | | | 1,249,434 | | | | 1,753,054 | |
| Deferred Rent Receivable | | | 9,656,179 | | | | 8,049,275 | |
| Prepaid Expenses | | | 6,189,796 | | | | 5,434,874 | |
| Intangible Assets, net of Accumulated Amortization of $13,699,519 and $13,404,318, respectively | | | 14,589,756 | | | | 10,010,165 | |
| Capitalized Lease Costs, net of Accumulated Amortization of $3,271,481 and $3,393,187, respectively | | | 5,231,845 | | | | 4,180,907 | |
| Financing Costs, net of Accumulated Amortization of $995,135 and $619,555, respectively | | | 500,129 | | | | 875,709 | |
| Other Assets | | | 4,202,832 | | | | 3,280,871 | |
| TOTAL ASSETS | | $ | 1,718,377,886 | | | $ | 1,443,037,755 | |
| | | | | | | | | |
| LIABILITIES AND SHAREHOLDERS’ EQUITY | | | | | | | | |
| | | | | | | | | |
| Liabilities: | | | | | | | | |
| Fixed Rate Mortgage Notes Payable, net of Unamortized Debt Issuance Costs | | $ | 711,545,649 | | | $ | 591,364,371 | |
| Loans Payable | | | 186,608,676 | | | | 120,091,417 | |
| Accounts Payable and Accrued Expenses | | | 5,891,172 | | | | 4,450,753 | |
| Other Liabilities | | | 16,426,622 | | | | 14,265,518 | |
| Total Liabilities | | | 920,472,119 | | | | 730,172,059 | |
| | | | | | | | | |
| COMMITMENTS AND CONTINGENCIES | | | | | | | | |
| | | | | | | | | |
| Shareholders’ Equity: | | | | | | | | |
| 6.125% Series C Cumulative Redeemable Preferred Stock, $0.01 Par Value Per Share: 16,400,000 and 12,400,000 Shares Authorized as of September 30, 2018 and 2017, respectively; 11,488,001 and 9,839,445 Shares Issued and Outstanding as of September 30, 2018 and 2017, respectively | | | 287,200,025 | | | | 245,986,125 | |
| Common Stock, $0.01 Par Value Per Share: 188,039,750 and 192,039,750 Shares Authorized as of September 30, 2018 and 2017, respectively; 81,503,134 and 75,630,521 Shares Issued and Outstanding as of September 30, 2018 and 2017, respectively | | | 815,031 | | | | 756,305 | |
| Excess Stock, $0.01 Par Value Per Share: 200,000,000 Shares Authorized as of September 30, 2018 and 2017; No Shares Issued or Outstanding as of September 30, 2018 and 2017 | | | -0- | | | | -0- | |
| Additional Paid-In Capital | | | 534,635,290 | | | | 459,552,701 | |
| Accumulated Other Comprehensive Income (Loss) | | | (24,744,579 | ) | | | 6,570,565 | |
| Undistributed Income | | | -0- | | | | -0- | |
| Total Shareholders’ Equity | | | 797,905,767 | | | | 712,865,696 | |
| TOTAL LIABILITIES & SHAREHOLDERS’ EQUITY | | $ | 1,718,377,886 | | | $ | 1,443,037,755 | |
 FOURTH QUARTER AND FISCAL YEAR END 2018 SUPPLEMENTAL INFORMATION FOURTH QUARTER AND FISCAL YEAR END 2018 SUPPLEMENTAL INFORMATION | 3 |
Consolidated Statements of Income
| | | For The | | | For The | |
| | | Three Months Ended | | | Twelve Months Ended | |
| | | 9/30/2018 | | | 9/30/2017 | | | 9/30/2018 | | | 9/30/2017 | |
| INCOME: | | | | | | | | | | | | | | | | |
| Rental Revenue | | $ | 30,305,505 | | | $ | 26,367,855 | | | $ | 115,864,119 | | | $ | 97,659,778 | |
| Reimbursement Revenue | | | 6,295,189 | | | | 4,789,059 | | | | 23,297,730 | | | | 18,725,527 | |
| Lease Termination Income | | | -0- | | | | -0- | | | | 210,261 | | | | -0- | |
| TOTAL INCOME | | | 36,600,694 | | | | 31,156,914 | | | | 139,372,110 | | | | 116,385,305 | |
| | | | | | | | | | | | | | | | | |
| EXPENSES: | | | | | | | | | | | | | | | | |
| Real Estate Taxes | | | 5,003,666 | | | | 3,857,976 | | | | 18,596,239 | | | | 15,266,634 | |
| Operating Expenses | | | 1,422,724 | | | | 1,251,936 | | | | 5,793,878 | | | | 4,887,922 | |
| General & Administrative Expenses | | | 2,723,788 | | | | 2,501,693 | | | | 8,776,579 | | | | 7,809,546 | |
| Acquisition Costs | | | -0- | | | | -0- | | | | -0- | | | | 178,526 | |
| Depreciation | | | 9,671,314 | | | | 8,185,168 | | | | 36,175,923 | | | | 29,634,998 | |
| Amortization of Capitalized Lease Costs and Intangible Assets | | | 650,484 | | | | 497,375 | | | | 2,391,104 | | | | 1,824,751 | |
| TOTAL EXPENSES | | | 19,471,976 | | | | 16,294,148 | | | | 71,733,723 | | | | 59,602,377 | |
| | | | | | | | | | | | | | | | | |
| OTHER INCOME (EXPENSE): | | | | | | | | | | | | | | | | |
| Dividend and Interest Income | | | 3,740,054 | | | | 2,299,911 | | | | 13,120,465 | | | | 6,930,564 | |
| Gain on Sale of Securities Transactions | | | -0- | | | | 17,770 | | | | 111,387 | | | | 2,311,714 | |
| Interest Expense, including Amortization of Financing Costs | | | (8,709,149 | ) | | | (6,918,257 | ) | | | (32,349,705 | ) | | | (25,754,121 | ) |
| TOTAL OTHER INCOME (EXPENSE) | | | (4,969,095 | ) | | | (4,600,576 | ) | | | (19,117,853 | ) | | | (16,511,843 | ) |
| | | | | | | | | | | | | | | | | |
| INCOME FROM CONTINUING OPERATIONS | | | 12,159,623 | | | | 10,262,190 | | | | 48,520,534 | | | | 40,271,085 | |
| | | | | | | | | | | | | | | | | |
| Gain on Sale of Real Estate Investments | | | -0- | | | | -0- | | | | 7,485,266 | | | | -0- | |
| | | | | | | | | | | | | | | | | |
| NET INCOME | | | 12,159,623 | | | | 10,262,190 | | | | 56,005,800 | | | | 40,271,085 | |
| | | | | | | | | | | | | | | | | |
| Less: Preferred Dividends | | | 4,377,262 | | | | 3,536,103 | | | | 17,190,456 | | | | 14,861,686 | |
| Less: Redemption of Preferred Stock | | | -0- | | | | -0- | | | | -0- | | | | 2,467,165 | |
| | | | | | | | | | | | | | | | |
| NET INCOME ATTRIBUTABLE TO COMMON SHAREHOLDERS | | $ | 7,782,361 | | | $ | 6,726,087 | | | $ | 38,815,344 | | | $ | 22,942,234 | |
| FOURTH QUARTER AND FISCAL YEAR END 2018 SUPPLEMENTAL INFORMATION | 4 |
Net Income, FFO, Core FFO, AFFO, EBITDAre, Adjusted EBITDA
(unaudited)
| | | For The | | | For The | |
| | | Three Months Ended | | | Twelve Months Ended | |
| FFO, Core FFO, AFFO | | 9/30/2018 | | | 9/30/2017 | | | 9/30/2018 | | | 9/30/2017 | |
| Net Income Attributable to Common Shareholders | | $ | 7,782,361 | | | $ | 6,726,087 | | | $ | 38,815,344 | | | $ | 22,942,234 | |
| Plus: Depreciation Expense (excluding Corporate Office Capitalized Costs) | | | 9,631,809 | | | | 8,145,660 | | | | 36,017,959 | | | | 29,478,322 | |
| Plus: Amortization of Intangible Assets | | | 455,418 | | | | 300,574 | | | | 1,613,368 | | | | 1,071,719 | |
| Plus: Amortization of Capitalized Lease Costs | | | 220,743 | | | | 222,293 | | | | 880,444 | | | | 855,000 | |
| Less: (Gain) / Plus: Loss on Sale of Real Estate Investments | | | -0- | | | | -0- | | | | (7,485,266 | ) | | | 95,336 | |
| FFO Attributable to Common Shareholders | | | 18,090,331 | | | | 15,394,614 | | | | 69,841,849 | | | | 54,442,611 | |
| Plus: Acquisition Costs | | | -0- | | | | -0- | | | | -0- | | | | 178,526 | |
| Plus: Redemption of Preferred Stock | | | -0- | | | | -0- | | | | -0- | | | | 2,467,165 | |
| Core FFO Attributable to Common Shareholders | | | 18,090,331 | | | | 15,394,614 | | | | 69,841,849 | | | | 57,088,302 | |
| Plus: Stock Compensation Expense | | | 94,756 | | | | 183,652 | | | | 433,895 | | | | 624,706 | |
| Plus: Depreciation of Corporate Office Capitalized Costs | | | 39,505 | | | | 39,508 | | | | 157,964 | | | | 156,676 | |
| Plus: Amortization of Financing Costs | | | 310,006 | | | | 284,789 | | | | 1,220,983 | | | | 1,234,259 | |
| Less: Lease Termination Income | | | -0- | | | | -0- | | | | (210,261 | ) | | | -0- | |
| Less: Gain on Sale of Securities Transactions | | | -0- | | | | (17,770 | ) | | | (111,387 | ) | | | (2,311,714 | ) |
| Less: Effect of non-cash U.S. GAAP Straight-line Rent Adjustment | | | (615,441 | ) | | | (103,135 | ) | | | (1,972,588 | ) | | | (1,027,927 | ) |
| Less: Recurring Capital Expenditures | | | (211,335 | ) | | | (311,875 | ) | | | (985,424 | ) | | | (883,864 | ) |
| AFFO Attributable to Common Shareholders | | $ | 17,707,822 | | | $ | 15,469,783 | | | $ | 68,375,031 | | | $ | 54,880,438 | |
| | | For The | | | For The | |
| | | Three Months Ended | | | Twelve Months Ended | |
| EBITDAre, Adjusted EBITDA | | 9/30/2018 | | | 9/30/2017 | | | 9/30/2018 | | | 9/30/2017 | |
| Net Income Attributable to Common Shareholders | | $ | 7,782,361 | | | $ | 6,726,087 | | | $ | 38,815,344 | | | $ | 22,942,234 | |
| Plus: Preferred Dividends | | | 4,377,262 | | | | 3,536,103 | | | | 17,190,456 | | | | 14,861,686 | |
| Plus: Redemption of Preferred Stock | | | -0- | | | | -0- | | | | -0- | | | | 2,467,165 | |
| Plus: Interest Expense, including Amortization of Financing Costs | | | 8,709,149 | | | | 6,918,257 | | | | 32,349,705 | | | | 25,754,121 | |
| Plus: Depreciation and Amortization | | | 10,321,798 | | | | 8,682,543 | | | | 38,567,027 | | | | 31,459,749 | |
| Less: (Gain) / Plus: Loss on Sale of Real Estate Investments | | | -0- | | | | -0- | | | | (7,485,266 | ) | | | 95,336 | |
| EBITDAre | | | 31,190,570 | | | | 25,862,990 | | | | 119,437,266 | | | | 97,580,291 | |
| Plus: Acquisition Costs | | | -0- | | | | -0- | | | | -0- | | | | 178,526 | |
| Plus: Net Amortization of Acquired Above and Below Market Lease Revenue | | | 25,677 | | | | 25,492 | | | | 102,708 | | | | 101,968 | |
| Less: Gain on Sale of Securities Transactions | | | -0- | | | | (17,770 | ) | | | (111,387 | ) | | | (2,311,714 | ) |
| Adjusted EBITDA | | $ | 31,216,247 | | | $ | 25,870,712 | | | $ | 119,428,587 | | | $ | 95,549,071 | |
| FOURTH QUARTER AND FISCAL YEAR END 2018 SUPPLEMENTAL INFORMATION | 5 |
NOI Reconciliations
(unaudited)
| | | For The | | | For The | |
| | | Three Months Ended | | | Twelve Months Ended | |
| Net Operating Income | | 9/30/2018 | | | 9/30/2017 | | | 9/30/2018 | | | 9/30/2017 | |
| Net Income Attributable to Common Shareholders | | $ | 7,782,361 | | | $ | 6,726,087 | | | $ | 38,815,344 | | | $ | 22,942,234 | |
| Plus: Redemption of Preferred Stock | | | -0- | | | | -0- | | | | -0- | | | | 2,467,165 | |
| Plus: Preferred Dividends | | | 4,377,262 | | | | 3,536,103 | | | | 17,190,456 | | | | 14,861,686 | |
| Plus: General & Administrative Expenses | | | 2,723,788 | | | | 2,501,693 | | | | 8,776,579 | | | | 7,809,546 | |
| Plus: Acquisition Costs | | | -0- | | | | -0- | | | | -0- | | | | 178,526 | |
| Plus: Depreciation | | | 9,671,314 | | | | 8,185,168 | | | | 36,175,923 | | | | 29,634,998 | |
| Plus: Amortization of Capitalized Lease Costs and Intangible Assets | | | 650,484 | | | | 497,375 | | | | 2,391,104 | | | | 1,824,751 | |
| Plus: Interest Expense, including Amortization of Financing Costs | | | 8,709,149 | | | | 6,918,257 | | | | 32,349,705 | | | | 25,754,121 | |
| Less: Dividend and Interest Income | | | (3,740,054 | ) | | | (2,299,911 | ) | | | (13,120,465 | ) | | | (6,930,564 | ) |
| Less: Gain on Sale of Securities Transactions | | | -0- | | | | (17,770 | ) | | | (111,387 | ) | | | (2,311,714 | ) |
| Less: Gain on Sale of Real Estate Investments | | | -0- | | | | -0- | | | | (7,485,266 | ) | | | -0- | |
| Less: Lease Termination Income | | | -0- | | | | -0- | | | | (210,261 | ) | | | -0- | |
| Net Operating Income – NOI | | $ | 30,174,304 | | | $ | 26,047,002 | | | $ | 114,771,732 | | | $ | 96,230,749 | |
| | | For The | | | For The | |
| | | Three Months Ended | | | Twelve Months Ended | |
| Components of Net Operating Income Consists of: | | 9/30/2018 | | | 9/30/2017 | | | 9/30/2018 | | | 9/30/2017 | |
| Revenues: | | | | | | | | | | | | | | | | |
| Rental Revenue | | $ | 30,305,505 | | | $ | 26,367,855 | | | $ | 115,864,119 | | | $ | 97,659,778 | |
| Reimbursement Revenue | | | 6,295,189 | | | | 4,789,059 | | | | 23,297,730 | | | | 18,725,527 | |
| Total Rental and Reimbursement Revenue | | | 36,600,694 | | | | 31,156,914 | | | | 139,161,849 | | | | 116,385,305 | |
| | | | | | | | | | | | | | | | | |
| Expenses: | | | | | | | | | | | | | | | | |
| Real Estate Taxes | | | 5,003,666 | | | | 3,857,976 | | | | 18,596,239 | | | | 15,266,634 | |
| Operating Expenses | | | 1,422,724 | | | | 1,251,936 | | | | 5,793,878 | | | | 4,887,922 | |
| Total Real Estate Taxes and Operating Expenses | | | 6,426,390 | | | | 5,109,912 | | | | 24,390,117 | | | | 20,154,556 | |
| Net Operating Income – NOI | | $ | 30,174,304 | | | $ | 26,047,002 | | | $ | 114,771,732 | | | $ | 96,230,749 | |
| FOURTH QUARTER AND FISCAL YEAR END 2018 SUPPLEMENTAL INFORMATION | 6 |
Financial Highlights
(unaudited)
| | | For The | | | For The | |
| | | Three Months Ended | | | Twelve Months Ended | |
| | | 9/30/2018 | | | 9/30/2017 | | | 9/30/2018 | | | 9/30/2017 | |
| | | | | | | | | | | | | |
| Weighted Average Common Shares Outstanding | | | | | | | | | | | | | | | | |
| Basic | | | 80,691,790 | | | | 74,634,201 | | | | 78,619,440 | | | | 72,114,078 | |
| Diluted | | | 80,888,874 | | | | 74,800,497 | | | | 78,802,208 | | | | 72,249,691 | |
| | | | | | | | | | | | | | | | | |
| Net Income Attributable to Common Shareholders | | $ | 7,782,361 | | | $ | 6,726,087 | | | $ | 38,815,344 | | | $ | 22,942,234 | |
| | | | | | | | | | | | | | | | | |
| Basic | | $ | 0.10 | | | $ | 0.09 | | | $ | 0.49 | | | $ | 0.32 | |
| Diluted | | | 0.10 | | | | 0.09 | | | | 0.49 | | | | 0.32 | |
| | | | | | | | | | | | | | | | | |
| Net Operating Income – NOI | | $ | 30,174,304 | | | $ | 26,047,002 | | | $ | 114,771,732 | | | $ | 96,230,749 | |
| | | | | | | | | | | | | | | | | |
| Basic | | $ | 0.37 | | | $ | 0.35 | | | $ | 1.46 | | | $ | 1.33 | |
| Diluted | | | 0.37 | | | | 0.35 | | | | 1.46 | | | | 1.33 | |
| | | | | | | | | | | | | | | | | |
| Funds From Operations – FFO | | $ | 18,090,331 | | | $ | 15,394,614 | | | $ | 69,841,849 | | | $ | 54,442,611 | |
| | | | | | | | | | | | | | | | | |
| Basic | | $ | 0.22 | | | $ | 0.21 | | | $ | 0.89 | | | $ | 0.75 | |
| Diluted | | | 0.22 | | | | 0.21 | | | | 0.89 | | | | 0.75 | |
| | | | | | | | | | | | | | | | | |
| Core Funds From Operations - Core FFO | | $ | 18,090,331 | | | $ | 15,394,614 | | | $ | 69,841,849 | | | $ | 57,088,302 | |
| | | | | | | | | | | | | | | | | |
| Basic | | $ | 0.22 | | | $ | 0.21 | | | $ | 0.89 | | | $ | 0.79 | |
| Diluted | | | 0.22 | | | | 0.21 | | | | 0.89 | | | | 0.79 | |
| | | | | | | | | | | | | | | | | |
| Core FFO Excluding Gain on Sale of Securities Transactions and Excluding Lease Termination Income | | $ | 18,090,331 | | | $ | 15,376,844 | | | $ | 69,520,201 | | | $ | 54,776,588 | |
| | | | | | | | | | | | | | | | |
| Basic | | $ | 0.22 | | | $ | 0.21 | | | $ | 0.88 | | | $ | 0.76 | |
| Diluted | | | 0.22 | | | | 0.21 | | | | 0.88 | | | $ | 0.76 | |
| | | | | | | | | | | | | | | | | |
| Adjusted Funds From Operations – AFFO | | $ | 17,707,822 | | | $ | 15,469,783 | | | $ | 68,375,031 | | | $ | 54,880,438 | |
| | | | | | | | | | | | | | | | | |
| Basic | | $ | 0.22 | | | $ | 0.21 | | | $ | 0.87 | | | $ | 0.76 | |
| Diluted | | | 0.22 | | | | 0.21 | | | | 0.87 | | | $ | 0.76 | |
| | | | | | | | | | | | | | | | | |
| Dividends Declared per Common Share | | $ | 0.17 | | | $ | 0.16 | | | $ | 0.68 | | | $ | 0.64 | |
| | | | | | | | | | | | | | | | | |
| Dividend/AFFO Payout Ratio | | | 77.3 | % | | | 76.2 | % | | | 78.2 | % | | | 84.2 | % |
| FOURTH QUARTER AND FISCAL YEAR END 2018 SUPPLEMENTAL INFORMATION | 7 |
Same Property Statistics
(unaudited)
| | | For The | | | | | | | |
| | | Three Months Ended | | | | | | | |
| | | 9/30/2018 | | | | | | 9/30/2017 | | | Change | | | Change % | |
| | | | | | | | | | | | | | | | |
| Total Square Feet / Total Properties | | | 21,173,581 / 111 | | | | | | | | 18,790,021 / 108 | | | | 2,383,560 | | | | 12.7 | % |
| | | | | | | | | | | | | | | | | | | | | |
| Occupancy Percentage at End of Period | | | 99.6 | % | | | | | | | 99.3 | % | | | 30 bps | | | | 0.3 | % |
| | | | | | | | | | | | | | | | | | | | | |
| Same Property Square Feet / Number of Same Properties | | | | | | | 16,927,532 / 98 | | | | | | | | | | | | | |
| | | | | | | | | | | | | | | | | | | | | |
| Same Property Occupancy Percentage at End of Period | | | 99.5 | % | | | | | | | 99.8 | % | | | (30) bps | | | | (0.3 | )% |
| | | | | | | | | | | | | | | | | | | | | |
| Same Property Net Operating Income (NOI) (GAAP) | | $ | 24,320,081 | | | | | | | $ | 24,127,404 | | | $ | 192,677 | | | | 0.8 | % |
| | | | | | | | | | | | | | | | | | | | | |
| Reversal of Effect of Non-cash U.S. GAAP Straight-line Rent Adjustment | | | (314,253 | ) | | | | | | | (203,251 | ) | | | (111,002 | ) | | | | |
| Same Property Cash NOI | | $ | 24,005,828 | | | | | | | $ | 23,924,153 | | | $ | 81,675 | | | | 0.3 | % |
Same Property Statistics includes all properties owned during the entire periods presented with the exclusion of properties expanded during the periods presented.
The 0.8% increase, amounting to $192,677 in Same Property NOI, consists of $178,175 attributable to increased Same Property NOI from occupied properties and by an increase in Same Property NOI from vacant properties of $14,502.
The 0.3% increase, amounting to $81,675 in Same Property Cash NOI, consists of $70,247 attributable to increased Same Property Cash NOI from occupied properties and by an increase in Same Property Cash NOI from vacant properties of $11,428.
Reconciliation of Same Property NOI to Total NOI
| | | For The Three Months Ended | | | | | | | |
| | | 9/30/2018 | | | 9/30/2017 | | | Change | | | Change % | |
| | | | | | | | | | | | | |
| Same Property NOI (GAAP) | | $ | 24,320,081 | | | $ | 24,127,404 | | | $ | 192,677 | | | | 0.8 | % |
| | | | | | | | | | | | | | | | | |
| NOI of properties purchased subsequent to June 30, 2017 (seven properties for fiscal 2018 and three properties for fiscal 2017) | | | 4,723,444 | | | | 568,075 | | | | | | | | | |
| | | | | | | | | | | | | | | | | |
| NOI of properties expanded subsequent to June 30, 2017 (two properties for fiscal 2018 and one property for fiscal 2017) | | | 1,130,109 | | | | 1,066,594 | | | | | | | | | |
| NOI of properties sold subsequent to June 30, 2017 (four properties for fiscal 2018) | | | 670 | | | | 284,929 | | | | | | | | | |
| Total NOI | | $ | 30,174,304 | | | $ | 26,047,002 | | | $ | 4,127,302 | | | | 15.8 | % |
| FOURTH QUARTER AND FISCAL YEAR END 2018 SUPPLEMENTAL INFORMATION | 8 |
Same Property Statistics
(unaudited)
| | | For The | | | | | | | |
| | | Twelve Months Ended | | | | | | | |
| | | 9/30/2018 | | | | | | 9/30/2017 | | | Change | | | Change % | |
| | | | | | | | | | | | | | | | |
| Total Square Feet / Total Properties | | | 21,173,581 / 111 | | | | | | | | 18,790,021 / 108 | | | | 2,383,560 | | | | 12.7 | % |
| | | | | | | | | | | | | | | | | | | | | |
| Occupancy Percentage at End of Period | | | 99.6 | % | | | | | | | 99.3 | % | | | 30 bps | | | | 0.3 | % |
| | | | | | | | | | | | | | | | | | | | | |
| Same Property Square Feet / Number of Same Properties | | | | | | | 15,065,707 / 91 | | | | | | | | | | | | | |
| | | | | | | | | | | | | | | | | | | | | |
| Same Property Occupancy Percentage at End of Period | | | 99.5 | % | | | | | | | 99.8 | % | | | (30 bps | ) | | | (0.3 | )% |
| | | | | | | | | | | | | | | | | | | | | |
| Same Property Net Operating Income (NOI) (GAAP) | | $ | 83,566,781 | | | | | | | $ | 83,733,452 | | | $ | (166,671 | ) | | | (0.2 | )% |
| | | | | | | | | | | | | | | | | | | | | |
| Reversal of Effect of Non-cash U.S. GAAP Straight-line Rent Adjustment | | | (967,710 | ) | | | | | | | (1,100,629 | ) | | | 132,919 | | | | | |
| Same Property Cash NOI | | $ | 82,599,071 | | | | | | | $ | 82,632,823 | | | $ | (33,752 | ) | | | 0.0 | % |
Same Property Statistics includes all properties owned during the entire periods presented with the exclusion of properties expanded during the periods presented.
The 0.2% decrease, amounting to $166,671 in Same Property NOI, consists of $44,171 attributable to decreased Same Property NOI from occupied properties and by a decrease in Same Property NOI from vacant properties of $122,500 attributable to a 30 bps decline in Same Property Occupancy Percentage.
The $33,752 decrease in Same Property Cash NOI, consists of $132,509 attributable to increased Same Property Cash NOI from occupied properties offset by a decrease in Same Property Cash NOI from vacant properties of $166,261 attributable to a 30 bps decline in Same Property Occupancy Percentage.
Reconciliation of Same Property NOI to Total NOI
| | | For The
Twelve Months Ended | | | | | | | |
| | | 9/30/2018 | | | 9/30/2017 | | | Change | | | Change % | |
| | | | | | | | | | | | | |
| Same Property NOI (GAAP) | | $ | 83,566,781 | | | $ | 83,733,452 | | | $ | (166,671 | ) | | | (0.2 | )% |
| | | | | | | | | | | | | | | | | |
| NOI of properties purchased subsequent to September 30, 2016 (seven properties for fiscal 2018 and ten properties for fiscal 2017) | | | 26,438,218 | | | | 7,063,623 | | | | | | | | | |
| | | | | | | | | | | | | | | | | |
| NOI of properties expanded subsequent to September 30, 2016 (two properties for fiscal 2018 and one property for fiscal 2017) | | | 4,159,745 | | | | 3,998,426 | | | | | | | | | |
| | | | | | | | | | | | | | | | | |
| NOI of properties sold subsequent to September 30, 2016 (four properties for fiscal 2018 and one property for fiscal 2017) | | | 606,988 | | | | 1,435,248 | | | | | | | | | |
| Total NOI | | $ | 114,771,732 | | | $ | 96,230,749 | | | $ | 18,540,983 | | | | 19.3 | % |
| FOURTH QUARTER AND FISCAL YEAR END 2018 SUPPLEMENTAL INFORMATION | 9 |
Consolidated Statements of Cash Flows
| | | For The | |
| | | Twelve Months Ended | |
| | | 9/30/2018 | | | 9/30/2017 | |
| CASH FLOWS FROM OPERATING ACTIVITIES | | | | | | | | |
| Net Income | | $ | 56,005,800 | | | $ | 40,271,085 | |
| Noncash Items Included in Net Income: | | | | | | | | |
| Depreciation & Amortization | | | 39,788,010 | | | | 32,694,009 | |
| Stock Compensation Expense | | | 433,895 | | | | 624,706 | |
| Deferred Straight Line Rent | | | (1,972,588 | ) | | | (1,027,927 | ) |
| Gain on Sale of Securities Transactions | | | (111,387 | ) | | | (2,311,714 | ) |
| (Gain) Loss on Sale of Real Estate Investments | | | (7,485,266 | ) | | | 95,336 | |
| Changes in: | | | | | | | | |
| Tenant & Other Receivables | | | 1,396,729 | | | | 357,823 | |
| Prepaid Expenses | | | (754,922 | ) | | | (603,887 | ) |
| Other Assets & Capitalized Lease Costs | | | (2,036,854 | ) | | | 15,353 | |
| Accounts Payable, Accrued Expenses & Other Liabilities | | | 265,745 | | | | 3,753,082 | |
| NET CASH PROVIDED BY OPERATING ACTIVITIES | | | 85,529,162 | | | | 73,867,866 | |
| | | | | | | | | |
| CASH FLOWS FROM INVESTING ACTIVITIES | | | | | | | | |
| Purchase of Real Estate & Intangible Assets | | | (283,402,845 | ) | | | (286,951,980 | ) |
| Capital Improvements | | | (9,084,163 | ) | | | (4,974,988 | ) |
| Proceeds from Sale of Real Estate Investments | | | 22,083,340 | | | | 4,125,819 | |
| Return of Deposits on Real Estate | | | 450,000 | | | | 3,400,000 | |
| Deposits Paid on Acquisitions of Real Estate | | | (200,000 | ) | | | (450,000 | ) |
| Proceeds from Sale of Securities Available for Sale | | | 2,620,166 | | | | 17,274,946 | |
| Purchase of Securities Available for Sale | | | (64,979,698 | ) | | | (71,494,810 | ) |
| NET CASH USED IN INVESTING ACTIVITIES | | | (332,513,200 | ) | | | (339,071,013 | ) |
| | | | | | | | | |
| CASH FLOWS FROM FINANCING ACTIVITIES | | | | | | | | |
| Proceeds from Fixed Rate Mortgage Notes Payable | | | 175,160,000 | | | | 188,809,000 | |
| Principal Payments on Fixed Rate Mortgage Notes Payable | | | (54,354,212 | ) | | | (73,594,586 | ) |
| Net Draws on Loans Payable | | | 66,517,259 | | | | 39,300,733 | |
| Financing Costs Paid on Debt | | | (1,469,914 | ) | | | (2,190,098 | ) |
| Redemption of 7.625% Series A Preferred Stock | | | -0- | | | | (53,493,750 | ) |
| Redemption of 7.875% Series B Preferred Stock | | | -0- | | | | (57,500,000 | ) |
| Proceeds from Underwritten Public Offering of 6.125% Series C Preferred Stock, net of offering costs | | | -0- | | | | 71,003,093 | |
| Proceeds from At-The-Market Preferred Equity Program, net of offering costs | | | 40,093,650 | | | | 35,733,885 | |
| Proceeds from Issuance of Common Stock in the DRIP, net of Dividend Reinvestments | | | 77,100,433 | | | | 81,805,937 | |
| Proceeds from the Exercise of Stock Options | | | 569,600 | | | | 469,300 | |
| Preferred Dividends Paid | | | (16,876,532 | ) | | | (14,500,474 | ) |
| Common Dividends Paid, net of Reinvestments | | | (40,657,707 | ) | | | (36,163,355 | ) |
| NET CASH PROVIDED BY FINANCING ACTIVITIES | | | 246,082,577 | | | | 179,679,685 | |
| | | | | | | | | |
| NET DECREASE IN CASH AND CASH EQUIVALENTS | | | (901,461 | ) | | | (85,523,462 | ) |
| CASH AND CASH EQUIVALENTS - BEGINNING OF YEAR | | | 10,226,046 | | | | 95,749,508 | |
| CASH AND CASH EQUIVALENTS - END OF YEAR | | $ | 9,324,585 | | | $ | 10,226,046 | |
| FOURTH QUARTER AND FISCAL YEAR END 2018 SUPPLEMENTAL INFORMATION | 10 |
Capital Structure and Leverage Ratios
(unaudited)
| | | As of | | | As of | |
| | | 9/30/2018 | | | 9/30/2017 | |
| | | | | | | |
| Fixed Rate Mortgage Notes Payable, net of Unamortized Debt Issuance Costs | | $ | 711,545,649 | | | $ | 591,364,371 | |
| Loans Payable | | | 186,608,676 | | | | 120,091,417 | |
| Total Debt | | | 898,154,325 | | | | 711,455,788 | |
| | | | | | | | | |
| 6.125% Series C Cumulative Redeemable Preferred Stock | | | 287,200,025 | | | | 245,986,125 | |
| Common Stock, Paid-In-Capital & Other | | | 510,705,742 | | | | 466,879,571 | |
| Total Shareholders’ Equity | | | 797,905,767 | | | | 712,865,696 | |
| | | | | | | | | |
| Total Book Capitalization | | | 1,696,060,092 | | | | 1,424,321,484 | |
| | | | | | | | | |
| Accumulated Depreciation | | | 207,065,634 | | | | 177,372,518 | |
| Total Undepreciated Book Capitalization | | $ | 1,903,125,726 | | | $ | 1,601,694,002 | |
| | | | | | | | | |
| Shares Outstanding | | | 81,503,134 | | | | 75,630,521 | |
| Market Price Per Share | | $ | 16.72 | | | $ | 16.19 | |
| | | | | | | | | |
| Equity Market Capitalization | | $ | 1,362,732,400 | | | $ | 1,224,458,135 | |
| Total Debt | | | 898,154,325 | | | | 711,455,788 | |
| Total Preferred Stock | | | 287,200,025 | | | | 245,986,125 | |
| Total Market Capitalization | | $ | 2,548,086,750 | | | $ | 2,181,900,048 | |
| | | | | | | | | |
| Total Debt | | $ | 898,154,325 | | | $ | 711,455,788 | |
| less: Cash and Cash Equivalents | | | 9,324,585 | | | | 10,226,046 | |
| Net Debt | | $ | 888,829,740 | | | $ | 701,229,742 | |
| less: Securities Available for Sale at Fair Value (Securities) | | | 154,920,545 | | | | 123,764,770 | |
| Net Debt Less Securities | | $ | 733,909,195 | | | $ | 577,464,972 | |
| | | | | | | | | |
| Net Debt / Total Undepreciated Book Capitalization | | | 46.7 | % | | | 43.8 | % |
| Net Debt / Total Market Capitalization | | | 34.9 | % | | | 32.1 | % |
| Net Debt Plus Preferred Stock / Total Market Capitalization | | | 46.2 | % | | | 43.4 | % |
| Net Debt Less Securities / Total Undepreciated Book Capitalization | | | 38.6 | % | | | 36.1 | % |
| Net Debt Less Securities / Total Market Capitalization | | | 28.8 | % | | | 26.5 | % |
| Net Debt Less Securities Plus Preferred Stock / Total Market Capitalization | | | 40.1 | % | | | 37.7 | % |
| | | | | | | | | |
| Weighted Average Interest Rate on Fixed Rate Debt | | | 4.07 | % | | | 4.18 | % |
| Weighted Average Term on Fixed Rate Debt | | | 11.7 yrs. | | | | 11.6 yrs. | |
| Weighted Average Lease Term | | | 8.1 yrs. | | | | 7.9 yrs. | |
| FOURTH QUARTER AND FISCAL YEAR END 2018 SUPPLEMENTAL INFORMATION | 11 |
Capital Structure and Leverage Ratios
(unaudited)
| | | For The Three Months Ended | | | For The Twelve Months Ended | |
| | | 9/30/2018 | | | 9/30/2017 | | | 9/30/2018 | | | 9/30/2017 | |
| Net Income | | $ | 12,159,623 | | | $ | 10,262,190 | | | $ | 56,005,800 | | | $ | 40,271,085 | |
| Plus: Interest Expense, including Amortization of Financing Costs | | | 8,709,149 | | | | 6,918,257 | | | | 32,349,705 | | | | 25,754,121 | |
| Plus: Depreciation and Amortization | | | 10,321,798 | | | | 8,682,543 | | | | 38,567,027 | | | | 31,459,749 | |
| Less: (Gain) / Plus: Loss on Sale of Real Estate Investments | | | -0- | | | | -0- | | | | (7,485,266 | ) | | | 95,336 | |
| EBITDAre | | | 31,190,570 | | | | 25,862,990 | | | | 119,437,266 | | | | 97,580,291 | |
| Plus: Acquisition Costs | | | -0- | | | | -0- | | | | -0- | | | | 178,526 | |
| Plus: Net Amortization of Acquired Above and Below Market Lease Revenue | | | 25,677 | | | | 25,492 | | | | 102,708 | | | | 101,968 | |
| Less: Gain on Sale of Securities Transactions | | | -0- | | | | (17,770 | ) | | | (111,387 | ) | | | (2,311,714 | ) |
| Adjusted EBITDA | | $ | 31,216,247 | | | $ | 25,870,712 | | | $ | 119,428,587 | | | $ | 95,549,071 | |
| | | | | | | | | | | | | | | | | |
| Interest Expense, including Amortization of Financing Costs | | $ | 8,709,149 | | | $ | 6,918,257 | | | $ | 32,349,705 | | | $ | 25,754,121 | |
| Preferred Dividends | | | 4,377,262 | | | | 3,536,103 | | | | 17,190,456 | | | | 14,861,686 | |
| Total Fixed Charges | | $ | 13,086,411 | | | $ | 10,454,360 | | | $ | 49,540,161 | | | $ | 40,615,807 | |
| | | | | | | | | | | | | | | | | |
| Interest Coverage | | | 3.6 x | | | | 3.7 x | | | | 3.7 x | | | | 3.7 x | |
| Fixed Charge Coverage | | | 2.4 x | | | | 2.5 x | | | | 2.4 x | | | | 2.4 x | |
| | | | | | | | | | | | | | | | | |
| Net Debt | | $ | 888,829,740 | | | $ | 701,229,742 | | | $ | 888,829,740 | | | $ | 701,229,742 | |
| Net Debt Less Securities | | | 733,909,195 | | | | 577,464,972 | | | | 733,909,195 | | | | 577,464,972 | |
| Total Preferred Stock | | | 287,200,025 | | | | 245,986,125 | | | | 287,200,025 | | | | 245,986,125 | |
| Annualized Adjusted EBITDA | | | 124,864,988 | | | | 103,482,848 | | | | 119,428,587 | | | | 95,549,071 | |
| | | | | | | | | | | | | | | | | |
| Net Debt / Adjusted EBITDA | | | 7.1 x | | | | 6.8 x | | | | 7.4 x | | | | 7.3 x | |
| Net Debt Less Securities / Adjusted EBITDA | | | 5.9 x | | | | 5.6 x | | | | 6.1 x | | | | 6.0 x | |
| Net Debt + Preferred Stock / Adjusted EBITDA | | | 9.4 x | | | | 9.2 x | | | | 9.8 x | | | | 9.9 x | |
| Net Debt Less Securities + Preferred Stock / Adjusted EBITDA | | | 8.2 x | | | | 8.0 x | | | | 8.5 x | | | | 8.6 x | |
| FOURTH QUARTER AND FISCAL YEAR END 2018 SUPPLEMENTAL INFORMATION | 12 |
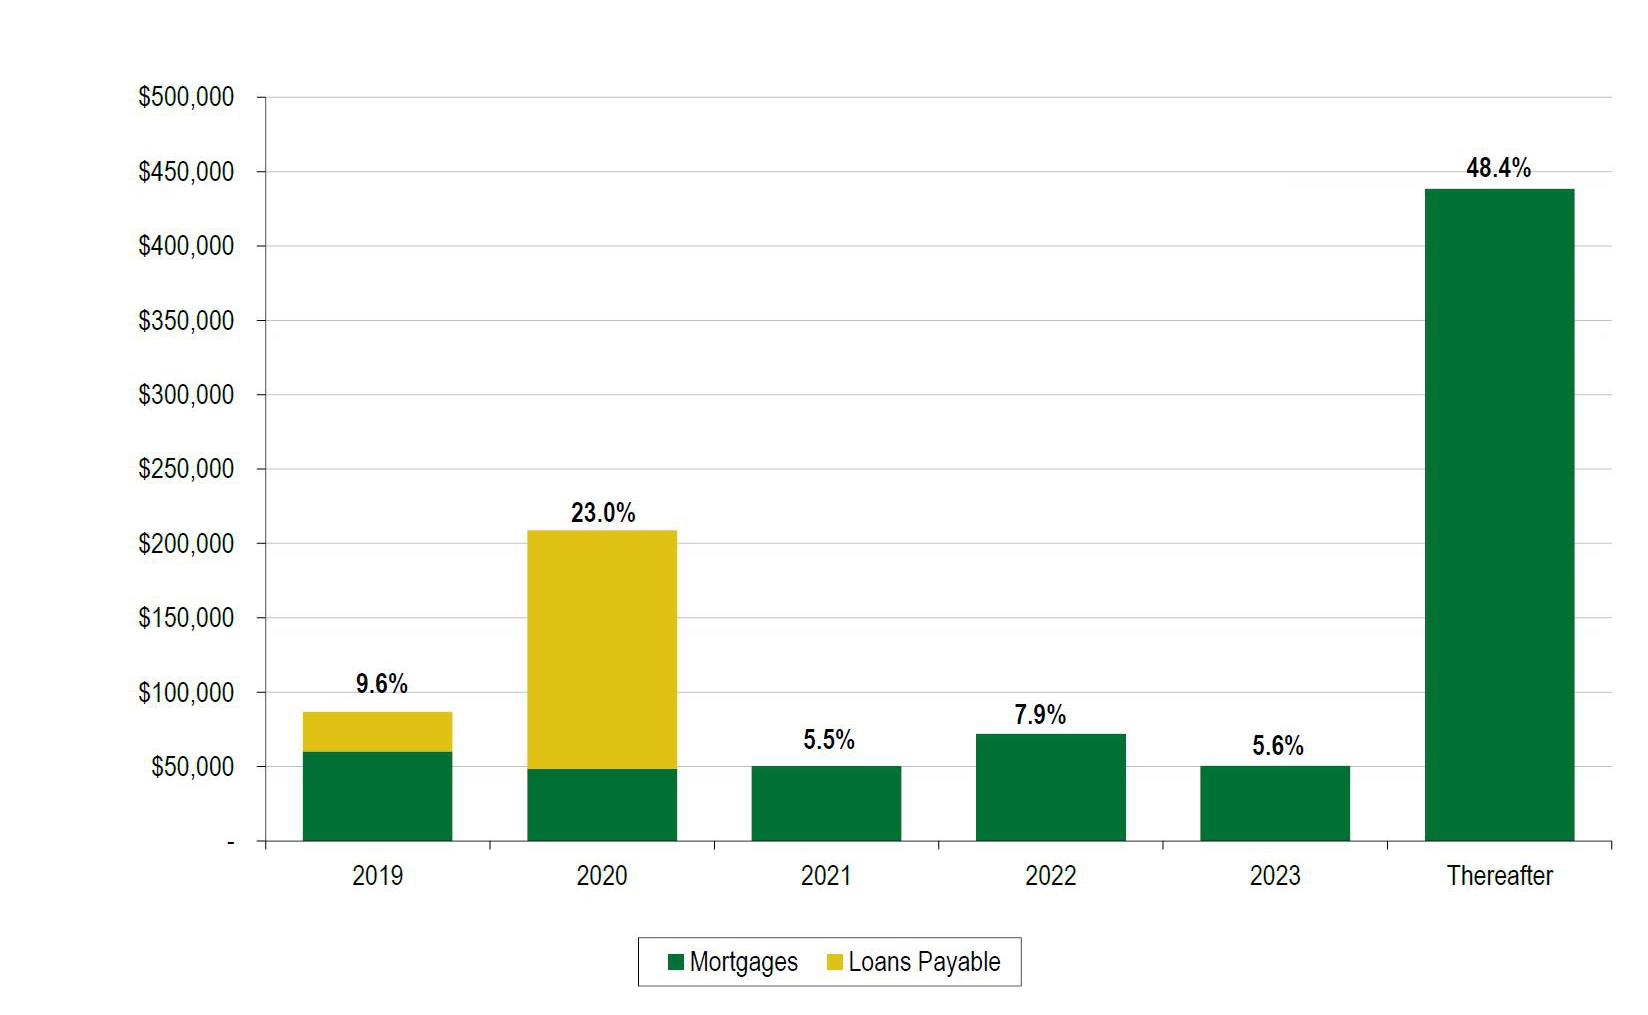
Debt Maturity
(Unaudited)
| | | | | | | | Loans | | | | | | | % of | |
| Fiscal Year Ended | | | | Mortgages | | | Payable | | | | Total | | | Total | |
| | | | | | | | | | | | | | | | |
| 2019 | | | | $ | 60,151,223 | | | $ | 26,608,676 | | (B) | | $ | 86,759,899 | | | | 9.6 | % |
| 2020 | | | | | 48,605,542 | | | | 160,000,000 | | (C) | | | 208,605,542 | | | | 23.0 | % |
| 2021 | | | | | 50,098,257 | | | | -0- | | | | | 50,098,257 | | | | 5.5 | % |
| 2022 | | | | | 72,031,353 | | | | -0- | | | | | 72,031,353 | | | | 7.9 | % |
| 2023 | | | | | 50,522,349 | | | | -0- | | | | | 50,522,349 | | | | 5.6 | % |
| Thereafter | | | | | 438,359,631 | | | | -0- | | | | | 438,359,631 | | | | 48.4 | % |
| | | | | | | | | | | | | | | | | | | | |
| Total as of 9/30/2018 | | (A) | | $ | 719,768,355 | | | $ | 186,608,676 | | | | $ | 906,377,031 | | | | 100.0 | % |
| | | | | | | | | | | | | | | | | | | | |
| Weighted Average Interest Rate | | | | | 4.07 | % | | | 3.74 | % | | | | 4.00 | % | | | | |
| Weighted Average Term | | | | | 11.7 yrs. | | | | 1.7 yrs. | | | | | 9.6 yrs. | | | | | |
| | (A) | Mortgages does not include unamortized debt issuance costs of $8,222,706. |
| | (B) | Represents margin debt which is due upon demand. Subsequent to fiscal yearend, margin debt was paid off. |
| | (C) | Represents the amount drawn down on a line of credit that has a one year extension option, which is not reflected above. Subsequent to fiscal yearend, $50,000,000 was paid down, which reduced our amount outstanding to $110,000,000. |
| FOURTH QUARTER AND FISCAL YEAR END 2018 SUPPLEMENTAL INFORMATION | 13 |
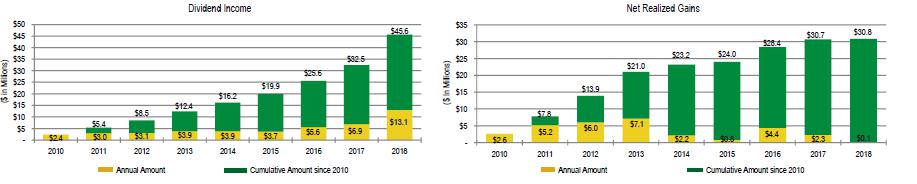
Securities Portfolio Historic Performance (Fiscal Year)
(unaudited)
Fiscal
Year | | | Securities
Portfolio
Cost(A) | | | Securities
Available
for Sale(A) | | | Dividend
Income | | | Net Realized
Gain on
Sale of
Securities | | | Change in
Unrealized
Gain/
(Loss)(B) | | | Total
Return | | | Total
Return % | |
| | | | | | | | | | | | | | | | | | | | | | | | | | | | | | |
| 2010 | | | $ | 24,027,834 | | | $ | 27,824,665 | | | $ | 2,387,757 | | | $ | 2,609,149 | | | $ | 6,319,226 | | | $ | 11,316,132 | | | | 47.10 | % |
| 2011 | | | | 32,401,668 | | | | 42,517,725 | | | | 2,981,534 | | | | 5,238,203 | | | | (7,747,894 | ) | | | 471,843 | | | | 1.46 | % |
| 2012 | | | | 41,896,896 | | | | 44,265,059 | | | | 3,144,837 | | | | 6,044,065 | | | | 3,015,774 | | | | 12,204,676 | | | | 29.13 | % |
| 2013 | | | | 56,301,236 | | | | 61,685,173 | | | | 3,861,374 | | | | 7,133,252 | | | | (3,394,669 | ) | | | 7,599,957 | | | | 13.50 | % |
| 2014 | | | | 43,462,472 | | | | 45,451,740 | | | | 3,863,136 | | | | 2,166,766 | | | | (1,867,912 | ) | | | 4,161,990 | | | | 9.58 | % |
| 2015 | | | | 59,190,047 | | | | 59,311,403 | | | | 3,707,498 | | | | 805,513 | | | | (5,562,959 | ) | | | (1,049,948 | ) | | | (1.77 | )% |
| 2016 | | | | 59,982,840 | | | | 54,541,237 | | | | 5,607,403 | | | | 4,398,599 | | | | 18,383,870 | | | | 28,389,872 | | | | 47.33 | % |
| 2017 | | | | 60,662,627 | | | | 73,604,894 | | | | 6,919,973 | | | | 2,311,714 | | | | (6,371,702 | ) | | | 2,859,985 | | | | 4.71 | % |
| 2018 | | | | 117,194,205 | | | | 123,764,770 | | | | 13,099,316 | | | | 111,387 | | | | (31,315,144 | ) | | | (18,104,441 | ) | | | (15.45 | )% |
| | | | | | | | | | | | | | | | | | | | | | | | | | | | | | |
| Total | | | | | | | | | | | $ | 45,572,828 | | | $ | 30,818,648 | | | $ | (28,541,410 | ) | | $ | 47,850,066 | | | | Avg. 15.07 | % |
| | (A) | Fiscal Year beginning balance |
| | (B) | Fiscal Year end balance |
| FOURTH QUARTER AND FISCAL YEAR END 2018 SUPPLEMENTAL INFORMATION | 14 |
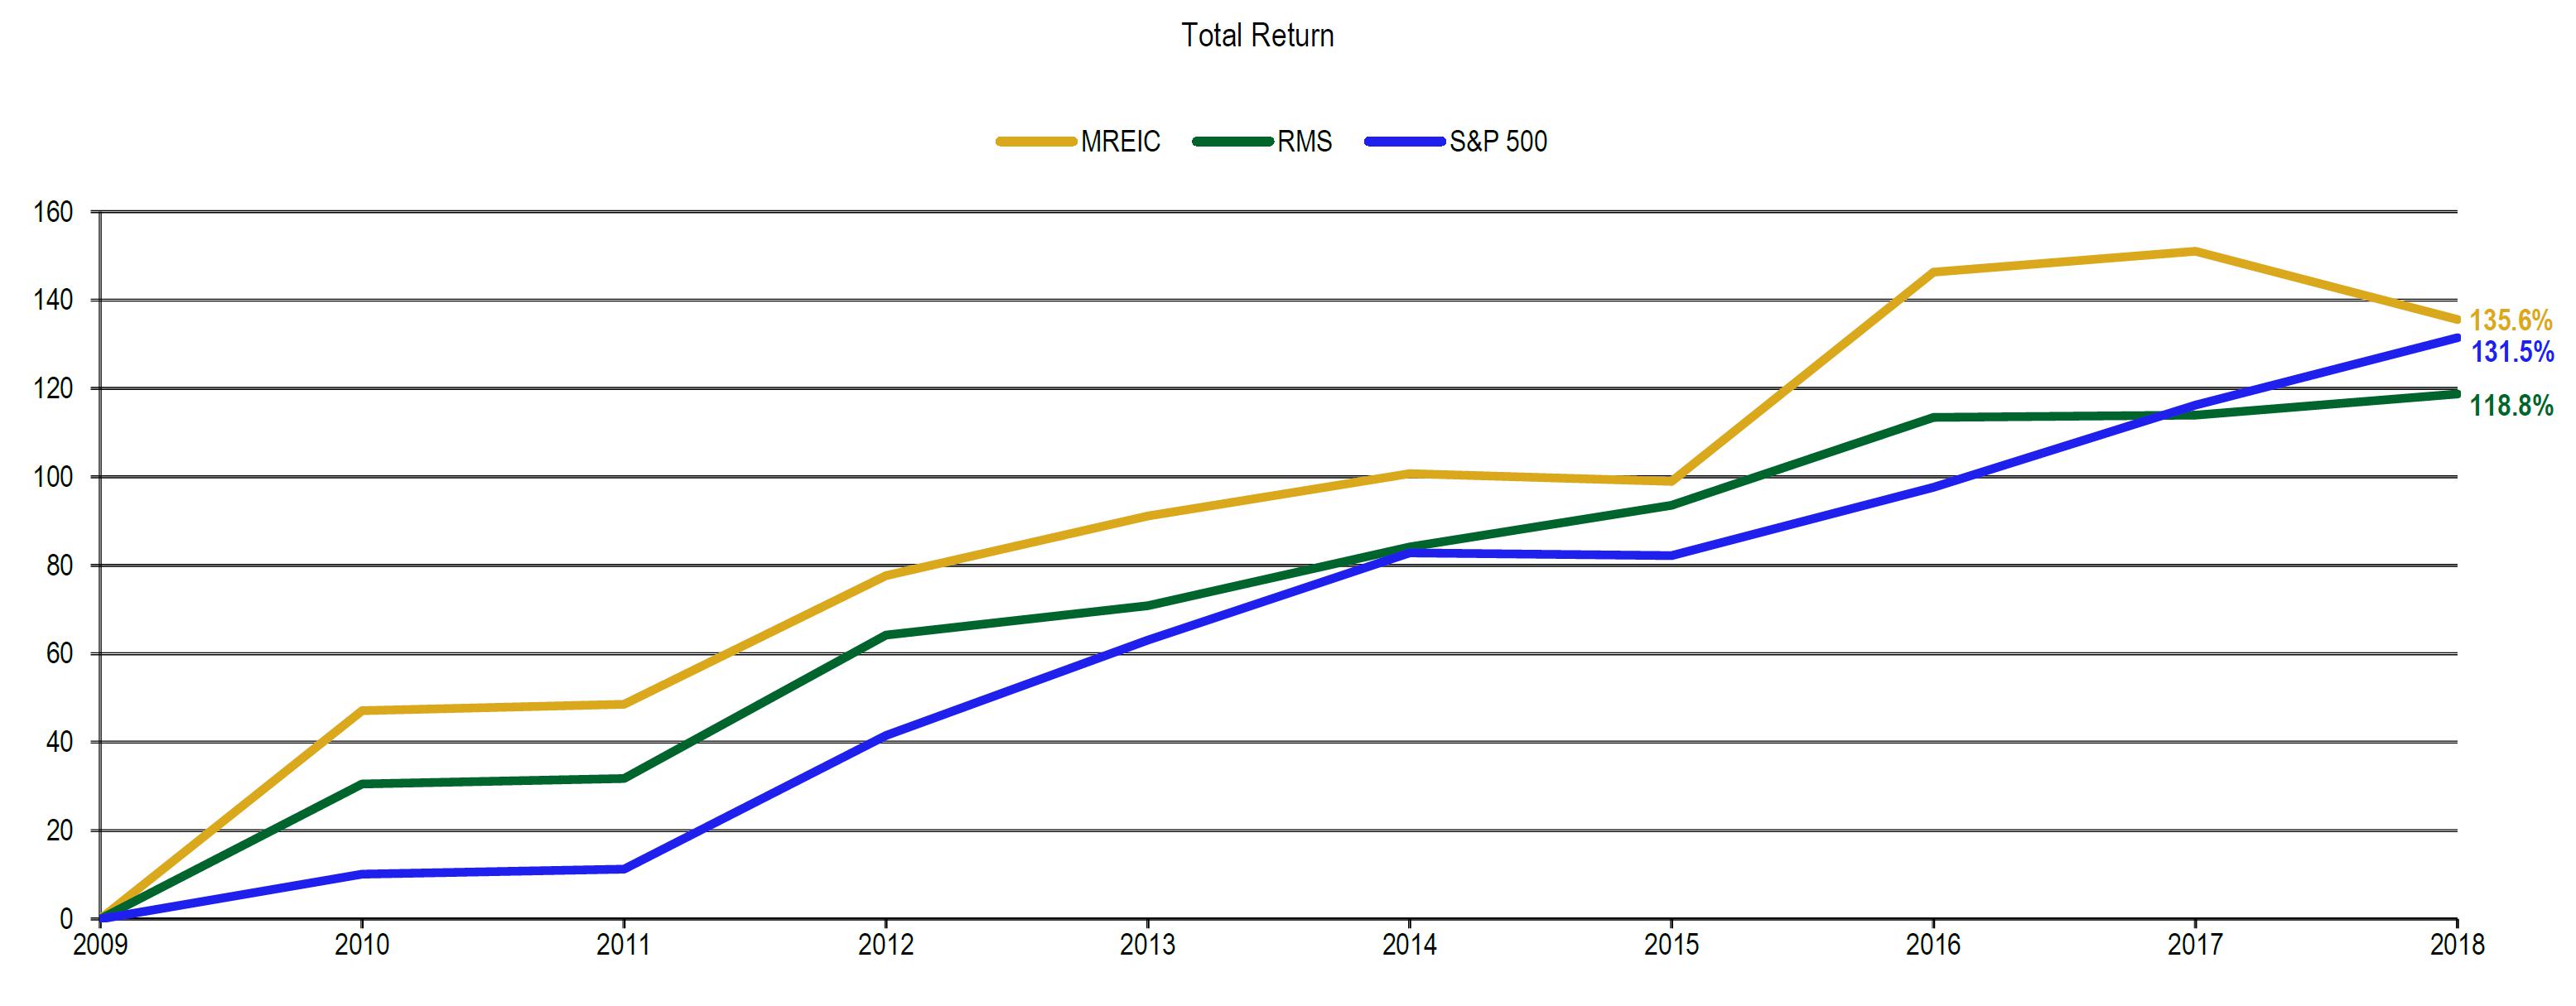
Securities Portfolio Historic Performance (Fiscal Year)
(unaudited)
| FISCAL YEAR | | | MREIC REIT Portfolio (%) | | | MSCI REIT Index (RMS)(%) | | | S&P 500 Index (%) | | | MREIC vs. MSCI REIT Index (RMS) Outperformance in BPS ∆ | | | MREIC vs. S&P 500 Index Outperformance in BPS ∆ | |
| | | | | | | | | | | | | | | | | |
| 2010 | | | | 47.10 | | | | 30.54 | | | | 10.16 | | | | 1656 | | | | 3694 | |
| 2011 | | | | 1.46 | | | | 1.26 | | | | 1.14 | | | | 20 | | | | 32 | |
| 2012 | | | | 29.13 | | | | 32.44 | | | | 30.20 | | | | (331 | ) | | | (107 | ) |
| 2013 | | | | 13.50 | | | | 6.63 | | | | 21.59 | | | | 687 | | | | (809 | ) |
| 2014 | | | | 9.58 | | | | 13.26 | | | | 19.73 | | | | (368 | ) | | | (1015 | ) |
| 2015 | | | | (1.77 | ) | | | 9.47 | | | | (0.61 | ) | | | (1124 | ) | | | (116 | ) |
| 2016 | | | | 47.33 | | | | 19.83 | | | | 15.43 | | | | 2750 | | | | 3190 | |
| 2017 | | | | 4.71 | | | | 0.54 | | | | 18.61 | | | | 417 | | | | (1390 | ) |
| 2018 | | | | (15.45 | ) | | | 4.78 | | | | 15.22 | | | | (2023 | ) | | | (3067 | ) |
| Average | | | | 15.07 | | | | 13.19 | | | | 14.61 | | | | 187 | | | | 46 | |
Source: SNL Financial
| FOURTH QUARTER AND FISCAL YEAR END 2018 SUPPLEMENTAL INFORMATION | 15 |
Property Table by Tenant
(unaudited)
| | | | | Property | | | Square | | | Occupied Square | | | % of Occupied | | | Annual | | | % of Total
Ann. | | | Rent Per
sf | | | Undepreciated | | | | Mortgage | |
| Tenant | | | | Count | | | Footage | | | Footage | | | sf | | | Rent | | | Rent | | | Occup. | | | Cost | | | | Balance | |
| | | | | | | | | | | | | | | | | | | | | | | | | | | | | | | |
| FedEx Ground Package System, Inc. | | | | | 44 | | | | 8,538,404 | | | | 8,538,404 | | | | 40.3 | % | | $ | 65,499,000 | | | | 51.7 | % | | $ | 7.67 | | | $ | 914,674,060 | | | | $ | 413,130,189 | |
| FedEx Corporation | | | | | 16 | | | | 1,544,996 | | | | 1,544,996 | | | | 7.3 | % | | | 8,100,000 | | | | 6.3 | % | | | 5.24 | | | | 109,379,980 | | | | | 18,744,507 | |
| Total FedEx | | | | | 60 | | | | 10,083,400 | | | | 10,083,400 | | | | 47.6 | % | | | 73,599,000 | | | | 58.0 | % | | | 7.30 | | | | 1,024,054,040 | | | | | 431,874,696 | |
| | | | | | | | | | | | | | | | | | | | | | | | | | | | | | | | | | | | | | | | |
| Milwaukee Electric Tool Corporation | | | | | 1 | | | | 861,889 | | | | 861,889 | | | | 4.2 | % | | | 3,032,000 | | | | 2.4 | % | | | 3.52 | | | | 36,914,917 | | | | | 21,722,567 | |
| Shaw Industries, Inc. | | | | | 1 | | | | 831,764 | | | | 831,764 | | | | 3.9 | % | | | 3,551,000 | | | | 2.8 | % | | | 4.27 | | | | 56,025,945 | | | | | 32,215,696 | |
| ULTA, Inc. | | | | | 1 | | | | 671,354 | | | | 671,354 | | | | 3.3 | % | | | 2,702,000 | | | | 2.1 | % | | | 4.02 | | | | 37,512,071 | | | | | 20,159,025 | |
| Amazon.com Services, Inc. (Amazon.com, Inc.) | | | | | 2 | | | | 662,942 | | | | 662,942 | | | | 3.1 | % | | | 3,904,000 | | | | 3.1 | % | | | 5.89 | | | | 62,931,258 | | | | | 37,845,988 | |
| Jim Beam Brands Company (Beam Suntory) | | | | | 1 | | | | 599,840 | | | | 599,840 | | | | 2.8 | % | | | 2,051,000 | | | | 1.6 | % | | | 3.42 | | | | 28,000,000 | | | | | 16,639,132 | |
| International Paper Company | | | | | 2 | | | | 578,472 | | | | 578,472 | | | | 2.7 | % | | | 2,592,000 | | | | 2.0 | % | | | 4.48 | | | | 36,175,715 | | | | | 20,662,730 | |
| TreeHouse Private Brands, Inc. | | | | | 1 | | | | 558,600 | | | | 558,600 | | | | 2.6 | % | | | 2,206,000 | | | | 1.7 | % | | | 3.95 | | | | 26,807,852 | | | | | 15,305,669 | |
| B. Braun Medical Inc. | | | | | 1 | | | | 399,440 | | | | 399,440 | | | | 1.9 | % | | | 2,130,000 | | | | 1.7 | % | | | 5.33 | | | | 29,973,199 | | | | | 19,187,819 | |
| CBOCS Distribution, Inc. (Cracker Barrel) | | | | | 1 | | | | 381,240 | | | | 381,240 | | | | 1.8 | % | | | 1,447,000 | | | | 1.1 | % | | | 3.80 | | | | 14,215,126 | | | | | 7,217,469 | |
| Best Buy Warehousing Logistics, Inc. | | | | | 1 | | | | 368,060 | | | | 368,060 | | | | 1.7 | % | | | 1,676,000 | | | | 1.3 | % | | | 4.55 | | | | 19,600,000 | | | | | 9,300,481 | |
| Coca-Cola | | | | | 2 | | | | 323,358 | | | | 323,358 | | | | 1.5 | % | | | 1,693,000 | | | | 1.3 | % | | | 5.24 | | | | 20,504,069 | | | | | 4,580,073 | |
| Autoneum North America, Inc. | | | | | 1 | | | | 315,560 | | | | 315,560 | | | | 1.5 | % | | | 1,703,000 | | | | 1.3 | % | | | 5.40 | | | | 21,040,395 | | | | | 14,471,117 | |
| Science Applications International Corporation | | | | | 1 | | | | 302,400 | | | | 302,400 | | | | 1.4 | % | | | 1,491,000 | | | | 1.2 | % | | | 4.93 | | | | 13,410,102 | | | | | -0- | |
| United Technologies Corporation | | | | | 3 | | | | 283,150 | | | | 283,150 | | | | 1.3 | % | | | 1,929,000 | | | | 1.5 | % | | | 6.81 | | | | 27,687,512 | | | | | 6,455,552 | |
| Bunzl USA Holdings, Inc. | | | | | 2 | | | | 268,778 | | | | 268,778 | | | | 1.3 | % | | | 1,474,000 | | | | 1.2 | % | | | 5.48 | | | | 18,708,688 | | | | | 12,170,963 | |
| Woodstream Corporation | | (A) | | | 1 | | | | 256,000 | | | | 256,000 | | | | 1.2 | % | | | 914,000 | | | | 0.7 | % | | | 3.57 | | | | 8,935,160 | | | | | -0- | |
| Anda Pharmaceuticals, Inc. | | | | | 1 | | | | 234,660 | | | | 234,660 | | | | 1.1 | % | | | 1,205,000 | | | | 1.0 | % | | | 5.14 | | | | 14,550,000 | | | | | 7,564,186 | |
| UGN, Inc. | | | | | 1 | | | | 232,200 | | | | 232,200 | | | | 1.1 | % | | | 1,070,000 | | | | 0.8 | % | | | 4.61 | | | | 17,524,760 | | | | | 7,126,384 | |
| Mickey Thompson Performance Tires and Wheels (Cooper Tire) | | | | | 1 | | | | 219,765 | | | | 219,765 | | | | 1.0 | % | | | 1,501,000 | | | | 1.2 | % | | | 6.83 | | | | 18,934,065 | | | | | 12,130,343 | |
| Rinnai America Corporation | | | | | 1 | | | | 218,120 | | | | 218,120 | | | | 1.0 | % | | | 831,000 | | | | 0.7 | % | | | 3.81 | | | | 14,933,683 | | | | | -0- | |
| Anheuser-Busch, Inc. | | | | | 1 | | | | 184,800 | | | | 184,800 | | | | 0.9 | % | | | 821,000 | | | | 0.6 | % | | | 4.44 | | | | 12,697,848 | | | | | -0- | |
| Carlisle Tire & Wheel Company | | | | | 1 | | | | 179,280 | | | | 179,280 | | | | 0.8 | % | | | 739,000 | | | | 0.6 | % | | | 4.12 | | | | 7,232,986 | | | | | -0- | |
| NF&M International, Inc. | | (B) | | | 1 | | | | 174,802 | | | | 174,802 | | | | 0.8 | % | | | 835,000 | | | | 0.7 | % | | | 4.78 | | | | 5,408,790 | | | | | -0- | |
| Home Depot USA, Inc. | | | | | 1 | | | | 171,200 | | | | 171,200 | | | | 0.8 | % | | | 997,000 | | | | 0.8 | % | | | 5.82 | | | | 11,303,317 | | | | | -0- | |
| Victory Packaging, L.P. | | | | | 1 | | | | 148,000 | | | | 148,000 | | | | 0.7 | % | | | 502,000 | | | | 0.4 | % | | | 3.39 | | | | 5,451,629 | | | | | -0- | |
| Challenger Lifts, Inc. (Snap-On Inc.) | | | | | 1 | | | | 137,500 | | | | 137,500 | | | | 0.6 | % | | | 838,000 | | | | 0.7 | % | | | 6.09 | | | | 11,304,000 | | | | | 6,525,135 | |
| Altec Industries, Inc. | | (A) | | | 1 | | | | 126,880 | | | | 126,880 | | | | 0.6 | % | | | 371,000 | | | | 0.3 | % | | | 2.92 | | | | 4,428,488 | | | | | -0- | |
| General Electric Company | | | | | 1 | | | | 125,860 | | | | 125,860 | | | | 0.6 | % | | | 1,321,000 | | | | 1.0 | % | | | 10.50 | | | | 19,950,000 | | | | | 11,199,661 | |
| The American Bottling Company (Keurig Dr Pepper) | | | | | 2 | | | | 110,080 | | | | 110,080 | | | | 0.5 | % | | | 743,000 | | | | 0.6 | % | | | 6.75 | | | | 10,498,031 | | | | | 1,685,288 | |
| Style Crest, Inc. | | | | | 1 | | | | 106,507 | | | | 106,507 | | | | 0.5 | % | | | 387,000 | | | | 0.3 | % | | | 3.63 | | | | 7,246,325 | | | | | -0- | |
| Pittsburgh Glass Works, LLC | | | | | 1 | | | | 102,135 | | | | 102,135 | | | | 0.5 | % | | | 442,000 | | | | 0.3 | % | | | 4.33 | | | | 4,245,913 | | | | | -0- | |
| Holland 1916 Inc. | | | | | 1 | | | | 95,898 | | | | 95,898 | | | | 0.5 | % | | | 349,000 | | | | 0.3 | % | | | 3.64 | | | | 7,397,881 | | | | | -0- | |
| National Oilwell Varco, Inc. | | | | | 1 | | | | 91,295 | | | | 91,295 | | | | 0.4 | % | | | 754,000 | | | | 0.6 | % | | | 8.26 | | | | 8,163,278 | | | | | 2,148,201 | |
| Joseph T. Ryerson and Son, Inc. | | | | | 1 | | | | 89,052 | | | | 89,052 | | | | 0.4 | % | | | 506,000 | | | | 0.4 | % | | | 5.68 | | | | 6,977,442 | | | | | -0- | |
| CHEP USA, Inc. | | | | | 1 | | | | 83,000 | | | | 83,000 | | | | 0.4 | % | | | 500,000 | | | | 0.4 | % | | | 6.02 | | | | 7,463,672 | | | | | -0- | |
| Sherwin-Williams Company | | | | | 2 | | | | 78,887 | | | | 78,887 | | | | 0.4 | % | | | 643,000 | | | | 0.5 | % | | | 8.15 | | | | 7,244,128 | | | | | -0- | |
| RGH Enterprises, Inc. (Cardinal Health) | | | | | 1 | | | | 75,000 | | | | 75,000 | | | | 0.4 | % | | | 607,000 | | | | 0.5 | % | | | 8.09 | | | | 5,525,600 | | | | | -0- | |
| Tampa Bay Grand Prix | | | | | 1 | | | | 68,385 | | | | 68,385 | | | | 0.3 | % | | | 297,000 | | | | 0.2 | % | | | 4.34 | | | | 5,677,982 | | | | | -0- | |
| Various Tenants at Retail Shopping Center | | | | | 1 | | | | 64,220 | | | | 64,220 | | | | 0.3 | % | | | 807,000 | | | | 0.6 | % | | | 12.57 | | | | 3,111,777 | | | | | -0- | |
| SOFIVE, Inc. | | | | | 1 | | | | 60,400 | | | | 60,400 | | | | 0.3 | % | | | 558,000 | | | | 0.4 | % | | | 9.24 | | | | 4,942,402 | | | | | 1,580,180 | |
| Kellogg Sales Company | | | | | 1 | | | | 54,812 | | | | 54,812 | | | | 0.3 | % | | | 329,000 | | | | 0.3 | % | | | 6.00 | | | | 3,494,108 | | | | | -0- | |
| Siemens Real Estate | | | | | 1 | | | | 51,130 | | | | 51,130 | | | | 0.2 | % | | | 464,000 | | | | 0.4 | % | | | 9.07 | | | | 4,452,425 | | | | | -0- | |
| Foundation Building Materials, LLC | | | | | 1 | | | | 36,270 | | | | 36,270 | | | | 0.2 | % | | | 172,000 | | | | 0.2 | % | | | 4.74 | | | | 2,523,644 | | | | | -0- | |
| Graybar Electric Company | | | | | 1 | | | | 26,340 | | | | 26,340 | | | | 0.2 | % | | | 109,000 | | | | 0.2 | % | | | 4.14 | | | | 1,885,254 | | | | | -0- | |
| Tenant Total as of 9/30/18 | | | | | 111 | | | | 21,092,725 | | | | 21,092,725 | | | | 99.6 | % | | $ | 126,792,000 | | | | 100.0 | % | | $ | 6.01 | | | $ | 1,717,065,477 | | (C) | | | $719,768,355 | |
| | | | | | | | | | | | | | | | | | | | | | | | | | | | | | | | | | | | | | | | |
| Vacant | | (B) | | | 1 | | | | 80,856 | | | | -0- | | | | 0.0 | % | | | -0- | | | | 0.0 | % | | | -0- | | | | 2,501,877 | | | | | -0- | |
| Total as of 9/30/18 | | | | | 111 | | | | 21,173,581 | | | | 21,092,725 | | | | 99.6 | % | | $ | 126,792,000 | | | | 100.0 | % | | $ | 6.01 | | | $ | 1,719,567,354 | | | | $ | 719,768,355 | |
| | | | | | | | | | | | | | | | | | | | | | | | | | | | | | | | | | | | | | | | |
| Acquisitions Subsequent to 9/30/18 | | | | | | | | | | | | | | | | | | | | | | | | | | | | | | | | | | | | | | | |
| FedEx Ground Package System, Inc. | | | | | 1 | | | | 347,145 | | | | 347,145 | | | | 1.6 | % | | | 5,328,000 | | | | 4.0 | % | | | 15.35 | | | | | | | | | | |
| Pro Forma Total with Acquisitons Subsequent to 9/30/18 | | | | | 112 | | | | 21,520,726 | | | | 21,439,870 | | | | 99.6 | % | | $ | 132,120,000 | | | | 100.0 | % | | $ | 6.16 | | | | | | | | | | |
| (A) | Woodstream Corporation and Altec Industries, Inc. are located at one property and therefore are counted as one property in the Property Count total. |
| (B) | NF&M International is located in a 255,658 square foot Industrial Park in Monaca (Pittsburgh), PA, of which 80,856 square feet is vacant. This Industrial Park is counted as one property in the Property Count total. |
| | Other than the two properties indicated in footnotes (A) and (B) and the one retail property, all other properties are single-tenant. |
| (C) | Does not include unamortized debt issuance costs of $8,222,706. |
| FOURTH QUARTER AND FISCAL YEAR END 2018 SUPPLEMENTAL INFORMATION | 16 |
Property Table by State
(unaudited)
| | | Property | | | Square | | | Occupied Square | | | % of Total | | | Annual | | | % of Total | | | Rent Per | | | Undepreciated | | | | Mortgage | |
| State | | Count | | | Footage | | | Footage | | | sf | | | Rent | | | Ann. Rent | | | sf Occup. | | | Cost | | | | Balance | |
| Florida | | | 13 | | | | 2,211,583 | | | | 2,211,583 | | | | 10.4 | % | | $ | 15,711,000 | | | | 12.4 | % | | $ | 7.10 | | | $ | 226,738,000 | | | | $ | 100,873,289 | |
| Texas | | | 10 | | | | 1,781,967 | | | | 1,781,967 | | | | 8.4 | % | | | 13,825,000 | | | | 10.9 | % | | | 7.76 | | | | 182,253,655 | | | | | 78,083,742 | |
| Ohio | | | 9 | | | | 1,550,706 | | | | 1,550,706 | | | | 7.3 | % | | | 8,908,000 | | | | 7.0 | % | | | 5.74 | | | | 114,243,557 | | | | | 40,030,595 | |
| Georgia | | | 5 | | | | 1,513,176 | | | | 1,513,176 | | | | 7.1 | % | | | 8,805,000 | | | | 6.9 | % | | | 5.82 | | | | 138,527,838 | | | | | 72,254,485 | |
| Kentucky | | | 3 | | | | 1,295,940 | | | | 1,295,940 | | | | 6.1 | % | | | 5,095,000 | | | | 4.0 | % | | | 3.93 | | | | 66,111,852 | | | | | 38,469,936 | |
| South Carolina | | | 6 | | | | 1,273,676 | | | | 1,273,676 | | | | 6.0 | % | | | 9,478,000 | | | | 7.5 | % | | | 7.44 | | | | 127,234,979 | | | | | 59,204,763 | |
| Mississippi | | | 4 | | | | 1,158,889 | | | | 1,158,889 | | | | 5.8 | % | | | 4,466,000 | | | | 3.5 | % | | | 3.85 | | | | 55,250,862 | | | | | 29,286,753 | |
| Indiana | | | 2 | | | | 999,176 | | | | 999,176 | | | | 4.8 | % | | | 4,417,000 | | | | 3.5 | % | | | 4.42 | | | | 63,016,154 | | | | | 30,596,176 | |
| Illinois | | | 9 | | | | 958,045 | | | | 958,045 | | | | 4.5 | % | | | 6,117,000 | | | | 4.8 | % | | | 6.38 | | | | 82,688,099 | | | | | 8,563,797 | |
| North Carolina | | | 4 | | | | 939,706 | | | | 939,706 | | | | 4.4 | % | | | 5,663,000 | | | | 4.5 | % | | | 6.03 | | | | 85,785,896 | | | | | 42,676,806 | |
| Tennessee | | | 3 | | | | 891,777 | | | | 891,777 | | | | 4.2 | % | | | 3,150,000 | | | | 2.5 | % | | | 3.47 | | | | 33,968,652 | | | | | 12,278,845 | |
| Michigan | | | 4 | | | | 833,054 | | | | 833,054 | | | | 3.9 | % | | | 5,574,000 | | | | 4.4 | % | | | 6.69 | | | | 73,039,812 | | | | | 25,763,057 | |
| Kansas | | | 4 | | | | 813,043 | | | | 813,043 | | | | 3.8 | % | | | 4,619,000 | | | | 3.6 | % | | | 5.68 | | | | 60,943,937 | | | | | 30,006,574 | |
| Missouri | | | 4 | | | | 739,330 | | | | 739,330 | | | | 3.5 | % | | | 2,828,000 | | | | 2.2 | % | | | 3.83 | | | | 34,987,692 | | | | | 6,633,001 | |
| Oklahoma | | | 4 | | | | 614,941 | | | | 614,941 | | | | 2.9 | % | | | 3,916,000 | | | | 3.1 | % | | | 6.37 | | | | 54,939,874 | | | | | 29,652,940 | |
| New York | | | 3 | | | | 518,565 | | | | 518,565 | | | | 2.4 | % | | | 3,886,000 | | | | 3.1 | % | | | 7.49 | | | | 51,336,423 | | | | | 21,328,714 | |
| Pennsylvania | | | 3 | | | | 504,040 | | | | 423,184 | | | | 2.4 | % | | | 2,807,000 | | | | 2.2 | % | | | 6.63 | | | | 36,883,632 | | | | | 14,452,942 | |
| Alabama | | | 2 | | | | 451,595 | | | | 451,595 | | | | 2.1 | % | | | 2,625,000 | | | | 2.1 | % | | | 5.81 | | | | 39,714,135 | | | | | 19,203,298 | |
| Virginia | | | 5 | | | | 407,265 | | | | 407,265 | | | | 1.9 | % | | | 2,449,000 | | | | 1.9 | % | | | 6.01 | | | | 34,680,077 | | | | | 4,395,246 | |
| Colorado | | | 2 | | | | 295,227 | | | | 295,227 | | | | 1.4 | % | | | 2,437,000 | | | | 1.9 | % | | | 8.25 | | | | 35,674,117 | | | | | 17,065,759 | |
| Arizona | | | 1 | | | | 283,358 | | | | 283,358 | | | | 1.3 | % | | | 1,361,000 | | | | 1.1 | % | | | 4.80 | | | | 16,824,226 | | | | | 3,719,709 | |
| Wisconsin | | | 2 | | | | 238,666 | | | | 238,666 | | | | 1.1 | % | | | 1,295,000 | | | | 1.0 | % | | | 5.43 | | | | 16,336,361 | | | | | 2,640,432 | |
| Washington | | | 1 | | | | 210,445 | | | | 210,445 | | | | 1.0 | % | | | 1,962,000 | | | | 1.5 | % | | | 9.32 | | | | 30,228,547 | | | | | 17,757,364 | |
| Louisiana | | | 1 | | | | 175,315 | | | | 175,315 | | | | 0.8 | % | | | 1,262,000 | | | | 1.0 | % | | | 7.20 | | | | 18,410,000 | | | | | 11,133,990 | |
| Maryland | | | 1 | | | | 148,881 | | | | 148,881 | | | | 0.7 | % | | | 1,452,000 | | | | 1.1 | % | | | 9.75 | | | | 14,512,355 | | | | | -0- | |
| New Jersey | | | 2 | | | | 124,620 | | | | 124,620 | | | | 0.6 | % | | | 1,365,000 | | | | 1.1 | % | | | 10.95 | | | | 8,054,179 | | | | | 1,580,180 | |
| Nebraska | | | 1 | | | | 89,115 | | | | 89,115 | | | | 0.4 | % | | | 446,000 | | | | 0.4 | % | | | 5.00 | | | | 5,944,691 | | | | | -0- | |
| Minnesota | | | 1 | | | | 60,398 | | | | 60,398 | | | | 0.3 | % | | | 372,000 | | | | 0.3 | % | | | 6.16 | | | | 5,220,000 | | | | | 2,115,962 | |
| Connecticut | | | 1 | | | | 54,812 | | | | 54,812 | | | | 0.3 | % | | | 329,000 | | | | 0.3 | % | | | 6.00 | | | | 3,494,108 | | | | | -0- | |
| Iowa | | | 1 | | | | 36,270 | | | | 36,270 | | | | 0.2 | % | | | 172,000 | | | | 0.2 | % | | | 4.74 | | | | 2,523,644 | | | | | -0- | |
| Total as of 9/30/18 | | | 111 | | | | 21,173,581 | | | | 21,092,725 | | | | 100.0 | % | | $ | 126,792,000 | | | | 100.0 | % | | $ | 6.01 | | | $ | 1,719,567,354 | | (A) | | $ | 719,768,355 | |
| | | | | | | | | | | | | | | | | | | | | | | | | | | | | | | | | | | | | | |
| Acquisitions Subsequent to 9/30/18 | | | | | | | | | | | | | | | | | | | | | | | | | | | | | | | | | | | | | |
| New Jersey | | | 1 | | | | 347,145 | | | | 347,145 | | | | 1.6 | % | | | 5,328,000 | | | | 4.0 | % | | | 15.35 | | | | | | | | | | |
| Pro Forma Total with Acquisitons Subsequent to 9/30/18 | | | 112 | | | | 21,520,726 | | | | 21,439,870 | | | | 100.0 | % | | $ | 132,120,000 | | | | 100.0 | % | | $ | 6.16 | | | | | | | | | | |
| | (A) | Does not include unamortized debt issuance costs of $8,222,706. |
| FOURTH QUARTER AND FISCAL YEAR END 2018 SUPPLEMENTAL INFORMATION | 17 |
Lease Expirations
(unaudited)
| | | | | Property | | | Square | | | % of Total | | | Annual | | | % of Total | | | Rent Per sf | | | Lease Exp. | | | Undepreciated | | | | Mortgage | |
| Fiscal Year | | | | Count | | | Footage | | | sf | | | Rent | | | Ann. Rent | | | Occup. | | | Term in Years | | | Cost | | | | Balance | |
| | | | | | | | | | | | | | | | | | | | | | | | | | | | | | | |
| 2019 | | | | | 6 | | | | 681,395 | | | | 3.2 | % | | $ | 3,914,000 | | | | 3.1 | % | | | 5.74 | | | | 0.6 | | | $ | 46,037,022 | | | | $ | 465,749 | |
| 2020 | | | | | 4 | | | | 383,449 | | | | 1.8 | % | | | 2,129,000 | | | | 1.7 | % | | | 5.55 | | | | 1.7 | | | | 27,452,849 | | | | | -0- | |
| 2021 | | (A) | | | 10 | | | | 1,206,723 | | | | 5.7 | % | | | 5,467,000 | | | | 4.3 | % | | | 4.53 | | | | 2.7 | | | | 69,377,107 | | | | | 7,832,154 | |
| 2022 | | | | | 7 | | | | 1,138,320 | | | | 5.4 | % | | | 6,419,000 | | | | 5.1 | % | | | 5.64 | | | | 3.5 | | | | 75,991,657 | | | | | 25,307,371 | |
| 2023 | | (A) | | | 13 | | | | 1,668,804 | | | | 7.9 | % | | | 9,481,000 | | | | 7.5 | % | | | 5.68 | | | | 4.7 | | | | 116,932,264 | | | | | 21,594,265 | |
| 2024 | | | | | 12 | | | | 1,584,634 | | | | 7.5 | % | | | 10,094,000 | | | | 8.0 | % | | | 6.37 | | | | 5.7 | | | | 122,194,406 | | | | | 34,459,394 | |
| 2025 | | (A) | | | 9 | | | | 2,404,478 | | | | 11.4 | % | | | 12,271,000 | | | | 9.7 | % | | | 5.10 | | | | 6.6 | | | | 159,917,562 | | | | | 74,976,653 | |
| 2026 | | | | | 7 | | | | 982,226 | | | | 4.6 | % | | | 7,922,000 | | | | 6.3 | % | | | 8.07 | | | | 7.6 | | | | 105,330,525 | | | | | 40,305,777 | |
| 2027 | | | | | 11 | | | | 2,304,616 | | | | 10.9 | % | | | 12,629,000 | | | | 10.0 | % | | | 5.48 | | | | 8.9 | | | | 178,945,464 | | | | | 72,819,938 | |
| 2028 | | | | | 11 | | | | 2,571,915 | | | | 12.1 | % | | | 13,826,000 | | | | 10.9 | % | | | 5.38 | | | | 9.5 | | | | 181,975,883 | | | | | 71,085,896 | |
| 2029 | | | | | 5 | | | | 1,171,338 | | | | 5.5 | % | | | 5,454,000 | | | | 4.3 | % | | | 4.66 | | | | 10.5 | | | | 76,019,210 | | | | | 32,457,568 | |
| 2030 | | | | | 4 | | | | 1,044,832 | | | | 4.9 | % | | | 7,403,000 | | | | 5.8 | % | | | 7.09 | | | | 11.5 | | | | 113,789,841 | | | | | 61,881,366 | |
| 2031 | | | | | 3 | | | | 963,269 | | | | 4.5 | % | | | 7,122,000 | | | | 5.6 | % | | | 7.39 | | | | 12.6 | | | | 104,367,000 | | | | | 64,988,499 | |
| 2032 | | | | | 6 | | | | 1,724,838 | | | | 8.3 | % | | | 13,134,000 | | | | 10.4 | % | | | 7.61 | | | | 13.6 | | | | 202,011,552 | | | | | 126,728,056 | |
| 2033 | | | | | 2 | | | | 639,068 | | | | 3.0 | % | | | 6,514,000 | | | | 5.0 | % | | | 10.19 | | | | 14.6 | | | | 106,803,506 | | | | | 69,560,000 | |
| 2034 | | | | | 1 | | | | 558,600 | | | | 2.6 | % | | | 2,206,000 | | | | 1.7 | % | | | 3.95 | | | | 15.1 | | | | 26,807,852 | | | | | 15,305,669 | |
| Various tenants at retail shopping center | | | | | 1 | | | | 64,220 | | | | 0.3 | % | | | 807,000 | | | | 0.6 | % | | | 12.57 | | | | -0- | | | | 3,111,777 | | | | | -0- | |
| Vacant | | (A) | | | 1 | | | | 80,856 | | | | 0.4 | % | | | -0- | | | | 0.0 | % | | | -0- | | | | -0- | | | | 2,501,877 | | | | | -0- | |
| Total as of 9/30/18 | | | | | 111 | | | | 21,173,581 | | | | 100.0 | % | | $ | 126,792,000 | | | | 100.0 | % | | $ | 6.01 | | | | 8.1 | | | $ | 1,719,567,354 | | (B) | | $ | 719,768,355 | |
| | | | | | | | | | | | | | | | | | | | | | | | | | | | | | | | | | | | | | | | |
| Acquisitions Subsequent to 9/30/18 | | | | | | | | | | | | | | | | | | | | | | | | | | | | | | | | | | | | | | | |
| 2032 | | | | | 1 | | | | 347,145 | | | | 1.6 | % | | | 5,328,000 | | | | 4.0 | % | | | 15.35 | | | | 13.8 | | | | | | | | | | |
| Pro Forma Total with Acquisitons Subsequent to 9/30/18 | | | | | 112 | | | | 21,520,726 | | | | 100.0 | % | | $ | 132,120,000 | | | | 100.0 | % | | $ | 6.16 | | | | 8.2 | | | | | | | | | | |
| | (A) | Included in 2021 is Woodstream Corporation and included in 2023 is Altec Industries which both occupy one property. Included in 2025 is NF&M International, which occupies 174,802 square feet of a 255,658 square foot Industrial Park. The remaining 80,856 square feet is included in Vacant. Each of these properties are counted as one property in the Property Count Total. Other than these properties and the one retail property, all other properties are single-tenant. |
| | (B) | Does not include unamortized debt issuance costs of $8,222,706. |
| FOURTH QUARTER AND FISCAL YEAR END 2018 SUPPLEMENTAL INFORMATION | 18 |
Recent Acquisitions During Fiscal 2018
(unaudited)
| | | | | | | | | | Date of | | Square | | | Annual | | | Rent Per | | | Lease | | Purchase | | | Initial Mortgage | |
| No | | | Tenant | | City (MSA) | | State | | Acquisition | | Footage | | | Rent | | | sf Occup. | | | Expiration | | Price | | | Balance | |
| 1 | | | FedEx Corporation | | Charleston | | SC | | 11/2/2017 | | | 121,683 | | | $ | 1,315,000 | | | $ | 10.81 | | | 8/31/2032 | | $ | 21,872,170 | | | $ | 14,200,000 | |
| 2 | | | Amazon.com Services, Inc. (Amazon.com, Inc.) | | Oklahoma City | | OK | | 11/30/2017 | | | 300,000 | | | | 1,884,000 | | | | 6.28 | | | 10/31/2027 | | | 30,250,000 | | | | 19,600,000 | |
| 3 | | | Shaw Industries, Inc. | | Savannah | | GA | | 1/22/2018 | | | 831,764 | | | | 3,551,000 | | | | 4.27 | | | 9/30/2027 | | | 57,483,636 | | | | 33,300,000 | |
| 4 | | | B. Braun Medical Inc. | | Daytona Beach | | FL | | 4/6/2018 | | | 399,440 | | | | 2,130,000 | | | | 5.33 | | | 4/1/2028 | | | 30,750,540 | | | | 19,500,000 | |
| 5 | | | Amazon.com Services, Inc. (Amazon.com, Inc.) | | Mobile | | AL | | 6/28/2018 | | | 362,942 | | | | 2,020,000 | | | | 5.57 | | | 11/30/2028 | | | 33,688,276 | | | | 19,000,000 | |
| 6 | | | FedEx Ground Package System, Inc. | | Charleston | | SC | | 8/15/2018 | | | 265,318 | | | | 2,713,000 | | | | 10.23 | | | 6/30/2033 | | | 47,174,296 | | | | 29,860,000 | |
| 7 | | | FedEx Ground Package System, Inc. | | Braselton (Atlanta) | | GA | | 9/6/2018 | | | 373,750 | | | | 3,801,000 | | | | 10.17 | | | 2/28/2033 | | | 61,113,264 | | | | 39,700,000 | |
| | | | Total as of 9/30/18 | | | | | | | | | 2,654,897 | | | $ | 17,414,000 | | | $ | 6.56 | | | | | $ | 282,332,182 | | | $ | 175,160,000 | |
| | | | | | | | | | | | | | | | | | | | | | | | | | | | | | | | |
| | | | Acquisitons Subsequent to 9/30/18 | | | | | | | | | | | | | | | | | | | | | | | | | | | | |
| 1 | | | FedEx Ground Package System, Inc. | | Trenton | | NJ | | 10/19/2018 | | | 347,145 | | | | 5,328,000 | | | | 15.35 | | | 6/30/2032 | | | 85,248,352 | | | | 55,000,000 | |
| FOURTH QUARTER AND FISCAL YEAR END 2018 SUPPLEMENTAL INFORMATION | 19 |
Property Table
(unaudited)
| | | | | | | | | | Fiscal Year | | | | | | Square | | | Annual | | | Rent Per sf | | | Lease Exp. Term in | | | Undepreciated | | | Mortgage | |
| No | | Tenant | | City (MSA) | | State | | | Acquisition | | | Occup. | | | Footage | | | Rent | | | Occup. | | | Years | | | Cost | | | Balance | |
| 1 | | Milwaukee Electric Tool Corporation | | Olive Branch (Memphis, TN) | | MS | | | 2013 | | | | 100.0 | % | | | 861,889 | | | $ | 3,032,000 | | | $ | 3.52 | | | | 9.8 | | | $ | 36,914,917 | | | $ | 21,722,567 | |
| 2 | | Shaw Industries, Inc. | | Savannah | | GA | | | 2018 | | | | 100.0 | % | | | 831,764 | | | | 3,551,000 | | | | 4.27 | | | | 9.0 | | | | 56,025,945 | | | | 32,215,696 | |
| 3 | | ULTA, Inc. | | Greenwood (Indianapolis) | | IN | | | 2015 | | | | 100.0 | % | | | 671,354 | | | | 2,702,000 | | | | 4.02 | | | | 6.8 | | | | 37,512,071 | | | | 20,159,025 | |
| 4 | | Jim Beam Brands Company (Beam Suntory) | | Frankfort (Lexington) | | KY | | | 2015 | | | | 100.0 | % | | | 599,840 | | | | 2,051,000 | | | | 3.42 | | | | 6.3 | | | | 28,000,000 | | | | 16,639,132 | |
| 5 | | TreeHouse Private Brands, Inc. | | Buckner (Louisville) | | KY | | | 2014 | | | | 100.0 | % | | | 558,600 | | | | 2,206,000 | | | | 3.95 | | | | 15.1 | | | | 26,807,852 | | | | 15,305,669 | |
| 6 | | FedEx Corporation | | Memphis | | TN | | | 2010 | | | | 100.0 | % | | | 449,900 | | | | 1,384,000 | | | | 3.08 | | | | 10.7 | | | | 14,614,986 | | | | 5,061,376 | |
| 7 | | B. Braun Medical Inc. | | Daytona Beach | | FL | | | 2018 | | | | 100.0 | % | | | 399,440 | | | | 2,130,000 | | | | 5.33 | | | | 9.5 | | | | 29,973,199 | | | | 19,187,819 | |
| 8 | | Woodstream Corporation | | St. Joseph | | MO | | | 2001 | | | | 100.0 | % | | | 256,000 | | | | 914,000 | | | | 3.57 | | | | 3.0 | | | | 8,935,160 | | | | -0- | |
| | | Altec Industries, Inc. | | St. Joseph | | MO | | | 2001 | | | | 100.0 | % | | | 126,880 | | | | 371,000 | | | | 2.92 | | | | 4.4 | | | | 4,428,488 | | | | -0- | |
| 9 | | CBOCS Distribution, Inc. (Cracker Barrel) | | Lebanon (Nashville) | | TN | | | 2011 | | | | 100.0 | % | | | 381,240 | | | | 1,447,000 | | | | 3.80 | | | | 5.8 | | | | 14,215,126 | | | | 7,217,469 | |
| 10 | | FedEx Ground Package System, Inc. | | Braselton (Atlanta) | | GA | | | 2018 | | | | 100.0 | % | | | 373,750 | | | | 3,801,000 | | | | 10.17 | | | | 14.4 | | | | 60,227,126 | | | | 39,700,000 | |
| 11 | | Best Buy Warehousing Logistics, Inc. | | Streetsboro (Cleveland) | | OH | | | 2012 | | | | 100.0 | % | | | 368,060 | | | | 1,676,000 | | | | 4.55 | | | | 3.3 | | | | 19,600,000 | | | | 9,300,481 | |
| 12 | | Amazon.com Services, Inc. (Amazon.com, Inc.) | | Mobile | | AL | | | 2018 | | | | 100.0 | % | | | 362,942 | | | | 2,020,000 | | | | 5.57 | | | | 10.2 | | | | 33,052,316 | | | | 18,832,395 | |
| 13 | | FedEx Ground Package System, Inc. | | Concord (Charlotte) | | NC | | | 2017 | | | | 100.0 | % | | | 354,482 | | | | 2,537,000 | | | | 7.16 | | | | 13.7 | | | | 40,043,145 | | | | 24,863,355 | |
| 14 | | FedEx Ground Package System, Inc. | | Mesquite (Dallas) | | TX | | | 2017 | | | | 100.0 | % | | | 351,874 | | | | 3,195,000 | | | | 9.08 | | | | 13.5 | | | | 49,880,493 | | | | 30,928,224 | |
| 15 | | FedEx Ground Package System, Inc. | | Walker (Grand Rapids) | | MI | | | 2017 | | | | 100.0 | % | | | 343,483 | | | | 2,102,000 | | | | 6.12 | | | | 13.3 | | | | 31,654,987 | | | | 19,468,554 | |
| 16 | | FedEx Ground Package System, Inc. | | Hamburg (Buffalo) | | NY | | | 2017 | | | | 100.0 | % | | | 338,584 | | | | 2,313,000 | | | | 6.83 | | | | 12.5 | | | | 34,850,000 | | | | 21,328,714 | |
| 17 | | FedEx Ground Package System, Inc. | | Concord (Charlotte) | | NC | | | 2016 | | | | 100.0 | % | | | 330,717 | | | | 2,237,000 | | | | 6.76 | | | | 6.8 | | | | 33,044,797 | | | | 17,813,451 | |
| 18 | | FedEx Ground Package System, Inc. | | Indianapolis | | IN | | | 2014 | | | | 100.0 | % | | | 327,822 | | | | 1,715,000 | | | | 5.23 | | | | 9.1 | | | | 25,504,083 | | | | 10,437,151 | |
| 19 | | Autoneum North America, Inc. | | Aiken (Augusta, GA) | | SC | | | 2017 | | | | 100.0 | % | | | 315,560 | | | | 1,703,000 | | | | 5.40 | | | | 13.6 | | | | 21,040,395 | | | | 14,471,117 | |
| 20 | | FedEx Ground Package System, Inc. | | Olathe (Kansas City) | | KS | | | 2016 | | | | 100.0 | % | | | 313,763 | | | | 2,200,000 | | | | 7.01 | | | | 12.7 | | | | 31,737,000 | | | | 19,956,867 | |
| 21 | | FedEx Ground Package System, Inc. | | Davenport (Orlando) | | FL | | | 2016 | | | | 100.0 | % | | | 310,922 | | | | 2,609,000 | | | | 8.39 | | | | 12.6 | | | | 37,780,000 | | | | 23,702,918 | |
| 22 | | FedEx Ground Package System, Inc. | | Ft. Worth (Dallas) | | TX | | | 2015 | | | | 100.0 | % | | | 304,608 | | | | 2,373,000 | | | | 7.79 | | | | 11.6 | | | | 35,300,832 | | | | 20,753,864 | |
| 23 | | Science Applications International Corporation | | Hanahan (Charleston) | | SC | | | 2005 | | | | 100.0 | % | | | 302,400 | | | | 1,491,000 | | | | 4.93 | | | | 0.6 | | | | 13,410,102 | | | | -0- | |
| 24 | | Amazon.com Services, Inc. (Amazon.com, Inc.) | | Oklahoma City | | OK | | | 2018 | | | | 100.0 | % | | | 300,000 | | | | 1,884,000 | | | | 6.28 | | | | 9.1 | | | | 29,878,942 | | | | 19,013,593 | |
| 25 | | International Paper Company | | Kenton | | OH | | | 2017 | | | | 100.0 | % | | | 298,472 | | | | 1,244,000 | | | | 4.17 | | | | 8.9 | | | | 17,881,607 | | | | 11,473,387 | |
| 26 | | FedEx Ground Package System, Inc. | | Jacksonville | | FL | | | 2015 | | | | 100.0 | % | | | 297,579 | | | | 1,998,000 | | | | 6.71 | | | | 11.3 | | | | 30,735,702 | | | | 16,243,754 | |
| 27 | | Western Container Corp. (Coca-Cola) | | Tolleson (Phoenix) | | AZ | | | 2003 | | | | 100.0 | % | | | 283,358 | | | | 1,361,000 | | | | 4.80 | | | | 8.6 | | | | 16,824,226 | | | | 3,719,709 | |
| 28 | | International Paper Company | | Edwardsville (Kansas City) | | KS | | | 2014 | | | | 100.0 | % | | | 280,000 | | | | 1,348,000 | | | | 4.81 | | | | 4.9 | | | | 18,294,108 | | | | 9,189,343 | |
| 29 | | FedEx Ground Package System, Inc. | | Charleston | | SC | | | 2018 | | | | 100.0 | % | | | 265,318 | | | | 2,713,000 | | | | 10.23 | | | | 14.8 | | | | 46,576,380 | | | | 29,860,000 | |
| 30 | | NF&M International, Inc. | | Monaca (Pittsburgh) | | PA | | | 1988 | | | | 68.4 | % | | | 255,658 | | | | 835,000 | | | | 4.78 | | | | 6.3 | | | | 7,910,666 | | | | -0- | |
| 31 | | FedEx Ground Package System, Inc. | | Orion | | MI | | | 2007 | | | | 100.0 | % | | | 245,633 | | | | 1,908,000 | | | | 7.77 | | | | 4.8 | | | | 22,890,124 | | | | -0- | |
| 32 | | FedEx Ground Package System, Inc. | | Homestead (Miami) | | FL | | | 2017 | | | | 100.0 | % | | | 237,756 | | | | 2,282,000 | | | | 9.60 | | | | 13.5 | | | | 37,873,120 | | | | 23,313,676 | |
| 33 | | Anda Pharmaceuticals, Inc. | | Olive Branch (Memphis, TN) | | MS | | | 2012 | | | | 100.0 | % | | | 234,660 | | | | 1,205,000 | | | | 5.14 | | | | 3.8 | | | | 14,550,000 | | | | 7,564,186 | |
| 34 | | UGN, Inc. | | Monroe (Cincinnati) | | OH | | | 2015 | | | | 100.0 | % | | | 232,200 | | | | 1,070,000 | | | | 4.61 | | | | 11.4 | | | | 17,524,760 | | | | 7,126,384 | |
| 35 | | FedEx Ground Package System, Inc. | | Colorado Springs | | CO | | | 2016 | | | | 100.0 | % | | | 225,362 | | | | 1,832,000 | | | | 8.13 | | | | 7.3 | | | | 29,320,066 | | | | 16,651,710 | |
| 36 | | Mickey Thompson Performance Tires and Wheels (Cooper Tire) | | Stow | | OH | | | 2017 | | | | 100.0 | % | | | 219,765 | | | | 1,501,000 | | | | 6.83 | | | | 8.9 | | | | 18,934,065 | | | | 12,130,343 | |
| 37 | | Rinnai America Corporation | | Griffin (Atlanta) | | GA | | | 2006 | | | | 100.0 | % | | | 218,120 | | | | 831,000 | | | | 3.81 | | | | 2.3 | | | | 14,933,683 | | | | -0- | |
| 38 | | FedEx Ground Package System, Inc. | | Ft. Myers | | FL | | | 2017 | | | | 100.0 | % | | | 213,672 | | | | 1,418,000 | | | | 6.64 | | | | 8.9 | | | | 21,663,635 | | | | 13,280,803 | |
| 39 | | FedEx Ground Package System, Inc. | | Burlington (Seattle/Everett) | | WA | | | 2016 | | | | 100.0 | % | | | 210,445 | | | | 1,962,000 | | | | 9.32 | | | | 11.9 | | | | 30,228,547 | | | | 17,757,364 | |
| 40 | | FedEx Ground Package System, Inc. | | Sauget (St. Louis, MO) | | IL | | | 2015 | | | | 100.0 | % | | | 198,773 | | | | 1,036,000 | | | | 5.21 | | | | 10.7 | | | | 15,204,950 | | | | 8,563,797 | |
| 41 | | Anheuser-Busch, Inc. | | Granite City (St. Louis, MO) | | IL | | | 2001 | | | | 100.0 | % | | | 184,800 | | | | 821,000 | | | | 4.44 | | | | 3.2 | | | | 12,697,848 | | | | -0- | |
| 42 | | Carrier Enterprise, LLC (United Technologies) | | Carrollton (Dallas) | | TX | | | 2010 | | | | 100.0 | % | | | 184,317 | | | | 1,241,000 | | | | 6.73 | | | | 5.3 | | | | 17,819,203 | | | | 6,455,552 | |
| 43 | | FedEx Ground Package System, Inc. | | Spring (Houston) | | TX | | | 2014 | | | | 100.0 | % | | | 181,176 | | | | 1,581,000 | | | | 8.73 | | | | 6.0 | | | | 19,294,396 | | | | 7,924,865 | |
| 44 | | Carlisle Tire & Wheel Company | | Edwardsville (Kansas City) | | KS | | | 2003 | | | | 100.0 | % | | | 179,280 | | | | 739,000 | | | | 4.12 | | | | 4.8 | | | | 7,232,986 | | | | -0- | |
| 45 | | FedEx Ground Package System, Inc. | | Ft. Mill (Charlotte, NC) | | SC | | | 2010 | | | | 100.0 | % | | | 176,939 | | | | 1,581,000 | | | | 8.94 | | | | 9.9 | | | | 17,074,037 | | | | 724,766 | |
| 46 | | FedEx Ground Package System, Inc. | | Covington (New Orleans) | | LA | | | 2016 | | | | 100.0 | % | | | 175,315 | | | | 1,262,000 | | | | 7.20 | | | | 6.8 | | | | 18,410,000 | | | | 11,133,990 | |
| 47 | | FedEx Ground Package System, Inc. | | Livonia (Detroit) | | MI | | | 2013 | | | | 100.0 | % | | | 172,005 | | | | 1,194,000 | | | | 6.94 | | | | 3.5 | | | | 13,762,030 | | | | 6,294,503 | |
| 48 | | Home Depot USA, Inc. | | Montgomery (Chicago) | | IL | | | 2004 | | | | 100.0 | % | | | 171,200 | | | | 997,000 | | | | 5.82 | | | | 1.8 | | | | 11,303,317 | | | | -0- | |
| 49 | | FedEx Ground Package System, Inc. | | Tampa | | FL | | | 2004 | | | | 100.0 | % | | | 170,779 | | | | 1,624,000 | | | | 9.51 | | | | 7.8 | | | | 19,701,575 | | | | 5,144,319 | |
| 50 | | FedEx Ground Package System, Inc. | | Edinburg | | TX | | | 2011 | | | | 100.0 | % | | | 164,207 | | | | 1,097,000 | | | | 6.68 | | | | 8.0 | | | | 12,039,014 | | | | -0- | |
| FOURTH QUARTER AND FISCAL YEAR END 2018 SUPPLEMENTAL INFORMATION | 20 |
Property Table
(unaudited)
| | | | | | | | | | Fiscal Year | | | | | | Square | | | Annual | | | Rent Per sf | | | Lease Exp. Term in | | | Undepreciated | | | Mortgage | |
| No | | Tenant | | City (MSA) | | State | | | Acquisition | | | Occup. | | | Footage | | | Rent | | | Occup. | | | Years | | | Cost | | | Balance | |
| 51 | | FedEx Ground Package System, Inc. | | Lindale (Tyler) | | TX | | | 2015 | | | | 100.0 | % | | | 163,378 | | | $ | 725,000 | | | $ | 4.44 | | | | 5.8 | | | $ | 9,965,550 | | | $ | 5,638,258 | |
| 52 | | Bunzl Distribution Midcentral, Inc. | | Kansas City | | MO | | | 2015 | | | | 100.0 | % | | | 158,417 | | | | 752,000 | | | | 4.75 | | | | 3.0 | | | | 9,980,250 | | | | 6,633,001 | |
| 53 | | FedEx Ground Package System, Inc. | | Oklahoma City | | OK | | | 2012 | | | | 100.0 | % | | | 158,340 | | | | 1,048,000 | | | | 6.62 | | | | 6.8 | | | | 12,584,462 | | | | 3,416,097 | |
| 54 | | FedEx Ground Package System, Inc. | | Waco | | TX | | | 2012 | | | | 100.0 | % | | | 150,710 | | | | 1,078,000 | | | | 7.15 | | | | 6.9 | | | | 12,551,368 | | | | 4,234,777 | |
| 55 | | FedEx Ground Package System, Inc. | | Beltsville (Washington, DC) | | MD | | | 2001 | | | | 100.0 | % | | | 148,881 | | | | 1,452,000 | | | | 9.75 | | | | 9.8 | | | | 14,512,355 | | | | -0- | |
| 56 | | Victory Packaging, L.P. | | Fayetteville | | NC | | | 1997 | | | | 100.0 | % | | | 148,000 | | | | 502,000 | | | | 3.39 | | | | 2.4 | | | | 5,451,629 | | | | -0- | |
| 57 | | FedEx Ground Package System, Inc. | | El Paso | | TX | | | 2006 | | | | 100.0 | % | | | 144,149 | | | | 1,345,000 | | | | 9.33 | | | | 5.0 | | | | 12,431,192 | | | | -0- | |
| 58 | | FedEx Ground Package System, Inc. | | Cocoa | | FL | | | 2008 | | | | 100.0 | % | | | 144,138 | | | | 1,112,000 | | | | 7.71 | | | | 6.0 | | | | 14,127,449 | | | | -0- | |
| 59 | | FedEx Ground Package System, Inc. | | Cudahy (Milwaukee) | | WI | | | 2001 | | | | 100.0 | % | | | 139,564 | | | | 827,000 | | | | 5.93 | | | | 8.8 | | | | 9,766,361 | | | | -0- | |
| 60 | | Challenger Lifts, Inc. (Snap-On Inc.) | | Louisville | | KY | | | 2016 | | | | 100.0 | % | | | 137,500 | | | | 838,000 | | | | 6.09 | | | | 7.7 | | | | 11,304,000 | | | | 6,525,135 | |
| 61 | | FedEx Ground Package System, Inc. | | Richfield (Cleveland) | | OH | | | 2006 | | | | 100.0 | % | | | 131,152 | | | | 1,493,000 | | | | 11.38 | | | | 6.0 | | | | 16,447,178 | | | | -0- | |
| 62 | | General Electric Company | | Imperial (Pittsburgh) | | PA | | | 2016 | | | | 100.0 | % | | | 125,860 | | | | 1,321,000 | | | | 10.50 | | | | 7.3 | | | | 19,950,000 | | | | 11,199,661 | |
| 63 | | FedEx Ground Package System, Inc. | | Wheeling (Chicago) | | IL | | | 2003 | | | | 100.0 | % | | | 123,000 | | | | 1,272,000 | | | | 10.34 | | | | 8.7 | | | | 18,982,474 | | | | -0- | |
| 64 | | FedEx Ground Package System, Inc. | | Altoona | | PA | | | 2014 | | | | 100.0 | % | | | 122,522 | | | | 651,000 | | | | 5.31 | | | | 4.9 | | | | 9,022,966 | | | | 3,253,281 | |
| 65 | | FedEx Corporation | | Charleston | | SC | | | 2018 | | | | 100.0 | % | | | 121,683 | | | | 1,315,000 | | | | 10.81 | | | | 13.9 | | | | 21,519,412 | | | | 13,683,131 | |
| 66 | | FedEx Corporation | | Mechanicsville (Richmond) | | VA | | | 2001 | | | | 100.0 | % | | | 112,799 | | | | 541,000 | | | | 4.80 | | | | 4.6 | | | | 7,792,395 | | | | -0- | |
| 67 | | FedEx Corporation | | Orlando | | FL | | | 2008 | | | | 100.0 | % | | | 110,638 | | | | 666,000 | | | | 6.02 | | | | 9.2 | | | | 8,774,524 | | | | -0- | |
| 68 | | Bunzl Distribution Oklahoma, Inc. | | Oklahoma City | | OK | | | 2017 | | | | 100.0 | % | | | 110,361 | | | | 722,000 | | | | 6.54 | | | | 5.9 | | | | 8,728,439 | | | | 5,537,962 | |
| 69 | | Style Crest, Inc. | | Winston-Salem | | NC | | | 2002 | | | | 100.0 | % | | | 106,507 | | | | 387,000 | | | | 3.63 | | | | 2.5 | | | | 7,246,325 | | | | -0- | |
| 70 | | FedEx Ground Package System, Inc. | | Cheektowaga (Buffalo) | | NY | | | 2002 | | | | 100.0 | % | | | 104,981 | | | | 966,000 | | | | 9.20 | | | | 0.9 | | | | 10,960,823 | | | | -0- | |
| 71 | | FedEx Ground Package System, Inc. | | West Chester Twp. (Cincinnati) | | OH | | | 1999 | | | | 100.0 | % | | | 103,818 | | | | 543,000 | | | | 5.23 | | | | 4.9 | | | | 5,733,686 | | | | -0- | |
| 72 | | FedEx Ground Package System, Inc. | | Roanoke | | VA | | | 2013 | | | | 100.0 | % | | | 103,402 | | | | 755,000 | | | | 7.30 | | | | 4.6 | | | | 10,200,000 | | | | 4,395,246 | |
| 73 | | Pittsburgh Glass Works, LLC | | O’ Fallon (St. Louis) | | MO | | | 1994 | | | | 100.0 | % | | | 102,135 | | | | 442,000 | | | | 4.33 | | | | 2.8 | | | | 4,245,913 | | | | -0- | |
| 74 | | FedEx Ground Package System, Inc. | | Green Bay | | WI | | | 2013 | | | | 100.0 | % | | | 99,102 | | | | 468,000 | | | | 4.72 | | | | 4.7 | | | | 6,570,000 | | | | 2,640,432 | |
| 75 | | Holland 1916 Inc. | | Liberty (Kansas City) | | MO | | | 1998 | | | | 100.0 | % | | | 95,898 | | | | 349,000 | | | | 3.64 | | | | 0.7 | | | | 7,397,881 | | | | -0- | |
| 76 | | FedEx Corporation | | Jacksonville | | FL | | | 1999 | | | | 100.0 | % | | | 95,883 | | | | 533,000 | | | | 5.56 | | | | 10.7 | | | | 6,396,958 | | | | -0- | |
| 77 | | FedEx Corporation | | Tampa | | FL | | | 2006 | | | | 100.0 | % | | | 95,662 | | | | 603,000 | | | | 6.30 | | | | 9.2 | | | | 7,857,120 | | | | -0- | |
| 78 | | FedEx Ground Package System, Inc. | | Hanahan (Charleston) | | SC | | | 2005 | | | | 100.0 | % | | | 91,776 | | | | 675,000 | | | | 7.35 | | | | 0.2 | | | | 7,614,653 | | | | 465,749 | |
| 79 | | National Oilwell Varco, Inc. | | Houston | | TX | | | 2010 | | | | 100.0 | % | | | 91,295 | | | | 754,000 | | | | 8.26 | | | | 4.0 | | | | 8,163,278 | | | | 2,148,201 | |
| 80 | | FedEx Corporation | | Omaha | | NE | | | 1999 | | | | 100.0 | % | | | 89,115 | | | | 446,000 | | | | 5.00 | | | | 5.1 | | | | 5,944,691 | | | | -0- | |
| 81 | | Joseph T. Ryerson and Son, Inc. | | Elgin (Chicago) | | IL | | | 2002 | | | | 100.0 | % | | | 89,052 | | | | 506,000 | | | | 5.68 | | | | 1.3 | | | | 6,977,442 | | | | -0- | |
| 82 | | FedEx Ground Package System, Inc. | | Huntsville | | AL | | | 2005 | | | | 100.0 | % | | | 88,653 | | | | 605,000 | | | | 6.82 | | | | 7.8 | | | | 6,661,819 | | | | 370,903 | |
| 83 | | CHEP USA, Inc. | | Roanoke | | VA | | | 2007 | | | | 100.0 | % | | | 83,000 | | | | 500,000 | | | | 6.02 | | | | 6.4 | | | | 7,463,672 | | | | -0- | |
| 84 | | FedEx Corporation | | Bedford Heights (Cleveland) | | OH | | | 2007 | | | | 100.0 | % | | | 82,269 | | | | 436,000 | | | | 5.30 | | | | 9.9 | | | | 6,919,836 | | | | -0- | |
| 85 | | RGH Enterprises, Inc. (Cardinal Health) | | Halfmoon (Albany) | | NY | | | 2012 | | | | 100.0 | % | | | 75,000 | | | | 607,000 | | | | 8.09 | | | | 3.2 | | | | 5,525,600 | | | | -0- | |
| 86 | | FedEx Corporation | | Schaumburg (Chicago) | | IL | | | 1997 | | | | 100.0 | % | | | 73,500 | | | | 478,000 | | | | 6.50 | | | | 8.5 | | | | 5,177,940 | | | | -0- | |
| 87 | | FedEx Corporation | | Romulus (Detroit) | | MI | | | 1998 | | | | 100.0 | % | | | 71,933 | | | | 370,000 | | | | 5.14 | | | | 2.7 | | | | 4,732,671 | | | | -0- | |
| 88 | | FedEx Ground Package System, Inc. | | Denver | | CO | | | 2005 | | | | 100.0 | % | | | 69,865 | | | | 605,000 | | | | 8.66 | | | | 7.1 | | | | 6,354,051 | | | | 414,050 | |
| 89 | | Tampa Bay Grand Prix | | Tampa | | FL | | | 2005 | | | | 100.0 | % | | | 68,385 | | | | 297,000 | | | | 4.34 | | | | 2.0 | | | | 5,677,982 | | | | -0- | |
| 90 | | Sherwin-Williams Company | | Rockford | | IL | | | 2011 | | | | 100.0 | % | | | 66,387 | | | | 481,000 | | | | 7.25 | | | | 5.3 | | | | 5,551,227 | | | | -0- | |
| 91 | | Various Tenants at Retail Shopping Center | | Somerset | | NJ | | | 1970 | | | | 100.0 | % | | | 64,220 | | | | 807,000 | | | | 12.57 | | | | na | | | | 3,111,777 | | | | -0- | |
| 92 | | The American Bottling Company (Keurig Dr Pepper) | | Cincinnati | | OH | | | 2015 | | | | 100.0 | % | | | 63,840 | | | | 481,000 | | | | 7.53 | | | | 11.0 | | | | 6,750,000 | | | | -0- | |
| 93 | | FedEx Corporation | | Chattanooga | | TN | | | 2007 | | | | 100.0 | % | | | 60,637 | | | | 319,000 | | | | 5.26 | | | | 4.1 | | | | 5,138,540 | | | | -0- | |
| 94 | | SOFIVE, Inc. | | Carlstadt (New York, NY) | | NJ | | | 2001 | | | | 100.0 | % | | | 60,400 | | | | 558,000 | | | | 9.24 | | | | 6.3 | | | | 4,942,402 | | | | 1,580,180 | |
| 95 | | FedEx Ground Package System, Inc. | | Stewartville (Rochester) | | MN | | | 2013 | | | | 100.0 | % | | | 60,398 | | | | 372,000 | | | | 6.16 | | | | 4.7 | | | | 5,220,000 | | | | 2,115,962 | |
| 96 | | Carrier Enterprise, LLC (United Technologies) | | Richmond | | VA | | | 2004 | | | | 100.0 | % | | | 60,000 | | | | 324,000 | | | | 5.40 | | | | 0.2 | | | | 4,768,309 | | | | -0- | |
| 97 | | FedEx Ground Package System, Inc. | | Augusta | | GA | | | 2005 | | | | 100.0 | % | | | 59,358 | | | | 501,000 | | | | 8.44 | | | | 2.8 | | | | 5,363,305 | | | | 338,789 | |
| 98 | | Kellogg Sales Company | | Newington (Hartford) | | CT | | | 2001 | | | | 100.0 | % | | | 54,812 | | | | 329,000 | | | | 6.00 | | | | 1.4 | | | | 3,494,108 | | | | -0- | |
| 99 | | Siemens Real Estate | | Lebanon (Cincinnati) | | OH | | | 2012 | | | | 100.0 | % | | | 51,130 | | | | 464,000 | | | | 9.07 | | | | 5.6 | | | | 4,452,425 | | | | -0- | |
| 100 | | FedEx Corporation | | Charlottesville | | VA | | | 1999 | | | | 100.0 | % | | | 48,064 | | | | 329,000 | | | | 6.85 | | | | 8.9 | | | | 4,455,701 | | | | -0- | |
| FOURTH QUARTER AND FISCAL YEAR END 2018 SUPPLEMENTAL INFORMATION | 21 |
Property Table
(unaudited)
| | | | | | | | | | Fiscal Year | | | | | | Square | | | Annual | | | Rent Per sf | | | Lease Exp. Term in | | | Undepreciated | | | Mortgage | |
| No | | Tenant | | City (MSA) | | State | | | Acquisition | | | Occup. | | | Footage | | | Rent | | | Occup. | | | Years | | | Cost | | | Balance | |
| 101 | | FedEx Ground Package System, Inc. | | Corpus Christi | | TX | | | 2012 | | | | 100.0 | % | | | 46,253 | | | $ | 436,000 | | | $ | 9.43 | | | | 2.9 | | | $ | 4,808,329 | | | $ | -0- | |
| 102 | | The American Bottling Company (Keurig Dr Pepper) | | Tulsa | | OK | | | 2014 | | | | 100.0 | % | | | 46,240 | | | | 262,000 | | | | 5.67 | | | | 5.4 | | | | 3,748,031 | | | | 1,685,288 | |
| 103 | | Heartland Coca-Cola Bottling Company, LLC (Coca-Cola) | | Topeka | | KS | | | 2009 | | | | 100.0 | % | | | 40,000 | | | | 332,000 | | | | 8.30 | | | | 3.0 | | | | 3,679,843 | | | | 860,364 | |
| 104 | | Collins Aerospace Systems (United Technologies) | | Rockford | | IL | | | 2015 | | | | 100.0 | % | | | 38,833 | | | | 364,000 | | | | 9.37 | | | | 8.8 | | | | 5,100,000 | | | | -0- | |
| 105 | | Foundation Building Materials, LLC | | Urbandale (Des Moines) | | IA | | | 1994 | | | | 100.0 | % | | | 36,270 | | | | 172,000 | | | | 4.74 | | | | 9.3 | | | | 2,523,644 | | | | -0- | |
| 106 | | FedEx Corporation | | Richland (Jackson) | | MS | | | 1994 | | | | 100.0 | % | | | 36,000 | | | | 120,000 | | | | 3.33 | | | | 5.5 | | | | 1,900,691 | | | | -0- | |
| 107 | | FedEx Corporation | | Punta Gorda | | FL | | | 2007 | | | | 100.0 | % | | | 34,624 | | | | 284,000 | | | | 8.20 | | | | 8.8 | | | | 4,133,510 | | | | -0- | |
| 108 | | FedEx Corporation | | Lakeland | | FL | | | 2006 | | | | 100.0 | % | | | 32,105 | | | | 155,000 | | | | 4.83 | | | | 9.2 | | | | 2,043,226 | | | | -0- | |
| 109 | | FedEx Corporation | | Augusta | | GA | | | 2006 | | | | 100.0 | % | | | 30,184 | | | | 121,000 | | | | 4.01 | | | | 4.2 | | | | 1,977,779 | | | | -0- | |
| 110 | | Graybar Electric Company | | Ridgeland (Jackson) | | MS | | | 1993 | | | | 100.0 | % | | | 26,340 | | | | 109,000 | | | | 4.14 | | | | 0.8 | | | | 1,885,254 | | | | -0- | |
| 111 | | Sherwin-Williams Company | | Burr Ridge (Chicago) | | IL | | | 1997 | | | | 100.0 | % | | | 12,500 | | | | 162,000 | | | | 12.96 | | | | 3.1 | | | | 1,692,901 | | | | -0- | |
| | | Total as of 9/30/18 | | | | | | | | | | | 99.6 | % | | | 21,173,581 | | | $ | 126,792,000 | | | $ | 6.01 | | | | 8.1 | | | $ | 1,719,567,354 | | (A) | $ | 719,768,355 | |
| | | | | | | | | | | | | | | | | | | | | | | | | | | | | | | | | | | | | | | |
| | | Acquisitons Subsequent to 9/30/18 | | | | | | | | | | | | | | | | | | | | | | | | | | | | | | | | | | | | |
| 112 | | FedEx Ground Package System, Inc. | | Trenton | | NJ | | | 2019 | | | | 100.0 | % | | | 347,145 | | | | 5,328,000 | | | | 15.35 | | | | 13.8 | | | | | | | | | |
| | | Pro Forma Total with Acquisitons Subsequent to 9/30/18 | | | | | | | | | | | 99.6 | % | | | 21,520,726 | | | $ | 132,120,000 | | | $ | 6.16 | | | | 8.2 | | | | | | | | | |
(A) Does not include unamortized debt issuance costs of $8,222,706.
| FOURTH QUARTER AND FISCAL YEAR END 2018 SUPPLEMENTAL INFORMATION | 22 |
Definitions
Investors and analysts following the real estate industry utilize funds from operations (“FFO”), core funds from operations (“Core FFO”), adjusted funds from operations (“AFFO”), net operating income (“NOI”), Same Property NOI, Same Property Cash NOI, and earnings before interest, taxes, depreciation and amortization for real estate, (“EBITDAre”)& (“Adjusted EBITDA”) variously defined, as supplemental performance measures. While we believe net income available to common stockholders, as defined by accounting principles generally accepted in the United States of America (U.S. GAAP), is the most appropriate measure, we consider NOI, Same Property NOI, Same Property Cash NOI, EBITDAre, Adjusted EBITDA, FFO, Core FFO and AFFO, given their wide use by and relevance to investors and analysts, appropriate supplemental performance measures. FFO, reflecting the assumption that real estate asset values rise or fall with market conditions, principally adjusts for the effects of U.S. GAAP depreciation and amortization of real estate assets. Core FFO reflects the same assumptions as FFO except that it also adjusts to exclude for the effects of acquisition costs and costs associated with the redemption of preferred stock. NOI provides a measure of rental operations, and does not factor in depreciation and amortization and non-property specific expenses such as interest expense and general and administrative expenses. EBITDAre and Adjusted EBITDA provides a tool to further evaluate the ability to incur and service debt and to fund dividends and other cash needs. AFFO provides a supplemental tool to evaluate our performance. In addition, NOI, Same Property NOI, Same Property Cash NOI, EBITDAre, Adjusted EBITDA, FFO, Core FFO and AFFO are commonly used in various ratios, pricing multiples, yields and returns and valuation of calculations used to measure financial position, performance and value. As used herein, we calculate the following non-U.S. GAAP measures as follows:
| ● | FFO, as defined by The National Association of Real Estate Investment Trusts (NAREIT), to be equal to net income applicable to common shareholders, as defined by U.S. GAAP, excluding extraordinary items as defined by U.S. GAAP, gains or losses from sales of previously depreciated real estate assets, impairment charges related to depreciable real estate assets, plus certain non-cash items such as real estate asset depreciation and amortization. FFO includes gains and losses realized on sale of securities investments. NAREIT created FFO as a non-U.S. GAAP supplemental measure of REIT operating performance and is used by industry analysts and investors as a supplemental operating performance measure of a REIT. |
| | | |
| ● | Core FFO is calculated as FFO plus acquisition costs and costs associated with the redemption of preferred stock. |
| | | |
| ● | AFFOis calculated as Core FFO, excluding lease termination income, net gain or loss on sale of securities transactions, stock based compensation expense, depreciation of corporate office tenant improvements, amortization of deferred financing costs, non-recurring other expense, non-cash U.S. GAAP straight-line rent adjustments and less recurring capital expenditures. Recurring capital expenditures are defined as all capital expenditures that are recurring in nature, excluding capital expenditures related to expansions at our current locations or capital expenditures that are incurred in conjunction with obtaining a new lease or a lease renewal. |
| | | |
| ● | NOIfrom property operations is calculated as net income attributable to common shareholders, as defined by U.S. GAAP, plus redemption of preferred stock, preferred dividends, general & administrative expenses, acquisitions costs, depreciation, amortization of capitalized lease costs & intangible assets and interest expense, including amortization of financing costs, less dividend and interest income, gain on sale of securities transactions, gain on sale of real estate investments, and lease termination income. The components of NOI consist of recurring rental and reimbursement revenue, less real estate taxes and operating expenses, such as insurance, utilities, and repairs and maintenance and other operating expenses. |
| | | |
| ● | Same Property NOIis calculated as the NOI of all properties owned during the entire periods presented with the exclusion of any properties expanded during the periods presented. |
| | | |
| ● | Same Property Cash NOIis calculated as the Same Property NOI adjusted to exclude the effect of non-cash U.S. GAAP straight-line rent adjustment for the properties included in the Same Property NOI calculation. |
| | | |
| ● | EBITDAre, as defined by NAREIT, is net income attributable to common shareholders, as defined by U.S. GAAP, plus preferred dividends, costs associated with the redemption of preferred stock, interest expense, including amortization of financing costs, depreciation and amortization, and plus losses (minus gains) on sales of real estate investments. |
| | | |
| ● | Adjusted EBITDA is calculated as EBITDAreplus acquisition costs, net amortization of acquired above and below market lease revenue, and plus losses (minus gains) on sale of securities transactions. |
FFO, Core FFO, AFFO, NOI, Same Property NOI, Same Property Cash NOI, EBITDAre and Adjusted EBITDA,do not represent cash generated from operating activities in accordance with U.S. GAAP and are not necessarily indicative of cash available to fund cash needs, including the repayment of principal on debt and payment of dividends and distributions. FFO, Core FFO, AFFO, NOI, Same Property NOI, Same Property Cash NOI, EBITDAre and Adjusted EBITDA should not be considered as substitutes for net income applicable to common shareholders (calculated in accordance with U.S. GAAP) as a measure of results of operations or cash flows (calculated in accordance with U.S. GAAP) as a measure of liquidity. FFO, Core FFO, AFFO, NOI, Same Property NOI, Same Property Cash NOI, EBITDAre and Adjusted EBITDA, as currently calculated by us, may not be comparable to similarly titled, but variously calculated, measures of other REITs.
| FOURTH QUARTER AND FISCAL YEAR END 2018 SUPPLEMENTAL INFORMATION | 23 |
| FOR IMMEDIATE RELEASE | November 28, 2018 |
| | Contact: Susan Jordan |
| | 732-577-9996 |
MONMOUTH REAL ESTATE REPORTS RESULTS FOR
THE FISCAL YEAR ENDED AND THE FOURTH QUARTER ENDED SEPTEMBER 30, 2018
FREEHOLD, NJ, November 28, 2018........ Monmouth Real Estate Investment Corporation (NYSE:MNR) reported Net Income Attributable to Common Shareholders of $38,815,000 or $0.49 per diluted share for the fiscal year ended September 30, 2018 as compared to $22,942,000 or $0.32 per diluted share for the fiscal year ended September 30, 2017, representing an increase in Net Income Attributable to Common Shareholders per share of 53.1%. The increase in Net Income Attributable to Common Shareholders was mostly attributable to the $18,541,000 increase in Net Operating Income (NOI). Funds From Operations (FFO) were $69,842,000 or $0.89 per diluted share for the fiscal year ended September 30, 2018 as compared to $54,443,000 or $0.75 per diluted share for the fiscal year ended September 30, 2017, representing an increase in FFO per share of 18.7%. Core Funds from Operations (Core FFO) were $69,842,000 or $0.89 per diluted share for the fiscal year ended September 30, 2018 as compared to $57,088,000 or $0.79 per diluted share for the fiscal year ended September 30, 2017, representing an increase in Core FFO per share of 12.7%. Adjusted Funds from Operations (AFFO), for the fiscal year ended September 30, 2018 were $68,375,000 or $0.87 per diluted share versus $54,880,000 or $0.76 per diluted share for the fiscal year ended September 30, 2017, representing an increase in AFFO per share of 14.5%.
Net Income Attributable to Common Shareholders for the three months ended September 30, 2018 was $7,782,000 or $0.10 per diluted share as compared to $6,726,000 or $0.09 per diluted share for the three months ended September 30, 2017, representing an increase in Net Income Attributable to Common Shareholders per share of 11.1%. FFO and Core FFO were $18,090,000 or $0.22 per diluted share for the three months ended September 30, 2018 as compared to $15,395,000 or $0.21 per diluted share for the three months ended September 30, 2017, representing an increase in FFO per share and Core FFO per share of 4.8%. AFFO for the three months ended September 30, 2018 was $17,708,000 or $0.22 per diluted share versus $15,470,000 or $0.21 per diluted share for the three months ended September 30, 2017, representing an increase in AFFO per share of 4.8%.
A summary of significant financial information for the three and twelve months ended September 30, 2018 and 2017 is as follows:
| | | Three Months Ended September 30, | |
| | | 2018 | | | 2017 | |
| Rental Revenue | | $ | 30,306,000 | | | $ | 26,368,000 | |
| Reimbursement Revenue | | $ | 6,295,000 | | | $ | 4,789,000 | |
| Net Operating Income (NOI) (1) | | $ | 30,174,000 | | | $ | 26,047,000 | |
| Total Expenses | | $ | 19,472,000 | | | $ | 16,294,000 | |
| Dividend and Interest Income | | $ | 3,740,000 | | | $ | 2,300,000 | |
| Gain on Sale of Securities Transactions | | $ | -0- | | | $ | 18,000 | |
| Net Income | | $ | 12,160,000 | | | $ | 10,262,000 | |
| Net Income Attributable to Common Shareholders | | $ | 7,782,000 | | | $ | 6,726,000 | |
| Net Income Attributable to Common Shareholders Per Diluted Common Share | | $ | 0.10 | | | $ | 0.09 | |
| FFO (1) | | $ | 18,090,000 | | | $ | 15,395,000 | |
| FFO per Diluted Common Share (1) | | $ | 0.22 | | | $ | 0.21 | |
| Core FFO (1) | | $ | 18,090,000 | | | $ | 15,395,000 | |
| Core FFO per Diluted Common Share (1) | | $ | 0.22 | | | $ | 0.21 | |
| AFFO (1) | | $ | 17,708,000 | | | $ | 15,470,000 | |
| AFFO per Diluted Common Share (1) | | $ | 0.22 | | | $ | 0.21 | |
| Dividends Declared per Common Share | | $ | 0.17 | | | $ | 0.16 | |
| | | | | | | | | |
| Weighted Avg. Diluted Common Shares Outstanding | | | 80,889,000 | | | | 74,800,000 | |
| | | Twelve Months Ended September 30, | |
| | | 2018 | | | 2017 | |
| Rental Revenue | | $ | 115,864,000 | | | $ | 97,660,000 | |
| Reimbursement Revenue | | $ | 23,298,000 | | | $ | 18,726,000 | |
| Lease Termination Income | | $ | 210,000 | | | $ | -0- | |
| Net Operating Income (NOI) (1) | | $ | 114,772,000 | | | $ | 96,231,000 | |
| Total Expenses | | $ | 71,734,000 | | | $ | 59,602,000 | |
| Dividend and Interest Income | | $ | 13,120,000 | | | $ | 6,931,000 | |
| Gain on Sale of Securities Transactions | | $ | 111,000 | | | $ | 2,312,000 | |
| Gain on Sale of Real Estate Investments | | $ | 7,485,000 | | | $ | -0- | |
| Net Income | | $ | 56,006,000 | | | $ | 40,271,000 | |
| Net Income Attributable to Common Shareholders | | $ | 38,815,000 | | | $ | 22,942,000 | |
| Net Income Attributable to Common Shareholders Per Diluted Common Share | | $ | 0.49 | | | $ | 0.32 | |
| FFO (1) | | $ | 69,842,000 | | | $ | 54,443,000 | |
| FFO per Diluted Common Share (1) | | $ | 0.89 | | | $ | 0.75 | |
| Core FFO (1) | | $ | 69,842,000 | | | $ | 57,088,000 | |
| Core FFO per Diluted Common Share (1) | | $ | 0.89 | | | $ | 0.79 | |
| AFFO (1) | | $ | 68,375,000 | | | $ | 54,880,000 | |
| AFFO per Diluted Common Share (1) | | $ | 0.87 | | | $ | 0.76 | |
| Dividends Declared per Common Share | | $ | 0.68 | | | $ | 0.64 | |
| | | | | | | | | |
| Weighted Avg. Diluted Common Shares Outstanding | | | 78,802,000 | | | | 72,250,000 | |
| FOURTH QUARTER AND FISCAL YEAR END 2018 SUPPLEMENTAL INFORMATION | 24 |
A summary of significant balance sheet information as of September 30, 2018 and 2017 is as follows:
| | | September 30, 2018 | | | September 30, 2017 | |
| Net Real Estate Investments | | $ | 1,512,513,000 | | | $ | 1,260,830,000 | |
| Securities Available for Sale at Fair Value | | $ | 154,921,000 | | | $ | 123,765,000 | |
| Total Assets | | $ | 1,718,378,000 | | | $ | 1,443,038,000 | |
| Fixed Rate Mortgage Notes Payable, net of Unamortized Debt Issuance Costs | | $ | 711,546,000 | | | $ | 591,364,000 | |
| Loans Payable | | $ | 186,609,000 | | | $ | 120,091,000 | |
| Total Shareholders’ Equity | | $ | 797,906,000 | | | $ | 712,866,000 | |
Michael P. Landy, President and CEO, commented on the results for the fiscal year 2018,
“Fiscal 2018 was a very productive year for Monmouth. We executed exceptionally well and our achievements were many. During the year, we accomplished the following:
Solid Financial Results
| ● | Generated 53% per share growth in Net Income Attributable to Common Shareholders |
| | | |
| ● | Increased our per share FFO to $0.89, representing an 18.7% increase over the prior year |
| | | |
| ● | Increased our per share AFFO to $0.87, representing a 14.5% increase over the prior year |
| | | |
| ● | Increased our Gross Revenue by 23.5% to $152.3 million |
| | | |
| ● | Increased our Net Operating Income by 19.3% to $114.8 million |
| | | |
| ● | Increased our common stock dividend by 6.3% on October 2, 2017, representing our second dividend increase in three years |
Strong Growth Record and Solid Pipeline
| ● | Acquired 2.7 million square feet of high-quality industrial space for $282.3 million, generating $17.4 million in rental revenue, comprising seven brand new Class A, built-to-suit properties, all leased long-term, of which 85% is leased to investment-grade tenants |
| | | |
| ● | Completed two expansions totaling $3.5 million, generating $367,000 in additional rental revenue, and resulting in 10-year lease extensions for both properties |
| | | |
| ● | Increased our gross leasable area (GLA) by 12.7% year-over-year, to 21.2 million square feet |
| | | |
| ● | Entered into commitments to acquire three new build-to-suit properties containing approximately 745,000 total square feet for a total cost of $154.0 million, of which one 347,145 square foot property was acquired for $85.2 million subsequent to fiscal yearend |
Strong Portfolio Performance
| ● | Renewed 11 of the 16 leases scheduled to expire in fiscal 2018, including one short term renewal |
| | | |
| ● | Renewed 10 leases comprising 972,000 square feet for a weighted-average lease term of 6.8 years and resulting in an increase in the weighted-average lease rate of 4.1% on a U.S. GAAP straight-line basis and a 2.8% increase on a cash basis |
| | | |
| ● | Sold four properties generating a realized gain of $7.5 million on a GAAP basis, and a $1.2 million gain over our original undepreciated cost |
| | | |
| ● | Increased our sector-leading occupancy rate by 30 basis points to 99.6% as of the current fiscal yearend, up from 99.3% as of the prior fiscal yearend, representing our third consecutive year with above 99% occupancy |
| | | |
| ● | Extended our weighted average lease maturity to 8.1 years as of the current fiscal yearend from 7.9 years as of the prior fiscal yearend |
Compelling Returns and Strengthened Capitalization
| ● | Achieved an 8% total shareholder return for fiscal 2018, versus a 4% total return for the MSCI US REIT Index during the same period |
| | | |
| ● | Achieved $2.5 billion in total market capitalization as of September 30, 2018, representing a 17% increase over the prior year |
| | | |
| ● | Raised $90.0 million in equity through our Dividend Reinvestment and Stock Purchase Plan |
| | | |
| ● | Raised $40.1 million in net proceeds through our 6.125% Series C Perpetual Preferred Stock ATM Program |
| | | |
| ● | Extended the weighted-average debt maturity on our fixed-rate debt to 11.7 years |
| | | |
| ● | Reduced the weighted-average interest rate on our fixed-rate debt to 4.1% from 4.2% |
| | | |
| ● | Reduced our General and Administrative expenses as a percentage of gross revenue by 8% to 5.8% for fiscal year 2018, and as a percentage of undepreciated assets by 4% to 46 basis points.” |
| FOURTH QUARTER AND FISCAL YEAR END 2018 SUPPLEMENTAL INFORMATION | 25 |
Mr. Landy stated, “On behalf of the hard-working team at Monmouth, I am happy to report these excellent results. The above metrics reflect a strong Company that has continued to enhance its position over the year. Our business model of investing in well-located, modern industrial buildings, leased primarily to investment-grade tenants, has provided our shareholders with reliable returns throughout the business cycle. The high-quality of our portfolio is evidenced by our sector-leading 99.6% occupancy rate.”
“During fiscal 2018, we grew our gross leasable area (GLA) by 13% through the acquisition of seven brand-new Class A, built-to-suit properties for an aggregate cost of $282.3 million. We also completed two property expansions which resulted in 10-year lease extensions for both properties. Approximately 80% of our total rental revenue is generated from investment-grade tenants with the remaining 20% secured by very strong unrated companies. Our property portfolio has a weighted-average building age of 8.7 years, and a weighted-average lease maturity of 8.1 years. We have assembled a modern industrial portfolio that contains large amounts of excess land to accommodate future growth. These are highly-automated industrial assets that are mission-critical to our tenants’ operations.”
“During the fiscal year, we raised $90 million in equity capital through our Dividend Reinvestment and Stock Purchase Plan. Of this amount, a total of $12.9 million in dividends was reinvested, representing a 24% participation rate. We also sold 1.65 million shares of our 6.125% Series C preferred stock through our ATM program generating net proceeds of $40.1 million. Subsequent to fiscal yearend, in October, we completed our first common stock offering since 2014, with the sale of 9.2 million shares that generated net proceeds of $132.3 million. Looking ahead, Monmouth is very well capitalized to continue to execute our qualitative growth strategy.”
“Subsequent to fiscal yearend, we also acquired a newly constructed built-to-suit property containing 347,000 square feet for $85.2 million. This brings our current portfolio to a total of 112 properties containing 21.5 million square feet, geographically diversified across 30 states. Our acquisition pipeline now comprises two brand new build-to-suit, industrial buildings that are currently being developed in Georgia and North Carolina. These two pipeline transactions total approximately 398,000 square feet for an aggregate purchase price of $68.7 million, and are scheduled to close during the first quarter of fiscal 2019 and the first half of fiscal 2020.”
“At the turn of the century, we anticipated that with the widespread growth of ecommerce, our property type would gain market share from the retail sector. Today, demand for industrial assets has never been stronger. We are now in our fourth consecutive year with an occupancy rate above 99%. Fiscal 2019 is poised to be another successful year at Monmouth. We look forward to reporting on our progress throughout the year.”
Monmouth Real Estate Investment Corporation will host its Fourth Quarter and FY 2018 Financial Results Webcast and Conference Call on Thursday, November 29, 2018 at 10:00 a.m. Eastern Time. Senior management will discuss the results, current market conditions and future outlook.
Our Fourth Quarter and FY 2018 financial results being released herein will be available on our website atwww.mreic.reit in the Investor Relations section, under Filings and Reports.
To participate in theWebcast, select the4Q2018 and Fiscal Yearend Webcast and Earnings Call “Link to Webcast” on the homepage of our website atwww.mreic.reit, in the Highlights section, which is located towards the bottom of the homepage. Interested parties can also participate viaconference call by calling toll free 1-877-510-5852 (domestically) or 1-412-902-4138 (internationally).
The replay of the conference call will be available at 12:00 p.m. Eastern Time on Thursday, November 29, 2018. It will be available until February 1, 2019, and can be accessed by dialing toll free 1-877-344-7529 (domestically) and 1-412-317-0088 (internationally) and entering the passcode 10123229. A transcript of the call and the webcast replay will be available at our website on the Investor Relations homepage,www.mreic.reit.
Monmouth Real Estate Investment Corporation, founded in 1968, is one of the oldest public equity REITs in the world. We specialize in single tenant, net-leased industrial properties, subject to long-term leases, primarily to investment-grade tenants. Monmouth Real Estate is a fully integrated and self-managed real estate company, whose property portfolio consists of 112 properties containing a total of approximately 21.5 million rentable square feet, geographically diversified across 30 states. In addition, we own a portfolio of REIT securities.
Certain statements included in this press release which are not historical facts may be deemed forward-looking statements within the meaning of the Private Securities Litigation Reform Act of 1995. Any such forward-looking statements are based on our current expectations and involve various risks and uncertainties. Although we believe the expectations reflected in any forward-looking statements are based on reasonable assumptions, we can provide no assurance those expectations will be achieved. The risks and uncertainties that could cause actual results or events to differ materially from expectations are contained in our annual report on Form 10-K and described from time to time in our other filings with the SEC. We undertake no obligation to publicly update or revise any forward-looking statements whether as a result of new information, future events, or otherwise.
Notes:
(1) Non-U.S. GAAP Information: FFO is defined by the National Association of Real Estate Investment Trusts (“NAREIT”) as net income applicable to common shareholders, excluding gains or losses from sales of depreciable assets, plus real estate-related depreciation and amortization. We define Core FFO as FFO plus acquisition costs and costs associated with the redemption of preferred stock. We define AFFO as Core FFO, excluding lease termination income, net gain or loss on sale of securities transactions, stock based compensation expense, depreciation of corporate office tenant improvements, amortization of deferred financing costs, non-recurring other expense, non-cash U.S. GAAP straight-line rent adjustments and less recurring capital expenditures. We define recurring capital expenditures as all capital expenditures that are recurring in nature, excluding capital expenditures related to expansions at our current locations or capital expenditures that are incurred in conjunction with obtaining a new lease or a lease renewal. We define NOI as recurring rental and reimbursement revenues less real estate taxes and other operating expenses. FFO, Core FFO and AFFO per diluted common share are defined as FFO, Core FFO and AFFO divided by weighted average diluted common shares outstanding. FFO, Core FFO and AFFO per diluted common share, as well as NOI, should be considered as supplemental measures of operating performance used by real estate investment trusts (REITs). FFO, Core FFO and AFFO per diluted common share exclude historical cost depreciation as an expense and may facilitate the comparison of REITs which have different cost basis. However, other REITs may use different methodologies to calculate FFO, Core FFO and AFFO and, accordingly, our FFO, Core FFO and AFFO may not be comparable to all other REITs. The items excluded from FFO, Core FFO and AFFO per diluted common share are significant components in understanding our financial performance.
| FOURTH QUARTER AND FISCAL YEAR END 2018 SUPPLEMENTAL INFORMATION | 26 |
FFO, Core FFO and AFFO per diluted common share (A) do not represent cash flow from operations as defined by accounting principles generally accepted in the United States of America; (B) should not be considered as an alternative to net income as a measure of operating performance or to cash flows from operating, investing and financing activities; and (C) are not alternatives to cash flow as a measure of liquidity. FFO, Core FFO and AFFO per diluted common share, as well as NOI, as calculated by us, may not be comparable to similarly titled measures reported by other REITs.
The following is a reconciliation of our U.S. GAAP Net Income to our FFO, Core FFO and AFFO for the three and twelve months ended September 30, 2018 and 2017:
| | | Three Months Ended | | | Twelve Months Ended | |
| | | 9/30/2018 | | | 9/30/2017 | | | 9/30/2018 | | | 9/30/2017 | |
| Net Income Attributable to Common Shareholders | | $ | 7,782,000 | | | $ | 6,726,000 | | | $ | 38,815,000 | | | $ | 22,942,000 | |
| Plus: Depreciation Expense (excluding Corporate Office Capitalized Costs) | | | 9,632,000 | | | | 8,146,000 | | | | 36,018,000 | | | | 29,479,000 | |
| Plus: Amortization of Intangible Assets | | | 455,000 | | | | 301,000 | | | | 1,614,000 | | | | 1,072,000 | |
| Plus: Amortization of Capitalized Lease Costs | | | 221,000 | | | | 222,000 | | | | 880,000 | | | | 855,000 | |
| Less: (Gain) / Plus: Loss on Sale of Real Estate Investments | | | -0- | | | | -0- | | | | (7,485,000 | ) | | | 95,000 | |
| FFO Attributable to Common Shareholders | | | 18,090,000 | | | | 15,395,000 | | | | 69,842,000 | | | | 54,443,000 | |
| Plus: Acquisition Costs | | | -0- | | | | -0- | | | | -0- | | | | 178,000 | |
| Plus: Redemption of Preferred Stock | | | -0- | | | | -0- | | | | -0- | | | | 2,467,000 | |
| Core FFO Attributable to Common Shareholders | | | 18,090,000 | | | | 15,395,000 | | | | 69,842,000 | | | | 57,088,000 | |
| Plus: Stock Compensation Expense | | | 95,000 | | | | 184,000 | | | | 434,000 | | | | 625,000 | |
| Plus: Depreciation of Corporate Office Capitalized Costs | | | 39,000 | | | | 39,000 | | | | 158,000 | | | | 157,000 | |
| Plus: Amortization of Financing Costs | | | 310,000 | | | | 285,000 | | | | 1,220,000 | | | | 1,234,000 | |
| Less: Lease Termination Income | | | -0- | | | | -0- | | | | (210,000 | ) | | | -0- | |
| Less: Gain on Sale of Securities Transactions | | | -0- | | | | (18,000 | ) | | | (111,000 | ) | | | (2,312,000 | ) |
| Less: Effect of Non-cash U.S. GAAP Straight-line Rent Adjustment | | | (615,000 | ) | | | (103,000 | ) | | | (1,973,000 | ) | | | (1,028,000 | ) |
| Less: Recurring Capital Expenditures | | | (211,000 | ) | | | (312,000 | ) | | | (985,000 | ) | | | (884,000 | ) |
| AFFO Attributable to Common Shareholders | | $ | 17,708,000 | | | $ | 15,470,000 | | | $ | 68,375,000 | | | $ | 54,880,000 | |
The following are the Cash Flows provided (used) by Operating, Investing and Financing Activities for the twelve months ended September 30, 2018 and 2017:
| | | Twelve Months Ended | |
| | | 9/30/2018 | | | 9/30/2017 | |
| | | | | | | |
| Operating Activities | | $ | 85,529,000 | | | $ | 73,868,000 | |
| Investing Activities | | | (332,513,000 | ) | | | (339,071,000 | ) |
| Financing Activities | | | 246,083,000 | | | | 179,680,000 | |
# # # # #
| FOURTH QUARTER AND FISCAL YEAR END 2018 SUPPLEMENTAL INFORMATION | 27 |