Exhibit 99

Table of Contents
The statement of operations and supplemental statement of operations provided in this supplemental information package present funds from operations (FFO), adjusted funds from operations (AFFO), net operating income (NOI) and adjusted EBITDA, which are REIT industry financial measures that are not calculated in accordance with accounting principles generally accepted in the United States. Please see page 21 for a definition of these supplemental performance measures. Please see the supplemental statement of operations reconciliation for a reconciliation of certain captions in the supplemental statement of operations reported in this supplemental information package to the statement of operations as reported in the Company’s filings with the SEC on Form 10-Q.
Consolidated Balance Sheets
(in thousands except for per share amounts)
| | | As of | | | As of | |
| | | June 30, | | | September 30, | |
| | | 2020 | | | 2019 | |
| | | (unaudited) | | | | |
| ASSETS | | | | | | | | |
| Real Estate Investments: | | | | | | | | |
| Land | | $ | 249,118 | | | $ | 239,299 | |
| Buildings and Improvements | | | 1,778,055 | | | | 1,627,219 | |
| Total Real Estate Investments | | | 2,027,173 | | | | 1,866,518 | |
| Accumulated Depreciation | | | (284,058 | ) | | | (249,584 | ) |
| Real Estate Investments | | | 1,743,115 | | | | 1,616,934 | |
| | | | | | | | | |
| Cash and Cash Equivalents | | | 12,104 | | | | 20,179 | |
| Securities Available for Sale at Fair Value | | | 118,877 | | | | 185,250 | |
| Tenant and Other Receivables | | | 2,565 | | | | 1,335 | |
| Straight-line Rent Receivable | | | 12,453 | | | | 11,199 | |
| Prepaid Expenses | | | 8,957 | | | | 6,714 | |
| Intangible Assets, net of Accumulated Amortization of $17,225 and $15,686, respectively | | | 17,154 | | | | 14,970 | |
| Capitalized Lease Costs, net of Accumulated Amortization of $4,184 and $3,378, respectively | | | 5,860 | | | | 5,670 | |
| Financing Costs, net of Accumulated Amortization of $259 and $1,352, respectively | | | 1,477 | | | | 144 | |
| Other Assets | | | 8,863 | | | | 9,553 | |
| TOTAL ASSETS | | $ | 1,931,425 | | | $ | 1,871,948 | |
| | | | | | | | | |
| LIABILITIES AND SHAREHOLDERS’ EQUITY | | | | | | | | |
| | | | | | | | | |
| Liabilities: | | | | | | | | |
| Fixed Rate Mortgage Notes Payable, net of Unamortized Debt Issuance Costs | | $ | 804,342 | | | $ | 744,928 | |
| Loans Payable | | | 80,000 | | | | 95,000 | |
| Accounts Payable and Accrued Expenses | | | 4,177 | | | | 3,570 | |
| Other Liabilities | | | 19,121 | | | | 17,407 | |
| Total Liabilities | | | 907,640 | | | | 860,905 | |
| | | | | | | | | |
| COMMITMENTS AND CONTINGENCIES | | | | | | | | |
| | | | | | | | | |
| Shareholders’ Equity: | | | | | | | | |
| 6.125% Series C Cumulative Redeemable Preferred Stock, $0.01 Par Value Per Share: 21,900 and 16,400 Shares Authorized as of June 30, 2020 and September 30, 2019, respectively; 17,354 and 13,907 Shares Issued and Outstanding as of June 30, 2020 and September 30, 2019, respectively | | | 433,850 | | | | 347,678 | |
| Common Stock, $0.01 Par Value Per Share: 200,000 and 188,040 Shares Authorized as of June 30, 2020 and September 30, 2019, respectively; 97,972 and 96,399 Shares Issued and Outstanding as of June 30, 2020 and September 30, 2019, respectively | | | 980 | | | | 964 | |
| Excess Stock, $0.01 Par Value Per Share: 200,000 Shares Authorized as of June 30, 2020 and September 30, 2019; No Shares Issued or Outstanding as of June 30, 2020 and September 30, 2019 | | | -0- | | | | -0- | |
| Additional Paid-In Capital | | | 588,955 | | | | 662,401 | |
| Undistributed Income | | | -0- | | | | -0- | |
| Total Shareholders’ Equity | | | 1,023,785 | | | | 1,011,043 | |
| TOTAL LIABILITIES & SHAREHOLDERS’ EQUITY | | $ | 1,931,425 | | | $ | 1,871,948 | |
 THIRD QUARTER FISCAL YEAR 2020 SUPPLEMENTAL INFORMATION THIRD QUARTER FISCAL YEAR 2020 SUPPLEMENTAL INFORMATION | 3 |
Consolidated Statements of Income (Loss)
(unaudited) (in thousands)
| | | For The | | | For The | |
| | | Three Months Ended | | | Nine Months Ended | |
| | | 6/30/2020 | | | 6/30/2019 | | | 6/30/2020 | | | 6/30/2019 | |
| INCOME: | | | | | | | | | | | | | | | | |
| Rental Revenue | | $ | 35,427 | | | $ | 33,127 | | | $ | 105,410 | | | $ | 98,678 | |
| Reimbursement Revenue | | | 6,348 | | | | 5,421 | | | | 19,772 | | | | 16,473 | |
| TOTAL INCOME | | | 41,775 | | | | 38,548 | | | | 125,182 | | | | 115,151 | |
| | | | | | | | | | | | | | | | | |
| EXPENSES: | | | | | | | | | | | | | | | | |
| Real Estate Taxes | | | 5,140 | | | | 4,168 | | | | 15,205 | | | | 12,370 | |
| Operating Expenses | | | 1,427 | | | | 1,649 | | | | 5,258 | | | | 5,186 | |
| General & Administrative Expenses | | | 2,198 | | | | 2,351 | | | | 6,858 | | | | 6,420 | |
| Non-recurring Severance Expense | | | -0- | | | | -0- | | | | 786 | | | | -0- | |
| Depreciation | | | 11,743 | | | | 10,833 | | | | 34,650 | | | | 32,067 | |
| Amortization of Capitalized Lease Costs and Intangible Assets | | | 788 | | | | 721 | | | | 2,308 | | | | 2,144 | |
| TOTAL EXPENSES | | | 21,296 | | | | 19,722 | | | | 65,065 | | | | 58,187 | |
| | | | | | | | | | | | | | | | | |
| OTHER INCOME (EXPENSE): | | | | | | | | | | | | | | | | |
| Dividend Income | | | 2,344 | | | | 3,686 | | | | 8,987 | | | | 11,569 | |
| Unrealized Holding Gains (Losses) Arising During the Periods | | | 19,610 | | | | (11,609 | ) | | | (67,100 | ) | | | (38,668 | ) |
| Interest Expense, including Amortization of Financing Costs | | | (8,975 | ) | | | (9,275 | ) | | | (27,235 | ) | | | (27,879 | ) |
| TOTAL OTHER INCOME (EXPENSE) | | | 12,979 | | | | (17,198 | ) | | | (85,348 | ) | | | (54,978 | ) |
| | | | | | | | | | | | | | | | | |
| NET INCOME (LOSS) | | | 33,458 | | | | 1,628 | | | | (25,231 | ) | | | 1,986 | |
| | | | | | | | | | | | | | | | | |
| Less: Preferred Dividends | | | 6,607 | | | | 4,749 | | | | 19,469 | | | | 13,650 | |
| | | | | | | | | | | | | | | | | |
| NET INCOME (LOSS) ATTRIBUTABLE TO COMMON SHAREHOLDERS | | $ | 26,851 | | | $ | (3,121 | ) | | $ | (44,700 | ) | | $ | (11,664 | ) |
| THIRD QUARTER FISCAL YEAR 2020 SUPPLEMENTAL INFORMATION | 4 |
FFO, AFFO and Adjusted EBITDA Reconciliations
(unaudited) (in thousands)
| | | For The | | | For The | |
| | | Three Months Ended | | | Nine Months Ended | |
| | | 6/30/2020 | | | 6/30/2019 | | | 6/30/2020 | | | 6/30/2019 | |
| FFO, AFFO | | | | | | | | | | | | | | | | |
| Net Income (Loss) Attributable to Common Shareholders | | $ | 26,851 | | | $ | (3,121 | ) | | $ | (44,700 | ) | | $ | (11,664 | ) |
| Less/Plus: Unrealized Holding (Gains) Losses Arising During the Periods | | | (19,610 | ) | | | 11,609 | | | | 67,100 | | | | 38,668 | |
| Plus: Depreciation Expense (excluding Corporate Office Capitalized Costs) | | | 11,685 | | | | 10,665 | | | | 34,474 | | | | 31,692 | |
| Plus: Amortization of Intangible Assets | | | 524 | | | | 490 | | | | 1,539 | | | | 1,495 | |
| Plus: Amortization of Capitalized Lease Costs | | | 290 | | | | 256 | | | | 846 | | | | 726 | |
| FFO Attributable to Common Shareholders | | | 19,740 | | | | 19,899 | | | | 59,259 | | | | 60,917 | |
| Plus: Depreciation of Corporate Office Capitalized Costs | | | 57 | | | | 168 | | | | 176 | | | | 376 | |
| Plus: Stock Compensation Expense | | | 98 | | | | 231 | | | | 368 | | | | 574 | |
| Plus: Amortization of Financing Costs | | | 327 | | | | 319 | | | | 1,084 | | | | 956 | |
| Plus: Non-recurring Severance Expense | | | -0- | | | | -0- | | | | 786 | | | | -0- | |
| Less: Recurring Capital Expenditures | | | (508 | ) | | | (702 | ) | | | (1,443 | ) | | | (1,888 | ) |
| Less: Effect of Non-cash U.S. GAAP Straight-line Rent Adjustment | | | (226 | ) | | | (527 | ) | | | (1,459 | ) | | | (1,352 | ) |
| AFFO Attributable to Common Shareholders | | $ | 19,488 | | | $ | 19,388 | | | $ | 58,771 | | | $ | 59,583 | |
| | | For The | | | For The | |
| | | Three Months Ended | | | Nine Months Ended | |
| | | 6/30/2020 | | | 6/30/2019 | | | 6/30/2020 | | | 6/30/2019 | |
| Adjusted EBITDA | | | | | | | | | | | | |
| Net Income (Loss) Attributable to Common Shareholders | | $ | 26,851 | | | $ | (3,121 | ) | | $ | (44,700 | ) | | $ | (11,664 | ) |
| Plus: Preferred Dividends | | | 6,607 | | | | 4,749 | | | | 19,469 | | | | 13,650 | |
| Plus: Interest Expense, including Amortization of Financing Costs | | | 8,975 | | | | 9,275 | | | | 27,235 | | | | 27,879 | |
| Plus: Depreciation and Amortization | | | 12,531 | | | | 11,554 | | | | 36,958 | | | | 34,211 | |
| Plus: Net Amortization of Acquired Above and Below Market Lease Revenue | | | 26 | | | | 26 | | | | 77 | | | | 77 | |
| Less/Plus: Unrealized Holding (Gains) Losses Arising During the Periods | | | (19,610 | ) | | | 11,609 | | | | 67,100 | | | | 38,668 | |
| Adjusted EBITDA | | $ | 35,380 | | | $ | 34,092 | | | $ | 106,139 | | | $ | 102,821 | |
| THIRD QUARTER FISCAL YEAR 2020 SUPPLEMENTAL INFORMATION | 5 |
NOI Reconciliations
(unaudited) (in thousands)
| | | For The | | | For The | |
| | | Three Months Ended | | | Nine Months Ended | |
| | 6/30/2020 | | | 6/30/2019 | | | 6/30/2020 | | | 6/30/2019 | |
| Net Operating Income | | | | | | | | | | | | |
| Net Income (Loss) Attributable to Common Shareholders | | $ | 26,851 | | | $ | (3,121 | ) | | $ | (44,700 | ) | | $ | (11,664 | ) |
| Plus: Preferred Dividends | | | 6,607 | | | | 4,749 | | | | 19,469 | | | | 13,650 | |
| Plus: General & Administrative Expenses | | | 2,198 | | | | 2,351 | | | | 6,858 | | | | 6,420 | |
| Plus: Non-recurring Severance Expense | | | -0- | | | | -0- | | | | 786 | | | | -0- | |
| Plus: Depreciation | | | 11,743 | | | | 10,833 | | | | 34,650 | | | | 32,067 | |
| Plus: Amortization of Capitalized Lease Costs and Intangible Assets | | | 788 | | | | 721 | | | | 2,308 | | | | 2,144 | |
| Plus: Interest Expense, including Amortization of Financing Costs | | | 8,975 | | | | 9,275 | | | | 27,235 | | | | 27,879 | |
| Less/Plus: Unrealized Holding (Gains) Losses Arising During the Periods | | | (19,610 | ) | | | 11,609 | | | | 67,100 | | | | 38,668 | |
| Less: Dividend Income | | | (2,344 | ) | | | (3,686 | ) | | | (8,987 | ) | | | (11,569 | ) |
| Net Operating Income – NOI | | $ | 35,208 | | | $ | 32,731 | | | $ | 104,719 | | | $ | 97,595 | |
| | | For The | | | For The | |
| | | Three Months Ended | | | Nine Months Ended | |
| | 6/30/2020 | | | 6/30/2019 | | | 6/30/2020 | | | 6/30/2019 | |
| Components of Net Operating Income Consists of: | | | | | | | | | | | | | | | | |
| Revenues: | | | | | | | | | | | | | | | | |
| Rental Revenue | | $ | 35,427 | | | $ | 33,127 | | | $ | 105,410 | | | $ | 98,678 | |
| Reimbursement Revenue | | | 6,348 | | | | 5,421 | | | | 19,772 | | | | 16,473 | |
| Total Rental and Reimbursement Revenue | | | 41,775 | | | | 38,548 | | | | 125,182 | | | | 115,151 | |
| | | | | | | | | | | | | | | | | |
| Expenses: | | | | | | | | | | | | | | | | |
| Real Estate Taxes | | | 5,140 | | | | 4,168 | | | | 15,205 | | | | 12,370 | |
| Operating Expenses | | | 1,427 | | | | 1,649 | | | | 5,258 | | | | 5,186 | |
| Total Real Estate Taxes and Operating Expenses | | | 6,567 | | | | 5,817 | | | | 20,463 | | | | 17,556 | |
| Net Operating Income – NOI | | $ | 35,208 | | | $ | 32,731 | | | $ | 104,719 | | | $ | 97,595 | |
| THIRD QUARTER FISCAL YEAR 2020 SUPPLEMENTAL INFORMATION | 6 |
Financial Highlights
(unaudited) (in thousands except for per share amounts)
| | | For The | | | For The | |
| | | Three Months Ended | | | Nine Months Ended | |
| | | 6/30/2020 | | | 6/30/2019 | | | Change (%) | | | 6/30/2020 | | | 6/30/2019 | | | Change (%) | |
| | | | | | | | | | | | | | | | | | | |
| Weighted Average Common Shares Outstanding | | | | | | | | | | | | | | | | | | | | | | | | |
| Basic | | | 97,906 | | | | 94,399 | | | | 3.7 | % | | | 97,548 | | | | 92,619 | | | | 5.3 | % |
| Diluted | | | 97,962 | | | | 94,493 | | | | 3.7 | % | | | 97,626 | | | | 92,719 | | | | 5.3 | % |
| | | | | | | | | | | | | | | | | | | | | | | | | |
| Net Income (Loss) Attributable to Common Shareholders | | $ | 26,851 | | | $ | (3,121 | ) | | | 960.3 | % | | $ | (44,700 | ) | | $ | (11,664 | ) | | | (283.2 | )% |
| | | | | | | | | | | | | | | | | | | | | | | | | |
| Basic | | $ | 0.27 | | | $ | (0.03 | ) | | | 1,000.0 | % | | $ | (0.46 | ) | | $ | (0.13 | ) | | | (253.8 | )% |
| Diluted | | | 0.27 | | | | (0.03 | ) | | | 1,000.0 | % | | | (0.46 | ) | | | (0.13 | ) | | | (253.8 | )% |
| | | | | | | | | | | | | | | | | | | | | | | | | |
| Net Operating Income – NOI | | $ | 35,208 | | | $ | 32,731 | | | | 7.6 | % | | $ | 104,719 | | | $ | 97,595 | | | | 7.3 | % |
| | | | | | | | | | | | | | | | | | | | | | | | | |
| Basic | | $ | 0.36 | | | $ | 0.35 | | | | 2.9 | % | | $ | 1.07 | | | $ | 1.05 | | | | 1.9 | % |
| Diluted | | | 0.36 | | | | 0.35 | | | | 2.9 | % | | | 1.07 | | | | 1.05 | | | | 1.9 | % |
| | | | | | | | | | | | | | | | | | | | | | | | | |
| Funds From Operations – FFO | | $ | 19,740 | | | $ | 19,899 | | | | (0.8 | )% | | $ | 59,259 | | | $ | 60,917 | | | | (2.7 | )% |
| | | | | | | | | | | | | | | | | | | | | | | | | |
| Basic | | $ | 0.20 | | | $ | 0.21 | | | | (4.8 | )% | | $ | 0.61 | | | $ | 0.66 | | | | (7.6 | )% |
| Diluted | | | 0.20 | | | | 0.21 | | | | (4.8 | )% | | | 0.61 | | | | 0.66 | | | | (7.6 | )% |
| | | | | | | | | | | | | | | | | | | | | | | | | |
| Adjusted Funds From Operations – AFFO | | $ | 19,488 | | | $ | 19,388 | | | | 0.5 | % | | $ | 58,771 | | | | 59,583 | | | | (1.4 | )% |
| | | | | | | | | | | | | | | | | | | | | | | | | |
| Basic | | $ | 0.20 | | | $ | 0.21 | | | | (4.8 | )% | | $ | 0.60 | | | $ | 0.64 | | | | (6.3 | )% |
| Diluted | | | 0.20 | | | | 0.21 | | | | (4.8 | )% | | | 0.60 | | | | 0.64 | | | | (6.3 | )% |
| | | | | | | | | | | | | | | | | | | | | | | | | |
| Dividends Declared per Common Share | | $ | 0.17 | | | $ | 0.17 | | | | | | | $ | 0.51 | | | $ | 0.51 | | | | | |
| | | | | | | | | | | | | | | | | | | | | | | | | |
| Dividend/AFFO Payout Ratio | | | 85.0 | % | | | 81.0 | % | | | | | | | 85.0 | % | | | 79.7 | % | | | | |
| THIRD QUARTER FISCAL YEAR 2020 SUPPLEMENTAL INFORMATION | 7 |
Same Property Statistics
(unaudited) (in thousands except for square feet)
| | | For The Three Months Ended | | | | | | | |
| | | 6/30/2020 | | | | | | 6/30/2019 | | | Change | | | Change % | |
| | | | | | | | | | | | | | | | |
| Total Square Feet / Total Properties | | | 23,375,642 / 118 | | | | | | | | 21,802,835 / 113 | | | | 1,572,807 | | | | 7.2 | % |
| | | | | | | | | | | | | | | | | | | | | |
| Occupancy Percentage at End of Period | | | 99.4 | % | | | | | | | 98.9 | % | | | 50 bps | | | | 0.5 | % |
| | | | | | | | | | | | | | | | | | | | | |
| Same Property Square Feet / Number of Same Properties | | | | | | | 21,802,835 / 113 | | | | | | | | | | | | | |
| | | | | | | | | | | | | | | | | | | | | |
| Same Property Occupancy Percentage at End of Period | | | 99.4 | % | | | | | | | 98.9 | % | | | 50 bps | | | | 0.5 | % |
| | | | | | | | | | | | | | | | | | | | | |
| Same Property Net Operating Income (NOI) (GAAP) | | $ | 32,792 | | | | | | | $ | 32,731 | | | $ | 61 | | | | 0.2 | % |
| | | | | | | | | | | | | | | | | | | | | |
| Reversal of Effect of Non-cash U.S. GAAP Straight-line Rent Adjustment | | | (34 | ) | | | | | | | (527 | ) | | | 493 | | | | | |
| Same Property Cash NOI | | $ | 32,758 | | | | | | | $ | 32,204 | | | $ | 554 | | | | 1.7 | % |
Same Property Statistics include all properties owned during the entire periods presented with the exclusion of properties expanded during the periods presented.
Reconciliation of Same Property NOI to Total NOI
(unaudited) (in thousands)
| | | For The Three Months Ended | | | | | | | |
| | | 6/30/2020 | | | 6/30/2019 | | | Change | | | Change % | |
| | | | | | | | | | | | | |
| Same Property NOI (GAAP) | | $ | 32,792 | | | $ | 32,731 | | | $ | 61 | | | | 0.2 | % |
| | | | | | | | | | | | | | | | | |
| NOI of properties purchased subsequent to March 31, 2019 (one property purchased during fiscal 2019 and four properties purchased during fiscal 2020) | | | 2,416 | | | | 0 | | | | | | | | | |
| | | | | | | | | | | | | | | | | |
| NOI of property expanded subsequent to March 31, 2019 (no properties expanded during fiscal 2019 or fiscal 2020) | | | 0 | | | | 0 | | | | | | | | | |
| | | | | | | | | | | | | | | | | |
| Total NOI | | $ | 35,208 | | | $ | 32,731 | | | $ | 2,477 | | | | 7.6 | % |
| THIRD QUARTER FISCAL YEAR 2020 SUPPLEMENTAL INFORMATION | 8 |
Same Property Statistics
(unaudited) (in thousands except for square feet)
| | | For The Nine Months Ended | | | | | | | |
| | | 6/30/2020 | | | | | | 6/30/2019 | | | Change | | | Change % | |
| | | | | | | | | | | | | | | | |
| Total Square Feet / Total Properties | | | 23,375,642 / 118 | | | | | | | | 21,802,835 / 113 | | | | 1,572,807 | | | | 7.2 | % |
| | | | | | | | | | | | | | | | | | | | | |
| Occupancy Percentage at End of Period | | | 99.4 | % | | | | | | | 98.9 | % | | | 50 bps | | | | 0.5 | % |
| | | | | | | | | | | | | | | | | | | | | |
| Same Property Square Feet / Number of Same Properties | | | | | | | 21,040,215 / 110 | | | | | | | | | | | | | |
| | | | | | | | | | | | | | | | | | | | | |
| Same Property Occupancy Percentage at End of Period | | | 99.3 | % | | | | | | | 98.9 | % | | | 40 bps | | | | 0.4 | % |
| | | | | | | | | | | | | | | | | | | | | |
| Same Property Net Operating Income (NOI) (GAAP) | | $ | 92,228 | | | | | | | $ | 91,637 | | | $ | 591 | | | | 0.6 | % |
| | | | | | | | | | | | | | | | | | | | | |
| Reversal of Effect of Non-cash U.S. GAAP Straight-line Rent Adjustment | | | (844 | ) | | | | | | | (1,370 | ) | | | 526 | | | | | |
| Same Property Cash NOI | | $ | 91,384 | | | | | | | $ | 90,267 | | | $ | 1,117 | | | | 1.2 | % |
Same Property Statistics include all properties owned during the entire periods presented with the exclusion of properties expanded during the periods presented.
Reconciliation of Same Property NOI to Total NOI
(unaudited) (in thousands)
| | | For The Nine Months Ended | | | | | | | |
| | | 6/30/2020 | | | 6/30/2019 | | | Change | | | Change % | |
| | | | | | | | | | | | | |
| Same Property NOI (GAAP) | | $ | 92,228 | | | $ | 91,637 | | | $ | 591 | | | | 0.6 | % |
| | | | | | | | | | | | | | | | | |
NOI of properties purchased subsequent to
September 30, 2018 (three properties purchased during fiscal 2019 and four properties purchased during fiscal 2020) | | | 10,960 | | | | 4,846 | | | | | | | | | |
| | | | | | | | | | | | | | | | | |
NOI of property expanded subsequent to
September 30, 2018 (one property expanded during fiscal 2019) | | | 1,531 | | | | 1,112 | | | | | | | | | |
| | | | | | | | | | | | | | | | | |
| Total NOI | | $ | 104,719 | | | $ | 97,595 | | | $ | 7,124 | | | | 7.3 | % |
| THIRD QUARTER FISCAL YEAR 2020 SUPPLEMENTAL INFORMATION | 9 |
Consolidated Statements of Cash Flows
(unaudited)(in thousands)
| | | For The | |
| | | Nine Months Ended | |
| | | | 6/30/2020 | | | | 6/30/2019 | |
| CASH FLOWS FROM OPERATING ACTIVITIES | | | | | | | | |
| Net Income (Loss) | | $ | (25,231 | ) | | $ | 1,986 | |
| Noncash Items Included in Net Income (Loss): | | | | | | | | |
| Depreciation & Amortization | | | 38,043 | | | | 35,167 | |
| Deferred Straight Line Rent | | | (1,459 | ) | | | (1,352 | ) |
| Stock Compensation Expense | | | 368 | | | | 574 | |
| Securities Available for Sale Received as Dividend Income | | | (977 | ) | | | (651 | ) |
| Unrealized Holding Losses Arising During the Periods | | | 67,100 | | | | 38,668 | |
| Changes in: | | | | | | | | |
| Tenant & Other Receivables | | | (1,153 | ) | | | 664 | |
| Prepaid Expenses | | | (2,242 | ) | | | (1,185 | ) |
| Other Assets & Capitalized Lease Costs | | | (1,999 | ) | | | 173 | |
| Accounts Payable, Accrued Expenses & Other Liabilities | | | 2,482 | | | | 709 | |
| NET CASH PROVIDED BY OPERATING ACTIVITIES | | | 74,932 | | | | 74,753 | |
| | | | | | | | | |
| CASH FLOWS FROM INVESTING ACTIVITIES | | | | | | | | |
| Purchase of Real Estate & Intangible Assets | | | (160,023 | ) | | | (113,406 | ) |
| Capital Improvements | | | (4,726 | ) | | | (11,594 | ) |
| Return of Deposits on Real Estate | | | 2,000 | | | | 200 | |
| Deposits Paid on Acquisitions of Real Estate | | | (550 | ) | | | (6,400 | ) |
| Proceeds from Securities Available for Sale Called for Redemption | | | 250 | | | | -0- | |
| Purchase of Securities Available for Sale | | | -0- | | | | (54,136 | ) |
| NET CASH USED IN INVESTING ACTIVITIES | | | (163,049 | ) | | | (185,336 | ) |
| | | | | | | | | |
| CASH FLOWS FROM FINANCING ACTIVITIES | | | | | | | | |
| Net Repayments on Loans Payable | | | (15,000 | ) | | | (60,422 | ) |
| Proceeds from Fixed Rate Mortgage Notes Payable | | | 100,560 | | | | 72,500 | |
| Principal Payments on Fixed Rate Mortgage Notes Payable | | | (41,166 | ) | | | (50,180 | ) |
| Financing Costs Paid on Debt | | | (2,397 | ) | | | (444 | ) |
| Proceeds from the Exercise of Stock Options | | | 1,016 | | | | 567 | |
| Proceeds from Underwritten Public Offering of Common Stock, net of offering costs | | | -0- | | | | 132,338 | |
| Proceeds from At-The-Market 6.125% Series C Preferred Stock, net of offering costs | | | 84,815 | | | | 24,049 | |
| Proceeds from Issuance of Common Stock in the DRIP, net of Dividend Reinvestments | | | 18,641 | | | | 44,618 | |
| Shares repurchased through the Common Stock Repurchase Plan | | | (4,276 | ) | | | -0- | |
| Preferred Dividends Paid | | | (19,029 | ) | | | (13,520 | ) |
| Common Dividends Paid, net of Reinvestments | | | (43,122 | ) | | | (34,616 | ) |
| NET CASH PROVIDED BY FINANCING ACTIVITIES | | | 80,042 | | | | 114,890 | |
| | | | | | | | | |
| NET INCREASE (DECREASE) IN CASH AND CASH EQUIVALENTS | | | (8,075 | ) | | | 4,307 | |
| CASH AND CASH EQUIVALENTS - BEGINNING OF PERIOD | | | 20,179 | | | | 9,324 | |
| CASH AND CASH EQUIVALENTS - END OF PERIOD | | $ | 12,104 | | | $ | 13,631 | |
| THIRD QUARTER FISCAL YEAR 2020 SUPPLEMENTAL INFORMATION | 10 |
Capital Structure and Leverage Ratios
(unaudited) (in thousands except for per share amounts)
| | | As of | | | As of | | | As of | |
| | | 6/30/2020 | | | 6/30/2019 | | | 9/30/2019 | |
| | | | | | | | | | |
| Fixed Rate Mortgage Notes Payable, net of Unamortized Debt Issuance Costs | | $ | 804,342 | | | $ | 734,095 | | | $ | 744,928 | |
| Loans Payable | | | 80,000 | | | | 126,187 | | | | 95,000 | |
| Total Debt | | | 884,342 | | | | 860,282 | | | | 839,928 | |
| | | | | | | | | | | | | |
| 6.125% Series C Cumulative Redeemable Preferred Stock | | | 433,850 | | | | 312,660 | | | | 347,678 | |
| Common Stock, Additional Paid-In-Capital & Other | | | 589,935 | | | | 641,112 | | | | 663,365 | |
| Total Shareholders’ Equity | | | 1,023,785 | | | | 953,772 | | | | 1,011,043 | |
| | | | | | | | | | | | | |
| Total Book Capitalization | | | 1,908,127 | | | | 1,814,054 | | | | 1,850,971 | |
| | | | | | | | | | | | | |
| Accumulated Depreciation | | | 284,058 | | | | 238,757 | | | | 249,584 | |
| Total Undepreciated Book Capitalization | | $ | 2,192,185 | | | $ | 2,052,811 | | | $ | 2,100,555 | |
| | | | | | | | | | | | | |
| Shares Outstanding | | | 97,972 | | | | 95,155 | | | | 96,399 | |
| Market Price Per Share | | $ | 14.49 | | | $ | 13.55 | | | $ | 14.41 | |
| | | | | | | | | | | | | |
| Equity Market Capitalization | | $ | 1,419,614 | | | $ | 1,289,350 | | | $ | 1,389,107 | |
| Total Debt | | | 884,342 | | | | 860,282 | | | | 839,928 | |
| Total Preferred Stock | | | 433,850 | | | | 312,660 | | | | 347,678 | |
| Total Market Capitalization | | $ | 2,737,806 | | | $ | 2,462,292 | | | $ | 2,576,713 | |
| | | | | | | | | | | | | |
| Total Debt | | $ | 884,342 | | | $ | 860,282 | | | $ | 839,928 | |
| less: Cash and Cash Equivalents | | | 12,104 | | | | 13,631 | | | | 20,179 | |
| Net Debt | | $ | 872,238 | | | $ | 846,651 | | | $ | 819,749 | |
| less: Securities Available for Sale at Fair Value (Securities) | | | 118,877 | | | | 171,040 | | | | 185,250 | |
| Net Debt Less Securities | | $ | 753,361 | | | $ | 675,611 | | | $ | 634,499 | |
| | | | | | | | | | | | | |
| Net Debt / Total Undepreciated Book Capitalization | | | 39.8 | % | | | 41.2 | % | | | 39.0 | % |
| Net Debt / Total Market Capitalization | | | 31.9 | % | | | 34.4 | % | | | 31.8 | % |
| Net Debt Plus Preferred Stock / Total Market Capitalization | | | 47.7 | % | | | 47.1 | % | | | 45.3 | % |
| Net Debt Less Securities / Total Undepreciated Book Capitalization | | | 34.4 | % | | | 32.9 | % | | | 30.2 | % |
| Net Debt Less Securities / Total Market Capitalization | | | 27.5 | % | | | 27.4 | % | | | 24.6 | % |
| Net Debt Less Securities Plus Preferred Stock / Total Market Capitalization | | | 43.4 | % | | | 40.1 | % | | | 38.1 | % |
| | | | | | | | | | | | | |
| Weighted Average Interest Rate on Fixed Rate Mortgage Debt | | | 4.00 | % | | | 4.03 | % | | | 4.03 | % |
| Weighted Average Term on Fixed Rate Mortgage Debt | | | 11.2 yrs. | | | | 11.5 yrs. | | | | 11.3 yrs. | |
| Weighted Average Lease Term | | | 7.2 yrs. | | | | 7.8 yrs. | | | | 7.6 yrs. | |
| THIRD QUARTER FISCAL YEAR 2020 SUPPLEMENTAL INFORMATION | 11 |
Capital Structure and Leverage Ratios
(unaudited) (in thousands)
| | | For the Three Months Ended | | | For the Nine Months Ended | | | Fiscal Year Ended | |
| | | 6/30/2020 | | | 6/30/2019 | | | 6/30/2020 | | | 6/30/2019 | | | 9/30/2019 | |
| Net Income (Loss) Attributable to Common Shareholders | | $ | 26,851 | | | $ | (3,121 | ) | | $ | (44,700 | ) | | $ | (11,664 | ) | | $ | 11,026 | |
| Plus: Preferred Dividends | | | 6,607 | | | | 4,749 | | | | 19,469 | | | | 13,650 | | | | 18,774 | |
| Plus: Interest Expense, including Amortization of Financing Costs | | | 8,975 | | | | 9,275 | | | | 27,235 | | | | 27,879 | | | | 36,912 | |
| Plus: Depreciation and Amortization | | | 12,531 | | | | 11,554 | | | | 36,958 | | | | 34,211 | | | | 45,890 | |
| Plus: Net Amortization of Acquired Above and Below Market Lease Revenue | | | 26 | | | | 26 | | | | 77 | | | | 77 | | | | 103 | |
| Less/Plus: Unrealized Holding (Gains) Losses Arising During the Periods | | | (19,610 | ) | | | 11,609 | | | | 67,100 | | | | 38,668 | | | | 24,680 | |
| Adjusted EBITDA | | $ | 35,380 | | | $ | 34,092 | | | $ | 106,139 | | | $ | 102,821 | | | $ | 137,385 | |
| | | | | | | | | | | | | | | | | | | | | |
| Interest Expense, including Amortization of Financing Costs | | $ | 8,975 | | | $ | 9,275 | | | $ | 27,235 | | | $ | 27,879 | | | $ | 36,912 | |
| Preferred Dividends | | | 6,607 | | | | 4,749 | | | | 19,469 | | | | 13,650 | | | | 18,774 | |
| Total Fixed Charges | | $ | 15,582 | | | $ | 14,024 | | | $ | 46,704 | | | $ | 41,529 | | | $ | 55,686 | |
| | | | | | | | | | | | | | | | | | | | | |
| Interest Coverage | | | 3.9 x | | | | 3.7 x | | | | 3.9 x | | | | 3.7 x | | | | 3.7 x | |
| Fixed Charge Coverage | | | 2.3 x | | | | 2.4 x | | | | 2.3 x | | | | 2.5 x | | | | 2.5 x | |
| | | | | | | | | | | | | | | | | | | | | |
| Net Debt | | $ | 872,238 | | | $ | 846,651 | | | $ | 872,238 | | | $ | 846,651 | | | $ | 819,749 | |
| Net Debt Less Securities | | | 753,361 | | | | 675,611 | | | | 753,361 | | | | 675,611 | | | | 634,499 | |
| Total Preferred Stock | | | 433,850 | | | | 312,660 | | | | 433,850 | | | | 312,660 | | | | 347,678 | |
| Annualized Adjusted EBITDA | | | 141,520 | | | | 136,368 | | | | 141,519 | | | | 137,095 | | | | 137,385 | |
| | | | | | | | | | | | | | | | | | | | | |
| Net Debt / Adjusted EBITDA | | | 6.2 x | | | | 6.2 x | | | | 6.2 x | | | | 6.2 x | | | | 6.0 x | |
| Net Debt Less Securities / Adjusted EBITDA | | | 5.3 x | | | | 5.0 x | | | | 5.3 x | | | | 4.9 x | | | | 4.6 x | |
| Net Debt + Preferred Stock / Adjusted EBITDA | | | 9.2 x | | | | 8.5 x | | | | 9.2 x | | | | 8.5 x | | | | 8.5 x | |
| Net Debt Less Securities + Preferred Stock / Adjusted EBITDA | | | 8.4 x | | | | 7.2 x | | | | 8.4 x | | | | 7.2 x | | | | 7.1 x | |
| THIRD QUARTER FISCAL YEAR 2020 SUPPLEMENTAL INFORMATION | 12 |
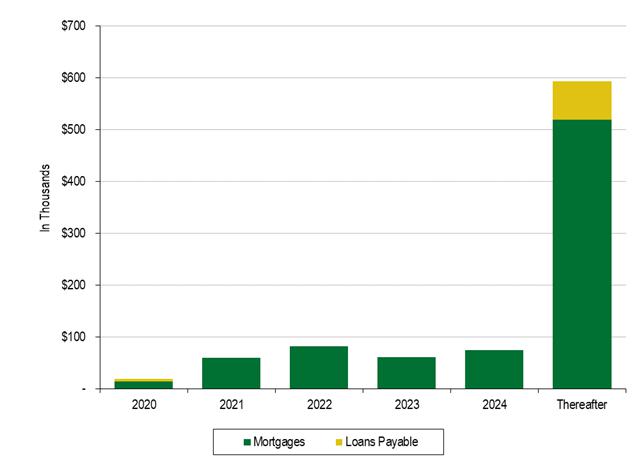
Debt Maturity
(unaudited) (In thousands)
| | | | | | | | | | Loans | | | | | | | % of | |
| Fiscal Year Ended | | | | | | Mortgages | | | Payable | | | | Total | | | Total | |
| | | | | | | | | | | | | | | | | | |
| 2020 | | | | | | $ | 14,688 | | | $ | 5,000 | | (B) | | $ | 19,688 | | | | 2.2 | % |
| 2021 | | | | | | | 60,263 | | | | -0- | | | | | 60,263 | | | | 6.8 | % |
| 2022 | | | | | | | 82,613 | | | | -0- | | | | | 82,613 | | | | 9.3 | % |
| 2023 | | | | | | | 61,541 | | | | -0- | | | | | 61,541 | | | | 6.9 | % |
| 2024 | | | | | | | 74,807 | | | | -0- | | | | | 74,807 | | | | 8.4 | % |
| Thereafter | | | | | | | 518,397 | | | | 75,000 | | (C) | | | 593,397 | | | | 66.4 | % |
| | | | | | | | | | | | | | | | | | | | | | |
| Total as of 6/30/2020 | | | (A) | | | $ | 812,309 | | | $ | 80,000 | | | | $ | 892,309 | | | | 100.0 | % |
| | | | | | | | | | | | | | | | | | | | | | |
| Weighted Average Interest Rate | | | | | | | 4.00 | % | | | 2.78 | % | | | | 3.89 | % | | | |
| Weighted Average Term | | | | | | | 11.2 yrs. | | | | 4.3 yrs. | | | | | 10.6 yrs. | | | | | |
| | (A) | Mortgages does not include unamortized debt issuance costs of $8.0 million. |
| | (B) | Represents margin debt which is due upon demand. Subsequent to the quarter end, we paid off this margin debt. |
| | (C) | Represents a Term Loan maturing January 2025. |
| THIRD QUARTER FISCAL YEAR 2020 SUPPLEMENTAL INFORMATION | 13 |
Property Table by Tenant
(unaudited)
| Tenant | | | | | Property
Count | | | Square
Footage | | | Occupied Square Footage | | | % of Occupied sf | | | Annual
Rent | | | % of Total Ann. Rent | | | Rent Per sf Occup. | | | Undepreciated
Cost | | | | Mortgage
Balance | |
| | | | | | | | | | | | | | | | | | | | | | | | | | | | | | | | |
| FedEx Ground Package System, Inc. | | | | | | | 45 | | | | 9,101,593 | | | | 9,101,593 | | | | 38.9 | % | | $ | 74,007,000 | | | | 50.2 | % | | $ | 8.13 | | | $ | 1,055,494,582 | | | | $ | 457,097,001 | |
| FedEx Corporation | | | | | | | 16 | | | | 1,164,830 | | | | 1,164,830 | | | | 5.0 | % | | | 7,492,000 | | | | 5.1 | % | | | 6.43 | | | | 108,854,670 | | | | | 20,771,501 | |
| FedEx Forward Depots, Inc. | | | | | | | 1 | | | | 449,900 | | | | 449,900 | | | | 1.9 | % | | | 1,394,000 | | | | 0.9 | % | | | 3.10 | | | | 16,092,852 | | | | | 3,532,289 | |
| Total FedEx | | | | | | | 62 | | | | 10,716,323 | | | | 10,716,323 | | | | 45.8 | % | | | 82,893,000 | | | | 56.2 | % | | | 7.74 | | | | 1,180,442,104 | | | | | 481,400,791 | |
| | | | | | | | | | | | | | | | | | | | | | | | | | | | | | | | | | | | | | | | | | |
| Amazon.com Services, Inc. (Amazon.com, Inc.) | | | | | | | 4 | | | | 1,370,465 | | | | 1,370,465 | | | | 5.9 | % | | | 9,709,000 | | | | 6.6 | % | | | 7.08 | | | | 151,597,032 | | | | | 85,937,017 | |
| Milwaukee Electric Tool Corporation | | | | | | | 1 | | | | 861,889 | | | | 861,889 | | | | 3.7 | % | | | 3,076,000 | | | | 2.1 | % | | | 3.57 | | | | 36,914,917 | | | | | 18,517,035 | |
| Shaw Industries, Inc. | | | | | | | 1 | | | | 831,764 | | | | 831,764 | | | | 3.6 | % | | | 3,529,000 | | | | 2.4 | % | | | 4.24 | | | | 56,025,945 | | | | | 28,825,747 | |
| ULTA, Inc. | | | | | | | 1 | | | | 671,354 | | | | 671,354 | | | | 2.9 | % | | | 2,755,000 | | | | 1.9 | % | | | 4.10 | | | | 37,540,948 | | | | | 17,710,034 | |
| Jim Beam Brands Company (Beam Suntory) | | | | | | | 1 | | | | 599,840 | | | | 599,840 | | | | 2.6 | % | | | 2,092,000 | | | | 1.4 | % | | | 3.49 | | | | 28,000,000 | | | | | 14,884,902 | |
| International Paper Company | | | | | | | 2 | | | | 578,472 | | | | 578,472 | | | | 2.5 | % | | | 2,639,000 | | | | 1.8 | % | | | 4.56 | | | | 37,024,608 | | | | | 18,234,310 | |
| TreeHouse Private Brands, Inc. | | | | | | | 1 | | | | 558,600 | | | | 558,600 | | | | 2.4 | % | | | 2,246,000 | | | | 1.5 | % | | | 4.02 | | | | 26,807,852 | | | | | 13,991,566 | |
| Autoneum North America, Inc. | | | | | | | 1 | | | | 413,605 | | | | 413,605 | | | | 1.8 | % | | | 2,221,000 | | | | 1.5 | % | | | 5.37 | | | | 21,040,396 | | | | | 13,069,495 | |
| B. Braun Medical Inc. | | | | | | | 1 | | | | 399,440 | | | | 399,440 | | | | 1.7 | % | | | 2,159,000 | | | | 1.5 | % | | | 5.41 | | | | 30,263,247 | | | | | 17,474,438 | |
| UGN, Inc. | | | | | | | 1 | | | | 387,000 | | | | 387,000 | | | | 1.7 | % | | | 2,088,000 | | | | 1.4 | % | | | 5.40 | | | | 21,576,756 | | | | | 12,830,691 | |
| CBOCS Distribution, Inc. (Cracker Barrel) | | | | | | | 1 | | | | 381,240 | | | | 381,240 | | | | 1.6 | % | | | 1,475,000 | | | | 1.0 | % | | | 3.87 | | | | 14,215,126 | | | | | -0- | |
| Best Buy Warehousing Logistics, Inc. | | | | | | | 1 | | | | 368,060 | | | | 368,060 | | | | 1.6 | % | | | 1,709,000 | | | | 1.2 | % | | | 4.64 | | | | 19,600,000 | | | | | 8,191,801 | |
| Toyota Tsusho America, Inc. | | | | | | | 1 | | | | 350,000 | | | | 350,000 | | | | 1.5 | % | | | 1,710,000 | | | | 1.2 | % | | | 4.89 | | | | 25,078,587 | | | | | 16,312,321 | |
| Coca-Cola | | | | | | | 2 | | | | 323,358 | | | | 323,358 | | | | 1.4 | % | | | 1,725,000 | | | | 1.2 | % | | | 5.33 | | | | 20,504,069 | | | | | 2,595,283 | |
| Science Applications International Corporation | | | | | | | 1 | | | | 302,400 | | | | 302,400 | | | | 1.3 | % | | | 1,683,000 | | | | 1.1 | % | | | 5.57 | | | | 14,463,148 | | | | | -0- | |
| Bunzl USA Holdings, Inc. | | | | | | | 2 | | | | 268,778 | | | | 268,778 | | | | 1.1 | % | | | 1,500,000 | | | | 1.0 | % | | | 5.58 | | | | 18,731,674 | | | | | 11,121,385 | |
| Woodstream Corporation | | | (A) | | | | 1 | | | | 256,000 | | | | 256,000 | | | | 1.1 | % | | | 932,000 | | | | 0.6 | % | | | 3.64 | | | | 8,958,278 | | | | | -0- | |
| Anda Pharmaceuticals, Inc. | | | | | | | 1 | | | | 234,660 | | | | 234,660 | | | | 1.0 | % | | | 1,215,000 | | | | 0.8 | % | | | 5.18 | | | | 14,550,000 | | | | | 6,428,839 | |
| United Technologies Corporation | | | | | | | 2 | | | | 223,150 | | | | 223,150 | | | | 1.0 | % | | | 1,507,000 | | | | 1.0 | % | | | 6.75 | | | | 23,594,917 | | | | | 4,961,570 | |
| Mickey Thompson Performance Tires and Wheels (Cooper Tire) | | | | | | | 1 | | | | 219,765 | | | | 219,765 | | | | 0.9 | % | | | 1,523,000 | | | | 1.0 | % | | | 6.93 | | | | 18,934,065 | | | | | 10,980,563 | |
| Rinnai America Corporation | | | | | | | 1 | | | | 218,120 | | | | 218,120 | | | | 0.9 | % | | | 851,000 | | | | 0.6 | % | | | 3.90 | | | | 15,082,217 | | | | | -0- | |
| Anheuser-Busch, Inc. | | | | | | | 1 | | | | 184,800 | | | | 184,800 | | | | 0.8 | % | | | 843,000 | | | | 0.6 | % | | | 4.56 | | | | 12,697,848 | | | | | -0- | |
| Carlisle Tire & Wheel Company | | | | | | | 1 | | | | 179,280 | | | | 179,280 | | | | 0.8 | % | | | 765,000 | | | | 0.5 | % | | | 4.27 | | | | 7,282,986 | | | | | -0- | |
| NF&M International, Inc. | | | (B) | | | | 1 | | | | 174,802 | | | | 174,802 | | | | 0.7 | % | | | 841,000 | | | | 0.6 | % | | | 4.81 | | | | 5,414,850 | | | | | -0- | |
| Home Depot USA, Inc. | | | | | | | 1 | | | | 171,200 | | | | 171,200 | | | | 0.7 | % | | | 1,064,000 | | | | 0.7 | % | | | 6.21 | | | | 11,303,317 | | | | | -0- | |
| Magna Seating of America, Inc. | | | | | | | 1 | | | | 153,000 | | | | 153,000 | | | | 0.7 | % | | | 1,197,000 | | | | 0.8 | % | | | 7.82 | | | | 17,557,830 | | | | | 9,277,101 | |
| Victory Packaging, L.P. | | | | | | | 1 | | | | 148,000 | | | | 148,000 | | | | 0.6 | % | | | 514,000 | | | | 0.3 | % | | | 3.47 | | | | 5,455,379 | | | | | -0- | |
| Challenger Lifts, Inc. (Snap-On Inc.) | | | | | | | 1 | | | | 137,500 | | | | 137,500 | | | | 0.6 | % | | | 852,000 | | | | 0.6 | % | | | 6.20 | | | | 11,304,000 | | | | | 5,808,421 | |
| Altec Industries, Inc. | | | (A) | | | | 1 | | | | 126,880 | | | | 126,880 | | | | 0.5 | % | | | 376,000 | | | | 0.3 | % | | | 2.96 | | | | 4,439,947 | | | | | -0- | |
| General Electric Company | | | | | | | 1 | | | | 125,860 | | | | 125,860 | | | | 0.5 | % | | | 1,334,000 | | | | 0.9 | % | | | 10.60 | | | | 19,964,283 | | | | | 9,793,926 | |
| Keurig Dr Pepper | | | | | | | 2 | | | | 110,080 | | | | 110,080 | | | | 0.5 | % | | | 753,000 | | | | 0.5 | % | | | 6.84 | | | | 10,498,031 | | | | | 1,448,041 | |
| Style Crest, Inc. | | | | | | | 1 | | | | 106,507 | | | | 106,507 | | | | 0.5 | % | | | 398,000 | | | | 0.3 | % | | | 3.74 | | | | 7,263,673 | | | | | -0- | |
| Sonwil Distribution Center, Inc. | | | | | | | 1 | | | | 104,981 | | | | 104,981 | | | | 0.4 | % | | | 630,000 | | | | 0.4 | % | | | 6.00 | | | | 10,960,823 | | | | | -0- | |
| Pittsburgh Glass Works, LLC | | | | | | | 1 | | | | 102,135 | | | | 102,135 | | | | 0.4 | % | | | 450,000 | | | | 0.3 | % | | | 4.41 | | | | 4,249,615 | | | | | -0- | |
| Dakota Bodies, LLC | | | | | | | 1 | | | | 96,687 | | | | 96,687 | | | | 0.4 | % | | | 378,000 | | | | 0.3 | % | | | 3.91 | | | | 7,797,827 | | | | | -0- | |
| National Oilwell Varco, Inc. | | | | | | | 1 | | | | 91,295 | | | | 91,295 | | | | 0.4 | % | | | 796,000 | | | | 0.5 | % | | | 8.72 | | | | 8,163,278 | | | | | 1,240,892 | |
| Joseph T. Ryerson and Son, Inc. | | | | | | | 1 | | | | 89,052 | | | | 89,052 | | | | 0.4 | % | | | 514,000 | | | | 0.3 | % | | | 5.77 | | | | 7,164,514 | | | | | -0- | |
| CHEP USA, Inc. | | | | | | | 1 | | | | 83,000 | | | | 83,000 | | | | 0.3 | % | | | 506,000 | | | | 0.4 | % | | | 6.10 | | | | 7,463,672 | | | | | -0- | |
| Sherwin-Williams Company | | | | | | | 2 | | | | 78,887 | | | | 78,887 | | | | 0.3 | % | | | 648,000 | | | | 0.4 | % | | | 8.21 | | | | 7,258,078 | | | | | -0- | |
| RGH Enterprises, Inc. (Cardinal Health) | | | | | | | 1 | | | | 75,000 | | | | 75,000 | | | | 0.2 | % | | | 619,000 | | | | 0.5 | % | | | 8.25 | | | | 5,525,600 | | | | | -0- | |
| Tampa Bay Grand Prix | | | | | | | 1 | | | | 68,385 | | | | 68,385 | | | | 0.3 | % | | | 361,000 | | | | 0.2 | % | | | 5.28 | | | | 5,677,982 | | | | | -0- | |
| Various Tenants at Retail Shopping Center | | | | | | | 1 | | | | 64,220 | | | | 61,190 | | | | 0.3 | % | | | 757,000 | | | | 0.5 | % | | | 12.37 | | | | 3,139,564 | | | | | -0- | |
| SOFIVE, Inc. | | | | | | | 1 | | | | 60,400 | | | | 60,400 | | | | 0.3 | % | | | 633,000 | | | | 0.4 | % | | | 10.48 | | | | 5,296,752 | | | | | 1,273,228 | |
| Locke Supply Co. | | | | | | | 1 | | | | 60,000 | | | | 60,000 | | | | 0.3 | % | | | 325,000 | | | | 0.2 | % | | | 5.42 | | | | 4,914,955 | | | | | -0- | |
| Siemens Real Estate | | | | | | | 1 | | | | 51,130 | | | | 51,130 | | | | 0.2 | % | | | 459,000 | | | | 0.3 | % | | | 8.98 | | | | 4,554,685 | | | | | -0- | |
| Foundation Building Materials, LLC | | | | | | | 1 | | | | 36,270 | | | | 36,270 | | | | 0.2 | % | | | 178,000 | | | | 0.1 | % | | | 4.91 | | | | 2,543,770 | | | | | -0- | |
| Graybar Electric Company | | | | | | | 1 | | | | 26,340 | | | | 26,340 | | | | 0.1 | % | | | 121,000 | | | | 0.1 | % | | | 4.59 | | | | 2,312,027 | | | | | -0- | |
| Vacant | | | (B) | | | | 2 | | | | 135,668 | | | | -0- | | | | 0.0 | % | | | -0- | | | | 0.0 | % | | | -0- | | | | 6,011,427 | | | | | -0- | |
| Total as of 6/30/20 | | | | | | | 118 | | | | 23,375,642 | | | | 23,236,944 | | | | 99.4 | % | | $ | 147,549,000 | | | | 100.0 | % | | $ | 6.35 | | | $ | 2,027,162,599 | | | (C) | $ | 812,309,397 | |
| | (A) | Woodstream Corporation and Altec Industries, Inc. are located at one property and, therefore, are counted as one property in the Property Count Total. |
| | (B) | NF&M International is located in a 255,658 square foot industrial park in Monaca (Pittsburgh), PA, of which 80,856 square feet are vacant. This industrial park is counted as one property in the Property Count Total. Other than two properties indicated in footnotes (A) and (B) and one retail property, all properties are single-tenant. |
| | (C) | Does not include unamortized debt issuance costs of $7,966,986. |
| THIRD QUARTER FISCAL YEAR 2020 SUPPLEMENTAL INFORMATION | 14 |
Property Table by State
(unaudited)
| State | | Property
Count | | Square
Footage | | | Occupied Square Footage | | | % of Total sf | | | Annual
Rent | | | % of Total Ann. Rent | | | Rent Per sf Occup. | | | Undepreciated
Cost | | | Mortgage
Balance | |
| Florida | | 13 | | | 2,211,583 | | | | 2,211,583 | | | | 9.5 | % | | $ | 15,817,000 | | | | 10.7 | % | | $ | 7.15 | | | $ | 227,587,902 | | | $ | 85,677,333 | |
| Indiana | | 4 | | | 1,964,923 | | | | 1,964,923 | | | | 8.4 | % | | | 11,132,000 | | | | 7.5 | % | | | 5.67 | | | | 167,487,527 | | | | 94,067,086 | |
| Ohio | | 10 | | | 1,858,506 | | | | 1,858,506 | | | | 8.0 | % | | | 11,218,000 | | | | 7.6 | % | | | 6.04 | | | | 137,189,167 | | | | 51,686,656 | |
| Texas | | 10 | | | 1,781,967 | | | | 1,781,967 | | | | 7.6 | % | | | 13,788,000 | | | | 9.3 | % | | | 7.74 | | | | 183,107,137 | | | | 67,681,983 | |
| Georgia | | 6 | | | 1,639,696 | | | | 1,639,696 | | | | 7.0 | % | | | 10,551,000 | | | | 7.1 | % | | | 6.43 | | | | 166,213,681 | | | | 81,421,927 | |
| South Carolina | | 6 | | | 1,371,721 | | | | 1,371,721 | | | | 5.9 | % | | | 10,309,000 | | | | 7.0 | % | | | 7.52 | | | | 129,964,844 | | | | 52,671,211 | |
| Kentucky | | 3 | | | 1,295,940 | | | | 1,295,940 | | | | 5.5 | % | | | 5,190,000 | | | | 3.5 | % | | | 4.00 | | | | 66,111,852 | | | | 34,684,889 | |
| North Carolina | | 5 | | | 1,225,987 | | | | 1,225,987 | | | | 5.2 | % | | | 8,688,000 | | | | 5.9 | % | | | 7.09 | | | | 132,526,762 | | | | 68,482,923 | |
| Mississippi | | 4 | | | 1,158,889 | | | | 1,158,889 | | | | 5.0 | % | | | 4,532,000 | | | | 3.1 | % | | | 3.91 | | | | 55,677,635 | | | | 24,945,874 | |
| Illinois | | 9 | | | 958,045 | | | | 958,045 | | | | 4.1 | % | | | 6,222,000 | | | | 4.2 | % | | | 6.49 | | | | 83,168,709 | | | | 7,483,017 | |
| Tennessee | | 3 | | | 891,777 | | | | 891,777 | | | | 3.8 | % | | | 3,188,000 | | | | 2.2 | % | | | 3.57 | | | | 35,677,250 | | | | 3,532,289 | |
| Michigan | | 4 | | | 833,054 | | | | 833,054 | | | | 3.6 | % | | | 5,577,000 | | | | 3.8 | % | | | 6.69 | | | | 73,424,162 | | | | 22,654,378 | |
| Kansas | | 4 | | | 813,043 | | | | 813,043 | | | | 3.5 | % | | | 4,678,000 | | | | 3.2 | % | | | 5.75 | | | | 61,025,122 | | | | 26,020,683 | |
| Missouri | | 4 | | | 740,119 | | | | 740,119 | | | | 3.2 | % | | | 2,900,000 | | | | 2.0 | % | | | 3.92 | | | | 35,448,902 | | | | 6,319,464 | |
| Oklahoma | | 4 | | | 614,941 | | | | 614,941 | | | | 2.6 | % | | | 3,975,000 | | | | 2.7 | % | | | 6.46 | | | | 54,961,021 | | | | 26,311,965 | |
| New York | | 3 | | | 518,565 | | | | 518,565 | | | | 2.2 | % | | | 3,572,000 | | | | 2.4 | % | | | 6.89 | | | | 51,618,400 | | | | 19,101,252 | |
| Pennsylvania | | 3 | | | 504,040 | | | | 423,184 | | | | 2.2 | % | | | 2,826,000 | | | | 1.9 | % | | | 6.68 | | | | 36,906,779 | | | | 12,326,903 | |
| New Jersey | | 3 | | | 471,765 | | | | 468,735 | | | | 2.0 | % | | | 6,696,000 | | | | 4.6 | % | | | 14.29 | | | | 92,423,938 | | | | 51,939,063 | |
| Alabama | | 2 | | | 451,595 | | | | 451,595 | | | | 1.9 | % | | | 2,650,000 | | | | 1.8 | % | | | 5.87 | | | | 39,714,135 | | | | 17,001,043 | |
| Virginia | | 5 | | | 407,265 | | | | 407,265 | | | | 1.7 | % | | | 2,456,000 | | | | 1.7 | % | | | 6.03 | | | | 34,868,096 | | | | 3,524,522 | |
| Colorado | | 2 | | | 295,227 | | | | 295,227 | | | | 1.3 | % | | | 2,441,000 | | | | 1.6 | % | | | 8.27 | | | | 35,694,134 | | | | 14,840,275 | |
| Arizona | | 1 | | | 283,358 | | | | 283,358 | | | | 1.2 | % | | | 1,393,000 | | | | 0.9 | % | | | 4.92 | | | | 16,824,226 | | | | 2,231,508 | |
| Wisconsin | | 2 | | | 238,666 | | | | 238,666 | | | | 1.0 | % | | | 1,295,000 | | | | 0.9 | % | | | 5.43 | | | | 16,377,221 | | | | 2,055,817 | |
| Washington | | 1 | | | 210,445 | | | | 210,445 | | | | 0.9 | % | | | 1,962,000 | | | | 1.3 | % | | | 9.32 | | | | 30,320,686 | | | | 15,766,363 | |
| Louisiana | | 1 | | | 175,315 | | | | 175,315 | | | | 0.7 | % | | | 1,270,000 | | | | 0.9 | % | | | 7.24 | | | | 18,425,875 | | | | 9,873,503 | |
| Maryland | | 1 | | | 148,881 | | | | 148,881 | | | | 0.6 | % | | | 1,455,000 | | | | 1.0 | % | | | 9.77 | | | | 14,512,355 | | | | -0- | |
| Nebraska | | 1 | | | 89,115 | | | | 89,115 | | | | 0.4 | % | | | 446,000 | | | | 0.3 | % | | | 5.00 | | | | 5,963,626 | | | | -0- | |
| Utah | | 1 | | | 69,734 | | | | 69,734 | | | | 0.3 | % | | | 772,000 | | | | 0.5 | % | | | 11.07 | | | | 12,666,994 | | | | 8,360,000 | |
| Minnesota | | 1 | | | 60,398 | | | | 60,398 | | | | 0.3 | % | | | 372,000 | | | | 0.3 | % | | | 6.16 | | | | 5,223,944 | | | | 1,647,470 | |
| Connecticut | | 1 | | | 54,812 | | | | -0- | | | | 0.2 | % | | | -0- | | | | 0.0 | % | | | -0- | | | | 3,506,747 | | | | -0- | |
| Iowa | | 1 | | | 36,270 | | | | 36,270 | | | | 0.2 | % | | | 178,000 | | | | 0.1 | % | | | 4.91 | | | | 2,543,770 | | | | -0- | |
| Total as of 6/30/20 | | 118 | | | 23,375,642 | | | | 23,236,944 | | | | 100.0 | % | | $ | 147,549,000 | | | | 100.0 | % | | $ | 6.35 | | | $ | 2,027,162,599 | | (A) | $ | 812,309,397 | |
| | (A) | Does not include unamortized debt issuance costs of $7,966,986. |
| THIRD QUARTER FISCAL YEAR 2020 SUPPLEMENTAL INFORMATION | 15 |
Lease Expirations
(unaudited)
| Fiscal Year | | | | Property
Count | | | Square
Footage | | | % of Total
Sf | | | Annual
Rent | | | % of Total
Ann. Rent | | | Rent Per sf
Occup. | | | Lease Exp.
Term in Years | | | Undepreciated
Cost | | | Mortgage
Balance | |
| | | | | | | | | | | | | | | | | | | | | | | | | | | | | | |
| 2020 | | (B) | | | 1 | | | | 98,045 | | | | 0.4 | % | | $ | 490,000 | | | | 0.3 | % | | $ | 5.00 | | | | -0- | | | $ | -0- | | | $ | -0- | |
| 2021 | | (A) | | | 10 | | | | 1,206,723 | | | | 5.2 | % | | | 5,560,000 | | | | 3.8 | % | | | 4.61 | | | | 0.9 | | | | 69,813,124 | | | | 6,683,239 | |
| 2022 | | | | | 7 | | | | 1,152,006 | | | | 4.9 | % | | | 6,372,000 | | | | 4.3 | % | | | 5.53 | | | | 1.7 | | | | 78,920,819 | | | | 19,765,577 | |
| 2023 | | (A) | | | 14 | | | | 1,840,004 | | | | 7.9 | % | | | 10,612,000 | | | | 7.2 | % | | | 5.77 | | | | 2.9 | | | | 128,622,634 | | | | 17,588,596 | |
| 2024 | | | | | 13 | | | | 1,887,034 | | | | 8.1 | % | | | 11,722,000 | | | | 7.9 | % | | | 6.21 | | | | 3.9 | | | | 137,488,989 | | | | 22,935,645 | |
| 2025 | | (A) | | | 10 | | | | 2,459,470 | | | | 10.5 | % | | | 12,462,000 | | | | 8.4 | % | | | 5.07 | | | | 4.9 | | | | 164,532,551 | | | | 64,398,049 | |
| 2026 | | | | | 8 | | | | 1,078,913 | | | | 4.6 | % | | | 8,331,000 | | | | 5.6 | % | | | 7.72 | | | | 5.9 | | | | 113,206,322 | | | | 30,442,622 | |
| 2027 | | | | | 12 | | | | 2,373,001 | | | | 10.2 | % | | | 13,049,000 | | | | 8.8 | % | | | 5.50 | | | | 7.1 | | | | 185,819,770 | | | | 64,355,260 | |
| 2028 | | | | | 11 | | | | 2,571,915 | | | | 11.0 | % | | | 13,970,000 | | | | 9.5 | % | | | 5.43 | | | | 7.8 | | | | 182,728,436 | | | | 62,263,260 | |
| 2029 | | | | | 9 | | | | 1,830,929 | | | | 7.8 | % | | | 10,548,000 | | | | 7.1 | % | | | 5.76 | | | | 8.8 | | | | 147,759,792 | | | | 61,791,530 | |
| 2030 | | | | | 5 | | | | 1,026,032 | | | | 4.4 | % | | | 8,177,000 | | | | 5.5 | % | | | 7.97 | | | | 9.8 | | | | 119,544,872 | | | | 58,729,758 | |
| 2031 | | | | | 3 | | | | 963,269 | | | | 4.1 | % | | | 7,152,000 | | | | 4.8 | % | | | 7.42 | | | | 10.8 | | | | 104,691,839 | | | | 58,095,208 | |
| 2032 | | (B) | | | 8 | | | | 2,131,983 | | | | 9.1 | % | | | 18,803,000 | | | | 12.7 | % | | | 8.82 | | | | 11.8 | | | | 290,952,566 | | | | 164,859,510 | |
| 2033 | | | | | 2 | | | | 639,068 | | | | 2.7 | % | | | 6,486,000 | | | | 4.4 | % | | | 10.15 | | | | 12.8 | | | | 106,803,506 | | | | 63,564,427 | |
| 2034 | | | | | 3 | | | | 1,561,347 | | | | 6.7 | % | | | 9,284,000 | | | | 6.6 | % | | | 5.95 | | | | 13.8 | | | | 127,748,517 | | | | 78,176,716 | |
| 2035 | | | | | 2 | | | | 356,015 | | | | 1.5 | % | | | 3,774,000 | | | | 2.6 | % | | | 10.60 | | | | 14.8 | | | | 59,377,871 | | | | 38,660,000 | |
| Various tenants at retail shopping center | | | | | 1 | | | | 64,220 | | | | 0.3 | % | | | 757,000 | | | | 0.5 | % | | | 12.37 | | | | -0- | | | | 3,139,564 | | | | -0- | |
| Vacant | | (A) | | | 2 | | | | 135,668 | | | | 0.6 | % | | | -0- | | | | 0.0 | % | | | -0- | | | | -0- | | | | 6,011,427 | | | | -0- | |
| Total as of 6/30/20 | | | | | 118 | | | | 23,375,642 | | | | 100.0 | % | | $ | 147,549,000 | | | | 100.0 | % | | $ | 6.35 | | | | 7.2 | | | $ | 2,027,162,599 | | (C) | $ | 812,309,397 | |
| | (A) | Included in 2021 is Woodstream Corporation and included in 2023 is Altec Industries, which both occupy one property. Included in 2025 is NF&M International, which occupies 174,802 square feet of a 255,658 square foot Industrial Park. The remaining 80,856 square feet are included in Vacant. Each of these properties are counted as one property in the Property Count Total. Other than these properties and one retail property, all properties are single-tenant. |
| | (B) | Included in 2020 and 2032 is a property located in Aiken (Augusta, GA), SC leased to Autoneum North America, Inc. This property contains two leasable structures with two different lease terms. Both are counted as one property in the property count total. |
| | (C) | Does not include unamortized debt issuance costs of $7,966,986. |
| THIRD QUARTER FISCAL YEAR 2020 SUPPLEMENTAL INFORMATION | 16 |
Recent Acquisitions During Fiscal 2020
(unaudited)
| | | | | | | | | Date of | | Square | | | Annual | | | Rent Per | | | Lease | | Purchase | | | Initial Mortgage | |
| No | | Tenant | | City (MSA) | | State | | Acquisition | | Footage | | | Rent | | | sf Occup. | | | Expiration | | Price | | | Balance | |
| 1 | | Amazon.com Services, Inc. | | Greenwood (Indianapolis) | | IN | | 10/10/19 | | | 615,747 | | | $ | 4,950,000 | | | $ | 8.04 | | | 8/31/34 | | $ | 81,500,000 | | | $ | 52,500,000 | |
| 2 | | Magna Seating of America, Inc. | | Lancaster (Columbus) | | OH | | 3/30/20 | | | 153,000 | | | | 1,197,000 | | | | 7.82 | | | 1/31/30 | | | 17,874,000 | | | | 9,400,000 | |
| 3 | | FedEx Ground Package System, Inc. | | Greensboro | | NC | | 5/21/20 | | | 286,281 | | | | 3,002,000 | | | | 10.49 | | | 4/30/35 | | | 47,645,000 | | | | 30,300,000 | |
| 4 | | FedEx Corporation | | Ogden (Salt Lake City) | | UT | | 5/21/20 | | | 69,734 | | | | 772,000 | | | | 11.07 | | | 3/31/35 | | | 12,864,000 | | | | 8,360,000 | |
| | | As of 6/30/20 | | | | | | | | | 1,124,762 | | | $ | 9,921,000 | | | $ | 8.82 | | | | | $ | 159,883,000 | | | $ | 100,560,000 | |
| THIRD QUARTER FISCAL YEAR 2020 SUPPLEMENTAL INFORMATION | 17 |
Property Table
(unaudited)
| | | | | | | | | | | | | | | | | | | | | Rent | | | Lease Exp. | | | | | | | |
| | | | | | | | | | | Fiscal Year | | | | | | Square | | | Annual | | | Per sf | | | Term in | | | Undepreciated | | | Mortgage | |
| No | | Tenant | | | | City (MSA) | | State | | Acquisition | | | Occup. | | | Footage | | | Rent | | | Occup. | | | Years | | | Cost | | | Balance | |
| 1 | | Milwaukee Electric Tool Corporation | | | | Olive Branch (Memphis, TN) | | MS | | | 2013 | | | | 100.0 | % | | | 861,889 | | | $ | 3,076,000 | | | $ | 3.57 | | | | 8.1 | | | $ | 36,914,917 | | | $ | 18,517,035 | |
| 2 | | Shaw Industries, Inc. | | | | Savannah | | GA | | | 2018 | | | | 100.0 | % | | | 831,764 | | | | 3,529,000 | | | | 4.24 | | | | 7.3 | | | | 56,025,945 | | | | 28,825,747 | |
| 3 | | ULTA, Inc. | | | | Greenwood (Indianapolis) | | IN | | | 2015 | | | | 100.0 | % | | | 671,354 | | | | 2,755,000 | | | | 4.10 | | | | 5.1 | | | | 37,540,948 | | | | 17,710,034 | |
| 4 | | Amazon.com Services, Inc. (Amazon.com, Inc.) | | | | Greenwood (Indianapolis) | | IN | | | 2020 | | | | 100.0 | % | | | 615,747 | | | | 4,950,000 | | | | 8.04 | | | | 14.2 | | | | 79,363,909 | | | | 51,354,459 | |
| 5 | | Jim Beam Brands Company (Beam Suntory) | | | | Frankfort (Lexington) | | KY | | | 2015 | | | | 100.0 | % | | | 599,840 | | | | 2,092,000 | | | | 3.49 | | | | 4.6 | | | | 28,000,000 | | | | 14,884,902 | |
| 6 | | TreeHouse Private Brands, Inc. | | | | Buckner (Louisville) | | KY | | | 2014 | | | | 100.0 | % | | | 558,600 | | | | 2,246,000 | | | | 4.02 | | | | 13.3 | | | | 26,807,852 | | | | 13,991,566 | |
| 7 | | FedEx Forward Depots, Inc. | | | | Memphis | | TN | | | 2010 | | | | 100.0 | % | | | 449,900 | | | | 1,394,000 | | | | 3.10 | | | | 8.9 | | | | 16,092,852 | | | | 3,532,289 | |
| 8 | | Autoneum North America, Inc. | | (B) | | Aiken (Augusta, GA) | | SC | | | 2017 | | | | 100.0 | % | | | 315,560 | | | | 1,731,000 | | | | 5.49 | | | | 11.8 | | | | 21,040,396 | | | | 13,069,495 | |
| | | Autoneum North America, Inc. | | | | Aiken (Augusta, GA) | | SC | | | 2017 | | | | 100.0 | % | | | 98,045 | | | | 490,000 | | | | 5.00 | | | | -0- | | | | -0- | | | | -0- | |
| 9 | | B. Braun Medical Inc. | | | | Daytona Beach | | FL | | | 2018 | | | | 100.0 | % | | | 399,440 | | | | 2,159,000 | | | | 5.41 | | | | 7.8 | | | | 30,263,247 | | | | 17,474,438 | |
| 10 | | UGN, Inc. | | | | Monroe (Cincinnati) | | OH | | | 2015 | | | | 100.0 | % | | | 387,000 | | | | 2,088,000 | | | | 5.40 | | | | 13.7 | | | | 21,576,756 | | | | 12,830,691 | |
| 11 | | Woodstream Corporation | | | | St. Joseph | | MO | | | 2001 | | | | 100.0 | % | | | 256,000 | | | | 932,000 | | | | 3.64 | | | | 1.3 | | | | 8,958,278 | | | | -0- | |
| | | Altec Industries, Inc. | | | | St. Joseph | | MO | | | 2001 | | | | 100.0 | % | | | 126,880 | | | | 376,000 | | | | 2.96 | | | | 2.7 | | | | 4,439,947 | | | | -0- | |
| 12 | | CBOCS Distribution, Inc. (Cracker Barrel) | | | | Lebanon (Nashville) | | TN | | | 2011 | | | | 100.0 | % | | | 381,240 | | | | 1,475,000 | | | | 3.87 | | | | 4.0 | | | | 14,215,126 | | | | -0- | |
| 13 | | FedEx Ground Package System, Inc. | | | | Braselton (Atlanta) | | GA | | | 2018 | | | | 100.0 | % | | | 373,750 | | | | 3,782,000 | | | | 10.12 | | | | 12.7 | | | | 60,227,126 | | | | 36,374,212 | |
| 14 | | Best Buy Warehousing Logistics, Inc. | | | | Streetsboro (Cleveland) | | OH | | | 2012 | | | | 100.0 | % | | | 368,060 | | | | 1,709,000 | | | | 4.64 | | | | 1.6 | | | | 19,600,000 | | | | 8,191,801 | |
| 15 | | Amazon.com Services, Inc. (Amazon.com, Inc.) | | | | Mobile | | AL | | | 2018 | | | | 100.0 | % | | | 362,942 | | | | 2,045,000 | | | | 5.63 | | | | 8.4 | | | | 33,052,316 | | | | 17,001,043 | |
| 16 | | FedEx Ground Package System, Inc. | | | | Concord (Charlotte) | | NC | | | 2017 | | | | 100.0 | % | | | 354,482 | | | | 2,537,000 | | | | 7.16 | | | | 11.9 | | | | 40,043,145 | | | | 22,428,160 | |
| 17 | | FedEx Ground Package System, Inc. | | | | Mesquite (Dallas) | | TX | | | 2017 | | | | 100.0 | % | | | 351,874 | | | | 3,203,000 | | | | 9.10 | | | | 11.8 | | | | 49,880,493 | | | | 27,811,093 | |
| 18 | | Toyota Tsusho America, Inc. | | | | Lafayette | | IN | | | 2019 | | | | 100.0 | % | | | 350,000 | | | | 1,710,000 | | | | 4.89 | | | | 9.0 | | | | 25,078,587 | | | | 16,312,321 | |
| 19 | | FedEx Ground Package System, Inc. | | | | Trenton | | NJ | | | 2019 | | | | 100.0 | % | | | 347,145 | | | | 5,306,000 | | | | 15.28 | | | | 12.0 | | | | 83,987,622 | | | | 50,665,835 | |
| 20 | | FedEx Ground Package System, Inc. | | | | Walker (Grand Rapids) | | MI | | | 2017 | | | | 100.0 | % | | | 343,483 | | | | 2,105,000 | | | | 6.13 | | | | 11.6 | | | | 31,654,987 | | | | 17,509,441 | |
| 21 | | FedEx Ground Package System, Inc. | | | | Hamburg (Buffalo) | | NY | | | 2017 | | | | 100.0 | % | | | 338,584 | | | | 2,323,000 | | | | 6.86 | | | | 10.8 | | | | 35,131,977 | | | | 19,101,252 | |
| 22 | | FedEx Ground Package System, Inc. | | | | Concord (Charlotte) | | NC | | | 2016 | | | | 100.0 | % | | | 330,717 | | | | 2,237,000 | | | | 6.76 | | | | 5.1 | | | | 33,053,688 | | | | 15,754,763 | |
| 23 | | FedEx Ground Package System, Inc. | | | | Indianapolis | | IN | | | 2014 | | | | 100.0 | % | | | 327,822 | | | | 1,717,000 | | | | 5.24 | | | | 7.3 | | | | 25,504,083 | | | | 8,690,272 | |
| 24 | | FedEx Ground Package System, Inc. | | | | Olathe (Kansas City) | | KS | | | 2016 | | | | 100.0 | % | | | 313,763 | | | | 2,210,000 | | | | 7.04 | | | | 10.9 | | | | 31,768,185 | | | | 17,829,098 | |
| 25 | | FedEx Ground Package System, Inc. | | | | Davenport (Orlando) | | FL | | | 2016 | | | | 100.0 | % | | | 310,922 | | | | 2,619,000 | | | | 8.42 | | | | 10.8 | | | | 37,791,677 | | | | 21,164,858 | |
| 26 | | FedEx Ground Package System, Inc. | | | | Ft. Worth (Dallas) | | TX | | | 2015 | | | | 100.0 | % | | | 304,608 | | | | 2,387,000 | | | | 7.84 | | | | 9.8 | | | | 35,444,074 | | | | 18,249,956 | |
| 27 | | Science Applications International Corporation | | | | Hanahan (Charleston) | | SC | | | 2005 | | | | 100.0 | % | | | 302,400 | | | | 1,683,000 | | | | 5.57 | | | | 3.3 | | | | 14,463,148 | | | | -0- | |
| 28 | | Amazon.com Services, Inc. (Amazon.com, Inc.) | | | | Oklahoma City | | OK | | | 2018 | | | | 100.0 | % | | | 300,000 | | | | 1,925,000 | | | | 6.42 | | | | 7.3 | | | | 29,878,942 | | | | 17,581,515 | |
| 29 | | International Paper Company | | | | Kenton | | OH | | | 2017 | | | | 100.0 | % | | | 298,472 | | | | 1,268,000 | | | | 4.25 | | | | 7.2 | | | | 18,730,500 | | | | 10,406,500 | |
| 30 | | FedEx Ground Package System, Inc. | | | | Jacksonville | | FL | | | 2015 | | | | 100.0 | % | | | 297,579 | | | | 1,998,000 | | | | 6.71 | | | | 9.5 | | | | 30,925,530 | | | | 14,163,110 | |
| 31 | | FedEx Ground Package System, Inc. | | | | Greensboro | | NC | | | 2020 | | | | 100.0 | % | | | 286,281 | | | | 3,002,000 | | | | 10.49 | | | | 14.8 | | | | 46,710,877 | | | | 30,300,000 | |
| 32 | | Western Container Corp. (Coca-Cola) | | | | Tolleson (Phoenix) | | AZ | | | 2003 | | | | 100.0 | % | | | 283,358 | | | | 1,393,000 | | | | 4.92 | | | | 6.8 | | | | 16,824,226 | | | | 2,231,508 | |
| 33 | | International Paper Company | | | | Edwardsville (Kansas City) | | KS | | | 2014 | | | | 100.0 | % | | | 280,000 | | | | 1,371,000 | | | | 4.90 | | | | 3.2 | | | | 18,294,108 | | | | 7,827,810 | |
| 34 | | FedEx Ground Package System, Inc. | | | | Charleston | | SC | | | 2018 | | | | 100.0 | % | | | 265,318 | | | | 2,704,000 | | | | 10.19 | | | | 13.0 | | | | 46,576,380 | | | | 27,190,215 | |
| 35 | | NF&M International, Inc. | | | | Monaca (Pittsburgh) | | PA | | | 1988 | | | | 68.4 | % | | | 255,658 | | | | 841,000 | | | | 4.81 | | | | 4.5 | | | | 7,919,530 | | | | -0- | |
| 36 | | FedEx Ground Package System, Inc. | | | | Orion | | MI | | | 2007 | | | | 100.0 | % | | | 245,633 | | | | 1,908,000 | | | | 7.77 | | | | 3.0 | | | | 22,940,227 | | | | -0- | |
| 37 | | FedEx Ground Package System, Inc. | | | | Homestead (Miami) | | FL | | | 2017 | | | | 100.0 | % | | | 237,756 | | | | 2,282,000 | | | | 9.60 | | | | 11.8 | | | | 37,911,556 | | | | 20,963,985 | |
| 38 | | Anda Pharmaceuticals, Inc. | | | | Olive Branch (Memphis, TN) | | MS | | | 2012 | | | | 100.0 | % | | | 234,660 | | | | 1,215,000 | | | | 5.18 | | | | 2.1 | | | | 14,550,000 | | | | 6,428,839 | |
| 39 | | FedEx Ground Package System, Inc. | | | | Colorado Springs | | CO | | | 2016 | | | | 100.0 | % | | | 225,362 | | | | 1,832,000 | | | | 8.13 | | | | 5.6 | | | | 29,320,066 | | | | 14,840,275 | |
| 40 | | Mickey Thompson Performance Tires and Wheels (Cooper Tire) | | | | Stow | | OH | | | 2017 | | | | 100.0 | % | | | 219,765 | | | | 1,523,000 | | | | 6.93 | | | | 7.2 | | | | 18,934,065 | | | | 10,980,563 | |
| 41 | | Rinnai America Corporation | | | | Griffin (Atlanta) | | GA | | | 2006 | | | | 100.0 | % | | | 218,120 | | | | 851,000 | | | | 3.90 | | | | 0.5 | | | | 15,082,217 | | | | -0- | |
| 42 | | FedEx Ground Package System, Inc. | | | | Ft. Myers | | FL | | | 2017 | | | | 100.0 | % | | | 213,672 | | | | 1,418,000 | | | | 6.64 | | | | 7.2 | | | | 21,684,310 | | | | 11,910,942 | |
| 43 | | FedEx Ground Package System, Inc. | | | | Burlington (Seattle/Everett) | | WA | | | 2016 | | | | 100.0 | % | | | 210,445 | | | | 1,962,000 | | | | 9.32 | | | | 10.2 | | | | 30,320,686 | | | | 15,766,363 | |
| 44 | | FedEx Ground Package System, Inc. | | | | Sauget (St. Louis, MO) | | IL | | | 2015 | | | | 100.0 | % | | | 198,773 | | | | 1,036,000 | | | | 5.21 | | | | 8.9 | | | | 15,204,950 | | | | 7,483,017 | |
| 45 | | Anheuser-Busch, Inc. | | | | Granite City (St. Louis, MO) | | IL | | | 2001 | | | | 100.0 | % | | | 184,800 | | | | 843,000 | | | | 4.56 | | | | 1.4 | | | | 12,697,848 | | | | -0- | |
| 46 | | Carrier Enterprise, LLC (United Technologies) | | | | Carrollton (Dallas) | | TX | | | 2010 | | | | 100.0 | % | | | 184,317 | | | | 1,140,000 | | | | 6.18 | | | | 3.6 | | | | 18,494,917 | | | | 4,961,570 | |
| 47 | | FedEx Ground Package System, Inc. | | | | Spring (Houston) | | TX | | | 2014 | | | | 100.0 | % | | | 181,176 | | | | 1,581,000 | | | | 8.73 | | | | 4.3 | | | | 19,328,922 | | | | 6,791,231 | |
| 48 | | Carlisle Tire & Wheel Company | | | | Edwardsville (Kansas City) | | KS | | | 2003 | | | | 100.0 | % | | | 179,280 | | | | 765,000 | | | | 4.27 | | | | 3.1 | | | | 7,282,986 | | | | -0- | |
| 49 | | FedEx Ground Package System, Inc. | | | | Ft. Mill (Charlotte, NC) | | SC | | | 2010 | | | | 100.0 | % | | | 176,939 | | | | 1,598,000 | | | | 9.03 | | | | 8.2 | | | | 17,063,643 | | | | -0- | |
| 50 | | FedEx Ground Package System, Inc. | | | | Covington (New Orleans) | | LA | | | 2016 | | | | 100.0 | % | | | 175,315 | | | | 1,270,000 | | | | 7.24 | | | | 5.0 | | | | 18,425,875 | | | | 9,873,503 | |
| 51 | | FedEx Ground Package System, Inc. | | | | Livonia (Detroit) | | MI | | | 2013 | | | | 100.0 | % | | | 172,005 | | | | 1,194,000 | | | | 6.94 | | | | 1.8 | | | | 13,879,697 | | | | 5,144,937 | |
| 52 | | Home Depot USA, Inc. | | | | Montgomery (Chicago) | | IL | | | 2004 | | | | 100.0 | % | | | 171,200 | | | | 1,064,000 | | | | 6.21 | | | | 2.5 | | | | 11,303,317 | | | | -0- | |
| 53 | | FedEx Ground Package System, Inc. | | | | Tampa | | FL | | | 2004 | | | | 100.0 | % | | | 170,779 | | | | 1,624,000 | | | | 9.51 | | | | 6.1 | | | | 19,745,245 | | | | -0- | |
| 54 | | FedEx Ground Package System, Inc. | | | | Edinburg | | TX | | | 2011 | | | | 100.0 | % | | | 164,207 | | | | 1,097,000 | | | | 6.68 | | | | 6.3 | | | | 12,039,014 | | | | -0- | |
| 55 | | FedEx Ground Package System, Inc. | | | | Lindale (Tyler) | | TX | | | 2015 | | | | 100.0 | % | | | 163,378 | | | | 725,000 | | | | 4.44 | | | | 4.0 | | | | 9,965,550 | | | | 4,932,882 | |
| 56 | | Bunzl Distribution Midcentral, Inc. | | | | Kansas City | | MO | | | 2015 | | | | 100.0 | % | | | 158,417 | | | | 764,000 | | | | 4.82 | | | | 1.3 | | | | 10,003,235 | | | | 6,319,464 | |
| 57 | | FedEx Ground Package System, Inc. | | | | Oklahoma City | | OK | | | 2012 | | | | 100.0 | % | | | 158,340 | | | | 1,048,000 | | | | 6.62 | | | | 5.1 | | | | 12,605,609 | | | | 2,480,488 | |
| 58 | | Magna Seating of America, Inc. | | | | Columbus | | OH | | | 2020 | | | | 100.0 | % | | | 153,000 | | | | 1,197,000 | | | | 7.82 | | | | 9.6 | | | | 17,557,830 | | | | 9,277,101 | |
| 59 | | FedEx Ground Package System, Inc. | | | | Waco | | TX | | | 2012 | | | | 100.0 | % | | | 150,710 | | | | 1,078,000 | | | | 7.15 | | | | 5.2 | | | | 12,551,368 | | | | 3,694,359 | |
| THIRD QUARTER FISCAL YEAR 2020 SUPPLEMENTAL INFORMATION | 18 |
Property Table
(unaudited)
| | | | | | | | | | | | | | | | | | | | Rent | | | Lease Exp. | | | | | | | |
| | | | | | | | | | | Fiscal Year | | | | | | Square | | | Annual | | | Per sf | | | Term in | | | Undepreciated | | | Mortgage | |
| No | | | Tenant | | City (MSA) | | State | | | Acquisition | | | Occup. | | | Footage | | | Rent | | | Occup. | | | Years | | | Cost | | | Balance | |
| | 60 | | | FedEx Ground Package System, Inc. | | Beltsville (Washington, DC) | | | MD | | | | 1997 | | | | 100.0 | % | | | 148,881 | | | $ | 1,455,000 | | | $ | 9.77 | | | | 8.1 | | | $ | 14,512,355 | | | $ | -0- | |
| | 61 | | | Victory Packaging, L.P. | | Fayetteville | | | NC | | | | 2006 | | | | 100.0 | % | | | 148,000 | | | | 514,000 | | | | 3.47 | | | | 0.7 | | | | 5,455,379 | | | | -0- | |
| | 62 | | | FedEx Ground Package System, Inc. | | El Paso | | | TX | | | | 2008 | | | | 100.0 | % | | | 144,149 | | | | 1,345,000 | | | | 9.33 | | | | 3.3 | | | | 12,431,192 | | | | -0- | |
| | 63 | | | FedEx Ground Package System, Inc. | | Cocoa | | | FL | | | | 2001 | | | | 100.0 | % | | | 144,138 | | | | 1,112,000 | | | | 7.71 | | | | 4.3 | | | | 14,127,449 | | | | -0- | |
| | 64 | | | FedEx Ground Package System, Inc. | | Cudahy (Milwaukee) | | | WI | | | | 2016 | | | | 100.0 | % | | | 139,564 | | | | 827,000 | | | | 5.93 | | | | 7.0 | | | | 9,807,221 | | | | -0- | |
| | 65 | | | Challenger Lifts, Inc. (Snap-On Inc.) | | Louisville | | | KY | | | | 2006 | | | | 100.0 | % | | | 137,500 | | | | 852,000 | | | | 6.20 | | | | 5.9 | | | | 11,304,000 | | | | 5,808,421 | |
| | 66 | | | FedEx Ground Package System, Inc. | | Richfield (Cleveland) | | | OH | | | | 2019 | | | | 100.0 | % | | | 131,152 | | | | 1,493,000 | | | | 11.38 | | | | 4.3 | | | | 16,447,178 | | | | -0- | |
| | 67 | | | FedEx Ground Package System, Inc. | | Savannah | | | GA | | | | 2016 | | | | 100.0 | % | | | 126,520 | | | | 1,755,000 | | | | 13.87 | | | | 8.3 | | | | 27,531,560 | | | | 16,221,968 | |
| | 68 | | | General Electric Company | | Imperial (Pittsburgh) | | | PA | | | | 2003 | | | | 100.0 | % | | | 125,860 | | | | 1,334,000 | | | | 10.60 | | | | 5.5 | | | | 19,964,283 | | | | 9,793,926 | |
| | 69 | | | FedEx Ground Package System, Inc. | | Wheeling (Chicago) | | | IL | | | | 2014 | | | | 100.0 | % | | | 123,000 | | | | 1,272,000 | | | | 10.34 | | | | 6.9 | | | | 18,992,949 | | | | -0- | |
| | 70 | | | FedEx Ground Package System, Inc. | | Altoona | | | PA | | | | 2018 | | | | 100.0 | % | | | 122,522 | | | | 651,000 | | | | 5.31 | | | | 3.2 | | | | 9,022,966 | | | | 2,532,977 | |
| | 71 | | | FedEx Corporation | | Charleston | | | SC | | | | 2001 | | | | 100.0 | % | | | 121,683 | | | | 1,314,000 | | | | 10.80 | | | | 12.2 | | | | 21,519,412 | | | | 12,411,501 | |
| | 72 | | | FedEx Corporation | | Mechanicsville (Richmond) | | | VA | | | | 2008 | | | | 100.0 | % | | | 112,799 | | | | 541,000 | | | | 4.80 | | | | 2.8 | | | | 7,827,460 | | | | -0- | |
| | 73 | | | FedEx Corporation | | Orlando | | | FL | | | | 2017 | | | | 100.0 | % | | | 110,638 | | | | 666,000 | | | | 6.02 | | | | 7.4 | | | | 8,810,059 | | | | -0- | |
| | 74 | | | Bunzl Distribution Oklahoma, Inc. | | Oklahoma City | | | OK | | | | 2002 | | | | 100.0 | % | | | 110,361 | | | | 736,000 | | | | 6.67 | | | | 4.2 | | | | 8,728,439 | | | | 4,801,921 | |
| | 75 | | | Style Crest, Inc. | | Winston-Salem | | | NC | | | | 2000 | | | | 100.0 | % | | | 106,507 | | | | 398,000 | | | | 3.74 | | | | 0.8 | | | | 7,263,673 | | | | -0- | |
| | 76 | | | SONWIL DISTRIBUTION CENTER, INC. | | Cheektowaga (Buffalo) | | | NY | | | | 1999 | | | | 100.0 | % | | | 104,981 | | | | 630,000 | | | | 6.00 | | | | 1.6 | | | | 10,960,823 | | | | -0- | |
| | 77 | | | FedEx Ground Package System, Inc. | | West Chester Twp. (Cincinnati) | | | OH | | | | 2013 | | | | 100.0 | % | | | 103,818 | | | | 556,000 | | | | 5.36 | | | | 3.2 | | | | 5,733,686 | | | | -0- | |
| | 78 | | | FedEx Ground Package System, Inc. | | Roanoke | | | VA | | | | 1994 | | | | 100.0 | % | | | 103,402 | | | | 755,000 | | | | 7.30 | | | | 2.8 | | | | 10,200,000 | | | | 3,524,522 | |
| | 79 | | | Pittsburgh Glass Works, LLC | | O’ Fallon (St. Louis) | | | MO | | | | 2013 | | | | 100.0 | % | | | 102,135 | | | | 450,000 | | | | 4.41 | | | | 1.0 | | | | 4,249,615 | | | | -0- | |
| | 80 | | | FedEx Ground Package System, Inc. | | Green Bay | | | WI | | | | 1998 | | | | 100.0 | % | | | 99,102 | | | | 468,000 | | | | 4.72 | | | | 2.9 | | | | 6,570,000 | | | | 2,055,817 | |
| | 81 | | | Dakota Bodies, LLC | | Liberty (Kansas City) | | | MO | | | | 1999 | | | | 100.0 | % | | | 96,687 | | | | 378,000 | | | | 3.91 | | | | 5.8 | | | | 7,797,827 | | | | -0- | |
| | 82 | | | FedEx Corporation | | Jacksonville | | | FL | | | | 2006 | | | | 100.0 | % | | | 95,883 | | | | 536,000 | | | | 5.59 | | | | 8.9 | | | | 6,584,384 | | | | -0- | |
| | 83 | | | FedEx Corporation | | Tampa | | | FL | | | | 2005 | | | | 100.0 | % | | | 95,662 | | | | 603,000 | | | | 6.30 | | | | 7.4 | | | | 7,889,727 | | | | -0- | |
| | 84 | | | Amazon.com Services, Inc. | | Hanahan (Charleston) | | | SC | | | | 2010 | | | | 100.0 | % | | | 91,776 | | | | 789,000 | | | | 8.60 | | | | 9.0 | | | | 9,301,865 | | | | -0- | |
| | 85 | | | National Oilwell Varco, Inc. | | Houston | | | TX | | | | 1999 | | | | 100.0 | % | | | 91,295 | | | | 796,000 | | | | 8.72 | | | | 9.3 | | | | 8,163,278 | | | | 1,240,892 | |
| | 86 | | | FedEx Corporation | | Omaha | | | NE | | | | 2002 | | | | 100.0 | % | | | 89,115 | | | | 446,000 | | | | 5.00 | | | | 3.3 | | | | 5,963,626 | | | | -0- | |
| | 87 | | | Joseph T. Ryerson and Son, Inc. | | Elgin (Chicago) | | | IL | | | | 2005 | | | | 100.0 | % | | | 89,052 | | | | 514,000 | | | | 5.77 | | | | 4.6 | | | | 7,164,514 | | | | -0- | |
| | 88 | | | FedEx Ground Package System, Inc. | | Huntsville | | | AL | | | | 2007 | | | | 100.0 | % | | | 88,653 | | | | 605,000 | | | | 6.82 | | | | 6.1 | | | | 6,661,819 | | | | -0- | |
| | 89 | | | CHEP USA, Inc. | | Roanoke | | | VA | | | | 2007 | | | | 100.0 | % | | | 83,000 | | | | 506,000 | | | | 6.10 | | | | 4.7 | | | | 7,463,672 | | | | -0- | |
| | 90 | | | FedEx Corporation | | Bedford Heights (Cleveland) | | | OH | | | | 2012 | | | | 100.0 | % | | | 82,269 | | | | 438,000 | | | | 5.32 | | | | 8.2 | | | | 7,304,467 | | | | -0- | |
| | 91 | | | RGH Enterprises, Inc. (Cardinal Health) | | Halfmoon (Albany) | | | NY | | | | 1997 | | | | 100.0 | % | | | 75,000 | | | | 619,000 | | | | 8.25 | | | | 1.4 | | | | 5,525,600 | | | | -0- | |
| | 92 | | | FedEx Corporation | | Schaumburg (Chicago) | | | IL | | | | 1998 | | | | 100.0 | % | | | 73,500 | | | | 478,000 | | | | 6.50 | | | | 6.8 | | | | 5,447,053 | | | | -0- | |
| | 93 | | | FedEx Corporation | | Romulus (Detroit) | | | MI | | | | 2005 | | | | 100.0 | % | | | 71,933 | | | | 370,000 | | | | 5.14 | | | | 0.9 | | | | 4,949,251 | | | | -0- | |
| | 94 | | | FedEx Ground Package System, Inc. | | Denver | | | CO | | | | 2005 | | | | 100.0 | % | | | 69,865 | | | | 609,000 | | | | 8.72 | | | | 5.3 | | | | 6,374,068 | | | | -0- | |
| | 95 | | | FedEx Corporation | | Ogden | | | UT | | | | 2011 | | | | 100.0 | % | | | 69,734 | | | | 772,000 | | | | 11.07 | | | | 14.8 | | | | 12,666,994 | | | | 8,360,000 | |
| | 96 | | | Tampa Bay Grand Prix | | Tampa | | | FL | | | | 1970 | | | | 100.0 | % | | | 68,385 | | | | 361,000 | | | | 5.28 | | | | 7.3 | | | | 5,677,982 | | | | -0- | |
| | 97 | | | Sherwin-Williams Company | | Rockford | | | IL | | | | 2015 | | | | 100.0 | % | | | 66,387 | | | | 486,000 | | | | 7.32 | | | | 3.5 | | | | 5,551,227 | | | | -0- | |
| | 98 | | | Various Tenants at Retail Shopping Center | | Somerset | | | NJ | | | | 2007 | | | | 95.0 | % | | | 64,220 | | | | 757,000 | | | | 12.37 | | | | na | | | | 3,139,564 | | | | -0- | |
| | 99 | | | Keurig Dr Pepper | | Cincinnati | | | OH | | | | 2001 | | | | 100.0 | % | | | 63,840 | | | | 487,000 | | | | 7.63 | | | | 9.3 | | | | 6,750,000 | | | | -0- | |
| | 100 | | | FedEx Corporation | | Chattanooga | | | TN | | | | 2013 | | | | 100.0 | % | | | 60,637 | | | | 319,000 | | | | 5.26 | | | | 2.3 | | | | 5,369,272 | | | | -0- | |
| | 101 | | | SOFIVE, Inc. | | Carlstadt (New York, NY) | | | NJ | | | | 2004 | | | | 100.0 | % | | | 60,400 | | | | 633,000 | | | | 10.48 | | | | 9.6 | | | | 5,296,752 | | | | 1,273,228 | |
| | 102 | | | FedEx Ground Package System, Inc. | | Stewartville (Rochester) | | | MN | | | | 2005 | | | | 100.0 | % | | | 60,398 | | | | 372,000 | | | | 6.16 | | | | 2.9 | | | | 5,223,944 | | | | 1,647,470 | |
| | 103 | | | Locke Supply Co. | | Richmond | | | VA | | | | 2001 | | | | 100.0 | % | | | 60,000 | | | | 325,000 | | | | 5.42 | | | | 11.8 | | | | 4,914,955 | | | | -0- | |
| | 104 | | | FedEx Ground Package System, Inc. | | Augusta | | | GA | | | | 2012 | | | | 100.0 | % | | | 59,358 | | | | 513,000 | | | | 8.64 | | | | 1.0 | | | | 5,363,304 | | | | -0- | |
| | 105 | | | Vacant | | Newington (Hartford) | | | CT | | | | 1999 | | | | 0.0 | % | | | 54,812 | | | | -0- | | | | na | | | | na | | | | 3,506,747 | | | | -0- | |
| | 106 | | | Siemens Real Estate | | Lebanon (Cincinnati) | | | OH | | | | 2012 | | | | 100.0 | % | | | 51,130 | | | | 459,000 | | | | 8.98 | | | | 3.8 | | | | 4,554,685 | | | | -0- | |
| | 107 | | | FedEx Corporation | | Charlottesville | | | VA | | | | 2014 | | | | 100.0 | % | | | 48,064 | | | | 329,000 | | | | 6.85 | | | | 7.2 | | | | 4,462,009 | | | | -0- | |
| | 108 | | | FedEx Ground Package System, Inc. | | Corpus Christi | | | TX | | | | 2009 | | | | 100.0 | % | | | 46,253 | | | | 436,000 | | | | 9.43 | | | | 1.2 | | | | 4,808,329 | | | | -0- | |
| | 109 | | | Keurig Dr Pepper | | Tulsa | | | OK | | | | 2015 | | | | 100.0 | % | | | 46,240 | | | | 266,000 | | | | 5.75 | | | | 3.7 | | | | 3,748,031 | | | | 1,448,041 | |
| | 110 | | | Heartland Coca-Cola Bottling Company, LLC (Coca-Cola) | | Topeka | | | KS | | | | 1994 | | | | 100.0 | % | | | 40,000 | | | | 332,000 | | | | 8.30 | | | | 1.3 | | | | 3,679,843 | | | | 363,775 | |
| | 111 | | | Collins Aerospace Systems (United Technologies) | | Rockford | | | IL | | | | 1994 | | | | 100.0 | % | | | 38,833 | | | | 367,000 | | | | 9.45 | | | | 7.0 | | | | 5,100,000 | | | | -0- | |
| | 112 | | | Foundation Building Materials, LLC | | Urbandale (Des Moines) | | | IA | | | | 2007 | | | | 100.0 | % | | | 36,270 | | | | 178,000 | | | | 4.91 | | | | 7.5 | | | | 2,543,770 | | | | -0- | |
| | 113 | | | FedEx Corporation | | Richland (Jackson) | | | MS | | | | 2006 | | | | 100.0 | % | | | 36,000 | | | | 120,000 | | | | 3.33 | | | | 3.8 | | | | 1,900,691 | | | | -0- | |
| | 114 | | | FedEx Corporation | | Punta Gorda | | | FL | | | | 2006 | | | | 100.0 | % | | | 34,624 | | | | 284,000 | | | | 8.20 | | | | 7.0 | | | | 4,133,510 | | | | -0- | |
| | 115 | | | FedEx Corporation | | Lakeland | | | FL | | | | 1993 | | | | 100.0 | % | | | 32,105 | | | | 155,000 | | | | 4.83 | | | | 7.4 | | | | 2,043,226 | | | | -0- | |
| THIRD QUARTER FISCAL YEAR 2020 SUPPLEMENTAL INFORMATION | 19 |
Property Table
(unaudited)
| | | | | | | | | | | | | | | | | | | | | | Rent | | | Lease Exp. | | | | | | | |
| | | | | | | | | | Fiscal Year | | | | | | Square | | | Annual | | | Per sf | | | Term in | | | Undepreciated | | | Mortgage | |
| No | | | Tenant | | City (MSA) | | State | | Acquisition | | | Occup. | | | Footage | | | Rent | | | Occup. | | | Years | | | Cost | | | Balance | |
| | 116 | | | FedEx Corporation | | Augusta | | GA | | | 2006 | | | | 100.0 | % | | | 30,184 | | | $ | 121,000 | | | $ | 4.01 | | | | 2.4 | | | $ | 1,983,529 | | | $ | -0- | |
| | 117 | | | Graybar Electric Company | | Ridgeland (Jackson) | | MS | | | 1993 | | | | 100.0 | % | | | 26,340 | | | | 121,000 | | | | 4.59 | | | | 5.1 | | | | 2,312,027 | | | | -0- | |
| | 118 | | | Sherwin-Williams Company | | Burr Ridge (Chicago) | | IL | | | 1997 | | | | 100.0 | % | | | 12,500 | | | | 162,000 | | | | 12.96 | | | | 1.3 | | | | 1,706,851 | | | | -0- | |
| | | | | Total as of 6/30/20 | | | | | | | | | | | 99.4 | % | | | 23,375,642 | | | $ | 147,549,000 | | | $ | 6.35 | | | | 7.2 | | | $ | 2,027,162,599 | | | $ | (A) 812,309,397 | |
| | (A) | Does not include unamortized debt issuance costs of $7,966,986. |
| | (B) | Property located in Aiken (Augusta, GA), SC leased to Autoneum North America, Inc. contains two leasable structures with two different lease terms. |
| THIRD QUARTER FISCAL YEAR 2020 SUPPLEMENTAL INFORMATION | 20 |
Definitions
Investors and analysts following the real estate industry utilize funds from operations (“FFO”), adjusted funds from operations (“AFFO”), net operating income (“NOI”), Same Property NOI, Same Property Cash NOI, and earnings before interest, taxes, depreciation and amortization for real estate & (“Adjusted EBITDA”) variously defined, as supplemental performance measures. While we believe net income available to common stockholders, as defined by accounting principles generally accepted in the United States of America (U.S. GAAP), is the most appropriate measure, we consider NOI, Same Property NOI, Same Property Cash NOI, Adjusted EBITDA, FFO and AFFO, given their wide use by and relevance to investors and analysts, appropriate supplemental performance measures. FFO, reflecting the assumption that real estate asset values rise or fall with market conditions, principally adjusts for the effects of U.S. GAAP depreciation and amortization of real estate assets. NOI provides a measure of rental operations, and does not factor in depreciation and amortization and non-property specific expenses such as interest expense and general and administrative expenses. Adjusted EBITDA provides a tool to further evaluate the ability to incur and service debt and to fund dividends and other cash needs. AFFO provides a supplemental tool to evaluate our performance. In addition, NOI, Same Property NOI, Same Property Cash NOI, Adjusted EBITDA, FFO and AFFO are commonly used in various ratios, pricing multiples, yields and returns and valuation of calculations used to measure financial position, performance and value. As used herein, we calculate the following non-U.S. GAAP measures as follows:
| | ● | FFO, as defined by The National Association of Real Estate Investment Trusts (Nareit), represents net income attributable to common shareholders, as defined by accounting principles generally accepted in the United States of America (U.S. GAAP), excluding extraordinary items, as defined under U.S. GAAP, gains or losses from sales of previously depreciated real estate assets, impairment charges related to depreciable real estate assets, plus certain non-cash items such as real estate asset depreciation and amortization. Included in the Nareit FFO White Paper - 2018 Restatement, is an option pertaining to assets incidental to our main business in the calculation of Nareit FFO to make an election to include or exclude mark-to-market changes in the value recognized on these marketable equity securities. In conjunction with the adoption of the FFO White Paper - 2018 Restatement, for all periods presented, we have elected to exclude unrealized gains and losses from our investments in marketable equity securities from our FFO calculation. Nareit created FFO as a non-GAAP supplemental measure of REIT operating performance. |
| | | |
| | ● | AFFO is calculated as FFO, excluding stock-based compensation expense, depreciation of corporate office tenant improvements, amortization of deferred financing costs, non-recurring severance expense, effect of non-cash U.S. GAAP straight-line rent adjustments and less recurring capital expenditures. Recurring capital expenditures are defined as all capital expenditures that are recurring in nature, excluding capital expenditures related to expansions at our current locations or capital expenditures that are incurred in conjunction with obtaining a new lease or a lease renewal. |
| | | |
| | ● | NOI from property operations is calculated as net income attributable to common shareholders, as defined by U.S. GAAP, plus preferred dividends, general & administrative expenses, non-recurring severance expense, depreciation, amortization of capitalized lease costs & intangible assets and interest expense, including amortization of financing costs, unrealized holding (gains) or losses arising during the periods, less dividend income. The components of NOI consist of recurring rental and reimbursement revenue, less real estate taxes and operating expenses, such as insurance, utilities, and repairs and maintenance. |
| | | |
| | ● | Same Property NOI is calculated as the NOI of all properties owned during the entire periods presented with the exclusion of any properties expanded during the periods presented. |
| | | |
| | ● | Same Property Cash NOI is calculated as the Same Property NOI adjusted to exclude the effect of non-cash U.S. GAAP straight-line rent adjustment for the properties included in the Same Property NOI calculation. |
| | | |
| | ● | Adjusted EBITDA is net income attributable to common shareholders, as defined by U.S. GAAP, plus preferred dividends, interest expense, including amortization of financing costs, depreciation and amortization, net amortization of acquired above and below market lease revenue and unrealized holding losses (minus gains) arising during the periods. |
FFO, AFFO, NOI, Same Property NOI, Same Property Cash NOI and Adjusted EBITDA, do not represent cash generated from operating activities in accordance with U.S. GAAP and are not necessarily indicative of cash available to fund cash needs, including the repayment of principal on debt and payment of dividends and distributions. FFO, AFFO, NOI, Same Property NOI, Same Property Cash NOI and Adjusted EBITDA should not be considered as substitutes for net income applicable to common shareholders (calculated in accordance with U.S. GAAP) as a measure of results of operations or cash flows (calculated in accordance with U.S. GAAP) as a measure of liquidity. FFO, AFFO, NOI, Same Property NOI, Same Property Cash NOI and Adjusted EBITDA, as currently calculated by us, may not be comparable to similarly titled, but variously calculated, measures of other REITs.
| THIRD QUARTER FISCAL YEAR 2020 SUPPLEMENTAL INFORMATION | 21 |
| FOR IMMEDIATE RELEASE | August 4, 2020 |
| | Contact: Becky Coleridge |
| | 732-577-9996 |
MONMOUTH REAL ESTATE REPORTS RESULTS FOR
THE THIRD QUARTER ENDED JUNE 30, 2020
HOLMDEL, NJ, August 4, 2020........ Monmouth Real Estate Investment Corporation (NYSE:MNR) reported Net Income Attributable to Common Shareholders of $26.9 million or $0.27 per diluted share for the three months ended June 30, 2020 as compared to Net Loss Attributable to Common Shareholders of $3.1 million or $0.03 per diluted share for the three months ended June 30, 2019, representing an increase of $30.0 million or $0.30 per diluted share. During the three months ended June 30, 2020, we recognized a $19.6 million unrealized holding gain on securities or $0.20 per diluted share as compared to an $11.6 million unrealized holding loss on securities or $0.12 per diluted share for the three months ended June 30, 2019. Funds from Operations (FFO), which excludes unrealized and realized gains or losses from our securities portfolio, for the three months ended June 30, 2020 were $19.7 million or $0.20 per diluted share versus $19.9 million or $0.21 per diluted share for the three months ended June 30, 2019, representing a decrease of $0.01 in FFO per diluted share. Adjusted Funds from Operations (AFFO), which also excludes unrealized and realized gains or losses from our securities portfolio, for the three months ended June 30, 2020 were $19.5 million or $0.20 per diluted share versus $19.4 million or $0.21 per diluted share for the three months ended June 30, 2019, representing a $0.01 decrease in AFFO per diluted share. Sequentially, our FFO of $0.20 per diluted share for the third quarter of fiscal 2020 is $0.01 lower than our FFO of $0.21 per diluted share for the second quarter of fiscal 2020 and our AFFO of $0.20 per diluted share for the third quarter of fiscal 2020 is consistent with our AFFO of $0.20 per diluted share for the second quarter of fiscal 2020. The year over year $0.01 decline in FFO and AFFO for the quarter is primarily attributable to a $1.9 million increase in Preferred Dividend expense as a result of an increase in preferred shares outstanding, as well as a $1.3 million decrease in dividend income, partially offset by a $2.5 million increase in Net Operating Income (NOI).
Portfolio Occupancy and Tenant Rent Collections During The COVID-19 Pandemic
Our portfolio occupancy remained nearly full during the quarter at 99.4% which represents a 50 basis point increase over the prior year period and is consistent with the prior quarter. Our rent collections throughout the COVID-19 Pandemic have been as follows:
| | ● | For the month of March were 100.0% |
| | ● | For the month of April were 99.6% |
| | ● | For the month of May were 97.9% |
| | ● | For the month of June were 99.4% |
| | ● | For the month of July were 99.6% |
| | ● | For the month of August, we expect total rent collections to come in at 99.6% |
While the future effects of the evolving impact of the COVID-19 pandemic are still uncertain, at this time we believe that the fallout will not have a material adverse effect on our financial condition. To date, Monmouth has received very limited requests for rent deferment. We have agreed to defer $438,000 which represents a 31 basis point impact on our annual base rent. Approximately 75% of this deferred amount is due to be paid by the end of the calendar year. Our weighted average lease term at quarter end is 7.2 years as compared to 7.4 years at the end of the prior quarter.
A summary of significant financial information for the three and nine months ended June 30, 2020 and 2019 (in thousands, except per share amounts) is as follows:
| | | Three Months Ended June 30, | |
| | | 2020 | | | 2019 | |
| Rental Revenue | | $ | 35,427 | | | $ | 33,127 | |
| Reimbursement Revenue | | $ | 6,348 | | | $ | 5,421 | |
| Net Operating Income (NOI) (1) | | $ | 35,208 | | | $ | 32,731 | |
| Total Expenses | | $ | 21,296 | | | $ | 19,722 | |
| Dividend Income | | $ | 2,344 | | | $ | 3,686 | |
| Unrealized Holding Gains (Losses) Arising During the Periods | | $ | 19,610 | | | $ | (11,609 | ) |
| Net Income | | $ | 33,458 | | | $ | 1,628 | |
| Net Income (Loss) Attributable to Common Shareholders | | $ | 26,851 | | | $ | (3,121 | ) |
| Net Income (Loss) Attributable to Common Shareholders Per Diluted Common Share | | $ | 0.27 | | | $ | (0.03 | ) |
| FFO (1) | | $ | 19,740 | | | $ | 19,899 | |
| FFO per Diluted Common Share (1) | | $ | 0.20 | | | $ | 0.21 | |
| AFFO (1) | | $ | 19,488 | | | $ | 19,388 | |
| AFFO per Diluted Common Share (1) | | $ | 0.20 | | | $ | 0.21 | |
| Dividends Declared per Common Share | | $ | 0.17 | | | $ | 0.17 | |
| | | | | | | | | |
| Weighted Avg. Diluted Common Shares Outstanding | | | 97,962 | | | | 94,493 | |
| THIRD QUARTER FISCAL YEAR 2020 SUPPLEMENTAL INFORMATION | 22 |
| | | Nine Months Ended June 30, | |
| | | 2020 | | | 2019 | |
| Rental Revenue | | $ | 105,410 | | | $ | 98,678 | |
| Reimbursement Revenue | | $ | 19,772 | | | $ | 16,473 | |
| Net Operating Income (NOI) (1) | | $ | 104,719 | | | $ | 97,595 | |
| Total Expenses | | $ | 65,065 | | | $ | 58,187 | |
| Dividend Income | | $ | 8,987 | | | $ | 11,569 | |
| Unrealized Holding Gains (Losses) Arising During the Periods | | $ | (67,100 | ) | | $ | (38,668 | ) |
| Net Income (Loss) | | $ | (25,231 | ) | | $ | 1,986 | |
| Net Income (Loss) Attributable to Common Shareholders | | $ | (44,700 | ) | | $ | (11,664 | ) |
| Net Income (Loss) Attributable to Common Shareholders Per Diluted Common Share | | $ | (0.46 | ) | | $ | (0.13 | ) |
| FFO (1) | | $ | 59,259 | | | $ | 60,917 | |
| FFO per Diluted Common Share (1) | | $ | 0.61 | | | $ | 0.66 | |
| AFFO (1) | | $ | 58,771 | | | $ | 59,583 | |
| AFFO per Diluted Common Share (1) | | $ | 0.60 | | | $ | 0.64 | |
| Dividends Declared per Common Share | | $ | 0.51 | | | $ | 0.51 | |
| | | | | | | | | |
| Weighted Avg. Diluted Common Shares Outstanding | | | 97,626 | | | | 92,719 | |
A summary of significant balance sheet information as of June 30, 2020 and September 30, 2019 (in thousands) is as follows:
| | | June 30, 2020 | | | September 30, 2019 | |
| Real Estate Investments | | $ | 1,743,115 | | | $ | 1,616,934 | |
| Securities Available for Sale at Fair Value | | $ | 118,877 | | | $ | 185,250 | |
| Total Assets | | $ | 1,931,425 | | | $ | 1,871,948 | |
| Fixed Rate Mortgage Notes Payable, net of Unamortized Debt Issuance Costs | | $ | 804,342 | | | $ | 744,928 | |
| Loans Payable | | $ | 80,000 | | | $ | 95,000 | |
| 6.125% Series C Cumulative Redeemable Preferred Stock | | $ | 433,850 | | | $ | 347,678 | |
| Total Shareholders’ Equity | | $ | 1,023,785 | | | $ | 1,011,043 | |
Highlights from Third Quarter Results
| | ● | Increased Gross Revenue by 4% over the prior year period to $44.1 million |
| | | |
| | ● | Increased Net Operating Income by 8% over the prior year period to $35.2 million |
| | | |
| | ● | Maintained a conservative AFFO dividend payout ratio of 85% |
| | | |
| | ● | Increased our Gross Leasable Area (GLA) by 7%, or 1.6 million square feet over the prior year period to 23.4 million square feet |
| | | |
| | ● | Entered into commitments to acquire four new build-to-suit properties containing 1.5 million total square feet for a total cost of $218.7 million all leased to Investment Grade tenants for a weighted average lease term of 16.8 years |
| | | |
| | ● | Acquired two properties comprising 356,000 square feet for $60.5 million, both of which are leased to FedEx for 15 years |
| | | |
| | ● | Increased our portfolio occupancy by 50 basis points over the prior year period and maintained our 99.4% occupancy rate sequentially |
| | | |
| | ● | Achieved a weighted average lease term of 7.2 years versus 7.8 years in the prior year period |
| | | |
| | ● | Increased our annualized average base rent per occupied square foot by 2% to $6.35 from the prior year period |
| | | |
| | ● | Achieved a weighted average debt maturity on fixed-rate mortgage debt of 11.2 years as compared to 11.5 years in the prior year period |
| | | |
| | ● | Maintained our Net Debt to Adjusted EBITDA at 6.2x which is in-line with the prior year period |
| | | |
| | ● | Reduced the weighted average interest rate on our fixed-rate mortgage debt to 4.00% from 4.03% in the prior year period and reduced the weighted average interest rate on our total fixed-rate debt to 3.90% from 4.03% in the prior year period |
| THIRD QUARTER FISCAL YEAR 2020 SUPPLEMENTAL INFORMATION | 23 |
| | ● | Raised $4.5 million in net proceeds through the Preferred Stock ATM Program with the sale of 185,000 shares of our 6.125% Series C Preferred Stock at a weighted average price of $24.93 per share |
| | | |
| | ● | Raised $1.2 million (including dividend reinvestments of $1.0 million) from the Dividend Reinvestment and Stock Purchase Plan, representing a 6% participation rate |
Michael P. Landy, President and CEO, commented, “Thus far in fiscal 2020, we have acquired four properties comprising 1.1 million square feet for a total purchase price of $159.9 million. During the recent quarter, we acquired two buildings comprising 356,000 square feet for a purchase price of $60.5 million. These properties, located in Greensboro, NC and Salt Lake City, UT are both leased to FedEx for 15 years. Our acquisition pipeline grew over the quarter to $218.7 million and currently contains four new build-to-suit properties comprising 1.5 million total square feet. These properties have a weighted average lease term of 16.8 years. In keeping with our business model, these projects are all leased to investment grade tenants which include, Amazon, FedEx, and Home Depot. Debt financing for three of these four future acquisitions has already been locked-in at a weighted average interest rate of 3.10%.”
“We have renewed four of the five leases that were set to expire this fiscal year. These four lease renewals represent 87% of the 410,000 square feet expiring this year. These lease renewals have a weighted average lease term of 4.2 years, and a weighted average lease rate of $5.87 per square foot on a GAAP basis and $5.71 per square foot on a cash basis. This represents an increase of 12.0% on a GAAP basis and an increase of 4.4% on a cash basis.”
“Monmouth went into the global pandemic very well positioned with a strong balance sheet, a high-quality tenant roster, nearly full occupancy, and a well-covered dividend. Our resilient rent collection results during these challenging times highlights the mission-critical nature of our assets and underscores the essential need for our tenants’ operations. Because our weighted average lease maturity is 7.2 years and our weighted average fixed-rate mortgage debt maturity is 11.2 years, we expect our income streams to remain resilient for years to come.”
“As a result of the government shutdowns, ecommerce sales as a percentage of total retail sales have accelerated from approximately 15% to 27% during the recent quarter. This has created tremendous demand for many of our properties with operations increasing to seven-day work weeks to accommodate this strong demand. The COVID-19 pandemic has also created a need for supply chain reconfiguration. Increased inventory stocking is currently taking place across the U.S. for several industries and this trend is accelerating to accommodate surges in demand. The COVID-19 pandemic has also increased the desire for additional domestic manufacturing, as supply chains now prefer shorter routes and less reliance on foreign sources. Because our portfolio comprises modern industrial buildings located throughout the continental U.S., we are very well-positioned to benefit from these accelerating trends going forward.”
Monmouth Real Estate Investment Corporation will host its Third Quarter FY 2020 Financial Results Webcast and Conference Call on Wednesday, August 5, 2020 at 10:00 a.m. Eastern Time. Senior management will discuss the results, current market conditions and future outlook.
Our Third Quarter FY 2020 financial results being released herein will be available on our website at www.mreic.reit in the Investor Relations section, under Filings and Reports.
To participate in the Webcast, select the 3Q2020 Webcast and Earnings Call “Link to Webcast” on the homepage of our website at www.mreic.reit, in the Highlights section, which is located towards the bottom of the homepage. Interested parties can also participate via conference call by calling toll free 1-877-510-5852 (domestically) or 1-412-902-4138 (internationally).
The replay of the conference call will be available at 12:00 p.m. Eastern Time on Wednesday, August 5, 2020. It will be available until November 16, 2020, and can be accessed by dialing toll free 1-877-344-7529 (domestically) and 1-412-317-0088 (internationally) and entering the passcode 10144143. A transcript of the call and the webcast replay will be available at our website on the Investor Relations homepage, www.mreic.reit.
Monmouth Real Estate Investment Corporation, founded in 1968, is one of the oldest public equity REITs in the world. We specialize in single tenant, net-leased industrial properties, subject to long-term leases, primarily to investment-grade tenants. Monmouth Real Estate is a fully integrated and self-managed real estate company, whose property portfolio consists of 118 properties containing a total of approximately 23.3 million rentable square feet, geographically diversified across 31 states.
Certain statements included in this press release, which are not historical facts, may be deemed forward-looking statements within the meaning of the Private Securities Litigation Reform Act of 1995. Any such forward-looking statements are based on our current expectations and involve various risks and uncertainties. Although we believe the expectations reflected in any forward-looking statements are based on reasonable assumptions, we can provide no assurance those expectations will be achieved. The risks and uncertainties that could cause actual results or events to differ materially from expectations are contained in our annual report on Form 10-K and described from time to time in our other filings with the SEC. We undertake no obligation to publicly update or revise any forward-looking statements whether as a result of new information, future events, or otherwise.
| THIRD QUARTER FISCAL YEAR 2020 SUPPLEMENTAL INFORMATION | 24 |
Notes:
(1) Non-U.S. GAAP Information: FFO, as defined by The National Association of Real Estate Investment Trusts (Nareit), represents net income attributable to common shareholders, as defined by accounting principles generally accepted in the United States of America (U.S. GAAP), excluding extraordinary items, as defined under U.S. GAAP, gains or losses from sales of previously depreciated real estate assets, impairment charges related to depreciable real estate assets, plus certain non-cash items such as real estate asset depreciation and amortization. Included in the Nareit FFO White Paper - 2018 Restatement, is an option pertaining to assets incidental to our main business in the calculation of Nareit FFO to make an election to include or exclude mark-to-market changes in the value recognized on these marketable equity securities. In conjunction with the adoption of the FFO White Paper - 2018 Restatement, for all periods presented, we have elected to exclude unrealized gains and losses from our investments in marketable equity securities from our FFO calculation. Nareit created FFO as a non-GAAP supplemental measure of REIT operating performance. We define Adjusted Funds From Operations (AFFO) as FFO, excluding stock based compensation expense, depreciation of corporate office tenant improvements, amortization of deferred financing costs, non-recurring severance expense, effect of non-cash U.S. GAAP straight-line rent adjustments and subtracting recurring capital expenditures. We define recurring capital expenditures as all capital expenditures that are recurring in nature, excluding capital expenditures related to expansions at our current locations or capital expenditures that are incurred in conjunction with obtaining a new lease or a lease renewal. We believe that, as widely recognized measures of performance used by other REITs, FFO and AFFO may be considered by investors as supplemental measures to compare our operating performance to those of other REITs. FFO and AFFO exclude historical cost depreciation as an expense and may facilitate the comparison of REITs which have a different cost basis. However, other REITs may use different methodologies to calculate FFO and AFFO and, accordingly, our FFO and AFFO may not be comparable to all other REITs. The items excluded from FFO and AFFO are significant components in understanding our financial performance.
FFO and AFFO are non-GAAP performance measures and (i) do not represent Cash Flow from Operations as defined by U.S. GAAP; (ii) should not be considered as an alternative to Net Income or Net Income Attributable to Common Shareholders as a measure of operating performance or to Cash Flows from Operating, Investing and Financing Activities; and (iii) are not an alternative to Cash Flows from Operating, Investing and Financing Activities as a measure of liquidity. FFO and AFFO, as calculated by us, may not be comparable to similarly titled measures reported by other REITs.
The following is a reconciliation of the Company’s U.S. GAAP Net Income (Loss) Attributable to Common Shareholders to the Company’s FFO and AFFO for the three and nine months ended June 30, 2020 and 2019 (in thousands):
| | | Three Months Ended | | | Nine Months Ended | |
| | | 6/30/2020 | | | 6/30/2019 | | | 6/30/2020 | | | 6/30/2019 | |
| Net Income (Loss) Attributable to Common Shareholders | | $ | 26,851 | | | $ | (3,121 | ) | | $ | (44,700 | ) | | $ | (11,664 | ) |
| Less/Plus: Unrealized Holding (Gains) Losses Arising During the Periods | | | (19,610 | ) | | | 11,609 | | | | 67,100 | | | | 38,668 | |
| Plus: Depreciation Expense (excluding Corporate Office Capitalized Costs) | | | 11,685 | | | | 10,665 | | | | 34,474 | | | | 31,692 | |
| Plus: Amortization of Intangible Assets | | | 524 | | | | 490 | | | | 1,539 | | | | 1,495 | |
| Plus: Amortization of Capitalized Lease Costs | | | 290 | | | | 256 | | | | 846 | | | | 726 | |
| FFO Attributable to Common Shareholders | | | 19,740 | | | | 19,899 | | | | 59,259 | | | | 60,917 | |
| Plus: Depreciation of Corporate Office Capitalized Costs | | | 57 | | | | 168 | | | | 176 | | | | 376 | |
| Plus: Stock Compensation Expense | | | 98 | | | | 231 | | | | 368 | | | | 574 | |
| Plus: Amortization of Financing Costs | | | 327 | | | | 319 | | | | 1,084 | | | | 956 | |
| Plus: Non-recurring Severance Expense | | | -0- | | | | -0- | | | | 786 | | | | -0- | |
| Less: Recurring Capital Expenditures | | | (508 | ) | | | (702 | ) | | | (1,443 | ) | | | (1,888 | ) |
| Less: Effect of Non-cash U.S. GAAP Straight-line Rent Adjustment | | | (226 | ) | | | (527 | ) | | | (1,459 | ) | | | (1,352 | ) |
| AFFO Attributable to Common Shareholders | | $ | 19,488 | | | $ | 19,388 | | | $ | 58,771 | | | $ | 59,583 | |
The following are the Cash Flows provided (used) by Operating, Investing and Financing Activities for the nine months ended June 30, 2020 and 2019 (in thousands):
| | | Nine Months Ended | |
| | | | 6/30/2020 | | | | 6/30/2019 | |
| | | | | | | | | |
| Operating Activities | | $ | 74,932 | | | $ | 74,753 | |
| Investing Activities | | | (163,049 | ) | | | (185,336 | ) |
| Financing Activities | | | 80,042 | | | | 114,890 | |
# # # # #
| THIRD QUARTER FISCAL YEAR 2020 SUPPLEMENTAL INFORMATION | 25 |