Exhibit 99

Table of Contents
The statement of operations and supplemental statement of operations provided in this supplemental information package present funds from operations (FFO), adjusted funds from operations (AFFO), net operating income (NOI) and adjusted EBITDA, which are REIT industry financial measures that are not calculated in accordance with accounting principles generally accepted in the United States. Please see page 21 for a definition of these supplemental performance measures. Please see the supplemental statement of operations reconciliation for a reconciliation of certain captions in the supplemental statement of operations reported in this supplemental information package to the statement of operations as reported in the Company’s filings with the SEC on Form 10-Q.
Consolidated Balance Sheets
(in thousands except for per share amounts)
| | | As of | | | As of | |
| | | June 30, | | | September 30, | |
| | | 2021 | | | 2020 | |
| | (unaudited) | | | | |
| ASSETS | | | | | | |
| | | | | | | |
| Real Estate Investments: | | | | | | | | |
| Land | | $ | 266,791 | | | $ | 250,497 | |
| Buildings and Improvements | | | 1,942,840 | | | | 1,793,367 | |
| Total Real Estate Investments | | | 2,209,631 | | | | 2,043,864 | |
| Accumulated Depreciation | | | (332,725 | ) | | | (296,020 | ) |
| Real Estate Investments | | | 1,876,906 | | | | 1,747,844 | |
| | | | | | | | | |
| Cash and Cash Equivalents | | | 90,896 | | | | 23,517 | |
| Securities Available for Sale at Fair Value | | | 148,382 | | | | 108,832 | |
| Tenant and Other Receivables | | | 3,201 | | | | 5,431 | |
| Deferred Rent Receivable | | | 15,066 | | | | 12,856 | |
| Prepaid Expenses | | | 9,191 | | | | 7,554 | |
| Intangible Assets, net of Accumulated Amortization of $19,061 and $17,330, respectively | | | 19,939 | | | | 16,832 | |
| Capitalized Lease Costs, net of Accumulated Amortization of $4,614 and $4,286, respectively | | | 5,817 | | | | 5,631 | |
| Financing Costs, net of Accumulated Amortization of $648 and $356, respectively | | | 1,088 | | | | 1,380 | |
| Other Assets | | | 7,592 | | | | 9,906 | |
| TOTAL ASSETS | | $ | 2,178,078 | | | $ | 1,939,783 | |
| | | | | | | | | |
| LIABILITIES AND SHAREHOLDERS’ EQUITY | | | | | | | | |
| | | | | | | | | |
| Liabilities: | | | | | | | | |
| Fixed Rate Mortgage Notes Payable, net of Unamortized Debt | | | | | | | | |
| Issuance Costs | | $ | 848,994 | | | $ | 799,507 | |
| Loans Payable | | | 165,000 | | | | 75,000 | |
| Accounts Payable and Accrued Expenses | | | 5,532 | | | | 3,998 | |
| Other Liabilities | | | 22,705 | | | | 23,673 | |
| Total Liabilities | | | 1,042,231 | | | | 902,178 | |
| | | | | | | | | |
| COMMITMENTS AND CONTINGENCIES | | | | | | | | |
| | | | | | | | | |
| Shareholders’ Equity: | | | | | | | | |
| 6.125% Series C Cumulative Redeemable Preferred Stock, $0.01 Par Value Per Share: 26,600 and 21,900 Shares Authorized as of June 30, 2021 and September 30, 2020, respectively; 21,986 and 18,880 Shares Issued and Outstanding as of June 30, 2021 and September 30, 2020, respectively | | | 549,640 | | | | 471,994 | |
| Common Stock, $0.01 Par Value Per Share: 300,000 and 200,000 Shares Authorized as of June 30, 2021 and September 30, 2020, respectively; 98,302 and 98,054 Shares Issued and Outstanding as of June 30, 2021 and September 30, 2020, respectively | | | 983 | | | | 981 | |
| Excess Stock, $0.01 Par Value Per Share: 200,000 Shares Authorized as of June 30, 2021 and September 30, 2020; No Shares Issued or Outstanding as of June 30, 2021 and September 30, 2020 | | | -0- | | | | -0- | |
| Additional Paid-In Capital | | | 587,730 | | | | 568,998 | |
| Accumulated Other Comprehensive Loss | | | (2,506 | ) | | | (4,368 | ) |
| Undistributed Income | | | -0- | | | | -0- | |
| Total Shareholders’ Equity | | | 1,135,847 | | | | 1,037,605 | |
| TOTAL LIABILITIES & SHAREHOLDERS’ EQUITY | | $ | 2,178,078 | | | $ | 1,939,783 | |
 THIRD QUARTER FISCAL YEAR 2021 SUPPLEMENTAL information THIRD QUARTER FISCAL YEAR 2021 SUPPLEMENTAL information | 3 |
Consolidated Statements of Income (Loss)
(unaudited) (in thousands)
| | | For The | | | For The | |
| | | Three Months Ended | | | Nine Months Ended | |
| | | 6/30/2021 | | | 6/30/2020 | | | 6/30/2021 | | | 6/30/2020 | |
| INCOME: | | | | | | | | | | | | | | | | |
| Rental Revenue | | $ | 39,032 | | | $ | 35,427 | | | $ | 115,123 | | | $ | 105,410 | |
| Reimbursement Revenue | | | 6,962 | | | | 6,348 | | | | 20,818 | | | | 19,772 | |
| Lease Termination Income | | | -0- | | | | -0- | | | | 377 | | | | -0- | |
| TOTAL INCOME | | | 45,994 | | | | 41,775 | | | | 136,318 | | | | 125,182 | |
| | | | | | | | | | | | | | | | | |
| EXPENSES: | | | | | | | | | | | | | | | | |
| Real Estate Taxes | | | 5,402 | | | | 5,140 | | | | 16,324 | | | | 15,205 | |
| Operating Expenses | | | 1,688 | | | | 1,590 | | | | 5,361 | | | | 5,344 | |
| General & Administrative Expenses | | | 2,246 | | | | 2,198 | | | | 6,363 | | | | 6,858 | |
| Non-recurring Strategic Alternatives & Proxy Costs | | | 8,657 | | | | -0- | | | | 10,896 | | | | -0- | |
| Non-recurring Severance Expense | | | -0- | | | | -0- | | | | -0- | | | | 786 | |
| Depreciation | | | 13,016 | | | | 11,743 | | | | 38,158 | | | | 34,650 | |
| Amortization of Capitalized Lease Costs and Intangible Assets | | | 1,031 | | | | 788 | | | | 2,718 | | | | 2,308 | |
| TOTAL EXPENSES | | | 32,040 | | | | 21,459 | | | | 79,820 | | | | 65,151 | |
| | | | | | | | | | | | | | | | | |
| OTHER INCOME (EXPENSE): | | | | | | | | | | | | | | | | |
| Dividend Income | | | 1,486 | | | | 2,344 | | | | 4,681 | | | | 8,987 | |
| Realized Gain On Sale of Real Estate Investment | | | 6,376 | | | | -0- | | | | 6,376 | | | | -0- | |
| Realized Gain On Sale of Securities Transactions | | | -0- | | | | -0- | | | | 2,248 | | | | -0- | |
| Unrealized Holding Gains (Losses) Arising During the Periods | | | 16,471 | | | | 19,610 | | | | 55,377 | | | | (67,100 | ) |
| Interest Expense, including Amortization of Financing Costs | | | (9,685 | ) | | | (8,975 | ) | | | (28,231 | ) | | | (27,235 | ) |
| TOTAL OTHER INCOME (EXPENSE) | | | 14,648 | | | | 12,979 | | | | 40,451 | | | | (85,348 | ) |
| | | | | | | | | | | | | | | | | |
| NET INCOME (LOSS) | | | 28,602 | | | | 33,295 | | | | 96,949 | | | | (25,317 | ) |
| Less: Net Income (Loss) Attributable to Non-Controlling Interest | | | 2,894 | | | | (163 | ) | | | 2,996 | | | | (86 | ) |
| | | | | | | | | | | | | | | | | |
| NET INCOME (LOSS) ATTRIBUTABLE TO SHAREHOLDERS | | | 25,708 | | | | 33,458 | | | | 93,953 | | | | (25,231 | ) |
| Less: Preferred Dividends | | | 8,416 | | | | 6,607 | | | | 25,003 | | | | 19,469 | |
| | | | | | | | | | | | | | | | | |
| NET INCOME (LOSS) ATTRIBUTABLE TO COMMON SHAREHOLDERS | | $ | 17,292 | | | $ | 26,851 | | | $ | 68,950 | | | $ | (44,700 | ) |
| THIRD QUARTER FISCAL YEAR 2021 SUPPLEMENTAL information | 4 |
FFO, AFFO and Adjusted EBITDA Reconciliations
(unaudited) (in thousands)
| | | For The | | | For The | |
| | | Three Months Ended | | | Nine Months Ended | |
| | | 6/30/2021 | | | 6/30/2020 | | | 6/30/2021 | | | 6/30/2020 | |
| FFO, AFFO | | | | | | | | | | | | | | | | |
| Net Income (Loss) Attributable to Common Shareholders | | $ | 17,292 | | | $ | 26,851 | | | $ | 68,950 | | | $ | (44,700 | ) |
| Less/Plus: Unrealized Holding (Gains) Losses Arising During the Periods | | | (16,471 | ) | | | (19,610 | ) | | | (55,377 | ) | | | 67,100 | |
| Plus: Depreciation Expense (excluding Corporate Office Capitalized Costs) | | | 12,960 | | | | 11,672 | | | | 37,959 | | | | 34,436 | |
| Plus: Amortization of Intangible Assets | | | 599 | | | | 524 | | | | 1,731 | | | | 1,539 | |
| Plus: Amortization of Capitalized Lease Costs | | | 374 | | | | 284 | | | | 971 | | | | 830 | |
| Less: Realized Gain on Sale of Real Estate Investment (A) | | | (3,252 | ) | | | -0- | | | | (3,252 | ) | | | -0- | |
| FFO Attributable to Common Shareholders (B) | | | 11,502 | | | | 19,721 | | | | 50,982 | | | | 59,205 | |
| Plus: Depreciation of Corporate Office Capitalized Costs | | | 57 | | | | 57 | | | | 172 | | | | 176 | |
| Plus: Stock Compensation Expense | | | 77 | | | | 98 | | | | 210 | | | | 368 | |
| Plus: Amortization of Financing Costs | | | 350 | | | | 326 | | | | 1,026 | | | | 1,082 | |
| Plus: Non-recurring Strategic Alternatives & Proxy Costs | | | 8,657 | | | | -0- | | | | 10,896 | | | | -0- | |
| Plus: Non-recurring Severance Expense | | | -0- | | | | -0- | | | | -0- | | | | 786 | |
| Less: Realized Gain on Sale of Securities Transactions | | | -0- | | | | -0- | | | | (2,248 | ) | | | -0- | |
| Less: Lease Termination Income | | | -0- | | | | -0- | | | | (377 | ) | | | -0- | |
| Less: Recurring Capital Expenditures | | | (229 | ) | | | (508 | ) | | | (791 | ) | | | (1,443 | ) |
| Less: Effect of Non-cash U.S. GAAP Straight-line Rent Adjustment | | | (713 | ) | | | (231 | ) | | | (2,363 | ) | | | (1,469 | ) |
| AFFO Attributable to Common Shareholders | | $ | 19,701 | | | $ | 19,463 | | | $ | 57,507 | | | $ | 58,705 | |
| | | For The | | | For The | |
| | | Three Months Ended | | | Nine Months Ended | |
| | | 6/30/2021 | | | 6/30/2020 | | | 6/30/2021 | | | 6/30/2020 | |
| Adjusted EBITDA | | | | | | | | | | | | | | | | |
| Net Income (Loss) Attributable to Common Shareholders | | $ | 17,292 | | | $ | 26,851 | | | $ | 68,950 | | | $ | (44,700 | ) |
| Plus: Preferred Dividends | | | 8,416 | | | | 6,607 | | | | 25,003 | | | | 19,469 | |
| Plus: Interest Expense, including Amortization of Financing Costs | | | 9,685 | | | | 8,975 | | | | 28,231 | | | | 27,235 | |
| Plus: Depreciation and Amortization | | | 14,047 | | | | 12,531 | | | | 40,876 | | | | 36,958 | |
| Plus: Net Amortization of Acquired Above and Below Market Lease Revenue | | | 26 | | | | 26 | | | | 77 | | | | 77 | |
| Plus: Non-recurring Strategic Alternatives & Proxy Costs | | | 8,657 | | | | -0- | | | | 10,896 | | | | -0- | |
| Less/Plus: Unrealized Holding (Gains) Losses Arising During the Periods | | | (16,471 | ) | | | (19,610 | ) | | | (55,377 | ) | | | 67,100 | |
| Less: Realized Gain on Sale of Real Estate Investment (A) | | | (3,252 | ) | | | -0- | | | | (3,252 | ) | | | -0- | |
| Less: Gain on Sale of Securities Transactions | | | -0- | | | | -0- | | | | (2,248 | ) | | | -0- | |
| Adjusted EBITDA | | $ | 38,400 | | | $ | 35,380 | | | $ | 113,156 | | | $ | 106,139 | |
| (A) | Represents our portion of the net realized gain from the sale of our property that we owned a 51% interest in. |
| (B) | FFO Attributable to Common Shareholders for the three and nine months ended June 30, 2021 includes Non-recurring Strategic Alternatives & Proxy Costs of $8.7 million and $10.9 million, respectively. FFO Attributable to Common Shareholders for the three and nine months ended June 30, 2021 excluding these Non-recurring Strategic Alternatives & Proxy Costs is $20.2 million and $61.9 million, respectively. |
| THIRD QUARTER FISCAL YEAR 2021 SUPPLEMENTAL information | 5 |
NOI Reconciliations
(unaudited) (in thousands)
| | | For The | | | For The | |
| | | Three Months Ended | | | Nine Months Ended | |
| | | 6/30/2021 | | | 6/30/2020 | | | 6/30/2021 | | | 6/30/2020 | |
| Net Operating Income | | | | | | | | | | | | | | | | |
| Net Income (Loss) Attributable to Common Shareholders | | $ | 17,292 | | | $ | 26,851 | | | $ | 68,950 | | | $ | (44,700 | ) |
| Plus: Net Income (Loss) Attributable to Non-Controlling Interest | | | 2,894 | | | | (163 | ) | | | 2,996 | | | | (86 | ) |
| Plus: Preferred Dividend Expense | | | 8,416 | | | | 6,607 | | | | 25,003 | | | | 19,469 | |
| Plus: General & Administrative Expenses | | | 2,246 | | | | 2,198 | | | | 6,363 | | | | 6,858 | |
| Plus: Non-recurring Strategic Alternative & Proxy Costs | | | 8,657 | | | | -0- | | | | 10,896 | | | | -0- | |
| Plus: Non-recurring Severance Expense | | | -0- | | | | -0- | | | | -0- | | | | 786 | |
| Plus: Depreciation | | | 13,016 | | | | 11,743 | | | | 38,158 | | | | 34,650 | |
| Plus: Amortization of Capitalized Lease Costs and Intangible Assets | | | 1,031 | | | | 788 | | | | 2,718 | | | | 2,308 | |
| Plus: Interest Expense, including Amortization of Financing Costs | | | 9,685 | | | | 8,975 | | | | 28,231 | | | | 27,235 | |
| Less/Plus: Unrealized Holding (Gains) Losses Arising During the Periods | | | (16,471 | ) | | | (19,610 | ) | | | (55,377 | ) | | | 67,100 | |
| Less: Dividend Income | | | (1,486 | ) | | | (2,344 | ) | | | (4,681 | ) | | | (8,987 | ) |
| Less: Realized Gain on Sale of Securities Transactions | | | -0- | | | | -0- | | | | (2,248 | ) | | | -0- | |
| Less: Realized Gain on Sale of Real Estate Investment | | | (6,376 | ) | | | -0- | | | | (6,376 | ) | | | -0- | |
| Less: Lease Termination Income | | | -0- | | | | -0- | | | | (377 | ) | | | -0- | |
| Net Operating Income – NOI | | $ | 38,904 | | | $ | 35,045 | | | $ | 114,256 | | | $ | 104,633 | |
| | | For The | | | For The | |
| | | Three Months Ended | | | Nine Months Ended | |
| | | 6/30/2021 | | | 6/30/2020 | | | 6/30/2021 | | | 6/30/2020 | |
| Components of Net Operating Income Consists of: | | | | | | | | | | | | | | | | |
| Revenues: | | | | | | | | | | | | | | | | |
| Rental Revenue | | $ | 39,032 | | | | 35,427 | | | $ | 115,123 | | | $ | 105,410 | |
| Reimbursement Revenue | | | 6,962 | | | | 6,348 | | | | 20,818 | | | | 19,772 | |
| Total Rental and Reimbursement Revenue | | | 45,994 | | | | 41,775 | | | | 135,941 | | | | 125,182 | |
| | | | | | | | | | | | | | | | | |
| Expenses: | | | | | | | | | | | | | | | | |
| Real Estate Taxes | | | 5,402 | | | | 5,140 | | | | 16,324 | | | | 15,205 | |
| Operating Expenses | | | 1,688 | | | | 1,590 | | | | 5,361 | | | | 5,344 | |
| Total Real Estate Taxes and Operating Expenses | | | 7,090 | | | | 6,730 | | | | 21,685 | | | | 20,549 | |
| Net Operating Income – NOI | | $ | 38,904 | | | $ | 35,045 | | | $ | 114,256 | | | $ | 104,633 | |
| THIRD QUARTER FISCAL YEAR 2021 SUPPLEMENTAL information | 6 |
Financial Highlights
(unaudited) (in thousands except for per share amounts)
| | | For The | | | For The | |
| | | Three Months Ended | | | Nine Months Ended | |
| | | 6/30/2021 | | | 6/30/2020 | | | Change (%) | | | 6/30/2021 | | | 6/30/2020 | | | Change (%) | |
| | | | | | | | | | | | | | | | | | | |
| Weighted Average Common Shares Outstanding | | | | | | | | | | | | | | | | | | | | | | | | |
| Basic | | | 98,302 | | | | 97,906 | | | | 0.4 | % | | | 98,234 | | | | 97,548 | | | | 0.7 | % |
| Diluted | | | 98,539 | | | | 97,962 | | | | 0.6 | % | | | 98,415 | | | | 97,626 | | | | 0.8 | % |
| | | | | | | | | | | | | | | | | | | | | | | | | |
| Net Income (Loss) Attributable to Common Shareholders | | $ | 17,292 | | | $ | 26,851 | | | | (35.6 | )% | | $ | 68,950 | | | $ | (44,700 | ) | | | 254.3 | % |
| | | | | | | | | | | | | | | | | | | | | | | | | |
| Basic | | $ | 0.17 | | | $ | 0.27 | | | | (37.0 | )% | | $ | 0.71 | | | $ | (0.46 | ) | | | 254.3 | % |
| Diluted | | | 0.17 | | | | 0.27 | | | | (37.0 | )% | | | 0.71 | | | | (0.46 | ) | | | 254.3 | % |
| | | | | | | | | | | | | | | | | | | | | | | | | |
| Net Operating Income – NOI | | $ | 38,904 | | | $ | 35,045 | | | | 11.0 | % | | $ | 114,256 | | | $ | 104,633 | | | | 9.2 | % |
| | | | | | | | | | | | | | | | | | | | | | | | | |
| Basic | | $ | 0.40 | | | $ | 0.36 | | | | 11.1 | % | | $ | 1.16 | | | $ | 1.07 | | | | 8.4 | % |
| Diluted | | | 0.39 | | | | 0.36 | | | | 8.3 | % | | | 1.16 | | | | 1.07 | | | | 8.4 | % |
| | | | | | | | | | | | | | | | | | | | | | | | | |
| Funds From Operations – FFO | | $ | 11,502 | | | $ | 19,721 | | | | (41.7 | )% | | $ | 50,982 | | | $ | 59,205 | | | | (13.9 | )% |
| | | | | | | | | | | | | | | | | | | | | | | | | |
| Basic | | $ | 0.12 | | | $ | 0.20 | | | | (40.0 | )% | | $ | 0.52 | | | $ | 0.61 | | | | (14.8 | )% |
| Diluted | | | 0.12 | | | | 0.20 | | | | (40.0 | )% | | | 0.52 | | | | 0.61 | | | | (14.8 | )% |
| | | | | | | | | | | | | | | | | | | | | | | | | |
| FFO Excluding Non-recurring Strategic Alternatives & Proxy Costs | | $ | 20,159 | | | $ | 19,721 | | | | 2.2 | % | | $ | 61,878 | | | $ | 59,205 | | | | 4.5 | % |
| | | | | | | | | | | | | | | | | | | | | | | | | |
| Basic | | $ | 0.21 | | | $ | 0.20 | | | | 0.5 | % | | $ | 0.63 | | | $ | 0.61 | | | | 3.2 | % |
| Diluted | | | 0.20 | | | | 0.20 | | | | 0.0 | % | | | 0.63 | | | | 0.61 | | | | 3.2 | % |
| | | | | | | | | | | | | | | | | | | | | | | | | |
| Adjusted Funds From Operations – AFFO | | $ | 19,701 | | | $ | 19,463 | | | | 1.2 | % | | $ | 57,507 | | | $ | 58,705 | | | | (2.0 | )% |
| | | | | | | | | | | | | | | | | | | | | | | | | |
| Basic | | $ | 0.20 | | | $ | 0.20 | | | | 0.0 | % | | $ | 0.59 | | | $ | 0.60 | | | | (1.7 | )% |
| Diluted | | | 0.20 | | | | 0.20 | | | | 0.0 | % | | | 0.58 | | | | 0.60 | | | | (3.3 | )% |
| | | | | | | | | | | | | | | | | | | | | | | | | |
| Dividends Declared per Common Share | | $ | 0.18 | | | $ | 0.17 | | | | | | | $ | 0.53 | | | $ | 0.51 | | | | | |
| | | | | | | | | | | | | | | | | | | | | | | | | |
| Dividend/FFO Excluding Non-recurring Strategic Alternatives & Proxy Costs | | | 90.0 | % | | | 85.0 | % | | | | | | | 84.1 | % | | | 83.6 | % | | | | |
| | | | | | | | | | | | | | | | | | | | | | | | | |
| Dividend/AFFO Payout Ratio | | | 90.0 | % | | | 85.0 | % | | | | | | | 91.4 | % | | | 85.0 | % | | | | |
| THIRD QUARTER FISCAL YEAR 2021 SUPPLEMENTAL information | 7 |
Same Property Statistics
(unaudited) (in thousands except for square feet)
| | | For The Three Months Ended | | | | | | | |
| | | 6/30/2021 | | | | | | 6/30/2020 | | | Change | | | Change % | |
| | | | | | | | | | | | | | | | |
| Total Square Feet / Total Properties | | | 24,521,727 / 120 | | | | | | | | 23,375,642 / 118 | | | | 1,146,085 | | | | 4.9 | % |
| | | | | | | | | | | | | | | | | | | | | |
| Occupancy Percentage at End of Period | | | 99.7 | % | | | | | | | 99.4 | % | | | 30 bps | | | | 0.3 | % |
| | | | | | | | | | | | | | | | | | | | | |
| Same Property Square Feet / Number of Same Properties | | | | | | | 22,498,383 / 113 | | | | | | | | | | | | | |
| | | | | | | | | | | | | | | | | | | | | |
| Same Property Occupancy Percentage at End of Period | | | 99.6 | % | | | | | | | 99.4 | % | | | 20 bps | | | | 0.2 | % |
| | | | | | | | | | | | | | | | | | | | | |
| Same Property Net Operating Income (NOI) (GAAP) | | $ | 34,550 | | | | | | | $ | 34,207 | | | $ | 343 | | | | 1.0 | % |
| | | | | | | | | | | | | | | | | | | | | |
| Reversal of Effect of Non-cash U.S. GAAP Straight-line Rent Adjustment | | | (556 | ) | | | | | | | (586 | ) | | | 30 | | | | | |
| Same Property Cash NOI | | $ | 33,994 | | | | | | | $ | 33,621 | | | $ | 373 | | | | 1.1 | % |
Same Property Statistics include all properties owned during the entire periods presented with the exclusion of properties expanded during the periods presented.
Reconciliation of Same Property NOI to Total NOI
(unaudited) (in thousands)
| | | For The Three Months Ended | | | | | | | |
| | | 6/30/2021 | | | 6/30/2020 | | | Change | | | Change % | |
| | | | | | | | | | | | | |
| Same Property NOI (GAAP) | | $ | 34,550 | | | $ | 34,207 | | | $ | 343 | | | | 1.0 | % |
| | | | | | | | | | | | | | | | | |
| NOI of properties purchased subsequent to March 31, 2020 (two properties purchased during fiscal 2021 and three properties purchased during fiscal 2020) | | | 3,680 | | | | 426 | | | | | | | | | |
| | | | | | | | | | | | | | | | | |
| NOI of property expanded subsequent to March 31, 2020 (two properties expanded during fiscal 2021) | | | 804 | | | | 688 | | | | | | | | | |
| | | | | | | | | | | | | | | | | |
| NOI of property sold subsequent to March 31, 2020 (one property sold during fiscal 2021) | | | (130 | ) | | | (276 | ) | | | | | | | | |
| | | | | | | | | | | | | | | | | |
| Total NOI | | $ | 38,904 | | | $ | 35,045 | | | $ | 3,859 | | | | 11.0 | % |
| THIRD QUARTER FISCAL YEAR 2021 SUPPLEMENTAL information | 8 |
Same Property Statistics
(unaudited) (in thousands except for square feet)
| | | For The Nine Months Ended | | | | | | | |
| | | 6/30/2021 | | | | | | 6/30/2020 | | | Change | | | Change % | |
| | | | | | | | | | | | | | | | |
| Total Square Feet / Total Properties | | | 24,521,727 / 120 | | | | | | | | 23,375,642 / 118 | | | | 1,146,085 | | | | 4.9 | % |
| | | | | | | | | | | | | | | | | | | | | |
| Occupancy Percentage at End of Period | | | 99.7 | % | | | | | | | 99.4 | % | | | 30 bps | | | | 0.3 | % |
| | | | | | | | | | | | | | | | | | | | | |
| Same Property Square Feet / Number of Same Properties | | | | | | | 21,729,641 / 111 | | | | | | | | | | | | | |
| | | | | | | | | | | | | | | | | | | | | |
| Same Property Occupancy Percentage at End of Period | | | 99.6 | % | | | | | | | 99.4 | % | | | 20 bps | | | | 0.2 | % |
| | | | | | | | | | | | | | | | | | | | | |
| Same Property Net Operating Income (NOI) (GAAP) | | $ | 98,280 | | | | | | | $ | 98,179 | | | $ | 101 | | | | 0.1 | % |
| | | | | | | | | | | | | | | | | | | | | |
| Reversal of Effect of Non-cash U.S. GAAP Straight-line Rent Adjustment | | | (1,195 | ) | | | | | | | (1,499 | ) | | | 304 | | | | | |
| Same Property Cash NOI | | $ | 97,085 | | | | | | | $ | 96,680 | | | $ | 405 | | | | 0.4 | % |
Same Property Statistics include all properties owned during the entire periods presented with the exclusion of properties expanded during the periods presented.
Reconciliation of Same Property NOI to Total NOI
(unaudited) (in thousands)
| | | For The Nine Months Ended | | | | | | | |
| | | 6/30/2021 | | | 6/30/2020 | | | Change | | | Change % | |
| | | | | | | | | | | | | |
| Same Property NOI (GAAP) | | $ | 98,280 | | | $ | 98,179 | | | $ | 101 | | | | 0.1 | % |
| | | | | | | | | | | | | | | | | |
NOI of properties purchased subsequent to September 30, 2019 (two properties purchased during fiscal 2021 and five properties purchased during fiscal 2020)
| | | 13,551 | | | | 4,393 | | | | | | | | | |
| | | | | | | | | | | | | | | | | |
| NOI of properties expanded subsequent to September 30, 2019 (two properties expanded during fiscal 2021) | | | 2,238 | | | | 2,066 | | | | | | | | | |
| | | | | | | | | | | | | | | | | |
| NOI of property sold subsequent to September 30, 2019 (one property sold during fiscal 2021) | | | 187 | | | | (5 | ) | | | | | | | | |
| | | | | | | | | | | | | | | | | |
| Total NOI | | $ | 114,256 | | | $ | 104,633 | | | $ | 9,623 | | | | 9.2 | % |
| THIRD QUARTER FISCAL YEAR 2021 SUPPLEMENTAL information | 9 |
Consolidated Statements of Cash Flows
(unaudited)(in thousands)
| | | For The | |
| | | Nine Months Ended | |
| | | 6/30/2021 | | | 6/30/2020 | |
| CASH FLOWS FROM OPERATING ACTIVITIES | | | | | | | | |
| Net Income (Loss) | | $ | 96,949 | | | $ | (25,317 | ) |
| Noncash Items Included in Net Income (Loss): | | | | | | | | |
| Depreciation & Amortization | | | 41,919 | | | | 38,043 | |
| Deferred Straight Line Rent | | | (2,378 | ) | | | (1,459 | ) |
| Stock Compensation Expense | | | 210 | | | | 368 | |
| Securities Available for Sale Received as Dividend Income | | | (752 | ) | | | (977 | ) |
| Realized Gain on Sale of Real Estate Investment | | | (6,376 | ) | | | -0- | |
| Realized Gain on Sale of Securities Transactions | | | (2,248 | ) | | | -0- | |
| Unrealized Holding (Gains) Losses Arising During the Periods | | | (55,377 | ) | | | 67,100 | |
| Changes in: | | | | | | | | |
| Tenant & Other Receivables | | | 2,307 | | | | (1,153 | ) |
| Prepaid Expenses | | | (1,637 | ) | | | (2,242 | ) |
| Other Assets & Capitalized Lease Costs | | | 803 | | | | (1,999 | ) |
| Accounts Payable, Accrued Expenses & Other Liabilities | | | 3,348 | | | | 2,600 | |
| NET CASH PROVIDED BY OPERATING ACTIVITIES | | | 76,768 | | | | 74,964 | |
| | | | | | | | | |
| CASH FLOWS FROM INVESTING ACTIVITIES | | | | | | | | |
| Purchase of Real Estate & Intangible Assets | | | (171,082 | ) | | | (160,023 | ) |
| Capital Improvements | | | (5,384 | ) | | | (4,726 | ) |
| Net Proceeds from Sale of Real Estate Investments | | | 12,303 | | | | -0- | |
| Return of Deposits on Real Estate | | | 5,060 | | | | 2,000 | |
| Deposits Paid on Acquisitions of Real Estate | | | (4,970 | ) | | | (550 | ) |
| Proceeds from the Sale of Securities Available for Sale | | | 16,327 | | | | -0- | |
| Proceeds from Securities Available for Sale Called for Redemption | | | 2,500 | | | | 250 | |
| NET CASH USED IN INVESTING ACTIVITIES | | | (145,246 | ) | | | (163,049 | ) |
| | | | | | | | | |
| CASH FLOWS FROM FINANCING ACTIVITIES | | | | | | | | |
| Net Draws (Repayments) on Loans Payable | | | 90,000 | | | | (15,000 | ) |
| Proceeds from Fixed Rate Mortgage Notes Payable | | | 104,000 | | | | 100,560 | |
| Principal Payments on Fixed Rate Mortgage Notes Payable | | | (54,696 | ) | | | (41,166 | ) |
| Financing Costs Paid on Debt | | | (569 | ) | | | (2,397 | ) |
| Proceeds from the Exercise of Stock Options | | | 1,966 | | | | 1,016 | |
| Net Distributions to Non-controlling Interest | | | (5,491 | ) | | | (32 | ) |
Proceeds from At-The-Market 6.125% Series C Preferred Stock,
net of offering costs | | | 75,958 | | | | 84,815 | |
| Proceeds from Issuance of Common Stock in the DRIP, net of Dividend Reinvestments | | | 320 | | | | 18,641 | |
| Shares repurchased through the Common Stock Repurchase Plan | | | -0- | | | | (4,276 | ) |
| Preferred Dividends Paid | | | (24,607 | ) | | | (19,029 | ) |
| Common Dividends Paid, net of Reinvestments | | | (51,024 | ) | | | (43,122 | ) |
| NET CASH PROVIDED BY FINANCING ACTIVITIES | | | 135,857 | | | | 80,010 | |
| | | | | | | | | |
| NET INCREASE (DECREASE) IN CASH AND CASH EQUIVALENTS | | | 67,379 | | | | (8,075 | ) |
| CASH AND CASH EQUIVALENTS - BEGINNING OF PERIOD | | | 23,517 | | | | 20,179 | |
| CASH AND CASH EQUIVALENTS - END OF PERIOD | | $ | 90,896 | | | $ | 12,104 | |
| THIRD QUARTER FISCAL YEAR 2021 SUPPLEMENTAL information | 10 |
Capital Structure and Leverage Ratios
(unaudited) (in thousands except for per share amounts)
| | | As of | | | As of | | | As of | |
| | | 6/30/2021 | | | 6/30/2020 | | | 9/30/2020 | |
| | | | | | | | | | |
| Fixed Rate Mortgage Notes Payable, net of Unamortized Debt Issuance Costs | | $ | 848,994 | | | $ | 804,342 | | | $ | 799,507 | |
| Loans Payable | | | 165,000 | | | | 80,000 | | | | 75,000 | |
| Total Debt | | | 1,013,994 | | | | 884,342 | | | | 874,507 | |
| | | | | | | | | | | | | |
| 6.125% Series C Cumulative Redeemable Preferred Stock | | | 549,640 | | | | 433,850 | | | | 471,994 | |
| Common Stock, Additional Paid-In-Capital & Other | | | 586,207 | | | | 589,935 | | | | 565,611 | |
| Total Shareholders’ Equity | | | 1,135,847 | | | | 1,023,785 | | | | 1,037,605 | |
| | | | | | | | | | | | | |
| Total Book Capitalization | | | 2,149,841 | | | | 1,908,127 | | | | 1,912,112 | |
| | | | | | | | | | | | | |
| Accumulated Depreciation | | | 332,725 | | | | 284,058 | | | | 296,020 | |
| Total Undepreciated Book Capitalization | | $ | 2,482,566 | | | $ | 2,192,185 | | | $ | 2,208,132 | |
| | | | | | | | | | | | | |
| Shares Outstanding | | | 98,302 | | | | 97,972 | | | | 98,054 | |
| Market Price Per Share | | $ | 18.72 | | | $ | 14.49 | | | $ | 13.85 | |
| | | | | | | | | | | | | |
| Equity Market Capitalization | | $ | 1,840,217 | | | $ | 1,419,609 | | | $ | 1,358,049 | |
| Total Debt | | | 1,013,994 | | | | 884,342 | | | | 874,507 | |
| Total Preferred Stock | | | 549,640 | | | | 433,850 | | | | 471,994 | |
| Total Market Capitalization | | $ | 3,403,851 | | | $ | 2,737,801 | | | $ | 2,704,550 | |
| | | | | | | | | | | | | |
| Total Debt | | $ | 1,013,994 | | | $ | 884,342 | | | $ | 874,507 | |
| less: Cash and Cash Equivalents | | | 90,896 | | | | 12,104 | | | | 23,517 | |
| Net Debt | | $ | 923,098 | | | $ | 872,238 | | | $ | 850,990 | |
| less: Securities Available for Sale at Fair Value (Securities) | | | 148,382 | | | | 118,877 | | | | 108,832 | |
| Net Debt Less Securities | | $ | 774,716 | | | $ | 753,361 | | | $ | 742,158 | |
| | | | | | | | | | | | | |
| Net Debt / Total Undepreciated Book Capitalization | | | 37.2 | % | | | 39.8 | % | | | 38.5 | % |
| Net Debt / Total Market Capitalization | | | 27.1 | % | | | 31.9 | % | | | 31.5 | % |
| Net Debt Plus Preferred Stock / Total Market Capitalization | | | 43.3 | % | | | 47.7 | % | | | 48.9 | % |
| Net Debt Less Securities / Total Undepreciated Book Capitalization | | | 31.2 | % | | | 34.4 | % | | | 33.6 | % |
| Net Debt Less Securities / Total Market Capitalization | | | 22.8 | % | | | 27.5 | % | | | 27.4 | % |
| Net Debt Less Securities Plus Preferred Stock / Total Market Capitalization | | | 38.9 | % | | | 43.4 | % | | | 44.9 | % |
| | | | | | | | | | | | | |
| Weighted Average Interest Rate on Fixed Rate Mortgage Debt | | | 3.86 | % | | | 4.00 | % | | | 3.98 | % |
| Weighted Average Term on Fixed Rate Mortgage Debt | | | 11.1 yrs. | | | | 11.2 yrs. | | | | 11.1 yrs. | |
| Weighted Average Lease Term | | | 7.2 yrs. | | | | 7.2 yrs. | | | | 7.1 yrs. | |
| THIRD QUARTER FISCAL YEAR 2021 SUPPLEMENTAL information | 11 |
Capital Structure and Leverage Ratios
(unaudited) (in thousands)
| | | For the Three Months Ended | | | For the Nine Months Ended | | | Fiscal Year Ended | |
| | | 6/30/2021 | | | 6/30/2020 | | | 6/30/2021 | | | 6/30/2020 | | | 9/30/2020 | |
| Net Income (Loss) Attributable to Common Shareholders | | $ | 17,292 | | | $ | 26,851 | | | $ | 68,950 | | | $ | (44,700 | ) | | $ | (48,617 | ) |
| Plus: Preferred Dividends | | | 8,416 | | | | 6,607 | | | | 25,003 | | | | 19,469 | | | | 26,474 | |
| Plus: Interest Expense, including Amortization of Financing Costs | | | 9,685 | | | | 8,975 | | | | 28,231 | | | | 27,235 | | | | 36,376 | |
| Plus: Depreciation and Amortization | | | 14,047 | | | | 12,531 | | | | 40,876 | | | | 36,958 | | | | 49,850 | |
| Plus: Net Amortization of Acquired Above and Below Market Lease Revenue | | | 26 | | | | 26 | | | | 77 | | | | 77 | | | | 103 | |
| Plus: Non-recurring Strategic Alternative & Proxy Costs | | | 8,657 | | | | -0- | | | | 10,896 | | | | -0- | | | | -0- | |
| Less/Plus: Unrealized Holding (Gains) Losses Arising During the Periods | | | (16,471 | ) | | | (19,610 | ) | | | (55,377 | ) | | | 67,100 | | | | 77,380 | |
| Less: Realized Gain on Sale of Real Estate Investment (A) | | | (3,252 | ) | | | -0- | | | | (3,252 | ) | | | -0- | | | | -0- | |
| Less: Realized Gain on Sale of Securities Transactions | | | -0- | | | | -0- | | | | (2,248 | ) | | | -0- | | | | -0- | |
| Adjusted EBITDA | | $ | 38,400 | | | $ | 35,380 | | | $ | 113,156 | | | $ | 106,139 | | | $ | 141,566 | |
| | | | | | | | | | | | | | | | | | | | | |
| Interest Expense, including Amortization of Financing Costs | | $ | 9,685 | | | $ | 8,975 | | | $ | 28,231 | | | $ | 27,235 | | | $ | 36,376 | |
| Preferred Dividends | | | 8,416 | | | | 6,607 | | | | 25,003 | | | | 19,469 | | | | 26,474 | |
| Total Fixed Charges | | $ | 18,101 | | | $ | 15,582 | | | $ | 53,234 | | | $ | 46,704 | | | $ | 62,850 | |
| | | | | | | | | | | | | | | | | | | | | |
| Interest Coverage | | | 4.0 x | | | | 3.9 x | | | | 4.0 x | | | | 3.9 x | | | | 3.9 x | |
| Fixed Charge Coverage | | | 2.1 x | | | | 2.3 x | | | | 2.1 x | | | | 2.3 x | | | | 2.3 x | |
| | | | | | | | | | | | | | | | | | | | | |
| Net Debt | | $ | 923,098 | | | $ | 872,238 | | | $ | 923,098 | | | $ | 872,238 | | | $ | 850,990 | |
| Net Debt Less Securities | | | 774,716 | | | | 753,361 | | | | 774,716 | | | | 753,361 | | | | 742,158 | |
| Total Preferred Stock | | | 549,640 | | | | 433,850 | | | | 549,640 | | | | 433,850 | | | | 471,994 | |
| Annualized Adjusted EBITDA | | | 153,600 | | | | 141,520 | | | | 150,875 | | | | 141,519 | | | | 141,566 | |
| | | | | | | | | | | | | | | | | | | | | |
| Net Debt / Adjusted EBITDA | | | 6.0 x | | | | 6.2 x | | | | 6.1 x | | | | 6.2 x | | | | 6.0 x | |
| Net Debt Less Securities / Adjusted EBITDA | | | 5.0 x | | | | 5.3 x | | | | 5.1 x | | | | 5.3 x | | | | 5.2 x | |
| Net Debt + Preferred Stock / Adjusted EBITDA | | | 9.6 x | | | | 9.2 x | | | | 9.8 x | | | | 9.2 x | | | | 9.3 x | |
| Net Debt Less Securities + Preferred Stock / Adjusted EBITDA | | | 8.6 x | | | | 8.4 x | | | | 8.8 x | | | | 8.4 x | | | | 8.6 x | |
| | (A) | Represents our portion of the net realized gain from the sale of our property that we owned a 51% interest in. |
| THIRD QUARTER FISCAL YEAR 2021 SUPPLEMENTAL information | 12 |
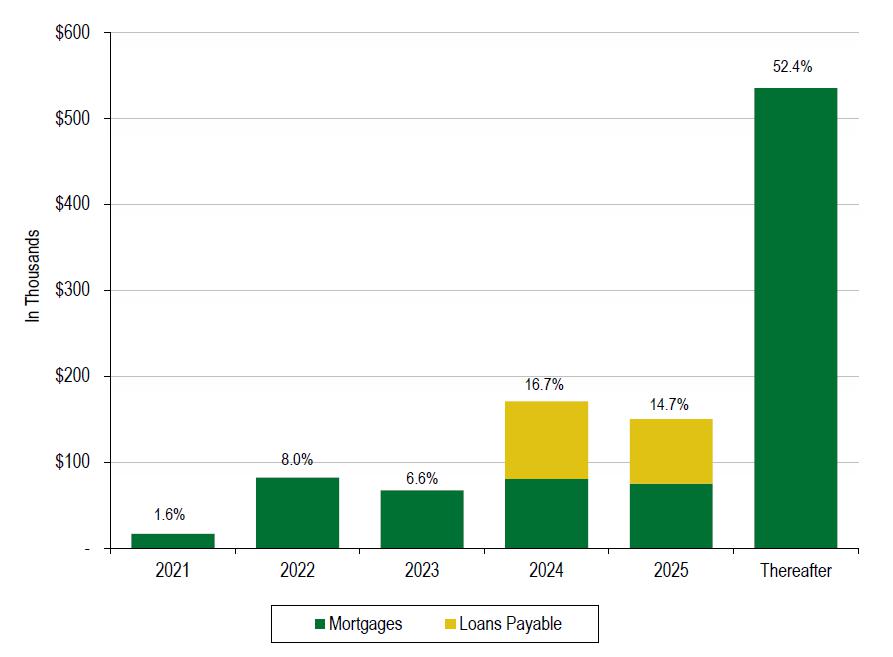
Debt Maturity
(unaudited) (In thousands)
| | | | | | Loans | | | | | | % of | |
| Fiscal Year Ended | | Mortgages | | | Payable | | | Total | | | Total | |
| | | | | | | | | | | | | |
| 2021 | | $ | 16,530 | | | | -0- | | | | 16,530 | | | | 1.6 | % |
| 2022 | | | 82,060 | | | | -0- | | | | 82,060 | | | | 8.0 | % |
| 2023 | | | 67,234 | | | | -0- | | | | 67,234 | | | | 6.6 | % |
| 2024 | | | 80,674 | | | | 90,000 | (B) | | | 170,674 | | | | 16.7 | % |
| 2025 | | | 75,069 | | | | 75,000 | (C) | | | 150,069 | | | | 14.7 | % |
| Thereafter | | | 535,108 | | | | -0- | | | | 535,108 | | | | 52.4 | % |
| Total as of 6/30/2021 | | $ | 856,675 | (A) | | $ | 165,000 | | | $ | 1,021,675 | | | | 100.0 | % |
| | | | | | | | | | | | | | | | | |
| Weighted Average Interest Rate | | | 3.86 | % | | | 2.16 | % | | | 3.59 | % | | | | |
| Weighted Average Term | | | 11.1 yrs. | | | | 3.0 yrs. | | | | 10.3 yrs. | | | | | |
| | (A) | Mortgages does not include unamortized debt issuance costs of $7.7 million. |
| | (B) | Represents a Line of Credit maturing January 2024. |
| | (C) | Represents a Term Loan maturing January 2025. |
| THIRD QUARTER FISCAL YEAR 2021 SUPPLEMENTAL information | 13 |
Property Table by Tenant
(unaudited)
| | | | Property | | | Square | | | Occupied Square | | | % of Occupied | | | Annual | | | % of Total | | | Rent Per | | | Undepreciated | | | Mortgage | |
| Tenant | | | Count | | | Footage | | | Footage | | | sf | | | Rent | | | Ann. Rent | | | sf Occup. | | | Cost | | | Balance | |
| | | | | | | | | | | | | | | | | | | | | | | | | | | | | | | | | | | | | | | |
| FedEx Ground Package System, Inc. | | | | 47 | | | | 10,072,613 | | | | 10,072,613 | | | | 41.0 | % | | $ | 80,425,000 | | | | 50.6 | % | | $ | 7.98 | | | $ | 1,147,240,676 | | | | $ | 472,570,290 | |
| FedEx Corporation | | | | 16 | | | | 1,164,813 | | | | 1,164,813 | | | | 4.8 | % | | | 7,543,000 | | | | 4.7 | % | | | 6.48 | | | | 109,308,345 | | | | | 19,559,469 | |
| Total FedEx | | | | 63 | | | | 11,237,426 | | | | 11,237,426 | | | | 45.8 | % | | | 87,968,000 | | | | 55.3 | % | | | 7.83 | | | | 1,256,549,021 | | | | | 492,129,759 | |
| | | | | | | | | | | | | | | | | | | | | | | | | | | | | | | | | | | | | | | |
| Subsidiaries of Amazon.com, Inc. | | | | 5 | | | | 1,491,245 | | | | 1,491,245 | | | | 6.1 | % | | | 10,742,000 | | | | 6.8 | % | | | 7.20 | | | | 166,563,789 | | | | | 91,341,377 | |
| Milwaukee Electric Tool Corporation | | | | 1 | | | | 861,889 | | | | 861,889 | | | | 3.5 | % | | | 3,098,000 | | | | 2.0 | % | | | 3.59 | | | | 36,914,917 | | | | | 16,588,500 | |
| Shaw Industries, Inc. | | | | 1 | | | | 831,764 | | | | 831,764 | | | | 3.4 | % | | | 3,563,000 | | | | 2.2 | % | | | 4.28 | | | | 56,025,945 | | | | | 26,792,654 | |
| Home Depot U.S.A., Inc. | | | | 2 | | | | 828,748 | | | | 828,748 | | | | 3.4 | % | | | 6,537,000 | | | | 4.1 | % | | | 7.89 | | | | 104,539,007 | | | | | 55,945,982 | |
| ULTA, Inc. | | | | 1 | | | | 671,354 | | | | 671,354 | | | | 2.7 | % | | | 2,782,000 | | | | 1.8 | % | | | 4.14 | | | | 37,773,835 | | | | | 16,233,638 | |
| Jim Beam Brands Company (Beam Suntory) | | | | 1 | | | | 599,840 | | | | 599,840 | | | | 2.4 | % | | | 2,112,000 | | | | 1.3 | % | | | 3.52 | | | | 28,000,000 | | | | | 13,769,810 | |
| International Paper Company | | | | 2 | | | | 578,491 | | | | 578,491 | | | | 2.4 | % | | | 2,663,000 | | | | 1.7 | % | | | 4.60 | | | | 37,024,608 | | | | | 16,770,698 | |
| TreeHouse Private Brands, Inc. | | | | 1 | | | | 558,509 | | | | 558,509 | | | | 2.3 | % | | | 2,267,000 | | | | 1.4 | % | | | 4.06 | | | | 26,807,852 | | | | | 13,196,520 | |
| B. Braun Medical Inc. | | | | 1 | | | | 399,440 | | | | 399,440 | | | | 1.6 | % | | | 2,330,000 | | | | 1.5 | % | | | 5.83 | | | | 30,871,732 | | | | | 16,436,710 | |
| UGN, Inc. | | | | 1 | | | | 387,000 | | | | 387,000 | | | | 1.6 | % | | | 2,107,000 | | | | 1.3 | % | | | 5.44 | | | | 21,576,756 | | | | | 11,734,063 | |
| CBOCS Distribution, Inc. (Cracker Barrel) | | | | 1 | | | | 381,240 | | | | 381,240 | | | | 1.6 | % | | | 1,490,000 | | | | 0.9 | % | | | 3.91 | | | | 14,215,126 | | | | | -0- | |
| Best Buy Warehousing Logistics, Inc. | | | | 1 | | | | 368,060 | | | | 368,060 | | | | 1.5 | % | | | 1,725,000 | | | | 1.1 | % | | | 4.69 | | | | 19,600,000 | | | | | 7,508,796 | |
| Toyota Tsusho America, Inc. | | | | 1 | | | | 350,418 | | | | 350,418 | | | | 1.4 | % | | | 1,722,000 | | | | 1.1 | % | | | 4.91 | | | | 25,078,587 | | | | | 15,454,363 | |
| Coca-Cola | | | | 2 | | | | 328,045 | | | | 328,045 | | | | 1.3 | % | | | 1,701,000 | | | | 1.1 | % | | | 5.19 | | | | 20,504,069 | | | | | 1,333,843 | |
| Autoneum North America, Inc. | | | | 1 | | | | 315,560 | | | | 315,560 | | | | 1.3 | % | | | 1,746,000 | | | | 1.1 | % | | | 5.53 | | | | 21,040,396 | | | | | 12,221,167 | |
| Science Applications International Corporation | | | | 1 | | | | 302,400 | | | | 302,400 | | | | 1.2 | % | | | 1,708,000 | | | | 1.1 | % | | | 5.65 | | | | 14,463,148 | | | | | -0- | |
| Bunzl USA Holdings, Inc. | | | | 2 | | | | 268,778 | | | | 268,778 | | | | 1.1 | % | | | 1,457,000 | | | | 0.9 | % | | | 5.42 | | | | 18,731,674 | | | | | 4,356,890 | |
| Woodstream Corporation | (A) | | | 1 | | | | 256,000 | | | | 256,000 | | | | 1.0 | % | | | 987,000 | | | | 0.6 | % | | | 3.86 | | | | 9,029,539 | | | | | -0- | |
| Anda Pharmaceuticals, Inc. | | | | 1 | | | | 234,660 | | | | 234,660 | | | | 1.0 | % | | | 1,220,000 | | | | 0.8 | % | | | 5.20 | | | | 14,550,000 | | | | | 5,736,033 | |
| Mickey Thompson Performance Tires and Wheels (Goodyear Tire & Rubber Co.) | | | | 1 | | | | 219,765 | | | | 219,765 | | | | 0.9 | % | | | 1,537,000 | | | | 1.0 | % | | | 6.99 | | | | 18,934,065 | | | | | 10,284,946 | |
| Rinnai America Corporation | | | | 1 | | | | 218,120 | | | | 218,120 | | | | 0.9 | % | | | 913,000 | | | | 0.6 | % | | | 4.19 | | | | 15,082,217 | | | | | -0- | |
| Anheuser-Busch, Inc. | | | | 1 | | | | 184,800 | | | | 184,800 | | | | 0.8 | % | | | 854,000 | | | | 0.5 | % | | | 4.62 | | | | 12,757,540 | | | | | -0- | |
| Carrier Enterprise, LLC (Carrier Global Corporation) | | | | 1 | | | | 184,317 | | | | 184,317 | | | | 0.8 | % | | | 1,160,000 | | | | 0.7 | % | | | 6.29 | | | | 18,494,917 | | | | | 4,025,447 | |
| Carlstar Group, LLC | | | | 1 | | | | 179,280 | | | | 179,280 | | | | 0.7 | % | | | 771,000 | | | | 0.5 | % | | | 4.30 | | | | 7,282,986 | | | | | -0- | |
| NF&M International, Inc. | (B) | | | 1 | | | | 174,802 | | | | 174,802 | | | | 0.7 | % | | | 795,000 | | | | 0.5 | % | | | 4.55 | | | | 5,445,065 | | | | | -0- | |
| Magna Seating of America, Inc. | | | | 1 | | | | 152,995 | | | | 152,995 | | | | 0.6 | % | | | 1,201,000 | | | | 0.8 | % | | | 7.85 | | | | 17,557,830 | | | | | 8,511,498 | |
| Victory Packaging, L.P. | | | | 1 | | | | 148,000 | | | | 148,000 | | | | 0.6 | % | | | 504,000 | | | | 0.3 | % | | | 3.41 | | | | 5,458,279 | | | | | -0- | |
| Challenger Lifts, Inc. (Snap-On Inc.) | | | | 1 | | | | 137,500 | | | | 137,500 | | | | 0.6 | % | | | 858,000 | | | | 0.5 | % | | | 6.24 | | | | 11,304,000 | | | | | 5,377,343 | |
| Altec Industries, Inc. | (A) | | | 1 | | | | 126,880 | | | | 126,880 | | | | 0.5 | % | | | 378,000 | | | | 0.2 | % | | | 2.98 | | | | 4,475,266 | | | | | -0- | |
| General Electric Company | | | | 1 | | | | 125,860 | | | | 125,860 | | | | 0.5 | % | | | 1,329,000 | | | | 0.8 | % | | | 10.56 | | | | 19,972,983 | | | | | 8,949,697 | |
| Keurig Dr Pepper | | | | 2 | | | | 110,080 | | | | 110,080 | | | | 0.4 | % | | | 757,000 | | | | 0.5 | % | | | 6.88 | | | | 10,498,031 | | | | | 1,303,703 | |
| Style Crest, Inc. | | | | 1 | | | | 106,507 | | | | 106,507 | | | | 0.4 | % | | | 433,000 | | | | 0.3 | % | | | 4.07 | | | | 7,421,032 | | | | | -0- | |
| Sonwil Distribution Center, Inc. | | | | 1 | | | | 104,981 | | | | 104,981 | | | | 0.4 | % | | | 630,000 | | | | 0.4 | % | | | 6.00 | | | | 10,960,823 | | | | | -0- | |
| Pittsburgh Glass Works, LLC, a Division of VITRO | | | | 1 | | | | 102,135 | | | | 102,135 | | | | 0.4 | % | | | 508,000 | | | | 0.3 | % | | | 4.97 | | | | 4,249,615 | | | | | -0- | |
| Dakota Bodies, LLC | | | | 1 | | | | 96,687 | | | | 96,687 | | | | 0.4 | % | | | 416,000 | | | | 0.3 | % | | | 4.30 | | | | 7,797,827 | | | | | -0- | |
| National Oilwell Varco, Inc. | | | | 1 | | | | 91,295 | | | | 91,295 | | | | 0.4 | % | | | 801,000 | | | | 0.5 | % | | | 8.77 | | | | 8,190,901 | | | | | 671,412 | |
| Joseph T. Ryerson and Son, Inc. | | | | 1 | | | | 89,123 | | | | 89,123 | | | | 0.4 | % | | | 519,000 | | | | 0.3 | % | | | 5.82 | | | | 7,184,598 | | | | | -0- | |
| CHEP USA, Inc. | | | | 1 | | | | 83,000 | | | | 83,000 | | | | 0.3 | % | | | 509,000 | | | | 0.3 | % | | | 6.13 | | | | 7,463,672 | | | | | -0- | |
| Sherwin-Williams Company | | | | 2 | | | | 78,887 | | | | 78,887 | | | | 0.3 | % | | | 648,000 | | | | 0.4 | % | | | 8.21 | | | | 7,427,594 | | | | | -0- | |
| United Parcel Service, Inc. | | | | 1 | | | | 75,000 | | | | 75,000 | | | | 0.3 | % | | | 595,000 | | | | 0.4 | % | | | 7.93 | | | | 6,741,021 | | | | | -0- | |
| Tampa Bay Grand Prix | | | | 1 | | | | 68,385 | | | | 68,385 | | | | 0.3 | % | | | 369,000 | | | | 0.2 | % | | | 5.40 | | | | 5,677,982 | | | | | -0- | |
| Various Tenants at Retail Shopping Center | | | | 1 | | | | 64,220 | | | | 61,190 | | | | 0.3 | % | | | 616,000 | | | | 0.4 | % | | | 10.07 | | | | 3,139,564 | | | | | -0- | |
| Locke Supply Co. | | | | 1 | | | | 60,000 | | | | 60,000 | | | | 0.2 | % | | | 340,000 | | | | 0.2 | % | | | 5.67 | | | | 5,097,101 | | | | | -0- | |
| Hartford Healthcare Corporation | | | | 1 | | | | 54,812 | | | | 54,812 | | | | 0.2 | % | | | 307,000 | | | | 0.2 | % | | | 5.60 | | | | 3,525,917 | | | | | -0- | |
| Siemens Real Estate | | | | 1 | | | | 51,130 | | | | 51,130 | | | | 0.2 | % | | | 464,000 | | | | 0.3 | % | | | 9.07 | | | | 4,554,684 | | | | | -0- | |
| Collins Aerospace (Raytheon Technologies Corporation) | | | | 1 | | | | 38,833 | | | | 38,833 | | | | 0.2 | % | | | 368,000 | | | | 0.2 | % | | | 9.48 | | | | 5,100,000 | | | | | -0- | |
| Foundation Building Materials, LLC | | | | 1 | | | | 36,270 | | | | 36,270 | | | | 0.2 | % | | | 179,000 | | | | 0.2 | % | | | 4.94 | | | | 2,543,770 | | | | | -0- | |
| Graybar Electric Company | | | | 1 | | | | 26,340 | | | | 26,340 | | | | 0.2 | % | | | 122,000 | | | | 0.1 | % | | | 4.63 | | | | 2,901,362 | | | | | -0- | |
| Vacant | (B) | | | 1 | | | | 80,856 | | | | -0- | | | | 0.0 | % | | | -0- | | | | 0.0 | % | | | -0- | | | | 2,518,657 | | | | | -0- | |
| Total as of 6/30/21 | | | | 120 | | | | 24,521,727 | | | | 24,437,841 | | | | 99.7 | % | | $ | 158,806,000 | | | | 100.0 | % | | $ | 6.50 | | | $ | 2,209,619,300 | | (C) | | $ | 856,674,849 | |
| | | | | | | | | | | | | | | | | | | | | | | | | | | | | | | | | | | | | | | |
| Acquisitions Subsequent to 6/30/21 | | | | | | | | | | | | | | | | | | | | | | | | | | | | | | | | | | | | | | |
| FedEx Ground Package System, Inc. | | | | 1 | | | | 143,794 | | | | 143,794 | | | | 0.6 | % | | | 3,233,000 | | | | 1.9 | % | | | 22.48 | | | | | | | | | | |
| Pro Forma Total with Acquisitions Subsequent to 6/30/21 | | | | 121 | | | | 24,665,521 | | | | 24,581,635 | | | | 99.7 | % | | $ | 162,039,000 | | | | 100.0 | % | | $ | 6.59 | | | | | | | | | | |
| | (A) | Woodstream Corporation and Altec Industries, Inc. are located at one property and, therefore, are counted as one property in the Property Count Total. |
| | (B) | NF&M International is located in a 255,658 square foot industrial park in Monaca (Pittsburgh), PA, of which 80,856 square feet are vacant. This industrial park is counted as one property in the Property Count Total. |
| | | Other than two properties indicated in footnotes (A) and (B) and one retail property, all properties are single-tenant. |
| | (C) | Does not include unamortized debt issuance costs of $7,681,337. |
| THIRD QUARTER FISCAL YEAR 2021 SUPPLEMENTAL information | 14 |
Property Table by State
(unaudited)
| | | Property | | | Square | | | Occupied Square | | | % of Total | | | Annual | | | % of Total | | | Rent Per | | | Undepreciated | | | Mortgage | |
| State | | Count | | | Footage | | | Footage | | | sf | | | Rent | | | Ann. Rent | | | sf Occup. | | | Cost | | | Balance | |
| Ohio | | | 11 | | | | 2,358,769 | | | | 2,358,769 | | | | 9.6 | % | | $ | 15,863,000 | | | | 10.0 | % | | $ | 6.73 | | | $ | 209,060,892 | | | $ | 93,753,230 | |
| Georgia | | | 7 | | | | 2,297,214 | | | | 2,297,214 | | | | 9.4 | % | | | 16,134,000 | | | | 10.2 | % | | | 7.02 | | | | 259,469,156 | | | | 132,329,894 | |
| Florida | | | 13 | | | | 2,223,042 | | | | 2,223,042 | | | | 9.1 | % | | | 16,002,000 | | | | 10.1 | % | | | 7.20 | | | | 228,907,551 | | | | 79,618,189 | |
| Indiana | | | 4 | | | | 1,965,341 | | | | 1,965,341 | | | | 8.0 | % | | | 11,212,000 | | | | 7.1 | % | | | 5.70 | | | | 167,720,415 | | | | 88,647,033 | |
| Texas | | | 10 | | | | 1,790,337 | | | | 1,790,337 | | | | 7.3 | % | | | 13,844,000 | | | | 8.7 | % | | | 7.73 | | | | 183,394,825 | | | | 61,359,821 | |
| Kentucky | | | 3 | | | | 1,295,849 | | | | 1,295,849 | | | | 5.3 | % | | | 5,237,000 | | | | 3.3 | % | | | 4.04 | | | | 66,111,852 | | | | 32,343,673 | |
| South Carolina | | | 6 | | | | 1,273,676 | | | | 1,273,676 | | | | 5.2 | % | | | 9,882,000 | | | | 6.2 | % | | | 7.76 | | | | 129,988,641 | | | | 49,445,388 | |
| North Carolina | | | 5 | | | | 1,225,987 | | | | 1,225,987 | | | | 5.0 | % | | | 8,713,000 | | | | 5.5 | % | | | 7.11 | | | | 132,687,021 | | | | 64,164,667 | |
| Mississippi | | | 4 | | | | 1,158,889 | | | | 1,158,889 | | | | 4.7 | % | | | 4,560,000 | | | | 2.9 | % | | | 3.93 | | | | 56,266,970 | | | | 22,324,533 | |
| Illinois | | | 9 | | | | 958,102 | | | | 958,102 | | | | 3.9 | % | | | 6,254,000 | | | | 3.9 | % | | | 6.53 | | | | 83,672,112 | | | | 6,827,092 | |
| Tennessee | | | 3 | | | | 891,777 | | | | 891,777 | | | | 3.6 | % | | | 3,203,000 | | | | 2.0 | % | | | 3.59 | | | | 35,677,250 | | | | 2,603,021 | |
| Michigan | | | 4 | | | | 833,717 | | | | 833,717 | | | | 3.4 | % | | | 5,629,000 | | | | 3.5 | % | | | 6.75 | | | | 73,561,442 | | | | 20,775,968 | |
| Kansas | | | 4 | | | | 813,062 | | | | 813,062 | | | | 3.3 | % | | | 4,998,000 | | | | 3.1 | % | | | 6.15 | | | | 63,645,556 | | | | 23,557,610 | |
| Missouri | | | 4 | | | | 740,119 | | | | 740,119 | | | | 3.0 | % | | | 3,003,000 | | | | 1.9 | % | | | 4.06 | | | | 35,555,482 | | | | -0- | |
| Oklahoma | | | 5 | | | | 735,721 | | | | 735,721 | | | | 3.0 | % | | | 4,943,000 | | | | 3.1 | % | | | 6.72 | | | | 69,942,758 | | | | 33,698,320 | |
| New York | | | 3 | | | | 518,565 | | | | 518,565 | | | | 2.1 | % | | | 3,554,000 | | | | 2.2 | % | | | 6.85 | | | | 52,841,861 | | | | 17,756,206 | |
| Pennsylvania | | | 3 | | | | 504,040 | | | | 423,184 | | | | 2.1 | % | | | 2,775,000 | | | | 1.7 | % | | | 6.56 | | | | 36,959,671 | | | | 11,047,899 | |
| Alabama | | | 2 | | | | 451,832 | | | | 451,832 | | | | 1.8 | % | | | 2,670,000 | | | | 1.7 | % | | | 5.91 | | | | 39,714,135 | | | | 15,893,528 | |
| New Jersey | | | 2 | | | | 411,365 | | | | 408,335 | | | | 1.7 | % | | | 5,944,000 | | | | 3.7 | % | | | 14.56 | | | | 87,127,186 | | | | 47,779,049 | |
| Virginia | | | 5 | | | | 407,443 | | | | 407,443 | | | | 1.7 | % | | | 2,474,000 | | | | 1.6 | % | | | 6.07 | | | | 35,059,207 | | | | 3,000,099 | |
| Colorado | | | 2 | | | | 295,227 | | | | 295,227 | | | | 1.2 | % | | | 2,441,000 | | | | 1.5 | % | | | 8.27 | | | | 35,694,134 | | | | 13,748,383 | |
| Arizona | | | 1 | | | | 288,045 | | | | 288,045 | | | | 1.2 | % | | | 1,409,000 | | | | 0.9 | % | | | 4.89 | | | | 16,824,226 | | | | 1,333,843 | |
| Wisconsin | | | 2 | | | | 238,666 | | | | 238,666 | | | | 1.0 | % | | | 1,295,000 | | | | 0.8 | % | | | 5.43 | | | | 16,377,221 | | | | 1,702,945 | |
| Washington | | | 1 | | | | 210,445 | | | | 210,445 | | | | 0.9 | % | | | 1,962,000 | | | | 1.2 | % | | | 9.32 | | | | 30,369,301 | | | | 14,569,993 | |
| Louisiana | | | 1 | | | | 175,315 | | | | 175,315 | | | | 0.7 | % | | | 1,274,000 | | | | 0.8 | % | | | 7.27 | | | | 18,425,875 | | | | 9,111,843 | |
| Maryland | | | 1 | | | | 148,881 | | | | 148,881 | | | | 0.6 | % | | | 1,455,000 | | | | 0.9 | % | | | 9.77 | | | | 14,632,389 | | | | -0- | |
| Nebraska | | | 1 | | | | 89,115 | | | | 89,115 | | | | 0.4 | % | | | 446,000 | | | | 0.3 | % | | | 5.00 | | | | 5,963,626 | | | | -0- | |
| Utah | | | 1 | | | | 69,734 | | | | 69,734 | | | | 0.3 | % | | | 772,000 | | | | 0.5 | % | | | 11.07 | | | | 12,666,994 | | | | 7,917,933 | |
| Minnesota | | | 1 | | | | 60,370 | | | | 60,370 | | | | 0.2 | % | | | 372,000 | | | | 0.4 | % | | | 6.16 | | | | 5,231,864 | | | | 1,364,689 | |
| Connecticut | | | 1 | | | | 54,812 | | | | 54,812 | | | | 0.2 | % | | | 307,000 | | | | 0.2 | % | | | 5.60 | | | | 3,525,917 | | | | -0- | |
| Iowa | | | 1 | | | | 36,270 | | | | 36,270 | | | | 0.1 | % | | | 179,000 | | | | 0.1 | % | | | 4.94 | | | | 2,543,770 | | | | -0- | |
| Total as of 6/30/21 | | | 120 | | | | 24,521,727 | | | | 24,437,841 | | | | 100.0 | % | | $ | 158,806,000 | | | | 100.0 | % | | $ | 6.50 | | | $ | 2,209,619,300 | | (A) | | $856,674,849 | |
| | | | | | | | | | | | | | | | | | | | | | | | | | | | | | | | | | | | | |
| Acquisitions Subsequent to 6/30/21 | | | | | | | | | | | | | | | | | | | | | | | | | | | | | | | | | | | | |
| Vermont | | | 1 | | | | 143,794 | | | | 143,794 | | | | 0.6 | % | | | 3,233,000 | | | | 1.9 | % | | | 22.48 | | | | | | | | | |
| Pro Forma Total with Acquisitions Subsequent to 6/30/21 | | | 121 | | | | 24,665,521 | | | | 24,581,635 | | | | 100.0 | % | | $ | 162,039,000 | | | | 100.0 | % | | $ | 6.59 | | | | | | | | | |
| | (A) | Does not include unamortized debt issuance costs of $7,681,337. |
| THIRD QUARTER FISCAL YEAR 2021 SUPPLEMENTAL information | 15 |
Lease Expirations
(unaudited)
| | | | | Property | | | Square | | | % of Total | | | Annual | | | % of Total | | | Rent Per sf | | | Lease Exp. Term in | | | Undepreciated | | | Mortgage | |
| Fiscal Year | | | | Count | | | Footage | | | Sf | | | Rent | | | Ann. Rent | | | Occup. | | | Years | | | Cost | | | Balance | |
| | | | | | | | | | | | | | | | | | | | | | | | | | | | | | |
| 2022 | | | | | 5 | | | | 1,065,169 | | | | 4.3 | % | | $ | 5,623,000 | | | | 3.5 | % | | $ | 5.28 | | | | 0.7 | | | $ | 71,756,260 | | | $ | 17,691,620 | |
| 2023(A) | | | | | 16 | | | | 2,117,731 | | | | 8.6 | % | | | 12,076,000 | | | | 7.6 | % | | | 5.70 | | | | 1.9 | | | | 149,258,939 | | | | 15,178,067 | |
| 2024 | | | | | 13 | | | | 1,887,039 | | | | 7.7 | % | | | 11,797,000 | | | | 7.4 | % | | | 6.25 | | | | 2.9 | | | | 137,674,811 | | | | 20,296,714 | |
| 2025(A) | | | | | 11 | | | | 2,607,541 | | | | 10.6 | % | | | 12,980,000 | | | | 8.2 | % | | | 4.98 | | | | 3.9 | | | | 170,882,575 | | | | 58,907,497 | |
| 2026(A) | | | | | 14 | | | | 1,738,731 | | | | 7.1 | % | | | 10,850,000 | | | | 6.8 | % | | | 6.24 | | | | 5.0 | | | | 137,382,883 | | | | 19,125,726 | |
| 2027 | | | | | 13 | | | | 2,390,188 | | | | 9.7 | % | | | 13,297,000 | | | | 8.4 | % | | | 5.56 | | | | 6.1 | | | | 187,747,728 | | | | 59,254,441 | |
| 2028 | | | | | 10 | | | | 2,172,458 | | | | 8.9 | % | | | 11,857,000 | | | | 7.5 | % | | | 5.46 | | | | 6.8 | | | | 153,000,879 | | | | 40,945,705 | |
| 2029 | | | | | 9 | | | | 1,831,303 | | | | 7.5 | % | | | 10,610,000 | | | | 6.7 | % | | | 5.79 | | | | 7.8 | | | | 147,994,178 | | | | 56,771,370 | |
| 2030 | | | | | 5 | | | | 1,102,002 | | | | 4.5 | % | | | 8,490,000 | | | | 5.3 | % | | | 7.70 | | | | 8.8 | | | | 129,463,623 | | | | 62,140,891 | |
| 2031 | | | | | 6 | | | | 1,218,941 | | | | 5.0 | % | | | 9,738,000 | | | | 6.1 | % | | | 7.99 | | | | 9.4 | | | | 137,855,742 | | | | 62,886,564 | |
| 2032 | | | | | 8 | | | | 2,131,983 | | | | 8.7 | % | | | 18,862,000 | | | | 11.9 | % | | | 8.85 | | | | 10.8 | | | | 291,154,266 | | | | 154,426,474 | |
| 2033 | | | | | 3 | | | | 1,038,508 | | | | 4.2 | % | | | 8,844,000 | | | | 5.6 | % | | | 8.52 | | | | 11.8 | | | | 137,685,523 | | | | 76,288,699 | |
| 2034 | | | | | 3 | | | | 1,561,256 | | | | 6.4 | % | | | 9,365,000 | | | | 5.9 | % | | | 6.00 | | | | 12.8 | | | | 127,748,518 | | | | 74,253,759 | |
| 2035 | | | | | 3 | | | | 856,283 | | | | 3.5 | % | | | 8,343,000 | | | | 5.3 | % | | | 9.74 | | | | 14.1 | | | | 131,119,464 | | | | 82,561,340 | |
| 2041 | | | | | 1 | | | | 657,518 | | | | 2.7 | % | | | 5,458,000 | | | | 3.4 | % | | | 8.30 | | | | 19.4 | | | | 93,235,690 | | | | 55,945,982 | |
| Various tenants at retail shopping center | | | | | 1 | | | | 64,220 | | | | 0.3 | % | | | 616,000 | | | | 0.4 | % | | | 10.07 | | | | -0- | | | | 3,139,564 | | | | -0- | |
| Vacant | | (A) | | | 1 | | | | 80,856 | | | | 0.3 | % | | | -0- | | | | 0.0 | % | | | -0- | | | | -0- | | | | 2,518,657 | | | | -0- | |
| Total as of 6/30/21 | | | | | 120 | | | | 24,521,727 | | | | 100.0 | % | | $ | 158,806,000 | | | | 100.0 | % | | $ | 6.50 | | | | 7.2 | | | $ | 2,209,619,300 | | (B) | | $856,674,849 | |
| | | | | | | | | | | | | | | | | | | | | | | | | | | | | | | | | | | | | | | |
| Acquisitions Subsequent to 6/30/21 | | | | | | | | | | | | | | | | | | | | | | | | | | | | | | | | | | | | | | |
| 2036 | | | | | 1 | | | | 143,794 | | | | 0.6 | % | | | 3,233,000 | | | | 1.9 | % | | | 22.48 | | | | 14.9 | | | | | | | | | |
| Pro Forma Total with Acquisitions Subsequent to 6/30/21 | | | | | 121 | | | | 24,665,521 | | | | 100.0 | % | | $ | 162,039,000 | | | | 100.0 | % | | $ | 6.59 | | | | 7.2 | | | | | | | | | |
| | (A) | Included in 2023 is Altec Industries and included in 2026 is Woodstream Corporation, which both occupy one property. Included in 2025 is NF&M International, which occupies 174,802 square feet of a 255,658 square foot Industrial Park. The remaining 80,856 square feet are included in Vacant. Each of these properties are counted as one property in the Property Count Total. Other than these properties and one retail property, all properties are single-tenant. |
| | (B) | Does not include unamortized debt issuance costs of $7,681,337. |
| THIRD QUARTER FISCAL YEAR 2021 SUPPLEMENTAL information | 16 |
Recent Acquisitions During Fiscal 2021
(unaudited)
| | | | | | | | | Date of | | Square | | | Annual | | | Rent Per | | | Lease | | Purchase | | | Initial Mortgage | |
| No | | Tenant | | City (MSA) | | State | | Acquisition | | Footage | | | Rent | | | sf Occup. | | | Expiration | | Price | | | Balance | |
| 1 | | FedEx Ground Package System, Inc. | | Plain City (Columbus) | | OH | | 12/17/2020 | | | 500,268 | | | $ | 4,569,000 | | | $ | 9.13 | | | 9/30/2035 | | $ | 73,304,000 | | | $ | 47,000,000 | |
| 2 | | Home Depot U.S.A., Inc. | | Locust Grove (Atlanta) | | GA | | 12/24/2020 | | | 657,518 | | | | 5,458,000 | | | | 8.30 | | | 11/30/2040 | | | 95,935,000 | | | | 57,000,000 | |
| | | As of 6/30/21 | | | | | | | | | 1,157,786 | | | $ | 10,027,000 | | | $ | 8.66 | | | | | $ | 169,239,000 | | | $ | 104,000,000 | |
| | | | | | | | | | | | | | | | | | | | | | | | | | | | | | | |
| | | Acquisitions Subsequent to 6/30/21 | | | | | | | | | | | | | | | | | | | | | | | | | | | | |
| 3 | | FedEx Ground Package System, Inc. | | Burlington | | VT | | 07/29/2021 | | | 143,794 | | | $ | 3,233,000 | | | | 22.48 | | | 8/31/2034 | | $ | 54,789,000 | | | | -0- | |
| | | Pro Forma Total with Acquisitions Subsequent to 6/30/21 | | | | | | | | | 1,301,580 | | | $ | 13,260,000 | | | $ | 10.19 | | | | | $ | 224,028,000 | | | $ | 104,000,000 | |
| THIRD QUARTER FISCAL YEAR 2021 SUPPLEMENTAL information | 17 |
Property Table
(unaudited)
| | | | | | | | | | | | | | | | | | | Rent | | | Lease Exp. | | | | | | | |
| | | | | | | | | Fiscal Year | | | | | | Square | | | Annual | | | Per sf | | | Term in | | | Undepreciated | | | Mortgage | |
| No | | Tenant | | City (MSA) | | State | | Acquisition | | | Occup. | | | Footage | | | Rent | | | Occup. | | | Years | | | Cost | | | Balance | |
| 1 | | Milwaukee Electric Tool Corporation | | Olive Branch (Memphis, TN) | | MS | | | 2013 | | | | 100.0 | % | | | 861,889 | | | $ | 3,098,000 | | | $ | 3.59 | | | | 7.1 | | | $ | 36,914,917 | | | $ | 16,588,500 | |
| .2 | | Shaw Industries, Inc. | | Savannah | | GA | | | 2018 | | | | 100.0 | % | | | 831,764 | | | | 3,563,000 | | | | 4.28 | | | | 6.3 | | | | 56,025,945 | | | | 26,792,654 | |
| 3 | | ULTA, Inc. | | Greenwood (Indianapolis) | | IN | | | 2015 | | | | 100.0 | % | | | 671,354 | | | | 2,782,000 | | | | 4.14 | | | | 4.1 | | | | 37,773,835 | | | | 16,233,638 | |
| 4 | | Home Depot U.S.A., Inc. | | Locust Grove (Atlanta) | | GA | | | 2021 | | | | 100.0 | % | | | 657,518 | | | | 5,458,000 | | | | 8.30 | | | | 19.4 | | | | 93,235,690 | | | | 55,945,982 | |
| 5 | | Amazon.com.indc, LLC | | Greenwood (Indianapolis) | | IN | | | 2020 | | | | 100.0 | % | | | 615,747 | | | | 4,991,000 | | | | 8.11 | | | | 13.2 | | | | 79,363,910 | | | | 49,323,176 | |
| 6 | | Jim Beam Brands Company (Beam Suntory) | | Frankfort (Lexington) | | KY | | | 2015 | | | | 100.0 | % | | | 599,840 | | | | 2,112,000 | | | | 3.52 | | | | 3.6 | | | | 28,000,000 | | | | 13,769,810 | |
| 7 | | TreeHouse Private Brands, Inc. | | Buckner (Louisville) | | KY | | | 2014 | | | | 100.0 | % | | | 558,509 | | | | 2,267,000 | | | | 4.06 | | | | 12.3 | | | | 26,807,852 | | | | 13,196,520 | |
| 8 | | FedEx Ground Package System, Inc. | | Plain City (Columbus) | | OH | | | 2021 | | | | 100.0 | % | | | 500,268 | | | | 4,569,000 | | | | 9.13 | | | | 14.3 | | | | 71,741,593 | | | | 45,955,361 | |
| 9 | | FedEx Forward Depots, Inc. | | Memphis | | TN | | | 2010 | | | | 100.0 | % | | | 449,900 | | | | 1,394,000 | | | | 3.10 | | | | 7.9 | | | | 16,092,852 | | | | 2,603,021 | |
| 10 | | B. Braun Medical Inc. | | Daytona Beach | | FL | | | 2018 | | | | 100.0 | % | | | 399,440 | | | | 2,330,000 | | | | 5.83 | | | | 11.7 | | | | 30,871,732 | | | | 16,436,710 | |
| 11 | | UGN, Inc. | | Monroe (Cincinnati) | | OH | | | 2015 | | | | 100.0 | % | | | 387,000 | | | | 2,107,000 | | | | 5.44 | | | | 12.7 | | | | 21,576,756 | | | | 11,734,063 | |
| 12 | | Woodstream Corporation | | St. Joseph | | MO | | | 2001 | | | | 100.0 | % | | | 256,000 | | | | 987,000 | | | | 3.86 | | | | 5.3 | | | | 9,029,539 | | | | -0- | |
| | | Altec Industries, Inc. | | St. Joseph | | MO | | | 2001 | | | | 100.0 | % | | | 126,880 | | | | 378,000 | | | | 2.98 | | | | 1.7 | | | | 4,475,266 | | | | -0- | |
| 13 | | CBOCS Distribution, Inc. (Cracker Barrel) | | Lebanon (Nashville) | | TN | | | 2011 | | | | 100.0 | % | | | 381,240 | | | | 1,490,000 | | | | 3.91 | | | | 3.0 | | | | 14,215,126 | | | | -0- | |
| 14 | | FedEx Ground Package System, Inc. | | Braselton (Atlanta) | | GA | | | 2018 | | | | 100.0 | % | | | 373,750 | | | | 3,801,000 | | | | 10.17 | | | | 11.7 | | | | 60,237,411 | | | | 34,269,304 | |
| 15 | | Best Buy Warehousing Logistics, Inc. | | Streetsboro (Cleveland) | | OH | | | 2012 | | | | 100.0 | % | | | 368,060 | | | | 1,725,000 | | | | 4.69 | | | | 0.6 | | | | 19,600,000 | | | | 7,508,796 | |
| 16 | | Amazon.com Services, Inc. (Amazon.com, Inc.) | | Mobile | | AL | | | 2018 | | | | 100.0 | % | | | 362,942 | | | | 2,065,000 | | | | 5.69 | | | | 7.4 | | | | 33,052,316 | | | | 15,893,528 | |
| 17 | | FedEx Ground Package System, Inc. | | Concord (Charlotte) | | NC | | | 2017 | | | | 100.0 | % | | | 354,482 | | | | 2,537,000 | | | | 7.16 | | | | 10.9 | | | | 40,043,145 | | | | 20,962,281 | |
| 18 | | FedEx Ground Package System, Inc. | | Mesquite (Dallas) | | TX | | | 2017 | | | | 100.0 | % | | | 351,874 | | | | 3,209,000 | | | | 9.12 | | | | 10.8 | | | | 49,880,493 | | | | 25,939,833 | |
| 19 | | Toyota Tsusho America, Inc. | | Lafayette | | IN | | | 2019 | | | | 100.0 | % | | | 350,418 | | | | 1,722,000 | | | | 4.91 | | | | 8.0 | | | | 25,078,587 | | | | 15,454,363 | |
| 20 | | FedEx Ground Package System, Inc. | | Trenton | | NJ | | | 2019 | | | | 100.0 | % | | | 347,145 | | | | 5,328,000 | | | | 15.35 | | | | 11.0 | | | | 83,987,622 | | | | 47,779,049 | |
| 21 | | FedEx Ground Package System, Inc. | | Walker (Grand Rapids) | | MI | | | 2017 | | | | 100.0 | % | | | 343,483 | | | | 2,106,000 | | | | 6.13 | | | | 10.6 | | | | 31,654,987 | | | | 16,329,177 | |
| 22 | | FedEx Ground Package System, Inc. | | Hamburg (Buffalo) | | NY | | | 2017 | | | | 100.0 | % | | | 338,584 | | | | 2,329,000 | | | | 6.88 | | | | 9.8 | | | | 35,140,017 | | | | 17,756,206 | |
| 23 | | FedEx Ground Package System, Inc. | | Concord (Charlotte) | | NC | | | 2016 | | | | 100.0 | % | | | 330,717 | | | | 2,237,000 | | | | 6.76 | | | | 4.1 | | | | 33,053,688 | | | | 14,514,340 | |
| 24 | | FedEx Ground Package System, Inc. | | Indianapolis | | IN | | | 2014 | | | | 100.0 | % | | | 327,822 | | | | 1,717,000 | | | | 5.24 | | | | 6.3 | | | | 25,504,083 | | | | 7,635,856 | |
| 25 | | Autoneum North America, Inc. | | Aiken (Augusta, GA) | | SC | | | 2017 | | | | 100.0 | % | | | 315,560 | | | | 1,746,000 | | | | 5.53 | | | | 10.8 | | | | 21,040,396 | | | | 12,221,167 | |
| 26 | | FedEx Ground Package System, Inc. | | Olathe (Kansas City) | | KS | | | 2016 | | | | 100.0 | % | | | 313,763 | | | | 2,553,000 | | | | 8.14 | | | | 9.9 | | | | 34,388,619 | | | | 16,545,478 | |
| 27 | | FedEx Ground Package System, Inc. | | Ft. Worth (Dallas) | | TX | | | 2015 | | | | 100.0 | % | | | 312,923 | | | | 2,394,000 | | | | 7.65 | | | | 8.8 | | | | 35,648,449 | | | | 16,747,643 | |
| 28 | | FedEx Ground Package System, Inc. | | Davenport (Orlando) | | FL | | | 2016 | | | | 100.0 | % | | | 310,922 | | | | 2,625,000 | | | | 8.44 | | | | 9.8 | | | | 38,087,185 | | | | 19,635,183 | |
| 29 | | FedEx Ground Package System, Inc. | | Jacksonville | | FL | | | 2015 | | | | 100.0 | % | | | 304,859 | | | | 1,998,000 | | | | 6.55 | | | | 8.5 | | | | 30,925,530 | | | | 12,908,433 | |
| 30 | | Science Applications International Corporation | | Hanahan (Charleston) | | SC | | | 2005 | | | | 100.0 | % | | | 302,400 | | | | 1,708,000 | | | | 5.65 | | | | 2.3 | | | | 14,463,148 | | | | -0- | |
| 31 | | Amazon.com Services, Inc. (Amazon.com, Inc.) | | Oklahoma City | | OK | | | 2018 | | | | 100.0 | % | | | 300,000 | | | | 1,948,000 | | | | 6.49 | | | | 6.3 | | | | 29,878,942 | | | | 16,721,349 | |
| 32 | | International Paper Company | | Kenton | | OH | | | 2017 | | | | 100.0 | % | | | 298,472 | | | | 1,281,000 | | | | 4.29 | | | | 6.2 | | | | 18,730,500 | | | | 9,758,566 | |
| 33 | | Western Container Corp. (Coca-Cola) | | Tolleson (Phoenix) | | AZ | | | 2003 | | | | 100.0 | % | | | 288,045 | | | | 1,409,000 | | | | 4.89 | | | | 5.8 | | | | 16,824,226 | | | | 1,333,843 | |
| 34 | | FedEx Ground Package System, Inc. | | Greensboro | | NC | | | 2020 | | | | 100.0 | % | | | 286,281 | | | | 3,002,000 | | | | 10.49 | | | | 13.8 | | | | 46,710,877 | | | | 28,688,046 | |
| 35 | | International Paper Company | | Edwardsville (Kansas City) | | KS | | | 2014 | | | | 100.0 | % | | | 280,019 | | | | 1,382,000 | | | | 4.94 | | | | 2.2 | | | | 18,294,108 | | | | 7,012,132 | |
| 36 | | FedEx Ground Package System, Inc. | | Charleston | | SC | | | 2018 | | | | 100.0 | % | | | 265,318 | | | | 2,713,000 | | | | 10.23 | | | | 12.0 | | | | 46,576,380 | | | | 25,582,685 | |
| 37 | | NF&M International, Inc. | | Monaca (Pittsburgh) | | PA | | | 1977 | | | | 68.4 | % | | | 255,658 | | | | 795,000 | | | | 4.55 | | | | 3.8 | | | | 7,963,722 | | | | -0- | |
| 38 | | FedEx Ground Package System, Inc. | | Orion | | MI | | | 2007 | | | | 100.0 | % | | | 245,633 | | | | 1,908,000 | | | | 7.77 | | | | 2.0 | | | | 23,069,307 | | | | -0- | |
| 39 | | FedEx Ground Package System, Inc. | | Homestead (Miami) | | FL | | | 2017 | | | | 100.0 | % | | | 237,756 | | | | 2,282,000 | | | | 9.60 | | | | 10.8 | | | | 37,911,556 | | | | 19,553,431 | |
| 40 | | Anda Pharmaceuticals, Inc. | | Olive Branch (Memphis, TN) | | MS | | | 2012 | | | | 100.0 | % | | | 234,660 | | | | 1,220,000 | | | | 5.20 | | | | 1.1 | | | | 14,550,000 | | | | 5,736,033 | |
| 41 | | FedEx Ground Package System, Inc. | | Colorado Springs | | CO | | | 2016 | | | | 100.0 | % | | | 225,362 | | | | 1,832,000 | | | | 8.13 | | | | 4.6 | | | | 29,320,066 | | | | 13,748,383 | |
| 42 | | Mickey Thompson Performance Tires and Wheels (Goodyear Tire & Rubber Company) | | Stow | | OH | | | 2017 | | | | 100.0 | % | | | 219,765 | | | | 1,537,000 | | | | 6.99 | | | | 6.2 | | | | 18,934,065 | | | | 10,284,946 | |
| 43 | | Rinnai America Corporation | | Griffin (Atlanta) | | GA | | | 2006 | | | | 100.0 | % | | | 218,120 | | | | 913,000 | | | | 4.19 | | | | 1.5 | | | | 15,082,217 | | | | -0- | |
| 44 | | FedEx Ground Package System, Inc. | | Ft. Myers | | FL | | | 2017 | | | | 100.0 | % | | | 213,672 | | | | 1,418,000 | | | | 6.64 | | | | 6.2 | | | | 21,684,310 | | | | 11,084,432 | |
| 45 | | FedEx Ground Package System, Inc. | | Burlington (Seattle/Everett) | | WA | | | 2016 | | | | 100.0 | % | | | 210,445 | | | | 1,962,000 | | | | 9.32 | | | | 9.2 | | | | 30,369,301 | | | | 14,569,993 | |
| 46 | | FedEx Ground Package System, Inc. | | Sauget (St. Louis, MO) | | IL | | | 2015 | | | | 100.0 | % | | | 198,729 | | | | 1,036,000 | | | | 5.21 | | | | 7.9 | | | | 15,407,470 | | | | 6,827,092 | |
| 47 | | Anheuser-Busch, Inc. | | Granite City (St. Louis, MO) | | IL | | | 2001 | | | | 100.0 | % | | | 184,800 | | | | 854,000 | | | | 4.62 | | | | 0.4 | | | | 12,757,540 | | | | -0- | |
| 48 | | Carrier Enterprise, LLC (Carrier Global Corporation) | | Carrollton (Dallas) | | TX | | | 2010 | | | | 100.0 | % | | | 184,317 | | | | 1,160,000 | | | | 6.29 | | | | 2.6 | | | | 18,494,917 | | | | 4,025,447 | |
| 49 | | FedEx Ground Package System, Inc. | | Spring (Houston) | | TX | | | 2014 | | | | 100.0 | % | | | 181,176 | | | | 1,581,000 | | | | 8.73 | | | | 3.3 | | | | 19,328,922 | | | | 6,106,876 | |
| 50 | | Carlstar Group, LLC | | Edwardsville (Kansas City) | | KS | | | 2003 | | | | 100.0 | % | | | 179,280 | | | | 771,000 | | | | 4.30 | | | | 2.1 | | | | 7,282,986 | | | | -0- | |
| 51 | | FedEx Ground Package System, Inc. | | Ft. Mill (Charlotte, NC) | | SC | | | 2010 | | | | 100.0 | % | | | 176,939 | | | | 1,598,000 | | | | 9.03 | | | | 7.2 | | | | 17,063,643 | | | | -0- | |
| 52 | | FedEx Ground Package System, Inc. | | Covington (New Orleans) | | LA | | | 2016 | | | | 100.0 | % | | | 175,315 | | | | 1,274,000 | | | | 7.27 | | | | 4.0 | | | | 18,425,875 | | | | 9,111,843 | |
| 53 | | FedEx Ground Package System, Inc. | | Tampa | | FL | | | 2004 | | | | 100.0 | % | | | 174,975 | | | | 1,624,000 | | | | 9.28 | | | | 5.1 | | | | 19,745,245 | | | | -0- | |
| 54 | | FedEx Ground Package System, Inc. | | Livonia (Detroit) | | MI | | | 2013 | | | | 100.0 | % | | | 172,668 | | | | 1,194,000 | | | | 6.92 | | | | 0.8 | | | | 13,887,897 | | | | 4,446,791 | |
| 55 | | Home Depot U.S.A., Inc. | | Montgomery (Chicago) | | IL | | | 2004 | | | | 100.0 | % | | | 171,230 | | | | 1,079,000 | | | | 6.30 | | | | 1.5 | | | | 11,303,317 | | | | -0- | |
| 56 | | FedEx Ground Package System, Inc. | | Edinburg | | TX | | | 2011 | | | | 100.0 | % | | | 164,207 | | | | 1,097,000 | | | | 6.68 | | | | 5.3 | | | | 12,039,014 | | | | -0- | |
| 57 | | FedEx Ground Package System, Inc. | | Lindale (Tyler) | | TX | | | 2015 | | | | 100.0 | % | | | 163,383 | | | | 725,000 | | | | 4.44 | | | | 3.0 | | | | 10,021,240 | | | | 4,503,798 | |
| 58 | | Bunzl Distribution Midcentral, Inc. | | Kansas City | | MO | | | 2015 | | | | 100.0 | % | | | 158,417 | | | | 714,000 | | | | 4.51 | | | | 5.3 | | | | 10,003,235 | | | | -0- | |
| 59 | | FedEx Ground Package System, Inc. | | Oklahoma City | | OK | | | 2012 | | | | 100.0 | % | | | 158,340 | | | | 1,048,000 | | | | 6.62 | | | | 4.1 | | | | 12,624,833 | | | | 1,913,054 | |
| 60 | | Magna Seating of America, Inc. | | Lancaster (Columbus) | | OH | | | 2020 | | | | 100.0 | % | | | 152,995 | | | | 1,201,000 | | | | 7.85 | | | | 8.6 | | | | 17,557,830 | | | | 8,511,498 | |
| THIRD QUARTER FISCAL YEAR 2021 SUPPLEMENTAL information | 18 |
Property Table
(unaudited)
| | | | | | | | | | | | | | | | | | | Rent | | | Lease Exp. | | | | | | | |
| | | | | | | | | Fiscal Year | | | | | | Square | | | Annual | | | Per sf | | | Term in | | | Undepreciated | | | Mortgage | |
| No | | Tenant | | City (MSA) | | State | | Acquisition | | | Occup. | | | Footage | | | Rent | | | Occup. | | | Years | | | Cost | | | Balance | |
| 61 | | FedEx Ground Package System, Inc. | | Waco | | TX | | | 2012 | | | | 100.0 | % | | | 150,710 | | | $ | 1,078,000 | | | $ | 7.15 | | | | 4.2 | | | $ | 12,551,368 | | | $ | 3,364,812 | |
| 62 | | FedEx Ground Package System, Inc. | | Beltsville (Washington, DC) | | MD | | | 2001 | | | | 100.0 | % | | | 148,881 | | | | 1,455,000 | | | | 9.77 | | | | 7.1 | | | | 14,632,389 | | | | -0- | |
| 63 | | Victory Packaging, L.P. | | Fayetteville | | NC | | | 1997 | | | | 100.0 | % | | | 148,000 | | | | 504,000 | | | | 3.41 | | | | 3.7 | | | | 5,458,279 | | | | -0- | |
| 64 | | FedEx Ground Package System, Inc. | | El Paso | | TX | | | 2006 | | | | 100.0 | % | | | 144,199 | | | | 1,345,000 | | | | 9.33 | | | | 2.3 | | | | 12,431,192 | | | | -0- | |
| 65 | | FedEx Ground Package System, Inc. | | Cocoa | | FL | | | 2008 | | | | 100.0 | % | | | 144,138 | | | | 1,112,000 | | | | 7.71 | | | | 3.3 | | | | 14,127,449 | | | | -0- | |
| 66 | | FedEx Ground Package System, Inc. | | Cudahy (Milwaukee) | | WI | | | 2001 | | | | 100.0 | % | | | 139,564 | | | | 827,000 | | | | 5.93 | | | | 6.0 | | | | 9,807,221 | | | | -0- | |
| 67 | | Challenger Lifts, Inc. (Snap-On Inc.) | | Louisville | | KY | | | 2016 | | | | 100.0 | % | | | 137,500 | | | | 858,000 | | | | 6.24 | | | | 4.9 | | | | 11,304,000 | | | | 5,377,343 | |
| 68 | | FedEx Ground Package System, Inc. | | Richfield (Cleveland) | | OH | | | 2006 | | | | 100.0 | % | | | 131,152 | | | | 1,493,000 | | | | 11.38 | | | | 3.3 | | | | 16,577,311 | | | | -0- | |
| 69 | | FedEx Ground Package System, Inc. | | Savannah | | GA | | | 2019 | | | | 100.0 | % | | | 126,520 | | | | 1,765,000 | | | | 13.95 | | | | 7.3 | | | | 27,531,560 | | | | 15,321,954 | |
| 70 | | General Electric Company | | Imperial (Pittsburgh) | | PA | | | 2016 | | | | 100.0 | % | | | 125,860 | | | | 1,329,000 | | | | 10.56 | | | | 9.5 | | | | 19,972,983 | | | | 8,949,697 | |
| 71 | | FedEx Ground Package System, Inc. | | Wheeling (Chicago) | | IL | | | 2003 | | | | 100.0 | % | | | 123,000 | | | | 1,272,000 | | | | 10.34 | | | | 5.9 | | | | 19,044,540 | | | | -0- | |
| 72 | | FedEx Ground Package System, Inc. | | Altoona | | PA | | | 2014 | | | | 100.0 | % | | | 122,522 | | | | 651,000 | | | | 5.31 | | | | 2.2 | | | | 9,022,966 | | | | 2,098,202 | |
| 73 | | FedEx Corporation | | Charleston | | SC | | | 2018 | | | | 100.0 | % | | | 121,683 | | | | 1,314,000 | | | | 10.80 | | | | 11.2 | | | | 21,538,966 | | | | 11,641,536 | |
| 74 | | Amazon.com Services, LLC | | Oklahoma City | | OK | | | 2020 | | | | 100.0 | % | | | 120,780 | | | | 935,000 | | | | 7.74 | | | | 9.2 | | | | 14,962,513 | | | | 9,403,324 | |
| 75 | | FedEx Corporation | | Mechanicsville (Richmond) | | VA | | | 2001 | | | | 100.0 | % | | | 112,799 | | | | 541,000 | | | | 4.80 | | | | 1.8 | | | | 7,836,425 | | | | -0- | |
| 76 | | FedEx Corporation | | Orlando | | FL | | | 2008 | | | | 100.0 | % | | | 110,621 | | | | 666,000 | | | | 6.02 | | | | 6.4 | | | | 8,810,059 | | | | -0- | |
| 77 | | Bunzl Distribution Oklahoma, Inc. | | Oklahoma City | | OK | | | 2017 | | | | 100.0 | % | | | 110,361 | | | | 743,000 | | | | 6.73 | | | | 3.2 | | | | 8,728,439 | | | | 4,356,890 | |
| 78 | | Style Crest, Inc. | | Winston-Salem | | NC | | | 2002 | | | | 100.0 | % | | | 106,507 | | | | 433,000 | | | | 4.07 | | | | 4.8 | | | | 7,421,032 | | | | -0- | |
| 79 | | Sonwil Distribution Center, Inc. | | Cheektowaga (Buffalo) | | NY | | | 2002 | | | | 100.0 | % | | | 104,981 | | | | 630,000 | | | | 6.00 | | | | 0.6 | | | | 10,960,823 | | | | -0- | |
| 80 | | FedEx Ground Package System, Inc. | | West Chester Twp. (Cincinnati) | | OH | | | 2000 | | | | 100.0 | % | | | 103,818 | | | | 560,000 | | | | 5.39 | | | | 2.2 | | | | 5,733,686 | | | | -0- | |
| 81 | | FedEx Ground Package System, Inc. | | Roanoke | | VA | | | 2013 | | | | 100.0 | % | | | 103,580 | | | | 755,000 | | | | 7.29 | | | | 1.8 | | | | 10,200,000 | | | | 3,000,099 | |
| 82 | | Pittsburgh Glass Works, LLC, a Division of VITRO | | O’ Fallon (St. Louis) | | MO | | | 1994 | | | | 100.0 | % | | | 102,135 | | | | 508,000 | | | | 4.97 | | | | 5.0 | | | | 4,249,615 | | | | -0- | |
| 83 | | FedEx Ground Package System, Inc. | | Green Bay | | WI | | | 2013 | | | | 100.0 | % | | | 99,102 | | | | 468,000 | | | | 4.72 | | | | 1.9 | | | | 6,570,000 | | | | 1,702,945 | |
| 84 | | Dakota Bodies, LLC | | Liberty (Kansas City) | | MO | | | 1998 | | | | 100.0 | % | | | 96,687 | | | | 416,000 | | | | 4.30 | | | | 4.8 | | | | 7,797,827 | | | | -0- | |
| 85 | | FedEx Corporation | | Jacksonville | | FL | | | 1999 | | | | 100.0 | % | | | 95,883 | | | | 536,000 | | | | 5.59 | | | | 7.9 | | | | 6,584,384 | | | | -0- | |
| 86 | | FedEx Corporation | | Tampa | | FL | | | 2006 | | | | 100.0 | % | | | 95,662 | | | | 603,000 | | | | 6.30 | | | | 6.4 | | | | 8,305,383 | | | | -0- | |
| 87 | | Amazon.com Services, Inc. | | Hanahan (Charleston) | | SC | | | 2005 | | | | 100.0 | % | | | 91,776 | | | | 803,000 | | | | 8.75 | | | | 8.0 | | | | 9,306,108 | | | | -0- | |
| 88 | | National Oilwell Varco, Inc. | | Houston | | TX | | | 2010 | | | | 100.0 | % | | | 91,295 | | | | 801,000 | | | | 8.77 | | | | 8.3 | | | | 8,190,901 | | | | 671,412 | |
| 89 | | Joseph T. Ryerson and Son, Inc. | | Elgin (Chicago) | | IL | | | 2002 | | | | 100.0 | % | | | 89,123 | | | | 519,000 | | | | 5.82 | | | | 3.6 | | | | 7,184,598 | | | | -0- | |
| 90 | | FedEx Corporation | | Omaha | | NE | | | 1999 | | | | 100.0 | % | | | 89,115 | | | | 446,000 | | | | 5.00 | | | | 2.3 | | | | 5,963,626 | | | | -0- | |
| 91 | | FedEx Ground Package System, Inc. | | Huntsville | | AL | | | 2005 | | | | 100.0 | % | | | 88,890 | | | | 605,000 | | | | 6.81 | | | | 5.1 | | | | 6,661,819 | | | | -0- | |
| 92 | | CHEP USA, Inc. | | Roanoke | | VA | | | 2007 | | | | 100.0 | % | | | 83,000 | | | | 509,000 | | | | 6.13 | | | | 3.7 | | | | 7,463,672 | | | | -0- | |
| 93 | | FedEx Corporation | | Bedford Heights (Cleveland) | | OH | | | 2007 | | | | 100.0 | % | | | 82,269 | | | | 438,000 | | | | 5.32 | | | | 7.2 | | | | 7,304,467 | | | | -0- | |
| 94 | | United Parcel Service, Inc. | | Halfmoon (Albany) | | NY | | | 2012 | | | | 100.0 | % | | | 75,000 | | | | 595,000 | | | | 7.93 | | | | 9.8 | | | | 6,741,021 | | | | -0- | |
| 95 | | FedEx Corporation | | Schaumburg (Chicago) | | IL | | | 1997 | | | | 100.0 | % | | | 73,500 | | | | 478,000 | | | | 6.50 | | | | 5.8 | | | | 5,447,053 | | | | -0- | |
| 96 | | FedEx Corporation | | Romulus (Detroit) | | MI | | | 1998 | | | | 100.0 | % | | | 71,933 | | | | 421,000 | | | | 5.85 | | | | 4.9 | | | | 4,949,251 | | | | -0- | |
| 97 | | FedEx Ground Package System, Inc. | | Denver | | CO | | | 2005 | | | | 100.0 | % | | | 69,865 | | | | 609,000 | | | | 8.72 | | | | 4.3 | | | | 6,374,068 | | | | -0- | |
| 98 | | FedEx Corporation | | Ogden (Salt Lake City) | | UT | | | 2020 | | | | 100.0 | % | | | 69,734 | | | | 772,000 | | | | 11.07 | | | | 13.8 | | | | 12,666,994 | | | | 7,917,933 | |
| 99 | | Tampa Bay Grand Prix | | Tampa | | FL | | | 2005 | | | | 100.0 | % | | | 68,385 | | | | 369,000 | | | | 5.40 | | | | 6.3 | | | | 5,677,982 | | | | -0- | |
| 100 | | Sherwin-Williams Company | | Rockford | | IL | | | 2011 | | | | 100.0 | % | | | 66,387 | | | | 486,000 | | | | 7.32 | | | | 2.5 | | | | 5,551,227 | | | | -0- | |
| 101 | | Various Tenants at Retail Shopping Center | | Somerset | | NJ | | | 1970 | | | | 95.0 | % | | | 64,220 | | | | 616,000 | | | | 10.07 | | | | na | | | | 3,139,564 | | | | -0- | |
| 102 | | Keurig Dr Pepper | | Cincinnati | | OH | | | 2015 | | | | 100.0 | % | | | 63,840 | | | | 488,000 | | | | 7.64 | | | | 8.3 | | | | 6,750,000 | | | | -0- | |
| 103 | | FedEx Corporation | | Chattanooga | | TN | | | 2007 | | | | 100.0 | % | | | 60,637 | | | | 319,000 | | | | 5.26 | | | | 1.3 | | | | 5,369,272 | | | | -0- | |
| 104 | | FedEx Ground Package System, Inc. | | Stewartsville (Rochester) | | MN | | | 2013 | | | | 100.0 | % | | | 60,370 | | | | 372,000 | | | | 6.16 | | | | 1.9 | | | | 5,231,864 | | | | 1,364,689 | |
| 105 | | Locke Supply Co. | | Richmond | | VA | | | 2004 | | | | 100.0 | % | | | 60,000 | | | | 340,000 | | | | 5.67 | | | | 10.8 | | | | 5,097,101 | | | | -0- | |
| 106 | | FedEx Ground Package System, Inc. | | Augusta | | GA | | | 2005 | | | | 100.0 | % | | | 59,358 | | | | 513,000 | | | | 8.64 | | | | 2.0 | | | | 5,363,304 | | | | -0- | |
| 107 | | Hartford Healthcare Corporation | | Newington (Hartford) | | CT | | | 2001 | | | | 100.0 | % | | | 54,812 | | | | 307,000 | | | | 5.60 | | | | 9.8 | | | | 3,525,917 | | | | -0- | |
| 108 | | Siemens Real Estate | | Lebanon (Cincinnati) | | OH | | | 2012 | | | | 100.0 | % | | | 51,130 | | | | 464,000 | | | | 9.07 | | | | 2.8 | | | | 4,554,684 | | | | -0- | |
| 109 | | FedEx Corporation | | Charlottesville | | VA | | | 1999 | | | | 100.0 | % | | | 48,064 | | | | 329,000 | | | | 6.85 | | | | 6.2 | | | | 4,462,009 | | | | -0- | |
| 110 | | FedEx Ground Package System, Inc. | | Corpus Christi | | TX | | | 2012 | | | | 100.0 | % | | | 46,253 | | | | 454,000 | | | | 9.82 | | | | 5.2 | | | | 4,808,329 | | | | -0- | |
| 111 | | Keurig Dr Pepper | | Tulsa | | OK | | | 2014 | | | | 100.0 | % | | | 46,240 | | | | 269,000 | | | | 5.82 | | | | 2.7 | | | | 3,748,031 | | | | 1,303,703 | |
| 112 | | Heartland Coca-Cola Bottling Company, LLC (Coca-Cola) | | Topeka | | KS | | | 2009 | | | | 100.0 | % | | | 40,000 | | | | 292,000 | | | | 7.30 | | | | 5.3 | | | | 3,679,843 | | | | -0- | |
| 113 | | Collins Aerospace Systems (Raytheon Technologies Corporation) | | Rockford | | IL | | | 2015 | | | | 100.0 | % | | | 38,833 | | | | 368,000 | | | | 9.48 | | | | 6.0 | | | | 5,100,000 | | | | -0- | |
| 114 | | Foundation Building Materials, LLC | | Urbandale (Des Moines) | | IA | | | 1994 | | | | 100.0 | % | | | 36,270 | | | | 179,000 | | | | 4.94 | | | | 6.5 | | | | 2,543,770 | | | | -0- | |
| 115 | | FedEx Corporation | | Richland (Jackson) | | MS | | | 1994 | | | | 100.0 | % | | | 36,000 | | | | 120,000 | | | | 3.33 | | | | 2.8 | | | | 1,900,691 | | | | -0- | |
| THIRD QUARTER FISCAL YEAR 2021 SUPPLEMENTAL information | 19 |
Property Table
(unaudited)
| | | | | | | | | | | | | | | | | | | Rent | | | Lease Exp. | | | | | | | |
| | | | | City | | | | Fiscal Year | | | | | | Square | | | Annual | | | Per sf | | | Term in | | | Undepreciated | | | Mortgage | |
| No | | Tenant | | (MSA) | | State | | Acquisition | | | Occup. | | | Footage | | | Rent | | | Occup. | | | Years | | | Cost | | | Balance | |
| 116 | | FedEx Corporation | | Punta Gorda | | FL | | | 2007 | | | | 100.0 | % | | | 34,624 | | | $ | 284,000 | | | $ | 8.20 | | | | 6.0 | | | $ | 4,133,510 | | | $ | -0- | |
| 117 | | FedEx Corporation | | Lakeland | | FL | | | 2006 | | | | 100.0 | % | | | 32,105 | | | | 155,000 | | | | 4.83 | | | | 6.4 | | | | 2,043,226 | | | | -0- | |
| 118 | | FedEx Corporation | | Augusta | | GA | | | 2006 | | | | 100.0 | % | | | 30,184 | | | | 121,000 | | | | 4.01 | | | | 1.4 | | | | 1,993,029 | | | | -0- | |
| 119 | | Graybar Electric Company | | Ridgeland (Jackson) | | MS | | | 1993 | | | | 100.0 | % | | | 26,340 | | | | 122,000 | | | | 4.63 | | | | 4.1 | | | | 2,901,362 | | | | -0- | |
| 120 | | Sherwin-Williams Company | | Burr Ridge (Chicago) | | IL | | | 1997 | | | | 100.0 | % | | | 12,500 | | | | 162,000 | | | | 12.96 | | | | 5.3 | | | | 1,876,367 | | | | -0- | |
| | | Total as of 6/30/21 | | | | | | | | | | | 99.7 | % | | | 24,521,727 | | | $ | 158,806,000 | | | $ | 6.50 | | | | 7.2 | | | $ | 2,209,619,300 | (A) | | $ | 856,674,849 | |
| | | | | | | | | | | | | | | | | | | | | | | | | | | | | | | | | | | | | | | |
| | | Acquisitions Subsequent to 6/30/21 | | | | | | | | | | | | | | | | | | | | | | | | | | | | | | | | | | | | |
| 121 | | FedEx Ground Package System, Inc. | | Burlington | | VT | | | 2021 | | | | 100.0 | % | | | 143,794 | | | | 3,233,000 | | | | 22.48 | | | | 14.9 | | | | | | | | | |
| | | Pro Forma Total with Acquisitions Subsequent to 6/30/21 | | | | | | | | | | | 99.7 | % | | | 24,665,521 | | | $ | 162,039,000 | | | $ | 6.59 | | | | 7.2 | | | | | | | | | |
| | (A) | Does not include unamortized debt issuance costs of $7,681,337. |
| THIRD QUARTER FISCAL YEAR 2021 SUPPLEMENTAL information | 20 |
Definitions
Investors and analysts following the real estate industry utilize funds from operations (“FFO”), adjusted funds from operations (“AFFO”), net operating income (“NOI”), Same Property NOI, Same Property Cash NOI, and earnings before interest, taxes, depreciation and amortization (“Adjusted EBITDA”) variously defined, as supplemental performance measures. While we believe net income available to common stockholders, as defined by accounting principles generally accepted in the United States of America (U.S. GAAP), is the most appropriate measure, we consider NOI, Same Property NOI, Same Property Cash NOI, Adjusted EBITDA, FFO and AFFO, given their wide use by and relevance to investors and analysts, appropriate supplemental performance measures. FFO, reflecting the assumption that real estate asset values rise or fall with market conditions, principally adjusts for the effects of U.S. GAAP depreciation and amortization of real estate assets. NOI provides a measure of rental operations, and does not factor in depreciation and amortization and non-property specific expenses such as interest expense and general and administrative expenses. Adjusted EBITDA provides a tool to further evaluate the ability to incur and service debt and to fund dividends and other cash needs. AFFO provides a supplemental tool to evaluate our performance. In addition, NOI, Same Property NOI, Same Property Cash NOI, Adjusted EBITDA, FFO and AFFO are commonly used in various ratios, pricing multiples, yields and returns and valuation of calculations used to measure financial position, performance and value. As used herein, we calculate the following non-U.S. GAAP measures as follows:
| | ● | FFO, as defined by The National Association of Real Estate Investment Trusts (Nareit), represents net income attributable to common shareholders, as defined by accounting principles generally accepted in the United States of America (U.S. GAAP), as defined under U.S. GAAP, excluding gains or losses from sales of previously depreciated real estate assets, impairment charges related to depreciable real estate assets, certain non-cash items such as real estate asset depreciation and amortization, plus our portion of these items related to our consolidated investment that we have a non-controlling interest in. Included in the Nareit FFO White Paper - 2018 Restatement, is an option pertaining to assets incidental to our main business in the calculation of Nareit FFO to make an election to include or exclude mark-to-market changes in the value recognized on these marketable equity securities. In conjunction with the adoption of the FFO White Paper - 2018 Restatement, for all periods presented, we have elected to exclude unrealized gains and losses from our investments in marketable equity securities from our FFO calculation. Nareit created FFO as a non-GAAP supplemental measure of REIT operating performance. |
| | ● | AFFO is calculated as FFO, excluding stock-based compensation expense, depreciation of corporate office tenant improvements, amortization of deferred financing costs, gains on the sale of securities, lease termination income, non-recurring severance expense, non-recurring strategic alternatives & proxy costs, effect of non-cash U.S. GAAP straight-line rent adjustments and less recurring capital expenditures, plus our portion of these items related to our consolidated investment that we have a non-controlling interest in. Recurring capital expenditures are defined as all capital expenditures that are recurring in nature, excluding capital expenditures related to expansions at our current locations or capital expenditures that are incurred in conjunction with obtaining a new lease or a lease renewal. |
| | ● | NOI from property operations is calculated as net income (loss) attributable to common shareholders, as defined by U.S. GAAP, plus net income (loss) attributable to non-controlling interest, plus preferred dividend expense, general & administrative expenses, non-recurring strategic alternatives & proxy costs, non-recurring severance expense, depreciation, amortization of capitalized lease costs & intangible assets and interest expense, including amortization of financing costs, unrealized holding (gains) or losses arising during the periods, less dividend income, realized gain on sale of securities transactions, realized gain on sale of real estate investment and lease termination income. The components of NOI consist of recurring rental and reimbursement revenue, less real estate taxes and operating expenses, such as insurance, utilities, and repairs and maintenance. |
| | ● | Same Property NOI is calculated as the NOI of all properties owned during the entire periods presented with the exclusion of any properties expanded during the periods presented. |
| | ● | Same Property Cash NOI is calculated as the Same Property NOI adjusted to exclude the effect of non-cash U.S. GAAP straight-line rent adjustment for the properties included in the Same Property NOI calculation. |
| | ● | Adjusted EBITDA is net income (loss) attributable to common shareholders, as defined by U.S. GAAP, plus preferred dividends, interest expense, including amortization of financing costs, depreciation and amortization, net amortization of acquired above and below market lease revenue, plus our portion of these items related to our consolidated investment that we have a non-controlling interest in, non-recurring strategic alternatives & proxy costs and unrealized holding losses (minus gains) arising during the periods less realized gain on sale of real estate investment and realized gain on sale of securities transactions. |
FFO, AFFO, NOI, Same Property NOI, Same Property Cash NOI and Adjusted EBITDA, do not represent cash generated from operating activities in accordance with U.S. GAAP and are not necessarily indicative of cash available to fund cash needs, including the repayment of principal on debt and payment of dividends and distributions. FFO, AFFO, NOI, Same Property NOI, Same Property Cash NOI and Adjusted EBITDA should not be considered as substitutes for net income applicable to common shareholders (calculated in accordance with U.S. GAAP) as a measure of results of operations or cash flows (calculated in accordance with U.S. GAAP) as a measure of liquidity. FFO, AFFO, NOI, Same Property NOI, Same Property Cash NOI and Adjusted EBITDA, as currently calculated by us, may not be comparable to similarly titled, but variously calculated, measures of other REITs.
| THIRD QUARTER FISCAL YEAR 2021 SUPPLEMENTAL information | 21 |
| FOR IMMEDIATE RELEASE | |
| | August 2, 2021 |
| | Contact: Becky Coleridge |
| | 732-577-9996 |
MONMOUTH REAL ESTATE REPORTS RESULTS FOR
THE THIRD QUARTER ENDED JUNE 30, 2021
HOLMDEL, NJ, August 2, 2021........ Monmouth Real Estate Investment Corporation (NYSE:MNR) reported Net Income Attributable to Common Shareholders of $17.3 million or $0.17 per diluted share for the three months ended June 30, 2021 as compared to Net Income Attributable to Common Shareholders of $26.9 million or $0.27 per diluted share for the three months ended June 30, 2020, representing a decrease of $9.6 million or $0.10 per diluted share. During the three months ended June 30, 2021, we recognized a $16.5 million unrealized holding gain on securities or $0.17 per diluted share as compared to a $19.6 million unrealized holding gain on securities or $0.20 per diluted share for the three months ended June 30, 2020. Funds from Operations (FFO), which excludes unrealized and realized gains or losses from our securities portfolio, for the three months ended June 30, 2021 were $11.5 million or $0.12 per diluted share versus $19.7 million or $0.20 per diluted share for the three months ended June 30, 2020, representing a decrease of $8.2 million or $0.08 per diluted share. The decrease in Net Income Attributable to Common Shareholders and FFO is primarily attributable to non-recurring strategic alternatives and proxy costs of $8.7 million related to our strategic alternatives process, our pending merger with Equity Commonwealth and our proxy process. FFO excluding these non-recurring costs for the three months ended June 30, 2021 were $20.2 million or $0.20 per diluted share versus $19.7 million or $0.20 per diluted share for the three months ended June 30, 2020, representing unchanged per diluted share earnings. For the three months ended June 30, 2021, Adjusted Funds from Operations (AFFO), which excludes non-recurring items, including costs related to our strategic alternatives process and our proxy process and unrealized and realized gains or losses from our securities portfolio, were $19.7 million or $0.20 per diluted share compared to $19.5 million or $0.20 per diluted share for the three months ended June 30, 2020. Sequentially, our AFFO of $0.20 per diluted share for the third quarter of fiscal 2021 also was unchanged compared to our AFFO per diluted share for the second quarter of fiscal 2021. During the nine months ended June 30, 2021, we recognized a $55.4 million unrealized holding gain on our securities portfolio representing $0.56 per diluted share as compared to a $67.1 million unrealized holding loss on securities or $0.69 per diluted share for the nine months ended June 30, 2020.
A summary of significant financial information for the three and nine months ended June 30, 2021 and 2020 (in thousands, except per share amounts) is as follows:
| | | Three Months Ended June 30, | |
| | | 2021 | | | 2020 | |
| Rental Revenue | | $ | 39,032 | | | $ | 35,427 | |
| Reimbursement Revenue | | $ | 6,962 | | | $ | 6,348 | |
| Net Operating Income (NOI) (1) | | $ | 38,904 | | | $ | 35,045 | |
| Total Expenses | | $ | 32,040 | | | $ | 21,459 | |
| Dividend Income | | $ | 1,486 | | | $ | 2,344 | |
| Realized Gain on Sale of Real Estate Investment | | $ | 6,376 | | | $ | -0- | |
| Unrealized Holding Gains Arising During the Periods | | $ | 16,471 | | | $ | 19,610 | |
| Net Income | | $ | 28,602 | | | $ | 33,295 | |
| Net Income Attributable to Common Shareholders | | $ | 17,292 | | | $ | 26,851 | |
| Net Income Attributable to Common Shareholders Per Diluted Common Share | | $ | 0.17 | | | $ | 0.27 | |
| FFO (1) | | $ | 11,502 | | | $ | 19,721 | |
| FFO per Diluted Common Share (1) | | $ | 0.12 | | | $ | 0.20 | |
| FFO Excluding Non-recurring Strategic Alternatives & Proxy Costs (1) | | $ | 20,159 | | | $ | 19,721 | |
| FFO Excluding Non-recurring Strategic Alternatives & Proxy Costs per Diluted Common Share (1) | | $ | 0.20 | | | $ | 0.20 | |
| AFFO (1) | | $ | 19,701 | | | $ | 19,463 | |
| AFFO per Diluted Common Share (1) | | $ | 0.20 | | | $ | 0.20 | |
| Dividends Declared per Common Share | | $ | 0.18 | | | $ | 0.17 | |
| | | | | | | | | |
| Weighted Avg. Diluted Common Shares Outstanding | | | 98,539 | | | | 97,962 | |
| THIRD QUARTER FISCAL YEAR 2021 SUPPLEMENTAL information | 22 |
| | | Nine Months Ended June 30, | |
| | | 2021 | | | 2020 | |
| Rental Revenue | | $ | 115,123 | | | $ | 105,410 | |
| Reimbursement Revenue | | $ | 20,818 | | | $ | 19,772 | |
| Lease Termination Income | | $ | 377 | | | $ | -0- | |
| Net Operating Income (NOI) (1) | | $ | 114,256 | | | $ | 104,633 | |
| Total Expenses | | $ | 79,820 | | | $ | 65,151 | |
| Dividend Income | | $ | 4,681 | | | $ | 8,987 | |
| Realized Gain on Sale of Real Estate Investment | | $ | 6,376 | | | $ | -0- | |
| Realized Gain on Sale of Securities Transactions | | $ | 2,248 | | | $ | -0- | |
| Unrealized Holding Gains (Losses) Arising During the Periods | | $ | 55,377 | | | $ | (67,100 | ) |
| Net Income (Loss) | | $ | 96,949 | | | $ | (25,317 | ) |
| Net Income (Loss) Attributable to Common Shareholders | | $ | 68,950 | | | $ | (44,700 | ) |
| Net Income (Loss) Attributable to Common Shareholders Per Diluted Common Share | | $ | 0.71 | | | $ | (0.46 | ) |
| FFO (1) | | $ | 50,982 | | | $ | 59,205 | |
| FFO per Diluted Common Share (1) | | $ | 0.52 | | | $ | 0.61 | |
| FFO Excluding Non-recurring Strategic Alternatives & Proxy Costs (1) | | $ | 61,878 | | | $ | 59,205 | |
| FFO Excluding Non-recurring Strategic Alternatives & Proxy Costs per Diluted Common Share (1) | | $ | 0.63 | | | $ | 0.61 | |
| AFFO (1) | | $ | 57,507 | | | $ | 58,705 | |
| AFFO per Diluted Common Share (1) | | $ | 0.58 | | | $ | 0.60 | |
| Dividends Declared per Common Share | | $ | 0.53 | | | $ | 0.51 | |
| | | | | | | | | |
| Weighted Avg. Diluted Common Shares Outstanding | | | 98,415 | | | | 97,626 | |
A summary of significant balance sheet information as of June 30, 2021 and September 30, 2020 (in thousands) is as follows:
| | | June 30, 2021 | | | September 30, 2020 | |
| Cash and Cash Equivalents | | $ | 90,896 | | | $ | 23,517 | |
| Real Estate Investments | | $ | 1,876,906 | | | $ | 1,747,844 | |
| Securities Available for Sale at Fair Value | | $ | 148,382 | | | $ | 108,832 | |
| Total Assets | | $ | 2,178,078 | | | $ | 1,939,783 | |
| Fixed Rate Mortgage Notes Payable, net of Unamortized Debt Issuance Costs | | $ | 848,994 | | | $ | 799,507 | |
| Loans Payable | | $ | 165,000 | | | $ | 75,000 | |
| Total Shareholders’ Equity | | $ | 1,135,847 | | | $ | 1,037,605 | |
During the third quarter, we accomplished the following:
| | ● | Increased our Rental and Reimbursement Revenue by 10% over the prior year period to $46.0 million; |
| | | |
| | ● | Increased our Net Operating Income by 11% over the prior year period to $38.9 million; |
| | | |
| | ● | Increased our Gross Leasable Area (GLA) by 5% over the prior year period to 24.5 million square feet; |
| | | |
| | ● | Grew our acquisition pipeline to six new build-to-suit properties containing 1.8 million total square feet representing an aggregate cost of $238.4 million, all of which will be leased to Investment Grade tenants,. Subsequent to the quarter end, we acquired one of these properties for $54.8 million representing 144,000 square feet; |
| | | |
| | ● | Completed a parking lot expansion for UPS at our property located in Halfmoon, NY for approximately $835,000, resulting in an initial increase in annual rent of approximately $52,000 with 2% annual increases; |
| | | |
| | ● | Increased our overall occupancy rate by 30 basis points over the prior year period to a sector leading 99.7% currently; |
| | | |
| | ● | Renewed all ten leases set to expire during fiscal 2021. These ten lease renewals, comprising 1.2 million square feet resulted in a 6.2% increase in GAAP rent, a 0.4% increase in cash rent, and have a weighted average lease renewal term of 4.2 years; |
| | | |
| | ● | Maintained a weighted average lease term of 7.2 years consistent with the prior year period; |
| THIRD QUARTER FISCAL YEAR 2021 SUPPLEMENTAL information | 23 |
| | ● | Increased our annualized average base rent per occupied square foot to $6.50, an increase of 2% compared to the prior year period; |
| | | |
| | ● | Maintained a weighted average debt maturity on our fixed-rate mortgage debt of 11.1 years; |
| | | |
| | ● | Reduced the weighted average interest rate on our fixed-rate mortgage debt to 3.86% from 4.00% in the prior year period; |
| | | |
| | ● | Reported $16.5 million in unrealized gains on our securities portfolio for the three months ended June 30, 2021. In addition, reported $55.4 million in unrealized gains on our securities portfolio for the nine months ended June 30, 2021. |
Highlights from the Third Quarter of Fiscal 2021:
| ● | Acquisitions. Through the third quarter end, Monmouth has completed the acquisitions of two high quality properties comprising 1.1 million square feet for an aggregate purchase price of $170.0 million and are expected to generate $10.1 million in annual rent. In addition, subsequent to quarter end, we acquired one building comprising 144,000 square feet situated on 43.4 acres located in the Burlington, VT MSA for $54.8 million. This property is leased to FedEx Ground for 15 years and is expected to generate $3.2 million in annual rent. |
| | |
| ● | Pipeline. Monmouth’s $183.6 million acquisition pipeline currently contains five new build-to-suit properties, comprising 1.6 million total square feet. These properties have a weighted average lease term of 13.4 years and are expected to generate $10.5 million in annual rent. These projects are all leased to investment grade tenants, with 68% leased to FedEx Ground and 32% leased to Mercedes Benz. |
| | |
| ● | Parking Expansion Projects. The Company currently has eight FedEx Ground parking expansion projects underway that it expects to cost approximately $37.3 million. These parking expansion projects will result in additional rent and extensions to the existing lease terms. We are also in discussions to expand parking at nine additional locations. |
| | |
| ● | Lease Renewals. The Company has renewed all ten leases that were set to expire this fiscal year representing 1.2 million square feet. These lease renewals have a weighted average lease term of 4.2 years, and a weighted average lease rate of $4.77 per square foot on a GAAP basis and $4.66 on a cash basis. This represents an increase of 6.2% on a GAAP basis and an increase of 0.4% on a cash basis. |
| | |
| ● | Key Financial Metrics and Ratios. At quarter end, Monmouth’s weighted average lease maturity was 7.2 years and its weighted average mortgage debt maturity was 11.1 years. For the quarter, Net Debt to Adjusted EBITDA was at 6.0x, Fixed Charge Coverage at 2.1x, and Net Debt to Total Market Capitalization at 27%. The Company’s occupancy rate has been over 98.9% for six consecutive years and its weighted average lease term has exceeded seven years for seven consecutive years. |
| | |
| ● | Securities Portfolio. At quarter end, the Company’s $148.4 million securities portfolio represented 5.9% of its undepreciated assets. Securities Available for Sale increased by $16.7 million during the current quarter and increased by $39.6 million from September 30, 2020 to June 30, 2021. The increase was primarily due to an Unrealized Holding Gain of $16.5 million during the three months ended and an Unrealized Holding Gain of $55.4 million for the nine months ended June 30, 2021. There were also sales and redemptions of securities during the nine month period totaling $18.8 million which resulted in a realized gain of $2.2 million. Our investment in UMH Properties is now showing a 118% gain, or $17 million not including substantial dividends. |
| | |
| ● | Asset Sale. During the quarter, on April 15, 2021, Monmouth sold its 60,400 square foot building located in Carlstadt, NJ for $13.0 million. The Company owned a 51% interest in this property. Its 51% portion of the sale proceeds resulted in a U.S. GAAP net realized gain of approximately $3.3 million, representing a 159% gain over its depreciated basis and a net realized gain of approximately $2.6 million, or a 96% net gain over its historic undepreciated cost. |
Merger Transaction with Equity Commonwealth
As previously announced, in January 2021, our Board of Directors unanimously decided to explore strategic alternatives to maximize shareholder value. Following a comprehensive strategic alternatives process, on May 4, 2021, we entered into a definitive merger agreement with Equity Commonwealth (“EQC”), a New York Stock Exchange traded real estate investment trust, under which, on the terms and subject to the conditions set forth in the merger agreement, we will merge with and into a new wholly-owned subsidiary of Equity Commonwealth, resulting in Equity Commonwealth acquiring us in an all-stock transaction. The merger agreement provides that, upon closing of the merger, our common stockholders will be entitled to receive 0.67 shares of Equity Commonwealth common stock for every share of Monmouth common stock they own and the outstanding shares of Monmouth common stock will be extinguished. We plan to continue to pay our regular quarterly common stock dividend and our quarterly Series C Cumulative Redeemable Preferred Stock dividend until closing of the merger. Under the terms of the definitive merger agreement, upon closing of the merger, each holder of our 6.125% Series C Preferred Stock will be entitled to receive an amount in cash equal to $25.00 per share plus accumulated and unpaid dividends and the outstanding shares of our 6.125% Series C Cumulative Redeemable Preferred Stock will be extinguished. The merger transaction is expected to close during the second half of calendar 2021, subject to customary closing conditions, including approval by common stockholders of both Equity Commonwealth and MREIC. Equity Commonwealth and MREIC stockholders are expected to own approximately 65% and 35%, respectively, of the pro forma company following the close of the transaction. On July 23, 2021, we filed with the SEC, and shortly thereafter began distributing to our stockholders, a definitive joint proxy statement/prospectus of MREIC and EQC pursuant to which both MREIC and EQC are seeking approval of the merger from their respective stockholders at special stockholder meetings that have been called for August 24, 2021.
| THIRD QUARTER FISCAL YEAR 2021 SUPPLEMENTAL information | 24 |
Under the terms of the merger agreement, Monmouth plans to continue to pay its regular quarterly common stock dividend and its Series C Cumulative Redeemable Preferred Stock dividend between signing and closing of the transaction. Equity Commonwealth expects to begin paying a quarterly dividend after the transaction has closed. The Equity Commonwealth Board of Trustees will determine the timing and amount of the dividend.
In light of the pending transaction with Equity Commonwealth, we do not intend to host a conference call or webcast in connection with our third quarter FY 2021 financial results. The results will be available on the Company’s website at www.mreic.reit in the Investor Relations section, under Filings and Reports.
Monmouth Real Estate Investment Corporation, founded in 1968, is one of the oldest public equity REITs in the world. We specialize in single tenant, net-leased industrial properties, subject to long-term leases, primarily to investment-grade tenants. Monmouth Real Estate is a fully integrated and self-managed real estate company, whose property portfolio consists of 121 properties, containing a total of approximately 24.7 million rentable square feet, geographically diversified across 32 states. Our occupancy rate is currently 99.7%, our weighted average building age is currently 10 years, and our percentage of revenue derived from Investment Grade tenants or their subsidiaries is currently 83%.
Certain statements included in this press release which are not historical facts may be deemed forward-looking statements within the meaning of the Private Securities Litigation Reform Act of 1995. Any such forward-looking statements are based on our current expectations and involve various risks and uncertainties. Although we believe the expectations reflected in any forward-looking statements are based on reasonable assumptions, we can provide no assurance those expectations will be achieved. The risks and uncertainties that could cause actual results or events to differ materially from expectations include risks and uncertainties relating to the proposed merger with Equity Commonwealth and other risks and uncertainties described in our annual report on Form 10-K and in our other filings with the SEC. We undertake no obligation to publicly update or revise any forward-looking statements whether as a result of new information, future events, or otherwise.
Additional Information and Where to Find It
In connection with the proposed merger between Monmouth and EQC, EQC has filed a registration statement on Form S-4 with the SEC, which became effective on July 23, 2021, to register the common shares of beneficial interest of EQC to be issued pursuant to the merger. The registration statement includes a joint proxy statement/prospectus which has been filed by EQC and Monmouth with the SEC and has been sent to the common shareholders of EQC seeking their approval of the share issuance and to the common shareholders of Monmouth seeking their approval of the merger (the “joint proxy statement/prospectus”). EQC and Monmouth may also file other documents regarding the proposed merger and share issuance with the SEC. BEFORE MAKING ANY VOTING OR INVESTMENT DECISION, INVESTORS AND SECURITY HOLDERS ARE URGED TO CAREFULLY READ THE ENTIRE REGISTRATION STATEMENT AND THE JOINT PROXY STATEMENT/PROSPECTUS, AND ANY OTHER RELEVANT DOCUMENTS FILED WITH THE SEC, AS WELL AS ANY AMENDMENTS OR SUPPLEMENTS TO THESE DOCUMENTS, CAREFULLY AND IN THEIR ENTIRETY BECAUSE THEY CONTAIN IMPORTANT INFORMATION ABOUT THE PROPOSED MERGER AND SHARE ISSUANCE. Investors and security holders may obtain free copies of the registration statement and joint proxy statement/prospectus and other documents filed with the SEC by EQC or Monmouth through the website maintained by the SEC at www.sec.gov. In addition, investors and security holders may obtain free copies of the registration statement and the joint proxy statement/prospectus and other documents filed with the SEC by EQC on EQC’s website at www.eqcre.com and may obtain free copies of the joint proxy statement/prospectus and other documents filed with the SEC by Monmouth on Monmouth’s website at www.mreic.reit.
Notes:
(1) Non-U.S. GAAP Information: FFO, as defined by The National Association of Real Estate Investment Trusts (NAREIT), represents net income attributable to common shareholders, as defined by accounting principles generally accepted in the United States of America (U.S. GAAP), excluding gains or losses from sales of previously depreciated real estate assets, impairment charges related to depreciable real estate assets, certain non-cash items such as real estate asset depreciation and amortization, plus our portion of these items related to our consolidated investment that we have a non-controlling interest in. Included in the NAREIT FFO White Paper - 2018 Restatement, is an option pertaining to assets incidental to our main business in the calculation of NAREIT FFO to make an election to include or exclude mark-to-market changes in the value recognized on these marketable equity securities. In conjunction with the adoption of the FFO White Paper - 2018 Restatement, for all periods presented, we have elected to exclude unrealized gains and losses from our investments in marketable equity securities from our FFO calculation. NAREIT created FFO as a non-GAAP supplemental measure of REIT operating performance. Our calculation of Adjusted Funds From Operations (AFFO) differs from NAREIT’s definition of AFFO because we exclude certain items that we view as nonrecurring or impacting comparability from period to period. We define AFFO as FFO, excluding stock based compensation expense, depreciation of corporate office tenant improvements, amortization of deferred financing costs, realized gain on sale of securities, lease termination income, non-recurring strategic alternatives & proxy costs, non-recurring severance expense, effect of non-cash U.S. GAAP straight-line rent adjustments and subtracting recurring capital expenditures, plus our portion of these items related to our equity investments that our investees have a non-controlling interest in. We define recurring capital expenditures as all capital expenditures that are recurring in nature, excluding capital expenditures related to expansions at our current locations or capital expenditures that are incurred in conjunction with obtaining a new lease or a lease renewal. We believe that, as widely recognized measures of performance used by other REITs, FFO and AFFO may be considered by investors as supplemental measures to compare our operating performance to those of other REITs. FFO and AFFO exclude historical cost depreciation as an expense and may facilitate the comparison of REITs which have a different cost basis. However, other REITs may use different methodologies to calculate FFO and AFFO and, accordingly, our FFO and AFFO may not be comparable to all other REITs. The items excluded from FFO and AFFO are significant components in understanding our financial performance.
FFO and AFFO are non-GAAP performance measures and (i) do not represent Cash Flow from Operations as defined by U.S. GAAP; (ii) should not be considered as an alternative to Net Income or Net Income Attributable to Common Shareholders as a measure of operating performance or to Cash Flows from Operating, Investing and Financing Activities; and (iii) are not an alternative to Cash Flows from Operating, Investing and Financing Activities as a measure of liquidity. FFO and AFFO, as calculated by us, may not be comparable to similarly titled measures reported by other REITs.
| THIRD QUARTER FISCAL YEAR 2021 SUPPLEMENTAL information | 25 |
The following is a reconciliation of the Company’s U.S. GAAP Net Income (Loss) Attributable to Common Shareholders to the Company’s FFO and AFFO for the three and nine months ended June 30, 2021 and 2020 (in thousands):
| | | Three Months Ended | | | Nine Months Ended | |
| | | 6/30/2021 | | | 6/30/2020 | | | 6/30/2021 | | | 6/30/2020 | |
| Net Income (Loss) Attributable to Common Shareholders | | $ | 17,292 | | | $ | 26,851 | | | $ | 68,950 | | | $ | (44,700 | ) |
| Less/Plus: Unrealized Holding (Gains) Losses Arising During the Periods | | | (16,471 | ) | | | (19,610 | ) | | | (55,377 | ) | | | 67,100 | |
| Plus: Depreciation Expense (excluding Corporate Office Capitalized Costs) | | | 12,960 | | | | 11,672 | | | | 37,959 | | | | 34,436 | |
| Plus: Amortization of Intangible Assets | | | 599 | | | | 524 | | | | 1,731 | | | | 1,539 | |
| Plus: Amortization of Capitalized Lease Costs | | | 374 | | | | 284 | | | | 971 | | | | 830 | |
| Less: Realized Gain on Sale of Real Estate Investment (1) | | | (3,252 | ) | | | -0- | | | | (3,252 | ) | | | -0- | |
| FFO Attributable to Common Shareholders (2) | | | 11,502 | | | | 19,721 | | | | 50,982 | | | | 59,205 | |
| Plus: Depreciation of Corporate Office Capitalized Costs | | | 57 | | | | 57 | | | | 172 | | | | 176 | |
| Plus: Stock Compensation Expense | | | 77 | | | | 98 | | | | 210 | | | | 368 | |
| Plus: Amortization of Financing Costs | | | 350 | | | | 326 | | | | 1,026 | | | | 1,082 | |
| Plus: Non-recurring Strategic Alternatives & Proxy Costs | | | 8,657 | | | | -0- | | | | 10,896 | | | | -0- | |
| Plus: Non-recurring Severance Expense | | | -0- | | | | -0- | | | | -0- | | | | 786 | |
| Less: Realized Gain on Sale of Securities Transactions | | | -0- | | | | -0- | | | | (2,248 | ) | | | -0- | |
| Less: Lease Termination Income | | | -0- | | | | -0- | | | | (377 | ) | | | -0- | |
| Less: Recurring Capital Expenditures | | | (229 | ) | | | (508 | ) | | | (791 | ) | | | (1,443 | ) |
| Less: Effect of Non-cash U.S. GAAP Straight-line Rent Adjustment | | | (713 | ) | | | (231 | ) | | | (2,363 | ) | | | (1,469 | ) |
| AFFO Attributable to Common Shareholders | | $ | 19,701 | | | $ | 19,463 | | | $ | 57,507 | | | $ | 58,705 | |
| | (1) | Represents our portion of the net realized gain from the sale of our property that we owned a 51% interest in. |
| | (2) | FFO Attributable to Common Shareholders for the three and nine months ended June 30, 2021 includes Non-recurring Strategic Alternatives & Proxy Costs of $8.7 million and $10.9 million, respectively. FFO Attributable to Common Shareholders for the three and nine months ended June 30, 2021 excluding these Non-recurring Strategic Alternatives & Proxy Costs is $20.2 million and $61.9 million, respectively. |
The following are the Cash Flows provided (used) by Operating, Investing and Financing Activities for the nine months ended June 30, 2021 and 2020 (in thousands):
| | | Nine Months Ended | |
| | | 6/30/2021 | | | 6/30/2020 | |
| | | | | | | |
| Operating Activities | | $ | 76,768 | | | $ | 74,964 | |
| Investing Activities | | | (145,246 | ) | | | (163,049 | ) |
| Financing Activities | | | 135,857 | | | | 80,010 | |
# # # # #
| THIRD QUARTER FISCAL YEAR 2021 SUPPLEMENTAL information | 26 |