UNITED STATES
SECURITIES AND EXCHANGE COMMISSION
Washington, D.C. 20549
FORM N-CSR
CERTIFIED SHAREHOLDER REPORT OF REGISTERED
MANAGEMENT INVESTMENT COMPANIES
Investment Company Act File Number: 811-2340
Montgomery Street Income Securities, Inc.
(Exact name of registrant as specified in charter)
Three Canal Plaza, 6th Floor
Portland ME 04101
(Address of principal executive offices)
Stacey E. Hong, President
Three Canal Plaza, 6th Floor
Portland ME 04101
(Name and address of agent for service)
Registrant’s telephone number, including area code: (207) 347-2000
Date of fiscal year end: December 31
Date of reporting period: January 1, 2015 – June 30, 2015
Form N-CSR is to be used by management investment companies to file reports with the Commission not later than 10 days after the transmission to stockholders of any report that is required to be transmitted to stockholders under Rule 30e-1 under the Investment Company Act of 1940 (17 CFR 270.30e-1). The Commission may use the information provided on Form N-CSR in its regulatory, disclosure review, inspection, and policymaking roles.
A registrant is required to disclose the information specified by Form N-CSR, and the Commission will make this information public. A registrant is not required to respond to the collection of information contained in Form N-CSR unless the Form displays a currently valid Office of Management and Budget (“OMB”) control number. Please direct comments concerning the accuracy of the information collection burden estimate and any suggestions for reducing the burden to Secretary, Securities and Exchange Commission, 450 Fifth Street, NW, Washington, DC 20549-0609. The OMB has reviewed this collection of information under the clearance requirements of 44 U.S.C. §3507.
Item 1. Report to Stockholders.

Montgomery Street
Income Securities, Inc. (MTS)
Semiannual Report to Stockholders
June 30, 2015 (Unaudited)
Montgomery Street Income Securities, Inc.
Portfolio Manager Review (Unaudited)
Portfolio Return
Montgomery Street Income Street Securities, Inc. (the “Fund”) had a total return based on net asset value (“NAV”) of 0.86% for the six-month period ended June 30, 2015. The total return of the Fund, based on the market price of its New York Stock Exchange traded shares, was 0.61% for the same period.1 The Fund’s NAV total return outperformed the Barclays U.S. Aggregate Bond Index, the Fund’s benchmark, which posted a total return of -0.10% for the six-month period.2 The portfolio manager of the Fund is Pacific Investment Management Company (“PIMCO”).
Market Review
In addition to the highly anticipated foray of the European Central Bank (“ECB”) into quantitative easing (“QE”), the new year began with a host of global central banks re-embracing monetary easing. The U.S. Federal Reserve (“Fed”) remained an outlier, as officials reiterated their desire to hike rates sometime this year, emphasizing the importance of incoming data. Some trends from 2014 continued into 2015, including generalized U.S. Dollar strength, lower oil prices, and uncertainty as evidenced in the choppiness of risk assets. First quarter gross domestic product (“GDP”) was revised up to show a more modest -0.2% decline; however, nearly every labor market indicator pointed to sustainable growth.
The U.S. economy continued to show signs of strength, as a healthier labor market, improving outlook for spending, and modest rebound in oil prices led to a sell-off in longer-dated U.S. Treasuries over the second quarter. After the U.S. Dollar’s seemingly unstoppable 25% rally over the prior nine months, lingering uncertainty about the start and pace of the Fed rate hikes anchored short-dated Treasuries and led to second quarter softness in the U.S. Dollar. Elsewhere in developed markets, global deflation fears gradually receded as oil prices firmed, the ECB committed to prevent deflation with QE, and the outlook for growth brightened. Although volatility in Eurozone markets grabbed headlines amid Greek concerns, modest market moves suggested the events in Greece were more noise than news for global financial markets.
Although global developed economies showed signs of improvement, heightened volatility led to a reversal in financial markets gains from the first quarter. The S&P 500 Index posted sluggish returns of 1.23%. During the first half, while in global fixed income markets, the Barclays U.S. Aggregate Bond Index declined as most developed market yield curves steepened over the second quarter amid a confluence of technical and fundamental factors.
| 1 | Total return based on NAV reflects changes in the Fund’s net asset value during the period. Total return based on market value reflects changes in market value. Each figure assumes that dividend and capital gain distributions, if any, were reinvested. These figures will differ depending upon the level of any discount from or premium to NAV at which the Fund’s shares traded during the period. Past results are not necessarily indicative of the future performance of the Fund. Investment return and principal value will fluctuate. |
| 2 | The Barclays U.S. Aggregate Bond Index is a broad-based benchmark that measures the investment grade, U.S. dollar-denominated, fixed-rate taxable bond market, including Treasuries, government-related and corporate securities, mortgage backed securities (agency fixed-rate and hybrid adjustable rate mortgage pass-throughs), asset backed securities and commercial mortgage backed securities. The Index does not include exposure to high yield securities, non-dollar securities or cash. Index returns assume reinvestment of dividends and interest, but unlike Fund returns, do not reflect fees or expenses. It is not possible to invest directly in an index. |
Montgomery Street Income Securities, Inc.
Portfolio Manager Review (Unaudited)
U.S. Treasury Bond Yield Curve (Unaudited)
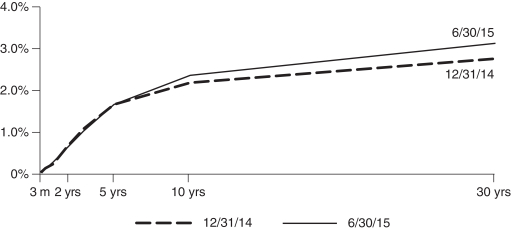
Source: Bloomberg
Performance is historical and does not guarantee future results.
Fund Performance
Given its primary focus on income generation, the Fund remained overweight investment grade credit relative to the benchmark throughout the six-month period. Security and sector selection, primarily among financials and industrials, contributed to performance despite general spread widening within the investment grade credit sector. Within that sector, the Fund focused on BBB-rated securities, while the benchmark focuses on AA-rated securities. An 11% tactical allocation to high yield credit (BBB- or below), which is outside the benchmark, added to returns, as this sector continued to post strong relative gains. The yield to maturity for the Fund as of period end was 3.31%, versus 2.39% for the benchmark. From an interest rate positioning standpoint, the Fund was focused on intermediate and longer-dated maturities and was underweight the short end of the curve, which detracted from returns as long-term rates rose faster than short-term rates for most developed countries over the period. Currency positioning was positive for performance, as the Fund was positioned long U.S. Dollar versus the Euro and Yen, and these currencies depreciated over the period, in light of diverging monetary policies. An overweight to emerging markets (“EM”) debt, specifically quasi-sovereign and corporate bonds, contributed to returns year-to-date as spreads tightened. An out-of-benchmark allocation to non-Agency mortgage backed securities (“MBS”), included in “Other” in the sector distribution table on the following page, added to returns, as prices continued to appreciate in line with the ongoing housing recovery. An underweight to Agency MBS, however, more than offset this positive impact, as the sector posted positive performance for the period.
Montgomery Street Income Securities, Inc.
Portfolio Manager Review (Unaudited)
As seen in the sector distribution table below, as of period end, the investment concentration differences relative to the benchmark included an overweight to investment grade credit and EM, and an out-of-index exposure to the high yield sector and non dollar securities.
Sector Distribution (Unaudited)
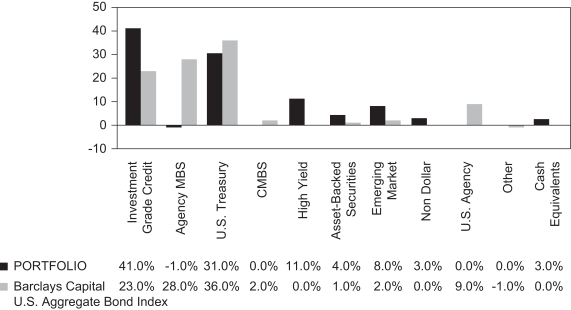
As of June 30, 2015.
Sector distribution is subject to change.
Percentages are based on total investments, which include the market value of derivative instruments.
Derivatives were used in the Fund and were instrumental in attaining specific exposures targeted to gain from anticipated market developments. The Fund’s exposure to U.S. interest rates, which was negative for returns as long-term rates sold off, was partly facilitated through the use of interest rate swaps. A currency long U.S. Dollar view against the Euro and Yen was implemented by the use of currency forwards, which was positive for returns. In addition, the Fund gained exposure to the EURO STOXX 50 Index through the use of options, which contributed to performance as the index posted positive returns.
Montgomery Street Income Securities, Inc.
Portfolio Manager Review (Unaudited)
Outlook
The cumulative benefits of global monetary policy accommodation and a near cessation of fiscal austerity will allow the gradual healing of global economic growth to continue. Importantly, PIMCO’s expectations for moderate growth, low energy prices and a still strong U.S. Dollar suggest inflationary pressures will build only gradually, allowing the Fed to begin reducing its policy accommodation later this year at a very measured pace. Across the globe, an accommodative ECB should support modest growth in the Eurozone, but uncertainty around Greece remains. That said, differentiation among EM economies may become more pronounced as a result of commodity price declines and impending normalization of Fed policy.
This material contains the current opinions of the portfolio manager only through the end of the period of the report as stated on the cover. Such opinions are subject to change without notice and should not be construed as a recommendation.
The Fund may not be suitable for all investors and investment in the Fund involves risk. The Fund may be affected by risks that include specific issuer credit risk, sector concentration risk, market capitalization risk and international investing risk. The Fund invests in individual bonds whose yields and value fluctuate so that an investment in the Fund may be worth more or less than its original cost. Bond investments are subject to interest rate risk such that when interest rates rise, the price of the bonds, and thus the value of the Fund, can decline and the investor can lose principal value. The Fund’s investments are also subject to credit risk and liquidity risk. Additionally, investing in foreign securities presents certain unique risks not associated with domestic investments, such as currency fluctuation, political and economic changes, and market risks. Derivative investments are subject to a number of risks such as liquidity risk, regulatory risk, interest rate risk, market risk, leverage risk, counterparty risk, valuation risk, correlation or basis risk, credit risk and management risk. Emerging markets investments may involve greater risk resulting from; less developed and stable economic and political systems, restrictions on investment by foreigners, liquidity and price volatility, exchange controls, confiscations of private property and other government restrictions, security registration, settlement and custody issues. High-yield bonds, lower-rated bonds and unrated securities are typically more sensitive to adverse economic or political changes or individual developments specific to the issuer, which may result in higher default risk, volatility, lower interest income and market values. Mortgage-related and other asset-backed securities include interest rate risk, legal and documentation risk, extension or contraction/prepayment risk making them more sensitive to change in interest rates. All of these factors may result in greater share price volatility. Closed-end funds, unlike open-end funds, are not continuously offered or redeemed and often trade at a discount to their net asset value.
NOT FDIC/NCUA INSURED. NO BANK GUARANTEE. MAY LOSE VALUE. NOT A DEPOSIT.
NOT INSURED BY ANY FEDERAL GOVERNMENT AGENCY.
Past performance is no guarantee of future results.
This report is sent to stockholders of Montgomery Street Income Securities, Inc., for their information. It is not a prospectus, circular or representation intended for use in the purchase or sale of shares of the Fund or of any securities mentioned in the report.
Montgomery Street Income Securities, Inc. (Unaudited)
Other Information
June 30, 2015
Market Price and Net Asset Value
The Fund’s market price was $16.39 as of June 30, 2015, compared with $16.44 as of December 31, 2014. The Fund’s shares traded at an 8.74% discount to NAV of $17.96 at June 30, 2015, compared to an 8.51% discount to NAV of $17.97 at December 31, 2014. Shares of closed-end funds frequently trade at a discount to NAV. The price of the Fund’s shares is determined by a number of factors, several of which are beyond the control of Fund management. The Fund, therefore, cannot predict whether its shares will trade at, below or above its NAV.
The Fund’s market price is published daily in The New York Times and on The Wall Street Journal’s website at www.wsj.com. The Fund’s NAV is available daily on its website at www.montgomerystreetincome.com and published weekly in Barron’s.
Dividends Paid
The Fund paid dividends of $0.15 per share on May 14, 2015 and August 10, 2015.
Dividend Reinvestment and Cash Purchase Option
The Fund maintains an optional Dividend Reinvestment and Cash Purchase Plan (“Plan”) for the automatic reinvestment of your dividends and capital gain distributions in shares of the Fund. Stockholders who participate in the Plan also can purchase additional shares of the Fund through the Plan’s voluntary cash investment feature. We recommend that you consider enrolling in the Plan to build your investment. The Plan’s features, including the voluntary cash investment feature, are described on page 40 of this report.
Limited Share Repurchases
The Fund is authorized to repurchase a limited number of shares of the Fund’s common stock from time to time when the shares are trading at less than 95% of their NAV. Repurchases are limited to a number of shares each calendar quarter approximately equal to the number of new shares issued under the Plan with respect to income distributed for the second preceding calendar quarter. There were 3,000 shares repurchased in the first quarter of 2015 and 6,000 shares repurchased in the second quarter of 2015. During the third quarter of 2015, 3,000 shares are expected to be repurchased.
Investment Portfolio
Following the Fund’s first and third quarter ends, a complete Investment Portfolio is filed with the U.S. Securities and Exchange Commission (“SEC”) on Form N-Q. The form is available in the “Financial Reports” tab on the Fund’s website at www.montgomerystreetincome.com, or on the SEC’s website at www.sec.gov, and it also may be reviewed and copied at the SEC’s Public Reference Room in Washington, DC. Information on the operation of the SEC’s Public Reference Room may be obtained by calling (800) SEC-0330.
Proxy Voting
Information about how the Fund voted any proxies related to its portfolio securities during the twelve-month period ended June 30, 2015 is available in the “Financial Reports” tab on the Fund’s website at www.montgomerystreetincome.com or on the SEC’s website at www.sec.gov. A description of the policies that the Fund uses to determine how to vote proxies relating to portfolio securities is available without charge, upon request, by calling (877) 437-3938 or on the SEC’s website at www.sec.gov.
Under the Fund’s current policy, it is the intention of the Fund to invest exclusively in non-voting securities. Under normal circumstances, the Fund does not intend to hold voting securities. In the event that the Fund does come into possession of any voting securities, the Fund intends to dispose of such securities as soon as it is reasonably practicable and prudent to do so. The Fund’s Board of Directors (the “Board”) may change this policy at any time.
Montgomery Street Income Securities, Inc. (Unaudited)
Other Information
June 30, 2015
Reports to Stockholders
The Fund’s annual and semiannual reports to stockholders will be mailed to stockholders, and also are available in the “Financial Reports” tab on the Fund’s website at www.montgomerystreetincome.com or by calling (877) 437-3938. Those stockholders who wish to view the Fund’s complete Investment Portfolio for the first and third quarters may view the Fund’s Form N-Q, as described above in “Investment Portfolio.”
Change in Fund Administrator and Fund Officers
Atlantic Fund Administration, LLC (“Atlantic”) was appointed as the Fund’s new Administrator effective close of business July 31, 2015. In conjunction with the change in Administrator, the following persons were appointed as officers of the Fund: Stacey E. Hong, President and Chief Executive Officer; Michael J. McKeen, Chief Financial Officer; Dennis Mason, Chief Compliance Officer; Gino Malaspina, Chief Legal Officer; Zachary Tackett, Secretary; Timothy Bowden, Vice President; Geoffrey Ney, Vice President; and Wendell Scott, Vice President, effective close of business July 31, 2015. Each of the Fund officers are affiliated with Atlantic.
Investment Objectives
The primary investment objective of the Fund is to seek as high a level of current income as is consistent with prudent investment risks, from a diversified portfolio primarily comprised of debt securities. Capital appreciation is a secondary objective. The investment objectives of the Fund may be changed by the Board without stockholder approval. There can be no assurance that the investment objectives of the Fund will be attained. More information on the Fund’s investment objectives, policies, restrictions and strategies is available at http://www.montgomerystreetincome.com, under “Investment Objectives and Strategies” and the annual reports subsequent to 2010 under “Financial Reports.”
Montgomery Street Income Securities, Inc. (Unaudited)
Investment Portfolio
June 30, 2015
| | | | | | | | |
| | | Principal
Amount ($)† | | | Value ($) | |
| | | | | | | |
Corporate Bonds 62.3% | | | | | | | | |
| | |
Consumer Discretionary 6.0% | | | | | | | | |
Amazon.com Inc., 2.60%, 12/05/19 | | | 600,000 | | | | 603,276 | |
Cablevision Systems Corp. Term Loan B, 2.69%, 04/09/20 (a) | | | 99,400 | | | | 98,257 | |
Charter Communications Operating LLC Term Loan, 3.00%, 03/08/20 (a) | | | 897,462 | | | | 886,620 | |
COX Communications Inc., 6.25%, 06/01/18 (b) | | | 263,000 | | | | 292,201 | |
CSC Holdings LLC, 8.63%, 02/15/19 | | | 2,000,000 | | | | 2,280,000 | |
Harrah’s Operating Co. Inc., 11.25%, 06/01/17 (c) (d) | | | 350,000 | | | | 274,750 | |
Hilton Worldwide Finance LLC Term Loan B, 3.50%, 09/23/20 (a) | | | 1,353,546 | | | | 1,353,763 | |
MGM Resorts International, 8.63%, 02/01/19 | | | 325,000 | | | | 367,250 | |
NBCUniversal Media LLC, 2.88%, 04/01/16 | | | 300,000 | | | | 304,608 | |
Nissan Motor Acceptance Corp., 2.65%, 09/26/18 (b) | | | 400,000 | | | | 410,026 | |
TCI Communications Inc., 8.75%, 08/01/15 | | | 35,000 | | | | 35,240 | |
Time Warner Cable Inc., 8.75%, 02/14/19 | | | 100,000 | | | | 118,692 | |
Time Warner Cable Inc., 8.25%, 04/01/19 | | | 140,000 | | | | 164,547 | |
Venetian Casino Resort LLC Term Loan, 3.25%, 12/16/20 (a) | | | 2,084,133 | | | | 2,072,920 | |
Viacom Inc., 4.25%, 09/15/15 | | | 200,000 | | | | 201,475 | |
Wynn Las Vegas LLC, 5.38%, 03/15/22 | | | 500,000 | | | | 509,375 | |
Wynn Las Vegas LLC, 5.50%, 03/01/25 (b) | | | 850,000 | | | | 809,625 | |
Wynn Macau Ltd., 5.25%, 10/15/21 (b) | | | 500,000 | | | | 472,500 | |
| | | | | | | | |
| | |
| | | | | | | 11,255,125 | |
| | |
Consumer Staples 1.6% | | | | | | | | |
Altria Group Inc., 9.25%, 08/06/19 (e) | | | 111,000 | | | | 139,386 | |
ConAgra Foods Inc., 1.90%, 01/25/18 | | | 800,000 | | | | 787,715 | |
Kraft Foods Group Inc., 2.25%, 06/05/17 | | | 600,000 | | | | 608,096 | |
Kraft Foods Group Inc., 5.38%, 02/10/20 | | | 268,000 | | | | 298,898 | |
Reynolds American Inc., 1.05%, 10/30/15 | | | 950,000 | | | | 946,742 | |
Reynolds American Inc., 4.45%, 06/12/25 | | | 200,000 | | | | 204,261 | |
| | | | | | | | |
| | |
| | | | | | | 2,985,098 | |
| | |
Energy 10.3% | | | | | | | | |
AK Transneft OJSC Via TransCapitalInvest Ltd., 8.70%, 08/07/18 | | | 1,200,000 | | | | 1,311,300 | |
Anadarko Petroleum Corp., 6.45%, 09/15/36 | | | 800,000 | | | | 920,473 | |
California Resources Corp., 5.00%, 01/15/20 | | | 200,000 | | | | 176,000 | |
Canadian Oil Sands Ltd., 7.75%, 05/15/19 (b) | | | 400,000 | | | | 434,774 | |
Canadian Oil Sands Ltd., 4.50%, 04/01/22 (b) | | | 1,000,000 | | | | 929,312 | |
CNPC General Capital Ltd., 1.18%, 05/14/17 (a) (b) | | | 600,000 | | | | 599,074 | |
Dolphin Energy Ltd., 5.50%, 12/15/21 (b) | | | 800,000 | | | | 906,179 | |
El Paso Pipeline Partners Operating Co. LLC, 6.50%, 04/01/20 | | | 1,000,000 | | | | 1,137,784 | |
Energy Future Intermediate Holding Company LLC Term Loan, 4.25%, 04/28/16 (a) | | | 1,742,057 | | | | 1,741,325 | |
Energy Transfer Partners LP, 4.05%, 03/15/25 | | | 600,000 | | | | 565,843 | |
Enterprise Products Operating LLC, 2.55%, 10/15/19 | | | 900,000 | | | | 899,032 | |
MarkWest Energy Partners LP, 5.50%, 02/15/23 | | | 500,000 | | | | 515,000 | |
MarkWest Energy Partners LP, 4.50%, 07/15/23 | | | 200,000 | | | | 196,000 | |
Midcontinent Express Pipeline LLC, 6.70%, 09/15/19 (b) | | | 400,000 | | | | 433,698 | |
Petrobras Global Finance BV, 2.64%, 03/17/17 (a) | | | 800,000 | | | | 783,360 | |
Petrobras Global Finance BV, 3.16%, 03/17/20 (a) | | | 600,000 | | | | 571,500 | |
Petrobras Global Finance BV, 4.38%, 05/20/23 | | | 700,000 | | | | 610,190 | |
Petrobras International Finance Co., 7.88%, 03/15/19 | | | 300,000 | | | | 318,579 | |
Pioneer Natural Resources Co., 6.88%, 05/01/18 | | | 1,300,000 | | | | 1,458,956 | |
Pioneer Natural Resources Co., 7.20%, 01/15/28 | | | 200,000 | | | | 246,061 | |
Plains All American Pipeline LP, 8.75%, 05/01/19 | | | 1,000,000 | | | | 1,220,232 | |
Ras Laffan Liquefied Natural Gas Co. Ltd. III, 5.30%, 09/30/20 | | | 572,700 | | | | 617,084 | |
Rosneft Finance SA, 7.88%, 03/13/18 | | | 500,000 | | | | 522,500 | |
Sabine Pass Liquefaction LLC, 5.75%, 05/15/24 | | | 600,000 | | | | 597,750 | |
Sinopec Group Overseas Development Ltd., 1.05%, 04/10/17 (a) (b) | | | 900,000 | | | | 898,888 | |
Targa Resources Partners LP, 5.25%, 05/01/23 | | | 400,000 | | | | 396,000 | |
Transcontinental Gas Pipe Line Co. LLC, 6.40%, 04/15/16 | | | 250,000 | | | | 260,205 | |
| | | | | | | | |
| | |
| | | | | | | 19,267,099 | |
The accompanying notes are an integral part of the financial statements.
Montgomery Street Income Securities, Inc. (Unaudited)
Investment Portfolio
June 30, 2015
| | | | | | | | |
| | | Principal
Amount ($)† | | | Value ($) | |
| | | | | | | |
| | |
Financials 30.4% | | | | | | | | |
Ally Financial Inc., 3.50%, 01/27/19 | | | 800,000 | | | | 794,000 | |
American Tower Corp., 3.40%, 02/15/19 | | | 300,000 | | | | 306,792 | |
American Tower Corp., 2.80%, 06/01/20 | | | 300,000 | | | | 295,568 | |
American Tower Corp., 4.00%, 06/01/25 | | | 200,000 | | | | 194,709 | |
ARC Properties Operating Partnership LP, 2.00%, 02/06/17 | | | 400,000 | | | | 388,000 | |
Asciano Finance Ltd., 5.00%, 04/07/18 | | | 300,000 | | | | 321,354 | |
Banco do Brasil SA, 6.25% (callable at 100 beginning 04/15/24) (b) (f) (g) | | | 500,000 | | | | 351,875 | |
Banco Santander Chile, 3.75%, 09/22/15 (b) | | | 500,000 | | | | 501,879 | |
Bank of America Corp., 6.00%, 09/01/17 | | | 115,000 | | | | 125,017 | |
Bank of America Corp., 2.65%, 04/01/19 | | | 800,000 | | | | 808,915 | |
Bank of America NA, 0.70%, 05/08/17 (a) | | | 600,000 | | | | 599,084 | |
Barclays Bank Plc, 10.18%, 06/12/21 (b) | | | 1,400,000 | | | | 1,854,859 | |
Barclays Bank Plc, 7.63%, 11/21/22 | | | 300,000 | | | | 341,640 | |
BAT International Finance Plc, 1.85%, 06/15/18 (h) (i) | | | 1,800,000 | | | | 1,803,346 | |
BBVA Bancomer SA, 4.50%, 03/10/16 (b) | | | 500,000 | | | | 510,500 | |
BBVA Bancomer SA, 6.50%, 03/10/21 (b) | | | 250,000 | | | | 270,000 | |
BNP Paribas, 7.78% (callable at 100 beginning 07/02/18) (f) (g), EUR | | | 300,000 | | | | 384,892 | |
BPCE SA, 4.63%, 07/11/24 (b) | | | 200,000 | | | | 195,313 | |
Cantor Fitzgerald LP, 6.50%, 06/17/22 (h) (i) | | | 300,000 | | | | 309,122 | |
CBA Capital Trust II, 6.02% (callable at 100 beginning 03/15/16) (b) (f) (g) | | | 200,000 | | | | 204,000 | |
Citigroup Inc., 0.67%, 05/31/17 (a), EUR | | | 800,000 | | | | 885,193 | |
Cooperatieve Centrale Raiffeisen-Boerenleenbank BA, 8.38% (callable at 100 beginning 07/26/16) (f) (g) | | | 800,000 | | | | 835,899 | |
Cooperatieve Centrale Raiffeisen-Boerenleenbank BA, 11.00% (callable at 100 beginning
06/30/19) (b) (f) (g) | | | 1,000,000 | | | | 1,267,500 | |
Credit Agricole SA, 7.88% (callable at 100 beginning 01/23/24) (f) (g) | | | 200,000 | | | | 204,432 | |
Credit Suisse AG, 6.50%, 08/08/23 (b) | | | 450,000 | | | | 492,125 | |
Credit Suisse AG, 5.75%, 09/18/25, EUR | | | 300,000 | | | | 371,172 | |
Daimler Finance North America LLC, 3.00%, 03/28/16 (b) | | | 300,000 | | | | 304,817 | |
Daimler Finance North America LLC, 3.88%, 09/15/21 (b) | | | 200,000 | | | | 211,427 | |
Export-Import Bank of Korea, 4.00%, 01/11/17 | | | 2,700,000 | | | | 2,805,508 | |
Export-Import Bank of Korea, 4.00%, 01/29/21 | | | 200,000 | | | | 212,747 | |
Ford Motor Credit Co. LLC, 5.63%, 09/15/15 | | | 2,000,000 | | | | 2,018,158 | |
Ford Motor Credit Co. LLC, 3.98%, 06/15/16 | | | 500,000 | | | | 511,649 | |
General Motors Financial Co. Inc., 3.45%, 04/10/22 | | | 700,000 | | | | 684,439 | |
Goldman Sachs Group Inc., 5.95%, 01/18/18 | | | 650,000 | | | | 714,216 | |
Goldman Sachs Group Inc., 6.15%, 04/01/18 | | | 600,000 | | | | 666,809 | |
Goldman Sachs Group Inc., 6.00%, 06/15/20 | | | 2,000,000 | | | | 2,283,862 | |
HBOS Plc, 6.75%, 05/21/18 (b) | | | 700,000 | | | | 775,743 | |
Host Hotels & Resorts LP, 6.00%, 11/01/20 | | | 450,000 | | | | 468,601 | |
HSBC Finance Corp., 6.68%, 01/15/21 | | | 300,000 | | | | 346,752 | |
HSBC Holdings Plc, 5.25% (callable at 100 beginning 09/16/22) (f) (g) (j), EUR | | | 1,800,000 | | | | 2,004,426 | |
ICICI Bank Ltd., 4.75%, 11/25/16 (b) | | | 300,000 | | | | 311,775 | |
International Lease Finance Corp., 7.13%, 09/01/18 (b) | | | 1,700,000 | | | | 1,895,500 | |
Intesa Sanpaolo SpA, 3.13%, 01/15/16 | | | 200,000 | | | | 201,525 | |
IPIC GMTN Ltd., 5.88%, 03/14/21, EUR | | | 200,000 | | | | 275,145 | |
JPMorgan Chase & Co., 5.30% (callable at 100 beginning 05/01/20) (f) (g) | | | 350,000 | | | | 347,410 | |
JPMorgan Chase & Co., 6.10% (callable at 100 beginning 10/01/24) (f) (g) | | | 700,000 | | | | 702,450 | |
JPMorgan Chase & Co., 6.30%, 04/23/19 | | | 2,500,000 | | | | 2,862,132 | |
JPMorgan Chase Bank NA, 6.00%, 10/01/17 | | | 600,000 | | | | 654,103 | |
Korea Exchange Bank, 3.13%, 06/26/17 (b) | | | 400,000 | | | | 410,356 | |
Lazard Group LLC, 6.85%, 06/15/17 | | | 90,000 | | | | 98,304 | |
LBG Capital No.2 Plc, 15.00%, 12/21/19 (j), GBP | | | 100,000 | | | | 223,116 | |
LeasePlan Corp NV, 3.00%, 10/23/17 (h) (i) | | | 500,000 | | | | 510,296 | |
Lloyds Bank Plc, 2.40%, 03/17/20 | | | 400,000 | | | | 398,558 | |
Lloyds Banking Group Plc, 7.50% (callable at 100 beginning 06/27/24) (f) (g) | | | 477,000 | | | | 491,310 | |
Merrill Lynch & Co. Inc., 6.88%, 04/25/18 | | | 2,400,000 | | | | 2,709,917 | |
The accompanying notes are an integral part of the financial statements.
Montgomery Street Income Securities, Inc. (Unaudited)
Investment Portfolio
June 30, 2015
| | | | | | | | |
| | | Principal
Amount ($)† | | | Value ($) | |
| | | | | | | |
Morgan Stanley, 6.63%, 04/01/18 | | | 900,000 | | | | 1,009,369 | |
Morgan Stanley, 7.30%, 05/13/19 | | | 800,000 | | | | 940,550 | |
Morgan Stanley, 5.50%, 01/26/20 | | | 2,850,000 | | | | 3,178,049 | |
Novo Banco SA, 5.00%, 04/23/19, EUR | | | 300,000 | | | | 339,492 | |
Sberbank of Russia Via SB Capital SA, 5.50%, 07/07/15 | | | 400,000 | | | | 400,115 | |
Sberbank Via SB Capital SA, 5.40%, 03/24/17 | | | 600,000 | | | | 605,250 | |
Shell International Finance BV, 2.13%, 05/11/20 | | | 200,000 | | | | 199,528 | |
Shinhan Bank, 4.13%, 10/04/16 (b) | | | 200,000 | | | | 206,948 | |
SLM Corp., 8.45%, 06/15/18 | | | 500,000 | | | | 555,650 | |
SLM Corp., 5.50%, 01/15/19 | | | 200,000 | | | | 203,924 | |
Springleaf Finance Corp., 6.90%, 12/15/17 | | | 500,000 | | | | 530,000 | |
Standard Chartered Plc, 6.50% (callable at 100 beginning 04/02/20) (b) (f) (g) (j) | | | 500,000 | | | | 504,313 | |
Sumitomo Mitsui Financial Group Inc., 4.44%, 04/02/24 (b) | | | 350,000 | | | | 356,988 | |
Sydney Airport Finance Co. Pty Ltd., 5.13%, 02/22/21 (b) (e) | | | 2,100,000 | | | | 2,331,682 | |
Synchrony Financial, 1.51%, 02/03/20 (a) | | | 250,000 | | | | 251,101 | |
Synchrony Financial, 2.70%, 02/03/20 | | | 100,000 | | | | 98,699 | |
UBS AG, 7.63%, 08/17/22 | | | 1,800,000 | | | | 2,107,357 | |
UBS AG Stamford, 5.88%, 12/20/17 | | | 175,000 | | | | 192,485 | |
USB Capital IX, 3.50% (callable at 100 beginning 08/24/15) (a) (f) | | | 625,000 | | | | 515,937 | |
Ventas Realty LP, 3.13%, 11/30/15 | | | 100,000 | | | | 100,806 | |
Weyerhaeuser Co., 7.38%, 10/01/19 | | | 1,000,000 | | | | 1,182,864 | |
| | | | | | | | |
| | |
| | | | | | | 56,529,344 | |
| | |
Health Care 2.1% | | | | | | | | |
Actavis Funding SCS, 1.37%, 03/12/18 (a) | | | 1,900,000 | | | | 1,907,955 | |
HCA Inc., 6.50%, 02/15/20 | | | 1,700,000 | | | | 1,899,750 | |
Zimmer Holdings Inc., 3.55%, 04/01/25 | | | 100,000 | | | | 96,785 | |
| | | | | | | | |
| | |
| | | | | | | 3,904,490 | |
| | |
Industrials 1.5% | | | | | | | | |
Aviation Capital Group Corp., 7.13%, 10/15/20 (b) | | | 600,000 | | | | 698,113 | |
AWAS Aviation Capital Ltd., 7.00%, 10/17/16 (b) (k) | | | 568,000 | | | | 575,100 | |
Masco Corp., 6.13%, 10/03/16 | | | 300,000 | | | | 315,750 | |
Masco Corp., 5.85%, 03/15/17 | | | 450,000 | | | | 477,000 | |
Masco Corp., 6.63%, 04/15/18 | | | 400,000 | | | | 438,000 | |
Odebrecht Offshore Drilling Finance Ltd., 6.75%, 10/01/22 (b) (k) | | | 183,820 | | | | 131,891 | |
Odebrecht Offshore Drilling Finance Ltd., 6.63%, 10/01/23 (b) | | | 189,580 | | | | 129,862 | |
| | | | | | | | |
| | |
| | | | | | | 2,765,716 | |
| | |
Information Technology 2.6% | | | | | | | | |
Activision Blizzard Inc. Term Loan B, 3.25%, 09/15/20 (a) | | | 74,750 | | | | 74,916 | |
Alibaba Group Holding Ltd., 2.50%, 11/28/19 (b) | | | 1,300,000 | | | | 1,284,768 | |
Avago Technologies Ltd. Term Loan B, 3.75%, 04/01/21 (a) | | | 863,175 | | | | 863,943 | |
Baidu Inc., 2.75%, 06/09/19 | | | 400,000 | | | | 399,909 | |
Dell Inc. Term Loan B, 3.75%, 09/24/18 (a) | | | 814,568 | | | | 813,640 | |
Sensata Technologies BV Term Loan, 3.00%, 10/14/21 (a) | | | 497,500 | | | | 498,301 | |
Tencent Holdings Ltd., 3.38%, 05/02/19 (b) | | | 900,000 | | | | 923,401 | |
| | | | | | | | |
| | |
| | | | | | | 4,858,878 | |
| | |
Materials 1.2% | | | | | | | | |
ALROSA Finance SA, 7.75%, 11/03/20 (b) | | | 300,000 | | | | 313,500 | |
Georgia-Pacific LLC, 5.40%, 11/01/20 (b) | | | 1,600,000 | | | | 1,784,413 | |
West Fraser Timber Co. Ltd., 4.35%, 10/15/24 (h) (i) | | | 100,000 | | | | 95,035 | |
WR Grace and Co. Term Loan, 2.75%, 02/03/21 (a) | | | 73,208 | | | | 72,998 | |
WR Grace and Co. Term Loan, 2.75%, 02/03/21 (a) | | | 26,356 | | | | 26,281 | |
| | | | | | | | |
| | |
| | | | | | | 2,292,227 | |
The accompanying notes are an integral part of the financial statements.
Montgomery Street Income Securities, Inc. (Unaudited)
Investment Portfolio
June 30, 2015
| | | | | | | | |
| | | Principal
Amount ($)† | | | Value ($) | |
| | | | | | | |
| | |
Telecommunication Services 4.7% | | | | | | | | |
AT&T Inc., 0.70%, 03/30/17 (a) | | | 500,000 | | | | 498,274 | |
Crown Castle International Co. New Term Loan B, 3.00%, 01/31/21 (a) | | | 1,388,684 | | | | 1,379,755 | |
Crown Castle International Corp., 5.25%, 01/15/23 | | | 500,000 | | | | 503,625 | |
Orange SA, 2.13%, 09/16/15 | | | 600,000 | | | | 601,418 | |
Qtel International Finance Ltd., 4.75%, 02/16/21 (b) | | | 300,000 | | | | 325,013 | |
Telecom Italia Capital SA, 7.00%, 06/04/18 | | | 100,000 | | | | 110,120 | |
Telecom Italia SpA, 7.38%, 12/15/17, GBP | | | 650,000 | | | | 1,122,268 | |
Telecom Italia SpA, 6.38%, 06/24/19, GBP | | | 300,000 | | | | 510,614 | |
Verizon Communications Inc., 1.82%, 09/15/16 (a) | | | 700,000 | | | | 708,614 | |
Verizon Communications Inc., 2.63%, 02/21/20 | | | 1,900,000 | | | | 1,894,119 | |
Verizon Communications Inc., 4.50%, 09/15/20 | | | 900,000 | | | | 969,977 | |
Verizon Communications Inc., 3.50%, 11/01/21 | | | 100,000 | | | | 101,151 | |
| | | | | | | | |
| | |
| | | | | | | 8,724,948 | |
| | |
Utilities 1.9% | | | | | | | | |
Duquesne Light Holdings Inc., 6.40%, 09/15/20 (b) | | | 400,000 | | | | 463,040 | |
Dynegy Inc., 6.75%, 11/01/19 (b) | | | 250,000 | | | | 260,125 | |
Entergy Corp., 4.00%, 07/15/22 | | | 300,000 | | | | 301,967 | |
Florida Power Corp., 5.80%, 09/15/17 | | | 195,000 | | | | 213,439 | |
Korea East-West Power Co. Ltd., 2.50%, 07/16/17 (b) | | | 1,400,000 | | | | 1,420,352 | |
NRG Energy Inc Term Loan, 2.75%, 07/01/18 (a) | | | 596,053 | | | | 590,885 | |
Saudi Electricity Global Sukuk Co. 2, 5.06%, 04/08/43 (b) | | | 200,000 | | | | 198,000 | |
| | | | | | | | |
| | |
| | | | | | | 3,447,808 | |
| |
Total Corporate Bonds (cost $113,160,096) | | | | | | | 116,030,733 | |
Non-U.S. Government Agency Asset-Backed Securities 4.8% | | | | | | | | |
| | |
Aegis Asset Backed Securities Trust REMIC, (2005, 3, M1), 0.66%, 08/25/35 (a) | | | 671,092 | | | | 665,230 | |
American Airlines Pass-Through Trust, (2013, 2, A), 4.95%, 01/15/23 | | | 366,336 | | | | 387,858 | |
Banc of America Funding Trust REMIC, (2004, A, 1A3), 2.62%, 09/20/34 (a) | | | 210,188 | | | | 208,325 | |
Banc of America Mortgage Securities Inc. REMIC, (2005, H, 2A5), 2.69%, 09/25/35 (a) | | | 631,456 | | | | 577,715 | |
Bayview Commercial Asset Trust, Interest Only REMIC, (2007, 4A, IO), 3.49%, 09/25/37 (a) (b) | | | 3,082,686 | | | | 91,897 | |
Bear Stearns Adjustable Rate Mortgage Trust REMIC, (2004, 6, 2A1), 2.74%, 09/25/34 (a) | | | 443,228 | | | | 425,553 | |
Cavalry CLO Ltd., (2014, 5A, A), 1.53%, 01/16/24 (a) (b) | | | 250,000 | | | | 249,416 | |
Citigroup Mortgage Loan Trust Inc. REMIC, (2004, NCM2, 1CB2), 6.75%, 08/25/34 | | | 105,959 | | | | 116,410 | |
Continental Airlines Inc. Pass-Through Trust, (2009, 1, A), 9.00%, 07/08/16 | | | 1,429,479 | | | | 1,522,395 | |
Credit Suisse First Boston Mortgage Securities Corp. REMIC, (2004, AR8, 2A1), 2.48%, 09/25/34 (a) | | | 553,695 | | | | 549,994 | |
Credit-Based Asset Servicing and Securitization LLC REMIC, (2006, SC1, A), 0.46%, 05/25/36 (a) (b) | | | 41,151 | | | | 39,524 | |
IndyMac INDX Mortgage Loan Trust REMIC, (2005, AR14, 2A1A), 0.49%, 07/25/35 (a) | | | 49,427 | | | | 43,855 | |
Inwood Park CDO Ltd., (2006, 1A, A1A), 0.50%, 01/20/21 (a) (b) | | | 60,128 | | | | 60,039 | |
Nationstar NIM Ltd. Trust, (2007, A, A), 9.79%, 03/25/37 (c) (d) | | | 22,008 | | | | — | |
Truman Capital Mortgage Loan Trust REMIC, (2006, 1, A), 0.45%, 03/25/36 (a) (b) | | | 1,080,246 | | | | 986,381 | |
United Air Lines Inc. Pass-Through Trust, (2009, 1A, O), 10.40%, 11/01/16 | | | 501,340 | | | | 545,834 | |
Voya CLO Ltd., (2012, 2, AR), 1.58%, 10/15/22 (a) (b) | | | 350,000 | | | | 349,497 | |
Voya CLO Ltd., (2012, 3, AR), 1.61%, 10/15/22 (a) (b) | | | 500,000 | | | | 499,559 | |
Washington Mutual Mortgage Pass-Through Certificates REMIC, (2005, AR16, 1A3), 2.34%,
12/25/35 (a) | | | 951,126 | | | | 899,803 | |
Washington Mutual Mortgage Pass-Through Certificates REMIC, (2006, 5, 2CB1), 6.00%, 07/25/36 | | | 970,717 | | | | 764,961 | |
| |
Total Non-U.S. Government Agency Asset-Backed Securities (cost $8,711,830) | | | | | | | 8,984,246 | |
Government and Agency Obligations 36.5% | | | | | | | | |
| | |
Government Securities 36.5% | | | | | | | | |
| | |
Municipals 0.3% | | | | | | | | |
California Earthquake Authority, 2.81%, 07/01/19 | | | 500,000 | | | | 511,585 | |
| | |
Sovereign 2.1% | | | | | | | | |
Australia Government Bond, 5.50%, 04/21/23, AUD | | | 386,000 | | | | 354,175 | |
Brazil Notas do Tesouro Nacional, 10.00%, 01/01/21, BRL | | | 4,730,000 | | | | 1,368,548 | |
Brazil Notas do Tesouro Nacional, 10.00%, 01/01/23, BRL | | | 190,000 | | | | 53,843 | |
Brazil Notas do Tesouro Nacional, 10.00%, 01/01/25, BRL | | | 3,810,000 | | | | 1,060,479 | |
Hellenic Republic Government Bond, 3.00%, 02/24/23 (k), EUR | | | 25,000 | | | | 12,291 | |
The accompanying notes are an integral part of the financial statements.
Montgomery Street Income Securities, Inc. (Unaudited)
Investment Portfolio
June 30, 2015
| | | | | | | | |
| | | Shares/Contracts
Principal
Amount ($)† | | | Value ($) | |
| | | | | | | |
Hellenic Republic Government Bond, 3.00%, 02/24/24 (k), EUR | | | 25,000 | | | | 11,824 | |
Hellenic Republic Government Bond, 3.00%, 02/24/25 (k), EUR | | | 25,000 | | | | 11,578 | |
Hellenic Republic Government Bond, 3.00%, 02/24/26 (k), EUR | | | 25,000 | | | | 11,142 | |
Hellenic Republic Government Bond, 3.00%, 02/24/27 (k), EUR | | | 25,000 | | | | 10,988 | |
Hellenic Republic Government Bond, 3.00%, 02/24/28 (k), EUR | | | 25,000 | | | | 11,114 | |
Hellenic Republic Government Bond, 3.00%, 02/24/29 (k), EUR | | | 25,000 | | | | 10,931 | |
Hellenic Republic Government Bond, 3.00%, 02/24/30 (k), EUR | | | 25,000 | | | | 10,897 | |
Hellenic Republic Government Bond, 3.00%, 02/24/31 (k), EUR | | | 25,000 | | | | 10,874 | |
Hellenic Republic Government Bond, 3.00%, 02/24/32 (k), EUR | | | 25,000 | | | | 10,701 | |
Hellenic Republic Government Bond, 3.00%, 02/24/33 (k), EUR | | | 25,000 | | | | 10,416 | |
Hellenic Republic Government Bond, 3.00%, 02/24/34 (k), EUR | | | 25,000 | | | | 10,667 | |
Hellenic Republic Government Bond, 3.00%, 02/24/35 (k), EUR | | | 25,000 | | | | 10,441 | |
Hellenic Republic Government Bond, 3.00%, 02/24/36 (k), EUR | | | 325,000 | | | | 137,383 | |
Hellenic Republic Government Bond, 3.00%, 02/24/37 (k), EUR | | | 25,000 | | | | 10,705 | |
Hellenic Republic Government Bond, 3.00%, 02/24/38 (k), EUR | | | 25,000 | | | | 10,680 | |
Hellenic Republic Government Bond, 3.00%, 02/24/39 (k), EUR | | | 25,000 | | | | 10,456 | |
Hellenic Republic Government Bond, 3.00%, 02/24/40 (k), EUR | | | 25,000 | | | | 10,654 | |
Hellenic Republic Government Bond, 3.00%, 02/24/41 (k), EUR | | | 25,000 | | | | 10,625 | |
Hellenic Republic Government Bond, 3.00%, 02/24/42 (k), EUR | | | 25,000 | | | | 10,695 | |
Italy Buoni Poliennali Del Tesoro, 2.50%, 12/01/24, EUR | | | 150,000 | | | | 170,536 | |
Italy Buoni Poliennali Del Tesoro, 5.00%, 03/01/25 (b), EUR | | | 50,000 | | | | 68,327 | |
Spain Government Bond, 1.60%, 04/30/25 (b), EUR | | | 400,000 | | | | 419,586 | |
| | | | | | | | |
| | |
| | | | | | | 3,840,556 | |
| | |
Treasury Inflation Index Securities 2.7% | | | | | | | | |
Italy Buoni Poliennali Del Tesoro Inflation Indexed Note, 2.10%, 09/15/21 (l), EUR | | | 2,497,202 | | | | 3,017,032 | |
U.S. Treasury Inflation Indexed Note, 2.00%, 01/15/26 (l) | | | 1,788,105 | | | | 2,046,263 | |
| | | | | | | | |
| | |
| | | | | | | 5,063,295 | |
| | |
U.S. Treasury Securities 31.4% | | | | | | | | |
U.S. Treasury Bond, 3.13%, 02/15/42 | | | 110,000 | | | | 110,103 | |
U.S. Treasury Bond, 3.63%, 08/15/43 | | | 2,400,000 | | | | 2,628,187 | |
U.S. Treasury Bond, 0.00%, 11/15/43 (m) | | | 1,800,000 | | | | 716,341 | |
U.S. Treasury Bond, 3.75%, 11/15/43 | | | 3,600,000 | | | | 4,030,312 | |
U.S. Treasury Bond, 3.13%, 08/15/44 | | | 1,700,000 | | | | 1,694,687 | |
U.S. Treasury Bond, 2.50%, 02/15/45 (n) | | | 6,300,000 | | | | 5,518,409 | |
U.S. Treasury Note, 2.75%, 02/15/24 (o) | | | 700,000 | | | | 725,813 | |
U.S. Treasury Note, 2.25%, 11/15/24 | | | 30,180,000 | | | | 29,944,234 | |
U.S. Treasury Note, 2.00%, 02/15/25 (n) | | | 8,610,000 | | | | 8,353,043 | |
U.S. Treasury Note, 2.13%, 05/15/25 (n) | | | 4,850,000 | | | | 4,754,135 | |
| | | | | | | | |
| | |
| | | | | | | 58,475,264 | |
| | |
U.S. Government Agency Mortgage-Backed Securities 0.0% | | | | | | | | |
| | |
Federal Home Loan Mortgage Corp. 0.0% | | | | | | | | |
Federal Home Loan Mortgage Corp. REMIC, 7.00%, 08/15/21 | | | 7,530 | | | | 8,209 | |
| |
Total Government and Agency Obligations (cost $68,626,420) | | | | | | | 67,898,909 | |
Purchased Options 0.0% | | | | | | | | |
| | |
Interest Rate Call Swaption, 3-Month LIBOR versus 1.00% fixed, Expiration 01/11/16, GSB (i) | | | 63 | | | | 9,810 | |
Interest Rate Put Swaption, 3-Month LIBOR versus 3.45% fixed, Expiration 09/21/15, BBP (i) | | | 22 | | | | 15,642 | |
| |
Total Purchased Options (cost $187,173) | | | | | | | 25,452 | |
Preferred Stocks 0.1% | | | | | | | | |
| | |
Financials 0.1% | | | | | | | | |
CoBank ACB, 6.20% (callable at 100 beginning 01/01/25) (f) (g) (h) (i) | | | 2,000 | | | | 202,625 | |
| |
Total Preferred Stocks (cost $200,000) | | | | | | | 202,625 | |
The accompanying notes are an integral part of the financial statements.
Montgomery Street Income Securities, Inc. (Unaudited)
Investment Portfolio
June 30, 2015
| | | | | | | | |
| | | Principal
Amount ($)† | | | Value ($) | |
| | | | | | | |
Short Term Investments 2.8% | | | | | | | | |
| | |
Certificates of Deposit 2.8% | | | | | | | | |
Banco Bilbao Vizcaya Argentaria, 1.03%, 10/23/15 (a) | | | 500,000 | | | | 499,772 | |
Banco Bilbao Vizcaya Argentaria, 1.13%, 05/16/16 (a) | | | 500,000 | | | | 498,238 | |
Credit Suisse, 0.60%, 08/24/15 (a) | | | 500,000 | | | | 499,986 | |
Credit Suisse, 0.65%, 01/28/16 (a) | | | 800,000 | | | | 800,092 | |
Intesa Sanpaolo SpA, 1.66%, 04/11/16 (a) | | | 400,000 | | | | 400,946 | |
Itau Unibanco, 1.56%, 05/31/16 (a) | | | 2,400,000 | | | | 2,402,575 | |
| |
Total Short Term Investments (cost $5,099,990) | | | | | | | 5,101,609 | |
| |
Total Investments - 106.5% (cost $195,985,509) | | | | | | | 198,243,574 | |
| | |
Total Forward Sales Commitments-(0.9%) (proceeds $1,694,531) | | | | | | | (1,684,828) | |
| | |
Other Assets and Liabilities, Net (5.6%) | | | | | | | (10,416,666) | |
| |
| | |
Total Net Assets - 100% | | | | | | | 186,142,080 | |
Forward Sales Commitments (0.9%) | | | | | | | | |
| | |
U.S. Government Agency Mortgage-Backed Securities (0.9%) | | | | | | | | |
Federal National Mortgage Association, 5.50%, 07/15/45, TBA (n) | | | (1,500,000) | | | | (1,684,828) | |
| |
Total Forward Sales Commitments (proceeds $1,694,531) | | | | | | | (1,684,828) | |
| (a) | Floating rate note. Floating rate notes are securities whose yields vary with a designated market index or market rate. Rate stated was in effect as of June 30, 2015. |
| (b) | The Fund’s investment adviser has deemed this security, which is exempt from registration under the Securities Act of 1933, as amended, (“1933 Act”) to be liquid based on procedures approved by the Fund’s Board of Directors. As of June 30, 2015, the aggregate value of these liquid securities was $30,415,681 which represented 16.3% of net assets. |
| (c) | Security is in default relating to principal and/or interest. |
| (d) | Non-income producing security. |
| (e) | The interest rate for this security is inversely affected by upgrades or downgrades to the credit rating of the issuer. |
| (f) | Perpetual maturity security. |
| (g) | Interest rate is fixed until stated call date and variable thereafter. |
| (h) | Security is restricted to resale to institutional investors. See Restricted Securities in the Notes to Investment Portfolio. |
| (i) | The Fund’s investment adviser has deemed this security to be illiquid based on procedures approved by the Fund’s Board of Directors. |
| (k) | Security is a “step-up” bond where the coupon may increase or step up at a future date. Rate stated was the coupon as of June 30, 2015. |
| (l) | Treasury inflation indexed note. Par amount is adjusted for inflation. |
| (m) | Security issued with a zero coupon. Income is recognized through the accretion of discount. |
| (n) | All or a portion of the security was purchased or sold on a delayed delivery basis. As of June 30, 2015, the total cost of investments purchased on a delayed delivery basis was $10,822,690. As of June 30, 2015, the total proceeds for investments sold on a delayed delivery basis were $1,694,531. |
| (o) | All or a portion of the security is pledged or segregated as collateral. |
| † | For fixed income securities, par amounts are listed in United States Dollars unless otherwise noted. Options are quoted in number of contracts. |
The accompanying notes are an integral part of the financial statements.
Montgomery Street Income Securities, Inc. (Unaudited)
Investment Portfolio
June 30, 2015
| | |
| Currencies: | | |
| AUD - Australian Dollar | | JPY - Japanese Yen |
| BRL - Brazilian Real | | MXN - Mexican Peso |
| EUR - European Currency Unit (Euro) | | USD - United States Dollar |
| GBP - British Pound | | |
| | |
| Abbreviations: | | |
| ABS - Asset Backed Securities | | Euribor - Europe Interbank Offered Rate Grade |
| BTP - Buoni del Tesoro Poliennali | | iTraxx - Group of international credit derivative indices |
| CDO - Collateralized Debt Obligation | | monitored by the International Index Company |
| CDX.NA.HY - Credit Derivatives Index - North American - | | LIBOR - London Interbank Offered Rate |
| High Yield | | NIM - Net Interest Margin |
| CDX.NA.IG - Credit Derivatives Index - North American - | | REMIC - Real Estate Mortgage Investment Conduit |
| Investment Grade | | TBA - To Be Announced (Securities purchased |
| CLO - Collateralized Loan Obligation | | on a delayed delivery basis) |
| | |
| |
| Counterparty Abbreviations: | | |
| BBP - Barclays Bank Plc | | GSI - Goldman Sachs International |
GSB - Goldman Sachs Bank GSC - Goldman Sachs & Co. | | MLP - Merrill Lynch Pierce, Fenner, & Smith |
The accompanying notes are an integral part of the financial statements.
Montgomery Street Income Securities, Inc. (Unaudited)
Notes to Investment Portfolio
June 30, 2015
Restricted Securities. Montgomery Street Income Securities Inc. (the “Fund”) invests in securities that are restricted under the 1933 Act or which are subject to legal, contractual, or other agreed upon restrictions on resale. Restricted securities are often purchased in private placement transactions and cannot be sold without prior registration unless the sale is pursuant to an exemption under the 1933 Act. As of June 30, 2015, the Fund held investments in restricted securities, excluding certain securities exempt from registration under the 1933 Act which are deemed to be liquid, as follows:
| | | | | | | | | | | | | | | | |
| | | Initial Acquisition
Date | | | Cost | | | Ending
Value | | | Percent of
Net Assets | |
BAT International Finance Plc, 1.85%, 06/15/18 | | | 06/11/2015 | | | $ | 1,798,971 | | | $ | 1,803,346 | | | | 1.0% | |
Cantor Fitzgerald LP, 6.50%, 06/17/22 | | | 06/15/2015 | | | | 300,000 | | | | 309,122 | | | | 0.1 | |
CoBank ACB , 6.20%, (callable at 100 beginning 01/01/25) | | | 11/20/2014 | | | | 200,000 | | | | 202,625 | | | | 0.1 | |
LeasePlan Corp. NV, 3.00%, 10/23/17 | | | 04/08/2014 | | | | 512,550 | | | | 510,296 | | | | 0.3 | |
West Fraser Timber Co. Ltd. , 4.35%, 10/15/24 | | | 10/08/2014 | | | | 100,000 | | | | 95,035 | | | | 0.1 | |
| | | | | | | | |
| | | | | | $ | 2,911,521 | | | $ | 2,920,424 | | | | 1.6% | |
| | | | | | | | |
Schedule of Written Options
| | | | | | | | | | | | | | | | |
| | | Expiration
Date | | | Exercise
Price | | | Contracts | | | Value | |
Credit Default Swaptions | | | | | | | | | | | | | | | | |
CDX.NA.IG-23 Put Option, BBP | | | 07/15/2015 | | | | 0.80 | | | | 38 | | | $ | (2,036) | |
CDX.NA.IG-23 Put Option, BBP | | | 07/15/2015 | | | | 0.80 | | | | 8 | | | | (429) | |
CDX.NA.IG-23 Put Option, BBP | | | 08/19/2015 | | | | 0.80 | | | | 5 | | | | (831) | |
CDX.NA.IG-23 Put Option, BBP | | | 08/19/2015 | | | | 0.80 | | | | 12 | | | | (1,994) | |
CDX.NA.IG-23 Put Option, BBP | | | 08/19/2015 | | | | 0.80 | | | | 5 | | | | (831) | |
iTraxx Europe Main Series 23 Put Option, BBP | | | 08/19/2015 | | | | 0.80 | | | | 5 | | | | (1,608) | |
iTraxx Europe Main Series 23 Put Option, BBP | | | 09/16/2015 | | | | 0.90 | | | | 10 | | | | (3,529) | |
iTraxx Europe Main Series 23 Put Option, GSB | | | 07/15/2015 | | | | 0.80 | | | | 3 | | | | (615) | |
iTraxx Europe Main Series 23 Put Option, GSB | | | 08/19/2015 | | | | 0.90 | | | | 5 | | | | (1,608) | |
iTraxx Europe Main Series 23 Put Option, GSB | | | 08/19/2015 | | | | 0.90 | | | | 8 | | | | (2,037) | |
iTraxx Europe Main Series 23 Put Option, GSB | | | 09/16/2015 | | | | 0.90 | | | | 5 | | | | (1,765) | |
iTraxx Europe Main Series 23 Put Option, GSB | | | 09/16/2015 | | | | 0.90 | | | | 5 | | | | (1,588) | |
Interest Rate Swaptions | | | | | | | | | | | | | | | | |
Call Swaption, 3-Month LIBOR versus 2.35% fixed, GSB | | | 09/30/2015 | | | | N/A | | | | 97 | | | | (89,221) | |
Call Swaption, 6-Month Euribor versus 0.35% fixed, GSB | | | 09/08/2015 | | | | N/A | | | | 38 | | | | (17,039) | |
Call Swaption, 6-Month Euribor versus 1.76% fixed, GSB | | | 01/11/2016 | | | | N/A | | | | 14 | | | | (3,960) | |
Put Swaption, 3-Month LIBOR versus 2.50% fixed, BBP | | | 09/21/2015 | | | | N/A | | | | 92 | | | | (9,443) | |
Put Swaption, 3-Month LIBOR versus 2.50% fixed, GSB | | | 07/15/2015 | | | | N/A | | | | 2 | | | | (1,221) | |
Put Swaption, 3-Month LIBOR versus 2.85% fixed, GSB | | | 09/30/2015 | | | | N/A | | | | 97 | | | | (62,950) | |
Put Swaption, 6-Month Euribor versus 0.35% fixed, GSB | | | 09/08/2015 | | | | N/A | | | | 38 | | | | (540) | |
| | | | | | | | | | | | |
| | | | | | | | | | | 487 | | | $ | (203,245) | |
| | | | | | | | | | | | |
Summary of Written Options
| | | | | | | | |
| | | Contracts/ Notional
Contracts | | | Premiums | |
| | | | |
Options outstanding at December 31, 2014 | | | 900,570 | | | $ | 460,405 | |
Options written during the period | | | 738 | | | | 598,042 | |
Options closed during the period | | | (900,572) | | | | (650,014) | |
Options expired during the period | | | (249) | | | | (45,882) | |
| | | | |
Options outstanding at June 30, 2015 | | | 487 | | | $ | 362,551 | |
| | | | |
The accompanying notes are an integral part of the financial statements.
Montgomery Street Income Securities, Inc. (Unaudited)
Notes to Investment Portfolio
June 30, 2015
Schedule of Exchange Traded Futures Options
| | | | | | | | | | | | | | | | | | |
| | | Expiration
Date | | Exercise
Price | | | Variation Margin
Receivable | | | Written
Contracts | | | Unrealized
Appreciation | |
Euro-Bund Put Option | | 08/21/2015 | | | EUR 148.50 | | | | 1,159 | | | | (13) | | | $ | 904 | |
| | | | | | | | | | |
Schedule of Open Futures Contracts
| | | | | | |
| | | Contracts
Long/
(Short) | | Unrealized
Appreciation/
(Depreciation) | |
90-Day Eurodollar Future, Expiration September 2016 | | (113) | | $ | (31,693) | |
90-Day Eurodollar Future, Expiration December 2016 | | (209) | | | (20,647) | |
90-Day Eurodollar Future, Expiration March 2017 | | (124) | | | (40,096) | |
90-Day Eurodollar Future, Expiration December 2018 | | (46) | | | 8,624 | |
90-Day Eurodollar Future, Expiration June 2016 | | (62) | | | (16,068) | |
Euro-BTP Future, Expiration September 2015 | | 46 | | | 30,693 | |
| | | | | | |
| | $ | (69,187) | |
| | | | | | |
Schedule of Open Forward Foreign Currency Contracts
| | | | | | | | | | | | | | | | | | | | | | |
| Counterparty | | Currency
Purchased/Sold | | Settlement
Date | | | Notional
Amount | | | Currency
Value | | | Unrealized
Gain/(Loss) | |
GSB | | BRL/USD | | | 07/02/2015 | | | | BRL | | | | 1,606,650 | | | $ | 516,757 | | | $ | 16,757 | |
BBP | | BRL/USD | | | 07/02/2015 | | | | BRL | | | | 8,518,690 | | | | 2,739,922 | | | | 28,258 | |
BBP | | EUR/USD | | | 07/02/2015 | | | | EUR | | | | 254,000 | | | | 283,172 | | | | (5,321) | |
GSB | | EUR/USD | | | 07/02/2015 | | | | EUR | | | | 14,652,000 | | | | 16,334,812 | | | | 67,462 | |
GSB | | EUR/USD | | | 08/04/2015 | | | | EUR | | | | 2,121,000 | | | | 2,365,680 | | | | (11,368) | |
GSB | | INR/USD | | | 08/24/2015 | | | | INR | | | | 50,030,660 | | | | 777,278 | | | | 6,627 | |
GSB | | JPY/USD | | | 07/02/2015 | | | | JPY | | | | 354,700,000 | | | | 2,898,231 | | | | 31,783 | |
GSB | | JPY/USD | | | 08/04/2015 | | | | JPY | | | | 123,700,000 | | | | 1,011,162 | | | | 12,490 | |
BBP | | MXN/USD | | | 07/07/2015 | | | | MXN | | | | 28,061,000 | | | | 1,784,660 | | | | (21,526) | |
GSB | | USD/AUD | | | 07/02/2015 | | | | AUD | | | | (1,152,000) | | | | (888,827) | | | | (10,279) | |
GSB | | USD/BRL | | | 07/02/2015 | | | | BRL | | | | (6,473,599) | | | | (2,082,146) | | | | (64,254) | |
BBP | | USD/BRL | | | 07/02/2015 | | | | BRL | | | | (347,101) | | | | (111,640) | | | | (641) | |
GSB | | USD/BRL | | | 07/02/2015 | | | | BRL | | | | (3,304,640) | | | | (1,062,893) | | | | 142,081 | |
BBP | | USD/BRL | | | 08/04/2015 | | | | BRL | | | | (8,518,690) | | | | (2,706,382) | | | | (25,399) | |
GSB | | USD/EUR | | | 07/02/2015 | | | | EUR | | | | (13,066,000) | | | | (14,566,657) | | | | (283,533) | |
GSB | | USD/EUR | | | 07/02/2015 | | | | EUR | | | | (1,840,000) | | | | (2,051,328) | | | | (19,474) | |
GSB | | USD/EUR | | | 08/04/2015 | | | | EUR | | | | (14,652,000) | | | | (16,342,264) | | | | (67,525) | |
GSB | | USD/GBP | | | 07/02/2015 | | | | GBP | | | | (1,137,000) | | | | (1,786,500) | | | | (56,918) | |
GSB | | USD/JPY | | | 07/02/2015 | | | | JPY | | | | (354,700,000) | | | | (2,898,231) | | | | (54,578) | |
GSB | | USD/JPY | | | 08/04/2015 | | | | JPY | | | | (354,700,000) | | | | (2,899,427) | | | | (32,005) | |
BBP | | USD/MXN | | | 07/07/2015 | | | | MXN | | | | (1,275,000) | | | | (81,089) | | | | 309 | |
| | | | | | | | | | | | | | | | | | |
| | | | | | | | | | | | | | | | $ | (18,765,710) | | | $ | (347,054) | |
| | | | | | | | | | | | | | | | | | |
Schedule of Interest Rate Swap Agreements
| | | | | | | | | | | | | | | | | | | | | | | | |
| Counterparty | | Floating Rate Index | | Paying Floating Rate | | Fixed Rate | | Expiration Date | | | | | Notional
Amount1 | | | Premiums
Paid /
(Received) | | | Unrealized
Appreciation /
(Depreciation) | |
Over the Counter Interest Rate Swap Agreements | |
GSB | | Brazil Interbank Rate | | Paying | | 11.00% | | 01/04/2021 | | | BRL | | | | 600,000 | | | $ | (2,064) | | | $ | (6,736) | |
GSB | | Brazil Interbank Rate | | Paying | | 12.85% | | 01/04/2021 | | | BRL | | | | 1,500,000 | | | | 3,209 | | | | 7,677 | |
GSB | | Brazil Interbank Rate | | Paying | | 11.50% | | 01/04/2021 | | | BRL | | | | 3,400,000 | | | | (3,367) | | | | (27,407) | |
GSB | | Brazil Interbank Rate | | Paying | | 12.06% | | 01/04/2021 | | | BRL | | | | 400,000 | | | | 1,430 | | | | (2,447) | |
| | | | | | | | | | | | | | | | | | | | |
| | | | | | | | | | | | | | | | | | $ | (792) | | | $ | (28,913) | |
| | | | | | | | | | | | | | | | | | | | |
The accompanying notes are an integral part of the financial statements.
Montgomery Street Income Securities, Inc. (Unaudited)
Notes to Investment Portfolio
June 30, 2015
Schedule of Interest Rate Swap Agreements (continued)
| | | | | | | | | | | | | | | | | | | | |
| Counterparty | | Floating Rate Index | | Paying/
Receiving
Floating Rate | | Fixed Rate | | Expiration Date | | | | | Notional
Amount1 | | | Unrealized
Appreciation /
(Depreciation) | |
Centrally Cleared Interest Rate Swap Agreements | |
N/A | | 3-Month LIBOR | | Receiving | | 1.30% | | 05/06/2017 | | | | | | | 4,200,000 | | | $ | (6,048) | |
N/A | | 3-Month LIBOR | | Receiving | | 2.00% | | 12/16/2020 | | | | | | | 3,600,000 | | | | (14,387) | |
N/A | | 3-Month LIBOR | | Receiving | | 2.50% | | 12/16/2025 | | | | | | | 6,100,000 | | | | (44,584) | |
N/A | | 6-Month Euribor | | Receiving | | 2.00% | | 09/17/2024 | | | EUR | | | | 4,300,000 | | | | (361,859) | |
N/A | | 6-Month Euribor | | Receiving | | 0.95% | | 03/25/2025 | | | EUR | | | | 300,000 | | | | 6,462 | |
N/A | | British Bankers’ Association Yen LIBOR | | Paying | | 0.50% | | 09/17/2021 | | | JPY | | | | 6,000,000 | | | | 277 | |
N/A | | British Bankers’ Association Yen LIBOR | | Paying | | 1.00% | | 09/18/2023 | | | JPY | | | | 256,300,000 | | | | (73,763) | |
N/A | | British Bankers’ Association Yen LIBOR | | Receiving | | 1.00% | | 09/20/2024 | | | JPY | | | | 130,000,000 | | | | (9,233) | |
N/A | | London-Interbank Offered Rate | | Receiving | | 2.00% | | 09/16/2025 | | | GBP | | | | 1,700,000 | | | | 128,478 | |
N/A | | Mexican Interbank Rate | | Paying | | 5.63% | | 07/07/2021 | | | MXN | | | | 900,000 | | | | (343) | |
N/A | | Mexican Interbank Rate | | Paying | | 5.61% | | 07/07/2021 | | | MXN | | | | 31,300,000 | | | | (2,408) | |
N/A | | Mexican Interbank Rate | | Paying | | 5.84% | | 09/14/2021 | | | MXN | | | | 7,500,000 | | | | 3,574 | |
N/A | | Mexican Interbank Rate | | Paying | | 5.81% | | 09/29/2021 | | | MXN | �� | | | 3,000,000 | | | | 1,497 | |
N/A | | Mexican Interbank Rate | | Paying | | 5.63% | | 10/11/2021 | | | MXN | | | | 24,200,000 | | | | (5,168) | |
N/A | | Mexican Interbank Rate | | Paying | | 6.19% | | 01/03/2035 | | | MXN | | | | 3,900,000 | | | | (26,020) | |
| | | | | | | | | | | | | | | | | | | | |
| | | | | | | | | | | | | | | | | | $ | (403,525) | |
| | | | | | | | | | | | | | | | | | | | |
Schedule of Credit Default Swap Agreements
| | | | | | | | | | | | | | | | | | | | | | | | | | |
| Counterparty | | Reference Obligation | | Implied Credit Spread3 | | Fixed
Received /
Pay Rate6 | | | Expiration
Date | | Notional
Amount1,5 | | | Value | | | Premiums
Paid /
(Received) | | | Unrealized
Appreciation /
(Depreciation) | |
Over the Counter Credit Default Swap Agreements | |
Credit default swap agreements - sell protection 2 | | | | | | | | | | | | | | | | | | | |
BBP | | Anadarko Petroleum Corp., 1.00%, 06/20/17 | | 0.37% | | | 1.00 | % | | 06/20/2017 | | $ | (100,000) | | | $ | 1,262 | | | $ | (3,337) | | | $ | 4,599 | |
GSI | | Canadian Natural Resources Ltd., 6.25%, 03/15/38 | | 0.17% | | | 1.00 | % | | 12/20/2015 | | | (500,000) | | | | 2,106 | | | | 1,714 | | | | 392 | |
GSI | | Chesapeake Energy Corp., 6.63%, 08/15/20 | | 5.18% | | | 5.00 | % | | 03/20/2020 | | | (400,000) | | | | (2,211) | | | | 13,461 | | | | (15,672) | |
GSI | | Federative Republic of Brazil, 12.25%, 03/06/30 | | 3.12% | | | 1.00 | % | | 03/20/2024 | | | (100,000) | | | | (14,889) | | | | (10,369) | | | | (4,520) | |
GSI | | Gazprom International BV, 5.63%, 07/22/13 | | 3.86% | | | 1.00 | % | | 03/20/2017 | | | (1,000,000) | | | | (47,383) | | | | (83,132) | | | | 35,749 | |
GSI | | KB Home, 9.10%, 09/15/17 | | 2.20% | | | 5.00 | % | | 06/20/2019 | | | (150,000) | | | | 15,980 | | | | 12,274 | | | | 3,706 | |
GSI | | NRG Energy Inc., 8.50%, 06/15/19 | | 0.80% | | | 5.00 | % | | 03/20/2017 | | | (200,000) | | | | 14,710 | | | | (14,306) | | | | 29,016 | |
BBP | | Petrobas International Finance Co., 8.38%, 12/10/18 | | 3.69% | | | 1.00 | % | | 06/20/2018 | | | (400,000) | | | | (29,998) | | | | (18,434) | | | | (11,564) | |
GSI | | Petrobas International Finance Co., 8.38%, 12/10/18 | | 4.03% | | | 1.00 | % | | 09/20/2019 | | | (200,000) | | | | (22,886) | | | | (10,922) | | | | (11,964) | |
BBP | | Republic of Italy, 6.88%, 09/27/23 | | 1.05% | | | 1.00 | % | | 12/20/2018 | | | (600,000) | | | | (954) | | | | (46,024) | | | | 45,070 | |
GSI | | Republic of Italy, 6.88%, 09/27/23 | | 1.38% | | | 1.00 | % | | 06/20/2020 | | | (1,000,000) | | | | (17,426) | | | | — | | | | (17,426) | |
GSI | | Republic of Italy, 6.88%, 09/27/23 | | 1.05% | | | 1.00 | % | | 12/20/2018 | | | (200,000) | | | | (318) | | | | (13,026) | | | | 12,708 | |
GSI | | Republic of Italy, 6.88%, 09/27/23 | | 1.13% | | | 1.00 | % | | 06/20/2019 | | | (200,000) | | | | (970) | | | | (1,360) | | | | 390 | |
GSI | | Republic of Italy, 6.88%, 09/27/23 | | 1.13% | | | 1.00 | % | | 06/20/2019 | | | (1,300,000) | | | | (6,309) | | | | 9,915 | | | | (16,224) | |
GSI | | Republic of Italy, 6.88%, 09/27/23 | | 1.13% | | | 1.00 | % | | 06/20/2019 | | | (3,500,000) | | | | (16,987) | | | | 9,648 | | | | (26,635) | |
GSI | | Spanish Government Bond, 5.50%, 07/30/17 | | 1.11% | | | 1.00 | % | | 06/20/2020 | | | (1,900,000) | | | | (9,742) | | | | 21,660 | | | | (31,402) | |
BBP | | United Mexican States, 5.95%, 03/19/19 | | 1.04% | | | 1.00 | % | | 03/20/2019 | | | (300,000) | | | | (365) | | | | (586) | | | | 221 | |
GSI | | United Mexican States, 5.95%, 03/19/19 | | 0.78% | | | 1.00 | % | | 09/20/2017 | | | (1,600,000) | | | | 8,066 | | | | (25,181) | | | | 33,247 | |
GSI | | United Mexican States, 5.95%, 03/19/19 | | 1.04% | | | 1.00 | % | | 03/20/2019 | | | (1,300,000) | | | | (1,582) | | | | 5,532 | | | | (7,114) | |
BBP | | Virgin Media Finance Plc, 4.88%, 02/15/22 | | 2.53% | | | 5.00 | % | | 03/20/2021 | | | (334,456) | | | | 44,151 | | | | 16,623 | | | | 27,528 | |
BBP | | Whirlpool Corp., 7.75%, 07/15/16 | | 0.48% | | | 1.00 | % | | 03/20/2019 | | | (200,000) | | | | 3,875 | | | | 288 | | | | 3,587 | |
| | | | | | | | | | | | | | |
| | $ | (15,484,456) | | | $ | (81,870) | | | $ | (135,562) | | | $ | 53,692 | |
| | | | | | | | | | | | | | |
The accompanying notes are an integral part of the financial statements.
Montgomery Street Income Securities, Inc. (Unaudited)
Notes to Investment Portfolio
June 30, 2015
Schedule of Credit Default Swap Agreements (continued)
| | | | | | | | | | | | | | | | | | | | | | |
| Counterparty | | Reference Obligation | | | | Fixed
Received /
Pay Rate6 | | | Expiration
Date | | Notional
Amount1,5 | | | Value4 | | | Unrealized
Appreciation /
(Depreciation) | |
Centrally Cleared Credit Default Swap Agreements | |
Credit default swap agreements - sell protection 2 | | | | | | | | | | | | | | | |
N/A | | CDX.NA.HY-24 | | | | | 5.00 | % | | 06/20/2020 | | $ | (1,985,000) | | | $ | 123,953 | | | $ | (10,524) | |
N/A | | CDX.NA.IG-24 | | | | | 1.00 | % | | 06/20/2020 | | | (2,400,000) | | | | 34,171 | | | | (10,576) | |
N/A | | CDX.NA.IG.17 | | | | | 1.00 | % | | 12/20/2016 | | | (600,000) | | | | 7,056 | | | | (2,548) | |
N/A | | CDX.NA.IG.18 | | | | | 1.00 | % | | 06/20/2017 | | | (7,100,000) | | | | 102,879 | | | | (1,841) | |
N/A | | CDX.NA.IG.19 | | | | | 1.00 | % | | 12/20/2017 | | | (43,400,000) | | | | 708,034 | | | | 648,458 | |
N/A | | iTraxx Europe Series 22 | | | | | 1.00 | % | | 12/20/2019 | | | (1,449,308) | | | | 21,415 | | | | (1,132) | |
| | | | | | | | | | | | | | |
| | $ | (56,934,308) | | | $ | 997,508 | | | $ | 621,837 | |
| | | | | | | | | | | | | | |
1Notional amount is stated in USD unless otherwise noted.
2If the Fund is a seller of protection and a credit event occurs, as defined under the terms of that particular swap agreement, the Fund will either (i) pay the buyer of protection an amount equal to the notional amount of the referenced obligation and take delivery of the referenced obligation, other deliverable obligations or underlying securities comprising the referenced index or (ii) pay a net settlement amount in the form of cash or securities equal to the notional amount of the swap agreement less the recovery value of the reference obligation or underlying securities comprising the referenced index.
3Implied credit spreads, represented in absolute terms, utilized in determining the value of credit default swap agreements on corporate issues and sovereign issues serve as an indicator of the current status of the payment/performance risk and represent the likelihood or risk of default for the credit derivative. The implied credit spread of a particular referenced entity reflects the cost of buying/selling protection and may include upfront payments required to be made to enter into the agreement. Wider credit spreads represent a deterioration of the referenced entity’s credit soundness and a greater likelihood or risk of default or other credit event occurring as defined under the terms of the applicable agreement.
4The prices and resulting values for credit default swap agreements on credit indices serve as an indicator of the current status of the payment/performance risk and represent the likelihood or risk of default for the credit derivative. Increasing market values, in absolute terms when compared to the notional amount of the swap, represent a deterioration of the referenced entity’s credit soundness and a greater likelihood or risk of default or other credit event occurring as defined under the terms of the agreement.
5The maximum potential amount the Fund could be required to pay as a seller of credit protection if a credit event occurs is limited to the total notional amount which is defined under the terms of each swap agreement.
6If the Fund is a seller of protection, the Fund receives the fixed rate.
The accompanying notes are an integral part of the financial statements.
Montgomery Street Income Securities, Inc. (Unaudited)
Statements of Assets and Liabilities
June 30, 2015
| | | | |
Assets | | | | |
Investments in securities, at value (cost $195,985,509) | | $ | 198,243,574 | |
Cash | | | 390,826 | |
Foreign currency (cost $428,116) | | | 431,196 | |
Receivables: | | | | |
Investments sold | | | 2,381,732 | |
Forward foreign currency contracts | | | 305,767 | |
Interest | | | 1,963,337 | |
Dividend | | | 3,100 | |
Variation margin on financial derivative instruments | | | 101,352 | |
Deposits with brokers and counterparties | | | 2,231,000 | |
Unrealized appreciation on OTC swap agreements | | | 203,890 | |
OTC swap premiums paid | | | 95,754 | |
Other assets | | | 53,629 | |
| | | | |
Total assets | | | 206,405,157 | |
| | | | |
| |
Liabilities | | | | |
Accrued management and investment advisory fee | | | 117,649 | |
Accrued administrative fee | | | 35,606 | |
Written options, at value (premiums $362,551) | | | 203,245 | |
Payables: | | | | |
Investment securities purchased | | | 1,397,688 | |
Reverse repurchase agreements | | | 4,765,250 | |
Payable for treasury roll transactions | | | 10,822,690 | |
Interest expense | | | 278 | |
Variation margin on financial derivative instruments | | | 15,603 | |
Investment forward sales commitments, at value (cost $1,694,531) | | | 1,684,828 | |
Forward foreign currency contracts | | | 652,821 | |
Deposits from brokers and counterparties | | | 60,000 | |
Unrealized depreciation on OTC swap agreements | | | 179,111 | |
OTC swap premiums received | | | 232,108 | |
Other liabilities | | | 96,200 | |
| | | | |
Total liabilities | | | 20,263,077 | |
| | | | |
Net Asset Value | | $ | 186,142,080 | |
| | | | |
Net assets consist of: | | | | |
Paid-in capital | | | 202,065,183 | |
Undistributed net investment income | | | 1,469,114 | |
Net unrealized appreciation on investments and foreign currency related items | | | 2,259,183 | |
Accumulated net realized loss | | | (19,651,400 | ) |
| | | | |
Net Asset Value | | $ | 186,142,080 | |
| | | | |
Net Asset Value per share ($186,142,080/10,365,084 shares of common stock outstanding, $.01 par value, 30,000,000 shares authorized) | | $ | 17.96 | |
| | | | |
The accompanying notes are an integral part of the financial statements.
Montgomery Street Income Securities, Inc. (Unaudited)
Statements of Operations
For the period ended June 30, 2015
| | | | |
Investment Income | | | | |
Income: | | | | |
Interest | | $ | 3,432,119 | |
Dividends | | | 6,200 | |
| | | | |
Total income | | | 3,438,319 | |
| | | | |
Expenses: | | | | |
Management and investment advisory fee | | | 234,286 | |
Administrative fee | | | 222,224 | |
Legal | | | 81,365 | |
Directors’ fees and expenses | | | 64,523 | |
Audit fees | | | 25,789 | |
Insurance | | | 24,312 | |
Stockholder reporting | | | 16,950 | |
Stockholder services | | | 14,428 | |
NYSE listing fee | | | 12,025 | |
Interest expense | | | 7,471 | |
Custodian fees | | | 5,464 | |
Other | | | 7,467 | |
| | | | |
Total expenses | | | 716,304 | |
| | | | |
Net investment income | | | 2,722,015 | |
| | | | |
| |
Realized and unrealized gain (loss) on investment transactions and foreign currency related items | | | | |
Net realized gain (loss) from: | | | | |
Investment transactions | | | (762,462 | ) |
Futures contracts | | | (28,026 | ) |
Swap agreements | | | (8,326 | ) |
Written options contracts | | | 369,503 | |
Foreign currency related items | | | 1,879,755 | |
Net change in unrealized appreciation (depreciation) on: | | | | |
Investments | | | (2,314,101 | ) |
Futures contracts and centrally cleared swap agreements | | | 72,945 | |
OTC swap agreements | | | 271,554 | |
Written options contracts | | | 21,767 | |
Foreign currency related items | | | (788,805 | ) |
| | | | |
Net loss on investment transactions and foreign currency related Items | | | (1,286,196 | ) |
| | | | |
Net increase in net assets resulting from operations | | $ | 1,435,819 | |
| | | | |
The accompanying notes are an integral part of the financial statements.
Montgomery Street Income Securities, Inc. (Unaudited)
Statement of Changes in Net Assets
| | | | | | | | |
| Increase (decrease) in net assets | | Six Months Ended
June 30, 2015 | | | Year Ended
December 31, 2014 | |
Operations: | | | | | | | | |
Net investment income | | $ | 2,722,015 | | | $ | 5,466,242 | |
| Net realized gain on investment transactions and foreign currency related items | | | 1,450,444 | | | | 4,895,357 | |
| Net change in unrealized appreciation (depreciation) on investment transactions and foreign currency related items | | | (2,736,640) | | | | 207,061 | |
| | | | |
Net increase in net assets resulting from operations | | | 1,435,819 | | | | 10,568,660 | |
Distributions to stockholders from net investment income | | | (1,555,184) | | | | (7,566,445) | |
| | | | |
Total distributions | | | (1,555,184) | | | | (7,566,445) | |
Fund share transactions: | | | | | | | | |
Reinvestment of distributions | | | 52,432 | | | | 267,402 | |
Cost of shares repurchased | | | (149,923) | | | | (245,868) | |
| | | | |
Net increase (decrease) in net assets from fund share transactions | | | (97,491) | | | | 21,534 | |
| | | | |
Net increase (decrease) in net assets | | | (216,856) | | | | 3,023,749 | |
Net assets at beginning of period | | | 186,358,936 | | | | 183,335,187 | |
| | | | |
| Net assets at end of period (including undistributed net investment income of $1,469,114 and $302,283, respectively) | | $ | 186,142,080 | | | $ | 186,358,936 | |
| | | | |
Other information | | | | | | | | |
Shares outstanding at beginning of period | | | 10,370,895 | | | | 10,369,576 | |
Shares issued to stockholders in reinvestment of distributions | | | 3,189 | | | | 16,319 | |
Shares repurchased | | | (9,000) | | | | (15,000) | |
| | | | |
Net increase (decrease) in fund shares outstanding | | | (5,811) | | | | 1,319 | |
| | | | |
Shares outstanding at end of period | | | 10,365,084 | | | | 10,370,895 | |
| | | | |
The accompanying notes are an integral part of the financial statements.
Montgomery Street Income Securities, Inc. (Unaudited)
Financial Highlights
| | | | | | | | | | | | | | | | | | | | | | | | |
| Years Ended December 31, | | 2015e | | | 2014 | | | 2013 | | | 2012 | | | 2011 | | | 2010c | |
Selected Per Share Data | | | | | | | | | | | | | | | | | | | | | | | | |
Net asset value, beginning of period | | | $17.97 | | | | $17.68 | | | | $18.37 | | | | $17.11 | | | | $17.12 | | | | $16.42 | |
| | | | | | | | | | | | | | | | | | | | | | | | |
Income from investment operations: | | | | | | | | | | | | | | | | | | | | | | | | |
Income a | | | 0.33 | | | | 0.66 | | | | 0.63 | | | | 0.73 | | | | 0.86 | | | | 0.86 | |
Operating expenses a | | | (0.07) | | | | (0.13) | | | | (0.13) | | | | (0.13) | | | | (0.12) | | | | (0.14) | |
| | | | | | | | | | | | | | | | | | | | | | | | |
Net investment income a | | | 0.26 | | | | 0.53 | | | | 0.50 | | | | 0.60 | | | | 0.74 | | | | 0.72 | |
Net realized and unrealized gain (loss) on investment transactions | | | (0.12) | | | | 0.49 | | | | (0.51) | | | | 1.50 | | | | (0.04) | | | | 0.71 | |
| | | | | | | | | | | | | | | | | | | | | | | | |
Total from investment operations | | | 0.14 | | | | 1.02 | | | | (0.01) | | | | 2.10 | | | | 0.70 | | | | 1.43 | |
| | | | | | | | | | | | | | | | | | | | | | | | |
Less distributions from: | | | | | | | | | | | | | | | | | | | | | | | | |
Net investment income | | | (0.15) | | | | (0.73) | | | | (0.68)g | | | | (0.85) | | | | (0.71) | | | | (0.73) | |
Net asset value, end of period | | | $17.96 | | | | $17.97 | | | | $17.68 | | | | $18.36 | | | | $17.11 | | | | 17.12 | |
| | | | | | | | | | | | | | | | | | | | | | | | |
Per share market value, end of period | | | $16.39 | | | | $16.44 | | | | $15.54 | | | | $16.90 | | | | $15.43 | | | | 15.78 | |
| | | | | | | | | | | | | | | | | | | | | | | | |
| Closing price range on New York Stock Exchange for each share of Common Stock outstanding: | | | | | | | | | | | | | | | | | | | | | | | | |
High ($) | | | 16.99 | | | | 16.78 | | | | 17.76 | | | | 17.30 | | | | 16.03 | | | | 16.78 | |
Low ($) | | | 16.33 | | | | 15.58 | | | | 15.32 | | | | 15.38 | | | | 15.05 | | | | 14.67 | |
Total Return | | | | | | | | | | | | | | | | | | | | | | | | |
Based on market value (%) b | | | 0.61f | | | | 10.57 | | | | (4.12) | | | | 15.22 | | | | 2.28 | | | | 12.50 | |
Based on net asset value (%) b | | | 0.86f | | | | 6.25 | | | | 0.35 | | | | 12.94 | | | | 4.54 | | | | 9.12 | |
Ratio to Average Net Assets and Supplemental Data | | | | | | | | | | | | | | | | | | | | | | | | |
Net assets, end of year ($ millions) | | | 186 | | | | 186 | | | | 183 | | | | 191 | | | | 177 | | | | 178 | |
Ratio of net expenses (%) | | | 0.76d | | | | 0.72 | | | | 0.70 | | | | 0.72 | | | | 0.71 | | | | 0.82 | |
Ratio of net investment income (%) | | | 2.90d | | | | 2.91 | | | | 2.74 | | | | 3.35 | | | | 4.24 | | | | 4.28 | |
Portfolio turnover rate (%) | | | 30f | | | | 103 | | | | 219 | | | | 312 | | | | 49 | | | | 132 | |
| a | Based on average shares outstanding during the period. |
| b | Total return based on net asset value reflects changes in the Fund’s net asset value during the year. Total return based on market value reflects changes in market price. Each figure includes reinvestment of dividends. These figures will differ depending upon the level of any discount or premium between market price and net asset value. |
| c | The Fund changed investment adviser effective March 15, 2010. |
| e | For the six months ended June 30, 2015. |
| g | Includes a return of capital distribution of $(0.03) per share. |
The accompanying notes are an integral part of the financial statements.
Montgomery Street Income Securities, Inc. (Unaudited)
Notes to Financial Statements
June 30, 2015
A. Significant Accounting Policies
Montgomery Street Income Securities, Inc. (the “Fund”) is registered under the Investment Company Act of 1940, as amended (the “1940 Act”), as a closed-end, diversified management investment company. Pacific Investment Management Company LLC (“PIMCO” or “Adviser”) serves as the investment adviser to the Fund.
The Fund is an investment company and follows accounting and reporting guidance under Financial Accounting Standards Board (“FASB”) Accounting Standards Codification (“ASC”) Topic 946, “Financial Services-Investment Companies”. The Fund’s financial statements are prepared in accordance with U.S. generally accepted accounting principles (“GAAP”), which requires the use of management estimates. Actual results could differ from those estimates. The policies described below are followed consistently by the Fund in the preparation of its financial statements.
Security Valuation. Under the Fund’s valuation policy and procedures, the Fund’s Board of Directors (the “Board”) has delegated the daily operational oversight of the securities valuation function to Jackson Fund Services (“JFS” or “Administrator”), a division of Jackson National Asset Management, LLC. The Board has delegated to the Pricing Committee of JFS (“Pricing Committee”), the authority to approve determinations of fair valuations of securities for which market quotations are not readily available as well as to supervise JFS in the performance of its responsibilities pursuant to the valuation policy and procedures. The Pricing Committee consists of the Fund’s Chief Executive Officer, Chief Financial Officer and Chief Compliance Officer. For those securities fair valued under procedures adopted by the Board, the Pricing Committee reviews and affirms the reasonableness of the fair valuation determinations after considering all relevant information that is reasonably available. The Pricing Committee’s fair valuation determinations are subject to review by the Chair of the Fund’s Valuation Committee on a monthly basis and the Board at its next regularly scheduled meeting covering the calendar quarter in which the fair valuation was determined.
Investments are stated at value determined as of the close of regular trading (generally, 4:00 PM Eastern Time) on the New York Stock Exchange (“NYSE”) on each day the exchange is open for trading. Debt securities are valued by independent pricing services approved by, or at the direction of, the Board. If the pricing services are unable to provide valuations, debt securities are valued at the most recent bid quotation for a long position and ask quotation for a short position or an evaluated price, as applicable, obtained from a broker/dealer or widely used quotation system. Fixed income securities with a remaining maturity of sixty days or less maturing at par, are valued at amortized cost, unless it is determined that such price does not approximate market value. Forward foreign currency contracts are generally valued at the forward foreign currency exchange rate as of the close of the NYSE. Futures contracts traded on an exchange are generally valued at the exchange’s settlement price. If the settlement price is not available, exchange traded futures are valued at the last sales price as of the close of business on the local exchange. Options traded on an exchange are generally valued at the last traded price as of the close of business on the local exchange. If the last trade is determined not to be representative of fair value, exchange traded options are valued at the last bid. Centrally cleared swap agreements, listed on a multilateral or trade facility platform, such as a registered exchange, are valued by the respective exchange. The exchange determines a daily settlement price via pricing models which use, as appropriate, its members’ actionable levels across complete term structures along with information obtained from external third party price providers. Over the counter (“OTC”) derivatives, including options and swap agreements, are generally valued by approved pricing services. If the pricing services are unable to provide valuations, OTC derivatives are valued at the most recent bid quotation or evaluated price, as applicable, obtained from a broker/dealer or by pricing models using observable inputs. Pricing services utilized to value debt and derivative instruments may use various pricing techniques which take into account appropriate factors such as yield, credit quality, coupon rate, maturity, type of issue, trading characteristics, call features, credit ratings, broker quotes and other relevant data.
Market quotations may not be readily available for certain debt and derivative investments. If market quotations are not readily available or if it is determined that a quotation of an investment does not represent market value, then the investment is valued at a “fair value” as determined in good faith using procedures approved by the Board. Although there can be no assurance, in general, the fair value of a security is the amount the owner of such security might reasonably expect to receive upon its current sale. Situations that may require a security to be fair valued may include instances where a security is thinly traded or restricted as to resale. In addition, securities may be fair valued based on the occurrence of a significant event. Significant events may be specific to
Montgomery Street Income Securities, Inc. (Unaudited)
Notes to Financial Statements
June 30, 2015
a particular issuer, such as mergers, restructurings or defaults. Alternatively, significant events may affect an entire market, such as natural disasters or government actions. Securities are fair valued based on observable and unobservable inputs including the Administrator‘s own assumptions in determining fair value. Under the procedures approved by the Board, the Administrator may utilize independent pricing services or other sources, including the Fund’s Adviser, to assist in determining the fair value of an investment. Factors considered to determine fair value include the correlation with price movement of similar securities in the same or other markets; the type, cost and investment characteristics of the security; the business and financial condition of the issuer; and trading or other market data. The value of an investment for purposes of calculating the Fund’s net asset value (“NAV”) can differ depending on the source and method used to determine the value.
Security Transactions, Investment Income and Expenses. Investment transactions are reported on trade date for financial reporting purposes. Interest income, including level-yield amortization of discounts and premiums on debt securities and convertible bonds, is accrued daily. The Fund may place a debt obligation on non-accrual status and reduce related interest income by ceasing accruals and writing off interest receivable when the collection of all or a portion of interest has become doubtful. A debt obligation is removed from non-accrual status when the issuer resumes interest payments or when collectability of interest is reasonably assured. Dividend income is recorded on the ex-dividend date. Expenses are recorded on an accrual basis.
Federal Income Taxes. The Fund intends to qualify as a “regulated investment company” and to distribute substantially all net investment income and net capital gains, if any, to its stockholders and otherwise comply with Subchapter M of the Internal Revenue Code applicable to regulated investment companies. Therefore, no federal income tax provision is required.
Distribution of Income and Capital Gains. The amount and timing of distributions are determined in accordance with federal income tax regulations, which may differ from GAAP. Distributions of net investment income are paid quarterly. Net realized gains from investment transactions will be distributed to stockholders at least annually to the extent they exceed available capital loss carryforwards. The Fund uses the specific identification method for determining realized gain or loss on investments sold for both financial and federal income tax reporting purposes.
Contingencies. In the normal course of business, the Fund may enter into contracts that contain general indemnification clauses. The Fund’s maximum exposure under these arrangements is unknown, as this would involve future claims that may be made against the Fund that have not yet been made. However, based on experience to date, the Fund expects any risk of loss to be remote.
Recent Accounting Pronouncements. In June 2014, FASB released Accounting Standards Update (“ASU”) 2014-11 “Repurchase-to-Maturity Transactions, Repurchase Financings and Disclosures”. The amendments in this ASU change the accounting for repurchase-to-maturity transactions and linked repurchase financings to secured borrowing accounting, which is consistent with the accounting for other repurchase agreements. The amendments also require two new disclosures. The first disclosure requires an entity to disclose information on transfers accounted for as sales in transactions that are economically similar to repurchase agreements. The second disclosure provides increased transparency about the types of collateral pledged in repurchase agreements and similar transactions accounted for as secured borrowings. ASU 2014-11 is effective for the first interim and annual period beginning on or after December 15, 2014. No new disclosures were required at June 30, 2015, and management is currently evaluating the disclosures required by the ASU for the annual period ending December 31, 2015.
B. FASB ASC Topic 820, “Fair Value Measurement”
This standard establishes a single authoritative definition of fair value, sets out a framework for measuring fair value and requires additional disclosures about fair value measurements. Various inputs are used in determining the value of the Fund’s investments under FASB ASC Topic 820 guidance. The inputs are summarized into three broad categories.
Level 1 includes valuations based on unadjusted quoted prices of identical securities in active markets, including valuations for securities listed on an exchange.
Montgomery Street Income Securities, Inc. (Unaudited)
Notes to Financial Statements
June 30, 2015
Level 2 includes valuations determined from significant direct or indirect observable inputs. Direct observable inputs include broker quotes, third party prices, closing prices of similar securities in active markets, closing prices for identical or similar securities in non-active markets. Indirect significant observable inputs include factors such as interest rates, yield curves, prepayment speeds or credit ratings. Level 2 generally includes valuations of vendor evaluated debt instruments, broker quotes in active markets, securities valued at amortized cost, centrally cleared swap agreements, modeled OTC derivatives contracts and swap agreements valued by pricing services.
Level 3 includes valuations determined from significant unobservable inputs including the Administrator’s own assumptions in determining the fair value of the investment. Inputs used to determine the fair value of Level 3 securities include security specific inputs such as: credit quality, credit rating spreads, issuer news, trading characteristics, call features or maturity; or industry specific inputs such as: trading activity of similar markets or securities, changes in the security’s underlying index or comparable securities’ models. Level 3 valuations include securities that are priced based on single source broker quotes, restricted to resale due to market events, newly issued or investments for which reliable quotes are otherwise not available.
To assess the continuing appropriateness of security valuation, the Administrator regularly compares prior day prices with current day prices, transaction prices and alternative vendor prices. When the comparison results exceed pre-defined thresholds, the Administrator challenges the prices exceeding tolerance levels with the pricing service or broker. To verify Level 3 unobservable inputs, the Administrator uses a variety of techniques as appropriate to substantiate these valuation approaches including a regular review of key inputs and assumptions, transaction back-testing or disposition analysis and review of related market activity.
The inputs or methodology used for valuing securities are not necessarily an indication of the risk associated with investing in those securities.
The following table summarizes the Fund’s investments in securities and other financial instruments as of June 30, 2015 by valuation level.
| | | | | | | | | | | | | | | | |
| | | Assets - Investments in Securities | |
| | | Level 1 | | | Level 2 | | | Level 3 | | | Total | |
Corporate Bonds | | $ | — | | | $ | 116,030,733 | | | $ | — | | | $ | 116,030,733 | |
Non-U.S. Government Agency ABS | | | — | | | | 8,984,246 | | | | — | | | | 8,984,246 | |
Government and Agency Obligations | | | — | | | | 67,898,909 | | | | — | | | | 67,898,909 | |
Purchased Options | | | — | | | | 25,452 | | | | — | | | | 25,452 | |
Preferred Stocks | | | 202,625 | | | | — | | | | — | | | | 202,625 | |
Short Term Investments | | | — | | | | 5,101,609 | | | | — | | | | 5,101,609 | |
| |
| | | | |
Fund Total | | $ | 202,625 | | | $ | 198,040,949 | | | $ | — | | | $ | 198,243,574 | |
| |
| | | Liabilities - Investments in Securities | |
| | | Level 1 | | | Level 2 | | | Level 3 | | | Total | |
Government and Agency Obligations | | $ | — | | | $ | (1,684,828 | ) | | $ | — | | | $ | (1,684,828 | ) |
| |
| | | | |
Fund Total | | $ | — | | | $ | (1,684,828 | ) | | $ | — | | | $ | (1,684,828 | ) |
| |
| | | Assets - Investments in Other Financial Instruments* | |
| | | Level 1 | | | Level 2 | | | Level 3 | | | Total | |
Exchange Traded Written Options | | $ | 904 | | | $ | — | | | $ | — | | | $ | 904 | |
Open Futures Contracts | | | 39,317 | | | | — | | | | — | | | | 39,317 | |
Open Forward Foreign Currency Contracts | | | — | | | | 305,767 | | | | — | | | | 305,767 | |
OTC Interest Rate Swap Agreements | | | — | | | | 7,677 | | | | — | | | | 7,677 | |
Centrally Cleared Interest Rate Swap Agreements | | | — | | | | 140,288 | | | | — | | | | 140,288 | |
OTC Credit Default Swap Agreements | | | — | | | | 196,213 | | | | — | | | | 196,213 | |
Centrally Cleared Credit Default Swap Agreements | | | — | | | | 648,458 | | | | — | | | | 648,458 | |
| |
| | | | |
Fund Total | | $ | 40,221 | | | $ | 1,298,403 | | | $ | — | | | $ | 1,338,624 | |
Montgomery Street Income Securities, Inc. (Unaudited)
Notes to Financial Statements
June 30, 2015
| | | | | | | | | | | | | | | | |
| | | Liabilities - Investments in Other Financial Instruments* | |
| | | Level 1 | | | Level 2 | | | Level 3 | | | Total | |
Written Options | | $ | — | | | $ | (203,245 | ) | | $ | — | | | $ | (203,245 | ) |
Open Futures Contracts | | | (108,504 | ) | | | — | | | | — | | | | (108,504 | ) |
Open Forward Foreign Currency Contracts | | | — | | | | (652,821 | ) | | | — | | | | (652,821 | ) |
OTC Interest Rate Swap Agreements | | | — | | | | (36,590 | ) | | | — | | | | (36,590 | ) |
Centrally Cleared Interest Rate Swap Agreements | | | — | | | | (543,813 | ) | | | — | | | | (543,813 | ) |
OTC Credit Default Swap Agreements | | | — | | | | (142,521 | ) | | | — | | | | (142,521 | ) |
Centrally Cleared Credit Default Swap Agreements | | | — | | | | (26,621 | ) | | | — | | | | (26,621 | ) |
| |
| | | | |
Fund Total | | $ | (108,504 | ) | | $ | (1,605,611 | ) | | $ | — | | | $ | (1,714,115 | ) |
* All derivatives are reflected at the unrealized appreciation/(depreciation) on the instrument, except for written options which are reflected at value.
Significant changes in unobservable valuation inputs to a different amount might result in a significantly higher or lower fair value measurement than the one used in a security’s valuation. The Fund recognizes transfers between levels as of the beginning of the period for financial reporting purposes. There were no transfers into or out of Level 1, 2 or 3 during the period. There were no significant Level 3 valuations for which significant unobservable valuation inputs were developed at June 30, 2015.
C. Investments
Forward Sales Commitments. The Fund may purchase or sell forward sales commitments. A forward sales commitment involves the Fund entering into a contract to purchase or sell securities for a fixed price at a future date beyond the customary settlement period. The purchase of a forward sales commitment involves the risk of loss if the value of the security to be purchased declines before the settlement date while the sale of a forward sales commitment involves the risk that the value of the securities to be sold may increase before the settlement date. The Fund may dispose of or renegotiate forward sales commitments after they are entered into, and may close these positions before they are delivered, which may result in a realized gain or loss.
When-Issued/Delayed-Delivery Securities. The Fund may purchase securities with delivery or payment to occur at a date beyond the normal settlement period. At the time the Fund enters into a commitment to purchase a security, the transaction is recorded and the value of the security is reflected in the NAV. The price of such security and the date when the security will be delivered and paid for are fixed at the time the transaction is negotiated. The value of the security may vary with market fluctuations. No interest accrues to the Fund until settlement of the trade. Certain risks may arise upon entering into when-issued or delayed-delivery securities from the potential inability of counterparties to meet the terms of their contracts or if the issuer does not issue the securities due to political, economic or other factors. Additionally, losses may arise due to changes in the value of the underlying securities prior to settlement date, if the counterparty does not perform under the contract’s terms, or if the issuer does not issue the securities due to political, economic or other factors.
Mortgage-Backed Dollar and Treasury Roll Transactions. The Fund may sell mortgage-backed or treasury securities and simultaneously contract to repurchase securities at a future date at an agreed upon price. The Fund may only enter into covered rolls. A “covered roll” is a type of dollar roll for which the Fund maintains offsetting positions in cash, U.S. Government securities, or other liquid assets which mature on or before the forward repurchase settlement date of the dollar roll transaction. During the period between the sale and repurchase, the Fund forgoes interest and principal paid on the mortgage-backed securities. The Fund is compensated by the interest earned on the cash proceeds of the initial sale and from negotiated fees paid by brokers offered as an inducement to the Fund to “roll over” its purchase commitments. The Fund may dispose of “covered roll” securities after they are entered into and close these positions before their maturity, which may result in a realized gain or loss.
In a mortgage-backed or treasury securities roll transaction, if the repurchased security is determined to be similar, but not substantially the same, the transaction is accounted for as a purchase and sale. Any gains, losses and any income or fees earned are recorded to realized gain or loss. If the repurchased security is determined to be substantially the same, the transaction is accounted for as a secured borrowing, rather than as a purchase and sales transaction. Any income or fees earned are recorded to investment income and financing costs associated with the transaction are recorded to interest expense.
Montgomery Street Income Securities, Inc. (Unaudited)
Notes to Financial Statements
June 30, 2015
Dollar roll transactions involve the risk that the market value of the securities sold by the Fund may decline below the repurchase price of those securities which the Fund is obligated to purchase or that the return earned by the Fund with the proceeds of a dollar roll may not exceed transaction costs.
For the 166 days treasury roll securities were outstanding, the average daily balance and the weighted average interest rate for treasury roll securities during the period ended June 30, 2015 were $13,790,947 and 0.08%, respectively. At June 30, 2015, $12,702 of deferred income was included in payable for treasury roll transactions on the Statement of Assets and Liabilities.
Repurchase Agreements. The Fund may invest in repurchase agreements. In a repurchase agreement, the Fund receives debt securities (collateral) subject to an obligation of the seller to repurchase, and the Fund to resell, the securities at an agreed upon price and date. The underlying securities used as collateral for repurchase agreements may be held in safekeeping by the Fund’s Custodian. Earnings on collateral and compensation to the seller are based on agreed upon rates between the seller and the Fund. Interest earned on repurchase agreements is recorded as interest income to the Fund. When a repurchase agreement is entered into, the Fund typically receives securities with a value that approximates or exceeds the repurchase price, including any accrued interest earned on the repurchase agreement. The value of such securities will be marked to market daily, and cash or additional securities will be exchanged between the parties with a frequency and in amounts prescribed in the repurchase agreement. In the event of a default by the counterparty, realization of the collateral proceeds could be delayed, during which time the value of such collateral may decline.
Reverse Repurchase Agreements - The Fund may enter into reverse repurchase agreements. In a reverse repurchase agreement, the Fund delivers to a counterparty a security in exchange for cash with a simultaneous agreement to repurchase the same or substantially the same security at an agreed upon price and date. Cash received in exchange for securities delivered plus accrued interest to be paid by the Fund are reflected as liabilities on the Statement of Assets and Liabilities. Interest paid is recorded as a component of interest expense on the Statements of Operations. The Fund receives principal and interest payments, if any, made on the security delivered to the counterparty during the term of the agreement. In periods of increased demand of the security, the Fund may receive a fee for use of the security by the counterparty, which may result in interest income to the Fund. A reverse repurchase agreement involves the risk that the value of the security delivered by the Fund may decline below the repurchase price of the security. The Fund will segregate assets determined to be liquid at the Custodian or otherwise cover its obligations under reverse repurchase agreements.
For the 98 days reverse repurchase agreements were outstanding, the average daily balance and the weighted average interest rate for reverse repurchase agreements during the period ended June 30, 2015 were $6,460,627 and 0.10%, respectively. The value of reverse repurchase agreements and collateral pledged or received are disclosed in the table below. The Fund’s net exposure to the counterparty is determined by the amount of any excess or shortfall in collateral compared to the value of the reverse repurchase agreement.
| | | | | | | | | | | | | | | | | | | | |
| Counterparty | | Payable for Reverse
Repurchase Agreement
Including Interest
Payable | | | Collateral
Amount | | | Interest Rate Expense | | | Date of Agreement | | | Maturity
Date | |
MLP | | $ | 4,765,574 | | | $ | 4,753,764 | | | | 0.35 | % | | | 06/24/15 | | | | 07/02/15 | |
Illiquid Investments. Illiquid securities and other investments are those that may not be sold or disposed of in the ordinary course of business within seven days at approximately the price used to determine the Fund’s NAV per share. The Fund may not be able to sell illiquid investments when the Adviser considers it desirable to do so or may have to sell such investments at a price that is lower than the price that could be obtained if the investments were liquid. A sale of illiquid investments may require more time and may result in higher dealer discounts and other selling expenses than would the sale of those that are liquid. Illiquid investments also may be more difficult to value, due to the unavailability of reliable market quotations for such investments, and investment in them may have an adverse impact on the NAV.
Restricted Securities. The Fund may own certain investment securities which are unregistered and thus restricted as to resale. Unregistered securities may be “illiquid” because there is no readily available market for
Montgomery Street Income Securities, Inc. (Unaudited)
Notes to Financial Statements
June 30, 2015
sale of the securities. Where future dispositions of the securities require registration under the 1933 Act, as amended, the Fund has the right to include those securities in such registration generally without costs to the Fund. The Fund normally has no right to require registration of unregistered securities.
U.S. Government Agencies or Government Sponsored Enterprises. The Fund may invest in U.S. government agencies or government sponsored enterprises. U.S. government securities are obligations of, and in certain cases, guaranteed by, the U.S. government, its agencies or instrumentalities. Some U.S. government securities, such as Treasury bills, notes and bonds, and securities guaranteed by the Government National Mortgage Association, are supported by the full faith and credit of the U.S. government; others, such as those of the Federal Home Loan Bank, are supported by the right of the issuer to borrow from the U.S. Department of the Treasury (“U.S. Treasury”); others, such as those of the Federal National Mortgage Association (“FNMA”) are supported by the discretionary authority of the U.S. government to purchase the agency’s obligations. U.S. government securities may include zero coupon securities, which do not distribute interest on a current basis and tend to be subject to greater risk than interest-paying securities of similar maturities.
Government-related guarantors (i.e., guarantors that are not backed by the full faith and credit of the U.S. government) include FNMA and the Federal Home Loan Mortgage Corporation (“FHLMC”). FNMA purchases conventional (i.e., not insured or guaranteed by any government agency) residential mortgages from a list of approved seller/servicers, which include state and federally chartered savings and loan associations, mutual savings banks, commercial banks and credit unions and mortgage bankers. Pass-through securities issued by FNMA are guaranteed as to timely payment of principal and interest by FNMA, but are not backed by the full faith and credit of the U.S. government. FHLMC issues Participation Certificates (“PCs”), which are pass-through securities, each representing an undivided interest in a pool of residential mortgages. FHLMC guarantees the timely payment of interest and ultimate collection of principal, but PCs are not backed by the full faith and credit of the U.S. government.
FNMA and FHMLC were placed into conservatorship by the Federal Housing Finance Agency (“FHFA”). As the conservator, FHFA succeeded to all rights, titles, powers and privileges of FNMA and FHLMC and of any stockholder, officer or director of FNMA and FHLMC with respect to FNMA and FHLMC and each enterprise’s assets. In connection with the conservatorship, the U.S. Treasury entered into a Senior Preferred Stock Purchase Agreement with FNMA and FHLMC. This agreement contains various covenants that severely limit each enterprise’s operations. In exchange for entering into these agreements, the U.S. Treasury received senior preferred stock in each enterprise and warrants to purchase each enterprise’s common stock. The U.S. Treasury announced the creation of a new secured lending facility, which is available to FNMA and FHLMC as a liquidity backstop and the creation of a temporary program to purchase mortgage-backed securities issued by FNMA and FHLMC. FNMA and FHLMC are continuing to operate as going concerns while in conservatorship and each remains liable for all of its obligations, including its guaranty obligations, associated with its mortgage-backed securities.
D. Risks
Interest Rate Risk. Interest rate risk is the risk that fixed income securities will decline in value because of changes in interest rates. As nominal interest rates rise, the value of certain fixed income securities held by the Fund is likely to decrease. A nominal interest rate can be described as the sum of a real interest rate and an expected inflation rate. Fixed income securities with longer durations tend to be more sensitive to changes in interest rates, usually making them more volatile than securities with shorter durations.
Inflation-indexed bonds, including Treasury Inflation-Protected Securities, decline in value when real interest rates rise. In certain interest rate environments, such as when real interest rates are rising faster than nominal interest rates, inflation-indexed bonds may experience greater losses than other fixed income securities with similar durations.
Variable and floating rate securities generally are less sensitive to interest rate changes but may decline in value if their interest rates do not rise as much, or as quickly, as interest rates in general. Conversely, variable and floating rate securities will not generally increase in value if interest rates decline. Inverse floating rate securities may decrease in value if interest rates increase. Inverse floating rate securities may also exhibit greater price
Montgomery Street Income Securities, Inc. (Unaudited)
Notes to Financial Statements
June 30, 2015
volatility than a fixed rate obligation with similar credit quality. When the Fund holds variable or floating rate securities, a decrease (or, in the case of inverse floating rate securities, an increase) in market interest rates will adversely affect the income received from such securities and the net asset value of the Fund’s shares.
Credit Risk. The Fund could lose money if the issuer or guarantor of a fixed income security, or the counterparty to a derivatives contract or repurchase agreement, is unable or unwilling to make timely principal and/or interest payments, or to otherwise honor its obligations. Securities are subject to varying degrees of credit risk, which are often reflected in credit ratings. Municipal bonds are subject to specific risks that litigation, legislation or other political events, local business or economic conditions, or the bankruptcy of the issuer could have a significant effect on an issuer’s ability to make payments of principal and/or interest.
High Yield Risk. Investments in high yield securities and unrated securities of similar credit quality (commonly known as “junk bonds”) may be subject to greater levels of credit and liquidity risk than investments in higher rated securities. These securities are considered predominately speculative with respect to the issuer’s continuing ability to make principal and interest payments. An economic downturn or period of rising interest rates could adversely affect the market for these securities and reduce the Fund’s ability to sell these securities (liquidity risk). If the issuer of a security is in default with respect to interest or principal payments, the Fund may lose its entire investment.
Market Risk. The market price of securities owned by the Fund may go up or down, sometimes rapidly or unpredictably. The value of a security may decline due to general market conditions that are not specifically related to a particular company, such as real or perceived adverse economic conditions, changes in the general outlook for corporate earnings, changes in interest or currency rates or adverse investor sentiment generally. It may also decline due to factors which affect a particular industry or industries, such as labor shortages or increased production costs and competitive conditions within an industry. During a general downturn in the securities markets, multiple asset classes may decline in value simultaneously. Equity securities, like common stocks and preferred stocks, generally have greater price volatility than fixed income securities.
Issuer Risk. The value of a security may decline for a number of reasons that directly relate to the issuer, such as management performance, financial leverage and reduced demand for the issuer’s goods or services.
Liquidity Risk. Liquidity risk exists when particular investments are difficult to purchase or sell. The Fund’s investments in illiquid securities may reduce the returns of the Fund because it may be unable to sell the illiquid securities at an advantageous time or price. Additionally, the markets for certain investments may become illiquid under adverse market or economic conditions independent of any specific adverse changes in the condition of a particular issuer. In such cases, the Fund, due to the difficulty in purchasing and selling illiquid securities and limitations on the Fund’s investments in such securities, may be unable to achieve its desired level of exposure to a certain sector. Foreign (non-U.S.) securities, certain derivatives and securities with substantial market and/or credit risk will tend to have greater exposure to liquidity risk.
Derivatives Risk. Derivatives are financial contracts whose value depends on, or is derived from, the value of an underlying asset, reference rate or index. When investing in a derivative instrument, the Fund could lose more than the principal amount invested. The Fund typically uses derivatives as a substitute for taking a position in the underlying asset or as part of a strategy designed to reduce exposure to other risks, such as interest rate or currency risk. The Fund may also use derivatives for leverage, in which case their use would involve leveraging risk. For example, a small investment in a derivative instrument may have a significant impact on the Fund’s exposure to interest rates, currency exchange rates or other investments. As a result a relatively small price movement in a derivative instrument may cause an immediate and substantial loss or gain. The Fund may engage in such transactions regardless of whether the Fund owns the asset, instrument or components of the index underlying the derivative instrument. The Fund may invest a portion of its assets in these types of instruments, which could cause the Fund’s investment exposure to exceed the value of its portfolio securities and its investment performance could be affected by securities it does not own. The Fund’s use of derivative instruments involves risks different from, or possibly greater than, the risks associated with investing directly in securities and other traditional investments. Derivatives are subject to a number of risks described elsewhere in this section, such as liquidity risk, interest rate risk, market risk, credit risk and management risk. They also
Montgomery Street Income Securities, Inc. (Unaudited)
Notes to Financial Statements
June 30, 2015
involve the risk of mispricing or improper valuation and the risk that changes in the value of the derivative may not correlate perfectly with the underlying asset, rate or index. The Fund’s Adviser must choose the correct derivatives exposure versus the underlying assets to be hedged or the income to be generated, in order to realize the desired results from the investment. The Fund’s Adviser must correctly predict price, credit or other applicable movements, during the life of a derivative, with respect to the underlying asset in order to realize the desired results from the investment. The Fund could experience losses if its derivatives were poorly correlated with its other investments, or if the Fund were unable to liquidate its position because of an illiquid secondary market. The market for many derivatives is, or suddenly can become, illiquid. Changes in liquidity may result in significant, rapid and unpredictable changes in the prices for derivatives. The value of derivatives may fluctuate more rapidly than other investments, which may increase the volatility of the Fund, depending on the nature and extent of the derivatives in the Fund’s portfolio. If the Fund’s Adviser uses derivatives in attempting to manage or “hedge” the overall risk of the portfolio, the strategy might not be successful. To the extent that the Fund is unable to close out a position because of market illiquidity or counterparty default, the Fund may not be able to prevent further losses of value in its derivatives holdings and the Fund’s liquidity may be impaired to the extent that it has a substantial portion of its otherwise liquid assets marked as segregated to cover its obligations under such derivative instruments. The Fund may also be required to take or make delivery of an underlying instrument that the manager would otherwise have attempted to avoid. Also, suitable derivative transactions may not be available in all circumstances, and there can be no assurance that the Fund will engage in these transactions to reduce exposure to other risks when that would be beneficial. The use of derivative strategies may also have a tax impact on the Fund. The timing and character of income, gains or losses from these strategies could impair the ability of the investment manager to utilize derivatives when it wishes to do so.
Mortgage-Related and Other Asset-Backed Securities Risk. Mortgage-related and other asset-backed securities are subject to certain additional risks. Generally, rising interest rates tend to extend the duration of fixed rate mortgage-related securities, making them more sensitive to changes in interest rates. This is known as extension risk. In addition, adjustable and fixed rate mortgage-related securities are subject to prepayment risk. When interest rates decline, borrowers may pay off their mortgages sooner than expected. This can reduce the returns of the Fund because the Fund may have to reinvest that money at the lower prevailing interest rates. The Fund’s investments in other asset-backed securities are subject to risks similar to those associated with mortgage-related securities, as well as additional risks associated with the nature and servicing of those assets.
Foreign (Non-U.S.) Investment Risk. Investments in foreign (non-U.S.) securities may experience more rapid and extreme changes in value than investments in securities of U.S. companies. The securities markets of many foreign countries are relatively small, with a limited number of companies representing a small number of industries. Additionally, issuers of foreign securities are usually not subject to the same degree of regulation as U.S. issuers. Reporting, accounting and auditing standards of foreign countries differ, in some cases significantly, from U.S. standards. Also, nationalization, expropriation or confiscatory taxation, currency blockage, political changes or diplomatic developments could adversely affect the Fund’s investments in a foreign country. In the event of nationalization, expropriation or other confiscatory taxation, the Fund could lose its entire investment in foreign securities. Adverse conditions in a certain region can adversely affect securities of other countries whose economies appear to be unrelated. If the Fund invests a significant portion of its assets in a specific geographic region, the Fund will generally have more exposure to regional economic risks associated with foreign investments in that region.
Emerging Markets Risk. Foreign investment risk may be particularly high to the extent that the Fund invests in emerging market securities that are economically tied to countries with developing economies. These securities may present market, credit, currency, liquidity, legal, political and other risks different from, or greater than, the risks of investing in developed foreign countries.
Currency Risk. To the extent that the Fund invests directly in foreign (non-U.S.) currencies, in securities that are denominated in foreign currencies, or in derivatives that provide exposure to foreign currencies, it will be subject to the risk that those currencies will decline in value relative to the U.S. dollar, or, in the case of hedging positions, that the U.S. dollar will decline in value relative to the currency being hedged.
Montgomery Street Income Securities, Inc. (Unaudited)
Notes to Financial Statements
June 30, 2015
Currency rates in foreign countries may fluctuate significantly over short periods of time for a number of reasons, including changes in interest rates, intervention (or the failure to intervene) by U.S. or foreign governments, central banks or supranational entities such as the International Monetary Fund, or the imposition of currency controls or other political developments in the United States or abroad. As a result, the Fund’s investments in foreign currencies or instruments with exposure to foreign currencies may reduce the returns of the Fund.
Leveraging Risk. Certain transactions may give rise to a form of leverage. Such transactions include, among others, reverse repurchase agreements and when-issued, delayed delivery or forward commitment transactions. The use of derivatives may also create leveraging risk. To mitigate leveraging risk, the Investment Adviser will segregate or “earmark” liquid assets or otherwise cover the transactions that may give rise to such risk. The Fund also may be exposed to leveraging risk by borrowing money for investment purposes. Leveraging may cause the Fund to liquidate portfolio positions to satisfy its obligations or to meet segregation requirements when it may not be advantageous to do so. Leveraging, including borrowing, may cause the Fund to be more volatile than if the Fund had not been leveraged. This is because leveraging tends to exaggerate the effect of any increase or decrease in the value of the Fund’s portfolio securities.
Smaller Company Risk. The general risks associated with fixed income securities are particularly pronounced for securities issued by companies with smaller market capitalizations. These companies may have limited product lines, markets or financial resources or they may depend on a few key employees. As a result, they may be subject to greater levels of credit, market and issuer risk. Securities of smaller companies may trade less frequently and in lesser volumes than more widely held securities and their values may fluctuate more sharply than other securities. Companies with medium-sized market capitalizations may have risks similar to those of smaller companies.
Management Risk. The Fund is subject to management risk because it is an actively managed investment portfolio. The Investment Adviser will apply investment techniques and risk analyses in making investment decisions for the Fund, but there can be no guarantee that these decisions will produce the desired results. Additionally, legislative, regulatory, or tax developments may affect the investment techniques available to the Investment Adviser and may also adversely affect the ability of the Fund to achieve its investment objectives.
Municipal Project-Specific Risk. The Fund may be more sensitive to adverse economic, business or political developments if it invests a substantial portion of its assets in the municipal bonds of similar projects (such as those relating to education, health care, housing, transportation, and utilities), in industrial development bonds, or in bonds from issuers in a single state.
Short Sale Risk. The Fund’s short sales, if any, are subject to special risks. A short sale involves the sale by the Fund of a security that it does not own with the hope of purchasing the same security at a later date at a lower price. The Fund may also enter into a short position through a forward commitment or a short derivative position through a futures contract or swap agreement. If the price of the security or derivative has increased during this time, then the Fund will incur a loss equal to the increase in price from the time that the short sale was entered into plus any premiums and interest paid to the third party. Therefore, short sales involve the risk that losses may be exaggerated, potentially losing more money than the actual cost of the investment. Also, there is the risk that the third party to the short sale may fail to honor its contract terms, causing a loss to the Fund.
Government, Legislative and Regulatory Risk. Instability in the financial markets can lead to a number of unprecedented actions that may support certain financial institutions and segments of the financial markets under extreme volatility, and in some cases a lack of liquidity. Federal, state, and other governments, their regulatory agencies, or self regulatory organizations may take actions that affect the regulation of the instruments in which the Fund invests, or the issuers of such instruments, in ways that are unforeseeable. Legislation or regulation may also change the way in which the Funds themselves are regulated. Such legislation or regulation could limit or preclude the Fund’s ability to achieve its investment objectives. Governments or their agencies may also acquire distressed assets from financial institutions and acquire ownership interests in those institutions. The implications of government ownership and disposition of these assets are unclear, and such a program may have positive or negative effects on the liquidity, valuation and performance of the Fund’s portfolio holdings.
Montgomery Street Income Securities, Inc. (Unaudited)
Notes to Financial Statements
June 30, 2015
E. Investment Transaction Agreements and Collateral
Under various agreements, certain investment transactions require collateral to be pledged to/from the Fund and a counterparty or segregated at the custodian. U.S. Treasury Bills and cash (U.S. dollar) are generally the preferred forms of collateral, although other forms of high quality or sovereign securities may be used. Securities held by the Fund that are used as collateral are identified as such within the Investment Portfolio. Collateral for OTC financial derivative transactions paid to or received from counterparties is included in receivable/payable for deposits with/from brokers and counterparties in the Statement of Assets and Liabilities.
Master Netting Agreements (“Master Agreements”). The Fund is subject to various Master Agreements, which govern the terms of certain transactions and mitigate the counterparty risk associated with relevant transactions by specifying credit protection mechanisms and providing standardization that improves legal certainty. Since different types of financial transactions have different mechanics and are sometimes traded out of different legal entities of a particular counterparty organization, each type of transaction may be covered by a different Master Agreement, potentially resulting in the need for multiple agreements with a single counterparty. The Fund may net exposure and collateralize multiple transaction types governed by the same Master Agreement with the same counterparty and may close out and net its total exposure to a counterparty in the event of a default and/or termination event with respect to all the transactions governed under a single agreement with a counterparty. Each Master Agreement defines whether the Fund is contractually able to net settle daily payments. Additionally, certain circumstances, such as laws of a particular jurisdiction or settlement of amounts due in different currencies, may prohibit or restrict the right of offset as defined in the Master Agreements.
Master Agreements also help limit credit and counterparty risk by specifying collateral posting arrangements at pre-arranged exposure levels. Under the Master Agreements, collateral is routinely transferred if the total net exposure to certain transactions (net of existing collateral) governed under the relevant master agreement with a counterparty in a given account exceeds a specified threshold depending on the counterparty and the type of Master Agreement. The Fund’s overall exposure to counterparty risk can change substantially within a short period, as it is affected by each transaction subject to the relevant Master Agreement. To the extent amounts due to the Fund from its counterparties are not fully collateralized, contractually or otherwise, the Fund bears the risk of loss from counterparty non-performance. The Fund’s investment adviser attempts to limit counterparty risk by only entering into Master Agreements with counterparties which the investment adviser believes to have the financial resources to honor their obligations and by monitoring the financial stability of those counterparties. For swap agreements executed with a Derivatives Clearing Organization (“DCO”) in a multilateral or other trade facility platform (“centrally cleared swaps”), counterparty risk is reduced by shifting exposure from the counterparty to the DCO. Additionally, the DCO has broad powers to provide an orderly liquidation in the event of a default.
Master Repurchase Agreements and Global Master Repurchase Agreements (individually and collectively “Master Repo Agreements”). Master Repo Agreements govern repurchase, reverse repurchase and treasury roll transactions between the Fund and select counterparties. The Master Repo Agreements maintain provisions for, among other things, initiation and confirmation, income payments and transfer, events of default, termination, and maintenance of collateral. In the event of default, the total value exposure will be offset against collateral exchanged to date, which would result in a net receivable/(payable) that would be due from/to the counterparty. Securities purchased under repurchase agreements are reflected as an asset on the Statement of Assets and Liabilities. The value of repurchase agreements and collateral pledged or received by a counterparty are disclosed in the Investment Portfolio. The Fund’s net exposure to the counterparty is determined by the amount of any excess or shortfall in collateral compared to the value of the repurchase or reverse repurchase agreement.
Master Securities Forward Transaction Agreements (“Master Forward Agreements”). Master Forward Agreements govern the considerations and factors surrounding the settlement of certain forward-settling transactions, such as delayed-delivery transactions, TBA securities and treasury roll transactions between the Fund and select counterparties. The Master Forward Agreements maintain provisions for, among other things, initiation and confirmation, payment and transfer, events of default, termination, and maintenance of collateral. Losses may arise due to changes in the value of the underlying securities prior to settlement date, if the counterparty does not perform under the contract’s terms, or if the issuer does not issue the securities due to political, economic or other factors. In the event of default, the unrealized gain or loss will be offset against
Montgomery Street Income Securities, Inc. (Unaudited)
Notes to Financial Statements
June 30, 2015
collateral exchanged to date, which would result in a net receivable/(payable) that would be due from/to the counterparty. In the ordinary course of business, settlements of transactions, are not typically subject to net settlement, except for TBA pools.
International Swaps and Derivatives Association Inc. Master Agreements and Credit Support Annexes (“ISDA Master Agreements”). ISDA Master Agreements govern OTC financial derivative transactions entered into by the Fund’s investment adviser and select counterparties. The ISDA Master Agreements maintain provisions for general obligations, representations, agreements, events of default, termination and maintenance of collateral. Termination includes conditions that may entitle counterparties to elect to terminate early and cause settlement of all outstanding transactions under the applicable ISDA Master Agreement. Any election to early termination could be material to the financial statements. In the event of default, the total financial derivative value exposure will be offset against collateral exchanged to date, which would result in a net receivable/(payable) that would be due from/to the counterparty. The amount of collateral exchanged is based on provisions within the ISDA Master Agreements and is determined by the net exposure with the counterparty and is not identified for a specific OTC derivative instrument.
Customer Account Agreements. Customer Account Agreements and related addendums govern cleared derivative transactions such as futures, options on futures and centrally cleared derivatives. If a Fund transacts in centrally cleared derivatives, the investment adviser is a party to agreements with (1) a Futures Commissions Merchant (“FCM”) in which the FCM facilitates the execution of the centrally cleared derivative with the DCO and (2) with an executing broker/swap dealer to agree to the terms of the swap and resolution process in the event the centrally cleared swap is not accepted for clearing by the designated DCO. Cleared derivatives transactions require posting an amount of cash or cash equivalents equal to a certain percentage of the contract amount known as the “initial margin” as determined by each relevant clearing agency and is segregated at an FCM which is registered with the Commodity Futures Trading Commission (“CFTC”) or the applicable regulator. The Fund receives from, or pays to, the counterparty an amount of cash equal to the daily fluctuation in the value of the contracts. Such receipts or payments are known as the “variation margin”. Variation margin received may not be netted between futures and centrally cleared derivatives. In the event of default, counterparty risk is significantly reduced as creditors to the FCM do not have claim to the Fund’s assets in the segregated account. Additionally, portability of exposure in the event of default further reduces risk.
F. Financial Derivative Instruments
Futures Contracts. The Fund may buy and sell futures on interest rates and currencies. A futures contract is a standardized contract obligating two parties to exchange a specified asset at an agreed upon price and date. Variation margin is recorded by the Fund until the contracts are terminated at which time realized gains and losses are recognized. Futures contracts involve, to varying degrees, risk of loss in excess of the variation margin recorded by the Fund. The primary risks associated with the use of futures contracts are the imperfect correlation between the change in value of the securities held by the Fund and the prices of the futures contracts and the possibility the Fund may not be able to enter into a closing transaction because of an illiquid market. With futures, counterparty risk to the Fund is reduced since futures contracts are exchange traded and the exchange’s clearinghouse, acting as counterparty to all exchange traded futures, guarantees the futures contracts against default.
Options Contracts. The Fund may buy and sell (“write”) call and put options on securities, futures, currencies and swap agreements (“swaptions”). An option is a contract that gives the purchaser of the option, in return for a premium paid, the right to buy a specified underlying instrument from the writer of the option (in the case of a call option), or to sell a specified underlying instrument to the writer of the option (in the case of a put option) at a designated price. The right to exercise is dependent upon the contract terms and can be during the term or at expiration of the option. When the Fund purchases an option, the premium paid by the Fund is recorded as an asset and is subsequently marked-to-market to reflect the current value of the option. Premiums paid for purchasing options which expire are treated as realized losses. Premiums paid for purchasing options which are exercised or closed are added to the cost basis of the underlying investment or offset against the proceeds of the underlying investment transaction to determine realized gain or loss. Purchasing call options tends to increase the Fund’s exposure to the underlying instrument. Purchasing put options tends to decrease the Fund’s exposure to the underlying instrument. The risks associated with purchasing options are limited to premiums paid and the
Montgomery Street Income Securities, Inc. (Unaudited)
Notes to Financial Statements
June 30, 2015
failure of the counterparty to honor its obligation under the contract. When the Fund sells (“writes”) a call or put option, the premium received by the Fund is recorded as a liability and is subsequently marked-to-market to reflect the current value of the option. Premiums received from writing options which expire are treated as realized gains. Premiums received from writing options which are exercised or closed are added to the proceeds of the underlying investment transaction or reduce the cost basis of the underlying investment to determine the realized gain or loss. Writing call options tends to decrease the Fund’s exposure to the underlying instrument. Writing put options tends to increase the Fund’s exposure to the underlying instrument. The risk associated with writing an option that is exercised is that an unfavorable change in the price of the security underlying the option could result in the Fund buying the underlying security at a price higher than the current value or selling the underlying security at a price lower than the current market value. There is also the risk the Fund may not be able to enter into a closing transaction if the market is illiquid. Options written by the Fund do not give rise to counterparty credit risk, as they obligate the Fund, not the counterparty, to perform.
Depending on the exchange on which an exchange traded futures option is traded, premium may be paid/received when purchasing/writing the option or there may be no premium paid/received when purchasing/writing the option. Exchange traded futures options are marked-to-market daily and the change in value is recorded by the Fund as an unrealized gain or loss. Variation margin on these options is recorded by the Fund until the contracts are terminated at which time realized gains and losses are recognized. Exchange traded futures options involve to varying degrees, risk of loss in excess of the variation margin recorded by the Fund.
Swaptions are similar to options on securities except that instead of purchasing the right to buy or sell a security, the writer or purchaser of the swaption is granting or buying the right to enter into a previously agreed upon interest rate swap agreement. The right to exercise is dependent upon the contract terms and can be during the term or at expiration of the option. Swaptions are illiquid investments.
Options contracts involve, to varying degrees, risk of loss in excess of the premium paid or received recorded by the Fund. The primary risks associated with the use of option contracts on futures contracts involve similar risks to trading in the underlying futures contracts, including the imperfect correlation between the change in value of the securities held by the Fund and the prices of the underlying futures contracts and the possibility the Fund may not be able to enter into a closing transaction because of an illiquid market. Certain option contracts entered into by the Fund during the period were traded on public markets that are regulated by the U.S. Commodity Futures Trading Commission (“CFTC”). Similar to futures contracts, counterparty risk to the Fund is reduced since the options on futures contracts traded by the Fund were exchange traded and the exchange’s clearing house, as counterparty to all exchange traded options, guarantees the options contracts against default.
Forward Foreign Currency Contracts. A forward foreign currency contract is an agreement between two parties to buy and sell a currency at a set price on a future date. The use of forward foreign currency contracts does not eliminate fluctuations in the underlying prices of the Fund’s portfolio securities, but it does establish a fixed rate of currency exchange that can be achieved in the future. The value of a forward foreign currency contract fluctuates with changes in foreign currency exchange rates. Forward foreign currency contracts are marked-to-market daily and the change in value is recorded by the Fund as an unrealized gain or loss and as a receivable or payable from forward foreign currency contracts. Upon settlement, or delivery or receipt of the currency, a realized gain or loss is recorded, which is equal to the difference between the value of the contract at the time it was opened and the value at the time it was closed. Forward foreign currency contracts involve market risk in excess of the receivable or payable related to forward foreign currency contracts recorded by the Fund. Although contracts limit the risk of loss due to a decline in the value of the hedged currency, they also limit any potential gain that might result should the value of the currency increase. Additionally, the Fund could be exposed to the risk of a previously hedged position becoming unhedged if the counterparty to a contract is unable to meet the terms of the contract or if the value of the currency changes unfavorably to the offsetting currency.
Swap Agreements. Swap agreements are bilaterally negotiated agreements between the Fund and a counterparty to exchange or swap investment cash flows, assets, foreign currencies or market-linked returns at specified, future intervals. Swap agreements may be privately negotiated in the OTC market or executed and centrally cleared with a DCO. OTC swaps are typically illiquid investments.
Montgomery Street Income Securities, Inc. (Unaudited)
Notes to Financial Statements
June 30, 2015
Swap agreements are marked-to-market daily and the change in value is recorded by the Fund as an unrealized gain or loss. For OTC swaps, premiums paid or received at the beginning of the measurement period are recorded as an asset or liability by the Fund and represent payments made or received upon entering into the OTC swap to compensate for differences between the stated terms of the OTC swap and prevailing market conditions relating to credit spreads, interest rates, currency exchange rates and other relevant factors as appropriate. These upfront payments are recorded as a realized gain or loss upon termination or maturity of the OTC swap. For centrally cleared swaps, daily changes in valuation are recorded as a receivable or payable, as appropriate, and received from or paid to the DCO on a daily basis until the contracts are terminated at which time a realized gain or loss is recorded. The use of centrally cleared swaps may require the Fund to commit initial and variation margin that may otherwise not be required under an OTC swap. A liquidation payment received or made at the termination of the swap agreement is recorded as a realized gain or loss. Net periodic payments received or paid by the Fund are included as part of realized gain or loss.
Entering into swap agreements involves, to varying degrees, elements of interest, credit, market and documentation risk in excess of the unrealized gain or loss recorded by the Fund. Such risks include that there is no liquid market for OTC swaps, that the counterparty to the agreements may default on its obligation to perform or disagree as to the meaning of contractual terms in the agreement and that there may be unfavorable changes in interest rates or value of underlying securities. Centrally cleared swaps involve to varying degrees, risk of loss in excess of the variation margin recorded by the Fund.
Interest Rate Swap Agreements. Interest rate swap agreements involve the exchange by the Fund with another party of their respective commitments to pay or receive interest with respect to the notional amount of principal. Interest rate swap agreements that the Fund entered into include: fixed-for-floating rate swaps, under which a party agrees to pay a fixed rate in exchange for receiving a floating rate tied to a benchmark and floating-for-fixed rate swaps, under which a party agrees to pay a floating rate in exchange for receiving a fixed rate.
The Fund’s maximum risk of loss from counterparty credit risk for an interest rate swap agreement is the discounted net value of the cash flows to be received from the counterparty over the contract’s remaining life, to the extent this amount is positive.
Credit Default Swap Agreements. Credit default swap agreements involve one party making a stream of payments (referred to as the buyer of protection) to another party (the seller of protection) in exchange for the right to receive a specified return if a credit event occurs for the referenced entity, obligation or index. As a seller of protection, the Fund will generally receive from the buyer of protection a premium in return for such protection and/or a fixed rate of income throughout the term of the swap if there is no credit event. A credit event is defined under the terms of each swap agreement and may include, but is not limited to, underlying entity default, bankruptcy, restructuring, write-down, principal shortfall or interest shortfall. As a seller, the Fund adds leverage to its portfolio because, in addition to its total net assets, the Fund is subject to investment exposure on the notional amount of the swap. If the Fund is a seller or buyer of protection and a credit event occurs, as defined under the terms of that particular swap agreement, the Fund will either pay to or receive from the buyer or seller of protection an amount prescribed in that particular swap agreement. Until a credit event occurs, recovery values are determined by market makers considering either industry standard recovery rates or entity specific factors and considerations. When a credit event occurs, the recovery value is determined by a facilitated auction, administered by ISDA, whereby a minimum number of allowable broker bids, together with a specified valuation method, are used to calculate the settlement value.
The Fund may use credit default swap agreements on corporate or sovereign issues to provide a measure of protection against defaults of an issuer (i.e., to reduce risk where the Fund owns or has exposure to the referenced obligation) or to take an active long or short position with respect to the likelihood of a particular issuer’s default. If a credit event occurs and cash settlement is not elected, a variety of other deliverable obligations may be delivered in lieu of the specific referenced obligation. The ability to deliver other obligations may result in a cheapest-to-deliver option (the buyer of protection’s right to choose the deliverable obligation with the lowest value following a credit event).
Montgomery Street Income Securities, Inc. (Unaudited)
Notes to Financial Statements
June 30, 2015
The Fund may use credit default swap agreements on credit indices to hedge a portfolio of credit default swap agreements or bonds, to protect investors owning bonds against default and to speculate on changes in credit quality. A credit index is a basket of credit instruments or exposures designed to represent a portion of the credit market. These indices consist of reference credits that are considered to be the liquid entities in the credit default swap market based on the index sector. Components of the indices may include, but are not limited to, investment grade securities, high yield securities, asset-backed securities and emerging market securities. These components can be determined based upon various credit ratings within each sector. Credit indices are traded using credit default swaps with standardized terms including a fixed spread and standard maturity dates. An index credit default swap references all the issuers in the index, and if there is a credit event, the credit event is settled based on that issuer’s weight in the index. The composition of the indices changes periodically, usually every six months, and for most indices, each issuer has an equal weight in the index.
Either as a seller of protection or a buyer of protection of a credit default swap agreement, the Fund’s maximum risk of loss from counterparty risk is the fair value of the agreement. The maximum potential amount of future payments (undiscounted) that the Fund as a seller of protection could be required to make under a credit default swap agreement would be an amount equal to the notional amount of the agreement. Notional amounts of all credit default swap agreements outstanding, as of June 30, 2015, for which the Fund is a seller of protection, are disclosed in the Notes to the Investment Portfolio. These potential amounts would be partially offset by any recovery values of the respective referenced obligations, upfront payments received upon entering into the agreement or net amounts received from the settlement of buy protection credit default swap agreements entered into by the Fund for the same referenced entity or entities.
FASB ASC Topic 815, “Derivatives and Hedging” and Financial Instruments Eligible for Offset. FASB ASC Topic 815 includes the requirement for enhanced qualitative disclosures about objectives and strategies for using derivative instruments and disclosures regarding credit related contingent features in derivative instruments; as well as quantitative disclosures in the semi-annual and annual financial statements about fair value, gains and losses, and volume of activity for derivative instruments. Information about these instruments is disclosed in the context of each instrument’s primary underlying risk exposure, which is categorized as credit, equity price, interest rate and foreign currency exchange rate risk. The following disclosures include: (1) Objectives and strategies for the Fund’s derivative investments during the year; (2) A summary table of the fair valuations of the Fund’s derivative instruments categorized by risk exposure, which references the location on the Statement of Assets and Liabilities and the realized and unrealized gain or loss on the Statement of Operations for each derivative instrument as of June 30, 2015; (3) A summary table of derivative instruments and certain investments of the Fund, which are subject to master netting agreements or a similar agreement and are eligible for offset in the Statement of Assets and Liabilities as of June 30, 2015; and (4) A table reflecting the Fund’s average monthly derivative volume for the period ended June 30, 2015.
Objectives and Strategies. The Fund entered into futures contracts to obtain exposure to or hedge changes in interest rates, as a substitute for investment in physical securities and as an efficient means of adjusting overall exposure to certain markets as part of its overall investment strategy. The Fund purchased and wrote option contracts to obtain exposure to or hedge changes in interest rates, to obtain exposure to or hedge changes in foreign currencies and to obtain exposure to or hedge changes in inflation. The Fund entered into forward foreign currency contracts to minimize foreign currency risk on portfolio securities denominated in foreign currencies. The Fund entered into interest rate swap agreements to manage duration, to obtain interest rate and yield curve exposure and as a substitute for investment in physical securities. The Fund entered into credit default swap agreements on corporate issues, sovereign issues and indices to obtain credit exposure.
Montgomery Street Income Securities, Inc. (Unaudited)
Notes to Financial Statements
June 30, 2015
Derivative Instruments Categorized by Risk Exposure
| | | | | | | | | | | | | | | | | | | | |
| | | Credit Contracts | | | Equity Contracts | | | Foreign Exchange Contracts | | | Interest Rate Contracts | | | Total | |
| | | | |
Fair values of derivative instruments on the Statement of Assets and Liabilities as of June 30, 2015: | |
Assets: | | | | | | | | | | | | | | | | | | | | |
Investments – unaffiliated, at value2 | | $ | — | | | $ | — | | | $ | — | | | $ | 25,452 | | | $ | 25,452 | |
Forward foreign currency contracts | | | — | | | | — | | | | 305,767 | | | | — | | | | 305,767 | |
Variation margin on financial derivative instruments | | | 36,832 | | | | — | | | | — | | | | 64,520 | | | | 101,352 | |
Unrealized appreciation on OTC swap agreements | | | 196,213 | | | | — | | | | — | | | | 7,677 | | | | 203,890 | |
OTC swap premiums paid | | | 91,115 | | | | — | | | | — | | | | 4,639 | | | | 95,754 | |
| | | | |
| | $ | 324,160 | | | $ | — | | | $ | 305,767 | | | $ | 102,288 | | | $ | 732,215 | |
Liabilities: | | | | | | | | | | | | | | | | | | | | |
Options written, at value | | $ | 18,871 | | | $ | — | | | $ | — | | | $ | 184,374 | | | $ | 203,245 | |
Forward foreign currency contracts | | | — | | | | — | | | | 652,821 | | | | — | | | | 652,821 | |
Variation margin on financial derivative instruments | | | — | | | | — | | | | — | | | | 15,603 | | | | 15,603 | |
Unrealized depreciation on OTC swap agreements | | | 142,521 | | | | — | | | | — | | | | 36,590 | | | | 179,111 | |
OTC swap premiums received | | | 226,677 | | | | — | | | | — | | | | 5,431 | | | | 232,108 | |
| | | | |
| | $ | 388,069 | | | $ | — | | | $ | 652,821 | | | $ | 241,998 | | | $ | 1,282,888 | |
The effect of derivative instruments on the Statement of Operations for the period ended June 30, 2015: | |
Net realized gain (loss) on: | |
Unaffiliated investments2 | | $ | — | | | $ | 237,649 | | | $ | — | | | $ | — | | | $ | 237,649 | |
Futures contracts | | | — | | | | — | | | | — | | | | (28,026) | | | | (28,026) | |
Swap agreements | | | (421) | | | | — | | | | — | | | | (7,905) | | | | (8,326) | |
Written option contracts | | | 41,122 | | | | 140,781 | | | | 23,299 | | | | 164,301 | | | | 369,503 | |
Foreign currency related items | | | — | | | | — | | | | 2,264,839 | | | | — | | | | 2,264,839 | |
| | | | |
| | $ | 40,701 | | | $ | 378,430 | | | $ | 2,288,138 | | | $ | 128,370 | | | $ | 2,835,639 | |
Net change in unrealized appreciation (depreciation) on: | |
Investments2 | | $ | — | | | $ | 5,800 | | | $ | — | | | $ | (11,614) | | | $ | (5,814) | |
Futures contracts and centrally cleared swap agreements | | | (160,009) | | | | (14) | | | | — | | | | 232,968 | | | | 72,945 | |
OTC swap agreements | | | 233,099 | | | | — | | | | — | | | | 38,455 | | | | 271,554 | |
Written option contracts | | | (26,391) | | | | (14,800) | | | | 6,202 | | | | 56,756 | | | | 21,767 | |
Foreign currency related items | | | — | | | | — | | | | (796,756) | | | | — | | | | (796,756) | |
| | | | |
| | $ | 46,699 | | | $ | (9,014) | | | $ | (790,554) | | | $ | 316,565 | | | $ | (436,304) | |
Derivative and Financial Instruments Eligible for Offset
| | | | | | | | | | | | | | | | | | | | | | | | |
| | | Gross Amount | | | | | | | | | | | | | | | | |
| | | Presented in | | | | | | | | | | | | | | | | |
| | | the | | | | | | | | | | | | | | | | |
| | | Statements of | | | | | | | | | | | | | | | | |
| | | Assets and | | | Financial | | | | | | | | | Total Collateral 7 | |
| | | Liabilities 3 | | | Instruments 4 | | | Collateral 5 | | | Net Amount 6 | | | Cash | | | Security | |
| | | | | | | | |
Derivative Assets by Counterparty* | |
BBP | | $ | 125,214 | | | $ | (85,152 | ) | | $ | — | | | $ | 40,062 | | | $ | — | | | $ | — | |
DUB | | | — | | | | — | | | | — | | | | — | | | | 60,000 | | | | — | |
GSB | | | 294,687 | | | | (294,687 | ) | | | — | | | | — | | | | — | | | | — | |
GSI | | | 115,208 | | | | (115,208 | ) | | | — | | | | — | | | | — | | | | — | |
| | | | | | | | | | | | |
Derivatives eligible for offset | | $ | 535,109 | | | $ | (495,047 | ) | | $ | — | | | $ | 40,062 | | | | | | | | | |
Derivatives not eligible for offset | | | 197,106 | | | | | | | | | | | | | | | $ | — | | | $ | — | |
| | | | | | | | | | | | | | | | | | | | | | | | |
| | $ | 732,215 | | | | | | | | | | | | | | | | | | | | | |
Derivative Liabilities by Counterparty* | |
BBP | | $ | 85,152 | | | $ | (85,152 | ) | | $ | — | | | $ | — | | | $ | — | | | $ | — | |
GSB | | | 819,068 | | | | (294,687 | ) | | | — | | | | 524,381 | | | | — | | | | — | |
GSI | | | 130,957 | | | | (115,208 | ) | | | (15,749 | ) | | | — | | | | — | | | | 414,750 | |
| | | | | | | | | | | | |
Derivatives eligible for offset | | $ | 1,035,177 | | | $ | (495,047 | ) | | $ | (15,749 | ) | | $ | 524,381 | | | | | | | | | |
Derivatives not eligible for offset | | | 247,711 | | | | | | | | | | | | | | | $ | 2,231,000 | | | $ | — | |
| | | | | | | | | | | | | | | | | | | | | | | | |
| | $ | 1,282,888 | | | | | | | | | | | | | | | | | | | | | |
Montgomery Street Income Securities, Inc. (Unaudited)
Notes to Financial Statements
June 30, 2015
| | | | | | | | | | | | | | | | | | | | | | | | |
| | | Gross Amount
Presented in
the Statement
of Assets and | | | Financial
Instruments 4 | | | Collateral 5 | | | Net Amount 8 | | | Total Collateral 7 | |
| | | Liabilities 8 | | | | | | Cash | | | Security | |
| | | | | | | | |
| Master Forward Agreement Transaction Assets by Counterparty* | | | | | | | | | | | | | | | | | | | | | |
GSC | | $ | 12,576,641 | | | $ | (12,507,518) | | | $ | — | | | $ | 69,123 | | | $ | — | | | $ | — | |
| | | | | | | | |
| | $ | 12,576,641 | | | $ | (12,507,518) | | | $ | — | | | $ | 69,123 | | | | | | | | | |
| Master Forward Agreement Transaction Liabilities by Counterparty* | | | | | | | | | | | | | | | | | | | | | |
GSC | | $ | 12,507,518 | | | $ | (12,507,518) | | | $ | — | | | $ | — | | | $ | — | | | $ | — | |
| | | | | | | | |
| | $ | 12,507,518 | | | $ | (12,507,518) | | | $ | — | | | $ | — | | | | | | | | | |
Average Derivative Volume1
| | | | | | | | | | | | | | | | | | | | |
| | | Cost of
Options
Purchased
and Written | | | Notional
Value at
Purchase of
Futures
Contracts | | | Cost of
Forward
Foreign
Currency
Contracts | | | Notional
Amount of
Interest
Rate Swap
Agreements | | | Notional
Amount of
Credit
Default
Swap
Agreements | |
| | | | |
Average monthly volume | | $ | 840,744 | | | $ | 65,321,331 | | | $ | 48,428,154 | | | $ | 29,766,416 | | | $ | 70,659,369 | |
1 The derivative instruments outstanding as of June 30, 2015, as disclosed in the Notes to Investment Portfolio and the amounts of realized and changes in unrealized gains and losses on derivative instruments during the period ended June 30, 2015, as disclosed in the Statement of Operations, also serve as indicators of the derivative volume for the Funds.
2 Purchased options market value is reflected in Investments, at value. Realized gain (loss) and change in unrealized appreciation (depreciation) on purchased options are reflected in realized gain (loss) on investments and change in unrealized appreciation (depreciation) on investments, respectively, in the Statement of Operations.
3 Amounts eligible for offset are presented gross in the Statement of Assets and Liabilities.
4 Financial instruments eligible for offset but not offset in the Statement of Assets and Liabilities.
5 Cash and security collateral not offset in the Statements of Assets and Liabilities. For derivative assets and liabilities, amounts do not reflect over-collateralization.
6 For assets, net amount represents the amount payable by the counterparty to the Fund in the event of default. For liabilities, net amount represents the amount payable by the Fund to the counterparty in the event of default.
7 Cash and security collateral pledged or segregated for derivative investments. For assets, amount reflects collateral received from or segregated by the counterparty. For liabilities, amount reflects collateral pledged or segregated by the Fund. Collateral for derivatives not eligible for offset includes amounts pledged for margin purposes.
8 Investment liabilities and assets include delayed delivery securities and secured borrowings. Liabilities reflect amounts payable to the counterparty for the market value of the investments, assets reflect the cost of the investment and the net amount reflects net unrealized gain or loss. The net unrealized gain or loss constitutes the amount which is subject to margin or collateral requirements as required under the Master Forward Agreement.
* Counterparties are defined on page 13 in the Investment Portfolio.
G. Purchases and Sales of Securities
During the period ended June 30, 2015, purchases and sales of investment securities, excluding U.S. government obligations and short-term investments, aggregated $72,770,343 and $57,982,002 respectively. During the period ended June 30, 2015, purchases and sales of long-term U.S. government obligations aggregated $44,043,470 and $35,578,969, respectively.
Subject to compliance with Rule 17a-7 under the 1940 Act, the Adviser is permitted to cause the Fund to purchase securities from or sell securities to another account, including another investment company, advised by the Adviser.
There are occasions when portfolio transactions for the Fund are executed as part of concurrent authorizations to purchase or sell the same security for the Fund and for other accounts served by the Adviser or an affiliated company. They are effected only when the Adviser believes that to do so is in the best interest of the Fund and the other accounts participating. When such concurrent authorizations occur, the executions will be allocated in an equitable manner.
Montgomery Street Income Securities, Inc. (Unaudited)
Notes to Financial Statements
June 30, 2015
H. Fees and Agreements
Investment Advisory Agreement. Pursuant to an Investment Advisory Agreement, the Fund pays PIMCO a quarterly fee at the annual rate of 0.25% of the average daily net assets of the Fund.
Fund Accounting and Administration Services Agreement. Pursuant to a Fund Accounting and Administration Services Agreement, the Fund pays JFS an annual fee, payable monthly, equal to 0.25% of the average daily value of the net assets of the Fund up to $100 million; 0.20% of the average daily value of the net assets of the Fund from $100 million to $200 million; and 0.15% of the average daily value of the net assets of the Fund over $200 million. JFS makes individuals available to the Fund to serve as its officers. Officers are not directly compensated by the Fund.
Directors’ Fees and Expenses. The Fund pays each Director of the Board a specified retainer fee plus specified amounts for each Board and Committee meeting attended.
I. Income Tax Matters
The following information is presented on an income tax basis. The timing and characterization of certain income and capital gains are determined in accordance with federal tax regulations, which may differ from GAAP. These differences primarily relate to timing differences in recognizing certain gains and losses on investment transactions and accounting treatment for notional principal contracts. To the extent that differences arise that are permanent in nature, such amounts are reclassified within the components of net assets on the Statement of Assets and Liabilities based on their federal income tax treatment; timing differences do not require reclassification. Permanent differences may include but are not limited to the following: foreign currency reclassifications, paydown reclassifications, accounting treatment of notional principal contracts and distribution adjustments. Timing and permanent differences do not impact the NAV of the Fund.
At June 30, 2015, the cost of investments and the components of net unrealized appreciation/(depreciation) were as follows:
| | | | | | |
Cost of Investments | | Gross Unrealized Depreciation | | Gross Unrealized Appreciation | | Net Unrealized Appreciation |
| $196,101,155 | | $(3,031,371) | | $5,173,790 | | $2,142,419 |
The distributions paid of $7,566,445 for the year ended December 31, 2014, were from net ordinary income.
At December 31, 2014, the Fund’s last fiscal year end, the Fund had unused capital loss carryforwards available for federal income tax purposes which may be applied against any future realized net taxable capital gains or until the respective expiration dates occur as noted below.
| | |
Years of Expiration | | Amount |
2016 | | $ 9,396,208 |
| 2017 | | 11,494,100 |
Total | | $ 20,890,308 |
The Fund had $40,391 of capital losses realized from November 1, 2014, through December 31, 2014, which were deferred for tax purposes to January 1, 2015, the first day of the current fiscal year.
FASB ASC Topic 740, “Income Taxes”, provides guidance for how uncertain tax positions should be recognized, measured, presented and disclosed in the financial statements. FASB ASC Topic 740 requires the evaluation of tax positions taken or expected to be taken in the course of preparing the Fund’s tax returns to determine whether the tax positions are “more-likely-than-not” of being sustained by the applicable tax authority. Tax positions not deemed to meet the “more-likely-than-not” threshold would result in the Fund recording a tax expense in the current year. FASB ASC Topic 740 requires that management evaluate the tax positions taken in returns for 2011 through 2014 which remain subject to examination, by the Internal Revenue Service and certain other jurisdictions. Management completed an evaluation of the Fund’s tax positions and based on that evaluation, determined that no provision for federal income tax was required in the Fund’s financial statements during the period ended June 30, 2015.
Montgomery Street Income Securities, Inc. (Unaudited)
Notes to Financial Statements
June 30, 2015
J. Share Repurchases
Under the Fund’s limited repurchase program, the Fund is authorized to effect repurchases of its shares in the open market from time to time when the Fund’s shares trade at a discount to their NAV. During the period ended June 30, 2015, the Fund purchased 9,000 shares of common stock on the open market at a total cost of $149,923. The weighted average discount of these purchases, comparing the purchase price to the NAV at the time of purchase, was 8.58%. During the year ended December 31, 2014, the Fund purchased 15,000 shares of common stock on the open market at a total cost of $245,868. The weighted average discount of these purchases, comparing the purchase price to the NAV at the time of purchase, was 9.99%.
K. Subsequent Events
Management has evaluated subsequent events for the Fund through the date the financial statements are issued, and the following events occurred:
On June 1, 2015, the Board approved Atlantic Fund Administration, LLC (“Atlantic”) as the Fund’s new Administrator effective close of business July 31, 2015.
No other events were noted that required adjustments to the financial statements or disclosure in the notes to financial statements.
Montgomery Street Income Securities, Inc. (Unaudited)
Dividend Reinvestment and Cash Purchase Plan (“Plan”)
June 30, 2015
All registered stockholders of the Fund’s Common Stock are offered the opportunity of participating in the Plan. Registered stockholders, on request or on becoming registered stockholders, are mailed information regarding the Plan, including a form by which they may elect to participate in the Plan and thereby cause their future net investment income dividends and capital gains distributions to be invested in shares of the Fund’s common stock. The Custodian is the agent (the “Plan Agent”) for stockholders who elect to participate in the Plan.
If a stockholder chooses to participate in the Plan, the stockholder’s dividends and capital gains distributions will be promptly invested, automatically increasing the stockholder’s holdings in the Fund. If the Fund declares a dividend or capital gains distributions payable either in cash or in stock of the Fund, the stockholder will automatically receive stock. If the market price per share on the payment date for the dividend (the “Valuation Date”) equals or exceeds the net asset value per share, the Fund will issue new shares to the stockholder at the greater of the following on the Valuation Date: (a) net asset value per share or (b) 95% of the market price per share. If the market price per share on the Valuation Date is less than the net asset value per share, the Fund will issue new shares to the stockholder at the market price per share on the Valuation Date. In either case, for federal income tax purposes the stockholder will be deemed to receive a distribution equal to the market value on the Valuation Date of the new shares issued. If dividends or capital gains distributions are payable only in cash, then the stockholder will receive shares purchased on the New York Stock Exchange or otherwise on the open market. In this event, for federal income tax purposes the amount of the distribution will equal the cash distribution paid. State and local taxes may also apply. All reinvestments are in full and fractional shares, carried to three decimal places.
Stockholders participating in the Plan can also purchase additional shares quarterly in any amount from $100 to $5,000 (a “Voluntary Cash Investment”) by sending in a check together with the cash remittance slip, which will be sent with each statement of the stockholder’s account, to Computershare, the Fund’s transfer agent (the “Transfer Agent”). Such additional shares will be purchased on the open market by the Plan Agent or its delegate. The purchase price of shares purchased on the open market, whether pursuant to a reinvestment of dividends payable only in cash or a Voluntary Cash Investment, will be the average price (including brokerage commissions) of all shares purchased by the Plan Agent or its delegate on the date such purchases are affected. In addition, stockholders may be charged a service fee in an amount up to 5% of the value of the Voluntary Cash Investment. Although subject to change, stockholders are currently charged $1 for each Voluntary Cash Investment.
Stockholders may terminate their participation in the Plan at any time and elect to receive dividends and other distributions in cash by notifying the Transfer Agent in writing. Such notification must be received not less than 10 days prior to the record date of any distribution. There is no charge or other penalty for such termination. The Plan may be terminated by the Fund upon written notice mailed to the stockholders at least 30 days prior to the record date of any distribution. Upon termination, the Fund will issue certificates for all full shares held under the Plan and cash for any fractional share.
Alternatively, stockholders may request the Transfer Agent to instruct the Plan Agent or its delegate to sell any full shares and remit the proceeds, less a $2.50 service fee and less brokerage commissions. The sale of shares (including fractional shares) will be a taxable event for federal income tax purposes and may be taxable for state and local tax purposes.
The Plan may be amended by the Fund at any time. Except when required by law, written notice of any amendment will be mailed to stockholders at least 30 days prior to its effective date. The amendment will be deemed accepted unless written notice of termination is received by the Transfer Agent prior to the effective date.
An investor holding shares in its own name can participate directly in the Plan. An investor holding shares in the name of a brokerage firm, bank or other nominee should contact that nominee, or any successor nominee, to determine whether the nominee can participate in the Plan on the investor’s behalf and to make any necessary arrangements for such participation.
Additional information, including a copy of the Plan and its Terms and Conditions and an enrollment form, can be obtained from the Transfer Agent by writing Computershare, P.O. Box 43006, Providence, RI 02940-3006, or by calling (877) 437-3938.
Montgomery Street Income Securities, Inc. (Unaudited)
Stockholder Meeting Results
June 30, 2015
Stockholder Meeting Results
The Annual Meeting of Stockholders of the Fund was held on July 21, 2015 at 4 Embarcadero Center, 22nd Floor, San Francisco, California. At the meeting, the following matter was voted upon and approved by the stockholders: To elect five Directors of the Fund to hold office until the next annual meeting or until their respective successors shall have been duly elected and qualified.
| | | | | | | | |
| | | Number of Votes: | |
| Directors | | For | | | Withheld | |
Richard J. Bradshaw | | | 7,308,558 | | | | 2,120,554 | |
Victor L. Hymes | | | 7,308,385 | | | | 2,120,727 | |
Richard H. Stanton | | | 7,280,067 | | | | 2,149,044 | |
Wendell G. Van Auken | | | 7,305,024 | | | | 2,124,088 | |
Nancy E. Wallace | | | 7,284,746 | | | | 2,144,366 | |
DIRECTORS
RICHARD J. BRADSHAW
Chairman
VICTOR L. HYMES
RICHARD S. STANTON
WENDELL G. VAN AUKEN
NANCY E. WALLACE
OFFICERS (Through July 31, 2015)
MARK D. NERUD
President and Chief Executive Officer
DANIEL W. KOORS
Treasurer and Chief Financial Officer
DIANA R. GONZALEZ
Chief Legal Officer
JOSEPH B. O’BOYLE
Chief Compliance Officer
EMILY J. BENNETT
Secretary
DANIELLE A. BERGANDINE
Assistant Secretary
OFFICERS (Effective August 1, 2015)
STACEY E. HONG
President and Chief Executive Officer
MICHAEL J. MCKEEN
Treasurer and Chief Financial Officer
GINO MALASPINA
Chief Legal Officer
DENNIS MASON
Chief Compliance Officer
ZACHARY TACKETT
Secretary
TIMOTHY BOWDEN
Vice President
GEOFFREY NEY
Vice President
WENDELL SCOTT
Vice President
Montgomery Street Income Securities, Inc. (Unaudited)
Investment Advisory Agreement Approval
June 30, 2015
At a meeting held on April 23, 2015, the Board, including the Directors of the Fund who were not parties to the agreement or “interested persons” of any such party as defined in the Investment Company Act of 1940, as amended (“1940 Act”), (the “Independent Directors”), voted to continue the Investment Advisory Agreement (the “Agreement”) with PIMCO until July 31, 2015.
In reviewing the Agreement, the Board considered, among other information, the written and oral reports provided by PIMCO, Jackson Fund Services (“JFS”), and Lipper, Inc. In addition, the Board took into account information provided at previous meetings and information provided about PIMCO and other potential advisers developed in connection with the Board’s search for a new adviser in 2010.
Nature, Extent, and Quality of Services. The Board examined the nature, extent, and quality of the advisory services provided and to be provided to the Fund by PIMCO. The Board considered the terms of the Investment Advisory Agreement, the experience and qualifications of PIMCO and its personnel in managing fixed-income instruments, PIMCO’s investment strategy for the Fund, and the risk profile of the Fund’s investments. The Board also considered the experience of PIMCO in managing open- and closed-end funds, the availability and responsiveness of PIMCO’s personnel, the extent and quality of information provided by PIMCO to the Board, PIMCO’s compliance policies and procedures and attention to compliance matters, and the extent of any regulatory issues relating to PIMCO or its affiliates. Further, the Board considered the stability of the PIMCO organization and turnover in its personnel and assets under management, the overall commitment of PIMCO to the Fund, and the general financial condition, resources, and reputation of PIMCO and its parent. The Board was generally satisfied with the nature, extent, and quality of the advisory services provided to the Fund.
Investment Performance. The Board reviewed the investment performance of the Fund over various periods compared to the performance of relevant indices and of independently selected peer groups of other similar funds. The Board also reviewed with PIMCO and JFS the ways in which the investment strategies employed by PIMCO had contributed to the Fund’s investment performance. The performance data showed, among other things, that the Fund outperformed the Barclays U.S. Aggregate Bond Index and underperformed the Barclays U.S. Credit Index for the one-year period ended December 31, 2014; outperformed the Barclays U.S. Aggregate Bond Index and the Barclays U.S. Credit Index for the three-year and five-year periods ended December 31, 2014; underperformed the average of its Lipper peer group for the one-year and five-year periods ended December 31, 2014; and equaled the performance of the average of its Lipper peer group for the three-year period ended December 31, 2014.
Cost of Services. The Board examined the cost of the services provided and to be provided to the Fund by PIMCO, including expense information concerning the Lipper peer group of other similar funds. The combined advisor and administrator fees charged by PIMCO and JFS were generally lower than those charged by the funds in the Lipper peer group. The advisory fee charged by PIMCO was also comparable to the advisory fee charged by the Fund’s prior investment adviser, as well as to the advisory fee proposed by the other adviser candidates considered by the Board in connection with its 2010 search. The Board concluded that the advisory fees charged by PIMCO generally were competitive.
Profits Realized. The Board considered profits realized and to be realized by PIMCO from its relationship with the Fund and reviewed an estimate prepared by PIMCO. The Board acknowledged the inherent limitations of profitability analyses, including their reliance on various allocations and assumptions. The Board recognized that PIMCO was entitled to earn a profit for the services it furnishes and concluded that the profit estimated to be earned by PIMCO would not be excessive.
Economies of Scale. The Board considered the extent to which economies of scale could be realized as the Fund grows and whether the advisory fee charged by PIMCO reflects any such economies of scale. It was noted that, as a closed-end fixed income fund making regular dividend distributions, the assets of the Fund were not expected to increase materially. Accordingly, the Board had negotiated with PIMCO a fixed fee rate taking into account the then-current size of the Fund. In the event the size of the Fund does increase materially in the future, the Board will consider whether the advisory fee should be adjusted to reflect any economies of scale.
Montgomery Street Income Securities, Inc. (Unaudited)
Investment Advisory Agreement Approval
June 30, 2015
Other Benefits. The Board recognized that PIMCO and its affiliates may derive other benefits from its relationship with the Fund, including the use of the Fund’s performance record in marketing other products, the inclusion of the Fund on its client list, and the aggregation of the Fund’s trade orders with other accounts.
In addition to the foregoing factors, among others, the Board considered its ability to terminate the Investment Advisory Agreement on sixty days’ notice. In its deliberations, the Board did not identify any particular factor or factors that were all-important or controlling, and each Director assigned different weights to the various factors considered.
Montgomery Street Income Securities, Inc. (Unaudited)
General Information
June 30, 2015
| | |
| Investment Adviser | | Pacific Investment Management Company LLC 650 Newport Center Drive Newport Beach, CA 92660 |
| |
Administrator (through July 31, 2015) | | Jackson Fund Services 225 West Wacker Drive Chicago, IL 60606 |
| |
Administrator (Effective August 1, 2015) | | Atlantic Fund Administration, LLC 3 Canal Plaza, Suite 600 Portland, ME 04101 |
| |
| Transfer Agent | | Computershare P.O. Box 30170 College Station, TX 77842-3170 (Tel) 1/877/437-3938 |
| |
| Custodian | | The Bank of New York Mellon Corporation One Mellon Center Pittsburgh, PA 15258 |
| |
| Legal Counsel | | Pillsbury Winthrop Shaw Pittman LLP Four Embarcadero Center San Francisco, CA 94111 |
Montgomery Street Income Securities, Inc. (Unaudited)
Privacy Policy Statement
June 30, 2015
Montgomery Street Income Securities, Inc. (the “Fund”) considers the privacy of its stockholders to be of fundamental importance and has established a policy to maintain the privacy of the information you share with us. In addition, the Fund relies on the privacy and customer information protection policies and procedures of its service providers.
Personal information we collect
We do not sell any information to any third parties. However, we may collect and retain certain nonpublic personal information about you, including:
| | • | | Information we receive from broker-dealers, investment advisers, the Fund’s transfer agent, and the Fund’s dividend reinvestment plan administrator (such as a stockholder’s name, address and tax identification number); |
| | • | | An address received from a third party when a stockholder has moved; and |
| | • | | Account balance and transaction activity. |
Personal information we may disclose
We may occasionally disclose nonpublic personal information about you to affiliates and non-affiliates as permitted by law. Instances when we may share information include:
| | • | | Disclosing information to a third party in order to process account transactions that you request or authorize; |
| | • | | Disclosing your name and address to companies that mail Fund-related materials, such as stockholder reports and proxy materials; and |
| | • | | Disclosing information in connection with regulatory inquiries and legal proceedings, such as responding to a request for information or subpoena. |
When information is shared with third parties, they are not permitted to use the information for any purpose other than to assist our servicing of your account(s) or as permitted by law. If you close your account(s) or if we lose contact with you, we will continue to share information in accordance with our current privacy policy and practices. We restrict access to your nonpublic personal information to authorized agents, including employees of the Fund’s administrator who need to know that information to provide services to the Fund and its stockholders. We maintain physical, electronic and procedural safeguards that comply with federal standards to guard your nonpublic personal information.
These measures reflect our commitment to maintaining the privacy of your nonpublic personal information. We appreciate the confidence you have shown by entrusting us with your assets.
If you would like to learn more or have any questions about our privacy practices, please contact the Fund at the following address:
Montgomery Street Income Securities, Inc.
c/o Atlantic Fund Services
3 Canal Plaza, Suite 600
Portland, ME 04101
Effective: August 31, 2007
Revised: August 1, 2015
Atlantic Fund Services
3 Canal Plaza, Suite 600
Portland, ME 04101
Presorted Standard
U.S. Postage
PAID
Lancaster, PA
Permit No. 1313
MSIS
(42065 6/15)
Item 2. Code of Ethics.
Not applicable.
Item 3. Audit Committee Financial Expert.
Not applicable.
Item 4. Principal Accountant Fees and Services.
Not applicable.
Item 5. Audit Committee of Listed Registrants.
Not applicable.
Item 6. Investments.
| (a) | Included in Report to Stockholders under Item 1. |
Item 7. Disclosure of Proxy Voting Policies and Procedures for Closed-End Management Investment Companies.
Not applicable.
Item 8. Portfolio Managers of Closed-End Management Investment Companies.
Not applicable.
Item 9. Purchases of Equity Securities by Closed-End Management Investment Company and Affiliated Purchasers.
| | | | | | | | |
| Period | | (a) Total Number of
Shares (or Units)
Purchased(1) | | (b) Average Price
Paid per Share
(or Unit) | | (c) Total Number of
Shares (or Units)
Purchased as Part of
Publicly Announced
Plans or Programs | | (d) Maximum Number (or
Approximate Dollar Value)
of Shares (or Units) that
May Yet Be Purchased
Under the Plans or
Programs |
January 1 – January 31 | | 0 | | 0 | | n/a | | n/a |
February 1 – February 29 | | 3,000 | | 16.58 | | n/a | | n/a |
March 1 – March 31 | | 0 | | 0 | | n/a | | n/a |
April 1 – April 30 | | 0 | | 0 | | n/a | | n/a |
May 1 – May 31 | | 2,133 | | 16.60 | | n/a | | n/a |
June 1 – June 30 | | 3,867 | | 16.64 | | n/a | | n/a |
| | | | |
Total | | 9,000 | | 16.60 | | n/a | | n/a |
(1) All purchases were made on the open market pursuant to the registrant’s Repurchase Program and related guidelines.
Item 10. Submission of Matters to a Vote of Security Holders.
There have been no material changes to the procedures by which stockholders may recommend nominees to the registrant’s Board of Directors since the registrant last disclosed such procedures in a Proxy Statement or Form N-CSR.
Item 11. Controls and Procedures.
| (a) | The President/Principal Executive Officer and the Treasurer/Principal Financial Officer of the registrant have concluded, based on their evaluation of the registrant’s disclosure controls and procedures (as defined in Rule 30a-3(c) under the Investment Company Act of 1940, as amended) as of a date within ninety (90) days of the filing date of this report on Form N-CSR, that such controls and procedures are effective and that the design and operation of such procedures ensures that information required to be disclosed by the registrant in this report on Form N-CSR is recorded, processed, summarized, and reported within the time periods specified in the U.S. Securities and Exchange Commission’s rules and forms. |
| (b) | There has been no change in the registrant’s internal controls over financial reporting (as defined in Rule 30a-3(d) under the Investment Company Act of 1940, as amended) that occurred during the second fiscal quarter of the period covered by this report that has materially affected, or is reasonably likely to materially affect, the registrant’s internal control over financial reporting. |
Item 12. Exhibits.
| | |
| (a)(1) | | Not applicable. |
| |
| (2) | | Certifications required by Rule 30a-2(a) under the Investment Company Act of 1940, as amended. |
| |
| (3) | | Not applicable. |
| |
| (b) | | Certification required by Rule 30a-2(b) under the Investment Company Act of 1940, as amended. |
SIGNATURES
Pursuant to the requirements of the Securities Exchange Act of 1934 and the Investment Company Act of 1940, the registrant has duly caused this report to be signed on its behalf by the undersigned, thereunto duly authorized.
| | |
| | Montgomery Street Income Securities, Inc. |
| |
| By: | | /s/ Stacey E. Hong |
| Name: | | Stacey E. Hong |
| Title: | | President and Principal Executive Officer |
| Date: | | September 4, 2015 |
Pursuant to the requirements of the Securities Exchange Act of 1934 and the Investment Company Act of 1940, this report has been signed below by the following persons on behalf of the registrant and in the capacities and on the dates indicated.
| | |
| By: | | /s/ Stacey E. Hong |
| Name: | | Stacey E. Hong |
| Title: | | President and Principal Executive Officer |
| Date: | | September 4, 2015 |
| | |
| By: | | /s/ Michael J. McKeen |
| Name: | | Michael J. McKeen |
| Title: | | Treasurer and Principal Financial Officer |
| Date: | | September 4, 2015 |
EXHIBIT LIST
| | |
| Exhibit 12(a)(2)(a): | | Certification of the Principal Executive Officer required by Rule 30a-2(a) under the Investment Company Act of 1940, as amended |
| |
| Exhibit 12(a)(2)(b): | | Certification of the Principal Financial Officer required by Rule 30a-2(a) under the Investment Company Act of 1940, as amended |
| |
| Exhibit 12(b): | | Certification required by Rule 30a-2(b) under the Investment Company Act of 1940, as amended |