Exhibit 99.2
MSI to Sell Enterprise
Business
Global Leader in Mission-Critical Public Safety
Communications
APRIL 15, 2014
SAFE HARBOR
A number of forward-looking statements will be made during this presentation. Forward-looking statements are any statements that are not historical facts. These forward-looking statements are based on the current expectations of Motorola Solutions, and we can give no assurance that any future results or events discussed in these statements will be achieved. Any forward-looking statements represent our views only as of today and should not be relied upon as representing our views as of any subsequent date. Forward-looking statements are subject to a variety of risks and uncertainties that could cause our actual results to differ materially from the statements contained in this presentation.
Information about factors that could cause, and in some cases have caused, such differences can be found on pages 10 through 21 in Item 1A of Motorola Solutions’ 2013 Annual Report on Form 10-K, and in our other SEC filings available for free on the SEC’s website at www.sec.gov, and on Motorola Solutions’ website at www.motorolasolutions.com/investor
This presentation is being made on the 15th of April 2014. The content of this presentation contains time-sensitive information that is accurate only as of the time hereof. If any portion of this presentation is rebroadcast, retransmitted or redistributed at a later date, Motorola Solutions will not be reviewing or updating the material that is contained herein.
Page 2
USE OF NON-GAAP MEASURES
In addition to the GAAP results provided during this event, Motorola Solutions has provided certain non-GAAP measurements. Motorola Solutions has provided these non-GAAP measurements as a measure to help investors better understand its core operating performance, enhance comparisons of Motorola Solutions’ core operating performance from period to period and to allow better comparisons of Motorola Solutions’ operating performance to that of its competitors. Among other things, the Company’s management uses these operating results, excluding the identified items, to evaluate the performance of its businesses and to evaluate results relative to incentive compensation targets.
Management uses operating results excluding these items because they believe this measure enables them to make better period-to-period evaluations of the financial performance of its core business operations. There are inherent limitations in the use of operating results excluding these items because the company’s GAAP results include the impact of these items. The non-GAAP measures are intended only as a supplement to the comparable GAAP measures and the Company compensates for the limitations inherent in the use of non-GAAP measures by using GAAP measures in conjunction with the non-GAAP measures. As a result, investors should consider these non-GAAP measures in addition to, and not in substitution for, or as superior to, measures of financial performance prepared in accordance with GAAP.
Details of these items and reconciliations of the non-GAAP measurements provided during this presentation to GAAP measurements can be found in the Appendix to this presentation and on Motorola Solutions’ website at www.motorolasolutions.com/investor.
Page 3
TRANSACTION OVERVIEW
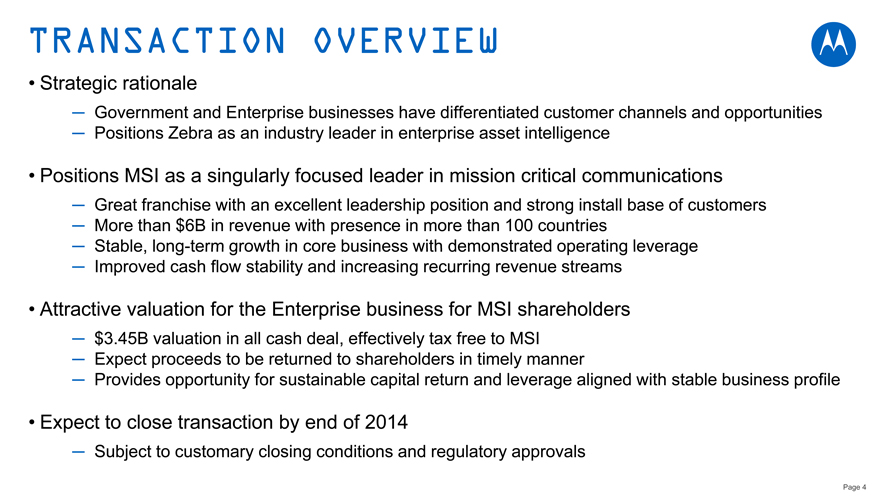
Strategic rationale
Government and Enterprise businesses have differentiated customer channels and opportunities Positions Zebra as an industry leader in enterprise asset intelligence
Positions MSI as a singularly focused leader in mission critical communications
Great franchise with an excellent leadership position and strong install base of customers More than $6B in revenue with presence in more than 100 countries Stable, long-term growth in core business with demonstrated operating leverage Improved cash flow stability and increasing recurring revenue streams
Attractive valuation for the Enterprise business for MSI shareholders
$3.45B valuation in all cash deal, effectively tax free to MSI
Expect proceeds to be returned to shareholders in timely manner
Provides opportunity for sustainable capital return and leverage aligned with stable business profile
Expect to close transaction by end of 2014
Subject to customary closing conditions and regulatory approvals
MSI REMAINING BUSINESS OVERVIEW
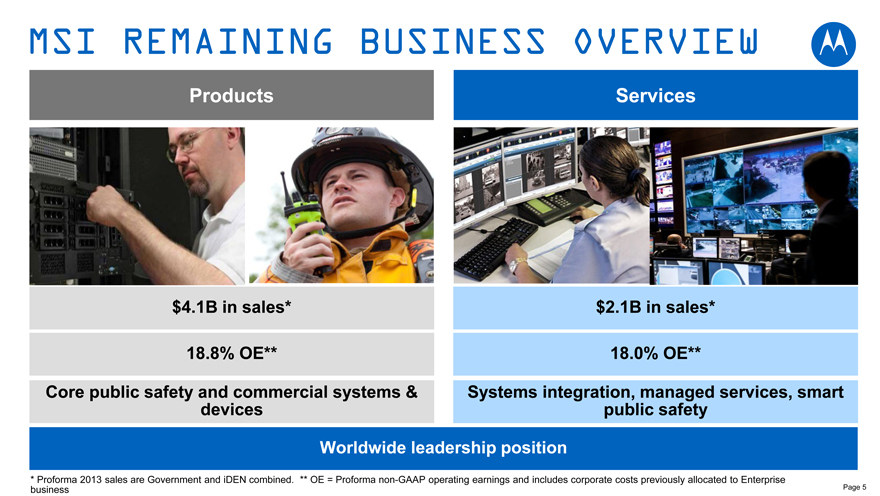
Products Services
$4.1B | | in sales* $2.1B in sales* |
Core public safety and commercial systems & Systems integration, managed services, smart
devices public safety
Worldwide leadership position
* Proforma 2013 sales are Government and iDEN combined. ** OE = Proforma non-GAAP operating earnings and includes corporate costs previously allocated to Enterprise business
Page 5
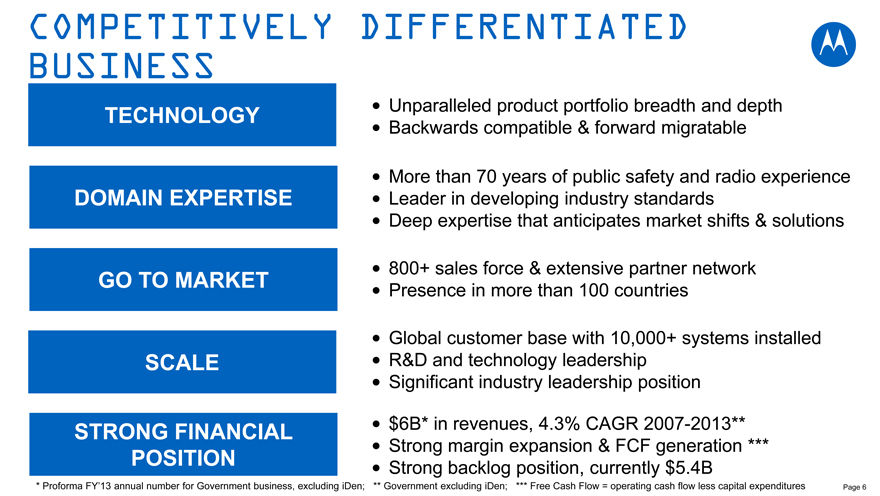
COMPETITIVELY DIFFERENTIATED BUSINESS
TECHNOLOGY
DOMAIN EXPERTISE
GO TO MARKET
SCALE
STRONG FINANCIAL POSITION
Unparalleled product portfolio breadth and depth Backwards compatible & forward migratable
More than 70 years of public safety and radio experience Leader in developing industry standards Deep expertise that anticipates market shifts & solutions
800+ sales force & extensive partner network Presence in more than 100 countries
Global customer base with 10,000+ systems installed R&D and technology leadership Significant industry leadership position
$6B* in revenues, 4.3% CAGR 2007-2013** Strong margin expansion & FCF generation *** Strong backlog position, currently $5.4B
* Proforma FY’13 annual number for Government business, excluding iDen; ** Government excluding iDen; *** Free Cash Flow = operating cash flow less capital expenditures
Page 6
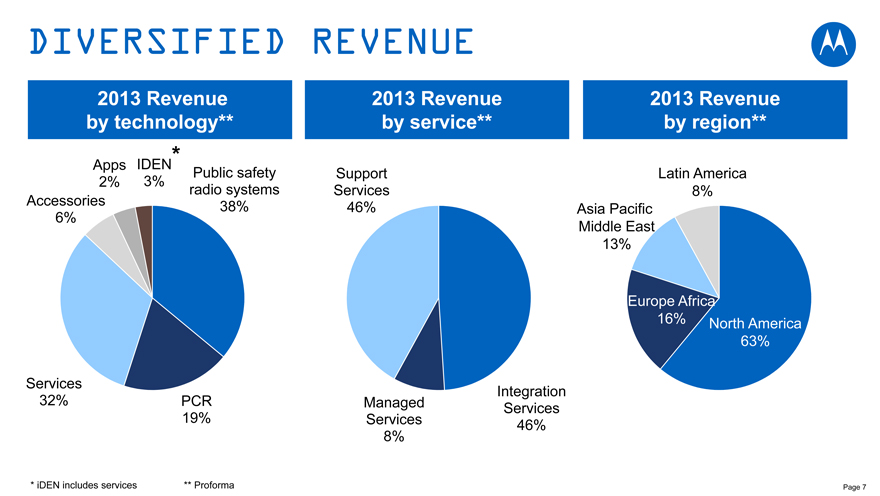
DIVERSIFIED REVENUE
2013 Revenue 2013 Revenue 2013 Revenue by technology** by service** by region**
Apps IDEN
Public safety Support Latin America
2% 3% radio systems Services 8% Accessories 38% 46% Asia Pacific 6% Middle East 13%
Europe Africa
16% North America 63%
Services
Integration 32% PCR Managed Services 19% Services 46% 8%
* | | iDEN includes services ** Proforma Page 7 |
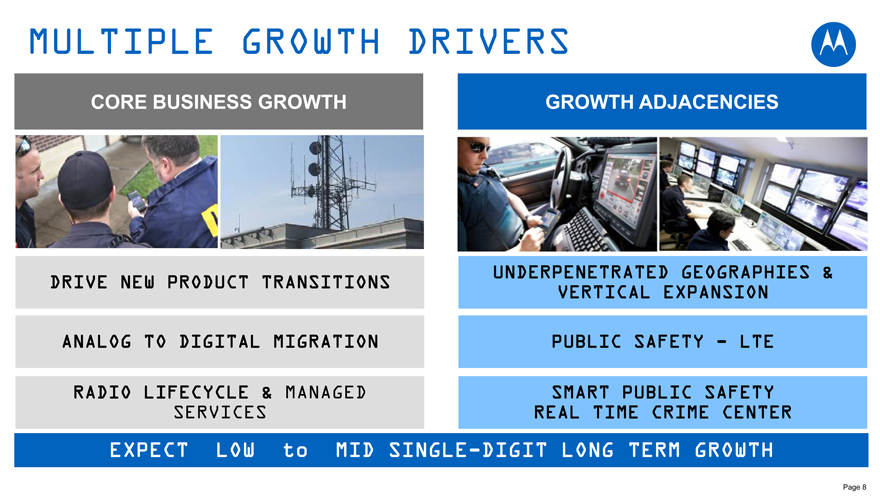
MULTIPLE GROWTH DRIVERS
CORE BUSINESS GROWTH GROWTH ADJACENCIES
UNDERPENETRATED GEOGRAPHIES & DRIVE NEW PRODUCT TRANSITIONS
VERTICAL EXPANSION
ANALOG TO DIGITAL MIGRATION PUBLIC SAFETY—LTE
RADIO LIFECYCLE & MANAGED SMART PUBLIC SAFETY SERVICES REAL TIME CRIME CENTER
EXPECT LOW to MID SINGLE-DIGIT LONG TERM GROWTH
Page 8
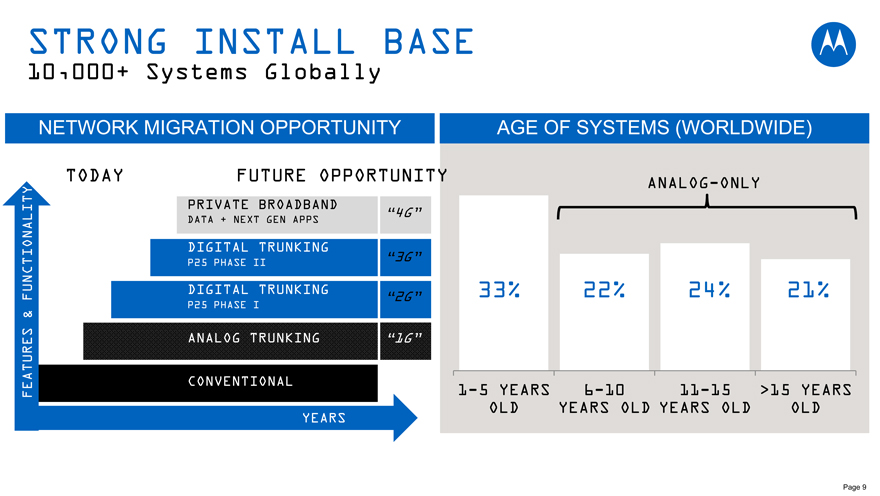
STRONG INSTALL BASE
10,000+ Systems Globally
NETWORK MIGRATION OPPORTUNITY AGE OF SYSTEMS (WORLDWIDE)
TODAY FUTURE OPPORTUNITY ANALOG-ONLY
MUCH OF
PRIVATE BROADBAND
“4G”
DATA + NEXT GEN APPS
ONALITY MUCH OF DIGITAL TRUNKING
“3G”
P25 PHASE II
DIGITAL TRUNKING 33% 22% 24% 21%
“2G”
FUNCTIONALITY & P25 PHASE I
ANALOG TRUNKING “1G”
CONVENTIONAL
FEATURES 1-5 YEARS 6-10 11-15 >15 YEARS OLD YEARS OLD YEARS OLD OLD
YEARS
Page 9
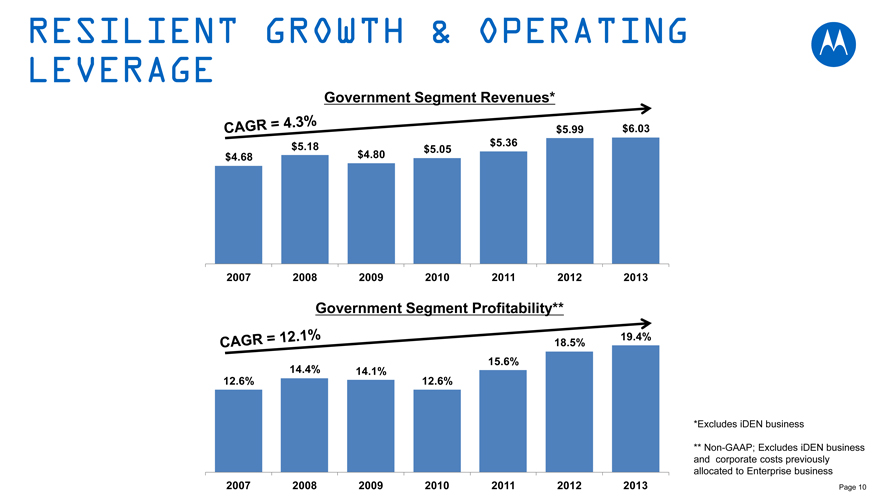
RESILIENT GROWTH & OPERATING LEVERAGE
Government Segment Revenues*
$5.99 $6.03 $5.18 $5.36 $5.05 $4.68 $4.80
CAGR=4.3%
2007 2008 2009 2010 2011 2012 2013
Government Segment Profitability**
19.4%
18.5%
15.6%
14.4% 14.1%
12.6% 12.6%
*Excludes iDEN business
CAGR=12.1%
** Non-GAAP; Excludes iDEN business and corporate costs previously allocated to Enterprise business
2007 2008 2009 2010 2011 2012 2013 Page 10
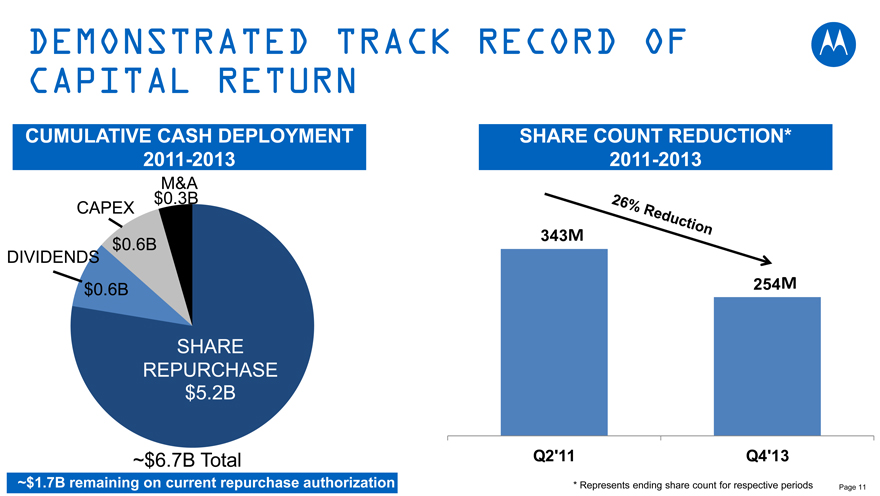
DEMONSTRATED TRACK RECORD OF CAPITAL RETURN
CUMULATIVE CASH DEPLOYMENT SHARE COUNT REDUCTION* 2011-2013 2011-2013
$M&A 0.3B CAPEX
343M
$0.6B
DIVIDENDS
REDUCTION 26%
$0.6B 254M
SHARE REPURCHASE
$5.2B
~$6.7B Total Q2’11 Q4’13
~$1.7B remaining on current repurchase authorization * Represents ending share count for respective periods Page 11
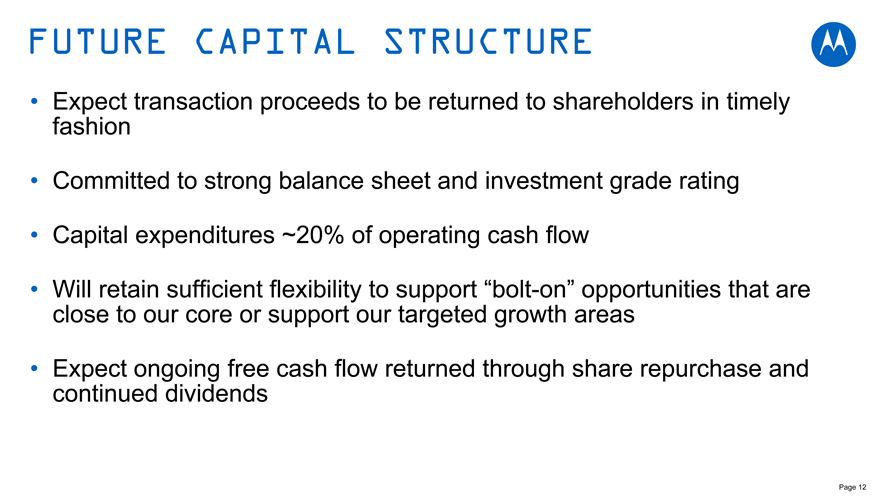
FUTURE CAPITAL STRUCTURE
Expect transaction proceeds to be returned to shareholders in timely fashion
Committed to strong balance sheet and investment grade rating
Capital expenditures ~20% of operating cash flow
Will retain sufficient flexibility to support “bolt-on” opportunities that are close to our core or support our targeted growth areas
Expect ongoing free cash flow returned through share repurchase and continued dividends
Page 12
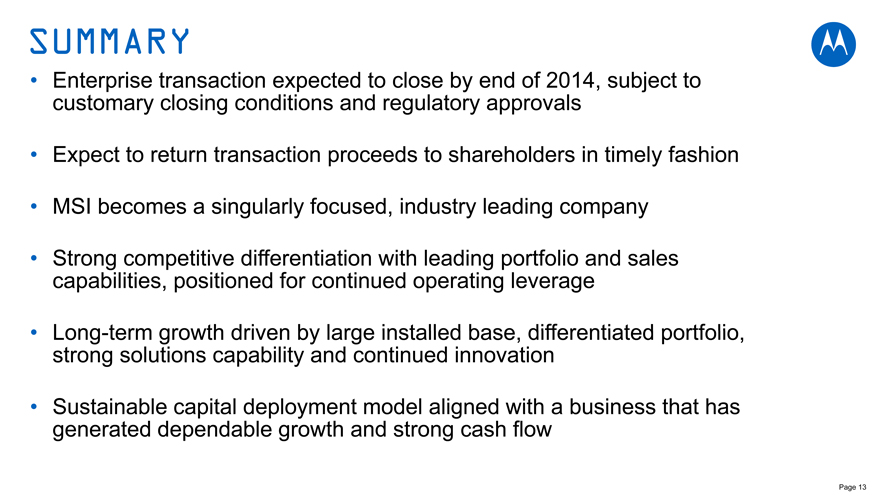
SUMMARY
Enterprise transaction expected to close by end of 2014, subject to customary closing conditions and regulatory approvals
Expect to return transaction proceeds to shareholders in timely fashion
MSI becomes a singularly focused, industry leading company
Strong competitive differentiation with leading portfolio and sales capabilities, positioned for continued operating leverage
Long-term growth driven by large installed base, differentiated portfolio, strong solutions capability and continued innovation
Sustainable capital deployment model aligned with a business that has generated dependable growth and strong cash flow
Page 13
USE OF NON-GAAP MEASURES
In addition to the GAAP results provided during this event, Motorola Solutions has provided certain non-GAAP measurements. Motorola Solutions has provided these non-GAAP measurements as a measure to help investors better understand its core operating performance, enhance comparisons of Motorola Solutions’ core operating performance from period to period and to allow better comparisons of Motorola Solutions’ operating performance to that of its competitors. Among other things, the Company’s management uses these operating results, excluding the identified items, to evaluate the performance of its businesses and to evaluate results relative to incentive compensation targets.
Management uses operating results excluding these items because they believe this measure enables them to make better period-to-period evaluations of the financial performance of its core business operations. There are inherent limitations in the use of operating results excluding these items because the company’s GAAP results include the impact of these items. The non-GAAP measures are intended only as a supplement to the comparable GAAP measures and the Company compensates for the limitations inherent in the use of non-GAAP measures by using GAAP measures in conjunction with the non-GAAP measures. As a result, investors should consider these non-GAAP measures in addition to, and not in substitution for, or as superior to, measures of financial performance prepared in accordance with GAAP.
Details of these items and reconciliations of the non-GAAP measurements provided during this presentation to GAAP measurements can be found in the Appendix to this presentation and on Motorola Solutions’ website at www.motorolasolutions.com/investor.
Page 15
SUPPLEMENTAL NON-GAAP MEASURES
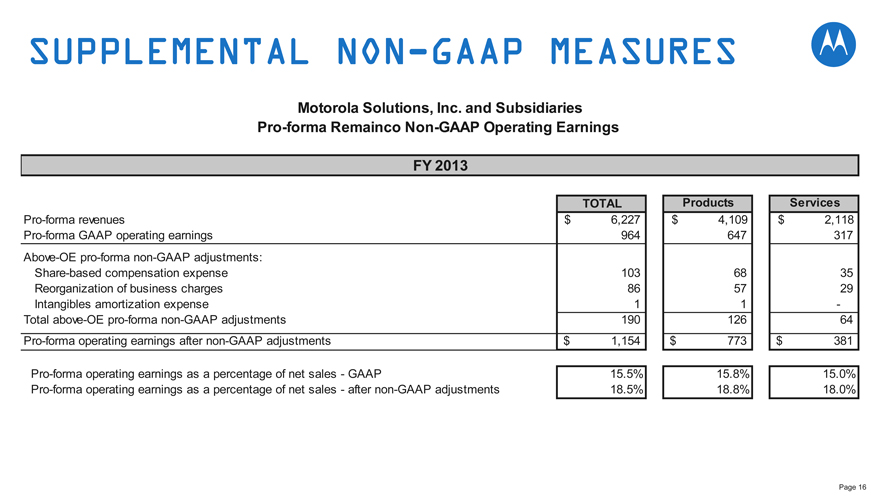
Motorola Solutions, Inc. and Subsidiaries Pro-forma Remainco Non-GAAP Operating Earnings
FY 2013
TOTAL Products Services
Pro-forma revenues $ 6,227 $ 4,109 $ 2,118
Pro-forma GAAP operating earnings 964 647 317
Above-OE pro-forma non-GAAP adjustments:
Share-based compensation expense 103 68 35
Reorganization of business charges 86 57 29
Intangibles amortization expense 1 1 -
Total above-OE pro-forma non-GAAP adjustments 190 126 64
Pro-forma operating earnings after non-GAAP adjustments $ 1,154 $ 773 $ 381
Pro-forma operating earnings as a percentage of net sales—GAAP 15.5% 15.8% 15.0%
Pro-forma operating earnings as a percentage of net sales—after non-GAAP adjustments 18.5% 18.8% 18.0%
Page 16