Indicate by check mark whether the registrant is a large accelerated filer, an accelerated filer, a non-accelerated filer, or a smaller reporting company. See the definitions of “large accelerated filer,” “accelerated filer” and “smaller reporting company” in Rule 12b-2 of the Exchange Act).
State the aggregate market value of the voting and non-voting common equity held by non-affiliates computed by reference to the price at which the common equity last sold, or the average bid and asked price of such common equity, as of the last business day of the registrant’s most recently completed second fiscal quarter: $476,662,462.
DOCUMENTS INCORPORATED BY REFERENCE: Portions of the Proxy Statement for the Registrant’s Annual Meeting of Shareholders to be held February 9, 2011 are incorporated by reference into Part III of this Form 10-K, to the extent described in such Part.
Statements contained in this Annual Report on Form 10-K that are not statements of historical fact should be considered forward-looking statements within the meaning of the Private Securities Litigation Reform Act of 1995 (the “Act”). In addition, certain statements in our future filings with the Securities and Exchange Commission (“SEC”), in press releases, and in oral and written statements made by us or with our approval that are not statements of historical fact constitute forward-looking statements within the meaning of the Act. Examples of forward-looking statements include, but are not limited to: (i) projections of revenue, income or loss, earnings or loss per share, the payment or nonpayment of dividends, capital structure and other statements concerning future financial performanc e; (ii) statements of our plans and objectives by our management or Board of Directors, including those relating to products or services; (iii) statements of assumptions underlying such statements; (iv) statements regarding business relationships with vendors, customers or collaborators; and (v) statements regarding products, their characteristics, performance, sales potential or effect in the hands of customers. Words such as “believes,” “anticipates,” “expects,” “intends,” “targeted,” “should,” “potential,” “goals,” “strategy,” and similar expressions are intended to identify forward-looking statements, but are not the exclusive means of identifying such statements.
Forward-looking statements involve risks and uncertainties that may cause actual results to differ materially from those in such statements. Factors that could cause actual results to differ from those discussed in the forward-looking statements include, but are not limited to, those described in Item 1A, Risk Factors, below. The performance of our business and our securities may be adversely affected by these factors and by other factors common to other businesses and investments, or to the general economy. Forward-looking statements are qualified by some or all of these risk factors. Therefore, you should consider these risk factors with caution and form your own critical and independent conclusions about the likely effect of these risk factors on our future performance. Forward-looking statements speak only as of the date on which statements are made, and we undertake no obligation to update any forward-looking statement to reflect events or circumstances after the date on which such statement is made to reflect the occurrence of unanticipated events or circumstances. Readers should carefully review the disclosures and the risk factors described in this and other documents we file from time to time with the SEC, including our reports on Forms 10-Q and 8-K.
MTS Systems Corporation (the “Company” or “MTS”) is a leading global supplier of test systems and industrial position sensors. The Company's operations are organized and managed in two business segments, the Test segment and the Sensors segment, based upon global similarities in markets, products, operations and distribution. The Test and Sensors segments represent approximately 80% and 20% of Company revenue, respectively. Company was incorporated under Minnesota law in 1967.
On September 28, 2008, the Company acquired substantially all of the assets of SANS Group (“SANS”). SANS manufactures material testing systems and offers a variety of test systems. The results of operations for SANS have been included in the Company’s results of operations since the date of the acquisition, and are reported in the Company’s Test segment. The term “organic” as used throughout this Annual Report on Form 10-K means “without the SANS acquisition”.
A typical test system includes a load frame to hold the prototype specimen, a hydraulic pump or electro-mechanical power source, piston actuators to create the force or motion, and a computer controller with specialized software to coordinate the actuator movement and record and manipulate results. Lower force and less dynamic testing can usually be accomplished with electro-mechanical power sources, which are generally less expensive than hydraulic systems. Higher force and more dynamic testing typically require hydraulically powered systems, which are usually more expensive. In addition to these basic components, the Test segment sells a variety of accessories and spare parts, as well as services, including installation, calibration, maintenance, training and consulting.
The Test segment has a diverse set of customers by industry and global geography. Generally, the Americas, Europe and Asia each accounts for approximately one-third of revenue, as measured by customer location.
Products and customers are grouped by the Company into the following three global markets:
The Sensors segment manufactures products exclusively utilizing magnetostriction technology. MTS has developed a unique implementation of the technology, known as Temposonics ®. This technology offers high speed and precise non-contact position sensing. It is ideal for use in harsh operating environments.
Sensors segment customers are also diverse by industry and geography. Regionally, the Americas, Europe and Asia represent approximately 30%, 45% and 25% of revenue, respectively, based upon customer location.
In addition to field sales and service personnel throughout the United States, the Test segment has sales and service subsidiaries in Toronto, Canada; Berlin, Germany; Paris, France; Cirencester, United Kingdom; Turin, Italy; Gothenburg, Sweden; Tokyo and Nagoya, Japan; Seoul, Korea; Shanghai and Shenzhen, China.
In fiscal 2010, product orders in the Test segment ranged in value from a few hundred dollars to $10 million on an equivalent United States dollar basis. The average order size was approximately $100,000. The Test segment also markets services to customers on a per-call and contract basis, accounting for virtually all of the Company’s Service Revenue in the Consolidated Statements of Income. Service orders in fiscal 2010 ranged from $100 to over $600,000 on a United States dollar-equivalent basis.
The timing and volume of large orders valued at $5 million or greater on a United States dollar-equivalent basis may produce volatility in orders, backlog, and quarterly operating results. Most customer orders are based on fixed-price quotations and typically have an average sales cycle of three to nine months due to the technical nature of the test systems and customer capital expenditure processes. The sales cycle for larger, more complex test systems may be up to three years.
As the Test segment generally sells products and services based on fixed-price contracts, fluctuations in the cost of materials and components between the date of the order and the delivery date may impact the expected profitability of any project. The material and component cost variability is considered in the estimation and customer negotiation process. The Company believes that fluctuations in the cost of raw materials and components have not had a significant impact on operating results.
MTS specializes in the control and measurement of forces and motion. Technologies include application software for test parameter control and results analysis, precise hydraulic and electric actuation in the Test segment, and magnetostriction technology in the Sensors segment.
The Company relies on a combination of patents, copyrights, trademarks and proprietary trade secrets to protect its proprietary technology, some of which are considered material to the Test and Sensors segments. The Company has obtained numerous patents and trademarks worldwide, and actively files and renews patents and trademarks on a global basis to establish and protect its proprietary technology. The Company has also entered into exclusive and non-exclusive license and confidentiality agreements relating to its own and third-party technologies. The Company aggressively protects its processes, products, and strategies as proprietary trade secrets. The Company’s efforts to protect intellectual property and avoid disputes over proprietary rights include ongoing review of third-party patents and patent applications.
There is no significant seasonality to Test or Sensors segment revenue.
Neither the Test nor the Sensors segment have significant finished product inventory, but maintain inventories of materials and components to facilitate on time product delivery. The Test segment may have varying levels of work-in-process projects that are classified as inventory or unbilled receivables, depending upon the production cycle, timing of orders, project revenue recognition and shipments to customers.
In the Test segment, payments are often received from customers upon order or at milestones during the fulfillment of the order, depending upon the size and customization of the system. These are recorded as Advance Payments from Customers on the Company’s Consolidated Balance Sheets and reduced as revenue is recognized. Conversely, if revenue is recognized on a project prior to customer billing, an Unbilled Accounts Receivable is recorded on the Company’s Consolidated Balance Sheets until the customer is billed. Upon billing, it is recorded as Accounts Receivable. Changes in the average size, payment terms and revenue recognition for orders in the Test segment may have a significant impact on investment in Accounts Receivable, Unbilled Accounts Receivable, Advance Payments from Customers and Inventory. It has not been the Com pany’s practice to provide rights of return for its products. Payment terms vary and are subject to negotiation.
The Company does not have a significant concentration of sales with any individual customer. Therefore, the loss of any one customer would not have a material impact on the Company.
Most of the Company’s products are built to order. The Company's backlog of orders, defined as firm orders from customers that remain unfulfilled, totaled approximately $214 million, $168 million, and $235 million at October 2, 2010, October 3, 2009 and September 27, 2008, respectively. The majority of this backlog is related to the Test segment. Based on anticipated production schedules, the Company estimates that approximately $188 million of the backlog at October 2, 2010 will be converted to revenue during fiscal 2011. Delays may occur in the conversion of backlog into revenue as a result of export licensing compliance, technical difficulties, specification changes, manufacturing capacity, supplier issues, or access to the customer site to install the system. While the backlog is subject to order cancellations, the Company has n ot historically experienced a significant number of order cancellations.
No material portion of the Company’s business is subject to re-negotiation of profits or termination of contracts or subcontracts at the election of any government.
The Company invests in significant product, system, and software application development. The Company also occasionally contracts with its customers to advance the state of technology and increase product functionality. Costs associated with R&D were expensed as incurred, totaling $14.9 million, $16.3 million and $16.2 million for the fiscal years ended October 2, 2010, October 3, 2009 and September 27, 2008, respectively. During the fiscal years ended October 2, 2010, October 3, 2009 and September 27, 2008, the Company allocated certain of its resources towards capitalized software development activities. Total software development costs capitalized during the fiscal years ended October 2, 2010, October 3, 2009 and September 27, 2008 were $3.6 million, $3.9 million and $4.2 million, respectively.
The Company believes its operations are in compliance with all applicable environmental regulations within the jurisdictions in which it operates.
Executive Officers serve at the discretion of and are elected by the Company’s Board of Directors. Business experience of the Executive Officers over the last five years is as follows:
The Company had 1,948 employees as of October 2, 2010, including approximately 1,050 employees located outside the United States.
The following summarizes, in no particular order, certain risks which could harm the Company’s business, financial condition and operating results. No such list can be comprehensive or predict in detail exactly which of the risks listed below could occur. All statements other than statements of historic fact in each of the Company’s public announcements and filings with the SEC are “forward-looking statements” within the meaning of the U.S. securities laws and should be read in light of these risk factors.
Volatility in the global economy could adversely affect results. The recent global financial crisis materially and negatively impacted our business and our customers’ businesses in both the U.S. and international markets. Longer term disruptions in the capital and credit markets could adversely affect the ability of the Company’s customers and suppliers to obtain financing for significant purchases and operations and could result in a decrease in orders and spending for its products and services. In addition, during periods of economic uncertainty the Company’s customers’ spending patterns could be negatively impacted resulting in a decrease in orders for its products and services.
The Company’s business is subject to strong competition. The Company’s products are sold in competitive markets throughout the world. Competition is based on application knowledge, product features and design, brand recognition, reliability, technology, breadth of product offerings, price, customer relationships, and after market support. If the Company is not perceived as competitive in overall value measured by these criteria, its customers may choose solutions offered by its competitors or developed internally.
The Company may not achieve its growth plans for the expansion of the business. In addition to market penetration, the Company’s long-term success depends on its ability to expand the business through (a) new product development, (b) mergers and acquisitions and/or (c) geographic expansion.
New product development requires that the Company maintain its ability to enhance and improve existing products, to continue to bring innovative products to market in a timely fashion and to adapt products to the needs and standards of current and potential customers. The Company’s products and services may become less competitive or eclipsed by technologies to which the Company does not have access or which render its solutions obsolete.
Mergers and acquisitions will be accompanied by risks which may include:
| | · | difficulties identifying suitable acquisition candidates at acceptable costs; |
| | · | unavailability of capital to conduct acquisitions; |
| | · | failure to achieve the financial and strategic goals for the acquired and combined businesses; |
| | · | difficulty assimilating the operations and personnel of the acquired businesses; |
| | · | disruption of ongoing business and distraction of management from the ongoing business; |
| | · | dilution of existing stockholders and earnings per share; |
| | · | unanticipated, undisclosed or inaccurately assessed liabilities, legal risks and costs; and |
| | · | difficulties retaining key vendors, customers or employees of the acquired business. |
Acquisitions of businesses having a significant presence outside the U.S. will increase the Company’s exposure to the risks of international operations discussed herein.
Geographic expansion will be primarily outside of the United States, and hence will be disproportionately subject to the risks of international operations discussed herein.
The Company may experience difficulties obtaining the services of skilled employees. The Company relies on knowledgeable, experienced and skilled technical personnel, particularly engineers, sales management, and service personnel, to design, assemble, sell and service its products. The Company also requires capable senior executives to lead the business and may be unable to attract, retain and motivate sufficient numbers of such people.
The Company may fail to protect its intellectual property effectively, or may infringe upon the intellectual property of others. The Company relies on trade secret, copyright, trademark and patent laws and contractual protections to protect its proprietary technology and other proprietary rights. The Company’s competitors may attempt to copy its products or gain access to its trade secrets. Notwithstanding the precautions taken by the Company to protect its intellectual property rights, it is possible that third parties may illegally copy or otherwise obtain and use its proprietary technology without the Company’s consent. Any litigation concerning infringement could result in substantial cost and divers ions of the Company’s resources, either of which could adversely affect the business. In some cases, there may be no effective legal recourse against duplication of products or services by competitors. Intellectual property rights in foreign jurisdictions may be limited or unavailable. Patents of third parties also have an important bearing on the Company’s ability to offer some of its products and services. The Company’s competitors may obtain patents related to the types of products and services the Company currently offers or plans to offer. Any infringement by the Company on intellectual property rights of others could result in litigation and adversely affect its ability to continue to provide, or could increase the cost of providing, products and services.
The business could be adversely affected by product liability and commercial litigation. The Company’s products may be asserted to cause or contribute to personal injury or property damage to its customers’ facilities or their employees. Additionally, the Company is, from time to time, involved in various kinds of commercial disputes with customers, vendors and others. The ensuing claims may arise singularly, in groups of related claims, or in class actions involving multiple claimants. Such claims and litigation are frequently expensive and time-consuming to resolve, may result in substantial liability to the Company, and may be in excess of available sources of insurance or other forms of re imbursement.
The Company may experience difficulty obtaining materials or components for its products. The Company purchases significant components of its products from third party suppliers. A small number of these suppliers compete with the Company on some level. Other materials and components may be provided by a limited number of suppliers or by sole sources and could only be replaced with difficulty or significant added cost. Additionally, some materials or components may become scarce or difficult to obtain in the market. This could adversely affect the lead-time with which the Company receives the materials or components, and in turn affect the Company’s commitments to its customers, or could adversely affect the material cost for the Company.
Government regulation could impose significant costs and other constraints. The Company’s manufacturing operations and past and present ownership and operations of real property are subject to extensive and changing federal, state, local and foreign laws and regulations, including laws and regulations pertaining to environmental, health and safety, as well as the handling or discharge of hazardous materials into the environment. The Company expects to continue to incur costs to comply with these laws, and may incur penalties for any failure to do so. The Company may also be identified as a responsible party and be subject to liability relating to any investigation and clean-up of properties used for industrial purp oses or the generation or disposal of hazardous substances. Some of the Company’s export sales require approval from the U.S. government. Changes in political relations between the U.S. and foreign countries and/or specific potential customers for which export licenses may be required, may cause a license application to be delayed or denied, or a previously issued license withdrawn, rendering the Company unable to complete a sale, or vulnerable to competitors who do not operate under such restrictions.
The sales, delivery and acceptance cycle for many of the Company’s products is irregular and may not develop as anticipated. Many of the Company’s products have a long sales, delivery and acceptance cycle. Events may cause recognition of orders, backlog and results of operations to be aberrant over shorter periods of time. These factors include the timing of individual large fixed price orders, delays in product readiness, damage or delays in transit, problems in achieving promised results, and various customer-initiated delays. Any such delay may cause fluctuation in the Company’s reported periodic financial results.
The Company’s customers are in cyclical industries. The Company’s orders are subject to customers’ procurement cycles and ability to invest capital, especially in the cyclical automotive, aircraft and machine tool industries. Any event which adversely impacts those customers’ new product development activities may reduce their demand for the Company’s products.
Interest rate fluctuations could adversely affect results. Significant changes in interest rates may affect the Company’s business in several contradictory ways, depending on the Company’s financial position. The Company may, in the future, use debt to finance the growth of the business through acquisitions, purchase shares of the Company’s common stock or to finance working capital needs. Fluctuations in interest rates can increase borrowing costs. Increases in short-term interest rates may directly impact the amount of interest the Company is required to pay and reduce earnings accordingly. Conversely, lower interest r ates will adversely impact the interest the Company earns on cash and short term investments.
The Company may be required to recognize impairment charges for long-lived assets. As of October 2, 2010, the net carrying value of long-lived assets (property, plant and equipment, goodwill and other intangible assets) totaled approximately $96.6 million. In accordance with generally accepted accounting principles, the Company periodically assesses these assets to determine if they are impaired. Significant negative industry or economic trends, disruptions to the Company’s business, significant unexpected or planned changes in use of the assets, divestitures and market capitalization declines may result in impairments to goodwill and other long-lived assets. Future impairment charges could significantly affect results o f operations in the periods recognized.
| Unresolved Staff Comments |
None.
The Company’s primary owned and leased facilities at October 2, 2010 were as follows:
Owned Property:
| | | | Square | |
| Location | Use of Facility | | Footage | |
| Eden Prairie, Minnesota, USA | Corporate headquarters and primary Test segment manufacturing and research | | | 420,000 | |
| Cary, North Carolina, USA | Sensors segment manufacturing, research and North American sales and service administration | | | 65,000 | |
| Berlin, Germany | Test segment manufacturing and European sales and service administration | | | 80,000 | |
| Shenzhen, China | Test segment manufacturing, research and sales and service administration | | | 75,000 | |
| Shanghai, China | Test segment manufacturing and sales and service administration | | | 129,000 | |
Leased Property:
| | | | Square | | | Lease | |
| Location | Use of Facility | | Footage | | | Expires | |
| Chanhassen, Minnesota, USA | Test segment manufacturing | | | 97,000 | | | | 2013 | |
| Ludenscheid, Germany | Sensors segment headquarters, manufacturing, research and European sales and service administration | | | 55,000 | | | | 2012 | |
| Creteil, France | Test segment sales and service administration | | | 16,000 | | | | 2015 | |
| Tokyo, Japan | Test segment sales and service administration. | | | 8,000 | | | | 2013 | |
| | Sensors segment manufacturing and Asia sales and service administration | | | 8,000 | | | | 2015 | |
| Seoul, South Korea | Test segment sales, service administration and assembly | | | 8,000 | | | | 2011 | |
| Shanghai, China | Test segment sales, service administration and assembly | | | 13,000 | | | | 2011 | |
| Shenzhen, China | Test segment manufacturing, research and sales and service administration | | | 13,000 | | | | 2013 | |
| Berlin, Germany | Land under Berlin facility | | | 30,000 | | | | 2052 | |
| Shenzhen, China | Land under Shenzhen facility | | | 31,000 | | | | 2047 | |
| Shanghai, China | Land under Shanghai facility | | | 161,000 | | | | 2056 | |
The Company also leases space in the United States, Europe and Asia for sales and service administration for the Test segment, including locations in Michigan, France, United Kingdom, Sweden, Italy, Japan, and various other locations in the United States. Neither the amount of leased space nor the rental obligations in these locations are significant individually or in the aggregate. Additional information relative to lease obligations is included in Management's Discussion and Analysis of Financial Condition and Results of Operations, appearing under Item 7 of this Annual Report on Form 10-K.
The Company considers its current facilities adequate to support its operations during fiscal year 2011.
On July 27, 2010, the Company settled a legal claim for patent infringement of $7.5 million. From time to time, the Company is party to various claims, legal actions, and complaints arising in the ordinary course of business. Management believes the final resolution of legal matters outstanding as of the end of fiscal year 2010 will not have a material adverse effect on the consolidated financial position or results of operations of the Company.
| Submission of Matters to a Vote of Security Holders |
No matters were submitted to a vote of shareholders during the fourth quarter of the fiscal year ended October 2, 2010.
| Item 5. | Market for Registrant’s Common Equity, Related Stockholder Matters and Issuer Purchases of Equity Securities |
Shares of the Company's common stock are traded on the NASDAQ Global Select MarketSM under the symbol MTSC.
The following table sets forth the low, high, and closing share prices for the fiscal quarters indicated, as well as the volume of shares traded in the quarter. *
| Quarter Ended | | Low | | | High | | | Close | | | Volume | |
| December 27, 2008 | | $ | 21.12 | | | $ | 42.46 | | | $ | 25.64 | | | | 9,480,094 | |
| March 28, 2009 | | $ | 19.75 | | | $ | 28.18 | | | $ | 22.71 | | | | 6,075,476 | |
| June 27, 2009 | | $ | 20.04 | | | $ | 23.32 | | | $ | 20.83 | | | | 8,684,079 | |
| October 3, 2009 | | $ | 20.40 | | | $ | 30.92 | | | $ | 28.13 | | | | 5,636,852 | |
| January 2, 2010 | | $ | 25.00 | | | $ | 30.00 | | | $ | 28.74 | | | | 3,610,138 | |
| April 3, 2010 | | $ | 24.85 | | | $ | 30.89 | | | $ | 29.06 | | | | 3,376,889 | |
| July 3, 2010 | | $ | 25.50 | | | $ | 31.66 | | | $ | 29.15 | | | | 4,831,965 | |
| October 2, 2010 | | $ | 26.17 | | | $ | 31.72 | | | $ | 31.50 | | | | 3,295,040 | |
* Source: NASDAQ OnlineSM at www.nasdaq.net.
At November 26, 2010, there were 958 holders of record of the Company's common stock. This number does not reflect shareholders who hold their shares in the name of broker-dealers or other nominees.
Purchases of Company Equity Securities:
| Fiscal Period | | Total Number of Shares Purchased | | | Average Price Paid per Share | | | Total Number of Shares Purchased as Part of Publicly Announced Plans or Programs | | | Maximum Number of Shares that May Yet be Purchased Under the Plans or Programs | |
| First Quarter | | | | | | | | | | | | |
| October 4, 2009 - | | | | | | | | | | | | |
| January 2, 2010 | | | 52,677 | | | $ | 27.21 | | | | 52,677 | | | | 1,950,861 | |
| Second Quarter | | | | | | | | | | | | | | | | |
| January 3, 2010 - | | | | | | | | | | | | | | | | |
| April 3, 2010 | | | 158,798 | | | $ | 28.21 | | | | 158,798 | | | | 1,792,063 | |
| Third Quarter | | | | | | | | | | | | | | | | |
| April 4, 2010 - | | | | | | | | | | | | | | | | |
| July 3, 2010 | | | 157,799 | | | $ | 29.64 | | | | 157,799 | | | | 1,634,264 | |
| Fourth Quarter | | | | | | | | | | | | | | | | |
| Fiscal Month | | | | | | | | | | | | | | | | |
| July 4, 2010 - | | | | | | | | | | | | | | | | |
| August 7, 2010 | | | 58,400 | | | $ | 29.18 | | | | 58,400 | | | | 1,575,864 | |
| August 8, 2010 - | | | | | | | | | | | | | | | | |
| September 4, 2010 | | | 934,092 | | | $ | 27.57 | | | | 934,092 | | | | 641,772 | |
| September 5, 2010 - | | | | | | | | | | | | | | | | |
| October 2, 2010 | | | - | | | $ | - | | | | - | | | | 641,772 | |
| | | | | | | | | | | | | | | | | |
| Fourth Quarter | | | 992,492 | | | $ | 27.66 | | | | 992,492 | | | | 641,772 | |
| | | | | | | | | | | | | | | | | |
| Fiscal Year 2010 | | | 1,361,766 | | | $ | 27.94 | | | | 1,361,766 | | | | | |
The Company purchases its common stock to mitigate dilution related to new shares created by employee equity compensation such as stock option, restricted stock, and employee stock purchase plan awards, as well as to return excess capital to shareholders.
During fiscal year 2010, Company share purchases were executed under a 3.0 million share purchase authorization approved by the Company’s Board of Directors and announced on August 20, 2007. Authority over pricing and timing under the authorization has been delegated to management. The share purchase authorization has no expiration date.
On May 26, 2010, the Company’s Board of Directors authorized an accelerated share purchase program to acquire shares of the Company’s common stock up to an aggregate purchase price of $30 million. On August 18, 2010, the Company entered into an accelerated share purchase agreement with an unrelated third party investment bank to purchase approximately 0.9 million shares of its common stock for $25 million. The transaction was accounted for as a share retirement resulting in a reduction of common stock and retained earnings of $0.2 million and $24.8 million, respectively, at the share retirement date.
The Company's historical dividend practice was to target a payout ratio over time of approximately 25% of net earnings. During fiscal years 2010 and 2009, the Company paid quarterly cash dividends of $0.15 per share to holders of its common stock, which resulted in a payout ratio of approximately 53% and 58%, respectively.
The Company’s unsecured credit agreement (“Credit Facility”) includes certain financial covenants, including the ratio of consolidated total indebtedness to consolidated EBITDA, as well as the ratio of consolidated EBITDA to consolidated interest expense. These financial covenants may restrict the Company’s ability to pay dividends and purchase outstanding shares of common stock. At October 2, 2010 and October 3, 2009, the Company was in compliance with these financial covenants. Information on the Company’s debt agreements is included in Item 7 of this Annual Report on Form 10-K.
Information regarding the Company’s equity compensation plans is included in Item 12 of this Annual Report on Form 10-K.
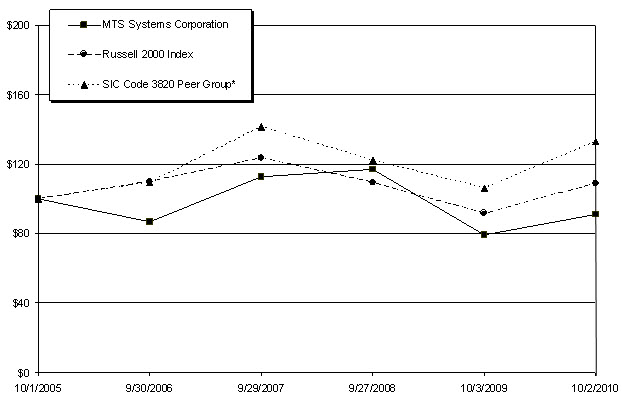
Shareholder Return Performance:
The graph and table below set forth a comparison of the cumulative total return of the Company’s common stock over the last five fiscal years. Assuming a $100 investment on October 1, 2005 and reinvestment of dividends, the total return over the same periods is compared to the Russell 2000 Index and a peer group of companies in the Laboratory Apparatus and Analytical, Optical, Measuring, and Controlling Instruments Standard Industrial Code (SIC Code 3820) who are traded on the NASDAQ, AMEX and NYSE exchanges. The table and graph are not necessarily indicative of future investment performance.
| | | FISCAL YEAR ENDED | |
| | | 10/1/05 | | | 9/29/06 | | | 9/29/07 | | | 9/27/08 | | | 10/3/09 | | | 10/2/10 | |
| MTS Systems Corporation | | $ | 100.00 | | | $ | 86.62 | | | $ | 112.77 | | | $ | 117.10 | | | $ | 79.46 | | | $ | 90.87 | |
| Russell 2000 Index | | | 100.00 | | | | 109.92 | | | | 123.49 | | | | 109.51 | | | | 91.72 | | | | 108.78 | |
| *SIC Code 3820 Peer Group (Modified to remove non-exchange traded companies) | | | 100.00 | | | | 109.46 | | | | 141.52 | | | | 121.98 | | | | 106.35 | | | | 133.11 | |
The table below provides selected historical financial data for the Company which should be read in conjunction with the Consolidated Financial Statements, the Notes to the Consolidated Financial Statements, and “Management’s Discussion and Analysis of Financial Condition and Results of Operations,” which are included in Items 7 and 8 of this Annual Report on Form 10-K. The statement of income data for each of the three fiscal years ended October 2, 2010, October 3, 2009, and September 27, 2008 and the balance sheet data at October 2, 2010 and October 3, 2009 are derived from the audited Consolidated Financial Statements included elsewhere in this report. The statement of income data for the fiscal years ended September 29, 2007 and September 30, 2006 and the balance sheet data at September 27, 2008, September 29, 2007 a nd September 30, 2006 are derived from financial statements of the Company that are not included in this Annual Report on Form 10-K.
| Five-Year Financial Summary | |
| (October 2, 2010; October 3, 2009; September 27, 2008; September 29, 2007; and September 30, 2006) | |
| (expressed in thousands, except per share data and numbers of shareholders and employees) | |
| | |
| | | 2010 | | | | 20091 | | | | 2008 | | | | 2007 | | | | 2006 | |
| Operations | | | | | | | | | | | | | | | | | | | |
| Revenue | | $ | 374,053 | | | $ | 408,881 | | | $ | 460,515 | | | $ | 410,091 | | | $ | 387,924 | |
| Gross profit | | | 151,794 | | | | 151,616 | | | | 190,253 | | | | 173,638 | | | | 168,235 | |
| Gross profit as a % of revenue | | | 40.6 | % | | | 37.1 | % | | | 41.3 | % | | | 42.3 | % | | | 43.4 | % |
| Research and development expense | | $ | 14,945 | | | $ | 16,322 | | | $ | 16,232 | | | $ | 19,285 | | | $ | 17,969 | |
| Research and development as a % of revenue | | | 4.0 | % | | | 4.0 | % | | | 3.5 | % | | | 4.7 | % | | | 4.6 | % |
| Effective income tax rate | | | 31.7 | % | | | 27.2 | % | | | 28.0 | % | | | 27.5 | % | | | 33.7 | % |
| Income before discontinued operations | | $ | 18,576 | | | $ | 17,394 | | | $ | 47,110 | | | $ | 41,041 | | | $ | 37,969 | |
| Net income | | | 18,576 | | | | 17,394 | | | | 49,191 | | | | 41,996 | | | | 39,323 | |
| Net income as a % of revenue | | | 5.0 | % | | | 4.3 | % | | | 10.7 | % | | | 10.2 | % | | | 10.1 | % |
| Diluted earnings per share of common stock before discontinued operations | | $ | 1.14 | | | $ | 1.03 | | | $ | 2.68 | | | $ | 2.24 | | | $ | 1.97 | |
| Diluted earnings per share of common stock | | | 1.14 | | | | 1.03 | | | | 2.80 | | | | 2.29 | | | | 2.04 | |
Weighted average dilutive shares outstanding during the year2 | | | 16,347 | | | | 16,831 | | | | 17,544 | | | | 18,330 | | | | 19,229 | |
| Net interest (expense) income | | $ | (1,052 | ) | | $ | (916 | ) | | $ | 2,950 | | | $ | 2,590 | | | $ | 1,879 | |
| Depreciation and amortization | | | 12,751 | | | | 12,132 | | | | 9,207 | | | | 7,985 | | | | 7,302 | |
| | | | | | | | | | | | | | | | | | | | | |
| Financial Position | | | | | | | | | | | | | | | | | | | | |
| Cash, cash equivalents and short-term investments | | $ | 76,611 | | | $ | 118,885 | | | $ | 114,099 | | | $ | 121,395 | | | $ | 121,537 | |
| Property and equipment, net | | | 56,444 | | | | 56,118 | | | | 50,534 | | | | 49,747 | | | | 42,972 | |
| Total assets | | | 346,405 | | | | 386,914 | | | | 399,157 | | | | 352,981 | | | | 324,123 | |
Interest-bearing debt3 | | | 40,000 | | | | 40,000 | | | | 26,308 | | | | 8,991 | | | | 15,673 | |
| Total shareholders’ investment | | | 166,106 | | | | 203,965 | | | | 204,942 | | | | 189,701 | | | | 169,321 | |
| Interest-bearing debt as a % of shareholders’ investment | | | 24.1 | % | | | 19.6 | % | | | 12.8 | % | | | 4.7 | % | | | 9.3 | % |
Return on equity4 | | | 9.1 | % | | | 8.5 | % | | | 24.8 | % | | | 24.2 | % | | | 20.1 | % |
Return on invested capital5 | | | 8.7 | % | | | 7.9 | % | | | 22.3 | % | | | 21.9 | % | | | 19.7 | % |
| | | | | | | | | | | | | | | | | | | | | |
| Other Statistics | | | | | | | | | | | | | | | | | | | | |
Number of common shareholders of record at year-end6 | | | 981 | | | | 1,010 | | | | 1,043 | | | | 1,092 | | | | 1,201 | |
| Number of employees at year-end | | | 1,948 | | | | 2,015 | | | | 1,660 | | | | 1,575 | | | | 1,474 | |
| Orders | | $ | 423,525 | | | $ | 340,839 | | | $ | 485,274 | | | $ | 421,437 | | | $ | 366,626 | |
| Backlog of orders at year-end | | | 214,330 | | | | 167,726 | | | | 234,710 | | | | 204,558 | | | | 189,000 | |
| Cash dividends paid per share | | | 0.60 | | | | 0.60 | | | | 0.60 | | | | 0.48 | | | | 0.41 | |
| 1 | The fiscal year ended October 3, 2009 was a 53-week fiscal year, whereas all other fiscal years presented were 52-week periods. |
| 2 | Assumes the conversion of potential common shares using the treasury stock method. |
| 3 | Consists of short-term borrowings and the current and non-current portion of long-term debt. |
| 4 | Calculated by dividing Income Before Discontinued Operations by beginning Shareholders’ Investment. |
| 5 | Calculated by dividing Income Before Discontinued Operations, excluding after-tax interest expense, by the aggregate of average interest bearing debt and average Shareholders’ Investment. |
| 6 | Does not include shareholders whose stock is held in the name of broker dealers or other nominees. |
| Management’s Discussion and Analysis of Financial Condition and Results of Operations |
MTS Systems Corporation is a leading global supplier of test systems and industrial position sensors. The Company’s testing hardware and software solutions help customers accelerate and improve their design, development, and manufacturing processes and are used for determining the mechanical behavior of materials, products, and structures. MTS’ high-performance position sensors provide controls for a variety of industrial and vehicular applications. MTS had 1,948 employees and revenue of $374 million for the fiscal year ended October 2, 2010.
Fiscal Year
The Company’s fiscal year ends on the Saturday closest to September 30. The fiscal years ended October 2, 2010, October 3, 2009 and September 27, 2008 consisted of 52 weeks, 53 weeks, and 52 weeks, respectively.
Fiscal Year 2010 Compared to Fiscal Year 2009
Summary of Financial Results
Highlights for Fiscal Year 2010 compared to Fiscal Year 2009 include:
| | · | Orders increased 24.3% to $423.5 million, compared to orders of $340.8 million for fiscal year 2009. The increase in orders represents worldwide growth of 23.9% and 25.9% in the Test and Sensors segments, respectively, including four large Test segment orders, each in excess of $5.0 million, totaling approximately $33 million. Fiscal year 2009 orders included one large order totaling approximately $7 million. Backlog of undelivered orders at October 2, 2010 was $214.3 million, an increase of 27.8% from backlog of $167.7 million at October 3, 2009. |
| | · | Revenue decreased 8.5% to $374.1 million, compared to revenue of $408.9 million for fiscal year 2009. This decrease was primarily due to 28.5% lower opening backlog, partially offset by the strong execution of short-cycle orders in the Test segment and higher volume in the Sensors segment. |
| | · | During each of the fiscal years 2010 and 2009, the Company initiated workforce reduction actions in order to align the Company’s operating cost structure with changing market conditions. As a result of these actions, the Company incurred severance and benefit costs totaling $1.6 million and $12.1 million during fiscal year 2010 and 2009, respectively. Severance and benefit costs recognized during fiscal year 2010 were associated entirely with the Test segment. For fiscal year 2009, $10.9 million and $1.2 million of severance and benefits costs were reported in the Test and Sensors segments, respectively. Of the $1.6 million severance costs in fiscal year 2010, $1.4 million, $0.1 million, and $0.1 million were reported in Cost of Sales, Selling and Marketing, and General and Administrative, respectively. Of the $12.1 million total severance costs in fiscal year 2009, $6.8 million, $4.0 million, $1.2 million, a nd $0.1 million were reported in Cost of Sales, Selling and Marketing, General and Administrative, and Research and Development expense, respectively. |
| | · | The Company settled a legal claim for patent infringement for $7.5 million, of which $6.3 million and $1.2 million was expensed during fiscal year 2010 and 2009, respectively. |
| | · | Income from operations increased 15.0%, to $28.3 million, compared to $24.6 million for fiscal year 2009, primarily driven by reduced severance charges, lower warranty expense, and lower operating expenses from reduced headcount and discretionary spending. This was partially offset by decreased volume, higher variable compensation expense and the previously mentioned legal settlement costs recognized in fiscal year 2010. |
| | · | Cash and cash equivalents at October 2, 2010 totaled $76.6 million, compared to $118.9 million at the end of fiscal year 2009. Cash flows from operations generated $33.2 million. During fiscal year 2010, the Company invested $11.2 million in capital expenditures, made $6.3 million of deferred payments associated with the acquisition of SANS, paid $12.1 million in dividends, and purchased approximately 1,362,000 shares of common stock for $38.2 million. |
Detailed Financial Results
Total Company
Orders and Backlog
The following is a comparison of fiscal year 2010 and fiscal year 2009 orders, separately identifying the estimated impact of currency translation:
| | | | | | Estimated | | | | |
| | | | | | Business | | | Currency | | | | |
| | | 2010 | | | Change | | | Translation | | | 2009 | |
| | | (expressed in millions) | |
| Orders | | $ | 423.5 | | | $ | 79.3 | | | $ | 3.4 | | | $ | 340.8 | |
Orders totaled $423.5 million, an increase of $82.7 million, or 24.3%, compared to orders of $340.8 million for fiscal year 2009, reflecting increased order volume across all geographies in both segments, including four large Test segment custom orders totaling approximately $33 million, and an estimated $3.4 million favorable impact of currency translation. Fiscal year 2009 orders included one larger order totaling approximately $7 million. Test segment orders increased $65.7 million to $340.7 million, while Sensors segment orders increased $17.0 million to $82.8 million.
The following is a comparison of fiscal year 2010 and fiscal year 2009 orders by geography:
| Geography | | 2010 | | | 2009 | | | Variance | | | % Variance | |
| | | (expressed in millions) | | | | |
| Americas | | $ | 143.5 | | | $ | 108.3 | | | $ | 35.2 | | | | 32.5 | % |
| Europe | | | 131.8 | | | | 108.7 | | | | 23.1 | | | | 21.3 | % |
| Asia | | | 148.2 | | | | 123.8 | | | | 24.4 | | | | 19.7 | % |
| Total Orders | | $ | 423.5 | | | $ | 340.8 | | | $ | 82.7 | | | | 24.3 | % |
Backlog of undelivered orders at October 2, 2010 was $214.3 million, an increase of approximately $46.6 million, or 27.8%, compared to backlog of $167.7 million at October 3, 2009. The Company believes backlog is not an absolute indicator of future revenue because a portion of the orders in backlog could be cancelled at the customer’s discretion. The Company seldom experiences order cancellations larger than $1.0 million. However, current economic conditions could have an adverse impact on order cancellations in the future.
Results of Operations
The following is a comparison of fiscal year 2010 and fiscal year 2009 statements of operations (in millions, except per share data):
| | | 2010 | | | 2009 | | | Variance | | | % Variance | |
| Revenue | | $ | 374.1 | | | $ | 408.9 | | | $ | (34.8 | ) | | | -8.5 | % |
| Cost of sales | | | 222.3 | | | | 257.3 | | | | (35.0 | ) | | | -13.6 | % |
| Gross profit | | | 151.8 | | | | 151.6 | | | | 0.2 | | | | 0.1 | % |
| Gross margin | | | 40.6 | % | | | 37.1 | % | | | 3.5 | % | | | | |
| | | | | | | | | | | | | | | | | |
| Operating expenses: | | | | | | | | | | | | | | | | |
| Selling and marketing | | | 65.9 | | | | 71.6 | | | | (5.7 | ) | | | -8.0 | % |
| General administrative | | | 42.7 | | | | 39.1 | | | | 3.6 | | | | 9.2 | % |
| Research and development | | | 14.9 | | | | 16.3 | | | | (1.4 | ) | | | -8.6 | % |
| Total operating expenses | | | 123.5 | | | | 127.0 | | | | (3.5 | ) | | | -2.8 | % |
| Income from operations | | | 28.3 | | | | 24.6 | | | | 3.7 | | | | 15.0 | % |
| Interest expense | | | (1.4 | ) | | | (2.0 | ) | | | 0.6 | | | | -30.0 | % |
| Interest income | | | 0.4 | | | | 1.1 | | | | (0.7 | ) | | | -63.6 | % |
| Other (expense) income, net | | | (0.1 | ) | | | 0.2 | | | | (0.3 | ) | | | -150.0 | % |
| | | | | | | | | | | | | | | | | |
| Income before income taxes | | | 27.2 | | | | 23.9 | | | | 3.3 | | | | 13.8 | % |
| Provision for income taxes | | | 8.6 | | | | 6.5 | | | | 2.1 | | | | 32.3 | % |
| Net income | | $ | 18.6 | | | $ | 17.4 | | | $ | 1.2 | | | | 6.9 | % |
| | | | | | | | | | | | | | | | | |
| Diluted earnings per share | | $ | 1.14 | | | $ | 1.03 | | | $ | 0.11 | | | | 10.7 | % |
The following is a comparison of fiscal year 2010 and fiscal year 2009 results of operations, separately identifying the estimated impact of currency translation:
| | | | | | Estimated | | | | |
| | | | | | Business | | | Currency | | | | |
| | | 2010 | | | Change | | | Translation | | | 2009 | |
| | | (expressed in millions) | |
| Revenue | | $ | 374.1 | | | $ | (38.1 | ) | | $ | 3.3 | | | $ | 408.9 | |
| Cost of sales | | | 222.3 | | | | (37.4 | ) | | | 2.4 | | | | 257.3 | |
| Gross profit | | | 151.8 | | | | (0.7 | ) | | | 0.9 | | | | 151.6 | |
| Gross margin | | | 40.6 | % | | | | | | | | | | | 37.1 | % |
| | | | | | | | | | | | | | | | | |
| Operating expenses: | | | | | | | | | | | | | | | | |
| Selling and marketing | | | 65.9 | | | | (6.3 | ) | | | 0.6 | | | | 71.6 | |
| General administrative | | | 42.7 | | | | 3.4 | | | | 0.2 | | | | 39.1 | |
| Research and development | | | 14.9 | | | | (1.4 | ) | | | - | | | | 16.3 | |
| Total operating expenses | | | 123.5 | | | | (4.3 | ) | | | 0.8 | | | | 127.0 | |
| Income from operations | | $ | 28.3 | | | $ | 3.6 | | | $ | 0.1 | | | $ | 24.6 | |
Revenue
Revenue was $374.1 million, a decrease of $34.8 million, or 8.5%, compared to revenue of $408.9 million for fiscal year 2009. This decrease was primarily due to a 28.5% decline in opening backlog, partially offset by higher volume in the Sensors segment and an estimated $3.3 million favorable impact of currency translation. Test segment revenue decreased 13.5% to $296.3 million, while Sensors segment revenue increased 17.3% to $77.8 million.
The following is a comparison of fiscal year 2010 and fiscal year 2009 revenue by geography:
| Geography | | 2010 | | | 2009 | | | Variance | | | % Variance | |
| | | (expressed in millions) | | | | |
| Americas | | $ | 122.1 | | | $ | 141.8 | | | $ | (19.7 | ) | | | -13.9 | % |
| Europe | | | 112.9 | | | | 128.7 | | | | (15.8 | ) | | | -12.3 | % |
| Asia | | | 139.1 | | | | 138.4 | | | | 0.7 | | | | 0.5 | % |
| Total Revenue | | $ | 374.1 | | | $ | 408.9 | | | $ | (34.8 | ) | | | -8.5 | % |
Although selective product price changes were implemented during each of these fiscal years, the overall impact of pricing changes did not have a material effect on revenue.
Gross profit
Gross profit was $151.8 million, relatively flat compared to gross profit of $151.6 million for fiscal year 2009. Gross profit as a percentage of revenue was 40.6%, an increase of 3.5 percentage points from 37.1% for fiscal year 2009. The increase was driven by higher volume in the Sensors segment, and includes a 1.9 percentage point increase due to reduced warranty expense in the Test segment, as well as a 1.5 percentage point increase due to $5.4 million lower severance charges associated with the workforce reduction actions. This was partially offset by lower volume in the Test segment and a 1.0 percentage point decrease due to $3.7 million higher variable compensation expense.
Selling and Marketing Expense
Selling and marketing expense was $65.9 million, a decrease of $5.7 million, or 8.0%, compared to $71.6 million for fiscal year 2009. This decrease was primarily due to reduced headcount and discretionary spending in both segments and $3.9 million lower severance charges associated with workforce reduction actions. Selling and marketing expense as a percentage of revenue was 17.6%, relatively flat compared to 17.5% for fiscal year 2009.
General and Administrative Expense
General and administrative expense was $42.7 million, an increase of $3.6 million, or 9.2%, compared to $39.1 million for fiscal year 2009. This increase was primarily due to $5.3 million increased legal expense, driven by the previously mentioned legal settlement costs, and $1.9 million increased variable compensation expense. This was partially offset by reduced headcount and discretionary spending in both segments. General and administrative expense as a percentage of revenue was 11.4%, compared to 9.6% for fiscal year 2009.
Research and Development Expense
Research and development expense was $14.9 million, a decrease of $1.4 million, or 8.6%, compared to $16.3 million for fiscal year 2009. This decrease was primarily due to a lower level of planned expenditures. In addition, the Company continued to allocate certain of its resources towards capitalized software development activities during fiscal year 2010. Total software development costs capitalized during fiscal years 2010 and 2009 were $3.6 million and $3.9 million, respectively. Research and development expense as a percentage of revenue was 4.0%, flat compared to fiscal year 2009.
Income from Operations
Income from operations was $28.3 million, an increase of $3.7 million, or 15.0%, compared to income from operations of $24.6 million for fiscal year 2009. This increase was primarily driven by reduced severance and warranty charges and lower operating expenses from reduced headcount and discretionary spending. This was partially offset by decreased volume, higher variable compensation expense and legal settlement costs recognized in fiscal year 2010. Operating income as a percentage of revenue was 7.6%, compared to 6.0% for fiscal year 2009.
Historically, the Company’s operating costs have been impacted by a level of inflation ranging from -1% to 4%. The Company uses a number of strategies to mitigate the effects of cost inflation including cost productivity initiatives such as global procurement strategies, as well as increasing prices. However, if the Company’s operating costs were to become subject to significant inflationary pressures, it may not be able to fully offset such higher costs despite these strategies.
Interest Expense
Interest expense was $1.4 million, a decrease of $0.6 million compared to $2.0 million for fiscal year 2009. This decrease was primarily due to the lapse of statute of limitations on certain tax contingencies in fiscal year 2010 which resulted in a reduction of the related interest expense previously recognized on those contingencies.
Interest Income
Interest income was $0.4 million, a decrease of $0.7 million compared to $1.1 million for fiscal year 2009, due to lower interest rates, primarily in Europe.
Other (Expense) Income, net
Other (expense) income, net was $0.1 million of net other expense, compared to $0.2 million of net other income in fiscal year 2009. The decrease was primarily due to higher net losses on foreign currency transactions in fiscal year 2010.
Provision for Income Taxes
Provision for income taxes totaled $8.6 million, an increase of $2.1 million, or 32.3%, compared to $6.5 million for the fiscal year 2009. The effective tax rate for fiscal year 2010 was 31.7%, an increase of 4.5 percentage points compared to a tax rate of 27.2% for fiscal 2009. The increase was primarily due to a $1.0 million tax benefit from the retroactive extension of U.S. R&D credits in fiscal year 2009 coupled with the U.S. R&D tax legislation expiring at the end of the first quarter of fiscal year 2010. This increase in the effective tax rate was partially offset by increased tax benefits of $0.8 million recognized in fiscal 2010 upon the release of certain contingencies, due to the lapse of statute of limitations, as well as the benefit of foreign tax credits associated with the cash repatriation of earnings. The tax benef its from the cash repatriation of earnings reflect the anticipated utilization of available foreign tax credits.
Net Income
Net income was $18.6 million, or $1.14 per diluted share, for fiscal year 2010, an increase of 6.9% compared to $17.4 million, or $1.03 per diluted share, for fiscal year 2009. The increase was primarily driven by higher income from operations.
Segment Results
Test Segment
Orders and Backlog
The following is a comparison of fiscal year 2010 and fiscal year 2009 orders for the Test segment, separately identifying the estimated impact of currency translation:
| | | | | | Estimated | | | | |
| | | | | | Business | | | Currency | | | | |
| | | 2010 | | | Change | | | Translation | | | 2009 | |
| | | (expressed in millions) | |
| Orders | | $ | 340.7 | | | $ | 62.9 | | | $ | 2.8 | | | $ | 275.0 | |
Orders totaled $340.7 million, an increase of $65.7 million, or 23.9%, compared to orders of $275.0 million for fiscal year 2009, primarily due to higher volume across all geographies, led by strength in the ground vehicles market in China and a broad-based increase in the infrastructure market, including the previously mentioned four large custom orders totaling approximately $33 million. Fiscal 2009 orders included one large order totaling approximately $7 million. Fiscal year 2010 orders also included an estimated $2.8 million favorable impact of currency translation. The Test segment accounted for 80.4% of total Company orders, compared to 80.7% for the fiscal 2009.
The following is a comparison of fiscal year 2010 and fiscal year 2009 orders for the Test segment by geography:
| Geography | | 2010 | | | 2009 | | | Variance | | | % Variance | |
| | | (expressed in millions) | | | | |
| Americas | | $ | 120.0 | | | $ | 87.8 | | | $ | 32.2 | | | | 36.7 | % |
| Europe | | | 93.5 | | | | 78.2 | | | | 15.3 | | | | 19.6 | % |
| Asia | | | 127.2 | | | | 109.0 | | | | 18.2 | | | | 16.7 | % |
| Total Orders | | $ | 340.7 | | | $ | 275.0 | | | $ | 65.7 | | | | 23.9 | % |
Backlog of undelivered orders at October 2, 2010 was $198.2 million, an increase of 26.7% from backlog of $156.4 million at October 3, 2009.
Results of Operations
The following is a comparison of fiscal year 2010 and fiscal year 2009 results of operations for the Test segment, separately identifying the estimated impact of currency translation:
| | | | | | Estimated | | | | |
| | | | | | Business | | | Currency | | | | |
| | | 2010 | | | Change | | | Translation | | | 2009 | |
| | | (expressed in millions) | |
| Revenue | | $ | 296.3 | | | $ | (49.2 | ) | | $ | 2.9 | | | $ | 342.6 | |
| Cost of sales | | | 187.8 | | | | (41.8 | ) | | | 2.2 | | | | 227.4 | |
| Gross profit | | | 108.5 | | | | (7.4 | ) | | | 0.7 | | | | 115.2 | |
| Gross margin | | | 36.6 | % | | | | | | | | | | | 33.6 | % |
| | | | | | | | | | | | | | | | | |
| Operating expenses: | | | | | | | | | | | | | | | | |
| Selling and marketing | | | 52.0 | | | | (4.5 | ) | | | 0.4 | | | | 56.1 | |
| General administrative | | | 34.1 | | | | 4.4 | | | | 0.1 | | | | 29.6 | |
| Research and development | | | 11.2 | | | | (0.8 | ) | | | - | | | | 12.0 | |
| Total operating expenses | | | 97.3 | | | | (0.9 | ) | | | 0.5 | | | | 97.7 | |
| Income (loss) from operations | | $ | 11.2 | | | $ | (6.5 | ) | | $ | 0.2 | | | $ | 17.5 | |
Revenue
Revenue was $296.3 million, a decrease of $46.3 million, or 13.5%, compared to revenue of $342.6 million for fiscal year 2009. The decrease was primarily due to a 29.8% decline in opening backlog, partially offset by the strong execution of short-cycle orders and an estimated $2.9 million favorable impact of currency translation. The long-cycle nature of custom projects in backlog caused the Test business to lag both the economic recession experienced in fiscal year 2009 as well as the recovery experienced in fiscal year 2010.
The following is a comparison of fiscal year 2010 and fiscal year 2009 revenue for the Test segment by geography:
| Geography | | 2010 | | | 2009 | | | Variance | | | % Variance | |
| | | (expressed in millions) | | | | |
| Americas | | $ | 98.9 | | | $ | 122.8 | | | $ | (23.9 | ) | | | -19.5 | % |
| Europe | | | 77.6 | | | | 96.3 | | | | (18.7 | ) | | | -19.4 | % |
| Asia | | | 119.8 | | | | 123.5 | | | | (3.7 | ) | | | -3.0 | % |
| Total Revenue | | $ | 296.3 | | | $ | 342.6 | | | $ | (46.3 | ) | | | -13.5 | % |
Gross Profit
Gross profit was $108.5 million, a decrease of $6.7 million, or 5.8%, compared to gross profit of $115.2 million for fiscal year 2009. Gross profit as a percentage of revenue was 36.6%, an increase of 3.0 percentage points from 33.6% for fiscal year 2009. This increase includes a 2.3 percentage point increase due to reduced warranty expense, as well as a 1.7 percentage point increase due to $5.1 million lower severance charges associated with the workforce reduction actions. This was partially offset by lower volume and a $3.5 million increase in variable compensation expense.
Selling and Marketing Expense
Selling and marketing expense was $52.0 million, a decrease of $4.1 million, or 7.3%, compared to $56.1 million for fiscal year 2009. This decrease was primarily due to reduced headcount and discretionary spending, and $3.1 million lower severance charges associated with workforce reduction actions. This was partially offset by $1.6 million increased variable compensation expense. Selling and marketing expense as a percentage of revenue was 17.5%, compared to 16.4% for fiscal year 2009.
General and Administrative Expense
General and administrative expense was $34.1 million, an increase of $4.5 million, or 15.2%, compared to $29.6 million for fiscal year 2009. This increase was primarily due to $5.3 million increased legal expense, driven by the previously mentioned legal settlement costs, and $1.4 million increased variable compensation expense. This was partially offset by reduced headcount and discretionary spending in both segments, and $1.0 million lower severance charges associated with workforce reduction. General and administrative expense as a percentage of revenue was 11.5%, compared to 8.6% for fiscal year 2009.
Research and Development Expense
Research and development expense was $11.2 million, a decrease of $0.8 million, or 6.7%, compared to $12.0 million for fiscal year 2009, due to a lower level of planned expenditures. Research and development expense as a percentage of revenue was 3.8%, compared to 3.5% for fiscal year 2009.
Income from Operations
Income from operations was $11.2 million, a decrease of $6.3 million, or 36.0%, compared to income from operations of $17.5 million for fiscal year 2009. This decrease was primarily driven by lower volume, higher variable compensation expense and legal settlement costs recognized in fiscal year 2010. This was partially offset by reduced severance and warranty charges and lower operating expenses from reduced headcount and discretionary spending. Operating income as a percentage of revenue was 3.8%, compared to 5.1% for fiscal year 2009.
Sensors Segment
Orders and Backlog
The following is a comparison of fiscal 2010 and fiscal 2009 orders for the Sensors segment, separately identifying the estimated impact of currency translation:
| | | | | | Estimated | | | | |
| | | | | | Business | | | Currency | | | | |
| | | 2010 | | | Change | | | Translation | | | 2009 | |
| | | (expressed in millions) | |
| Orders | | $ | 82.8 | | | $ | 16.4 | | | $ | 0.6 | | | $ | 65.8 | |
Orders totaled $82.8 million, an increase of $17.0 million, or 25.8%, compared to orders of $65.8 million for fiscal year 2009, primarily due to higher volume across all geographies, resulting from customer inventory replenishment and modest end-market recovery, as well as an estimated $0.6 million favorable impact of currency translation. The strongest growth was experienced in the mobile hydraulic, wind, steel, plastics and rubber markets. Sensors segment accounted for 19.6% of total Company orders, compared to 19.3% for fiscal year 2009.
The following is a comparison of fiscal year 2010 and fiscal year 2009 orders for the Sensors segment by geography:
| Geography | | 2010 | | | 2009 | | | Variance | | | % Variance | |
| | | (expressed in millions) | | | | |
| Americas | | $ | 23.5 | | | $ | 20.5 | | | $ | 3.0 | | | | 14.6 | % |
| Europe | | | 38.3 | | | | 30.5 | | | | 7.8 | | | | 25.6 | % |
| Asia | | | 21.0 | | | | 14.8 | | | | 6.2 | | | | 41.9 | % |
| Total Orders | | $ | 82.8 | | | $ | 65.8 | | | $ | 17.0 | | | | 25.8 | % |
Backlog of undelivered orders at October 2, 2010 was $16.1 million, an increase of 42.5% from backlog of $11.3 million at October 3, 2009.
Results of Operations
The following is a comparison of fiscal year 2010 and fiscal year 2009 results of operations for the Sensors segment, separately identifying the estimated impact of currency translation:
| | | | | | Estimated | | | | |
| | | | | | Business | | | Currency | | | | |
| | | 2010 | | | Change | | | Translation | | | 2009 | |
| | | (expressed in millions) | |
| Revenue | | $ | 77.8 | | | $ | 11.1 | | | $ | 0.4 | | | $ | 66.3 | |
| Cost of sales | | | 34.5 | | | | 4.4 | | | | 0.2 | | | | 29.9 | |
| Gross profit | | | 43.3 | | | | 6.7 | | | | 0.2 | | | | 36.4 | |
| Gross margin | | | 55.7 | % | | | | | | | | | | | 54.9 | % |
| | | | | | | | | | | | | | | | | |
| Operating expenses: | | | | | | | | | | | | | | | | |
| Selling and marketing | | | 13.9 | | | | (1.8 | ) | | | 0.2 | | | | 15.5 | |
| General administrative | | | 8.6 | | | | (1.0 | ) | | | 0.1 | | | | 9.5 | |
| Research and development | | | 3.7 | | | | (0.6 | ) | | | - | | | | 4.3 | |
| Total operating expenses | | | 26.2 | | | | (3.4 | ) | | | 0.3 | | | | 29.3 | |
| Income (loss) from operations | | $ | 17.1 | | | $ | 10.1 | | | $ | (0.1 | ) | | $ | 7.1 | |
Revenue
Revenue was $77.8 million, an increase of $11.5 million, or 17.3%, compared to revenue of $66.3 million for the fiscal year 2009. This increase was primarily driven by increased worldwide order volume.
The following is a comparison of fiscal year 2010 and fiscal year 2009 revenue for the Sensors segment by geography:
| Geography | | 2010 | | | 2009 | | | Variance | | | % Variance | |
| | | (expressed in millions) | | | | |
| Americas | | $ | 23.2 | | | $ | 19.0 | | | $ | 4.2 | | | | 22.1 | % |
| Europe | | | 35.3 | | | | 32.4 | | | | 2.9 | | | | 9.0 | % |
| Asia | | | 19.3 | | | | 14.9 | | | | 4.4 | | | | 29.5 | % |
| Total Revenue | | $ | 77.8 | | | $ | 66.3 | | | $ | 11.5 | | | | 17.3 | % |
Gross Profit
Gross profit was $43.3 million, an increase of $6.9 million, or 19.0%, compared to gross profit of $36.4 million for fiscal year 2009. Gross profit as a percentage of revenue was 55.7%, an increase of 0.8 percentage points from 54.9% for fiscal year 2009. This increase was primarily due to increased volume and $0.3 million of severance charges associated with workforce reduction actions recognized in fiscal year 2009. This was partially offset by $0.2 million increased variable compensation expense.
Selling and Marketing Expense
Selling and marketing expense was $13.9 million, a decrease of $1.6 million, or 10.3%, compared to $15.5 million for fiscal year 2009. The decrease is primarily due to reduced headcount and $0.8 million of severance charges associated with workforce reduction actions recognized in fiscal year 2009. This was partially offset by $0.4 million increased variable compensation expense. Selling and marketing expense as a percentage of revenue was 17.9%, compared to 23.4% for fiscal year 2009.
General and Administrative Expense
General and administrative expense was $8.6 million, a decrease of $0.9 million, or 9.5%, compared to $9.5 million for fiscal year 2009, primarily due to reduced headcount and discretionary spending, partially offset by a $0.5 million increased variable compensation expense. General and administrative expense as a percentage of revenue was 11.1%, compared to 14.3% for fiscal year 2009.
Research and Development Expense
Research and development expense was $3.7 million, a decrease of $0.6 million, or 14.0%, compared to $4.3 million for fiscal year 2009. The decrease was due to reduced headcount, partially offset by $0.3 million increased variable compensation expense. Research and development expense as a percentage of revenue was 4.8%, compared to 6.5% for fiscal year 2009.
Income from operations
Income from operations was $17.1 million, an increase of $10.0 million, or 140.8%, compared to income from operations of $7.1 million for fiscal year 2009, primarily due to higher gross profit and reduced operating expenses. Operating income as a percentage of revenue was 22.0%, compared to 10.7% for fiscal year 2009.
Fiscal Year 2009 Compared to Fiscal Year 2008
Summary of Financial Results
Highlights for Fiscal Year 2009 compared to Fiscal Year 2008 include:
| | · | On September 28, 2008 the Company acquired substantially all of the assets of SANS for $49.4 million. SANS has manufacturing facilities in both Shenzhen and Shanghai, China, and is headquartered in Shenzhen. SANS manufactures material testing systems and offers a variety of products, including electro-mechanical and static-hydraulic testing machines. The results of operations for SANS have been included in the Company’s results of operations since the date of the acquisition, and are reported in the Company’s Test segment. Orders for SANS for fiscal year 2009 were $24.9 million. SANS reported a $3.0 million loss from operations for fiscal year 2009, on $23.6 million of revenue, driven by lower gross profit, which includes a $1.9 million reduction associated with the sale of inventory that was written up to fair value as part of the acquisition, as well as increased operating expenses associated with int egration-related items. Total Company headcount in Asia increased by approximately 550 employees during fiscal year 2009 to support the SANS business. |
| | · | Orders decreased 29.8% to $340.8 million, compared to orders of $485.3 million for fiscal year 2008, as sharply lower demand in worldwide industrial capital spending in the Company’s markets had a negative impact on both the Test and Sensors segments. Backlog of undelivered orders at October 3, 2009 was $167.7 million, including $9.9 million from SANS, a decrease of 28.5% from backlog of $234.7 million at September 27, 2008. |
| | · | Revenue decreased 11.2% to $408.9 million, compared to revenue of $460.5 million for fiscal year 2008. This decrease was primarily due to a 12.4% decrease in the organic Test business and a 31.3% decline in the Sensors segment. SANS provided a 5.1% benefit for fiscal year 2009. |
| | · | The Company initiated workforce reduction actions throughout fiscal year 2009, in order to align the Company’s operating cost structure with changing market conditions. As a result of the workforce reduction actions, the Company incurred severance and benefit costs totaling $12.1 million, of which $10.9 million and $1.2 million was reported in the Test and Sensors segments, respectively. Of the $12.1 million total costs, $6.8 million, $4.0 million, $1.2 million, and $0.1 million were reported in Cost of Sales, Selling and Marketing, General and Administrative, and Research and Development expense, respectively. These actions resulted in approximately an 18% reduction in the organic business workforce. |
| | · | Income from operations decreased 60.2%, to $24.6 million, compared to $61.8 million for fiscal year 2008, primarily driven by lower volume, higher warranty expense and the previously mentioned severance charges. This was partially offset by reduced operating expenses in the organic Test business, resulting from a smaller workforce and lower discretionary spending, and a $6.7 million reduction in variable compensation expense. |
| | · | Cash and cash equivalents at October 3, 2009 totaled $118.9 million, compared to $114.1 million at the end of fiscal year 2008. Cash flows from operations generated $43.8 million. During fiscal year 2009, the Company borrowed $16.0 million from its credit facility, paid an additional $25.1 million for the acquisition of SANS, invested $9.8 million in capital expenditures, and purchased 507,500 shares of common stock for $12.8 million. |
Detailed Financial Results
Total Company
Orders and Backlog
The following is a comparison of fiscal year 2009 and fiscal year 2008 orders, separately identifying the impact of the SANS acquisition as well as the estimated impact of currency translation:
| | | | | | Estimated | | | | | | Estimated | | | | |
| | | | | | Organic | | | | | | | | | | |
| | | | | | Business | | | SANS | | | Currency | | | | |
| | | 2009 | | | Change | | | Acquisition | | | Translation | | | 2008 | |
| | | (expressed in millions) | |
| Orders | | $ | 340.8 | | | $ | (161.3 | ) | | $ | 24.9 | | | $ | (8.1 | ) | | $ | 485.3 | |
Orders totaled $340.8 million, a decrease of $144.5 million, or 29.8%, compared to orders of $485.3 million for fiscal year 2008, reflecting lower order volume in both segments across all geographies as a result of reduced capital spending and overall severe economic conditions. Currency translation had an estimated $8.1 million unfavorable impact on fiscal year 2009 orders. These decreases were partially offset by $24.9 million from SANS.
The following is a comparison of fiscal year 2009 and fiscal year 2008 orders by geography:
| Geography | | 2009 | | | 2008 | | | Variance | | | % Variance | |
| | | (expressed in millions) | | | | |
| Americas | | $ | 108.3 | | | $ | 176.2 | | | $ | (67.9 | ) | | | -38.5 | % |
| Europe | | | 108.7 | | | | 168.4 | | | | (59.7 | ) | | | -35.5 | % |
| Asia | | | 123.8 | | | | 140.7 | | | | (16.9 | ) | | | -12.0 | % |
| Total Orders | | $ | 340.8 | | | $ | 485.3 | | | $ | (144.5 | ) | | | -29.8 | % |
Backlog of undelivered orders at October 3, 2009 was $167.7 million, a decrease of approximately $67.0 million, or 28.5%, compared to backlog of $234.7 million at September 27, 2008. Backlog included $9.9 million from SANS. During fiscal year 2009, the Company experienced one significant cancellation in the Test segment of approximately $3.0 million. The Company believes backlog is not an absolute indicator of its future revenue because a portion of the orders constituting this backlog could be cancelled at the customer’s discretion. The Company seldom experiences order cancellations larger than $1.0 million. However, current economic conditions could have an adverse impact on order cancellations in the future.
Results of Operations
The following is a comparison of fiscal year 2009 and fiscal year 2008 statements of operations (in millions, except per share data):
| | | 2009 | | | 2008 | | | Variance | | | % Variance | |
| | | | | | | | | | | | | |
| Revenue | | $ | 408.9 | | | $ | 460.5 | | | $ | (51.6 | ) | | | -11.2 | % |
| Cost of sales | | | 257.3 | | | | 270.2 | | | | (12.9 | ) | | | -4.8 | % |
| Gross profit | | | 151.6 | | | | 190.3 | | | | (38.7 | ) | | | -20.3 | % |
| Gross margin | | | 37.1 | % | | | 41.3 | % | | | -4.2 | % | | | | |
| | | | | | | | | | | | | | | | | |
| Operating expenses: | | | | | | | | | | | | | | | | |
| Selling and marketing | | | 71.6 | | | | 76.9 | | | | (5.3 | ) | | | -6.9 | % |
| General administrative | | | 39.1 | | | | 35.4 | | | | 3.7 | | | | 10.5 | % |
| Research and development | | | 16.3 | | | | 16.2 | | | | 0.1 | | | | 0.6 | % |
| Total operating expenses | | | 127.0 | | | | 128.5 | | | | (1.5 | ) | | | -1.2 | % |
| Income from operations | | | 24.6 | | | | 61.8 | | | | (37.2 | ) | | | -60.2 | % |
| Interest expense | | | (2.0 | ) | | | (1.1 | ) | | | (0.9 | ) | | | 81.8 | % |
| Interest income | | | 1.1 | | | | 4.0 | | | | (2.9 | ) | | | -72.5 | % |
| Other income, net | | | 0.2 | | | | 0.8 | | | | (0.6 | ) | | | -75.0 | % |
| Income before income taxes and discontinued operations | | | 23.9 | | | | 65.5 | | | | (41.6 | ) | | | -63.5 | % |
| Provision for income taxes | | | 6.5 | | | | 18.4 | | | | (11.9 | ) | | | -64.7 | % |
| Income before discontinued operations | | | 17.4 | | | | 47.1 | | | | (29.7 | ) | | | -63.1 | % |
| Income from discontinued operations, net of tax | | | - | | | | 2.1 | | | | (2.1 | ) | | | -100.0 | % |
| Net income | | $ | 17.4 | | | $ | 49.2 | | | $ | (31.8 | ) | | | -64.6 | % |
| | | | | | | | | | | | | | | | | |
| Diluted earnings per share | | $ | 1.03 | | | $ | 2.80 | | | $ | (1.77 | ) | | | -63.2 | % |
The following is a comparison of fiscal year 2009 and fiscal year 2008 results of operations, separately identifying the impact of the SANS acquisition as well as the estimated impact of currency translation:
| | | | | | Estimated | | | | | | Estimated | | | | |
| | | | | | Organic | | | | | | | | | | |
| | | | | | Business | | | SANS | | | Currency | | | | |
| | | 2009 | | | Change | | | Acquisition | | | Translation | | | 2008 | |
| | | (expressed in millions) | |
| Revenue | | $ | 408.9 | | | $ | (65.3 | ) | | $ | 23.6 | | | $ | (9.9 | ) | | $ | 460.5 | |
| Cost of sales | | | 257.3 | | | | (21.0 | ) | | | 14.6 | | | | (6.5 | ) | | | 270.2 | |
| Gross profit | | | 151.6 | �� | | | (44.3 | ) | | | 9.0 | | | | (3.4 | ) | | | 190.3 | |
| Gross margin | | | 37.1 | % | | | | | | | 38.2 | % | | | | | | | 41.3 | % |
| | | | | | | | | | | | | | | | | | | | | |
| Operating expenses: | | | | | | | | | | | | | | | | | | | | |
| Selling and marketing | | | 71.6 | | | | (7.6 | ) | | | 4.2 | | | | (1.9 | ) | | | 76.9 | |
| General administrative | | | 39.1 | | | | (3.6 | ) | | | 7.8 | | | | (0.5 | ) | | | 35.4 | |
| Research and development | | | 16.3 | | | | 0.3 | | | | - | | | | (0.2 | ) | | | 16.2 | |
| Total operating expenses | | | 127.0 | | | | (10.9 | ) | | | 12.0 | | | | (2.6 | ) | | | 128.5 | |
| Income (loss) from operations | | $ | 24.6 | | | $ | (33.4 | ) | | $ | (3.0 | ) | | $ | (0.8 | ) | | $ | 61.8 | |
Revenue
Revenue was $408.9 million, a decrease of $51.6 million, or 11.2%, compared to revenue of $460.5 million for fiscal year 2008. This decrease reflects lower worldwide volume in the organic Test business and Sensors segment, resulting from reduced industrial capital spending, and an estimated $9.9 million unfavorable impact of currency translation, partially offset by $23.6 million from SANS. Due to the strong backlog position at the beginning of fiscal 2009, the percentage rate decrease in organic revenue represents approximately one half of the rate decrease in organic orders.
The following is a comparison of fiscal year 2009 and fiscal year 2008 revenue by geography:
| Geography | | 2009 | | | 2008 | | | Variance | | | % Variance | |
| | | (expressed in millions) | | | | |
| Americas | | $ | 141.8 | | | $ | 168.6 | | | $ | (26.8 | ) | | | -15.9 | % |
| Europe | | | 128.7 | | | | 152.0 | | | | (23.3 | ) | | | -15.3 | % |
| Asia | | | 138.4 | | | | 139.9 | | | | (1.5 | ) | | | -1.1 | % |
| Total Revenue | | $ | 408.9 | | | $ | 460.5 | | | $ | (51.6 | ) | | | -11.2 | % |
Although selective product price changes were implemented during each of these fiscal years, the overall impact of pricing changes did not have a material effect on revenue.
Gross profit
Gross profit was $151.6 million, a decrease of $38.7 million, or 20.3%, compared to gross profit of $190.3 million for fiscal year 2008. Gross profit as a percentage of revenue was 37.1%, a decrease of 4.2 percentage points from 41.3% for fiscal year 2008. This decrease was driven by lower volume in the organic business, and includes a 1.6 percentage point reduction due to $6.8 million severance and benefit costs associated with workforce reduction actions, as well as a 1.2 percentage point reduction due to higher warranty expense in the organic Test business. This was partially offset by a $3.1 million reduction in variable compensation expense.
Selling and Marketing Expense
Selling and marketing expense was $71.6 million, a decrease of $5.3 million, or 6.9%, compared to $76.9 million for fiscal year 2008. This decrease was primarily due to lower compensation and benefits resulting from a reduction in employees, lower commissions and sales incentives, reduced discretionary spending, as well as a $1.4 million reduction in variable compensation expense in the organic business. These decreases were partially offset by a $4.2 million increase from SANS, as well as $4.0 million severance and benefit costs associated with workforce reduction actions. Selling and marketing expense as a percentage of revenue was 17.5%, compared to 16.7% for fiscal year 2008.
General and Administrative Expense
General and administrative expense was $39.1 million, an increase of $3.7 million, or 10.5%, compared to $35.4 million for fiscal year 2008. This increase was primarily driven by $7.8 million from SANS, $1.2 million severance and benefit costs associated with workforce reduction actions, and increased legal expense in the organic business. These increases were partially offset by lower compensation and benefits resulting from a reduction in employees, reduced discretionary spending, and a $2.2 million reduction in variable compensation expense. General and administrative expense as a percentage of revenue was 9.6%, compared to 7.7% for fiscal year 2008.
Research and Development Expense
Research and development expense was $16.3 million, relatively flat compared to $16.2 million for fiscal year 2008, as increased spending in the organic Test business on new product initiatives was partially offset by reduced spending in the Sensors segment. In addition, the Company continued to allocate certain of its resources towards capitalized software development activities during fiscal year 2009. Total software development costs capitalized during fiscal years 2009 and 2008 were $3.9 million and $4.2 million, respectively. Research and development expense as a percentage of revenue was 4.0%, compared to 3.5% for fiscal year 2008.
Income from Operations
Income from operations was $24.6 million, a decrease of $37.2 million, or 60.2%, compared to income from operations of $61.8 million for fiscal year 2008. This decrease was primarily driven by lower gross profit in the organic business, severance and benefit costs associated with workforce reduction actions, as well as a $3.0 million operating loss from SANS, partially offset by reduced operating expenses in the organic business and reduced variable compensation expense. Operating income as a percentage of revenue was 6.0%, compared to 13.4% for fiscal year 2008.
A historical level of inflation ranging from -1% to 4% impacted the Company’s operating costs. The Company uses a number of strategies to mitigate the effects of cost inflation, including cost productivity initiatives such as global procurement strategies, as well as increasing prices. However, if the Company’s operating costs were to become subject to significant inflationary pressures, it may not be able to fully offset such higher costs despite these strategies.
Interest Expense
Interest expense was $2.0 million, an increase of $0.9 million compared to $1.1 for fiscal year 2008, as the interest expense incurred on the higher level of short-term borrowings was partially offset by a reduction in fixed-rate long-term debt.
Interest income
Interest income was $1.1 million, a decrease of $2.9 million compared to $4.0 million for fiscal year 2008, due to lower interest rates, primarily in Europe.
Other Income, net
Other income, net was $0.2 million, a decrease of $0.6 million compared to $0.8 million of net other income in fiscal year 2008. This decrease was primarily due to net losses on foreign currency transactions compared to net gains on foreign currency transactions in fiscal year 2008.
Provision for Income Taxes
Provision for income taxes totaled $6.5 million, a decrease of $11.9 million, or 64.7%, compared to $18.4 million for the fiscal year 2008. This decrease was primarily due to decreased income before income taxes. The effective tax rate for both fiscal years 2009 and 2008 is impacted by the Company’s geographic mix of income, with foreign income now generally taxed at lower rates than domestic income. In addition, the effective tax rate is favorably impacted by the Company's R&D credits and qualified domestic production activities. The effective tax rate is unfavorably impacted by certain non-deductible business expenses. The effective tax rate from continuing operations was 27.2%, a decrease of 0.8 percentage points compared to a tax rate of 28.0% for fiscal year 2008. The effective tax rate for fis cal year 2009 was favorably impacted by lower income before income taxes and a $1.0 million tax benefit from the retroactive extension of U.S. R&D credits in fiscal year 2009, while the effective tax rate for fiscal year 2008 was favorably impacted by a $3.7 million tax benefit from the repatriation of earnings from Japanese affiliates and the successful closure of foreign tax audits.
Income before Discontinued Operations
Income before discontinued operations was $17.4 million, or $1.03 per diluted share, a decrease of $29.7 million, or 63.1%, compared to $47.1 million, or $2.68 per diluted share, for fiscal year 2008. The decrease was primarily driven by lower income from operations, which included pretax severance and benefits costs of $12.1 million, or $0.48 per share.
Discontinued Operations
On June 27, 2008, the Company sold substantially all of the net assets of its Nano Instruments product line, which was based in Oak Ridge, Tennessee. As a result of this sale, the Company recorded a gain of $2.4 million, net of tax of $3.6 million, in fiscal year 2008. The Nano Instruments product line was historically included in the Company’s Test segment for financial reporting. The results of operations of the Nano Instruments product line, including the gain on the sale, have been excluded from the results of operations of the Test segment and are reported as discontinued operations.
Net Income
Net income was $17.4 million, or $1.03 per diluted share, for fiscal year 2009, a decrease of 64.6% compared to $49.2 million, or $2.80 per diluted share, for fiscal year 2008. Income from discontinued operations in fiscal year 2008 was $2.1 million or $0.12 per diluted share.
Segment Results
Test Segment
Orders and Backlog
The following is a comparison of fiscal year 2009 and fiscal year 2008 orders for the Test segment, separately identifying the impact of the SANS acquisition as well as the estimated impact of currency translation:
| | | | | | Estimated | | | | | | Estimated | | | | |
| | | | | | Organic | | | | | | | | | | |
| | | | | | Business | | | SANS | | | Currency | | | | |
| | | 2009 | | | Change | | | Acquisition | | | Translation | | | 2008 | |
| | | (expressed in millions) | |
| Orders | | $ | 275.0 | | | $ | (133.7 | ) | | $ | 24.9 | | | $ | (6.0 | ) | | $ | 389.8 | |
Orders totaled $275.0 million, a decrease of $114.8 million, or 29.5%, compared to orders of $389.8 million for fiscal year 2008, reflecting lower volume in the organic business across all geographies due to sharply lower worldwide capital spending in the segment’s markets, and an estimated $6.0 million unfavorable impact of currency translation. This was partially offset by $24.9 million from SANS. Fiscal 2009 orders included one large order totaling approximately $7 million. Fiscal year 2008 orders included six large orders totaling approximately $52 million. The Company considers an individual order valued at an amount equal to or greater than $5.0 million a large order. The Test segment accounted for 80.7% of total Company orders, compared to 80.3% for the fiscal 2008.
The following is a comparison of fiscal year 2009 and fiscal year 2008 orders for the Test segment by geography:
| Geography | | 2009 | | | 2008 | | | Variance | | | % Variance | |
| | | (expressed in millions) | | | | |
| Americas | | $ | 87.8 | | | $ | 150.6 | | | $ | (62.8 | ) | | | -41.7 | % |
| Europe | | | 78.2 | | | | 119.5 | | | | (41.3 | ) | | | -34.6 | % |
| Asia | | | 109.0 | | | | 119.7 | | | | (10.7 | ) | | | -8.9 | % |
| Total Orders | | $ | 275.0 | | | $ | 389.8 | | | $ | (114.8 | ) | | | -29.5 | % |
Backlog of undelivered orders at October 3, 2009 was $156.4 million, a decrease of 29.8% from backlog of $222.8 million at September 27, 2008. Backlog included $9.9 million from SANS.
Results of Operations
The following is a comparison of fiscal year 2009 and fiscal year 2008 results of operations for the Test segment, separately identifying the impact of the SANS acquisition as well as the impact of currency translation:
| | | | | | Estimated | | | | | | Estimated | | | | |
| | | | | | Organic | | | | | | | | | | |
| | | | | | Business | | | SANS | | | Currency | | | | |
| | | 2009 | | | Change | | | Acquisition | | | Translation | | | 2008 | |
| | | (expressed in millions) | |
| Revenue | | $ | 342.6 | | | $ | (37.5 | ) | | $ | 23.6 | | | $ | (7.6 | ) | | $ | 364.1 | |
| Cost of sales | | | 227.4 | | | | (10.0 | ) | | | 14.6 | | | | (5.6 | ) | | | 228.4 | |
| Gross profit | | | 115.2 | | | | (27.5 | ) | | | 9.0 | | | | (2.0 | ) | | | 135.7 | |
| Gross margin | | | 33.6 | % | | | | | | | 38.2 | % | | | | | | | 37.3 | % |
| | | | | | | | | | | | | | | | | | | | | |
| Operating expenses: | | | | | | | | | | | | | | | | | | | | |
| Selling and marketing | | | 56.1 | | | | (5.8 | ) | | | 4.2 | | | | (1.5 | ) | | | 59.2 | |
| General administrative | | | 29.6 | | | | (2.2 | ) | | | 7.8 | | | | (0.3 | ) | | | 24.3 | |
| Research and development | | | 12.0 | | | | 0.9 | | | | - | | | | - | | | | 11.1 | |
| Total operating expenses | | | 97.7 | | | | (7.1 | ) | | | 12.0 | | | | (1.8 | ) | | | 94.6 | |
| Income (loss) from operations | | $ | 17.5 | | | $ | (20.4 | ) | | $ | (3.0 | ) | | $ | (0.2 | ) | | $ | 41.1 | |
Revenue
Revenue was $342.6 million, a decrease of $21.5 million, or 5.9%, compared to revenue of $364.1 million for fiscal year 2008, as the $23.6 million from SANS was substantially offset by lower volume in the organic business across all geographies, as well as an estimated $7.6 million unfavorable impact of currency translation. Due to the strong backlog position at the beginning of fiscal 2009, the percentage rate decrease in revenue in the organic business represents approximately one half of the percentage rate decrease in orders.
The following is a comparison of fiscal year 2009 and fiscal year 2008 revenue for the Test segment by geography:
| Geography | | 2009 | | | 2008 | | | Variance | | | % Variance | |
| | | (expressed in millions) | | | | |
| Americas | | $ | 122.8 | | | $ | 142.7 | | | $ | (19.9 | ) | | | -13.9 | % |
| Europe | | | 96.3 | | | | 104.1 | | | | (7.8 | ) | | | -7.5 | % |
| Asia | | | 123.5 | | | | 117.3 | | | | 6.2 | | | | 5.3 | % |
| Total Revenue | | $ | 342.6 | | | $ | 364.1 | | | $ | (21.5 | ) | | | -5.9 | % |
Gross Profit
Gross profit was $115.2 million, a decrease of $20.5 million, or 15.1%, compared to gross profit of $135.7 million for fiscal year 2008. Gross profit as a percentage of revenue was 33.6%, a decrease of 3.7 percentage points from 37.3% for fiscal year 2008. This decrease was primarily due to the revenue volume decline, and includes a 1.9 percentage point reduction due to $6.5 million severance and benefit costs associated with workforce reduction actions, as well as a 1.5 percentage point reduction due to higher warranty expense in the organic Test business driven by a higher rate of claims. This was partially offset by a $3.0 million reduction in variable compensation expense.
Selling and Marketing Expense
Selling and marketing expense was $56.1 million, a decrease of $3.1 million, or 5.2%, compared to $59.2 million for fiscal year 2008. This decrease was primarily due to lower compensation and benefits, resulting from a reduction in workforce, lower commissions and sales incentives, reduced discretionary spending and a $0.9 million reduction in variable compensation expense in the organic business. These decreases were partially offset by $4.2 million increase from SANS, as well as $3.2 million severance and benefit costs associated with workforce reduction actions. Selling and marketing expense as a percentage of revenue was 16.4%, compared to 16.3% for fiscal year 2008.
General and Administrative Expense
General and administrative expense was $29.6 million, an increase of $5.3 million, or 21.8%, compared to $24.3 million for fiscal year 2008. This increase was primarily driven by $7.8 million from SANS, $1.2 million severance and benefit costs associated with workforce reduction actions, and increased legal fees in the organic business. These increases were partially offset by lower compensation and benefits resulting from a reduction in workforce, reduced discretionary spending, and a $1.6 million reduction in variable compensation expense. General and administrative expense as a percentage of revenue was 8.6%, compared to 6.7% for fiscal year 2008.
Research and Development Expense
Research and development expense was $12.0 million, an increase of $0.9 million, or 8.1%, compared to $11.1 million for fiscal year 2008, driven by a planned increase in spending on new product initiatives. In addition, the Company continued to allocate certain of its resources towards capitalized software development activities during fiscal year 2009. Total software development costs capitalized during fiscal years 2009 and 2008 were $3.9 million and $4.2 million, respectively. Research and development expense as a percentage of revenue was 3.5%, compared to 3.0% for fiscal year 2008.
Income from Operations
Income from operations was $17.5 million, a decrease of $23.6 million, or 57.4%, compared to income from operations of $41.1 million for fiscal year 2008. This decrease was primarily due to lower gross profit in the organic business, severance and benefit costs associated with workforce reduction actions, as well as a $3.0 million operating loss from SANS, partially offset by reduced operating expenses in the organic business and reduced variable compensation expense. Operating income as a percentage of revenue was 5.1%, compared to 11.3% for fiscal year 2008.
SANS Acquisition
Orders and revenue were $24.9 million and $23.6 million, respectively. Gross profit as a percentage of revenue was 38.2%. Gross profit includes a $1.9 million reduction associated with the sale of inventory that was written up to fair value as part of the acquisition, which negatively impacted the gross margin rate by 7.8 percentage points. Loss from operations was $3.0 million, driven by reduced gross profit and increased operating expenses associated with integration activities.
Sensors Segment
Orders and Backlog
The following is a comparison of fiscal 2009 and fiscal 2008 orders for the Sensors segment, separately identifying the estimated impact of currency translation:
| | | | | | Estimated | | | | |
| | | | | | Business | | | Currency | | | | |
| | | 2009 | | | Change | | | Translation | | | 2008 | |
| | | (expressed in millions) | |
| Orders | | $ | 65.8 | | | $ | (27.6 | ) | | $ | (2.1 | ) | | $ | 95.5 | |
Orders totaled $65.8 million, a decrease of $29.7 million, or 31.1%, compared to orders of $95.5 million for fiscal year 2008, primarily due to lower volume across all geographies resulting from sharply lower demand in worldwide industrial capital spending and a reduction in customer inventory levels. Sensors segment accounted for 19.3% of total Company orders, compared to 19.7% for fiscal year 2008.
The following is a comparison of fiscal year 2009 and fiscal year 2008 orders for the Sensors segment by geography:
| Geography | | 2009 | | | 2008 | | | Variance | | | % Variance | |
| | | (expressed in millions) | | | | |
| Americas | | $ | 20.5 | | | $ | 25.6 | | | $ | (5.1 | ) | | | -19.9 | % |
| Europe | | | 30.5 | | | | 48.9 | | | | (18.4 | ) | | | -37.6 | % |
| Asia | | | 14.8 | | | | 21.0 | | | | (6.2 | ) | | | -29.5 | % |
| Total Orders | | $ | 65.8 | | | $ | 95.5 | | | $ | (29.7 | ) | | | -31.1 | % |
Backlog of undelivered orders at October 3, 2009 was $11.3 million, a decrease of 5.0% from backlog of $11.9 million at September 27, 2008.
Results of Operations
The following is a comparison of fiscal year 2009 and fiscal year 2008 results of operations for the Sensors segment, separately identifying the estimated impact of currency translation:
| | | | | | Estimated | | | | |
| | | | | | Business | | | Currency | | | | |
| | | 2009 | | | Change | | | Translation | | | 2008 | |
| | | (expressed in millions) | |
| Revenue | | $ | 66.3 | | | $ | (27.8 | ) | | $ | (2.3 | ) | | $ | 96.4 | |
| Cost of sales | | | 29.9 | | | | (11.0 | ) | | | (0.9 | ) | | | 41.8 | |
| Gross profit | | | 36.4 | | | | (16.8 | ) | | | (1.4 | ) | | | 54.6 | |
| Gross margin | | | 54.9 | % | | | | | | | | | | | 56.6 | % |
| | | | | | | | | | | | | | | | | |
| Operating expenses: | | | | | | | | | | | | | | | | |
| Selling and marketing | | | 15.5 | | | | (1.8 | ) | | | (0.4 | ) | | | 17.7 | |
| General administrative | | | 9.5 | | | | (1.4 | ) | | | (0.2 | ) | | | 11.1 | |
| Research and development | | | 4.3 | | | | (0.6 | ) | | | (0.2 | ) | | | 5.1 | |
| Total operating expenses | | | 29.3 | | | | (3.8 | ) | | | (0.8 | ) | | | 33.9 | |
| Income (loss) from operations | | $ | 7.1 | | | $ | (13.0 | ) | | $ | (0.6 | ) | | $ | 20.7 | |
Revenue
Revenue was $66.3 million, a decrease of $30.1 million, or 31.2%, compared to revenue of $96.4 million for the fiscal year 2008. This decrease was primarily driven by reduced worldwide order volume.
The following is a comparison of fiscal year 2009 and fiscal year 2008 revenue for the Sensors segment by geography:
| Geography | | 2009 | | | 2008 | | | Variance | | | % Variance | |
| | | (expressed in millions) | | | | |
| Americas | | $ | 19.0 | | | $ | 25.9 | | | $ | (6.9 | ) | | | -26.6 | % |
| Europe | | | 32.4 | | | | 47.9 | | | | (15.5 | ) | | | -32.4 | % |
| Asia | | | 14.9 | | | | 22.6 | | | | (7.7 | ) | | | -34.1 | % |
| Total Revenue | | $ | 66.3 | | | $ | 96.4 | | | $ | (30.1 | ) | | | -31.2 | % |
Gross Profit
Gross profit was $36.4 million, a decrease of $18.2 million, or 33.3%, compared to gross profit of $54.6 million for fiscal year 2008. Gross profit as a percentage of revenue was 54.9%, a decrease of 1.7 percentage points from 56.6% for fiscal year 2008. This decrease was primarily due to reduced volume, and $0.3 million severance and benefit costs associated with workforce reduction actions, partially offset by $0.2 million reduced variable compensation expense.
Selling and Marketing Expense
Selling and marketing expense was $15.5 million, a decrease of $2.2 million, or 12.4%, compared to $17.7 million for fiscal year 2008. The decrease is primarily due to reduced discretionary spending, lower commission expense, and $0.4 million reduced variable compensation expense, partially offset by $0.8 million severance and benefit costs associated with workforce reduction actions. Selling and marketing expense as a percentage of revenue was 23.4%, compared to 18.4% for fiscal year 2008.
General and Administrative Expense
General and administrative expense was $9.5 million, a decrease of $1.6 million, or 14.4%, compared to $11.1 million for fiscal year 2008, primarily due to reduced compensation and benefits expense, including a $0.6 million reduction in variable compensation, as well as reduced discretionary spending. General and administrative expense as a percentage of revenue was 14.3%, compared to 11.5% for fiscal year 2008.
Research and Development Expense
Research and development expense was $4.3 million, a decrease of $0.8 million, or 15.7%, compared to $5.1 million for fiscal year 2008. The decrease was due to planned reduction in spending. Research and development expense as a percentage of revenue was 6.5%, compared to 5.3% for fiscal year 2008.
Income from operations
Income from operations was $7.1 million, a decrease of $13.6 million, or 65.7%, compared to income from operations of $20.7 million for fiscal year 2008, primarily due to lower gross profit, partially offset by reduced operating expenses. Operating income as a percentage of revenue was 10.7%, compared to 21.5% for fiscal year 2008.
Cash Flow Comparison - Fiscal Years 2010, 2009 and 2008
Total cash and cash equivalents decreased $42.3 million during fiscal year 2010, primarily due to purchases of company stock, dividend payments, investment in property and equipment and deferred payments for the SANS acquisition, partially offset by earnings.
Total cash and cash equivalents increased $4.8 million during fiscal year 2009, primarily due to earnings and decreased working capital requirements, partially offset by employee incentive and related benefit payments, purchases of company stock, dividend payments, investment in property and equipment, and payments for the acquisition of SANS.
Total cash and cash equivalents increased $9.8 million during fiscal year 2008, primarily due to earnings, proceeds received from borrowings on the credit facility, net proceeds from the conversion of short-term investments to cash and cash equivalents, net proceeds from the sale of the Nano Instruments product line, and proceeds from the exercise of stock options. These factors were partially offset by purchases of the Company’s common stock, an initial investment towards the purchase of SANS, funding contributions to a defined benefit pension plan, increased working capital requirements, and dividend payments.
Cash flow from operating activities provided cash of $33.2 million during fiscal year 2010, compared to cash provided of $43.8 million and $30.2 million in fiscal year 2009 and 2008, respectively. Fiscal year 2010 cash flow from operating activities was primarily driven by earnings.
Fiscal year 2009 cash flow from operating activities was primarily due to earnings and $52.1 million decreased accounts and unbilled receivables driven by lower revenue volume. This cash provided was partially offset by $14.6 million decreased accounts payable primarily resulting from overall reduced spending levels, $20.7 million decrease in advance payables received from customers driven by decreased orders and negotiated payment terms, and $8.6 million incentive and benefit payments.
Fiscal year 2008 cash flow from operating activities was primarily due to earnings, partially offset by $13.2 million contributions to a defined benefit pension plan, $11.1 million increased working capital requirements, and $4.6 million net cash usage for the discontinued Nano Instruments product line.
Cash flow from investing activities required the use of cash totaling $17.5 million during fiscal year 2010, compared to the use of cash totaling $33.6 million during fiscal year 2009, and $3.6 million provided during fiscal year 2008. The cash usage for fiscal year 2010 was due to a $11.2 million investment in property and equipment, and $6.3 million of deferred payments for the SANS acquisition.
During fiscal year 2009, the Company paid $25.1 million associated with the acquisition of SANS and invested $9.8 million in property and equipment. This was partially offset by $1.3 million of proceeds received from the sale of the Nano instruments product line in fiscal year 2008.
During fiscal year 2008, the Company received net proceeds of $17.1 million and $10.3 million for the maturity of short term investments and the sale of the Nano Instruments product line, respectively, and invested $13.7 million and $9.8 million in SANS and property and equipment, respectively.
Cash flow from financing activities required a use of cash of $49.2 million during fiscal year 2010, compared to $7.8 million and $26.5 million used in fiscal year 2009 and 2008, respectively. The cash usage for fiscal year 2010 primarily resulted from purchases of the Company’s common stock of $38.2 million and payment of cash dividends of $12.1 million, partially offset by $1.0 million received from stock option exercises and stock purchases under the Company’s employee stock purchase plan.
During fiscal year 2009, the Company’s cash usage primarily resulted from purchases of the Company’s common stock of $12.8 million, payment of cash dividends of $10.1 million, and repayment of interest-bearing debt of $2.3 million, partially offset by $16.0 million borrowings on the Company’s credit facility, and $1.6 million received from stock option exercises and stock purchases under the Company’s employee stock purchase plan.
During fiscal year 2008, the Company’s cash usage primarily resulted from purchases of the Company’s common stock of $42.0 million, including purchases of stock related to stock option exercises of $3.2 million, payment of cash dividends of $10.5 million, and net repayment of interest-bearing debt of $6.7 million, partially offset by $24.0 million borrowings on the Company’s credit facility, and $7.9 million received from stock option exercises and stock purchases under the Company’s employee stock purchase plan.
During fiscal years 2010, 2009 and 2008, the Company purchased approximately 1.4 million, 0.5 million, and 1.0 million shares of its common stock for $38.2 million, $12.8 million, and $38.8 million, respectively. During fiscal year 2010 and 2008, the Company purchased 0.9 million and 0.7 million shares, respectively, of its common stock under accelerated share purchase programs.
Liquidity and Capital Resources
The Company had cash and cash equivalents of $76.6 million at October 2, 2010. Of this amount, approximately $23.2 million was located in North America, $33.8 million in Europe, and $19.6 million in Asia. The North American balance was primarily invested in money market funds and bank deposits. In Europe, the balances were primarily invested in Euro money market funds and bank deposits. In Asia, the balances were primarily invested in bank deposits. In accordance with its investment policy, the Company places cash equivalent investments with issuers who have high-quality investment credit ratings. In addition, the Company limits the amount of investment exposure it has with any particular issuer. The Company’s investment objectives are to preserve principal, maintain liquidity, and achieve the best available return consistent with i ts primary objectives of safety and liquidity. At October 2, 2010, the Company held no short-term investments.
At October 2, 2010, the Company’s capital structure was comprised of $40.2 million in short-term debt and $166.1 million in Shareholders’ Investment. Total interest-bearing debt at October 2, 2010 and October 3, 2009 was $40.0 million. The borrowings on the credit facility include, at the Company’s discretion, optional month-to-month term renewals and loan repricing until December 2012. Under the terms of the credit facility, the Company has agreed to certain financial covenants, including, among other covenants, the ratio of consolidated total indebtedness to consolidated earnings before interest, taxes, depreciation, and amortization (“EBITDA”), as well as the ratio of consolidated EBITDA to consolidated interest expense. These covenants may restrict the Company’s ability to pay dividends and purchase outstanding shares of common stock. At October 2, 2010, the Company was in compliance with these financial covenants.
Shareholders' Investment decreased by $37.9 million during fiscal year 2010, primarily due to $38.2 million in purchases of the Company’s common stock, $10.1 million of foreign currency translation losses, and $9.7 million in dividends declared, partially offset by operating results of $18.6 million and $1.0 million received from stock option exercises and stock purchases under the Company’s employee stock purchase plan.
The Company believes that its liquidity, represented by funds available from cash, cash equivalents, the credit facility, and anticipated cash from operations are adequate to fund ongoing operations, internal growth opportunities, capital expenditures, Company dividends and share purchases, as well as to fund strategic acquisitions.
At October 2, 2010, the Company’s contractual obligations were as follows:
| | | | | | Payments Due by Period | |
| | | | | | (expressed in thousands) | |
Contractual Obligations(1) | | Total | | | Less than 1 year | | | 1 - 3 years | | | 3 - 5 years | | | More than 5 years | |
| Operating Lease Obligations | | $ | 13,065 | | | $ | 4,563 | | | $ | 5,165 | | | $ | 1,491 | | | $ | 1,846 | |
Other Long-Term Obligations(2) | | | 9,662 | | | | 2,142 | | | | 2,701 | | | | 2,337 | | | | 2,482 | |
| Total | | $ | 22,727 | | | $ | 6,705 | | | $ | 7,866 | | | $ | 3,828 | | | $ | 4,328 | |
| | (1) | Long-term income tax liabilities for uncertain tax positions have been excluded from the contractual obligations table as the Company is not able to make a reasonably reliable estimate of the amount and period of related future payments. At October 2, 2010, the Company’s long-term liability for uncertain tax positions was $4.2 million. |
| | (2) | Other long-term obligations include liabilities under pension and other retirement plans. |
At October 2, 2010 the Company had letters of credit and guarantees outstanding totaling $41.1 million and $1.4 million, respectively, primarily to bond advance payments and performance related to customer contracts in the Test segment. The Company’s operating leases are primarily for office space and automobiles.
Off-Balance Sheet Arrangements
At the end of fiscal year 2010, the Company did not have any off-balance sheet arrangements, as such term is defined in rules promulgated by the SEC, that have or are reasonably likely to have a current or future effect on the Company’s financial condition, changes in financial condition, revenues or expenses, results of operations, liquidity, capital expenditures or capital resources that are material to investors.
Critical Accounting Policies
The Consolidated Financial Statements are prepared in accordance with U.S. generally accepted accounting principles (“GAAP”), which require the Company to make estimates and assumptions in certain circumstances that affect amounts reported. In preparing these financial statements, management has made its best estimates and judgments of certain amounts, giving due consideration to materiality. The Company believes that of its significant accounting policies, the following are particularly important to the portrayal of the Company's results of operations and financial position, may require the application of a higher level of judgment by the Company's management, and as a result, are subject to an inherent degree of uncertainty. For further information see “Summary of Significant Accounting Policies” under Note 1 to the Consolidated Financial Statements, included in Item 8 of this Annual Report on Form 10-K.
Revenue Recognition: The Company is required to comply with a variety of technical accounting requirements in order to achieve consistent and accurate revenue recognition. The most significant area of judgment and estimation is percentage of completion contract accounting. The Company develops cost estimates that include materials, component parts, labor and overhead costs. Detailed costs plans are developed for all aspects of the contracts during the bidding phase of the contract. Cost estimates are largely based on actual historical performance of similar projects combined with current knowledge of the projects in progress. Significant factors that impact the cost estimates include technical risk, inflationary cost of mater ials and labor, changes in scope and schedule, and internal and subcontractor performance. Actual costs incurred during the project phase are monitored and compared to the estimates on a monthly basis. Cost estimates are revised based on changes in circumstances. Anticipated losses on long-term contracts are recognized when such losses become evident.
Inventories: The Company maintains a material amount of inventory to support its engineering and manufacturing operations. The Company establishes valuation reserves for excess, slow moving, and obsolete inventory based on inventory levels, expected product life, and forecasted sales demand. It is possible that an increase in the Company’s inventory reserves may be required in the future if there is a significant decline in demand for the Company’s products and the Company does not adjust its manufacturing production accordingly.
Impairment of Long-Lived Assets. The Company reviews the carrying value of long-lived assets or asset groups, such as property and equipment and intangibles subject to amortization, when events or changes in circumstances such as market value, asset utilization, physical change, legal factors, or other matters indicate that the carrying value may not be recoverable. When this review indicates the carrying value of an asset or asset group exceeds the sum of the undiscounted cash flows expected to result from the use and eventual disposition of the asset or asset group, the Company recognizes an asset impairment charge against operations. The amount of the impairment loss recorded is the amount by which the carrying value of the impaired asset or asset group exceeds its fair value.
Goodwill: The Company tests goodwill at least annually for impairment. Goodwill is also tested for impairment as changes in circumstances occur indicating that the carrying value may not be recoverable. Goodwill impairment testing first requires a comparison of the fair value of each reporting unit to the carrying value. If the carrying value of the reporting unit exceeds fair value, goodwill is considered impaired.
The Company has three discrete reporting units, two of which are assigned goodwill. At October 2, 2010, one reporting unit was assigned $13.8 million of goodwill while another was assigned $1.6 million. The fair value of a reporting unit is estimated using a discounted cash flow model that requires input of certain estimates and assumptions requiring management judgment, including projections of economic conditions and customer demand, revenue and margins, changes in competition, operating costs, and new product introductions. At October 2, 2010, the estimated fair value of the reporting unit assigned $1.6 million of goodwill is substantially in excess of its carrying value, while the estimated fair value of the reporting unit assigned $13.8 million of goodwill exceeds its carrying value by approximately 8 percent. While the Company belie ves the estimates and assumptions used in determining the fair value of its reporting units are reasonable, significant changes in estimates of future cash flows, such as those caused by unforeseen events or changes in market conditions could materially impact the fair value of a reporting unit which could result in the recognition of a goodwill impairment charge.
Software Development Costs: The Company incurs costs associated with the development of software to be sold, leased, or otherwise marketed. Software development costs are expensed as incurred until technological feasibility has been established, at which time future costs incurred are capitalized until the product is available for general release to the public. A certain amount of judgment and estimation is required to assess when technological feasibility is established, as well as the ongoing assessment of the recoverability of capitalized costs. In evaluating the recoverability of capitalized software costs, the Company compares expected product performance, utilizing forecasted r evenue amounts, to the total costs incurred to date and estimates of additional costs to be incurred. If revised forecasted product revenue is less than, and/or revised forecasted costs are greater than, the previously forecasted amounts, the net realizable value may be lower than previously estimated, which could result in the recognition of an impairment charge in the period in which such a determination is made.
Warranty Obligations: The Company is subject to warranty obligations on sales of its products. A certain amount of judgment is required in determining appropriate reserve levels for anticipated warranty claims. While these reserve levels are based on historical warranty experience, they may not reflect the actual claims that will occur over the upcoming warranty period, and additional warranty reserves may be required.
Income Taxes: The Company records a tax provision for the anticipated tax consequences of the reported results of operations. Deferred tax assets and liabilities are measured using the currently enacted tax rates that apply to taxable income in effect for the years in which those deferred tax assets and liabilities are expected to be realized or settled. The Company records a valuation allowance to reduce deferred tax assets to the amount that is believed more likely than not to be realized. The Company believes it is more likely than not that forecasted income, including income that may be generated as a result of certain t ax planning strategies, together with the tax effects of the deferred tax liabilities, will be sufficient to fully recover the remaining net realizable value of its deferred tax assets. In the event that all or part of the net deferred tax assets are determined not to be realizable in the future, an adjustment to the valuation allowance would be charged to earnings in the period such determination is made. In addition, the calculation of tax liabilities involves significant judgment in estimating the impact of uncertainties in the application of complex tax laws. Resolution of these uncertainties in a manner inconsistent with management's expectations could have a material impact on the Company's financial condition and operating results.
Recent Accounting Pronouncements
In October 2009, the FASB issued ASU 2009-14, Software (Topic 985) – “Certain Revenue Arrangements that Include Software Elements.” ASU 2009-14 changes the accounting model for revenue arrangements that include both tangible products and software elements. Specifically, tangible products containing software components and non-software components that function together to deliver the tangible product's essential functionality are excluded from the software revenue guidance in Accounting Standards Codification (“ASC”) Subtopic 985-605, “Software-Revenue Recognition.” In addition, ASU 2009-14 requires that hardware components of a tangible product containing software components be excluded from the software revenue guidance. The provisions of ASU 2009-14 are effective prospectively for revenue arrang ements entered into or materially modified in fiscal years beginning on or after June 15, 2010 which, for the Company, will be fiscal year 2011. The Company is currently evaluating the impact of this new guidance, but does not expect the adoption of ASU 2009-14 to have a material impact on its consolidated financial statements.
In October 2009, the FASB issued ASU 2009-13, “Revenue Recognition (Topic 605) - Multiple-Deliverable Revenue Arrangements.” ASU 2009-13 amends the criteria established in ASC 605-25, “Revenue Recognition – Multiple Element Arrangements,” for separating consideration in multiple-deliverable arrangements. This guidance establishes a selling price hierarchy for determining the selling price of a deliverable. Specifically, the selling price used for each deliverable is based on: (a) vendor-specific objective evidence if available; (b) third-party evidence if vendor-specific objective evidence is not available; or (c) estimated selling price if neither vendor-specific objective evidence nor third-party evidence is available. In addition, ASU 2009-13 eliminates the residual method of allocation and requires that a rrangement consideration be allocated at the inception of the arrangement to all deliverables using the relative selling price method. Also, ASU 2009-13 significantly expands required disclosures related to a vendor's multiple-deliverable revenue arrangements. The provisions of ASU 2009-13 are effective prospectively for revenue arrangements entered into or materially modified in fiscal years beginning on or after June 15, 2010 which, for the Company, will be fiscal year 2011. Early adoption is permitted. The Company is currently evaluating the impact of this new guidance, but does not expect the adoption of ASU 2009-13 to have a material impact on its consolidated financial statements.
Quarterly Financial Information
Revenue and operating results reported on a quarterly basis do not necessarily reflect trends in demand for the Company's products or its operating efficiency. Revenue and operating results in any quarter may be significantly affected by customer shipments, installation timing, or the timing of the completion of one or more contracts where revenue is recognized upon shipment or customer acceptance rather than on the percentage-of-completion method of revenue recognition. The Company's use of the percentage-of-completion revenue recognition method for large, long-term projects generally has the effect of smoothing significant fluctuations from quarter to quarter. See Note 1 to the Consolidated Financial Statements included in Item 8 of this Annual Report on Form 10-K for additional information on the Company's revenue recognition policy. Q uarterly earnings also vary as a result of the use of estimates including, but not limited to, the rates used in recording federal, state, and foreign income tax expense. See Notes 1 and 8 to the Consolidated Financial Statements included in Item 8 of this Annual Report on Form 10-K for additional information on the Company's use of estimates and income tax related matters, respectively.
Selected quarterly financial information for the fiscal years ended October 2, 2010 and October 3, 2009 was as follows:
| | | First | | | Second | | | Third | | | Fourth | | | Total | |
| | | Quarter | | | Quarter | | | Quarter | | | Quarter | | | Year | |
| | | (expressed in thousands, except per share data) | |
| | | | | | | | | | | | | | | | |
| 2010 | | | | | | | | | | | | | | | |
| Revenue | | $ | 88,960 | | | $ | 94,270 | | | $ | 84,944 | | | $ | 105,879 | | | $ | 374,053 | |
| Gross profit | | | 35,182 | | | | 38,528 | | | | 33,249 | | | | 44,835 | | | | 151,794 | |
| Income (loss) before income taxes | | | 5,701 | | | | 9,660 | | | | (1,563 | ) | | | 13,414 | | | | 27,212 | |
| Net income | | $ | 3,837 | | | $ | 6,174 | | | $ | 5 | | | $ | 8,560 | | | $ | 18,576 | |
| Earnings per share: | | | | | | | | | | | | | | | | | | | | |
| Basic | | $ | 0.23 | | | $ | 0.37 | | | $ | 0.00 | | | $ | 0.54 | | | $ | 1.14 | |
| Diluted | | $ | 0.23 | | | $ | 0.37 | | | $ | 0.00 | | | $ | 0.54 | | | $ | 1.14 | |
| | | | | | | | | | | | | | | | | | | | | |
| 2009 | | | | | | | | | | | | | | | | | | | | |
| Revenue | | $ | 116,609 | | | $ | 107,652 | | | $ | 90,779 | | | $ | 93,841 | | | $ | 408,881 | |
| Gross profit | | | 44,221 | | | | 41,513 | | | | 34,604 | | | | 31,278 | | | | 151,616 | |
| Income (loss) before income taxes | | | 12,842 | | | | 10,359 | | | | 4,495 | | | | (3,793 | ) | | | 23,903 | |
| Net income (loss) | | $ | 9,751 | | | $ | 7,473 | | | $ | 3,149 | | | $ | (2,979 | ) | | $ | 17,394 | |
| Earnings (loss) per share: | | | | | | | | | | | | | | | | | | | | |
| Basic | | $ | 0.58 | | | $ | 0.45 | | | $ | 0.19 | | | $ | (0.18 | ) | | $ | 1.04 | |
| Diluted | | $ | 0.57 | | | $ | 0.45 | | | $ | 0.19 | | | $ | (0.18 | ) | | $ | 1.03 | |
| Quantitative and Qualitative Disclosures about Market Risk |
Foreign Currency Exchange Risk
Approximately 65-70% of the Company’s revenue has historically been derived from shipments to customers outside of the United States and about 57% of this revenue (approximately 38% of the Company's total revenue) is denominated in currencies other than the U.S. dollar. The Company’s international subsidiaries have functional currencies other than the Company’s U.S. dollar reporting currency and, occasionally, transact business in currencies other than their functional currencies. These non-functional currency transactions expose the Company to market risk on assets, liabilities and cash flows recognized on these transactions.
The strengthening of the U.S. dollar relative to foreign currencies decreases the value of foreign currency-denominated revenue and earnings when translated into U.S. dollars. Conversely, a weakening of the U.S. dollar increases the value of foreign currency-denominated revenue and earnings. The following table illustrates financial results utilizing currency exchange rates from the prior year to estimate the impact of currency on the following financial items:
Foreign Currency Exchange Rates
| | | 2010 | | | 2009 | | | 2008 | |
| | | (expressed in thousands) | |
| Increase (decrease) from currency translation on: | | | | | | | |
| Orders | | $ | 3,430 | | | $ | (8,077 | ) | | $ | 21,090 | |
| Revenue | | | 3,333 | | | | (9,921 | ) | | | 22,128 | |
| Net Income | | $ | 105 | | | $ | (581 | ) | | $ | 2,243 | |
The estimated net effect of currency translation on orders, revenue, and net income was favorable in fiscal year 2010 in comparison to fiscal year 2009, primarily driven by the favorable translation impact associated with the weakening in the value of the U.S. dollar against the Japanese Yen throughout fiscal year 2010, as well as against the Euro during the first half of fiscal year 2010. This was partially offset by an unfavorable translation impact associated with the strengthening in the value of the U.S. dollar against the Euro during the second half of fiscal year 2010.
A hypothetical 10% appreciation or depreciation in foreign currencies against the U.S. dollar, assuming all other variables are held constant, would result in an increase or decrease in fiscal year 2010 revenue of approximately $16.4 million.
The Company has operational procedures to mitigate these non-functional currency exposures. The Company also utilizes foreign currency exchange contracts to exchange currencies at set exchange rates on future dates to offset expected gains or losses on specifically identified exposures. See Note 1 to the Consolidated Financial Statements included in Item 8 of this Annual Report on Form 10-K.
Gains and losses on foreign currency transactions, which are included in Revenue, net in the accompanying Consolidated Statements of Income, were a net loss of $0.1 million in fiscal year 2010, a net loss of $1.6 million in fiscal year 2009, and a net gain of $0.6 million in fiscal year 2008. Mark-to-market gains and losses on derivatives designated as cash flow hedges in the Company’s currency hedging program, as well as on the translation of non-current assets and liabilities, are recorded within Accumulated Other Comprehensive Income in the Consolidated Balance Sheet. The Company recognizes gains and losses on fair value and cash flow hedges at the time a gain or loss is recognized on the hedged exposure in the Consolidated Statement of Income, or at the time the cash flow hedge is determined to be ineffective. The associated mar k-to-market gains and losses are reclassified from Accumulated Other Comprehensive Income to the same line item in the Consolidated Statements of Income that the underlying hedged transaction is reported.
Interest Rates
The Company is also directly exposed to changes in market interest rates on cash, cash equivalents, short-term investments, and debt and is indirectly exposed to the impact of market interest rates on overall business activity.
On floating-rate investments, increases and decreases in market interest rates will increase or decrease future interest income, respectively. On floating-rate debt, increases or decreases in market interest rates will increase or decrease future interest expense, respectively. On fixed-rate investments, increases or decreases in market interest rates do not impact future interest income but may decrease or increase the fair market value of the investments, respectively.
At October 2, 2010, the Company had cash and cash equivalents of $76.6 million. Most of this balance was invested in interest-bearing bank deposits or money market funds, with interest rates re-set every 1-89 days. A hypothetical increase or decrease of 1% in market interest rates, assuming all other variables were held constant, would increase or decrease interest income by approximately $1.1 million on an annualized basis.
The Company’s short-term borrowings outstanding at the end of fiscal year 2010 consisted of $40.0 million utilization of the revolving credit facility and $0.2 million in non-interest bearing notes payable to vendors. This utilization of the credit facility involves interest payments calculated at a floating rate. In order to mitigate the Company’s exposure to interest rate increases, the Company has entered into floating to fixed interest rate swap agreements. The notes payable to vendors are non-interest bearing and, therefore, are not impacted by the effect of increases or decreases in market interest rates.
A discount rate of 4.7% and an expected rate increase in future compensation levels of 2.7% was used in the calculation of the pension liability related to the non-contributory, defined benefit pension plan of one of the Company’s international subsidiaries. In addition, a 5.2% expected rate of return was used in the calculation of the plan assets associated with this defined benefit pension plan.
| Financial Statements and Supplementary Data |
The Company's audited financial statements and notes thereto described in Item 15 of this Annual Report on Form 10-K, and appearing on pages F-1 through F-33 of this report, are incorporated by reference herein. See also "Quarterly Financial Data" in Management’s Discussion and Analysis under Item 7 of this Annual Report on Form 10-K, which is incorporated herein by reference.
| Changes in and Disagreements With Accountants on Accounting and Financial Disclosure |
None.
The Company’s management, including the Chief Executive Officer and Chief Financial Officer, have conducted an evaluation of the effectiveness of the design and operation of the Company’s disclosure controls and procedures (as defined under Rules 13a-15(e) and 15d-15(e) promulgated under the Securities Exchange Act of 1934 (the “1934 Act”)) as of October 2, 2010. Based on that evaluation, the Company’s Chief Executive Officer and Chief Financial Officer concluded that the Company’s disclosure controls and procedures are effective in ensuring that information required to be disclosed by the Company in the reports it files or submits under the 1934 Act is recorded, processed, summarized, and reported within the time periods specified in the SEC’s rules and forms, and that such information required t o be disclosed by the Company in the reports that it files or submits under the 1934 Act is accumulated and communicated to the Company’s management, including its Chief Executive Officer and Chief Financial Officer, as appropriate to allow timely decisions regarding required disclosure.
There have been no changes in internal control over financial reporting during the fiscal quarter ended October 2, 2010 that have materially affected, or are reasonably likely to materially affect, the Company’s internal control over financial reporting.
Management’s Report on Internal Control Over Financial Reporting
The Company’s management is responsible for establishing and maintaining adequate internal control over financial reporting, as such term is defined in Rule 13a-15(f) under the Exchange Act. The Company’s internal control over financial reporting is designed to provide reasonable assurance regarding the reliability of financial reporting and the preparation of financial statements. Under the supervision and with the participation of management, including its Chief Executive Officer and Chief Financial Officer, the Company conducted an evaluation of the effectiveness of internal controls over financial reporting as of October 2, 2010. In making this assessment, management used the criteria set forth by the Committee of Sponsoring Organizations of the Treadway Commission in Internal Control – Integrated Framework. Based on management’s assessment using this framework, management concluded that the Company’s internal control over financial reporting is effective as of October 2, 2010.
KPMG LLP, an independent registered public accounting firm, has audited the consolidated financial statements included in this Annual Report on Form 10-K and, as part of this audit, has issued its report, included in Item 8, on the effectiveness of the Company’s internal control over financial reporting.
None.
| Item 10. | Directors and Executive Officers of Registrant |
The required information with respect to the directors of the Company, the Company’s Code of Business Conduct, compliance with Section 16(a) of the Securities Exchange Act of 1934, and the Company’s Audit Committee, including the Audit Committee financial experts, is incorporated herein by reference to the information set forth under the headings "Election of Directors" and ”Other Information” in the Company’s Proxy Statement for the Annual Meeting of Shareholders scheduled to be held on February 9, 2011. Information regarding the Company’s executive officers is contained under Item 1 of Part I of this Annual Report on Form 10-K.
The information required by this Item is incorporated herein by reference to the information set forth under headings "Executive Compensation" and “Election of Directors – Independent Directors Compensation” in the Company's Proxy Statement for the Annual Meeting of Shareholders scheduled to be held on February 9, 2011.
| Security Ownership of Certain Beneficial Owners and Management and Related Stockholder Matters |
Equity Compensation Plan Information:
The following table sets forth the aggregate information regarding grants under all equity compensation plans as of October 2, 2010:
| Plan Category | | Number of Securities to be Issued Upon Exercise of Outstanding Options, Warrants and Rights (in thousands) (a) | | | Weighted- Average Exercise Price of Outstanding Warrants and Rights (b) | | | Number of Securities Remaining Available for Future Issuance Under Equity Compensation Plans (Excluding Securities Reflected in Column (a))(1) (in thousands) (c) | |
| Equity compensation plans approved by security holders | | | 1,418 | | | $ | 32.37 | | | | 1,216 | |
| | | | | | | | | | | | | |
| Equity compensation plans not approved by security holders | | | - | | | | - | | | | - | |
| | | | | | | | | | | | | |
| Total | | | 1,418 | | | $ | 32.37 | | | | 1,216 | |
| (1) | Includes 445 thousand shares available for issuance under the 2002 Employee Stock Purchase Plan as of October 2, 2010. |
Certain other information required by this Item is incorporated herein by reference to the information set forth under the heading "Other Information - Security Ownership of Principal Shareholders and Management” in the Company’s Proxy Statement for the Annual Meeting of Shareholders scheduled to be held on February 9, 2011.
| Certain Relationships and Related Transactions, and Directors Independence |
The information required by this Item is incorporated herein by reference to the information set forth under the headings “Election of Directors – Other Information Regarding the Board” and “Other Information – Related Party Transactions” in the Company’s Proxy Statement for the Annual Meeting of Shareholders scheduled to be held February 9, 2011.
| Principal Accountant Fees and Services |
The information required by this Item is incorporated by reference to the information set forth under the heading “Ratification of Appointment of Independent Registered Public Accounting Firm” in the Company’s Proxy Statement for the Annual Meeting of Shareholders scheduled to be held on February 9, 2011.
| Item 15. | Exhibits and Financial Statement Schedules |
The following documents are filed as part of this report:
| | (1) | Consolidated Financial Statements: |
Report of Independent Registered Public Accounting Firm
Consolidated Balance Sheets – October 2, 2010 and October 3, 2009
Consolidated Statements of Income for the Fiscal Years Ended October 2, 2010, October 3, 2009 and September 27, 2008
Consolidated Statements of Shareholders’ Investment for the Fiscal Years Ended October 2, 2010, October 3, 2009 and September 27, 2008
Consolidated Statements of Cash Flows for the Fiscal Years Ended October 2, 2010, October 3, 2009 and September 27, 2008
Notes to Consolidated Financial Statements
| | (2) | Financial Statement Schedules: |
See accompanying Index to Financial Statements on page F-1.
| Exhibit Number | | Description |
| | | |
| 3.a | | Restated and Amended Articles of Incorporation, incorporated herein by reference from Exhibit 3.a of the Company’s Form 10-K for the fiscal year ended September 30, 1996. |
| | | |
| 3.b | | Amended and Restated Bylaws, incorporated herein by reference to Exhibit 3.1 of the Company’s Form 8-K Current Report filed on December 1, 2009. |
| | | |
| 10.a | | Executive Variable Compensation Plan, incorporated herein by reference to Exhibit 5.02 of the Company’s Form 8-K Current Report filed on February 12, 2010. |
| | | |
| 10.b | | 2002 Employee Stock Purchase Plan, as amended, incorporated herein by reference to Exhibit 10.d of the Company’s Form 10-K filed for the fiscal year ended October 1, 2005. |
| | | |
| 10.c | | 2006 Stock Incentive Plan, incorporated herein by reference to Exhibit 99.1 of the Company’s Form 8-K Current Report filed on February 7, 2006. |
| | | |
| 10.d | | Form of Notice of Grant of Restricted Stock (Director) under 2006 Stock Incentive Plan, incorporated herein by reference to Exhibit 99.2 of the Company’s Form 8-K Current Report filed on February 7, 2006. |
| | | |
| 10.e | | Uniform Terms and Conditions to Restricted Stock Awards (Director) under 2006 Stock Incentive Plan, incorporated herein by reference to Exhibit 99.3 of Company’s Form 8-K Current Report filed on February 7, 2006. |
| 10.f | | Description of the terms of employment of Susan E. Knight, pursuant to an offer letter, incorporated by reference to Exhibit 10.r of the Company’s Form 10-Q/A for the fiscal quarter ended December 31, 2001. |
| | | |
| 10.g | | Letter dated February 6, 1987 from MTS Sensor Technologie GmbH and Co. KG (formerly, Hellwig GmbH) regarding its pension commitment to Joachim Hellwig, incorporated by reference to Exhibit 10.p of the Company’s Form 10-K filed for fiscal year ended October 2, 2004. |
| | | |
| 10.h | | Employment Contract dated January 1, 1991 between MTS Sensor Technologie GmbH and Co. KG and Joachim Hellwig, incorporated by reference to Exhibit 10.q of the Company’s Form 10-K filed for fiscal year ended October 2, 2004. |
| | | |
| 10.i | | Change in Control Agreement, dated December 31, 2008, between the Company and Laura B. Hamilton, incorporated herein by reference to Exhibit 10.k of the Company’s Form 10-K filed for the fiscal year ended October 3, 2009. |
| | | |
| 10.j | | Form of Indemnification Agreement between the Company and each of its directors and executive officers, incorporated herein by reference to Exhibit 10.1 of the Company’s Form 8-K Current Report filed on September 1, 2006. |
| | | |
| 10.k | | First Amendment to the Company’s 2006 Stock Incentive Plan, First Amendment to the Company’s Executive Variable Compensation Plan, amendments to the Company’s Executive Deferred Compensation Plan (2005), and amendments to the Company’s form of change in control agreements, incorporated herein by reference to Exhibits 10.1, 10.2, 10.3 and 10.4 of the Company’s Form 8-K Current Report filed on October 27, 2008. |
| | | |
| 10.l | | Master Asset Purchase Agreement dated April 28, 2008, between the Company and the SANS Group, incorporated herein by reference to Exhibit 2.1 of the Company’s Form 8-K Current Report filed October 2, 2008. |
| | | |
| 10.m | | Credit Agreement dated December 18, 2007, among the Company, Wells Fargo Bank, National Association, Fifth Third Bank, The Bank of Tokyo Mitsubishi UFJ, Ltd., U.S. Bank National Association, JPMorgan Chase Bank, N.A. and J.P. Morgan Securities Inc., incorporated herein by reference to Exhibit 10.1 of the Company’s Form 8-K Current Report filed December 21, 2007. |
| | | |
| 10.n | | Change in Control Agreement, dated December 31, 2008, between the Company and Susan E. Knight incorporated herein by reference to Exhibit 10.p of the Company’s Form 10-K filed for the fiscal year ended October 3, 2009. |
| | | |
| 10.o | | Change in Control Agreement, dated December 31, 2008, between the Company and Kathleen M. Staby, incorporated herein by reference to Exhibit 10.q of the Company’s Form 10-K filed for the fiscal year ended October 3, 2009. |
| 10.p | | Severance Agreement, dated March 30, 2009, between the Company and Alfred Richter, incorporated herein by reference to Exhibit 10.k of the Company’s Form 10-K filed for the fiscal year ended October 3, 2009. |
| | | |
| 10.q | | Change in Control Agreement, dated March 30, 2009, between the Company and Alfred Richter, incorporated herein by reference to Exhibit 10.k of the Company’s Form 10-K filed for the fiscal year ended October 3, 2009. |
| | | |
| 10.r | | Form of Notice of Grant of Restricted Stock Units under 2006 Stock Incentive Plan, incorporated herein by reference to Exhibit 10.1 of the Company’s Form 8-K Current Report filed on June 29, 2009. |
| | | |
| 10.s | | Uniform Terms and Conditions to Restricted Stock Units under 2006 Stock Incentive Plan, incorporated herein by reference to Exhibit 10.2 of Company’s Form 8-K Current Report filed on June 29, 2009. |
| | | |
| 10.t | | Letter Agreement Regarding Accelerated Share Repurchase Program by and between MTS Systems Corporation and J.P. Morgan Securities Inc., as agent for JPMorgan Chase Bank, National Association, London Branch, dated August 18, 2010, incorporated by reference into Exhibit 10.1 of the Company's Form 8-K Current Report filed on August 19, 2010. |
| | | |
| | Subsidiaries of the Company (Filed herewith). |
| | | |
| | Consent of Independent Registered Public Accounting Firm (Filed herewith). |
| | | |
| | Certification of the Chief Executive Officer Pursuant to Section 302 of the Sarbanes-Oxley Act of 2002 (Filed herewith). |
| | | |
| | Certification of the Chief Financial Officer Pursuant to Section 302 of the Sarbanes-Oxley Act of 2002 (Filed herewith). |
| | | |
| | Certification of the Chief Executive Officer Pursuant to Section 906 of the Sarbanes-Oxley Act of 2002 (Filed herewith). |
| | | |
| | Certification of the Chief Financial Officer Pursuant to Section 906 of the Sarbanes-Oxley Act of 2002 (Filed herewith). |
SIGNATURES
Pursuant to the requirement of Section 13 or 15(d) of the Securities Exchange Act of 1934, the Registrant has duly caused this report to be signed on its behalf by the undersigned thereunto duly authorized.
| | MTS SYSTEMS CORPORATION |
| | | |
| | By: | /s/ LAURA B. HAMILTON | |
| | | Laura B. Hamilton |
| | | Chair and Chief Executive Officer |
Pursuant to the requirements of the Securities Exchange Act of 1934, this report has been signed below by the following persons on behalf of the Registrant and in the capacities and on the date indicated:
| Signatures | | Title | | Date |
| | | | | |
| /s/ LAURA B. HAMILTON | | Chair and Chief | | November 30, 2010 |
| Laura B. Hamilton | | Executive Officer | | |
| | | | | |
| /s/ SUSAN E. KNIGHT | | Chief Financial Officer | | November 30, 2010 |
| Susan E. Knight | | and Vice President | | |
| | | | | |
| /s/ DAVID J. ANDERSON | | Director | | November 30, 2010 |
| David J. Anderson | | | | |
| | | | | |
| /s/ JEAN-LOU CHAMEAU | | Director | | November 30, 2010 |
| Jean-Lou Chameau | | | | |
| | | | | |
| /s/ BRENDAN C. HEGARTY | | Director | | November 30, 2010 |
| Brendan C. Hegarty | | | | |
| | | | | |
| /s/ EMILY M. LIGGETT | | Director | | November 30, 2010 |
| Emily M. Liggett | | | | |
| | | | | |
| /s/ WILLIAM V. MURRAY | | Director | | November 30, 2010 |
| William V. Murray | | | | |
| | | | | |
| /s/ BARB J. SAMARDZICH | | Director | | November 30, 2010 |
| Barb J. Samardzich | | | | |
| | | | | |
| /s/ GAIL P. STEINEL | | Director | | November 30, 2010 |
| Gail P. Steinel | | | | |
MTS Systems Corporation and Subsidiaries
Index to Financial Statements
| CONSOLIDATED FINANCIAL STATEMENTS | Page |
| | |
| Report of Independent Registered Public Accounting Firm | F-2 |
| | |
| Consolidated Balance Sheets – October 2, 2010 and October 3, 2009 | F-3 |
| | |
| Consolidated Statements of Income for the Fiscal Years Ended October 2, 2010, October 3, 2009, and September 27, 2008 | F-4 |
| | |
| Consolidated Statements of Shareholders’ Investment and Comprehensive Income (Loss) for the Fiscal Years Ended October 2, 2010, October 3, 2009 and September 27, 2008 | F-5 |
| | |
| Consolidated Statements of Cash Flows for the Fiscal Years Ended October 2, 2010, October 3, 2009 and September 27, 2008 | F-6 |
| | |
| Notes to Consolidated Financial Statements | F-7 through F-32 |
| | |
| Financial Statement Schedule | |
| Schedule | Description | |
| | | |
| II | Summary of Consolidated Allowances For Doubtful Accounts | F-33 |
Report of Independent Registered Public Accounting Firm
The Board of Directors and Shareholders
MTS Systems Corporation:
We have audited the accompanying consolidated balance sheets of MTS Systems Corporation and subsidiaries as of October 2, 2010 and October 3, 2009, and the related consolidated statements of income, shareholder’s investment and comprehensive income, and cash flows for each of the fiscal years in the three-year period ended October 2, 2010. In connection with our audits of the consolidated financial statements, we also have audited financial statement schedule II. We also have audited MTS Systems Corporation’s internal control over financial reporting as of October 2, 2010, based on criteria established in Internal Control – Integrated Framework issued by the Committee of Sponsoring Organizations of the Treadway Commission (COSO). MTS Systems Corporation and subsidiaries’ management is responsible for the se consolidated financial statements, for maintaining effective internal control over financial reporting, and for its assessment of the effectiveness of internal control over financial reporting, included in the accompanying Management’s Report on Internal Control Over Financial Reporting appearing under Item 9A of this Form 10-K. Our responsibility is to express an opinion on these consolidated financial statements and an opinion on the Company’s internal control over financial reporting based on our audits.
We conducted our audits in accordance with the standards of the Public Company Accounting Oversight Board (United States). Those standards require that we plan and perform the audits to obtain reasonable assurance about whether the financial statements are free of material misstatement and whether effective internal control over financial reporting was maintained in all material respects. Our audits of the consolidated financial statements included examining, on a test basis, evidence supporting the amounts and disclosures in the financial statements, assessing the accounting principles used and significant estimates made by management, and evaluating the overall financial statement presentation. Our audit of internal control over financial reporting included obtaining an understanding of internal control over financial reporting, assessi ng the risk that a material weakness exists, and testing and evaluating the design and operating effectiveness of internal control based on the assessed risk. Our audits also included performing such other procedures as we considered necessary in the circumstances. We believe that our audits provide a reasonable basis for our opinions.
A company’s internal control over financial reporting is a process designed to provide reasonable assurance regarding the reliability of financial reporting and the preparation of financial statements for external purposes in accordance with generally accepted accounting principles. A company’s internal control over financial reporting includes those policies and procedures that (1) pertain to the maintenance of records that, in reasonable detail, accurately and fairly reflect the transactions and dispositions of the assets of the company; (2) provide reasonable assurance that transactions are recorded as necessary to permit preparation of financial statements in accordance with generally accepted accounting principles, and that receipts and expenditures of the company are being made only in accordance with authorizations of m anagement and directors of the company; and (3) provide reasonable assurance regarding prevention or timely detection of unauthorized acquisition, use, or disposition of the company’s assets that could have a material effect on the consolidated financial statements.
Because of its inherent limitations, internal control over financial reporting may not prevent or detect misstatements. Also, projections of any evaluation of effectiveness to future periods are subject to the risk that controls may become inadequate because of changes in conditions, or that the degree of compliance with the policies or procedures may deteriorate.
In our opinion, the consolidated financial statements referred to above present fairly, in all material respects, the financial position of MTS Systems Corporation and subsidiaries as of October 2, 2010 and October 3, 2009, and the results of its operations and its cash flows for each of the fiscal years in the three-year period ended October 2, 2010, in conformity with U.S. generally accepted accounting principles. Also in our opinion, the related financial statement schedule II, when considered in relation to the basic consolidated financial statements taken as a whole, presents fairly, in all material respects, the information set forth therein. Also in our opinion, MTS Systems Corporation and subsidiaries maintained, in all material respects, effective internal control over financial reporting as of October 2, 2010, based o n criteria established in Internal Control – Integrated Framework issued by the Committee of Sponsoring Organizations of the Treadway Commission.
Minneapolis, Minnesota
November 30, 2010
Consolidated Balance Sheets
(October 2 and October 3, respectively)
| Assets | | 2010 | | | 2009 | |
| | | (expressed in thousands) | |
| Current Assets: | | | | | | |
| Cash and cash equivalents | | $ | 76,611 | | | $ | 118,885 | |
| Accounts receivable, net of allowance for doubtful accounts of $1,358 and $1,410 respectively | | | 66,369 | | | | 72,553 | |
| Unbilled accounts receivable | | | 26,389 | | | | 27,246 | |
| Inventories | | | 51,792 | | | | 47,969 | |
| Prepaid expenses and other current assets | | | 10,799 | | | | 6,583 | |
| Deferred tax assets | | | 12,742 | | | | 12,322 | |
| Total current assets | | | 244,702 | | | | 285,558 | |
| Property and equipment, net | | | 56,444 | | | | 56,118 | |
| Goodwill | | | 15,429 | | | | 15,206 | |
| Other intangibles, net | | | 24,753 | | | | 23,826 | |
| Other assets | | | 3,368 | | | | 4,181 | |
| Deferred tax assets | | | 1,709 | | | | 2,025 | |
| Total assets | | $ | 346,405 | | | $ | 386,914 | |
| | | | | | | | | |
| | | | | | | | | |
| Liabilities and Shareholders’ Investment | | | | | | | | |
| | | | | | | | | |
| Current Liabilities: | | | | | | | | |
| Short-term borrowings | | $ | 40,229 | | | $ | 40,182 | |
| Accounts payable | | | 21,818 | | | | 18,630 | |
| Accrued payroll and related costs | | | 32,725 | | | | 25,376 | |
| Advance payments from customers | | | 44,000 | | | | 46,739 | |
| Accrued warranty costs | | | 7,505 | | | | 9,774 | |
| Accrued income taxes | | | 2,642 | | | | 1,182 | |
| Deferred tax liabilities | | | 996 | | | | 960 | |
| Other accrued liabilities | | | 11,925 | | | | 25,149 | |
| Total current liabilities | | | 161,840 | | | | 167,992 | |
| Deferred tax liabilities | | | 6,057 | | | | 3,843 | |
| Non-current accrued income taxes | | | 4,181 | | | | 3,591 | |
| Pension benefit plan | | | 3,080 | | | | 1,917 | |
| Other long-term liabilities | | | 5,141 | | | | 5,606 | |
| Total liabilities | | | 180,299 | | | | 182,949 | |
| | | | | | | | | |
| Shareholders’ Investment: | | | | | | | | |
| Common stock, 25¢ par value; 64,000 shares authorized: | | | | | | | | |
| 15,264 and 16,564 shares issued and outstanding | | | 3,816 | | | | 4,141 | |
| Retained earnings | | | 147,609 | | | | 174,301 | |
| Accumulated other comprehensive income | | | 14,681 | | | | 25,523 | |
| Total shareholders’ investment | | | 166,106 | | | | 203,965 | |
| Total liabilities and shareholders’ investment | | $ | 346,405 | | | $ | 386,914 | |
The accompanying Notes to Consolidated Financial Statements are an integral part of these consolidated financial statements.
Consolidated Statements of Income
| (For the Fiscal Years Ended October 2, October 3 and September 27, respectively) | |
| | | | | | | | | | |
| | | 2010 | | | 2009 | | | 2008 | |
| | | | | | | |
| | | | | | | | | | |
| Revenue: | | | | | | | | | |
| Product | | $ | 315,691 | | | $ | 349,502 | | | $ | 395,173 | |
| Service | | | 58,362 | | | | 59,379 | | | | 65,342 | |
| Total Revenue | | | 374,053 | | | | 408,881 | | | | 460,515 | |
| Cost of Sales: | | | | | | | | | | | | |
| Product | | | 192,454 | | | | 224,279 | | | | 235,861 | |
| Service | | | 29,805 | | | | 32,986 | | | | 34,401 | |
| Total Cost of Sales | | | 222,259 | | | | 257,265 | | | | 270,262 | |
| Gross Profit | | | 151,794 | | | | 151,616 | | | | 190,253 | |
| Operating Expenses: | | | | | | | | | | | | |
| Selling and marketing | | | 65,841 | | | | 71,571 | | | | 76,867 | |
| General and administrative | | | 42,663 | | | | 39,129 | | | | 35,393 | |
| Research and development | | | 14,945 | | | | 16,322 | | | | 16,232 | |
| Total Operating Expenses | | | 123,449 | | | | 127,022 | | | | 128,492 | |
| Income From Operations | | | 28,345 | | | | 24,594 | | | | 61,761 | |
| Interest expense | | | (1,418 | ) | | | (2,024 | ) | | | (1,083 | ) |
| Interest income | | | 366 | | | | 1,108 | | | | 4,033 | |
| Other (expense) income, net | | | (81 | ) | | | 225 | | | | 749 | |
| Income Before Income Taxes and Discontinued Operations | | | 27,212 | | | | 23,903 | | | | 65,460 | |
| Provision for Income Taxes | | | 8,636 | | | | 6,509 | | | | 18,350 | |
| Income Before Discontinued Operations | | | 18,576 | | | | 17,394 | | | | 47,110 | |
| Discontinued Operations: | | | | | | | | | | | | |
| Loss from discontinued operations, net of tax | | | - | | | | - | | | | (368 | ) |
| Net gain on disposal of discontinued businesses, net of tax | | | - | | | | - | | | | 2,449 | |
| Income from Discontinued Operations, net of tax | | | - | | | | - | | | | 2,081 | |
| Net Income | | $ | 18,576 | | | $ | 17,394 | | | $ | 49,191 | |
| Earnings Per Share | | | | | | | | | | | | |
| Basic: | | | | | | | | | | | | |
| Income Before Discontinued Operations | | $ | 1.14 | | | $ | 1.04 | | | $ | 2.72 | |
| Discontinued Operations: | | | | | | | | | | | | |
| Loss from discontinued operations, net of tax | | | - | | | | - | | | | (0.02 | ) |
| Net gain on disposal of discontinued businesses, net of tax | | | - | | | | - | | | | 0.14 | |
| Income from Discontinued Operations, net of tax | | | - | | | | - | | | | 0.12 | |
| Earnings Per Share - Basic | | $ | 1.14 | | | $ | 1.04 | | | $ | 2.84 | |
| Diluted: | | | | | | | | | | | | |
| Income Before Discontinued Operations | | $ | 1.14 | | | $ | 1.03 | | | $ | 2.68 | |
| Discontinued Operations: | | | | | | | | | | | | |
| Loss from discontinued operations, net of tax | | | - | | | | - | | | | (0.02 | ) |
| Net gain on disposal of discontinued businesses, net of tax | | | - | | | | - | | | | 0.14 | |
| Income from Discontinued Operations, net of tax | | | - | | | | - | | | | 0.12 | |
| Earnings Per Share - Diluted | | $ | 1.14 | | | $ | 1.03 | | | $ | 2.80 | |
The accompanying Notes to Consolidated Financial Statements are an integral part of these consolidated financial statements.
Consolidated Statements of Shareholders' Investment and Comprehensive Income (Loss)
(For the Fiscal Years Ended October 2, October 3 and September 27, respectively, expressed in thousands)
| | | Common Stock | | | Additional | | | | | | Accumulated Other | | | Total | |
| | | Shares | | | | | | Paid-In | | | Retained | | | Comprehensive | | | Shareholders' | |
| | | Issued | | | Amount | | | Capital | | | Earnings | | | Income (Loss) | | | Investment | |
| Balance, September 29, 2007 | | | 17,704 | | | $ | 4,426 | | | $ | - | | | $ | 164,862 | | | $ | 20,413 | | | $ | 189,701 | |
| Net income | | | - | | | | - | | | | - | | | | 49,191 | | | | - | | | | 49,191 | |
| Foreign currency translation | | | - | | | | - | | | | - | | | | - | | | | 3,859 | | | | 3,859 | |
| Minimum pension liability adjustment | | | - | | | | - | | | | - | | | | - | | | | 890 | | | | 890 | |
| Derivative instruments | | | - | | | | - | | | | - | | | | - | | | | 320 | | | | 320 | |
| Total comprehensive income | | | - | | | | - | | | | - | | | | 49,191 | | | | 5,069 | | | | 54,260 | |
| Exercise of stock options | | | 332 | | | | 83 | | | | 7,096 | | | | - | | | | - | | | | 7,179 | |
| Stock-based compensation | | | 11 | | | | 3 | | | | 4,190 | | | | - | | | | - | | | | 4,193 | |
| Tax benefit from equity compensation | | | - | | | | - | | | | 1,302 | | | | - | | | | - | | | | 1,302 | |
| Issuance for employee stock purchase plan | | | 21 | | | | 5 | | | | 682 | | | | - | | | | - | | | | 687 | |
| Common stock purchased and retired | | | (1,092 | ) | | | (273 | ) | | | (13,270 | ) | | | (28,499 | ) | | | - | | | | (42,042 | ) |
| Dividends, $0.48 per share | | | - | | | | - | | | | - | | | | (10,338 | ) | | | - | | | | (10,338 | ) |
| Balance, September 27, 2008 | | | 16,976 | | | | 4,244 | | | | - | | | | 175,216 | | | | 25,482 | | | | 204,942 | |
| Net income | | | - | | | | - | | | | - | | | | 17,394 | | | | - | | | | 17,394 | |
| Foreign currency translation | | | - | | | | - | | | | - | | | | - | | | | 2,459 | | | | 2,459 | |
| Pension benefit plan adjustments | | | - | | | | - | | | | - | | | | - | | | | (982 | ) | | | (982 | ) |
| Derivative instruments | | | - | | | | - | | | | - | | | | - | | | | (1,436 | ) | | | (1,436 | ) |
| Total comprehensive income | | | - | | | | - | | | | - | | | | 17,394 | | | | 41 | | | | 17,435 | |
| Exercise of stock options | | | 40 | | | | 10 | | | | 899 | | | | - | | | | - | | | | 909 | |
| Stock-based compensation | | | 17 | | | | 4 | | | | 3,327 | | | | - | | | | - | | | | 3,331 | |
| Tax shortfall from equity compensation | | | - | | | | - | | | | (491 | ) | | | - | | | | - | | | | (491 | ) |
| Issuance for employee stock purchase plan | | | 36 | | | | 9 | | | | 709 | | | | - | | | | - | | | | 718 | |
| Common stock purchased and retired | | | (505 | ) | | | (126 | ) | | | (4,444 | ) | | | (8,253 | ) | | | - | | | | (12,823 | ) |
| Dividends, $0.60 per share | | | - | | | | - | | | | - | | | | (10,056 | ) | | | - | | | | (10,056 | ) |
| Balance, October 3, 2009 | | | 16,564 | | | | 4,141 | | | | - | | | | 174,301 | | | | 25,523 | | | | 203,965 | |
| Net income | | | - | | | | - | | | | - | | | | 18,576 | | | | - | | | | 18,576 | |
| Foreign currency translation | | | - | | | | - | | | | - | | | | - | | | | (10,100 | ) | | | (10,100 | ) |
| Pension benefit plan adjustments | | | - | | | | - | | | | - | | | | - | | | | (1,130 | ) | | | (1,130 | ) |
| Derivative instruments | | | - | | | | - | | | | - | | | | - | | | | 388 | | | | 388 | |
| Total comprehensive income | | | - | | | | - | | | | - | | | | 18,576 | | | | (10,842 | ) | | | 7,734 | |
| Exercise of stock options | | | 16 | | | | 4 | | | | 319 | | | | - | | | | - | | | | 323 | |
| Stock-based compensation | | | 19 | | | | 5 | | | | 2,378 | | | | - | | | | - | | | | 2,383 | |
| Tax shortfall from equity compensation | | | - | | | | - | | | | (1,151 | ) | | | - | | | | - | | | | (1,151 | ) |
| Issuance for employee stock purchase plan | | | 33 | | | | 8 | | | | 684 | | | | - | | | | - | | | | 692 | |
| Common stock purchased and retired | | | (1,368 | ) | | | (342 | ) | | | (2,230 | ) | | | (35,584 | ) | | | - | | | | (38,156 | ) |
| Dividends, $0.60 per share | | | - | | | | - | | | | - | | | | (9,684 | ) | | | - | | | | (9,684 | ) |
| Balance, October 2, 2010 | | | 15,264 | | | $ | 3,816 | | | $ | - | | | $ | 147,609 | | | $ | 14,681 | | | $ | 166,106 | |
The accompanying Notes to Consolidated Financial Statements are an integral part of these consolidated financial statements.
Consolidated Statements of Cash Flows
(For the Fiscal Years Ended October 2, October 3, and September 27, respectively)
| | | 2010 | | | 2009 | | | 2008 | |
| | | (expressed in thousands) | |
| Cash Flows from Operating Activities: | | | | | | | | | |
| Net income | | $ | 18,576 | | | $ | 17,394 | | | $ | 49,191 | |
| Adjustments to reconcile net income to net cash provided by operating activities: | | | | | | | | | | | | |
| Loss from discontinued operations | | | - | | | | - | | | | 368 | |
| Net gain on disposal of discontinued operations | | | - | | | | - | | | | (2,449 | ) |
| Stock-based compensation | | | 2,448 | | | | 3,384 | | | | 4,199 | |
| Excess tax benefits from stock-based compensation | | | (65 | ) | | | (4 | ) | | | (925 | ) |
| Charge for fair value mark-up of acquired inventory | | | - | | | | 1,859 | | | | - | |
| Net periodic pension benefit cost | | | 401 | | | | 738 | | | | 1,282 | |
| Depreciation and amortization | | | 12,751 | | | | 12,132 | | | | 9,207 | |
| Deferred income taxes | | | 2,121 | | | | (364 | ) | | | (5,726 | ) |
| Bad debt provision | | | 159 | | | | 755 | | | | (111 | ) |
| Changes in operating assets and liabilities, excluding the effect of the acquisition: | | | | | | | | | | | | |
| Accounts and unbilled contracts receivable | | | 5,599 | | | | 52,129 | | | | (27,462 | ) |
| Inventories | | | (5,408 | ) | | | 5,980 | | | | (3,191 | ) |
| Prepaid expenses and other assets | | | (6,426 | ) | | | (6,657 | ) | | | (5,911 | ) |
| Accounts payable | | | 3,152 | | | | (14,582 | ) | | | 6,138 | |
| Accrued payroll and related costs | | | 7,441 | | | | (8,571 | ) | | | 4,441 | |
| Advance payments from customers | | | (2,415 | ) | | | (20,654 | ) | | | 13,398 | |
| Accrued warranty costs | | | (2,093 | ) | | | 3,614 | | | | (138 | ) |
| Other liabilities | | | (2,708 | ) | | | (3,031 | ) | | | 5,613 | |
| Contributions to pension benefit plan | | | (343 | ) | | | (488 | ) | | | (13,198 | ) |
| Operating activities of discontinued operations | | | - | | | | 204 | | | | (4,552 | ) |
| Net Cash Provided by Operating Activities | | | 33,190 | | | | 43,838 | | | | 30,174 | |
| Cash Flows from Investing Activities: | | | | | | | | | | | | |
| Additions to property and equipment | | | (11,214 | ) | | | (9,757 | ) | | | (9,752 | ) |
| Payments for acquisition | | | (6,314 | ) | | | (25,143 | ) | | | (13,737 | ) |
| Net proceeds from sale of businesses | | | - | | | | 1,330 | | | | 10,293 | |
| Proceeds from maturity of short-term investments | | | - | | | | - | | | | 19,050 | |
| Purchases of short-term investments | | | - | | | | - | | | | (2,000 | ) |
| Investing activities of discontinued operations | | | - | | | | - | | | | (287 | ) |
| Net Cash (Used in) Provided by Investing Activities | | | (17,528 | ) | | | (33,570 | ) | | | 3,567 | |
| Cash Flows from Financing Activities: | | | | | | | | | | | | |
| Net receipts under short-term borrowings | | | 29 | | | | 15,796 | | | | 23,866 | |
| Repayments of long-term debt | | | - | | | | (2,308 | ) | | | (6,683 | ) |
| Excess tax benefits from stock-based compensation | | | 65 | | | | 4 | | | | 925 | |
| Cash dividends | | | (12,107 | ) | | | (10,112 | ) | | | (10,478 | ) |
| Proceeds from exercise of stock options and employee stock purchase plan | | | 1,015 | | | | 1,627 | | | | 7,866 | |
| Payments to purchase and retire common stock | | | (38,156 | ) | | | (12,823 | ) | | | (42,042 | ) |
| Net Cash Used in Financing Activities | | | (49,154 | ) | | | (7,816 | ) | | | (26,546 | ) |
| Effect of Exchange Rate Changes on Cash and Cash Equivalents | | | (8,782 | ) | | | 2,334 | | | | 2,559 | |
| Cash and Cash Equivalents: | | | | | | | | | | | | |
| (Decrease) increase during the year | | | (42,274 | ) | | | 4,786 | | | | 9,754 | |
| Balance, beginning of year | | | 118,885 | | | | 114,099 | | | | 104,345 | |
| Balance, end of year | | $ | 76,611 | | | $ | 118,885 | | | $ | 114,099 | |
| Supplemental Disclosures of Cash Flows: | | | | | | | | | | | | |
| Cash paid during the year for: | | | | | | | | | | | | |
| Interest | | $ | 1,549 | | | $ | 1,596 | | | $ | 726 | |
| Income taxes | | | 9,669 | | | | 13,250 | | | | 22,157 | |
The accompanying Notes to Consolidated Financial Statements are an integral part of these consolidated financial statements.
Notes to Consolidated Financial Statements
1. Summary of Significant Accounting Policies:
Nature of Operations
MTS Systems Corporation is a leading global supplier of test systems and industrial position sensors. The Company’s hardware and software solutions help customers accelerate and improve their design, development, and manufacturing processes and are used for determining the mechanical behavior of materials, products, and structures. MTS’ high-performance position sensors provide controls for a variety of industrial and vehicular applications.
Fiscal Year
The Company’s fiscal year ends on the Saturday closest to September 30. The Company’s fiscal years ended October 2, 2010 and September 27, 2008 consisted of 52 weeks. The Company’s fiscal year ended October 3, 2009 consisted of 53 weeks.
Consolidation
The Consolidated Financial Statements include the accounts of MTS Systems Corporation and its wholly owned subsidiaries (the "Company"). Significant intercompany balances and transactions have been eliminated.
Revenue Recognition
Orders that are manufactured and delivered in less than six months with routine installations and no special acceptance protocol may involve separable elements for revenue recognition purposes. Sufficient evidence of fair value of these elements exists to allow revenue recognition for these systems upon shipment, less the greater of the fair value associated with installation and training (if applicable) or the amount of revenue for which payment is deemed contingent upon delivery of these elements, which is deferred until customer acceptance. Fair value is determined based upon the sale price of similar products sold individually. In cases where special acceptance protocols exist, installation and training are not considered to be separable from the other elements of the arrangement. Accordingly, revenue for these systems is recognized u pon the completion of installation and fulfillment of obligations specific to the terms of the arrangement.
Certain contractual arrangements require longer production periods, generally longer than six months (long-term contracts), and may contain non-routine installations and special acceptance protocols. These arrangements often include hardware, software, installation services, training and support. In certain arrangements software may be essential to the functionality of the system deliverable. For these arrangements the Company identifies components of the arrangement which are considered software-related. Contractual arrangements in which software is essential to system functionality typically include significant production, modification, and customization. For arrangements with essential software and all other lo ng-term arrangements with complex installations and/or unusual acceptance protocols, revenue is recognized using the percentage-of-completion method, based on the cost incurred to-date relative to estimated total cost of the contract. Elements of an arrangement that do not separately fall within the scope of the percentage of completion method (e.g. software maintenance and training) are accounted for as the service is provided based on fair value as determined by stand-alone sales.
The Company enters into long-term contracts for customized equipment sold to its customers. Under the terms of such contracts, revenue recognized using the percentage-of-completion method may not, in certain circumstances, be invoiced until completion of contractual milestones, upon shipment of the equipment, or upon installation and acceptance by the customer. Unbilled amounts for these contracts appear in the Consolidated Balance Sheets as Unbilled Accounts Receivable.
Revenue for services is recognized as the service is performed or ratably over a defined contractual period for service maintenance contracts.
Revenue is recorded net of taxes collected from customers that are remitted to governmental authorities, with the collected taxes recorded as current liabilities until remitted to the relevant government authority.
Shipping and Handling
Freight revenue billed to customers is reported within Revenue on the Consolidated Statements of Income, and expenses incurred for shipping products to customers are reported within Cost of Sales on the Consolidated Statements of Income.
Research and Development
Research and development costs associated with new products are charged to operations as incurred.
Foreign Currency
The financial position and results of operations of the Company's foreign subsidiaries are measured using local currency as the functional currency. Assets and liabilities are translated using fiscal period-end exchange rates, and monthly statements of income are translated using average exchange rates applicable to each month, with the resulting translation adjustments recorded as a separate component of Shareholders' Investment. The Company recorded (losses)/gains on foreign currency translation in Comprehensive Income of ($10.1) million, $2.5 million, and $3.9 million for fiscal years 2010, 2009, and 2008 respectively. Gains and losses from foreign currency transactions are recognized in the Consolidated Statements of Income. The Company recorded net foreign currency transaction (losses)/gains of ($0.1) million, ($1.6) million, and $0. 6 million in fiscal years 2010, 2009, and 2008, respectively.
Cash and Cash Equivalents
Cash and cash equivalents represent cash, demand deposits, and highly liquid investments with original maturities of three months or less. Cash equivalents are recorded at cost, which approximates fair value. Cash equivalents, both inside and outside the United States, are invested in money market funds and bank deposits in local currency denominations.
Accounts Receivable and Long-Term Contracts
The Company grants credit to customers, but it generally does not require collateral or other security from domestic customers. When deemed appropriate, receivables from customers located outside the United States are supported by letters of credit from financial institutions. The allowance for doubtful accounts is based on management's assessment of the collectibility of specific customer accounts and includes consideration of the credit worthiness and financial condition of those specific customers. The Company records an allowance to reduce receivables to the amount that is reasonably believed to be collectible and considers factors such as the financial condition of the customer and the aging of the receivables. If there is a deterioration of a customer's financial condition, if the Company becomes aware of additional information rela ted to the credit worthiness of a customer, or if future actual default rates on trade receivables in general differ from those currently anticipated, the Company may have to adjust its allowance for doubtful accounts, which would affect earnings in the period the adjustments were made.
The Company enters into long-term contracts for customized equipment sold to its customers. Under the terms of such contracts, revenue recognized using the percentage-of-completion method may be invoiced upon completion of contractual milestones, shipment to the customer, or installation and customer acceptance. Unbilled amounts relating to these contracts are reflected as Unbilled Accounts Receivable in the accompanying Consolidated Balance Sheets. Amounts unbilled at October 2, 2010 are expected to be invoiced during fiscal year 2011.
Inventories
Inventories consist of material, labor, and overhead costs and are stated at the lower of cost or market value, determined under the first-in, first-out accounting method. Inventories at October 2, 2010 and October 3, 2009 were as follows:
| | | 2010 | | | 2009 | |
| | | (expressed in thousands) | |
| Customer projects in various stages of completion | | $ | 16,126 | | | $ | 15,075 | |
| | | | | | | | | |
Components, assemblies and parts | | | 35,666 | | | | 32,894 | |
| Total | | $ | 51,792 | | | $ | 47,969 | |
Software Development Costs
The Company capitalizes certain software development costs related to software to be sold, leased, or otherwise marketed. Capitalized software development costs include purchased materials and services, salary and benefits of the Company’s development and technical support staff, and other costs associated with the development of new products and services. Software development costs are expensed as incurred until technological feasibility has been established, at which time future costs incurred are capitalized until the product is available for general release to the public. Based on the Company’s product development process, technological feasibility is generally established once product and detailed program designs have been completed, uncertainties related to high-risk development issues have been resolved through coding a nd testing, and the Company has established that the necessary skills, hardware, and software technology are available for production of the product. Once a software product is available for general release to the public, capitalized development costs associated with that product will begin to be amortized to cost of sales over the product’s estimated economic life, using the greater of straight-line or a method that results in cost recognition in future periods that is consistent with the anticipated timing of product revenue recognition.
The Company’s capitalized software development costs are subject to an ongoing assessment of recoverability, which is impacted by estimates and assumptions of future revenues and expenses for these software products, as well as other factors such as changes in product technologies. Any portion of unamortized capitalized software development costs that are determined to be in excess of net realizable value will be expensed in the period such a determination is made. The Company reached technological feasibility for certain software products and began capitalizing software development costs during each of the fiscal years ended October 2, 2010 and October 3, 2009. Amortization expense for software development costs was $1.3 million and $0.7 million for the fiscal years ended October 2, 2010 and October 3, 2009, respectively. See Note 4 to the Consolidated Financial Statements for additional information on capitalized software development costs.
Impairment of Long-lived Assets
The Company reviews the carrying value of long-lived assets or asset groups, such as property and equipment and intangibles subject to amortization, when events or changes in circumstances such as market value, asset utilization, physical change, legal factors, or other matters indicate that the carrying value may not be recoverable. When this review indicates the carrying value of an asset or asset group exceeds the sum of the undiscounted cash flows expected to result from the use and eventual disposition of the asset or asset group, the Company recognizes an asset impairment charge against operations. The amount of the impairment loss recorded is the amount by which the carrying value of the impaired asset or asset group exceeds its fair value.
Property and Equipment
Property and equipment is stated at cost. Additions, replacements, and improvements are capitalized at cost, while maintenance and repairs are charged to operations as incurred. Depreciation is recorded over the following estimated useful lives of the property:
Buildings and improvements: 10 to 40 years
Machinery and equipment: 3 to 10 years
Building and equipment additions are generally depreciated on a straight-line basis for financial reporting purposes and on an accelerated basis for income tax purposes. See Note 4 to the Consolidated Financial Statements for additional information on property and equipment.
Goodwill and Intangible Assets
Goodwill represents the excess of acquisition costs over the fair value of the net assets of businesses acquired.Goodwill is not amortized to income, but instead tested at least annually for impairment. Goodwill is also tested for impairment as changes in circumstances occur indicating that the carrying value may not be recoverable.
Goodwill impairment testing first requires a comparison of the fair value of each reporting unit to the carrying value. If the carrying value of the reporting unit exceeds fair value, goodwill is considered impaired. Impairment testing for indefinite-lived intangible assets requires a comparison between the fair value and the carrying value of the asset. If the carrying value of the asset exceeds its fair value, the asset is reduced to fair value. At both October 2, 2010 and October 3, 2009, there were no indefinite-lived intangible assets.
Intangible assets with finite lives are amortized on a straight-line basis over the expected period to be benefited by future cash flows, and reviewed for impairment. Fair values of goodwill and intangible assets are primarily determined using discounted cash flow analyses. At both October 2, 2010 and October 3, 2009, the Company determined there was no impairment of its goodwill or intangible assets. See Note 4 to the Consolidated Financial Statements for additional information on goodwill and intangible assets.
Other Assets
Other assets at October 2, 2010 and October 3, 2009 include security deposits paid on leased property and cash redemption values on group insurance policies.
Warranty Obligations
Sales of the Company’s products and systems are subject to limited warranty obligations that are included in customer contracts. For sales that include installation services, warranty obligations typically extend for a period of twelve to twenty-four months from the date of either shipment or acceptance. Product obligations typically extend for a period of twelve to twenty-four months from the date of purchase. Under the terms of these warranties, the Company is obligated to repair or replace any components or assemblies it deems defective due to workmanship or materials. The Company reserves the right to reject warranty claims where it determines that failure is due to normal wear, customer modifications, improper maintenance, or misuse. The Company records general warranty provisions based on an estimated warranty expense percenta ge applied to current period revenue. The percentage applied reflects historical warranty claims experience over the preceding twelve-month period. Both the experience percentage and the warranty liability are evaluated on an ongoing basis for adequacy. In addition, warranty provisions are also recognized for certain nonrecurring product claims that are individually significant.
Warranty provisions and claims for the years ended October 2, 2010 and October 3, 2009, were as follows:
| | | 2010 | | | 2009 | |
| | | (expressed in thousands) | |
| Beginning balance | | $ | 9,774 | | | $ | 6,107 | |
| Warranty claims | | | (7,036 | ) | | | (9,122 | ) |
| Warranty provisions | | | 5,439 | | | | 11,251 | |
| Adjustments to preexisting warranties | | | (496 | ) | | | 1,485 | |
| Acquisition of SANS | | | - | | | | 73 | |
| Translation adjustment | | | (176 | ) | | | (20 | ) |
| Ending balance | | $ | 7,505 | | | $ | 9,774 | |
Derivative Financial Instruments
The Company’s results of operations could be materially impacted by changes in foreign currency exchange rates, as well as interest rates on its floating rate indebtedness. In an effort to manage exposure to these risks, the Company periodically enters into forward and option currency exchange contracts and interest rate swaps. Because the market value of these hedging contracts is derived from current market rates, they are classified as derivative financial instruments. The Company does not use derivatives for speculative or trading purposes. The derivative contracts contain credit risk to the extent that the Company’s bank counterparties may be unable to meet the terms of the agreements. The amount of such credit risk is generally limited to the unrealized gains, if any, in such contracts. Such risk is minimized by limiting those counterparties to major financial institutions of high credit quality. For derivative instruments executed under master netting arrangements, the Company has the contractual right to offset fair value amounts recognized for the right to reclaim cash collateral with obligations to return cash collateral. The Company does not offset fair value amounts recognized on these derivative instruments. As of October 2, 2010, the Company does not have any foreign exchange contracts with credit-risk related contingent features.
The Company’s foreign exchange cash flow hedges and interest rate swaps are designated and qualify as hedging instruments pursuant to ASC 815. The Company also has derivatives which are accounted for and reported under the guidance of ASC 830-20-10. Regardless of designation for accounting purposes, the Company believes that all of its derivative instruments are hedges of transactional risk exposures. The fair value of the Company’s outstanding designated and undesignated derivative assets and liabilities were reported in the Consolidated Balance Sheet as follows:
| | | October 2, 2010 | |
| | | Prepaid Expenses and Other Current Assets | | | Other Accrued Liabilities | |
| Designated hedge derivatives: | | (expressed in thousands) | |
| Foreign exchange cash flow hedges | | $ | 126 | | | $ | 547 | |
| Interest rate swaps | | | - | | | | 1,406 | |
| Total designated hedge derivatives | | | 126 | | | | 1,953 | |
| | | | | | | | | |
| Derivatives not designated as hedges: | | | | | | | | |
| Foreign exchange balance sheet derivatives | | | - | | | | 1,023 | |
| Total hedge and other derivatives | | $ | 126 | | | $ | 2,976 | |
| | | October 3, 2009 | |
| | | Prepaid Expenses and Other Current Assets | | | Other Accrued Liabilities | |
| Designated hedge derivatives: | | (expressed in thousands) | |
| Foreign exchange cash flow hedges | | $ | 234 | | | $ | 470 | |
| Interest rate swaps | | | - | | | | 1,894 | |
| Total designated hedge derivatives | | | 234 | | | | 2,364 | |
| | | | | | | | | |
| Derivatives not designated as hedges: | | | | | | | | |
| Foreign exchange balance sheet derivatives | | | - | | | | 729 | |
| Total hedge and other derivatives | | $ | 234 | | | $ | 3,093 | |
Foreign Exchange Cash Flow Hedges
Currency exchange contracts utilized to maintain the functional currency value of expected financial transactions denominated in foreign currencies are designated as cash flow hedges. Qualifying gains and losses related to changes in the market value of these contracts are reported as a component of Accumulated Other Comprehensive Income (“AOCI”) within Shareholders’ Investment on the Consolidated Balance Sheets and reclassified into earnings in the same period during which the underlying hedged transaction affects earnings. The effective portion of the cash flow hedges represents the change in fair value of the hedge that offsets the change in the functional currency value of the hedged item. The Company periodically assesses whether its currency exchange contracts are effective and, when a contract is determined to be no longer effective as a hedge, the Company discontinues hedge accounting prospectively. Subsequent changes in the market value of ineffective currency exchange contracts are recognized as an increase or decrease in Revenue on the Consolidated Statement of Income, as that is the same line item upon which the underlying hedged transaction is reported.
At October 2, 2010 and October 3, 2009, the Company had outstanding cash flow hedge currency exchange contracts with gross notional U.S. dollar equivalent amounts of $17.6 million and $16.6 million, respectively. Upon netting offsetting contracts to sell foreign currencies against contracts to purchase foreign currencies, irrespective of contract maturity dates, the net notional U.S. dollar equivalent amount of contracts outstanding were $15.2 million and $11.0 million at October 2, 2010 and October 3, 2009, respectively. At October 2, 2010 the net market value of the foreign currency exchange contracts was a net liability of $0.4 million, consisting of $0.5 million in liabilities and $0.1 million in offsetting assets. At October 3, 2009 the net market value of the foreign currency exchange contracts was a net liability of $0.3 million, c onsisting of $0.5 million in liabilities and $0.2 million in offsetting assets.
The pretax amounts recognized in AOCI on currency exchange contracts for the fiscal years ended October 2, 2010 and October 3, 2009, including gains (losses) reclassified into earnings in the Consolidated Statements of Income and gains (losses) recognized in other comprehensive income (“OCI”), are as follows:
| | | 2010 | | | 2009 | |
| | | (expressed in thousands) | |
| Beginning unrealized net (loss) gain in AOCI | | $ | (519 | ) | | $ | 108 | |
| Net loss reclassified into Revenue (effective portion) | | | 148 | | | | 1,969 | |
| Net loss reclassified into Revenue upon the removal of hedge designations on underlying foreign currency transactions that were cancelled | | | - | | | | 46 | |
| Net loss recognized in OCI (effective portion) | | | (13 | ) | | | (2,642 | ) |
| Ending unrealized net loss in AOCI | | $ | (384 | ) | | $ | (519 | ) |
The amount recognized in earnings as a result of the ineffectiveness of cash flow hedges was less than $0.1 million in each of the fiscal years ended October 2, 2010 and October 3, 2009. At October 2, 2010 and October 3, 2009, the amount projected to be reclassified from AOCI into earnings in the next 12 months was a net loss of $0.4 and $0.5 million, respectively. The maximum remaining maturity of any forward or optional contract at October 2, 2010 and October 3, 2009 was 1.2 years and 0.7 years, respectively.
Interest Rate Swaps
The Company also uses floating to fixed interest rate swaps to mitigate its exposure to changes in interest rates related to a portion of its floating rate indebtedness. The Company has designated these interest rate swaps as cash flow hedges. As a result, changes in the fair value of the interest rate swap are recorded in AOCI within Shareholders’ Investment on the Consolidated Balance Sheets.
At October 2, 2010 and October 3, 2009, the Company had outstanding interest rate swaps with total notional amounts of $40.0 million, which equals the amount of outstanding credit facility borrowings as of that date. Every month, the Company pays fixed interest on these interest rate swaps in exchange for interest received at monthly U.S. LIBOR. At October 2, 2010 and October 3, 2009, the weighted-average fixed interest rate payable by the Company under the terms of the interest rate swap arrangements was 3.31%. At October 2, 2010 and October 3, 2009, there was a 63 basis-point and a 45 basis-point differential, respectively, between the variable-rate interest paid by the Company on its outstanding credit facility borrowings and the variable-rate interest received on the interest rate swaps. As a result of this differential, the overall e ffective interest rate applicable to outstanding credit facility borrowings at October 2, 2010 and October 3, 2009, under the terms of the credit facility borrowings and interest rate swap agreements, was 3.94% and 3.76%, respectively. The total market value of the interest rate swaps at October 2, 2010 and October 3, 2009 was a liability of $1.4 million and $1.9 million, respectively.
The pretax amounts recognized in AOCI on interest rate swaps for the fiscal years ended October 2, 2010 and October 3, 2009 are as follows:
| | | 2010 | | | 2009 | |
| | | (expressed in thousands) | |
| Beginning unrealized net loss in AOCI | | $ | (1,894 | ) | | $ | (199 | ) |
| Net loss reclassified into interest expense (effective portion) | | | 1,223 | | | | 970 | |
| Net loss recognized in OCI (effective portion) | | | (735 | ) | | | (2,665 | ) |
| Ending unrealized net loss in AOCI | | $ | (1,406 | ) | | $ | (1,894 | ) |
Foreign Exchange Balance Sheet Derivatives
The Company also uses foreign exchange derivative contracts to maintain the functional currency value of monetary assets and liabilities denominated in non-functional foreign currencies. The gains and losses related to the changes in the market value of these derivative contracts are included in Other (Expense) Income, net on the Consolidated Statement of Income in the current period.
At October 2, 2010 and October 3, 2009, the Company had outstanding foreign exchange balance sheet derivative contracts with gross notional U.S. dollar equivalent amounts of $34.7 million and $54.5 million, respectively. Upon netting offsetting contracts by counterparty banks to sell foreign currencies against contracts to purchase foreign currencies, irrespective of contract maturity dates, the net notional U.S. dollar equivalent amount of contracts outstanding at October 2, 2010 and October 3, 2009 was $2.6 million and $12.7 million, respectively. At October 2, 2010 and October 3, 2009, the net market value of the foreign exchange balance sheet derivative contracts was a net liability of $1.0 million and $0.7 million, respectively.
The net loss recognized in the Consolidated Statements of Income on foreign exchange balance sheet derivative contracts during the fiscal years ended October 2, 2010 and October 3, 2009 is as follows:
| | | 2010 | | | 2009 | |
| | | (expressed in thousands) | |
| Net loss recognized in Other (expense) income, net | | $ | (834 | ) | | $ | (1,863 | ) |
Income Taxes
The Company records a tax provision for the anticipated tax consequences of the reported results of operations. Deferred tax assets and liabilities are measured using the currently enacted tax rates that apply to taxable income in effect for the years in which those deferred tax assets and liabilities are expected to be realized or settled. The Company records a valuation allowance to reduce deferred tax assets to the amount that is believed more likely than not to be realized. The Company believes it is more likely than not that forecasted income, including income that may be generated as a result of certain tax planning strategies, together with the tax effects of the deferred tax liabilities, will be sufficient to fully recover the remaining net realizable value of its deferred tax assets. In the event that all or part of the net defer red tax assets are determined not to be realizable in the future, an adjustment to the valuation allowance would be charged to earnings in the period such determination is made. In addition, the calculation of tax liabilities involves significant judgment in estimating the impact of uncertainties in the application of complex tax laws. Resolution of these uncertainties in a manner inconsistent with management’s expectations could have a material impact on the Company’s financial condition and operating results. See Note 8 to the Consolidated Financial Statements for additional information on income taxes.
Earnings Per Common Share
Basic earnings per share are computed by dividing net earnings by the daily weighted average number of common shares outstanding during the applicable periods. Diluted earnings per share include the potentially dilutive effect of common shares issued in connection with outstanding stock-based compensation options and grants, using the treasury stock method. Under the treasury stock method, shares associated with certain stock options have been excluded from the diluted weighted average shares outstanding calculation because the exercise of those options would lead to a net reduction in common shares outstanding. As a result, stock options to acquire 1.2 million, 1.3 million, and 0.9 million weighted common shares have been excluded from the diluted weighted shares outstanding calculation for the fiscal year ended October 2, 2010, October 3, 2009, and September 27, 2008, respectively. The potentially dilutive effect of common shares issued in connection with outstanding stock options is determined based on income before discontinued operations. A reconciliation of these amounts is as follows:
| | | 2010 | | | 2009 | | | 2008 | |
| | | (expressed in thousands, except per share data) | |
| | | | | | | | | | |
| Income before discontinued operations | | $ | 18,576 | | | $ | 17,394 | | | $ | 47,110 | |
| Income from discontinued operations, net of tax | | | - | | | | - | | | | 2,081 | |
| Net income | | $ | 18,576 | | | $ | 17,394 | | | $ | 49,191 | |
| Weighted average common shares outstanding | | | 16,281 | | | | 16,793 | | | | 17,351 | |
| Dilutive potential common shares | | | 66 | | | | 38 | | | | 193 | |
| Total dilutive common shares | | | 16,347 | | | | 16,831 | | | | 17,544 | |
| Earnings per share: | | | | | | | | | | | | |
| Basic: | | | | | | | | | | | | |
| Income before discontinued operations | | $ | 1.14 | | | $ | 1.04 | | | $ | 2.72 | |
| Income from discontinued operations, net of tax | | | - | | | | - | | | | 0.12 | |
| Earnings per share | | $ | 1.14 | | | $ | 1.04 | | | $ | 2.84 | |
| Diluted: | | | | | | | | | | | | |
| Income before discontinued operations | | $ | 1.14 | | | $ | 1.03 | | | $ | 2.68 | |
| Income from discontinued operations, net of tax | | | - | | | | - | | | | 0.12 | |
| Earnings per share | | $ | 1.14 | | | $ | 1.03 | | | $ | 2.80 | |
During the fourth quarter of fiscal year 2010, the Company entered into an accelerated share purchase agreement with an unrelated third party investment bank. This forward contract is indexed to, and potentially settled in, the Company’s common stock. This forward contract meets the requirements of ASC 815-40 to be classified as permanent equity. In connection with the agreement, the Company made an initial $25.0 million payment to the investment bank and immediately received approximately 0.9 million shares of its common stock. Effective as of the date of the initial stock purchase, the transaction was accounted for as a share retirement resulting in a reduction of common stock and retained earnings of $0.2 million and $24.8 million, respectively. As long as the forward contract continues to meet the requirements to be classified as permanent equity, the Company will not record future changes in its fair value. The contract continued to meet those requirements as of October 2, 2010 and the Company expects it will continue to meet those requirements through the settlement date. The agreement expires in the second quarter of fiscal year 2011 however the investment bank has the right to accelerate the end of the purchase period. Upon settlement of the contract, the Company will adjust common stock and retained earnings to reflect the final settlement amount.
The specific number of shares that the Company will ultimately purchase under the accelerated share purchase agreement will be based on the volume weighted average price (“VWAP”) of the Company’s common stock during the purchase period, less an agreed upon discount. At the completion of the purchase period, depending on the VWAP, the Company may be required to deliver, at its option, either additional shares of its common stock or cash to the investment bank in order to settle a loss position. Alternatively, the Company may be entitled to receive additional shares of its common stock from the investment bank in order to settle a gain position. The maximum amount of shares of common stock the Company can be required to issue to settle a loss posi tion cannot exceed 2.7 million. At October 2, 2010, the accelerated share purchase agreement was in a loss position which, if the contract had been settled on that date, would have required the Company to deliver to the investment bank either approximately 30,000 shares of its common stock or $0.9 million. For every $1.00 change in the Company’s VWAP, the settlement amount changes by approximately 30,000 shares of the Company’s common stock or $0.9 million.
Stock-Based Compensation
The Company measures the cost of employee services received in exchange for the award of equity instruments based on the fair value of the award at the date of grant, and recognizes the cost over the period during which an employee is required to provide services in exchange for the award.
For purposes of determining estimated fair value of stock-based payment awards, the Company utilizes a Black-Scholes option pricing model, which requires the input of certain assumptions requiring management judgment. Because the Company’s employee stock option awards have characteristics significantly different from those of traded options, and because changes in the input assumptions can materially affect fair value estimates, existing models may not provide a reliable single measure of the fair value of employee stock options. Management will continue to assess the assumptions and methodologies used to calculate estimated fair value of stock-based compensation. Circumstances may change and additional data may become available over time that could result in changes to these assumptions and methodologies and thereby materially impa ct the fair value determination of future grants of stock-based payment awards. If factors change and the Company employs different assumptions in future periods, the compensation expense recorded may differ significantly from the stock-based compensation expense recorded in the current period. See Note 2 to the Consolidated Financial Statements for additional information on stock-based compensation.
Comprehensive Income (Loss)
Comprehensive Income (Loss), a component of Shareholders’ Investment, for the fiscal years ended October 2, 2010, October 3, 2009 and September 27, 2008 consists of net income, pension benefit plan adjustments, derivative instrument gains or losses and foreign currency translation adjustments.
The accumulated balances for each component of Accumulated Other Comprehensive Income were as follows:
| | | Derivative Financial Instrument Unrealized Loss | | | Pension Benefit Plan Adjustments | | | Foreign Currency Translation Adjustment | | | Total Accumulated Other Comprehensive Income | |
| | | (expressed in thousands) | |
| Balances at September 29, 2007 | | $ | (392 | ) | | $ | (1,101 | ) | | $ | 21,906 | | | | 20,413 | |
| Foreign exchange translation adjustments | | | - | | | | (29 | ) | | | 3,888 | | | | 3,859 | |
| Pension benefit plan adjustments, net of tax of $374 | | | - | | | | 866 | | | | - | | | | 866 | |
| Change in unrealized loss, net of tax of ($523) | | | (973 | ) | | | - | | | | - | | | | (973 | ) |
| Realized loss, net of tax of $892 | | | 1,293 | | | | 24 | | | | - | | | | 1,317 | |
| Balances at September 27, 2008 | | | (72 | ) | | | (240 | ) | | | 25,794 | | | | 25,482 | |
| Foreign exchange translation adjustments | | | - | | | | - | | | | 2,459 | | | | 2,459 | |
| Pension benefit plan adjustments, net of tax of ($429) | | | - | | | | (992 | ) | | | - | | | | (992 | ) |
| Change in unrealized loss, net of tax of ($1,910) | | | (3,397 | ) | | | - | | | | - | | | | (3,397 | ) |
| Realized loss, net of tax of $1,028 | | | 1,961 | | | | 10 | | | | - | | | | 1,971 | |
| Balances at October 3, 2009 | | | (1,508 | ) | | | (1,222 | ) | | | 28,253 | | | | 25,523 | |
| Foreign exchange translation adjustments | | | - | | | | 23 | | | | (10,123 | ) | | | (10,100 | ) |
| Pension benefit plan adjustments, net of tax of ($493) | | | - | | | | (1,141 | ) | | | - | | | | (1,141 | ) |
| Change in unrealized loss, net of tax of ($277) | | | (470 | ) | | | - | | | | - | | | | (470 | ) |
| Realized loss, net of tax of $517 | | | 858 | | | | 11 | | | | - | | | | 869 | |
| Balances at October 2, 2010 | | $ | (1,120 | ) | | $ | (2,329 | ) | | $ | 18,130 | | | $ | 14,681 | |
Use of Estimates
The preparation of financial statements in accordance with U.S. generally accepted accounting principles requires management to make estimates and assumptions that affect the reported amounts of assets and liabilities, disclosure of contingent assets and liabilities as of the date of the financial statements, and reported amounts of revenue and expense during the reporting period. Ultimate results could differ from those estimates. Additionally, the Company frequently undertakes significant technological innovation on certain of its long-term contracts, involving performance risk that may result in delayed delivery of product and/or revenue and gross profit variation due to changes in the ultimate costs of these contracts versus estimates.
Recent Accounting Pronouncements
In January 2010, the Financial Accounting Standards Board (“FASB”) issued Accounting Standards Update (“ASU”) 2010-06, “Improving Disclosures about Fair Value Measurements.” ASU 2010-06 requires additional disclosures about fair value measurements. The new disclosure provisions of ASU 2010-06 are effective for interim and annual reporting periods beginning after December 15, 2009, except for the disclosures about purchases, sales, issuances and settlements in the roll forward of activity in Level 3 fair value measurements. Those disclosures are effective for fiscal years beginning after December 15, 2010, and for interim periods within those fiscal years. The Company’s adoption of the provisions of ASU 2010-06 during fiscal year 2010 did not have an impact on its consolidated financial statements.
2. Stock-Based Compensation:
The Company compensates officers, directors, and employees with stock-based compensation under two stock plans approved by the Company’s shareholders in 2002 and 2006, and administered under the supervision of the Company’s Board of Directors. During the years ended October 2, 2010, October 3, 2009, and September 27, 2008, the Company awarded stock options, employee stock purchase plan shares, and restricted stock grants. During the years ended October 2, 2010 and October 3, 2009, the Company also awarded restricted stock units under the 2006 stock plan. At October 2, 2010, a total of 1,216,034 shares were available for future grant under these plans.
Stock-Based Compensation Expense
The effect of recording stock-based compensation expense for the years ended October 2, 2010, October 3, 2009, and September 27, 2008 was as follows (in thousands, except per share data):
| | | 2010 | | | 2009 | | | 2008 | |
| | | | | | | | | | |
| Stock-based compensation expense by type of award: | | | | | | | | | |
| Employee stock options | | $ | 1,519 | | | $ | 2,478 | | | $ | 3,591 | |
| Employee stock purchase plan (ESPP) | | | 175 | | | | 242 | | | | 191 | |
| Restricted stock grants and units | | | 691 | | | | 612 | | | | 441 | |
| Amounts capitalized as inventory | | | (639 | ) | | | (775 | ) | | | (938 | ) |
Amounts recognized in income for amounts previously capitalized as inventory | | | 702 | | | | 827 | | | | 914 | |
| | | | | | | | | | | | | |
| Total stock-based compensation included in income from operations | | | 2,448 | | | | 3,384 | | | | 4,199 | |
| Income tax benefit on stock-based compensation | | | (828 | ) | | | (1,091 | ) | | | (1,421 | ) |
| Net compensation expense included in net income | | $ | 1,620 | | | $ | 2,293 | | | $ | 2,778 | |
| | | | | | | | | | | | | |
| Earnings per share: | | | | | | | | | | | | |
| Basic | | $ | 0.10 | | | $ | 0.14 | | | $ | 0.16 | |
| Diluted | | $ | 0.10 | | | $ | 0.14 | | | $ | 0.16 | |
At October 2, 2010, there was $2.2 million of total stock option expense related to non-vested awards not yet recognized, which is expected to be recognized over a weighted average period of approximately 1.4 years. At October 2, 2010, there was $1.2 million and $0.3 million of total restricted stock expense related to non-vested awards of restricted stock units and restricted stock grants, respectively, not yet recognized, which is expected to be recognized over a weighted average period of approximately 1.6 years and 1.1 years, respectively.
The fair value of stock options granted under stock-based compensation programs has been estimated as of the date of each grant using the multiple option form of the Black-Scholes valuation model, based on the grant price and assumptions regarding the expected grant life, stock price volatility, dividends, and risk-free interest rates. Each vesting period of an option award is valued separately, with this value being recognized evenly over the vesting period. The weighted average per share fair value of stock options granted during the fiscal years ended October 2, 2010, October 3, 2009, and September 27, 2008 was $6.73, $4.71, and $7.53, respectively. The weighted average assumptions used to determine fair value of stock options granted during those fiscal years were as follows:
| | | 2010 | | | 2009 | | | 2008 | |
| Expected life (in years) | | | 2.9 | | | | 2.7 | | | | 2.6 | |
| Risk-free interest rate | | | 1.0 | % | | | 1.4 | % | | | 2.8 | % |
| Expected volatility | | | 40.0 | % | | | 41.4 | % | | | 33.3 | % |
| Dividend yield | | | 2.1 | % | | | 2.9 | % | | | 1.7 | % |
The expected life represents the period that the stock option awards are expected to be outstanding and was determined based on historical and anticipated future exercise and expiration patterns. The risk-free interest rate used is based on the yield of constant maturity U.S. Treasury bonds on the grant date with a remaining term equal to the expected life of the grant. The Company estimates stock price volatility based on a historical weekly price observation. The dividend yield assumption is based on the annualized current dividend divided by the share price on the grant date.
Awards of restricted stock grants and restricted stock units both are valued based on the market value of the Company’s shares at the date of grant. The value of restricted stock grants and restricted stock units is allocated to expense evenly over the restricted period. Employee stock purchase plan share awards are valued based on the value of the discount feature plus the fair value of the optional features, which is determined as of the date of grant using the Black-Scholes valuation model. The value of these share awards is allocated to expense evenly over each purchase period.
Stock Options
Stock options are granted at exercise prices equal to the closing market price of the Company’s stock on the date of grant. Generally, options vest proportionally on the first three anniversaries of the grant date and expire five years from the grant date.
Stock option activity for the fiscal years ended October 2, 2010, October 3, 2009, and September 27, 2008 was as follows (in thousands, except per share amounts):
| | | 2010 | | | 2009 | | | 2008 | |
| | | Shares | | | WAEP* | | | Shares | | | WAEP* | | | Shares | | | WAEP* | |
| Options outstanding at beginning of year | | | 1,492 | | | $ | 35.56 | | | | 1,572 | | | $ | 37.59 | | | | 1,588 | | | $ | 34.60 | |
| Granted | | | 252 | | | $ | 28.62 | | | | 273 | | | $ | 20.60 | | | | 377 | | | $ | 35.87 | |
| Exercised | | | (16 | ) | | $ | 20.55 | | | | (40 | ) | | $ | 22.44 | | | | (332 | ) | | $ | 21.62 | |
| Forfeited or expired | | | (399 | ) | | $ | 35.20 | | | | (313 | ) | | $ | 34.36 | | | | (61 | ) | | $ | 35.87 | |
| Options outstanding at end of year | | | 1,329 | | | $ | 34.53 | | | | 1,492 | | | $ | 35.56 | | | | 1,572 | | | $ | 37.59 | |
| Options eligible for exercise at year-end | | | 811 | | | $ | 38.93 | | | | 892 | | | $ | 38.90 | | | | 821 | | | $ | 35.68 | |
*Weighted Average Exercise Price
Options outstanding at October 2, 2010 had a weighted average remaining contractual term of 2.6 years, and an aggregate intrinsic value of $3.2 million. Options eligible for exercise at October 2, 2010 had a weighted average remaining contractual term of 1.8 years, and an aggregate intrinsic value of $0.7 million.
The total intrinsic value of stock options exercised during the fiscal years ended October 2, 2010, October 3, 2009, and September 27, 2008 was $0.1 million, less than $0.1 million and $5.8 million, respectively.
Restricted Stock
The Company awards directors and key employees restricted stock grants and restricted stock units that vest over three years. For restricted stock grants awarded to directors, participants are entitled to cash dividends and voting rights on unvested shares, but the sale and transfer of these shares is restricted during the vesting period. For restricted stock grants awarded to employees, participants were not entitled to cash dividends and voting rights on unvested shares.
Restricted stock grant activity for the fiscal years ended October 2, 2010, October 3, 2009, and September 27, 2008 was as follows (in thousands, except per share amounts):
| | | 2010 | | | 2009 | | | 2008 | |
| | | Shares | | | WAGDFV* | | | Shares | | | WAGDFV* | | | Shares | | | WAGDFV* | |
| Unvested shares at beginning of year | | | 36 | | | $ | 28.72 | | | | 20 | | | $ | 39.29 | | | | 22 | | | $ | 38.64 | |
| Granted | | | 20 | | | $ | 26.47 | | | | 29 | | | $ | 24.76 | | | | 12 | | | $ | 38.30 | |
| Vested | | | (10 | ) | | $ | 33.71 | | | | (10 | ) | | $ | 38.99 | | | | (11 | ) | | $ | 36.62 | |
| Forfeited | | | (17 | ) | | $ | 25.85 | | | | (3 | ) | | $ | 26.91 | | | | (3 | ) | | $ | 39.87 | |
| Unvested shares at end of year | | | 29 | | | $ | 27.18 | | | | 36 | | | $ | 28.72 | | | | 20 | | | $ | 39.29 | |
*Weighted Average Grant Date Fair Value
Restricted stock unit activity for the fiscal years ended October 2, 2010 and October 3, 2009, was as follows (in thousands, except per share amounts):
| | | 2010 | | | 2009 | |
| | | Shares | | | WAGDFV* | | | Shares | | | WAGDFV* | |
| Outstanding at beginning of year | | | 38 | | | $ | 20.55 | | | | - | | | $ | - | |
| Granted | | | 37 | | | $ | 28.62 | | | | 39 | | | $ | 20.55 | |
| Vested | | | (12 | ) | | $ | 20.55 | | | | - | | | $ | - | |
| Forfeited | | | (4 | ) | | $ | 21.61 | | | | (1 | ) | | $ | 20.55 | |
| Outstanding at end of year | | | 59 | | | $ | 25.51 | | | | 38 | | | $ | 20.55 | |
*Weighted Average Grant Date Fair Value
Employee Stock Purchase Plan
The Company’s U.S. employees are eligible to participate in the Company’s Employee Stock Purchase Plan (“ESPP”). Employee purchases of Company stock are funded by payroll deductions over calendar six-month periods. The purchase price is 85% of the lower of the market price at either the beginning or end of the six-month period. The shares are required to be held by the employee for at least eighteen months subsequent to the purchase. Two purchase periods closed in fiscal year 2010 with the combined issuance of 33,249 shares at a weighted average price of $20.82. In fiscal years 2009 and 2008, purchases were 36,333 and 20,733 shares, respectively, with weighted average share prices of $19.75 and $33.15, respectively. At October 2, 2010, the number of shares remaining for issuance under the ESPP was 444,887.
3. Acquisitions & Divestitures:
Business Acquisition
On September 28, 2008, the Company acquired substantially all of the assets of SANS. SANS has manufacturing facilities in both Shenzhen and Shanghai, China, and is headquartered in Shenzhen. SANS manufactures material testing solutions and offers a variety of products, including electro-mechanical and static-hydraulic testing machines. The acquisition accelerates the Company’s China growth strategy while also broadening its product offering worldwide.
The total purchase price for SANS of $48.1 million, including direct acquisition costs of $2.9 million, has been substantially paid. The remaining liability of less than $0.1 million is included in Other Accrued Liabilities on the October 2, 2010 Consolidated Balance Sheet, and is expected to be paid during the next twelve months. The results of operations for SANS have been included in the Company’s Consolidated Statements of Income since the date of acquisition, and are reported in the Company’s Test segment. Pro forma results have not been included as the impact of the acquisition is not material.
Subsequent to the acquisition, the company entered into a transition services agreement with SANS to facilitate order processing and product delivery while the Company obtained manufacturing permits and export licenses from the Chinese Government. Under the terms of the agreement, the Company was entitled to all the profit and risk of loss on these transactions. Many of the shareowners of SANS are currently employed by the Company and thus the transactions executed under this agreement are considered related party transactions. The transition services agreement expired during fiscal year 2009; however, as of October 2, 2010 and October 3, 2009 the outstanding receivables from SANS were $1.2 million and $5.0 million, respectively. All of the outstanding receivables as of October 2, 2010 are expected to be collected within the next twelve m onths.
Discontinued Operations
On June 27, 2008, the Company sold substantially all of the net assets of its Nano Instruments product line, which was based in Oak Ridge, Tennessee. As a result of this sale, the Company recorded a gain of $2.4 million, net of tax of $3.6 million, in fiscal year 2008. The Nano Instruments product line was historically included in the Company’s Test segment for financial reporting. The results of operations of the Nano Instruments product line, including the gain on the sale, have been excluded from the results of operations of the Test segment and are reported as discontinued operations.
The Company does not allocate interest income or interest expense to discontinued operations. Operating results of discontinued operations included in Loss from Discontinued Operations, net of Tax in the Consolidated Statement of Income for the fiscal year ended September 27, 2008 were as follows:
| | | 2008 | |
| | | (expressed in thousands) | |
| Revenue | | $ | 6,106 | |
| Loss on discontinued operations before taxes and gain on sale | | | (628 | ) |
| Benefit for income taxes | | | (260 | ) |
| Loss from discontinued operations, net of tax | | $ | (368 | ) |
4. Capital Assets:
Property and Equipment
Property and equipment at October 2, 2010 and October 3, 2009 consist of the following:
| | | 2010 | | | 2009 | |
| | | (expressed in thousands) | |
| Land and improvements | | $ | 1,714 | | | $ | 1,716 | |
| Buildings and improvements | | | 52,535 | | | | 52,921 | |
| Machinery and equipment | | | 104,405 | | | | 96,156 | |
| Total | | | 158,654 | | | | 150,793 | |
| Less accumulated depreciation | | | (102,210 | ) | | | (94,675 | ) |
| Property and equipment, net | | $ | 56,444 | | | $ | 56,118 | |
Goodwill
The changes to the carrying amount of goodwill for fiscal years ended October 2, 2010 and October 3, 2009 were as follows:
| | | 2010 | | | 2009 | |
| | | (expressed in thousands) | |
| Beginning balance | | $ | 15,206 | | | $ | 1,668 | |
| Acquisition of SANS | | | - | | | | 13,604 | |
| Currency translation | | | 223 | | | | (66 | ) |
| Ending balance | | $ | 15,429 | | | $ | 15,206 | |
Other Intangible Assets
Other intangible assets consist of the following:
| | | October 2, 2010 | |
| | | Gross Carrying Amount | | | Accumulated Amortization | | | Net Carrying Value | | | Weighted Average Useful Life (in Years) | |
| | | (expressed in thousands) | | | | |
| Software development costs | | $ | 11,640 | | | $ | (2,062 | ) | | $ | 9,578 | | | | 6.0 | |
| Patents | | | 9,484 | | | | (1,347 | ) | | | 8,137 | | | | 15.3 | |
| Trademarks and trade names | | | 5,689 | | | | (603 | ) | | | 5,086 | | | | 30.2 | |
| Non-compete agreements | | | 2,485 | | | | (1,657 | ) | | | 828 | | | | 3.0 | |
| Land-use rights | | | 1,167 | | | | (43 | ) | | | 1,124 | | | | 47.8 | |
| Total | | $ | 30,465 | | | $ | (5,711 | ) | | $ | 24,753 | | | | 14.7 | |
| | | October 3, 2009 | |
| | | Gross Carrying Amount | | | Accumulated Amortization | | | Net Carrying Value | | | Weighted Average Useful Life (in Years) | |
| | | (expressed in thousands) | | | | |
| Software development costs | | $ | 8,062 | | | $ | (729 | ) | | $ | 7,333 | | | | 5.0 | |
| Patents | | | 9,225 | | | | (652 | ) | | | 8,573 | | | | 15.4 | |
| Trademarks and trade names | | | 5,583 | | | | (412 | ) | | | 5,171 | | | | 30.2 | |
| Non-compete agreements | | | 2,435 | | | | (812 | ) | | | 1,623 | | | | 3.0 | |
| Land-use rights | | | 1,144 | | | | (18 | ) | | | 1,126 | | | | 47.8 | |
| Total | | $ | 26,449 | | | $ | (2,623 | ) | | $ | 23,826 | | | | 15.6 | |
Amortization expense recognized during the fiscal years ended October 2, 2010 and October 3, 2009 was $3.0 million and $2.4 million, respectively. The estimated future amortization expense related to other intangible assets for the next five fiscal years is as follows:
| Fiscal Year | | Amortization Expense | |
| | | (expressed in thousands) | |
| | | | |
| 2011 | | $ | 3,383 | |
| 2012 | | $ | 3,182 | |
| 2013 | | $ | 3,182 | |
| 2014 | | $ | 3,181 | |
| 2015 | | $ | 3,168 | |
Future amortization amounts presented above are estimates. Actual future amortization expense may be different, due to future acquisitions, impairments, changes in amortization periods, or other factors.
5. Business Segment Information:
The Company’s Chief Executive Officer and management regularly review financial information for the Company’s three discrete operating segments. Based on similarities in the economic characteristics, nature of products and services, production processes, type or class of customer served, method of distribution and regulatory environments, the operating segments have been aggregated for financial statement purposes and categorized into two reportable segments, “Test” and “Sensors.” The Test segment provides testing equipment, systems, and services to the ground vehicles, aerospace, and infrastructure markets. The Sensors segment provides high-performance position sensors for a variety of industrial and vehicular applications.
In evaluating each segment's performance, management focuses on income from operations. This measure excludes interest income and expense, income taxes and other non-operating items. Corporate expenses, including costs associated with various support functions such as human resources, information technology, legal, finance and accounting, and general and administrative costs, are allocated to the reportable segments primarily on the basis of revenue.
Financial information by reportable segment for the fiscal years ended October 2, 2010, October 3, 2009, and September 27, 2008, were as follows:
| | | 2010 | | | 2009 | | | 2008 | |
| | | (expressed in thousands) | |
| Revenue | | | | | | | | | |
| Test | | $ | 296,230 | | | $ | 342,595 | | | $ | 364,068 | |
| Sensors | | | 77,823 | | | | 66,286 | | | | 96,447 | |
| Total Revenue | | $ | 374,053 | | | $ | 408,881 | | | $ | 460,515 | |
| | | | | | | | | | | | | |
| Income from Operations | | | | | | | | | | | | |
| Test | | $ | 11,204 | | | $ | 17,494 | | | $ | 41,108 | |
| Sensors | | | 17,141 | | | | 7,100 | | | | 20,653 | |
| Total Income from Operations | | $ | 28,345 | | | $ | 24,594 | | | $ | 61,761 | |
| | | | | | | | | | | | | |
| Assets | | | | | | | | | | | | |
| Test | | $ | 261,109 | | | $ | 289,700 | | | $ | 301,346 | |
| Sensors | | | 85,296 | | | | 97,214 | | | | 97,431 | |
| Discontinued Operations | | | - | | | | - | | | | 380 | |
| Total Assets | | $ | 346,405 | | | $ | 386,914 | | | $ | 399,157 | |
| | | | | | | | | | | | | |
| Other Segment Data | | | | | | | | | | | | |
| Test: | | | | | | | | | | | | |
| Goodwill | | $ | 13,817 | | | $ | 13,538 | | | $ | - | |
| Capital expenditures | | | 8,702 | | | | 8,134 | | | | 7,643 | |
| Depreciation and amortization | | $ | 10,686 | | | $ | 10,090 | | | $ | 7,317 | |
| Sensors: | | | | | | | | | | | | |
| Goodwill | | $ | 1,612 | | | $ | 1,668 | | | $ | 1,668 | |
| Capital expenditures | | | 2,512 | | | | 1,623 | | | | 2,109 | |
| Depreciation and amortization | | $ | 2,065 | | | $ | 2,042 | | | $ | 1,890 | |
| Geographic information was as follows: | | | | | | | | | |
| | | 2010 | | | 2009 | | | 2008 | |
| | | (expressed in thousands) | |
| Revenue | | | | | | | | | |
| United States | | $ | 109,638 | | | $ | 123,336 | | | $ | 147,766 | |
| Europe, excluding Germany | | | 71,155 | | | | 95,368 | | | | 92,995 | |
| China | | | 77,600 | | | | 61,209 | | | | 35,325 | |
| Japan | | | 27,540 | | | | 47,500 | | | | 48,802 | |
| Germany | | | 41,710 | | | | 33,341 | | | | 58,962 | |
| Asia, excluding Japan & China | | | 33,673 | | | | 29,439 | | | | 55,396 | |
| Other | | | 12,737 | | | | 18,688 | | | | 21,269 | |
| Total Revenue | | $ | 374,053 | | | $ | 408,881 | | | $ | 460,515 | |
| | | | | | | | | | | | | |
| Property and Equipment, Net | | | | | | | | | | | | |
| United States | | $ | 36,216 | | | $ | 34,613 | | | $ | 35,842 | |
| Germany | | | 10,748 | | | | 12,092 | | | | 11,860 | |
| China | | | 6,915 | | | | 7,043 | | | | - | |
| Asia, excluding China | | | 2,028 | | | | 1,794 | | | | 2,255 | |
| Europe, excluding Germany | | | 537 | | | | 576 | | | | 577 | |
| Total Property and Equipment, Net | | $ | 56,444 | | | $ | 56,118 | | | $ | 50,534 | |
Revenue by geographic area is presented based on customer location. No countries other than the United States, China, Japan and Germany had revenue in excess of 10% of the Company's total revenue during any of the periods presented. No single customer accounted for 10% or more of the Company’s consolidated revenue for any of the periods presented.
6. Fair Value Measurements
In determining the fair value of financial assets and liabilities, the Company currently utilizes market data or other assumptions that it believes market participants would use in pricing the asset or liability, and adjusts for non-performance and/or other risk associated with the Company as well as counterparties, as appropriate.
ASC 820-10 establishes a fair value hierarchy that prioritizes the inputs to valuation techniques used to measure fair value into three broad levels. The three levels of the fair value hierarchy are as follows:
Level 1: Inputs are unadjusted quoted prices which are available in active markets for identical assets or liabilities.
Level 2: Inputs are other-than-quoted prices in active markets included in Level 1, which are either directly or indirectly observable, such as quoted prices for similar assets or liabilities in active markets, or for identical assets or liabilities in inactive markets. Level 2 includes those financial assets and liabilities that are valued using models or other valuation methodologies. The models used are primarily industry-standard, and consider various assumptions, including quoted forward prices, time value, volatility factors, and current contractual prices for the underlying instruments, as well as other relevant economic measures. Substantially all of the assumptions used in these valuation models are observable in the marketplace.
Level 3: Inputs are unobservable and reflect the Company’s own assumptions used to measure assets and liabilities at fair value.
The hierarchy gives the highest priority to Level 1, as this level provides the most reliable measure of fair value, while giving the lowest priority to Level 3.
Financial Instruments Measured at Fair Value on a Recurring Basis
Financial assets and liabilities subject to fair value measurements on a recurring basis are as follows:
| | | October 2, 2010 | |
| | | Level 1 | | | Level 2 | | | Level 3 | | | Total | |
| Assets: | | (expressed in thousands) | |
Currency contracts(1) | | $ | - | | | $ | 126 | | | $ | - | | | $ | 126 | |
| Total assets | | $ | - | | | $ | 126 | | | $ | - | | | $ | 126 | |
| | | | | | | | | | | | | | | | | |
| Liabilities: | | | | | | | | | | | | | | | | |
Currency contracts(1) | | $ | - | | | $ | 1,570 | | | $ | - | | | $ | 1,570 | |
Interest rate swaps(2) | | | | | | | 1,406 | | | | - | | | | 1,406 | |
| Total liabilities | | $ | - | | | $ | 2,976 | | | $ | - | | | $ | 2,976 | |
| | | October 3, 2009 | |
| | | Level 1 | | | Level 2 | | | Level 3 | | | Total | |
| Assets: | | (expressed in thousands) | |
Currency contracts(1) | | $ | - | | | $ | 234 | | | $ | - | | | $ | 234 | |
| Total assets | | $ | - | | | $ | 234 | | | $ | - | | | $ | 234 | |
| | | | | | | | | | | | | | | | | |
| Liabilities: | | | | | | | | | | | | | | | | |
Currency contracts(1) | | $ | - | | | $ | 1,199 | | | $ | - | | | $ | 1,199 | |
Interest rate swaps(2) | | | | | | | 1,894 | | | | - | | | | 1,894 | |
| Total liabilities | | $ | - | | | $ | 3,093 | | | $ | - | | | $ | 3,093 | |
| | (1) | Based on observable market transactions of spot currency rates and forward currency rates on equivalently-termed instruments. |
| | (2) | Based on LIBOR and swap rates. |
Nonfinancial Assets Measured at Fair Value on a Nonrecurring Basis
The Company’s goodwill, intangible assets and other long-lived assets are nonfinancial assets that were acquired either as part of a business combination, individually or with a group of other assets. These nonfinancial assets were initially, and are currently, measured and recognized at amounts equal to the fair value determined as of the date of acquisition. Periodically, these nonfinancial assets are tested for impairment, by comparing their respective carrying values to the estimated fair value of the reporting unit or asset group in which they reside. In the event any of these nonfinancial assets were to become impaired, the Company would recognize an impairment loss equal to the amount by which the carrying value of the reporting unit, impaired asset or asset group exceeds its estimated fair value. Fair value measurements of r eporting units are estimated using an income approach involving discounted or undiscounted cash flow models that contain certain Level 3 inputs requiring management judgment, including projections of economic conditions and customer demand, revenue and margins, changes in competition, operating costs, working capital requirements, and new product introductions. Fair value measurements of the reporting units associated with the Company’s goodwill balances are estimated at least annually in the fourth quarter of each fiscal year for purposes of impairment testing. Fair value measurements associated with the Company’s intangible assets and other long-lived assets are estimated when events or changes in circumstances such as market value, asset utilization, physical change, legal factors, or other matters indicate that the carrying value may not be recoverable.
Financial Instruments not Measured at Fair Value
Certain of the Company’s financial instruments are not measured at fair value but nevertheless are recorded at carrying amounts approximating fair value, based on their short-term nature or variable interest rate. These financial instruments include cash and cash equivalents, accounts receivable, accounts payable and short-term borrowings.
7. Financing:
Short-term borrowings at October 2, 2010 and October 3, 2009 consist of the following:
| | | 2010 | | | 2009 | |
| | | (expressed in thousands) | |
| Bank line of credit, monthly U.S. LIBOR plus 63 basis points (0.94% rate in effect at October 2, 2010), maturing October 2010, with optional month-to-month term renewal and loan repricing until December 2012 | | $ | 40,000 | | | $ | 40,000 | |
| Notes payable, non-interest bearing | | | 229 | | | | 182 | |
| Total Short-Term Borrowings | | $ | 40,229 | | | $ | 40,182 | |
The Company’s unsecured credit facility provides for up to $75.0 million for working capital financing, acquisitions, share purchases, or other general corporate purposes and expires in December 2012. At October 2, 2010 and October 3, 2009, outstanding borrowings under the credit facility were $40.0 million. At October 2, 2010, the Company had outstanding letters of credit drawn from the credit facility totaling $12.5 million, leaving approximately $22.5 million of unused borrowing capacity.
The weighted average interest rate on outstanding borrowings under the Credit Facility during the fiscal years ended October 2, 2010 and October 3, 2009 was 0.80% and 1.32%, respectively. In order to mitigate its exposure to interest rate increases on its floating rate indebtedness, the Company has entered into floating to fixed interest rate swaps. Subsequent to October 2, 2010, the Company renewed each of the outstanding borrowings on the credit facility for an additional month. The Company intends to continue to renew each of the outstanding borrowings on the credit facility monthly throughout the entire term of the interest rate swap arrangement directly associated with the borrowing. See Note 1 to the Consolidated Financial Statements for additional information on the interest rate swaps.
At the Company’s election, future borrowings under the Credit Facility can be structured to bear interest at either an alternate base rate (“ABR”) or an adjusted LIBOR plus an applicable margin. The ABR is the greater of the Prime Rate or the Federal Funds Effective Rate plus 0.5%. At October 2, 2010, the prime rate of 3.25% was the applicable ABR. The adjusted LIBOR is generally determined based on the multiple of the applicable LIBOR and a statutory reserve factor, considering the projected period of use of the loan proceeds. The applicable margin applied to adjusted LIBOR on borrowings varies based on the Company’s leverage ratio. At October 2, 2010, the spread of the adjusted LIBOR plus the applicable margin ranged from 0.88% to 1.09%. Commitment fees are payable on the unused portion of the Credit Facility at rates between 0.09% and 0.18%, based on the Company’s leverage ratio. During each the fiscal years ended October 2, 2010 and October 3, 2009, commitment fees incurred on the Credit Facility were less than $0.1 million.
Notes payable at October 2, 2010 and October 3, 2009 consisted of non-interest bearing notes payable to vendors by the Company’s Japanese Sensors subsidiary.
The Company is subject to financial covenants, among other restrictions, under the Credit Facility, including, among other covenants, the ratio of consolidated total indebtedness to consolidated EBITDA, as well as the ratio of consolidated EBITDA to consolidated interest expense. These covenants restrict the Company’s ability to pay dividends and purchase outstanding shares of common stock. At October 2, 2010 and October 3, 2009, the Company was in compliance with these financial covenants.
At October 2, 2010, the Company had outstanding letters of credit and guarantees totaling $41.1 million and $1.4 million, respectively, primarily to bond advance payments and performance related to customer contracts in the Test segment.
8. Income Taxes:
The components of income before income taxes for the fiscal years ended October 2, 2010, October 3, 2009, and September 27, 2008 were as follows:
| | | 2010 | | | 2009 | | | 2008 | |
| | | (expressed in thousands) | |
| Income before income taxes and discontinued operations: | | | | | | | | | |
| Domestic | | $ | 10,659 | | | $ | 15,965 | | | $ | 29,745 | |
| Foreign | | | 16,553 | | | | 7,938 | | | | 35,715 | |
| Total | | $ | 27,212 | | | $ | 23,903 | | | $ | 65,460 | |
The provision for income taxes from continuing operations for the fiscal years ended October 2, 2010, October 3, 2009, and September 27, 2008 was as follows:
| | | 2010 | | | 2009 | | | 2008 | |
| | | (expressed in thousands) | |
| Current provision (benefit): | | | | | | | | | |
| Federal | | $ | 357 | | | $ | (601 | ) | | $ | 9,016 | |
| State | | | 65 | | | | 5 | | | | 1,080 | |
| Foreign | | | 6,046 | | | | 7,435 | | | | 11,943 | |
| Deferred | | | 2,168 | | | | (330 | ) | | | (3,689 | ) |
| Total provision | | $ | 8,636 | | | $ | 6,509 | | | $ | 18,350 | |
A reconciliation from the federal statutory income tax rate to the Company’s effective income tax rate for the fiscal years ended October 2, 2010, October 3, 2009, and September 27, 2008 is as follows:
| | | 2010 | | | 2009 | | | 2008 | |
| | | | | | | | | | |
| United States federal statutory income tax rate | | | 35 | % | | | 35 | % | | | 35 | % |
| Foreign provision (less than) greater than U.S. tax rate | | | (1 | ) | | | 1 | | | | (1 | ) |
| Settlement of audits, favorable resolution of accrued tax matters | | | (2 | ) | | | - | | | | (2 | ) |
| State income taxes, net of federal benefit | | | 1 | | | | 1 | | | | 1 | |
| Research and development tax credits | | | (1 | ) | | | (13 | ) | | | - | |
| Domestic production activities deduction | | | - | | | | (1 | ) | | | (1 | ) |
| Foreign tax credits | | | (3 | ) | | | - | | | | (5 | ) |
| Valuation allowances against deferred tax assets | | | - | | | | 1 | | | | - | |
| Nondeductible stock option expense and other permanent items | | | 3 | | | | 3 | | | | 1 | |
| Effective income tax rate | | | 32 | % | | | 27 | % | | | 28 | % |
A summary of the deferred tax assets and liabilities for the fiscal years ended October 2, 2010, October 3, 2009, and September 27, 2008 is as follows:
| | | 2010 | | | 2009 | | | 2008 | |
| | | (expressed in thousands) | |
| Deferred Tax Asset: | | | | | | | | | |
| Accrued compensation and benefits | | $ | 8,509 | | | $ | 9,212 | | | $ | 7,887 | |
| Inventory reserves | | | 3,246 | | | | 3,621 | | | | 1,679 | |
| Allowance for doubtful accounts | | | 175 | | | | 132 | | | | 163 | |
| Intangible and other assets | | | 4,473 | | | | 3,100 | | | | 3,323 | |
| Net operating loss carryovers | | | 2,080 | | | | 2,093 | | | | 2,555 | |
| Unrealized derivative instrument losses | | | 634 | | | | 804 | | | | 82 | |
| Capital loss carryovers | | | - | | | | - | | | | - | |
| Research and development and foreign tax credits | | | 2,050 | | | | 1,187 | | | | 2,713 | |
| Total deferred tax asset before valuation allowance | | | 21,167 | | | | 20,149 | | | | 18,402 | |
| Less valuation allowance | | | (986 | ) | | | (987 | ) | | | (809 | ) |
| Total Deferred Tax Asset | | $ | 20,181 | | | $ | 19,162 | | | $ | 17,593 | |
| | | | | | | | | | | | | |
| Deferred Tax Liability: | | | | | | | | | | | | |
| Property and equipment | | $ | 10,026 | | | $ | 7,485 | | | $ | 4,193 | |
| Intangible Assets | | | - | | | | - | | | | 40 | |
| Foreign deferred revenue and other | | | 2,757 | | | | 2,133 | | | | 4,300 | |
| Total Deferred Tax Liability | | $ | 12,783 | | | $ | 9,618 | | | $ | 8,533 | |
| Net Deferred Tax Asset | | $ | 7,398 | | | $ | 9,544 | | | $ | 9,060 | |
As of October 2, 2010, the Company’s German, French, Italian, and Swedish subsidiaries had net operating loss carryovers of $2.5 million $1.8 million, $1.6 million and $0.7 million, respectively. These net operating loss carryovers will not expire under local tax law, except for Italy which has a five year limitation. The Company determined that the benefit of the German and Swedish subsidiaries net operating loss carryover of $2.5 million and $0.7 million, respectively are not likely to be realized. Accordingly, as of October 2, 2010, the Company had a full valuation allowance against each of the German and Swedish subsidiaries’ deferred tax assets in the amount of $0.8 million, and $0.2 million, respectively.
During fiscal year 2010, the Company repatriated $51.0 million of historic earnings from its German, Japanese, Korean and Canadian subsidiaries, a portion of which constituted previously taxed income. The Company recorded a $0.3 million tax benefit during fiscal year 2010 related to these repatriations. Also during fiscal year 2010, the Company was only allowed to recognize research and development credits on applicable spending during the first quarter, as the provision in the U.S. tax law allowing for these credits expired on December 31, 2009.
During fiscal year 2009, U.S. research and development tax credit legislation was extended with an effective date retroactive to January 1, 2008. This legislation allowed the Company to recognize $3.0 million of tax benefits in fiscal year 2009, partly due to tax credits available on applicable research and development spending by the Company during the last three fiscal quarters of fiscal year 2008 and partly due to a full year of credit for fiscal year 2009.
During fiscal year 2008, the Company repatriated $20.2 million of historic earnings from its Japanese subsidiaries. The Company recorded $3.5 million of net tax benefit during fiscal year 2008 related to these dividends. Also during fiscal year 2008, the Company was only allowed to recognize research and development credits on applicable spending during the first quarter, as the provision in the U.S. tax law allowing for these credits expired on December 31, 2007.
According to ASC 740-30, the Company has not recognized a deferred tax liability for the undistributed earnings of certain of its foreign operations because those subsidiaries have invested or will invest the undistributed earnings indefinitely. At October 2, 2010, undistributed earnings were approximately $68 million. It is impractical for the Company to determine the amount of unrecognized deferred tax liabilities on these indefinitely reinvested earnings. Deferred taxes are recorded for earnings of our foreign operations when the Company determines that such earnings are no longer indefinitely reinvested.
In the fiscal years ended October 2, 2010, October 3, 2009, September 27, 2008, the Company recognized tax (shortfalls)/benefits of ($1.2) million, ($0.5) million, and $1.3 million, respectively, related to the Company's equity compensation plans. These (shortfalls)/benefits were directly allocated to Shareholders' Investment on the Consolidated Balance Sheet. Additionally, the deferred tax asset or liability related to the Company’s unrealized gain or loss associated with derivative instruments was directly allocated to Accumulated Other Comprehensive Income (Loss) within Shareholders’ Investment. The deferred tax asset associated with the defined benefit pension plan of one of the Company’s German subsidiaries was also directly allocated to Accumulated Other Comprehensive Income (Loss) within Shareholders’ Invest ment.
A summary of changes in the Company’s liability for unrecognized tax benefits for the fiscal years ended October 2, 2010 and October 3, 2009 is as follows:
| | | 2010 | | | 2009 | |
| | | (expressed in thousands) | |
| Beginning balance | | $ | 3,591 | | | $ | 4,009 | |
| Increase (decrease) due to tax positions related to the current year | | | 1,274 | | | | (151 | ) |
| Decrease due to lapse of statute of limitations | | | (657 | ) | | | (267 | ) |
| Exchange rate change | | | (27 | ) | | | - | |
| Ending balance | | $ | 4,181 | | | $ | 3,591 | |
Included in the balance of unrecognized tax benefits at October 2, 2010 are potential benefits of $1.3 million that, if recognized, would favorably impact the effective tax rate on continuing operations.
At October 2, 2010 and October 3, 2009, the Company had accrued interest related to uncertain income tax positions of approximately $0.5 million and $0.7 million, respectively. At October 2, 2010 and October 3, 2009, no accrual for penalties related to uncertain tax positions existed. Interest and penalties related to uncertain tax positions are included in Interest Expense and General and Administrative Expense, respectively, on the Consolidated Statements of Income.
The Company is subject to U.S. federal income tax as well as income tax of numerous state and foreign jurisdictions. The Company is no longer subject to U.S. federal tax examinations for fiscal years before 2007 and with limited exceptions, state and foreign income tax examinations for fiscal years before 2006. The Company’s Japanese and French tax returns have been examined by the tax authorities through fiscal year 2006. The Company’s German tax returns have been examined by the tax authorities through fiscal year 2005. As of October 2, 2010, the Company does not expect significant changes in the amount of unrecognized tax benefits during the next twelve months.
The Company’s domestic entity and certain of its foreign subsidiaries are expected to receive income tax refunds within the next twelve months. As a result, the Company has recognized a current income tax receivable of $7.7 million at October 2, 2010, which is included in Prepaid Expenses and Other Current Assets on the Consolidated Balance Sheet.
9. Employee Benefit Plans:
Retirement Savings Plan
The Company offers a contributory retirement savings plan that has two components: (1) a 401(k) component with a Company match and (2) a fiscal year Company contribution.
The 401(k) component of the retirement savings plan allows eligible U.S. employees to contribute a portion of their pre-tax income to the plan each pay period. The Company matches 50% of employees’ pre-tax contributions (excluding “catch-up” contributions that employees age 50 or older may make to the plan), up to 6% of compensation, subject to limitations imposed by federal law. The Company’s matching contributions were $1.9 million, $2.2 million, and $2.2 million in fiscal years 2010, 2009, and 2008, respectively. Employees may also contribute a percentage of their salary to the plan on an after-tax basis.
The Company also provides an annual fiscal year contribution to the retirement plan for eligible U.S. employees. Employees who are active as of the end of the fiscal year and whom have been paid for 1,000 hours or more of service during a plan year are eligible for a fiscal year contribution. After three years as a participant, employees have a vested interest equal to 100% of the total Company fiscal year contributions. The plan provides for a minimum fiscal year contribution of 3% of participant compensation below the Social Security taxable wage base and 6% of participant compensation in excess of the Social Security taxable wage base, up to the maximum contribution allowed by federal law. The Company’s Board of Directors approves any changes to the contribution levels under the plan. The Company's fiscal year contributions under the plan totaled $2.4 million, $2.6 million, and $2.7 million in fiscal years 2010, 2009, and 2008, respectively.
Defined Benefit Pension Plan
One of the Company's German subsidiaries has a non-contributory, defined benefit retirement plan for eligible employees. This plan provides benefits based on the employee's years of service and compensation during the years immediately preceding retirement, termination, disability, or death, as defined in the plan. The Company uses a September 30 measurement date for this defined benefit retirement plan.
During the fiscal year ended October 2, 2010, the Company adopted the disclosure provisions of FASB issued FSP FAS 132R-1, “Employers’ Disclosures about Postretirement Benefit Plan Assets” as codified by ASC 715-20-50. This standard requires additional disclosures regarding defined benefit pension plan assets, including categorization of plan assets within a three level fair value hierarchy as described in Note 6 to the Consolidated Financial Statements.
During the fiscal year ended October 3, 2009, the Company initiated workforce reduction actions, in order to align the Company’s operating cost structure with changing market conditions. These actions resulted in both voluntary and involuntary terminations of German employees who are eligible to receive future benefits under the German defined benefit pension plan. The voluntary termination actions were executed under early retirement plan arrangements which provide, among other benefits, special termination benefits involving the Company’s funding of the defined benefit pension plan for future service periods in effect throughout the contractual term of each early retirement arrangement. During the fiscal year ended October 3, 2009, the Company recognized costs of $0.3 million associated with these special termination benefit s. The special termination benefits are to be paid directly from the Company’s assets throughout the contractual terms of the arrangements, the lengths of which range from approximately 1.0 to 5.5 years. See Note 10 to the Consolidated Financial Statements for additional information regarding the Company’s cost reduction actions that were initiated during the fiscal year ended October 3, 2009.
The Company recognizes the funded status of the defined benefit pension in its statement of financial position, recognizes changes in that funded status in the year in which the changes occur through comprehensive income, and measures the plan’s assets and its obligations that determine its funded status as of the end of the Company’s fiscal year.
The pretax amount recognized in Accumulated Other Comprehensive Income as of October 2, 2010 and October 3, 2009 consists of the following:
| | | 2010 | | | 2009 | |
| | | (expressed in thousands) | |
| Actuarial net loss | | $ | 3,337 | | | $ | 1,750 | |
The portion of the pretax amount in Accumulated Other Comprehensive Income at October 3, 2009 that was recognized during the fiscal year ended October 2, 2010 was less than $0.1 million. The portion of the pretax amount in Accumulated Other Comprehensive Income at October 2, 2010 that is expected to be recognized as a component of net periodic retirement cost during the next fiscal year is $0.1 million.
The following is a summary of the changes in benefit obligations and plan assets during the fiscal years ended October 2, 2010 and October 3, 2009:
| | | 2010 | | | 2009 | |
| | | (expressed in thousands) | |
| Change in benefit obligation: | | | | | | |
| Projected benefit obligation, beginning of year | | $ | 15,593 | | | $ | 13,020 | |
| Service cost | | | 349 | | | | 400 | |
| Interest cost | | | 784 | | | | 764 | |
| Actuarial loss | | | 1,331 | | | | 1,283 | |
| Exchange rate change | | | (829 | ) | | | 167 | |
| Benefits paid | | | (343 | ) | | | (303 | ) |
| Special termination benefits | | | - | | | | 262 | |
| Projected benefit obligation, end of year | | $ | 16,885 | | | $ | 15,593 | |
| | | | | | | | | |
| Change in plan assets: | | | | | | | | |
| Fair value of plan assets, beginning of year | | $ | 13,676 | | | $ | 12,775 | |
| Actual return on plan assets | | | 444 | | | | 695 | |
| Employer contributions | | | 343 | | | | 488 | |
| Exchange rate change | | | (786 | ) | | | 21 | |
| Benefits paid | | | (343 | ) | | | (303 | ) |
| Fair value of plan assets, end of year | | $ | 13,334 | | | $ | 13,676 | |
The following is a summary of the funded status of the defined benefit retirement plan and amounts recognized in the Company’s Consolidated Balance Sheets at October 2, 2010 and October 3, 2009:
| | | 2010 | | | 2009 | |
| | | (expressed in thousands) | |
| Funded status: | | | | | | |
| Funded status, end of year | | $ | (3,551 | ) | | $ | (1,917 | ) |
| Accumulated other comprehensive loss | | | 3,337 | | | | 1,750 | |
| Net amount recognized | | $ | (214 | ) | | $ | (167 | ) |
| | | | | | | | | |
| Amounts recognized in consolidated balance sheets: | | | | | | | | |
| Accrued payroll and related costs | | $ | (471 | ) | | $ | - | |
| Pension benefit plan | | | (3,080 | ) | | | (1,917 | ) |
| Deferred income taxes | | | 1,007 | | | | 528 | |
| Accumulated other comprehensive income, net of tax | | | 2,330 | | | | 1,222 | |
| Net amount recognized | | $ | (214 | ) | | $ | (167 | ) |
The weighted average assumptions used to determine the defined benefit retirement plan obligation at October 2, 2010 and October 3, 2009, and also the net periodic benefit cost for the following fiscal year, were as follows:
| | | 2010 | | | 2009 | |
| Discount rate | | | 4.7 | % | | | 5.5 | % |
| Expected rate of return on plan assets | | | 5.2 | % | | | 5.9 | % |
| Expected rate of increase in future compensation levels | | | 2.7 | % | | | 3.0 | % |
The discount rate is calculated based on zero-coupon bond yields published by the Deutsche Bundesbank for maturities that match the weighted average duration of the pension liability, adjusted for the average credit spread of corporate bond rates above the government bond yields.
The expected rate of return on plan assets represents the weighted average of the expected returns on individual asset categories in the portfolio. The Company uses investment services to assist with determining the overall expected rate of return on pension plan assets. Factors considered in the determination include historical long-term investment performance and estimates of future long-term returns by asset class.
The overall objective of the Company’s investment policy and strategy for the defined benefit retirement plan is to maintain sufficient liquidity to pay benefits and minimize the volatility of returns while earning the highest possible rate of return over time to satisfy the benefit obligations. The plan fiduciaries assist the Company with setting the long-term strategic investment objectives for the defined benefit retirement plan assets. The objectives include preserving the funded status of the trust and balancing risk and return. Investment performance and plan asset mix are reviewed periodically.
Plan assets are currently invested in a single mutual fund, the underlying assets of which are allocated to fixed income, equity, cash and cash equivalents, and other investment categories (see table below). Any decisions to change the asset allocation are made by the plan fiduciaries. However, investment into equity securities is limited to a maximum of 40% of total plan assets while investment into fixed income securities is not limited.
The actual defined benefit retirement plan asset allocations within the balanced mutual fund at October 2, 2010 and October 3, 2009 are as follows:
| | | Percentage of Plan Assets | |
| | | 2010 | | | 2009 | |
Fixed income securities(1) | | | 76.5 | % | | | 71.0 | % |
Equity securities(2) | | | 17.5 | % | | | 19.3 | % |
| Cash and cash equivalents | | | 1.8 | % | | | 2.3 | % |
Other(3) | | | 4.2 | % | | | 7.4 | % |
| | | | 100.0 | % | | | 100.0 | % |
| | (1) | Fixed income securities are comprised primarily of international government agency and international corporate bonds with investment grade ratings. |
| | (2) | Equity securities consist of an international mutual fund that invests solely in international stocks that are actively traded on international exchanges. |
| | (3) | Other asset holdings are comprised primarily of international bond futures and a derivatives-based mutual fund that invests in various assets. |
As of October 2, 2010, the defined benefit retirement plan assets subject to fair value measurements are as follows:
| | | Level 1 | | | Level 2 | | | Level 3 | | | Total | |
| | | (expressed in thousands) | |
Mutual fund(1) | | $ | - | | | $ | 13,334 | | | $ | - | | | $ | 13,334 | |
| | (1) | The fair value of the mutual fund is generally valued based on closing prices from national exchanges, if the underlying securities are traded on an active market, or fixed income pricing models that use observable market inputs. |
Net periodic benefit cost for the Company’s defined benefit retirement plan for the fiscal years ended October 2, 2010, October 3, 2009, and September 27, 2008 included the following components:
| | | 2010 | | | 2009 | | | 2008 | |
| | | (expressed in thousands) | | | | |
| Service cost | | $ | 349 | | | $ | 400 | | | $ | 551 | |
| Interest cost | | | 784 | | | | 764 | | | | 740 | |
| Expected return on plan assets | | | (748 | ) | | | (702 | ) | | | (44 | ) |
| Net amortization and deferral | | | 16 | | | | 14 | | | | 35 | |
| Special termination benefits | | | - | | | | 262 | | | | - | |
| Net periodic benefit cost | | $ | 401 | | | $ | 738 | | | $ | 1,282 | |
The accumulated benefit obligation of the Company’s defined benefit retirement plan as of October 2, 2010 and October 3, 2009 was $15.6 million and $14.4 million, respectively.
The future pension benefit payments, which reflect expected future service, for the next five fiscal years, and the combined five fiscal years thereafter, are as follows:
| Future Benefit payments: | | | |
| | | Pension | |
| Fiscal Year | | Benefits | |
| | | (expressed in thousands) | |
| 2011 | | $ | 471 | |
| 2012 | | | 588 | |
| 2013 | | | 654 | |
| 2014 | | | 708 | |
| 2015 | | | 758 | |
| 2016 through 2020 | | | 4,676 | |
| | | $ | 7,855 | |
Other Retirement Plans
Certain of the Company’s international subsidiaries have non-contributory, unfunded postretirement benefit plans that provide retirement benefits for eligible employees and managing directors. Generally, these postretirement plans provide benefits that accumulate based on years of service and compensation levels. As of October 2, 2010 and October 3, 2009, the aggregate liabilities associated with these postretirement benefit plans was $3.0 million and $2.5 million, respectively.
10. Severance Costs:
The Company initiated workforce reduction actions during each of the fiscal years ended October 2, 2010 and October 3, 2009, in order to align the Company’s operating cost structure with changing market conditions. As a result of these actions, the Company incurred severance and benefit costs totaling $1.6 million and $12.1 million during the fiscal years ended October 2, 2010 and October 3, 2009, respectively. Severance and benefit costs recognized during the fiscal year ended October 2, 2010 were associated entirely with the Test segment. For the fiscal year ended October 3, 2009, $10.9 million and $1.2 million of severance and benefits costs were reported in the Test and Sensors segments, respectively. At October 3, 2010, the remaining severance liability was $4.6 million, of which $2.6 million will be paid over the next twelve m onths.
The following table summarizes the severance charges included in the Company’s Consolidated Statement of Income for the fiscal years ended October 2, 2010 and October 3, 2009:
| | | 2010 | | | 2009 | |
| | | (expressed in thousands) | |
| Cost of sales | | $ | 1,391 | | | $ | 6,770 | |
| Selling and marketing | | | 100 | | | | 3,989 | |
| General and administrative | | | 133 | | | | 1,171 | |
| Research and development | | | - | | | | 155 | |
| Total severance costs | | $ | 1,624 | | | $ | 12,085 | |
11. Commitments and Contingencies:
Litigation: During the fiscal year ended October 2, 2010, the Company settled a legal claim for patent infringement of $7.5 million. Of the total settlement amount, $6.3 million and $1.2 million was expensed during the fiscal years ended October 2, 2010 and October 3, 2009, respectively.
The Company is subject to various claims, legal actions, and complaints arising in the ordinary course of business. Management believes the final resolution of legal matters outstanding as of October 2, 2010 will not have a material adverse effect on the consolidated financial position or results of operations of the Company. The Company expenses legal costs as incurred.
Leases: Total lease expense associated with continuing operations was $5.3 million, $5.9 million, and $5.4 million for fiscal years 2010, 2009, and 2008, respectively. The Company has operating lease commitments for equipment, land, and facilities that expire on various dates through 2056. Minimum annual rental commitments for the next five fiscal years and thereafter are as follows:
| Year | | Payments | |
| | | (expressed in thousands) | |
| 2011 | | $ | 4,563 | |
| 2012 | | | 3,224 | |
| 2013 | | | 1,941 | |
| 2014 | | | 855 | |
| 2015 | | | 636 | |
| Thereafter | | | 1,846 | |
| | | $ | 13,065 | |
12. Related Party Transactions:
During the fiscal years ended October 2, 2010, October 3, 2009 and September 27, 2008, MTS Sensors purchased mechanical components and remote-mechanic workbench services from Mark-Tronik GmbH (“Mark-Tronik”) aggregating approximately $1.5 million, $1.1 million and $1.6 million, respectively. MTS Sensors is owned by MTS Systems GmbH, a wholly-owned subsidiary of the Company. The owner and general manager of Mark-Tronik is a related party to a member of management of the Company. At October 2, 2010 and October 3, 2009, net outstanding payments due to Mark-Tronik by MTS Sensors were $0.1 million and less than $0.1 million, respectively.
During the fiscal year ended October 2, 2010 and October 3, 2009 the Company purchased legal services from Gray Plant Mooty Mooty and Bennett, P.A. (“GPM”) aggregating to approximately $0.3 million and $0.2 million, respectively. A shareholder of GPM is a related party to a member of management of the Company. At October 2, 2010 and October 3, 2009, net outstanding payments due to GPM by the Company were less than $0.1 million.
MTS SYSTEMS CORPORATION AND SUBSIDIARIES
SCHEDULE II - SUMMARY OF CONSOLIDATED ALLOWANCES
FOR DOUBTFUL ACCOUNTS
FOR THE FISCAL YEARS ENDED OCTOBER 2, 2010, OCTOBER 3, 2009,
AND SEPTEMBER 27, 2008
(expressed in thousands)
| | | Balance Beginning of Year | | | | | | Amounts Written-Off/ Payments | | | | |
| | | | | | | | | | | | | |
Allowance for Doubtful Accounts: | |
| | | | | | | | | | | | | |
| | $ | 1,410 | | | $ | 159 | | | $ | (211 | ) | | $ | 1,358 | |
| | | | | | | | | | | | | | | | | |
| | | 1,008 | | | | 755 | | | | (353 | ) | | | 1,410 | |
| | | | | | | | | | | | | | | | | |
| | | 1,518 | | | | (111 | ) | | | (399 | ) | | | 1,008 | |