 Earnings Presentation Second Quarter 2013 July 18, 2013 Exhibit 99.2 |
 Safe Harbor Statement 2 Statements in this presentation concerning the Company’s goals, strategies, and expectations for business and financial results may be "forward-looking statements" within the meaning of the Private Securities Litigation Reform Act of 1995 and are based on current indicators and expectations. Whenever you read a statement that is not simply a statement of historical fact (such as when we describe what we "believe," "expect," or "anticipate" will occur, and other similar statements), you must remember that our expectations may not be correct, even though we believe they are reasonable. We do not guarantee that the transactions and events described will happen as described (or that they will happen at all). You should review this presentation with the understanding that actual future results may be materially different from what we expect. Many of the factors that will determine these results are beyond our ability to control or predict. You are cautioned not to put undue reliance on any forward-looking statement. We do not intend, and undertake no obligation, to update these forward-looking statements. These statements involve a number of risks and uncertainties that could cause actual results to differ materially from those expressed or implied in the applicable statements. Such risks include: (1) Fluctuations in product demand and market acceptance (2) Uncertainties associated with the general economic conditions in domestic and international markets (3) Increased competition in our markets (4) Changes in seasonality (5) Difficulties in manufacturing operations, such as production outages or maintenance programs (6) Raw material availability (7) Fluctuations in raw material costs; fluctuations outside the “normal” range of industry cycles (8) Changes in laws and regulations and approvals and decisions of courts, regulators, and governmental bodies Myers Industries, Inc. encourages investors to learn more about these risk factors. A detailed explanation of these factors is available in the Company’s publicly filed quarterly and annual reports, which can be found online at www.myersind.com and at the SEC.gov web site. |
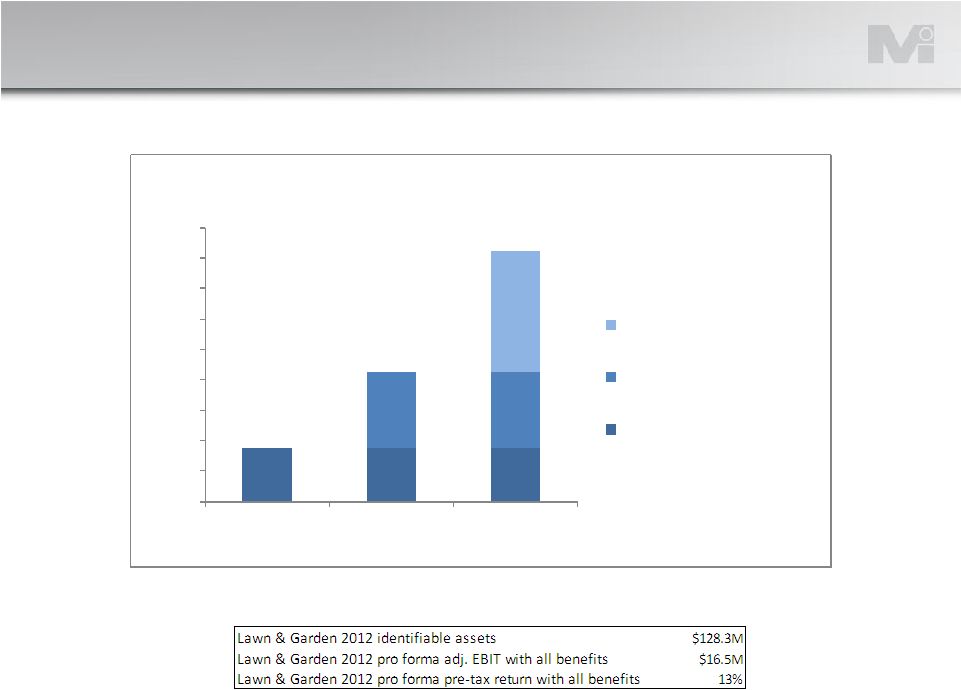 $3.5 $3.5 $3.5 $5.0 $5.0 $8.0 $- $2.0 $4.0 $6.0 $8.0 $10.0 $12.0 $14.0 $16.0 $18.0 2012 Adj. EBIT* 2012 Adj. EBIT* with Phase 1 2012 Adj. EBIT* with Phases 1&2 Lawn & Garden Pro Forma EBIT Phase 2 Benefits Phase 1 Benefits 2012 Adjusted Earnings Before Income Taxes (EBIT) Lawn & Garden Restructuring 3 $Millions *See 2012 Reconciliation of Non-GAAP Financial Measures on slide 12 |
 Q2 Q2 Highlights 2013 2012 B/(W) Net sales $204.0 $181.1 12.7% Gross margin 27.3% 26.2% 4.2% SG&A $42.7 $37.4 -14.1% Net income - adjusted* $8.4 $5.7 47.9% Effective tax rate 30.8% 36.7% EPS - adjusted* $0.25 $0.17 47.1% *See 2013 Reconciliation of Non-GAAP measures on slide 13 Second Quarter 2013 Financial Summary 4 • Net sales increased 12.7% • Material Handling sales increased 39% as a result of Novel and Jamco acquisitions and organic growth • Gross margin 27.3% compared to 26.2% in Q2 2012 • Productivity improvements and material cost savings drove most of the increase Note: All figures except ratios and percents are $Millions |
   Second Quarter 2013 Financial Summary 5 Notes: All figures except ratios and percents are $Millions Free Cash Flow = Cash flow from Operations – Capital Expenditures Six Months Ended Six Months Ended Cash June 30, June 30, Highlights 2013 2012 Cash provided by operations $30.1 $7.9 Capital expenditures $10.2 $8.4 Free cash flow $19.9 ($0.5) Dividends $3.0 $5.0 Balance Sheet June 30, December 31, Highlights 2013 2012 Long-term debt $96.0 $92.8 Debt - net of cash $73.7 $88.9 Net Debt to total capital 23.9% 27.9% |
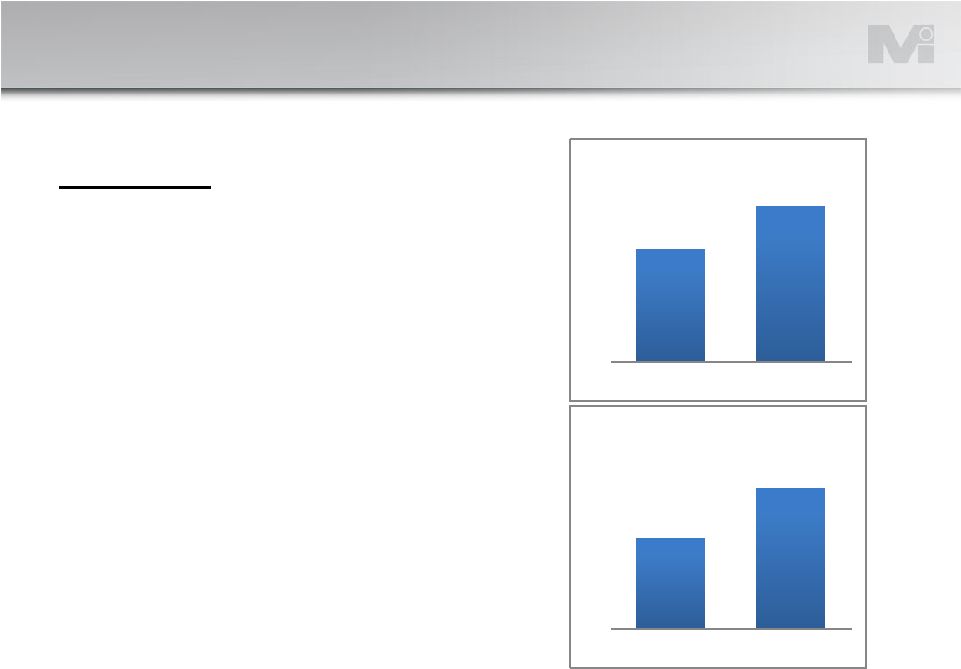 Q2 Results • Net sales increased 39% as a result of the Novel & Jamco acquisitions and organic growth • The increased sales led to the higher adjusted EBIT year-over-year Segment Review – Material Handling 6 $ Millions See 2013 Reconciliation of Non-GAAP measures on slide 13 $9.2 $11.0 $6 $9 $12 Q2 2012 Q2 2013 EBIT - Adjusted $60.3 $83.8 $0 $10 $20 $30 $40 $50 $60 $70 $80 $90 Q2 2012 Q2 2013 Net Sales |
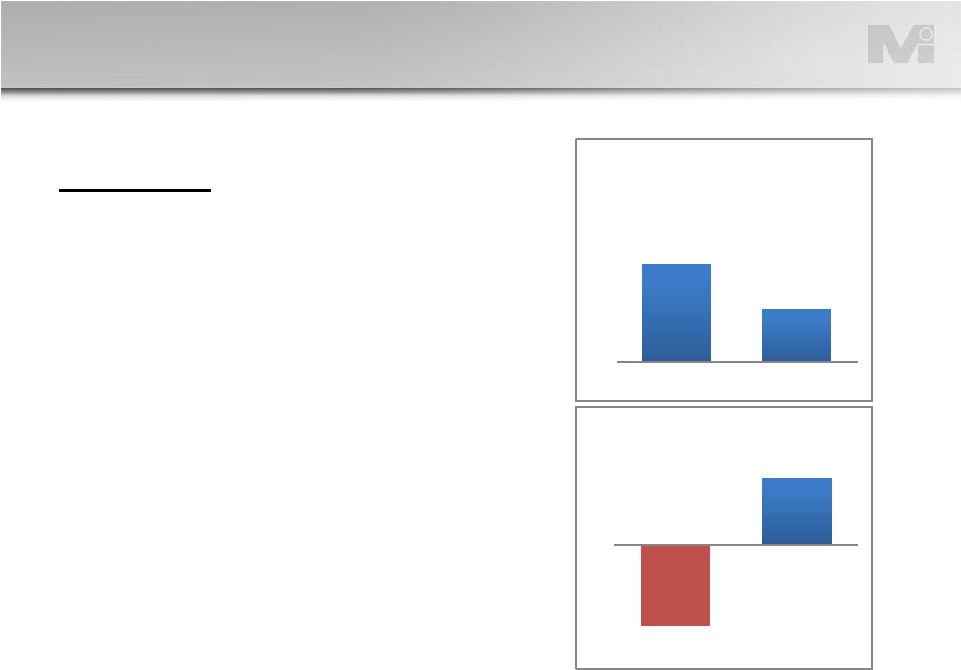 Q2 Results • Decreased volumes at the big box retailers contributed to the decline in sales • Productivity and material cost savings drove the significant increase in adjusted EBIT Segment Review – Lawn & Garden 7 $ Millions See 2013 Reconciliation of Non-GAAP measures on slide 13 $42.5 $40.9 $39 $42 $45 Q2 2012 Q2 2013 Net Sales $(1.5) $1.2 -$2 -$2 -$1 -$1 $0 $1 $1 $2 Q2 2012 Q2 2013 EBIT - Adjusted |
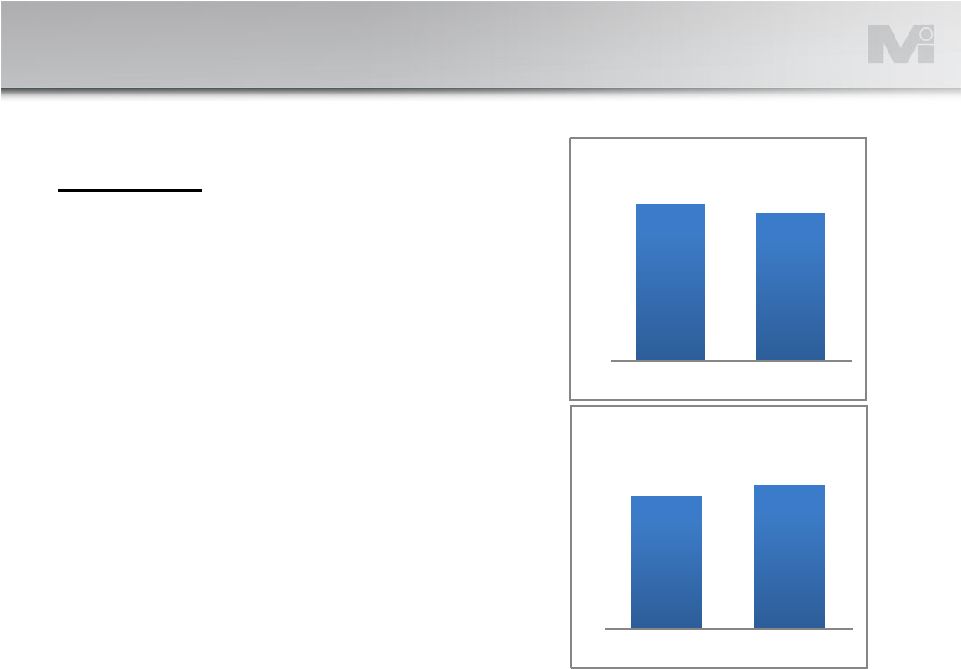
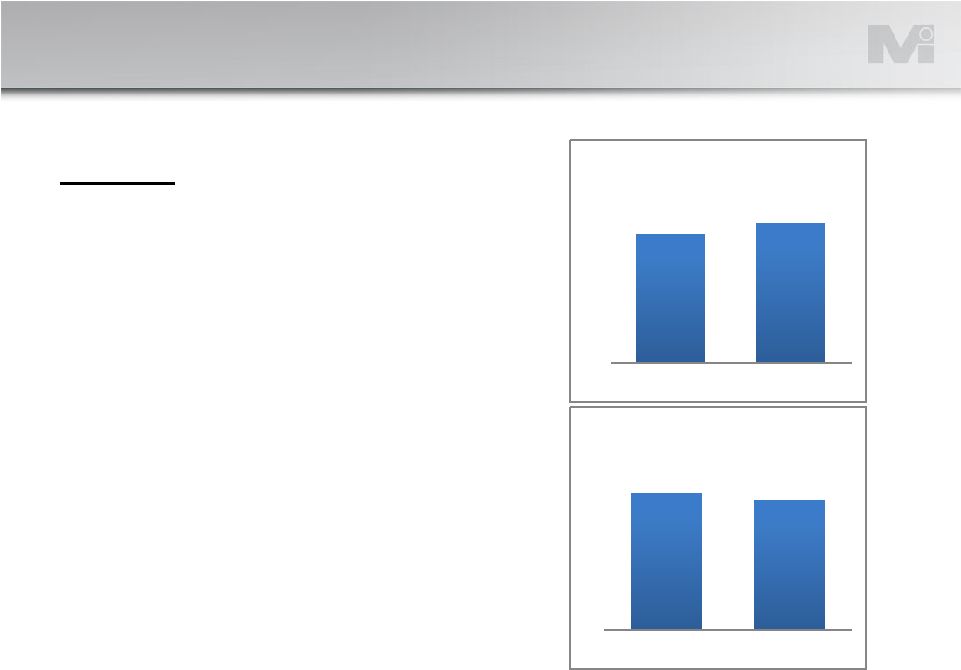 Q2 Results • New product and increased equipment sales leading to market share gains resulted in year-over- year sales improvement despite a continued slow replacement tire market • A less favorable product mix of equipment vs. supplies driven by the slow replacement tire market and planned IT expenses contributed to the decrease in adjusted EBIT Segment Review – Distribution 8 $ Millions See 2013 Reconciliation of Non-GAAP measures on slide 13 $44.2 $45.9 $25 $30 $35 $40 $45 $50 Q2 2012 Q2 2013 Net Sales $4.1 $3.9 $0 $5 Q2 2012 Q2 2013 EBIT - Adjusted |
 Q2 Results • Strong marine and RV sales during the quarter were offset by lower custom sales compared to last year • Productivity improvements and a favorable product mix more than offset the lower sales Segment Review – Engineered Products 9 $ Millions See 2013 Reconciliation of Non-GAAP measures on slide 13 $38.6 $37.6 $20 $25 $30 $35 $40 Q2 2012 Q2 2013 Net Sales $4.7 $5.1 $0 $1 $2 $3 $4 $5 $6 Q2 2012 Q2 2013 EBIT - Adjusted |
 Second Half 2013 Outlook Second Half Outlook • Material Handling • Second half results will benefit from the 2012 acquisitions and organic growth • Lawn & Garden • Expect results to continue to improve year-over-year driven by new products, cost reductions, material substitutions and restructuring projects • Distribution • Anticipate continued market share gains in a slow marketplace • Engineered Products • Expect strength in the marine and RV markets to continue • Overall expect improved results in second half driven by our recent acquisitions, organic growth, continued reinvestment in operations, cost savings and expected benefits from the Lawn & Garden Segment restructuring 10 |
 Appendix 11 |
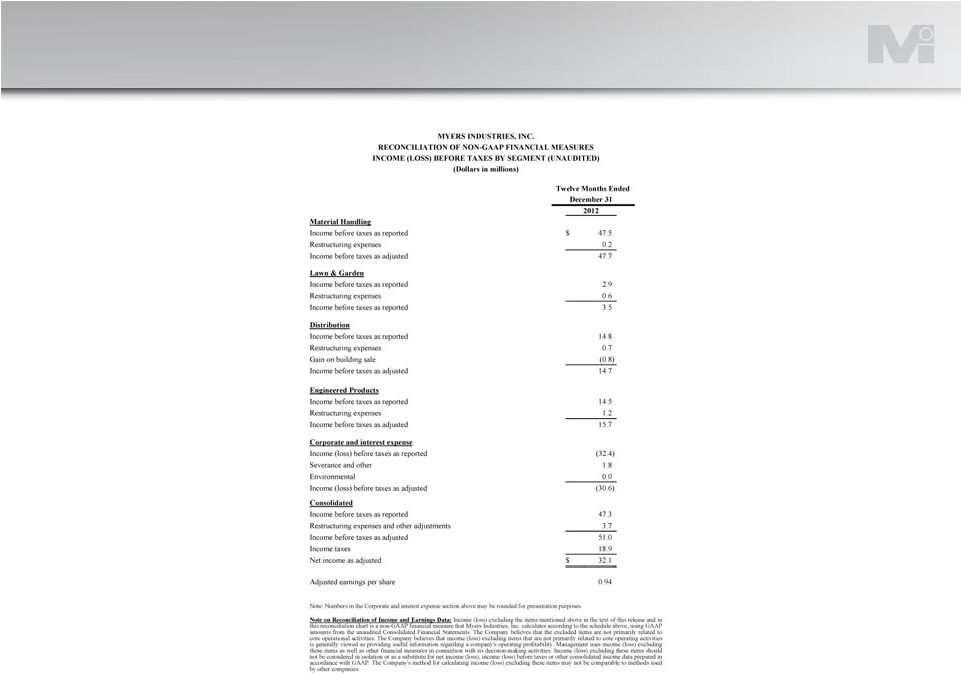 2012 Reconciliation of Non-GAAP Measures 12 |
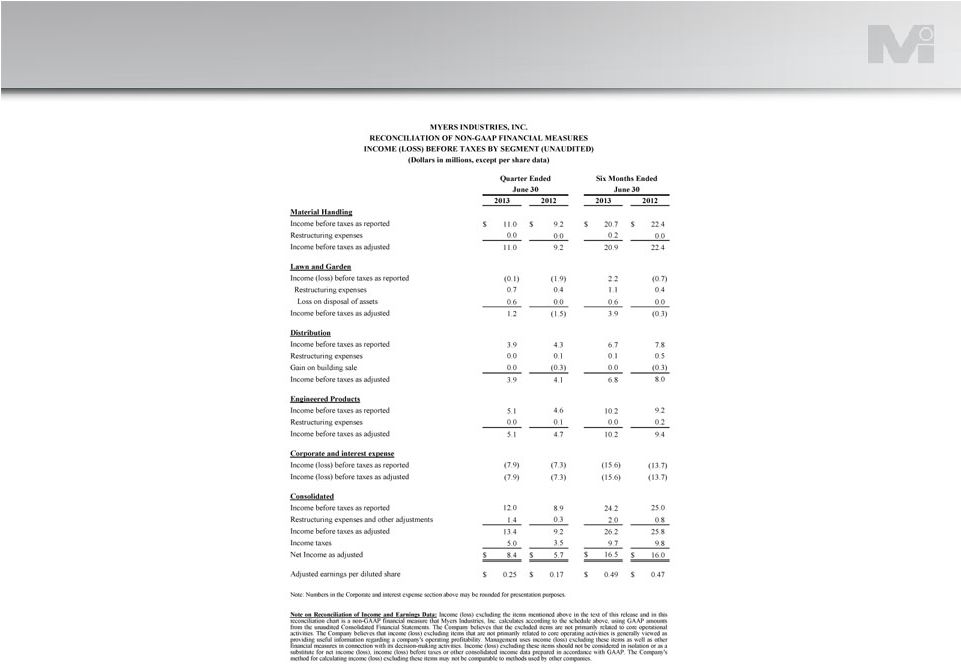 2013 Reconciliation of Non-GAAP Measures 13 |
 |
 |