 Earnings Presentation Third Quarter 2013 October 24, 2013 Exhibit 99.3 |
 Safe Harbor Statement 2 Statements in this presentation concerning the Company’s goals, strategies, and expectations for business and financial results may be "forward-looking statements" within the meaning of the Private Securities Litigation Reform Act of 1995 and are based on current indicators and expectations. Whenever you read a statement that is not simply a statement of historical fact (such as when we describe what we "believe," "expect," or "anticipate" will occur, and other similar statements), you must remember that our expectations may not be correct, even though we believe they are reasonable. We do not guarantee that the transactions and events described will happen as described (or that they will happen at all). You should review this presentation with the understanding that actual future results may be materially different from what we expect. Many of the factors that will determine these results are beyond our ability to control or predict. You are cautioned not to put undue reliance on any forward-looking statement. We do not intend, and undertake no obligation, to update these forward-looking statements. These statements involve a number of risks and uncertainties that could cause actual results to differ materially from those expressed or implied in the applicable statements. Such risks include: (1) Fluctuations in product demand and market acceptance (2) Uncertainties associated with the general economic conditions in domestic and international markets (3) Increased competition in our markets (4) Changes in seasonality (5) Difficulties in manufacturing operations, such as production outages or maintenance programs (6) Raw material availability (7) Fluctuations in raw material costs; fluctuations outside the “normal” range of industry cycles (8) Changes in laws and regulations and approvals and decisions of courts, regulators, and governmental bodies Myers Industries, Inc. encourages investors to learn more about these risk factors. A detailed explanation of these factors is available in the Company’s publicly filed quarterly and annual reports, which can be found online at www.myersind.com and at the SEC.gov web site. |
 Private Placement of Debt • Note purchase agreement for private placement of notes totaling $100M signed October 22, 2013 with a group of institutional investors • Senior unsecured notes will be funded in December 2013 and January 2014 in four series: • $40,000,000 4.67% Senior Notes, Series A, due January 15, 2021 • $11,000,000 5.25% Senior Notes, Series B, due January 15, 2024 • $29,000,000 5.30% Senior Notes, Series C, due January 15, 2024 • $20,000,000 5.45% Senior Notes, Series D, due January 15, 2026 • Proceeds will be used to repay existing debt and grow our five key business platforms: • Returnable packaging • Storage and safety products • Tire repair and retread products • Specialty molding • Distribution 3 |
 Highlights • Agreement for $100M of private placement notes providing financial flexibility for funding growth and repaying debt • Q3 net sales decline of 1.2% due to a number of small market factors • Adjusted EPS of $0.25 vs. $0.20 in Q3 2012, a 25% increase • Earnings benefited from productivity gains, cost savings and phase one of the Lawn and Garden Segment restructuring • Year to date strong free cash flow gains 4 |
 Third Quarter 2013 Financial Summary 5 • Net sales declined 1.2% due to a number of factors including: • Poor tomato crop that impacted the Material Handling Segment food processing sales • Delay in orders to Q4 in the Lawn & Garden Segment • Focus on more profitable business in the Engineered Products Segment • Gross profit margin 27.5% compared to 26.7% in Q3 2012 • Productivity improvements and material cost savings drove most of the improvement Note: All figures except ratios and percents are $Millions Q3 Q3 Highlights 2013 2012 B/(W) Net sales $194.9 $197.3 (1.2%) Gross profit margin 27.5% 26.7% 3.0% SG&A $41.6 $43.0 3.2% Net income - adjusted* $8.4 $6.8 24.4% Effective tax rate 40.8% 32.4% EPS - adjusted* $0.25 $0.20 25.0% *See 2013 Reconciliation of Non-GAAP measures on slide 13 |
  Nine Months Ended Nine Months Ended Cash September 30, September 30, Highlights 2013 2012 Cash provided by operations $46.8 $23.3 Capital expenditures $20.0 $15.2 Free cash flow $26.8 $8.1 Dividends $6.0 $7.6 Balance Sheet September 30, December 31, Highlights 2013 2012 Long-term debt $75.5 $92.8 Debt - net of cash $68.5 $88.9 Net Debt to total capital 22.2% 27.9% Third Quarter 2013 Financial Summary 6 Notes: All figures except ratios and percents are $Millions Free cash flow = cash flow provided by operations – capital expenditures |
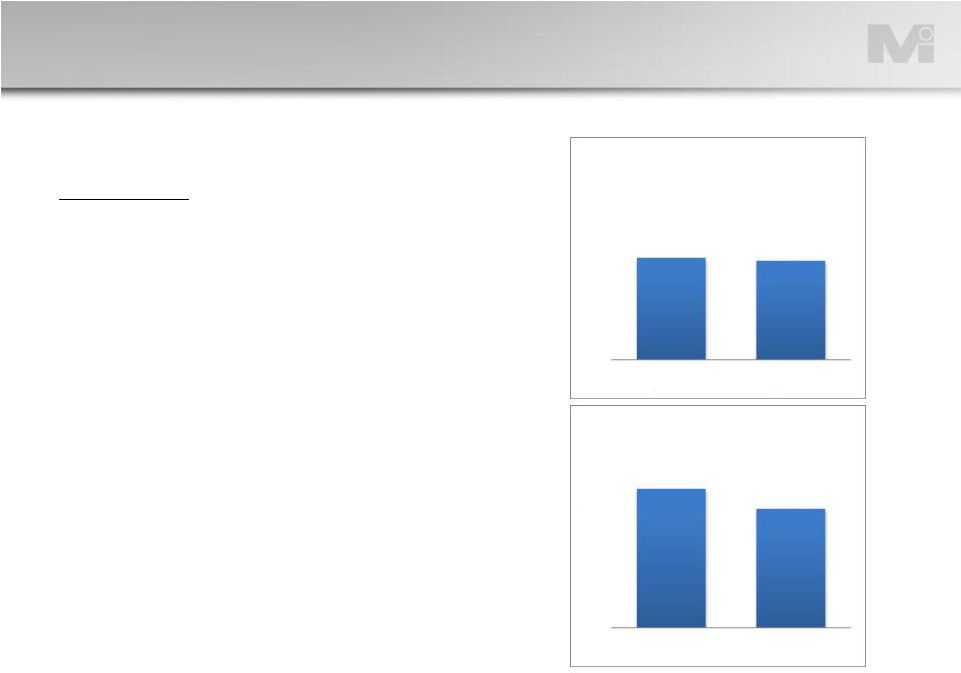 Q3 Results • Incremental sales from the Jamco acquisition were more than offset by a sales decrease that was driven by lower than anticipated food processing sales • The lower sales volume and a less favorable product mix led to a decline in adjusted EBIT year-over-year Segment Review – Material Handling 7 $ Millions See 2013 Reconciliation of Non-GAAP measures on slide 13 $80 $75 $70 Q3 2012 Q3 2013 $76.0 $76.2 Net Sales EBIT - Adjusted $15 $10 $5 $0 Q3 2012 Q3 2013 $12.5 $10.7 |
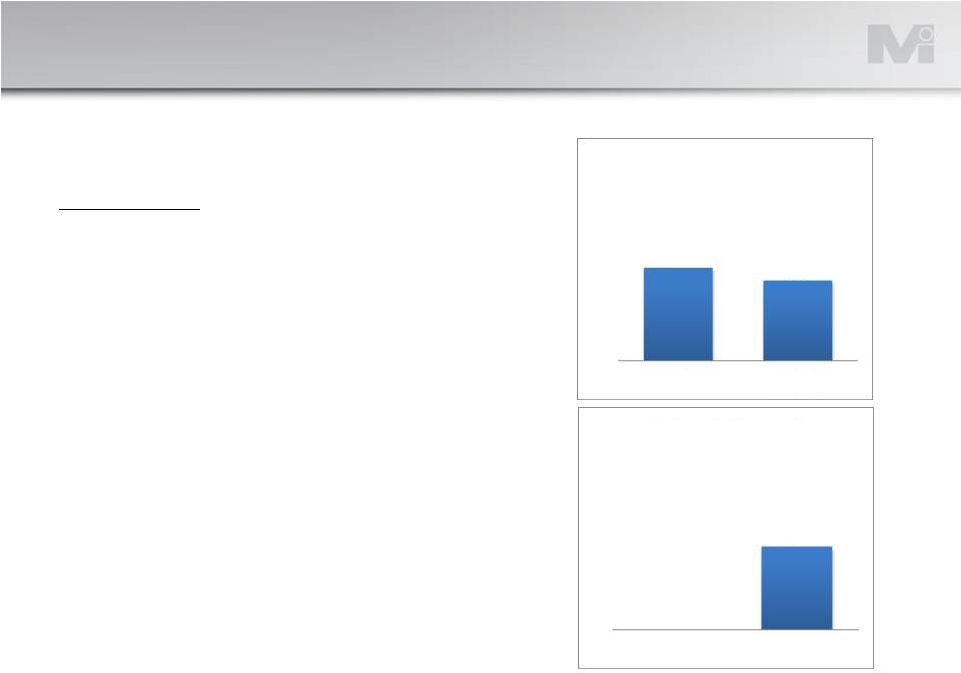 Q3 Results • A delay in customer orders to the fourth quarter resulted in lower sales as compared to last year • Phase one restructuring savings in addition to productivity gains and material cost savings drove the significant increase in adjusted EBIT Segment Review – Lawn & Garden 8 $ Millions See 2013 Reconciliation of Non-GAAP measures on slide 13 Net Sales $45.3 $44.9 $42 $45 $48 Q3 2012 Q3 2013 $0.0 $2.5 $0 $5 Q3 2012 Q3 2013 EBIT - Adjusted |
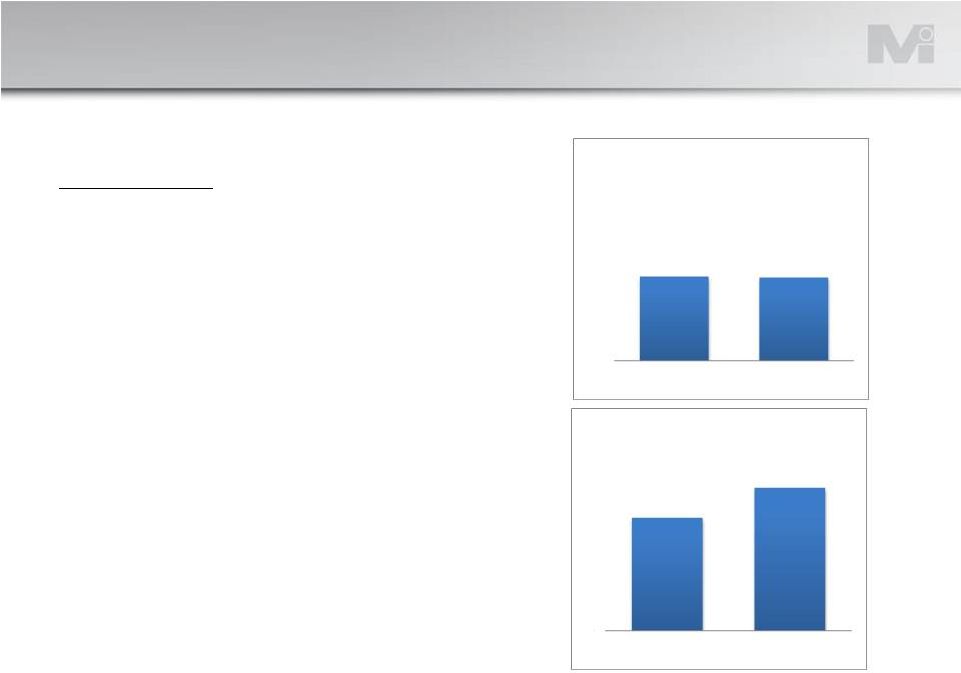 Q3 Results • New product sales offset lower international sales volumes during the quarter • A favorable product mix and lower SG&A expenses led to the increase in adjusted EBIT Segment Review – Distribution 9 $ Millions See 2013 Reconciliation of Non-GAAP measures on slide 13 $45.1 $45.0 $40 $45 $50 Q3 2012 Q3 2013 Net Sales $3.4 $4.3 $0 $5 Q3 2012 Q3 2013 EBIT - Adjusted |
 Q3 Results • Lower custom sales resulting from a focus on more profitable business led to the decline in sales • Productivity improvements and material cost savings substantially offset the lower sales Segment Review – Engineered Products 10 $ Millions See 2013 Reconciliation of Non-GAAP measures on slide 13 $30 $35 $40 $35.7 $33.8 Q3 2012 Q3 2013 Net Sales $0 $5 Q3 2012 Q3 2013 $3.7 $3.5 EBIT - Adjusted |
 Fourth Quarter 2013 Outlook Q4 Outlook • Material Handling • Anticipate that sales will be comparable to last year • Lawn & Garden • Sales of new products combined with normal seasonal orders should result in overall stronger sales • Productivity, material cost savings and phase one restructuring savings are expected to continue during the quarter • Distribution • Anticipate that new product and equipment sales will be strong • Engineered Products • Lower custom sales expected as part of focus on more profitable business • Focus on productivity improvements will continue • Overall expect improved results in the fourth quarter driven by sales of new products, productivity gains, material cost savings and expected benefits from the Lawn & Garden Segment restructuring 11 |
 Appendix 12 |
 2013 Reconciliation of Non-GAAP Measures 13 MYERS INDUSTRIES, INC. RECONCILIATION OF NON-GAAP FINANCIAL MEASURES INCOME (LOSS) BEFORE TAXES BY SEGMENT (UNAUDITED) (Dollars in millions, except per share data) Quarter Ended Nine Months Ended September 30 September 30 2013 2012 2013 2012 Material Handling Income before taxes as reported $ 10.7 $ 12.5 $ 31.4 $ 34.9 Restructuring expenses 0.0 0.0 0.2 0.0 Income before taxes as adjusted 10.7 12.5 31.6 34.9 Lawn and Garden Income (loss) before taxes as reported 0.1 0.0 2.3 (0.7) Restructuring expenses and other adjustments 1.1 0.0 2.3 0.5 Loss on disposal of assets 0.0 0.0 0.6 0.0 Depreciation recapture 1.3 0.0 1.3 0.0 Income (loss) before taxes as adjusted 2.5 0.0 6.5 (0.2) Distribution Income before taxes as reported 4.3 3.3 11.0 11.2 Restructuring expenses 0.0 0.2 0.1 0.7 Gain on building sale 0.0 (0.1) 0.0 (0.4) Income before taxes as adjusted 4.3 3.4 11.1 11.5 Engineered Products Income before taxes as reported 3.5 2.9 13.7 12.2 Restructuring expenses 0.0 0.8 0.0 1.0 Income before taxes as adjusted 3.5 3.7 13.7 13.2 Corporate and interest expense Income (loss) before taxes as reported (7.6) (10.1) (23.3) (24.0) Severance and other 0.0 1.5 0.0 1.5 Income (loss) before taxes as adjusted (7.6) (8.6) (23.3) (22.5) Consolidated Income before taxes as reported 11.0 8.6 35.1 33.6 Restructuring expenses and other adjustments 2.4 2.4 4.5 3.3 Income before taxes as adjusted 13.4 11.0 39.6 36.9 Income taxes 5.0 4.2 14.6 14.0 Net Income as adjusted $ 8.4 $ 6.8 $ 25.0 $ 22.9 Adjusted earnings per diluted share $ 0.25 $ 0.20 $ 0.73 $ 0.67 Note: Numbers in the Corporate and interest expense section above may be rounded for presentation purposes. Note on Reconciliation of Income and Earnings Data: reconciliation chart is a non-GAAP financial measure that Myers Industries, Inc. calculates according to the schedule above, using GAAP amounts from the unaudited Consolidated Financial Statements. The Company believes that the excluded items are not primarily related to core operational activities. The Company believes that income (loss) excluding items that are not primarily related to core operating activities is generally viewed as providing useful information regarding a company's operating profitability. Management uses income (loss) excluding these items as well as other financial measures in connection with its decision-making activities. Income (loss) excluding these items should not be considered in isolation or as a substitute for net income (loss), income (loss) before taxes or other consolidated income data prepared in accordance with GAAP. The Company's method for calculating income (loss) excluding these items may not be comparable to methods used by other companies. Income (loss) excluding the items mentioned above in the text of this release and in this |
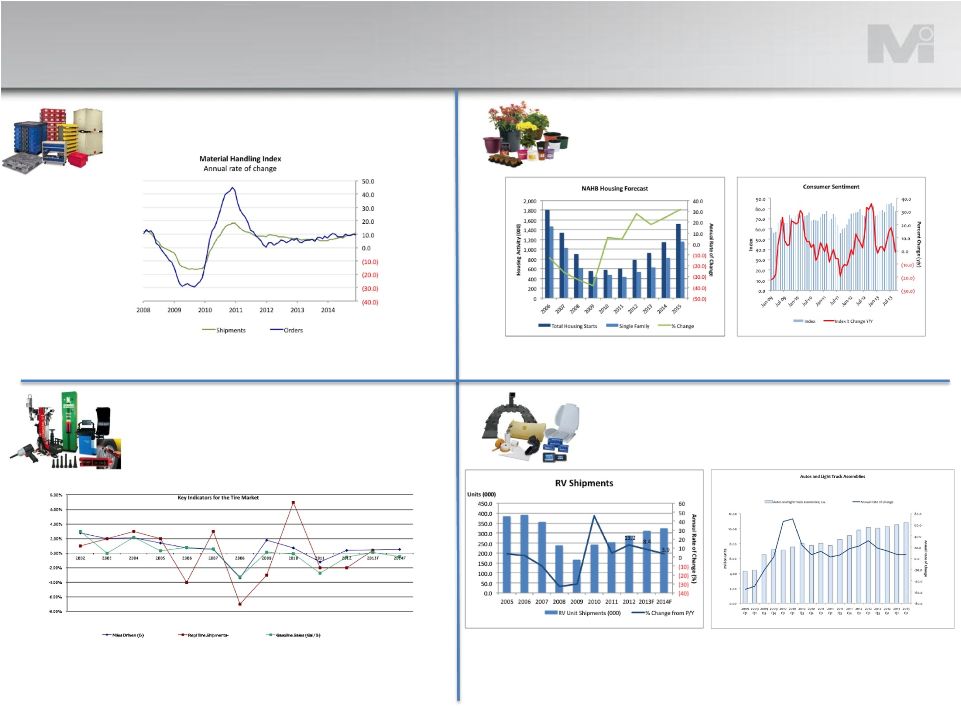 Market Indicators Material Handling MHEM Index Lawn & Garden Housing Starts Consumer Sentiment Distribution Miles Driven Replacement Tire Shipments, Gasoline Sales Engineered Products RVIA Auto Market Indicator Source: Material Handling Industry Aug 2013 Forecast Source: US Census and National Association of Home Builders (NAHB), September 2013; Thomson Reuters/University of Michigan, September 2013 Source: JP Morgan, RMA, Energy Information Administration Sources: RVIA Forecast, Oct 2013; FRB G17 Release, Sept 2013 14 |
 |