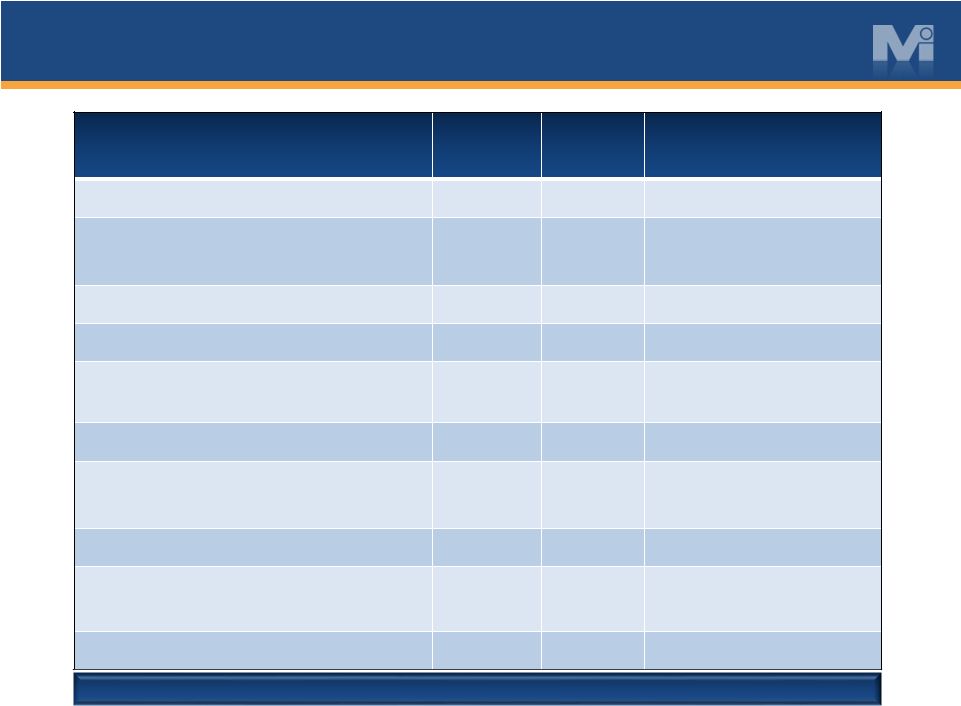
RECONCILIATION OF NON-GAAP MEASURES 12 MYERS INDUSTRIES, INC. RECONCILIATION OF NON-GAAP FINANCIAL MEASURES INCOME (LOSS) BEFORE TAXES BY SEGMENT (UNAUDITED) (Dollars in millions, except per share data) Note on Reconciliation of Income and Earnings Data: Income (loss) excluding the items above in the text of this presentation and in this reconciliation chart is a non-GAAP financial measure that Myers Industries, Inc. calculates according to the schedule above using GAAP amounts from the unaudited Condensed Consolidated Statement of Operations. The Company believes that the excluded items are not primarily related to core operational activities. The Company believes that income (loss) excluding items that are not primarily related to core operating activities is generally viewed as providing useful information regarding a company's operating profitability. Management uses income (loss) excluding these items as well as other financial measures in connection with its decision-making activities. Income (loss) excluding these items should not be considered in isolation or as a substitute for income (loss) prepared in accordance with GAAP. The Company's method for calculating income (loss) excluding these items may not be comparable to methods used by other companies. *Income taxes are calculated using the normalized effective tax rate for each year. The normalized rate used above is 36%. Quarter Ended June30, Six Months Ended June30, 2016 2015 2016 2015 Material Handling Operating income as reported $ 14,333 $ 20,846 $ 21,774 $ 34,253 Litigation reserve reversal - (3,010) - (3,010) Asset impairments 1,329 - 9,874 - Reduction to contingent liability (2,335) (2,335) Restructuring expenses and other adjustments - 449 - 540 Operating income as adjusted 13,327 18,285 29,313 31,783 Distribution Operating income as reported 3,966 4,508 6,502 7,999 Restructuring expenses and other adjustments - - - 53 Operating income as adjusted 3,966 4,508 6,502 8,052 Corporate Expense Corporate expense as reported (7,133) (5,612) (15,981) (15,794) CFO severance related costs - - 2,011 - Environmental reserve 1,550 - 1,550 - Professional, legal fees and other adjustments - - - 1,806 Corporate expense as adjusted (5,583) (5,612) (12,420) (13,988) Continuing Operations Operating income as reported 11,166 19,742 12,295 26,458 Total of all adjustments above 544 (2,561) 11,100 (611) Operating income as adjusted 11,710 17,181 23,395 25,847 Interest expense, net (2,053) (2,467) (4,072) (5,169) Income before taxes as adjusted 9,657 14,714 19,323 20,678 Income tax expense* (3,477) (5,253) (6,956) (7,382) Income from continuing operations as adjusted $ 6,180 $ 9,461 $ 12,367 $ 13,296 Adjusted earnings per diluted share from continuing operations $ 0.21 $ 0.30 $ 0.41 $ 0.42 |


