
MYERS INDUSTRIES, INC. Third Quarter 2019 Earnings Presentation 21 54 91 142 184 230 56 67 73 Font Color Exhibit 99.2
Safe Harbor Statement & Non-GAAP Measures Statements in this presentation include “forward-looking” statements within the meaning of the Private Securities Litigation Reform Act of 1995. Any statement that is not of historical fact may be deemed “forward-looking”. Words such as “expect”, “believe”, “project”, “plan”, “anticipate”, “intend”, “objective”, “outlook”, “target”, “goal”, “view” and similar expressions identify forward-looking statements. These statements are based on management's current views and assumptions of future events and financial performance and involve a number of risks and uncertainties, many outside of the Company's control that could cause actual results to materially differ from those expressed or implied. Risks and uncertainties include: raw material availability, increases in raw material costs, or other production costs; risks associated with our strategic growth initiatives or the failure to achieve the anticipated benefits of such initiatives; unanticipated downturn in business relationships with customers or their purchases; competitive pressures on sales and pricing; changes in the markets for the Company's business segments; changes in trends and demands in the markets in which the Company competes; operational problems at our manufacturing facilities, or unexpected failures at those facilities; future economic and financial conditions in the United States and around the world; inability of the Company to meet future capital requirements; claims, litigation and regulatory actions against the Company; changes in laws and regulations affecting the Company; and other risks as detailed in the Company's 10-K and other reports filed with the Securities and Exchange Commission. Such reports are available on the Securities and Exchange Commission's public reference facilities and its website at www.sec.gov and on the Company's Investor Relations section of its website at www.myersindustries.com. Myers Industries undertakes no obligation to publicly update or revise any forward-looking statements contained herein. These statements speak only as of the date made. The Company refers to certain non-GAAP financial measures throughout this presentation. Adjusted EPS, adjusted income per diluted share from continuing operations, adjusted operating income, adjusted gross profit, adjusted EBITDA and free cash flow are non-GAAP financial measures and are intended to serve as a supplement to results provided in accordance with accounting principles generally accepted in the United States. The Company believes that such information provides an additional measurement and consistent historical comparison of the Company’s performance. Reconciliations of the non-GAAP financial measures to the most directly comparable GAAP measures are available in the appendix of this presentation.

2019 Q3 Overview Challenges Achievements Completed acquisition of Tuffy Manufacturing Industries, Inc. in August 2019 for $18M Aligns with our strategy focused on growing in key niche markets Extends Myers Tire Supply ‘s position as a leader in the Commercial Fleet market Distribution Segment transformation continues to deliver results Sales increased year-over-year for fourth consecutive quarter Adjusted EBITDA margin increased to 9.5% Adjusted operating income increased by 7.9%, despite a 7.2% decline in net sales Generated free cash flow of $22.1M Recorded a $3.5M charge for estimated product replacement costs related to a manufacturing defect identified in a certain boxes produced within the Material Handling Segment Product was manufactured in May and June 2019 Sales declined across all end markets in the Material Handling Segment Food and Beverage market down due to lower seed box sales year-over-year Industrial end market down due to softer than anticipated demand for our military products Incremental sales from Hurricane Dorian were not enough to offset anticipated softer demand in our Consumer end market Continued lower sales to RV customers led to a year-over-year decline in our Vehicle end market Results reflect continuing operations. See appendix for non-GAAP reconciliations.
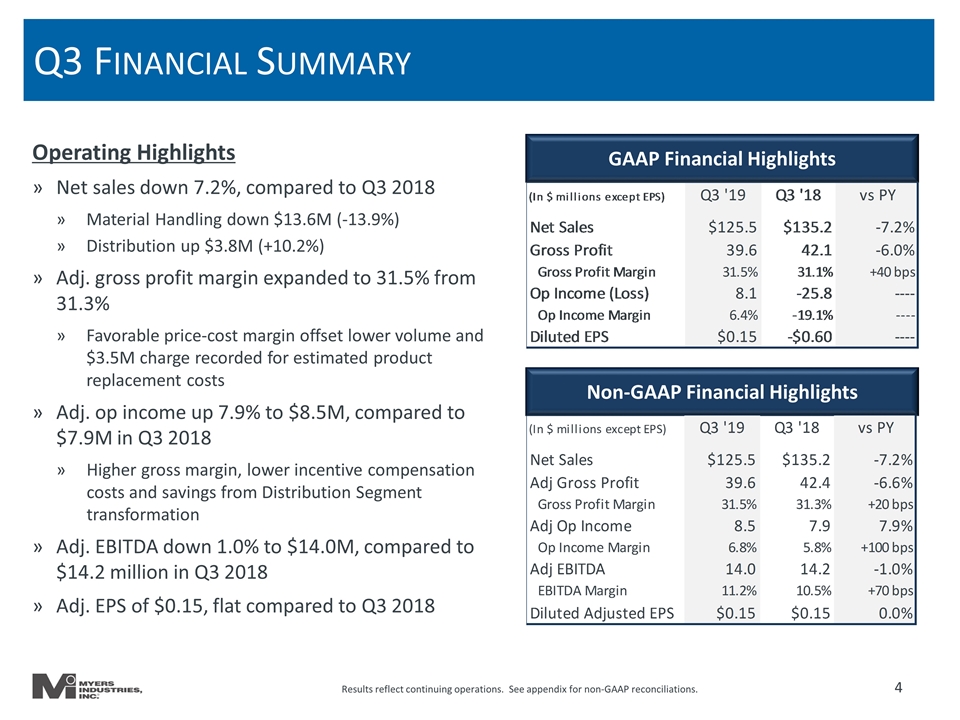
Q3 Financial Summary Operating Highlights Net sales down 7.2%, compared to Q3 2018 Material Handling down $13.6M (-13.9%) Distribution up $3.8M (+10.2%) Adj. gross profit margin expanded to 31.5% from 31.3% Favorable price-cost margin offset lower volume and $3.5M charge recorded for estimated product replacement costs Adj. op income up 7.9% to $8.5M, compared to $7.9M in Q3 2018 Higher gross margin, lower incentive compensation costs and savings from Distribution Segment transformation Adj. EBITDA down 1.0% to $14.0M, compared to $14.2 million in Q3 2018 Adj. EPS of $0.15, flat compared to Q3 2018 GAAP Financial Highlights Non-GAAP Financial Highlights Results reflect continuing operations. See appendix for non-GAAP reconciliations.
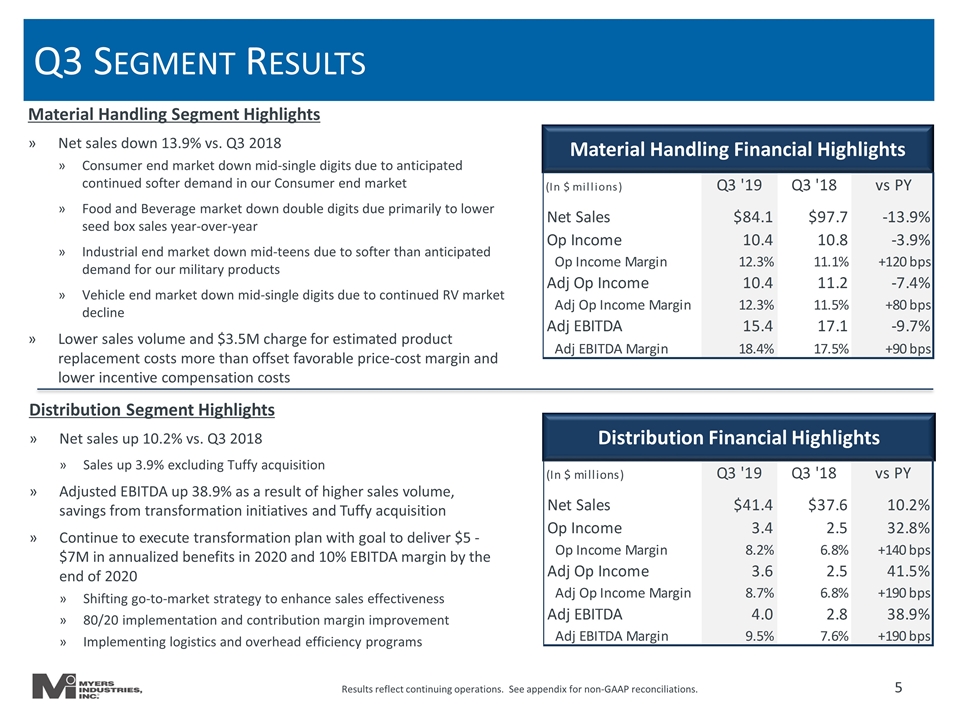
Q3 Segment Results Material Handling Segment Highlights Net sales down 13.9% vs. Q3 2018 Consumer end market down mid-single digits due to anticipated continued softer demand in our Consumer end market Food and Beverage market down double digits due primarily to lower seed box sales year-over-year Industrial end market down mid-teens due to softer than anticipated demand for our military products Vehicle end market down mid-single digits due to continued RV market decline Lower sales volume and $3.5M charge for estimated product replacement costs more than offset favorable price-cost margin and lower incentive compensation costs Material Handling Financial Highlights Distribution Financial Highlights Results reflect continuing operations. See appendix for non-GAAP reconciliations. Distribution Segment Highlights Net sales up 10.2% vs. Q3 2018 Sales up 3.9% excluding Tuffy acquisition Adjusted EBITDA up 38.9% as a result of higher sales volume, savings from transformation initiatives and Tuffy acquisition Continue to execute transformation plan with goal to deliver $5 - $7M in annualized benefits in 2020 and 10% EBITDA margin by the end of 2020 Shifting go-to-market strategy to enhance sales effectiveness 80/20 implementation and contribution margin improvement Implementing logistics and overhead efficiency programs
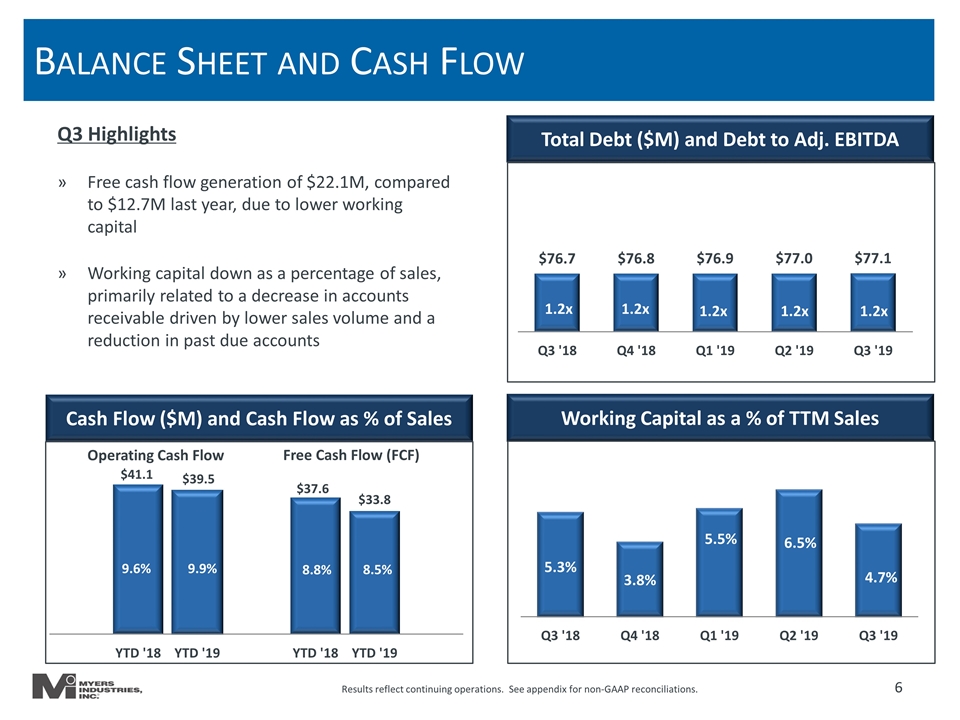
Working Capital as a % of TTM Sales Balance Sheet and Cash Flow Cash Flow ($M) and Cash Flow as % of Sales Total Debt ($M) and Debt to Adj. EBITDA Operating Cash Flow Free Cash Flow (FCF) 8.5% 8.8% 9.9% 9.6% 1.2x Q3 Highlights Free cash flow generation of $22.1M, compared to $12.7M last year, due to lower working capital Working capital down as a percentage of sales, primarily related to a decrease in accounts receivable driven by lower sales volume and a reduction in past due accounts Results reflect continuing operations. See appendix for non-GAAP reconciliations.
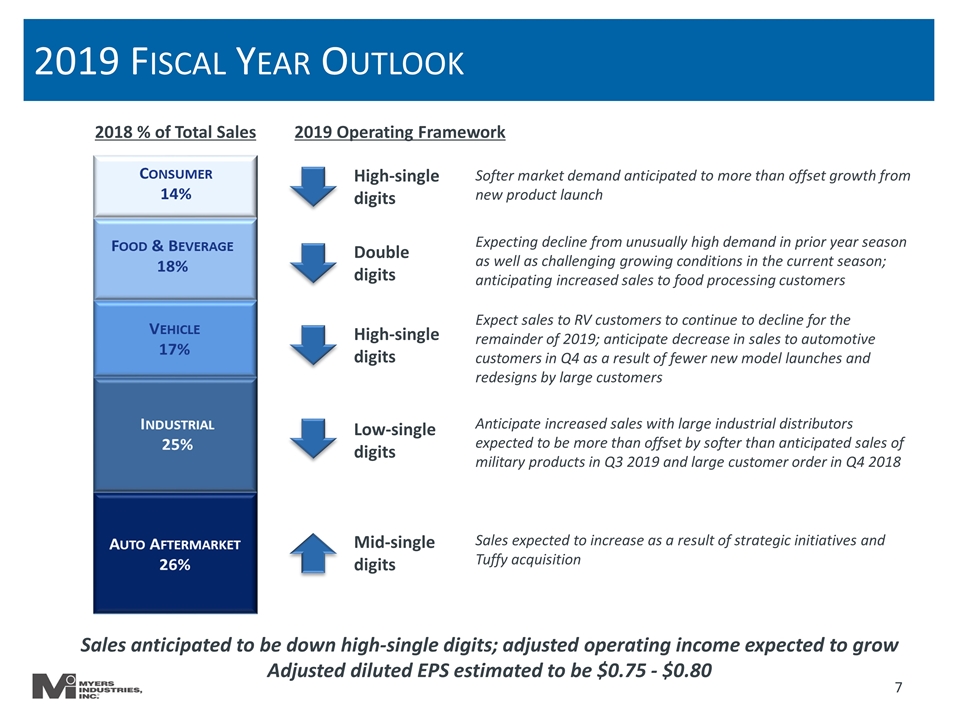
2018 % of Total Sales 2019 Operating Framework High-single digits Double digits High-single digits Low-single digits Mid-single digits Expecting decline from unusually high demand in prior year season as well as challenging growing conditions in the current season; anticipating increased sales to food processing customers Softer market demand anticipated to more than offset growth from new product launch Expect sales to RV customers to continue to decline for the remainder of 2019; anticipate decrease in sales to automotive customers in Q4 as a result of fewer new model launches and redesigns by large customers Anticipate increased sales with large industrial distributors expected to be more than offset by softer than anticipated sales of military products in Q3 2019 and large customer order in Q4 2018 Sales expected to increase as a result of strategic initiatives and Tuffy acquisition Auto Aftermarket 26% Industrial 25% Sales anticipated to be down high-single digits; adjusted operating income expected to grow Adjusted diluted EPS estimated to be $0.75 - $0.80 2019 Fiscal Year Outlook
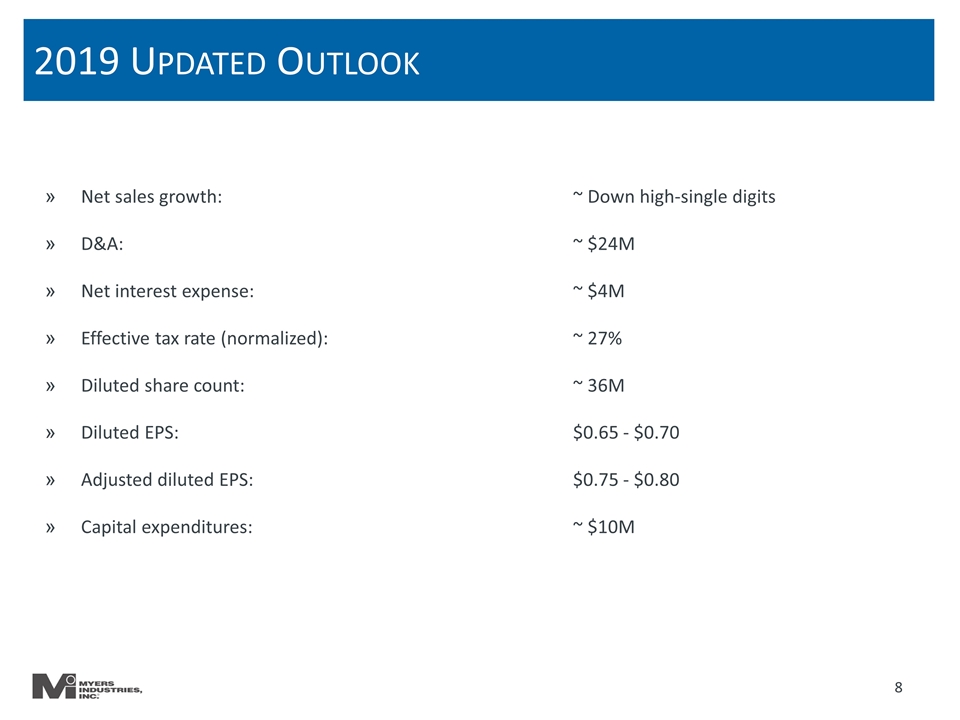
2019 Updated Outlook Net sales growth:~ Down high-single digits D&A: ~ $24M Net interest expense:~ $4M Effective tax rate (normalized):~ 27% Diluted share count:~ 36M Diluted EPS:$0.65 - $0.70 Adjusted diluted EPS: $0.75 - $0.80 Capital expenditures: ~ $10M

Appendix
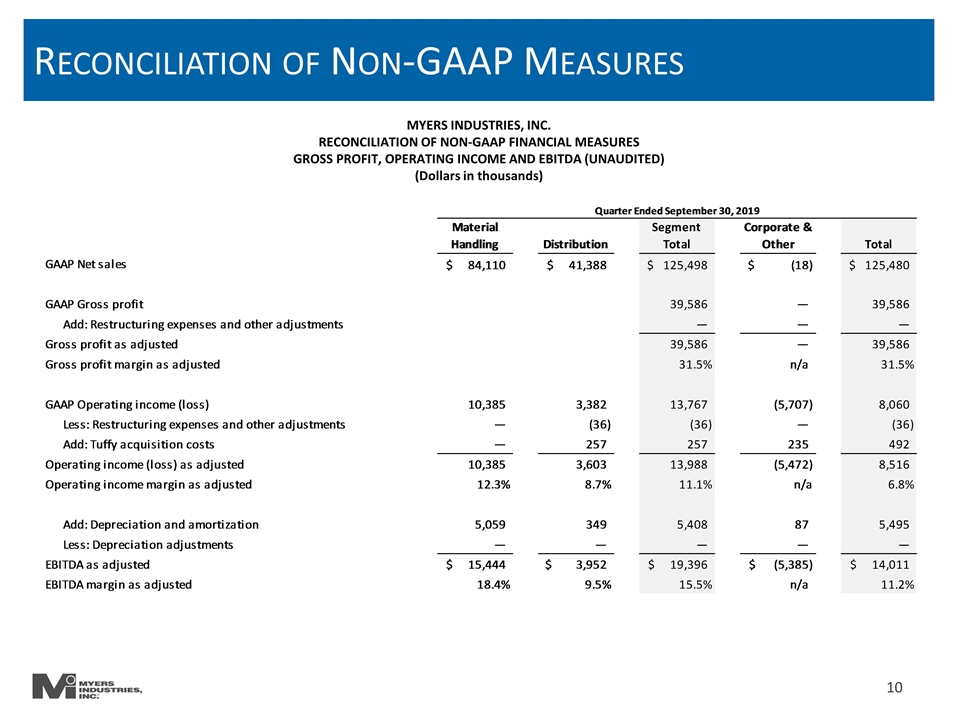
Reconciliation of Non-GAAP Measures MYERS INDUSTRIES, INC. RECONCILIATION OF NON-GAAP FINANCIAL MEASURES GROSS PROFIT, OPERATING INCOME AND EBITDA (UNAUDITED) (Dollars in thousands)
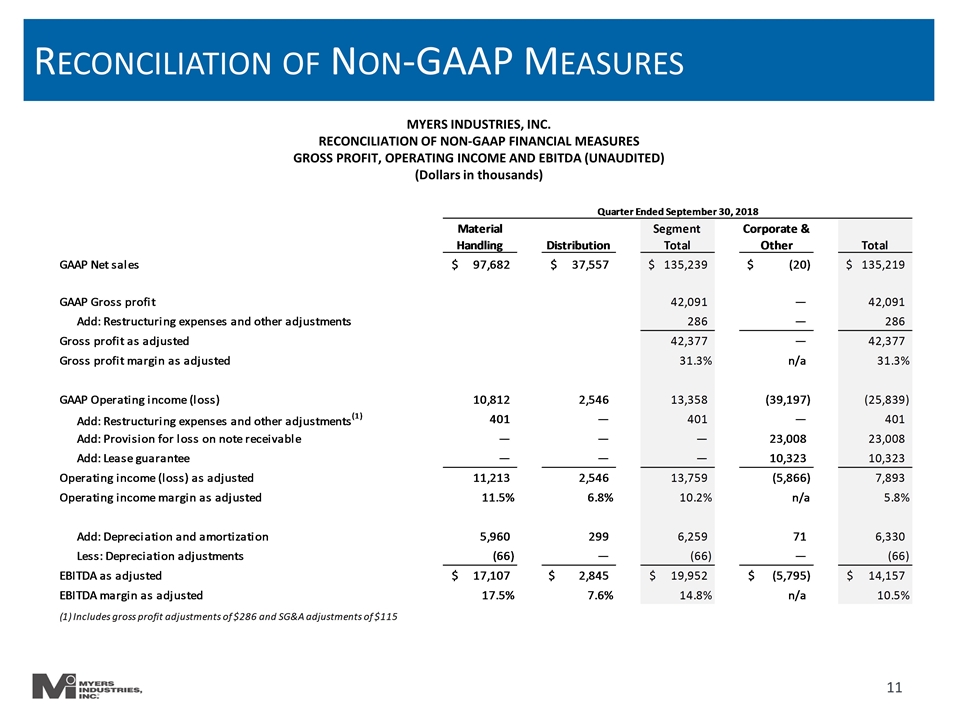
Reconciliation of Non-GAAP Measures MYERS INDUSTRIES, INC. RECONCILIATION OF NON-GAAP FINANCIAL MEASURES GROSS PROFIT, OPERATING INCOME AND EBITDA (UNAUDITED) (Dollars in thousands)
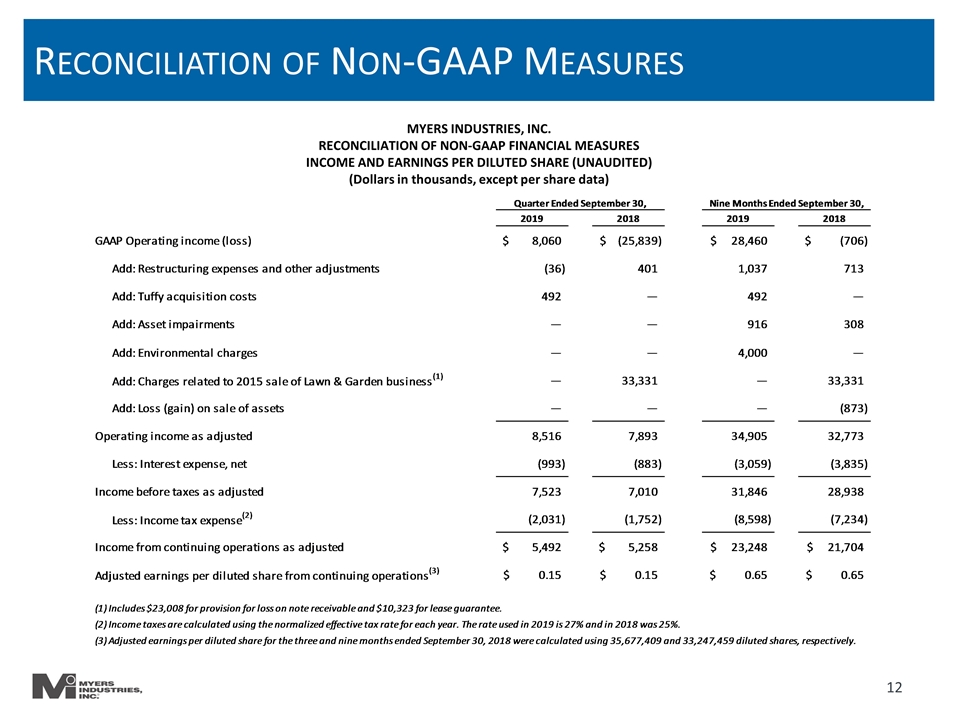
Reconciliation of Non-GAAP Measures MYERS INDUSTRIES, INC. RECONCILIATION OF NON-GAAP FINANCIAL MEASURES INCOME AND EARNINGS PER DILUTED SHARE (UNAUDITED) (Dollars in thousands, except per share data)
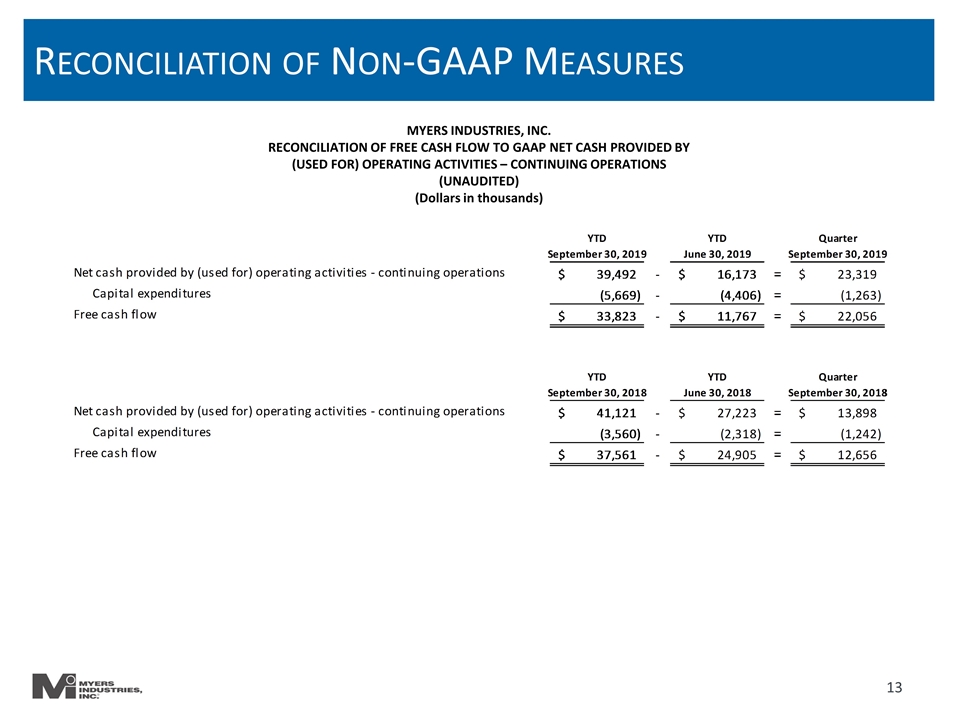
Reconciliation of Non-GAAP Measures MYERS INDUSTRIES, INC. RECONCILIATION OF FREE CASH FLOW TO GAAP NET CASH PROVIDED BY (USED FOR) OPERATING ACTIVITIES – CONTINUING OPERATIONS (UNAUDITED) (Dollars in thousands)
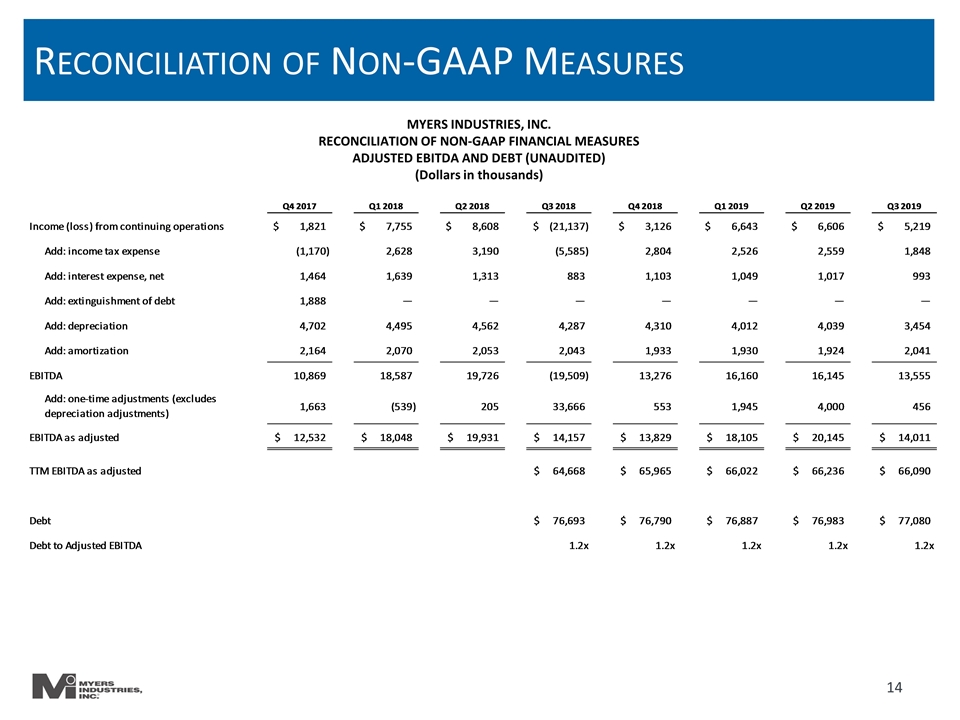
Reconciliation of Non-GAAP Measures MYERS INDUSTRIES, INC. RECONCILIATION OF NON-GAAP FINANCIAL MEASURES ADJUSTED EBITDA AND DEBT (UNAUDITED) (Dollars in thousands)
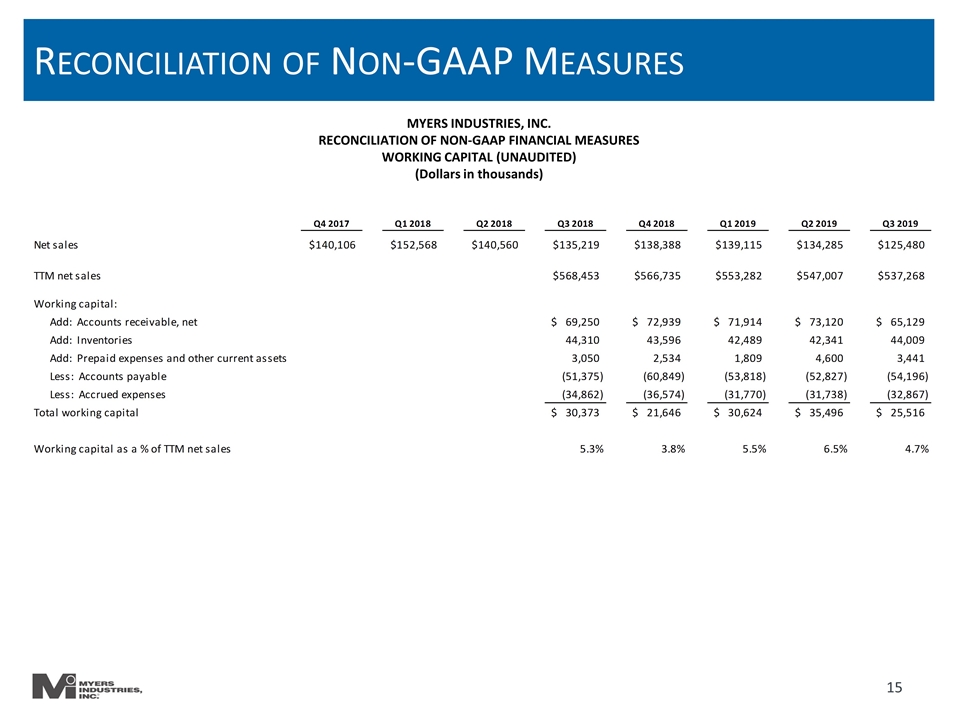
Reconciliation of Non-GAAP Measures MYERS INDUSTRIES, INC. RECONCILIATION OF NON-GAAP FINANCIAL MEASURES WORKING CAPITAL (UNAUDITED) (Dollars in thousands)
