UNITED STATES
SECURITIES AND EXCHANGE COMMISSION
WASHINGTON, D.C. 20549
FORM N-CSR
CERTIFIED SHAREHOLDER REPORT OF REGISTERED
MANAGEMENT INVESTMENT COMPANIES
Investment Company Act file number: 811-00134
AB GLOBAL RISK ALLOCATION FUND, INC.
(Exact name of registrant as specified in charter)
1345 Avenue of the Americas, New York, New York 10105
(Address of principal executive offices) (Zip code)
Joseph J. Mantineo
AllianceBernstein L.P.
1345 Avenue of the Americas
New York, New York 10105
(Name and address of agent for service)
Registrant’s telephone number, including area code: (800) 221-5672
Date of fiscal year end: November 30, 2017
Date of reporting period: November 30, 2017
| ITEM 1. | REPORTS TO STOCKHOLDERS. |
NOV 11.30.17
ANNUAL REPORT
AB GLOBAL RISK ALLOCATION FUND

| | |
| |
| Investment Products Offered | | • Are Not FDIC Insured • May Lose Value • Are Not Bank Guaranteed |
Investors should consider the investment objectives, risks, charges and expenses of the Fund carefully before investing. For copies of our prospectus or summary prospectus, which contain this and other information, visit us online at www.abfunds.com or contact your AB representative. Please read the prospectus and/or summary prospectus carefully before investing.
This shareholder report must be preceded or accompanied by the Fund’s prospectus for individuals who are not current shareholders of the Fund.
You may obtain a description of the Fund’s proxy voting policies and procedures, and information regarding how the Fund voted proxies relating to portfolio securities during the most recent 12-month period ended June 30, without charge. Simply visit AB’s website at www.abfunds.com, or go to the Securities and Exchange Commission’s (the “Commission”) website at www.sec.gov, or call AB at (800) 227 4618.
The Fund files its complete schedule of portfolio holdings with the Commission for the first and third quarters of each fiscal year on Form N-Q. The Fund’s Forms N-Q are available on the Commission’s website at www.sec.gov. The Fund’s Forms N-Q may also be reviewed and copied at the Commission’s Public Reference Room in Washington, DC; information on the operation of the Public Reference Room may be obtained by calling (800) SEC 0330. AB publishes full portfolio holdings for the Fund monthly at www.abfunds.com.
AllianceBernstein Investments, Inc. (ABI) is the distributor of the AB family of mutual funds. ABI is a member of FINRA and is an affiliate of AllianceBernstein L.P., the Adviser of the funds.
The [A/B] logo is a registered service mark of AllianceBernstein and AllianceBernstein® is a registered service mark used by permission of the owner, AllianceBernstein L.P.
| | |
| FROM THE PRESIDENT | |  |
Dear Shareholder,
We are pleased to provide this report for AB Global Risk Allocation Fund (the “Fund”). Please review the discussion of Fund performance, the market conditions during the reporting period and the Fund’s investment strategy.
As always, AB strives to keep clients ahead of what’s next by:
| + | | Transforming uncommon insights into uncommon knowledge with a global research scope |
| + | | Navigating markets with seasoned investment experience and sophisticated solutions |
| + | | Providing thoughtful investment insights and actionable ideas |
Whether you’re an individual investor or a multi-billion-dollar institution, we put knowledge and experience to work for you.
AB’s global research organization connects and collaborates across platforms and teams to deliver impactful insights and innovative products. Better insights lead to better opportunities—anywhere in the world.
For additional information about AB’s range of products and shareholder resources, please log on to www.abfunds.com.
Thank you for your investment in the AB Mutual Funds.
Sincerely,

Robert M. Keith
President and Chief Executive Officer, AB Mutual Funds
| | |
| abfunds.com | | AB GLOBAL RISK ALLOCATION FUND | 1 |
ANNUAL REPORT
January 16, 2018
This report provides management’s discussion of fund performance for AB Global Risk Allocation Fund for the annual reporting period ended November 30, 2017.
The Fund’s investment objective is total return consistent with reasonable risks through a combination of income and long-term growth of capital.
NAV RETURNS AS OF NOVEMBER 30, 2017 (unaudited)
| | | | | | | | |
| | | 6 Months | | | 12 Months | |
| AB GLOBAL RISK ALLOCATION FUND1 | | | | | | | | |
| Class A Shares | | | 4.10% | | | | 12.21% | |
| Class B Shares2 | | | 3.63% | | | | 11.27% | |
| Class C Shares | | | 3.69% | | | | 11.34% | |
| Advisor Class Shares3 | | | 4.25% | | | | 12.53% | |
| Class R Shares3 | | | 3.88% | | | | 11.84% | |
| Class K Shares3 | | | 4.05% | | | | 12.15% | |
| Class I Shares3 | | | 4.25% | | | | 12.60% | |
| Primary Benchmark: MSCI World Index | | | 9.55% | | | | 23.66% | |
Blended Benchmark: 60% MSCI World Index /
40% Bloomberg Barclays Global Aggregate Bond Index | | | 6.66% | | | | 16.55% | |
| Bloomberg Barclays Global Aggregate Bond Index | | | 2.41% | | | | 6.53% | |
| 1 | Includes the impact of proceeds received and credited to the Fund resulting from class action settlements, which enhanced the performance of all share classes of the Fund for the six- and 12-month periods ended November 30, 2017, by 0.04% and 0.80%, respectively. Also includes the impact of proceeds received and credited to the Fund in connection with a third party regulatory settlement, which enhanced performance for the six- and 12-month periods ended November 30, 2017, by 0.02% and 0.02%, respectively. The returns shown are based on net asset values calculated for shareholder transactions and may differ from the returns shown in the Financial Highlights, which reflect adjustments made to the net asset values in accordance with accounting principles generally accepted in the United States of America. |
| 2 | Effective January 31, 2009, Class B shares are no longer available for purchase to new investors. Please see Note A for additional information. |
| 3 | Please note that these share classes are for investors purchasing shares through accounts established under certain fee-based programs sponsored and maintained by certain broker-dealers and financial intermediaries, institutional pension plans and/or investment advisory clients of, and certain other persons associated with, the Adviser and its affiliates or the Fund. |
INVESTMENT RESULTS
The table above shows the Fund’s performance compared with its primary benchmark, the Morgan Stanley Capital International (“MSCI”) World Index, and its blended benchmark, a 60% / 40% blend of MSCI World Index / Bloomberg Barclays Global Aggregate Bond Index, respectively, for the
| | |
| 2 | AB GLOBAL RISK ALLOCATION FUND | | abfunds.com |
six- and 12-month periods ended November 30, 2017. The table also includes the individual performance of the Bloomberg Barclays Global Aggregate Bond Index.
During both periods, all share classes of the Fund underperformed the primary and blended benchmarks, before sales charges. The Fund is strategically diversified in multi-asset exposures and has lower equity exposure; therefore, it underperformed the 100% stock primary benchmark, as equity markets delivered strong performance.
During the 12-month period, global equity, credit, interest rate and inflation-sensitive exposures contributed to absolute returns, with equity exposure being the most significant contributor. For the six-month period, global equity and credit exposures, along with inflation-sensitive exposure contributed, while interest rate exposures detracted. The Fund’s active currency exposure also contributed for both periods.
Derivatives were used for hedging and investment purposes, including futures, interest rate swaps, credit default swaps, purchased and written options and written swaptions, which added to absolute returns during both periods; currency forwards added to returns for the six-month period and detracted during the 12-month period.
MARKET REVIEW AND INVESTMENT STRATEGY
The Fund’s Senior Investment Management Team uses proprietary quantitative signals along with fundamental research insights when allocating risk to equity, interest rate and inflation-sensitive assets. Over the 12-month period, the improvement in the economy and corporate earnings, gradual pace of US Federal Reserve interest rate increases and progress on the US tax cut plan supported equity market performance. The Fund maintained an overweight in risk allocation to global equity and benefited from this tilt, as equity markets continued to deliver strong positive returns. The Fund also benefited from a tactically maintained long exposure to emerging-market currencies.
Over the six-month period, the Fund continued to maintain an overweight to equity risk allocation, relative to the risk allocation to inflation-sensitive assets. Within equities, the Fund was overweight European and Japanese exposures relative to the US. The Fund maintained close to neutral risk allocation to interest rate duration exposure, and within interest rate allocation, was underweight to low interest rate countries. In currency exposures, the Fund maintained long emerging-market currency exposures against the euro, yen and G10 commodity currencies.
| | |
| abfunds.com | | AB GLOBAL RISK ALLOCATION FUND | 3 |
INVESTMENT POLICIES
The Fund invests dynamically in a number of global asset classes, including equity/credit, fixed-income, and inflation-indexed instruments. In making decisions on the allocation of assets among asset classes, the Adviser will use a tail risk parity strategy. This strategy attempts to provide investors with favorable long-term total return while minimizing exposure to material downside (“tail”) events. To execute this strategy, an average tail loss for each asset class is calculated based on historical market behavior and on a forward-looking basis through options prices. Fund assets are then allocated among asset classes so that each asset class will contribute equally to the expected tail loss of the Fund. This will generally result in the Fund having greater exposures to lower risk asset classes (such as fixed-income) than to higher risk asset classes. The Adviser will make frequent adjustments to the Fund’s asset class exposures based on these tail risk parity determinations.
The asset classes in which the Fund may invest include:
| | + | | equity/credit: equity securities of all types and corporate fixed-income securities (regardless of credit quality, but subject to the limitations on high-yield securities set forth below) | |
| | + | | fixed-income: fixed-income securities of the US and foreign governments and their agencies and instrumentalities | |
| | + | | inflation-linked: global inflation-indexed securities (including Treasury inflation-protected securities) | |
The Fund’s investments within each asset class are generally index-based—typically, portfolios of individual securities intended to track the performance of the particular asset class and, primarily for certain types of assets such as credit assets, derivatives intended to track such performance. With respect to the inflation-indexed asset class, the Fund may also seek exposure, at times significantly, to commodities and commodities-related instruments and derivatives since these instruments are typically affected directly or indirectly by the level and change in inflation. Equity securities will comprise no more than 75% of the Fund’s investments. The Fund may invest in fixed-income securities with a range of maturities from short- to long-term. The Fund may invest up to 20% of its assets in high-yield securities (securities rated below BBB- by S&P Global Ratings, Moody’s Investors Service, Inc., or Fitch Ratings, which are commonly known as “junk bonds”). As an operating policy, the Fund will invest no more than 5% of its assets in securities rated CCC- or below.
The Fund’s investments in each asset class will generally be global in nature, and will generally include investments in both developed and
| | |
| 4 | AB GLOBAL RISK ALLOCATION FUND | | abfunds.com |
(continued on next page)
emerging markets. The Fund typically invests at least 40% of its assets in securities of non-US companies and/or foreign countries and
their agencies and instrumentalities unless conditions are not deemed favorable by the Adviser, in which case the Fund will invest at least 30% of its assets in such foreign securities.
Derivatives, particularly futures contracts and swaps, often provide more efficient and economical exposure to market segments than direct investments, and the Fund’s exposure to certain types of assets may at times be achieved partially or substantially through investment in derivatives. Derivatives transactions may also be a quicker and more efficient way to alter the Fund’s exposure than buying and selling direct investments. In determining when and to what extent to enter into derivatives transactions, the Adviser will consider factors such as the risk and returns of these investments relative to direct investments and the cost of such transactions. Because derivatives transactions frequently require cash outlays that are only a small portion of the amount of exposure obtained through the derivative, a portion of the Fund’s assets may be held in cash or invested in cash equivalents to cover the Fund’s derivatives obligations, such as short-term US government and agency securities, repurchase agreements and money market funds. At times, a combination of direct securities investments and derivatives will be used to gain asset class exposure so that the Fund’s aggregate exposure will substantially exceed its net assets (i.e., so that the Fund is effectively leveraged). Overall Fund exposure and the allocation to equity/credit will typically increase during bull markets, while overall exposure and allocation to equity/credit and inflation-indexed securities will typically decrease during bear markets. In addition, the Fund may at times invest in shares of exchange-traded funds in lieu of making direct investments in securities.
While the Fund may seek to gain exposure to physical commodities traded in the commodities markets through investments in a variety of derivative instruments, the Adviser expects that the Fund will seek to gain exposure to commodities and commodities-related instruments and derivatives primarily through investments in AllianceBernstein Global Risk Allocation (Cayman) Ltd., a wholly-owned subsidiary of the Fund organized under the laws of the Cayman Islands (the “Subsidiary”). The Subsidiary is advised by the Adviser and has the same investment objective and substantially similar investment policies and restrictions as the Fund except that the Subsidiary, unlike the Fund, may invest without limitation in commodities and commodities-related instruments. The Fund will be subject to the risks associated with the commodities, derivatives and other instruments in which the Subsidiary invests, to the extent of its investment in the Subsidiary.
(continued on next page)
| | |
| abfunds.com | | AB GLOBAL RISK ALLOCATION FUND | 5 |
The Fund limits its investment in the Subsidiary to no more than 25% of its total assets. Investment in the Subsidiary is expected to provide
the Fund with commodity exposure within the limitations of federal tax requirements that apply to the Fund.
Currency exchange rate fluctuations can have a dramatic impact on returns. The Adviser may seek to hedge all or a portion of the currency exposure resulting from Fund investments or decide not to hedge this exposure. To hedge all or a portion of its currency risk, the Fund may invest in currency-related derivatives, including forward currency exchange contracts.
| | |
| 6 | AB GLOBAL RISK ALLOCATION FUND | | abfunds.com |
DISCLOSURES AND RISKS
Benchmark Disclosure
The MSCI World Index and the Bloomberg Barclays Global Aggregate Bond Index are unmanaged and do not reflect fees and expenses associated with the active management of a mutual fund portfolio. The MSCI World Index (free float-adjusted, market capitalization weighted) represents the equity market performance of developed markets. The Bloomberg Barclays Global Aggregate Bond Index represents the performance of the global investment-grade developed fixed-income markets. MSCI makes no express or implied warranties or representations, and shall have no liability whatsoever with respect to any MSCI data contained herein. The MSCI data may not be further redistributed or used as a basis for other indices, any securities or financial products. This report is not approved, reviewed or produced by MSCI. An investor cannot invest directly in an index or average, and their results are not indicative of the performance for any specific investment, including the Fund.
A Word About Risk
Market Risk: The value of the Fund’s investments will fluctuate as the stock or bond market fluctuates. The value of its investments may decline, sometimes rapidly and unpredictably, simply because of economic changes or other events that affect large portions of the market.
Allocation Risk: The allocation of investments among asset classes may have a significant effect on the Fund’s net asset value (“NAV”) when the asset classes in which the Fund has invested more heavily perform worse than the asset classes invested in less heavily.
Interest Rate Risk: Changes in interest rates will affect the value of investments in fixed-income securities. When interest rates rise, the value of existing investments in fixed-income securities tends to fall and this decrease in value may not be offset by higher income from new investments. The Fund may be subject to heightened interest rate risk due to rising rates as the current period of historically low interest rates may be ending. Interest rate risk is generally greater for fixed-income securities with longer maturities or durations.
Credit Risk: An issuer or guarantor of a fixed-income security, or the counterparty to a derivatives or other contract, may be unable or unwilling to make timely payments of interest or principal, or to otherwise honor its obligations. The issuer or guarantor may default, causing a loss of the full principal amount of a security. The degree of risk for a particular security may be reflected in its credit rating. There is the possibility that the credit rating of a fixed-income security may be downgraded after purchase, which may adversely affect the value of the security.
| | |
| abfunds.com | | AB GLOBAL RISK ALLOCATION FUND | 7 |
DISCLOSURES AND RISKS (continued)
Commodity Risk: Investing in commodities and commodity-linked derivative instruments, either directly or through the Subsidiary, may subject the Fund to greater volatility than investments in traditional securities. The value of commodity-linked derivative instruments may be affected by changes in overall market movements, commodity index volatility, changes in interest rates, or factors affecting a particular industry or commodity, such as drought, floods, weather, livestock disease, embargoes, tariffs and international economic, political and regulatory developments.
Below Investment Grade Securities Risk: Investments in fixed-income securities with ratings below investment-grade, commonly known as “junk bonds”, tend to have a higher probability that an issuer will default or fail to meet its payment obligations. These securities may be subject to greater price volatility due to such factors as specific corporate developments, interest rate sensitivity, negative perceptions of the junk bond market generally and less secondary market liquidity.
Foreign (Non-US) Risk: Investments in securities of non-US issuers may involve more risk than those of US issuers. These securities may fluctuate more widely in price and may be less liquid due to adverse market, economic, political, regulatory or other factors.
Currency Risk: Fluctuations in currency exchange rates may negatively affect the value of the Fund’s investments or reduce its returns.
Emerging Market Risk: Investments in emerging-market countries may have more risk because the markets are less developed and less liquid as well as being subject to increased economic, political, regulatory or other uncertainties.
Subsidiary Risk: By investing in the Subsidiary, the Fund is indirectly exposed to the risks associated with the Subsidiary. The derivatives and other investments held by the Subsidiary are generally similar to those that are permitted to be held by the Fund and are subject to the same risks that apply to similar investments if held directly by the Fund. The Subsidiary is not registered under the Investment Company Act of 1940, as amended (the “1940 Act”), and, unless otherwise noted in the Fund’s prospectus, is not subject to all of the investor protections of the 1940 Act. However, the Fund wholly owns and controls the Subsidiary, and the Fund and the Subsidiary are managed by the Adviser, making it unlikely the Subsidiary will take actions contrary to the interests of the Fund or its shareholders. In addition, changes in federal tax laws applicable to the Fund or interpretations hereof could limit the Fund’s ability to gain exposure to commodities investments through investments in the Subsidiary.
| | |
| 8 | AB GLOBAL RISK ALLOCATION FUND | | abfunds.com |
DISCLOSURES AND RISKS (continued)
Derivatives Risk: Derivatives may be illiquid, difficult to price, and leveraged so that small changes may produce disproportionate losses for the Fund, and may be subject to counterparty risk to a greater degree than more traditional investments.
Leverage Risk: Because the Fund uses leveraging techniques, its NAV may be more volatile because leverage tends to exaggerate the effect of changes in interest rates and any increase or decrease in the value of the Fund’s investments.
Management Risk: The Fund is subject to management risk because it is an actively managed investment fund. The Adviser will apply its investment techniques and risk analyses in making investment decisions for the Fund, but there is no guarantee that its techniques will produce the intended results.
These risks are fully discussed in the Fund’s prospectus. As with all investments, you may lose money by investing in the Fund.
An Important Note About Historical Performance
The investment return and principal value of an investment in the Fund will fluctuate, so that shares, when redeemed, may be worth more or less than their original cost. Performance shown in this report represents past performance and does not guarantee future results. Current performance may be lower or higher than the performance information shown. You may obtain performance information current to the most recent month-end by visiting www.abfunds.com.
All fees and expenses related to the operation of the Fund have been deducted. NAV returns do not reflect sales charges; if sales charges were reflected, the Fund’s quoted performance would be lower. SEC returns reflect the applicable sales charges for each share class: a 4.25% maximum front-end sales charge for Class A shares; the applicable contingent deferred sales charge for Class B shares (4% year 1, 3% year 2, 2% year 3, 1% year 4) and a 1% 1-year contingent deferred sales charge for Class C shares. Returns for the different share classes will vary due to different expenses associated with each class. Performance assumes reinvestment of distributions and does not account for taxes.
| | |
| abfunds.com | | AB GLOBAL RISK ALLOCATION FUND | 9 |
HISTORICAL PERFORMANCE
GROWTH OF A $10,000 INVESTMENT IN THE FUND (unaudited)
11/30/2007 TO 11/30/2017
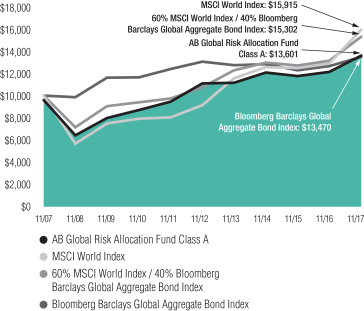
This chart illustrates the total value of an assumed $10,000 investment in AB Global Risk Allocation Fund Class A shares (from 11/30/2007 to 11/30/2017) as compared to the performance of the Fund’s benchmarks. The chart reflects the deduction of the maximum 4.25% sales charge from the initial $10,000 investment in the Fund and assumes the reinvestment of dividends and capital gains distributions. Prior to October 8, 2012, the Fund used a different strategy.
| | |
| 10 | AB GLOBAL RISK ALLOCATION FUND | | abfunds.com |
HISTORICAL PERFORMANCE (continued)
AVERAGE ANNUAL RETURNS AS OF NOVEMBER 30, 2017 (unaudited)
| | | | | | | | |
| | | NAV Returns | | | SEC Returns
(reflects applicable
sales charges) | |
| CLASS A SHARES | | | | | | | | |
| 1 Year | | | 12.21% | | | | 7.44% | |
| 5 Years | | | 4.18% | | | | 3.28% | |
| 10 Years | | | 3.57% | | | | 3.12% | |
| CLASS B SHARES | | | | | | | | |
| 1 Year | | | 11.27% | | | | 7.27% | |
| 5 Years | | | 3.39% | | | | 3.39% | |
| 10 Years1 | | | 2.95% | | | | 2.95% | |
| CLASS C SHARES | | | | | | | | |
| 1 Year | | | 11.34% | | | | 10.34% | |
| 5 Years | | | 3.41% | | | | 3.41% | |
| 10 Years | | | 2.81% | | | | 2.81% | |
| ADVISOR CLASS SHARES2 | | | | | | | | |
| 1 Year | | | 12.53% | | | | 12.53% | |
| 5 Years | | | 4.46% | | | | 4.46% | |
| 10 Years | | | 3.86% | | | | 3.86% | |
| CLASS R SHARES2 | | | | | | | | |
| 1 Year | | | 11.84% | | | | 11.84% | |
| 5 Years | | | 3.84% | | | | 3.84% | |
| 10 Years | | | 3.27% | | | | 3.27% | |
| CLASS K SHARES2 | | | | | | | | |
| 1 Year | | | 12.15% | | | | 12.15% | |
| 5 Years | | | 4.16% | | | | 4.16% | |
| 10 Years | | | 3.58% | | | | 3.58% | |
| CLASS I SHARES2 | | | | | | | | |
| 1 Year | | | 12.60% | | | | 12.60% | |
| 5 Years | | | 4.62% | | | | 4.62% | |
| 10 Years | | | 4.02% | | | | 4.02% | |
The Fund’s current prospectus fee table shows the Fund’s total annual operating expense ratios as 1.33%, 2.09%, 2.08%, 1.08%, 1.65%, 1.34% and 0.90% for Class A, Class B, Class C, Advisor Class, Class R, Class K and Class I shares, respectively. The Financial Highlights section of this report sets forth expense ratio data for the current reporting period; the expense ratios shown above may differ from the expense ratios in the Financial Highlights section since they are based on different time periods.
| 1 | Assumes conversion of Class B shares into Class A shares after eight years. |
| 2 | These share classes are offered at NAV to eligible investors and their SEC returns are the same as their NAV returns. Please note that these share classes are for investors purchasing shares through accounts established under certain fee-based programs sponsored and maintained by certain broker-dealers and financial intermediaries, institutional pension plans and/or investment advisory clients of, and certain other persons associated with, the Adviser and its affiliates or the Fund. |
| | |
| abfunds.com | | AB GLOBAL RISK ALLOCATION FUND | 11 |
HISTORICAL PERFORMANCE (continued)
SEC AVERAGE ANNUAL RETURNS
AS OF THE MOST RECENT CALENDAR QUARTER-END
DECEMBER 31, 2017 (unaudited)
| | | | |
| | | SEC Returns
(reflects applicable
sales charges) | |
| CLASS A SHARES | | | | |
| 1 Year | | | 7.05% | |
| 5 Years | | | 3.47% | |
| 10 Years | | | 3.27% | |
| CLASS B SHARES | | | | |
| 1 Year | | | 6.89% | |
| 5 Years | | | 3.56% | |
| 10 Years1 | | | 3.08% | |
| CLASS C SHARES | | | | |
| 1 Year | | | 9.94% | |
| 5 Years | | | 3.59% | |
| 10 Years | | | 2.96% | |
| ADVISOR CLASS SHARES2 | | | | |
| 1 Year | | | 12.06% | |
| 5 Years | | | 4.64% | |
| 10 Years | | | 4.00% | |
| CLASS R SHARES2 | | | | |
| 1 Year | | | 11.37% | |
| 5 Years | | | 4.02% | |
| 10 Years | | | 3.40% | |
| CLASS K SHARES2 | | | | |
| 1 Year | | | 11.70% | |
| 5 Years | | | 4.34% | |
| 10 Years | | | 3.72% | |
| CLASS I SHARES2 | | | | |
| 1 Year | | | 12.15% | |
| 5 Years | | | 4.79% | |
| 10 Years | | | 4.16% | |
| 1 | Assumes conversion of Class B shares into Class A shares after eight years. |
| 2 | Please note that these share classes are for investors purchasing shares through accounts established under certain fee-based programs sponsored and maintained by certain broker-dealers and financial intermediaries, institutional pension plans and/or investment advisory clients of, and certain other persons associated with, the Adviser and its affiliates or the Fund. |
| | |
| 12 | AB GLOBAL RISK ALLOCATION FUND | | abfunds.com |
EXPENSE EXAMPLE
(unaudited)
As a shareholder of the Fund, you incur two types of costs: (1) transaction costs, including sales charges (loads) on purchase payments, contingent deferred sales charges on redemptions and (2) ongoing costs, including management fees; distribution (12b-1) fees; and other Fund expenses. This example is intended to help you understand your ongoing costs (in dollars) of investing in the Fund and to compare these costs with the ongoing costs of investing in other mutual funds.
The Example is based on an investment of $1,000 invested at the beginning of the period and held for the entire period as indicated below.
Actual Expenses
The table below provides information about actual account values and actual expenses. You may use the information, together with the amount you invested, to estimate the expenses that you paid over the period. Simply divide your account value by $1,000 (for example, an $8,600 account value divided by $1,000 = 8.6), then multiply the result by the number under the heading entitled “Expenses Paid During Period” to estimate the expenses you paid on your account during this period.
Hypothetical Example for Comparison Purposes
The table below also provides information about hypothetical account values and hypothetical expenses based on the Fund’s actual expense ratio and an assumed annual rate of return of 5% before expenses, which is not the Fund’s actual return. The hypothetical account values and expenses may not be used to estimate the actual ending account balance or expenses you paid for the period. You may use this information to compare the ongoing costs of investing in the Fund and other funds by comparing this 5% hypothetical example with the 5% hypothetical examples that appear in the shareholder reports of other funds.
Please note that the expenses shown in the table are meant to highlight your ongoing costs only and do not reflect any transactional costs, such as sales charges (loads), or contingent deferred sales charges on redemptions. Therefore, the hypothetical example is useful in comparing ongoing costs only, and will not help you determine the relative total costs of owning different funds. In addition, if these transactional costs were included, your costs would have been higher.
| | | | | | | | | | | | | | | | | | | | | | | | |
| | | Beginning
Account
Value
June 1, 2017 | | | Ending
Account
Value
November 30, 2017 | | | Expenses
Paid
During
Period* | | | Annualized
Expense
Ratio* | | | Total
Expenses
Paid
During
Period+ | | | Total
Annualized
Expense
Ratio+ | |
| Class A | | | | | | | | | | | | | | | | | | | | | | | | |
Actual | | $ | 1,000 | | | $ | 1,040.40 | | | $ | 6.55 | | | | 1.28 | % | | $ | 6.60 | | | | 1.29 | % |
Hypothetical** | | $ | 1,000 | | | $ | 1,018.65 | | | $ | 6.48 | | | | 1.28 | % | | $ | 6.53 | | | | 1.29 | % |
| | |
| abfunds.com | | AB GLOBAL RISK ALLOCATION FUND | 13 |
EXPENSE EXAMPLE (continued)
| | | | | | | | | | | | | | | | | | | | | | | | |
| | | Beginning
Account
Value
June 1, 2017 | | | Ending
Account
Value
November 30, 2017 | | | Expenses
Paid
During
Period* | | | Annualized
Expense
Ratio* | | | Total
Expenses
Paid
During
Period+ | | | Total
Annualized
Expense
Ratio+ | |
| Class B | | | | | | | | | | | | | | | | | | | | | | | | |
Actual | | $ | 1,000 | | | $ | 1,036.30 | | | $ | 10.57 | | | | 2.07 | % | | $ | 10.62 | | | | 2.08 | % |
Hypothetical** | | $ | 1,000 | | | $ | 1,014.69 | | | $ | 10.45 | | | | 2.07 | % | | $ | 10.50 | | | | 2.08 | % |
| Class C | | | | | | | | | | | | | | | | | | | | | | | | |
Actual | | $ | 1,000 | | | $ | 1,036.90 | | | $ | 10.41 | | | | 2.05 | % | | $ | 10.41 | | | | 2.05 | % |
Hypothetical** | | $ | 1,000 | | | $ | 1,014.71 | | | $ | 10.30 | | | | 2.05 | % | | $ | 10.30 | | | | 2.05 | % |
| Advisor Class | | | | | | | | | | | | | | | | | | | | | |
Actual | | $ | 1,000 | | | $ | 1,042.50 | | | $ | 5.27 | | | | 1.03 | % | | $ | 5.33 | | | | 1.04 | % |
Hypothetical** | | $ | 1,000 | | | $ | 1,019.90 | | | $ | 5.22 | | | | 1.03 | % | | $ | 5.27 | | | | 1.04 | % |
| Class R | | | | | | | | | | | | | | | | | | | | | | | | |
Actual | | $ | 1,000 | | | $ | 1,038.80 | | | $ | 8.29 | | | | 1.63 | % | | $ | 8.29 | | | | 1.63 | % |
Hypothetical** | | $ | 1,000 | | | $ | 1,016.80 | | | $ | 8.20 | | | | 1.63 | % | | $ | 8.20 | | | | 1.63 | % |
| Class K | | | | | | | | | | | | | | | | | | | | | | | | |
Actual | | $ | 1,000 | | | $ | 1,040.50 | | | $ | 6.75 | | | | 1.32 | % | | $ | 6.80 | | | | 1.33 | % |
Hypothetical** | | $ | 1,000 | | | $ | 1,018.45 | | | $ | 6.68 | | | | 1.32 | % | | $ | 6.73 | | | | 1.33 | % |
| Class I | | | | | | | | | | | | | | | | | | | | | | | | |
Actual | | $ | 1,000 | | | $ | 1,041.90 | | | $ | 5.02 | | | | 0.98 | % | | $ | 5.02 | | | | 0.98 | % |
Hypothetical** | | $ | 1,000 | | | $ | 1,020.16 | | | $ | 4.96 | | | | 0.98 | % | | $ | 4.96 | | | | 0.98 | % |
| * | Expenses are equal to the classes’ annualized expense ratios multiplied by the average account value over the period, multiplied by 183/365 (to reflect the one-half year period). |
| ** | Assumes 5% annual return before expenses. |
| + | In connection with the Fund’s investments in affiliated/unaffiliated underlying portfolios, the Fund incurs no direct expenses, but bears proportionate shares of the fees and expenses (i.e., operating, administrative and investment advisory fees) of the affiliated/unaffiliated underlying portfolios. The Adviser has contractually agreed to waive its fees from the Fund in an amount equal to the Fund’s pro rata share of certain acquired fund fees and expenses of the affiliated underlying portfolios. The Fund’s total expenses are equal to the classes’ annualized expense ratio plus the Fund’s pro rata share of the weighted average expense ratio of the affiliated/unaffiliated underlying portfolios in which it invests, multiplied by the average account value over the period, multiplied by 183/365 (to reflect the one-half year period). |
| | |
| 14 | AB GLOBAL RISK ALLOCATION FUND | | abfunds.com |
PORTFOLIO SUMMARY
November 30, 2017 (unaudited)
PORTFOLIO STATISTICS
Net Assets ($mil): $281.8
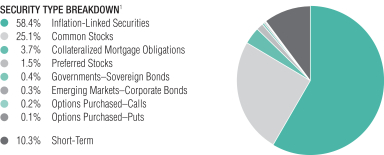
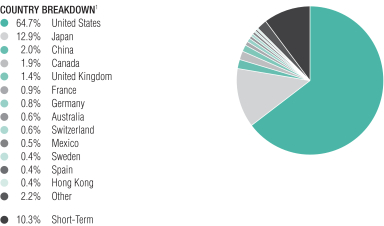
| 1 | All data are as of November 30, 2017. The Fund’s security type and country breakdowns are expressed as a percentage of total investments (excluding security lending collateral) and may vary over time. The Fund also enters into derivative transactions, which may be used for hedging or investment purposes (see “Portfolio of Investments” section of the report for additional details). “Other” country weightings represent 0.3% or less in the following countries: Argentina, Austria, Belgium, Bermuda, Brazil, Chile, Colombia, Denmark, Finland, Ireland, Italy, Jersey (Channel Islands), Jordan, Luxembourg, Macau, Netherlands, New Zealand, Norway, Portugal, Singapore, South Africa, Turkey and United Arab Emirates. |
| | |
| abfunds.com | | AB GLOBAL RISK ALLOCATION FUND | 15 |
PORTFOLIO SUMMARY (continued)
November 30, 2017 (unaudited)
TEN LARGEST HOLDINGS1
| | | | | | | | |
| Security | | U.S. $ Value | | | Percent of
Net Assets | |
| U.S. Treasury Inflation Index | | $ | 130,521,869 | | | | 46.3 | % |
| Japanese Government CPI Linked Bond Series 21 | | | 27,685,936 | | | | 9.8 | |
| Federal National Mortgage Association Connecticut Avenue Securities Series 2015-C03, Class 2M2 | | | 8,754,954 | | | | 3.1 | |
| Hersha Hospitality Trust | | | 1,516,500 | | | | 0.5 | |
| Pebblebrook Hotel Trust | | | 1,486,535 | | | | 0.5 | |
| Federal National Mortgage Association Connecticut Avenue Securities Series 2015-C03, Class 1M2 | | | 1,398,655 | | | | 0.5 | |
| Mexico Government International Bond | | | 1,233,287 | | | | 0.5 | |
| Apartment Investment & Management Co. | | | 1,130,640 | | | | 0.4 | |
| Petrobras Global Finance BV | | | 687,590 | | | | 0.3 | |
| China Shenhua Energy Co., Ltd. | | | 492,067 | | | | 0.2 | |
| | $ | 174,908,033 | | | | 62.1 | % |
| | |
| 16 | AB GLOBAL RISK ALLOCATION FUND | | abfunds.com |
CONSOLIDATED PORTFOLIO OF INVESTMENTS
November 30, 2017
| | | | | | | | | | | | |
| | | | | | Principal
Amount
(000) | | | U.S. $ Value | |
| |
| | | | | | | | | | | | |
INFLATION-LINKED SECURITIES – 56.1% | | | | | | | | | | | | |
Japan – 9.8% | | | | | | | | | | | | |
Japanese Government CPI Linked Bond
Series 21
0.10%, 3/10/26 | | | JPY | | | | 2,965,786 | | | $ | 27,685,936 | |
| | | | | | | | | | | | |
| | | |
United States – 46.3% | | | | | | | | | | | | |
U.S. Treasury Inflation Index (TIPS)
0.375%, 7/15/25(a) | | | U.S.$ | | | | 105,018 | | | | 104,345,556 | |
0.375%, 1/15/27 | | | | | | | 26,664 | | | | 26,176,313 | |
| | | | | | | | | | | | |
| | | |
Total Inflation-Linked Securities
(cost $162,129,728) | | | | | | | | | | | 158,207,805 | |
| | | | | | | | | | | | |
| | | |
| | | | | | Shares | | | | |
COMMON STOCKS – 24.1% | | | | | | | | | | | | |
Financials – 4.6% | | | | | | | | | | | | |
Banks – 1.8% | | | | | | | | | | | | |
ABN AMRO Group NV (GDR)(b) | | | | | | | 1,125 | | | | 33,344 | |
Agricultural Bank of China Ltd. – Class H | | | | | | | 838,000 | | | | 391,552 | |
Aozora Bank Ltd. | | | | | | | 500 | | | | 19,468 | |
Australia & New Zealand Banking Group Ltd. | | | | | | | 886 | | | | 19,239 | |
Banco Bilbao Vizcaya Argentaria SA | | | | | | | 3,189 | | | | 27,340 | |
Banco de Sabadell SA | | | | | | | 16,035 | | | | 32,345 | |
Banco Santander SA | | | | | | | 3,772 | | | | 25,406 | |
Bank of America Corp. | | | | | | | 1,350 | | | | 38,029 | |
Bank of China Ltd. – Class H | | | | | | | 709,000 | | | | 346,489 | |
Bank of Communications Co., Ltd. – Class H | | | | | | | 451,000 | | | | 335,437 | |
Bank of East Asia Ltd. (The) | | | | | | | 3,800 | | | | 16,875 | |
Bank of Ireland Group PLC(c) | | | | | | | 2,334 | | | | 18,207 | |
Bank of Kyoto Ltd. (The) | | | | | | | 400 | | | | 20,470 | |
Bank of Montreal | | | | | | | 747 | | | | 57,478 | |
Bank of Nova Scotia (The) | | | | | | | 862 | | | | 54,460 | |
Bank of Queensland Ltd. | | | | | | | 2,070 | | | | 20,745 | |
Bankia SA | | | | | | | 6,083 | | | | 29,242 | |
Bankinter SA | | | | | | | 3,395 | | | | 32,773 | |
Barclays PLC | | | | | | | 10,110 | | | | 26,380 | |
BB&T Corp. | | | | | | | 899 | | | | 44,429 | |
Bendigo & Adelaide Bank Ltd. | | | | | | | 1,883 | | | | 16,675 | |
BNP Paribas SA | | | | | | | 331 | | | | 25,061 | |
BOC Hong Kong Holdings Ltd. | | | | | | | 4,000 | | | | 20,356 | |
CaixaBank SA | | | | | | | 4,609 | | | | 21,902 | |
Canadian Imperial Bank of Commerce/Canada | | | | | | | 584 | | | | 53,477 | |
Chiba Bank Ltd. (The) | | | | | | | 3,000 | | | | 23,099 | |
| | |
| abfunds.com | | AB GLOBAL RISK ALLOCATION FUND | 17 |
CONSOLIDATED PORTFOLIO OF INVESTMENTS (continued)
| | | | | | | | | | | | |
| Company | | | | |
Shares | | | U.S. $ Value | |
| |
| | | | | | | | | | | | |
China CITIC Bank Corp., Ltd. – Class H | | | | | | | 530,000 | | | $ | 343,717 | |
China Construction Bank Corp. – Class H | | | | | | | 465,000 | | | | 407,917 | |
China Everbright Bank Co., Ltd. – Class H | | | | | | | 690,000 | | | | 321,247 | |
China Minsheng Banking Corp., Ltd. – Class H | | | | | | | 354,500 | | | | 357,706 | |
Chugoku Bank Ltd. (The) | | | | | | | 1,200 | | | | 15,716 | |
CIT Group, Inc. | | | | | | | 697 | | | | 34,738 | |
Citigroup, Inc. | | | | | | | 564 | | | | 42,582 | |
Citizens Financial Group, Inc. | | | | | | | 745 | | | | 30,322 | |
Comerica, Inc. | | | | | | | 403 | | | | 33,574 | |
Commerzbank AG(c) | | | | | | | 2,045 | | | | 29,698 | |
Commonwealth Bank of Australia | | | | | | | 310 | | | | 18,796 | |
Concordia Financial Group Ltd. | | | | | | | 3,600 | | | | 19,824 | |
Credit Agricole SA | | | | | | | 1,641 | | | | 27,649 | |
Danske Bank A/S | | | | | | | 858 | | | | 32,030 | |
DBS Group Holdings Ltd. | | | | | | | 1,100 | | | | 20,034 | |
DNB ASA | | | | | | | 1,818 | | | | 33,115 | |
Erste Group Bank AG(c) | | | | | | | 821 | | | | 35,935 | |
Fifth Third Bancorp | | | | | | | 1,167 | | | | 35,605 | |
First Republic Bank/CA | | | | | | | 402 | | | | 38,407 | |
Fukuoka Financial Group, Inc. | | | | | | | 4,000 | | | | 20,810 | |
Hachijuni Bank Ltd. (The) | | | | | | | 2,900 | | | | 16,639 | |
Hang Seng Bank Ltd. | | | | | | | 1,100 | | | | 27,261 | |
Hiroshima Bank Ltd. (The) | | | | | | | 2,000 | | | | 15,828 | |
HSBC Holdings PLC | | | | | | | 5,317 | | | | 52,983 | |
Huntington Bancshares, Inc./OH | | | | | | | 2,387 | | | | 34,373 | |
ING Groep NV | | | | | | | 1,574 | | | | 28,442 | |
Intesa Sanpaolo SpA | | | | | | | 7,713 | | | | 25,987 | |
Intesa Sanpaolo SpA – RSP | | | | | | | 10,090 | | | | 32,260 | |
Japan Post Bank Co., Ltd. | | | | | | | 1,400 | | | | 17,839 | |
JPMorgan Chase & Co. | | | | | | | 448 | | | | 46,825 | |
KBC Group NV | | | | | | | 411 | | | | 33,703 | |
KeyCorp | | | | | | | 1,685 | | | | 31,981 | |
Kyushu Financial Group, Inc. | | | | | | | 2,700 | | | | 16,048 | |
Lloyds Banking Group PLC | | | | | | | 36,308 | | | | 32,403 | |
M&T Bank Corp. | | | | | | | 381 | | | | 64,370 | |
Mebuki Financial Group, Inc. | | | | | | | 4,400 | | | | 18,570 | |
Mitsubishi UFJ Financial Group, Inc. | | | | | | | 2,500 | | | | 17,820 | |
Mizuho Financial Group, Inc. | | | | | | | 9,000 | | | | 16,371 | |
National Australia Bank Ltd. | | | | | | | 869 | | | | 19,523 | |
National Bank of Canada | | | | | | | 1,132 | | | | 55,777 | |
Nordea Bank AB | | | | | | | 3,090 | | | | 36,235 | |
Oversea-Chinese Banking Corp., Ltd. | | | | | | | 2,279 | | | | 21,094 | |
People’s United Financial, Inc. | | | | | | | 2,269 | | | | 43,156 | |
PNC Financial Services Group, Inc. (The) | | | | | | | 291 | | | | 40,903 | |
Raiffeisen Bank International AG(c) | | | | | | | 1,044 | | | | 36,902 | |
Regions Financial Corp. | | | | | | | 1,804 | | | | 29,928 | |
Resona Holdings, Inc. | | | | | | | 2,200 | | | | 11,714 | |
| | |
| 18 | AB GLOBAL RISK ALLOCATION FUND | | abfunds.com |
CONSOLIDATED PORTFOLIO OF INVESTMENTS (continued)
| | | | | | | | | | | | |
| Company | | | | |
Shares | | | U.S. $ Value | |
| |
| | | | | | | | | | | | |
Royal Bank of Canada | | | | | | | 718 | | | $ | 56,125 | |
Royal Bank of Scotland Group PLC(c) | | | | | | | 6,922 | | | | 25,883 | |
Seven Bank Ltd. | | | | | | | 4,800 | | | | 16,165 | |
Shinsei Bank Ltd. | | | | | | | 1,000 | | | | 16,073 | |
Shizuoka Bank Ltd. (The) | | | | | | | 2,000 | | | | 19,784 | |
Signature Bank/New York NY(c) | | | | | | | 215 | | | | 29,515 | |
Skandinaviska Enskilda Banken AB – Class A | | | | | | | 3,315 | | | | 39,399 | |
Societe Generale SA | | | | | | | 422 | | | | 21,236 | |
Standard Chartered PLC(c) | | | | | | | 2,940 | | | | 29,332 | |
Sumitomo Mitsui Financial Group, Inc. | | | | | | | 500 | | | | 20,386 | |
Sumitomo Mitsui Trust Holdings, Inc. | | | | | | | 400 | | | | 14,880 | |
SunTrust Banks, Inc. | | | | | | | 583 | | | | 35,930 | |
Suruga Bank Ltd. | | | | | | | 800 | | | | 17,268 | |
Svenska Handelsbanken AB – Class A | | | | | | | 2,923 | | | | 39,988 | |
Swedbank AB – Class A | | | | | | | 1,696 | | | | 40,559 | |
Toronto-Dominion Bank (The) | | | | | | | 1,045 | | | | 59,323 | |
UniCredit SpA(c) | | | | | | | 1,079 | | | | 21,753 | |
United Overseas Bank Ltd. | | | | | | | 1,000 | | | | 19,477 | |
US Bancorp | | | | | | | 800 | | | | 44,120 | |
Wells Fargo & Co. | | | | | | | 690 | | | | 38,964 | |
Westpac Banking Corp. | | | | | | | 832 | | | | 19,964 | |
Yamaguchi Financial Group, Inc. | | | | | | | 2,000 | | | | 23,977 | |
| | | | | | | | | | | | |
| | | | | | | | | | | 5,124,736 | |
| | | | | | | | | | | | |
Capital Markets – 0.9% | | | | | | | | | | | | |
3i Group PLC | | | | | | | 4,463 | | | | 54,436 | |
Affiliated Managers Group, Inc. | | | | | | | 225 | | | | 44,701 | |
Ameriprise Financial, Inc. | | | | | | | 250 | | | | 40,807 | |
ASX Ltd. | | | | | | | 592 | | | | 25,702 | |
Bank of New York Mellon Corp. (The) | | | | | | | 853 | | | | 46,693 | |
BlackRock, Inc. – Class A | | | | | | | 109 | | | | 54,630 | |
Brookfield Asset Management, Inc. – Class A | | | | | | | 1,245 | | | | 51,744 | |
Charles Schwab Corp. (The) | | | | | | | 729 | | | | 35,568 | |
CI Financial Corp. | | | | | | | 2,261 | | | | 51,086 | |
CITIC Securities Co., Ltd. – Class H | | | | | | | 161,000 | | | | 350,159 | |
CME Group, Inc. – Class A | | | | | | | 377 | | | | 56,377 | |
Credit Suisse Group AG (REG)(c) | | | | | | | 1,310 | | | | 22,230 | |
Daiwa Securities Group, Inc. | | | | | | | 2,000 | | | | 12,513 | |
Deutsche Bank AG (REG) | | | | | | | 1,113 | | | | 20,991 | |
Deutsche Boerse AG | | | | | | | 355 | | | | 40,290 | |
E*TRADE Financial Corp.(c) | | | | | | | 742 | | | | 35,720 | |
Eaton Vance Corp. | | | | | | | 655 | | | | 36,208 | |
Franklin Resources, Inc. | | | | | | | 837 | | | | 36,284 | |
Goldman Sachs Group, Inc. (The) | | | | | | | 162 | | | | 40,118 | |
Haitong Securities Co., Ltd. – Class H | | | | | | | 198,800 | | | | 298,035 | |
Hargreaves Lansdown PLC | | | | | | | 1,868 | | | | 40,482 | |
Hong Kong Exchanges & Clearing Ltd. | | | | | | | 900 | | | | 27,214 | |
IGM Financial, Inc. | | | | | | | 1,289 | | | | 44,540 | |
| | |
| abfunds.com | | AB GLOBAL RISK ALLOCATION FUND | 19 |
CONSOLIDATED PORTFOLIO OF INVESTMENTS (continued)
| | | | | | | | | | | | |
| Company | | | | |
Shares | | | U.S. $ Value | |
| |
| | | | | | | | | | | | |
Intercontinental Exchange, Inc. | | | | | | | 727 | | | $ | 51,944 | |
Invesco Ltd. | | | | | | | 1,109 | | | | 40,113 | |
Investec PLC | | | | | | | 4,737 | | | | 33,165 | |
Japan Exchange Group, Inc. | | | | | | | 1,100 | | | | 20,329 | |
Julius Baer Group Ltd.(c) | | | | | | | 634 | | | | 37,283 | |
London Stock Exchange Group PLC | | | | | | | 1,249 | | | | 63,857 | |
Macquarie Group Ltd. | | | | | | | 261 | | | | 19,584 | |
Moody’s Corp. | | | | | | | 325 | | | | 49,341 | |
Morgan Stanley | | | | | | | 735 | | | | 37,933 | |
MSCI, Inc. – Class A | | | | | | | 361 | | | | 46,461 | |
Nasdaq, Inc. | | | | | | | 753 | | | | 59,607 | |
Natixis SA | | | | | | | 3,393 | | | | 27,506 | |
Nomura Holdings, Inc. | | | | | | | 2,100 | | | | 12,698 | |
Northern Trust Corp. | | | | | | | 412 | | | | 40,285 | |
Partners Group Holding AG | | | | | | | 68 | | | | 46,831 | |
Raymond James Financial, Inc. | | | | | | | 418 | | | | 36,909 | |
S&P Global, Inc. | | | | | | | 311 | | | | 51,464 | |
SBI Holdings, Inc./Japan | | | | | | | 1,300 | | | | 23,276 | |
Schroders PLC | | | | | | | 944 | | | | 44,051 | |
SEI Investments Co. | | | | | | | 695 | | | | 48,900 | |
Singapore Exchange Ltd. | | | | | | | 3,300 | | | | 18,397 | |
St James’s Place PLC | | | | | | | 2,130 | | | | 34,982 | |
State Street Corp. | | | | | | | 421 | | | | 40,142 | |
T. Rowe Price Group, Inc. | | | | | | | 627 | | | | 64,531 | |
TD Ameritrade Holding Corp. | | | | | | | 771 | | | | 39,452 | |
Thomson Reuters Corp. | | | | | | | 1,197 | | | | 52,718 | |
UBS Group AG(c) | | | | | | | 1,814 | | | | 31,379 | |
| | | | | | | | | | | | |
| | | | | | | | | | | 2,539,666 | |
| | | | | | | | | | | | |
Consumer Finance – 0.1% | | | | | | | | | | | | |
Acom Co., Ltd.(c) | | | | | | | 4,000 | | | | 16,727 | |
AEON Financial Service Co., Ltd. | | | | | | | 800 | | | | 17,813 | |
Ally Financial, Inc. | | | | | | | 1,228 | | | | 32,984 | |
American Express Co. | | | | | | | 516 | | | | 50,418 | |
Capital One Financial Corp. | | | | | | | 376 | | | | 34,592 | |
Credit Saison Co., Ltd. | | | | | | | 900 | | | | 17,349 | |
Discover Financial Services | | | | | | | 568 | | | | 40,101 | |
Navient Corp. | | | | | | | 1,339 | | | | 16,885 | |
Provident Financial PLC | | | | | | | 801 | | | | 9,479 | |
Synchrony Financial | | | | | | | 1,033 | | | | 37,074 | |
| | | | | | | | | | | | |
| | | | | | | | | | | 273,422 | |
| | | | | | | | | | | | |
Diversified Financial Services – 0.3% | |
AMP Ltd. | | | | | | | 3,999 | | | | 15,556 | |
Berkshire Hathaway, Inc. – Class B(c) | | | | | | | 231 | | | | 44,585 | |
Challenger Ltd./Australia | | | | | | | 1,797 | | | | 19,149 | |
Element Fleet Management Corp. | | | | | | | 3,194 | | | | 24,088 | |
Eurazeo SA | | | | | | | 577 | | | | 50,755 | |
| | |
| 20 | AB GLOBAL RISK ALLOCATION FUND | | abfunds.com |
CONSOLIDATED PORTFOLIO OF INVESTMENTS (continued)
| | | | | | | | | | | | |
| Company | | | | |
Shares | | | U.S. $ Value | |
| |
| | | | | | | | | | | | |
EXOR NV | | | | | | | 480 | | | $ | 29,071 | |
First Pacific Co., Ltd./Hong Kong | | | | | | | 22,000 | | | | 16,450 | |
Groupe Bruxelles Lambert SA | | | | | | | 600 | | | | 64,593 | |
IHS Markit Ltd.(c) | | | | | | | 1,109 | | | | 49,484 | |
Industrivarden AB – Class C | | | | | | | 1,828 | | | | 44,578 | |
Investor AB – Class B | | | | | | | 902 | | | | 42,173 | |
Kinnevik AB | | | | | | | 1,368 | | | | 43,907 | |
L E Lundbergforetagen AB – Class B | | | | | | | 428 | | | | 31,410 | |
Leucadia National Corp. | | | | | | | 1,464 | | | | 38,518 | |
Mitsubishi UFJ Lease & Finance Co., Ltd. | | | | | | | 3,500 | | | | 20,054 | |
Onex Corp. | | | | | | | 648 | | | | 46,857 | |
ORIX Corp. | | | | | | | 1,000 | | | | 17,324 | |
Pargesa Holding SA | | | | | | | 691 | | | | 59,429 | |
Standard Life Aberdeen PLC | | | | | | | 13,478 | | | | 78,475 | |
Voya Financial, Inc. | | | | | | | 775 | | | | 34,255 | |
Wendel SA | | | | | | | 294 | | | | 49,465 | |
| | | | | | | | | | | | |
| | | | | | | | | | | 820,176 | |
| | | | | | | | | | | | |
Insurance – 1.4% | |
Admiral Group PLC | | | | | | | 1,243 | | | | 32,340 | |
Aegon NV | | | | | | | 4,545 | | | | 28,233 | |
Aflac, Inc. | | | | | | | 694 | | | | 60,822 | |
Ageas | | | | | | | 832 | | | | 40,916 | |
AIA Group Ltd. | | | | | | | 2,400 | | | | 19,555 | |
Alleghany Corp.(c) | | | | | | | 66 | | | | 38,597 | |
Allianz SE (REG) | | | | | | | 222 | | | | 52,431 | |
Allstate Corp. (The) | | | | | | | 643 | | | | 66,010 | |
American International Group, Inc. | | | | | | | 720 | | | | 43,171 | |
Aon PLC | | | | | | | 435 | | | | 60,996 | |
Arch Capital Group Ltd.(c) | | | | | | | 593 | | | | 56,151 | |
Arthur J Gallagher & Co. | | | | | | | 958 | | | | 63,065 | |
Assicurazioni Generali SpA | | | | | | | 1,915 | | | | 35,057 | |
Assurant, Inc. | | | | | | | 420 | | | | 42,365 | |
Aviva PLC | | | | | | | 5,185 | | | | 35,769 | |
Axis Capital Holdings Ltd. | | | | | | | 710 | | | | 37,197 | |
Baloise Holding AG (REG) | | | | | | | 288 | | | | 44,419 | |
Brighthouse Financial, Inc.(c) | | | | | | | 60 | | | | 3,527 | |
China Life Insurance Co., Ltd. – Class H | | | | | | | 88,000 | | | | 288,153 | |
Chubb Ltd. | | | | | | | 371 | | | | 56,433 | |
Cincinnati Financial Corp. | | | | | | | 705 | | | | 52,685 | |
CNP Assurances | | | | | | | 1,623 | | | | 36,458 | |
Dai-ichi Life Holdings, Inc. | | | | | | | 1,000 | | | | 20,606 | |
Direct Line Insurance Group PLC | | | | | | | 8,791 | | | | 43,507 | |
Everest Re Group Ltd. | | | | | | | 214 | | | | 46,994 | |
Fairfax Financial Holdings Ltd. | | | | | | | 85 | | | | 46,711 | |
FNF Group | | | | | | | 1,183 | | | | 47,864 | |
Gjensidige Forsikring ASA | | | | | | | 2,409 | | | | 43,708 | |
Great-West Lifeco, Inc. | | | | | | | 2,017 | | | | 54,890 | |
| | |
| abfunds.com | | AB GLOBAL RISK ALLOCATION FUND | 21 |
CONSOLIDATED PORTFOLIO OF INVESTMENTS (continued)
| | | | | | | | | | | | |
| Company | | | | |
Shares | | | U.S. $ Value | |
| |
| | | | | | | | | | | | |
Hannover Rueck SE (REG) | | | | | | | 383 | | | $ | 50,410 | |
Hartford Financial Services Group, Inc. (The) | | | | | | | 878 | | | | 50,432 | |
Industrial Alliance Insurance & Financial Services, Inc. | | | | | | | 1,008 | | | | 47,011 | |
Insurance Australia Group Ltd. | | | | | | | 3,856 | | | | 21,026 | |
Intact Financial Corp. | | | | | | | 960 | | | | 80,541 | |
Japan Post Holdings Co., Ltd. | | | | | | | 1,600 | | | | 18,447 | |
Legal & General Group PLC | | | | | | | 13,473 | | | | 48,722 | |
Lincoln National Corp. | | | | | | | 446 | | | | 34,141 | |
Loews Corp. | | | | | | | 1,014 | | | | 50,984 | |
Manulife Financial Corp. | | | | | | | 2,171 | | | | 45,619 | |
Mapfre SA | | | | | | | 8,898 | | | | 29,933 | |
Markel Corp.(c) | | | | | | | 39 | | | | 43,169 | |
Marsh & McLennan Cos., Inc. | | | | | | | 753 | | | | 63,199 | |
Medibank Pvt Ltd. | | | | | | | 7,758 | | | | 19,253 | |
MetLife, Inc. | | | | | | | 661 | | | | 35,483 | |
MS&AD Insurance Group Holdings, Inc. | | | | | | | 400 | | | | 13,090 | |
Muenchener Rueckversicherungs-Gesellschaft AG in Muenchen (REG) | | | | | | | 212 | | | | 47,245 | |
New China Life Insurance Co., Ltd. – Class H | | | | | | | 74,000 | | | | 473,660 | |
NN Group NV | | | | | | | 985 | | | | 43,185 | |
Old Mutual PLC | | | | | | | 9,763 | | | | 26,081 | |
Poste Italiane SpA(b) | | | | | | | 5,111 | | | | 37,322 | |
Power Corp. of Canada | | | | | | | 1,760 | | | | 44,595 | |
Power Financial Corp. | | | | | | | 1,872 | | | | 51,293 | |
Principal Financial Group, Inc. | | | | | | | 589 | | | | 41,695 | |
Progressive Corp. (The) | | | | | | | 1,147 | | | | 60,998 | |
Prudential Financial, Inc. | | | | | | | 336 | | | | 38,922 | |
Prudential PLC | | | | | | | 1,555 | | | | 39,089 | |
QBE Insurance Group Ltd. | | | | | | | 1,386 | | | | 11,233 | |
Reinsurance Group of America, Inc. – Class A | | | | | | | 376 | | | | 60,931 | |
RenaissanceRe Holdings Ltd. | | | | | | | 388 | | | | 51,468 | |
RSA Insurance Group PLC | | | | | | | 5,407 | | | | 44,512 | |
Sampo Oyj – Class A | | | | | | | 886 | | | | 46,801 | |
SCOR SE | | | | | | | 791 | | | | 32,216 | |
Sompo Holdings, Inc. | | | | | | | 400 | | | | 16,220 | |
Sony Financial Holdings, Inc. | | | | | | | 1,072 | | | | 18,232 | |
Sun Life Financial, Inc. | | | | | | | 1,344 | | | | 53,108 | |
Suncorp Group Ltd. | | | | | | | 1,549 | | | | 16,884 | |
Swiss Life Holding AG(c) | | | | | | | 132 | | | | 44,395 | |
Swiss Re AG | | | | | | | 469 | | | | 44,035 | |
T&D Holdings, Inc. | | | | | | | 1,250 | | | | 20,684 | |
Tokio Marine Holdings, Inc. | | | | | | | 400 | | | | 17,742 | |
Torchmark Corp. | | | | | | | 598 | | | | 53,132 | |
Travelers Cos., Inc. (The) | | | | | | | 464 | | | | 62,905 | |
Trisura Group Ltd.(c) | | | | | | | 7 | | | | 144 | |
Tryg A/S | | | | | | | 1,864 | | | | 45,325 | |
| | |
| 22 | AB GLOBAL RISK ALLOCATION FUND | | abfunds.com |
CONSOLIDATED PORTFOLIO OF INVESTMENTS (continued)
| | | | | | | | | | | | |
| Company | | | | |
Shares | | | U.S. $ Value | |
| |
| | | | | | | | | | | | |
UnipolSai Assicurazioni SpA | | | | | | | 12,165 | | | $ | 28,532 | |
Unum Group | | | | | | | 830 | | | | 46,995 | |
Willis Towers Watson PLC | | | | | | | 352 | | | | 56,602 | |
WR Berkley Corp. | | | | | | | 735 | | | | 50,803 | |
XL Group Ltd. | | | | | | | 1,187 | | | | 46,079 | |
Zurich Insurance Group AG | | | | | | | 154 | | | | 46,610 | |
| | | | | | | | | | | | |
| | | | | | | | | | | 3,969,763 | |
| | | | | | | | | | | | |
Mortgage Real Estate Investment Trusts (REITs) – 0.1% | | | | | | | | | | | | |
AGNC Investment Corp. | | | | | | | 2,408 | | | | 47,919 | |
Annaly Capital Management, Inc. | | | | | | | 3,658 | | | | 42,689 | |
| | | | | | | | | | | | |
| | | | | | | | | | | 90,608 | |
| | | | | | | | | | | | |
Thrifts & Mortgage Finance – 0.0% | | | | | | | | | | | | |
New York Community Bancorp, Inc. | | | | | | | 3,312 | | | | 44,182 | |
| | | | | | | | | | | | |
| | | | | | | | | | | 12,862,553 | |
| | | | | | | | | | | | |
| Information Technology – 2.9% | | | | | | | | | | | | |
Communications Equipment – 0.2% | | | | | | | | | | | | |
Cisco Systems, Inc. | | | | | | | 2,148 | | | | 80,120 | |
F5 Networks, Inc.(c) | | | | | | | 462 | | | | 62,000 | |
Harris Corp. | | | | | | | 675 | | | | 97,538 | |
Juniper Networks, Inc. | | | | | | | 2,077 | | | | 57,658 | |
Motorola Solutions, Inc. | | | | | | | 840 | | | | 79,052 | |
Nokia Oyj | | | | | | | 5,115 | | | | 25,595 | |
Palo Alto Networks, Inc.(c) | | | | | | | 297 | | | | 43,288 | |
Telefonaktiebolaget LM Ericsson – Class B | | | | | | | 4,594 | | | | 28,923 | |
| | | | | | | | | | | | |
| | | | | | | | | | | 474,174 | |
| | | | | | | | | | | | |
Electronic Equipment, Instruments & Components – 0.4% | | | | | | | | | | | | |
Alps Electric Co., Ltd. | | | | | | | 500 | | | | 16,068 | |
Amphenol Corp. – Class A | | | | | | | 1,084 | | | | 98,199 | |
Arrow Electronics, Inc.(c) | | | | | | | 775 | | | | 62,566 | |
Avnet, Inc. | | | | | | | 1,566 | | | | 64,848 | |
CDW Corp./DE | | | | | | | 1,016 | | | | 71,130 | |
Corning, Inc. | | | | | | | 2,176 | | | | 70,481 | |
Flex Ltd.(c) | | | | | | | 3,294 | | | | 59,523 | |
FLIR Systems, Inc. | | | | | | | 1,824 | | | | 84,962 | |
Hamamatsu Photonics KK | | | | | | | 600 | | | | 20,707 | |
Hexagon AB – Class B | | | | | | | 836 | | | | 41,110 | |
Hirose Electric Co., Ltd. | | | | | | | 100 | | | | 14,956 | |
Hitachi High-Technologies Corp. | | | | | | | 500 | | | | 20,843 | |
Hitachi Ltd. | | | | | | | 4,000 | | | | 29,971 | |
Ingenico Group SA | | | | | | | 325 | | | | 34,057 | |
Keyence Corp. | | | | | | | 100 | | | | 58,189 | |
Kyocera Corp. | | | | | | | 400 | | | | 28,267 | |
Murata Manufacturing Co., Ltd. | | | | | | | 100 | | | | 13,619 | |
| | |
| abfunds.com | | AB GLOBAL RISK ALLOCATION FUND | 23 |
CONSOLIDATED PORTFOLIO OF INVESTMENTS (continued)
| | | | | | | | | | | | |
| Company | | | | |
Shares | | | U.S. $ Value | |
| |
| | | | | | | | | | | | |
Nippon Electric Glass Co., Ltd. | | | | | | | 400 | | | $ | 15,618 | |
Omron Corp. | | | | | | | 500 | | | | 29,634 | |
Shimadzu Corp. | | | | | | | 1,100 | | | | 26,337 | |
TDK Corp. | | | | | | | 300 | | | | 24,743 | |
TE Connectivity Ltd. | | | | | | | 878 | | | | 82,918 | |
Trimble, Inc.(c) | | | | | | | 1,320 | | | | 55,427 | |
Yaskawa Electric Corp. | | | | | | | 1,000 | | | | 44,584 | |
Yokogawa Electric Corp. | | | | | | | 1,200 | | | | 22,253 | |
| | | | | | | | | | | | |
| | | | | | | | | | | 1,091,010 | |
| | | | | | | | | | | | |
Internet Software & Services – 0.3% | | | | | | | | | | | | |
Akamai Technologies, Inc.(c) | | | | | | | 806 | | | | 44,959 | |
Alphabet, Inc. – Class A(c) | | | | | | | 78 | | | | 80,821 | |
Alphabet, Inc. – Class C(c) | | | | | | | 76 | | | | 77,627 | |
Cars.com, Inc.(c)(d) | | | | | | | 283 | | | | 6,860 | |
CoStar Group, Inc.(c) | | | | | | | 287 | | | | 87,526 | |
DeNA Co., Ltd. | | | | | | | 600 | | | | 13,624 | |
eBay, Inc.(c) | | | | | | | 1,712 | | | | 59,355 | |
Facebook, Inc. – Class A(c) | | | | | | | 387 | | | | 68,569 | |
Kakaku.com, Inc. | | | | | | | 1,400 | | | | 22,211 | |
MercadoLibre, Inc. | | | | | | | 134 | | | | 36,869 | |
Mixi, Inc. | | | | | | | 300 | | | | 13,974 | |
REA Group Ltd. | | | | | | | 310 | | | | 18,613 | |
Twitter, Inc.(c) | | | | | | | 1,866 | | | | 38,402 | |
United Internet AG | | | | | | | 623 | | | | 42,047 | |
VeriSign, Inc.(c)(d) | | | | | | | 824 | | | | 94,843 | |
Yahoo Japan Corp.(c) | | | | | | | 4,600 | | | | 21,120 | |
Zillow Group, Inc. – Class C(c)(d) | | | | | | | 848 | | | | 34,802 | |
| | | | | | | | | | | | |
| | | | | | | | | | | 762,222 | |
| | | | | | | | | | | | |
IT Services – 0.7% | | | | | | | | | | | | |
Accenture PLC – Class A | | | | | | | 613 | | | | 90,730 | |
Alliance Data Systems Corp. | | | | | | | 215 | | | | 51,443 | |
Amadeus IT Group SA – Class A | | | | | | | 787 | | | | 56,753 | |
Atos SE | | | | | | | 247 | | | | 36,485 | |
Automatic Data Processing, Inc. | | | | | | | 831 | | | | 95,116 | |
Black Knight, Inc.(c) | | | | | | | 362 | | | | 16,254 | |
Broadridge Financial Solutions, Inc. | | | | | | | 1,174 | | | | 105,965 | |
Capgemini SE | | | | | | | 360 | | | | 41,462 | |
CGI Group, Inc. – Class A(c) | | | | | | | 1,595 | | | | 84,179 | |
Cognizant Technology Solutions Corp. – Class A | | | | | | | 1,099 | | | | 79,436 | |
Computershare Ltd. | | | | | | | 1,857 | | | | 23,316 | |
DXC Technology Co. | | | | | | | 635 | | | | 61,049 | |
Fidelity National Information Services, Inc. | | | | | | | 969 | | | | 91,406 | |
First Data Corp. – Class A(c) | | | | | | | 3,401 | | | | 55,946 | |
Fiserv, Inc.(c) | | | | | | | 669 | | | | 87,940 | |
FleetCor Technologies, Inc.(c) | | | | | | | 249 | | | | 45,286 | |
Fujitsu Ltd. | | | | | | | 2,000 | | | | 14,985 | |
| | |
| 24 | AB GLOBAL RISK ALLOCATION FUND | | abfunds.com |
CONSOLIDATED PORTFOLIO OF INVESTMENTS (continued)
| | | | | | | | | | | | |
| Company | | | | |
Shares | | | U.S. $ Value | |
| |
| | | | | | | | | | | | |
Gartner, Inc.(c) | | | | | | | 575 | | | $ | 69,512 | |
Global Payments, Inc. | | | | | | | 567 | | | | 57,017 | |
International Business Machines Corp. | | | | | | | 502 | | | | 77,293 | |
Mastercard, Inc. – Class A | | | | | | | 649 | | | | 97,655 | |
Nomura Research Institute Ltd. | | | | | | | 700 | | | | 31,805 | |
NTT Data Corp. | | | | | | | 2,000 | | | | 23,594 | |
Obic Co., Ltd. | | | | | | | 300 | | | | 20,846 | |
Otsuka Corp. | | | | | | | 300 | | | | 22,453 | |
Paychex, Inc. | | | | | | | 1,472 | | | | 99,080 | |
PayPal Holdings, Inc.(c) | | | | | | | 1,263 | | | | 95,647 | |
Sabre Corp. | | | | | | | 2,420 | | | | 48,182 | |
Total System Services, Inc. | | | | | | | 1,066 | | | | 79,268 | |
Vantiv, Inc. – Class A(c) | | | | | | | 1,056 | | | | 79,200 | |
Visa, Inc. – Class A | | | | | | | 718 | | | | 80,840 | |
Western Union Co. (The) – Class W | | | | | | | 3,117 | | | | 61,374 | |
Worldpay Group PLC(b) | | | | | | | 9,043 | | | | 51,618 | |
| | | | | | | | | | | | |
| | | | | | | | | | | 2,033,135 | |
| | | | | | | | | | | | |
Semiconductors & Semiconductor Equipment – 0.4% | | | | | | | | | | | | |
Advanced Micro Devices, Inc.(c)(d) | | | | | | | 2,015 | | | | 21,943 | |
Analog Devices, Inc. | | | | | | | 607 | | | | 52,269 | |
Applied Materials, Inc. | | | | | | | 967 | | | | 51,029 | |
ASM Pacific Technology Ltd. | | | | | | | 1,400 | | | | 20,221 | |
ASML Holding NV | | | | | | | 269 | | | | 47,205 | |
Broadcom Ltd. | | | | | | | 205 | | | | 56,978 | |
Infineon Technologies AG | | | | | | | 1,599 | | | | 44,186 | |
Intel Corp. | | | | | | | 1,884 | | | | 84,478 | |
KLA-Tencor Corp. | | | | | | | 609 | | | | 62,264 | |
Lam Research Corp. | | | | | | | 384 | | | | 73,855 | |
Marvell Technology Group Ltd. | | | | | | | 2,554 | | | | 57,056 | |
Maxim Integrated Products, Inc. | | | | | | | 1,384 | | | | 72,425 | |
Microchip Technology, Inc. | | | | | | | 789 | | | | 68,635 | |
Micron Technology, Inc.(c) | | | | | | | 1,172 | | | | 49,681 | |
NVIDIA Corp. | | | | | | | 256 | | | | 51,382 | |
NXP Semiconductors NV(c) | | | | | | | 516 | | | | 58,509 | |
Qorvo, Inc.(c) | | | | | | | 444 | | | | 34,001 | |
QUALCOMM, Inc. | | | | | | | 984 | | | | 65,278 | |
Rohm Co., Ltd. | | | | | | | 200 | | | | 20,612 | |
Skyworks Solutions, Inc. | | | | | | | 431 | | | | 45,143 | |
STMicroelectronics NV | | | | | | | 1,365 | | | | 30,892 | |
Texas Instruments, Inc. | | | | | | | 847 | | | | 82,405 | |
Tokyo Electron Ltd. | | | | | | | 100 | | | | 18,605 | |
Xilinx, Inc. | | | | | | | 811 | | | | 56,373 | |
| | | | | | | | | | | | |
| | | | | | | | | | | 1,225,425 | |
| | | | | | | | | | | | |
| | |
| abfunds.com | | AB GLOBAL RISK ALLOCATION FUND | 25 |
CONSOLIDATED PORTFOLIO OF INVESTMENTS (continued)
| | | | | | | | | | | | |
| Company | | | �� | |
Shares | | | U.S. $ Value | |
| |
| | | | | | | | | | | | |
Software – 0.7% | | | | | | | | | | | | |
Activision Blizzard, Inc. | | | | | | | 841 | | | $ | 52,478 | |
Adobe Systems, Inc.(c) | | | | | | | 449 | | | | 81,480 | |
ANSYS, Inc.(c) | | | | | | | 635 | | | | 94,101 | |
Autodesk, Inc.(c) | | | | | | | 395 | | | | 43,332 | |
CA, Inc. | | | | | | | 2,135 | | | | 70,604 | |
Cadence Design Systems, Inc.(c) | | | | | | | 1,796 | | | | 78,862 | |
CDK Global, Inc. | | | | | | | 1,015 | | | | 70,126 | |
Citrix Systems, Inc.(c) | | | | | | | 604 | | | | 52,929 | |
Constellation Software, Inc./Canada | | | | | | | 106 | | | | 62,087 | |
Dassault Systemes SE | | | | | | | 646 | | | | 69,401 | |
Dell Technologies, Inc. – Class V(c) | | | | | | | 758 | | | | 59,306 | |
Electronic Arts, Inc.(c) | | | | | | | 495 | | | | 52,643 | |
Fortinet, Inc.(c) | | | | | | | 1,023 | | | | 43,027 | |
Gemalto NV | | | | | | | 365 | | | | 13,849 | |
Intuit, Inc. | | | | | | | 570 | | | | 89,615 | |
Konami Holdings Corp. | | | | | | | 400 | | | | 21,188 | |
LINE Corp.(c) | | | | | | | 600 | | | | 25,754 | |
Micro Focus International PLC (Sponsored ADR)(c) | | | | | | | 417 | | | | 13,970 | |
Microsoft Corp. | | | | | | | 995 | | | | 83,749 | |
Mobileye NV(c)(d) | | | | | | | 315 | | | | 19,787 | |
Nexon Co., Ltd.(c) | | | | | | | 1,100 | | | | 31,806 | |
Nintendo Co., Ltd. | | | | | | | 100 | | | | 40,778 | |
Nuance Communications, Inc.(c) | | | | | | | 2,749 | | | | 42,720 | |
Open Text Corp. | | | | | | | 1,658 | | | | 54,078 | |
Oracle Corp. | | | | | | | 1,536 | | | | 75,356 | |
Oracle Corp. Japan | | | | | | | 400 | | | | 35,654 | |
Red Hat, Inc.(c) | | | | | | | 568 | | | | 72,000 | |
Sage Group PLC (The) | | | | | | | 5,404 | | | | 56,600 | |
salesforce.com, Inc.(c) | | | | | | | 534 | | | | 55,707 | |
SAP SE | | | | | | | 466 | | | | 52,682 | |
ServiceNow, Inc.(c) | | | | | | | 428 | | | | 52,644 | |
Splunk, Inc.(c) | | | | | | | 575 | | | | 46,052 | |
Symantec Corp. | | | | | | | 1,835 | | | | 53,160 | |
Synopsys, Inc.(c) | | | | | | | 974 | | | | 88,030 | |
Trend Micro, Inc./Japan | | | | | | | 400 | | | | 22,706 | |
VMware, Inc. – Class A(c)(d) | | | | | | | 527 | | | | 63,298 | |
Workday, Inc. – Class A(c) | | | | | | | 384 | | | | 39,552 | |
| | | | | | | | | | | | |
| | | | | | | | | | | 1,981,111 | |
| | | | | | | | | | | | |
Technology Hardware, Storage & Peripherals – 0.2% | | | | | | | | | | | | |
Apple, Inc. | | | | | | | 407 | | | | 69,943 | |
BlackBerry Ltd.(c) | | | | | | | 2,745 | | | | 29,617 | |
Brother Industries Ltd. | | | | | | | 900 | | | | 22,381 | |
Canon, Inc. | | | | | | | 900 | | | | 34,520 | |
FUJIFILM Holdings Corp. | | | | | | | 600 | | | | 24,581 | |
| | |
| 26 | AB GLOBAL RISK ALLOCATION FUND | | abfunds.com |
CONSOLIDATED PORTFOLIO OF INVESTMENTS (continued)
| | | | | | | | | | | | |
| Company | | | | |
Shares | | | U.S. $ Value | |
| |
| | | | | | | | | | | | |
Hewlett Packard Enterprise Co. | | | | | | | 3,043 | | | $ | 42,450 | |
HP, Inc. | | | | | | | 2,579 | | | | 55,320 | |
Konica Minolta, Inc. | | | | | | | 2,400 | | | | 23,574 | |
NEC Corp. | | | | | | | 700 | | | | 18,741 | |
NetApp, Inc. | | | | | | | 1,082 | | | | 61,144 | |
Ricoh Co., Ltd. | | | | | | | 2,300 | | | | 20,486 | |
Seagate Technology PLC | | | | | | | 978 | | | | 37,712 | |
Seiko Epson Corp. | | | | | | | 900 | | | | 21,917 | |
Western Digital Corp. | | | | | | | 465 | | | | 36,670 | |
Xerox Corp. | | | | | | | 1,717 | | | | 50,926 | |
| | | | | | | | | | | | |
| | | | | | | | | | | 549,982 | |
| | | | | | | | | | | | |
| | | | | | | | | | | 8,117,059 | |
| | | | | | | | | | | | |
Industrials – 2.5% | | | | | | | | | | | | |
Aerospace & Defense – 0.3% | | | | | | | | | | | | |
Airbus SE | | | | | | | 181 | | | | 18,835 | |
Arconic, Inc. | | | | | | | 824 | | | | 20,279 | |
BAE Systems PLC | | | | | | | 2,639 | | | | 19,652 | |
Boeing Co. (The) | | | | | | | 219 | | | | 60,619 | |
Bombardier, Inc. – Class B(c) | | | | | | | 7,317 | | | | 17,014 | |
CAE, Inc. | | | | | | | 2,809 | | | | 49,598 | |
Cobham PLC(c) | | | | | | | 9,287 | | | | 15,951 | |
Dassault Aviation SA | | | | | | | 11 | | | | 16,885 | |
General Dynamics Corp. | | | | | | | 241 | | | | 49,926 | |
Huntington Ingalls Industries, Inc. | | | | | | | 180 | | | | 43,501 | |
L3 Technologies, Inc. | | | | | | | 265 | | | | 52,626 | |
Leonardo SpA | | | | | | | 684 | | | | 8,177 | |
Lockheed Martin Corp. | | | | | | | 198 | | | | 63,186 | |
Meggitt PLC | | | | | | | 2,664 | | | | 17,462 | |
Northrop Grumman Corp. | | | | | | | 198 | | | | 60,865 | |
Raytheon Co. | | | | | | | 297 | | | | 56,772 | |
Rockwell Collins, Inc. | | | | | | | 452 | | | | 59,804 | |
Rolls-Royce Holdings PLC(c) | | | | | | | 1,271 | | | | 14,741 | |
Safran SA | | | | | | | 174 | | | | 18,542 | |
Singapore Technologies Engineering Ltd. | | | | | | | 4,200 | | | | 10,193 | |
Textron, Inc. | | | | | | | 720 | | | | 40,111 | |
Thales SA | | | | | | | 192 | | | | 19,405 | |
TransDigm Group, Inc. | | | | | | | 93 | | | | 26,392 | |
United Technologies Corp. | | | | | | | 418 | | | | 50,766 | |
Zodiac Aerospace | | | | | | | 368 | | | | 10,817 | |
| | | | | | | | | | | | |
| | | | | | | | | | | 822,119 | |
| | | | | | | | | | | | |
Air Freight & Logistics – 0.1% | | | | | | | | | | | | |
Bollore SA | | | | | | | 3,319 | | | | 17,627 | |
CH Robinson Worldwide, Inc. | | | | | | | 534 | | | | 46,271 | |
Deutsche Post AG (REG) | | | | | | | 500 | | | | 23,800 | |
Expeditors International of Washington, Inc. | | | | | | | 744 | | | | 48,196 | |
FedEx Corp. | | | | | | | 189 | | | | 43,746 | |
| | |
| abfunds.com | | AB GLOBAL RISK ALLOCATION FUND | 27 |
CONSOLIDATED PORTFOLIO OF INVESTMENTS (continued)
| | | | | | | | | | | | |
| Company | | | | |
Shares | | | U.S. $ Value | |
| |
| | | | | | | | | | | | |
Kuehne & Nagel International AG (REG) | | | | | | | 139 | | | $ | 24,436 | |
Royal Mail PLC | | | | | | | 3,581 | | | | 21,423 | |
United Parcel Service, Inc. – Class B | | | | | | | 471 | | | | 57,203 | |
Yamato Holdings Co., Ltd. | | | | | | | 400 | | | | 8,150 | |
| | | | | | | | | | | | |
| | | | | | | | | | | 290,852 | |
| | | | | | | | | | | | |
Airlines – 0.1% | | | | | | | | | | | | |
American Airlines Group, Inc. | | | | | | | 507 | | | | 25,598 | |
ANA Holdings, Inc. | | | | | | | 400 | | | | 16,004 | |
Cathay Pacific Airways Ltd.(c) | | | | | | | 8,000 | | | | 12,290 | |
Delta Air Lines, Inc. | | | | | | | 566 | | | | 29,953 | |
Deutsche Lufthansa AG (REG) | | | | | | | 656 | | | | 22,572 | |
easyJet PLC | | | | | | | 784 | | | | 14,907 | |
International Consolidated Airlines Group SA | | | | | | | 1,885 | | | | 15,559 | |
Japan Airlines Co., Ltd. | | | | | | | 400 | | | | 14,675 | |
Qantas Airways Ltd. | | | | | | | 2,474 | | | | 10,673 | |
Singapore Airlines Ltd. | | | | | | | 1,500 | | | | 11,968 | |
Southwest Airlines Co. | | | | | | | 528 | | | | 32,034 | |
United Continental Holdings, Inc.(c) | | | | | | | 315 | | | | 19,946 | |
| | | | | | | | | | | | |
| | | | | | | | | | | 226,179 | |
| | | | | | | | | | | | |
Building Products – 0.1% | | | | | | | | | | | | |
AO Smith Corp. | | | | | | | 711 | | | | 45,092 | |
Asahi Glass Co., Ltd. | | | | | | | 200 | | | | 8,374 | |
Assa Abloy AB – Class B | | | | | | | 848 | | | | 17,212 | |
Cie de Saint-Gobain | | | | | | | 254 | | | | 14,477 | |
Daikin Industries Ltd. | | | | | | | 100 | | | | 11,553 | |
Fortune Brands Home & Security, Inc. | | | | | | | 681 | | | | 46,594 | |
Geberit AG (REG) | | | | | | | 50 | | | | 21,766 | |
Johnson Controls International PLC | | | | | | | 1,024 | | | | 38,543 | |
LIXIL Group Corp. | | | | | | | 400 | | | | 10,560 | |
Masco Corp. | | | | | | | 1,061 | | | | 45,528 | |
TOTO Ltd. | | | | | | | 300 | | | | 16,744 | |
| | | | | | | | | | | | |
| | | | | | | | | | | 276,443 | |
| | | | | | | | | | | | |
Commercial Services & Supplies – 0.2% | | | | | | | | | | | | |
Babcock International Group PLC | | | | | | | 1,434 | | | | 13,518 | |
Brambles Ltd. | | | | | | | 1,685 | | | | 13,083 | |
Cintas Corp. | | | | | | | 386 | | | | 60,772 | |
Dai Nippon Printing Co., Ltd. | | | | | | | 500 | | | | 10,963 | |
Edenred | | | | | | | 463 | | | | 13,236 | |
G4S PLC | | | | | | | 3,969 | | | | 13,768 | |
ISS A/S | | | | | | | 413 | | | | 15,604 | |
Park24 Co., Ltd. | | | | | | | 400 | | | | 9,845 | |
Republic Services, Inc. – Class A | | | | | | | 966 | | | | 62,732 | |
Secom Co., Ltd. | | | | | | | 200 | | | | 14,980 | |
Securitas AB – Class B | | | | | | | 1,405 | | | | 24,691 | |
Societe BIC SA | | | | | | | 160 | | | | 18,564 | |
Sohgo Security Services Co., Ltd. | | | | | | | 200 | | | | 11,128 | |
| | |
| 28 | AB GLOBAL RISK ALLOCATION FUND | | abfunds.com |
CONSOLIDATED PORTFOLIO OF INVESTMENTS (continued)
| | | | | | | | | | | | |
| Company | | | | |
Shares | | | U.S. $ Value | |
| |
| | | | | | | | | | | | |
Stericycle, Inc.(c) | | | | | | | 372 | | | $ | 24,667 | |
Toppan Printing Co., Ltd. | | | | | | | 1,000 | | | | 9,338 | |
Waste Connections, Inc. | | | | | | | 891 | | | | 61,328 | |
Waste Management, Inc. | | | | | | | 916 | | | | 75,341 | |
| | | | | | | | | | | | |
| | | | | | | | | | | 453,558 | |
| | | | | | | | | | | | |
Construction & Engineering – 0.4% | | | | | | | | | | | | |
ACS Actividades de Construccion y Servicios SA | | | | | | | 436 | | | | 16,848 | |
Boskalis Westminster | | | | | | | 549 | | | | 20,277 | |
Bouygues SA | | | | | | | 319 | | | | 16,489 | |
China Communications Construction Co., Ltd. – Class H | | | | | | | 248,000 | | | | 277,261 | |
China Railway Construction Corp., Ltd. – Class H | | | | | | | 224,500 | | | | 266,536 | |
China Railway Group Ltd. – Class H | | | | | | | 360,000 | | | | 269,849 | |
CIMIC Group Ltd. | | | | | | | 319 | | | | 12,410 | |
Eiffage SA | | | | | | | 192 | | | | 21,047 | |
Ferrovial SA | | | | | | | 951 | | | | 20,950 | |
Fluor Corp. | | | | | | | 716 | | | | 34,662 | |
HOCHTIEF AG | | | | | | | 79 | | | | 13,901 | |
Jacobs Engineering Group, Inc. | | | | | | | 615 | | | | 40,362 | |
JGC Corp. | | | | | | | 700 | | | | 12,214 | |
Kajima Corp. | | | | | | | 2,000 | | | | 21,061 | |
Obayashi Corp. | | | | | | | 1,000 | | | | 12,982 | |
Orascom Construction Ltd.(c) | | | | | | | 173 | | | | 1,315 | |
Shimizu Corp. | | | | | | | 1,000 | | | | 11,148 | |
Skanska AB – Class B | | | | | | | 763 | | | | 16,760 | |
SNC-Lavalin Group, Inc. | | | | | | | 1,097 | | | | 47,846 | |
Taisei Corp. | | | | | | | 400 | | | | 21,068 | |
Vinci SA | | | | | | | 175 | | | | 17,877 | |
| | | | | | | | | | | | |
| | | | | | | | | | | 1,172,863 | |
| | | | | | | | | | | | |
Electrical Equipment – 0.1% | | | | | | | | | | | | |
ABB Ltd. (REG) | | | | | | | 788 | | | | 20,231 | |
Acuity Brands, Inc. | | | | | | | 140 | | | | 23,999 | |
AMETEK, Inc. | | | | | | | 672 | | | | 48,848 | |
Eaton Corp. PLC | | | | | | | 547 | | | | 42,546 | |
Emerson Electric Co. | | | | | | | 688 | | | | 44,596 | |
Fuji Electric Co., Ltd. | | | | | | | 2,000 | | | | 14,181 | |
Legrand SA | | | | | | | 296 | | | | 22,155 | |
Mabuchi Motor Co., Ltd. | | | | | | | 200 | | | | 10,742 | |
Mitsubishi Electric Corp. | | | | | | | 700 | | | | 11,630 | |
Nidec Corp. | | | | | | | 100 | | | | 13,661 | |
OSRAM Licht AG | | | | | | | 209 | | | | 17,937 | |
Prysmian SpA | | | | | | | 537 | | | | 17,886 | |
Rockwell Automation, Inc. | | | | | | | 235 | | | | 45,374 | |
Schneider Electric SE (Paris)(c) | | | | | | | 198 | | | | 17,016 | |
Sensata Technologies Holding NV(c) | | | | | | | 858 | | | | 42,857 | |
Vestas Wind Systems A/S | | | | | | | 152 | | | | 9,692 | |
| | | | | | | | | | | | |
| | | | | | | | | | | 403,351 | |
| | | | | | | | | | | | |
| | |
| abfunds.com | | AB GLOBAL RISK ALLOCATION FUND | 29 |
CONSOLIDATED PORTFOLIO OF INVESTMENTS (continued)
| | | | | | | | | | | | |
| Company | | | | |
Shares | | | U.S. $ Value | |
| |
| | | | | | | | | | | | |
Industrial Conglomerates – 0.1% | | | | | | | | | | | | |
3M Co. | | | | | | | 284 | | | $ | 69,052 | |
CK Hutchison Holdings Ltd. | | | | | | | 1,184 | | | | 14,940 | |
DCC PLC | | | | | | | 173 | | | | 16,757 | |
General Electric Co. | | | | | | | 1,596 | | | | 29,191 | |
Honeywell International, Inc. | | | | | | | 378 | | | | 58,953 | |
Jardine Matheson Holdings Ltd. | | | | | | | 200 | | | | 12,496 | |
Jardine Strategic Holdings Ltd. | | | | | | | 300 | | | | 12,450 | |
Keihan Holdings Co., Ltd. | | | | | | | 400 | | | | 11,877 | |
Keppel Corp., Ltd. | | | | | | | 2,400 | | | | 13,650 | |
NWS Holdings Ltd. | | | | | | | 5,257 | | | | 9,584 | |
Roper Technologies, Inc. | | | | | | | 184 | | | | 49,167 | |
Seibu Holdings, Inc. | | | | | | | 600 | | | | 10,871 | |
Sembcorp Industries Ltd. | | | | | | | 4,900 | | | | 11,118 | |
Siemens AG (REG) | | | | | | | 118 | | | | 16,041 | |
Smiths Group PLC | | | | | | | 1,381 | | | | 27,700 | |
Toshiba Corp.(c) | | | | | | | 2,000 | | | | 4,930 | |
| | | | | | | | | | | | |
| | | | | | | | | | | 368,777 | |
| | | | | | | | | | | | |
Machinery – 0.5% | | | | | | | | | | | | |
AGCO Corp. | | | | | | | 496 | | | | 35,107 | |
Alfa Laval AB | | | | | | | 849 | | | | 20,092 | |
Alstom SA | | | | | | | 518 | | | | 21,362 | |
Amada Holdings Co., Ltd. | | | | | | | 900 | | | | 12,033 | |
ANDRITZ AG | | | | | | | 354 | | | | 19,802 | |
Atlas Copco AB – Class A | | | | | | | 436 | | | | 18,744 | |
Atlas Copco AB – Class B | | | | | | | 520 | | | | 20,008 | |
Caterpillar, Inc. | | | | | | | 323 | | | | 45,592 | |
CNH Industrial NV | | | | | | | 1,193 | | | | 15,491 | |
Cummins, Inc. | | | | | | | 221 | | | | 36,995 | |
Deere & Co. | | | | | | | 289 | | | | 43,310 | |
Dover Corp. | | | | | | | 428 | | | | 41,820 | |
FANUC Corp. | | | | | | | 100 | | | | 25,010 | |
Flowserve Corp. | | | | | | | 599 | | | | 25,505 | |
Fortive Corp. | | | | | | | 674 | | | | 50,314 | |
GEA Group AG | | | | | | | 378 | | | | 18,281 | |
Hino Motors Ltd. | | | | | | | 900 | | | | 11,117 | |
Hitachi Construction Machinery Co., Ltd. | | | | | | | 400 | | | | 13,320 | |
Hoshizaki Corp. | | | | | | | 100 | | | | 9,532 | |
IHI Corp. | | | | | | | 200 | | | | 6,239 | |
Illinois Tool Works, Inc. | | | | | | | 349 | | | | 59,068 | |
IMI PLC | | | | | | | 1,187 | | | | 20,162 | |
Ingersoll-Rand PLC | | | | | | | 469 | | | | 41,094 | |
JTEKT Corp. | | | | | | | 700 | | | | 12,120 | |
Kawasaki Heavy Industries Ltd. | | | | | | | 300 | | | | 10,011 | |
Komatsu Ltd. | | | | | | | 400 | | | | 12,538 | |
Kone Oyj – Class B | | | | | | | 326 | | | | 16,778 | |
Kubota Corp. | | | | | | | 700 | | | | 13,325 | |
| | |
| 30 | AB GLOBAL RISK ALLOCATION FUND | | abfunds.com |
CONSOLIDATED PORTFOLIO OF INVESTMENTS (continued)
| | | | | | | | | | | | |
| Company | | | | |
Shares | | | U.S. $ Value | |
| |
| | | | | | | | | | | | |
Kurita Water Industries Ltd. | | | | | | | 400 | | | $ | 12,578 | |
Makita Corp. | | | | | | | 300 | | | | 12,438 | |
MAN SE | | | | | | | 62 | | | | 6,963 | |
Metso Oyj | | | | | | | 392 | | | | 13,821 | |
Middleby Corp. (The)(c) | | | | | | | 251 | | | | 32,008 | |
MINEBEA MITSUMI, Inc. | | | | | | | 500 | | | | 9,972 | |
Mitsubishi Heavy Industries Ltd. | | | | | | | 300 | | | | 11,160 | |
Nabtesco Corp. | | | | | | | 400 | | | | 15,730 | |
NGK Insulators Ltd. | | | | | | | 600 | | | | 11,522 | |
NSK Ltd. | | | | | | | 600 | | | | 9,153 | |
PACCAR, Inc. | | | | | | | 502 | | | | 35,306 | |
Parker-Hannifin Corp. | | | | | | | 211 | | | | 39,560 | |
Pentair PLC | | | | | | | 481 | | | | 34,228 | |
Sandvik AB | | | | | | | 907 | | | | 15,593 | |
Schindler Holding AG | | | | | | | 78 | | | | 17,665 | |
Schindler Holding AG (REG) | | | | | | | 81 | | | | 18,048 | |
SKF AB – Class B | | | | | | | 706 | | | | 15,984 | |
Snap-on, Inc. | | | | | | | 233 | | | | 39,477 | |
Stanley Black & Decker, Inc. | | | | | | | 329 | | | | 55,808 | |
Sumitomo Heavy Industries Ltd. | | | | | | | 400 | | | | 16,458 | |
THK Co., Ltd. | | | | | | | 400 | | | | 14,795 | |
Volvo AB – Class B | | | | | | | 910 | | | | 17,345 | |
WABCO Holdings, Inc.(c) | | | | | | | 273 | | | | 40,800 | |
Wabtec Corp./DE | | | | | | | 449 | | | | 34,528 | |
Wartsila Oyj Abp | | | | | | | 244 | | | | 16,118 | |
Weir Group PLC (The) | | | | | | | 503 | | | | 13,365 | |
Xylem, Inc./NY | | | | | | | 796 | | | | 55,195 | |
Yangzijiang Shipbuilding Holdings Ltd. | | | | | | | 12,600 | | | | 14,730 | |
Zardoya Otis SA | | | | | | | 1,731 | | | | 19,346 | |
| | | | | | | | | | | | |
| | | | | | | | | | | 1,324,464 | |
| | | | | | | | | | | | |
Marine – 0.0% | | | | | | | | | | | | |
AP Moller – Maersk A/S – Class A | | | | | | | 10 | | | | 17,172 | |
AP Moller – Maersk A/S – Class B | | | | | | | 9 | | | | 16,226 | |
Mitsui OSK Lines Ltd. | | | | | | | 300 | | | | 9,720 | |
Nippon Yusen KK(c) | | | | | | | 500 | | | | 11,749 | |
| | | | | | | | | | | | |
| | | | | | | | | | | 54,867 | |
| | | | | | | | | | | | |
Professional Services – 0.2% | | | | | | | | | | | | |
Adecco Group AG (REG) | | | | | | | 233 | | | | 17,639 | |
Bureau Veritas SA | | | | | | | 963 | | | | 25,512 | |
Capita PLC | | | | | | | 1,612 | | | | 10,177 | |
Dun & Bradstreet Corp. (The) | | | | | | | 311 | | | | 38,287 | |
Equifax, Inc. | | | | | | | 383 | | | | 43,708 | |
Experian PLC | | | | | | | 1,125 | | | | 23,408 | |
Intertek Group PLC | | | | | | | 254 | | | | 17,974 | |
ManpowerGroup, Inc. | | | | | | | 340 | | | | 43,826 | |
Nielsen Holdings PLC | | | | | | | 827 | | | | 30,367 | |
| | |
| abfunds.com | | AB GLOBAL RISK ALLOCATION FUND | 31 |
CONSOLIDATED PORTFOLIO OF INVESTMENTS (continued)
| | | | | | | | | | | | |
| Company | | | | |
Shares | | | U.S. $ Value | |
| |
| | | | | | | | | | | | |
Randstad Holding NV | | | | | | | 258 | | | $ | 15,869 | |
Recruit Holdings Co., Ltd. | | | | | | | 600 | | | | 14,138 | |
RELX NV | | | | | | | 1,139 | | | | 26,046 | |
RELX PLC | | | | | | | 1,122 | | | | 26,214 | |
Robert Half International, Inc. | | | | | | | 701 | | | | 39,985 | |
SEEK Ltd. | | | | | | | 867 | | | | 12,210 | |
SGS SA (REG) | | | | | | | 10 | | | | 24,764 | |
Verisk Analytics, Inc. – Class A(c) | | | | | | | 637 | | | | 61,420 | |
Wolters Kluwer NV | | | | | | | 490 | | | | 25,372 | |
| | | | | | | | | | | | |
| | | | | | | | | | | 496,916 | |
| | | | | | | | | | | | |
Road & Rail – 0.2% | | | | | | | | | | | | |
AMERCO | | | | | | | 94 | | | | 34,843 | |
Aurizon Holdings Ltd. | | | | | | | 2,894 | | | | 11,644 | |
Canadian National Railway Co. (Toronto) | | | | | | | 661 | | | | 51,598 | |
Canadian Pacific Railway Ltd. | | | | | | | 280 | | | | 49,005 | |
Central Japan Railway Co. | | | | | | | 84 | | | | 15,571 | |
ComfortDelGro Corp., Ltd. | | | | | | | 6,300 | | | | 9,375 | |
CSX Corp. | | | | | | | 526 | | | | 29,324 | |
DSV A/S | | | | | | | 295 | | | | 22,719 | |
East Japan Railway Co. | | | | | | | 200 | | | | 19,379 | |
Hankyu Hanshin Holdings, Inc. | | | | | | | 300 | | | | 11,648 | |
JB Hunt Transport Services, Inc. | | | | | | | 438 | | | | 48,679 | |
Kansas City Southern | | | | | | | 333 | | | | 37,343 | |
Keikyu Corp. | | | | | | | 500 | | | | 9,681 | |
Keio Corp. | | | | | | | 200 | | | | 8,849 | |
Keisei Electric Railway Co., Ltd. | | | | | | | 400 | | | | 12,846 | |
Kintetsu Group Holdings Co., Ltd. | | | | | | | 300 | | | | 11,774 | |
MTR Corp., Ltd. | | | | | | | 3,000 | | | | 17,687 | |
Nagoya Railroad Co., Ltd. | | | | | | | 400 | | | | 9,765 | |
Nippon Express Co., Ltd. | | | | | | | 200 | | | | 12,745 | |
Norfolk Southern Corp. | | | | | | | 311 | | | | 43,114 | |
Odakyu Electric Railway Co., Ltd. | | | | | | | 600 | | | | 12,772 | |
Tobu Railway Co., Ltd. | | | | | | | 400 | | | | 12,764 | |
Tokyu Corp. | | | | | | | 1,000 | | | | 15,996 | |
Union Pacific Corp. | | | | | | | 324 | | | | 40,986 | |
West Japan Railway Co. | | | | | | | 218 | | | | 16,049 | |
| | | | | | | | | | | | |
| | | | | | | | | | | 566,156 | |
| | | | | | | | | | | | |
Trading Companies & Distributors – 0.1% | | | | | | | | | | | | |
AerCap Holdings NV(c) | | | | | | | 317 | | | | 16,475 | |
Ashtead Group PLC | | | | | | | 560 | | | | 14,390 | |
Brenntag AG | | | | | | | 322 | | | | 20,062 | |
Bunzl PLC | | | | | | | 677 | | | | 19,372 | |
Fastenal Co. | | | | | | | 755 | | | | 39,554 | |
Ferguson PLC | | | | | | | 313 | | | | 22,570 | |
Finning International, Inc. | | | | | | | 1,846 | | | | 44,227 | |
ITOCHU Corp. | | | | | | | 1,000 | | | | 17,384 | |
| | |
| 32 | AB GLOBAL RISK ALLOCATION FUND | | abfunds.com |
CONSOLIDATED PORTFOLIO OF INVESTMENTS (continued)
| | | | | | | | | | | | |
| Company | | | | |
Shares | | | U.S. $ Value | |
| |
| | | | | | | | | | | | |
Marubeni Corp. | | | | | | | 2,200 | | | $ | 14,686 | |
MISUMI Group, Inc. | | | | | | | 500 | | | | 14,657 | |
Mitsubishi Corp. | | | | | | | 600 | | | | 15,090 | |
Mitsui & Co., Ltd. | | | | | | | 1,100 | | | | 16,778 | |
Rexel SA | | | | | | | 970 | | | | 17,873 | |
Sumitomo Corp. | | | | | | | 1,000 | | | | 15,598 | |
Toyota Tsusho Corp. | | | | | | | 400 | | | | 15,128 | |
Travis Perkins PLC | | | | | | | 782 | | | | 17,016 | |
United Rentals, Inc.(c) | | | | | | | 195 | | | | 31,099 | |
WW Grainger, Inc. | | | | | | | 196 | | | | 43,377 | |
| | | | | | | | | | | | |
| | | | | | | | | | | 395,336 | |
| | | | | | | | | | | | |
Transportation Infrastructure – 0.1% | | | | | | | | | | | | |
Abertis Infraestructuras SA | | | | | | | 1,446 | | | | 32,261 | |
Aena SME SA(b) | | | | | | | 131 | | | | 26,046 | |
Aeroports de Paris | | | | | | | 132 | | | | 25,177 | |
Atlantia SpA | | | | | | | 613 | | | | 20,378 | |
Auckland International Airport Ltd. | | | | | | | 2,334 | | | | 10,178 | |
Fraport AG Frankfurt Airport Services Worldwide | | | | | | | 264 | | | | 26,318 | |
Groupe Eurotunnel SE (REG) | | | | | | | 1,705 | | | | 22,668 | |
Hutchison Port Holdings Trust – Class U | | | | | | | 27,300 | | | | 11,634 | |
Japan Airport Terminal Co., Ltd. | | | | | | | 300 | | | | 11,246 | |
Kamigumi Co., Ltd. | | | | | | | 500 | | | | 11,028 | |
Macquarie Infrastructure Corp. | | | | | | | 570 | | | | 38,065 | |
Mitsubishi Logistics Corp. | | | | | | | 500 | | | | 13,420 | |
SATS Ltd. | | | | | | | 2,900 | | | | 11,376 | |
Sydney Airport | | | | | | | 2,782 | | | | 15,647 | |
Transurban Group | | | | | | | 1,567 | | | | 14,911 | |
| | | | | | | | | | | | |
| | | | | | | | | | | 290,353 | |
| | | | | | | | | | | | |
| | | | | | | | | | | 7,142,234 | |
| | | | | | | | | | | | |
Consumer Staples – 2.3% | | | | | | | | | | | | |
Beverages – 0.4% | | | | | | | | | | | | |
Anheuser-Busch InBev SA/NV | | | | | | | 336 | | | | 38,493 | |
Asahi Group Holdings Ltd. | | | | | | | 900 | | | | 45,731 | |
Brown-Forman Corp. – Class B | | | | | | | 1,243 | | | | 74,331 | |
Carlsberg A/S – Class B | | | | | | | 434 | | | | 51,487 | |
Coca-Cola Amatil Ltd. | | | | | | | 5,133 | | | | 30,937 | |
Coca-Cola Bottlers Japan, Inc. | | | | | | | 1,200 | | | | 45,667 | |
Coca-Cola Co. (The) | | | | | | | 2,349 | | | | 107,514 | |
Coca-Cola European Partners PLC | | | | | | | 1,012 | | | | 39,388 | |
Coca-Cola HBC AG(c) | | | | | | | 1,304 | | | | 41,778 | |
Constellation Brands, Inc. – Class A | | | | | | | 321 | | | | 69,846 | |
Diageo PLC | | | | | | | 1,525 | | | | 52,725 | |
Dr Pepper Snapple Group, Inc. | | | | | | | 924 | | | | 83,336 | |
Heineken Holding NV | | | | | | | 450 | | | | 43,325 | |
Heineken NV | | | | | | | 502 | | | | 51,099 | |
Kirin Holdings Co., Ltd. | | | | | | | 1,800 | | | | 42,132 | |
| | |
| abfunds.com | | AB GLOBAL RISK ALLOCATION FUND | 33 |
CONSOLIDATED PORTFOLIO OF INVESTMENTS (continued)
| | | | | | | | | | | | |
| Company | | | | |
Shares | | | U.S. $ Value | |
| |
| | | | | | | | | | | | |
Molson Coors Brewing Co. – Class B | | | | | | | 775 | | | $ | 60,528 | |
Monster Beverage Corp.(c) | | | | | | | 1,264 | | | | 79,215 | |
PepsiCo, Inc. | | | | | | | 845 | | | | 98,459 | |
Pernod Ricard SA | | | | | | | 347 | | | | 54,083 | |
Remy Cointreau SA | | | | | | | 337 | | | | 44,809 | |
Suntory Beverage & Food Ltd. | | | | | | | 800 | | | | 34,624 | |
Treasury Wine Estates Ltd. | | | | | | | 645 | | | | 7,735 | |
| | | | | | | | | | | | |
| | | | | | | | | | | 1,197,242 | |
| | | | | | | | | | | | |
Food & Staples Retailing – 0.6% | | | | | | | | | | | | |
Aeon Co., Ltd. | | | | | | | 2,800 | | | | 45,573 | |
Alimentation Couche-Tard, Inc. – Class B | | | | | | | 1,687 | | | | 86,027 | |
Carrefour SA | | | | | | | 1,249 | | | | 26,199 | |
Casino Guichard Perrachon SA | | | | | | | 448 | | | | 27,246 | |
Colruyt SA | | | | | | | 915 | | | | 48,502 | |
Costco Wholesale Corp. | | | | | | | 505 | | | | 93,137 | |
CVS Health Corp. | | | | | | | 854 | | | | 65,416 | |
Distribuidora Internacional de Alimentacion SA | | | | | | | 6,300 | | | | 29,646 | |
Empire Co., Ltd. – Class A | | | | | | | 3,731 | | | | 71,777 | |
FamilyMart UNY Holdings Co., Ltd. | | | | | | | 600 | | | | 40,525 | |
George Weston Ltd. | | | | | | | 1,022 | | | | 87,066 | |
ICA Gruppen AB | | | | | | | 1,334 | | | | 48,288 | |
J Sainsbury PLC | | | | | | | 10,711 | | | | 33,632 | |
Jean Coutu Group PJC, Inc. (The) – Class A | | | | | | | 4,420 | | | | 84,210 | |
Jeronimo Martins SGPS SA | | | | | | | 2,095 | | | | 41,144 | |
Koninklijke Ahold Delhaize NV | | | | | | | 1,925 | | | | 41,187 | |
Kroger Co. (The) | | | | | | | 1,741 | | | | 45,022 | |
Lawson, Inc. | | | | | | | 700 | | | | 48,292 | |
Loblaw Cos., Ltd. | | | | | | | 1,937 | | | | 101,988 | |
METRO AG(c) | | | | | | | 963 | | | | 18,811 | |
Metro, Inc. | | | | | | | 2,641 | | | | 82,721 | |
Rite Aid Corp.(c)(d) | | | | | | | 1,822 | | | | 3,662 | |
Seven & i Holdings Co., Ltd. | | | | | | | 900 | | | | 37,256 | |
Sundrug Co., Ltd. | | | | | | | 900 | | | | 41,499 | |
Sysco Corp. | | | | | | | 1,355 | | | | 78,224 | |
Tesco PLC | | | | | | | 14,259 | | | | 37,421 | |
Tsuruha Holdings, Inc. | | | | | | | 300 | | | | 41,463 | |
Wal-Mart Stores, Inc. | | | | | | | 1,159 | | | | 112,690 | |
Walgreens Boots Alliance, Inc. | | | | | | | 793 | | | | 57,699 | |
Wesfarmers Ltd. | | | | | | | 1,156 | | | | 38,561 | |
Wm Morrison Supermarkets PLC | | | | | | | 13,410 | | | | 39,228 | |
Woolworths Ltd. | | | | | | | 2,044 | | | | 41,837 | |
| | | | | | | | | | | | |
| | | | | | | | | | | 1,695,949 | |
| | | | | | | | | | | | |
Food Products – 0.7% | | | | | | | | | | | | |
Ajinomoto Co., Inc. | | | | | | | 1,500 | | | | 27,576 | |
Archer-Daniels-Midland Co. | | | | | | | 1,514 | | | | 60,378 | |
Aryzta AG(c) | | | | | | | 565 | | | | 18,912 | |
| | |
| 34 | AB GLOBAL RISK ALLOCATION FUND | | abfunds.com |
CONSOLIDATED PORTFOLIO OF INVESTMENTS (continued)
| | | | | | | | | | | | |
| Company | | | | |
Shares | | | U.S. $ Value | |
| |
| | | | | | | | | | | | |
Associated British Foods PLC | | | | | | | 933 | | | $ | 37,185 | |
Barry Callebaut AG (REG)(c) | | | | | | | 33 | | | | 61,432 | |
Bunge Ltd. | | | | | | | 891 | | | | 59,617 | |
Calbee, Inc. | | | | | | | 900 | | | | 31,524 | |
Campbell Soup Co. | | | | | | | 1,279 | | | | 63,055 | |
Chocoladefabriken Lindt & Spruengli AG | | | | | | | 9 | | | | 53,199 | |
Chocoladefabriken Lindt & Spruengli AG (REG) | | | | | | | 1 | | | | 70,122 | |
Conagra Brands, Inc. | | | | | | | 1,969 | | | | 73,503 | |
Danone SA | | | | | | | 580 | | | | 48,980 | |
General Mills, Inc. | | | | | | | 1,305 | | | | 73,811 | |
Golden Agri-Resources Ltd. | | | | | | | 132,000 | | | | 36,290 | |
Hershey Co. (The) | | | | | | | 758 | | | | 84,085 | |
Hormel Foods Corp.(d) | | | | | | | 1,930 | | | | 70,349 | |
Ingredion, Inc. | | | | | | | 628 | | | | 86,965 | |
JM Smucker Co. (The) | | | | | | | 614 | | | | 71,635 | |
Kellogg Co. | | | | | | | 1,053 | | | | 69,666 | |
Kerry Group PLC – Class A | | | | | | | 503 | | | | 52,685 | |
Kikkoman Corp. | | | | | | | 1,200 | | | | 47,100 | |
Kraft Heinz Co. (The) | | | | | | | 886 | | | | 72,094 | |
Marine Harvest ASA(c) | | | | | | | 1,945 | | | | 34,305 | |
McCormick & Co., Inc./MD | | | | | | | 900 | | | | 91,962 | |
MEIJI Holdings Co., Ltd. | | | | | | | 400 | | | | 34,789 | |
Mondelez International, Inc. – Class A | | | | | | | 1,174 | | | | 50,412 | |
Nestle SA (REG) | | | | | | | 608 | | | | 52,014 | |
NH Foods Ltd. | | | | | | | 1,000 | | | | 24,582 | |
Nisshin Seifun Group, Inc. | | | | | | | 2,500 | | | | 48,951 | |
Nissin Foods Holdings Co., Ltd. | | | | | | | 600 | | | | 43,435 | |
Orkla ASA | | | | | | | 3,826 | | | | 38,379 | |
Saputo, Inc. | | | | | | | 2,289 | | | | 77,675 | |
Tate & Lyle PLC | | | | | | | 4,685 | | | | 42,627 | |
Toyo Suisan Kaisha Ltd. | | | | | | | 900 | | | | 38,377 | |
Tyson Foods, Inc. – Class A | | | | | | | 1,060 | | | | 87,185 | |
WH Group Ltd.(b) | | | | | | | 40,500 | | | | 43,137 | |
Wilmar International Ltd. | | | | | | | 13,700 | | | | 31,821 | |
Yakult Honsha Co., Ltd. | | | | | | | 500 | | | | 38,991 | |
Yamazaki Baking Co., Ltd. | | | | | | | 1,800 | | | | 34,768 | |
| | | | | | | | | | | | |
| | | | | | | | | | | 2,083,573 | |
| | | | | | | | | | | | |
Household Products – 0.3% | |
Church & Dwight Co., Inc. | | | | | | | 1,639 | | | | 77,181 | |
Clorox Co. (The) | | | | | | | 669 | | | | 93,185 | |
Colgate-Palmolive Co. | | | | | | | 1,207 | | | | 87,447 | |
Edgewell Personal Care Co.(c) | | | | | | | 667 | | | | 38,679 | |
Essity AB – Class B(c) | | | | | | | 1,288 | | | | 37,449 | |
Henkel AG & Co. KGaA | | | | | | | 338 | | | | 41,236 | |
Henkel AG & Co. KGaA (Preference Shares) | | | | | | | 356 | | | | 48,367 | |
Kimberly-Clark Corp. | | | | | | | 706 | | | | 84,551 | |
| | |
| abfunds.com | | AB GLOBAL RISK ALLOCATION FUND | 35 |
CONSOLIDATED PORTFOLIO OF INVESTMENTS (continued)
| | | | | | | | | | | | |
| Company | | | | |
Shares | | | U.S. $ Value | |
| |
| | | | | | | | | | | | |
Lion Corp. | | | | | | | 1,800 | | | $ | 33,682 | |
Procter & Gamble Co. (The) | | | | | | | 1,192 | | | | 107,268 | |
Reckitt Benckiser Group PLC | | | | | | | 499 | | | | 43,801 | |
Spectrum Brands Holdings, Inc. | | | | | | | 551 | | | | 63,299 | |
Unicharm Corp. | | | | | | | 1,300 | | | | 34,139 | |
| | | | | | | | | | | | |
| | | | | | | | | | | 790,284 | |
| | | | | | | | | | | | |
Personal Products – 0.2% | |
Beiersdorf AG | | | | | | | 471 | | | | 56,092 | |
Coty, Inc. – Class A(d) | | | | | | | 2,104 | | | | 36,252 | |
Estee Lauder Cos., Inc. (The) – Class A | | | | | | | 855 | | | | 106,730 | |
Kao Corp. | | | | | | | 500 | | | | 33,150 | |
Kose Corp. | | | | | | | 300 | | | | 46,103 | |
L’Oreal SA | | | | | | | 228 | | | | 50,432 | |
Pola Orbis Holdings, Inc. | | | | | | | 1,400 | | | | 51,170 | |
Shiseido Co., Ltd. | | | | | | | 900 | | | | 43,999 | |
Unilever NV | | | | | | | 860 | | | | 49,595 | |
Unilever PLC | | | | | | | 811 | | | | 45,747 | |
| | | | | | | | | | | | |
| | | | | | | | | | | 519,270 | |
| | | | | | | | | | | | |
Tobacco – 0.1% | | | | | | | | | | | | |
Altria Group, Inc. | | | | | | | 1,060 | | | | 71,900 | |
British American Tobacco PLC | | | | | | | 579 | | | | 36,820 | |
British American Tobacco PLC (Sponsored ADR) | | | | | | | 643 | | | | 40,914 | |
Imperial Brands PLC | | | | | | | 987 | | | | 40,910 | |
Japan Tobacco, Inc. | | | | | | | 1,099 | | | | 36,397 | |
Philip Morris International, Inc. | | | | | | | 715 | | | | 73,466 | |
Swedish Match AB | | | | | | | 1,345 | | | | 50,889 | |
| | | | | | | | | | | | |
| | | | | | | | | | | 351,296 | |
| | | | | | | | | | | | |
| | | | | | | | | | | 6,637,614 | |
| | | | | | | | | | | | |
Consumer Discretionary – 2.3% | | | | | | | | | | | | |
Auto Components – 0.2% | | | | | | | | | | | | |
Aisin Seiki Co., Ltd. | | | | | | | 300 | | | | 16,144 | |
Autoliv, Inc.(d) | | | | | | | 287 | | | | 36,713 | |
BorgWarner, Inc. | | | | | | | 633 | | | | 35,246 | |
Bridgestone Corp. | | | | | | | 500 | | | | 22,850 | |
Cie Generale des Etablissements Michelin – Class B | | | | | | | 199 | | | | 28,856 | |
Continental AG | | | | | | | 107 | | | | 28,519 | |
Delphi Automotive PLC | | | | | | | 302 | | | | 31,610 | |
Denso Corp. | | | | | | | 400 | | | | 22,582 | |
GKN PLC | | | | | | | 5,805 | | | | 24,329 | |
Goodyear Tire & Rubber Co. (The) | | | | | | | 816 | | | | 26,414 | |
Koito Manufacturing Co., Ltd. | | | | | | | 300 | | | | 20,849 | |
Lear Corp. | | | | | | | 199 | | | | 35,997 | |
Linamar Corp. | | | | | | | 630 | | | | 34,060 | |
Magna International, Inc. (Toronto) – Class A | | | | | | | 729 | | | | 40,893 | |
NGK Spark Plug Co., Ltd. | | | | | | | 700 | | | | 16,258 | |
| | |
| 36 | AB GLOBAL RISK ALLOCATION FUND | | abfunds.com |
CONSOLIDATED PORTFOLIO OF INVESTMENTS (continued)
| | | | | | | | | | | | |
| Company | | | | |
Shares | | | U.S. $ Value | |
| |
| | | | | | | | | | | | |
NOK Corp. | | | | | | | 700 | | | $ | 17,133 | |
Nokian Renkaat Oyj | | | | | | | 578 | | | | 25,231 | |
Schaeffler AG (Preference Shares) | | | | | | | 1,288 | | | | 22,474 | |
Stanley Electric Co., Ltd. | | | | | | | 500 | | | | 20,084 | |
Sumitomo Electric Industries Ltd. | | | | | | | 900 | | | | 15,786 | |
Sumitomo Rubber Industries Ltd. | | | | | | | 800 | | | | 14,639 | |
Toyoda Gosei Co., Ltd. | | | | | | | 600 | | | | 15,047 | |
Toyota Industries Corp. | | | | | | | 300 | | | | 18,735 | |
Valeo SA | | | | | | | 282 | | | | 20,450 | |
Yokohama Rubber Co., Ltd. (The) | | | | | | | 700 | | | | 15,775 | |
| | | | | | | | | | | | |
| | | | | | | | | | | 606,674 | |
| | | | | | | | | | | | |
Automobiles – 0.2% | | | | | | | | | | | | |
Bayerische Motoren Werke AG | | | | | | | 252 | | | | 25,441 | |
Bayerische Motoren Werke AG (Preference Shares) | | | | | | | 288 | | | | 24,942 | |
Daimler AG (REG) | | | | | | | 349 | | | | 28,913 | |
Ferrari NV | | | | | | | 303 | | | | 32,892 | |
Fiat Chrysler Automobiles NV(c) | | | | | | | 1,290 | | | | 22,153 | |
Ford Motor Co. | | | | | | | 2,754 | | | | 34,480 | |
General Motors Co. | | | | | | | 869 | | | | 37,445 | |
Harley-Davidson, Inc.(d) | | | | | | | 457 | | | | 22,941 | |
Honda Motor Co., Ltd. | | | | | | | 700 | | | | 23,370 | |
Isuzu Motors Ltd. | | | | | | | 1,200 | | | | 19,094 | |
Mazda Motor Corp. | | | | | | | 1,000 | | | | 13,510 | |
Mitsubishi Motors Corp. | | | | | | | 2,200 | | | | 15,510 | |
Nissan Motor Co., Ltd. | | | | | | | 2,100 | | | | 20,421 | |
Peugeot SA | | | | | | | 996 | | | | 20,581 | |
Porsche Automobil Holding SE (Preference Shares) | | | | | | | 377 | | | | 31,583 | |
Renault SA | | | | | | | 203 | | | | 20,612 | |
Subaru Corp. | | | | | | | 400 | | | | 13,181 | |
Suzuki Motor Corp. | | | | | | | 300 | | | | 16,238 | |
Tesla, Inc.(c)(d) | | | | | | | 54 | | | | 16,678 | |
Toyota Motor Corp. | | | | | | | 300 | | | | 18,944 | |
Volkswagen AG | | | | | | | 151 | | | | 31,335 | |
Volkswagen AG (Preference Shares) | | | | | | | 138 | | | | 29,295 | |
Yamaha Motor Co., Ltd. | | | | | | | 600 | | | | 18,871 | |
| | | | | | | | | | | | |
| | | | | | | | | | | 538,430 | |
| | | | | | | | | | | | |
Distributors – 0.0% | | | | | | | | | | | | |
Genuine Parts Co. | | | | | | | 435 | | | | 40,442 | |
Jardine Cycle & Carriage Ltd. | | | | | | | 400 | | | | 11,854 | |
LKQ Corp.(c) | | | | | | | 877 | | | | 34,572 | |
| | | | | | | | | | | | |
| | | | | | | | | | | 86,868 | |
| | | | | | | | | | | | |
Diversified Consumer Services – 0.0% | | | | | | | | | | | | |
Benesse Holdings, Inc. | | | | | | | 400 | | | | 14,157 | |
H&R Block, Inc. | | | | | | | 830 | | | | 21,729 | |
| | | | | | | | | | | | |
| | | | | | | | | | | 35,886 | |
| | | | | | | | | | | | |
| | |
| abfunds.com | | AB GLOBAL RISK ALLOCATION FUND | 37 |
CONSOLIDATED PORTFOLIO OF INVESTMENTS (continued)
| | | | | | | | | | | | |
| Company | | | | |
Shares | | | U.S. $ Value | |
| |
| | | | | | | | | | | | |
Hotels, Restaurants & Leisure – 0.4% | | | | | | | | | | | | |
Accor SA | | | | | | | 515 | | | $ | 25,793 | |
Aramark | | | | | | | 1,174 | | | | 50,012 | |
Aristocrat Leisure Ltd. | | | | | | | 960 | | | | 16,044 | |
Carnival Corp. | | | | | | | 557 | | | | 36,561 | |
Carnival PLC | | | | | | | 409 | | | | 26,506 | |
Chipotle Mexican Grill, Inc. – Class A(c) | | | | | | | 57 | | | | 17,350 | |
Compass Group PLC | | | | | | | 1,758 | | | | 35,654 | |
Crown Resorts Ltd. | | | | | | | 1,793 | | | | 16,812 | |
Darden Restaurants, Inc. | | | | | | | 368 | | | | 31,030 | |
Domino’s Pizza Enterprises Ltd. | | | | | | | 317 | | | | 11,342 | |
Domino’s Pizza, Inc. | | | | | | | 151 | | | | 28,110 | |
Flight Centre Travel Group Ltd. | | | | | | | 539 | | | | 18,304 | |
Galaxy Entertainment Group Ltd. | | | | | | | 3,000 | | | | 21,730 | |
Genting Singapore PLC | | | | | | | 17,400 | | | | 17,221 | |
Hilton Worldwide Holdings, Inc. | | | | | | | 532 | | | | 41,262 | |
InterContinental Hotels Group PLC | | | | | | | 495 | | | | 29,128 | |
Las Vegas Sands Corp. | | | | | | | 477 | | | | 33,051 | |
Marriott International, Inc./MD – Class A | | | | | | | 350 | | | | 44,450 | |
McDonald’s Corp. | | | | | | | 324 | | | | 55,718 | |
McDonald’s Holdings Co. Japan Ltd. | | | | | | | 400 | | | | 17,471 | |
Melco Resorts & Entertainment Ltd. (ADR) | | | | | | | 460 | | | | 12,011 | |
Merlin Entertainments PLC(b) | | | | | | | 4,383 | | | | 20,859 | |
MGM China Holdings Ltd. | | | | | | | 6,400 | | | | 16,417 | |
MGM Resorts International | | | | | | | 769 | | | | 26,238 | |
Norwegian Cruise Line Holdings Ltd.(c) | | | | | | | 485 | | | | 26,268 | |
Oriental Land Co., Ltd./Japan | | | | | | | 300 | | | | 26,756 | |
Paddy Power Betfair PLC | | | | | | | 223 | | | | 24,868 | |
Restaurant Brands International, Inc. | | | | | | | 668 | | | | 41,489 | |
Royal Caribbean Cruises Ltd. | | | | | | | 277 | | | | 34,315 | |
Sands China Ltd. | | | | | | | 3,600 | | | | 17,588 | |
Shangri-La Asia Ltd. | | | | | | | 10,000 | | | | 22,616 | |
SJM Holdings Ltd. | | | | | | | 16,000 | | | | 12,908 | |
Sodexo SA | | | | | | | 224 | | | | 29,224 | |
Starbucks Corp. | | | | | | | 666 | | | | 38,508 | |
Tabcorp Holdings Ltd. | | | | | | | 4,110 | | | | 15,153 | |
Tatts Group Ltd. | | | | | | | 5,221 | | | | 17,148 | |
TUI AG | | | | | | | 1,641 | | | | 30,309 | |
Whitbread PLC | | | | | | | 504 | | | | 24,318 | |
William Hill PLC | | | | | | | 6,112 | | | | 23,896 | |
Wyndham Worldwide Corp. | | | | | | | 277 | | | | 31,132 | |
Wynn Macau Ltd. | | | | | | | 6,800 | | | | 19,574 | |
Wynn Resorts Ltd. | | | | | | | 179 | | | | 28,296 | |
Yum! Brands, Inc. | | | | | | | 630 | | | | 52,586 | |
| | | | | | | | | | | | |
| | | | | | | | | | | 1,166,026 | |
| | | | | | | | | | | | |
| | |
| 38 | AB GLOBAL RISK ALLOCATION FUND | | abfunds.com |
CONSOLIDATED PORTFOLIO OF INVESTMENTS (continued)
| | | | | | | | | | | | |
| Company | | | | |
Shares | | | U.S. $ Value | |
| |
| | | | | | | | | | | | |
Household Durables – 0.2% | | | | | | | | | | | | |
Auto Trader Group PLC(b) | | | | | | | 4,579 | | | $ | 20,819 | |
Barratt Developments PLC | | | | | | | 2,559 | | | | 20,989 | |
Berkeley Group Holdings PLC | | | | | | | 550 | | | | 28,396 | |
Casio Computer Co., Ltd. | | | | | | | 900 | | | | 13,247 | |
DR Horton, Inc. | | | | | | | 836 | | | | 42,636 | |
Electrolux AB – Class B | | | | | | | 748 | | | | 24,843 | |
Garmin Ltd. | | | | | | | 605 | | | | 37,558 | |
Husqvarna AB – Class B | | | | | | | 2,521 | | | | 23,012 | |
Iida Group Holdings Co., Ltd. | | | | | | | 900 | | | | 16,639 | |
Leggett & Platt, Inc. | | | | | | | 679 | | | | 32,755 | |
Lennar Corp. – Class A | | | | | | | 555 | | | | 34,843 | |
Lennar Corp. – Class B | | | | | | | 11 | | | | 570 | |
Mohawk Industries, Inc.(c) | | | | | | | 156 | | | | 44,087 | |
Newell Brands, Inc. | | | | | | | 610 | | | | 18,892 | |
Nikon Corp. | | | | | | | 1,200 | | | | 23,864 | |
Panasonic Corp. | | | | | | | 1,400 | | | | 20,952 | |
Persimmon PLC | | | | | | | 763 | | | | 26,207 | |
PulteGroup, Inc. | | | | | | | 1,261 | | | | 43,038 | |
Rinnai Corp. | | | | | | | 200 | | | | 17,974 | |
SEB SA | | | | | | | 162 | | | | 29,831 | |
Sekisui Chemical Co., Ltd. | | | | | | | 800 | | | | 15,525 | |
Sekisui House Ltd. | | | | | | | 1,100 | | | | 20,591 | |
Sharp Corp./Japan(c) | | | | | | | 200 | | | | 6,348 | |
Sony Corp. | | | | | | | 500 | | | | 23,402 | |
Taylor Wimpey PLC | | | | | | | 9,372 | | | | 24,794 | |
Techtronic Industries Co., Ltd. | | | | | | | 3,500 | | | | 20,291 | |
Toll Brothers, Inc. | | | | | | | 690 | | | | 34,728 | |
Whirlpool Corp. | | | | | | | 167 | | | | 28,151 | |
| | | | | | | | | | | | |
| | | | | | | | | | | 694,982 | |
| | | | | | | | | | | | |
Internet & Direct Marketing Retail – 0.1% | | | | | | | | | | | | |
Amazon.com, Inc.(c) | | | | | | | 29 | | | | 34,126 | |
Expedia, Inc. | | | | | | | 215 | | | | 26,337 | |
Liberty Interactive Corp. QVC Group – Class A(c) | | | | | | | 1,207 | | | | 29,451 | |
Netflix, Inc.(c) | | | | | | | 129 | | | | 24,198 | |
Priceline Group, Inc. (The)(c) | | | | | | | 17 | | | | 29,575 | |
Rakuten, Inc. | | | | | | | 1,299 | | | | 13,330 | |
Start Today Co., Ltd. | | | | | | | 600 | | | | 18,359 | |
TripAdvisor, Inc.(c) | | | | | | | 426 | | | | 14,748 | |
Zalando SE(b)(c) | | | | | | | 491 | | | | 25,145 | |
| | | | | | | | | | | | |
| | | | | | | | | | | 215,269 | |
| | | | | | | | | | | | |
Leisure Products – 0.1% | | | | | | | | | | | | |
Bandai Namco Holdings, Inc. | | | | | | | 400 | | | | 13,057 | |
Hasbro, Inc. | | | | | | | 367 | | | | 34,138 | |
Mattel, Inc.(d) | | | | | | | 1,058 | | | | 19,309 | |
Polaris Industries, Inc.(d) | | | | | | | 248 | | | | 31,499 | |
| | |
| abfunds.com | | AB GLOBAL RISK ALLOCATION FUND | 39 |
CONSOLIDATED PORTFOLIO OF INVESTMENTS (continued)
| | | | | | | | | | | | |
| Company | | | | |
Shares | | | U.S. $ Value | |
| |
| | | | | | | | | | | | |
Sankyo Co., Ltd. | | | | | | | 400 | | | $ | 12,921 | |
Sega Sammy Holdings, Inc. | | | | | | | 1,100 | | | | 13,318 | |
Shimano, Inc. | | | | | | | 100 | | | | 13,835 | |
Yamaha Corp. | | | | | | | 400 | | | | 14,743 | |
| | | | | | | | | | | | |
| | | | | | | | | | | 152,820 | |
| | | | | | | | | | | | |
Media – 0.4% | | | | | | | | | | | | |
Altice NV – Class A(c) | | | | | | | 704 | | | | 5,549 | |
Altice NV – Class B(c) | | | | | | | 1,011 | | | | 7,965 | |
Axel Springer SE | | | | | | | 600 | | | | 47,400 | |
CBS Corp. – Class B | | | | | | | 447 | | | | 25,059 | |
Charter Communications, Inc. – Class A(c) | | | | | | | 83 | | | | 27,075 | |
Comcast Corp. – Class A | | | | | | | 824 | | | | 30,933 | |
Dentsu, Inc. | | | | | | | 300 | | | | 13,619 | |
Discovery Communications, Inc. – Class A(c)(d) | | | | | | | 1,012 | | | | 19,248 | |
Discovery Communications, Inc. – Class C(c) | | | | | | | 997 | | | | 18,026 | |
DISH Network Corp. – Class A(c) | | | | | | | 282 | | | | 14,283 | |
Eutelsat Communications SA | | | | | | | 1,132 | | | | 25,609 | |
Hakuhodo DY Holdings, Inc. | | | | | | | 1,100 | | | | 14,818 | |
I-CABLE Communications Ltd.(c) | | | | | | | 2,936 | | | | 84 | |
Interpublic Group of Cos., Inc. (The) | | | | | | | 1,393 | | | | 27,554 | |
ITV PLC | | | | | | | 7,799 | | | | 16,875 | |
JCDecaux SA | | | | | | | 889 | | | | 37,019 | |
Lagardere SCA | | | | | | | 819 | | | | 26,826 | |
Liberty Broadband Corp.(c) | | | | | | | 346 | | | | 30,085 | |
Liberty Global PLC – Class A(c) | | | | | | | 813 | | | | 25,821 | |
Liberty Global PLC – Series C(c) | | | | | | | 1,811 | | | | 55,833 | |
Liberty Global PLC LiLAC – Class C(c) | | | | | | | 937 | | | | 19,443 | |
Liberty Media Corp.-Liberty SiriusXM – Class A(c) | | | | | | | 944 | | | | 38,487 | |
Liberty Media Corp.-Liberty SiriusXM – Class C(c) | | | | | | | 700 | | | | 28,567 | |
News Corp. – Class A | | | | | | | 2,510 | | | | 40,562 | |
Omnicom Group, Inc. | | | | | | | 460 | | | | 32,862 | |
Pearson PLC | | | | | | | 1,740 | | | | 16,648 | |
ProSiebenSat.1 Media SE | | | | | | | 638 | | | | 20,299 | |
Publicis Groupe SA | | | | | | | 351 | | | | 23,302 | |
RTL Group SA (London)(c) | | | | | | | 319 | | | | 25,459 | |
Schibsted ASA | | | | | | | 973 | | | | 26,210 | |
Schibsted ASA – Class B | | | | | | | 1,054 | | | | 26,150 | |
Scripps Networks Interactive, Inc. – Class A | | | | | | | 407 | | | | 33,309 | |
SES SA | | | | | | | 1,380 | | | | 22,780 | |
Shaw Communications, Inc. – Class B | | | | | | | 2,404 | | | | 53,571 | |
Singapore Press Holdings Ltd. | | | | | | | 6,100 | | | | 12,506 | |
Sirius XM Holdings, Inc.(d) | | | | | | | 4,633 | | | | 25,481 | |
Sky PLC(c) | | | | | | | 1,340 | | | | 16,970 | |
TEGNA, Inc. | | | | | | | 850 | | | | 11,288 | |
Telenet Group Holding NV(c) | | | | | | | 522 | | | | 36,503 | |
Time Warner, Inc. | | | | | | | 454 | | | | 41,546 | |
Toho Co., Ltd./Tokyo | | | | | | | 500 | | | | 16,914 | |
| | |
| 40 | AB GLOBAL RISK ALLOCATION FUND | | abfunds.com |
CONSOLIDATED PORTFOLIO OF INVESTMENTS (continued)
| | | | | | | | | | | | |
| Company | | | | |
Shares | | | U.S. $ Value | |
| |
| | | | | | | | | | | | |
Twenty-First Century Fox, Inc. – Class A | | | | | | | 1,016 | | | $ | 32,451 | |
Twenty-First Century Fox, Inc. – Class B | | | | | | | 1,020 | | | | 31,773 | |
Viacom, Inc. – Class B | | | | | | | 642 | | | | 18,181 | |
Vivendi SA | | | | | | | 1,098 | | | | 29,227 | |
Walt Disney Co. (The) | | | | | | | 397 | | | | 41,614 | |
WPP PLC | | | | | | | 1,472 | | | | 25,979 | |
| | | | | | | | | | | | |
| | | | | | | | | | | 1,217,763 | |
| | | | | | | | | | | | |
Multiline Retail – 0.2% | | | | | | | | | | | | |
Canadian Tire Corp., Ltd. – Class A | | | | | | | 300 | �� | | | 37,910 | |
Dollar General Corp. | | | | | | | 382 | | | | 33,647 | |
Dollar Tree, Inc.(c) | | | | | | | 304 | | | | 31,239 | |
Dollarama, Inc. | | | | | | | 452 | | | | 55,253 | |
Don Quijote Holdings Co., Ltd. | | | | | | | 400 | | | | 19,149 | |
Harvey Norman Holdings Ltd. | | | | | | | 3,556 | | | | 10,855 | |
Isetan Mitsukoshi Holdings Ltd. | | | | | | | 1,500 | | | | 17,439 | |
J Front Retailing Co., Ltd. | | | | | | | 1,000 | | | | 16,959 | |
Kohl’s Corp. | | | | | | | 485 | | | | 23,265 | |
Macy’s, Inc.(d) | | | | | | | 699 | | | | 16,636 | |
Marks & Spencer Group PLC | | | | | | | 4,897 | | | | 20,742 | |
Marui Group Co., Ltd. | | | | | | | 900 | | | | 15,965 | |
Next PLC | | | | | | | 400 | | | | 24,211 | |
Nordstrom, Inc. | | | | | | | 496 | | | | 22,543 | |
Ryohin Keikaku Co., Ltd. | | | | | | | 100 | | | | 31,189 | |
Takashimaya Co., Ltd. | | | | | | | 2,000 | | | | 19,769 | |
Target Corp. | | | | | | | 562 | | | | 33,664 | |
| | | | | | | | | | | | |
| | | | | | | | | | | 430,435 | |
| | | | | | | | | | | | |
Specialty Retail – 0.3% | | | | | | | | | | | | |
ABC-Mart, Inc. | | | | | | | 300 | | | | 16,487 | |
Advance Auto Parts, Inc. | | | | | | | 173 | | | | 17,473 | |
AutoNation, Inc.(c)(d) | | | | | | | 587 | | | | 32,502 | |
AutoZone, Inc.(c) | | | | | | | 47 | | | | 32,278 | |
Bed Bath & Beyond, Inc. | | | | | | | 660 | | | | 14,777 | |
Best Buy Co., Inc. | | | | | | | 397 | | | | 23,665 | |
CarMax, Inc.(c) | | | | | | | 276 | | | | 19,019 | |
CECONOMY AG | | | | | | | 963 | | | | 12,642 | |
Dick’s Sporting Goods, Inc. | | | | | | | 553 | | | | 16,291 | |
Dixons Carphone PLC | | | | | | | 4,868 | | | | 10,458 | |
Dufry AG (REG)(c) | | | | | | | 127 | | | | 18,278 | |
Foot Locker, Inc. | | | | | | | 407 | | | | 17,436 | |
Gap, Inc. (The) | | | | | | | 852 | | | | 27,528 | |
Hennes & Mauritz AB – Class B | | | | | | | 936 | | | | 22,029 | |
Hikari Tsushin, Inc. | | | | | | | 100 | | | | 14,451 | |
Home Depot, Inc. (The) | | | | | | | 245 | | | | 44,056 | |
Industria de Diseno Textil SA | | | | | | | 757 | | | | 26,777 | |
Kingfisher PLC | | | | | | | 6,282 | | | | 28,340 | |
L Brands, Inc. | | | | | | | 409 | | | | 22,933 | |
| | |
| abfunds.com | | AB GLOBAL RISK ALLOCATION FUND | 41 |
CONSOLIDATED PORTFOLIO OF INVESTMENTS (continued)
| | | | | | | | | | | | |
| Company | | | | |
Shares | | | U.S. $ Value | |
| |
| | | | | | | | | | | | |
Lowe’s Cos., Inc. | | | | | | | 362 | | | $ | 30,180 | |
Nitori Holdings Co., Ltd. | | | | | | | 100 | | | | 16,334 | |
O’Reilly Automotive, Inc.(c) | | | | | | | 119 | | | | 28,109 | |
Ross Stores, Inc. | | | | | | | 451 | | | | 34,289 | |
Shimamura Co., Ltd. | | | | | | | 100 | | | | 12,059 | |
Signet Jewelers Ltd.(d) | | | | | | | 287 | | | | 15,007 | |
Tiffany & Co. | | | | | | | 315 | | | | 29,767 | |
TJX Cos., Inc. (The) | | | | | | | 528 | | | | 39,890 | |
Tractor Supply Co.(d) | | | | | | | 570 | | | | 38,897 | |
Ulta Salon Cosmetics & Fragrance, Inc.(c) | | | | | | | 91 | | | | 20,176 | |
USS Co., Ltd. | | | | | | | 700 | | | | 14,814 | |
Yamada Denki Co., Ltd. | | | | | | | 3,500 | | | | 19,042 | |
| | | | | | | | | | | | |
| | | | | | | | | | | 715,984 | |
| | | | | | | | | | | | |
Textiles, Apparel & Luxury Goods – 0.2% | | | | | | | | | | | | |
adidas AG | | | | | | | 138 | | | | 28,839 | |
Asics Corp. | | | | | | | 900 | | | | 13,351 | |
Burberry Group PLC | | | | | | | 981 | | | | 22,775 | |
Christian Dior SE | | | | | | | 102 | | | | 36,458 | |
Cie Financiere Richemont SA (REG) | | | | | | | 285 | | | | 24,562 | |
Gildan Activewear, Inc. | | | | | | | 1,287 | | | | 40,840 | |
Hanesbrands, Inc.(d) | | | | | | | 1,331 | | | | 27,805 | |
Hermes International | | | | | | | 67 | | | | 35,299 | |
HUGO BOSS AG | | | | | | | 261 | | | | 21,496 | |
Kering | | | | | | | 75 | | | | 33,259 | |
Li & Fung Ltd. | | | | | | | 38,000 | | | | 16,787 | |
Lululemon Athletica, Inc.(c) | | | | | | | 362 | | | | 24,240 | |
Luxottica Group SpA | | | | | | | 509 | | | | 29,560 | |
LVMH Moet Hennessy Louis Vuitton SE | | | | | | | 90 | | | | 26,218 | |
Michael Kors Holdings Ltd.(c) | | | | | | | 474 | | | | 27,701 | |
NIKE, Inc. – Class B | | | | | | | 676 | | | | 40,844 | |
Pandora A/S | | | | | | | 240 | | | | 24,048 | |
PVH Corp. | | | | | | | 229 | | | | 30,812 | |
Ralph Lauren Corp. | | | | | | | 379 | | | | 36,062 | |
Swatch Group AG (The) | | | | | | | 56 | | | | 20,464 | |
Swatch Group AG (The) (REG) | | | | | | | 301 | | | | 21,324 | |
Tapestry, Inc. | | | | | | | 597 | | | | 24,889 | |
Under Armour, Inc. – Class A(c)(d) | | | | | | | 1,122 | | | | 14,911 | |
Under Armour, Inc. – Class C(c)(d) | | | | | | | 1,242 | | | | 14,817 | |
VF Corp. | | | | | | | 576 | | | | 42,025 | |
Yue Yuen Industrial Holdings Ltd. | | | | | | | 3,500 | | | | 12,523 | |
| | | | | | | | | | | | |
| | | | | | | | | | | 691,909 | |
| | | | | | | | | | | | |
| | | | | | | | | | | 6,553,046 | |
| | | | | | | | | | | | |
Health Care – 2.3% | | | | | | | | | | | | |
Biotechnology – 0.2% | | | | | | | | | | | | |
AbbVie, Inc. | | | | | | | 784 | | | | 75,985 | |
Alexion Pharmaceuticals, Inc.(c) | | | | | | | 232 | | | | 25,476 | |
| | |
| 42 | AB GLOBAL RISK ALLOCATION FUND | | abfunds.com |
CONSOLIDATED PORTFOLIO OF INVESTMENTS (continued)
| | | | | | | | | | | | |
| Company | | | | |
Shares | | | U.S. $ Value | |
| |
| | | | | | | | | | | | |
Alkermes PLC(c) | | | | | | | 331 | | | $ | 17,308 | |
Amgen, Inc. | | | | | | | 320 | | | | 56,211 | |
Biogen, Inc.(c) | | | | | | | 169 | | | | 54,447 | |
BioMarin Pharmaceutical, Inc.(c) | | | | | | | 341 | | | | 29,258 | |
Celgene Corp.(c) | | | | | | | 350 | | | | 35,291 | |
CSL Ltd. | | | | | | | 450 | | | | 48,940 | |
Genmab A/S(c) | | | | | | | 279 | | | | 54,880 | |
Gilead Sciences, Inc. | | | | | | | 703 | | | | 52,570 | |
Grifols SA | | | | | | | 2,271 | | | | 66,226 | |
Idorsia Ltd.(c) | | | | | | | 213 | | | | 4,579 | |
Incyte Corp.(c) | | | | | | | 189 | | | | 18,709 | |
Regeneron Pharmaceuticals, Inc.(c) | | | | | | | 66 | | | | 23,883 | |
Seattle Genetics, Inc.(c) | | | | | | | 303 | | | | 18,462 | |
United Therapeutics Corp.(c) | | | | | | | 217 | | | | 28,208 | |
Vertex Pharmaceuticals, Inc.(c) | | | | | | | 246 | | | | 35,495 | |
| | | | | | | | | | | | |
| | | | | | | | | | | 645,928 | |
| | | | | | | | | | | | |
Health Care Equipment & Supplies – 0.7% | | | | | | | | | | | | |
Abbott Laboratories | | | | | | | 1,269 | | | | 71,534 | |
Align Technology, Inc.(c) | | | | | | | 301 | | | | 78,525 | |
Baxter International, Inc. | | | | | | | 1,040 | | | | 68,151 | |
Becton Dickinson and Co. | | | | | | | 309 | | | | 70,517 | |
Boston Scientific Corp.(c) | | | | | | | 1,769 | | | | 46,489 | |
Cochlear Ltd. | | | | | | | 378 | | | | 51,671 | |
Coloplast A/S – Class B | | | | | | | 742 | | | | 58,069 | |
Cooper Cos., Inc. (The) | | | | | | | 246 | | | | 59,330 | |
CR Bard, Inc. | | | | | | | 106 | | | | 35,610 | |
CYBERDYNE, Inc.(c) | | | | | | | 3,000 | | | | 39,902 | |
Danaher Corp. | | | | | | | 776 | | | | 73,223 | |
DENTSPLY SIRONA, Inc. | | | | | | | 989 | | | | 66,273 | |
DexCom, Inc.(c) | | | | | | | 430 | | | | 25,125 | |
Edwards Lifesciences Corp.(c) | | | | | | | 320 | | | | 37,504 | |
Essilor International Cie Generale d’Optique SA | | | | | | | 493 | | | | 63,403 | |
Getinge AB – Class B | | | | | | | 2,759 | | | | 49,702 | |
Hologic, Inc.(c) | | | | | | | 1,129 | | | | 47,102 | |
Hoya Corp. | | | | | | | 800 | | | | 39,118 | |
IDEXX Laboratories, Inc.(c) | | | | | | | 330 | | | | 51,615 | |
Intuitive Surgical, Inc.(c) | | | | | | | 183 | | | | 73,160 | |
Koninklijke Philips NV | | | | | | | 479 | | | | 18,572 | |
Medtronic PLC | | | | | | | 683 | | | | 56,095 | |
Olympus Corp. | | | | | | | 900 | | | | 37,089 | |
ResMed, Inc. | | | | | | | 778 | | | | 66,441 | |
Smith & Nephew PLC | | | | | | | 4,175 | | | | 73,894 | |
Sonova Holding AG (REG) | | | | | | | 433 | | | | 68,972 | |
Stryker Corp. | | | | | | | 486 | | | | 75,816 | |
Sysmex Corp. | | | | | | | 700 | | | | 53,256 | |
Teleflex, Inc. | | | | | | | 270 | | | | 71,690 | |
Terumo Corp. | | | | | | | 1,000 | | | | 47,953 | |
| | |
| abfunds.com | | AB GLOBAL RISK ALLOCATION FUND | 43 |
CONSOLIDATED PORTFOLIO OF INVESTMENTS (continued)
| | | | | | | | | | | | |
| Company | | | | |
Shares | | | U.S. $ Value | |
| |
| | | | | | | | | | | | |
Varian Medical Systems, Inc.(c) | | | | | | | 475 | | | $ | 53,081 | |
William Demant Holding A/S(c) | | | | | | | 2,432 | | | | 66,939 | |
Zimmer Biomet Holdings, Inc. | | | | | | | 375 | | | | 43,912 | |
| | | | | | | | | | | | |
| | | | | | | | | | | 1,839,733 | |
| | | | | | | | | | | | |
Health Care Providers & Services – 0.5% | | | | | | | | | | | | |
Aetna, Inc. | | | | | | | 367 | | | | 66,126 | |
Alfresa Holdings Corp. | | | | | | | 2,100 | | | | 45,138 | |
AmerisourceBergen Corp. – Class A | | | | | | | 482 | | | | 40,883 | |
Anthem, Inc. | | | | | | | 274 | | | | 64,379 | |
Cardinal Health, Inc. | | | | | | | 702 | | | | 41,551 | |
Centene Corp.(c) | | | | | | | 478 | | | | 48,799 | |
Cigna Corp. | | | | | | | 335 | | | | 70,930 | |
DaVita, Inc.(c) | | | | | | | 632 | | | | 38,590 | |
Envision Healthcare Corp.(c) | | | | | | | 549 | | | | 17,530 | |
Express Scripts Holding Co.(c) | | | | | | | 647 | | | | 42,171 | |
Fresenius Medical Care AG & Co. KGaA | | | | | | | 755 | | | | 75,280 | |
Fresenius SE & Co. KGaA | | | | | | | 693 | | | �� | 50,060 | |
HCA Healthcare, Inc.(c) | | | | | | | 514 | | | | 43,690 | |
Healthscope Ltd. | | | | | | | 25,489 | | | | 38,546 | |
Henry Schein, Inc.(c) | | | | | | | 702 | | | | 50,158 | |
Humana, Inc. | | | | | | | 169 | | | | 44,085 | |
Laboratory Corp. of America Holdings(c) | | | | | | | 407 | | | | 64,416 | |
McKesson Corp. | | | | | | | 241 | | | | 35,605 | |
Mediclinic International PLC | | | | | | | 5,230 | | | | 39,998 | |
Medipal Holdings Corp. | | | | | | | 2,200 | | | | 42,820 | |
MEDNAX, Inc.(c) | | | | | | | 637 | | | | 31,716 | |
Miraca Holdings, Inc. | | | | | | | 900 | | | | 39,222 | |
Patterson Cos., Inc.(d) | | | | | | | 1,039 | | | | 37,975 | |
Quest Diagnostics, Inc. | | | | | | | 556 | | | | 54,744 | |
Ramsay Health Care Ltd. | | | | | | | 768 | | | | 40,773 | |
Ryman Healthcare Ltd. | | | | | | | 6,840 | | | | 49,109 | |
Sonic Healthcare Ltd. | | | | | | | 2,611 | | | | 44,227 | |
Suzuken Co., Ltd./Aichi Japan | | | | | | | 1,300 | | | | 51,516 | |
UnitedHealth Group, Inc. | | | | | | | 310 | | | | 70,733 | |
Universal Health Services, Inc. – Class B | | | | | | | 362 | | | | 39,223 | |
| | | | | | | | | | | | |
| | | | | | | | | | | 1,419,993 | |
| | | | | | | | | | | | |
Health Care Technology – 0.0% | | | | | | | | | | | | |
Cerner Corp.(c) | | | | | | | 701 | | | | 49,554 | |
M3, Inc. | | | | | | | 1,500 | | | | 49,666 | |
| | | | | | | | | | | | |
| | | | | | | | | | | 99,220 | |
| | | | | | | | | | | | |
Life Sciences Tools & Services – 0.2% | | | | | | | | | | | | |
Agilent Technologies, Inc. | | | | | | | 816 | | | | 56,500 | |
Eurofins Scientific SE | | | | | | | 116 | | | | 70,241 | |
Illumina, Inc.(c) | | | | | | | 183 | | | | 42,095 | |
IQVIA Holdings, Inc.(c) | | | | | | | 646 | | | | 65,898 | |
Lonza Group AG (REG)(c) | | | | | | | 278 | | | | 72,879 | |
| | |
| 44 | AB GLOBAL RISK ALLOCATION FUND | | abfunds.com |
CONSOLIDATED PORTFOLIO OF INVESTMENTS (continued)
| | | | | | | | | | | | |
| Company | | | | |
Shares | | | U.S. $ Value | |
| |
| | | | | | | | | | | | |
Mettler-Toledo International, Inc.(c) | | | | | | | 105 | | | $ | 66,067 | |
QIAGEN NV(c) | | | | | | | 1,521 | | | | 48,209 | |
Thermo Fisher Scientific, Inc. | | | | | | | 346 | | | | 66,695 | |
Waters Corp.(c) | | | | | | | 286 | | | | 56,391 | |
| | | | | | | | | | | | |
| | | | | | | | | | | 544,975 | |
| | | | | | | | | | | | |
Pharmaceuticals – 0.7% | | | | | | | | | | | | |
Allergan PLC | | | | | | | 688 | | | | 119,595 | |
Astellas Pharma, Inc. | | | | | | | 3,100 | | | | 39,408 | |
AstraZeneca PLC | | | | | | | 729 | | | | 47,048 | |
Bayer AG (REG) | | | | | | | 484 | | | | 61,779 | |
Bristol-Myers Squibb Co. | | | | | | | 870 | | | | 54,975 | |
Chugai Pharmaceutical Co., Ltd. | | | | | | | 1,000 | | | | 51,700 | |
Daiichi Sankyo Co., Ltd. | | | | | | | 2,000 | | | | 48,202 | |
Eisai Co., Ltd. | | | | | | | 700 | | | | 39,699 | |
Eli Lilly & Co. | | | | | | | 693 | | | | 58,656 | |
GlaxoSmithKline PLC | | | | | | | 3,649 | | | | 63,137 | |
Hikma Pharmaceuticals PLC | | | | | | | 2,641 | | | | 36,788 | |
Hisamitsu Pharmaceutical Co., Inc. | | | | | | | 800 | | | | 45,115 | |
Jazz Pharmaceuticals PLC(c) | | | | | | | 223 | | | | 31,162 | |
Johnson & Johnson | | | | | | | 554 | | | | 77,189 | |
Kyowa Hakko Kirin Co., Ltd. | | | | | | | 2,200 | | | | 41,868 | |
Mallinckrodt PLC(c) | | | | | | | 476 | | | | 10,386 | |
Merck & Co., Inc. | | | | | | | 863 | | | | 47,698 | |
Merck KGaA | | | | | | | 536 | | | | 57,107 | |
Mitsubishi Tanabe Pharma Corp. | | | | | | | 1,800 | | | | 38,918 | |
Mylan NV(c) | | | | | | | 1,027 | | | | 37,516 | |
Novartis AG (REG) | | | | | | | 923 | | | | 79,190 | |
Novo Nordisk A/S – Class B | | | | | | | 1,284 | | | | 66,369 | |
Ono Pharmaceutical Co., Ltd. | | | | | | | 1,900 | | | | 43,379 | |
Orion Oyj – Class B | | | | | | | 948 | | | | 35,016 | |
Otsuka Holdings Co., Ltd. | | | | | | | 900 | | | | 39,908 | |
Perrigo Co. PLC | | | | | | | 428 | | | | 37,326 | |
Pfizer, Inc. | | | | | | | 2,016 | | | | 73,100 | |
Roche Holding AG | | | | | | | 268 | | | | 67,728 | |
Sanofi | | | | | | | 604 | | | | 55,097 | |
Santen Pharmaceutical Co., Ltd. | | | | | | | 3,000 | | | | 45,728 | |
Shionogi & Co., Ltd. | | | | | | | 700 | | | | 39,016 | |
Shire PLC | | | | | | | 706 | | | | 35,000 | |
Sumitomo Dainippon Pharma Co., Ltd. | | | | | | | 2,600 | | | | 37,804 | |
Taisho Pharmaceutical Holdings Co., Ltd. | | | | | | | 500 | | | | 39,738 | |
Takeda Pharmaceutical Co., Ltd. | | | | | | | 1,000 | | | | 55,166 | |
UCB SA | | | | | | | 558 | | | | 41,716 | |
Valeant Pharmaceuticals International, Inc.(c) | | | | | | | 834 | | | | 14,047 | |
Vifor Pharma AG | | | | | | | 380 | | | | 47,943 | |
Zoetis, Inc. | | | | | | | 996 | | | | 72,001 | |
| | | | | | | | | | | | |
| | | | | | | | | | | 1,933,218 | |
| | | | | | | | | | | | |
| | | | | | | | | | | 6,483,067 | |
| | | | | | | | | | | | |
| | |
| abfunds.com | | AB GLOBAL RISK ALLOCATION FUND | 45 |
CONSOLIDATED PORTFOLIO OF INVESTMENTS (continued)
| | | | | | | | | | | | |
| Company | | | | |
Shares | | | U.S. $ Value | |
| |
| | | | | | | | | | | | |
Materials – 2.0% | | | | | | | | | | | | |
Chemicals – 1.1% | | | | | | | | | | | | |
Agrium, Inc. (Toronto) | | | | | | | 771 | | | $ | 84,716 | |
Air Liquide SA | | | | | | | 407 | | | | 50,824 | |
Air Products & Chemicals, Inc. | | | | | | | 522 | | | | 85,107 | |
Air Water, Inc. | | | | | | | 1,200 | | | | 25,845 | |
Akzo Nobel NV | | | | | | | 460 | | | | 41,447 | |
Albemarle Corp. | | | | | | | 546 | | | | 73,339 | |
Arkema SA | | | | | | | 294 | | | | 35,973 | |
Asahi Kasei Corp. | | | | | | | 3,000 | | | | 37,660 | |
Axalta Coating Systems Ltd.(c) | | | | | | | 2,149 | | | | 68,037 | |
BASF SE | | | | | | | 444 | | | | 49,787 | |
Celanese Corp. – Class A | | | | | | | 722 | | | | 77,427 | |
CF Industries Holdings, Inc. | | | | | | | 1,192 | | | | 44,664 | |
Chr Hansen Holding A/S | | | | | | | 469 | | | | 42,563 | |
Covestro AG(b) | | | | | | | 458 | | | | 47,699 | |
Croda International PLC | | | | | | | 648 | | | | 37,469 | |
Daicel Corp. | | | | | | | 1,800 | | | | 21,430 | |
DowDuPont, Inc. | | | | | | | 2,104 | | | | 151,404 | |
Eastman Chemical Co. | | | | | | | 794 | | | | 73,342 | |
Ecolab, Inc. | | | | | | | 833 | | | | 113,221 | |
EMS-Chemie Holding AG (REG) | | | | | | | 47 | | | | 31,374 | |
Evonik Industries AG | | | | | | | 1,232 | | | | 46,009 | |
FMC Corp. | | | | | | | 742 | | | | 70,045 | |
FUCHS PETROLUB SE (Preference Shares) | | | | | | | 915 | | | | 48,108 | |
Givaudan SA (REG) | | | | | | | 25 | | | | 56,912 | |
Hitachi Chemical Co., Ltd. | | | | | | | 800 | | | | 21,162 | |
Incitec Pivot Ltd. | | | | | | | 7,237 | | | | 21,957 | |
International Flavors & Fragrances, Inc. | | | | | | | 533 | | | | 82,850 | |
Johnson Matthey PLC | | | | | | | 1,127 | | | | 46,195 | |
JSR Corp. | | | | | | | 1,300 | | | | 25,001 | |
K&S AG (REG) | | | | | | | 1,009 | | | | 23,661 | |
Kaneka Corp. | | | | | | | 3,000 | | | | 26,593 | |
Kansai Paint Co., Ltd. | | | | | | | 1,000 | | | | 26,270 | |
Koninklijke DSM NV | | | | | | | 642 | | | | 60,048 | |
Kuraray Co., Ltd. | | | | | | | 1,400 | | | | 27,044 | |
LANXESS AG | | | | | | | 442 | | | | 33,601 | |
Linde AG | | | | | | | 192 | | | | 42,210 | |
LyondellBasell Industries NV – Class A | | | | | | | 645 | | | | 67,531 | |
Methanex Corp. | | | | | | | 1,103 | | | | 58,786 | |
Mitsubishi Chemical Holdings Corp. | | | | | | | 3,200 | | | | 34,796 | |
Mitsubishi Gas Chemical Co., Inc. | | | | | | | 1,100 | | | | 30,883 | |
Mitsui Chemicals, Inc. | | | | | | | 800 | | | | 25,971 | |
Monsanto Co. | | | | | | | 797 | | | | 94,317 | |
Mosaic Co. (The) | | | | | | | 2,007 | | | | 48,750 | |
Nippon Paint Holdings Co., Ltd. | | | | | | | 600 | | | | 18,443 | |
Nissan Chemical Industries Ltd. | | | | | | | 600 | | | | 24,079 | |
| | |
| 46 | AB GLOBAL RISK ALLOCATION FUND | | abfunds.com |
CONSOLIDATED PORTFOLIO OF INVESTMENTS (continued)
| | | | | | | | | | | | |
| Company | | | | |
Shares | | | U.S. $ Value | |
| |
| | | | | | | | | | | | |
Nitto Denko Corp. | | | | | | | 300 | | | $ | 29,714 | |
Novozymes A/S – Class B | | | | | | | 559 | | | | 30,278 | |
Orica Ltd. | | | | | | | 1,553 | | | | 20,108 | |
Potash Corp. of Saskatchewan, Inc. | | | | | | | 3,664 | | | | 71,908 | |
PPG Industries, Inc. | | | | | | | 660 | | | | 77,121 | |
Praxair, Inc. | | | | | | | 436 | | | | 67,109 | |
Sherwin-Williams Co. (The) | | | | | | | 231 | | | | 92,266 | |
Shin-Etsu Chemical Co., Ltd. | | | | | | | 300 | | | | 31,611 | |
Sika AG | | | | | | | 6 | | | | 46,425 | |
Solvay SA | | | | | | | 330 | | | | 46,450 | |
Sumitomo Chemical Co., Ltd. | | | | | | | 4,000 | | | | 28,052 | |
Symrise AG | | | | | | | 710 | | | | 60,359 | |
Syngenta AG (REG) | | | | | | | 75 | | | | 34,714 | |
Taiyo Nippon Sanso Corp. | | | | | | | 2,100 | | | | 28,976 | |
Teijin Ltd. | | | | | | | 1,100 | | | | 23,811 | |
Toray Industries, Inc. | | | | | | | 2,500 | | | | 23,582 | |
Umicore SA | | | | | | | 1,130 | | | | 52,760 | |
WR Grace & Co. | | | | | | | 870 | | | | 63,780 | |
Yara International ASA | | | | | | | 866 | | | | 38,491 | |
| | | | | | | | | | | | |
| | | | | | | | | | | 3,122,065 | |
| | | | | | | | | | | | |
Construction Materials – 0.1% | | | | | | | | | | | | |
Boral Ltd. | | | | | | | 4,494 | | | | 25,718 | |
CRH PLC | | | | | | | 1,075 | | | | 37,127 | |
Fletcher Building Ltd. | | | | | | | 5,162 | | | | 24,575 | |
HeidelbergCement AG | | | | | | | 356 | | | | 37,952 | |
Imerys SA | | | | | | | 563 | | | | 51,578 | |
James Hardie Industries PLC | | | | | | | 1,450 | | | | 23,768 | |
LafargeHolcim Ltd. (REG)(c) | | | | | | | 595 | | | | 32,641 | |
Martin Marietta Materials, Inc. | | | | | | | 237 | | | | 49,388 | |
Taiheiyo Cement Corp. | | | | | | | 700 | | | | 28,876 | |
Vulcan Materials Co. | | | | | | | 393 | | | | 49,380 | |
| | | | | | | | | | | | |
| | | | | | | | | | | 361,003 | |
| | | | | | | | | | | | |
Containers & Packaging – 0.3% | | | | | | | | | | | | |
Amcor Ltd./Australia | | | | | | | 2,606 | | | | 30,561 | |
Avery Dennison Corp. | | | | | | | 978 | | | | 111,609 | |
Ball Corp. | | | | | | | 1,802 | | | | 71,918 | |
CCL Industries, Inc. – Class B | | | | | | | 1,790 | | | | 82,955 | |
Crown Holdings, Inc.(c) | | | | | | | 1,332 | | | | 79,560 | |
International Paper Co. | | | | | | | 1,270 | | | | 71,895 | |
Packaging Corp. of America | | | | | | | 678 | | | | 80,411 | |
Sealed Air Corp. | | | | | | | 1,509 | | | | 72,507 | |
Toyo Seikan Group Holdings Ltd. | | | | | | | 2,000 | | | | 33,119 | |
WestRock Co. | | | | | | | 1,050 | | | | 65,531 | |
| | | | | | | | | | | | |
| | | | | | | | | | | 700,066 | |
| | | | | | | | | | | | |
| | |
| abfunds.com | | AB GLOBAL RISK ALLOCATION FUND | 47 |
CONSOLIDATED PORTFOLIO OF INVESTMENTS (continued)
| | | | | | | | | | | | |
| Company | | | | |
Shares | | | U.S. $ Value | |
| |
| | | | | | | | | | | | |
Metals & Mining – 0.4% | | | | | | | | | | | | |
Agnico Eagle Mines Ltd. | | | | | | | 888 | | | $ | 38,923 | |
Alumina Ltd. | | | | | | | 11,360 | | | | 19,256 | |
Anglo American PLC | | | | | | | 1,415 | | | | 26,017 | |
Antofagasta PLC | | | | | | | 2,036 | | | | 25,075 | |
ArcelorMittal(c) | | | | | | | 987 | | | | 29,714 | |
Barrick Gold Corp. (Toronto) | | | | | | | 2,364 | | | | 32,653 | |
BHP Billiton Ltd. | | | | | | | 1,146 | | | | 23,906 | |
BHP Billiton PLC | | | | | | | 1,449 | | | | 26,354 | |
Boliden AB | | | | | | | 977 | | | | 30,927 | |
Eldorado Gold Corp. | | | | | | | 7,136 | | | | 8,186 | |
First Quantum Minerals Ltd. | | | | | | | 3,202 | | | | 36,806 | |
Fortescue Metals Group Ltd. | | | | | | | 2,635 | | | | 9,210 | |
Franco-Nevada Corp. | | | | | | | 739 | | | | 60,207 | |
Freeport-McMoRan, Inc.(c) | | | | | | | 2,604 | | | | 36,248 | |
Fresnillo PLC | | | | | | | 1,276 | | | | 22,295 | |
Glencore PLC | | | | | | | 5,705 | | | | 26,245 | |
Goldcorp, Inc. | | | | | | | 3,213 | | | | 40,619 | |
Hitachi Metals Ltd. | | | | | | | 1,600 | | | | 21,369 | |
JFE Holdings, Inc. | | | | | | | 1,300 | | | | 30,855 | |
Kinross Gold Corp.(c) | | | | | | | 6,730 | | | | 28,117 | |
Kobe Steel Ltd.(c) | | | | | | | 2,300 | | | | 21,841 | |
Maruichi Steel Tube Ltd. | | | | | | | 700 | | | | 19,801 | |
Mitsubishi Materials Corp. | | | | | | | 800 | | | | 26,936 | |
Newcrest Mining Ltd. | | | | | | | 981 | | | | 17,220 | |
Newmont Mining Corp. | | | | | | | 1,386 | | | | 51,268 | |
Nippon Steel & Sumitomo Metal Corp. | | | | | | | 1,200 | | | | 29,316 | |
Norsk Hydro ASA | | | | | | | 4,362 | | | | 29,668 | |
Nucor Corp. | | | | | | | 910 | | | | 52,325 | |
Randgold Resources Ltd. | | | | | | | 312 | | | | 28,617 | |
Rio Tinto Ltd. | | | | | | | 439 | | | | 23,723 | |
Rio Tinto PLC | | | | | | | 669 | | | | 31,674 | |
South32 Ltd. | | | | | | | 7,874 | | | | 19,270 | |
Sumitomo Metal Mining Co., Ltd. | | | | | | | 1,000 | | | | 39,093 | |
Teck Resources Ltd. – Class B | | | | | | | 2,652 | | | | 60,927 | |
thyssenkrupp AG | | | | | | | 1,007 | | | | 27,566 | |
Turquoise Hill Resources Ltd.(c) | | | | | | | 6,412 | | | | 18,985 | |
voestalpine AG | | | | | | | 636 | | | | 36,949 | |
Wheaton Precious Metals Corp. | | | | | | | 1,870 | | | | 39,121 | |
Yamana Gold, Inc. | | | | | | | 7,199 | | | | 18,414 | |
| | | | | | | | | | | | |
| | | | | | | | | | | 1,165,696 | |
| | | | | | | | | | | | |
Paper & Forest Products – 0.1% | | | | | | | | | | | | |
Mondi PLC | | | | | | | 1,889 | | | | 45,134 | |
Oji Holdings Corp. | | | | | | | 5,000 | | | | 30,583 | |
Stora Enso Oyj – Class R | | | | | | | 2,477 | | | | 37,865 | |
Svenska Cellulosa AB SCA – Class B | | | | | | | 1,288 | | | | 12,563 | |
| | |
| 48 | AB GLOBAL RISK ALLOCATION FUND | | abfunds.com |
CONSOLIDATED PORTFOLIO OF INVESTMENTS (continued)
| | | | | | | | | | | | |
| Company | | | | |
Shares | | | U.S. $ Value | |
| |
| | | | | | | | | | | | |
UPM-Kymmene Oyj | | | | | | | 1,348 | | | $ | 40,564 | |
West Fraser Timber Co., Ltd. | | | | | | | 1,065 | | | | 67,310 | |
| | | | | | | | | | | | |
| | | | | | | | | | | 234,019 | |
| | | | | | | | | | | | |
| | | | | | | | | | | 5,582,849 | |
| | | | | | | | | | | | |
Energy – 1.7% | | | | | | | | | | | | |
Energy Equipment & Services – 0.1% | | | | | | | | | | | | |
Baker Hughes a GE Co. – Class A | | | | | | | 758 | | | | 22,535 | |
Core Laboratories NV(d) | | | | | | | 280 | | | | 28,210 | |
Halliburton Co. | | | | | | | 747 | | | | 31,210 | |
Helmerich & Payne, Inc.(d) | | | | | | | 490 | | | | 28,704 | |
National Oilwell Varco, Inc. | | | | | | | 851 | | | | 28,551 | |
Petrofac Ltd. | | | | | | | 6,919 | | | | 39,436 | |
Saipem SpA(c) | | | | | | | 858 | | | | 3,446 | |
Schlumberger Ltd. | | | | | | | 606 | | | | 38,087 | |
TechnipFMC PLC | | | | | | | 994 | | | | 28,468 | |
Tenaris SA | | | | | | | 3,797 | | | | 55,336 | |
Weatherford International PLC(c)(d) | | | | | | | 2,627 | | | | 8,669 | |
| | | | | | | | | | | | |
| | | | | | | | | | | 312,652 | |
| | | | | | | | | | | | |
Oil, Gas & Consumable Fuels – 1.6% | |
AltaGas Ltd. | | | | | | | 3,076 | | | | 69,929 | |
Anadarko Petroleum Corp. | | | | | | | 586 | | | | 28,181 | |
Andeavor | | | | | | | 483 | | | | 50,942 | |
Antero Resources Corp.(c) | | | | | | | 1,271 | | | | 24,149 | |
Apache Corp. | | | | | | | 607 | | | | 25,391 | |
ARC Resources Ltd. | | | | | | | 2,540 | | | | 31,126 | |
BP PLC | | | | | | | 13,599 | | | | 90,572 | |
Cabot Oil & Gas Corp. | | | | | | | 1,013 | | | | 29,326 | |
Caltex Australia Ltd. | | | | | | | 2,288 | | | | 59,264 | |
Cameco Corp. | | | | | | | 2,728 | | | | 25,585 | |
Canadian Natural Resources Ltd. (Toronto) | | | | | | | 1,035 | | | | 35,106 | |
Cenovus Energy, Inc. | | | | | | | 2,621 | | | | 24,988 | |
Cheniere Energy, Inc.(c) | | | | | | | 609 | | | | 29,427 | |
Chevron Corp. | | | | | | | 461 | | | | 54,854 | |
China Petroleum & Chemical Corp. – Class H | | | | | | | 470,000 | | | | 337,355 | |
China Shenhua Energy Co., Ltd. – Class H | | | | | | | 199,000 | | | | 492,067 | |
Cimarex Energy Co. | | | | | | | 268 | | | | 31,118 | |
Concho Resources, Inc.(c) | | | | | | | 241 | | | | 33,706 | |
ConocoPhillips | | | | | | | 716 | | | | 36,430 | |
Continental Resources, Inc./OK(c) | | | | | | | 603 | | | | 28,540 | |
Crescent Point Energy Corp. | | | | | | | 2,365 | | | | 17,250 | |
Devon Energy Corp. | | | | | | | 669 | | | | 25,777 | |
Diamondback Energy, Inc.(c) | | | | | | | 286 | | | | 31,263 | |
Enagas SA | | | | | | | 3,496 | | | | 102,598 | |
Enbridge, Inc. (Toronto) | | | | | | | 1,314 | | | | 49,549 | |
Encana Corp. | | | | | | | 2,016 | | | | 23,861 | |
Eni SpA | | | | | | | 4,936 | | | | 81,201 | |
| | |
| abfunds.com | | AB GLOBAL RISK ALLOCATION FUND | 49 |
CONSOLIDATED PORTFOLIO OF INVESTMENTS (continued)
| | | | | | | | | | | | |
| Company | | | | |
Shares | | | U.S. $ Value | |
| |
| | | | | | | | | | | | |
EOG Resources, Inc. | | | | | | | 364 | | | $ | 37,245 | |
EQT Corp. | | | | | | | 539 | | | | 32,124 | |
Exxon Mobil Corp. | | | | | | | 713 | | | | 59,386 | |
Galp Energia SGPS SA | | | | | | | 4,711 | | | | 88,959 | |
Hess Corp. | | | | | | | 565 | | | | 25,922 | |
HollyFrontier Corp. | | | | | | | 1,019 | | | | 45,325 | |
Husky Energy, Inc.(c) | | | | | | | 3,080 | | | | 37,314 | |
Idemitsu Kosan Co., Ltd. | | | | | | | 1,300 | | | | 43,862 | |
Imperial Oil Ltd. | | | | | | | 1,534 | | | | 47,323 | |
Inpex Corp. | | | | | | | 4,500 | | | | 51,181 | |
Inter Pipeline Ltd. | | | | | | | 3,237 | | | | 67,994 | |
JXTG Holdings, Inc. | | | | | | | 10,100 | | | | 57,065 | |
Keyera Corp. | | | | | | | 1,731 | | | | 48,784 | |
Kinder Morgan, Inc./DE | | | | | | | 1,880 | | | | 32,392 | |
Koninklijke Vopak NV | | | | | | | 1,705 | | | | 71,944 | |
Lundin Petroleum AB(c) | | | | | | | 2,787 | | | | 64,191 | |
Marathon Oil Corp. | | | | | | | 1,390 | | | | 20,628 | |
Marathon Petroleum Corp. | | | | | | | 622 | | | | 38,956 | |
Murphy Oil Corp. | | | | | | | 914 | | | | 25,546 | |
Neste Oyj | | | | | | | 1,560 | | | | 96,819 | |
Newfield Exploration Co.(c) | | | | | | | 746 | | | | 23,074 | |
Noble Energy, Inc. | | | | | | | 924 | | | | 24,301 | |
Occidental Petroleum Corp. | | | | | | | 693 | | | | 48,857 | |
Oil Search Ltd. | | | | | | | 7,596 | | | | 40,700 | |
OMV AG | | | | | | | 1,553 | | | | 96,698 | |
ONEOK, Inc. | | | | | | | 703 | | | | 36,486 | |
Origin Energy Ltd.(c) | | | | | | | 6,206 | | | | 42,108 | |
Parsley Energy, Inc. – Class A(c) | | | | | | | 749 | | | | 20,118 | |
Pembina Pipeline Corp. | | | | | | | 2,130 | | | | 74,178 | |
Peyto Exploration & Development Corp. | | | | | | | 1,639 | | | | 19,450 | |
Phillips 66 | | | | | | | 607 | | | | 59,219 | |
Pioneer Natural Resources Co. | | | | | | | 178 | | | | 27,775 | |
PrairieSky Royalty Ltd. | | | | | | | 1,883 | | | | 49,273 | |
Range Resources Corp. | | | | | | | 940 | | | | 16,939 | |
Repsol SA | | | | | | | 4,690 | | | | 86,015 | |
Royal Dutch Shell PLC – Class A | | | | | | | 3,106 | | | | 99,321 | |
Royal Dutch Shell PLC – Class B | | | | | | | 3,120 | | | | 101,090 | |
Santos Ltd.(c) | | | | | | | 11,768 | | | | 45,573 | |
Seven Generations Energy Ltd.(c) | | | | | | | 1,456 | | | | 19,908 | |
Showa Shell Sekiyu KK | | | | | | | 4,200 | | | | 53,858 | |
Snam SpA | | | | | | | 22,765 | | | | 114,707 | |
Southwestern Energy Co.(c) | | | | | | | 2,381 | | | | 15,143 | |
Statoil ASA | | | | | | | 4,590 | | | | 92,301 | |
Suncor Energy, Inc. (Toronto) | | | | | | | 1,483 | | | | 51,439 | |
Targa Resources Corp. | | | | | | | 621 | | | | 26,951 | |
TOTAL SA | | | | | | | 1,632 | | | | 92,249 | |
Tourmaline Oil Corp.(c) | | | | | | | 1,532 | | | | 27,525 | |
| | |
| 50 | AB GLOBAL RISK ALLOCATION FUND | | abfunds.com |
CONSOLIDATED PORTFOLIO OF INVESTMENTS (continued)
| | | | | | | | | | | | |
| Company | | | | |
Shares | | | U.S. $ Value | |
| |
| | | | | | | | | | | | |
TransCanada Corp. | | | | | | | 1,444 | | | $ | 69,259 | |
Valero Energy Corp. | | | | | | | 618 | | | | 52,913 | |
Vermilion Energy, Inc. | | | | | | | 920 | | | | 32,446 | |
Williams Cos., Inc. (The) | | | | | | | 1,051 | | | | 30,532 | |
Woodside Petroleum Ltd. | | | | | | | 1,843 | | | | 43,525 | |
| | | | | | | | | | | | |
| | | | | | | | | | | 4,496,446 | |
| | | | | | | | | | | | |
| | | | | | | | | | | 4,809,098 | |
| | | | | | | | | | | | |
Utilities – 1.7% | | | | | | | | | | | | |
Electric Utilities – 0.9% | | | | | | | | | | | | |
Alliant Energy Corp. | | | | | | | 1,649 | | | | 74,386 | |
American Electric Power Co., Inc. | | | | | | | 1,054 | | | | 81,822 | |
AusNet Services | | | | | | | 25,318 | | | | 36,025 | |
Chubu Electric Power Co., Inc. | | | | | | | 2,200 | | | | 27,891 | |
Chugoku Electric Power Co., Inc. (The) | | | | | | | 2,700 | | | | 29,841 | |
CK Infrastructure Holdings Ltd. | | | | | | | 4,000 | | | | 34,036 | |
CLP Holdings Ltd. | | | | | | | 5,000 | | | | 50,991 | |
Contact Energy Ltd. | | | | | | | 9,286 | | | | 34,376 | |
Duke Energy Corp. | | | | | | | 865 | | | | 77,141 | |
Edison International | | | | | | | 797 | | | | 64,772 | |
EDP – Energias de Portugal SA | | | | | | | 18,050 | | | | 63,270 | |
Electricite de France SA | | | | | | | 3,570 | | | | 46,784 | |
Emera, Inc. | | | | | | | 2,500 | | | | 94,098 | |
Endesa SA | | | | | | | 3,408 | | | | 75,992 | |
Enel SpA | | | | | | | 10,639 | | | | 69,122 | |
Entergy Corp. | | | | | | | 880 | | | | 76,102 | |
Eversource Energy | | | | | | | 1,141 | | | | 73,994 | |
Exelon Corp. | | | | | | | 1,491 | | | | 62,190 | |
FirstEnergy Corp. | | | | | | | 1,915 | | | | 65,378 | |
Fortis, Inc./Canada | | | | | | | 2,662 | | | | 98,008 | |
Fortum Oyj | | | | | | | 4,004 | | | | 84,147 | |
HK Electric Investments & HK Electric Investments Ltd. – Class SS(b) | | | | | | | 35,797 | | | | 32,909 | |
Hokuriku Electric Power Co. | | | | | | | 3,500 | | | | 30,881 | |
Hydro One Ltd.(b) | | | | | | | 3,582 | | | | 63,136 | |
Iberdrola SA | | | | | | | 7,327 | | | | 58,202 | |
Kansai Electric Power Co., Inc. (The) | | | | | | | 1,900 | | | | 25,179 | |
Kyushu Electric Power Co., Inc. | | | | | | | 2,000 | | | | 22,874 | |
Mercury NZ Ltd. | | | | | | | 14,799 | | | | 33,279 | |
NextEra Energy, Inc. | | | | | | | 539 | | | | 85,184 | |
OGE Energy Corp. | | | | | | | 1,973 | | | | 70,554 | |
Orsted A/S(b) | | | | | | | 1,497 | | | | 87,195 | |
PG&E Corp. | | | | | | | 922 | | | | 50,009 | |
Pinnacle West Capital Corp. | | | | | | | 753 | | | | 69,133 | |
Power Assets Holdings Ltd. | | | | | | | 5,500 | | | | 47,033 | |
PPL Corp. | | | | | | | 1,790 | | | | 65,639 | |
Red Electrica Corp. SA | | | | | | | 3,748 | | | | 84,662 | |
| | |
| abfunds.com | | AB GLOBAL RISK ALLOCATION FUND | 51 |
CONSOLIDATED PORTFOLIO OF INVESTMENTS (continued)
| | | | | | | | | | | | |
| Company | | | | |
Shares | | | U.S. $ Value | |
| |
| | | | | | | | | | | | |
Southern Co. (The) | | | | | | | 1,397 | | | $ | 71,526 | |
SSE PLC | | | | | | | 3,489 | | | | 64,468 | |
Terna Rete Elettrica Nazionale SpA | | | | | | | 13,636 | | | | 84,268 | |
Tohoku Electric Power Co., Inc. | | | | | | | 2,300 | | | | 30,425 | |
Tokyo Electric Power Co. Holdings, Inc.(c) | | | | | | | 6,500 | | | | 26,195 | |
Westar Energy, Inc. | | | | | | | 973 | | | | 55,665 | |
Xcel Energy, Inc. | | | | | | | 1,190 | | | | 61,416 | |
| | | | | | | | | | | | |
| | | | | | | | | | | 2,540,198 | |
| | | | | | | | | | | | |
Gas Utilities – 0.1% | | | | | | | | | | | | |
APA Group | | | | | | | 4,738 | | | | 33,594 | |
Atmos Energy Corp. | | | | | | | 860 | | | | 79,369 | |
Gas Natural SDG SA | | | | | | | 2,625 | | | | 58,718 | |
Hong Kong & China Gas Co., Ltd. | | | | | | | 30,346 | | | | 59,345 | |
Osaka Gas Co., Ltd. | | | | | | | 2,000 | | | | 38,496 | |
Toho Gas Co., Ltd. | | | | | | | 800 | | | | 22,774 | |
Tokyo Gas Co., Ltd. | | | | | | | 1,200 | | | | 28,244 | |
UGI Corp. | | | | | | | 1,317 | | | | 64,546 | |
| | | | | | | | | | | | |
| | | | | | | | | | | 385,086 | |
| | | | | | | | | | | | |
Independent Power and Renewable Electricity Producers – 0.1% | | | | | | | | | | | | |
AES Corp./VA | | | | | | | 4,046 | | | | 42,807 | |
Calpine Corp.(c) | | | | | | | 1,855 | | | | 27,862 | |
Electric Power Development Co., Ltd. | | | | | | | 1,303 | | | | 36,260 | |
Meridian Energy Ltd. | | | | | | | 16,289 | | | | 32,287 | |
| | | | | | | | | | | | |
| | | | | | | | | | | 139,216 | |
| | | | | | | | | | | | |
Multi-Utilities – 0.5% | | | | | | | | | | | | |
AGL Energy Ltd. | | | | | | | 1,749 | | | | 33,163 | |
Ameren Corp. | | | | | | | 1,162 | | | | 74,321 | |
Atco Ltd./Canada – Class I | | | | | | | 1,665 | | | | 59,468 | |
Canadian Utilities Ltd. – Class A | | | | | | | 2,932 | | | | 88,722 | |
CenterPoint Energy, Inc. | | | | | | | 2,121 | | | | 63,651 | |
Centrica PLC | | | | | | | 23,244 | | | | 45,444 | |
CMS Energy Corp. | | | | | | | 1,535 | | | | 76,596 | |
Consolidated Edison, Inc. | | | | | | | 866 | | | | 77,109 | |
Dominion Energy, Inc. | | | | | | | 792 | | | | 66,631 | |
DTE Energy Co. | | | | | | | 687 | | | | 79,397 | |
E.ON SE | | | | | | | 6,694 | | | | 77,543 | |
Engie SA | | | | | | | 3,398 | | | | 59,474 | |
Innogy SE(b) | | | | | | | 2,098 | | | | 97,054 | |
National Grid PLC | | | | | | | 4,604 | | | | 55,130 | |
NiSource, Inc. | | | | | | | 2,608 | | | | 71,798 | |
Public Service Enterprise Group, Inc. | | | | | | | 1,187 | | | | 62,982 | |
RWE AG(c) | | | | | | | 2,734 | | | | 62,670 | |
SCANA Corp. | | | | | | | 783 | | | | 33,802 | |
Sempra Energy | | | | | | | 547 | | | | 66,182 | |
Suez | | | | | | | 3,280 | | | | 60,429 | |
| | |
| 52 | AB GLOBAL RISK ALLOCATION FUND | | abfunds.com |
CONSOLIDATED PORTFOLIO OF INVESTMENTS (continued)
| | | | | | | | | | | | |
| Company | | | | |
Shares | | | U.S. $ Value | |
| |
| | | | | | | | | | | | |
United Utilities Group PLC | | | | | | | 6,181 | | | $ | 68,620 | |
Veolia Environnement SA | | | | | | | 2,624 | | | | 66,320 | |
WEC Energy Group, Inc. | | | | | | | 1,055 | | | | 73,312 | |
| | | | | | | | | | | | |
| | | | | | | | | | | 1,519,818 | |
| | | | | | | | | | | | |
Water Utilities – 0.1% | | | | | | | | | | | | |
American Water Works Co., Inc. | | | | | | | 869 | | | | 79,566 | |
Severn Trent PLC | | | | | | | 2,353 | | | | 66,820 | |
| | | | | | | | | | | | |
| | | | | | | | | | | 146,386 | |
| | | | | | | | | | | | |
| | | | | | | | | | | 4,730,704 | |
| | | | | | | | | | | | |
Real Estate – 1.2% | | | | | | | | | | | | |
Equity Real Estate Investment Trusts (REITs) – 0.9% | | | | | | | | | | | | |
Alexandria Real Estate Equities, Inc. | | | | | | | 370 | | | | 47,012 | |
American Tower Corp. | | | | | | | 354 | | | | 50,951 | |
Ascendas Real Estate Investment Trust | | | | | | | 9,200 | | | | 18,044 | |
AvalonBay Communities, Inc. | | | | | | | 234 | | | | 42,431 | |
Boston Properties, Inc. | | | | | | | 360 | | | | 45,137 | |
British Land Co. PLC (The) | | | | | | | 5,156 | | | | 43,895 | |
Brixmor Property Group, Inc. | | | | | | | 1,101 | | | | 19,895 | |
Camden Property Trust | | | | | | | 472 | | | | 43,084 | |
CapitaLand Commercial Trust | | | | | | | 14,000 | | | | 19,644 | |
CapitaLand Mall Trust | | | | | | | 12,000 | | | | 18,264 | |
Colony NorthStar, Inc. – Class A | | | | | | | 3,138 | | | | 38,252 | |
Crown Castle International Corp. | | | | | | | 494 | | | | 55,822 | |
Daiwa House REIT Investment Corp. | | | | | | | 6 | | | | 14,362 | |
Dexus | | | | | | | 2,267 | | | | 17,834 | |
Digital Realty Trust, Inc. | | | | | | | 378 | | | | 44,113 | |
Duke Realty Corp. | | | | | | | 1,323 | | | | 37,216 | |
Equinix, Inc. | | | | | | | 91 | | | | 42,269 | |
Equity Residential | | | | | | | 641 | | | | 42,832 | |
Essex Property Trust, Inc. | | | | | | | 185 | | | | 45,693 | |
Extra Space Storage, Inc. | | | | | | | 489 | | | | 41,741 | |
Federal Realty Investment Trust | | | | | | | 282 | | | | 37,283 | |
Fonciere Des Regions | | | | | | | 424 | | | | 45,326 | |
Gecina SA | | | | | | | 296 | | | | 49,324 | |
GGP, Inc. | | | | | | | 1,214 | | | | 28,529 | |
Goodman Group | | | | | | | 2,849 | | | | 18,825 | |
GPT Group (The) | | | | | | | 4,611 | | | | 18,950 | |
H&R Real Estate Investment Trust | | | | | | | 3,643 | | | | 59,693 | |
Hammerson PLC | | | | | | | 5,647 | | | | 39,690 | |
HCP, Inc. | | | | | | | 1,144 | | | | 30,247 | |
Host Hotels & Resorts, Inc. | | | | | | | 1,706 | | | | 33,762 | |
ICADE | | | | | | | 547 | | | | 50,809 | |
Intu Properties PLC | | | | | | | 9,375 | | | | 24,933 | |
Iron Mountain, Inc. | | | | | | | 1,144 | | | | 46,755 | |
Japan Prime Realty Investment Corp. | | | | | | | 6 | | | | 20,125 | |
| | |
| abfunds.com | | AB GLOBAL RISK ALLOCATION FUND | 53 |
CONSOLIDATED PORTFOLIO OF INVESTMENTS (continued)
| | | | | | | | | | | | |
| Company | | | | |
Shares | | | U.S. $ Value | |
| |
| | | | | | | | | | | | |
Japan Real Estate Investment Corp. | | | | | | | 4 | | | $ | 19,406 | |
Japan Retail Fund Investment Corp. | | | | | | | 8 | | | | 14,167 | |
JBG SMITH Properties | | | | | | | 232 | | | | 7,728 | |
Kimco Realty Corp. | | | | | | | 1,471 | | | | 27,243 | |
Klepierre SA | | | | | | | 1,062 | | | | 43,824 | |
Land Securities Group PLC | | | | | | | 3,092 | | | | 39,060 | |
Liberty Property Trust | | | | | | | 1,003 | | | | 45,015 | |
Link REIT | | | | | | | 3,000 | | | | 26,856 | |
Macerich Co. (The) | | | | | | | 493 | | | | 31,922 | |
Mid-America Apartment Communities, Inc. | | | | | | | 487 | | | | 49,888 | |
Mirvac Group | | | | | | | 10,349 | | | | 19,235 | |
National Retail Properties, Inc. | | | | | | | 864 | | | | 35,484 | |
Nippon Building Fund, Inc. | | | | | | | 4 | | | | 20,010 | |
Nippon Prologis REIT, Inc. | | | | | | | 7 | | | | 14,996 | |
Nomura Real Estate Master Fund, Inc. | | | | | | | 12 | | | | 15,109 | |
Prologis, Inc. | | | | | | | 721 | | | | 47,752 | |
Public Storage | | | | | | | 203 | | | | 43,263 | |
Realty Income Corp. | | | | | | | 678 | | | | 37,493 | |
Regency Centers Corp. | | | | | | | 664 | | | | 45,026 | |
RioCan Real Estate Investment Trust (Toronto) | | | | | | | 3,105 | | | | 59,927 | |
SBA Communications Corp.(c) | | | | | | | 280 | | | | 47,530 | |
Scentre Group | | | | | | | 5,795 | | | | 18,629 | |
Segro PLC | | | | | | | 5,086 | | | | 37,729 | |
Simon Property Group, Inc. | | | | | | | 199 | | | | 32,188 | |
SL Green Realty Corp. | | | | | | | 359 | | | | 36,701 | |
SmartCentres Real Estate Investment Trust | | | | | | | 1,619 | | | | 36,543 | |
Stockland | | | | | | | 5,177 | | | | 18,492 | |
Suntec Real Estate Investment Trust | | | | | | | 13,300 | | | | 20,176 | |
UDR, Inc. | | | | | | | 1,200 | | | | 47,196 | |
Unibail-Rodamco SE | | | | | | | 156 | | | | 39,870 | |
United Urban Investment Corp. | | | | | | | 12 | | | | 16,985 | |
Ventas, Inc. | | | | | | | 613 | | | | 39,238 | |
VEREIT, Inc. | | | | | | | 3,437 | | | | 26,809 | |
Vicinity Centres | | | | | | | 8,394 | | | | 17,845 | |
Vornado Realty Trust | | | | | | | 465 | | | | 36,093 | |
Welltower, Inc. | | | | | | | 621 | | | | 41,893 | |
Westfield Corp. | | | | | | | 2,599 | | | | 16,543 | |
Weyerhaeuser Co. | | | | | | | 1,110 | | | | 39,272 | |
| | | | | | | | | | | | |
| | | | | | | | | | | 2,445,878 | |
| | | | | | | | | | | | |
Real Estate Management & Development – 0.3% | | | | | | | | | | | | |
Aeon Mall Co., Ltd. | | | | | | | 900 | | | | 16,505 | |
CapitaLand Ltd. | | | | | | | 6,700 | | | | 17,624 | |
CBRE Group, Inc. – Class A(c) | | | | | | | 938 | | | | 40,672 | |
City Developments Ltd. | | | | | | | 2,300 | | | | 20,744 | |
CK Asset Holdings Ltd. | | | | | | | 2,684 | | | | 22,709 | |
Daito Trust Construction Co., Ltd. | | | | | | | 100 | | | | 18,306 | |
| | |
| 54 | AB GLOBAL RISK ALLOCATION FUND | | abfunds.com |
CONSOLIDATED PORTFOLIO OF INVESTMENTS (continued)
| | | | | | | | | | | | |
| Company | | | | |
Shares | | | U.S. $ Value | |
| |
| | | | | | | | | | | | |
Daiwa House Industry Co., Ltd. | | | | | | | 500 | | | $ | 18,364 | |
Deutsche Wohnen SE | | | | | | | 1,099 | | | | 48,640 | |
First Capital Realty, Inc. | | | | | | | 2,575 | | | | 41,994 | |
Global Logistic Properties Ltd. | | | | | | | 8,000 | | | | 19,872 | |
Hang Lung Group Ltd. | | | | | | | 4,000 | | | | 14,391 | |
Hang Lung Properties Ltd. | | | | | | | 7,000 | | | | 16,558 | |
Henderson Land Development Co., Ltd. | | | | | | | 3,465 | | | | 22,713 | |
Hongkong Land Holdings Ltd. | | | | | | | 2,200 | | | | 16,090 | |
Hulic Co., Ltd. | | | | | | | 1,800 | | | | 19,783 | |
Hysan Development Co., Ltd. | | | | | | | 4,000 | | | | 21,434 | |
Jones Lang LaSalle, Inc. | | | | | | | 249 | | | | 37,970 | |
Kerry Properties Ltd. | | | | | | | 4,500 | | | | 19,923 | |
LendLease Group | | | | | | | 1,330 | | | | 16,102 | |
Mitsubishi Estate Co., Ltd. | | | | | | | 900 | | | | 16,110 | |
Mitsui Fudosan Co., Ltd. | | | | | | | 700 | | | | 15,875 | |
New World Development Co., Ltd. | | | | | | | 16,287 | | | | 23,667 | |
Nomura Real Estate Holdings, Inc. | | | | | | | 800 | | | | 18,546 | |
Sino Land Co., Ltd. | | | | | | | 10,000 | | | | 18,139 | |
Sumitomo Realty & Development Co., Ltd. | | | | | | | 1,000 | | | | 33,042 | |
Sun Hung Kai Properties Ltd. | | | | | | | 1,000 | | | | 16,394 | |
Swire Pacific Ltd. – Class A | | | | | | | 2,500 | | | | 24,046 | |
Swire Properties Ltd. | | | | | | | 5,200 | | | | 17,667 | |
Swiss Prime Site AG (REG)(c) | | | | | | | 732 | | | | 63,136 | |
Tokyo Tatemono Co., Ltd. | | | | | | | 1,300 | | | | 18,079 | |
Tokyu Fudosan Holdings Corp. | | | | | | | 2,900 | | | | 21,006 | |
UOL Group Ltd. | | | | | | | 3,428 | | | | 22,681 | |
Vonovia SE | | | | | | | 1,235 | | | | 58,195 | |
Wharf Holdings Ltd. (The) | | | | | | | 2,000 | | | | 6,327 | |
Wharf Real Estate Investment Co., Ltd.(c) | | | | | | | 2,000 | | | | 12,087 | |
Wheelock & Co., Ltd. | | | | | | | 2,000 | | | | 13,764 | |
| | | | | | | | | | | | |
| | | | | | | | | | | 849,155 | |
| | | | | | | | | | | | |
| | | | | | | | | | | 3,295,033 | |
| | | | | | | | | | | | |
Telecommunication Services – 0.6% | |
Diversified Telecommunication Services – 0.5% | | | | | | | | | | | | |
AT&T, Inc. | | | | | | | 2,120 | | | | 77,126 | |
BCE, Inc. | | | | | | | 3,032 | | | | 145,096 | |
BT Group PLC | | | | | | | 7,665 | | | | 26,927 | |
CenturyLink, Inc. | | | | | | | 3,838 | | | | 55,996 | |
Deutsche Telekom AG (REG) | | | | | | | 2,256 | | | | 40,289 | |
Elisa Oyj | | | | | | | 1,116 | | | | 45,384 | |
Frontier Communications Corp.(d) | | | | | | | 2,474 | | | | 21,029 | |
HKT Trust & HKT Ltd. – Class SS | | | | | | | 15,000 | | | | 18,803 | |
Iliad SA | | | | | | | 138 | | | | 32,268 | |
Inmarsat PLC | | | | | | | 3,662 | | | | 23,933 | |
Koninklijke KPN NV | | | | | | | 12,242 | | | | 44,880 | |
| | |
| abfunds.com | | AB GLOBAL RISK ALLOCATION FUND | 55 |
CONSOLIDATED PORTFOLIO OF INVESTMENTS (continued)
| | | | | | | | | | | | |
| Company | | | | |
Shares | | | U.S. $ Value | |
| |
| | | | | | | | | | | | |
Nippon Telegraph & Telephone Corp. | | | | | | | 600 | | | $ | 31,322 | |
Orange SA | | | | | | | 2,176 | | | | 37,447 | |
PCCW Ltd. | | | | | | | 34,000 | | | | 20,242 | |
Proximus SADP | | | | | | | 1,770 | | | | 60,703 | |
Singapore Telecommunications Ltd. | | | | | | | 7,300 | | | | 20,185 | |
Spark New Zealand Ltd. | | | | | | | 7,582 | | | | 18,760 | |
Swisscom AG (REG) | | | | | | | 114 | | | | 60,226 | |
TDC A/S | | | | | | | 5,676 | | | | 34,547 | |
Telecom Italia SpA/Milano (ordinary shares)(c) | | | | | | | 31,583 | | | | 26,427 | |
Telecom Italia SpA/Milano (savings shares) | | | | | | | 39,625 | | | | 26,838 | |
Telefonica Deutschland Holding AG | | | | | | | 7,772 | | | | 37,033 | |
Telefonica SA | | | | | | | 3,229 | | | | 33,107 | |
Telenor ASA | | | | | | | 2,325 | | | | 52,210 | |
Telia Co. AB | | | | | | | 12,753 | | | | 56,002 | |
Telstra Corp., Ltd. | | | | | | | 7,921 | | | | 20,609 | |
TELUS Corp. | | | | | | | 3,342 | | | | 123,510 | |
TPG Telecom Ltd. | | | | | | | 4,421 | | | | 19,963 | |
Verizon Communications, Inc. | | | | | | | 1,696 | | | | 86,309 | |
Vocus Group Ltd. | | | | | | | 10,099 | | | | 24,156 | |
Zayo Group Holdings, Inc.(c) | | | | | | | 1,513 | | | | 53,469 | |
| | | | | | | | | | | | |
| | | | | | | | | | | 1,374,796 | |
| | | | | | | | | | | | |
Wireless Telecommunication Services – 0.1% | |
KDDI Corp. | | | | | | | 800 | | | | 22,829 | |
Millicom International Cellular SA | | | | | | | 591 | | | | 38,654 | |
NTT DOCOMO, Inc. | | | | | | | 1,000 | | | | 25,822 | |
Rogers Communications, Inc. – Class B | | | | | | | 2,193 | | | | 113,819 | |
SoftBank Group Corp. | | | | | | | 200 | | | | 16,978 | |
Sprint Corp.(c) | | | | | | | 2,737 | | | | 16,394 | |
StarHub Ltd. | | | | | | | 10,000 | | | | 21,161 | |
T-Mobile US, Inc.(c) | | | | | | | 690 | | | | 42,138 | |
Tele2 AB – Class B | | | | | | | 4,849 | | | | 62,024 | |
Vodafone Group PLC | | | | | | | 17,886 | | | | 54,232 | |
| | | | | | | | | | | | |
| | | | | | | | | | | 414,051 | |
| | | | | | | | | | | | |
| | | | | | | | | | | 1,788,847 | |
| | | | | | | | | | | | |
Total Common Stocks
(cost $54,050,950) | | | | | | | | | | | 68,002,104 | |
| | | | | | | | | | | | |
| | | | | | | | | | | | |
| | |
| 56 | AB GLOBAL RISK ALLOCATION FUND | | abfunds.com |
CONSOLIDATED PORTFOLIO OF INVESTMENTS (continued)
| | | | | | | | | | | | |
| | | | | | Principal
Amount
(000) | | | U.S. $ Value | |
| |
| | | | | | | | | | | | |
COLLATERALIZED MORTGAGE OBLIGATIONS – 3.6% | | | | | | | | | | | | |
Risk Share Floating Rate – 3.6% | | | | | | | | | | | | |
Federal National Mortgage Association Connecticut Avenue Securities
Series 2015-C03, Class 1M2
6.329% (LIBOR 1 Month + 5.00%), 7/25/25(e) | | U.S.$ | | | | | 1,253 | | | $ | 1,398,655 | |
Series 2015-C03, Class 2M2 6.329% (LIBOR 1 Month + 5.00%), 7/25/25(e) | | | | | | | 8,000 | | | | 8,754,954 | |
| | | | | | | | | | | | |
| | | |
Total Collateralized Mortgage Obligations
(cost $9,278,942) | | | | | | | | | | | 10,153,609 | |
| | | | | | | | | | | | |
| | | |
| | | | | | Shares | | | | |
PREFERRED STOCKS – 1.5% | | | | | | | | | | | | |
Financials – 1.5% | | | | | | | | | | | | |
Equity Real Estate Investment Trusts (REITs) – 1.5% | | | | | | | | | | | | |
Apartment Investment & Management Co.
6.875% | | | | | | | 42,000 | | | | 1,130,640 | |
Hersha Hospitality Trust
6.875% | | | | | | | 60,000 | | | | 1,516,500 | |
Pebblebrook Hotel Trust
6.50%(d) | | | | | | | 58,525 | | | | 1,486,535 | |
| | | | | | | | | | | | |
| | | |
Total Preferred Stocks
(cost $4,013,125) | | | | | | | | | | | 4,133,675 | |
| | | | | | | | | | | | |
| | | |
| | | | | | Principal
Amount
(000) | | | | |
GOVERNMENTS – SOVEREIGN BONDS – 0.4% | | | | | | | | | | | | |
Mexico – 0.4% | | | | | | | | | | | | |
Mexico Government International Bond
4.125%, 1/21/26
(cost $1,170,791) | | U.S.$ | | | | | 1,174 | | | | 1,233,287 | |
| | | | | | | | | | | | |
| | | | | | | | | | | | |
EMERGING MARKETS – CORPORATE BONDS – 0.2% | | | | | | | | | | | | |
Industrial – 0.2% | | | | | | | | | | | | |
Energy – 0.2% | | | | | | | | | | | | |
Petrobras Global Finance BV
5.625%, 5/20/43
(cost $510,530) | | | | | | | 768 | | | | 687,590 | |
| | | | | | | | | | | | |
| | |
| abfunds.com | | AB GLOBAL RISK ALLOCATION FUND | 57 |
CONSOLIDATED PORTFOLIO OF INVESTMENTS (continued)
| | | | | | | | | | | | |
| | | | | |
Notional Amount | | | U.S. $ Value | |
| |
| | | | | | | | | | | | |
OPTIONS PURCHASED – CALLS – 0.2% | | | | | | | | | | | | |
Options on Funds and Investment Trusts – 0.1% | | | | | | | | | |
SPDR S&P 500 ETF Trust
Expiration: Dec 2017; Contracts: 1,116; Exercise Price: USD 263.00;
Counterparty: Morgan Stanley & Co., Inc.(c) | | | USD | | | | 111,600 | | | $ | 314,154 | |
| | | | | | | | | | | | |
| | | |
Options on Forward Contracts – 0.1% | | | | | | | | | | | | |
SEK/EUR
Expiration: Feb 2018; Contracts: 23,474,000; Exercise Price: SEK 9.70;
Counterparty: UBS AG(c) | | | SEK | | | | 23,474,000 | | | | 8,685 | |
TRY/EUR
Expiration: Jan 2018; Contracts: 20,213,829; Exercise Price: TRY 4.24;
Counterparty: Goldman Sachs Bank USA(c) | | | TRY | | | | 20,213,829 | | | | 1,714 | |
TRY/USD
Expiration: Jan 2018; Contracts: 20,792,000; Exercise Price: TRY 3.68;
Counterparty: Citibank, NA(c) | | | TRY | | | | 20,792,000 | | | | 4,789 | |
ZAR/USD
Expiration: Jan 2018; Contracts: 75,428,600; Exercise Price: ZAR 13.40;
Counterparty: Goldman Sachs Bank USA(c) | | | ZAR | | | | 75,428,600 | | | | 84,228 | |
| | | | | | | | | | | | |
| | | | | | | | | | | 99,416 | |
| | | | | | | | | | | | |
Total Options Purchased – Calls
(premiums paid $319,097) | | | | | | | | | | | 413,570 | |
| | | | | | | | | | | | |
| | | | | | | | | | | | |
OPTIONS PURCHASED – PUTS – 0.1% | | | | | | | | | | | | |
Swaptions – 0.1% | | | | | | | | | | | | |
IRS Swaption
Expiration: Dec 2017; Contracts: 42,216,000; Exercise Rate: 2.43%;
Counterparty: Citibank, NA(c) | | | USD | | | | 42,216,000 | | | | 152,047 | |
| | | | | | | | | | | | |
| | | |
Options on Forward Contracts – 0.0% | | | | | | | | | | | | |
USD/MXN
Expiration: Aug 2018; Contracts: 2,800,000; Exercise Price: USD 17.50;
Counterparty: Credit Suisse
International(c) | | | USD | | | | 2,800,000 | | | | 24,715 | |
| | | | | | | | | | | | |
| | | |
Total Options Purchased – Puts
(premiums paid $183,067) | | | | | | | | | | | 176,762 | |
| | | | | | | | | | | | |
| | |
| 58 | AB GLOBAL RISK ALLOCATION FUND | | abfunds.com |
CONSOLIDATED PORTFOLIO OF INVESTMENTS (continued)
| | | | | | | | | | | | |
| Company | | | | |
Shares | | | U.S. $ Value | |
| |
| | | | | | | | | | | | |
INVESTMENT COMPANIES – 0.0% | | | | | | | | | | | | |
Funds and Investment Trusts – 0.0% | | | | | | | | | | | | |
Altaba, Inc.(c)(f)
(cost $40,415) | | | | | | | 1,120 | | | $ | 78,467 | |
| | | | | | | | | | | | |
| | | | | | | | | | | | |
RIGHTS – 0.0% | | | | | | | | | | | | |
Consumer Staples – 0.0% | | | | | | | | | | | | |
Food & Staples Retailing – 0.0% | | | | | | | | | | | | |
Safeway, Inc., expiring 2/02/19(c)(d)(g) | | | | | | | 620 | | | | 629 | |
Safeway, Inc., expiring 2/02/17(c)(d)(g) | | | | | | | 620 | | | | 31 | |
| | | | | | | | | | | | |
| | | | | | | | | | | 660 | |
| | | | | | | | | | | | |
Industrials – 0.0% | | | | | | | | | | | | |
Aerospace & Defense – 0.0% | | | | | | | | | | | | |
Rolls-Royce Holdings PLC,
expiring 12/01/17(c)(g) | | | | | | | 58,466 | | | | 79 | |
| | | | | | | | | | | | |
| | | |
Total Rights
(cost $724) | | | | | | | | | | | 739 | |
| | | | | | | | | | | | |
| | | |
| | | | | | Principal
Amount
(000) | | | | |
SHORT-TERM INVESTMENTS – 9.9% | | | | | | | | | | | | |
Governments – Treasuries – 7.3% | | | | | | | | | | | | |
Japan – 7.3% | | | | | | | | | | | | |
Japan Treasury Discount Bill
Series 707
Zero Coupon, 12/11/17
(cost $21,285,582) | | | JPY | | | | 2,309,000 | | | | 20,517,386 | |
| | | | | | | | | | | | |
| | | |
| | | | | | Shares | | | | |
Investment Companies – 2.6% | | | | | | | | | | | | |
AB Fixed Income Shares, Inc. – Government Money Market Portfolio – Class AB, 0.91%(f)(h)(i)
(cost $7,373,236) | | | | | | | 7,373,236 | | | | 7,373,236 | |
| | | | | | | | | | | | |
| | | |
Total Short-Term Investments
(cost $28,658,818) | | | | | | | | | | | 27,890,622 | |
| | | | | | | | | | | | |
Total Investments Before Security Lending Collateral for Securities Loaned – 96.1%
(cost $260,356,187) | | | | | | | | | | | 270,978,230 | |
| | | | | | | | | | | | |
| | | | | | | | | | | | |
| | |
| abfunds.com | | AB GLOBAL RISK ALLOCATION FUND | 59 |
CONSOLIDATED PORTFOLIO OF INVESTMENTS (continued)
| | | | | | | | | | | | |
| Company | | | | |
Shares | | | U.S. $ Value | |
| |
| | | | | | | | | | | | |
INVESTMENTS OF CASH COLLATERAL FOR SECURITIES LOANED – 0.5% | | | | | | | | | | | | |
Investment Companies – 0.5% | | | | | | | | | | | | |
AB Fixed Income Shares, Inc. – Government Money Market Portfolio – Class AB, 0.91%(f)(h)(i)
(cost $1,332,435) | | | | | | | 1,332,435 | | | $ | 1,332,435 | |
| | | | | | | | | | | | |
| | | |
Total Investments – 96.6%
(cost $261,688,622) | | | | | | | | | | | 272,310,665 | |
Other assets less liabilities – 3.4% | | | | | | | | | | | 9,496,397 | |
| | | | | | | | | | | | |
| | | |
Net Assets – 100.0% | | | | | | | | | | $ | 281,807,062 | |
| | | | | | | | | | | | |
FUTURES (see Note D)
| | | | | | | | | | | | | | | | | | | | | | | | | | | | |
| Description | | Number of
Contracts | | | Expiration
Month | | | Notional
(000) | | | Original
Value | | | Value at
November 30,
2017 | | | Unrealized
Appreciation/
(Depreciation) | |
Purchased Contracts | |
10 Yr Australian Bond Futures | | | 35 | | |
| December
2017 |
| | | AUD | | | | 3,500 | | | $ | 3,420,102 | | | $ | 3,458,666 | | | $ | 38,564 | |
Brent Crude Futures | | | 28 | | |
| March
2018 |
| | | USD | | | | 28 | | | | 1,753,131 | | | | 1,745,520 | | | | (7,611 | ) |
Canadian 10 Yr Bond Futures | | | 191 | | |
| March
2018 |
| | | CAD | | | | 19,100 | | | | 20,120,331 | | | | 20,237,724 | | | | 117,393 | |
Cattle Feeder Futures | | | 18 | | |
| January
2018 |
| | | USD | | | | 900 | | | | 1,365,668 | | | | 1,387,575 | | | | 21,907 | |
Cocoa Futures | | | 94 | | |
| March
2018 |
| | | USD | | | | 1 | | | | 1,952,255 | | | | 1,926,060 | | | | (26,195 | ) |
Coffee Robusta Futures | | | 70 | | |
| January
2018 |
| | | USD | | | | 1 | | | | 1,381,520 | | | | 1,208,200 | | | | (173,320 | ) |
Coffee ‘C’ Futures | | | 19 | | |
| March
2018 |
| | | USD | | | | 713 | | | | 914,199 | | | | 915,562 | | | | 1,363 | |
Copper Futures | | | 40 | | |
| March
2018 |
| | | USD | | | | 1,000 | | | | 3,112,249 | | | | 3,064,000 | | | | (48,249 | ) |
Corn Futures | | | 151 | | |
| March
2018 |
| | | USD | | | | 755 | | | | 2,680,277 | | | | 2,685,913 | | | | 5,636 | |
Cotton No.2 Futures | | | 94 | | |
| March
2018 |
| | | USD | | | | 4,700 | | | | 3,230,417 | | | | 3,422,070 | | | | 191,653 | |
Euro STOXX 50 Index Futures | | | 469 | | |
| December
2017 |
| | | EUR | | | | 5 | | | | 19,548,517 | | | | 19,945,451 | | | | 396,934 | |
Euro-Bund Futures | | | 34 | | |
| December
2017 |
| | | EUR | | | | 3,400 | | | | 6,590,771 | | | | 6,585,031 | | | | (5,740 | ) |
FTSE 100 Index Futures | | | 32 | | |
| December
2017 |
| | | GBP | | | | – 0 | –** | | | 3,216,696 | | | | 3,171,758 | | | | (44,938 | ) |
| | |
| 60 | AB GLOBAL RISK ALLOCATION FUND | | abfunds.com |
CONSOLIDATED PORTFOLIO OF INVESTMENTS (continued)
| | | | | | | | | | | | | | | | | | | | | | | | | | | | |
| Description | | Number of
Contracts | | | Expiration
Month | | | Notional
(000) | | | Original
Value | | | Value at
November 30,
2017 | | | Unrealized
Appreciation/
(Depreciation) | |
Gasoline RBOB Futures | | | 28 | | |
| January
2018 |
| | | USD | | | | 1,176 | | | $ | 1,860,311 | | | $ | 2,034,480 | | | $ | 174,169 | |
Gold 100 OZ Futures | | | 31 | | |
| February
2018 |
| | | USD | | | | 3 | | | | 3,986,058 | | | | 3,957,770 | | | | (28,288 | ) |
Hang Seng Index Futures | | | 3 | | |
| December
2017 |
| | | HKD | | | | – 0 | –** | | | 575,345 | | | | 563,094 | | | | (12,251 | ) |
KC HRW Wheat Futures | | | 73 | | |
| March
2018 |
| | | USD | | | | 365 | | | | 1,621,710 | | | | 1,574,975 | | | | (46,735 | ) |
Lean Hogs Futures | | | 57 | | |
| February
2018 |
| | | USD | | | | 2,280 | | | | 1,598,563 | | | | 1,590,870 | | | | (7,693 | ) |
Live Cattle Futures | | | 27 | | |
| February
2018 |
| | | USD | | | | 1,080 | | | | 1,363,042 | | | | 1,349,730 | | | | (13,312 | ) |
LME Lead Futures | | | 37 | | |
| December
2017 |
| | | USD | | | | 1 | | | | 2,162,516 | | | | 2,287,987 | | | | 125,471 | |
LME Nickel Futures | | | 15 | | |
| December
2017 |
| | | USD | | | | – 0 | –** | | | 1,089,250 | | | | 995,130 | | | | (94,120 | ) |
LME Nickel Futures | | | 28 | | |
| January
2018 |
| | | USD | | | | – 0 | –** | | | 1,992,853 | | | | 1,861,272 | | | | (131,581 | ) |
LME Primary Aluminum Futures | | | 119 | | |
| December
2017 |
| | | USD | | | | 3 | | | | 6,266,775 | | | | 6,048,175 | | | | (218,600 | ) |
LME Primary Aluminum Futures | | | 85 | | |
| January
2018 |
| | | USD | | | | 2 | | | | 4,470,397 | | | | 4,333,938 | | | | (136,459 | ) |
LME Zinc Futures | | | 27 | | |
| January
2018 |
| | | USD | | | | 1 | | | | 2,120,024 | | | | 2,131,144 | | | | 11,120 | |
Long Gilt Futures | | | 65 | | |
| March
2018 |
| | | GBP | | | | 6,500 | | | | 10,910,090 | | | | 10,865,185 | | | | (44,905 | ) |
Low SU Gasoil Futures | | | 41 | | |
| December
2017 |
| | | USD | | | | 4 | | | | 2,157,700 | | | | 2,283,700 | | | | 126,000 | |
Mini MSCI Emerging Markets Futures | | | 208 | | |
| December
2017 |
| | | USD | | | | 10 | | | | 11,486,507 | | | | 11,648,000 | | | | 161,493 | |
Natural Gas Futures | | | 97 | | |
| January
2018 |
| | | USD | | | | 970 | | | | 3,177,329 | | | | 2,934,250 | | | | (243,079 | ) |
Nikkei 225 (CME) Futures | | | 112 | | |
| December
2017 |
| | | USD | | | | 1 | | | | 10,976,326 | | | | 12,812,800 | | | | 1,836,474 | |
NY Harbor ULSD Futures | | | 57 | | |
| January
2018 |
| | | USD | | | | 2,394 | | | | 4,506,548 | | | | 4,542,854 | | | | 36,306 | |
Palladium Futures | | | 26 | | |
| March
2018 |
| | | USD | | | | 3 | | | | 2,570,029 | | | | 2,609,230 | | | | 39,201 | |
Platinum Futures | | | 78 | | |
| January
2018 |
| | | USD | | | | 4 | | | | 3,703,612 | | | | 3,675,750 | | | | (27,862 | ) |
Russell 2000 Mini Futures | | | 136 | | |
| December
2017 |
| | | USD | | | | 7 | | | | 9,728,627 | | | | 10,508,720 | | | | 780,093 | |
S&P Mid 400 E-Mini Futures | | | 16 | | |
| December
2017 |
| | | USD | | | | 2 | | | | 2,822,753 | | | | 3,040,000 | | | | 217,247 | |
S&P TSX 60 Index Futures | | | 11 | | |
| December
2017 |
| | | CAD | | | | 2 | | | | 1,496,223 | | | | 1,622,013 | | | | 125,790 | |
Silver Futures | | | 26 | | |
| March
2018 |
| | | USD | | | | 130 | | | | 2,214,485 | | | | 2,141,620 | | | | (72,865 | ) |
| | |
| abfunds.com | | AB GLOBAL RISK ALLOCATION FUND | 61 |
CONSOLIDATED PORTFOLIO OF INVESTMENTS (continued)
| | | | | | | | | | | | | | | | | | | | | | | | | | | | |
| Description | | Number of
Contracts | | | Expiration
Month | | | Notional
(000) | | | Original
Value | | | Value at
November 30,
2017 | | | Unrealized
Appreciation/
(Depreciation) | |
Soybean Futures | | | 68 | | |
| January
2018 |
| | | USD | | | | 340 | | | $ | 3,397,127 | | | $ | 3,351,550 | | | $ | (45,577 | ) |
Soybean Meal Futures | | | 120 | | |
| January
2018 |
| | | USD | | | | 12 | | | | 3,763,084 | | | | 3,918,000 | | | | 154,916 | |
Soybean Oil Futures | | | 128 | | |
| January
2018 |
| | | USD | | | | 7,680 | | | | 2,648,443 | | | | 2,599,680 | | | | (48,763 | ) |
SPI 200 Futures | | | 4 | | |
| December
2017 |
| | | AUD | | | | – 0 | –** | | | 431,308 | | | | 452,781 | | | | 21,473 | |
Sugar 11 (World) Futures | | | 83 | | |
| March
2018 |
| | | USD | | | | 9,296 | | | | 1,389,106 | | | | 1,401,837 | | | | 12,731 | |
TOPIX Index Futures | | | 12 | | |
| December
2017 |
| | | JPY | | | | 120 | | | | 1,706,701 | | | | 1,916,034 | | | | 209,333 | |
U.S. T-Note 5 Yr (CBT) Futures | | | 96 | | |
| March
2018 |
| | | USD | | | | 9,600 | | | | 11,212,200 | | | | 11,169,000 | | | | (43,200 | ) |
Wheat (CBT) Futures | | | 73 | | |
| March
2018 |
| | | USD | | | | 365 | | | | 1,614,429 | | | | 1,580,450 | | | | (33,979 | ) |
WTI Crude Futures | | | 32 | | |
| January
2018 |
| | | USD | | | | 32 | | | | 1,762,000 | | | | 1,836,800 | | | | 74,800 | |
|
Sold Contracts | |
10 Yr Japan Bond (OSE) Futures | | | 14 | | |
| December
2017 |
| | | JPY | | | | 1,400,000 | | | | 18,791,868 | | | | 18,774,890 | | | | 16,978 | |
Gasoline RBOB Futures | | | 30 | | |
| December
2017 |
| | | USD | | | | 1,260 | | | | 2,201,220 | | | | 2,179,800 | | | | 21,420 | |
Gold 100 OZ Futures | | | 4 | | |
| February
2018 |
| | | USD | | | | – 0 | –** | | | 510,952 | | | | 510,680 | | | | 272 | |
Live Cattle Futures | | | 10 | | |
| February
2018 |
| | | USD | | | | 400 | | | | 500,300 | | | | 499,900 | | | | 400 | |
LME Lead Futures | | | 16 | | |
| December
2017 |
| | | USD | | | | – 0 | –** | | | 997,510 | | | | 989,400 | | | | 8,110 | |
LME Nickel Futures | | | 15 | | |
| December
2017 |
| | | USD | | | | – 0 | –** | | | 995,558 | | | | 995,130 | | | | 428 | |
LME Nickel Futures | | | 10 | | |
| January
2018 |
| | | USD | | | | – 0 | –** | | | 699,694 | | | | 664,740 | | | | 34,954 | |
LME Primary Aluminum Futures | | | 119 | | |
| December
2017 |
| | | USD | | | | 3 | | | | 6,273,942 | | | | 6,048,175 | | | | 225,767 | |
LME Primary Aluminum Futures | | | 4 | | |
| January
2018 |
| | | USD | | | | – 0 | –** | | | 210,914 | | | | 203,950 | | | | 6,964 | |
LME Zinc Futures | | | 3 | | |
| January
2018 |
| | | USD | | | | – 0 | –** | | | 236,636 | | | | 236,794 | | | | (158 | ) |
| | |
| 62 | AB GLOBAL RISK ALLOCATION FUND | | abfunds.com |
CONSOLIDATED PORTFOLIO OF INVESTMENTS (continued)
| | | | | | | | | | | | | | | | | | | | | | | | | | | | |
| Description | | Number of
Contracts | | | Expiration
Month | | | Notional
(000) | | | Original
Value | | | Value at
November 30,
2017 | | | Unrealized
Appreciation/
(Depreciation) | |
Palladium Futures | | | 4 | | |
| March
2018 |
| | | USD | | | | – 0 | –** | | $ | 395,489 | | | $ | 401,420 | | | $ | (5,931 | ) |
S&P 500 E-Mini Futures | | | 82 | | |
| December
2017 |
| | | USD | | | | 4 | | | | 10,319,913 | | | | 10,856,390 | | | | (536,477 | ) |
WTI Crude Futures | | | 7 | | |
| December
2017 |
| | | USD | | | | 7 | | | | 393,983 | | | | 401,800 | | | | (7,817 | ) |
| | | | | | | | | | | | | | | | | | | | | | | | | | | | |
| | | | | | | | | | | | | | | | | | | | | | | | | | $ | 3,089,655 | |
| | | | | | | | | | | | | | | | | | | | | | | | | | | | |
FORWARD CURRENCY EXCHANGE CONTRACTS (see Note D)
| | | | | | | | | | | | | | | | | | | | |
| Counterparty | | Contracts to Deliver (000) | | | In Exchange
For
(000) | | | Settlement
Date | | | Unrealized
Appreciation/
(Depreciation) | |
Australia and New Zealand Banking Group Ltd. | | CNY | | | 18,555 | | | USD | | | 2,827 | | | | 12/13/17 | | | $ | 19,625 | |
Australia and New Zealand Banking Group Ltd. | | CNY | | | 18,650 | | | USD | | | 2,816 | | | | 12/13/17 | | | | (5,721 | ) |
Australia and New Zealand Banking Group Ltd. | | CNY | | | 69,432 | | | USD | | | 10,564 | | | | 12/18/17 | | | | 63,605 | |
Australia and New Zealand Banking Group Ltd. | | AUD | | | 2,184 | | | JPY | | | 191,117 | | | | 1/16/18 | | | | 51,094 | |
Australia and New Zealand Banking Group Ltd. | | JPY | | | 126,918 | | | GBP | | | 842 | | | | 3/14/18 | | | | 8,593 | |
Bank of America, NA | | BRL | | | 10,678 | | | USD | | | 3,274 | | | | 12/04/17 | | | | 11,852 | |
Bank of America, NA | | BRL | | | 15,019 | | | USD | | | 4,553 | | | | 12/04/17 | | | | (35,485 | ) |
Bank of America, NA | | USD | | | 7,916 | | | BRL | | | 25,697 | | | | 12/04/17 | | | | (65,996 | ) |
Bank of America, NA | | COP | | | 5,225,385 | | | USD | | | 1,718 | | | | 12/07/17 | | | | (13,735 | ) |
Bank of America, NA | | NOK | | | 8,825 | | | USD | | | 1,142 | | | | 12/18/17 | | | | 80,701 | |
Bank of America, NA | | USD | | | 2,394 | | | PLN | | | 8,524 | | | | 12/18/17 | | | | 21,263 | |
Bank of America, NA | | JPY | | | 2,310,175 | | | USD | | | 21,465 | | | | 12/22/17 | | | | 917,706 | |
Bank of America, NA | | AUD | | | 3,557 | | | USD | | | 2,819 | | | | 1/16/18 | | | | 129,372 | |
Bank of America, NA | | USD | | | 2,158 | | | JPY | | | 242,295 | | | | 1/16/18 | | | | 772 | |
Bank of America, NA | | USD | | | 2,774 | | | MXN | | | 50,532 | | | | 1/16/18 | | | | (83,214 | ) |
Bank of America, NA | | USD | | | 1,714 | | | SEK | | | 13,853 | | | | 1/16/18 | | | | (53,515 | ) |
Bank of America, NA | | RUB | | | 66,853 | | | USD | | | 1,135 | | | | 1/25/18 | | | | (291 | ) |
Bank of America, NA | | USD | | | 1,131 | | | RUB | | | 67,081 | | | | 1/25/18 | | | | 8,360 | |
Barclays Bank PLC | | USD | | | 673 | | | ZAR | | | 9,538 | | | | 12/07/17 | | | | 21,885 | |
Barclays Bank PLC | | CNY | | | 37,320 | | | USD | | | 5,672 | | | | 12/13/17 | | | | 25,336 | |
Barclays Bank PLC | | USD | | | 1,138 | | | CNY | | | 7,520 | | | | 12/13/17 | | | | (604 | ) |
Barclays Bank PLC | | INR | | | 182,401 | | | USD | | | 2,776 | | | | 12/14/17 | | | | (44,524 | ) |
Barclays Bank PLC | | USD | | | 2,826 | | | INR | | | 182,401 | | | | 12/14/17 | | | | (6,227 | ) |
Barclays Bank PLC | | CNY | | | 18,652 | | | USD | | | 2,834 | | | | 12/15/17 | | | | 12,321 | |
Barclays Bank PLC | | CAD | | | 11,884 | | | USD | | | 9,593 | | | | 12/18/17 | | | | 379,592 | |
Barclays Bank PLC | | JPY | | | 3,832,399 | | | USD | | | 35,366 | | | | 12/18/17 | | | | 1,288,907 | |
Barclays Bank PLC | | SEK | | | 14,223 | | | EUR | | | 1,462 | | | | 12/18/17 | | | | 41,179 | |
Barclays Bank PLC | | TWD | | | 85,689 | | | USD | | | 2,832 | | | | 12/20/17 | | | | (25,780 | ) |
Barclays Bank PLC | | USD | | | 2,854 | | | TWD | | | 85,689 | | | | 12/20/17 | | | | 3,141 | |
| | |
| abfunds.com | | AB GLOBAL RISK ALLOCATION FUND | 63 |
CONSOLIDATED PORTFOLIO OF INVESTMENTS (continued)
| | | | | | | | | | | | | | | | | | | | |
| Counterparty | | Contracts to Deliver (000) | | | In Exchange
For
(000) | | | Settlement
Date | | | Unrealized
Appreciation/
(Depreciation) | |
Barclays Bank PLC | | AUD | | | 4,405 | | | USD | | | 3,396 | | | | 1/16/18 | | | $ | 65,021 | |
Barclays Bank PLC | | CAD | | | 2,893 | | | USD | | | 2,284 | | | | 1/16/18 | | | | 40,488 | |
Barclays Bank PLC | | CHF | | | 2,234 | | | USD | | | 2,288 | | | | 1/16/18 | | | | 8,584 | |
Barclays Bank PLC | | CHF | | | 1,146 | | | USD | | | 1,151 | | | | 1/16/18 | | | | (17,888 | ) |
Barclays Bank PLC | | EUR | | | 1,448 | | | USD | | | 1,685 | | | | 1/16/18 | | | | (44,020 | ) |
Barclays Bank PLC | | GBP | | | 1,893 | | | EUR | | | 2,108 | | | | 1/16/18 | | | | (47,938 | ) |
Barclays Bank PLC | | GBP | | | 1,287 | | | PLN | | | 6,198 | | | | 1/16/18 | | | | 13,917 | |
Barclays Bank PLC | | GBP | | | 1,926 | | | USD | | | 2,565 | | | | 1/16/18 | | | | (44,089 | ) |
Barclays Bank PLC | | HUF | | | 446,219 | | | USD | | | 1,666 | | | | 1/16/18 | | | | (36,111 | ) |
Barclays Bank PLC | | JPY | | | 319,062 | | | USD | | | 2,854 | | | | 1/16/18 | | | | 12,193 | |
Barclays Bank PLC | | MXN | | | 32,980 | | | USD | | | 1,704 | | | | 1/16/18 | | | | (52,109 | ) |
Barclays Bank PLC | | NOK | | | 11,494 | | | EUR | | | 1,179 | | | | 1/16/18 | | | | 23,399 | |
Barclays Bank PLC | | SEK | | | 19,003 | | | USD | | | 2,281 | | | | 1/16/18 | | | | 2,603 | |
Barclays Bank PLC | | TRY | | | 6,728 | | | EUR | | | 1,436 | | | | 1/16/18 | | | | 20,605 | |
Barclays Bank PLC | | TRY | | | 8,646 | | | USD | | | 2,267 | | | | 1/16/18 | | | | 90,546 | |
Barclays Bank PLC | | USD | | | 2,779 | | | AUD | | | 3,547 | | | | 1/16/18 | | | | (96,699 | ) |
Barclays Bank PLC | | USD | | | 2,666 | | | CAD | | | 3,339 | | | | 1/16/18 | | | | (75,681 | ) |
Barclays Bank PLC | | USD | | | 5,139 | | | CHF | | | 5,104 | | | | 1/16/18 | | | | 69,258 | |
Barclays Bank PLC | | USD | | | 1,727 | | | JPY | | | 195,053 | | | | 1/16/18 | | | | 10,860 | |
Barclays Bank PLC | | USD | | | 1,697 | | | SEK | | | 13,682 | | | | 1/16/18 | | | | (56,877 | ) |
Barclays Bank PLC | | KRW | | | 753,627 | | | USD | | | 672 | | | | 1/18/18 | | | | (20,657 | ) |
Barclays Bank PLC | | USD | | | 2,968 | | | KRW | | | 3,250,169 | | | | 1/18/18 | | | | 20,394 | |
Barclays Bank PLC | | USD | | | 1,884 | | | ZAR | | | 27,068 | | | | 1/25/18 | | | | 72,879 | |
Barclays Bank PLC | | CNY | | | 15,085 | | | USD | | | 2,273 | | | | 2/07/18 | | | | 2,969 | |
Barclays Bank PLC | | CNY | | | 15,047 | | | USD | | | 2,264 | | | | 2/07/18 | | | | (621 | ) |
Barclays Bank PLC | | TWD | | | 170,525 | | | USD | | | 5,739 | | | | 2/07/18 | | | | 35,786 | |
Barclays Bank PLC | | USD | | | 5,661 | | | CNY | | | 37,643 | | | | 2/07/18 | | | | 3,256 | |
Barclays Bank PLC | | JPY | | | 127,022 | | | USD | | | 1,136 | | | | 3/14/18 | | | | 1,023 | |
Barclays Bank PLC | | USD | | | 1,147 | | | HUF | | | 297,086 | | | | 3/14/18 | | | | (10,421 | ) |
BNP Paribas SA | | COP | | | 6,713,646 | | | USD | | | 2,236 | | | | 12/07/17 | | | | 10,642 | |
BNP Paribas SA | | HKD | | | 7,454 | | | USD | | | 955 | | | | 12/18/17 | | | | 499 | |
BNP Paribas SA | | USD | | | 2,974 | | | CZK | | | 64,510 | | | | 12/18/17 | | | | 38,359 | |
BNP Paribas SA | | CAD | | | 4,046 | | | USD | | | 3,247 | | | | 1/16/18 | | | | 108,315 | |
BNP Paribas SA | | MXN | | | 83,765 | | | USD | | | 4,505 | | | | 1/16/18 | | | | 43,321 | |
BNP Paribas SA | | NZD | | | 2,320 | | | USD | | | 1,682 | | | | 1/16/18 | | | | 97,107 | |
BNP Paribas SA | | USD | | | 570 | | | CZK | | | 12,445 | | | | 1/16/18 | | | | 12,984 | |
BNP Paribas SA | | USD | | | 1,135 | | | GBP | | | 835 | | | | 1/16/18 | | | | (4,192 | ) |
BNP Paribas SA | | USD | | | 2,225 | | | COP | | | 6,713,646 | | | | 2/07/18 | | | | (11,119 | ) |
Brown Brothers Harriman & Co. | | GBP | | | 515 | | | USD | | | 674 | | | | 12/18/17 | | | | (22,730 | ) |
Citibank, NA | | COP | | | 5,207,925 | | | USD | | | 1,707 | | | | 12/07/17 | | | | (19,159 | ) |
Citibank, NA | | USD | | | 2,849 | | | COP | | | 8,616,030 | | | | 12/07/17 | | | | 6,884 | |
Citibank, NA | | USD | | | 2,849 | | | COP | | | 8,549,997 | | | | 12/07/17 | | | | (15,309 | ) |
Citibank, NA | | USD | | | 9,991 | | | CNY | | | 66,500 | | | | 12/13/17 | | | | 71,653 | |
Citibank, NA | | USD | | | 2,838 | | | CNY | | | 18,716 | | | | 12/15/17 | | | | (6,887 | ) |
Citibank, NA | | EUR | | | 2,386 | | | USD | | | 2,813 | | | | 12/18/17 | | | | (29,466 | ) |
Citibank, NA | | PLN | | | 4,156 | | | USD | | | 1,139 | | | | 12/18/17 | | | | (38,640 | ) |
Citibank, NA | | SEK | | | 13,851 | | | USD | | | 1,712 | | | | 12/18/17 | | | | 55,113 | |
Citibank, NA | | USD | | | 6,165 | | | NOK | | | 47,874 | | | | 12/18/17 | | | | (407,556 | ) |
Citibank, NA | | TRY | | | 4,353 | | | EUR | | | 960 | | | | 1/03/18 | | | | 44,101 | |
Citibank, NA | | TRY | | | 9,825 | | | USD | | | 2,574 | | | | 1/10/18 | | | | 95,653 | |
Citibank, NA | | CNY | | | 37,731 | | | USD | | | 5,632 | | | | 1/16/18 | | | | (57,600 | ) |
| | |
| 64 | AB GLOBAL RISK ALLOCATION FUND | | abfunds.com |
CONSOLIDATED PORTFOLIO OF INVESTMENTS (continued)
| | | | | | | | | | | | | | | | | | | | |
| Counterparty | | Contracts to Deliver (000) | | | In Exchange
For
(000) | | | Settlement
Date | | | Unrealized
Appreciation/
(Depreciation) | |
Citibank, NA | | EUR | | | 957 | | | TRY | | | 4,446 | | | | 1/16/18 | | | $ | (23,510 | ) |
Citibank, NA | | EUR | | | 2,410 | | | USD | | | 2,828 | | | | 1/16/18 | | | | (49,264 | ) |
Citibank, NA | | SEK | | | 9,508 | | | CHF | | | 1,113 | | | | 1/16/18 | | | | (4,226 | ) |
Citibank, NA | | SEK | | | 15,920 | | | USD | | | 1,911 | | | | 1/16/18 | | | | 2,713 | |
Citibank, NA | | TRY | | | 8,747 | | | USD | | | 2,248 | | | | 1/16/18 | | | | 46,016 | |
Citibank, NA | | USD | | | 1,701 | | | AUD | | | 2,172 | | | | 1/16/18 | | | | (58,953 | ) |
Citibank, NA | | USD | | | 2,260 | | | CAD | | | 2,840 | | | | 1/16/18 | | | | (57,556 | ) |
Citibank, NA | | USD | | | 1,148 | | | CHF | | | 1,137 | | | | 1/16/18 | | | | 11,987 | |
Citibank, NA | | USD | | | 1,721 | | | CZK | | | 37,737 | | | | 1/16/18 | | | | 47,650 | |
Citibank, NA | | USD | | | 2,855 | | | GBP | | | 2,171 | | | | 1/16/18 | | | | 85,817 | |
Citibank, NA | | USD | | | 1,704 | | | MXN | | | 32,920 | | | | 1/16/18 | | | | 48,770 | |
Citibank, NA | | USD | | | 2,254 | | | NZD | | | 3,165 | | | | 1/16/18 | | | | (91,740 | ) |
Citibank, NA | | USD | | | 6,312 | | | TRY | | | 24,470 | | | | 1/16/18 | | | | (151,660 | ) |
Citibank, NA | | USD | | | 1,685 | | | ZAR | | | 23,424 | | | | 1/16/18 | | | | 10,942 | |
Citibank, NA | | ZAR | | | 24,293 | | | USD | | | 1,692 | | | | 1/16/18 | | | | (67,048 | ) |
Citibank, NA | | USD | | | 2,277 | | | RUB | | | 138,392 | | | | 1/25/18 | | | | 73,690 | |
Citibank, NA | | USD | | | 1,152 | | | ZAR | | | 16,255 | | | | 1/25/18 | | | | 23,664 | |
Citibank, NA | | ZAR | | | 24,533 | | | USD | | | 1,704 | | | | 1/25/18 | | | | (70,106 | ) |
Citibank, NA | | COP | | | 3,406,740 | | | USD | | | 1,128 | | | | 2/07/18 | | | | 4,521 | |
Citibank, NA | | CHF | | | 1,966 | | | USD | | | 2,016 | | | | 3/14/18 | | | | 2,143 | |
Citibank, NA | | NOK | | | 9,233 | | | EUR | | | 947 | | | | 3/14/18 | | | | 20,989 | |
Citibank, NA | | SEK | | | 9,233 | | | EUR | | | 934 | | | | 3/14/18 | | | | 8,429 | |
Citibank, NA | | TRY | | | 9,010 | | | USD | | | 2,196 | | | | 3/14/18 | | | | (29,958 | ) |
Citibank, NA | | USD | | | 1,118 | | | MXN | | | 21,347 | | | | 3/14/18 | | | | 7,615 | |
Citibank, NA | | USD | | | 1,140 | | | NOK | | | 9,239 | | | | 3/14/18 | | | | (26,473 | ) |
Citibank, NA | | USD | | | 556 | | | TRY | | | 2,279 | | | | 3/14/18 | | | | 6,636 | |
Citibank, NA | | ZAR | | | 7,911 | | | USD | | | 557 | | | | 3/14/18 | | | | (10,125 | ) |
Credit Suisse International | | BRL | | | 1,304 | | | USD | | | 407 | | | | 12/04/17 | | | | 8,914 | |
Credit Suisse International | | USD | | | 400 | | | BRL | | | 1,304 | | | | 12/04/17 | | | | (1,447 | ) |
Credit Suisse International | | USD | | | 1,156 | | | COP | | | 3,491,979 | | | | 12/07/17 | | | | 1,489 | |
Credit Suisse International | | EUR | | | 7,330 | | | USD | | | 8,512 | | | | 12/15/17 | | | | (218,588 | ) |
Credit Suisse International | | NOK | | | 4,677 | | | USD | | | 568 | | | | 12/18/17 | | | | 5,791 | |
Credit Suisse International | | CAD | | | 3,628 | | | MXN | | | 54,982 | | | | 1/16/18 | | | | 113,944 | |
Credit Suisse International | | CHF | | | 2,836 | | | USD | | | 2,865 | | | | 1/16/18 | | | | (28,968 | ) |
Credit Suisse International | | ILS | | | 13,928 | | | USD | | | 3,959 | | | | 1/16/18 | | | | (31,938 | ) |
Credit Suisse International | | JPY | | | 126,611 | | | NZD | | | 1,641 | | | | 1/16/18 | | | | (6,880 | ) |
Credit Suisse International | | JPY | | | 196,355 | | | USD | | | 1,728 | | | | 1/16/18 | | | | (21,086 | ) |
Credit Suisse International | | USD | | | 1,717 | | | HUF | | | 446,219 | | | | 1/16/18 | | | | (15,311 | ) |
Credit Suisse International | | USD | | | 1,556 | | | MYR | | | 6,573 | | | | 1/26/18 | | | | 51,547 | |
| | |
| abfunds.com | | AB GLOBAL RISK ALLOCATION FUND | 65 |
CONSOLIDATED PORTFOLIO OF INVESTMENTS (continued)
| | | | | | | | | | | | | | | | | | | | |
| Counterparty | | Contracts to Deliver (000) | | | In Exchange
For
(000) | | | Settlement
Date | | | Unrealized
Appreciation/
(Depreciation) | |
Credit Suisse International | | CHF | | | 1,393 | | | GBP | | | 1,066 | | | | 3/14/18 | | | $ | 19,437 | |
Deutsche Bank AG | | BRL | | | 24,367 | | | USD | | | 7,510 | | | | 12/04/17 | | | | 65,931 | |
Deutsche Bank AG | | USD | | | 4,137 | | | BRL | | | 13,702 | | | | 12/04/17 | | | | 48,658 | |
Deutsche Bank AG | | USD | | | 3,275 | | | BRL | | | 10,665 | | | | 12/04/17 | | | | (17,254 | ) |
Deutsche Bank AG | | COP | | | 3,511,050 | | | USD | | | 1,161 | | | | 12/07/17 | | | | (2,937 | ) |
Deutsche Bank AG | | USD | | | 5,705 | | | CNY | | | 37,604 | | | | 12/18/17 | | | | (17,645 | ) |
Deutsche Bank AG | | USD | | | 571 | | | HUF | | | 146,000 | | | | 12/18/17 | | | | (15,339 | ) |
Deutsche Bank AG | | BRL | | | 1,304 | | | USD | | | 404 | | | | 1/03/18 | | | | 6,782 | |
Deutsche Bank AG | | USD | | | 2,899 | | | BRL | | | 9,361 | | | | 1/03/18 | | | | (48,690 | ) |
Deutsche Bank AG | | ILS | | | 6,042 | | | EUR | | | 1,459 | | | | 1/16/18 | | | | 10,659 | |
Deutsche Bank AG | | USD | | | 3,987 | | | CHF | | | 3,934 | | | | 1/16/18 | | | | 26,596 | |
Deutsche Bank AG | | GBP | | | 1,071 | | | USD | | | 1,427 | | | | 3/14/18 | | | | (26,094 | ) |
Goldman Sachs Bank USA | | NZD | | | 8,939 | | | USD | | | 6,432 | | | | 12/18/17 | | | | 323,433 | |
Goldman Sachs Bank USA | | TRY | | | 11,099 | | | EUR | | | 2,552 | | | | 1/04/18 | | | | 239,167 | |
Goldman Sachs Bank USA | | EUR | | | 2,417 | | | AUD | | | 3,647 | | | | 1/16/18 | | | | (127,282 | ) |
Goldman Sachs Bank USA | | MXN | | | 31,542 | | | EUR | | | 1,402 | | | | 1/16/18 | | | | (6,679 | ) |
Goldman Sachs Bank USA | | MXN | | | 15,897 | | | USD | | | 860 | | | | 1/16/18 | | | | 13,647 | |
Goldman Sachs Bank USA | | MXN | | | 33,151 | | | USD | | | 1,757 | | | | 1/16/18 | | | | (8,650 | ) |
Goldman Sachs Bank USA | | NOK | | | 4,353 | | | USD | | | 537 | | | | 1/16/18 | | | | 13,037 | |
Goldman Sachs Bank USA | | SEK | | | 9,297 | | | EUR | | | 963 | | | | 1/16/18 | | | | 35,071 | |
Goldman Sachs Bank USA | | USD | | | 1,713 | | | TRY | | | 6,399 | | | | 1/16/18 | | | | (102,011 | ) |
Goldman Sachs Bank USA | | USD | | | 1,136 | | | ZAR | | | 15,338 | | | | 1/16/18 | | | | (25,069 | ) |
Goldman Sachs Bank USA | | ZAR | | | 44,819 | | | USD | | | 3,220 | | | | 1/25/18 | | | | (20,707 | ) |
JPMorgan Chase Bank, NA | | ZAR | | | 9,537 | | | USD | | | 675 | | | | 12/07/17 | | | | (20,025 | ) |
JPMorgan Chase Bank, NA | | USD | | | 77 | | | CNY | | | 505 | | | | 12/13/17 | | | | (216 | ) |
JPMorgan Chase Bank, NA | | USD | | | 3,906 | | | CNY | | | 25,749 | | | | 12/18/17 | | | | (11,976 | ) |
JPMorgan Chase Bank, NA | | JPY | | | 254,687 | | | USD | | | 2,260 | | | | 1/16/18 | | | | (8,407 | ) |
JPMorgan Chase Bank, NA | | MXN | | | 22,249 | | | USD | | | 1,148 | | | | 1/16/18 | | | | (36,626 | ) |
JPMorgan Chase Bank, NA | | USD | | | 2,282 | | | JPY | | | 257,845 | | | | 1/16/18 | | | | 15,036 | |
JPMorgan Chase Bank, NA | | USD | | | 4,439 | | | MXN | | | 82,281 | | | | 1/16/18 | | | | (57,318 | ) |
JPMorgan Chase Bank, NA | | ZAR | | | 14,395 | | | USD | | | 1,009 | | | | 1/16/18 | | | | (33,510 | ) |
| | |
| 66 | AB GLOBAL RISK ALLOCATION FUND | | abfunds.com |
CONSOLIDATED PORTFOLIO OF INVESTMENTS (continued)
| | | | | | | | | | | | | | | | | | | | |
| Counterparty | | Contracts to Deliver (000) | | | In Exchange
For
(000) | | | Settlement
Date | | | Unrealized
Appreciation/
(Depreciation) | |
Morgan Stanley Capital Services, Inc. | | USD | | | 1,704 | | | EUR | | | 1,427 | | | | 12/15/17 | | | $ | (3,982 | ) |
Morgan Stanley Capital Services, Inc. | | CNY | | | 18,689 | | | USD | | | 2,827 | | | | 12/27/17 | | | | 3,581 | |
Morgan Stanley Capital Services, Inc. | | AUD | | | 2,978 | | | USD | | | 2,283 | | | | 1/16/18 | | | | 31,050 | |
Morgan Stanley Capital Services, Inc. | | EUR | | | 998 | | | SEK | | | 9,700 | | | | 1/16/18 | | | | (28,206 | ) |
Morgan Stanley Capital Services, Inc. | | NZD | | | 1,655 | | | AUD | | | 1,494 | | | | 1/16/18 | | | | (931 | ) |
Royal Bank of Scotland PLC | | CHF | | | 1,426 | | | USD | | | 1,501 | | | | 12/18/17 | | | | 49,488 | |
Royal Bank of Scotland PLC | | CZK | | | 24,546 | | | USD | | | 1,128 | | | | 12/18/17 | | | | (18,201 | ) |
Royal Bank of Scotland PLC | | SEK | | | 13,816 | | | USD | | | 1,706 | | | | 12/18/17 | | | | 54,044 | |
Royal Bank of Scotland PLC | | CAD | | | 1,471 | | | USD | | | 1,141 | | | | 1/16/18 | | | | (423 | ) |
Royal Bank of Scotland PLC | | NZD | | | 3,165 | | | USD | | | 2,277 | | | | 1/16/18 | | | | 114,569 | |
Royal Bank of Scotland PLC | | USD | | | 1,696 | | | NZD | | | 2,320 | | | | 1/16/18 | | | | (111,548 | ) |
Royal Bank of Scotland PLC | | EUR | | | 1,436 | | | ILS | | | 5,947 | | | | 3/14/18 | | | | (11,344 | ) |
Royal Bank of Scotland PLC | | GBP | | | 852 | | | EUR | | | 950 | | | | 3/14/18 | | | | (17,968 | ) |
Standard Chartered Bank | | CNY | | | 64 | | | USD | | | 10 | | | | 12/15/17 | | | | (60 | ) |
Standard Chartered Bank | | HUF | | | 146,000 | | | USD | | | 547 | | | | 12/18/17 | | | | (8,956 | ) |
Standard Chartered Bank | | USD | | | 914 | | | CNY | | | 6,079 | | | | 12/18/17 | | | | 5,534 | |
Standard Chartered Bank | | USD | | | 2,803 | | | CNY | | | 18,689 | | | | 12/27/17 | | | | 20,447 | |
Standard Chartered Bank | | TRY | | | 4,453 | | | EUR | | | 950 | | | | 1/04/18 | | | | 7,503 | |
Standard Chartered Bank | | USD | | | 4,506 | | | CNY | | | 30,069 | | | | 1/10/18 | | | | 30,893 | |
Standard Chartered Bank | | CHF | | | 2,773 | | | USD | | | 2,840 | | | | 1/16/18 | | | | 10,289 | |
Standard Chartered Bank | | GBP | | | 878 | | | USD | | | 1,150 | | | | 1/16/18 | | | | (39,585 | ) |
Standard Chartered Bank | | JPY | | | 318,658 | | | USD | | | 2,842 | | | | 1/16/18 | | | | 3,950 | |
Standard Chartered Bank | | JPY | | | 65,270 | | | USD | | | 573 | | | | 1/16/18 | | | | (8,006 | ) |
| | |
| abfunds.com | | AB GLOBAL RISK ALLOCATION FUND | 67 |
CONSOLIDATED PORTFOLIO OF INVESTMENTS (continued)
| | | | | | | | | | | | | | | | | | | | |
| Counterparty | | Contracts to Deliver (000) | | | In Exchange
For
(000) | | | Settlement
Date | | | Unrealized
Appreciation/
(Depreciation) | |
Standard Chartered Bank | | MXN | | | 10,906 | | | USD | | | 569 | | | | 1/16/18 | | | $ | (12,248 | ) |
Standard Chartered Bank | | NOK | | | 9,285 | | | EUR | | | 951 | | | | 1/16/18 | | | | 17,801 | |
Standard Chartered Bank | | TRY | | | 4,211 | | | EUR | | | 937 | | | | 1/16/18 | | | | 58,692 | |
Standard Chartered Bank | | USD | | | 5,661 | | | CNY | | | 37,731 | | | | 1/16/18 | | | | 29,107 | |
Standard Chartered Bank | | USD | | | 1,716 | | | JPY | | | 194,221 | | | | 1/16/18 | | | | 13,898 | |
Standard Chartered Bank | | USD | | | 3,406 | | | JPY | | | 381,298 | | | | 1/16/18 | | | | (9,014 | ) |
Standard Chartered Bank | | USD | | | 842 | | | MXN | | | 16,348 | | | | 1/16/18 | | | | 29,166 | |
Standard Chartered Bank | | USD | | | 2,800 | | | INR | | | 182,457 | | | | 3/12/18 | | | | (3,285 | ) |
State Street Bank & Trust Co. | | CAD | | | 492 | | | USD | | | 394 | | | | 12/18/17 | | | | 12,409 | |
State Street Bank & Trust Co. | | CHF | | | 136 | | | USD | | | 143 | | | | 12/18/17 | | | | 4,859 | |
State Street Bank & Trust Co. | | DKK | | | 3,313 | | | USD | | | 535 | | | | 12/18/17 | | | | 4,400 | |
State Street Bank & Trust Co. | | DKK | | | 1,037 | | | USD | | | 166 | | | | 12/18/17 | | | | (229 | ) |
State Street Bank & Trust Co. | | EUR | | | 11,422 | | | USD | | | 13,718 | | | | 12/18/17 | | | | 110,093 | |
State Street Bank & Trust Co. | | EUR | | | 310 | | | USD | | | 364 | | | | 12/18/17 | | | | (5,021 | ) |
State Street Bank & Trust Co. | | HKD | | | 822 | | | USD | | | 105 | | | | 12/18/17 | | | | 214 | |
State Street Bank & Trust Co. | | JPY | | | 101,810 | | | USD | | | 926 | | | | 12/18/17 | | | | 20,740 | |
State Street Bank & Trust Co. | | JPY | | | 29,467 | | | USD | | | 259 | | | | 12/18/17 | | | | (3,134 | ) |
State Street Bank & Trust Co. | | NOK | | | 2,818 | | | USD | | | 363 | | | | 12/18/17 | | | | 24,392 | |
State Street Bank & Trust Co. | | NZD | | | 510 | | | USD | | | 367 | | | | 12/18/17 | | | | 18,648 | |
State Street Bank & Trust Co. | | SEK | | | 11,379 | | | USD | | | 1,428 | | | | 12/18/17 | | | | 66,748 | |
State Street Bank & Trust Co. | | SGD | | | 767 | | | USD | | | 568 | | | | 12/18/17 | | | | (1,019 | ) |
State Street Bank & Trust Co. | | USD | | | 207 | | | EUR | | | 176 | | | | 12/18/17 | | | | 2,956 | |
State Street Bank & Trust Co. | | USD | | | 6,286 | | | EUR | | | 5,234 | | | | 12/18/17 | | | | (50,446 | ) |
State Street Bank & Trust Co. | | USD | | | 91 | | | JPY | | | 9,813 | | | | 12/18/17 | | | | (3,273 | ) |
State Street Bank & Trust Co. | | USD | | | 181 | | | NZD | | | 248 | | | | 12/18/17 | | | | (11,367 | ) |
State Street Bank & Trust Co. | | USD | | | 9,007 | | | SEK | | | 71,323 | | | | 12/18/17 | | | | (477,848 | ) |
| | |
| 68 | AB GLOBAL RISK ALLOCATION FUND | | abfunds.com |
CONSOLIDATED PORTFOLIO OF INVESTMENTS (continued)
| | | | | | | | | | | | | | | | | | | | |
| Counterparty | | Contracts to Deliver (000) | | | In Exchange
For
(000) | | | Settlement
Date | | | Unrealized
Appreciation/
(Depreciation) | |
State Street Bank & Trust Co. | | USD | | | 27 | | | TRY | | | 97 | | | | 12/18/17 | | | $ | (2,745 | ) |
State Street Bank & Trust Co. | | CNY | | | 30,069 | | | USD | | | 4,494 | | | | 1/10/18 | | | | (42,568 | ) |
State Street Bank & Trust Co. | | AUD | | | 718 | | | USD | | | 550 | | | | 1/16/18 | | | | 6,796 | |
State Street Bank & Trust Co. | | CZK | | | 30,681 | | | EUR | | | 1,198 | | | | 1/16/18 | | | | (7,631 | ) |
State Street Bank & Trust Co. | | EUR | | | 2,366 | | | USD | | | 2,769 | | | | 1/16/18 | | | | (55,614 | ) |
State Street Bank & Trust Co. | | JPY | | | 181,186 | | | USD | | | 1,601 | | | | 1/16/18 | | | | (12,700 | ) |
State Street Bank & Trust Co. | | NZD | | | 1,641 | | | EUR | | | 952 | | | | 1/16/18 | | | | 15,223 | |
State Street Bank & Trust Co. | | PLN | | | 5,093 | | | EUR | | | 1,195 | | | | 1/16/18 | | | | (17,441 | ) |
State Street Bank & Trust Co. | | AUD | | | 144 | | | USD | | | 109 | | | | 3/14/18 | | | | 142 | |
State Street Bank & Trust Co. | | EUR | | | 966 | | | GBP | | | 856 | | | | 3/14/18 | | | | 4,298 | |
UBS AG | | AUD | | | 6,967 | | | USD | | | 5,543 | | | | 12/18/17 | | | | 274,248 | |
UBS AG | | GBP | | | 5,751 | | | USD | | | 7,532 | | | | 12/18/17 | | | | (250,230 | ) |
UBS AG | | USD | | | 1,760 | | | GBP | | | 1,339 | | | | 12/18/17 | | | | 51,746 | |
UBS AG | | CHF | | | 1,657 | | | USD | | | 1,711 | | | | 1/16/18 | | | | 20,533 | |
UBS AG | | EUR | | | 3,551 | | | USD | | | 4,179 | | | | 1/16/18 | | | | (59,740 | ) |
UBS AG | | USD | | | 3,995 | | | GBP | | | 2,978 | | | | 1/16/18 | | | | 39,922 | |
| | | | | | | | | | | | | | | | | | | | |
| | | $ | 2,445,920 | |
| | | | | | | | | | | | | | | | | | | | |
PUT OPTIONS WRITTEN (see Note D)
| | | | | | | | | | | | | | | | | | | | | | | | | | | | | | | | | | |
| Description | | Counterparty | | Contracts | | | Exercise
Price | | | Expiration
Month | | | Notional
(000) | | | Premiums
Received | | | U.S. $ Value | |
SPDR S&P 500 ETF Trust | | Morgan
Stanley &
Co.,
Inc. | | | 1,116 | | | | USD | | | | 246.00 | | |
| December
2017 |
| | | USD | | | | 112 | | | $ | 84,768 | | | $ | (16,740 | ) |
| | |
| abfunds.com | | AB GLOBAL RISK ALLOCATION FUND | 69 |
CONSOLIDATED PORTFOLIO OF INVESTMENTS (continued)
CURRENCY OPTIONS WRITTEN (see Note D)
| | | | | | | | | | | | | | | | | | | | | | | | | | | | | | | | |
Description/
Counterparty | | Exercise
Price | | | Expiration
Month | | | Contracts | | | Notional
Amount
(000) | | | Premiums
Received | | | U.S. $ Value | |
Call | | | | | | | | | | | | | | | | | | | | | | | | | | | | | | | | |
USD vs. MXN/Credit Suisse International | | | USD | | | | 22.00 | | | | 08/2018 | | | | 2,800,000 | | | | USD | | | | 2,800 | | | $ | 54,516 | | | $ | (37,016 | ) |
Put | | | | | | | | | | | | | | | | | | | | | | | | | | | | | | | | |
SEK vs. EUR/
UBS AG | | | SEK | | | | 10.100 | | | | 02/2018 | | | | 24,442,000 | | | | SEK | | | | 24,442 | | | | 15,760 | | | | (19,543 | ) |
TRY vs. EUR/
Goldman Sachs Bank USA | | | TRY | | | | 4.550 | | | | 01/2018 | | | | 21,704,000 | | | | TRY | | | | 21,704 | | | | 51,924 | | | | (233,091 | ) |
TRY vs. USD/
Citibank, NA | | | TRY | | | | 4.050 | | | | 01/2018 | | | | 22,883,000 | | | | TRY | | | | 22,883 | | | | 54,530 | | | | (64,050 | ) |
ZAR vs. USD/
Goldman Sachs Bank USA | | | ZAR | | | | 14.800 | | | | 01/2018 | | | | 83,309,000 | | | | ZAR | | | | 83,309 | | | | 91,128 | | | | (52,628 | ) |
| | | | | | | | | | | | | | | | | | | | | | | | | | | | | | | | |
| | | | | | | | | | | | | | | | | | | | | | | | | | $ | 267,858 | | | $ | (406,328 | ) |
| | | | | | | | | | | | | | | | | | | | | | | | | | | | | | | | |
INTEREST RATE SWAPTIONS WRITTEN (see Note D)
| | | | | | | | | | | | | | | | | | | | | | | | | | | | |
| Description | | Index | | | Counter-
Party | | | Strike
Rate | | | Expiration
Date | | | Notional
Amount
(000) | | | Premiums
Received | | | Market
Value | |
Put | | | | | | | | | | | | | | | | | | | | | | | | | | | | |
OTC – 1 Year Interest Rate Swap | | | 3 Month LIBOR | | | | Citibank, NA | | | | 2.56 | % | | | 12/18/17 | | | $ | 42,216 | | | $ | 37,572 | | | $ | (25,878 | ) |
CENTRALLY CLEARED CREDIT DEFAULT SWAPS (see Note D)
| | | | | | | | | | | | | | | | | | | | | | | | | | | | |
| Description | | Fixed
Rate
(Pay)
Receive | | | Payment
Frequency | | | Implied
Credit
Spread at
November 30,
2017 | | | Notional
Amount
(000) | | | Market
Value | | | Upfront
Premiums
Paid
(Received) | | | Unrealized
Appreciation/
(Depreciation) | |
Sale Contracts | |
CDX-NAHY Series 26, 5 Year Index, 6/20/21* | | | 5.00 | % | | | Quarterly | | | | 2.37 | % | | USD | 12,250 | | | $ | 1,118,833 | | | $ | 250,395 | | | $ | 868,438 | |
CDX-NAIG Series 26, 5 Year Index, 6/20/21* | | | 1.00 | | | | Quarterly | | | | 0.35 | | | USD | 18,750 | | | | 454,422 | | | | 144,241 | | | | 310,181 | |
| | | | | | | | | | | | | | | | | | | | | | | | | | | | |
| | | | | | | | | | | | | | | | | | $ | 1,573,255 | | | $ | 394,636 | | | $ | 1,178,619 | |
| | | | | | | | | | | | | | | | | | | | | | | | | | | | |
| | |
| 70 | AB GLOBAL RISK ALLOCATION FUND | | abfunds.com |
CONSOLIDATED PORTFOLIO OF INVESTMENTS (continued)
CENTRALLY CLEARED INTEREST RATE SWAPS (see Note D)
| | | | | | | | | | | | | | | | | | |
| | | | | | | Rate Type | | | | | |
Notional
Amount
(000) | | | Termination
Date | | | Payments
made
by the Fund | | Payments
received
by the Fund | | Payment
Frequency
Paid/Received | | Unrealized
Appreciation/
(Depreciation) | |
AUD | | | 15,000 | | | | 7/09/25 | | | 6 Month BBSW | | 3.168% | | Semi-Annual/
Semi-Annual | | $ | 530,981 | |
AUD | | | 4,740 | | | | 2/23/27 | | | 6 Month BBSW | | 3.040% | | Semi-Annual/
Semi-Annual | | | 118,000 | |
NZD | | | 20,260 | | | | 2/24/27 | | | 3 Month BKBM | | 3.508% | | Quarterly/
Semi-Annual | | | 673,648 | |
AUD | | | 9,490 | | | | 2/27/27 | | | 6 Month BBSW | | 2.975% | | Semi-Annual/
Semi-Annual | | | 193,953 | |
NZD | | | 10,120 | | | | 2/28/27 | | | 3 Month BKBM | | 3.445% | | Quarterly/
Semi-Annual | | | 298,573 | |
| | | | | | | | | | | | | | | | | | |
| | | | | | | | | | | | | | | | $ | 1,815,155 | |
| | | | | | | | | | | | | | | | | | |
CREDIT DEFAULT SWAPS (see Note D)
| | | | | | | | | | | | | | | | | | | | | | | | | | | | |
Swap
Counterparty &
Referenced
Obligation | | Fixed
Rate
(Pay)
Receive | | | Payment
Frequency | | | Implied
Credit
Spread at
November 30,
2017 | | | Notional
Amount
(000) | | | Market
Value | | | Upfront
Premiums
Paid
(Received) | | | Unrealized
Appreciation/
(Depreciation) | |
Buy Contracts | | | | | | | | | | | | | | | | | | | | | | | | | | | | |
Goldman Sachs International iTraxx Australia Series 24, 5 Year Index, 12/20/20* | | | (1.00 | )% | | | Quarterly | | | | 0.28 | % | | USD | 1,110 | | | $ | (26,203 | ) | | $ | 7,405 | | | $ | (33,608 | ) |
Goldman Sachs International iTraxx Australia Series 24, 5 Year Index, 12/20/20* | | | (1.00 | ) | | | Quarterly | | | | 0.28 | | | USD | 1,490 | | | | (35,173 | ) | | | 9,943 | | | | (45,116 | ) |
Sale Contracts | | | | | | | | | | | | | | | | | | | | | | | | | | | | |
Deutsche Bank AG iTraxx Australia Series 24, 5 Year Index, 12/20/20* | | | 1.00 | | | | Quarterly | | | | 0.28 | | | USD | 2,600 | | | | 61,375 | | | | (19,020 | ) | | | 80,395 | |
| | | | | | | | | | | | | | | | | | | | | | | | | | | | |
| | | | | | | | | | | | | | | | | | $ | (1 | ) | | $ | (1,672 | ) | | $ | 1,671 | |
| | | | | | | | | | | | | | | | | | | | | | | | | | | | |
| | |
| abfunds.com | | AB GLOBAL RISK ALLOCATION FUND | 71 |
CONSOLIDATED PORTFOLIO OF INVESTMENTS (continued)
| ** | Notional amount less than 500. |
| (a) | Position, or a portion thereof, has been segregated to collateralize OTC derivatives outstanding. |
| (b) | Security is exempt from registration under Rule 144A of the Securities Act of 1933. These securities are considered restricted, but liquid and may be resold in transactions exempt from registration, normally to qualified institutional buyers. At November 30, 2017, the aggregate market value of these securities amounted to $586,283 or 0.2% of net assets. |
| (c) | Non-income producing security. |
| (d) | Represents entire or partial securities out on loan. See Note E for securities lending information. |
| (e) | Floating Rate Security. Stated interest/floor rate was in effect at November 30, 2017. |
| (f) | To obtain a copy of the fund’s shareholder report, please go to the Securities and Exchange Commission’s website at www.sec.gov. Additionally, shareholder reports for AB funds can be obtained by calling AB at (800) 227-4618. |
| (g) | Security in which significant unobservable inputs (Level 3) were used in determining fair value. |
| (h) | Affiliated investments. |
| (i) | The rate shown represents the 7-day yield as of period end. |
Currency Abbreviations:
AUD – Australian Dollar
BRL – Brazilian Real
CAD – Canadian Dollar
CHF – Swiss Franc
CNY – Chinese Yuan Renminbi
COP – Colombian Peso
CZK – Czech Koruna
DKK – Danish Krone
EUR – Euro
GBP – Great British Pound
HKD – Hong Kong Dollar
HUF – Hungarian Forint
ILS – Israeli Shekel
INR – Indian Rupee
JPY – Japanese Yen
KRW – South Korean Won
MXN – Mexican Peso
MYR – Malaysian Ringgit
NOK – Norwegian Krone
NZD – New Zealand Dollar
PLN – Polish Zloty
RUB – Russian Ruble
SEK – Swedish Krona
SGD – Singapore Dollar
TRY – Turkish Lira
TWD – New Taiwan Dollar
USD – United States Dollar
ZAR – South African Rand
Glossary:
ADR – American Depositary Receipt
BBSW – Bank Bill Swap Reference Rate (Australia)
BKBM – Bank Bill Benchmark (New Zealand)
CBT – Chicago Board of Trade
CDX-NAHY – North American High Yield Credit Default Swap Index
CDX-NAIG – North American Investment Grade Credit Default Swap Index
CME – Chicago Mercantile Exchange
CPI – Consumer Price Index
| | |
| 72 | AB GLOBAL RISK ALLOCATION FUND | | abfunds.com |
CONSOLIDATED PORTFOLIO OF INVESTMENTS (continued)
ETF – Exchange Traded Fund
FTSE – Financial Times Stock Exchange
GDR – Global Depositary Receipt
IRS – Interest Rate Swaption
KC HRW – Kansas City Hard Red Winter
LIBOR – London Interbank Offered Rates
LME – London Metal Exchange
MSCI – Morgan Stanley Capital International
OSE – Osaka Securities Exchange
RBOB – Reformulated Gasoline Blend-Stock for Oxygen Blending (Unleaded Gas)
REG – Registered Shares
REIT – Real Estate Investment Trust
RSP – Risparmio (Convertible Savings Shares)
SPDR – Standard & Poor’s Depository Receipt
SPI – Share Price Index
TIPS – Treasury Inflation Protected Security
TOPIX – Tokyo Price Index
TSX – Toronto Stock Exchange
ULSD – Ultra-Low Sulfur Diesel
WTI – West Texas Intermediate
See notes to financial statements.
| | |
| abfunds.com | | AB GLOBAL RISK ALLOCATION FUND | 73 |
CONSOLIDATED STATEMENT OF ASSETS & LIABILITIES
November 30, 2017
| | | | |
| Assets | | | | |
Investments in securities, at value | | | | |
Unaffiliated issuers (cost $252,982,951) | | $ | 263,604,994 | (a) |
Affiliated issuers (cost $8,705,671—including investment of cash collateral for securities loaned of $1,332,435) | | | 8,705,671 | |
Cash | | | 45,515 | |
Cash collateral due from broker | | | 7,546,264 | |
Foreign currencies, at value (cost $4,100,705) | | | 3,196,078 | |
Unrealized appreciation on forward currency exchange contracts | | | 6,722,816 | |
Unaffiliated interest and dividends receivable | | | 362,465 | |
Unrealized appreciation on credit default swaps | | | 80,395 | |
Receivable from third party regulatory settlement | | | 43,921 | |
Receivable for capital stock sold | | | 28,162 | |
Upfront premiums paid on credit default swaps | | | 17,348 | |
Affiliated dividends receivable | | | 4,546 | |
| | | | |
Total assets | | | 290,358,175 | |
| | | | |
| Liabilities | | | | |
Options written, at value (premiums received $352,626) | | | 423,068 | |
Swaptions written, at value (premiums received $37,572) | | | 25,878 | |
Unrealized depreciation on forward currency exchange contracts | | | 4,276,896 | |
Payable for collateral received on securities loaned | | | 1,306,312 | |
Payable for variation margin on futures | | | 750,083 | |
Cash collateral due to broker | | | 520,000 | |
Payable for capital stock redeemed | | | 263,118 | |
Payable for variation margin on exchange traded swaps | | | 136,688 | |
Advisory fee payable | | | 129,482 | |
Unrealized depreciation on credit default swaps | | | 78,724 | |
Distribution fee payable | | | 64,254 | |
Transfer Agent fee payable | | | 38,565 | |
Collateral due to Securities Lending Agent | | | 26,123 | |
Upfront premiums received on credit default swaps | | | 19,020 | |
Administrative fee payable | | | 16,060 | |
Directors’ fees payable | | | 76 | |
Accrued expenses | | | 476,766 | |
| | | | |
Total liabilities | | | 8,551,113 | |
| | | | |
Net Assets | | $ | 281,807,062 | |
| | | | |
| Composition of Net Assets | | | | |
Capital stock, at par | | $ | 169,042 | |
Additional paid-in capital | | | 273,140,068 | |
Distributions in excess of net investment income | | | (2,925,727 | ) |
Accumulated net realized loss on investment and foreign currency transactions | | | (6,955,452 | ) |
Net unrealized appreciation on investments and foreign currency denominated assets and liabilities | | | 18,379,131 | |
| | | | |
| | $ | 281,807,062 | |
| | | | |
See notes to consolidated financial statements.
| | |
| 74 | AB GLOBAL RISK ALLOCATION FUND | | abfunds.com |
CONSOLIDATED STATEMENT OF ASSETS & LIABILITIES (continued)
Net Asset Value Per Share—24 billion shares of capital stock authorized, $.01 par value
| | | | | | | | | | | | |
| Class | | Net Assets | | | Shares
Outstanding | | | Net Asset
Value | |
| |
| A | | $ | 243,518,028 | | | | 14,535,460 | | | $ | 16.75 | * |
| |
| B | | $ | 2,643,311 | | | | 174,676 | | | $ | 15.13 | |
| |
| C | | $ | 12,187,658 | | | | 803,369 | | | $ | 15.17 | |
| |
| Advisor | | $ | 17,199,626 | | | | 1,016,797 | | | $ | 16.92 | |
| |
| R | | $ | 2,525,576 | | | | 152,232 | | | $ | 16.59 | |
| |
| K | | $ | 1,265,438 | | | | 75,718 | | | $ | 16.71 | |
| |
| I | | $ | 2,467,425 | | | | 145,967 | | | $ | 16.90 | |
| |
| (a) | Includes securities on loan with a value of $1,278,886 (see Note E). |
| * | The maximum offering price per share for Class A shares was $17.49 which reflects a sales charge of 4.25%. |
See notes to consolidated financial statements.
| | |
| abfunds.com | | AB GLOBAL RISK ALLOCATION FUND | 75 |
CONSOLIDATED STATEMENT OF OPERATIONS
Year Ended November 30, 2017
| | | | | | | | |
| Investment Income | | | | | | | | |
Interest (net of foreign taxes withheld of $225) | | $ | 3,742,738 | | | | | |
Dividends | | | | | | | | |
Unaffiliated issuers (net of foreign taxes withheld of $128,256) | | | 1,989,717 | | | | | |
Affiliated issuers | | | 117,052 | | | | | |
Other income | | | 3,423 | | | $ | 5,852,930 | |
| | | | | | | | |
| Expenses | | | | | | | | |
Advisory fee (see Note B) | | | 1,634,353 | | | | | |
Distribution fee—Class A | | | 594,428 | | | | | |
Distribution fee—Class B | | | 30,961 | | | | | |
Distribution fee—Class C | | | 246,485 | | | | | |
Distribution fee—Class R | | | 13,430 | | | | | |
Distribution fee—Class K | | | 3,294 | | | | | |
Transfer agency—Class A | | | 421,855 | | | | | |
Transfer agency—Class B | | | 6,905 | | | | | |
Transfer agency—Class C | | | 46,347 | | | | | |
Transfer agency—Advisor Class | | | 26,470 | | | | | |
Transfer agency—Class R | | | 7,096 | | | | | |
Transfer agency—Class K | | | 2,690 | | | | | |
Transfer agency—Class I | | | 1,670 | | | | | |
Custodian | | | 362,015 | | | | | |
Audit and tax | | | 153,058 | | | | | |
Registration fees | | | 113,644 | | | | | |
Printing | | | 74,755 | | | | | |
Administrative | | | 70,426 | | | | | |
Legal | | | 45,723 | | | | | |
Directors’ fees | | | 28,619 | | | | | |
Miscellaneous | | | 32,188 | | | | | |
| | | | | | | | |
Total expenses | | | 3,916,412 | | | | | |
Less: expenses waived and reimbursed by the Adviser (see Notes B & E) | | | (41,856 | ) | | | | |
| | | | | | | | |
Net expenses | | | | | | | 3,874,556 | |
| | | | | | | | |
Net investment income | | | | | | | 1,978,374 | |
| | | | | | | | |
See notes to consolidated financial statements.
| | |
| 76 | AB GLOBAL RISK ALLOCATION FUND | | abfunds.com |
CONSOLIDATED STATEMENT OF OPERATIONS (continued)
| | | | | | | | |
| Realized and Unrealized Gain (Loss) on Investment and Foreign Currency Transactions | | | | | | | | |
Net realized gain on: | | | | | | | | |
Investment transactions | | | | | | $ | 4,454,800 | |
Forward currency exchange contracts | | | | | | | (3,185,798 | ) |
Futures | | | | | | | 5,358,868 | |
Options written | | | | | | | 5,494,469 | |
Swaps | | | | | | | 389,109 | |
Swaptions written | | | | | | | 319,582 | |
Foreign currency transactions | | | | | | | 2,240,698 | |
Net change in unrealized appreciation/depreciation of: | | | | | | | | |
Investments | | | | | | | 10,471,210 | |
Forward currency exchange contracts | | | | | | | 2,265,086 | |
Futures | | | | | | | 2,188,007 | |
Options written | | | | | | | (1,615,117 | ) |
Swaps | | | | | | | 2,252,483 | |
Swaptions written | | | | | | | 28,218 | |
Foreign currency denominated assets and liabilities | | | | | | | (230,159 | ) |
| | | | | | | | |
Net gain on investment and foreign currency transactions | | | | | | | 30,431,456 | |
| | | | | | | | |
Contributions from Adviser (see Note B) | | | | | | | 3,108 | |
| | | | | | | | |
Net Increase in Net Assets from Operations | | | | | | $ | 32,412,938 | |
| | | | | | | | |
See notes to consolidated financial statements.
| | |
| abfunds.com | | AB GLOBAL RISK ALLOCATION FUND | 77 |
CONSOLIDATED STATEMENT OF CHANGES IN NET ASSETS
| | | | | | | | |
| | | Year Ended
November 30,
2017 | | | Year Ended
November 30,
2016 | |
Increase (Decrease) in Net Assets
from Operations | | | | | | | | |
Net investment income | | $ | 1,978,374 | | | $ | 2,629,213 | |
Net realized gain on investment and foreign currency transactions | | | 15,071,728 | | | | 7,866,079 | |
Net change in unrealized appreciation/depreciation of investments and foreign currency denominated assets and liabilities | | | 15,359,728 | | | | (2,178,251 | ) |
Contributions from Adviser (see Note B) | | | 3,108 | | | | 652 | |
| | | | | | | | |
Net increase in net assets from operations | | | 32,412,938 | | | | 8,317,693 | |
| Dividends to Shareholders from | | | | | | | | |
Net investment income | | | | | | | | |
Class A | | | (12,060,264 | ) | | | (166,587 | ) |
Class B | | | (176,673 | ) | | | – 0 | – |
Class C | | | (2,068,206 | ) | | | – 0 | – |
Advisor Class | | | (712,844 | ) | | | (37,257 | ) |
Class R | | | (132,112 | ) | | | – 0 | – |
Class K | | | (77,414 | ) | | | (1,139 | ) |
Class I | | | (132,489 | ) | | | (918 | ) |
| Capital Stock Transactions | | | | | | | | |
Net decrease | | | (27,616,944 | ) | | | (69,922,020 | ) |
| Capital Contributions | | | | | | | | |
Proceeds from third party regulatory settlement (see Note F) | | | 43,921 | | | | – 0 | – |
| | | | | | | | |
Total decrease | | | (10,520,087 | ) | | | (61,810,228 | ) |
| Net Assets | | | | | | | | |
Beginning of period | | | 292,327,149 | | | | 354,137,377 | |
| | | | | | | | |
End of period (including distributions in excess of net investment income of ($2,925,727) and undistributed net investment income of $8,440,809, respectively) | | $ | 281,807,062 | | | $ | 292,327,149 | |
| | | | | | | | |
See notes to consolidated financial statements.
| | |
| 78 | AB GLOBAL RISK ALLOCATION FUND | | abfunds.com |
NOTES TO CONSOLIDATED FINANCIAL STATEMENTS
November 30, 2017
NOTE A
Significant Accounting Policies
AB Global Risk Allocation Fund, Inc. (the “Fund”) is registered under the Investment Company Act of 1940 as a diversified, open-end management investment company. As part of the Fund’s investment strategy, the Fund seeks to gain exposure to commodities and commodities-related instruments and derivatives primarily through investments in AllianceBernstein Cayman Global Risk Allocation, Ltd., a wholly-owned subsidiary of the Fund organized under the laws of the Cayman Islands (the “Subsidiary”). The Fund is the sole shareholder of the Subsidiary and it is intended that the Fund will remain the sole shareholder and will continue to control the Subsidiary. Under the Articles of Association of the Subsidiary, shares issued by the Subsidiary confer upon a shareholder the right to receive notice of, to attend and to vote at general meetings of the Subsidiary and shall confer upon the shareholder rights in a winding-up or repayment of capital and the right to participate in the profits or assets of the Subsidiary. As of November 30, 2017, net assets of the Fund were $281,807,062, of which $9,945,906, or approximately 4%, represented the Fund’s ownership of all issued shares and voting rights of the Subsidiary. This report presents the consolidated financial statements of the Fund and the Subsidiary. All intercompany transactions and balances have been eliminated in consolidation. The Fund offers Class A, Class B, Class C, Advisor Class, Class R, Class K and Class I shares. Class T shares have been authorized but currently are not offered. Class A shares are sold with a front-end sales charge of up to 4.25% for purchases not exceeding $1,000,000. With respect to purchases of $1,000,000 or more, Class A shares redeemed within one year of purchase may be subject to a contingent deferred sales charge of 1%. Class B shares are currently sold with a contingent deferred sales charge which declines from 4% to zero depending on the period of time the shares are held. Effective January 31, 2009, sales of Class B shares of the Fund to new investors were suspended. Class B shares will only be issued (i) upon the exchange of Class B shares from another AB mutual fund, (ii) for purposes of dividend reinvestment, (iii) through the Fund’s Automatic Investment Program (the “Program”) for accounts that established the Program prior to January 31, 2009, and (iv) for purchases of additional shares by Class B shareholders as of January 31, 2009. The ability to establish a new Program for accounts containing Class B shares was suspended as of January 31, 2009. Class B shares will automatically convert to Class A shares eight years after the end of the calendar month of purchase. Class C shares are subject to a contingent deferred sales charge of 1% on redemptions made within the first year after purchase, and 0% after the first year of purchase. Effective April 10, 2017, Class C shares will automatically convert to Class A shares ten years after the end of the calendar month of purchase. Class R and Class K shares are sold
| | |
| abfunds.com | | AB GLOBAL RISK ALLOCATION FUND | 79 |
NOTES TO CONSOLIDATED FINANCIAL STATEMENTS (continued)
without an initial or contingent deferred sales charge. Advisor Class and Class I shares are sold without an initial or contingent deferred sales charge and are not subject to ongoing distribution expenses. All eight classes of shares have identical voting, dividend, liquidation and other rights, except that the classes bear different distribution and transfer agency expenses. Each class has exclusive voting rights with respect to its distribution plan. The consolidated financial statements have been prepared in conformity with U.S. generally accepted accounting principles (“U.S. GAAP”) which require management to make certain estimates and assumptions that affect the reported amounts of assets and liabilities in the consolidated financial statements and amounts of income and expenses during the reporting period. Actual results could differ from those estimates. The Fund is an investment company under U.S. GAAP and follows the accounting and reporting guidance applicable to investment companies. The following is a summary of significant accounting policies followed by the Fund.
1. Security Valuation
Portfolio securities are valued at their current market value determined on the basis of market quotations or, if market quotations are not readily available or are deemed unreliable, at “fair value” as determined in accordance with procedures established by and under the general supervision of the Fund’s Board of Directors (the “Board”).
In general, the market values of securities which are readily available and deemed reliable are determined as follows: securities listed on a national securities exchange (other than securities listed on the NASDAQ Stock Market, Inc. (“NASDAQ”)) or on a foreign securities exchange are valued at the last sale price at the close of the exchange or foreign securities exchange. If there has been no sale on such day, the securities are valued at the last traded price from the previous day. Securities listed on more than one exchange are valued by reference to the principal exchange on which the securities are traded; securities listed only on NASDAQ are valued in accordance with the NASDAQ Official Closing Price; listed or over the counter (“OTC”) market put or call options are valued at the mid level between the current bid and ask prices. If either a current bid or current ask price is unavailable, AllianceBernstein L.P. (the “Adviser”) will have discretion to determine the best valuation (e.g., last trade price in the case of listed options); open futures are valued using the closing settlement price or, in the absence of such a price, the most recent quoted bid price. If there are no quotations available for the day of valuation, the last available closing settlement price is used; U.S. Government securities and any other debt instruments having 60 days or less remaining until maturity are generally valued at market by an independent pricing vendor, if a market price is available. If a market price is not available, the securities are valued at amortized cost. This methodology is commonly used for short term
| | |
| 80 | AB GLOBAL RISK ALLOCATION FUND | | abfunds.com |
NOTES TO CONSOLIDATED FINANCIAL STATEMENTS (continued)
securities that have an original maturity of 60 days or less, as well as short term securities that had an original term to maturity that exceeded 60 days. In instances when amortized cost is utilized, the Valuation Committee (the “Committee”) must reasonably conclude that the utilization of amortized cost is approximately the same as the fair value of the security. Such factors the Committee will consider include, but are not limited to, an impairment of the creditworthiness of the issuer or material changes in interest rates. Fixed-income securities, including mortgage-backed and asset-backed securities, may be valued on the basis of prices provided by a pricing service or at a price obtained from one or more of the major broker-dealers. In cases where broker-dealer quotes are obtained, the Adviser may establish procedures whereby changes in market yields or spreads are used to adjust, on a daily basis, a recently obtained quoted price on a security. Swaps and other derivatives are valued daily, primarily using independent pricing services, independent pricing models using market inputs, as well as third party broker-dealers or counterparties. Open end mutual funds are valued at the closing net asset value per share, while exchange traded funds are valued at the closing market price per share.
Securities for which market quotations are not readily available (including restricted securities) or are deemed unreliable are valued at fair value as deemed appropriate by the Adviser. Factors considered in making this determination may include, but are not limited to, information obtained by contacting the issuer, analysts, analysis of the issuer’s financial statements or other available documents. In addition, the Fund may use fair value pricing for securities primarily traded in non-U.S. markets because most foreign markets close well before the Fund values its securities at 4:00 p.m., Eastern Time. The earlier close of these foreign markets gives rise to the possibility that significant events, including broad market moves, may have occurred in the interim and may materially affect the value of those securities. To account for this, the Fund generally values many of its foreign equity securities using fair value prices based on third party vendor modeling tools to the extent available.
2. Fair Value Measurements
In accordance with U.S. GAAP regarding fair value measurements, fair value is defined as the price that the Fund would receive to sell an asset or pay to transfer a liability in an orderly transaction between market participants at the measurement date. U.S. GAAP establishes a framework for measuring fair value, and a three-level hierarchy for fair value measurements based upon the transparency of inputs to the valuation of an asset or liability (including those valued based on their market values as described in Note A.1 above). Inputs may be observable or unobservable and refer broadly to the assumptions that market participants would use in pricing the asset or liability. Observable inputs reflect the assumptions
| | |
| abfunds.com | | AB GLOBAL RISK ALLOCATION FUND | 81 |
NOTES TO CONSOLIDATED FINANCIAL STATEMENTS (continued)
market participants would use in pricing the asset or liability based on market data obtained from sources independent of the Fund. Unobservable inputs reflect the Fund’s own assumptions about the assumptions that market participants would use in pricing the asset or liability based on the best information available in the circumstances. Each investment is assigned a level based upon the observability of the inputs which are significant to the overall valuation. The three-tier hierarchy of inputs is summarized below.
| | • | | Level 1—quoted prices in active markets for identical investments |
| | • | | Level 2—other significant observable inputs (including quoted prices for similar investments, interest rates, prepayment speeds, credit risk, etc.) |
| | • | | Level 3—significant unobservable inputs (including the Fund’s own assumptions in determining the fair value of investments) |
The fair value of debt instruments, such as bonds, and over-the-counter derivatives is generally based on market price quotations, recently executed market transactions (where observable) or industry recognized modeling techniques and are generally classified as Level 2. Pricing vendor inputs to Level 2 valuations may include quoted prices for similar investments in active markets, interest rate curves, coupon rates, currency rates, yield curves, option adjusted spreads, default rates, credit spreads and other unique security features in order to estimate the relevant cash flows which are then discounted to calculate fair values. If these inputs are unobservable and significant to the fair value, these investments will be classified as Level 3. In addition, non-agency rated investments are classified as Level 3.
Where readily available market prices or relevant bid prices are not available for certain equity investments, such investments may be valued based on similar publicly traded investments, movements in relevant indices since last available prices or based upon underlying company fundamentals and comparable company data (such as multiples to earnings or other multiples to equity). Where an investment is valued using an observable input, such as another publicly traded security, the investment will be classified as Level 2. If management determines that an adjustment is appropriate based on restrictions on resale, illiquidity or uncertainty, and such adjustment is a significant component of the valuation, the investment will be classified as Level 3. An investment will also be classified as Level 3 where management uses company fundamentals and other significant inputs to determine the valuation.
Options are valued using market-based inputs to models, broker or dealer quotations, or alternative pricing sources with reasonable levels of price transparency, where such inputs and models are available. Alternatively the values may be obtained through unobservable management determined inputs and/or management’s proprietary models. Where models are used,
| | |
| 82 | AB GLOBAL RISK ALLOCATION FUND | | abfunds.com |
NOTES TO CONSOLIDATED FINANCIAL STATEMENTS (continued)
the selection of a particular model to value an option depends upon the contractual terms of, and specific risks inherent in, the option as well as the availability of pricing information in the market. Valuation models require a variety of inputs, including contractual terms, market prices, measures of volatility and correlations of such inputs. Exchange traded options generally will be classified as Level 2. For options that do not trade on exchange but trade in liquid markets, inputs can generally be verified and model selection does not involve significant management judgment. Options are classified within Level 2 on the fair value hierarchy when all of the significant inputs can be corroborated to market evidence. Otherwise such instruments are classified as Level 3.
Valuations of mortgage-backed or other asset-backed securities, by pricing vendors, are based on both proprietary and industry recognized models and discounted cash flow techniques. Significant inputs to the valuation of these instruments are value of the collateral, the rates and timing of delinquencies, the rates and timing of prepayments, and default and loss expectations, which are driven in part by housing prices for residential mortgages. Significant inputs are determined based on relative value analyses, which incorporate comparisons to instruments with similar collateral and risk profiles, including relevant indices. Mortgage and asset-backed securities for which management has collected current observable data through pricing services are generally categorized within Level 2. Those investments for which current observable data has not been provided are classified as Level 3.
Other fixed income investments, including non-U.S. government and corporate debt, are generally valued using quoted market prices, if available, which are typically impacted by current interest rates, maturity dates and any perceived credit risk of the issuer. Additionally, in the absence of quoted market prices, these inputs are used by pricing vendors to derive a valuation based upon industry or proprietary models which incorporate issuer specific data with relevant yield/spread comparisons with more widely quoted bonds with similar key characteristics. Those investments for which there are observable inputs are classified as Level 2. Where the inputs are not observable, the investments are classified as Level 3.
The following table summarizes the valuation of the Fund’s investments by the above fair value hierarchy levels as of November 30, 2017:
| | | | | | | | | | | | | | | | |
Investments in
Securities: | | Level 1 | | | Level 2 | | | Level 3 | | | Total | |
Assets: | | | | | | | | | | | | | | | | |
Inflation-Linked Securities | | $ | – 0 | – | | $ | 158,207,805 | | | $ | | – 0 – | | $ | 158,207,805 | |
Common Stocks: | | | | | | | | | | | | | | | | |
Financials | | | 4,913,004 | | | | 7,949,549 | | | | | – 0 – | | | 12,862,553 | |
Information Technology | | | 6,482,397 | | | | 1,634,662 | | | | | – 0 – | | | 8,117,059 | |
Industrials | | | 3,766,410 | | | | 3,375,824 | | | | | – 0 – | | | 7,142,234 | |
| | |
| abfunds.com | | AB GLOBAL RISK ALLOCATION FUND | 83 |
NOTES TO CONSOLIDATED FINANCIAL STATEMENTS (continued)
| | | | | | | | | | | | | | | | |
Investments in
Securities: | | Level 1 | | | Level 2 | | | Level 3 | | | Total | |
Consumer Staples | | $ | 3,744,326 | | | $ | 2,893,288 | | | $ | – 0 | – | | $ | 6,637,614 | |
Consumer Discretionary | | | 3,495,752 | | | | 3,057,294 | | | | – 0 | – | | | 6,553,046 | |
Health Care | | | 3,866,154 | | | | 2,616,913 | | | | – 0 | – | | | 6,483,067 | |
Materials | | | 3,017,915 | | | | 2,564,934 | | | | – 0 | – | | | 5,582,849 | |
Energy | | | 2,165,657 | | | | 2,643,441 | | | | – 0 | – | | | 4,809,098 | |
Utilities | | | 2,803,998 | | | | 1,926,706 | | | | – 0 | – | | | 4,730,704 | |
Real Estate | | | 2,022,204 | | | | 1,272,829 | | | | – 0 | – | | | 3,295,033 | |
Telecommunication Services | | | 845,650 | | | | 943,197 | | | | – 0 | – | | | 1,788,847 | |
Collateralized Mortgage Obligations | | | – 0 | – | | | 10,153,609 | | | | – 0 | – | | | 10,153,609 | |
Preferred Stocks | | | 4,133,675 | | | | – 0 | – | | | – 0 | – | | | 4,133,675 | |
Governments – Sovereign Bonds | | | – 0 | – | | | 1,233,287 | | | | – 0 | – | | | 1,233,287 | |
Emerging Markets – Corporate Bonds | | | – 0 | – | | | 687,590 | | | | – 0 | – | | | 687,590 | |
Options Purchased – Calls | | | – 0 | – | | | 413,570 | | | | – 0 | – | | | 413,570 | |
Options Purchased – Puts | | | – 0 | – | | | 176,762 | | | | – 0 | – | | | 176,762 | |
Investment Companies | | | 78,467 | | | | – 0 | – | | | – 0 | – | | | 78,467 | |
Rights | | | – 0 | – | | | – 0 | – | | | 739 | | | | 739 | |
Short-Term Investments: | | | | | | | | | | | | | | | | |
Governments – Treasuries | | | – 0 | – | | | 20,517,386 | | | | – 0 | – | | | 20,517,386 | |
Investment Companies | | | 7,373,236 | | | | – 0 | – | | | – 0 | – | | | 7,373,236 | |
Investments of Cash Collateral for Securities Loaned in Affiliated Money Market Fund | | | 1,332,435 | | | | – 0 | – | | | – 0 | – | | | 1,332,435 | |
| | | | | | | | | | | | | | | | |
Total Investments in Securities | | | 50,041,280 | | | | 222,268,646 | | | | 739 | | | | 272,310,665 | |
Other Financial Instruments(a): | | | | | | | | | | | | | | | | |
Assets: | | | | | | | | | | | | | | | | |
Futures | | | 4,567,620 | | | | 627,740 | | | | – 0 | – | | | 5,195,360 | (b) |
Forward Currency Exchange Contracts | | | – 0 | – | | | 6,722,816 | | | | – 0 | – | | | 6,722,816 | |
Centrally Cleared Credit Default Swaps | | | – 0 | – | | | 1,573,255 | | | | – 0 | – | | | 1,573,255 | (b) |
Centrally Cleared Interest Rate Swaps | | | – 0 | – | | | 1,815,155 | | | | – 0 | – | | | 1,815,155 | (b) |
Credit Default Swaps | | | – 0 | – | | | 61,375 | | | | – 0 | – | | | 61,375 | |
Liabilities: | | | | | | | | | | | | | | | | |
Futures | | | (2,048,516 | ) | | | (57,189 | ) | | | – 0 | – | | | (2,105,705 | )(b) |
Forward Currency Exchange Contracts | | | – 0 | – | | | (4,276,896 | ) | | | – 0 | – | | | (4,276,896 | ) |
Put Options Written | | | – 0 | – | | | (16,740 | ) | | | – 0 | – | | | (16,740 | ) |
Currency Options Written | | | – 0 | – | | | (406,328 | ) | | | – 0 | – | | | (406,328 | ) |
Interest Rate Swaptions | | | – 0 | – | | | (25,878 | ) | | | – 0 | – | | | (25,878 | ) |
Credit Default Swaps | | | – 0 | – | | | (61,376 | ) | | | – 0 | – | | | (61,376 | ) |
| | | | | | | | | | | | | | | | |
Total(c) | | $ | 52,560,384 | | | $ | 228,224,580 | | | $ | 739 | | | $ | 280,785,703 | |
| | | | | | | | | | | | | | | | |
| (a) | Other financial instruments are derivative instruments, such as futures, forwards and swaps, which are valued at the unrealized appreciation/(depreciation) on the instrument. Other financial instruments may also include swaps with upfront premiums, options written and swaptions written which are valued at market value. |
| (b) | Only variation margin receivable/(payable) at period end is reported within the consolidated statement of assets and liabilities. This amount reflects cumulative unrealized appreciation/(depreciation) of exchange-traded derivatives as reported in the consolidated portfolio of investments. Exchange-traded swaps with upfront premiums are presented here as market value. |
| (c) | There were de minimis transfers under 1% of net assets between Level 1 and Level 2 during the reporting period. |
| | |
| 84 | AB GLOBAL RISK ALLOCATION FUND | | abfunds.com |
NOTES TO CONSOLIDATED FINANCIAL STATEMENTS (continued)
The Fund recognizes all transfers between levels of the fair value hierarchy assuming the financial instruments were transferred at the beginning of the reporting period.
The following is a reconciliation of investments in which significant unobservable inputs (Level 3) were used in determining fair value.
| | | | | | | | | | | | |
| | | Common
Stocks(a) | | | Rights | | | Total | |
Balance as of 11/30/16 | | $ | – 0 | – | | $ | 797 | | | $ | 797 | |
Accrued discounts/(premiums) | | | – 0 | – | | | – 0 | – | | | – 0 | – |
Realized gain (loss) | | | (24,324 | ) | | | 4 | | | | (24,320 | ) |
Change in unrealized appreciation/depreciation | | | 24,324 | | | | 11 | | | | 24,335 | |
Purchases | | | – 0 | – | | | 77 | | | | 77 | |
Sales | | | – 0 | – | | | (150 | ) | | | (150 | ) |
Transfers in to Level 3 | | | – 0 | – | | | – 0 | – | | | – 0 | – |
Transfers out of Level 3 | | | – 0 | – | | | – 0 | – | | | – 0 | – |
| | | | | | | | | | | | |
Balance as of 11/30/17 | | $ | – 0 | – | | $ | 739 | | | $ | 739 | |
| | | | | | | | | | | | |
Net change in unrealized appreciation/depreciation from investments held as of 11/30/17(a) | | $ | – 0 | – | | $ | 14 | | | $ | 14 | |
| | | | | | | | | | | | |
| (a) | The Fund held securities with zero market value that were sold (or expired) during the reporting period. |
| (b) | The unrealized appreciation/depreciation is included in net change in unrealized appreciation/depreciation on investments and other financial instruments in the accompanying consolidated statement of operations. |
The Adviser established the Committee to oversee the pricing and valuation of all securities held in the Fund. The Committee operates under pricing and valuation policies and procedures established by the Adviser and approved by the Board, including pricing policies which set forth the mechanisms and processes to be employed on a daily basis to implement these policies and procedures. In particular, the pricing policies describe how to determine market quotations for securities and other instruments. The Committee’s responsibilities include: 1) fair value and liquidity determinations (and oversight of any third parties to whom any responsibility for fair value and liquidity determinations is delegated), and 2) regular monitoring of the Adviser’s pricing and valuation policies and procedures and modification or enhancement of these policies and procedures (or recommendation of the modification of these policies and procedures) as the Committee believes appropriate.
The Committee is also responsible for monitoring the implementation of the pricing policies by the Adviser’s Pricing Group (the “Pricing Group”) and any third party which performs certain pricing functions in accordance with the pricing policies. The Pricing Group is responsible for the oversight of the third party on a day-to-day basis. The Committee and the Pricing Group perform a series of activities to provide reasonable assurance of the accuracy of prices including: 1) periodic vendor due diligence meetings, review of methodologies, new developments and processes at vendors, 2)
| | |
| abfunds.com | | AB GLOBAL RISK ALLOCATION FUND | 85 |
NOTES TO CONSOLIDATED FINANCIAL STATEMENTS (continued)
daily comparison of security valuation versus prior day for all securities that exceeded established thresholds, and 3) daily review of unpriced, stale, and variance reports with exceptions reviewed by senior management and the Committee.
In addition, several processes outside of the pricing process are used to monitor valuation issues including: 1) performance and performance attribution reports are monitored for anomalous impacts based upon benchmark performance, and 2) portfolio managers review all portfolios for performance and analytics (which are generated using the Adviser’s prices).
3. Currency Translation
Assets and liabilities denominated in foreign currencies and commitments under forward currency exchange contracts are translated into U.S. dollars at the mean of the quoted bid and ask prices of such currencies against the U.S. dollar. Purchases and sales of portfolio securities are translated into U.S. dollars at the rates of exchange prevailing when such securities were acquired or sold. Income and expenses are translated into U.S. dollars at rates of exchange prevailing when accrued.
Net realized gain or loss on foreign currency transactions represents foreign exchange gains and losses from sales and maturities of foreign fixed income investments, holding of foreign currencies, currency gains or losses realized between the trade and settlement dates on foreign investment transactions, and the difference between the amounts of dividends, interest and foreign withholding taxes recorded on the Fund’s books and the U.S. dollar equivalent amounts actually received or paid. Net unrealized currency gains and losses from valuing foreign currency denominated assets and liabilities at period end exchange rates are reflected as a component of net unrealized appreciation or depreciation of foreign currency denominated assets and liabilities.
4. Taxes
It is the Fund’s policy to meet the requirements of the Internal Revenue Code applicable to regulated investment companies and to distribute all of its investment company taxable income and net realized gains, if any, to shareholders. Therefore, no provisions for federal income or excise taxes are required. The Fund may be subject to taxes imposed by countries in which it invests. Such taxes are generally based on income and/or capital gains earned or repatriated. Taxes are accrued and applied to net investment income, net realized gains and net unrealized appreciation/depreciation as such income and/or gains are earned.
If, during a taxable year, the Subsidiary’s taxable losses (and other deductible items) exceed its income and gains, the net loss will not pass through
| | |
| 86 | AB GLOBAL RISK ALLOCATION FUND | | abfunds.com |
NOTES TO CONSOLIDATED FINANCIAL STATEMENTS (continued)
to the Fund as a deductible amount for Federal income tax purposes. Note that the loss from the Subsidiary’s contemplated activities also cannot be carried forward to reduce future Subsidiary’s income in subsequent years. However, if the Subsidiary’s taxable gains exceed its losses and other deductible items during a taxable year, the net gain will pass through to the Fund as income for Federal income tax purposes.
In accordance with U.S. GAAP requirements regarding accounting for uncertainties in income taxes, management has analyzed the Fund’s tax positions taken or expected to be taken on federal and state income tax returns for all open tax years (the current and the prior three tax years) and has concluded that no provision for income tax is required in the Fund’s consolidated financial statements.
5. Investment Income and Investment Transactions
Dividend income is recorded on the ex-dividend date or as soon as the Fund is informed of the dividend. Interest income is accrued daily. Investment transactions are accounted for on the date the securities are purchased or sold. Investment gains or losses are determined on the identified cost basis. The Fund amortizes premiums and accretes discounts as adjustments to interest income.
6. Class Allocations
All income earned and expenses incurred by the Fund are borne on a pro-rata basis by each outstanding class of shares, based on the proportionate interest in the Fund represented by the net assets of such class, except for class specific expenses which are allocated to the respective class. Realized and unrealized gains and losses are allocated among the various share classes based on respective net assets.
7. Dividends and Distributions
Dividends and distributions to shareholders, if any, are recorded on the ex-dividend date. Income dividends and capital gains distributions are determined in accordance with federal tax regulations and may differ from those determined in accordance with U.S. GAAP. To the extent these differences are permanent, such amounts are reclassified within the capital accounts based on their federal tax basis treatment; temporary differences do not require such reclassification.
NOTE B
Advisory Fee and Other Transactions with Affiliates
Under the terms of the investment advisory agreement, the Fund pays the Adviser an advisory fee at an annual rate of .60% of the first $200 million, .50% of the next $200 million and .40% in excess of $400 million of the Fund’s average daily net assets. The fee is accrued daily and paid monthly.
| | |
| abfunds.com | | AB GLOBAL RISK ALLOCATION FUND | 87 |
NOTES TO CONSOLIDATED FINANCIAL STATEMENTS (continued)
The Subsidiary has entered into a separate agreement with the Adviser for the management of the Subsidiary’s portfolio. The Adviser receives no compensation from the Subsidiary for its services under the agreement.
Pursuant to the investment advisory agreement, the Fund may reimburse the Adviser for certain legal and accounting services provided to the Fund by the Adviser. For the year ended November 30, 2017, the reimbursement for such services amounted to $70,426.
During the year ended November 30, 2017 and the year ended November 30, 2016, the Adviser reimbursed the Fund $3,108 and $652, respectively, for trading losses incurred due to a trade entry error.
The Fund compensates AllianceBernstein Investor Services, Inc. (“ABIS”), a wholly-owned subsidiary of the Adviser, under a Transfer Agency Agreement for providing personnel and facilities to perform transfer agency services for the Fund. ABIS may make payments to intermediaries that provide omnibus account services, sub-accounting services and/or networking services. Such compensation retained by ABIS amounted to $220,299 for the year ended November 30, 2017.
AllianceBernstein Investments, Inc. (the “Distributor”), a wholly-owned subsidiary of the Adviser, serves as the distributor of the Fund’s shares. The Distributor has advised the Fund that it has retained front-end sales charges of $1,910 from the sale of Class A shares and received $999, $3,245 and $510 in contingent deferred sales charges imposed upon redemptions by shareholders of Class A, Class B and Class C shares, respectively, for the year ended November 30, 2017.
The Fund may invest in AB Government Money Market Portfolio (the “Government Money Market Portfolio”) which has a contractual annual advisory fee rate of .20% of the portfolio’s average daily net assets and bears its own expenses. In connection with the investment by the Fund in the Government Money Market Portfolio, the Adviser has contractually agreed to waive its advisory fee from the Fund in an amount equal to the Fund’s pro rata share of the effective advisory fees of Government Money Market Portfolio, as borne indirectly by the Fund as an acquired fund fee and expense. For the year ended November 30, 2017, such waiver amounted to $38,275.
| | |
| 88 | AB GLOBAL RISK ALLOCATION FUND | | abfunds.com |
NOTES TO CONSOLIDATED FINANCIAL STATEMENTS (continued)
A summary of the Fund’s transactions in AB mutual funds for the year ended November 30, 2017 is as follows:
| | | | | | | | | | | | | | | | | | | | |
| Fund | | Market
Value
11/30/16
(000) | | | Purchases
at Cost
(000) | | | Sales
Proceeds
(000) | | | Market
Value
11/30/17
(000) | | | Dividend
Income
(000) | |
Government Money Market Portfolio | | $ | 16,330 | | | $ | 178,584 | | | $ | 187,540 | | | $ | 7,374 | | | $ | 104 | |
Government Money Market Portfolio* | | | 834 | | | | 37,772 | | | | 37,274 | | | | 1,332 | | | | 13 | |
| | | | | | | | | | | | | | | | | | | | |
Total | | | | | | | | | | | | | | $ | 8,706 | | | $ | 117 | |
| | | | | | | | | | | | | | | | | | | | |
| * | Investments of cash collateral for securities lending transactions (see Note E). |
Brokerage commissions paid on investment transactions for the year ended November 30, 2017 amounted to $184,654, of which $0 and $0, respectively, was paid to Sanford C. Bernstein & Co. LLC and Sanford C. Bernstein Limited, affiliates of the Adviser.
NOTE C
Distribution Services Agreement
The Fund has adopted a Distribution Services Agreement (the “Agreement”) pursuant to Rule 12b-1 under the Investment Company Act of 1940. Under the Agreement, the Fund pays distribution and servicing fees to the Distributor at an annual rate of up to .30% of the Fund’s average daily net assets attributable to Class A shares, 1% of the Fund’s average daily net assets attributable to both Class B and Class C shares, .50% of the Fund’s average daily net assets attributable to Class R shares and .25% of the Fund’s average daily net assets attributable to Class K shares. There are no distribution and servicing fees on the Advisor Class and Class I shares. The fees are accrued daily and paid monthly. Effective February 27, 2015, payments under the Agreement in respect of Class A shares are limited to an annual rate of .25% of Class A shares’ average daily net assets. The Agreement provides that the Distributor will use such payments in their entirety for distribution assistance and promotional activities. Since the commencement of the Fund’s operations, the Distributor has incurred expenses in excess of the distribution costs reimbursed by the Fund in the amounts of $770,253, $3,492,715, $416,294 and $251,193 for Class B, Class C, Class R and Class K shares, respectively. While such costs may be recovered from the Fund in future periods so long as the Agreement is in effect, the rate of the distribution and servicing fees payable under the Agreement may not be increased without a shareholder vote. In accordance with the Agreement, there is no provision for recovery of unreimbursed distribution costs incurred by the Distributor beyond the current fiscal year for Class A shares. The Agreement also provides that the Adviser may use its own resources to finance the distribution of the Fund’s shares.
| | |
| abfunds.com | | AB GLOBAL RISK ALLOCATION FUND | 89 |
NOTES TO CONSOLIDATED FINANCIAL STATEMENTS (continued)
NOTE D
Investment Transactions
Purchases and sales of investment securities (excluding short-term investments) for the year ended November 30, 2017 were as follows:
| | | | | | | | |
| | | Purchases | | | Sales | |
Investment securities (excluding U.S. government securities) | | $ | 24,388,727 | | | $ | 62,648,932 | |
U.S. government securities | | | 43,826,239 | | | | 6,032,109 | |
The cost of investments for federal income tax purposes, gross unrealized appreciation and unrealized depreciation are as follows:
| | | | |
Cost | | $ | 279,049,029 | |
| | | | |
Gross unrealized appreciation | | $ | 33,268,538 | |
Gross unrealized depreciation | | | (34,929,167 | ) |
| | | | |
Net unrealized appreciation | | $ | (1,660,629 | ) |
| | | | |
1. Derivative Financial Instruments
The Fund may use derivatives in an effort to earn income and enhance returns, to replace more traditional direct investments, to obtain exposure to otherwise inaccessible markets (collectively, “investment purposes”), or to hedge or adjust the risk profile of its portfolio.
The principal types of derivatives utilized by the Fund, as well as the methods in which they may be used are:
The Fund may buy or sell futures for investment purposes or for the purpose of hedging its portfolio against adverse effects of potential movements in the market. The Fund bears the market risk that arises from changes in the value of these instruments and the imperfect correlation between movements in the price of the futures and movements in the price of the assets, reference rates or indices which they are designed to track. Among other things, the Fund may purchase or sell futures for foreign currencies or options thereon for non-hedging purposes as a means of making direct investment in foreign currencies, as described below under “Currency Transactions”.
At the time the Fund enters into futures, the Fund deposits and maintains as collateral an initial margin with the broker, as required by the exchange on which the transaction is effected. Such amount is shown as cash collateral due from broker on the consolidated statement of assets and liabilities. Pursuant to the contract, the Fund agrees to receive from or pay to the broker an amount of cash equal to the daily fluctuation in the value of the contract. Such receipts or
| | |
| 90 | AB GLOBAL RISK ALLOCATION FUND | | abfunds.com |
NOTES TO CONSOLIDATED FINANCIAL STATEMENTS (continued)
payments are known as variation margin and are recorded by the Fund as unrealized gains or losses. Risks may arise from the potential inability of a counterparty to meet the terms of the contract. The credit/counterparty risk for exchange-traded futures is generally less than privately negotiated futures, since the clearinghouse, which is the issuer or counterparty to each exchange-traded future, has robust risk mitigation standards, including the requirement to provide initial and variation margin. When the contract is closed, the Fund records a realized gain or loss equal to the difference between the value of the contract at the time it was opened and the time it was closed.
Use of long futures subjects the Fund to risk of loss in excess of the amounts shown on the consolidated statement of assets and liabilities, up to the notional value of the futures. Use of short futures subjects the Fund to unlimited risk of loss. Under some circumstances, futures exchanges may establish daily limits on the amount that the price of futures can vary from the previous day’s settlement price, which could effectively prevent liquidation of unfavorable positions.
During the year ended November 30, 2017, the Fund held futures for hedging and non-hedging purposes.
| | • | | Forward Currency Exchange Contracts |
The Fund may enter into forward currency exchange contracts in order to hedge its exposure to changes in foreign currency exchange rates on its foreign portfolio holdings, to hedge certain firm purchase and sale commitments denominated in foreign currencies and for non-hedging purposes as a means of making direct investments in foreign currencies, as described below under “Currency Transactions”.
A forward currency exchange contract is a commitment to purchase or sell a foreign currency at a future date at a negotiated forward rate. The gain or loss arising from the difference between the original contract and the closing of such contract would be included in net realized gain or loss on forward currency exchange contracts. Fluctuations in the value of open forward currency exchange contracts are recorded for financial reporting purposes as unrealized appreciation and/or depreciation by the Fund. Risks may arise from the potential inability of a counterparty to meet the terms of a contract and from unanticipated movements in the value of a foreign currency relative to the U.S. dollar.
During the year ended November 30, 2017, the Fund held forward currency exchange contracts for hedging and non-hedging purposes.
| | |
| abfunds.com | | AB GLOBAL RISK ALLOCATION FUND | 91 |
NOTES TO CONSOLIDATED FINANCIAL STATEMENTS (continued)
For hedging and investment purposes, the Fund may purchase and write (sell) put and call options on U.S. and foreign securities, including government securities, and foreign currencies that are traded on U.S. and foreign securities exchanges and over-the-counter markets. Among other things, the Fund may use options transactions for non-hedging purposes as a means of making direct investments in foreign currencies, as described below under “Currency Transactions” and may use options strategies involving the purchase and/or writing of various combinations of call and/or put options, for hedging and investment purposes.
The risk associated with purchasing an option is that the Fund pays a premium whether or not the option is exercised. Additionally, the Fund bears the risk of loss of the premium and change in market value should the counterparty not perform under the contract. If a put or call option purchased by the Fund were permitted to expire without being sold or exercised, its premium would represent a loss to the Fund. Put and call options purchased are accounted for in the same manner as portfolio securities. The cost of securities acquired through the exercise of call options is increased by premiums paid. The proceeds from securities sold through the exercise of put options are decreased by the premiums paid.
When the Fund writes an option, the premium received by the Fund is recorded as a liability and is subsequently adjusted to the current market value of the option written. Premiums received from written options which expire unexercised are recorded by the Fund on the expiration date as realized gains from options written. The difference between the premium received and the amount paid on effecting a closing purchase transaction, including brokerage commissions, is also treated as a realized gain, or if the premium received is less than the amount paid for the closing purchase transaction, as a realized loss. If a call option is exercised, the premium received is added to the proceeds from the sale of the underlying security or currency in determining whether the Fund has realized a gain or loss. If a put option is exercised, the premium received reduces the cost basis of the security or currency purchased by the Fund. In writing an option, the Fund bears the market risk of an unfavorable change in the price of the security or currency underlying the written option. Exercise of an option written by the Fund could result in the Fund selling or buying a security or currency at a price different from the current market value.
The Fund may also invest in options on swap agreements, also called “swaptions”. A swaption is an option that gives the buyer the right,
| | |
| 92 | AB GLOBAL RISK ALLOCATION FUND | | abfunds.com |
NOTES TO CONSOLIDATED FINANCIAL STATEMENTS (continued)
but not the obligation, to enter into a swap on a future date in exchange for paying a market-based “premium”. A receiver swaption gives the owner the right to receive the total return of a specified asset, reference rate, or index. A payer swaption gives the owner the right to pay the total return on a specified asset, reference rate, or index. Swaptions also include options that allow an existing swap to be terminated or extended by one of the counterparties.
During the year ended November 30, 2017, the Fund held purchased options for hedging and non-hedging purposes. During the year ended November 30, 2017, the Fund held written options for hedging and non-hedging purposes.
During the year ended November 30, 2017, the Fund held written swaptions for hedging and non-hedging purposes.
At November 30, 2017, the maximum payments for written put options amounted to $168,548,999. In certain circumstances maximum payout amounts may be partially offset by recovery values of the respective referenced assets and upfront premium received upon entering into the contract.
The Fund may enter into swaps to hedge its exposure to interest rates, credit risk, equity markets or currencies. The Fund may also enter into swaps for non-hedging purposes as a means of gaining market exposures, making direct investments in foreign currencies, as described below under “Currency Transactions.” A swap is an agreement that obligates two parties to exchange a series of cash flows at specified intervals based upon or calculated by reference to changes in specified prices or rates for a specified amount of an underlying asset. The payment flows are usually netted against each other, with the difference being paid by one party to the other. In addition, collateral may be pledged or received by the Fund in accordance with the terms of the respective swaps to provide value and recourse to the Fund or its counterparties in the event of default, bankruptcy or insolvency by one of the parties to the swap.
Risks may arise as a result of the failure of the counterparty to the swap to comply with the terms of the swap. The loss incurred by the failure of a counterparty is generally limited to the net interim payment to be received by the Fund, and/or the termination value at the end of the contract. Therefore, the Fund considers the creditworthiness of each counterparty to a swap in evaluating potential counterparty risk. This risk is mitigated by having a netting arrangement between the Fund and the counterparty and by the posting of collateral by the counterparty to the Fund to cover the Fund’s exposure to the
| | |
| abfunds.com | | AB GLOBAL RISK ALLOCATION FUND | 93 |
NOTES TO CONSOLIDATED FINANCIAL STATEMENTS (continued)
counterparty. Additionally, risks may arise from unanticipated movements in interest rates or in the value of the underlying securities. The Fund accrues for the interim payments on swaps on a daily basis, with the net amount recorded within unrealized appreciation/depreciation of swaps on the consolidated statement of assets and liabilities, where applicable. Once the interim payments are settled in cash, the net amount is recorded as realized gain/(loss) on swaps on the consolidated statement of operations, in addition to any realized gain/(loss) recorded upon the termination of swaps. Upfront premiums paid or received are recognized as cost or proceeds on the consolidated statement of assets and liabilities and are amortized on a straight line basis over the life of the contract. Amortized upfront premiums are included in net realized gain/(loss) from swaps on the consolidated statement of operations. Fluctuations in the value of swaps are recorded as a component of net change in unrealized appreciation/depreciation of swaps on the consolidated statement of operations.
Certain standardized swaps, including certain interest rate swaps and credit default swaps, are (or soon will be) subject to mandatory central clearing. Cleared swaps are transacted through futures commission merchants (“FCMs”) that are members of central clearinghouses, with the clearinghouse serving as central counterparty, similar to transactions in futures contracts. Centralized clearing will be required for additional categories of swaps on a phased-in basis based on requirements published by the Securities and Exchange Commission and Commodity Futures Trading Commission.
At the time the Fund enters into a centrally cleared swap, the Fund deposits and maintains as collateral an initial margin with the broker, as required by the clearinghouse on which the transaction is effected. Such amount is shown as cash collateral due from broker on the consolidated statement of assets and liabilities. Pursuant to the contract, the Fund agrees to receive from or pay to the broker an amount of cash equal to the daily fluctuation in the value of the contract. Such receipts or payments are known as variation margin and are recorded by the Fund as unrealized gains or losses. Risks may arise from the potential inability of a counterparty to meet the terms of the contract. The credit/counterparty risk for centrally cleared swaps is generally less than non-centrally cleared swaps, since the clearinghouse, which is the issuer or counterparty to each centrally cleared swap, has robust risk mitigation standards, including the requirement to provide initial and variation margin. When the contract is closed, the Fund records a realized gain or loss equal to the difference between the value of the contract at the time it was opened and the time it was closed.
| | |
| 94 | AB GLOBAL RISK ALLOCATION FUND | | abfunds.com |
NOTES TO CONSOLIDATED FINANCIAL STATEMENTS (continued)
Interest Rate Swaps:
The Fund is subject to interest rate risk exposure in the normal course of pursuing its investment objectives. Because the Fund holds fixed rate bonds, the value of these bonds may decrease if interest rates rise. To help hedge against this risk and to maintain its ability to generate income at prevailing market rates, the Fund may enter into interest rate swaps. Interest rate swaps are agreements between two parties to exchange cash flows based on a notional amount. The Fund may elect to pay a fixed rate and receive a floating rate, or, receive a fixed rate and pay a floating rate on a notional amount.
In addition, the Fund may also enter into interest rate swap transactions to preserve a return or spread on a particular investment or portion of its portfolio, or protecting against an increase in the price of securities the Fund anticipates purchasing at a later date. Interest rate swaps involve the exchange by a Fund with another party of their respective commitments to pay or receive interest (e.g., an exchange of floating rate payments for fixed rate payments) computed based on a contractually-based principal (or “notional”) amount. Interest rate swaps are entered into on a net basis (i.e., the two payment streams are netted out, with the Fund receiving or paying, as the case may be, only the net amount of the two payments).
During the year ended November 30, 2017, the Fund held interest rate swaps for hedging and non-hedging purposes.
Credit Default Swaps:
The Fund may enter into credit default swaps, including to manage its exposure to the market or certain sectors of the market, to reduce its risk exposure to defaults by corporate and sovereign issuers held by the Fund, or to create exposure to corporate or sovereign issuers to which it is not otherwise exposed. The Fund may purchase credit protection (“Buy Contract”) or provide credit protection (“Sale Contract”) on the referenced obligation of the credit default swap. During the term of the swap, the Fund receives/(pays) fixed payments from/(to) the respective counterparty, calculated at the agreed upon rate applied to the notional amount. If the Fund is a buyer/(seller) of protection and a credit event occurs, as defined under the terms of the swap, the Fund will either (i) receive from the seller/(pay to the buyer) of protection an amount equal to the notional amount of the swap (the “Maximum Payout Amount”) and deliver/(take delivery of) the referenced obligation or (ii) receive/(pay) a net settlement amount in the form of cash or securities equal to the notional amount of the swap less the recovery value of the referenced obligation.
In certain circumstances Maximum Payout Amounts may be partially offset by recovery values of the respective referenced obligations, upfront premium received upon entering into the agreement, or net amounts received from settlement of buy protection credit default swaps entered into by the Fund for the same referenced obligations
| | |
| abfunds.com | | AB GLOBAL RISK ALLOCATION FUND | 95 |
NOTES TO CONSOLIDATED FINANCIAL STATEMENTS (continued)
with the same counterparty. As of November 30, 2017, the Fund did not have Buy Contracts outstanding with respect to the same referenced obligations and same counterparty for its Sale Contracts outstanding.
Credit default swaps may involve greater risks than if a Fund had invested in the referenced obligation directly. Credit default swaps are subject to general market risk, liquidity risk, counterparty risk and credit risk. If the Fund is a buyer of protection and no credit event occurs, it will lose the payments it made to its counterparty. If the Fund is a seller of protection and a credit event occurs, the value of the referenced obligation received by the Fund coupled with the periodic payments previously received, may be less than the Maximum Payout Amount it pays to the buyer, resulting in a net loss to the Fund.
Implied credit spreads over U.S. Treasuries of comparable maturity utilized in determining the market value of credit default swaps on issuers as of period end are disclosed in the portfolio of investments. The implied spreads serve as an indicator of the current status of the payment/performance risk and typically reflect the likelihood of default by the issuer of the referenced obligation. The implied credit spread of a particular reference obligation also reflects the cost of buying/selling protection and may reflect upfront payments required to be made to enter into the agreement. Widening credit spreads typically represent a deterioration of the referenced obligation’s credit soundness and greater likelihood of default or other credit event occurring as defined under the terms of the agreement. A credit spread identified as “Defaulted” indicates a credit event has occurred for the referenced obligation.
During the year ended November 30, 2017, the Fund held credit default swaps for hedging and non-hedging purposes.
The Fund and the Subsidiary typically enters into International Swaps and Derivatives Association, Inc. Master Agreements (“ISDA Master Agreement”) with its OTC derivative contract counterparties in order to, among other things, reduce its credit risk to OTC counterparties. ISDA Master Agreements include provisions for general obligations, representations, collateral and events of default or termination. Under an ISDA Master Agreement, the Fund typically may offset with the OTC counterparty certain derivative financial instruments’ payables and/or receivables with collateral held and/or posted and create one single net payment (close-out netting) in the event of default or termination. In the event of a default by an OTC counterparty, the return of collateral with market value in excess of the Fund’s and the Subsidiary net liability, held by the defaulting party, may be delayed or denied.
The Fund’s and Subsidiary’s ISDA Master Agreements may contain provisions for early termination of OTC derivative transactions in the event the
| | |
| 96 | AB GLOBAL RISK ALLOCATION FUND | | abfunds.com |
NOTES TO CONSOLIDATED FINANCIAL STATEMENTS (continued)
net assets of the Fund or the Subsidiary decline below specific levels (“net asset contingent features”). If these levels are triggered, the Fund’s and the Subsidiary OTC counterparty has the right to terminate such transaction and require the Fund or the Subsidiary to pay or receive a settlement amount in connection with the terminated transaction. For additional details, please refer to netting arrangements by the OTC counterparty tables below.
During the year ended November 30, 2017, the Fund had entered into the following derivatives:
| | | | | | | | | | | | |
| | | Asset Derivatives | | | Liability Derivatives | |
Derivative Type | | Consolidated
Statement of
Assets and
Liabilities
Location | | Fair Value | | | Consolidated
Statement of
Assets and
Liabilities
Location | | Fair Value | |
Interest rate contracts | |
Receivable/Payable for variation margin on futures | |
$ |
172,935 |
* | |
Receivable/Payable for variation margin on futures | |
$ |
93,845 |
* |
| | | | |
Equity contracts | | Receivable/Payable for variation margin on futures | | | 3,748,837 | * | | Receivable/Payable for variation margin on futures | | | 593,666 | * |
| | | | |
Commodity contracts | |
Receivable/Payable for variation margin on futures | | | 1,273,588 | * | | Receivable/Payable for variation margin on futures | | | 1,418,194 | * |
| | | | |
Credit contracts | | Receivable/Payable for variation margin on exchange traded swaps | | | 1,178,619 | * | | | | | | |
| | | | |
Interest rate contracts | |
Receivable/Payable for variation margin on exchange traded swaps | | | 1,815,155 | * | | | | | | |
| | | | |
Foreign currency contracts | |
Unrealized appreciation on forward currency exchange contracts | | | 6,722,816 | | | Unrealized depreciation on forward currency exchange contracts | | | 4,276,896 | |
| | | | |
Interest rate contracts | |
Investments in securities, at value | | | 152,047 | | | | | | | |
| | | | |
Foreign exchange contracts | |
Investments in securities, at value | | | 124,131 | | | | | | | |
| | | | |
Equity contracts | | Investments in securities, at value | | | 314,154 | | | | | | | |
| | |
| abfunds.com | | AB GLOBAL RISK ALLOCATION FUND | 97 |
NOTES TO CONSOLIDATED FINANCIAL STATEMENTS (continued)
| | | | | | | | | | | | |
| | | Asset Derivatives | | | Liability Derivatives | |
Derivative Type | | Consolidated
Statement of
Assets and
Liabilities
Location | | Fair Value | | | Consolidated
Statement of
Assets and
Liabilities
Location | | Fair Value | |
Interest rate contracts | | | | | | | | Swaptions written, at value | | $ | 25,878 | |
Foreign exchange contracts | | | | | | | | Options written, at value | | | 406,328 | |
| | | | |
Equity contracts | | | | | | | | Options written, at value | | | 16,740 | |
| | | | |
Credit contracts | | Unrealized appreciation on credit default swaps | | $ | 80,395 | | | Unrealized depreciation on credit default swaps | | | 78,724 | |
| | | | | | | | | | | | |
Total | | | | $ | 15,582,677 | | | | | $ | 6,910,271 | |
| | | | | | | | | | | | |
| * | Only variation margin receivable/payable at period end is reported within the consolidated statement of assets and liabilities. |
This amount reflects cumulative appreciation/(depreciation) of exchange-traded derivatives as reported in the consolidated portfolio of investments.
| | | | | | | | | | |
Derivative Type | | Location of
Gain or (Loss)
on Derivatives
Within Consolidated
Statement of
Operations | | Realized Gain
or (Loss) on
Derivatives | | | Change in
Unrealized
Appreciation or
(Depreciation) | |
Interest rate contracts | | Net realized gain (loss) on futures; Net change in unrealized appreciation/depreciation of futures | | $ | (572,958 | ) | | $ | 147,787 | |
| | | |
Equity contracts | | Net realized gain (loss) on futures; Net change in unrealized appreciation/depreciation of futures | | | 3,340,286 | | | | 3,406,249 | |
| | | |
Commodity contracts | | Net realized gain (loss) on futures; Net change in unrealized appreciation/depreciation of futures | | | 2,591,540 | | | | (1,366,029 | ) |
| | | |
Foreign currency contracts | | Net realized gain (loss) on forward currency exchange contracts; Net change in unrealized appreciation/depreciation of forward currency exchange contracts | | | (3,185,798 | ) | | | 2,265,086 | |
| | |
| 98 | AB GLOBAL RISK ALLOCATION FUND | | abfunds.com |
NOTES TO CONSOLIDATED FINANCIAL STATEMENTS (continued)
| | | | | | | | | | |
Derivative Type | | Location of
Gain or (Loss)
on Derivatives
Within Consolidated
Statement of
Operations | | Realized Gain
or (Loss) on
Derivatives | | | Change in
Unrealized
Appreciation or
(Depreciation) | |
Interest rate contracts | | Net realized gain (loss) on investment transactions; Net change in unrealized appreciation/depreciation of investments | | $ | 210,681 | | | $ | 29,988 | |
| | | |
Foreign exchange contracts | | Net realized gain (loss) on investment transactions; Net change in unrealized appreciation/depreciation of investments | | | (944,102 | ) | | | (38,895 | ) |
| | | |
Equity contracts | | Net realized gain (loss) on investment transactions; Net change in unrealized appreciation/depreciation of investments | | | 138,587 | | | | 705,243 | |
| | | |
Foreign exchange contracts | | Net realized gain (loss) on options written; Net change in unrealized appreciation/depreciation of options written | | | 1,856,755 | | | | (381,117 | ) |
| | | |
Equity contracts | | Net realized gain (loss) on options written; Net change in unrealized appreciation/depreciation of options written | | | 3,637,714 | | | | (1,234,000 | ) |
| | | |
Interest rate contracts | | Net realized gain (loss) on swaptions written; Net change in unrealized appreciation/depreciation of swaptions written | | | 319,582 | | | | 28,218 | |
| | | |
Interest rate contracts | | Net realized gain (loss) on swaps; Net change in unrealized appreciation/depreciation of swaps | | | (139,425 | ) | | | 1,707,822 | |
| | | |
Credit contracts | | Net realized gain (loss) on swaps; Net change in unrealized appreciation/depreciation of swaps | | | 528,534 | | | | 544,661 | |
| | | | | | | | | | |
Total | | | | $ | 7,781,396 | | | $ | 5,815,013 | |
| | | | | | | | | | |
| | |
| abfunds.com | | AB GLOBAL RISK ALLOCATION FUND | 99 |
NOTES TO CONSOLIDATED FINANCIAL STATEMENTS (continued)
The following table represents the average monthly volume of the Fund’s derivative transactions during the year ended November 30, 2017:
| | | | |
Futures: | | | | |
Average original value of buy contracts | | $ | 189,633,077 | |
Average original value of sale contracts | | $ | 44,182,685 | |
Forward Currency Exchange Contracts: | | | | |
Average principal amount of buy contracts | | $ | 261,699,033 | |
Average principal amount of sale contracts | | $ | 411,473,379 | |
Purchased Options: | | | | |
Average monthly cost | | $ | 724,146 | |
Options Written: | | | | |
Average notional amount | | $ | 51,757,474 | |
Swaptions Written: | | | | |
Average notional amount | | $ | 46,573,714 | (a) |
Centrally Cleared Interest Rate Swaps: | | | | |
Average notional amount | | $ | 69,590,316 | |
Credit Default Swaps: | | | | |
Average notional amount of buy contracts | | $ | 2,600,000 | |
Average notional amount of sale contracts | | $ | 2,600,000 | |
Centrally Cleared Credit Default Swaps: | | | | |
Average notional amount of sale contracts | | $ | 31,134,615 | |
| (a) | Positions were open for six months during the period. |
For financial reporting purposes, the Fund does not offset derivative assets and derivative liabilities that are subject to netting arrangements in the consolidated statement of assets and liabilities.
All OTC derivatives held at period end were subject to netting arrangements. The following table presents the Fund’s derivative assets and liabilities by OTC counterparty net of amounts available for offset under ISDA Master Agreements and net of the related collateral received/pledged by the Fund as of
November 30, 2017. Exchange-traded derivatives are not subject to netting arrangements and as such are excluded from the table.
AB Global Risk Allocation Fund
| | | | | | | | | | | | | | | | | | | | |
Counterparty | | Derivative
Assets
Subject to
a MA | | | Derivative
Available
for Offset | | | Cash
Collateral
Received* | | | Security
Collateral
Received* | | | Net Amount
of Derivatives
Assets | |
OTC Derivatives: | | | | | | | | | | | | | | | | | | | | |
Australia and New Zealand Banking Group Ltd. | | $ | 142,917 | | | $ | (5,721 | ) | | $ | – 0 | – | | $ | – 0 | – | | $ | 137,196 | |
Bank of America, NA | | | 1,170,026 | | | | (252,236 | ) | | | – 0 | – | | | – 0 | – | | | 917,790 | |
Barclays Bank PLC | | | 2,266,142 | | | | (580,246 | ) | | | – 0 | – | | | – 0 | – | | | 1,685,896 | |
BNP Paribas SA | | | 311,227 | | | | (15,311 | ) | | | (260,000 | ) | | | – 0 | – | | | 35,916 | |
Citibank, NA | | | 831,822 | | | | (831,822 | ) | | | – 0 | – | | | – 0 | – | | | – 0 | – |
Credit Suisse International | | | 225,837 | | | | (225,837 | ) | | | – 0 | – | | | – 0 | – | | | – 0 | – |
Deutsche Bank AG | | | 220,001 | | | | (127,959 | ) | | | (92,042 | ) | | | – 0 | – | | | – 0 | – |
Goldman Sachs Bank USA/Goldman Sachs International | | | 710,297 | | | | (637,493 | ) | | | – 0 | – | | | – 0 | – | | | 72,804 | |
| | |
| 100 | AB GLOBAL RISK ALLOCATION FUND | | abfunds.com |
NOTES TO CONSOLIDATED FINANCIAL STATEMENTS (continued)
| | | | | | | | | | | | | | | | | | | | |
Counterparty | | Derivative
Assets
Subject to
a MA | | | Derivative
Available
for Offset | | | Cash
Collateral
Received* | | | Security
Collateral
Received* | | | Net Amount
of Derivatives
Assets | |
JPMorgan Chase Bank, NA | | $ | 15,036 | | | $ | (15,036 | ) | | $ | – 0 | – | | $ | – 0 | – | | $ | – 0 | – |
Morgan Stanley Capital Services, Inc. | | | 34,631 | | | | (33,119 | ) | | | – 0 | – | | | – 0 | – | | | 1,512 | |
Royal Bank of Scotland PLC | | | 218,101 | | | | (159,484 | ) | | | – 0 | – | | | – 0 | – | | | 58,617 | |
Standard Chartered Bank | | | 227,280 | | | | (81,154 | ) | | | – 0 | – | | | – 0 | – | | | 146,126 | |
State Street Bank & Trust Co. | | | 291,918 | | | | (291,918 | ) | | | – 0 | – | | | – 0 | – | | | – 0 | – |
UBS AG | | | 395,134 | | | | (329,513 | ) | | | – 0 | – | | | – 0 | – | | | 65,621 | |
| | | | | | | | | | | | | | | | | | | | |
Total | | $ | 7,060,369 | | | $ | (3,586,849 | ) | | $ | (352,042 | ) | | $ | – 0 | – | | $ | 3,121,478 | ^ |
| | | | | | | | | | | | | | | | | | | | |
| | | | | |
Counterparty | | Derivative
Liabilities
Subject
to a MA | | | Derivative
Available
for Offset | | | Cash
Collateral
Pledged* | | | Security
Collateral
Pledged* | | | Net Amount
of Derivatives
Liabilities | |
OTC Derivatives: | | | | | | | | | | | | | | | | | | | | |
Australia and New Zealand Banking Group Ltd. | | $ | 5,721 | | | $ | (5,721 | ) | | $ | – 0 | – | | $ | – 0 | – | | $ | – 0 | – |
Bank of America, NA | | | 252,236 | | | | (252,236 | ) | | | – 0 | – | | | – 0 | – | | | – 0 | – |
Barclays Bank PLC | | | 580,246 | | | | (580,246 | ) | | | – 0 | – | | | – 0 | – | | | – 0 | – |
BNP Paribas SA | | | 15,311 | | | | (15,311 | ) | | | – 0 | – | | | – 0 | – | | | – 0 | – |
Brown Brothers Harriman & Co. | | | 22,730 | | | | – 0 | – | | | – 0 | – | | | – 0 | – | | | 22,730 | |
Citibank, NA | | | 1,305,164 | | | | (831,822 | ) | | | – 0 | – | | | – 0 | – | | | 473,342 | |
Credit Suisse International | | | 361,234 | | | | (225,837 | ) | | | – 0 | – | | | – 0 | – | | | 135,397 | |
Deutsche Bank AG | | | 127,959 | | | | (127,959 | ) | | | – 0 | – | | | – 0 | – | | | – 0 | – |
Goldman Sachs Bank USA/Goldman Sachs International | | | 637,493 | | | | (637,493 | ) | | | – 0 | – | | | – 0 | – | | | – 0 | – |
JPMorgan Chase Bank, NA | | | 168,078 | | | | (15,036 | ) | | | – 0 | – | | | – 0 | – | | | 153,042 | |
Morgan Stanley Capital Services, Inc. | | | 33,119 | | | | (33,119 | ) | | | – 0 | – | | | – 0 | – | | | – 0 | – |
Royal Bank of Scotland PLC | | | 159,484 | | | | (159,484 | ) | | | – 0 | – | | | – 0 | – | | | – 0 | – |
Standard Chartered Bank | | | 81,154 | | | | (81,154 | ) | | | – 0 | – | | | – 0 | – | | | – 0 | – |
State Street Bank & Trust Co. | | | 691,036 | | | | (291,918 | ) | | | – 0 | – | | | – 0 | – | | | 399,118 | |
UBS AG | | | 329,513 | | | | (329,513 | ) | | | – 0 | – | | | – 0 | – | | | – 0 | – |
| | | | | | | | | | | | | | | | | | | | |
Total | | $ | 4,770,478 | | | $ | (3,586,849 | ) | | $ | – 0 | – | | $ | – 0 | – | | $ | 1,183,629 | ^ |
| | | | | | | | | | | | | | | | | | | | |
| * | The actual collateral received/pledged may be more than the amount reported due to over-collateralization. |
| ^ | Net amount represents the net receivable/payable that would be due from/to the counterparty in the event of default or termination. The net amount from OTC financial derivative instruments can only be netted across transactions governed under the same master agreement with the same counterparty. |
| | |
| abfunds.com | | AB GLOBAL RISK ALLOCATION FUND | 101 |
NOTES TO CONSOLIDATED FINANCIAL STATEMENTS (continued)
2. Currency Transactions
The Fund may invest in non-U.S. Dollar-denominated securities on a currency hedged or unhedged basis. The Fund may seek investment opportunities by taking long or short positions in currencies through the use of currency-related derivatives, including forward currency exchange contracts, futures and options on futures, swaps, and other options. The Fund may enter into transactions for investment opportunities when it anticipates that a foreign currency will appreciate or depreciate in value but securities denominated in that currency are not held by the Fund and do not present attractive investment opportunities. Such transactions may also be used when the Adviser believes that it may be more efficient than a direct investment in a foreign currency-denominated security. The Fund may also conduct currency exchange contracts on a spot basis (i.e., for cash at the spot rate prevailing in the currency exchange market for buying or selling currencies).
3. TBA and Dollar Rolls
The Fund may invest in TBA mortgage-backed securities. A TBA, or “To Be Announced”, trade represents a contract for the purchase or sale of mortgage-backed securities to be delivered at a future agree-upon date; however, the specific mortgage pool numbers or the number of pools that will be delivered to fulfill the trade obligation or terms of the contract are unknown at the time of the trade. Mortgage pools (including fixed-rate or variable-rate mortgages) guaranteed by the Government National Mortgage Association, or GNMA, the Federal National Mortgage Association, or FNMA, or the Federal Home Loan Mortgage Corporation, or FHLMC, are subsequently allocated to the TBA transactions. During the year ended November 30, 2017, the Fund did not engage in TBA transactions.
The Fund may enter into dollar rolls. Dollar rolls involve sales by the Fund of securities for delivery in the current month and the Fund’s simultaneously contracting to repurchase substantially similar (same type and coupon) securities on a specified future date. During the roll period, the Fund forgoes principal and interest paid on the securities. The Fund is compensated by the difference between the current sales price and the lower forward price for the future purchase (often referred to as the “drop”) as well as by the interest earned on the cash proceeds of the initial sale. Dollar rolls involve the risk that the market value of the securities the Fund is obligated to repurchase under the agreement may decline below the repurchase price. Dollar rolls are speculative techniques. During the year ended November 30, 2017, the Fund had no transactions in dollar rolls.
NOTE E
Securities Lending
The Fund may enter into securities lending transactions. Under the Fund’s securities lending program, all loans of securities will be collateralized continually
| | |
| 102 | AB GLOBAL RISK ALLOCATION FUND | | abfunds.com |
NOTES TO CONSOLIDATED FINANCIAL STATEMENTS (continued)
by cash. The Fund will be compensated for the loan from a portion of the net return from the income earned on cash collateral after a rebate is paid to the borrower (in some cases, this rebate may be a “negative rebate” or fee paid by the borrower to the Fund in connection with the loan), and payments are made for fees of the securities lending agent and for certain other administrative expenses. It is the policy of the Fund to receive collateral consisting of cash in an amount exceeding the value of the securities loaned. The Fund will have the right to call a loan and obtain the securities loaned at any time on notice to the borrower within the normal and customary settlement time for the securities. While the securities are on loan, the borrower is obligated to pay the Fund amounts equal to any income or other distributions from the securities. The Fund will not be able to exercise voting rights with respect to any securities during the existence of a loan, but will have the right to regain ownership of loaned securities in order to exercise voting or other ownership rights. The lending agent has agreed to indemnify the Fund in the case of default of any securities borrower. Collateral received and securities loaned are marked to market daily to ensure that the securities loaned are secured by collateral. The lending agent currently invests the cash collateral received in Government Money Market Portfolio, an eligible money market vehicle, in accordance with the investment restrictions of the Fund, and as approved by the Board. The collateral received on securities loaned is recorded as an asset as well as a corresponding liability in the consolidated statement of assets and liabilities. When the Fund lends securities, its investment performance will continue to reflect changes in the value of the securities loaned. At November 30, 2017, the Fund had securities on loan with a value of $1,278,886 and had received cash collateral which has been invested into Government Money Market Portfolio of $1,332,435. The cash collateral will be adjusted on the next business day to maintain the required collateral amount. The Fund earned securities lending income of $0 and $13,080 from the borrowers and Government Money Market Portfolio, respectively, for the year ended November 30, 2017; these amounts are reflected in the consolidated statement of operations. In connection with the cash collateral investment by the Fund in the Government Money Market Portfolio, the Adviser has agreed to waive a portion of the Fund’s share of the advisory fees of Government Money Market Portfolio, as borne indirectly by the Fund as an acquired fund fee and expense. For the year ended November 30, 2017, such waiver amounted to $3,581. A principal risk of lending portfolio securities is that the borrower may fail to return the loaned securities upon termination of the loan and that the collateral will not be sufficient to replace the loaned securities.
| | |
| abfunds.com | | AB GLOBAL RISK ALLOCATION FUND | 103 |
NOTES TO CONSOLIDATED FINANCIAL STATEMENTS (continued)
NOTE F
Capital Stock
Each class consists of 3,000,000,000 authorized shares. Transactions in capital shares for each class were as follows:
| | | | | | | | | | | | | | | | | | | | | | | | |
| | | | | | | | | | | | | | | | | | | | | | | | |
| | | Shares | | | | | | Amount | | | | |
| | | Year Ended
November 30,
2017 | | | Year Ended
November 30,
2016 | | | | | | Year Ended
November 30,
2017 | | | Year Ended
November 30,
2016 | | | | |
| | | | | | | | |
| Class A | | | | | | | | | | | | | | | | | | | | | | | | |
Shares sold | | | 608,371 | | | | 489,236 | | | | | | | $ | 9,693,114 | | | $ | 7,396,811 | | | | | |
| | | | | |
Shares issued in reinvestment of dividends | | | 727,436 | | | | 10,093 | | | | | | | | 10,926,083 | | | | 151,290 | | | | | |
| | | | | |
Shares converted from Class B | | | 67,717 | | | | 120,858 | | | | | | | | 1,074,933 | | | | 1,815,343 | | | | | |
| | | | | |
Shares converted from Class C | | | 1,469,724 | | | | – 0 | – | | | | | | | 23,298,593 | | | | – 0 | – | | | | |
| | | | | |
Shares redeemed | | | (2,779,539 | ) | | | (3,687,023 | ) | | | | | | | (44,282,607 | ) | | | (55,901,878 | ) | | | | |
| | | | | |
Net increase (decrease) | | | 93,709 | | | | (3,066,836 | ) | | | | | | $ | 710,116 | | | $ | (46,538,434 | ) | | | | |
| | | | | |
| | | | | | | | | | | | | | | | | | | | | | | | |
| Class B | | | | | | | | | | | | | | | | | | | | | | | | |
Shares sold | | | 14,235 | | | | 16,866 | | | | | | | $ | 205,717 | | | $ | 232,023 | | | | | |
| | | | | |
Shares issued in reinvestment of dividends | | | 12,557 | | | | – 0 | – | | | | | | | 171,656 | | | | – 0 | – | | | | |
| | | | | |
Shares converted to Class A | | | (74,654 | ) | | | (132,695 | ) | | | | | | | (1,074,933 | ) | | | (1,815,343 | ) | | | | |
| | | | | |
Shares redeemed | | | (34,173 | ) | | | (59,593 | ) | | | | | | | (492,420 | ) | | | (814,791 | ) | | | | |
| | | | | |
Net decrease | | | (82,035 | ) | | | (175,422 | ) | | | | | | $ | (1,189,980 | ) | | $ | (2,398,111 | ) | | | | |
| | | | | |
| | | | | | | | | | | | | | | | | | | | | | | | |
| Class C | | | | | | | | | | | | | | | | | | | | | | | | |
Shares sold | | | 47,516 | | | | 72,560 | | | | | | | $ | 691,927 | | | $ | 994,049 | | | | | |
| | | | | |
Shares issued in reinvestment of dividends | | | 122,968 | | | | – 0 | – | | | | | | | 1,684,665 | | | | – 0 | – | | | | |
| | | | | |
Shares converted to Class A | | | (1,616,943 | ) | | | – 0 | – | | | | | | | (23,298,593 | ) | | | – 0 | – | | | | |
| | | | | |
Shares redeemed | | | (595,661 | ) | | | (832,317 | ) | | | | | | | (8,546,258 | ) | | | (11,474,076 | ) | | | | |
| | | | | |
Net decrease | | | (2,042,120 | ) | | | (759,757 | ) | | | | | | $ | (29,468,259 | ) | | $ | (10,480,027 | ) | | | | |
| | | | | |
| | | | | | | | | | | | | | | | | | | | | | | | |
| Advisor Class | | | | | | | | | | | | | | | | | | | | | | | | |
Shares sold | | | 600,033 | | | | 238,576 | | | | | | | $ | 9,643,985 | | | $ | 3,688,037 | | | | | |
| | | | | |
Shares issued in reinvestment of dividends | | | 40,167 | | | | 2,341 | | | | | | | | 607,725 | | | | 35,351 | | | | | |
| | | | | |
Shares redeemed | | | (436,588 | ) | | | (940,434 | ) | | | | | | | (7,018,969 | ) | | | (14,105,621 | ) | | | | |
| | | | | |
Net increase (decrease) | | | 203,612 | | | | (699,517 | ) | | | | | | $ | 3,232,741 | | | $ | (10,382,233 | ) | | | | |
| | | | | |
| | |
| 104 | AB GLOBAL RISK ALLOCATION FUND | | abfunds.com |
NOTES TO CONSOLIDATED FINANCIAL STATEMENTS (continued)
| | | | | | | | | | | | | | | | | | | | | | | | |
| | | | | | | | | | | | | | | | | | | | | | | | |
| | | Shares | | | | | | Amount | | | | |
| | | Year Ended
November 30,
2017 | | | Year Ended
November 30,
2016 | | | | | | Year Ended
November 30,
2017 | | | Year Ended
November 30,
2016 | | | | |
| | | | | | | | |
| Class R | | | | | | | | | | | | | | | | | | | | | | | | |
Shares sold | | | 25,778 | | | | 54,770 | | | | | | | $ | 404,415 | | | $ | 825,333 | | | | | |
| | | | | |
Shares issued in reinvestment of dividends | | | 8,849 | | | | – 0 | – | | | | | | | 132,111 | | | | – 0 | – | | | | |
| | | | | |
Shares redeemed | | | (58,117 | ) | | | (158,963 | ) | | | | | | | (919,801 | ) | | | (2,460,799 | ) | | | | |
| | | | | |
Net decrease | | | (23,490 | ) | | | (104,193 | ) | | | | | | $ | (383,275 | ) | | $ | (1,635,466 | ) | | | | |
| | | | | |
| | | | | | | | | | | | | | | | | | | | | | | | |
| Class K | | | | | | | | | | | | | | | | | | | | | | | | |
Shares sold | | | 15,073 | | | | 22,149 | | | | | | | $ | 238,007 | | | $ | 333,135 | | | | | |
| | | | | |
Shares issued in reinvestment of dividends | | | 5,164 | | | | 76 | | | | | | | | 77,410 | | | | 1,139 | | | | | |
| | | | | |
Shares redeemed | | | (59,373 | ) | | | (34,549 | ) | | | | | | | (936,549 | ) | | | (513,846 | ) | | | | |
| | | | | |
Net decrease | | | (39,136 | ) | | | (12,324 | ) | | | | | | $ | (621,132 | ) | | $ | (179,572 | ) | | | | |
| | | | | |
| | | | | | | | | | | | | | | | | | | | | | | | |
| Class I | | | | | | | | | | | | | | | | | | | | | | | | |
Shares sold | | | 20,482 | | | | 139,695 | | | | | | | $ | 332,209 | | | $ | 2,095,794 | | | | | |
| | | | | |
Shares issued in reinvestment of dividends | | | 8,768 | | | | 61 | | | | | | | | 132,487 | | | | 918 | | | | | |
| | | | | |
Shares redeemed | | | (22,449 | ) | | | (26,686 | ) | | | | | | | (361,851 | ) | | | (404,889 | ) | | | | |
| | | | | |
Net increase | | | 6,801 | | | | 113,070 | | | | | | | $ | 102,845 | | | $ | 1,691,823 | | | | | |
| | | | | |
For the year ended November 30, 2017, the Fund recorded $43,921 related to a third party’s settlement of regulatory proceedings. This amount is presented in the Fund’s statement of changes in net assets. Neither the Fund nor its affiliates were involved in the proceedings or the calculation of the payment.
NOTE G
Risks Involved in Investing in the Fund
Allocation Risk—The allocation of investments among asset classes may have a significant effect on the Fund’s net asset value, or NAV, when the asset classes in which the Fund’s has invested more heavily perform worse than the asset classes invested in less heavily.
Interest Rate Risk and Credit Risk—Interest rate risk is the risk that changes in interest rates will affect the value of the Fund’s investments in fixed-income debt securities such as bonds or notes. Increases in interest rates may cause the value of the Fund’s investments to decline. Credit risk is the risk that the issuer or guarantor of a debt security, or the counterparty to a derivative contract, will be unable or unwilling to make timely principal and/or interest payments, or to otherwise honor its obligations. The degree of risk for a particular security may be reflected in its credit
| | |
| abfunds.com | | AB GLOBAL RISK ALLOCATION FUND | 105 |
NOTES TO CONSOLIDATED FINANCIAL STATEMENTS (continued)
rating. Credit risk is greater for medium quality and lower-rated securities. Lower-rated debt securities and similar unrated securities (commonly known as “junk bonds”) have speculative elements or are predominantly speculative risks.
Commodity Risk—Investing in commodities and commodity-linked derivative instruments, either directly or through the Subsidiary, may subject the Fund to greater volatility than investments in traditional securities. The value of commodity-linked derivative instruments may be affected by changes in overall market movements, commodity index volatility, changes in interest rates, or factors affecting a particular industry or commodity, such as drought, floods, weather, livestock disease, embargoes, tariffs and international economic, political and regulatory developments.
Below Investment Grade Securities Risk—Investments in fixed-income securities with ratings below investment grade, commonly known as “junk bonds”, tend to have a higher probability that an issuer will default or fail to meet its payment obligations. These securities may be subject to greater price volatility due to such factors as specific corporate developments, interest rate sensitivity, negative perceptions of the junk bond market generally and less secondary market liquidity.
Foreign (Non-U.S.) Risk—Investments in securities of non-U.S. issuers may involve more risk than those of U.S. issuers. These securities may fluctuate more widely in price and may be less liquid due to adverse market, economic, political, regulatory or other factors.
Currency Risk—Fluctuations in currency exchange rates may negatively affect the value of the Fund’s investments or reduce its returns.
Emerging Market Risk—Investments in emerging market countries may have more risk because the markets are less developed and less liquid as well as being subject to increased economic, political, regulatory or other uncertainties.
Subsidiary Risk—By investing in the Subsidiary, the Fund is indirectly exposed to the risks associated with the Subsidiary. The derivatives and other investments held by the Subsidiary are generally similar to those that are permitted to be held by the Fund and are subject to the same risks that apply to similar investments if held directly by the Fund. The Subsidiary is not registered under the Investment Company Act of 1940, as amended (the “1940 Act”), and, unless otherwise noted in the Fund’s prospectus, is not subject to all of the investor protections of the 1940 Act. However, the Fund wholly owns and controls the Subsidiary, and the Fund and the Subsidiary are managed by the Adviser, making it unlikely the
| | |
| 106 | AB GLOBAL RISK ALLOCATION FUND | | abfunds.com |
NOTES TO CONSOLIDATED FINANCIAL STATEMENTS (continued)
Subsidiary will take actions contrary to the interests of the Fund or its shareholders. In addition, changes in federal tax laws applicable to the Fund or interpretations thereof could limit the Fund’s ability to gain exposure to commodities investments through investments in the Subsidiary.
Derivatives Risk—The Fund may enter into derivative transactions such as forwards, options, futures and swaps. Derivatives may be illiquid, difficult to price, and leveraged so that small changes may produce disproportionate losses for the Fund, and subject to counterparty risk to a greater degree than more traditional investments. Derivatives may result in significant losses, including losses that are far greater than the value of the derivatives reflected on the consolidated statement of assets and liabilities.
Leverage Risk—When the Fund borrows money or otherwise leverages its investments, its performance may be volatile because leverage tends to exaggerate the effect of any increase or decrease in the value of the Fund’s investments. The Fund may create leverage through the use of reverse repurchase arrangements, forward currency exchange contracts, forward commitments, dollar rolls or futures or by borrowing money. The use of other types of derivative instruments by the Fund, such as options and swaps, may also result in a form of leverage. Leverage may result in higher returns to the Fund than if the Fund were not leveraged, but may also adversely affect returns, particularly if the market is declining.
Indemnification Risk—In the ordinary course of business, the Fund enters into contracts that contain a variety of indemnifications. The Fund’s maximum exposure under these arrangements is unknown. However, the Fund has not had prior claims or losses pursuant to these indemnification provisions and expects the risk of loss thereunder to be remote. Therefore, the Fund has not accrued any liability in connection with these indemnification provisions.
NOTE H
Joint Credit Facility
A number of open-end mutual funds managed by the Adviser, including the Fund, participate in a $280 million revolving credit facility (the “Facility”) intended to provide short-term financing, if necessary, subject to certain restrictions in connection with abnormal redemption activity. Commitment fees related to the Facility are paid by the participating funds and are included in miscellaneous expenses in the consolidated statement of operations. The Fund did not utilize the Facility during the year ended November 30, 2017.
| | |
| abfunds.com | | AB GLOBAL RISK ALLOCATION FUND | 107 |
NOTES TO CONSOLIDATED FINANCIAL STATEMENTS (continued)
NOTE I
Distributions to Shareholders
The tax character of distributions paid during the fiscal year ended November 30, 2017 and the period ended November 30, 2016 were as follows:
| | | | | | | | |
| | | 2017 | | | 2016 | |
Distributions paid from: | | | | | | | | |
Ordinary income | | $ | 15,360,002 | | | $ | 205,901 | |
| | | | | | | | |
Total distributions paid | | $ | 15,360,002 | | | $ | 205,901 | |
| | | | | | | | |
As of November 30, 2017, the components of accumulated earnings/(deficit) on a tax basis were as follows:
| | | | |
Undistributed ordinary income | | $ | 8,120,564 | |
Accumulated capital and other losses | | | (2,796,717 | )(a) |
Unrealized appreciation/(depreciation) | | | (2,375,812 | )(b) |
| | | | |
Total accumulated earnings/(deficit) | | $ | 2,948,035 | |
| | | | |
| (a) | As of November 30, 2017, the Fund had a net capital loss carryforward of $2,796,717. During the fiscal year, the Fund utilized $13,912,005 of capital loss carry forwards to offset current year net realized gains. |
| (b) | The differences between book-basis and tax-basis unrealized appreciation/(depreciation) are attributable primarily to the tax deferral of losses on wash sales, the tax treatment of swaps, passive foreign investment companies (PFICs), partnership investments, the recognition for tax purposes of unrealized gains/losses on certain derivative instruments, the tax treatment of earnings from the Subsidiary, and corporate restructuring. |
For tax purposes, net realized capital losses may be carried over to offset future capital gains, if any. Funds are permitted to carry forward capital losses for an indefinite period, and such losses will retain their character as either short-term or long-term capital losses. As of November 30, 2017, the Fund had a net short-term capital loss carryforward of $2,623,591 and a net long-term capital loss carryforward of $173,126, which may be carried forward for an indefinite period.
During the current fiscal year, permanent differences primarily due to the tax treatment of swaps, passive foreign investment companies (PFICs), partnership investments, foreign currency reclassifications, paydown gain/loss reclassifications, and book/tax differences associated with the treatment of earnings from the Subsidiary, resulted in a net decrease in distributions in excess of net investment income, a net increase in accumulated net realized loss on investment and foreign currency transactions, and a net increase in additional paid-in capital. These reclassifications had no effect on net assets.
| | |
| 108 | AB GLOBAL RISK ALLOCATION FUND | | abfunds.com |
NOTES TO CONSOLIDATED FINANCIAL STATEMENTS (continued)
NOTE J
Recent Accounting Pronouncements
In March 2017, the Financial Accounting Standards Board issued an Accounting Standards Update, ASU 2017-08, Receivables—Nonrefundable Fees and Other Costs (Subtopic 310-20), Premium Amortization on Purchased Callable Debt Securities (the “ASU”) which amends the amortization period for certain purchased callable debt securities held at a premium, shortening such period to the earliest call date. The ASU does not require any accounting change for debt securities held at a discount; the discount continues to be amortized to maturity. The ASU is effective for fiscal years, and interim periods within those fiscal years, beginning after December 15, 2018. At this time, management is evaluating the implications of these changes on the consolidated financial statements.
NOTE K
Subsequent Events
Management has evaluated subsequent events for possible recognition or disclosure in the consolidated financial statements through the date the consolidated financial statements are issued. Management has determined that there are no material events that would require disclosure in the Fund’s consolidated financial statements through this date.
| | |
| abfunds.com | | AB GLOBAL RISK ALLOCATION FUND | 109 |
CONSOLIDATED FINANCIAL HIGHLIGHTS
Selected Data For A Share Of Capital Stock Outstanding Throughout Each Period
| | | | | | | | | | | | | | | | | | | | |
| | | Class A | |
| | | Year Ended November 30, | |
| | | 2017 | | | 2016 | | | 2015 | | | 2014 | | | 2013 | |
| | | | |
| | | | | | | | | | | | | | | | | | | | |
Net asset value, beginning of period | | | $ 15.79 | | | | $ 15.29 | | | | $ 17.54 | | | | $ 16.48 | | | | $ 17.72 | |
| | | | |
Income From Investment Operations | | | | | | | | | | | | | | | | | | | | |
Net investment income(a) | | | .13 | (b) | | | .15 | (b)† | | | .16 | | | | .21 | | | | .10 | |
Net realized and unrealized gain (loss) on investment and foreign currency transactions | | | 1.67 | | | | .36 | | | | (.60 | ) | | | 1.11 | | | | (.02 | ) |
Contributions from Adviser | | | .00 | (c) | | | .00 | (c) | | | .01 | | | | – 0 | – | | | .01 | |
Capital Contributions | | | .00 | (c) | | | – 0 | – | | | – 0 | – | | | – 0 | – | | | – 0 | – |
| | | | |
Net increase (decrease) in net asset value from operations | | | 1.80 | | | | .51 | | | | (.43 | ) | | | 1.32 | | | | .09 | |
| | | | |
Less: Dividends and Distributions | | | | | | | | | | | | | | | | | | | | |
Dividends from net investment income | | | (.84 | ) | | | (.01 | ) | | | (1.10 | ) | | | – 0 | – | | | (.15 | ) |
Distributions from net realized gain on investment transactions | | | – 0 | – | | | – 0 | – | | | (.48 | ) | | | (.26 | ) | | | (1.18 | ) |
Tax return of capital | | | – 0 | – | | | – 0 | – | | | (.24 | ) | | | – 0 | – | | | – 0 | – |
| | | | |
Total dividends and distributions | | | (.84 | ) | | | (.01 | ) | | | (1.82 | ) | | | (.26 | ) | | | (1.33 | ) |
| | | | |
Net asset value, end of period | | | $ 16.75 | | | | $ 15.79 | | | | $ 15.29 | | | | $ 17.54 | | | | $ 16.48 | |
| | | | |
Total Return | | | | | | | | | | | | | | | | | | | | |
Total investment return based on net asset value(d)*# | | | 12.00 | % | | | 3.34 | %† | | | (2.56 | )%(e) | | | 8.14 | % | | | .57 | % |
Ratios/Supplemental Data | | | | | | | | | | | | | | | | | | | | |
Net assets, end of period (000’s omitted) | | | $243,518 | | | | $228,036 | | | | $267,703 | | | | $304,092 | | | | $330,368 | |
Ratio to average net assets of: | | | | | | | | | | | | | | | | | | | | |
Expenses, net of waivers/reimbursements(f)(g) | | | 1.29 | % | | | 1.28 | % | | | 1.28 | % | | | 1.28 | % | | | 1.17 | % |
Expenses, before waivers/reimbursements(f)(g) | | | 1.30 | % | | | 1.30 | % | | | 1.28 | % | | | 1.28 | % | | | 1.17 | % |
Net investment income | | | .79 | %(b) | | | .96 | %(b)† | | | 1.01 | % | | | 1.25 | % | | | .58 | % |
Portfolio turnover rate | | | 30 | % | | | 79 | % | | | 250 | % | | | 96 | % | | | 158 | %** |
See footnote summary on page 117.
| | |
| 110 | AB GLOBAL RISK ALLOCATION FUND | | abfunds.com |
CONSOLIDATED FINANCIAL HIGHLIGHTS (continued)
Selected Data For A Share Of Capital Stock Outstanding Throughout Each Period
| | | | | | | | | | | | | | | | | | | | |
| | | Class B | |
| | | Year Ended November 30, | |
| | | 2017 | | | 2016 | | | 2015 | | | 2014 | | | 2013 | |
| | | | |
| | | | | | | | | | | | | | | | | | | | |
Net asset value, beginning of period | | | $ 14.32 | | | | $ 13.96 | | | | $ 16.13 | | | | $ 15.29 | | | | $ 16.57 | |
| | | | |
Income From Investment Operations | | | | | | | | | | | | | | | | | | | | |
Net investment income (loss)(a) | | | (.02 | )(b) | | | – 0 | –(b)(c)† | | | .01 | | | | .08 | | | | (.03 | ) |
Net realized and unrealized gain (loss) on investment and foreign currency transactions | | | 1.54 | | | | .36 | | | | (.52 | ) | | | 1.02 | | | | .00 | (c) |
Contributions from Adviser | | | .00 | (c) | | | .00 | (c) | | | .01 | | | | – 0 | – | | | .01 | |
Capital Contributions | | | .00 | (c) | | | – 0 | – | | | – 0 | – | | | – 0 | – | | | – 0 | – |
| | | | |
Net increase (decrease) in net asset value from operations | | | 1.52 | | | | .36 | | | | (.50 | ) | | | 1.10 | | | | (.02 | ) |
| | | | |
Less: Dividends and Distributions | | | | | | | | | | | | | | | | | | | | |
Dividends from net investment income | | | (.71 | ) | | | – 0 | – | | | (.95 | ) | | | – 0 | – | | | (.08 | ) |
Distributions from net realized gain on investment transactions | | | – 0 | – | | | – 0 | – | | | (.48 | ) | | | (.26 | ) | | | (1.18 | ) |
Tax return of capital | | | – 0 | – | | | – 0 | – | | | (.24 | ) | | | – 0 | – | | | – 0 | – |
| | | | |
Total dividends and distributions | | | (.71 | ) | | | – 0 | – | | | (1.67 | ) | | | (.26 | ) | | | (1.26 | ) |
| | | | |
Net asset value, end of period | | | $ 15.13 | | | | $ 14.32 | | | | $ 13.96 | | | | $ 16.13 | | | | $ 15.29 | |
| | | | |
Total Return | | | | | | | | | | | | | | | | | | | | |
Total investment return based on net asset value(d)*# | | | 11.12 | % | | | 2.58 | %† | | | (3.30 | )%(e) | | | 7.32 | % | | | (.12 | )% |
Ratios/Supplemental Data | | | | | | | | | | | | | | | | | | | | |
Net assets, end of period (000’s omitted) | | | $2,643 | | | | $3,676 | | | | $6,033 | | | | $11,730 | | | | $18,652 | |
Ratio to average net assets of: | | | | | | | | | | | | | | | | | | | | |
Expenses, net of waivers/reimbursements(f)(g) | | | 2.08 | % | | | 2.04 | % | | | 2.05 | % | | | 2.01 | % | | | 1.89 | % |
Expenses, before waivers/reimbursements(f)(g) | | | 2.10 | % | | | 2.06 | % | | | 2.05 | % | | | 2.01 | % | | | 1.89 | % |
Net investment income (loss) | | | (.16 | )%(b) | | | .01 | %(b)† | | | .10 | % | | | .54 | % | | | (.21 | )% |
Portfolio turnover rate | | | 30 | % | | | 79 | % | | | 250 | % | | | 96 | % | | | 158 | %** |
See footnote summary on page 117.
| | |
| abfunds.com | | AB GLOBAL RISK ALLOCATION FUND | 111 |
CONSOLIDATED FINANCIAL HIGHLIGHTS (continued)
Selected Data For A Share Of Capital Stock Outstanding Throughout Each Period
| | | | | | | | | | | | | | | | | | | | |
| | | Class C | |
| | | Year Ended November 30, | |
| | | 2017 | | | 2016 | | | 2015 | | | 2014 | | | 2013 | |
| | | | |
| | | | | | | | | | | | | | | | | | | | |
Net asset value, beginning of period | | | $ 14.37 | | | | $ 14.01 | | | | $ 16.22 | | | | $ 15.37 | | | | $ 16.66 | |
| | | | |
Income From Investment Operations | | | | | | | | | | | | | | | | | | | | |
Net investment income (loss)(a) | | | (.07 | )(b) | | | .03 | (b)† | | | .04 | | | | .08 | | | | (.02 | ) |
Net realized and unrealized gain (loss) on investment and foreign currency transactions | | | 1.60 | | | | .33 | | | | (.55 | ) | | | 1.03 | | | | (.01 | ) |
Contributions from Adviser | | | .00 | (c) | | | .00 | (c) | | | .01 | | | | – 0 | – | | | .01 | |
Capital Contributions | | | .00 | (c) | | | – 0 | – | | | – 0 | – | | | – 0 | – | | | – 0 | – |
| | | | |
Net increase (decrease) in net asset value from operations | | | 1.53 | | | | .36 | | | | (.50 | ) | | | 1.11 | | | | (.02 | ) |
| | | | |
Less: Dividends and Distributions | | | | | | | | | | | | | | | | | | | | |
Dividends from net investment income | | | (.73 | ) | | | – 0 | – | | | (.99 | ) | | | – 0 | – | | | (.09 | ) |
Distributions from net realized gain on investment transactions | | | – 0 | – | | | – 0 | – | | | (.48 | ) | | | (.26 | ) | | | (1.18 | ) |
Tax return of capital | | | – 0 | – | | | – 0 | – | | | (.24 | ) | | | – 0 | – | | | – 0 | – |
| | | | |
Total dividends and distributions | | | (.73 | ) | | | – 0 | – | | | (1.71 | ) | | | (.26 | ) | | | (1.27 | ) |
| | | | |
Net asset value, end of period | | | $ 15.17 | | | | $ 14.37 | | | | $ 14.01 | | | | $ 16.22 | | | | $ 15.37 | |
| | | | |
Total Return | | | | | | | | | | | | | | | | | | | | |
Total investment return based on net asset value(d)*# | | | 11.18 | % | | | 2.57 | %† | | | (3.27 | )%(e) | | | 7.35 | % | | | (.12 | )% |
Ratios/Supplemental Data | | | | | | | | | | | | | | | | | | | | |
Net assets, end of period (000’s omitted) | | | $12,188 | | | | $40,885 | | | | $50,508 | | | | $57,567 | | | | $60,336 | |
Ratio to average net assets of: | | | | | | | | | | | | | | | | | | | | |
Expenses, net of waivers/reimbursements(f)(g) | | | 2.05 | % | | | 2.03 | % | | | 2.02 | % | | | 2.00 | % | | | 1.89 | % |
Expenses, before waivers/reimbursements(f)(g) | | | 2.06 | % | | | 2.05 | % | | | 2.02 | % | | | 2.00 | % | | | 1.89 | % |
Net investment income (loss) | | | (.46 | )%(b) | | | .18 | %(b)† | | | .26 | % | | | .53 | % | | | (.14 | )% |
Portfolio turnover rate | | | 30 | % | | | 79 | % | | | 250 | % | | | 96 | % | | | 158 | %** |
See footnote summary on page 117.
| | |
| 112 | AB GLOBAL RISK ALLOCATION FUND | | abfunds.com |
CONSOLIDATED FINANCIAL HIGHLIGHTS (continued)
Selected Data For A Share Of Capital Stock Outstanding Throughout Each Period
| | | | | | | | | | | | | | | | | | | | |
| | | Advisor Class | |
| | | Year Ended November 30, | |
| | | 2017 | | | 2016 | | | 2015 | | | 2014 | | | 2013 | |
| | | | |
| | | | | | | | | | | | | | | | | | | | |
Net asset value, beginning of period | | | $ 15.94 | | | | $ 15.41 | | | | $ 17.67 | | | | $ 16.55 | | | | $ 17.77 | |
| | | | |
Income From Investment Operations | | | | | | | | | | | | | | | | | | | | |
Net investment income(a) | | | .19 | (b) | | | .16 | (b)† | | | .21 | | | | .21 | | | | .14 | |
Net realized and unrealized gain (loss) on investment and foreign currency transactions | | | 1.67 | | | | .40 | | | | (.61 | ) | | | 1.17 | | | | (.02 | ) |
Contributions from Adviser | | | .00 | (c) | | | .00 | (c) | | | .01 | | | | – 0 | – | | | .02 | |
Capital Contributions | | | .00 | (c) | | | – 0 | – | | | – 0 | – | | | – 0 | – | | | – 0 | – |
| | | | |
Net increase (decrease) in net asset value from operations | | | 1.86 | | | | .56 | | | | (.39 | ) | | | 1.38 | | | | .14 | |
| | | | |
Less: Dividends and Distributions | | | | | | | | | | | | | | | | | | | | |
Dividends from net investment income | | | (.88 | ) | | | (.03 | ) | | | (1.15 | ) | | | – 0 | – | | | (.18 | ) |
Distributions from net realized gain on investment transactions | | | – 0 | – | | | – 0 | – | | | (.48 | ) | | | (.26 | ) | | | (1.18 | ) |
Tax return of capital | | | – 0 | – | | | – 0 | – | | | (.24 | ) | | | – 0 | – | | | – 0 | – |
| | | | |
Total dividends and distributions | | | (.88 | ) | | | (.03 | ) | | | (1.87 | ) | | | (.26 | ) | | | (1.36 | ) |
| | | | |
Net asset value, end of period | | | $ 16.92 | | | | $ 15.94 | | | | $ 15.41 | | | | $ 17.67 | | | | $ 16.55 | |
| | | | |
Total Return | | | | | | | | | | | | | | | | | | | | |
Total investment return based on net asset value(d)*# | | | 12.38 | % | | | 3.55 | %† | | | (2.27 | )%(e) | | | 8.41 | % | | | .86 | % |
Ratios/Supplemental Data | | | | | | | | | | | | | | | | | | | | |
Net assets, end of period (000’s omitted) | | | $17,200 | | | | $12,960 | | | | $23,311 | | | | $20,893 | | | | $22,933 | |
Ratio to average net assets of: | | | | | | | | | | | | | | | | | | | | |
Expenses, net of waivers/reimbursements(f)(g) | | | 1.04 | % | | | 1.03 | % | | | 1.02 | % | | | 1.00 | % | | | .88 | % |
Expenses, before waivers/reimbursements(f)(g) | | | 1.05 | % | | | 1.05 | % | | | 1.02 | % | | | 1.00 | % | | | .88 | % |
Net investment income | | | 1.19 | %(b) | | | 1.06 | %(b)† | | | 1.34 | % | | | 1.25 | % | | | .85 | % |
Portfolio turnover rate | | | 30 | % | | | 79 | % | | | 250 | % | | | 96 | % | | | 158 | %** |
See footnote summary on page 117.
| | |
| abfunds.com | | AB GLOBAL RISK ALLOCATION FUND | 113 |
CONSOLIDATED FINANCIAL HIGHLIGHTS (continued)
Selected Data For A Share Of Capital Stock Outstanding Throughout Each Period
| | | | | | | | | | | | | | | | | | | | |
| | | Class R | |
| | | Year Ended November 30, | |
| | | 2017 | | | 2016 | | | 2015 | | | 2014 | | | 2013 | |
| | | | |
| | | | | | | | | | | | | | | | | | | | |
Net asset value, beginning of period | | | $ 15.61 | | | | $ 15.15 | | | | $ 17.40 | | | | $ 16.40 | | | | $ 17.66 | |
| | | | |
Income From Investment Operations | | | | | | | | | | | | | | | | | | | | |
Net investment income(a) | | | .06 | (b) | | | .06 | (b)† | | | .11 | | | | .16 | | | | .04 | |
Net realized and unrealized gain (loss) on investment and foreign currency transactions | | | 1.67 | | | | .40 | | | | (.60 | ) | | | 1.10 | | | | (.02 | ) |
Contributions from Adviser | | | .00 | (c) | | | .00 | (c) | | | .01 | | | | – 0 | – | | | .02 | |
Capital Contributions | | | .00 | (c) | | | – 0 | – | | | – 0 | – | | | – 0 | – | | | – 0 | – |
| | | | |
Net increase (decrease) in net asset value from operations | | | 1.73 | | | | .46 | | | | (.48 | ) | | | 1.26 | | | | .04 | |
| | | | |
Less: Dividends and Distributions | | | | | | | | | | | | | | | | | | | | |
Dividends from net investment income | | | (.75 | ) | | | – 0 | – | | | (1.05 | ) | | | – 0 | – | | | (.12 | ) |
Distributions from net realized gain on investment transactions | | | – 0 | – | | | – 0 | – | | | (.48 | ) | | | (.26 | ) | | | (1.18 | ) |
Tax return of capital | | | – 0 | – | | | – 0 | – | | | (.24 | ) | | | – 0 | – | | | – 0 | – |
| | | | |
Total dividends and distributions | | | (.75 | ) | | | – 0 | – | | | (1.77 | ) | | | (.26 | ) | | | (1.30 | ) |
| | | | |
Net asset value, end of period | | | $ 16.59 | | | | $ 15.61 | | | | $ 15.15 | | | | $ 17.40 | | | | $ 16.40 | |
| | | | |
Total Return | | | | | | | | | | | | | | | | | | | | |
Total investment return based on net asset value(d)*# | | | 11.63 | % | | | 3.04 | %† | | | (2.84 | )%(e) | | | 7.75 | % | | | .29 | % |
Ratios/Supplemental Data | | | | | | | | | | | | | | | | | | | | |
Net assets, end of period (000’s omitted) | | | $2,526 | | | | $2,743 | | | | $4,241 | | | | $4,523 | | | | $3,676 | |
Ratio to average net assets of: | | | | | | | | | | | | | | | | | | | | |
Expenses, net of waivers/reimbursements(f)(g) | | | 1.63 | % | | | 1.61 | % | | | 1.61 | % | | | 1.59 | % | | | 1.46 | % |
Expenses, before waivers/reimbursements(f)(g) | | | 1.64 | % | | | 1.62 | % | | | 1.61 | % | | | 1.59 | % | | | 1.46 | % |
Net investment income | | | .36 | %(b) | | | .41 | %(b)† | | | .69 | % | | | .95 | % | | | .23 | % |
Portfolio turnover rate | | | 30 | % | | | 79 | % | | | 250 | % | | | 96 | % | | | 158 | %** |
See footnote summary on page 117.
| | |
| 114 | AB GLOBAL RISK ALLOCATION FUND | | abfunds.com |
CONSOLIDATED FINANCIAL HIGHLIGHTS (continued)
Selected Data For A Share Of Capital Stock Outstanding Throughout Each Period
| | | | | | | | | | | | | | | | | | | | |
| | | Class K | |
| | | Year Ended November 30, | |
| | | 2017 | | | 2016 | | | 2015 | | | 2014 | | | 2013 | |
| | | | |
| | | | | | | | | | | | | | | | | | | | |
Net asset value, beginning of period | | | $ 15.75 | | | | $ 15.25 | | | | $ 17.50 | | | | $ 16.45 | | | | $ 17.68 | |
| | | | |
Income From Investment Operations | | | | | | | | | | | | | | | | | | | | |
Net investment income(a) | | | .10 | (b) | | | .15 | (b)† | | | .16 | | | | .21 | | | | .09 | |
Net realized and unrealized gain (loss) on investment and foreign currency transactions | | | 1.68 | | | | .36 | | | | (.59 | ) | | | 1.10 | | | | .00 | (c) |
Contributions from Adviser | | | .00 | (c) | | | .00 | (c) | | | .01 | | | | – 0 | – | | | .01 | |
Capital Contributions | | | .00 | (c) | | | – 0 | – | | | – 0 | – | | | – 0 | – | | | – 0 | – |
| | | | |
Net increase (decrease) in net asset value from operations | | | 1.78 | | | | .51 | | | | (.42 | ) | | | 1.31 | | | | .10 | |
| | | | |
Less: Dividends and Distributions | | | | | | | | | | | | | | | | | | | | |
Dividends from net investment income | | | (.82 | ) | | | (.01 | ) | | | (1.11 | ) | | | – 0 | – | | | (.15 | ) |
Distributions from net realized gain on investment transactions | | | – 0 | – | | | – 0 | – | | | (.48 | ) | | | (.26 | ) | | | (1.18 | ) |
Tax return of capital | | | – 0 | – | | | – 0 | – | | | (.24 | ) | | | – 0 | – | | | – 0 | – |
| | | | |
Total dividends and distributions | | | (.82 | ) | | | (.01 | ) | | | (1.83 | ) | | | (.26 | ) | | | (1.33 | ) |
| | | | |
Net asset value, end of period | | | $ 16.71 | | | | $ 15.75 | | | | $ 15.25 | | | | $ 17.50 | | | | $ 16.45 | |
| | | | |
Total Return | | | | | | | | | | | | | | | | | | | | |
Total investment return based on net asset value(d)*# | | | 12.00 | % | | | 3.27 | %† | | | (2.55 | )%(e) | | | 8.09 | % | | | .64 | % |
Ratios/Supplemental Data | | | | | | | | | | | | | | | | | | | | |
Net assets, end of period (000’s omitted) | | | $1,265 | | | | $1,809 | | | | $1,939 | | | | $2,098 | | | | $2,033 | |
Ratio to average net assets of: | | | | | | | | | | | | | | | | | | | | |
Expenses, net of waivers/reimbursements(f)(g) | | | 1.31 | % | | | 1.30 | % | | | 1.30 | % | | | 1.27 | % | | | 1.16 | % |
Expenses, before waivers/reimbursements(f)(g) | | | 1.33 | % | | | 1.31 | % | | | 1.30 | % | | | 1.27 | % | | | 1.16 | % |
Net investment income | | | .66 | %(b) | | | 1.00 | %(b)† | | | .99 | % | | | 1.26 | % | | | .57 | % |
Portfolio turnover rate | | | 30 | % | | | 79 | % | | | 250 | % | | | 96 | % | | | 158 | %** |
See footnote summary on page 117.
| | |
| abfunds.com | | AB GLOBAL RISK ALLOCATION FUND | 115 |
CONSOLIDATED FINANCIAL HIGHLIGHTS (continued)
Selected Data For A Share Of Capital Stock Outstanding Throughout Each Period
| | | | | | | | | | | | | | | | | | | | |
| | | Class I | |
| | | Year Ended November 30, | |
| | | 2017 | | | 2016 | | | 2015 | | | 2014 | | | 2013 | |
| | | | |
| | | | | | | | | | | | | | | | | | | | |
Net asset value, beginning of period | | | $ 15.94 | | | | $ 15.39 | | | | $ 17.66 | | | | $ 16.52 | | | | $ 17.72 | |
| | | | |
Income From Investment Operations | | | | | | | | | | | | | | | | | | | | |
Net investment income(a) | | | .18 | (b) | | | .29 | (b)† | | | .22 | | | | .27 | | | | .10 | |
Net realized and unrealized gain (loss) on investment and foreign currency transactions | | | 1.69 | | | | .30 | | | | (.60 | ) | | | 1.13 | | | | .05 | ‡ |
Contributions from Adviser | | | .00 | (c) | | | .00 | (c) | | | .01 | | | | – 0 | – | | | .01 | |
Capital Contributions | | | .00 | (c) | | | – 0 | – | | | – 0 | – | | | – 0 | – | | | – 0 | – |
| | | | |
Net increase (decrease) in net asset value from operations | | | 1.87 | | | | .59 | | | | (.37 | ) | | | 1.40 | | | | .16 | |
| | | | |
Less: Dividends and Distributions | | | | | | | | | | | | | | | | | | | | |
Dividends from net investment income | | | (.91 | ) | | | (.04 | ) | | | (1.18 | ) | | | – 0 | – | | | (.18 | ) |
Distributions from net realized gain on investment transactions | | | – 0 | – | | | – 0 | – | | | (.48 | ) | | | (.26 | ) | | | (1.18 | ) |
Tax return of capital | | | – 0 | – | | | – 0 | – | | | (.24 | ) | | | – 0 | – | | | – 0 | – |
| | | | |
Total dividends and distributions | | | (.91 | ) | | | (.04 | ) | | | (1.90 | ) | | | (.26 | ) | | | (1.36 | ) |
| | | | |
Net asset value, end of period | | | $ 16.90 | | | | $ 15.94 | | | | $ 15.39 | | | | $ 17.66 | | | | $ 16.52 | |
| | | | |
Total Return | | | | | | | | | | | | | | | | | | | | |
Total investment return based on net asset value(d)*# | | | 12.39 | % | | | 3.81 | %† | | | (2.12 | )%(e) | | | 8.55 | % | | | 1.02 | % |
Ratios/Supplemental Data | | | | | | | | | �� | | | | | | | | | | | |
Net assets, end of period (000’s omitted) | | | $2,467 | | | | $2,218 | | | | $402 | | | | $49 | | | | $84 | |
Ratio to average net assets of: | | | | | | | | | | | | | | | | | | | | |
Expenses, net of waivers/reimbursements(f)(g) | | | .93 | % | | | .86 | % | | | .91 | % | | | .83 | % | | | .71 | % |
Expenses, before waivers/reimbursements(f)(g) | | | .95 | % | | | .87 | % | | | .91 | % | | | .83 | % | | | .71 | % |
Net investment income | | | 1.14 | %(b) | | | 1.88 | %(b)† | | | 1.45 | % | | | 1.59 | % | | | .98 | % |
Portfolio turnover rate | | | 30 | % | | | 79 | % | | | 250 | % | | | 96 | % | | | 158 | %** |
See footnote summary on page 117.
| | |
| 116 | AB GLOBAL RISK ALLOCATION FUND | | abfunds.com |
CONSOLIDATED FINANCIAL HIGHLIGHTS (continued)
Selected Data For A Share Of Capital Stock Outstanding Throughout Each Period
| (a) | Based on average shares outstanding. |
| (b) | Net of fees and expenses waived/reimbursed by the Adviser. |
| (c) | Amount is less than $.005. |
| (d) | Total investment return is calculated assuming an initial investment made at the net asset value at the beginning of the period, reinvestment of all dividends and distributions at net asset value during the period, and redemption on the last day of the period. Initial sales charges or contingent deferred sales charges are not reflected in the calculation of total investment return. Total return does not reflect the deduction of taxes that a shareholder would pay on fund distributions or the redemption of fund shares. Total investment return calculated for a period of less than one year is not annualized. |
| (e) | Includes the impact of a voluntary reimbursement from the Adviser for trading losses incurred due to a trade entry error; absent of such payment, the Fund’s performance would have been reduced by 0.07% for the year ended November 30, 2015. |
| (f) | In connection with the Fund’s investments in affiliated underlying portfolios, the Fund incurs no direct expenses, but bear proportionate shares of the fees and expenses (i.e., operating, administrative and investment advisory fees) of the affiliated underlying portfolios. The Adviser has contractually agreed to waive its fees from the Fund in an amount equal to the Fund’s pro rata share of certain acquired fund fees and expenses, and for the years ended November 30, 2017 and November 30, 2016 (annualized) such waiver amounted to 0.01% and 0.02%, respectively. |
| (g) | The expense ratios presented below exclude interest expense: |
| | | | | | | | | | | | | | | | | | | | |
| | | Year Ended November 30, | |
| | | 2017 | | | 2016 | | | 2015 | | | 2014 | | | 2013 | |
Class A | |
Net of waivers/reimbursements | | | 1.29 | % | | | 1.28 | % | | | N/A | | | | N/A | | | | 1.17 | % |
Before waivers/reimbursements | | | 1.30 | % | | | 1.29 | % | | | N/A | | | | N/A | | | | 1.17 | % |
Class B | |
Net of waivers/reimbursements | | | 2.08 | % | | | 2.04 | % | | | N/A | | | | N/A | | | | 1.89 | % |
Before waivers/reimbursements | | | 2.10 | % | | | 2.06 | % | | | N/A | | | | N/A | | | | 1.89 | % |
Class C | |
Net of waivers/reimbursements | | | 2.05 | % | | | 2.03 | % | | | N/A | | | | N/A | | | | 1.88 | % |
Before waivers/reimbursements | | | 2.06 | % | | | 2.05 | % | | | N/A | | | | N/A | | | | 1.88 | % |
Advisor Class | |
Net of waivers/reimbursements | | | 1.04 | % | | | 1.03 | % | | | N/A | | | | N/A | | | | .87 | % |
Before waivers/reimbursements | | | 1.05 | % | | | 1.05 | % | | | N/A | | | | N/A | | | | .87 | % |
Class R | |
Net of waivers/reimbursements | | | 1.63 | % | | | 1.61 | % | | | N/A | | | | N/A | | | | 1.46 | % |
Before waivers/reimbursements | | | 1.64 | % | | | 1.62 | % | | | N/A | | | | N/A | | | | 1.46 | % |
Class K | |
Net of waivers/reimbursements | | | 1.31 | % | | | 1.29 | % | | | N/A | | | | N/A | | | | 1.15 | % |
Before waivers/reimbursements | | | 1.33 | % | | | 1.31 | % | | | N/A | | | | N/A | | | | 1.15 | % |
Class I | |
Net of waivers/reimbursements | | | .93 | % | | | .85 | % | | | N/A | | | | N/A | | | | .71 | % |
Before waivers/reimbursements | | | .95 | % | | | .87 | % | | | N/A | | | | N/A | | | | .71 | % |
| † | For the year ended November 30, 2016 the amount includes a refund for overbilling of prior years’ custody out of pocket fees as follows: |
| | | | | | | | |
Net Investment
Income Per Share | | Net Investment
Income Ratio | | | Total
Return | |
| $.001 | | | .06 | % | | | .06 | % |
| | |
| abfunds.com | | AB GLOBAL RISK ALLOCATION FUND | 117 |
CONSOLIDATED FINANCIAL HIGHLIGHTS (continued)
Selected Data For A Share Of Capital Stock Outstanding Throughout Each Period
| * | Includes the impact of proceeds received and credited to the Fund resulting from class action settlements, which enhanced the Fund’s performance for the years ended November 30, 2017, November 30, 2016, November 30, 2015, November 30, 2014 and November 30, 2013 by 0.81%, 0.01%, 0.08%, 0.06% and 0.04%, respectively. |
| | Includes the impact of proceeds received and credited to the Fund resulting from a third party regulatory settlement, which enhanced the Fund’s performance for the year ended November 30, 2017 by .02%. |
| # | The net asset value and total return include adjustments in accordance with accounting principles generally accepted in the United States of America for financial reporting purposes. As such, the net asset value and total return for shareholder transactions may differ from financial statements. |
| ** | The Fund accounts for dollar roll transactions as purchases and sales. |
| ‡ | Due to timing of sales and repurchase of capital shares, the net realized and unrealized gain (loss) per share is not in accord with the Fund’s change in net realized and unrealized gain (loss) on investment transactions for the period. |
See notes to consolidated financial statements.
| | |
| 118 | AB GLOBAL RISK ALLOCATION FUND | | abfunds.com |
REPORT OF INDEPENDENT REGISTERED
PUBLIC ACCOUNTING FIRM
To the Board of Directors and Shareholders of
AB Global Risk Allocation Fund, Inc.
We have audited the accompanying consolidated statement of assets and liabilities of AB Global Risk Allocation Fund, Inc. (the “Fund”), including the consolidated portfolio of investments, as of November 30, 2017, and the related consolidated statement of operations for the year then ended, the consolidated statements of changes in net assets for each of the two years in the period then ended, and the consolidated financial highlights for each of the five years in the period then ended. These financial statements and financial highlights are the responsibility of the Fund’s management. Our responsibility is to express an opinion on these financial statements and financial highlights based on our audits.
We conducted our audits in accordance with the standards of the Public Company Accounting Oversight Board (United States). Those standards require that we plan and perform the audit to obtain reasonable assurance about whether the financial statements and financial highlights are free of material misstatement. We were not engaged to perform an audit of the Fund’s internal control over financial reporting. Our audits included consideration of internal control over financial reporting as a basis for designing audit procedures that are appropriate in the circumstances, but not for the purpose of expressing an opinion on the effectiveness of the Fund’s internal control over financial reporting. Accordingly, we express no such opinion. An audit also includes examining, on a test basis, evidence supporting the amounts and disclosures in the financial statements and financial highlights, assessing the accounting principles used and significant estimates made by management, and evaluating the overall financial statement presentation. Our procedures included confirmation of securities owned as of November 30, 2017, by correspondence with the custodian and others, or by other appropriate auditing procedures where replies from others were not received. We believe that our audits provide a reasonable basis for our opinion.
In our opinion, the financial statements and financial highlights referred to above present fairly, in all material respects, the consolidated financial position of AB Global Risk Allocation Fund, Inc. at November 30, 2017, the consolidated results of its operations for the year then ended, the consolidated changes in its net assets for each of the two years in the period then ended, and the consolidated financial highlights for each of the five years in the period then ended, in conformity with U.S. generally accepted accounting principles.

New York, New York
January 26, 2018
| | |
| abfunds.com | | AB GLOBAL RISK ALLOCATION FUND | 119 |
2017 FEDERAL TAX INFORMATION
(unaudited)
For Federal income tax purposes, the following information is furnished with respect to the distributions paid by the Fund during the taxable period ended November 30, 2017. For individual shareholders, the Fund designates 15.96% of dividends paid as qualified dividend income. For corporate shareholders, 5.20% of dividends paid qualify for the dividends received deduction. For foreign shareholders, 17% of ordinary dividends paid may be considered to be qualifying to be taxed as interest-related dividends.
Shareholders should not use the above information to prepare their income tax returns. The information necessary to complete your income tax returns will be included with your Form 1099-DIV which will be sent to you separately in January 2018.
| | |
| 120 | AB GLOBAL RISK ALLOCATION FUND | | abfunds.com |
BOARD OF DIRECTORS
| | |
Marshall C. Turner, Jr.(1), Chairman Michael J. Downey(1) William H. Foulk, Jr.(1) Nancy P. Jacklin(1) | | Robert M. Keith, President and Chief Executive Officer Carol C. McMullen(1) Garry L. Moody(1) Earl D. Weiner(1) |
OFFICERS
| | |
Daniel J. Loewy(2), Vice President Leon Zhu(2) , Vice President Emilie D. Wrapp, Secretary Joseph J. Mantineo, Treasurer and Chief Financial Officer | | Phyllis J. Clarke, Controller Vincent S. Noto, Chief Compliance Officer |
| | |
Custodian and Accounting Agent State Street Bank and Trust Company State Street Corporation CCB/5 1 Iron Street Boston, MA 02210 Principal Underwriter AllianceBernstein Investments, Inc. 1345 Avenue of the Americas New York, NY 10105 Legal Counsel Seward & Kissel LLP One Battery Park Plaza New York, NY 10004 | | Transfer Agent AllianceBernstein Investor Services, Inc. P.O. Box 786003 San Antonio, TX 78278-6003 Toll-Free (800) 221-5672 Independent Registered Public Accounting Firm Ernst & Young LLP 5 Times Square New York, NY 10036 |
| 1 | Member of the Audit Committee, the Governance and Nominating Committee and the Independent Directors Committee. |
| 2 | The management of, and investment decisions for, the Fund’s portfolio are made by the Adviser’s Quantitative Investment Team. Messrs. Loewy and Zhu are the investment professionals with the most significant responsibilities for the day-to-day management of the Fund’s portfolio. |
| | |
| abfunds.com | | AB GLOBAL RISK ALLOCATION FUND | 121 |
MANAGEMENT OF THE FUND
Board of Directors Information
The business and affairs of the Fund are managed under the direction of the Board of Directors. Certain information concerning the Fund’s Directors is set forth below.
| | | | | | | | |
NAME,
ADDRESS*, AGE,
(YEAR FIRST ELECTED**) | | PRINCIPAL
OCCUPATION(S)
DURING PAST FIVE YEARS
AND OTHER INFORMATION*** | | PORTFOLIOS
IN FUND
COMPLEX
OVERSEEN BY
DIRECTOR | | | OTHER PUBLIC
COMPANY
DIRECTORSHIPS
CURRENTLY HELD
BY DIRECTOR |
| INTERESTED DIRECTOR | | | | | | |
Robert M. Keith, #
1345 Avenue of the Americas
New York, NY 10105
57
(2010) | | Senior Vice President of AllianceBernstein L.P. (the “Adviser”) and the head of AllianceBernstein Investments, Inc. (“ABI”) since July 2008; Director of ABI and President of the AB Mutual Funds. Previously, he served as Executive Managing Director of ABI from December 2006 to June 2008. Prior to joining ABI in 2006, Executive Managing Director of Bernstein Global Wealth Management, and prior thereto, Senior Managing Director and Global Head of Client Service and Sales of the Adviser’s institutional investment management business since 2004. Prior thereto, he was Managing Director and Head of North American Client Service and Sales in the Adviser’s institutional investment management business, with which he had been associated since prior to 2004. | | | 96 | | | None |
| | |
| 122 | AB GLOBAL RISK ALLOCATION FUND | | abfunds.com |
MANAGEMENT OF THE FUND (continued)
| | | | | | | | |
NAME,
ADDRESS*, AGE,
(YEAR FIRST ELECTED**) | | PRINCIPAL
OCCUPATION(S)
DURING PAST FIVE YEARS
AND OTHER INFORMATION*** | | PORTFOLIOS
IN FUND
COMPLEX
OVERSEEN BY
DIRECTOR | | | OTHER PUBLIC
COMPANY
DIRECTORSHIPS
CURRENTLY HELD
BY DIRECTOR |
| DISINTERESTED DIRECTORS | | | | | | |
Marshall C. Turner, Jr., ##
Chairman of the Board
76
(2005) | | Private Investor since prior to 2013. Former Chairman and CEO of Dupont Photomasks, Inc. (components of semi-conductor manufacturing). He has extensive operating leadership and venture capital investing experience, including five interim or full-time CEO roles, and prior service as general partner of institutional venture capital partnerships. He also has extensive non-profit board leadership experience, and currently serves on the boards of two education and science-related non-profit organizations. He has served as a director of one AB fund since 1992, and director or trustee of multiple AB Funds since 2005. He has been Chairman of the AB Funds since January 2014, and the Chairman of the Independent Directors Committees of such Funds since February 2014. | | | 96 | | | Xilinx, Inc. (programmable logic semi-conductors) since 2007 |
| | | | | | | | |
Michael J. Downey##
74
(2005) | | Private Investor since prior to 2013. Formerly, managing partner of Lexington Capital, LLC (investment advisory firm) from December 1997 until December 2003. He served as a Director of Prospect Acquisition Corp. (financial services) from 2007 until 2009. From 1987 until 1993, Chairman and CEO of Prudential Mutual Fund Management, director of the Prudential mutual funds, and member of the Executive Committee of Prudential Securities Inc. He has served as a director or trustee of the AB Funds since 2005 and is a director and Chairman of one other registered investment company. | | | 96 | | | The Asia Pacific Fund, Inc. (registered investment company) since prior to 2013 |
| | |
| abfunds.com | | AB GLOBAL RISK ALLOCATION FUND | 123 |
MANAGEMENT OF THE FUND (continued)
| | | | | | | | |
NAME,
ADDRESS*, AGE,
(YEAR FIRST ELECTED**) | | PRINCIPAL
OCCUPATION(S)
DURING PAST FIVE YEARS
AND OTHER INFORMATION*** | | PORTFOLIOS
IN FUND
COMPLEX
OVERSEEN BY
DIRECTOR | | | OTHER PUBLIC
COMPANY
DIRECTORSHIPS
CURRENTLY HELD
BY DIRECTOR |
DISINTERESTED DIRECTORS (continued) | | | | | | |
William H. Foulk, Jr.##
85
(1992)
| | Investment Adviser and an Independent Consultant since prior to 2013. Previously, he was Senior Manager of Barrett Associates, Inc., a registered investment adviser. He was formerly Deputy Comptroller and Chief Investment Officer of the State of New York and, prior thereto, Chief Investment Officer of the New York Bank for Savings. He has served as a director or trustee of various AB Funds since 1983, and was Chairman of the Independent Directors Committees of the AB Funds from 2003 until early February 2014. He served as Chairman of such Funds from 2003 through December 2013. He is also active in a number of mutual fund related organizations and committees. | | | 96 | | | None |
| | |
| 124 | AB GLOBAL RISK ALLOCATION FUND | | abfunds.com |
MANAGEMENT OF THE FUND (continued)
| | | | | | | | |
NAME,
ADDRESS*, AGE,
(YEAR FIRST ELECTED**) | | PRINCIPAL
OCCUPATION(S)
DURING PAST FIVE YEARS
AND OTHER INFORMATION*** | | PORTFOLIOS
IN FUND
COMPLEX
OVERSEEN BY
DIRECTOR | | | OTHER PUBLIC
COMPANY
DIRECTORSHIPS
CURRENTLY HELD
BY DIRECTOR |
DISINTERESTED DIRECTORS (continued) | | | | | | |
Nancy P. Jacklin##
69 (2006) | | Private Investor since prior to 2013. Professorial Lecturer at the Johns Hopkins School of Advanced International Studies (2008-2015). U.S. Executive Director of the International Monetary Fund (which is responsible for ensuring the stability of the international monetary system), (December 2002-May 2006); Partner, Clifford Chance (1992-2002); Sector Counsel, International Banking and Finance, and Associate General Counsel, Citicorp (1985-1992); Assistant General Counsel (International), Federal Reserve Board of Governors (1982-1985); and Attorney Advisor, U.S. Department of the Treasury (1973-1982). Member of the Bar of the District of Columbia and of New York; and member of the Council on Foreign Relations. She has served as a director or trustee of the AB Funds since 2006 and has been Chairman of the Governance and Nominating Committees of the AB Funds since August 2014. | | | 96 | | | None |
| | |
| abfunds.com | | AB GLOBAL RISK ALLOCATION FUND | 125 |
MANAGEMENT OF THE FUND (continued)
| | | | | | | | |
NAME,
ADDRESS*, AGE,
(YEAR FIRST ELECTED**) | | PRINCIPAL
OCCUPATION(S)
DURING PAST FIVE YEARS
AND OTHER INFORMATION*** | | PORTFOLIOS
IN FUND
COMPLEX
OVERSEEN BY
DIRECTOR | | | OTHER PUBLIC
COMPANY
DIRECTORSHIPS
CURRENTLY HELD
BY DIRECTOR |
DISINTERESTED DIRECTORS (continued) | | | | | | |
Carol C. McMullen##
62 (2016) | | Managing Director of Slalom Consulting (consulting) since 2014, private investor and member of the Partners Healthcare Investment Committee. Formerly, Director of Norfolk & Dedham Group (mutual property and casualty insurance) from 2011 until November 2016; Director of Partners Community Physicians Organization (healthcare) since 2014 until December 2016; and Managing Director of The Crossland Group (consulting) from 2012 to 2013. She has held a number of senior positions in the asset and wealth management industries, including at Eastern Bank (where her roles included President of Eastern Wealth Management), Thomson Financial (Global Head of Sales for Investment Management), and Putnam Investments (where her roles included Head of Global Investment Research). She has served on a number of private company and non-profit boards, and as a director or trustee of the AB Funds since June 2016. | | | 96 | | | None |
| | |
| 126 | AB GLOBAL RISK ALLOCATION FUND | | abfunds.com |
MANAGEMENT OF THE FUND (continued)
| | | | | | | | |
NAME,
ADDRESS*, AGE,
(YEAR FIRST ELECTED**) | | PRINCIPAL
OCCUPATION(S)
DURING PAST FIVE YEARS
AND OTHER INFORMATION*** | | PORTFOLIOS
IN FUND
COMPLEX
OVERSEEN BY
DIRECTOR | | | OTHER PUBLIC
COMPANY
DIRECTORSHIPS
CURRENTLY HELD
BY DIRECTOR |
DISINTERESTED DIRECTORS (continued) | | | | | | |
Garry L. Moody##
65
(2008) | | Independent Consultant. Formerly, Partner, Deloitte & Touche LLP (1995-2008) where he held a number of senior positions, including Vice Chairman, and U.S. and Global Investment Management Practice Managing Partner; President, Fidelity Accounting and Custody Services Company (1993-1995), where he was responsible for accounting, pricing, custody and reporting for the Fidelity mutual funds; and Partner, Ernst & Young LLP (1975-1993), where he served as the National Director of Mutual Fund Tax Services and Managing Partner of its Chicago Office Tax department. He is a member of the Trustee Advisory Board of BoardIQ, a biweekly publication focused on issues and news affecting directors of mutual funds. He has served as a director or trustee, and as Chairman of the Audit Committees, of the AB Funds since 2008. | | | 96 | | | None |
| | | | | | | | |
Earl D. Weiner##
78
(2007) | | Of Counsel, and Partner prior to January 2007, of the law firm Sullivan & Cromwell LLP and is a former member of the ABA Federal Regulation of Securities Committee Task Force to draft editions of the Fund Director’s Guidebook. He also serves as a director or trustee of various non-profit organizations and has served as Chairman or Vice Chairman of a number of them. He has served as a director or trustee of the AB Funds since 2007 and served as Chairman of the Governance and Nominating Committees of the AB Funds from 2007 until August 2014. | | | 96 | | | None |
| | |
| abfunds.com | | AB GLOBAL RISK ALLOCATION FUND | 127 |
MANAGEMENT OF THE FUND (continued)
| * | The address for each of the Fund’s disinterested Directors is c/o AllianceBernstein L.P., Attention: Office of the Senior Officer, 1345 Avenue of the Americas, New York, NY 10105. |
| ** | There is no stated term of office for the Fund’s Directors. |
| *** | The information above includes each Director’s principal occupation during the last five years and other information relating to the experience, attributes, and skills relevant to each Director’s qualifications to serve as a Director, which led to the conclusion that each Director should serve as a Director for the Fund. |
| # | Mr. Keith is an “interested person” of the Fund, as defined in the 1940 Act, due to his position as a Senior Vice President of the Adviser. |
| ## | Member of the Audit Committee, the Governance and Nominating Committee and the Independent Directors Committee. |
| | |
| 128 | AB GLOBAL RISK ALLOCATION FUND | | abfunds.com |
MANAGEMENT OF THE FUND (continued)
Officer Information
Certain information concerning the Fund’s Officers is set forth below.
| | | | |
NAME, ADDRESS*
AND AGE | | POSITION(S)
HELD WITH FUND | | PRINCIPAL OCCUPATION
DURING PAST FIVE YEARS |
Robert M. Keith
57 | | President and Chief Executive Officer | | See biography above. |
| | | | |
Daniel J. Loewy 43 | | Vice President | | Senior Vice President of the Adviser**, with which he has been associated since prior to 2013. |
| | | | |
Leon Zhu
50 | | Vice President | | Senior Vice President of the Adviser**, with which he has been associated since prior to 2013. |
| | | | |
Emilie D. Wrapp
62 | | Secretary | | Senior Vice President, Assistant General Counsel and Assistant Secretary of ABI**, with which she has been associated since prior to 2013. |
| | | | |
Joseph J. Mantineo 58 | | Treasurer and Chief Financial Officer | | Senior Vice President of AllianceBernstein Investor Services, Inc. (“ABIS”)**, with which he has been associated since prior to 2013. |
| | | | |
Phyllis J. Clarke 57 | | Controller | | Vice President of ABIS**, with which she has been associated since prior to 2013. |
| | | | |
Vincent S. Noto 53 | | Chief Compliance Officer | | Senior Vice President since 2015 and Mutual Fund Chief Compliance Officer of the Adviser** since 2014. Prior thereto, he was Vice President and Director of Mutual Fund Compliance of the Adviser** since prior to 2013. |
| * | The address for each of the Fund’s Officers is 1345 Avenue of the Americas, New York, NY 10105. |
| ** | The Adviser, ABI and ABIS are affiliates of the Fund. |
The Fund’s Statement of Additional Information (“SAI”) has additional information about the Fund’s Directors and Officers and is available without charge upon request. Contact your financial representative or AB at (800) 227-4618, or visit www.abfunds.com, for a free prospectus or SAI.
| | |
| abfunds.com | | AB GLOBAL RISK ALLOCATION FUND | 129 |
Information Regarding the Review and Approval of the Fund’s Advisory Agreement
The disinterested directors (the “directors”) of AB Global Risk Allocation Fund, Inc. (the “Fund”) unanimously approved the continuance of the Advisory Agreement with the Adviser at a meeting held on May 2-4, 2017 (the “Meeting”).
Prior to approval of the continuance of the Advisory Agreement, the directors had requested from the Adviser, and received and evaluated, extensive materials. They reviewed the proposed continuance of the Advisory Agreement with the Adviser and with experienced counsel who are independent of the Adviser, who advised on the relevant legal standards. The directors also reviewed an independent evaluation prepared by the Fund’s Senior Officer (who is also the Fund’s Independent Compliance Officer), who acted as their independent fee consultant, of the reasonableness of the advisory fee, in which the Senior Officer concluded that the contractual fee for the Fund was reasonable. The directors also discussed the proposed continuance in private sessions with counsel and the Fund’s Senior Officer.
The directors considered their knowledge of the nature and quality of the services provided by the Adviser to the Fund gained from their experience as directors or trustees of most of the registered investment companies advised by the Adviser, their overall confidence in the Adviser’s integrity and competence they have gained from that experience, the Adviser’s initiative in identifying and raising potential issues with the directors and its responsiveness, frankness and attention to concerns raised by the directors in the past, including the Adviser’s willingness to consider and implement organizational and operational changes designed to improve investment results and the services provided to the AB Funds. The directors noted that they have four regular meetings each year, at each of which they review extensive materials and information from the Adviser, including information on the investment performance of the Fund.
The directors also considered all factors they believed relevant, including the specific matters discussed below. During the course of their deliberations, the directors evaluated, among other things, the reasonableness of the advisory fee. The directors did not identify any particular information that was all-important or controlling, and different directors may have attributed different weights to the various factors. The directors determined that the selection of the Adviser to manage the Fund and the overall arrangements between the Fund and the Adviser, as provided in the Advisory Agreement, including the advisory fee, were fair and reasonable in light of the services performed, expenses incurred and such other matters as the directors considered relevant in the exercise of their business judgment. The material factors and conclusions that formed the basis for the directors’ determinations included the following:
| | |
| 130 | AB GLOBAL RISK ALLOCATION FUND | | abfunds.com |
Nature, Extent and Quality of Services Provided
The directors considered the scope and quality of services provided by the Adviser under the Advisory Agreement, including the quality of the investment research capabilities of the Adviser and the other resources it has dedicated to performing services for the Fund. They also noted the professional experience and qualifications of the Fund’s portfolio management team and other senior personnel of the Adviser. The directors also considered that the Advisory Agreement provides that the Fund will reimburse the Adviser for the cost to it of providing certain clerical, accounting, administrative and other services to the Fund by employees of the Adviser or its affiliates. Requests for these reimbursements are made on a quarterly basis and subject to approval by the directors. Reimbursements, to the extent requested and paid, result in a higher rate of total compensation from the Fund to the Adviser than the fee rate stated in the Advisory Agreement. The directors noted that the methodology used to determine the reimbursement amounts had been reviewed by an independent consultant retained by the Fund’s Senior Officer. The quality of administrative and other services, including the Adviser’s role in coordinating the activities of the Fund’s other service providers, also was considered. The directors concluded that, overall, they were satisfied with the nature, extent and quality of services provided to the Fund under the Advisory Agreement.
Costs of Services Provided and Profitability
The directors reviewed a schedule of the revenues and expenses and related notes indicating the profitability of the Fund to the Adviser for calendar years 2015 and 2016 that had been prepared with an expense allocation methodology arrived at in consultation with an independent consultant retained by the Fund’s Senior Officer. The directors noted the assumptions and methods of allocation used by the Adviser in preparing fund-specific profitability data and understood that there are a number of potentially acceptable allocation methodologies for information of this type. The directors noted that the profitability information reflected all revenues and expenses of the Adviser’s relationship with the Fund, including those relating to its subsidiaries that provide transfer agency, distribution and brokerage services to the Fund. The directors recognized that it is difficult to make comparisons of the profitability of the Advisory Agreement with the profitability of advisory contracts for unaffiliated funds because comparative information is not generally publicly available and is affected by numerous factors. The directors focused on the profitability of the Adviser’s relationship with the Fund before taxes and distribution expenses. The directors noted that the Fund was not profitable to the Adviser in the periods reviewed.
Fall-Out Benefits
The directors considered the other benefits to the Adviser and its affiliates from their relationships with the Fund, including, but not limited to, benefits relating to soft dollar arrangements (whereby investment advisers receive
| | |
| abfunds.com | | AB GLOBAL RISK ALLOCATION FUND | 131 |
brokerage and research services from brokers that execute agency transactions for their clients); 12b-1 fees and sales charges received by the Fund’s principal underwriter (which is a wholly owned subsidiary of the Adviser) in respect of certain classes of the Fund’s shares; brokerage commissions paid by the Fund to brokers affiliated with the Adviser; and transfer agency fees paid by the Fund to a wholly owned subsidiary of the Adviser. The directors recognized that the Fund’s unprofitability to the Adviser would be exacerbated without these benefits. The directors understood that the Adviser also might derive reputational and other benefits from its association with the Fund.
Investment Results
In addition to the information reviewed by the directors in connection with the Meeting, the directors receive detailed performance information for the Fund at each regular Board meeting during the year.
At the Meeting, the directors reviewed information prepared by an analytical service that is not affiliated with the Adviser (the “15(c) service provider”), showing the performance of the Class A Shares of the Fund against a peer group and a peer universe, and information prepared by the Adviser showing performance of the Class A Shares against a broad-based securities market index, in each case for the 1-, 3-, 5- and 10-year periods ended February 28, 2017. Based on their review, the directors concluded that the Fund’s investment performance was acceptable.
Advisory Fees and Other Expenses
The directors considered the advisory fee rate paid by the Fund to the Adviser and information prepared by the 15(c) service provider concerning advisory fee rates paid by other funds in the same category as the Fund at a common asset level. The directors recognized that it is difficult to make comparisons of advisory fees because there are variations in the services that are included in the fees paid by other funds. The directors compared the Fund’s contractual effective advisory fee rate with a peer group median and took into account the impact on the advisory fee rate of the administrative expense reimbursement paid to the Adviser in the latest fiscal year.
The directors also considered the Adviser’s fee schedule for institutional clients pursuing a similar investment style. For this purpose, they reviewed the relevant advisory fee information from the Adviser’s Form ADV and the evaluation from the Fund’s Senior Officer and noted the differences between the Fund’s fee schedule, on the one hand, and the institutional fee schedule and the schedule of fees charged to any offshore funds and any sub-advised funds, on the other. The directors noted that the Adviser may, in some cases, agree to fee rates with large institutional clients that are lower than those reviewed by the directors and that they had previously discussed with the Adviser its policies in respect of such arrangements.
| | |
| 132 | AB GLOBAL RISK ALLOCATION FUND | | abfunds.com |
The Adviser reviewed with the directors the significantly greater scope of the services it provides to the Fund relative to institutional, offshore fund and sub-advised fund clients. In light of the substantial differences in services rendered by the Adviser to institutional, offshore fund and sub-advised fund clients as compared to funds such as the Fund, the directors considered these fee comparisons inapt and did not place significant weight on them in their deliberations.
The directors noted that the Fund invests in shares of exchange-traded funds (“ETFs”), subject to the restrictions and limitations of the Investment Company Act of 1940 as these may be varied as a result of exemptive orders issued by the SEC. The directors noted that ETFs pay advisory fees pursuant to their advisory contracts, and that the Adviser had provided, and they had reviewed, information about the expense ratios of the relevant ETFs. The directors concluded, based on the Adviser’s explanation of how it uses ETFs when they are the most cost-effective way to obtain desired exposures for a fund or to temporarily “equitize” cash inflows pending purchases of underlying securities, that the advisory fee for the Fund is paid for services that are in addition to, rather than duplicative of, the services provided under the advisory contracts of the ETFs.
The directors also considered the total expense ratio of the Class A shares of the Fund in comparison to a peer group and a peer universe selected by the 15(c) service provider. The Class A expense ratio of the Fund was based on the Fund’s latest fiscal year. The directors noted that it was likely that the expense ratios of some of the other funds in the Fund’s category were lowered by waivers or reimbursements by those funds’ investment advisers, which in some cases might be voluntary or temporary. The directors view expense ratio information as relevant to their evaluation of the Adviser’s services because the Adviser is responsible for coordinating services provided to the Fund by others. The directors noted that the Fund’s expense ratio was above the peer group median. After reviewing and discussing the Adviser’s explanations of the reasons for this, the directors concluded that the Fund’s expense ratio was acceptable.
Economies of Scale
The directors noted that the advisory fee schedule for the Fund contains breakpoints and that the net assets of the Fund were higher than a breakpoint level. Accordingly, the Fund’s current effective advisory fee rate reflected a reduction due to the breakpoint and would be further reduced to the extent the net assets of the Fund increase. The directors took into consideration prior presentations by an independent consultant on economies of scale in the mutual fund industry and for the AB Funds, and by the Adviser concerning certain of its views on economies of scale. The directors also had requested and received from the Adviser certain updates on economies of scale in advance of the Meeting. The directors believe that economies of scale may be realized (if at all) by the Adviser
| | |
| abfunds.com | | AB GLOBAL RISK ALLOCATION FUND | 133 |
across a variety of products and services, and not only in respect of a single fund. The directors noted that there is no established methodology for setting breakpoints that give effect to the fund-specific services provided by a fund’s adviser and to the economies of scale that an adviser may realize in its overall mutual fund business or those components of it which directly or indirectly affect a fund’s operations. The directors observed that in the mutual fund industry as a whole, as well as among funds similar to the Fund, there is no uniformity or pattern in the fees and asset levels at which breakpoints (if any) apply. The directors also noted that the advisory agreements for many funds do not have breakpoints at all. Having taken these factors into account, the directors concluded that the Fund’s breakpoint arrangements were acceptable and provide a means for sharing of any economies of scale.
| | |
| 134 | AB GLOBAL RISK ALLOCATION FUND | | abfunds.com |
This page is not part of the Shareholder Report or the Financial Statements.
AB FAMILY OF FUNDS
US EQUITY
US CORE
Core Opportunities Fund
FlexFee™ US Thematic Portfolio
Select US Equity Portfolio
US GROWTH
Concentrated Growth Fund
Discovery Growth Fund
FlexFee™ Large Cap Growth Portfolio
Growth Fund
Large Cap Growth Fund
Small Cap Growth Portfolio
US VALUE
Discovery Value Fund
Equity Income Fund
Relative Value Fund
Small Cap Value Portfolio
Value Fund
INTERNATIONAL/ GLOBAL EQUITY
INTERNATIONAL/ GLOBAL CORE
Global Core Equity Portfolio
International Portfolio
International Strategic Core Portfolio
Sustainable Global Thematic Fund
Tax-Managed International Portfolio
Tax-Managed Wealth Appreciation Strategy
Wealth Appreciation Strategy
INTERNATIONAL/ GLOBAL GROWTH
Concentrated International Growth Portfolio
Sustainable International Thematic Fund1
INTERNATIONAL/ GLOBAL EQUITY (continued)
INTERNATIONAL/ GLOBAL VALUE
Asia ex-Japan Equity Portfolio
International Value Fund
FIXED INCOME
MUNICIPAL
High Income Municipal Portfolio
Intermediate California Municipal Portfolio
Intermediate Diversified Municipal Portfolio
Intermediate New York Municipal Portfolio
Municipal Bond Inflation Strategy
Tax-Aware Fixed Income Portfolio
National Portfolio
Arizona Portfolio
California Portfolio
Massachusetts Portfolio
Minnesota Portfolio
New Jersey Portfolio
New York Portfolio
Ohio Portfolio
Pennsylvania Portfolio
Virginia Portfolio
TAXABLE
Bond Inflation Strategy
FlexFee™ International Bond Portfolio
Global Bond Fund
High Income Fund
High Yield Portfolio
Income Fund
Intermediate Bond Portfolio
Limited Duration High Income Portfolio
Short Duration Portfolio
ALTERNATIVES
All Market Real Return Portfolio
Credit Long/Short Portfolio
Global Real Estate Investment Fund
Select US Long/Short Portfolio
Unconstrained Bond Fund
MULTI-ASSET
All Market Income Portfolio
All Market Total Return Portfolio1
Conservative Wealth Strategy
Emerging Markets Multi-Asset Portfolio
Global Risk Allocation Fund
Tax-Managed All Market Income Portfolio1
TARGET-DATE
Multi-Manager Select Retirement Allocation Fund
Multi-Manager Select 2010 Fund
Multi-Manager Select 2015 Fund
Multi-Manager Select 2020 Fund
Multi-Manager Select 2025 Fund
Multi-Manager Select 2030 Fund
Multi-Manager Select 2035 Fund
Multi-Manager Select 2040 Fund
Multi-Manager Select 2045 Fund
Multi-Manager Select 2050 Fund
Multi-Manager Select 2055 Fund
CLOSED-END FUNDS
Alliance California Municipal Income Fund
AllianceBernstein Global High Income Fund
AllianceBernstein National Municipal Income Fund
We also offer Government Money Market Portfolio1, which serves as the money market fund exchange vehicle for the AB mutual funds. An investment in Government Money Market Portfolio is not a deposit in a bank and is not insured or guaranteed by the Federal Deposit Insurance Corporation or any other government agency. Although the Fund seeks to preserve the value of your investment at $1.00 per share, it is possible to lose money by investing in the Fund.
Investors should consider the investment objectives, risks, charges and expenses of the Fund carefully before investing. For copies of our prospectus or summary prospectus, which contain this and other information, visit us online at www.abfunds.com or contact your AB representative. Please read the prospectus and/or summary prospectus carefully before investing.
| 1 | Prior to April 17, 2017, Tax-Managed All Market Income Portfolio was named Tax-Managed Balanced Wealth Strategy; prior to April 24, 2017, All Market Total Return Portfolio was named Balanced Wealth Strategy; prior to November 10, 2017, Government Money Market Portfolio was named Government Exchange Reserves; prior to January 8, 2018, Sustainable International Thematic Fund was named International Growth Fund. |
| | |
| abfunds.com | | AB GLOBAL RISK ALLOCATION FUND | 135 |
NOTES
| | |
| 136 | AB GLOBAL RISK ALLOCATION FUND | | abfunds.com |
NOTES
| | |
| abfunds.com | | AB GLOBAL RISK ALLOCATION FUND | 137 |
NOTES
| | |
| 138 | AB GLOBAL RISK ALLOCATION FUND | | abfunds.com |
NOTES
| | |
| abfunds.com | | AB GLOBAL RISK ALLOCATION FUND | 139 |
NOTES
| | |
| 140 | AB GLOBAL RISK ALLOCATION FUND | | abfunds.com |

AB GLOBAL RISK ALLOCATION FUND
1345 Avenue of the Americas
New York, NY 10105
800 221 5672
GRA-0151-1117 
(a) The registrant has adopted a code of ethics that applies to its principal executive officer, principal financial officer and principal accounting officer. A copy of the registrant’s code of ethics is filed herewith as Exhibit 12(a)(1).
(b) During the period covered by this report, no material amendments were made to the provisions of the code of ethics adopted in 2(a) above.
(c) During the period covered by this report, no implicit or explicit waivers to the provisions of the code of ethics adopted in 2(a) above were granted.
| ITEM 3. | AUDIT COMMITTEE FINANCIAL EXPERT. |
The registrant’s Board of Directors has determined that independent directors Garry L. Moody, William H. Foulk, Jr. and Marshall C. Turner, Jr. qualify as audit committee financial experts.
| ITEM 4. | PRINCIPAL ACCOUNTANT FEES AND SERVICES. |
(a) - (c) The following table sets forth the aggregate fees billed by the independent registered public accounting firm Ernst & Young, for the Fund’s last two fiscal years, for professional services rendered for: (i) the audit of the Fund’s annual financial statements included in the Fund’s annual report to stockholders; (ii) assurance and related services that are reasonably related to the performance of the audit of the Fund’s financial statements and are not reported under (i), which include advice and education related to accounting and auditing issues, quarterly press release review (for those Funds that issue quarterly press releases), and preferred stock maintenance testing (for those Funds that issue preferred stock); and (iii) tax compliance, tax advice and tax return preparation.
| | | | | | | | | | | | | | | | | | | | |
| | | | | Audit Fees | | Audit-Related Fees | | Tax Fees |
AB Global Risk Allocation | | 2016 | | | $ | 99,392 | | | | $ | 15 | | | | $ | 46,007 | |
| | 2017 | | | $ | 99,392 | | | | $ | 38 | | | | $ | 51,990 | |
(d) Not applicable.
(e) (1) Beginning with audit and non-audit service contracts entered into on or after May 6, 2003, the Fund’s Audit Committee policies and procedures require the pre-approval of all audit and non-audit services provided to the Fund by the Fund’s independent registered public accounting firm. The Fund’s Audit Committee policies and procedures also require pre-approval of all audit and non-audit services provided to the Adviser and Service Affiliates to the extent that these services are directly related to the operations or financial reporting of the Fund.
(e) (2) All of the amounts for Audit Fees, Audit-Related Fees and Tax Fees in the table under Item 4 (a) – (c) are for services pre-approved by the Fund’s Audit Committee.
(f) Not applicable.
(g) The following table sets forth the aggregate non-audit services provided to the Fund, the Fund’s Adviser and entities that control, are controlled by or under common control with the Adviser that provide ongoing services to the Fund:
| | | | | | | | | | | | | | | |
| | | | | All Fees for
Non-Audit Services
Provided to the
Portfolio, the Adviser
and Service Affiliates | | Total Amount of
Foregoing Column Pre-
approved by the Audit
Committee
(Portion Comprised of
Audit Related Fees)
(Portion Comprised of
Tax Fees) |
AB Global Risk Allocation | | 2016 | | | $ | 452,472 | | | | $ | 46,022 | |
| | | | | | | | | | $ | (15 | ) |
| | | | | | | | | | $ | (46,007 | ) |
| | 2017 | | | $ | 775,143 | | | | $ | 52,028 | |
| | | | | | | | | | $ | (38 | ) |
| | | | | | | | | | $ | (51,990 | ) |
(h) The Audit Committee of the Fund has considered whether the provision of any non-audit services not pre-approved by the Audit Committee provided by the Fund’s independent registered public accounting firm to the Adviser and Service Affiliates is compatible with maintaining the auditor’s independence.
| ITEM 5. | AUDIT COMMITTEE OF LISTED REGISTRANTS. |
Not applicable to the registrant.
| ITEM 6. | SCHEDULE OF INVESTMENTS. |
Please see Schedule of Investments contained in the Report to Shareholders included under Item 1 of this Form N-CSR.
| ITEM 7. | DISCLOSURE OF PROXY VOTING POLICIES AND PROCEDURES FOR CLOSED-END MANAGEMENT INVESTMENT COMPANIES. |
Not applicable to the registrant.
| ITEM 8. | PORTFOLIO MANAGERS OF CLOSED-END MANAGEMENT INVESTMENT COMPANIES. |
Not applicable to the registrant.
| ITEM 9. | PURCHASES OF EQUITY SECURITIES BY CLOSED-END MANAGEMENT INVESTMENT COMPANY AND AFFILIATED PURCHASERS. |
Not applicable to the registrant.
| ITEM 10. | SUBMISSION OF MATTERS TO A VOTE OF SECURITY HOLDERS. |
There have been no material changes to the procedures by which shareholders may recommend nominees to the Fund’s Board of Directors since the Fund last provided disclosure in response to this item.
| ITEM 11. | CONTROLS AND PROCEDURES. |
(a) The registrant’s principal executive officer and principal financial officer have concluded that the registrant’s disclosure controls and procedures (as defined in Rule 30a-3 (c) under the Investment Company Act of 1940, as amended) are effective at the reasonable assurance level based on their evaluation of these controls and procedures as of a date within 90 days of the filing date of this document.
(b) There were no changes in the registrant’s internal controls over financial reporting that occurred during the second fiscal quarter of the period that has materially affected, or is reasonably likely to materially affect, the registrant’s internal control over financial reporting.
The following exhibits are attached to this Form N-CSR:
| | |
EXHIBIT NO. | | DESCRIPTION OF EXHIBIT |
| |
| 12 (a) (1) | | Code of Ethics that is subject to the disclosure of Item 2 hereof |
| |
| 12 (b) (1) | | Certification of Principal Executive Officer Pursuant to Section 302 of the Sarbanes-Oxley Act of 2002 |
| |
| 12 (b) (2) | | Certification of Principal Financial Officer Pursuant to Section 302 of the Sarbanes-Oxley Act of 2002 |
| |
| 12 (c) | | Certification of Principal Executive Officer and Principal Financial Officer Pursuant to Section 906 of the Sarbanes-Oxley Act of 2002 |
SIGNATURES
Pursuant to the requirements of the Securities Exchange Act of 1934 and the Investment Company Act of 1940, the registrant has duly caused this report to be signed on its behalf by the undersigned, thereunto duly authorized.
(Registrant): AB Global Risk Allocation Fund, Inc.
| | |
By: | | /s/ Robert M. Keith |
| | |
| | Robert M. Keith |
| | President |
| |
Date: | | January 29, 2018 |
Pursuant to the requirements of the Securities Exchange Act of 1934 and the Investment Company Act of 1940, this report has been signed below by the following persons on behalf of the registrant and in the capacities and on the dates indicated.
| | |
By: | | /s/ Robert M. Keith |
| | |
| | Robert M. Keith |
| | President |
| |
Date: | | January 29, 2018 |
| |
By: | | /s/ Joseph J. Mantineo |
| | |
| | Joseph J. Mantineo |
| | Treasurer and Chief Financial Officer |
| |
Date: | | January 29, 2018 |