
ANNUAL SHAREHOLDERS’ MEETING April 29, 2013
Please remember that during today’s program, representatives of Fulton may make forward- looking statements regarding Fulton’s financial condition, results of operations and business. These forward-looking statements are not guarantees of future performance and are subject to risks, uncertainties and other factors, some of which are beyond Fulton’s control and difficult to predict and could cause actual results to differ materially from those expressed or forecasted in the forward-looking statements. Fulton undertakes no obligation, other than as required by law, to update or revise any forward-looking statements, whether as a result of new information, future events or otherwise. In our quarterly earnings releases and other material news releases, which are available on our website at www.fult.com, we include our safe harbor statement on forward-looking statements; we refer you to this section of those news releases and the statement is incorporated into this presentation. For a more complete discussion of certain risks and uncertainties affecting Fulton, please see the sections entitled “Risk Factors” and “Management’s Discussion and Analysis of Financial Condition and Results of Operations” set forth in Fulton’s filings with the SEC. 2

3 Cameras, recording devices and cell phones are not permitted to be used in the meeting. The display of placards and/or signs is prohibited. Questions from shareholders should be directed to the Chairperson of the meeting during the Question and Answer period. During the Question and Answer period, please remember to state your name prior to asking your question. During the Question and Answer period, please limit yourself to one question to give other shareholders the opportunity to speak.
4
5 Business Meeting Proposals: • Election of directors • Say on Pay • Amended and Restated Equity and Cash Incentive Compensation Plan • Ratification of appointment of independent auditor Introductions Results of Voting Conclusion of Business Meeting Management Presentation Questions and Answers
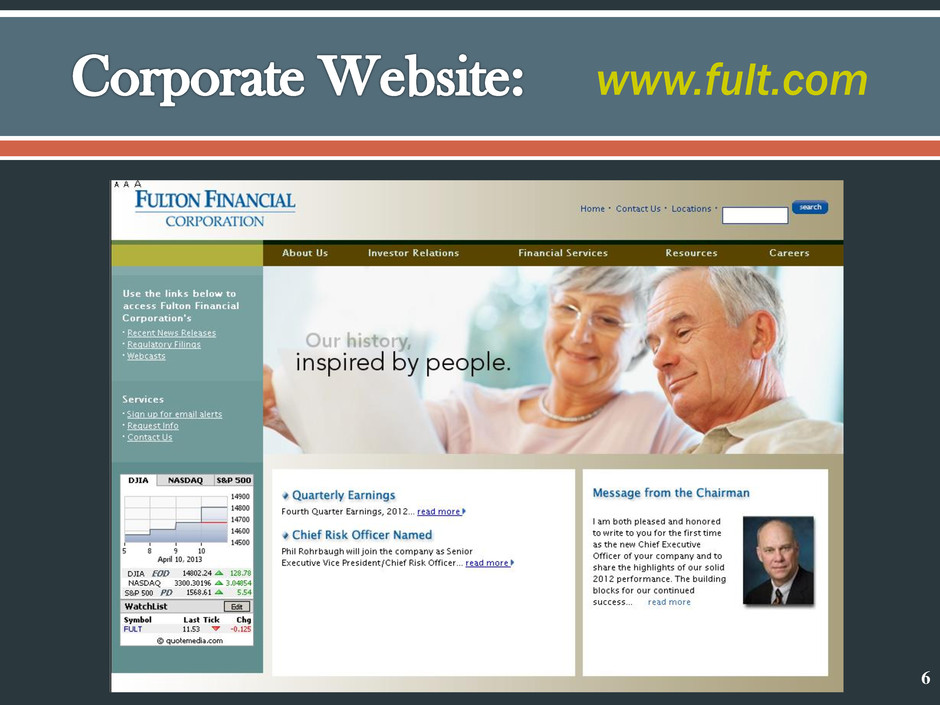
www.fult.com 6
ANNUAL SHAREHOLDERS’ MEETING April 29, 2013 7

8 BOARD OF DIRECTORS

9
10
11
12

13
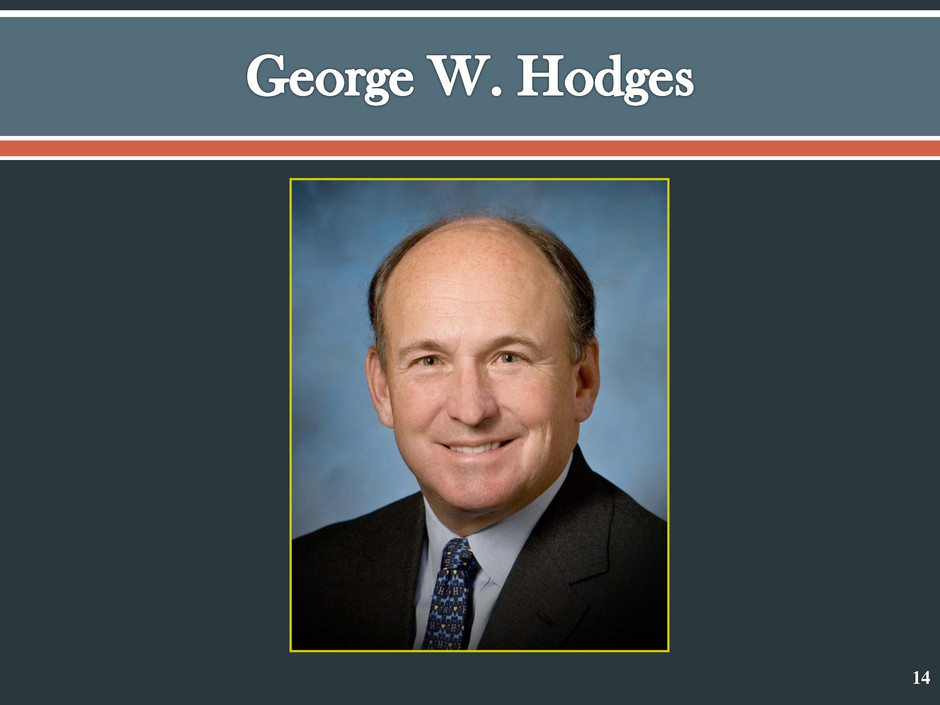
14

15
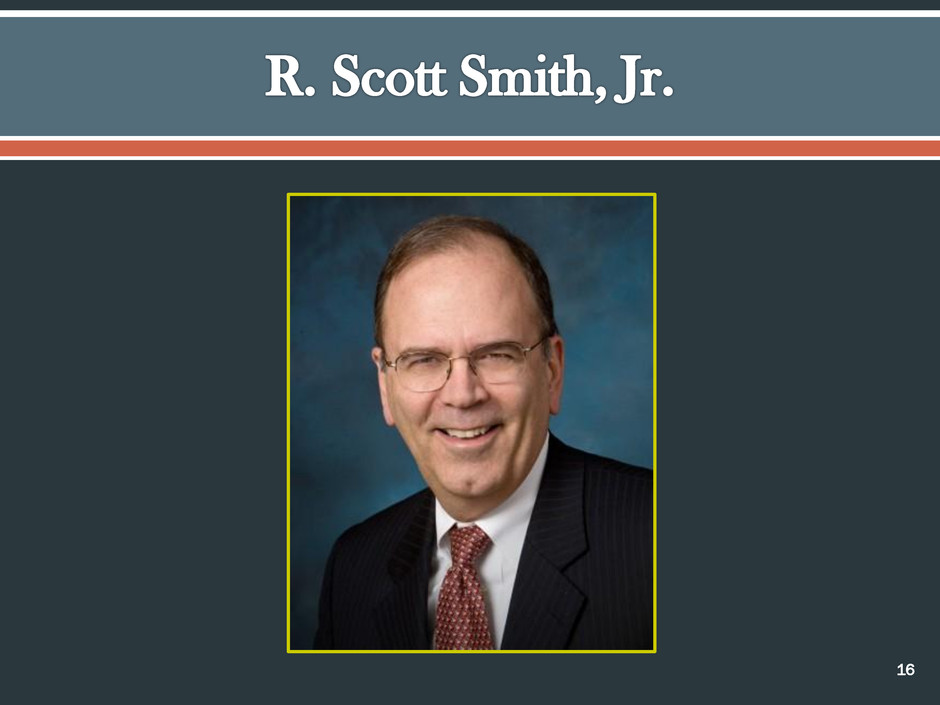
16
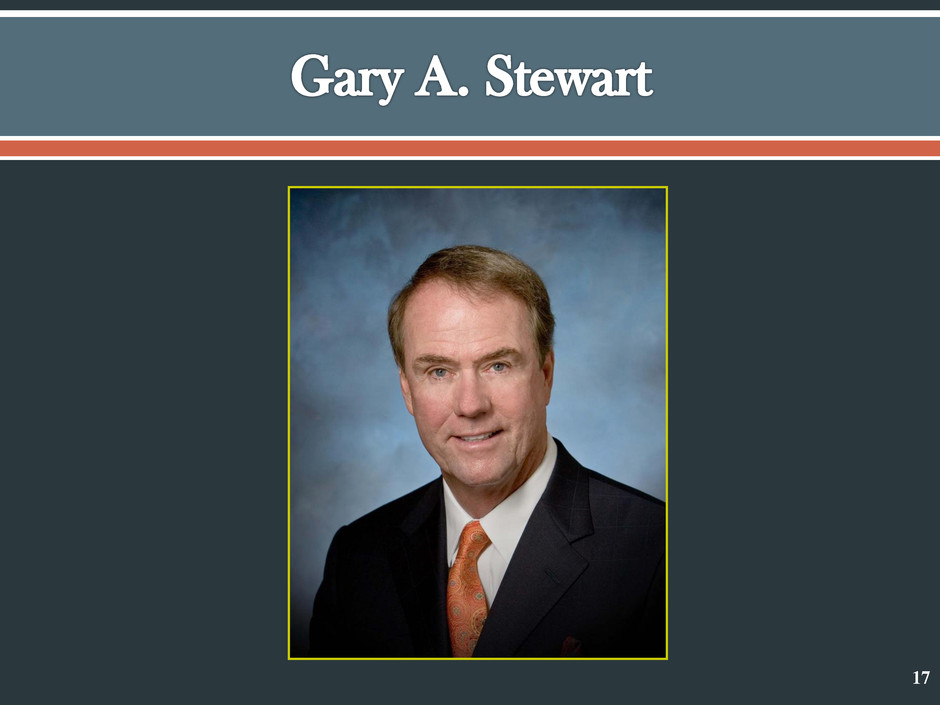
17
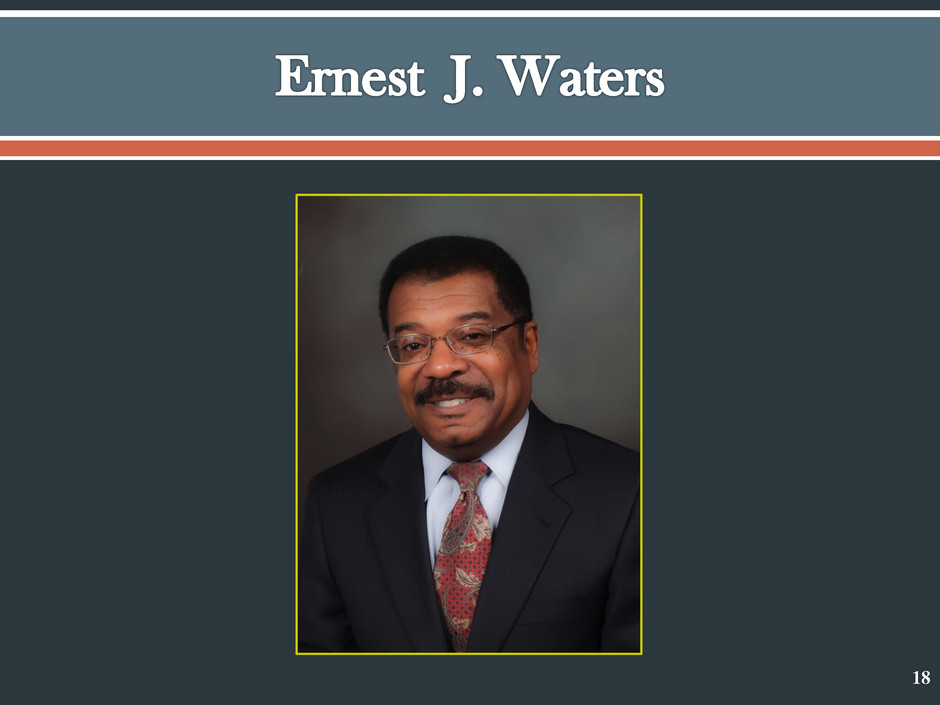
18

19 RECOGNITION OF RETIRING DIRECTORS
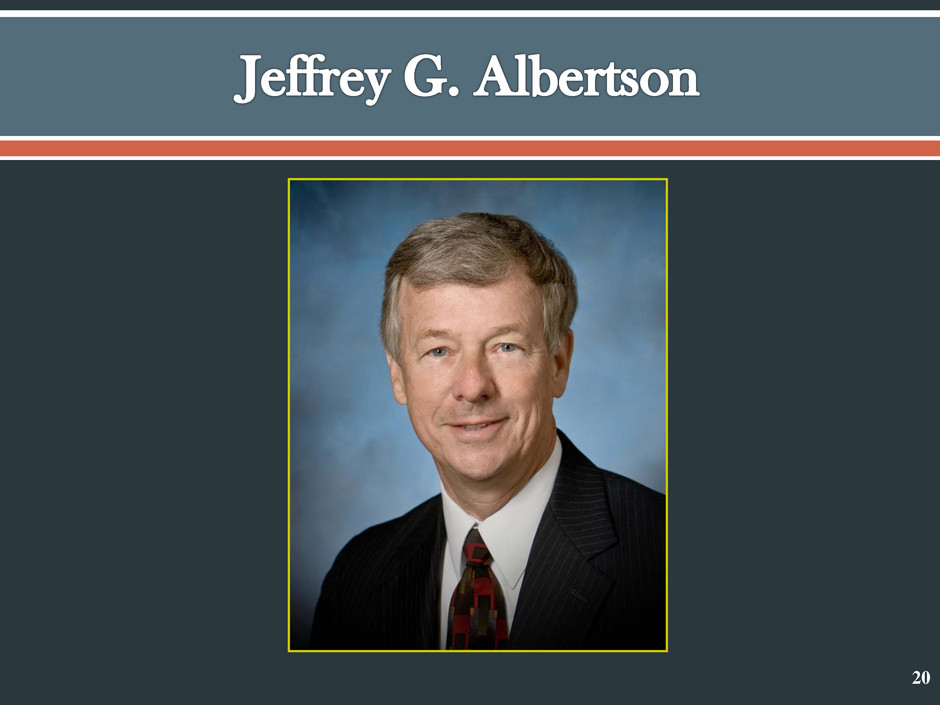
20
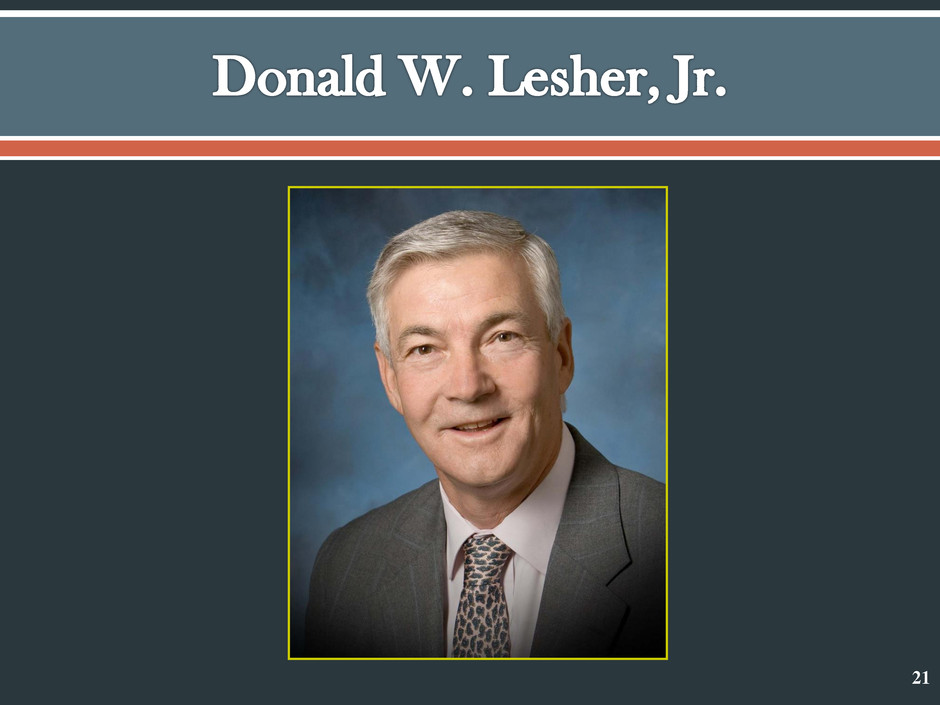
21
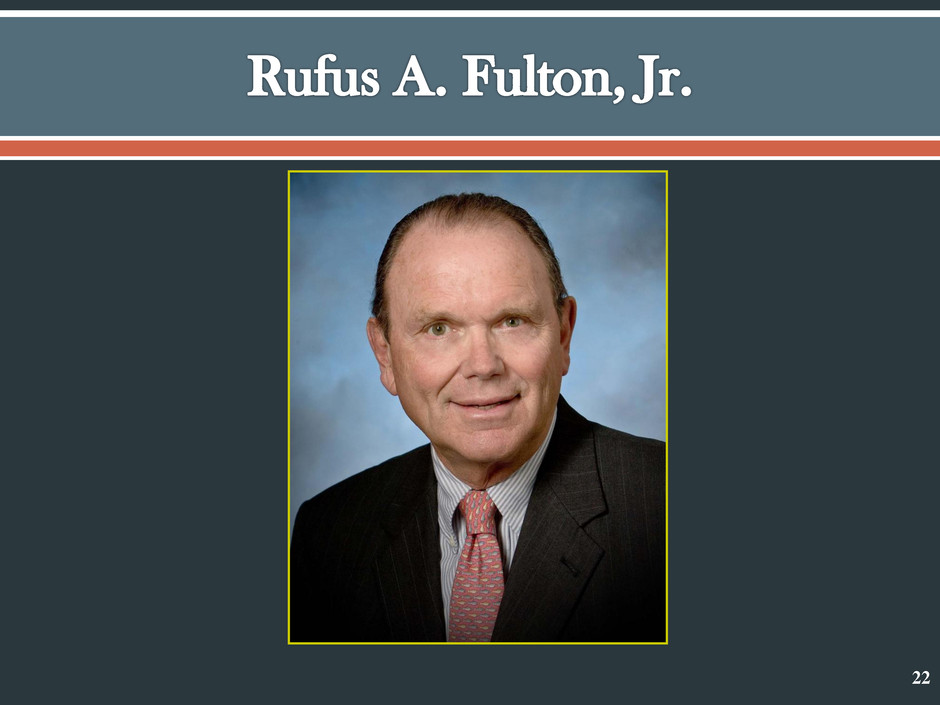
22

23 SENIOR MANAGEMENT
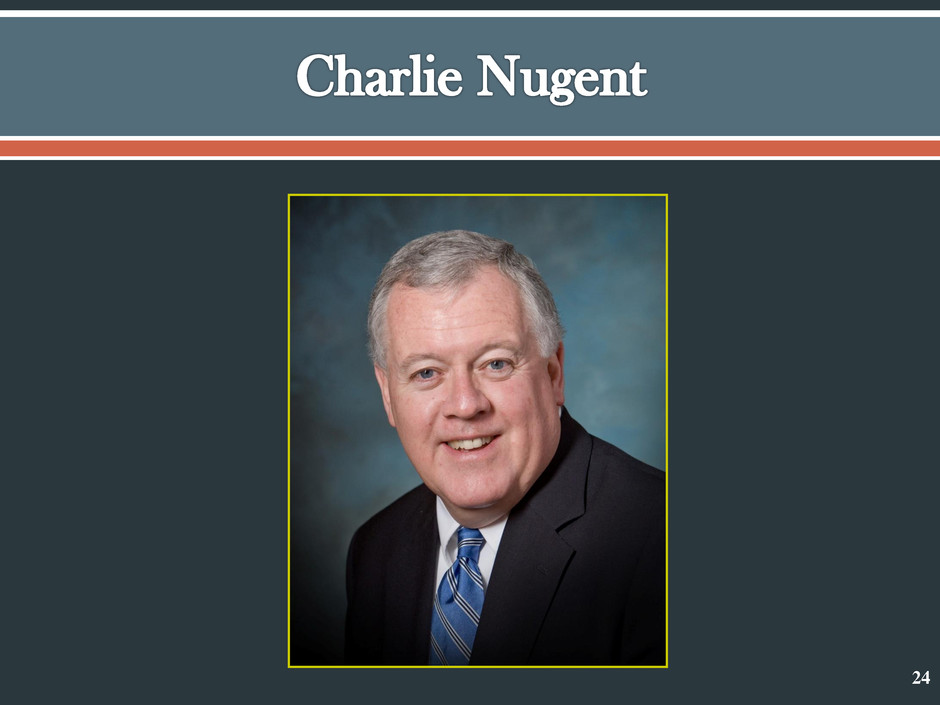
24
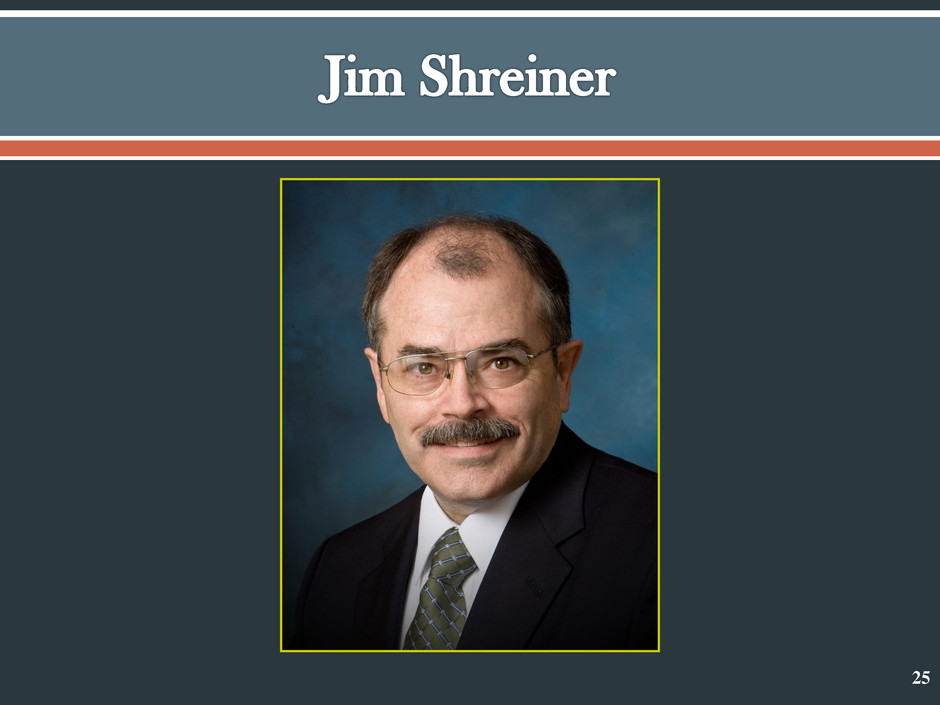
25
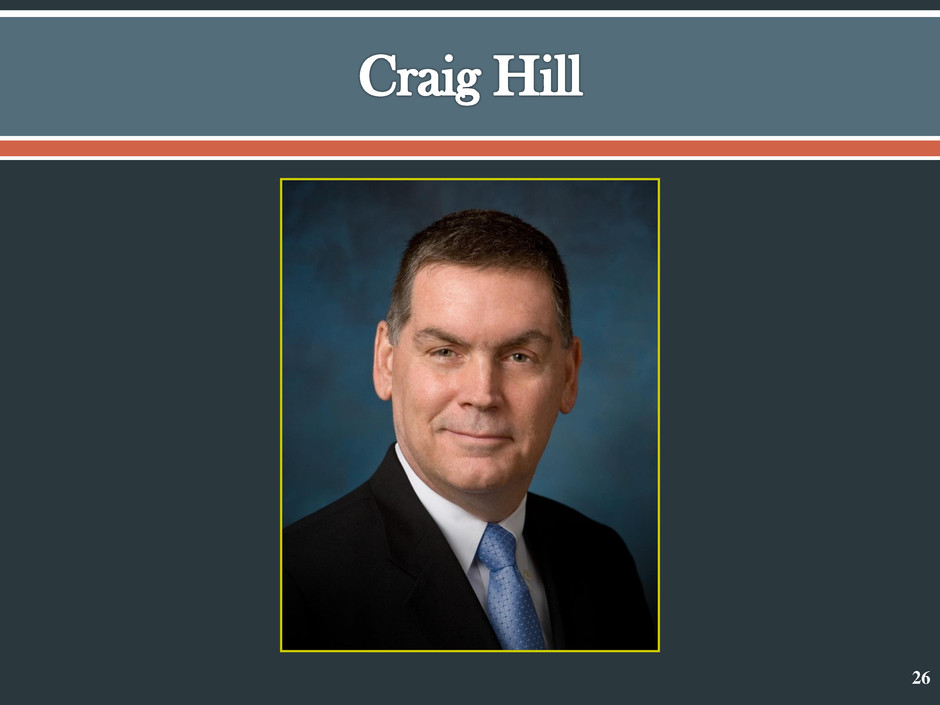
26
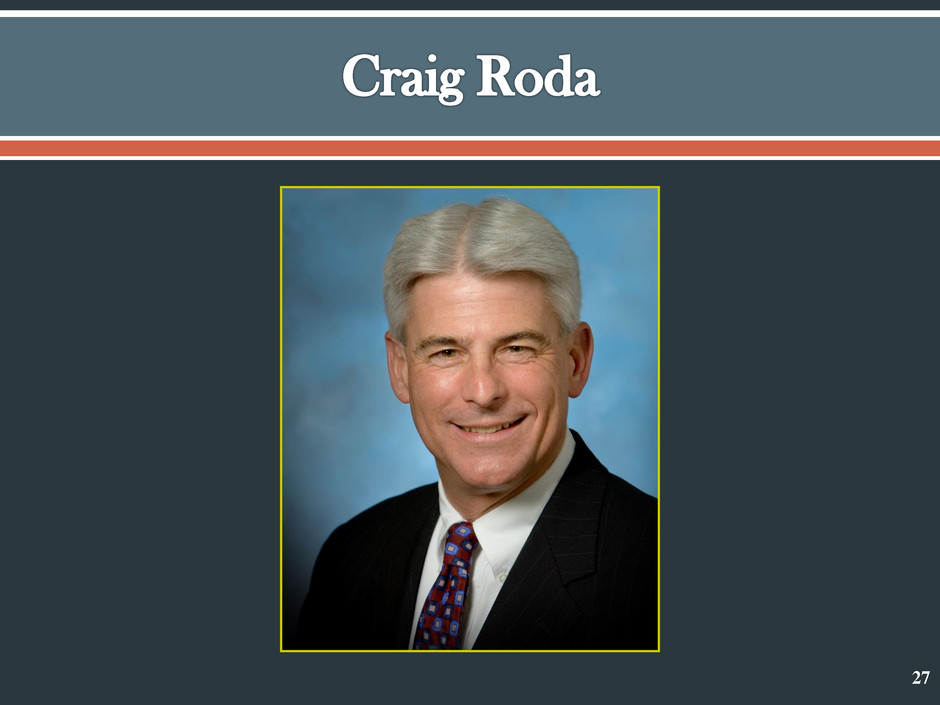
27

28

29 AFFILIATE CHIEF EXECUTIVE OFFICERS

30
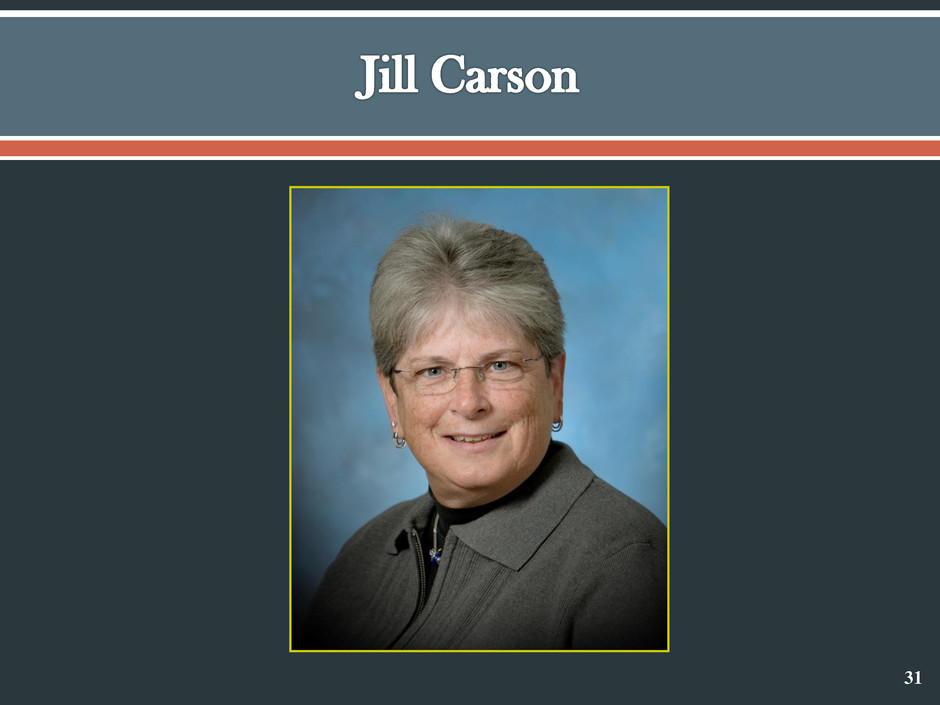
31

32
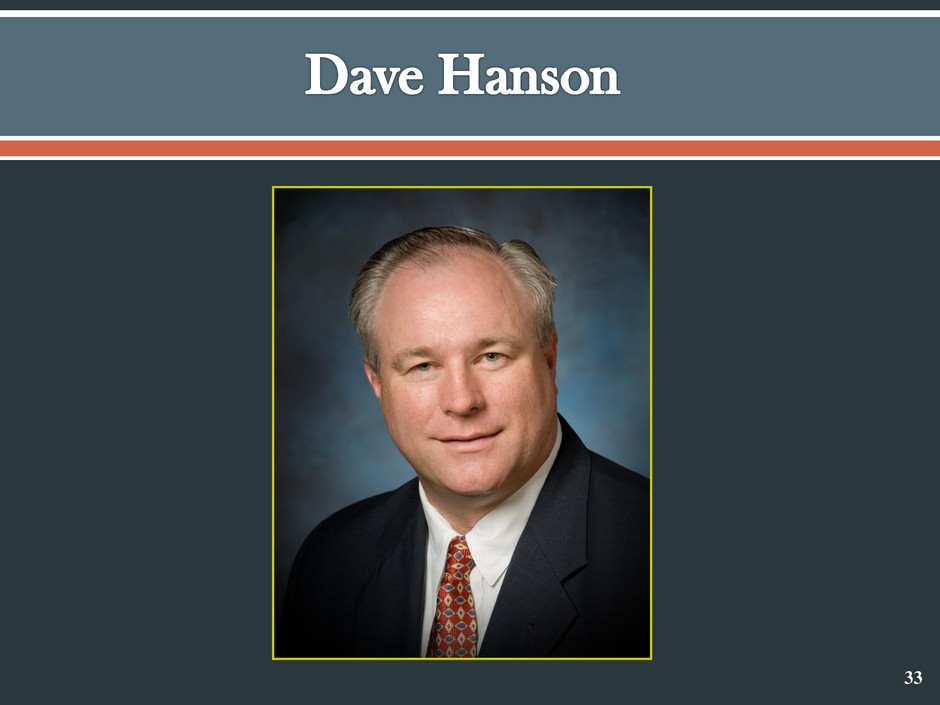
33
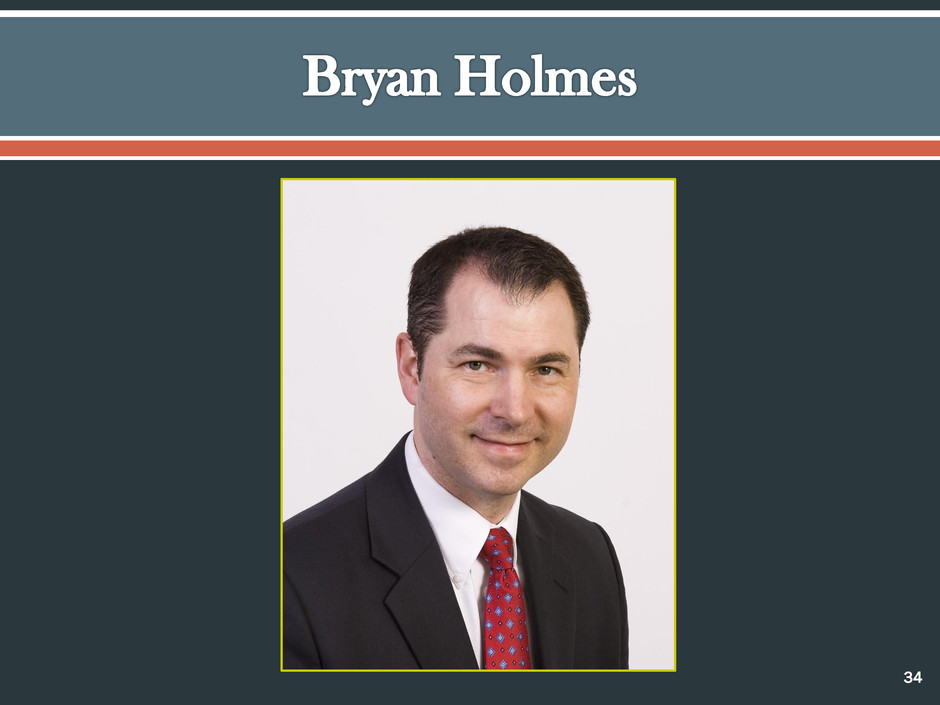
34
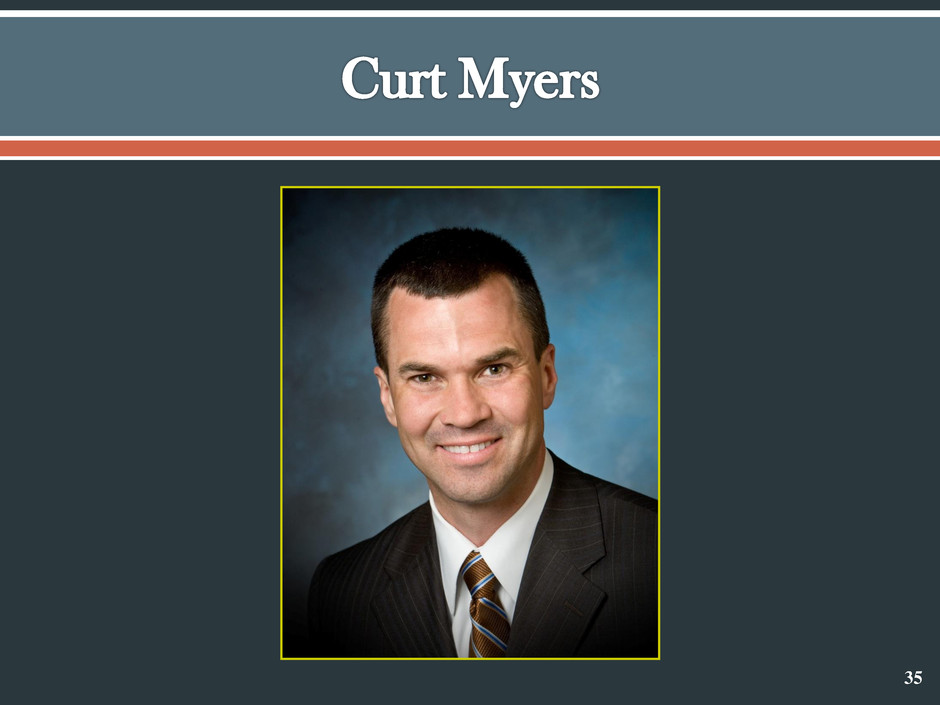
35

36
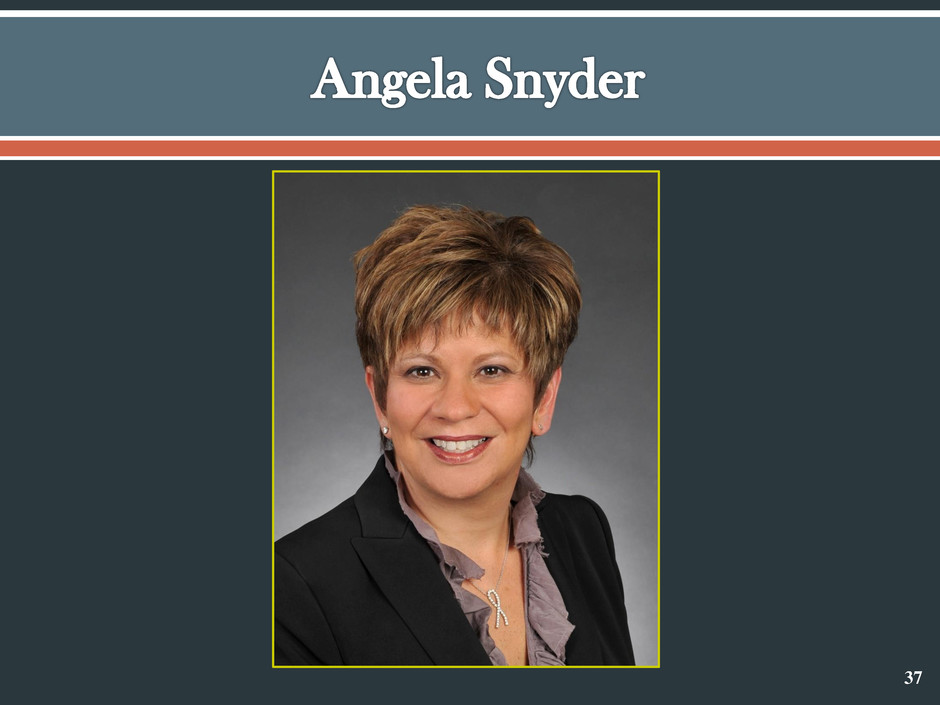
37
38

39 REPORT OF THE JUDGE OF ELECTIONS
ANNUAL SHAREHOLDERS’ MEETING April 29, 2013 40

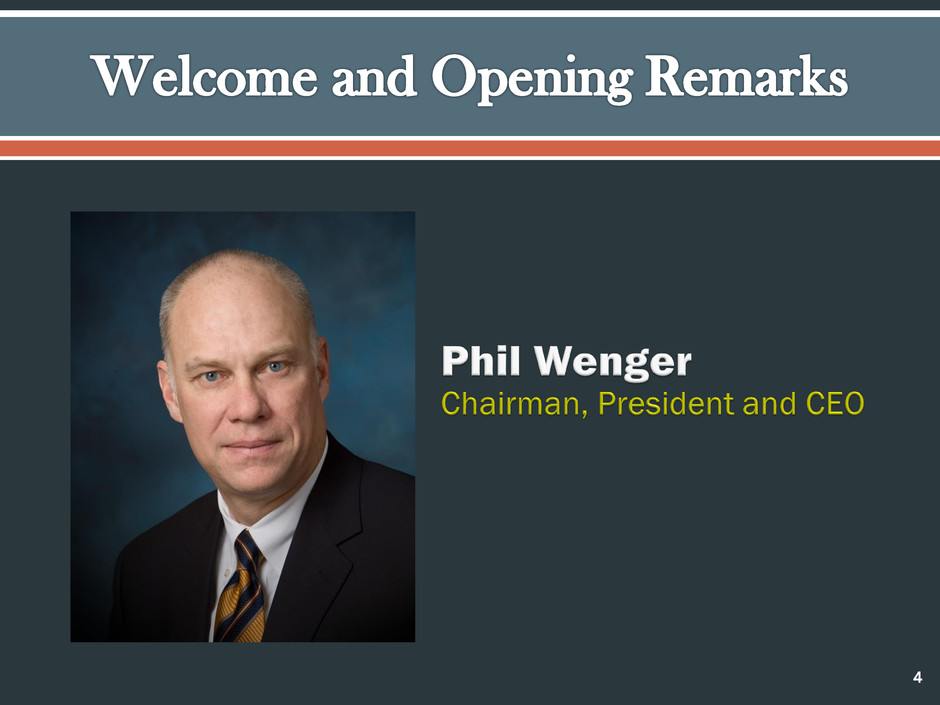
A LOOK BACK AND A LOOK AHEAD Phil Wenger Chairman, President and CEO 41
Solid financial results: Growth in earnings per share Increased return on assets Growth in core deposit base Increased non-interest income Improved asset quality Reduced provision for credit losses 42

EARNINGS, STOCK AND ANALYSTS’ VIEWS 43

44 Actual EPS Rank Company Name State 2012Y 2011Y % Change 1 BancorpSouth, Inc. MS $0.90 $0.45 100.0% 2 Susquehanna Bancshares, Inc. PA $0.77 $0.40 92.5% 3 Associated Banc-Corp WI $1.00 $0.66 51.5% 4 People's United Financial, Inc. CT $0.72 $0.55 30.9% 5 BOK Financial Corporation OK $5.13 $4.17 23.0% 6 City National Corporation CA $3.83 $3.21 19.3% 7 Webster Financial Corporation CT $1.86 $1.61 15.5% 8 UMB Financial Corporation MO $3.04 $2.64 15.2% 9 FirstMerit Corporation OH $1.22 $1.10 10.9% 10 Fulton Financial Corporation PA $0.80 $0.73 9.6% 11 Cullen/Frost Bankers, Inc. TX $3.86 $3.54 9.0% 12 Commerce Bancshares, Inc. MO $2.90 $2.69 7.8% 13 Valley National Bancorp NJ $0.73 $0.74 -1.4% 14 International Bancshares Corporation TX $1.39 $1.69 -17.8% 15 First Niagara Financial Group, Inc. NY $0.40 $0.64 -37.5% 16 First Horizon National Corporation TN -$0.11 $0.50 -122.0% 17 TCF Financial Corporation MN -$1.37 $0.71 -293.0% 18 Synovus Financial Corp. GA $0.85 -$0.15 NM Average -5.1% Median 10.9%

45 $- $0.05 $0.10 $0.15 $0.20 $0.25 Q1 2009 Q2 2009 Q3 2009 Q4 2009 Q1 2010 Q2 2010 Q3 2010 Q4 2010 Q1 2011 Q2 2011 Q3 2011 Q4 2011 Q1 2012 Q2 2012 Q3 2012 Q4 2012

46 $97.84 $85.06 $60 $80 $100 $120 12/31/07 12/31/08 12/31/09 12/31/10 12/31/11 12/31/12 In ve st m en t V al ue (1 ) FULT Peer (1) Value of an investment of $100.00 made on December 31, 2007 in FULT and the peer group, assuming all dividends were reinvested in such securities over the past 5 years. 46
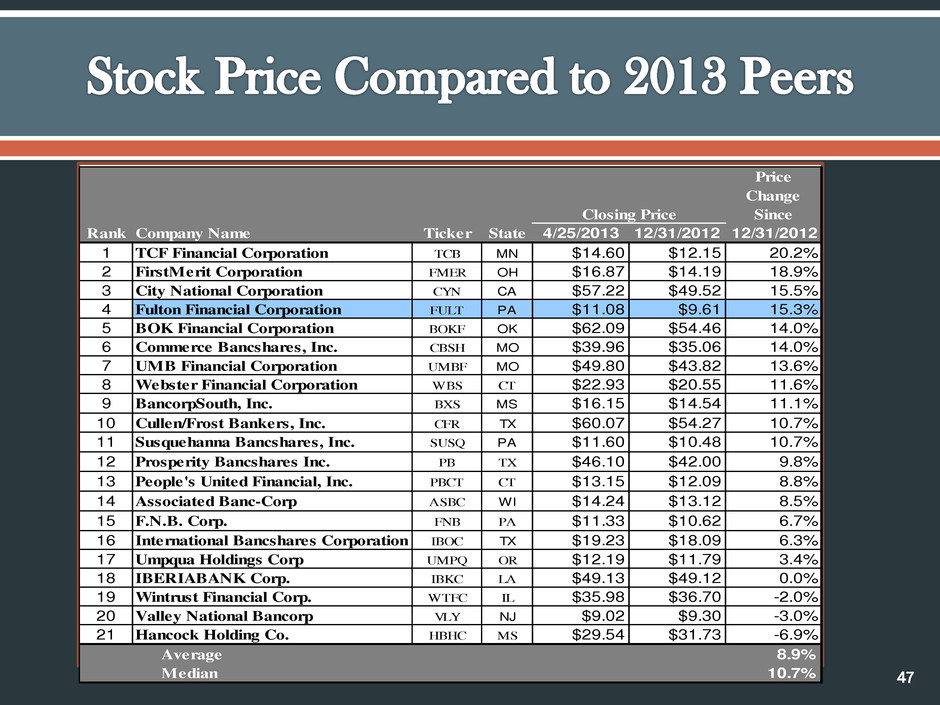
Closing Price Price Change Since Rank Company Name Ticker State 4/25/2013 12/31/2012 12/31/2012 1 TCF Financial Corporation TCB MN $14.60 $12.15 20.2% 2 FirstMerit Corporation FMER OH $16.87 $14.19 18.9% 3 City National Corporation CYN CA $57.22 $49.52 15.5% 4 Fulton Financial Corporation FULT PA $11.08 $9.61 15.3% 5 BOK Financial Corporation BOKF OK $62.09 $54.46 14.0% 6 Commerce Bancshares, Inc. CBSH MO $39.96 $35.06 14.0% 7 UMB Financial Corporation UMBF MO $49.80 $43.82 13.6% 8 Webster Financial Corporation WBS CT $22.93 $20.55 11.6% 9 BancorpSouth, Inc. BXS MS $16.15 $14.54 11.1% 10 Cullen/Frost Bankers, Inc. CFR TX $60.07 $54.27 10.7% 11 Susquehanna Bancshares, Inc. SUSQ PA $11.60 $10.48 10.7% 12 Prosperity Bancshares Inc. PB TX $46.10 $42.00 9.8% 13 People's United Financial, Inc. PBCT CT $13.15 $12.09 8.8% 14 Associated Banc-Corp ASBC WI $14.24 $13.12 8.5% 15 F.N.B. Corp. FNB PA $11.33 $10.62 6.7% 16 International Bancshares Corporation IBOC TX $19.23 $18.09 6.3% 17 Umpqua Holdings Corp UMPQ OR $12.19 $11.79 3.4% 18 IBERIABANK Corp. IBKC LA $49.13 $49.12 0.0% 19 Wintrust Financial Corp. WTFC IL $35.98 $36.70 -2.0% 20 Valley National Bancorp VLY NJ $9.02 $9.30 -3.0% 21 Hancock Holding Co. HBHC MS $29.54 $31.73 -6.9% Average 8.9% Median 10.7% 47
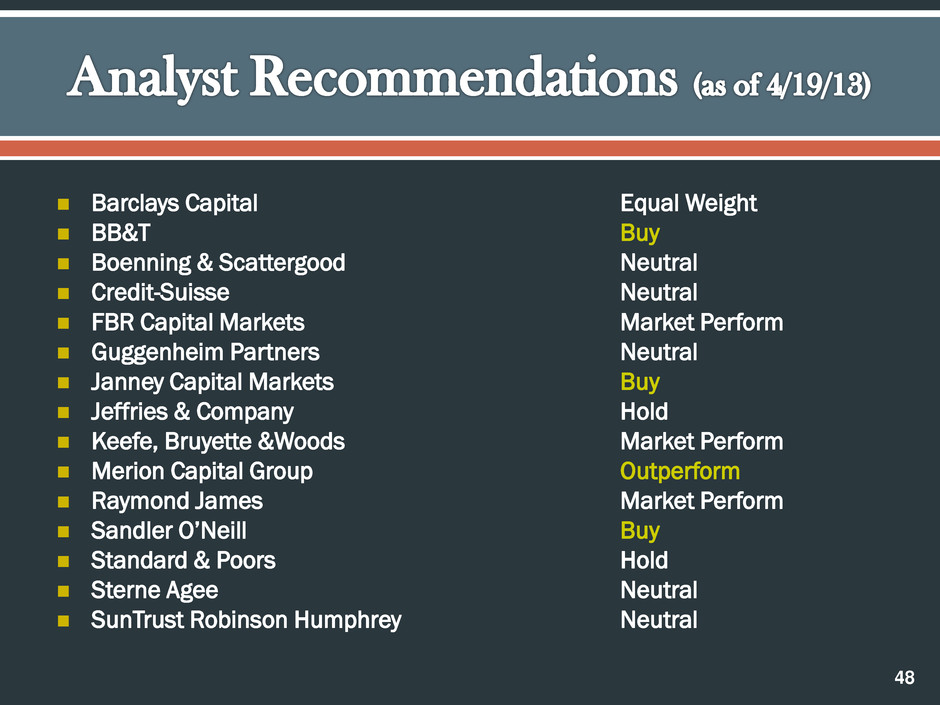
Barclays Capital Equal Weight BB&T Buy Boenning & Scattergood Neutral Credit-Suisse Neutral FBR Capital Markets Market Perform Guggenheim Partners Neutral Janney Capital Markets Buy Jeffries & Company Hold Keefe, Bruyette &Woods Market Perform Merion Capital Group Outperform Raymond James Market Perform Sandler O’Neill Buy Standard & Poors Hold Sterne Agee Neutral SunTrust Robinson Humphrey Neutral 48

49 Source: SNL Financial LC Median EPS Estimate Rank Company Name State 2013Y 2012Y % Change 1 Hancock Holding Co. MS $2.50 $1.75 42.9% 2 IBERIABANK Corp. LA $3.25 $2.59 25.5% 3 Susquehanna Bancshares, Inc. PA $0.93 $0.77 20.8% 4 International Bancshares Corporation TX $1.51 $1.39 8.6% 5 People's United Financial, Inc. CT $0.78 $0.72 8.3% 6 Prosperity Bancshares Inc. TX $3.49 $3.23 7.9% 7 Wintrust Financial Corp. IL $2.48 $2.31 7.4% 8 F.N.B. Corp. PA $0.85 $0.79 7.0% 9 FirstMerit Corporation OH $1.30 $1.22 6.6% 10 Fulton Financial Corporation PA $0.84 $0.80 5.0% 11 BancorpSouth, Inc. MS $0.94 $0.90 4.4% 12 Associated Banc-Corp WI $1.04 $1.00 4.0% 13 Cullen/Frost Bankers, Inc. TX $3.90 $3.86 1.0% 14 Webster Financial Corporation CT $1.87 $1.86 0.3% 15 City National Corporation CA $3.83 $3.83 -0.1% 16 Commerce Bancshares, Inc. MO $2.83 $2.90 -2.4% 17 Umpqua Holdings Corp MO $0.87 $0.90 -3.9% 18 UMB Financial Corporation MO $2.81 $3.04 -7.6% 19 Valley National Bancorp NJ $0.67 $0.73 -8.2% 20 BOK Financial Corporation OK $4.63 $5.13 -9.7% 21 TCF Financial Corporation MN $0.85 -$1.37 NM Average 5.9% Median 4.7%

INCREASED RETURN ON AVERAGE ASSETS 50
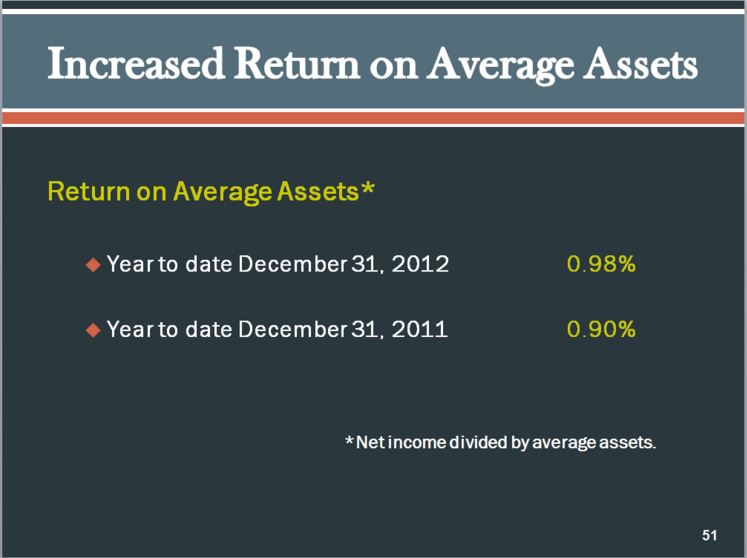
Return on Average Assets* Year to date December 31, 2012 0.98% Year to date December 31, 2011 0.90% *Net income divided by average assets. 51
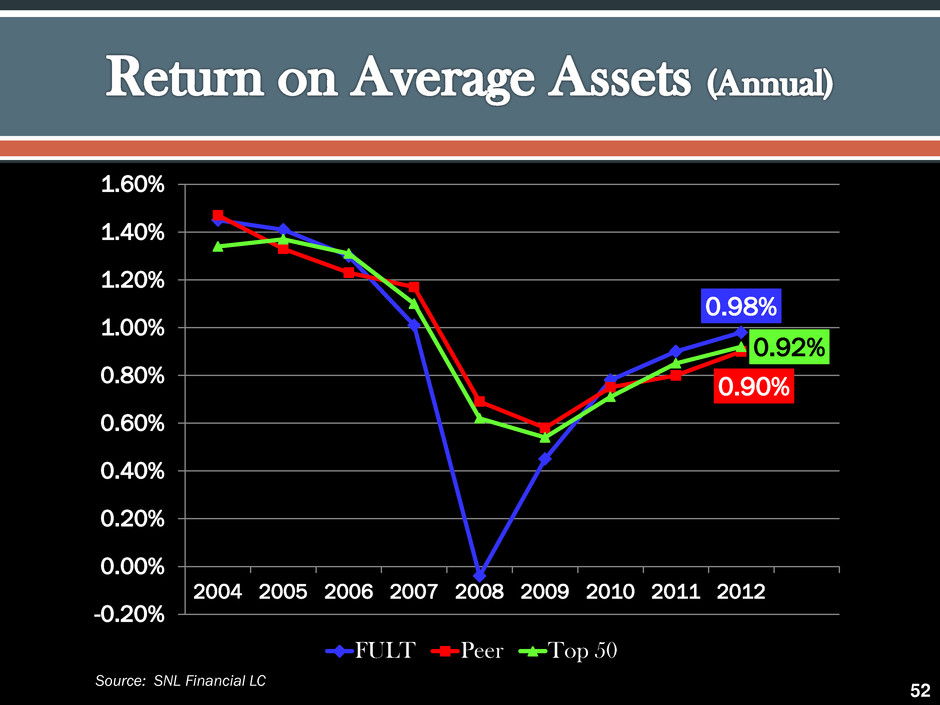
52 0.98% 0.90% 0.92% -0.20% 0.00% 0.20% 0.40% 0.60% 0.80% 1.00% 1.20% 1.40% 1.60% 2004 2005 2006 2007 2008 2009 2010 2011 2012 FULT Peer Top 50 Source: SNL Financial LC

GROWTH 53
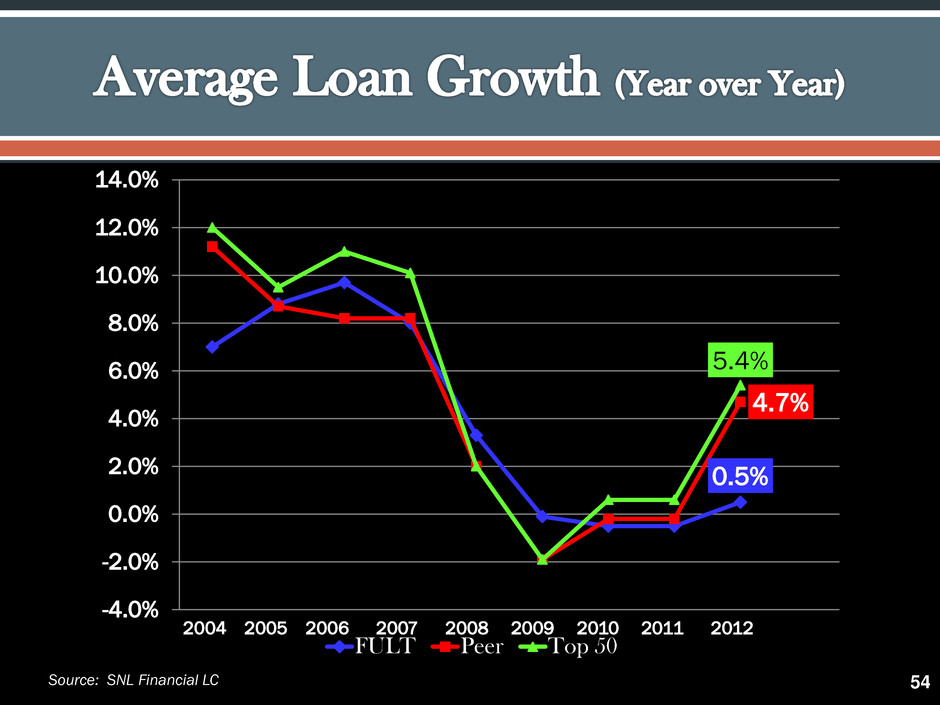
54 2004 2005 2006 2007 2008 2009 2010 2011 2012 0.5% 4.7% 5.4% -4.0% -2.0% 0.0% 2.0% 4.0% 6.0% 8.0% 10.0% 12.0% 14.0% FULT Peer Top 50 Source: SNL Financial LC

55 2004 2005 2006 2007 2008 2009 2010 2011 2012 6.3% 10.1% 13.1% -5.0% 0.0% 5.0% 10.0% 15.0% 20.0% FULT Peer Top 50 * Average total deposits, less average certificates of deposit Source: SNL Financial LC
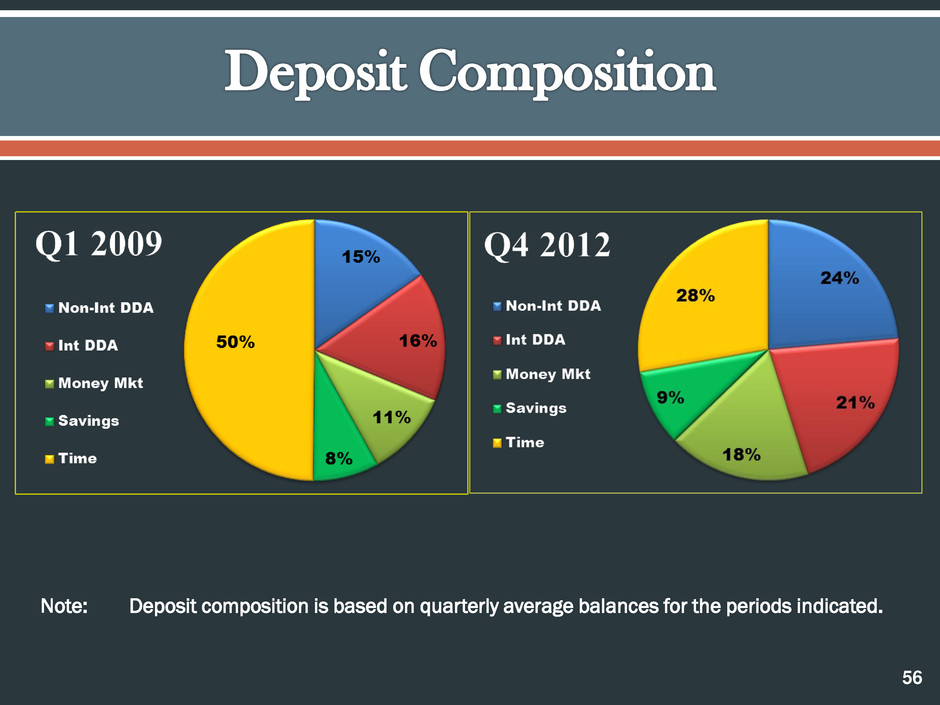
56 Note: Deposit composition is based on quarterly average balances for the periods indicated.

57 3.65% 3.41% 3.38% 3.00% 3.20% 3.40% 3.60% 3.80% 4.00% Q1 2009 Q2 2009 Q3 2009 Q4 2009 Q1 2010 Q2 2010 Q3 2010 Q4 2010 Q1 2011 Q2 2011 Q3 2011 Q4 2011 Q1 2012 Q2 2012 Q3 2012 Q4 2012 FULT Peer Top 50 * Fully taxable equivalent Source: SNL Financial LC 57
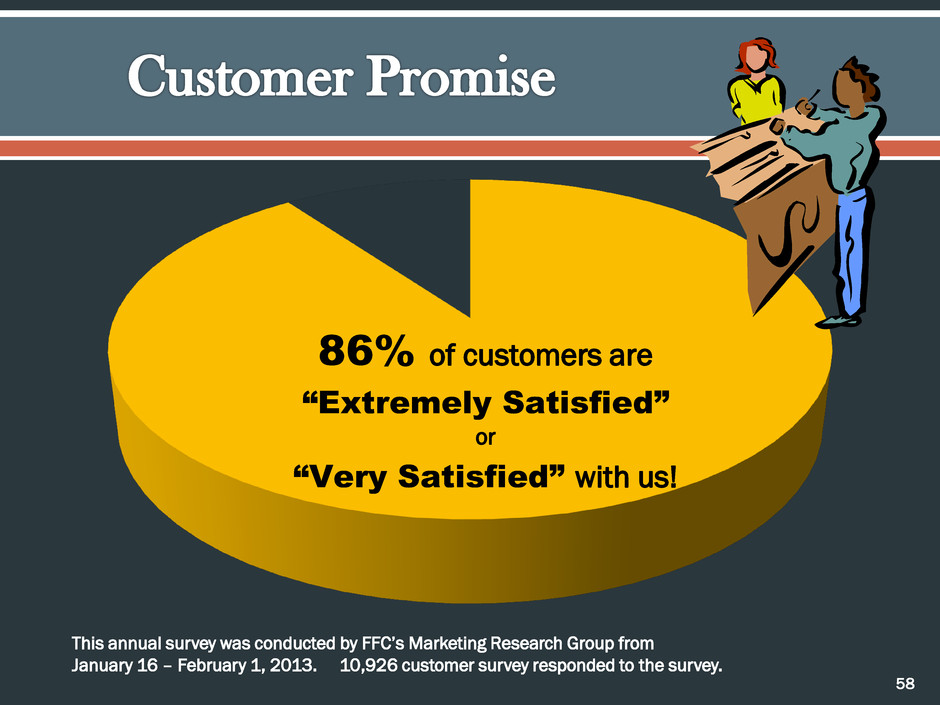
86% of customers are “Extremely Satisfied” or “Very Satisfied” with us! 58 This annual survey was conducted by FFC’s Marketing Research Group from January 16 – February 1, 2013. 10,926 customer survey responded to the survey.
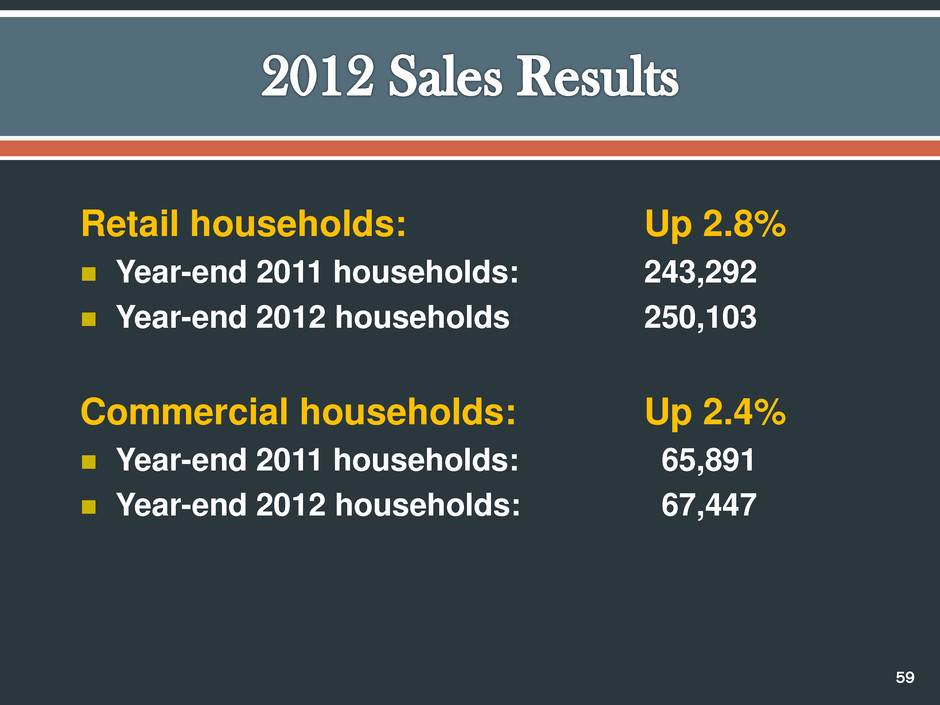
Retail households: Up 2.8% Year-end 2011 households: 243,292 Year-end 2012 households: 250,103 Commercial households: Up 2.4% Year-end 2011 households: 65,891 Year-end 2012 households: 67,447 59

INCREASED NON-INTEREST INCOME 60
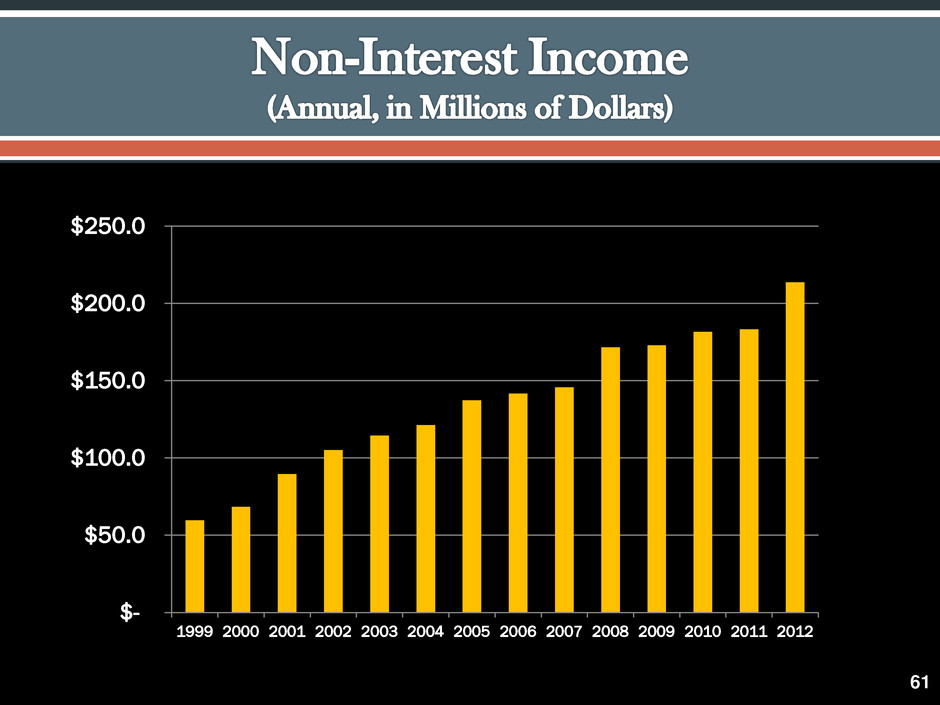
61 $- $50.0 $100.0 $150.0 $200.0 $250.0 1999 2000 2001 2002 2003 2004 2005 2006 2007 2008 2009 2010 2011 2012 Series 1
IMPROVED ASSET QUALITY & REDUCED PROVISION FOR CREDIT LOSSES 62

63 1.52% 1.35% 1.20% 0.00% 0.25% 0.50% 0.75% 1.00% 1.25% 1.50% 1.75% 2.00% 2.25% 2.50% 2.75% 2004 2005 2006 2007 2008 2009 2010 2011 2012 FULT Peer Top 50 Source: SNL Financial LC

64 $- $5.0 $10.0 $15.0 $20.0 $25.0 $30.0 $35.0 $40.0 $45.0 $50.0 Q4 2009 Q1 2010 Q2 2010 Q3 2010 Q4 2010 Q1 2011 Q2 2011 Q3 2011 Q4 2011 Q1 2012 Q2 2012 Q3 2012 Q4 2012 Series 1 64

CAPITAL 65

66 11.0% 12.0% 13.0% 14.0% 15.0% 16.0% 2001 2002 2003 2004 2005 2006 2007 2008 2009 2010 2011 2012 (est)

Fulton Financial Well- Capitalized Total Risk-Based Capital Ratio 15.60% 10.00% Tier 1 Risk-Based Capital Ratio 13.40% 6.00% Tier 1 Leverage Ratio 10.95% 5.00% 67
Reinvesting into profitable business lines Increased quarterly cash dividend twice in 2012 Repurchasing our stock 68
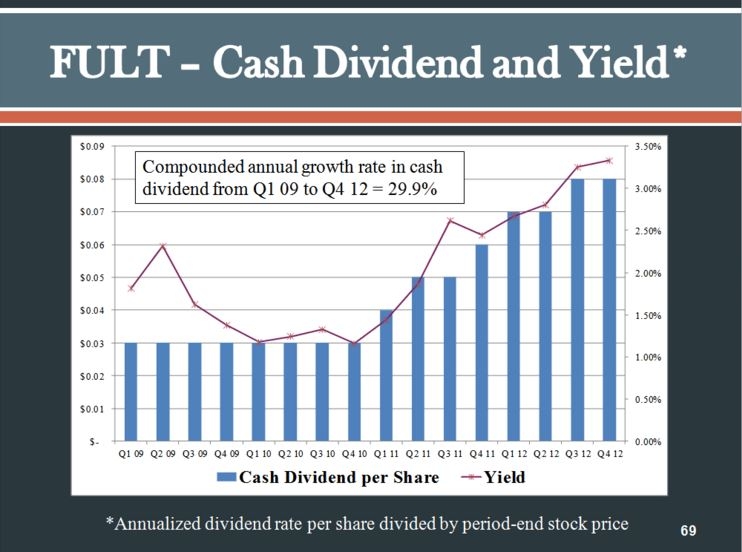
69 0.00% 0.50% 1.00% 1.50% 2.00% 2.50% 3.00% 3.50% $- $0.01 $0.02 $0.03 $0.04 $0.05 $0.06 $0.07 $0.08 $0.09 Q1 09 Q2 09 Q3 09 Q4 09 Q1 10 Q2 10 Q3 10 Q4 10 Q1 11 Q2 11 Q3 11 Q4 11 Q1 12 Q2 12 Q3 12 Q4 12 Cash Dividend per Share Yield Compounded annual growth rate in cash dividend from Q1 09 to Q4 12 = 29.9% *Annualized dividend rate per share divided by period-end stock price
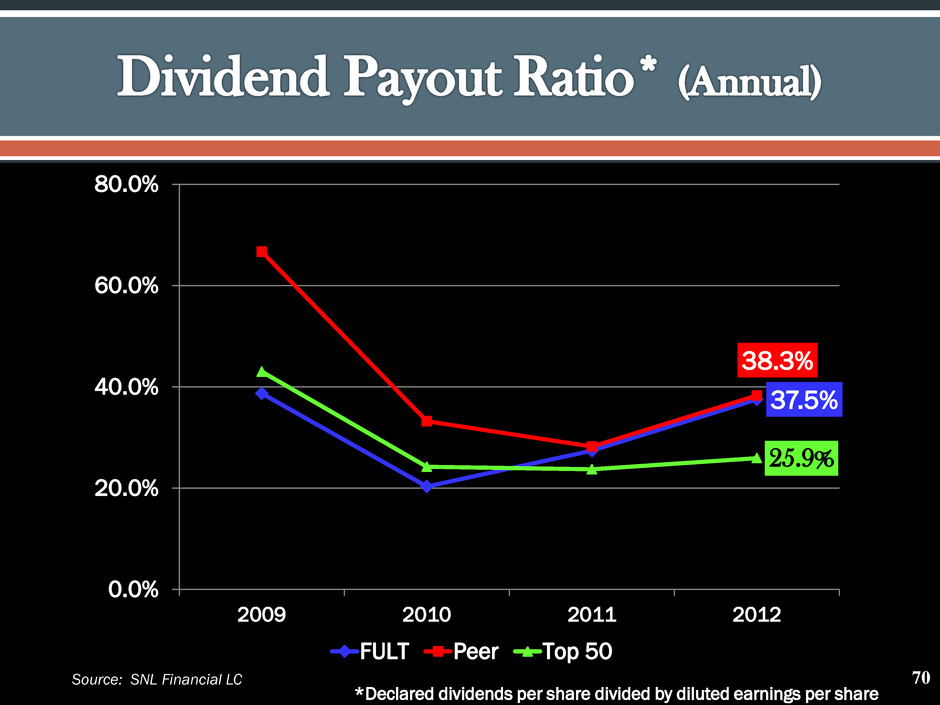
70 37.5% 38.3% 25.9% 0.0% 20.0% 40.0% 60.0% 80.0% 2009 2010 2011 2012 FULT Peer Top 50 *Declared dividends per share divided by diluted earnings per share Source: SNL Financial LC 70
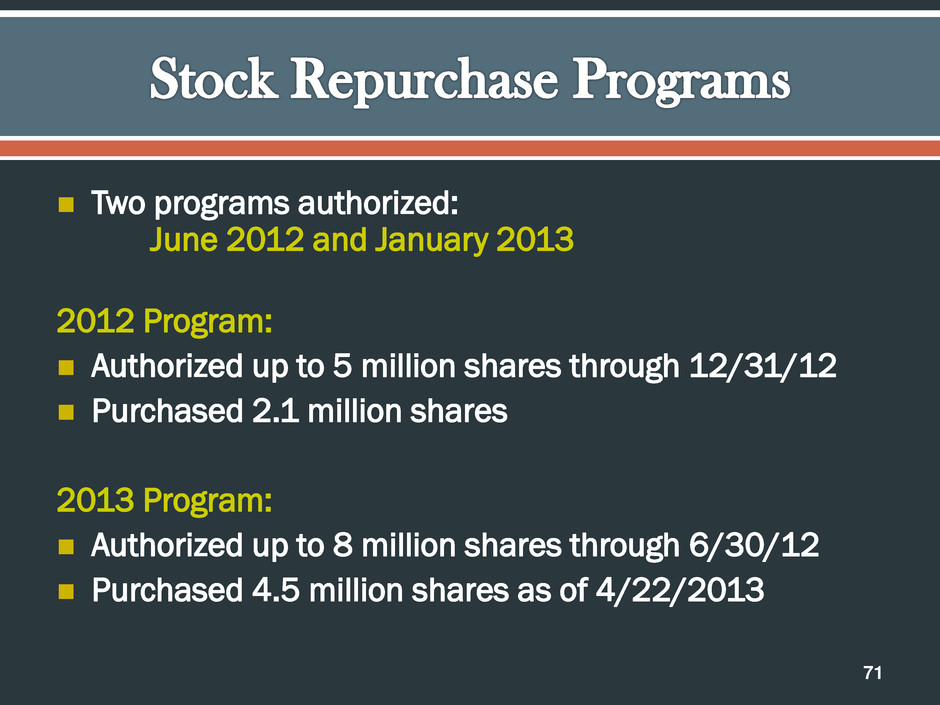
71 Two programs authorized: June 2012 and January 2013 2012 Program: Authorized up to 5 million shares through 12/31/12 Purchased 2.1 million shares 2013 Program: Authorized up to 8 million shares through 6/30/12 Purchased 4.5 million shares as of 4/22/2013

OUR OPERATIONS 72
73
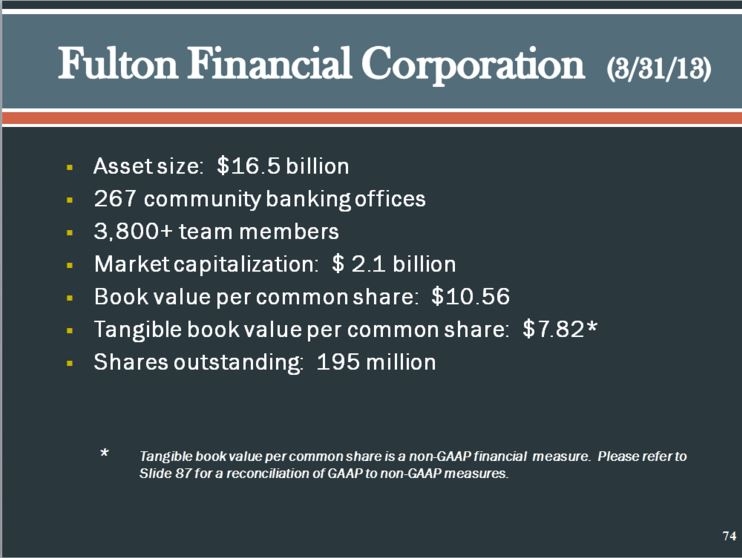
Asset size: $16.5 billion 267 community banking offices 3,800+ team members Market capitalization: $ 2.1 billion Book value per common share: $10.56 Tangible book value per common share: $7.82* Shares outstanding: 195 million * Tangible book value per common share is a non-GAAP financial measure. Please refer to Slide 87 for a reconciliation of GAAP to non-GAAP measures. 74

75 57.6% 63.0% 63.1% 50.0% 52.0% 54.0% 56.0% 58.0% 60.0% 62.0% 64.0% 66.0% 2005 2006 2007 2008 2009 2010 2011 2012 FULT Peer Top 50 Source: SNL Financial LC 75

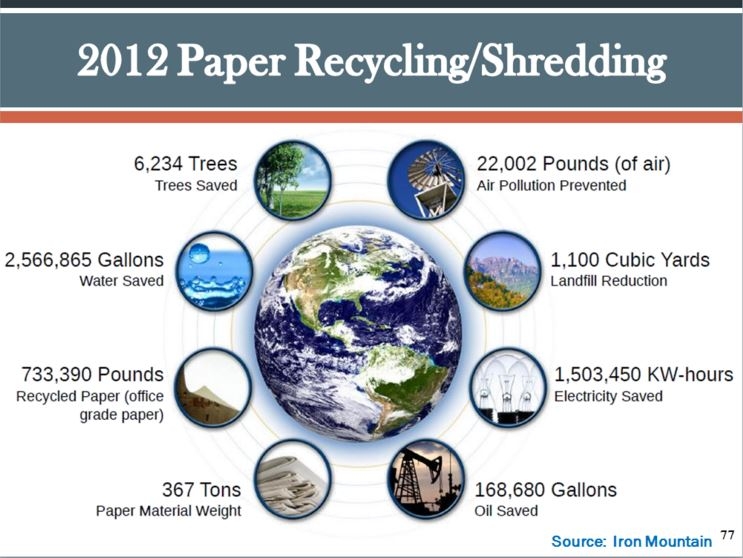
2012 Goal: $1,214,000 Hard Dollar Savings: $1,900,127 Soft Dollar Savings: $1,080,986 TOTAL: $2,981,113 76
77 Source: Iron Mountain 77

High efficiency heat & air conditioning systems, lighting and lighting controls, and appliances. Low VOC paint and carpet adhesive. Flooring finishes - carpet, vinyl, tile incorporate recycled material. Attractive, efficient use of space Ergonomics factored in when designing space and purchasing furniture and equipment 78
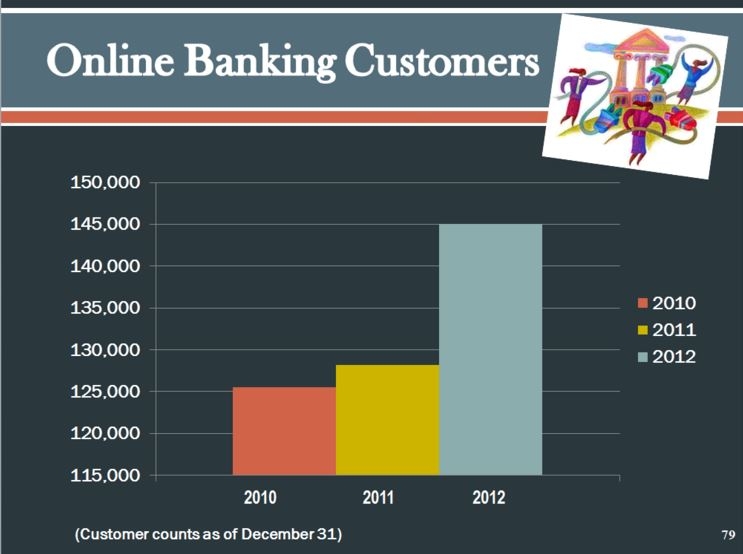
115,000 120,000 125,000 130,000 135,000 140,000 145,000 150,000 2010 2011 2012 2010 2011 2012 (Customer counts as of December 31) 79

THE FUTURE 80
Managing our net interest margin Regulatory pressures on our industry Risk management and compliance Expense management 81

Number of transactions (in millions) 0 5 10 15 20 25 30 35 Fee Income (in millions) $0.0 $2.0 $4.0 $6.0 $8.0 $10.0 $12.0 82 2010 2011 2012 2010 2011 2012

Grow our presence and customer base Realize operating efficiencies Benefiting from added risk management and compliance expertise Leveraging new technological capabilities 83
ANNUAL SHAREHOLDERS’ MEETING April 29, 2013 84

QUESTIONS AND ANSWERS 85
ANNUAL SHAREHOLDERS’ MEETING April 29, 2013 86

87 References to Peers. Fulton Financial Corporation compares its performance to a group of similar financial holding companies located in the United States selected by Fulton based on asset size, loan distribution, revenue composition, geographic focus, ownership and market capitalization. For comparisons of Fulton’s results for 2012 and earlier periods, the peer group consisted of the following institutions: Associated Banc-Corp; BancorpSouth, Inc.; BOK Financial Corporation; City National Corporation; Commerce Bancshares, Inc.; Cullen/Frost Bankers, Inc.; First Horizon National Corporation; FirstMerit Corporation; First Niagara Financial Group, Inc.; International Bancshares Corporation; People’s United Financial, Inc.; Susquehanna Bancshares, Inc.; Synovus Financial Corp.; TCF Financial Corporation; UMB Financial Corporation; Valley National Bancorp; and Webster Financial Corporation. References to Top 50. Comparisons of Fulton’s results to those of the “Top 50” for all periods are to the 50 largest (in asset size) publicly traded domestic bank and thrift holding companies as of December 31, 2011. Excludes credit card companies. Source: SNL Financial Peer and Top 50 information shown on the graphs in this presentation represent the median for each of those groups. Slide 74. Reconciliation of tangible book value per common share at March 31, 2013 (000’s omitted, except per share amount) Shareholders’ Equity $2,061,763 Less: Goodwill and Intangible Assets $ 534,987 Tangible Shareholders’ Equity $1,526,776 Divided by: Common shares outstanding 195,276 Tangible book value per common share $ 7.82
ANNUAL SHAREHOLDERS’ MEETING April 29, 2013 88


