INVESTOR PRESENTATION z Data as of September 30, 2018 - Unless otherwise noted
Forward-Looking Statements This presentation may contain forward-looking statements with respect to the Corporation’s financial condition, results of operations and business. Do not unduly rely on forward-looking statements. Forward-looking statements can be identified by the use of words such as "may," "should," "will," "could," "estimates," "predicts," "potential," "continue," "anticipates," "believes," "plans," "expects," "future," "intends," “projects,” the negative of these terms and other comparable terminology. These forward looking statements may include projections of, or guidance on, the Corporation’s future financial performance, expected levels of future expenses, anticipated growth strategies, descriptions of new business initiatives and anticipated trends in the Corporation’s business or financial results. Forward-looking statements are neither historical facts, nor assurance of future performance. Instead, they are based on current beliefs, expectations and assumptions regarding the future of the Corporation’s business, future plans and strategies, projections, anticipated events and trends, the economy and other future conditions. Because forward-looking statements relate to the future, they are subject to inherent uncertainties, risks and changes in circumstances that are difficult to predict and many of which are outside of the Corporation’s control, and actual results and financial condition may differ materially from those indicated in the forward-looking statements. Therefore, you should not unduly rely on any of these forward-looking statements. Any forward-looking statement is based only on information currently available and speaks only as of the date when made. The Corporation undertakes no obligation, other than as required by law, to update or revise any forward-looking statements, whether as a result of new information, future events or otherwise. A discussion of certain risks and uncertainties affecting the Corporation, and some of the factors that could cause the Corporation’s actual results to differ materially from those described in the forward-looking statements, can be found in the sections entitled “Risk Factors” and “Management’s Discussion and Analysis of Financial Condition and Results of Operations” in the Corporation’s Annual Report on Form 10-K for the year ended December 31, 2017 and Quarterly Reports on Form 10-Q for the quarters ended March 31, 2018 and June 30, 2018 and other periodic reports, which the Corporation files with the Securities and Exchange Commission and are available in the Investor Relations section of the Corporation’s website (www.fult.com) and on the Securities and Exchange Commission’s website (www.sec.gov). The Corporation uses certain non-GAAP financial measures in this presentation. These non-GAAP financial measures are reconciled to the most comparable GAAP measures at the end of this presentation. 2
Why Fulton? . Deep Executive Bench with Continuity . Valuable Franchise in Attractive Markets . Investing in People to Drive Growth . Relationship Banking Strategy Focused on the Customer Experience . Granular, Well-Diversified Loan Portfolio . Attractive, Low-Cost Core Deposit Profile . Solid Asset Quality and Reserves . Well-Positioned Balance Sheet for Rising Interest Rates . Prudent Expense Management with Opportunities to Improve . Excess Capital to Deploy 3
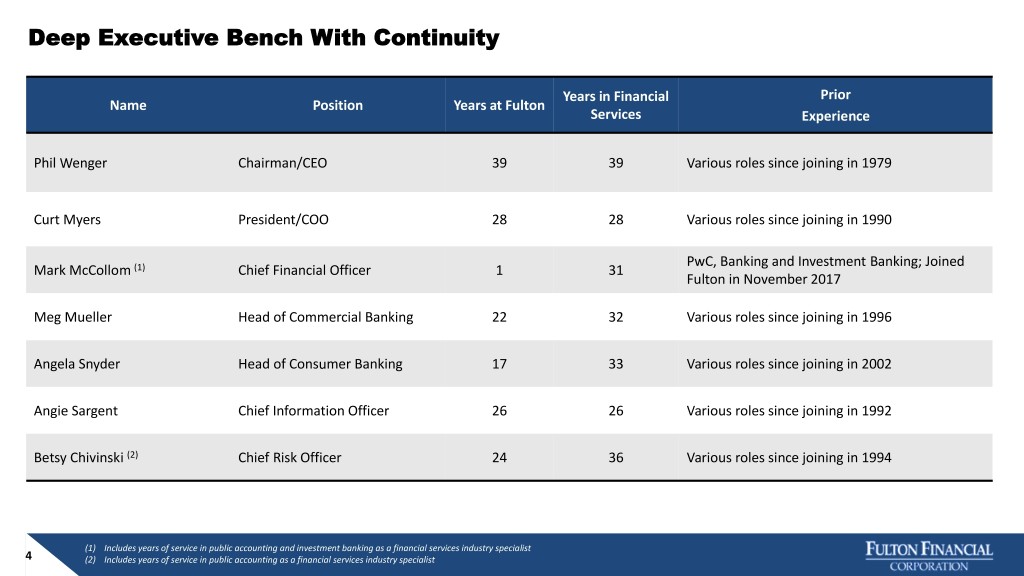
Deep Executive Bench With Continuity Years in Financial Prior Name Position Years at Fulton Services Experience Phil Wenger Chairman/CEO 39 39 Various roles since joining in 1979 Curt Myers President/COO 28 28 Various roles since joining in 1990 PwC, Banking and Investment Banking; Joined Mark McCollom (1) Chief Financial Officer 1 31 Fulton in November 2017 Meg Mueller Head of Commercial Banking 22 32 Various roles since joining in 1996 Angela Snyder Head of Consumer Banking 17 33 Various roles since joining in 2002 Angie Sargent Chief Information Officer 26 26 Various roles since joining in 1992 Betsy Chivinski (2) Chief Risk Officer 24 36 Various roles since joining in 1994 (1) Includes years of service in public accounting and investment banking as a financial services industry specialist 4 (2) Includes years of service in public accounting as a financial services industry specialist

A Valuable Franchise . ~240 financial centers throughout the Mid-Atlantic . Asset size of $20.4 billion . 3,600+ team members (3,530 FTEs (1)) . Market capitalization of $2.9 billion (2) . Opportunity to meaningfully grow our market share(3) o ~16% deposit market share across the 15 counties where we have a Top 5 deposit market share; Represents 58% of our total deposits o ~1% deposit market share across the 37 counties where we do not have a Top 5 deposit market share; Represents 42% of our total deposits (Merging with Fulton Bank in 4Q18) (Merging with Fulton Bank in 4Q18) (1) Average full-time equivalent employees. (2) Based on shares outstanding as of September 30, 2018 and the closing price as of September 28, 2018 (3) Data as of June 30, 2018 per S&P Global 5 Market Intelligence (4) Includes FNB Bank and Swineford National Bank that were consolidated early 4Q18 ; Map includes Fulton Financial counties with a financial center and/or a loan production office (“LPO”), and incorporated cities in MD and VA with a financial center and/or LPO
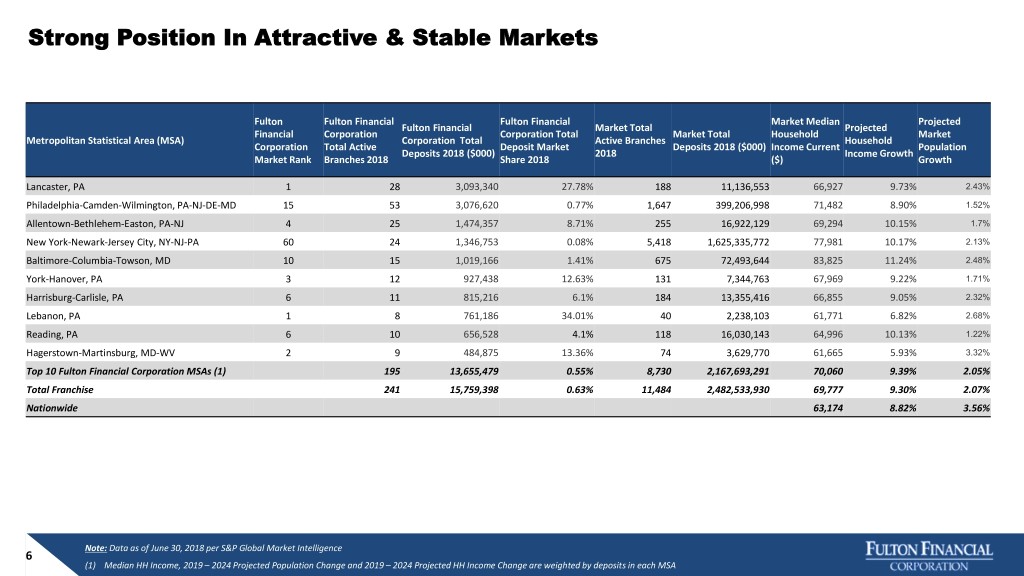
Strong Position In Attractive & Stable Markets Fulton Fulton Financial Fulton Financial Market Median Projected Fulton Financial Market Total Projected Financial Corporation Corporation Total Market Total Household Market Metropolitan Statistical Area (MSA) Corporation Total Active Branches Household Corporation Total Active Deposit Market Deposits 2018 ($000) Income Current Population Deposits 2018 ($000) 2018 Income Growth Market Rank Branches 2018 Share 2018 ($) Growth Lancaster, PA 1 28 3,093,340 27.78% 188 11,136,553 66,927 9.73% 2.43% Philadelphia-Camden-Wilmington, PA-NJ-DE-MD 15 53 3,076,620 0.77% 1,647 399,206,998 71,482 8.90% 1.52% Allentown-Bethlehem-Easton, PA-NJ 4 25 1,474,357 8.71% 255 16,922,129 69,294 10.15% 1.7% New York-Newark-Jersey City, NY-NJ-PA 60 24 1,346,753 0.08% 5,418 1,625,335,772 77,981 10.17% 2.13% Baltimore-Columbia-Towson, MD 10 15 1,019,166 1.41% 675 72,493,644 83,825 11.24% 2.48% York-Hanover, PA 3 12 927,438 12.63% 131 7,344,763 67,969 9.22% 1.71% Harrisburg-Carlisle, PA 6 11 815,216 6.1% 184 13,355,416 66,855 9.05% 2.32% Lebanon, PA 1 8 761,186 34.01% 40 2,238,103 61,771 6.82% 2.68% Reading, PA 6 10 656,528 4.1% 118 16,030,143 64,996 10.13% 1.22% Hagerstown-Martinsburg, MD-WV 2 9 484,875 13.36% 74 3,629,770 61,665 5.93% 3.32% Top 10 Fulton Financial Corporation MSAs (1) 195 13,655,479 0.55% 8,730 2,167,693,291 70,060 9.39% 2.05% Total Franchise 241 15,759,398 0.63% 11,484 2,482,533,930 69,777 9.30% 2.07% Nationwide 63,174 8.82% 3.56% Note: Data as of June 30, 2018 per S&P Global Market Intelligence 6 (1) Median HH Income, 2019 – 2024 Projected Population Change and 2019 – 2024 Projected HH Income Change are weighted by deposits in each MSA
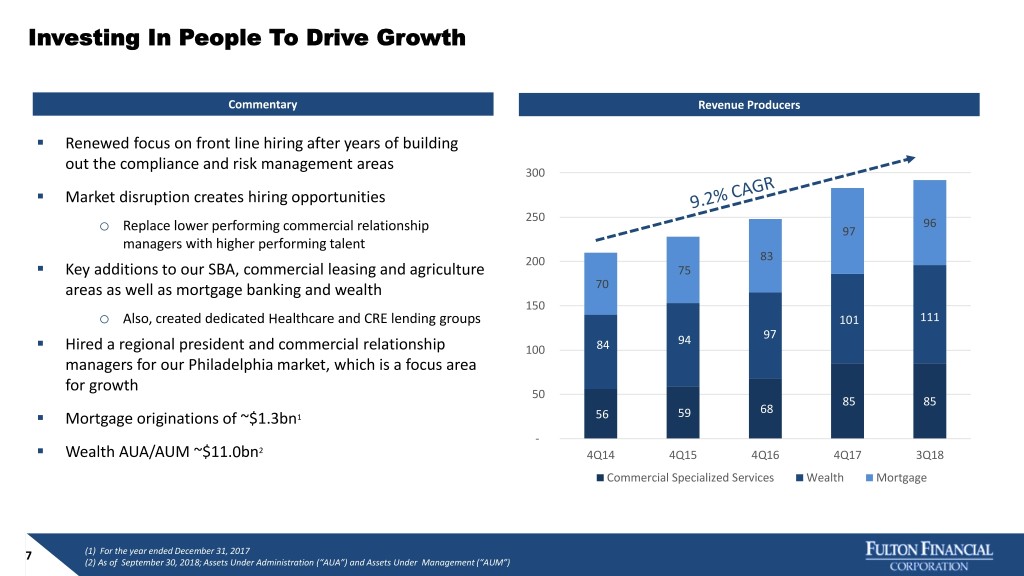
Investing In People To Drive Growth Commentary Revenue Producers . Renewed focus on front line hiring after years of building out the compliance and risk management areas 300 . Market disruption creates hiring opportunities 250 96 o Replace lower performing commercial relationship 97 managers with higher performing talent . 200 83 Key additions to our SBA, commercial leasing and agriculture 75 areas as well as mortgage banking and wealth 70 150 o Also, created dedicated Healthcare and CRE lending groups 101 111 . 94 97 Hired a regional president and commercial relationship 100 84 managers for our Philadelphia market, which is a focus area for growth 50 85 85 . 59 68 Mortgage originations of ~$1.3bn1 56 . - Wealth AUA/AUM ~$11.0bn2 4Q14 4Q15 4Q16 4Q17 3Q18 Commercial Specialized Services Wealth Mortgage 7 (1) For the year ended December 31, 2017 (2) As of September 30, 2018; Assets Under Administration (“AUA”) and Assets Under Management (“AUM”)
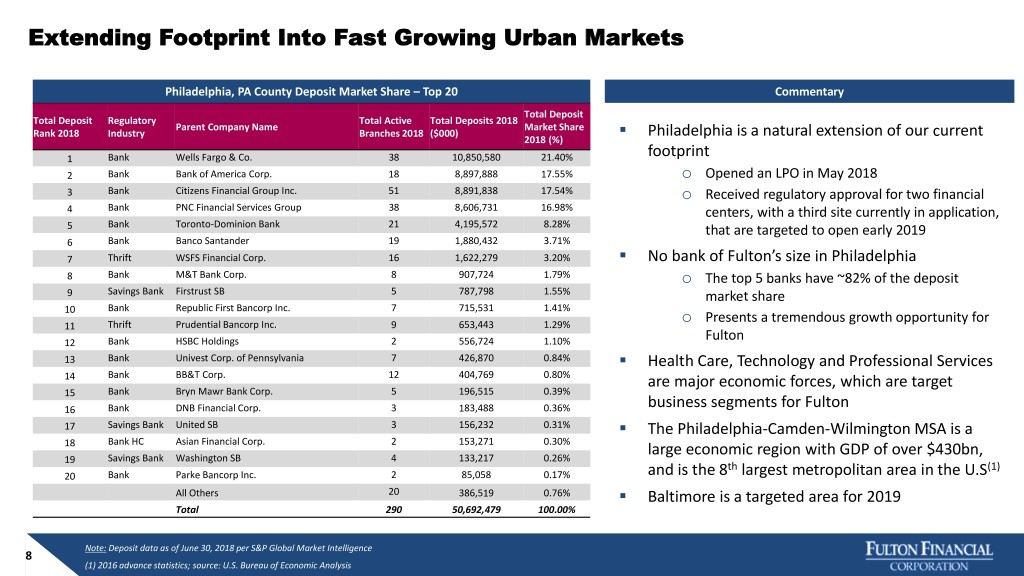
Extending Footprint Into Fast Growing Urban Markets Philadelphia, PA County Deposit Market Share – Top 20 Commentary Total Deposit Total Deposit Regulatory Total Active Total Deposits 2018 Parent Company Name Market Share . Rank 2018 Industry Branches 2018 ($000) Philadelphia is a natural extension of our current 2018 (%) 1 Bank Wells Fargo & Co. 38 10,850,580 21.40% footprint 2 Bank Bank of America Corp. 18 8,897,888 17.55% o Opened an LPO in May 2018 3 Bank Citizens Financial Group Inc. 51 8,891,838 17.54% o Received regulatory approval for two financial 4 Bank PNC Financial Services Group 38 8,606,731 16.98% centers, with a third site currently in application, 5 Bank Toronto-Dominion Bank 21 4,195,572 8.28% that are targeted to open early 2019 6 Bank Banco Santander 19 1,880,432 3.71% . 7 Thrift WSFS Financial Corp. 16 1,622,279 3.20% No bank of Fulton’s size in Philadelphia 8 Bank M&T Bank Corp. 8 907,724 1.79% o The top 5 banks have ~82% of the deposit 9 Savings Bank Firstrust SB 5 787,798 1.55% market share 10 Bank Republic First Bancorp Inc. 7 715,531 1.41% o Presents a tremendous growth opportunity for 11 Thrift Prudential Bancorp Inc. 9 653,443 1.29% Fulton 12 Bank HSBC Holdings 2 556,724 1.10% 13 Bank Univest Corp. of Pennsylvania 7 426,870 0.84% . Health Care, Technology and Professional Services 14 Bank BB&T Corp. 12 404,769 0.80% are major economic forces, which are target 15 Bank Bryn Mawr Bank Corp. 5 196,515 0.39% 16 Bank DNB Financial Corp. 3 183,488 0.36% business segments for Fulton 17 Savings Bank United SB 3 156,232 0.31% . The Philadelphia-Camden-Wilmington MSA is a 18 Bank HC Asian Financial Corp. 2 153,271 0.30% large economic region with GDP of over $430bn, 19 Savings Bank Washington SB 4 133,217 0.26% th (1) 20 Bank Parke Bancorp Inc. 2 85,058 0.17% and is the 8 largest metropolitan area in the U.S All Others 20 386,519 0.76% . Baltimore is a targeted area for 2019 Total 290 50,692,479 100.00% Note: Deposit data as of June 30, 2018 per S&P Global Market Intelligence 8 (1) 2016 advance statistics; source: U.S. Bureau of Economic Analysis

Recent Strategic Initiatives Support Our Relationship Banking Strategy Growth: Growth:Investing Investingin talent, introducing in talent new, introducing digital new digital capabilities, implementingcapabilities, implementing technology technology enhancements , expanding the Fulton Forward TM enhancements, expanding the initiativeFulton Forward and focusing initiative and on focusing Channel on Strategies (example: Branch Optimization)Channel strategies (example: Branch Optimization). RiskRisk and and ComplianceCompliance:: Continuously improving the operating effectiveness ofContinuously our Risk Management improving the operating and BSA effectiveness frameworks and related of our Risk Management and BSA frameworks controls/processesand related controls/processes at all levelsat all levels. OperationalOperational Excellence Excellence:: Focusing on employee engagement, advancing Focusing on employee engagement, businessadvancing line business structure line structure and consolidationand efforts, improving processes/automationconsolidation efforts, improving, developing enterprise technology strategy and processes/automation, developing enterprise enhancingtechnology strategycustomerand enhancingintelligence customer capabilities intelligence capabilities. 9
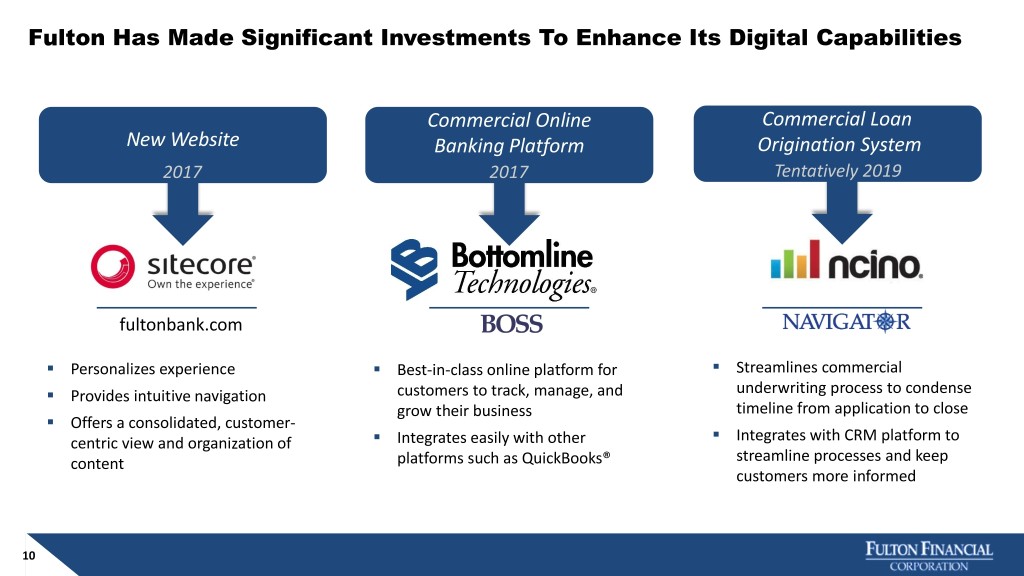
Fulton Has Made Significant Investments To Enhance Its Digital Capabilities Commercial Online Commercial Loan NewNew Website Website PurchaseBanking Platform Origination System 2017 2017 Tentatively 2019 fultonbank.com . . Personalizes experience . Best-in-class online platform for Streamlines commercial . Provides intuitive navigation customers to track, manage, and underwriting process to condense . grow their business timeline from application to close Offers a consolidated, customer- . . centric view and organization of Integrates easily with other Integrates with CRM platform to content platforms such as QuickBooks® streamline processes and keep customers more informed 10

Website Recently Recognized As An Innovation Leader Our redesigned customer website allows users to have a cohesive and personalized experience as they explore all of our products, services and capabilities in one place . Leverages data and customer insights to deliver personalized content to customers and prospects while capturing valuable information that can be translated into sales and marketing opportunities Fulton Bank recently won Sitecore’s 2018 annual award for Best Use of Personalization in North America. 11

Optimizing Our Branch Network Optimizing our financial center network will: . Move us towards multiple financial center types vs. a one-size-fits-all model . Give us greater ability to re-invest in people & digital transactions . Orient the financial center as a primary touchpoint enabling higher- value activities geared towards advice and sales . Create greater focus on customer experience in the financial centers . Closed 30+ financial centers and upgraded 56 financial centers to the new format since 2014 12

Granular, Well-Diversified Loan Portfolio . Average Loans for the first nine months of 2018 are up 4.2% compared to the first nine months of 2017 . Yields continue to move higher after several years of declines $16.0 $15.8 4.50% $15.2 $0.6 $0.4 $14.1 $1.0 $0.9 $14.0 $0.4 4.32% $13.3 4.30% $12.9 $0.8 $0.4 $1.8 $2.0 $0.4 4.21% $0.7 Portfolio Loan Total (1) Yield $12.0 $0.6 $1.5 $1.4 $1.5 Balances $1.4 $1.6 4.10% 4.04% $1.7 $10.0 $1.7 4.07% $1.7 3.95% 3.90% $4.3 $8.0 $4.2 $4.1 $3.7 $3.9 Average Average LoanPortfolio 3.70% $6.0 $6.2 $6.3 $5.1 $5.2 $5.6 $4.0 3.50% 2014 2015 2016 2017 Sep 2018 ($ IN BILLIONS) Comm'l Mtg Comm'l Home Equity Res Mtg Construction Consumer/Other FTE loan yield (1) 13 Note: Loan portfolio composition is based on average balances for the years ended December 31, 2014 to 2017, and for the first nine months ended September30, 2018 (1) Presented on a fully-taxable equivalent basis
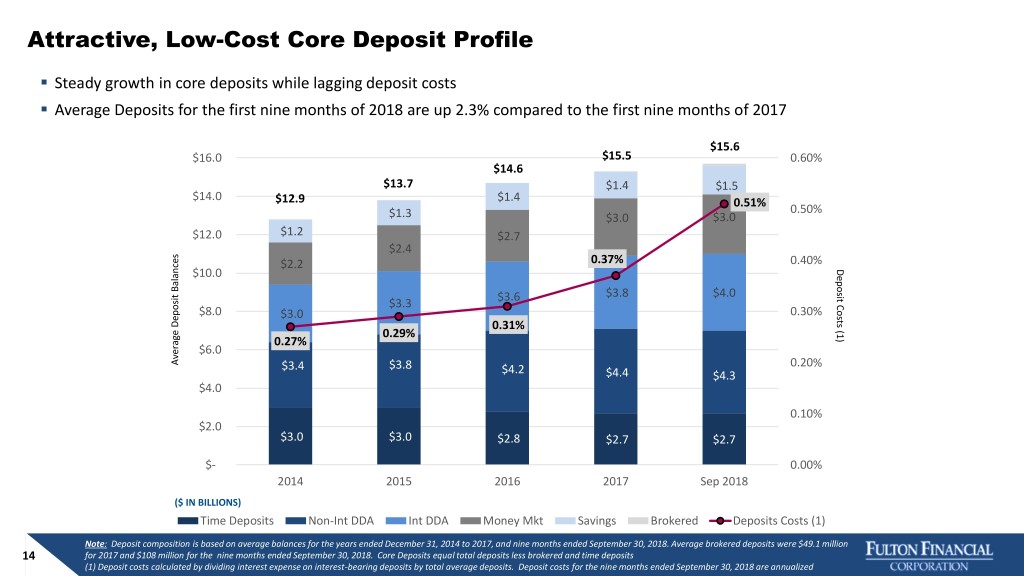
Attractive, Low-Cost Core Deposit Profile . Steady growth in core deposits while lagging deposit costs . Average Deposits for the first nine months of 2018 are up 2.3% compared to the first nine months of 2017 $15.6 $16.0 $15.5 0.60% $14.6 $ $13.7 $- $1.4 $1.5 $14.0 $12.9 $1.4 0.51% $- 0.50% $- $1.3 $3.0 $3.0 $12.0 $1.2 $2.7 $2.4 0.37% 0.40% $2.2 DepositCosts $10.0 $3.6 $3.8 $4.0 $3.3 $8.0 $3.0 0.30% 0.31% (1) 0.29% 0.27% $6.0 Average Average BalancesDeposit $3.4 $3.8 0.20% $4.2 $4.4 $4.3 $4.0 0.10% $2.0 $3.0 $3.0 $2.8 $2.7 $2.7 $- 0.00% 2014 2015 2016 2017 Sep 2018 ($ IN BILLIONS) Time Deposits Non-Int DDA Int DDA Money Mkt Savings Brokered Deposits Costs (1) Note: Deposit composition is based on average balances for the years ended December 31, 2014 to 2017, and nine months ended September 30, 2018. Average brokered deposits were $49.1 million 14 for 2017 and $108 million for the nine months ended September 30, 2018. Core Deposits equal total deposits less brokered and time deposits (1) Deposit costs calculated by dividing interest expense on interest-bearing deposits by total average deposits. Deposit costs for the nine months ended September 30, 2018 are annualized
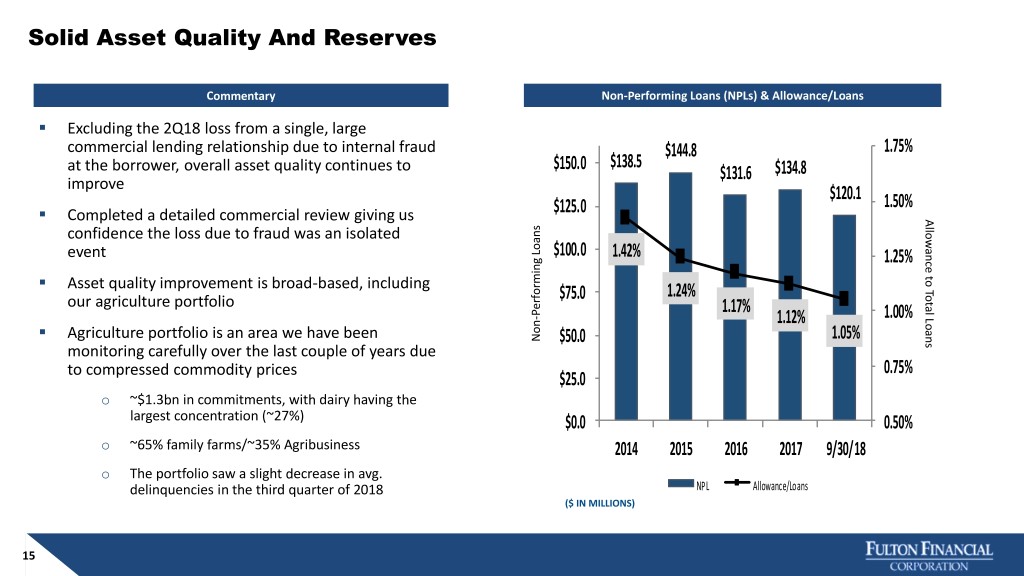
Solid Asset Quality And Reserves Commentary Non-Performing Loans (NPLs) & Allowance/Loans . Excluding the 2Q18 loss from a single, large commercial lending relationship due to internal fraud $144.8 1.75% $138.5 at the borrower, overall asset quality continues to $150.0 $131.6 $134.8 improve $120.1 . $125.0 1.50% Completed a detailed commercial review giving us AllowanceTotalto Loans confidence the loss due to fraud was an isolated event $100.0 1.42% 1.25% . Asset quality improvement is broad-based, including 1.24% our agriculture portfolio $75.0 Performing Loans Performing 1.17% - 1.00% . 1.12% Agriculture portfolio is an area we have been Non $50.0 1.05% monitoring carefully over the last couple of years due 0.75% to compressed commodity prices $25.0 o ~$1.3bn in commitments, with dairy having the largest concentration (~27%) $0.0 0.50% o ~65% family farms/~35% Agribusiness 2014 2015 2016 2017 9/30/18 o The portfolio saw a slight decrease in avg. delinquencies in the third quarter of 2018 NPL Allowance/Loans ($ IN MILLIONS) 15
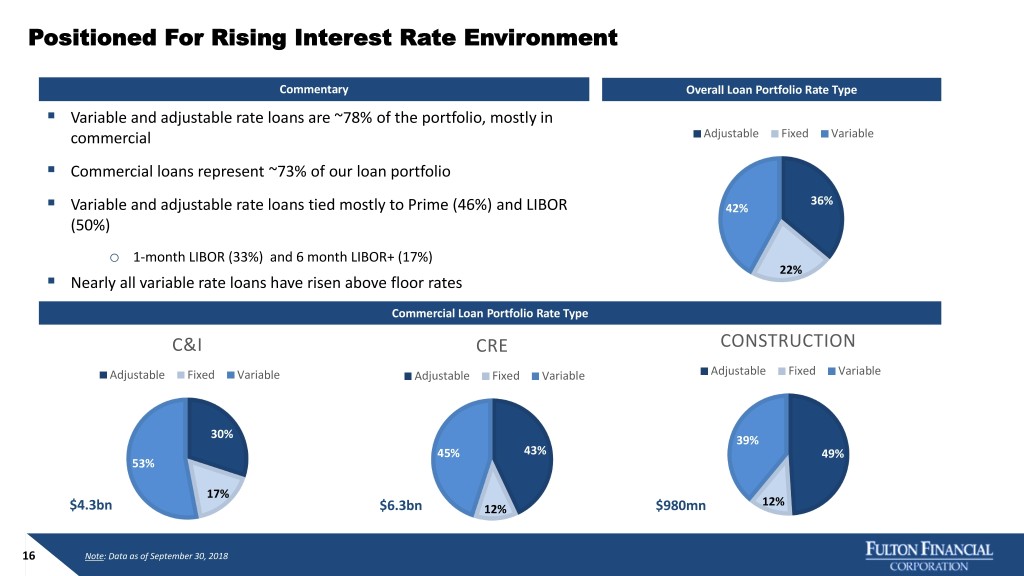
Positioned For Rising Interest Rate Environment Commentary Overall Loan Portfolio Rate Type . Variable and adjustable rate loans are ~78% of the portfolio, mostly in commercial Adjustable Fixed Variable . Commercial loans represent ~73% of our loan portfolio . 36% Variable and adjustable rate loans tied mostly to Prime (46%) and LIBOR 42% (50%) o 1-month LIBOR (33%) and 6 month LIBOR+ (17%) 22% . Nearly all variable rate loans have risen above floor rates Commercial Loan Portfolio Rate Type C&I CRE CONSTRUCTION Adjustable Fixed Variable Adjustable Fixed Variable Adjustable Fixed Variable 30% 39% 45% 43% 49% 53% 17% 12% $4.3bn $6.3bn 12% $980mn 16 Note: Data as of September 30, 2018

Prudent Expense Management With Opportunities To Improve Commentary Efficiency Ratio (FTE) . Low rate environment and continued buildout of our 71.00% compliance, risk and technology infrastructures were the 69.00% primary drivers of the increase in the efficiency ratio in 67.00% 2015 65.00% . 63.00% ~ $730 Meaningful positive operating leverage in 2016 and 2017 million reduced the efficiency ratio 61.00% 2014Y 2015Y 2016Y 2017Y~ $610 YTD o Closed 30+ financial centers since 2014 million o Balance sheet positioned for rising interest rate Fulton Peer Median environment Non-Interest Expenses / Average Assets . Our efficiency ratio was 62.5%(1) in 3Q18 within our goal of 3.00% 60.0% - 65.0%, and reached the lowest level since the first quarter of 2013 2.90% . Opportunities exist to gain efficiencies as we continue to: 2.80% o Optimize our delivery channels 2.70% o Upgrade our origination and servicing platforms 2.60% o Consolidate our bank charters 2.50% o Exit our BSA/AML orders 2014Y 2015Y 2016Y 2017Y YTD Fulton Peer Median Note: Chart Data from S&P Global Market Intelligence; YTD data as of the most recent reporting date 17 See “Appendix” for listing of Peer Group banks (1) Non-GAAP based financial measure. Please refer to the calculation and management’s reasons for using this measure on the slide titled “Non-GAAP Reconciliation” at the end of this presentation
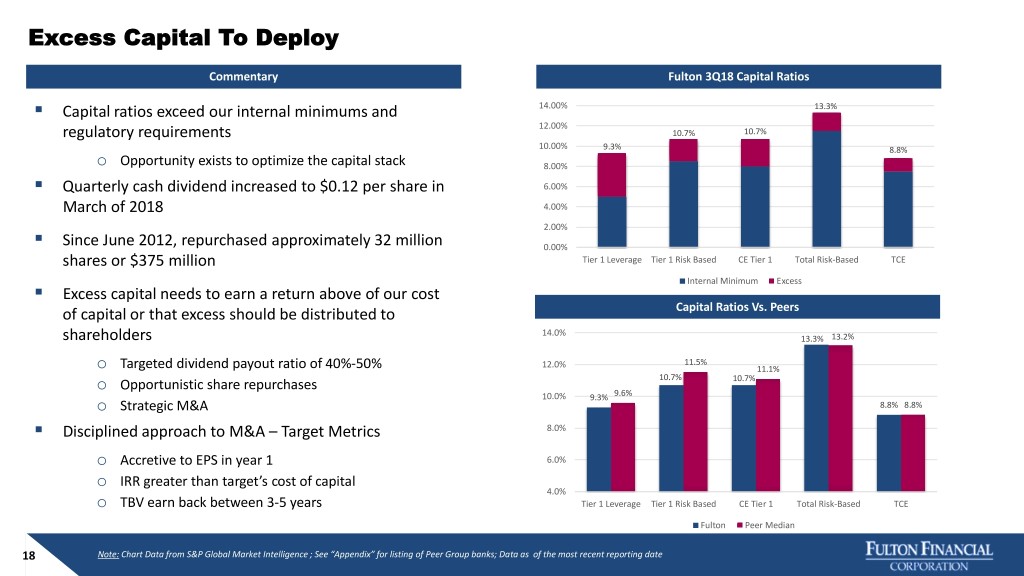
Excess Capital To Deploy Commentary Fulton 3Q18 Capital Ratios . Capital ratios exceed our internal minimums and 14.00% 13.3% 12.00% regulatory requirements 10.7% 10.7% 10.00% 9.3% 8.8% o Opportunity exists to optimize the capital stack 8.00% . Quarterly cash dividend increased to $0.12 per share in 6.00% March of 2018 4.00% ~ $730 . 2.00% million Since June 2012, repurchased approximately 32 million 0.00% shares or $375 million Tier 1 Leverage Tier 1 Risk Based CE Tier 1 Total~ $610 Risk-Based TCE million Internal Minimum Excess . Excess capital needs to earn a return above of our cost of capital or that excess should be distributed to Capital Ratios Vs. Peers 14.0% shareholders 13.3% 13.2% 11.5% o Targeted dividend payout ratio of 40%-50% 12.0% 11.1% 10.7% o Opportunistic share repurchases 10.7% 10.0% 9.3% 9.6% o Strategic M&A 8.8% 8.8% . Disciplined approach to M&A – Target Metrics 8.0% o Accretive to EPS in year 1 6.0% o IRR greater than target’s cost of capital 4.0% o TBV earn back between 3-5 years Tier 1 Leverage Tier 1 Risk Based CE Tier 1 Total Risk-Based TCE Fulton Peer Median 18 Note: Chart Data from S&P Global Market Intelligence ; See “Appendix” for listing of Peer Group banks; Data as of the most recent reporting date
RECENT FINANCIAL PERFORMANCE
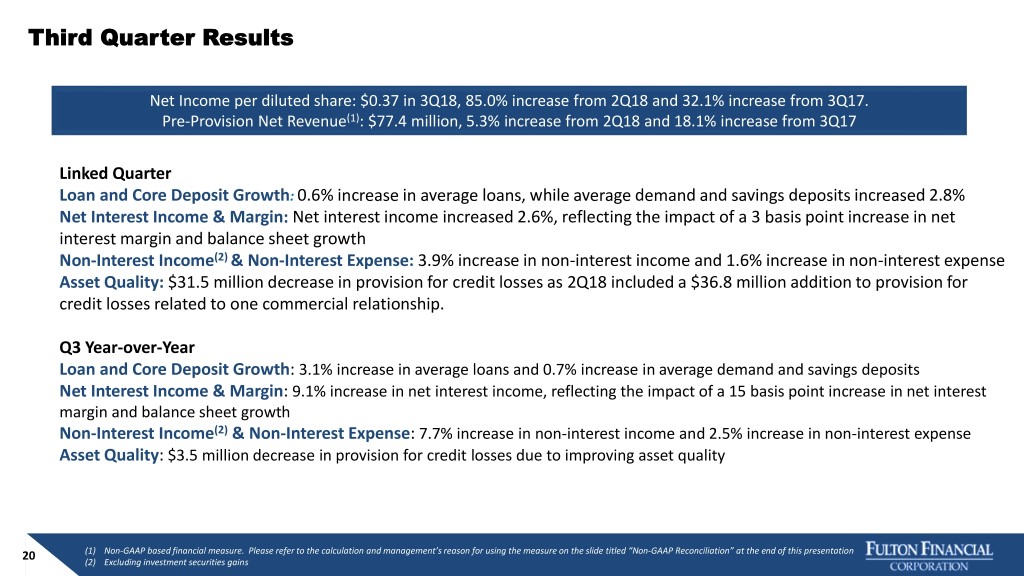
Third Quarter Results Net Income per diluted share: $0.37 in 3Q18, 85.0% increase from 2Q18 and 32.1% increase from 3Q17. Pre-Provision Net Revenue(1): $77.4 million, 5.3% increase from 2Q18 and 18.1% increase from 3Q17 Linked Quarter Loan and Core Deposit Growth: 0.6% increase in average loans, while average demand and savings deposits increased 2.8% Net Interest Income & Margin: Net interest income increased 2.6%, reflecting the impact of a 3 basis point increase in net interest margin and balance sheet growth Non-Interest Income(2) & Non-Interest Expense: 3.9% increase in non-interest income and 1.6% increase in non-interest expense Asset Quality: $31.5 million decrease in provision for credit losses as 2Q18 included a $36.8 million addition to provision for credit losses related to one commercial relationship. Q3 Year-over-Year Loan and Core Deposit Growth: 3.1% increase in average loans and 0.7% increase in average demand and savings deposits Net Interest Income & Margin: 9.1% increase in net interest income, reflecting the impact of a 15 basis point increase in net interest margin and balance sheet growth Non-Interest Income(2) & Non-Interest Expense: 7.7% increase in non-interest income and 2.5% increase in non-interest expense Asset Quality: $3.5 million decrease in provision for credit losses due to improving asset quality 20 (1) Non-GAAP based financial measure. Please refer to the calculation and management’s reason for using the measure on the slide titled “Non-GAAP Reconciliation” at the end of this presentation (2) Excluding investment securities gains
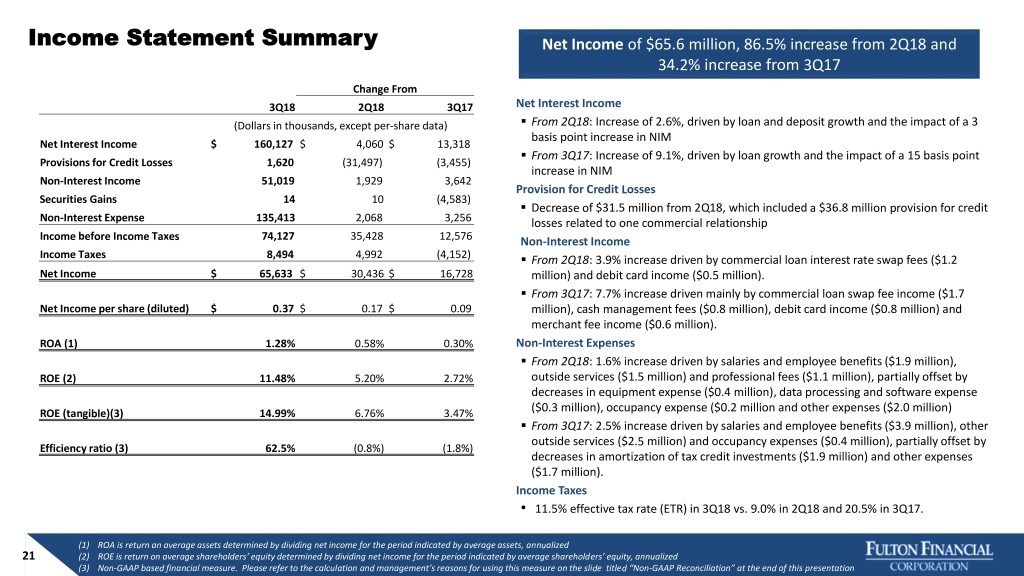
Income Statement Summary Net Income of $65.6 million, 86.5% increase from 2Q18 and 34.2% increase from 3Q17 Change From 3Q18 2Q18 3Q17 Net Interest Income . (Dollars in thousands, except per-share data) From 2Q18: Increase of 2.6%, driven by loan and deposit growth and the impact of a 3 basis point increase in NIM Net Interest Income $ 160,127 $ 4,060 $ 13,318 . From 3Q17: Increase of 9.1%, driven by loan growth and the impact of a 15 basis point Provisions for Credit Losses 1,620 (31,497) (3,455) increase in NIM Non-Interest Income 51,019 1,929 3,642 Provision for Credit Losses Securities Gains 14 10 (4,583) . Decrease of $31.5 million from 2Q18, which included a $36.8 million provision for credit Non-Interest Expense 135,413 2,068 3,256 losses related to one commercial relationship Income before Income Taxes 74,127 35,428 12,576 Non-Interest Income Income Taxes 8,494 4,992 (4,152) . From 2Q18: 3.9% increase driven by commercial loan interest rate swap fees ($1.2 Net Income $ 65,633 $ 30,436 $ 16,728 million) and debit card income ($0.5 million). . From 3Q17: 7.7% increase driven mainly by commercial loan swap fee income ($1.7 Net Income per share (diluted) $ 0.37 $ 0.17 $ 0.09 million), cash management fees ($0.8 million), debit card income ($0.8 million) and merchant fee income ($0.6 million). ROA (1) 1.28% 0.58% 0.30% Non-Interest Expenses . From 2Q18: 1.6% increase driven by salaries and employee benefits ($1.9 million), ROE (2) 11.48% 5.20% 2.72% outside services ($1.5 million) and professional fees ($1.1 million), partially offset by decreases in equipment expense ($0.4 million), data processing and software expense ROE (tangible)(3) 14.99% 6.76% 3.47% ($0.3 million), occupancy expense ($0.2 million and other expenses ($2.0 million) . From 3Q17: 2.5% increase driven by salaries and employee benefits ($3.9 million), other outside services ($2.5 million) and occupancy expenses ($0.4 million), partially offset by Efficiency ratio (3) 62.5% (0.8%) (1.8%) decreases in amortization of tax credit investments ($1.9 million) and other expenses ($1.7 million). Income Taxes • 11.5% effective tax rate (ETR) in 3Q18 vs. 9.0% in 2Q18 and 20.5% in 3Q17. (1) ROA is return an average assets determined by dividing net income for the period indicated by average assets, annualized 21 (2) ROE is return on average shareholders’ equity determined by dividing net income for the period indicated by average shareholders’ equity, annualized (3) Non-GAAP based financial measure. Please refer to the calculation and management’s reasons for using this measure on the slide titled “Non-GAAP Reconciliation” at the end of this presentation
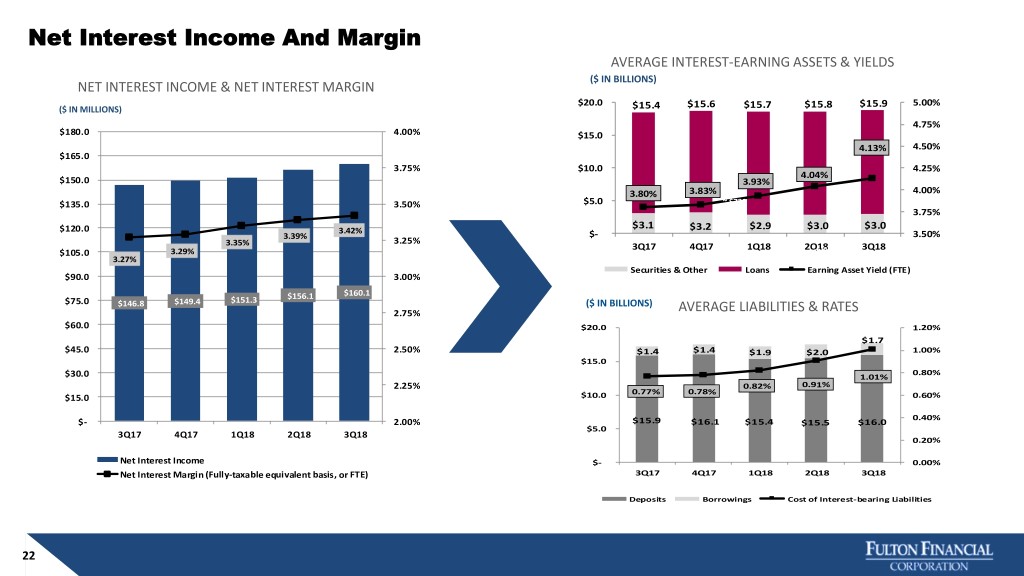
Net Interest Income And Margin AVERAGE INTEREST-EARNING ASSETS & YIELDS ($ IN BILLIONS) NET INTEREST INCOME & NET INTEREST MARGIN $20.0 $15.6 $15.9 5.00% ($ IN MILLIONS) $15.4 $15.7 $15.8 4.75% $180.0 4.00% $15.0 4.13% 4.50% $165.0 3.75% $10.0 4.25% 4.04% $150.0 3.93% 3.80% 3.83% 4.00% $135.0 3.50% $5.0 ~ $730 million 3.75% $120.0 $3.1 $3.2 $2.9 $3.0 $3.0 3.42% $- 3.50% 3.39% 3.25% ~ $610 3.35% 3Q17 4Q17 1Q18 2Q18 3Q18 $105.0 3.29% million 3.27% Securities & Other Loans Earning Asset Yield (FTE) $90.0 3.00% $156.1 $160.1 $75.0 $146.8 $149.4 $151.3 ($ IN BILLIONS) 2.75% AVERAGE LIABILITIES & RATES $60.0 $20.0 1.20% $1.7 $45.0 2.50% $1.4 $1.4 $1.9 $2.0 1.00% $15.0 0.80% $30.0 1.01% 2.25% 0.82% 0.91% 0.77% 0.78% $15.0 $10.0 0.60% 0.40% $- 2.00% $15.9 $16.1 $15.4 $15.5 $16.0 $5.0 3Q17 4Q17 1Q18 2Q18 3Q18 0.20% Net Interest Income $- 0.00% Net Interest Margin (Fully-taxable equivalent basis, or FTE) 3Q17 4Q17 1Q18 2Q18 3Q18 Deposits Borrowings Cost of Interest-bearing Liabilities 22
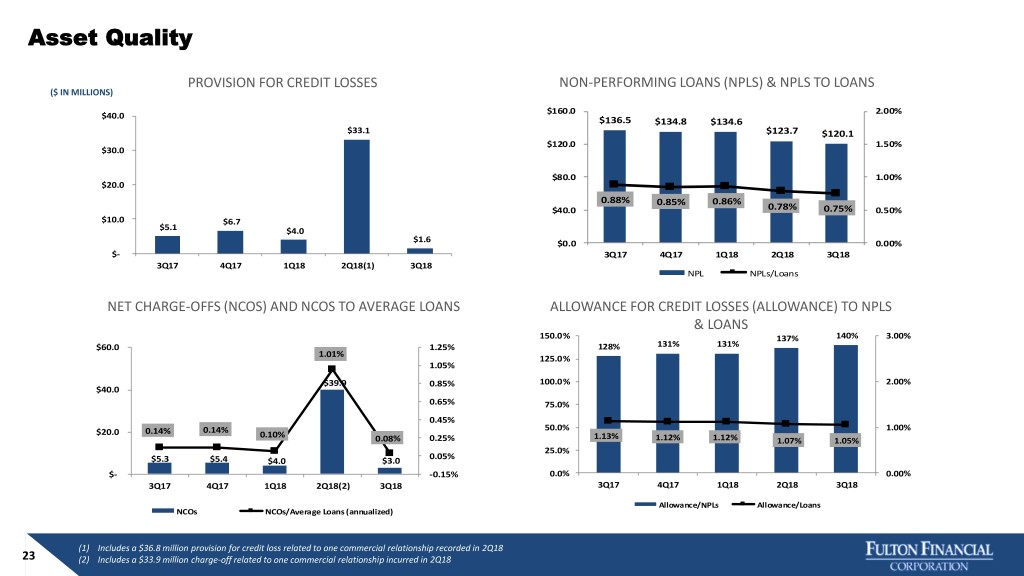
Asset Quality PROVISION FOR CREDIT LOSSES NON-PERFORMING LOANS (NPLS) & NPLS TO LOANS ($ IN MILLIONS) $160.0 2.00% $40.0 $136.5 $134.8 $134.6 $33.1 $123.7 $120.1 $120.0 1.50% $30.0 $80.0 1.00% $20.0 0.88% 0.85% 0.86% $40.0 0.78% 0.75% 0.50% $10.0 $6.7 $5.1 $4.0 $1.6 $0.0 0.00% $- 3Q17 4Q17 1Q18 2Q18 3Q18 3Q17 4Q17 1Q18 2Q18(1) 3Q18 NPL NPLs/Loans NET CHARGE-OFFS (NCOS) AND NCOS TO AVERAGE LOANS ALLOWANCE FOR CREDIT LOSSES (ALLOWANCE) TO NPLS & LOANS 150.0% 137% 140% 3.00% $60.0 1.25% 128% 131% 131% 1.01% 125.0% 1.05% $39.9 0.85% 100.0% 2.00% $40.0 0.65% 75.0% 0.45% 0.14% 0.14% 50.0% 1.00% $20.0 0.10% 1.13% 0.08% 0.25% 1.12% 1.12% 1.07% 1.05% 25.0% 0.05% $5.3 $5.4 $4.0 $3.0 $- -0.15% 0.0% 0.00% 3Q17 4Q17 1Q18 2Q18(2) 3Q18 3Q17 4Q17 1Q18 2Q18 3Q18 Allowance/NPLs Allowance/Loans NCOs NCOs/Average Loans (annualized) (1) Includes a $36.8 million provision for credit loss related to one commercial relationship recorded in 2Q18 23 (2) Includes a $33.9 million charge-off related to one commercial relationship incurred in 2Q18
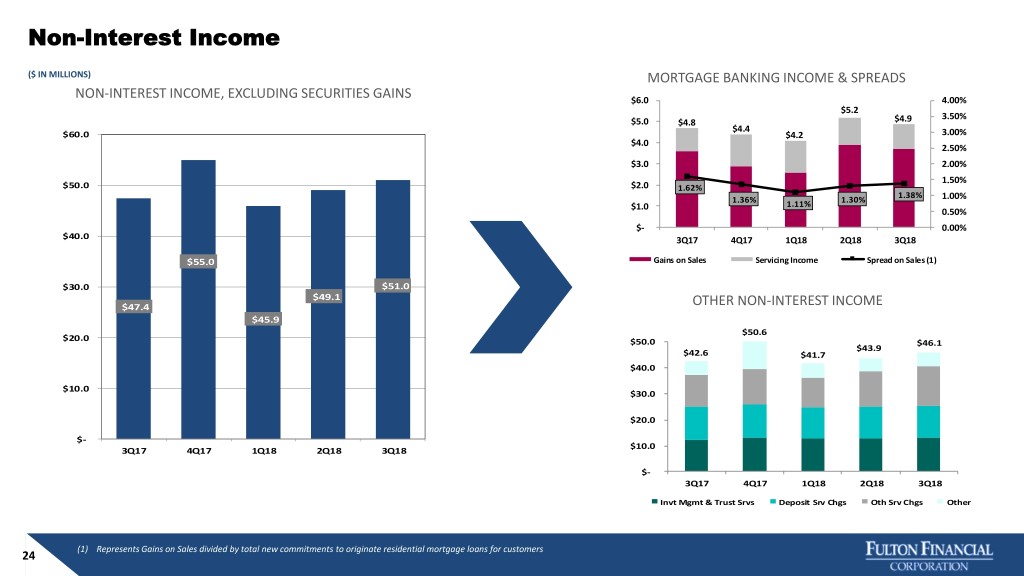
Non-Interest Income ($ IN MILLIONS) MORTGAGE BANKING INCOME & SPREADS NON-INTEREST INCOME, EXCLUDING SECURITIES GAINS $6.0 4.00% $5.2 3.50% $5.0 $4.8 $4.9 $4.4 $60.0 $4.2 3.00% $4.0 2.50% $3.0 2.00% 1.50% $50.0 $2.0 1.62% 1.38% 1.36% 1.30% 1.00% $1.0 1.11% 0.50% ~ $730 $- million 0.00% $40.0 3Q17 4Q17 1Q18 2Q18 3Q18 $55.0 Gains on Sales Servicing Income~ $610 Spread on Sales (1) million $30.0 $51.0 $49.1 $47.4 OTHER NON-INTEREST INCOME $45.9 $50.6 $20.0 $50.0 $46.1 $43.9 $42.6 $41.7 $40.0 $10.0 $30.0 $20.0 $- $10.0 3Q17 4Q17 1Q18 2Q18 3Q18 $- 3Q17 4Q17 1Q18 2Q18 3Q18 Invt Mgmt & Trust Srvs Deposit Srv Chgs Oth Srv Chgs Other (1) Represents Gains on Sales divided by total new commitments to originate residential mortgage loans for customers 24

Non-Interest Expenses ($ IN MILLIONS) SALARIES AND EMPLOYEE BENEFITS & STAFFING (1) NON-INTEREST EXPENSE & EFFICIENCY RATIO $90.0 3,700 $80.0 $72.9 $73.5 $75.8 $74.9 $76.8 3,600 $70.0 3,560 3,570 3,500 $60.0 $160.0 68.0% $50.0 3,400 $40.0 3,300 $140.0 67.5% 67.0% $30.0 3,200 $20.0 ~ $730 million 3,100 $10.0 $120.0 66.0% $- 3,000 ~ $610 3Q17 4Q17 1Q18 2Q18 3Q18 million $100.0 65.0% $138.5 Employee Benefits Total Salaries Average Full-time Equivalent Employees $136.7 $132.2 $133.3 $135.4 $80.0 64.3% 64.0% 64.2% OTHER NON-INTEREST EXPENSES $60.0 63.0% $70.0 $65.0 63.3% $60.9 $58.6 $60.0 $59.3 $58.4 $40.0 62.5% 62.0% $50.0 $40.0 $20.0 61.0% $30.0 $20.0 $- 60.0% $10.0 3Q17 4Q17 1Q18 2Q18 3Q18 $- 3Q17 4Q17 1Q18 2Q18 3Q18 Occp & Equip Data Processing & Software Outside Srvs Other 25 (1) Non-GAAP based financial measure. Please refer to the calculation and management’s reasons for using this measure on the slide titled “Non-GAAP Reconciliation” at the end of this presentation
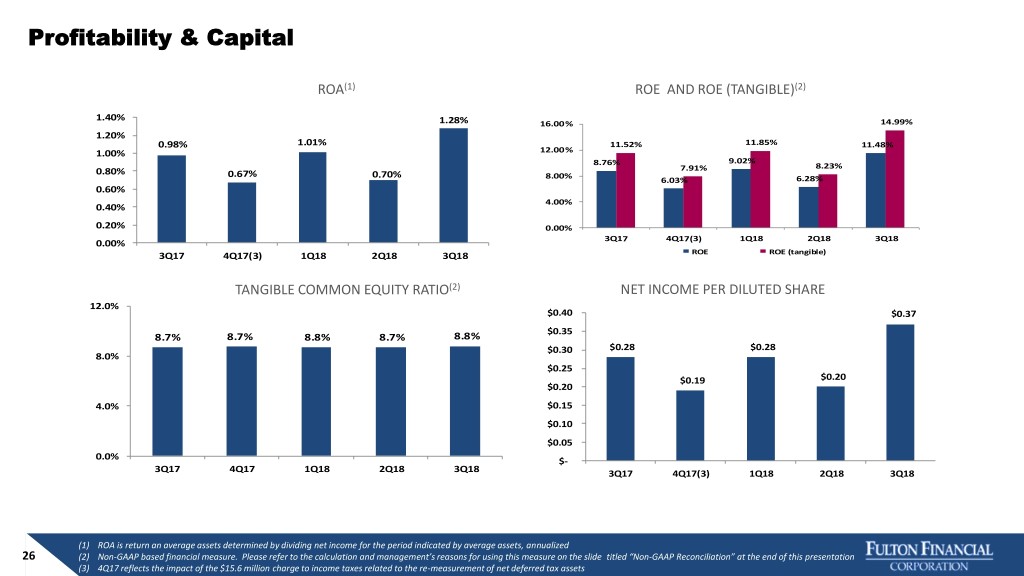
Profitability & Capital ROA(1) ROE AND ROE (TANGIBLE)(2) 1.40% 1.28% 16.00% 14.99% 1.20% 0.98% 1.01% 11.52% 11.85% 11.48% 1.00% 12.00% 8.76% 9.02% 7.91% 8.23% 0.80% 0.67% 0.70% 8.00% 6.03% 6.28% 0.60% 4.00% 0.40% 0.20% 0.00% 3Q17 4Q17(3) 1Q18 2Q18 3Q18 0.00% 3Q17 4Q17(3) 1Q18 2Q18 3Q18 ROE ROE (tangible) TANGIBLE COMMON EQUITY RATIO(2) NET INCOME PER DILUTED SHARE 12.0% $0.40 $0.37 $0.35 8.7% 8.7% 8.8% 8.7% 8.8% $0.30 $0.28 $0.28 8.0% $0.25 $0.19 $0.20 $0.20 4.0% $0.15 $0.10 $0.05 0.0% $- 3Q17 4Q17 1Q18 2Q18 3Q18 3Q17 4Q17(3) 1Q18 2Q18 3Q18 (1) ROA is return an average assets determined by dividing net income for the period indicated by average assets, annualized 26 (2) Non-GAAP based financial measure. Please refer to the calculation and management’s reasons for using this measure on the slide titled “Non-GAAP Reconciliation” at the end of this presentation (3) 4Q17 reflects the impact of the $15.6 million charge to income taxes related to the re-measurement of net deferred tax assets
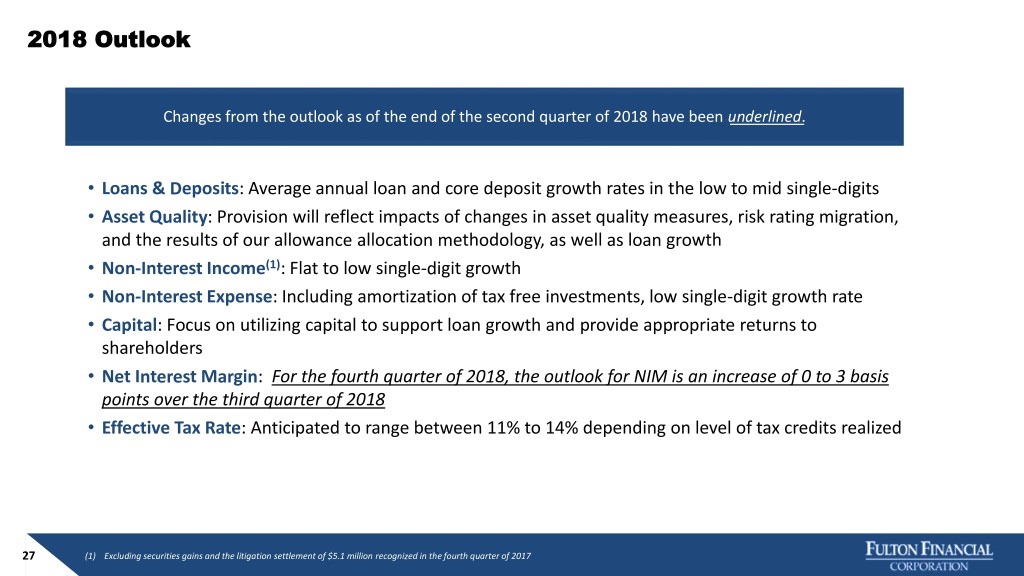
2018 Outlook Changes from the outlook as of the end of the second quarter of 2018 have been underlined. • Loans & Deposits: Average annual loan and core deposit growth rates in the low to mid single-digits • Asset Quality: Provision will reflect impacts of changes in asset quality measures, risk rating migration, and the results of our allowance allocation methodology, as well as loan growth • Non-Interest Income(1): Flat to low single-digit growth • Non-Interest Expense: Including amortization of tax free investments, low single-digit growth rate • Capital: Focus on utilizing capital to support loan growth and provide appropriate returns to shareholders • Net Interest Margin: For the fourth quarter of 2018, the outlook for NIM is an increase of 0 to 3 basis points over the third quarter of 2018 • Effective Tax Rate: Anticipated to range between 11% to 14% depending on level of tax credits realized 27 (1) Excluding securities gains and the litigation settlement of $5.1 million recognized in the fourth quarter of 2017
APPENDIX
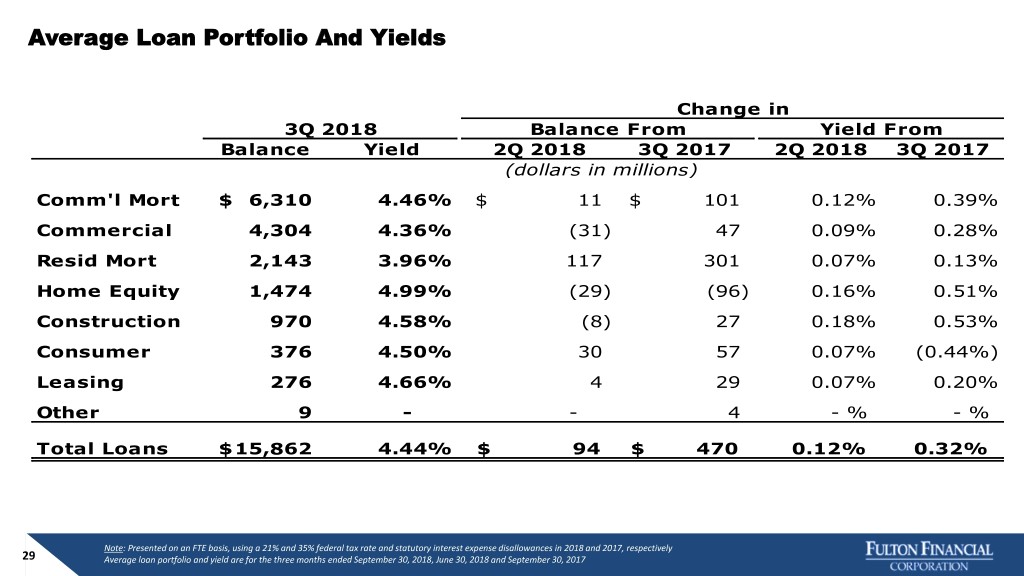
Average Loan Portfolio And Yields Change in 3Q 2018 Balance From Yield From Balance Yield 2Q 2018 3Q 2017 2Q 2018 3Q 2017 (dollars in millions) Comm'l Mort $ 6,310 4.46% $ 11 $ 101 0.12% 0.39% Commercial 4,304 4.36% (31) 47 0.09% 0.28% Resid Mort 2,143 3.96% 117 301 0.07% 0.13% Home Equity 1,474 4.99% (29) (96) 0.16% 0.51% Construction 970 4.58% (8) 27 0.18% 0.53% Consumer 376 4.50% 30 57 0.07% (0.44%) Leasing 276 4.66% 4 29 0.07% 0.20% Other 9 - - 4 - % - % - Total Loans $ 15,862 4.44% $ 94 $ 470 0.12% 0.32% Note: Presented on an FTE basis, using a 21% and 35% federal tax rate and statutory interest expense disallowances in 2018 and 2017, respectively 29 Average loan portfolio and yield are for the three months ended September 30, 2018, June 30, 2018 and September 30, 2017
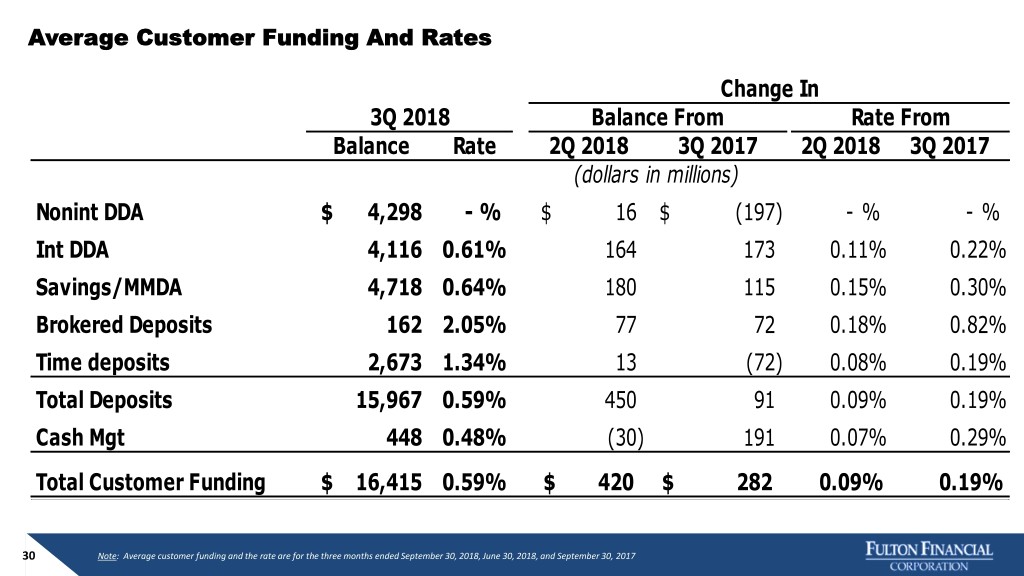
Average Customer Funding And Rates Change In 3Q 2018 Balance From Rate From Balance Rate 2Q 2018 3Q 2017 2Q 2018 3Q 2017 (dollars in millions) Nonint DDA $ 4,298 - % $ 16 $ (197) - % - % Int DDA 4,116 0.61% 164 173 0.11% 0.22% Savings/MMDA 4,718 0.64% 180 115 0.15% 0.30% Brokered Deposits 162 2.05% 77 72 0.18% 0.82% Time deposits 2,673 1.34% 13 (72) 0.08% 0.19% Total Deposits 15,967 0.59% 450 91 0.09% 0.19% Cash Mgt 448 0.48% (30) 191 0.07% 0.29% Total Customer Funding $ 16,415 0.59% $ 420 $ 282 0.09% 0.19% 30 Note: Average customer funding and the rate are for the three months ended September 30, 2018, June 30, 2018, and September 30, 2017
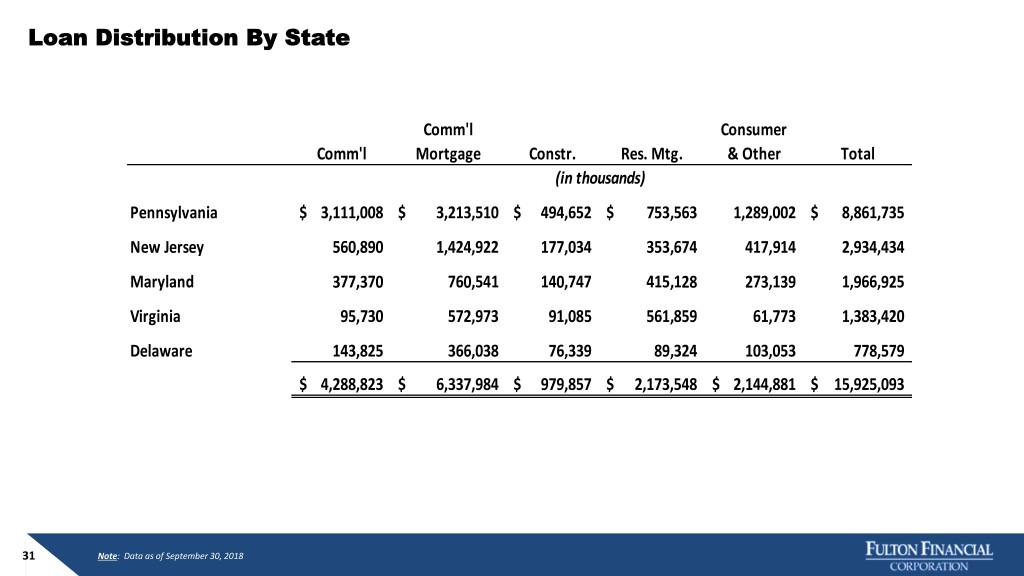
Loan Distribution By State Comm'l Consumer Comm'l Mortgage Constr. Res. Mtg. & Other Total (in thousands) Pennsylvania $ 3,111,008 $ 3,213,510 $ 494,652 $ 753,563 1,289,002 $ 8,861,735 New Jersey 560,890 1,424,922 177,034 353,674 417,914 2,934,434 Maryland 377,370 760,541 140,747 415,128 273,139 1,966,925 Virginia 95,730 572,973 91,085 561,859 61,773 1,383,420 Delaware 143,825 366,038 76,339 89,324 103,053 778,579 $ 4,288,823 $ 6,337,984 $ 979,857 $ 2,173,548 $ 2,144,881 $ 15,925,093 31 Note: Data as of September 30, 2018
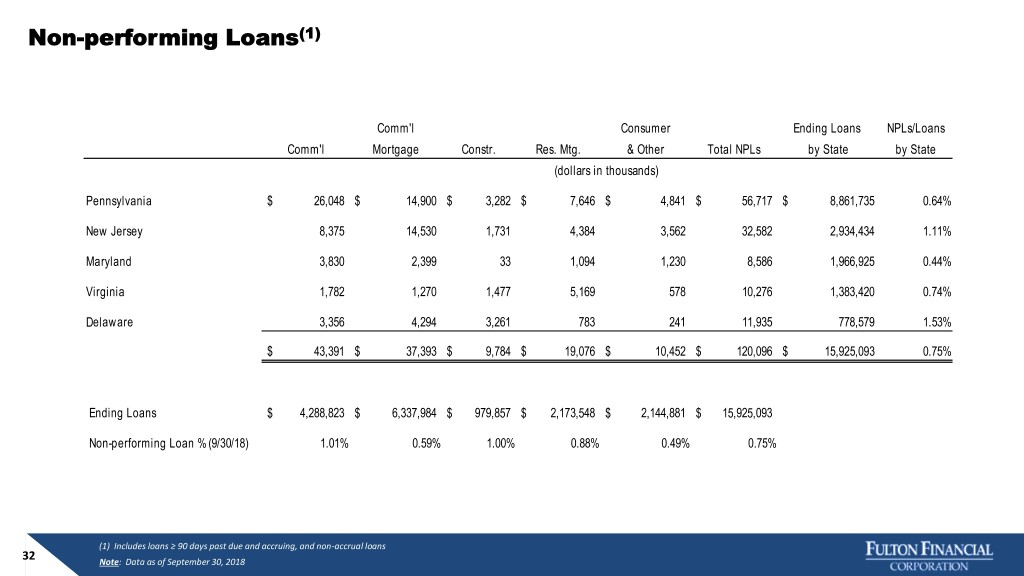
Non-performing Loans(1) Comm'l Consumer Ending Loans NPLs/Loans Comm'l Mortgage Constr. Res. Mtg. & Other Total NPLs by State by State (dollars in thousands) Pennsylvania $ 26,048 $ 14,900 $ 3,282 $ 7,646 $ 4,841 $ 56,717 $ 8,861,735 0.64% New Jersey 8,375 14,530 1,731 4,384 3,562 32,582 2,934,434 1.11% Maryland 3,830 2,399 33 1,094 1,230 8,586 1,966,925 0.44% Virginia 1,782 1,270 1,477 5,169 578 10,276 1,383,420 0.74% Delaware 3,356 4,294 3,261 783 241 11,935 778,579 1.53% $ 43,391 $ 37,393 $ 9,784 $ 19,076 $ 10,452 $ 120,096 $ 15,925,093 0.75% Ending Loans $ 4,288,823 $ 6,337,984 $ 979,857 $ 2,173,548 $ 2,144,881 $ 15,925,093 Non-performing Loan % (9/30/18) 1.01% 0.59% 1.00% 0.88% 0.49% 0.75% (1) Includes loans ≥ 90 days past due and accruing, and non-accrual loans 32 Note: Data as of September 30, 2018
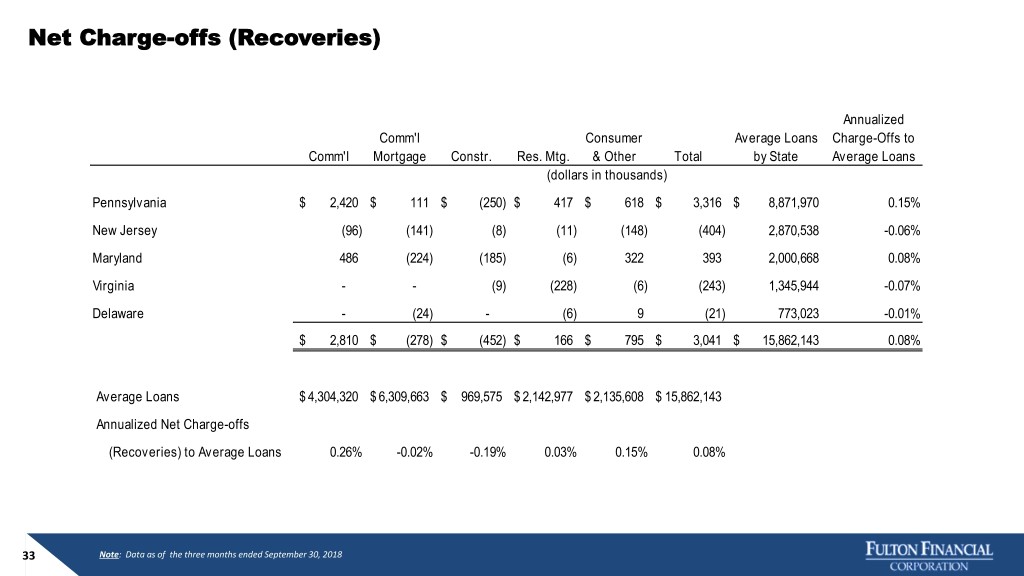
Net Charge-offs (Recoveries) Annualized Comm'l Consumer Average Loans Charge-Offs to Comm'l Mortgage Constr. Res. Mtg. & Other Total by State Average Loans (dollars in thousands) Pennsylvania $ 2,420 $ 111 $ (250) $ 417 $ 618 $ 3,316 $ 8,871,970 0.15% New Jersey (96) (141) (8) (11) (148) (404) 2,870,538 -0.06% Maryland 486 (224) (185) (6) 322 393 2,000,668 0.08% Virginia - - (9) (228) (6) (243) 1,345,944 -0.07% Delaware - (24) - (6) 9 (21) 773,023 -0.01% $ 2,810 $ (278) $ (452) $ 166 $ 795 $ 3,041 $ 15,862,143 0.08% Average Loans $ 4,304,320 $ 6,309,663 $ 969,575 $ 2,142,977 $ 2,135,608 $ 15,862,143 Annualized Net Charge-offs (Recoveries) to Average Loans 0.26% -0.02% -0.19% 0.03% 0.15% 0.08% 33 Note: Data as of the three months ended September 30, 2018
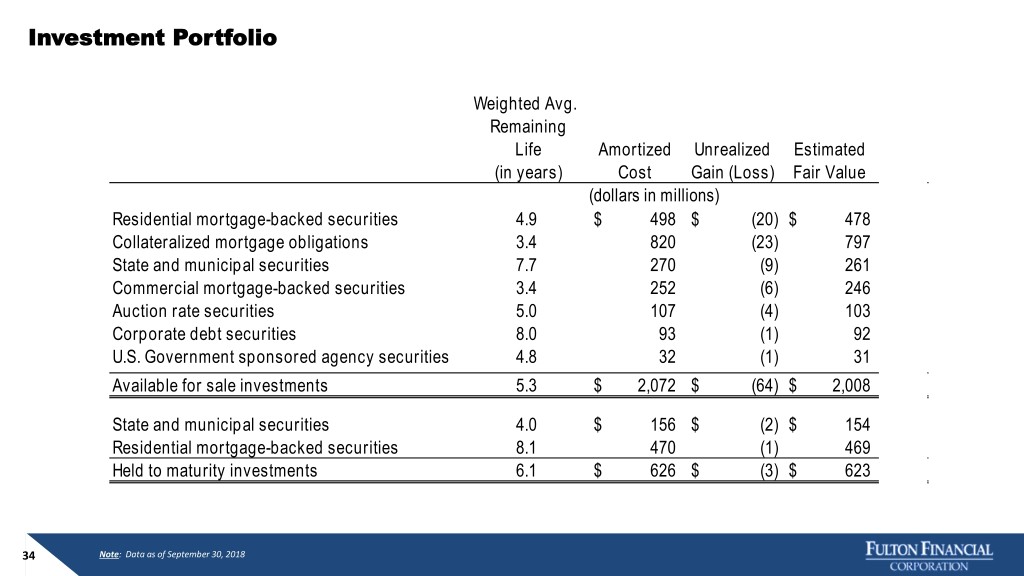
Investment Portfolio Weighted Avg. Remaining Life Amortized Unrealized Estimated (in years) Cost Gain (Loss) Fair Value (dollars in millions) Residential mortgage-backed securities 4.9 $ 498 $ (20) $ 478 Collateralized mortgage obligations 3.4 820 (23) 797 State and municipal securities 7.7 270 (9) 261 Commercial mortgage-backed securities 3.4 252 (6) 246 Auction rate securities 5.0 107 (4) 103 Corporate debt securities 8.0 93 (1) 92 U.S. Government sponsored agency securities 4.8 32 (1) 31 Available for sale investments 5.3 $ 2,072 $ (64) $ 2,008 State and municipal securities 4.0 $ 156 $ (2) $ 154 Residential mortgage-backed securities 8.1 470 (1) 469 Held to maturity investments 6.1 $ 626 $ (3) $ 623 34 Note: Data as of September 30, 2018

Non-Interest Income (Excluding Securities Gains) Change From 3Q 2018 2Q 2018 3Q 2017 2Q 2018 3Q 2017 (in thousands) Other service charges and fees: Merchant fees $ 5,006 $ 4,920 $ 4,398 $ 86 $ 608 Commercial loan interest rate swap fees 3,607 2,393 1,954 1,214 1,653 Debit card income 3,604 3,077 2,830 527 774 Letter of credit fees 983 956 1,056 27 (73) Foreign exchange incomce 542 591 470 (49) 72 Other 1,691 1,728 1,543 (37) 148 Total 15,433 13,665 12,251 1,768 3,182 Service charges on deposit accounts: Overdraft fees 5,167 5,092 5,844 75 (677) Cash management fees 4,472 4,452 3,624 20 848 Other 2,620 2,726 3,554 (106) (934) Total 12,259 12,270 13,022 (11) (763) Investment management and trust services 13,066 12,803 12,157 263 909 Mortgage banking income 4,896 5,163 4,805 (267) 91 Other: Credit card income 3,080 2,866 2,829 214 251 Small business administration lending income 530 846 565 (316) (35) Other income 1,755 1,477 1,748 278 7 Total 5,365 5,189 5,142 176 223 Total Non-Interest Income, excluding securities gains $ 51,019 $ 49,090 $ 47,377 $ 1,929 $ 3,642 35
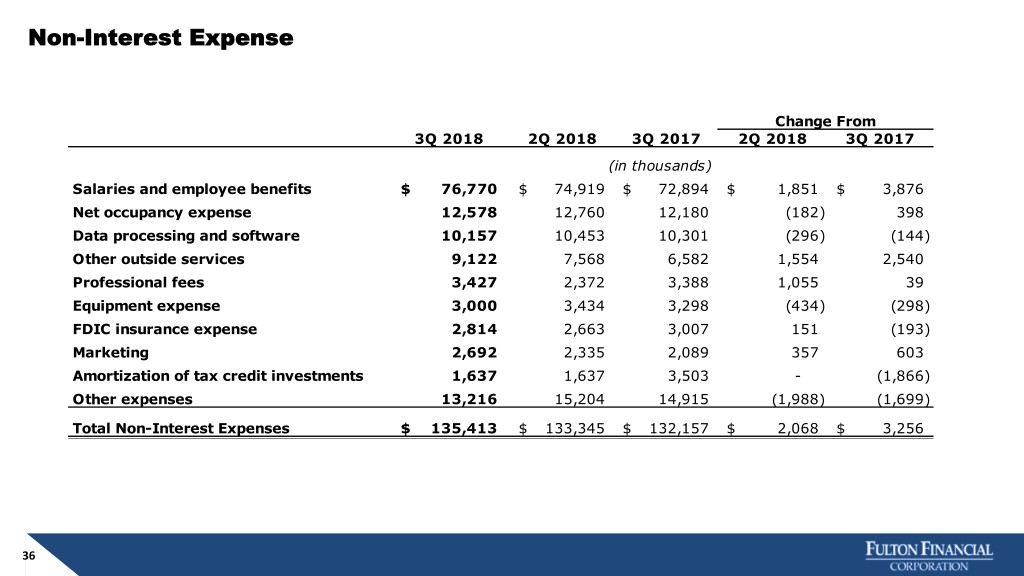
Non-Interest Expense Change From 3Q 2018 2Q 2018 3Q 2017 2Q 2018 3Q 2017 (in thousands) Salaries and employee benefits $ 76,770 $ 74,919 $ 72,894 $ 1,851 $ 3,876 Net occupancy expense 12,578 12,760 12,180 (182) 398 Data processing and software 10,157 10,453 10,301 (296) (144) Other outside services 9,122 7,568 6,582 1,554 2,540 Professional fees 3,427 2,372 3,388 1,055 39 Equipment expense 3,000 3,434 3,298 (434) (298) FDIC insurance expense 2,814 2,663 3,007 151 (193) Marketing 2,692 2,335 2,089 357 603 Amortization of tax credit investments 1,637 1,637 3,503 - (1,866) Other expenses 13,216 15,204 14,915 (1,988) (1,699) Total Non-Interest Expenses $ 135,413 $ 133,345 $ 132,157 $ 2,068 $ 3,256 36
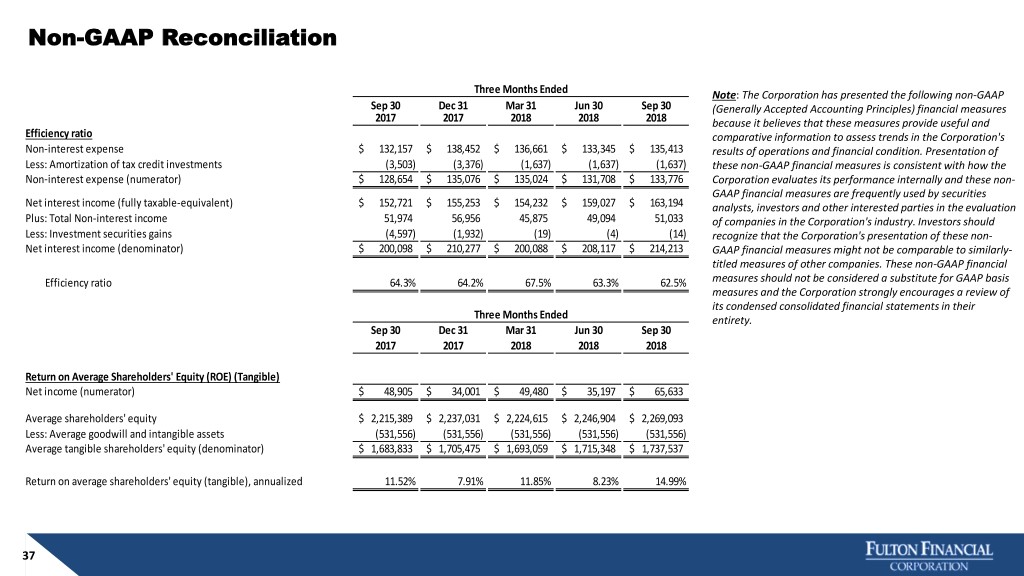
Non-GAAP Reconciliation Three Months Ended Note: The Corporation has presented the following non-GAAP Sep 30 Dec 31 Mar 31 Jun 30 Sep 30 (Generally Accepted Accounting Principles) financial measures 2017 2017 2018 2018 2018 because it believes that these measures provide useful and Efficiency ratio comparative information to assess trends in the Corporation's Non-interest expense $ 132,157 $ 138,452 $ 136,661 $ 133,345 $ 135,413 results of operations and financial condition. Presentation of Less: Amortization of tax credit investments (3,503) (3,376) (1,637) (1,637) (1,637) these non-GAAP financial measures is consistent with how the Non-interest expense (numerator) $ 128,654 $ 135,076 $ 135,024 $ 131,708 $ 133,776 Corporation evaluates its performance internally and these non- GAAP financial measures are frequently used by securities Net interest income (fully taxable-equivalent) $ 152,721 $ 155,253 $ 154,232 $ 159,027 $ 163,194 analysts, investors and other interested parties in the evaluation Plus: Total Non-interest income 51,974 56,956 45,875 49,094 51,033 of companies in the Corporation's industry. Investors should Less: Investment securities gains (4,597) (1,932) (19) (4) (14) recognize that the Corporation's presentation of these non- Net interest income (denominator) $ 200,098 $ 210,277 $ 200,088 $ 208,117 $ 214,213 GAAP financial measures might not be comparable to similarly- titled measures of other companies. These non-GAAP financial Efficiency ratio 64.3% 64.2% 67.5% 63.3% 62.5% measures should not be considered a substitute for GAAP basis measures and the Corporation strongly encourages a review of its condensed consolidated financial statements in their Three Months Ended entirety. Sep 30 Dec 31 Mar 31 Jun 30 Sep 30 2017 2017 2018 2018 2018 Return on Average Shareholders' Equity (ROE) (Tangible) Net income (numerator) $ 48,905 $ 34,001 $ 49,480 $ 35,197 $ 65,633 Average shareholders' equity $ 2,215,389 $ 2,237,031 $ 2,224,615 $ 2,246,904 $ 2,269,093 Less: Average goodwill and intangible assets (531,556) (531,556) (531,556) (531,556) (531,556) Average tangible shareholders' equity (denominator) $ 1,683,833 $ 1,705,475 $ 1,693,059 $ 1,715,348 $ 1,737,537 Return on average shareholders' equity (tangible), annualized 11.52% 7.91% 11.85% 8.23% 14.99% 37

Non-GAAP Reconciliation Sep 30 Dec 31 Mar 31 Jun 30 Sep 30 2017 2017 2018 2018 2018 Tangible Common Equity to Tangible Assets (TCE Ratio) (dollars in thousands) Shareholders' equity $ 2,225,786 $ 2,229,857 $ 2,235,493 $ 2,245,785 $ 2,283,014 Less: Intangible assets (531,556) (531,556) (531,556) (531,556) (531,556) Tangible shareholders' equity (numerator) $ 1,694,230 $ 1,698,301 $ 1,703,937 $ 1,714,229 $ 1,751,458 Total assets $ 20,062,860 $ 20,036,905 $ 19,948,941 $ 20,172,539 $ 20,364,810 Less: Intangible assets (531,556) (531,556) (531,556) (531,556) (531,556) Total tangible assets (denominator) $ 19,531,304 $ 19,505,349 $ 19,417,385 $ 19,640,983 $ 19,833,254 Tangible Common Equity to Tangible Assets 8.7% 8.7% 8.8% 8.7% 8.8% Three Months Ended Sep 30 Dec 31 Mar 31 Jun 30 Sep 30 2017 2017 2018 2018 2018 Pre-Provision Net Revenue (in thousands) Net interest income $ 146,809 $ 149,413 $ 151,318 $ 156,067 $ 160,127 Non-interest income 51,974 56,956 45,875 49,094 51,033 Less: Investment securities gains (4,597) (1,932) (19) (4) (14) Total Revenue $ 194,186 $ 204,437 $ 197,174 $ 205,157 $ 211,146 Non-interest expense $ 132,157 $ 138,452 $ 136,661 $ 133,345 $ 135,413 Less: Amortization of tax credit investments (3,503) (3,376) (1,637) (1,637) (1,637) Total Non-interest expense $ 128,654 $ 135,076 $ 135,024 $ 131,708 $ 133,776 Pre-Provision Net Revenue $ 65,532 $ 69,361 $ 62,150 $ 73,449 $ 77,370 38
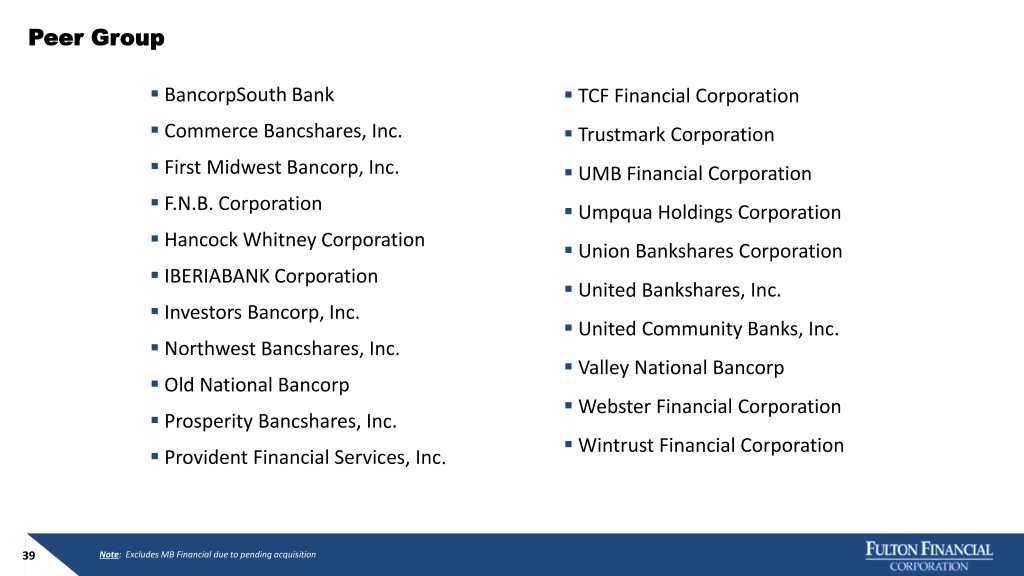
Peer Group . BancorpSouth Bank . TCF Financial Corporation . Commerce Bancshares, Inc. . Trustmark Corporation . First Midwest Bancorp, Inc. . UMB Financial Corporation . F.N.B. Corporation . Umpqua Holdings Corporation . Hancock Whitney Corporation . Union Bankshares Corporation . IBERIABANK Corporation . United Bankshares, Inc. . Investors Bancorp, Inc. . United Community Banks, Inc. . Northwest Bancshares, Inc. . Valley National Bancorp . Old National Bancorp . Webster Financial Corporation . Prosperity Bancshares, Inc. . Wintrust Financial Corporation . Provident Financial Services, Inc. 39 Note: Excludes MB Financial due to pending acquisition

www.fult.com


