
2020 AND FOURTH QUARTER RESULTS NASDAQ: FULT Data as of December 31, 2020 unless otherwise noted
This presentation may contain forward-looking statements with respect to the Corporation’s financial condition, results of operations and business. Do not unduly rely on forward-looking statements. Forward-looking statements can be identified by the use of words such as "may," "should," "will," "could," "estimates," "predicts," "potential," "continue," "anticipates," "believes," "plans," "expects," "future," "intends," “projects,” the negative of these terms and other comparable terminology. These forward-looking statements may include projections of, or guidance on, the Corporation’s future financial performance, expected levels of future expenses, including future credit losses, anticipated growth strategies, descriptions of new business initiatives and anticipated trends in the Corporation’s business or financial results. Management’s 2021 Outlook contained herein is comprised of forward-looking statements. Forward-looking statements are neither historical facts, nor assurance of future performance. Instead, they are based on current beliefs, expectations and assumptions regarding the future of the Corporation’s business, future plans and strategies, projections, anticipated events and trends, the economy and other future conditions. Because forward-looking statements relate to the future, they are subject to inherent uncertainties, risks and changes in circumstances that are difficult to predict and many of which are outside of the Corporation’s control, and actual results and financial condition may differ materially from those indicated in the forward-looking statements. Therefore, you should not unduly rely on any of these forward-looking statements. Any forward-looking statement is based only on information currently available and speaks only as of the date when made. The Corporation undertakes no obligation, other than as required by law, to update or revise any forward-looking statements, whether as a result of new information, future events or otherwise. A discussion of certain risks and uncertainties affecting the Corporation, and some of the factors that could cause the Corporation’s actual results to differ materially from those described in the forward-looking statements, can be found in the sections entitled “Risk Factors” and “Management’s Discussion and Analysis of Financial Condition and Results of Operations” in the Corporation’s Annual Report on Form 10-K for the year ended December 31, 2019, Quarterly Reports on Form 10-Q for the quarters end March 31, 2020, June 30, 2020 and September 30, 2020 and other current and periodic reports, which have been, or will be, filed with the Securities and Exchange Commission and are or will be available in the Investor Relations section of the Corporation’s website (www.fult.com) and on the Securities and Exchange Commission’s website (www.sec.gov). The Corporation uses certain non-GAAP financial measures in this presentation. These non-GAAP financial measures are reconciled to the most comparable GAAP measures at the end of this presentation. FORWARD-LOOKING STATEMENTS 2

1. ROA is return an average assets determined by dividing net income for the period indicated by average assets, annualized. 2. ROE is return on average shareholders’ equity determined by dividing net income for the period indicated by average shareholders’ equity, annualized. 3. Non-GAAP financial measure. Please refer to the calculation and management’s reasons for using this measure on the slide titled “Non-GAAP Reconciliation” at the end of this presentation. INCOME STATEMENT SUMMARY 3 Change From 4Q20 3Q20 4Q19 (dollars in thousands, except per-share data) Net Interest Income $ 161,591 $ 7,475 $ 2,321 Provision for Credit Losses 6,240 (840) (14,290) Non-Interest Income 55,574 (7,672) 293 Securities Gains — (2) — Non-Interest Expense 154,737 15,592 15,763 Income before Income Taxes 56,187 (14,951) 1,140 Income Taxes 5,362 (4,167) (1,896) Net Income 50,825 (10,785) 3,036 Preferred Stock Dividends (2,135) (2,135) (2,135) Net Income Available to Common Shareholders $ 48,690 $ (12,920) $ 901 Net income per share (diluted) $ 0.30 $ (0.08) $ 0.01 ROA (1) 0.79 % (0.19) % (0.08) % ROE (2) 7.95 % (2.38) % (0.15) % ROE (tangible) (3) 10.32 % (3.18) % (0.20) % Efficiency ratio (3) 69.5 % 7.2 % 6.5 %
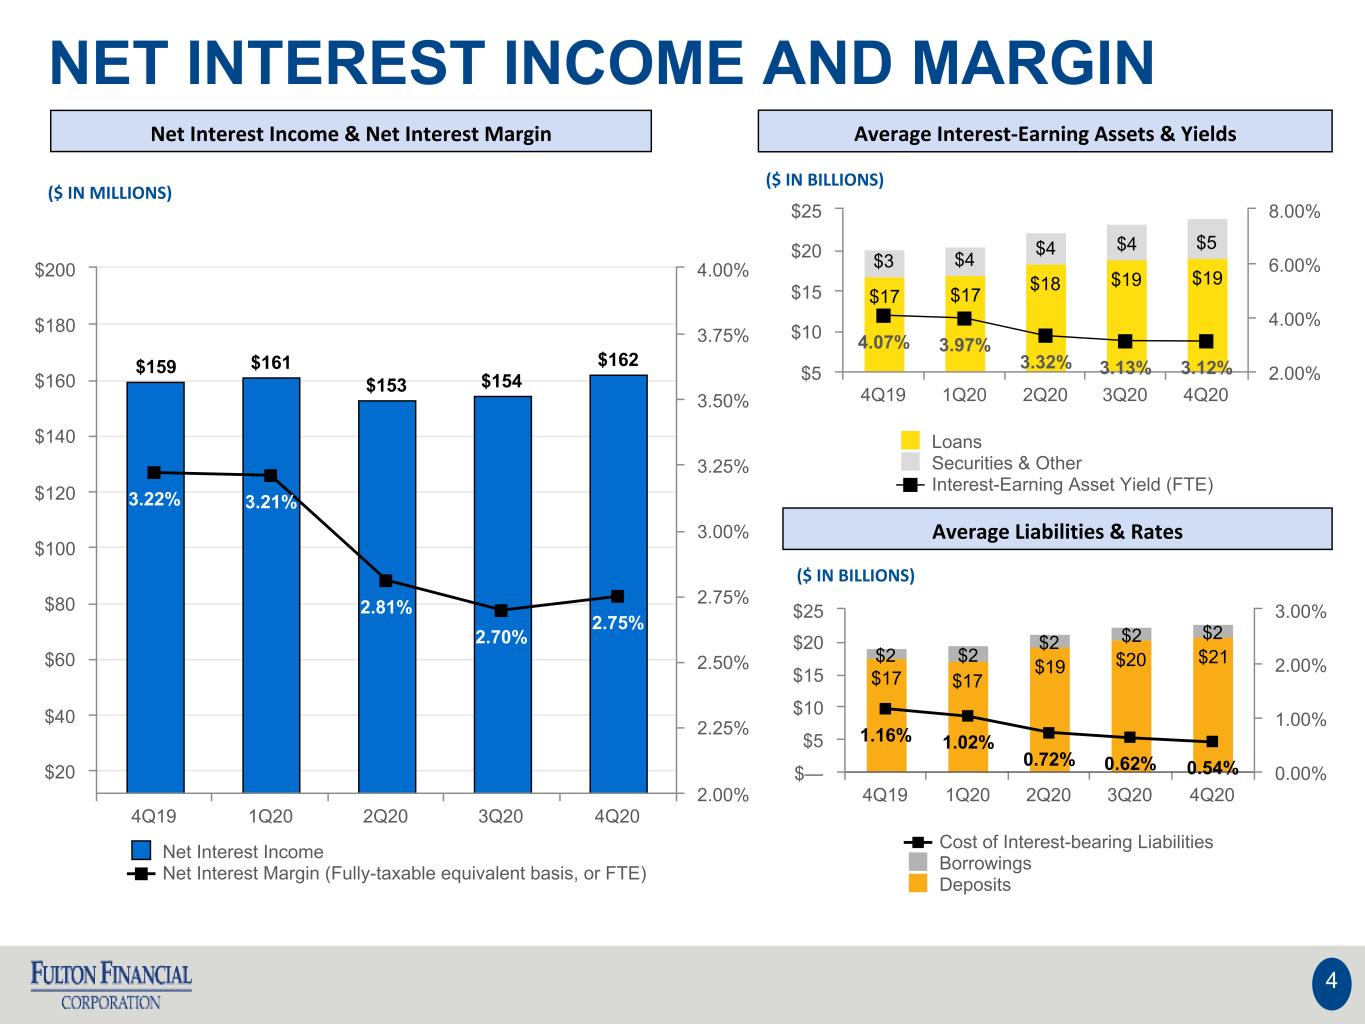
NET INTEREST INCOME AND MARGIN Net Interest Income & Net Interest Margin Average Interest-Earning Assets & Yields Average Liabilities & Rates ($ IN MILLIONS) ($ IN BILLIONS) ($ IN BILLIONS) 4 $17 $17 $19 $20 $21 $2 $2 $2 $2 $2 1.16% 1.02% 0.72% 0.62% 0.54% Cost of Interest-bearing Liabilities Borrowings Deposits 4Q19 1Q20 2Q20 3Q20 4Q20 $— $5 $10 $15 $20 $25 0.00% 1.00% 2.00% 3.00% $159 $161 $153 $154 $162 3.22% 3.21% 2.81% 2.70% 2.75% Net Interest Income Net Interest Margin (Fully-taxable equivalent basis, or FTE) 4Q19 1Q20 2Q20 3Q20 4Q20 $20 $40 $60 $80 $100 $120 $140 $160 $180 $200 2.00% 2.25% 2.50% 2.75% 3.00% 3.25% 3.50% 3.75% 4.00% $17 $17 $18 $19 $19 $3 $4 $4 $4 $5 4.07% 3.97% 3.32% 3.13% 3.12% Loans Securities & Other Interest-Earning Asset Yield (FTE) 4Q19 1Q20 2Q20 3Q20 4Q20 $5 $10 $15 $20 $25 2.00% 4.00% 6.00% 8.00%
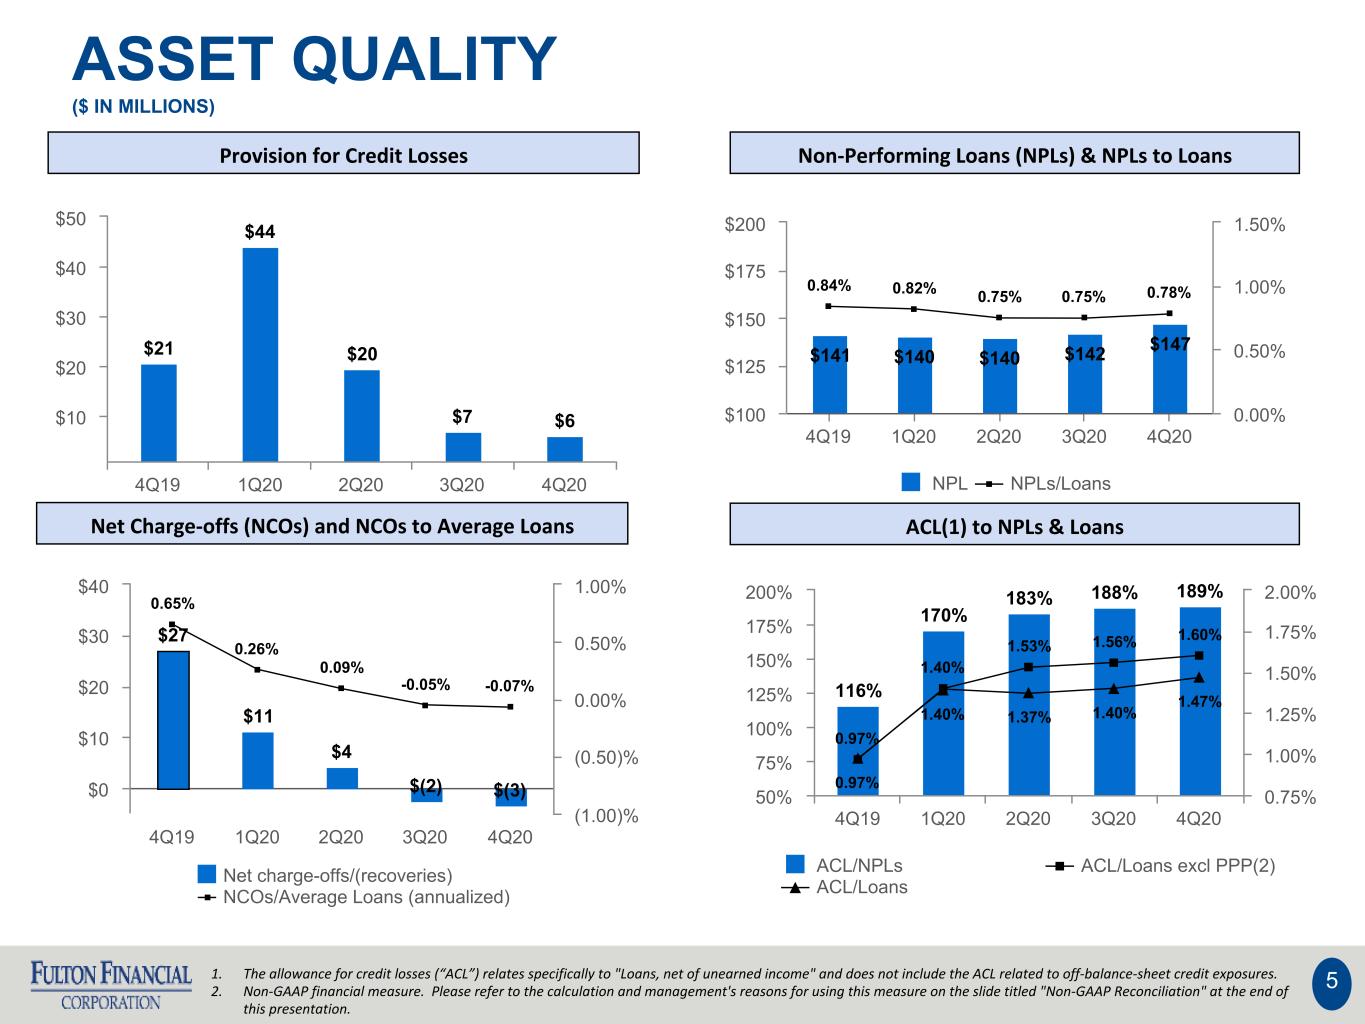
ASSET QUALITY ($ IN MILLIONS) Provision for Credit Losses Non-Performing Loans (NPLs) & NPLs to Loans Net Charge-offs (NCOs) and NCOs to Average Loans ACL(1) to NPLs & Loans 51. The allowance for credit losses (“ACL”) relates specifically to "Loans, net of unearned income" and does not include the ACL related to off-balance-sheet credit exposures. 2. Non-GAAP financial measure. Please refer to the calculation and management's reasons for using this measure on the slide titled "Non-GAAP Reconciliation" at the end of this presentation. $21 $44 $20 $7 $6 4Q19 1Q20 2Q20 3Q20 4Q20 $10 $20 $30 $40 $50 $141 $140 $140 $142 $147 0.84% 0.82% 0.75% 0.75% 0.78% NPL NPLs/Loans 4Q19 1Q20 2Q20 3Q20 4Q20 $100 $125 $150 $175 $200 0.00% 0.50% 1.00% 1.50% $27 $11 $4 $(2) $(3) 0.65% 0.26% 0.09% -0.05% -0.07% Net charge-offs/(recoveries) NCOs/Average Loans (annualized) 4Q19 1Q20 2Q20 3Q20 4Q20 $0 $10 $20 $30 $40 (1.00)% (0.50)% 0.00% 0.50% 1.00% 116% 170% 183% 188% 189% 0.97% 1.40% 1.53% 1.56% 1.60% 0.97% 1.40% 1.37% 1.40% 1.47% ACL/NPLs ACL/Loans excl PPP(2) ACL/Loans 4Q19 1Q20 2Q20 3Q20 4Q20 50% 75% 100% 125% 150% 175% 200% 0.75% 1.00% 1.25% 1.50% 1.75% 2.00%
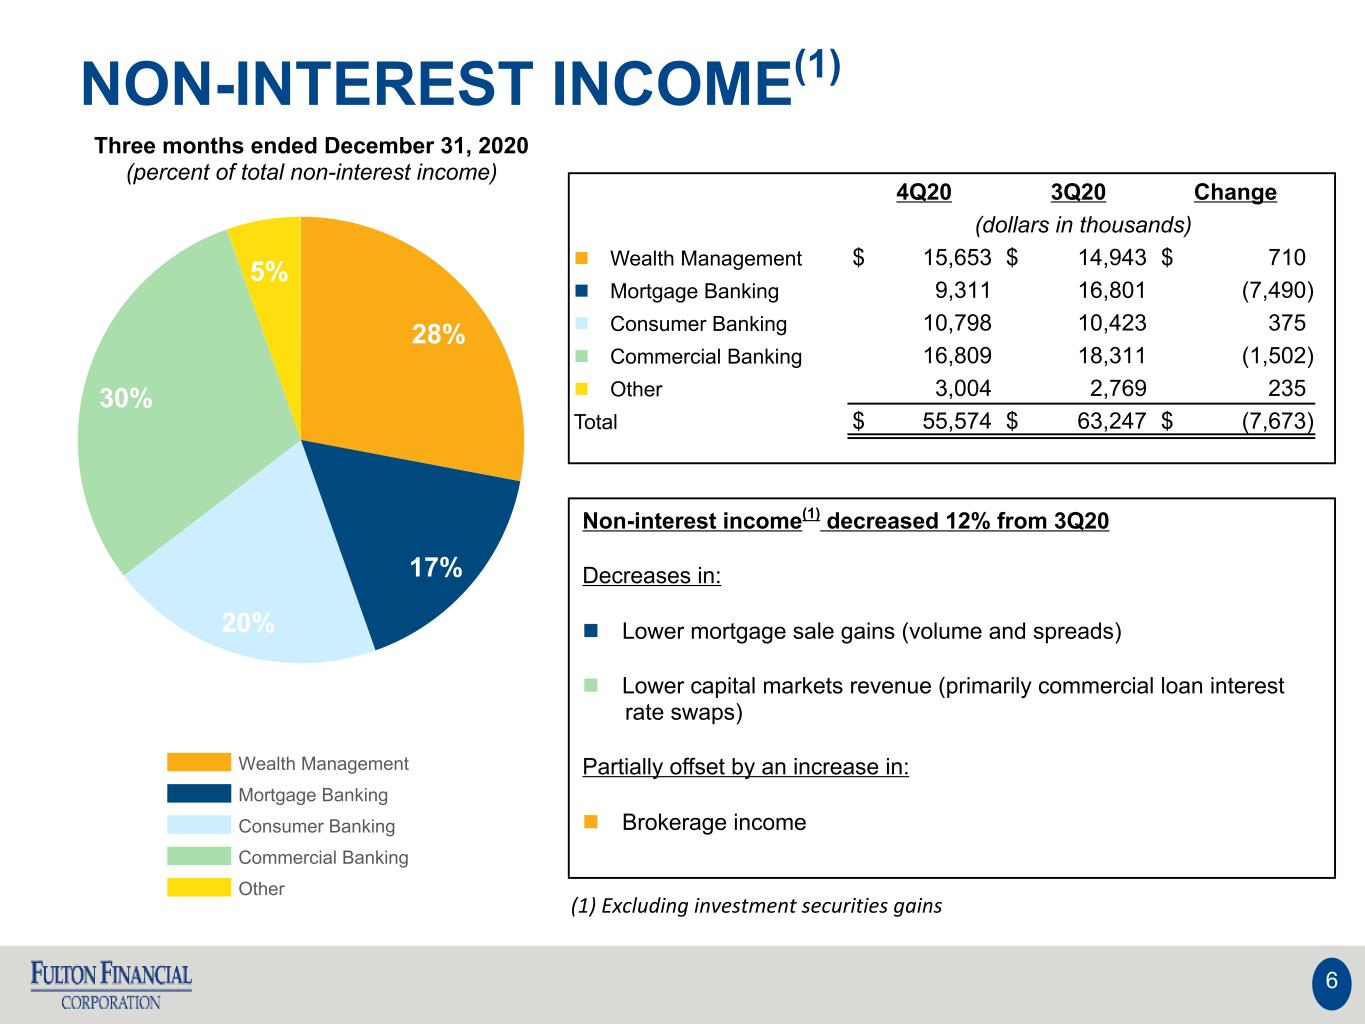
NON-INTEREST INCOME(1) (1) Excluding investment securities gains Three months ended December 31, 2020 (percent of total non-interest income) 6 Non-interest income(1) decreased 12% from 3Q20 Decreases in: n Lower mortgage sale gains (volume and spreads) n Lower capital markets revenue (primarily commercial loan interest rate swaps) Partially offset by an increase in: n Brokerage income 28% 17% 20% 30% 5% Wealth Management Mortgage Banking Consumer Banking Commercial Banking Other 4Q20 3Q20 Change (dollars in thousands) n Wealth Management $ 15,653 $ 14,943 $ 710 n Mortgage Banking 9,311 16,801 (7,490) n Consumer Banking 10,798 10,423 375 n Commercial Banking 16,809 18,311 (1,502) n Other 3,004 2,769 235 Total $ 55,574 $ 63,247 $ (7,673)
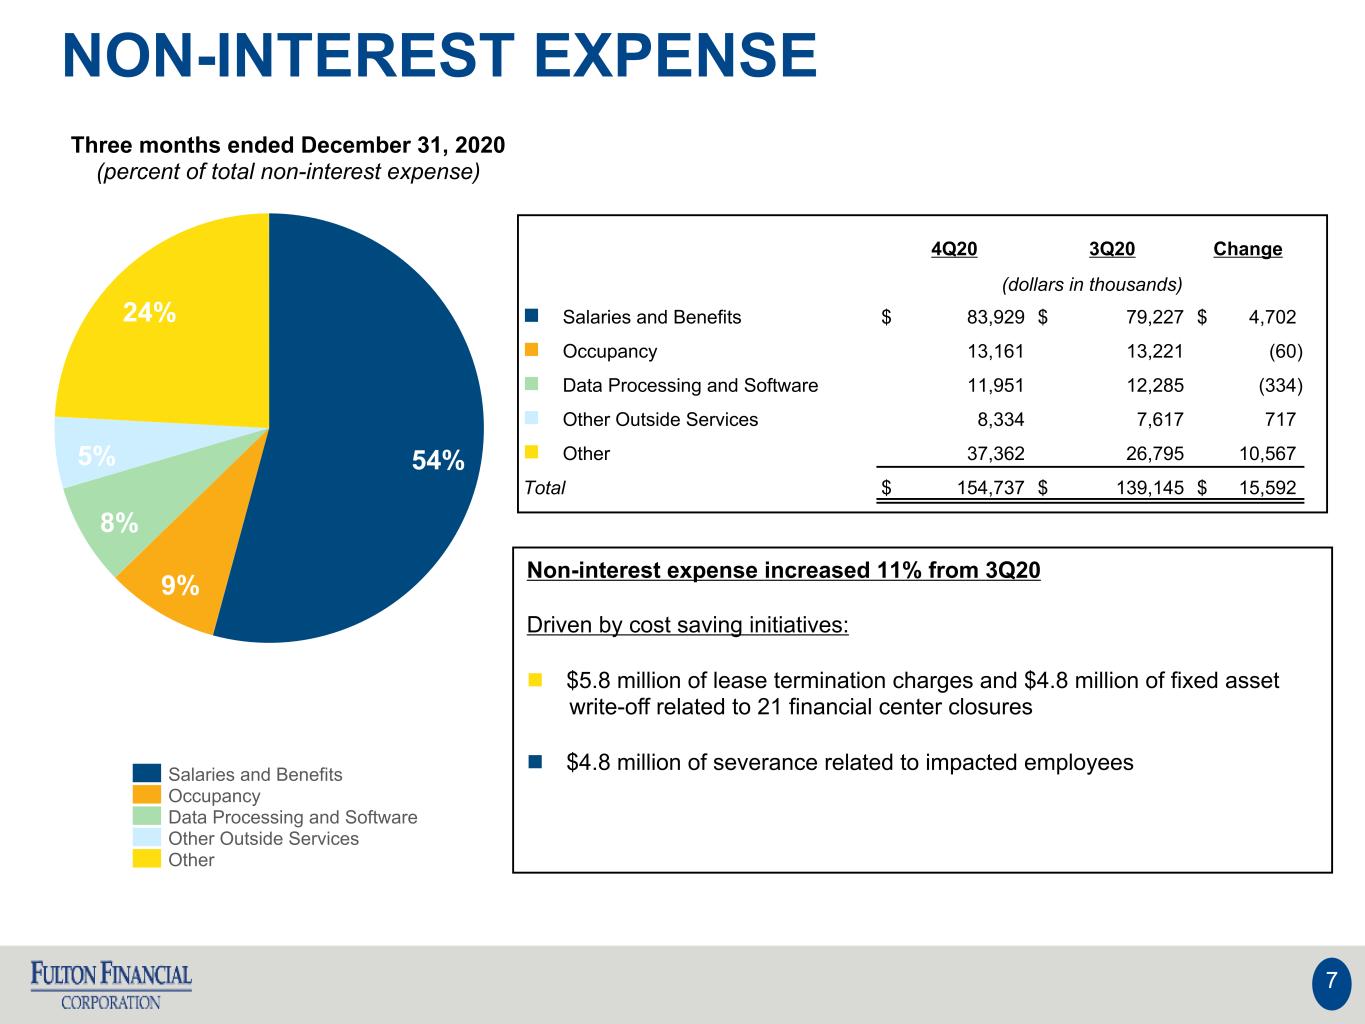
NON-INTEREST EXPENSE Three months ended December 31, 2020 (percent of total non-interest expense) 7 54% 9% 8% 5% 24% Salaries and Benefits Occupancy Data Processing and Software Other Outside Services Other 4Q20 3Q20 Change (dollars in thousands) n Salaries and Benefits $ 83,929 $ 79,227 $ 4,702 n Occupancy 13,161 13,221 (60) n Data Processing and Software 11,951 12,285 (334) n Other Outside Services 8,334 7,617 717 n Other 37,362 26,795 10,567 Total $ 154,737 $ 139,145 $ 15,592 Non-interest expense increased 11% from 3Q20 Driven by cost saving initiatives: n $5.8 million of lease termination charges and $4.8 million of fixed asset write-off related to 21 financial center closures n $4.8 million of severance related to impacted employees

COST SAVING INITIATIVES 8 Initiatives included the following outcomes: • Reallocation of management responsibilities and flattening of reporting structures • Closures of 21 financial centers • The renegotiation of certain vendor contracts $16.2 million of costs recognized in 2020, which included the following items: • Q3 2020 - $0.8 million in employee severance • Q4 2020 - $15.4 million in the following categories: ◦ $4.8 million in employee severance ◦ $4.8 million in fixed assets write-off ◦ $5.8 million in lease termination charges Cost Saving Initiative 3Q20 4Q20 $— $5.0 $10.0 $15.0 $20.0 dollars in millions Actual $0.8(1) Actual $15.4(2) (1) Recognized in salaries and benefit expense (2) Recognized $4.8 million in salaries and benefit expense and $10.6 million in other expense
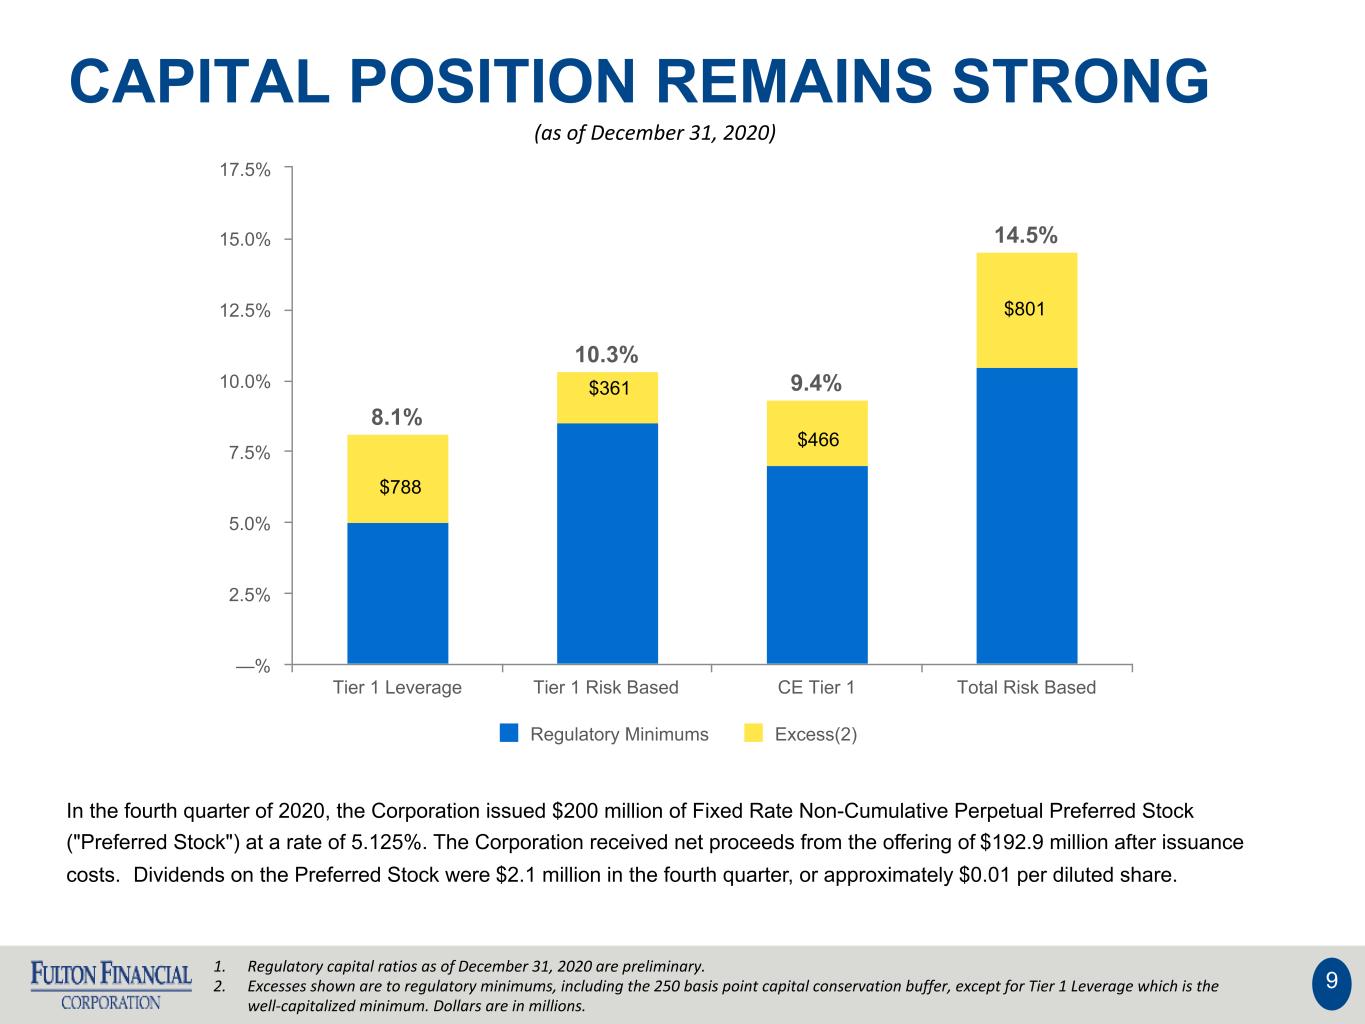
CAPITAL POSITION REMAINS STRONG 9 In the fourth quarter of 2020, the Corporation issued $200 million of Fixed Rate Non-Cumulative Perpetual Preferred Stock ("Preferred Stock") at a rate of 5.125%. The Corporation received net proceeds from the offering of $192.9 million after issuance costs. Dividends on the Preferred Stock were $2.1 million in the fourth quarter, or approximately $0.01 per diluted share. 1. Regulatory capital ratios as of December 31, 2020 are preliminary. 2. Excesses shown are to regulatory minimums, including the 250 basis point capital conservation buffer, except for Tier 1 Leverage which is the well-capitalized minimum. Dollars are in millions. 8.1% 10.3% 9.4% 14.5% Regulatory Minimums Excess(2) Tier 1 Leverage Tier 1 Risk Based CE Tier 1 Total Risk Based —% 2.5% 5.0% 7.5% 10.0% 12.5% 15.0% 17.5% $788 $361 $466 $801 (as of December 31, 2020)

2021 OUTLOOK 10 Net interest income: $620 - $640 million Provision for credit losses: $30 - $50 million Non-interest income: $210 - $220 million Non-interest expense: $550 - $570 million

NON-GAAP RECONCILIATION Note: The Corporation has presented the following non-GAAP (Generally Accepted Accounting Principles) financial measures because it believes that these measures provide useful and comparative information to assess trends in the Corporation's results of operations and financial condition. Presentation of these non-GAAP financial measures is consistent with how the Corporation evaluates its performance internally and these non-GAAP financial measures are frequently used by securities analysts, investors and other interested parties in the evaluation of companies in the Corporation's industry. Investors should recognize that the Corporation's presentation of these non-GAAP financial measures might not be comparable to similarly-titled measures of other companies. These non-GAAP financial measures should not be considered a substitute for GAAP basis measures and the Corporation strongly encourages a review of its condensed consolidated financial statements in their entirety. 11 Three months ended Dec 31 Sep 30 Dec 31 Return on average common shareholders' equity (tangible) 2020 2020 2019 Net income available to common shareholders $ 48,690 $ 61,610 $ 47,789 Plus: Intangible amortization, net of tax 104 103 112 (Numerator) 48,794 61,713 47,901 Average shareholders' equity $ 2,544,866 $ 2,374,091 $ 2,341,397 Less: Average preferred stock (127,639) — — Less: Average goodwill and intangible assets (535,474) (534,971) (534,190) Average tangible common shareholders' equity (denominator) 1,881,753 1,839,120 1,807,207 Return on average common shareholders' equity (tangible), annualized 10.3 % 13.5 % 10.5 %
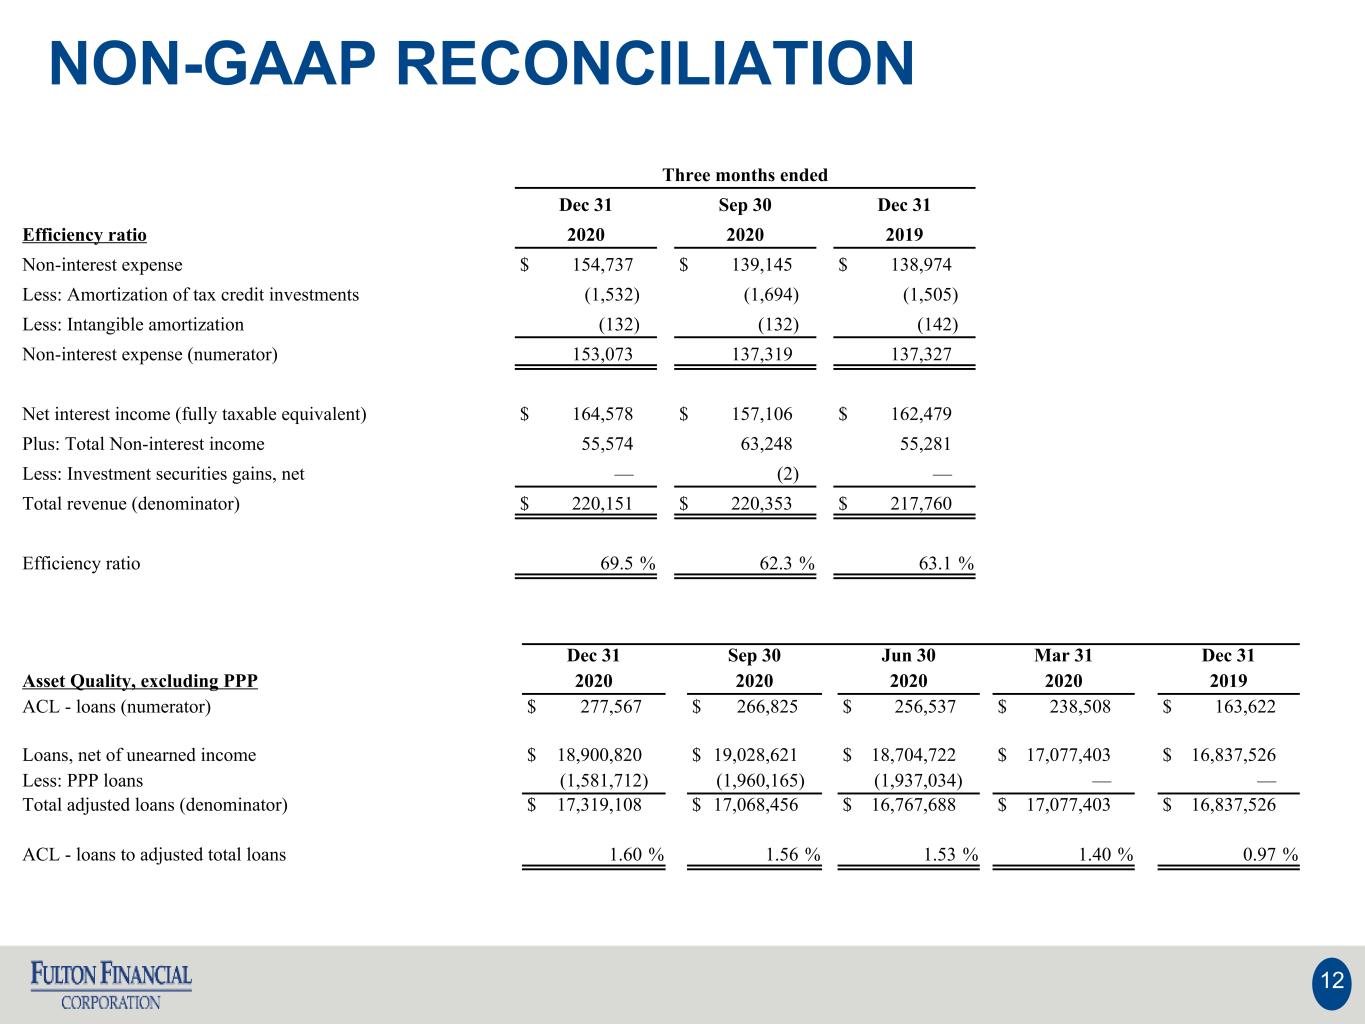
NON-GAAP RECONCILIATION 12 Three months ended Dec 31 Sep 30 Dec 31 Efficiency ratio 2020 2020 2019 Non-interest expense $ 154,737 $ 139,145 $ 138,974 Less: Amortization of tax credit investments (1,532) (1,694) (1,505) Less: Intangible amortization (132) (132) (142) Non-interest expense (numerator) 153,073 137,319 137,327 Net interest income (fully taxable equivalent) $ 164,578 $ 157,106 $ 162,479 Plus: Total Non-interest income 55,574 63,248 55,281 Less: Investment securities gains, net — (2) — Total revenue (denominator) $ 220,151 $ 220,353 $ 217,760 Efficiency ratio 69.5 % 62.3 % 63.1 % Dec 31 Sep 30 Jun 30 Mar 31 Dec 31 Asset Quality, excluding PPP 2020 2020 2020 2020 2019 ACL - loans (numerator) $ 277,567 $ 266,825 $ 256,537 $ 238,508 $ 163,622 Loans, net of unearned income $ 18,900,820 $ 19,028,621 $ 18,704,722 $ 17,077,403 $ 16,837,526 Less: PPP loans (1,581,712) (1,960,165) (1,937,034) — — Total adjusted loans (denominator) $ 17,319,108 $ 17,068,456 $ 16,767,688 $ 17,077,403 $ 16,837,526 ACL - loans to adjusted total loans 1.60 % 1.56 % 1.53 % 1.40 % 0.97 %

APPENDIX - CREDIT DISCLOSURES 13 Additional detail on deferrals and select industries (data as of December 31, 2020; all industry classifications based on NAICS codes)
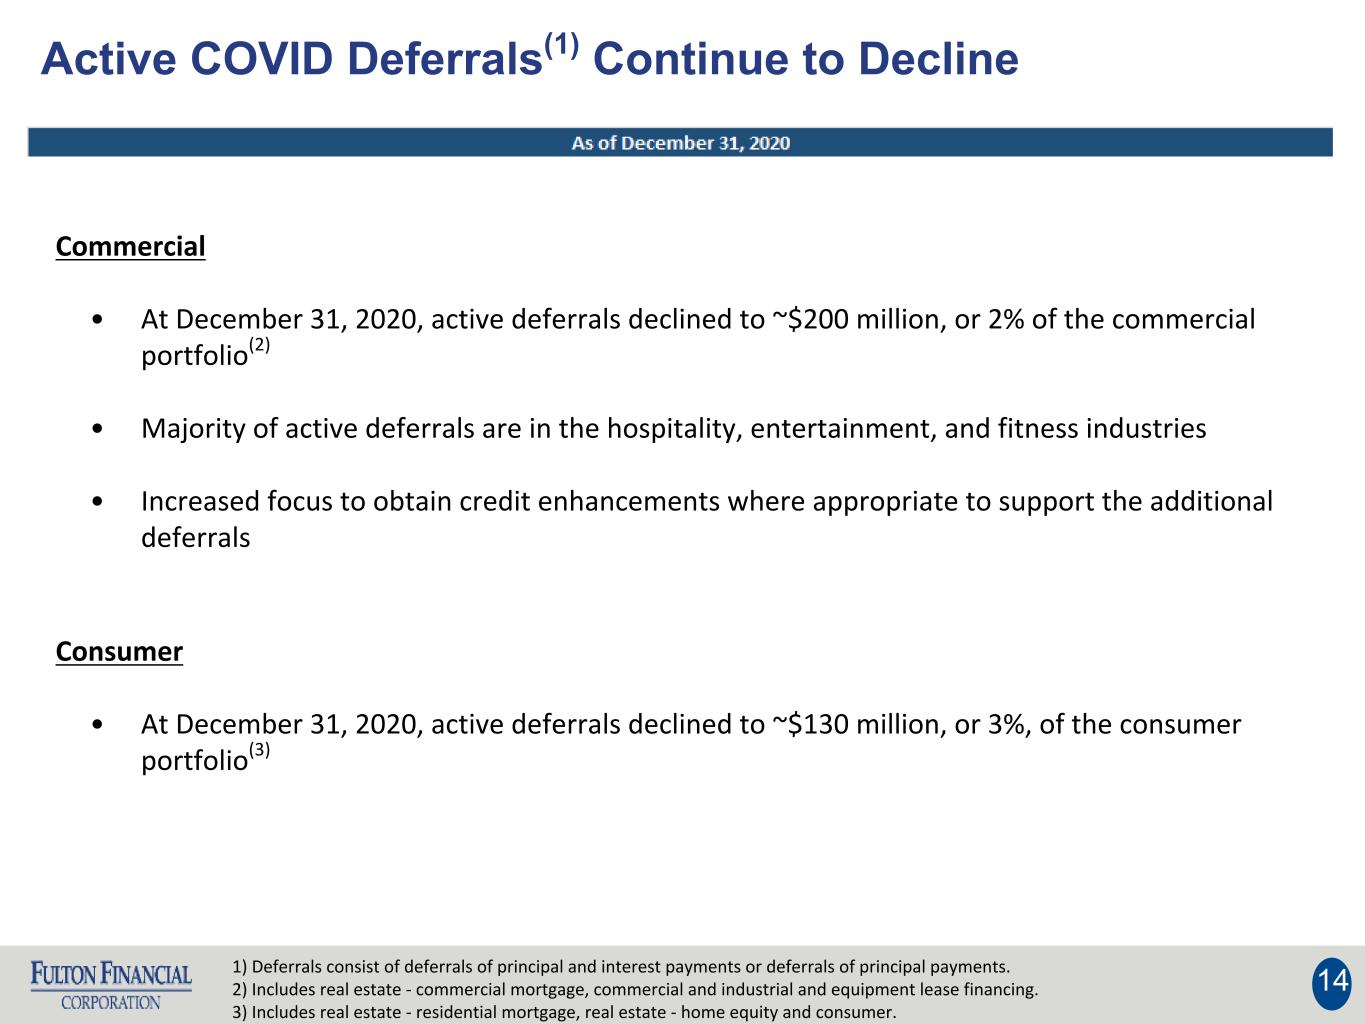
Active COVID Deferrals(1) Continue to Decline 14 Commercial • At December 31, 2020, active deferrals declined to ~$200 million, or 2% of the commercial portfolio(2) • Majority of active deferrals are in the hospitality, entertainment, and fitness industries • Increased focus to obtain credit enhancements where appropriate to support the additional deferrals Consumer • At December 31, 2020, active deferrals declined to ~$130 million, or 3%, of the consumer portfolio(3) 1) Deferrals consist of deferrals of principal and interest payments or deferrals of principal payments. 2) Includes real estate - commercial mortgage, commercial and industrial and equipment lease financing. 3) Includes real estate - residential mortgage, real estate - home equity and consumer.

Selected Industries With Heightened Risk Due to COVID-19 15 (1) Based on regulatory classifications. Commercial Portfolio consists of Commercial and Industrial, Commercial Mortgage, and Construction loans to commercial borrowers. Note: "Pass," "Special Mention" and "Substandard or Lower" are the Corporation's internal risk rating categories. Please see Note 1 - Basis of Presentation in the Corporation's Form 10-Q for the quarter ended September 30, 2020 for a description of these categories.
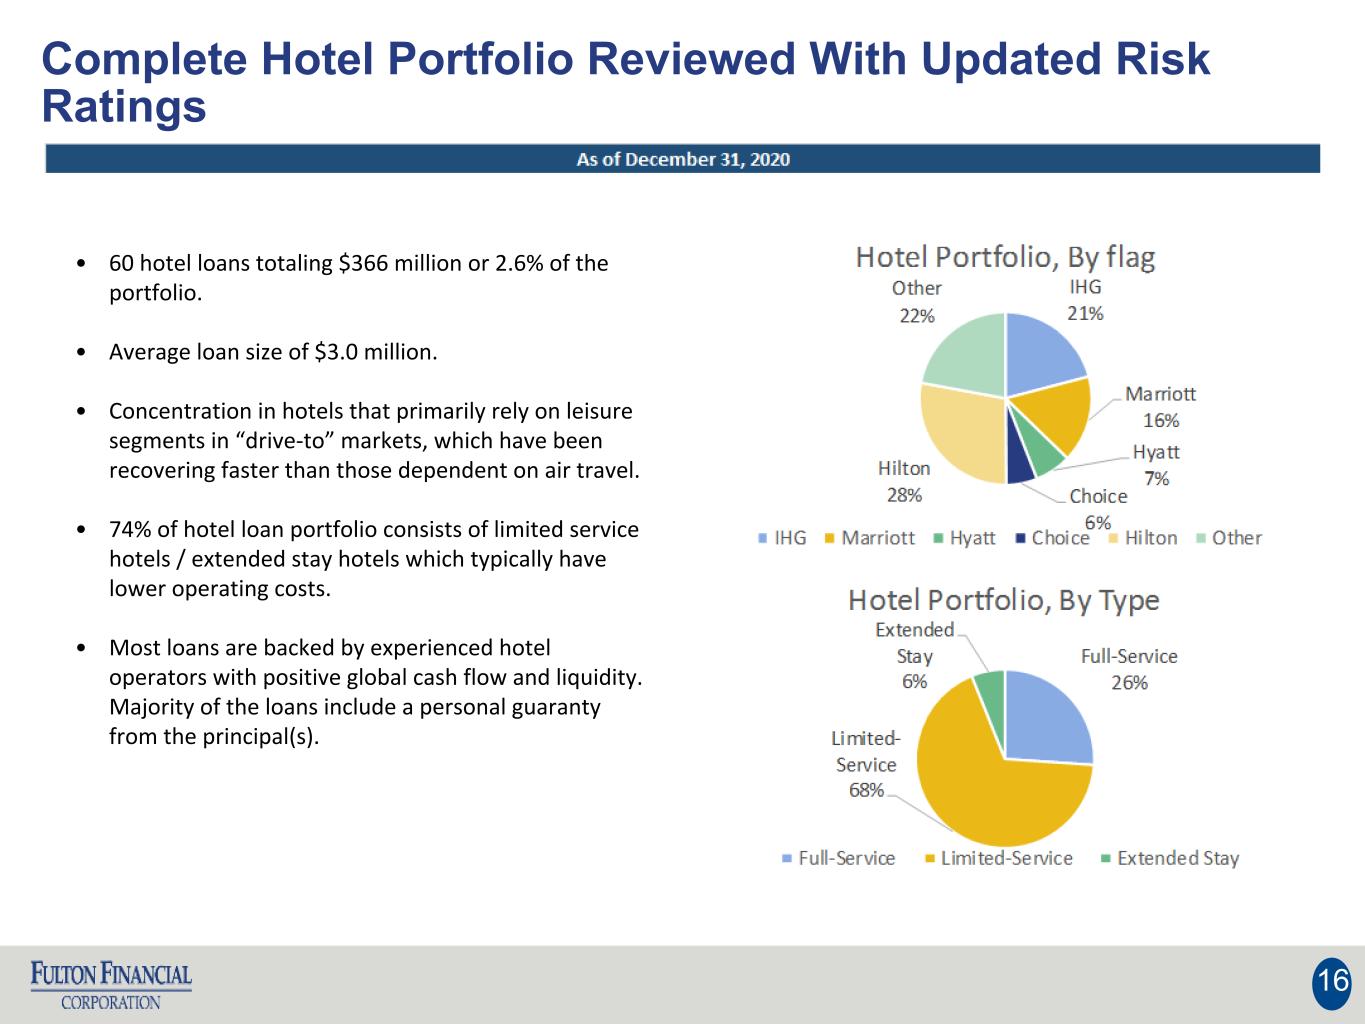
Complete Hotel Portfolio Reviewed With Updated Risk Ratings 16 • 60 hotel loans totaling $366 million or 2.6% of the portfolio. • Average loan size of $3.0 million. • Concentration in hotels that primarily rely on leisure segments in “drive-to” markets, which have been recovering faster than those dependent on air travel. • 74% of hotel loan portfolio consists of limited service hotels / extended stay hotels which typically have lower operating costs. • Most loans are backed by experienced hotel operators with positive global cash flow and liquidity. Majority of the loans include a personal guaranty from the principal(s).
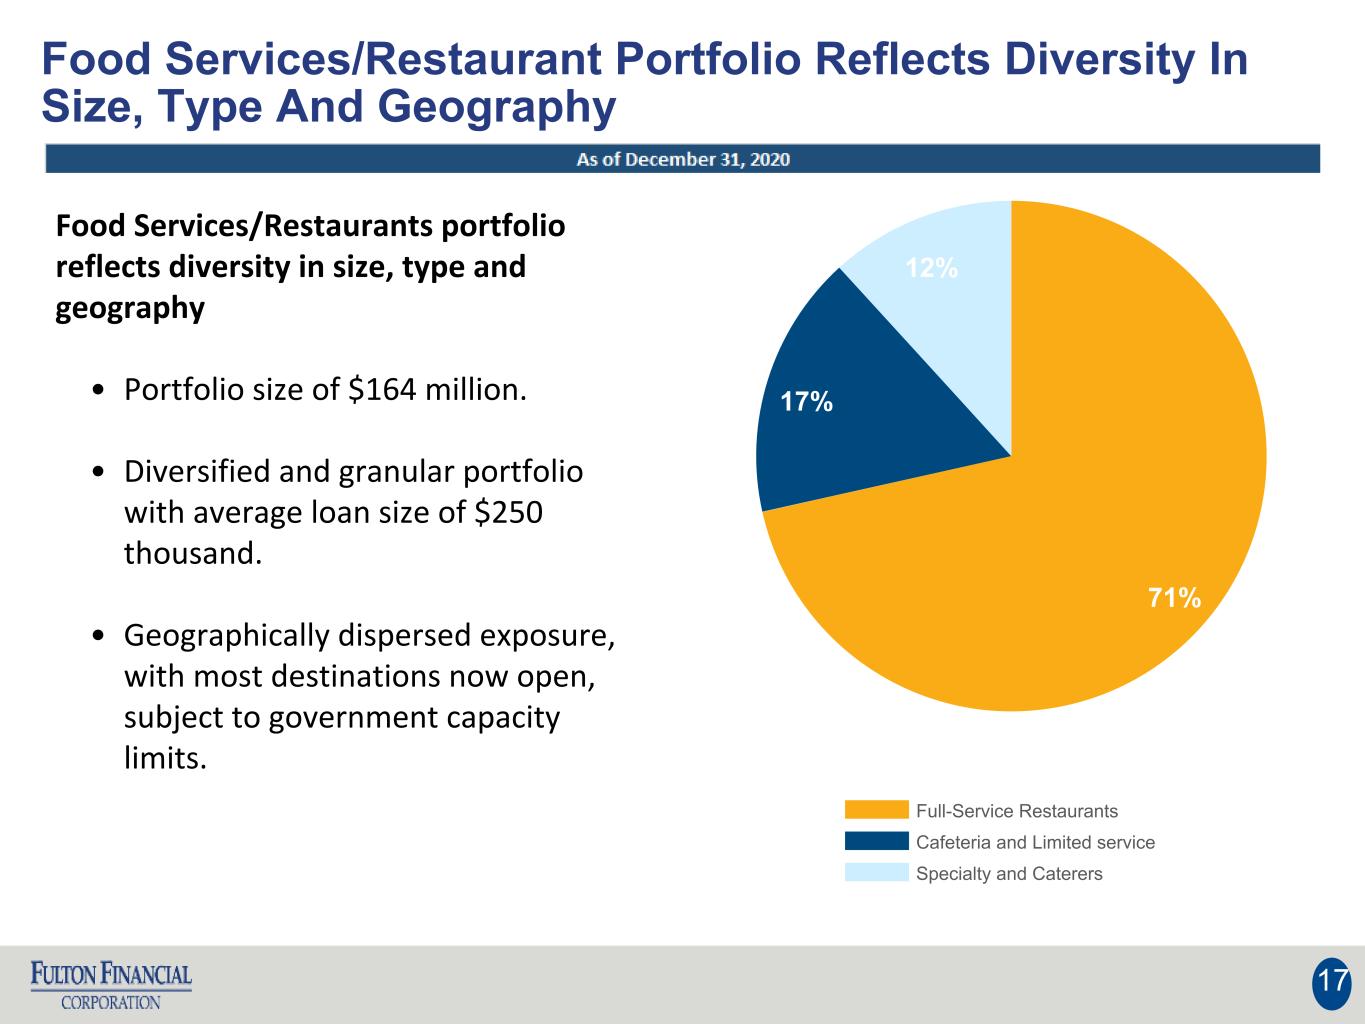
Food Services/Restaurant Portfolio Reflects Diversity In Size, Type And Geography 17 Food Services/Restaurants portfolio reflects diversity in size, type and geography • Portfolio size of $164 million. • Diversified and granular portfolio with average loan size of $250 thousand. • Geographically dispersed exposure, with most destinations now open, subject to government capacity limits. 71% 17% 12% Full-Service Restaurants Cafeteria and Limited service Specialty and Caterers

Arts and Entertainment: Portfolio Risk Assessment Shows Reasonable Ability To Perform Given Current Environment 18 The Arts/Entertainment portfolio risk assessment shows reasonable ability to perform given current environment • Portfolio of $307 million. • Diverse portfolio with average loan size of $1.1 million. • Largest sub-sector includes fitness centers. 80% of fitness portfolio comprised primarily of regional YMCA facilities across five-state footprint, which are open and operating as well as providing social and youth support activities during pandemic. • Performing Arts Promoters, Theater & Performing Arts and Spectator & Sports Teams portfolios reviewed and reflect reasonable ability to perform given current environment. 37% 16% 14% 12% 11% 4% 2% 4% Fitness and Recreational Sports Centers Golf Courses and Country Clubs Marinas Other Arts, Entertainment, and Recreation Performing Arts Promoters Theater & Performing Arts Spectator & Sports Teams Museums & Amusement
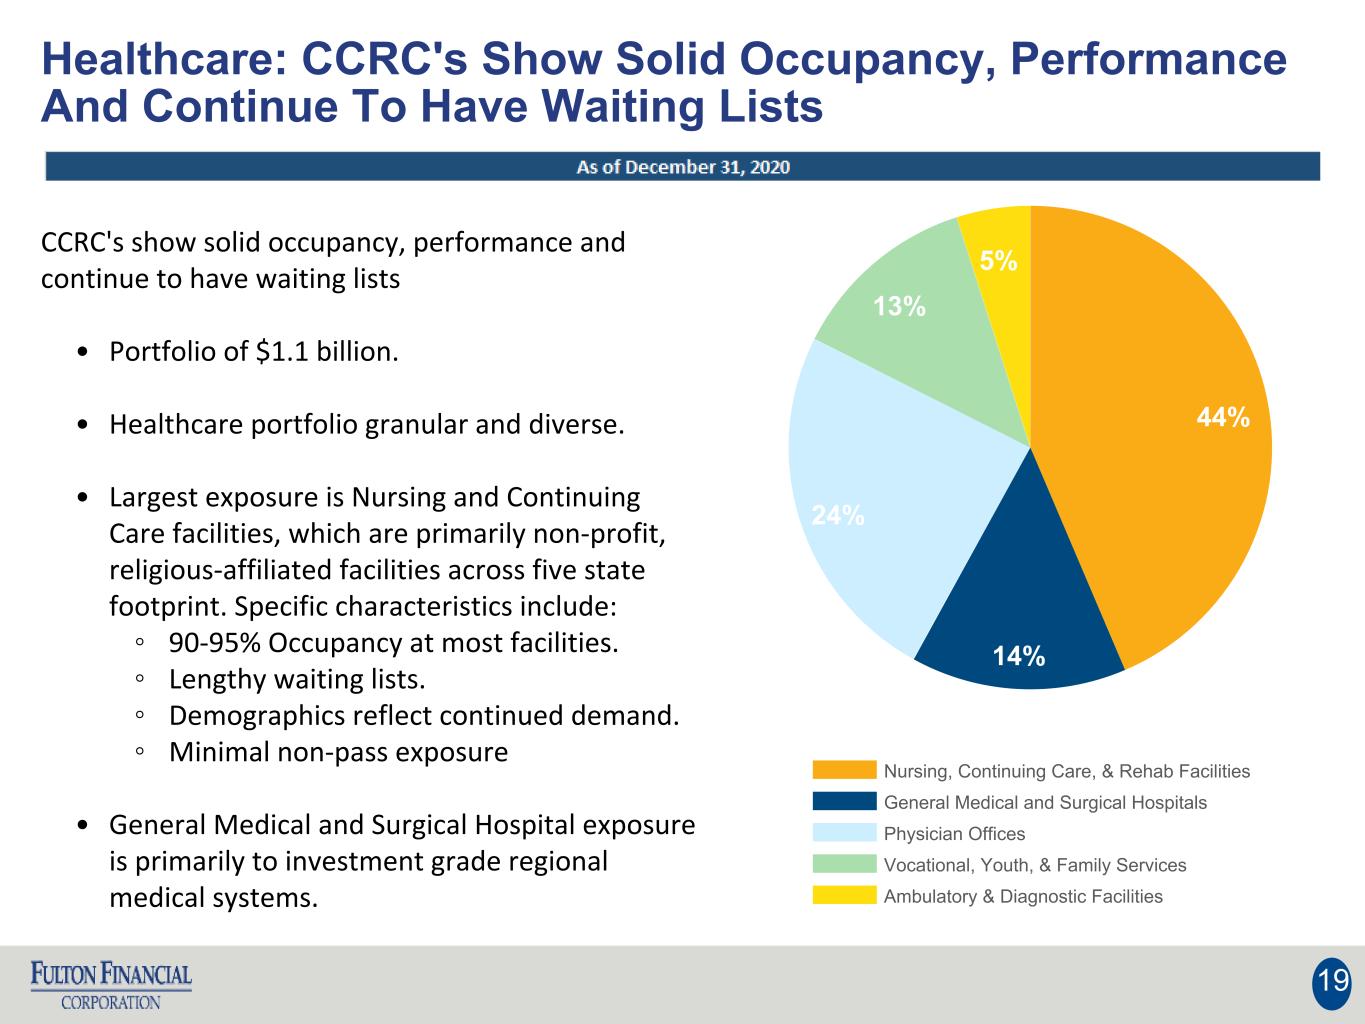
Healthcare: CCRC's Show Solid Occupancy, Performance And Continue To Have Waiting Lists 19 CCRC's show solid occupancy, performance and continue to have waiting lists • Portfolio of $1.1 billion. • Healthcare portfolio granular and diverse. • Largest exposure is Nursing and Continuing Care facilities, which are primarily non-profit, religious-affiliated facilities across five state footprint. Specific characteristics include: ◦ 90-95% Occupancy at most facilities. ◦ Lengthy waiting lists. ◦ Demographics reflect continued demand. ◦ Minimal non-pass exposure • General Medical and Surgical Hospital exposure is primarily to investment grade regional medical systems. 44% 14% 24% 13% 5% Nursing, Continuing Care, & Rehab Facilities General Medical and Surgical Hospitals Physician Offices Vocational, Youth, & Family Services Ambulatory & Diagnostic Facilities
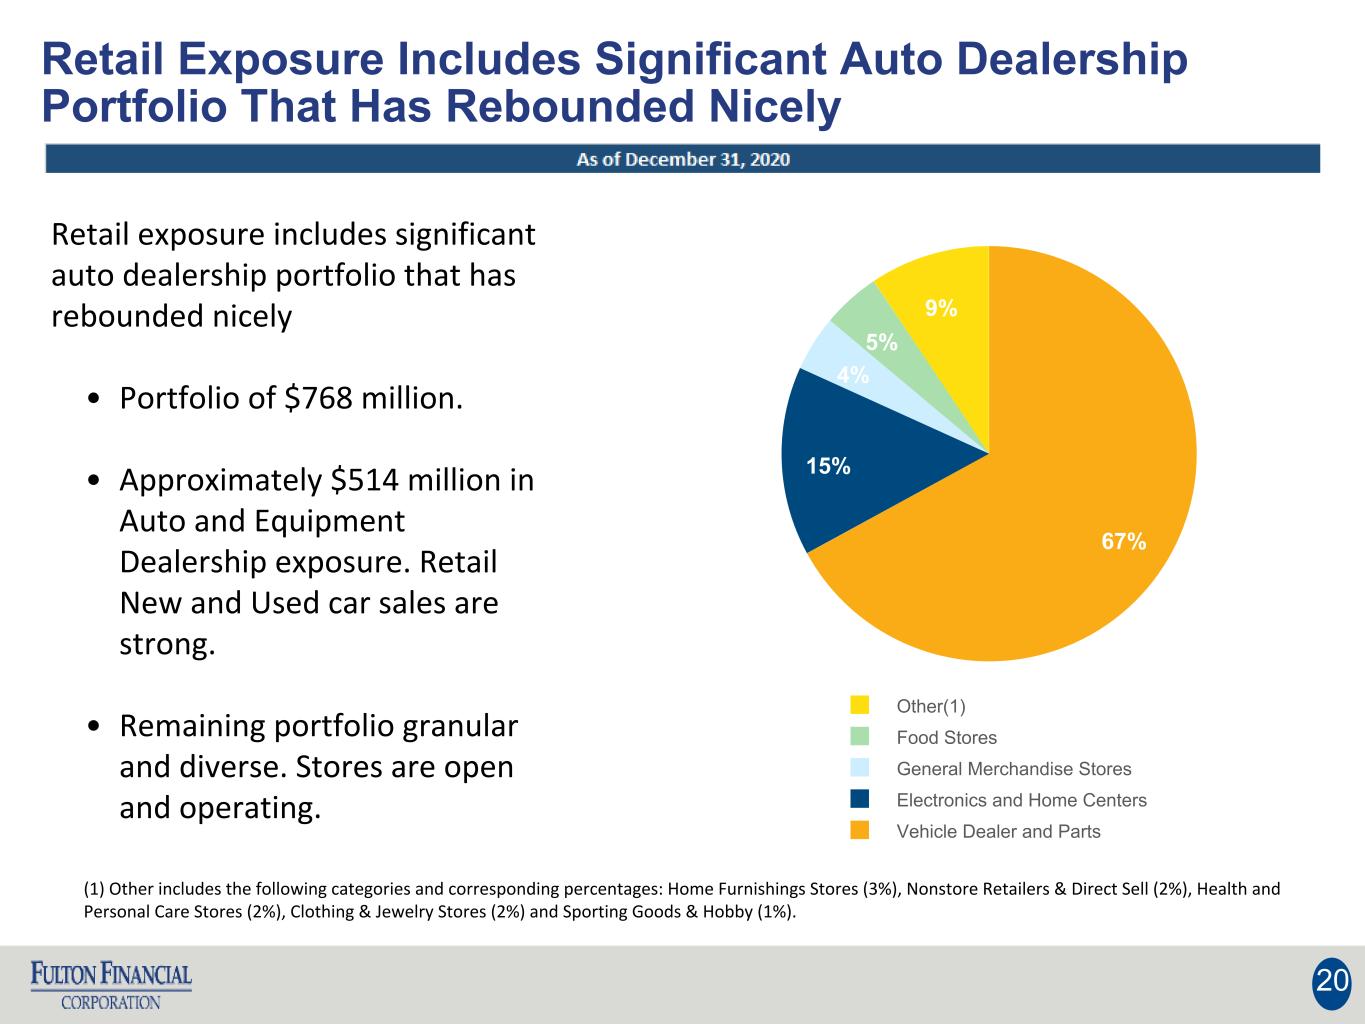
Retail Exposure Includes Significant Auto Dealership Portfolio That Has Rebounded Nicely 20 Retail exposure includes significant auto dealership portfolio that has rebounded nicely • Portfolio of $768 million. • Approximately $514 million in Auto and Equipment Dealership exposure. Retail New and Used car sales are strong. • Remaining portfolio granular and diverse. Stores are open and operating. 67% 15% 4% 5% 9% Other(1) Food Stores General Merchandise Stores Electronics and Home Centers Vehicle Dealer and Parts (1) Other includes the following categories and corresponding percentages: Home Furnishings Stores (3%), Nonstore Retailers & Direct Sell (2%), Health and Personal Care Stores (2%), Clothing & Jewelry Stores (2%) and Sporting Goods & Hobby (1%).
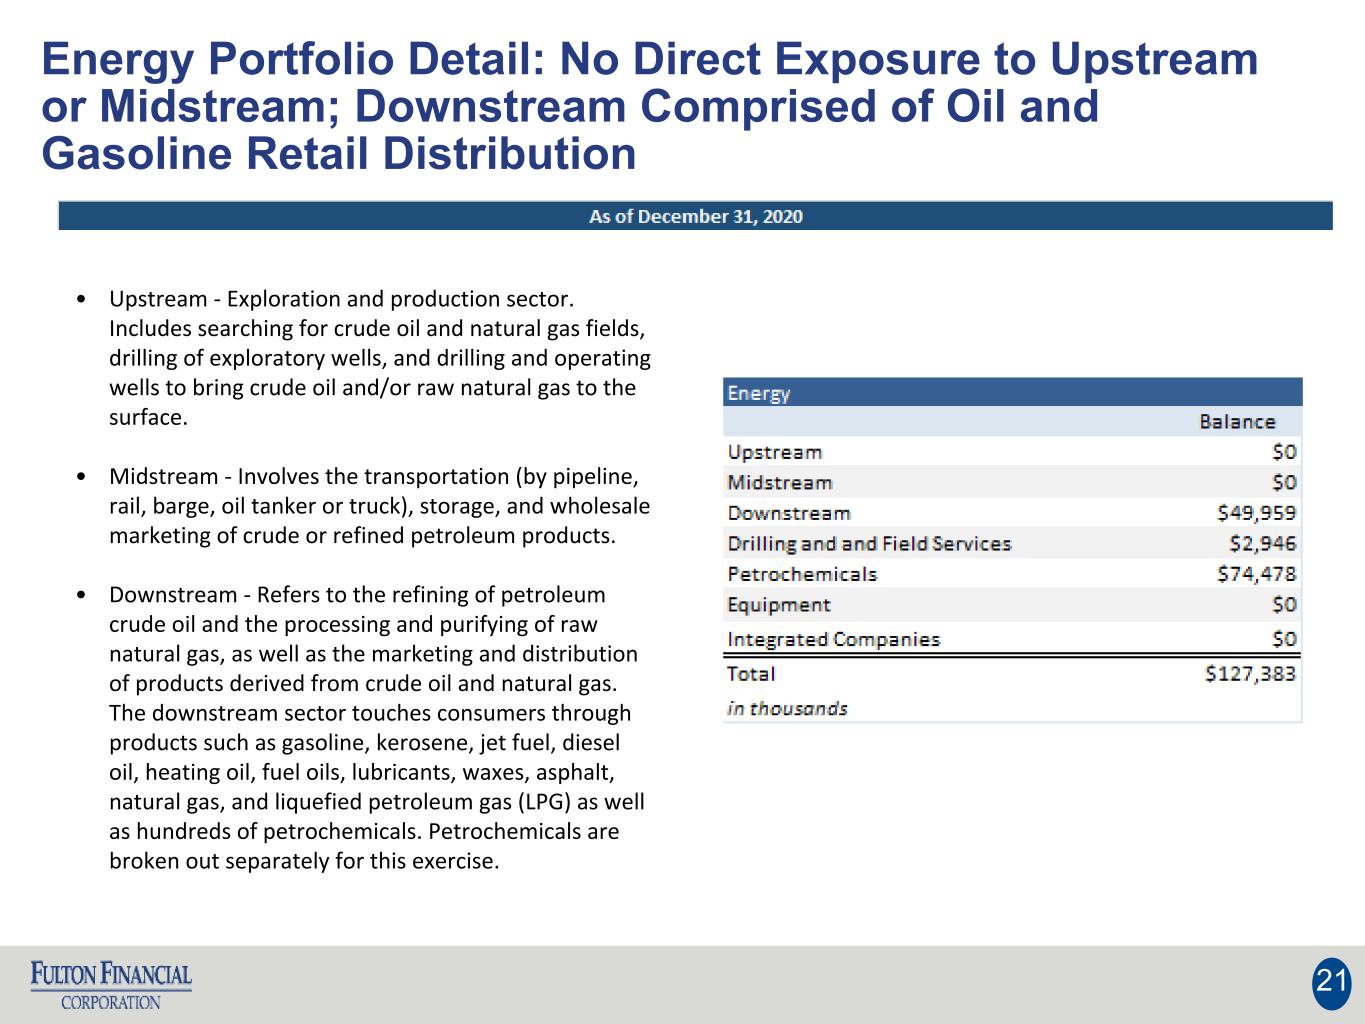
Energy Portfolio Detail: No Direct Exposure to Upstream or Midstream; Downstream Comprised of Oil and Gasoline Retail Distribution 21 • Upstream - Exploration and production sector. Includes searching for crude oil and natural gas fields, drilling of exploratory wells, and drilling and operating wells to bring crude oil and/or raw natural gas to the surface. • Midstream - Involves the transportation (by pipeline, rail, barge, oil tanker or truck), storage, and wholesale marketing of crude or refined petroleum products. • Downstream - Refers to the refining of petroleum crude oil and the processing and purifying of raw natural gas, as well as the marketing and distribution of products derived from crude oil and natural gas. The downstream sector touches consumers through products such as gasoline, kerosene, jet fuel, diesel oil, heating oil, fuel oils, lubricants, waxes, asphalt, natural gas, and liquefied petroleum gas (LPG) as well as hundreds of petrochemicals. Petrochemicals are broken out separately for this exercise.


