
Fulton Financial Corporation
Ferris Baker, Watts Inc.
Mid-Atlantic Bank Conference
August 8, 2007
1

Forward-Looking Statement
The following presentation may contain forward-looking statements about
Fulton Financial Corporation’s growth and acquisition strategies, new
products and services, and future financial performance, including
earnings and dividends per share, return on average assets, return on
average equity, efficiency ratio and capital ratio. Forward-looking
statements are encouraged by the Private Securities Litigation Reform Act
of 1995.
Such forward-looking information is based upon certain underlying
assumptions, risks and uncertainties. Because of the possibility of
change in the underlying assumptions, actual results could differ
materially from these forward-looking statements. Risks and uncertainties
that may affect future results include: pricing pressures on loans and
deposits, actions of bank and non-bank competitors, changes in local and
national economic conditions, changes in regulatory requirements,
actions of the Federal Reserve Board, the Corporation’s success in merger
and acquisition integration, and customers’ acceptance of the
Corporation’s products and services.
2

Presentation Outline
Overview
Strategic Issues and Responses
Challenges
Recent trends
Financial Performance
Summary
Questions
3
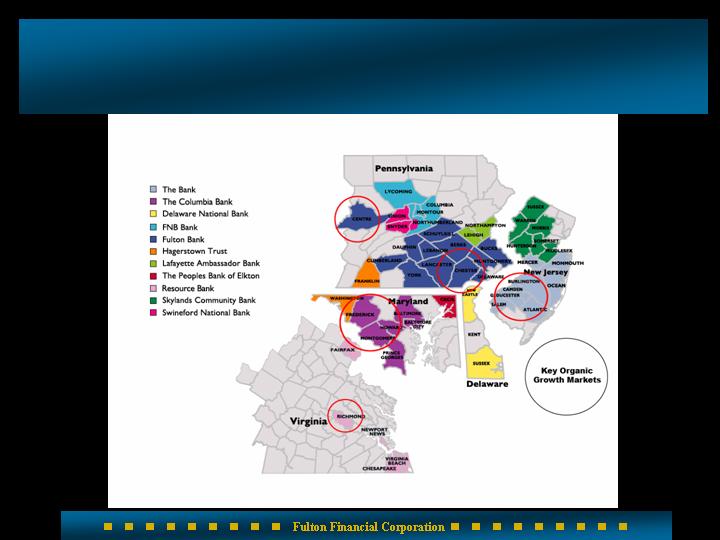
Key Organic Growth Markets
4

Organic Growth Initiatives
Additional cash management product
options to keep funds on balance sheet
Market segmentation / targeted direct mail
Corporate-wide sales / incentive programs
Remote deposit item capture / business
clients
Corporate credit card rewards program
Small business segment
Affiliate CEO scorecard
5

FFC Affiliates in Affluent
Markets*
*Source: SNL, Median HH Income, 2006 data
6
County
National
Ranking
Ranking in
State
Median HH
Ranking
FFC Affiliate
Fairfax, VA
#3
#2
$101,762
Resource Bank
Hunterdon, NJ
#4
#1
$100,485
Skylands Bank
Morris, NJ
#7
#2
$96,965
Skylands Bank
Somerset, NJ
#8
#3
$96,350
Skylands Bank
Howard, MD
#9
#1
$92,433
Columbia Bank
Montgomery, MD
#19
#2
$87,053
Columbia Bank
Chester, PA
#24
#1
$83,001
Fulton Bank

Serving PA’s Strongest Markets*
*Source: SNL, Median HH Income, 2006 data
7
County
Rank
Projected
Change
2006 - 2011
Median
HH Income
2006
Projected HH
Income Change
2006 - 2011
Chester, PA
1
9.63%
$83,001
25.46%
Montgomery, PA
2
3.05
77,383
23.86
Bucks, PA
3
4.06
76,234
23.89
Delaware, PA
4
0.17
63,220
20.68
Cumberland, PA
5
4.37
58,384
18.62
Northampton, PA
6
8.45
56,249
18.97
Lancaster, PA
8
4.62
55,546
17.63
York, PA
9
6.18
55,118
17.39
Lehigh, PA
10
5.46
55,107
19.86
Berks, PA
11
5.62
55,089
17.50
Average
4.66
63,533
19.82
Average of all other (57)
1.20
42,366
16.64

Fulton Financial Profile
Regional financial holding company
(formed in 1982)
11 community banks and 3 financial
services affiliates in 5 states
260 community banking offices
Asset size: $15.1 billion
Market capitalization: $2.3 billion
8

25 consecutive years of record earnings
33 consecutive years of dividend
increases
10.1% compounded annual growth rate in
dividends per share
8.5% compounded annual growth rate in
earnings per share (last 5 years = 7.0%)
25 bank acquisitions
What have we accomplished?
9
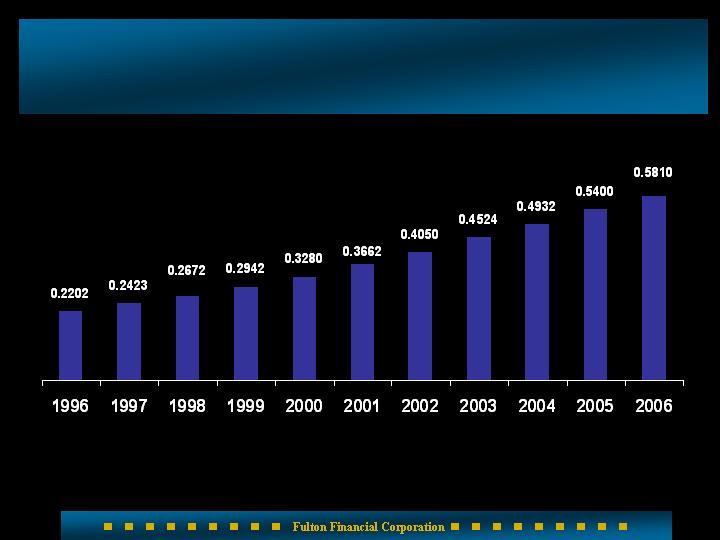
10-year Dividend History
10

Quarterly Cash Dividend
15 cents
Dividend yield:
approximately 4.40%
11

Capital (6/30/07 estimates)
Total Capital (GAAP): $1.5 billion
Total Regulatory Capital: $1.4 billion
Ratios (estimated):
Total Risk-Based Capital 12.80%
Tier 1 Risk-Based Capital 10.00%
Leverage Capital 7.80%
12

Stock Repurchase
April 2007: 1 million share buyback
in progress through 12/31/07.
Long history of repurchasing our
shares
13

Financial Performance
14

Q2/07
Tough quarter
Reported EPS of .23/share
Significant, aggressive steps to
improve earnings
Optimistic about developing trends
Additional Alt-A repayment requests
Costs of workforce initiatives
Good loan and deposit growth
15

Challenges
Improving our earnings
Loan loss provision returning to
more normal levels
Reduced level of bank stock gains
Consumer loan growth
Resource Mortgage repurchase
requests
16

Recent Positive Trends
Strong commercial loan growth and pipeline
Linked quarter core deposit growth
Increased margin normalization
Declining CD re-pricing differential
Improved loan yields
Slightly steeper yield curve
Reduced Alt-A exposure
17

RMC: Future Exposure
*All 1st Lien
**$1 million 1st Lien
.6 2nd
$1.3 million
Estimated EPD exposure
$15.3 million
Total
$1.6** million
=
Pre 3/31/07 – Monitoring Loans
$13.7* million
=
New Fundings - 2nd Quarter
18

Increasing Non-interest Income
Company-wide promotions to
increase referrals for fee-generating
products and services:
Investment management and trust services
Cash Management
Credit and debit cards
Leasing
International services
19

Fulton Financial Advisors
New senior leadership
Reduction of overhead
Recurring fee new business pipeline
20

Operating Efficiency
21

Consolidation, Standardization
and Centralization
22

Benefits of Consolidation
15 banking affiliates reduced to 11 in
seven months
Market and geographic efficiencies
Leverage brand over wider market
Larger affiliate provides strong
leadership and management expertise
Business model intact
Fewer affiliates, faster standardization
23

Reducing Expenses
Product standardization that
simplifies customer choices
Departmental centralization
Workforce management – job
elimination and attrition
Employee benefit plan consistency
24

Anticipated Impact
$1.5 million per month
beginning 2008
25

Customer Experience
26

Customer Satisfaction
*Retail:
90% extremely/very satisfied
Commercial:
90% extremely/very satisfied
Fulton Financial Advisors:
80+% very satisfied/satisfied
Fulton Mortgage Company:
99% of expectations met/exceeded
98% would recommend FMC to others
*Compared to national average of 62%
Source: American Banker/Gallup Consumer Survey
27

Customer Experience
Customer experience champion in
every affiliate and department
Simplified product choices
Standardization of process and
procedures across all affiliates
28

Market Opportunities
In market M&A = opportunity to grow
households
Leverage our high customer
satisfaction
Increased targeted advertising and
promotion
“Local” = perceived value
Customer retention is a key strength
29

43 relationships with commitments to lend
of $20 million or more
Maximum individual commitment of
$33 million
Average commercial lending relationship size is
$394,444
Loans and corresponding relationships are within
Fulton’s geographic market area
Summary of Larger Loans
30
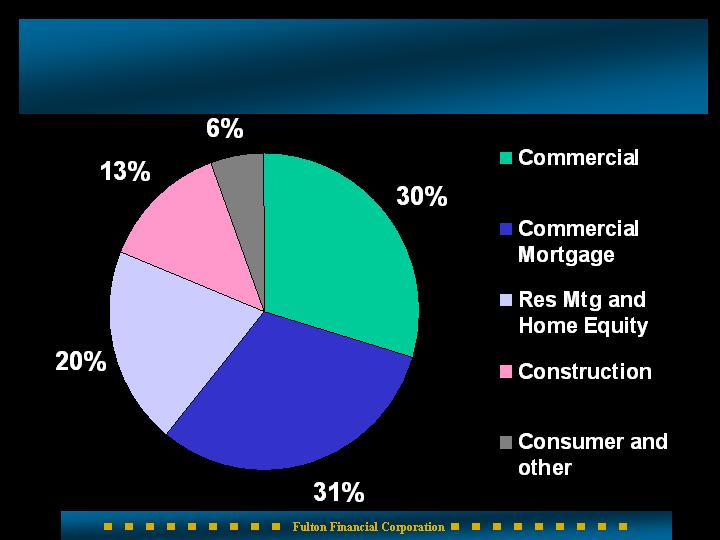
Loan Diversification (6/30/07)
31

Commercial Loan Concentration
By Industry (as of 6/30/07)
32
Industry
%
Construction
28.0
RE - Investor - Owned
22.1
Services
13.5
Manufacturing
7.6
Retail
6.3
Health Care
5.8
Agriculture
4.9
Wholesale
4.2
Other
2.7
Financial Services
2.1
Arts and Entertainment
1.6
Transportation
1.2
100.0

Short-term rating P-1
Long-term rating
Issuer A-2
Lead Bank Deposits A-1
Outlook Stable
Credit Ratings
Moody’s Investor Services
Short-term rating F-1
Long-term rating A
Outlook Stable
Fitch Ratings
Standard & Poors
Credit rating BBB+
Outlook Stable
Dominion Bond Rating Service
Credit rating A
Outlook Stable
33

Quarter Ended June 30, 2007
$39.8 million Net income
(14.7% decrease from 2006)
$ 0.23 Net income per share
(14.8% decrease from 2006)
$ 0.150 Cash dividends per share
(1.7% increase over 2006)
1.08% Return on assets
10.52% Return on equity
19.30% Return on tangible equity
34

Year Ended December 31, 2006
$185.5 million Net income
(11.7% increase over 2005)
$ 1.06 Net income per share
(6.0% increase over 2005)
$ 0.581 Cash dividends per share
(7.6% increase over 2005)
1.30% Return on assets
12.84% Return on equity
23.87% Return on tangible equity
35

Greater Bay Bancorp *
International Bancshares Corporation
Old National Bancorp
South Financial Group, Inc.
Susquehanna Bancshares, Inc.
TCF Financial Corporation
Trustmark Corporation
UMB Financial Corporation
United Bankshares, Inc.
Valley National Bancorp
Whitney Holding Corporation
Wilmington Trust Corporation
*acquired
Peer Group
Associated Banc-Corp
BancorpSouth, Inc.
Bank of Hawaii Corporation
BOK Financial Corporation
Citizens Banking Corporation
City National Corporation
Colonial BancGroup, Inc.
Commerce Bancshares, Inc.
Cullen/Frost Bankers, Inc.
First Citizens BancShares, Inc.
First Midwest Bancorp, Inc.
First Republic Bank*
First Merit Corporation
36
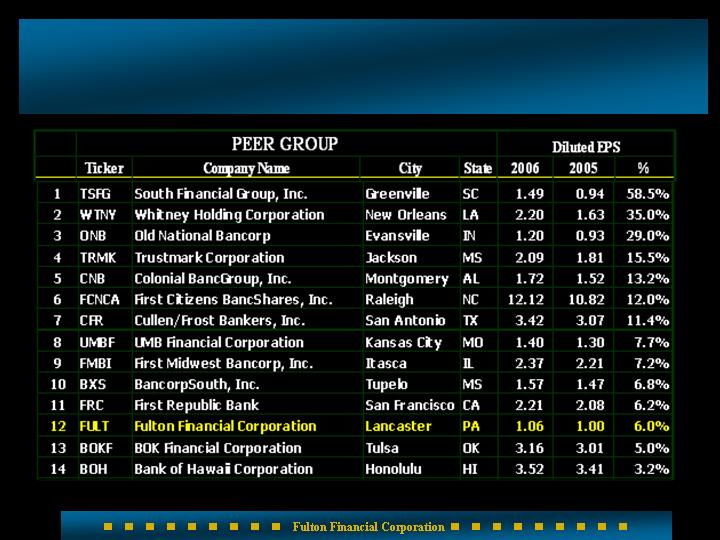
2006 EPS growth - Peer Group
37
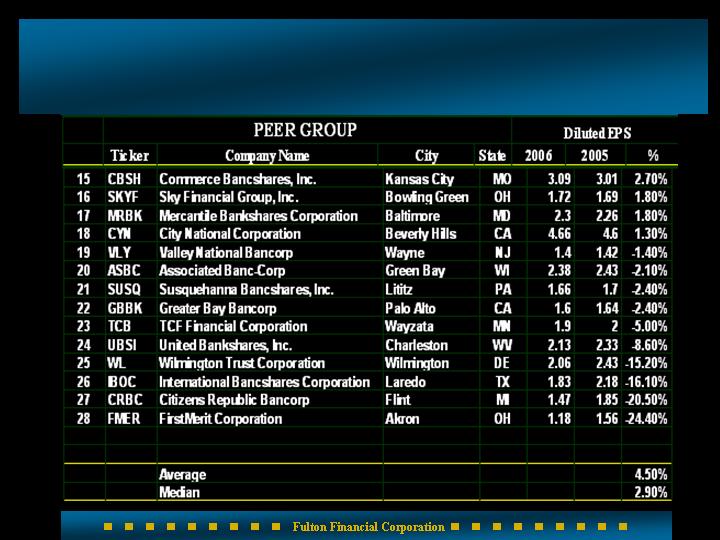
EPS Growth (continued)
38

Income Statement Summary
(6/30/07)
39
2007
2006
$
%
Net Interest Income
242,680
$
237,890
$
4,790
$
2%
Loan Loss Provision
(3,660)
(1,880)
(1,780)
95%
Other Income
73,660
68,540
5,120
7%
Securities Gains
2,410
4,070
(1,660)
-41%
Other Expenses
(199,010)
(178,800)
(20,210)
11%
Income Taxes
(35,110)
(39,240)
4,130
-11%
Net Income
80,970
$
90,580
$
(9,610)
$
-11%
Earnings Per Share
$0.46
$0.52
-$0.06
-12%
(dollars in thousands)

Income Statement Summary
(linked quarter)
40
2nd Qtr
1st Qtr
$
%
Net Interest Income
120,910
$
121,780
$
(870)
$
-1%
Loan Loss Provision
(2,700)
(960)
(1,740)
181%
Other Income
36,380
37,290
(910)
-2%
Securities Gains
630
1,780
(1,150)
-65%
Other Expenses
(98,110)
(100,910)
2,800
-3%
Income Taxes
(17,260)
(17,850)
590
-3%
Net Income
39,850
$
41,130
$
(1,280)
$
-3%
Earnings Per Share
$0.23
$0.24
-$0.01
-4%
(dollars in thousands)

Loan Growth
(6/30/07)
41
2007
2006
$
%
(dollars in millions)
Commercial
3,100
$
2,750
$
350
$
13%
Comm'l Mort
3,260
3,020
240
8%
Resid Mort/HE
2,140
2,020
120
6%
Construction
1,390
1,340
50
4%
Cons./Other
610
590
20
3%
Total Loans
10,500
$
9,720
$
780
8%

Average Loan Growth
Linked Quarter
42
2nd Q 07
1st Q 07
$
%
(dollars in millions)
Commercial
3,170
$
3,030
$
140
$
5%
Comm'l Mort
3,290
3,240
50
2%
Resid Mort/HE
2,150
2,140
10
0%
Construction
1,380
1,400
(20)
-1%
Cons./Other
590
600
(10)
-2%
Total Loans
10,580
$
10,410
$
170
2%
Net Interest Margin
(6/30/07)
43
Net Interest Margin Trend
44

Interest Rate Shocks
(6/30/07)
Rate Change NII Change (Annual) % Change
+300 bp + $ 11.5 million + 2.3%
+200 bp + $ 7.7 million + 1.6%
+100 bp + $ 3.9 million + .8%
- 100 bp - $ 5.4 million - 1.1%
- 200 bp - $ 13.1 million - 2.7%
- 300 bp - $ 22.3 million - 4.5%
6 month cumulative gap – 0.90
45

Investment Portfolio
(06/30/2007)
46
ENDING
MODIFIED
BALANCE
DURATION
CREDIT RATING
(000's)
Mortgage-backed securities
1,279.0
$
2.92
AAA
Municipal bonds
503.6
4.21
AAA
Collateralized mortgage obligations
467.0
3.05
AAA
U.S. Treasuries and agencies
282.1
2.23
AAA
Corporate & trust preferred securities
75.0
6.55
Various
Bank stocks
91.5
NA
Not rated
FHLB stock
92.1
NA
AAA
Other investments
21.5
NA
Unrealized gain - bank stock
(8.8)
Unrealized loss-bonds
(52.7)
Total Investments
2,750.4
$
3.22

Deposit Growth
(6/30/07)
47
2007
2006
$
%
(dollars in millions)
Nonint DDA
1,740
$
1,860
$
(120)
$
-6%
Int DDA
1,670
1,680
(10)
-1%
Savings/MMDA
2,300
2,360
(60)
-3%
CD's
4,490
3,990
500
13%
Cash Mgt
600
490
110
22%
Total Deposits
10,800
$
10,380
$
420
$
4%

Average Deposit Growth
Linked Quarter
48
2nd Q 07
1st Q 07
$
%
(dollars in millions)
Nonint DDA
1,760
$
1,720
$
40
$
2%
Int DDA
1,680
1,660
20
1%
Savings/MMDA
2,300
2,300
-
0%
CD's
4,530
4,460
70
2%
Cash Mgt
630
570
60
11%
Total Deposits
10,900
$
10,710
$
190
$
2%
Net Charge-Offs To Loans
(6/30/07)
49

Other Income
(6/30/07)
50
2007
2006
$
%
(dollars in thousands)
Invt Mgt & Trust
20,080
$
19,130
$
950
$
5%
Mort. Sales Gains
9,580
10,060
(480)
-5%
Overdraft & NSF Fees
9,980
9,790
190
2%
Service Charges
6,310
6,660
(350)
-5%
Cash Mgt Fees
5,560
4,870
690
14%
Success Card Fees
4,140
3,620
520
14%
Other
18,010
14,850
3,160
21%
Total
73,660
$
68,980
$
4,680
$
7%

Other Income Detail
Linked Quarter
51
2nd Q 07
1st Q 07
$
%
(dollars in thousands)
Invt Mgt & Trust
10,270
$
9,810
$
460
$
5%
Mort. Sales Gains
4,190
5,390
(1,200)
-22%
Overdraft & NSF Fees
5,210
4,770
440
9%
Service Charges
3,150
3,150
-
0%
Cash Mgt Fees
2,860
2,700
160
6%
Success Card Fees
2,220
1,920
300
16%
Other
8,480
9,540
(1,060)
-11%
Total
36,380
$
37,280
$
(900)
$
-2%
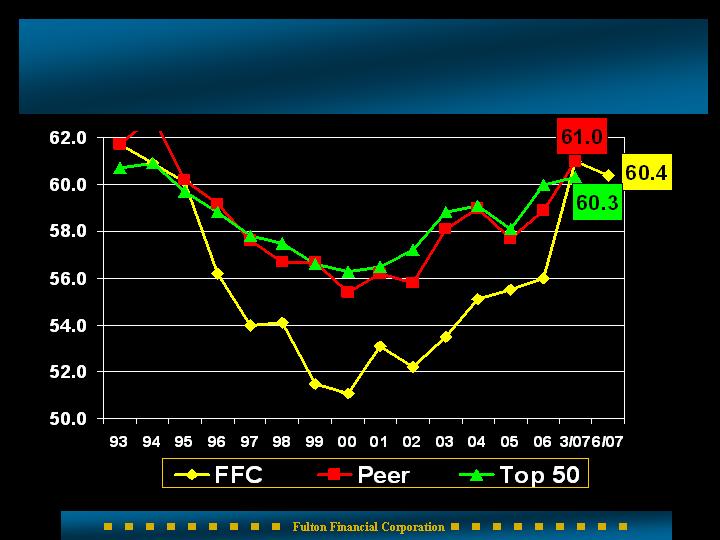
Efficiency Ratio
(6/30/07)
52

Other Expense
(6/30/07)
53
2007
2006
$
%
(dollars in thousands)
Salaries & Benefits
111,850
$
105,230
$
6,620
$
6%
Occupancy & Equip.
27,300
25,120
2,180
9%
DP/Software/Telecom
12,960
12,590
370
3%
Amortization
4,180
3,860
320
8%
Other Expenses
42,720
35,120
7,600
22%
Total
199,010
$
181,920
$
17,090
$
9%

Other Expense Detail
Linked Quarter
54
2nd Q 07
1st Q 07
$
%
(dollars in thousands)
Salaries & Benefits
55,550
$
56,290
$
(740)
$
-1%
Occupancy & Equip.
13,390
13,910
(520)
-4%
DP/Software/Telecom
6,630
6,320
310
5%
Amortization
2,200
1,980
220
11%
Other Expenses
20,340
22,400
(2,060)
-9%
Total
98,110
$
100,900
$
(2,790)
$
-3%

Positive Trends – Core Banking
Strong core deposit growth – DDA
Strong commercial loan growth and
pipeline
Loan yields improving
Improving normalized NIM
55

Fulton Financial Corporation
One Penn Square
Lancaster, PA 17602
www.fult.com
56