
Fulton Financial Corporation
Investor Presentation
November 2007 (Revised)
1

Forward-Looking Statement
The following presentation may contain forward-looking statements about
Fulton Financial Corporation’s growth and acquisition strategies, new
products and services, and future financial performance, including
earnings and dividends per share, return on average assets, return on
average equity, efficiency ratio and capital ratio. Forward-looking
statements are encouraged by the Private Securities Litigation Reform Act
of 1995.
Such forward-looking information is based upon certain underlying
assumptions, risks and uncertainties. Because of the possibility of
change in the underlying assumptions, actual results could differ
materially from these forward-looking statements. Risks and uncertainties
that may affect future results include: pricing pressures on loans and
deposits, actions of bank and non-bank competitors, changes in local and
national economic conditions, changes in regulatory requirements,
actions of the Federal Reserve Board, the Corporation’s success in merger
and acquisition integration, and customers’ acceptance of the
Corporation’s products and services.
2

Presentation Outline
Corporate Overview
Growth Initiatives
Challenges
Financial Performance
3

Fulton Financial Profile
Regional financial holding company
(formed in 1982)
11 community banks and 3 financial
services affiliates in 5 states
267 community banking offices
Asset size: $15.4 billion
Market capitalization: $2.1 billion
4

25 consecutive years of record earnings
34 consecutive years of dividend increases
9.8% compounded annual growth rate in
dividends per share
8.5% compounded annual growth rate in
earnings per share (last 5 years = 7.0%)
25 bank acquisitions
What have we accomplished?
5
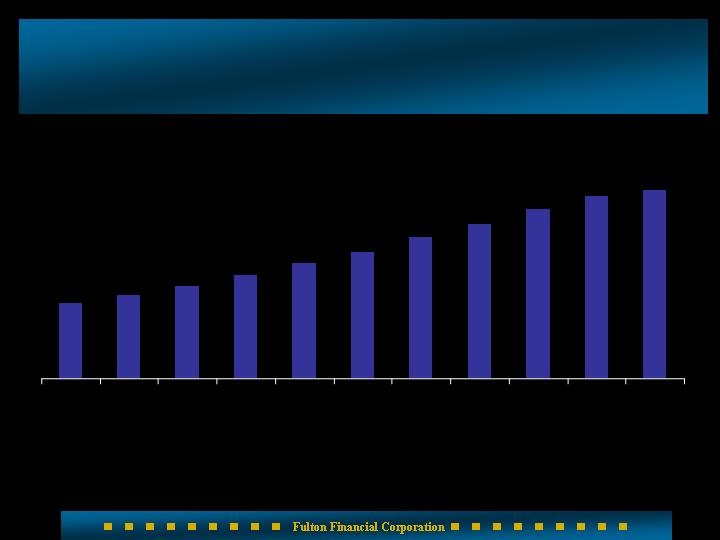
10-year Dividend History
0.2423
0.2672
0.3280
0.3662
0.4524
0.4932
0.5400
0.5810
0.2942
0.4050
0.5975
1997
1998
1999
2000
2001
2002
2003
2004
2005
2006
2007
6

Quarterly Cash Dividend
15 cents
Dividend yield:
approximately 4.7%
7

Capital (9/30/07)
$1.55 billion
$1.42 billion
12.30%
9.60%
7.60%
Total Capital (GAAP):
Total Regulatory Capital:
Ratios (estimated):
Total Risk-Based Capital
Tier 1 Risk-Based Capital
Leverage Capital
8

Stock Repurchase
April 2007: Announced 1 million
share buyback through 12/31/07.
Long history of repurchasing our
shares
9
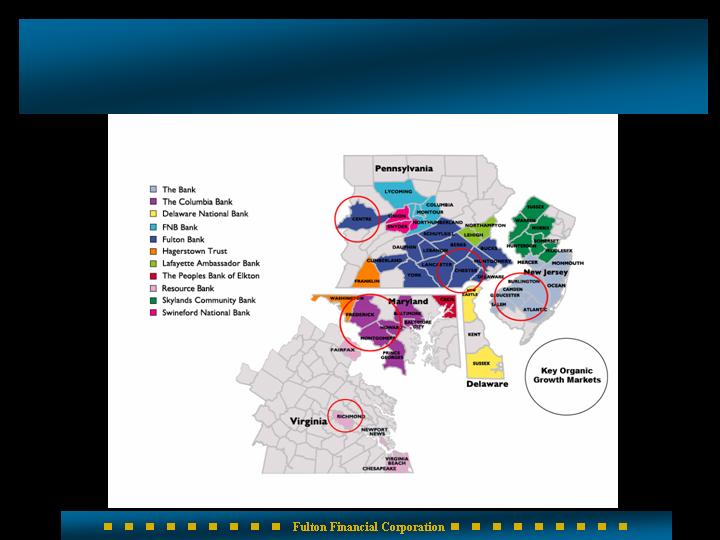
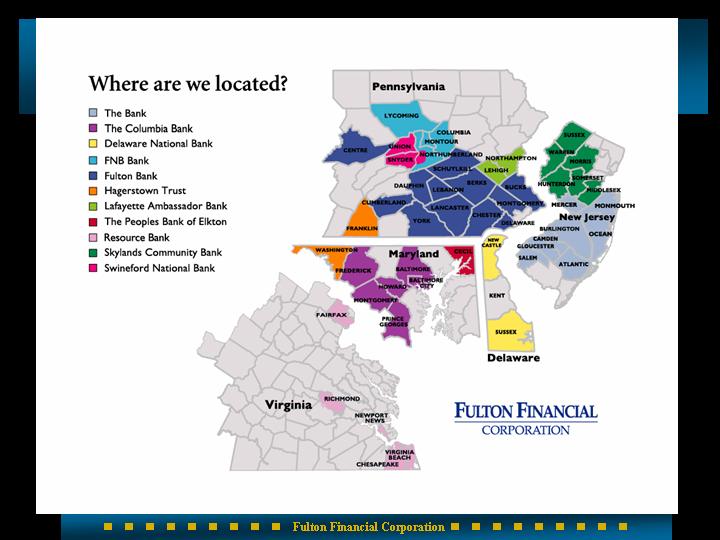
Key Organic Growth Markets
10

Virginia Organic Growth Initiatives
Resource Bank to become division of
Fulton Bank
Transition from a nationwide
mortgage lender into a strong
community bank
Core funding and lending activities
Open new branches in strongest
eastern Virginia markets
Utilize Fulton critical mass
11

FFC Affiliates in Affluent Markets*
*Source: Bancology Vol. 24, September 2007
County
National
Ranking
Ranking in
State
Median HH
Ranking
FFC Affiliate
Hunterdon, NJ
#2
#1
$95,981
Skylands Bank
Loudoun, VA
#3
#1
$93,034
Resource Bank
Fairfax, VA
#4
#2
$91,851
Resource Bank
Morris, NJ
#6
#2
$90,417
Skylands Bank
Somerset, NJ
#7
#3
$90,411
Skylands Bank
Howard, MD
#9
#1
$86,370
Columbia Bank
12

Serving PA’s Strongest Markets*
*Source: SNL, Median HH Income, 2006 data
County
Rank
Projected
Change
2006 - 2011
Median
HH Income
2006
Projected HH
Income Change
2006 - 2011
Chester, PA
1
9.63%
$83,001
25.46%
Montgomery, PA
2
3.05
77,383
23.86
Bucks, PA
3
4.06
76,234
23.89
Delaware, PA
4
0.17
63,220
20.68
Cumberland, PA
5
4.37
58,384
18.62
Northampton, PA
6
8.45
56,249
18.97
Lancaster, PA
8
4.62
55,546
17.63
York, PA
9
6.18
55,118
17.39
Lehigh, PA
10
5.46
55,107
19.86
Berks, PA
11
5.62
55,089
17.50
Average
4.66
61,370
19.82
Average of all other (57)
1.20
42,366
16.64
13

Q3/07
Tough quarter - $16.0 million charge
related to Resource Mortgage
Reported EPS of .19 cents
Good commercial loan growth: 12%
annualized
Asset quality good
Cash Management fees strong
Reviewing Resource Mortgage records
Higher funding costs due to CD growth
Loan loss provision increased
14

Components of $16 Million Charge
9.9 million – potential borrower
misrepresentation
3.6 million – added to existing
reserves
(valuations)
2.2 million – new and existing
outstanding
repurchase requests
15

Resource Mortgage Review
The law firm of Wachtell, Lipton, Rosen & Katz was
hired to review loans originated by Resource
Mortgage
Wachtell hired Promontory Financial Group LLC to
assist in the review
Their review has been completed
Review focused on loans originated from January 1,
2005 through October 2007
Goal was to determine if there were additional
potentially material occurrences of misrepresentation
of borrower information
16

Resource Mortgage Review (Continued)
Review involved sampling and analyzing loan data,
document examination, and interviews
Sampling criteria: identifying loans with high loan to
value ratios, borrowers with low credit scores,
limited documentation, other “high-risk” criteria, and
certain previously identified loans
KPMG reviewed work-papers and sampling
methodology
Based on the results of the review, no changes were
required in the corporation’s consolidated financial
statements for the 3rd quarter
17

Continued Challenges
Loan loss provision returning to
more normal levels
Sluggish consumer sector
Resource Mortgage issues
Greater reliance on wholesale
funding / margin pressure
18

Consolidation, Standardization
and Centralization
19

Benefits of Consolidation
15 banking affiliates reduced to 11 in
seven months
Marketing and branding efficiencies
Leverage brand over wider market
Larger affiliate provides strong
leadership and management expertise
Business model intact
Fewer affiliates, faster standardization
20

Expense Reduction
Product standardization that
simplifies customer choices
Departmental centralization
Workforce management savings
Employee benefit plan consistency
Ongoing review of expenses
21

Customer Satisfaction
*Retail:
90% extremely/very satisfied
Commercial:
90% extremely/very satisfied
Fulton Financial Advisors:
80+% very satisfied/satisfied
Fulton Mortgage Company:
99% of expectations met/exceeded
98% would recommend FMC to others
*Compared to national average of 62%
Source: American Banker/Gallup Consumer Survey
22

Market Opportunities
In market M&A = opportunity to grow
households faster
Leverage our high customer
satisfaction
Increased targeted advertising and
promotion
“Local” = perceived value
Customer retention is a key strength
23

41 relationships with commitments to lend
of $20 million or more
Maximum individual commitment of
$33 million
Average commercial lending relationship size is
$401,728
Loans and corresponding relationships are within
Fulton’s geographic market area
Summary of Larger Loans
24

Loan Diversification (9/30/07)
21%
13%
5%
31%
30%
Commercial
Commercial
Mortgage
Res Mtg and
Home Equity
Construction
Consumer and
other
25

Commercial Loan Concentration
By Industry (as of 9/30/07)
Industry
%
Construction
27.4
RE - Investor - Owned
22.2
Services
13.9
Manufacturing
7.3
Retail
6.1
Health Care
5.7
Agriculture
4.9
Wholesale
4.2
Other
3.1
Financial Services
2.1
Arts and Entertainment
1.9
Transportation
1.2
100.0
26

Credit Ratings
Moody’s Investor Services
Short-term rating P-1
Long-term rating
Issuer A-2
Lead Bank Deposits A-1
Outlook Stable
Fitch Ratings
Short-term rating F-1
Long-term rating A-
Outlook Stable
Standard & Poors
Credit Rating BBB+
Outlook Stable
Dominion Bond Rating Service
Credit rating A
Outlook Stable
27

Financial Performance
28

Quarter Ended September 30, 2007
$33.6 million
$0.19
$0.150
0.88%
8.67%
15.76%
Net income
(30.6% decrease from 2006)
Net income per share
(32.1% decrease from 2006)
Cash dividends per share
Return on assets
Return on equity
Return on tangible equity
29

International Bancshares Corporation
Old National Bancorp
South Financial Group, Inc.
Susquehanna Bancshares, Inc.
TCF Financial Corporation
Trustmark Corporation
UMB Financial Corporation
United Bankshares, Inc.
Valley National Bancorp
Whitney Holding Corporation
Wilmington Trust Corporation
Peer Group
Associated Banc-Corp
BancorpSouth, Inc.
Bank of Hawaii Corporation
BOK Financial Corporation
Citizens Banking Corporation
City National Corporation
Colonial BancGroup, Inc.
Commerce Bancshares, Inc.
Cullen/Frost Bankers, Inc.
First Citizens BancShares, Inc.
First Midwest Bancorp, Inc.
First Merit Corporation
30

Income Statement Summary
(September Year to Date)
2007
2006
$
%
Net Interest Income
365,090
$
363,820
$
1,270
$
0%
Loan Loss Provision
(8,260)
(2,430)
(5,830)
240%
Other Income
110,530
104,000
6,530
6%
Securities Gains
2,280
5,520
(3,240)
-59%
Other Expenses
(307,010)
(271,240)
(35,770)
13%
Income Taxes
(48,090)
(60,750)
12,660
-21%
Net Income
114,540
$
138,920
$
(24,380)
$
-18%
Earnings Per Share
$0.66
$0.80
-$0.14
-18%
(dollars in thousands)
31

Income Statement Summary
(linked quarter)
3rd Qtr
2nd Qtr
$
%
Net Interest Income
122,410
$
120,910
$
1,500
$
1%
Loan Loss Provision
(4,610)
(2,700)
(1,910)
71%
Other Income
36,870
36,380
490
1%
Securities Gains
(130)
630
(760)
N/M
Other Expenses
(107,990)
(98,110)
(9,880)
10%
Income Taxes
(12,980)
(17,260)
4,280
-25%
Net Income
33,570
$
39,850
$
(6,280)
$
-16%
Earnings Per Share
$0.19
$0.23
-$0.04
-17%
(dollars in thousands)
32

Average Loans
(September Year to Date)
2007
2006
$
%
(dollars in millions)
Commercial
3,160
$
2,780
$
380
$
14%
Comm'l Mort
3,310
3,030
280
9%
Resid Mort
730
620
110
18%
Home Equity
1,440
1,400
40
3%
Construction
1,390
1,320
70
5%
Cons./Other
590
600
(10)
-2%
Total Loans
10,620
$
9,750
$
870
9%
33

Average Loans
Linked Quarter
3rd Q 07
2nd Q 07
$
%
(dollars in millions)
Commercial
3,280
$
3,170
$
110
$
3%
Comm'l Mort
3,380
3,290
90
3%
Resid Mort
770
720
50
7%
Home Equity
1,450
1,430
20
1%
Construction
1,380
1,380
-
0%
Cons./Other
600
590
10
2%
Total Loans
10,860
$
10,580
$
280
3%
34

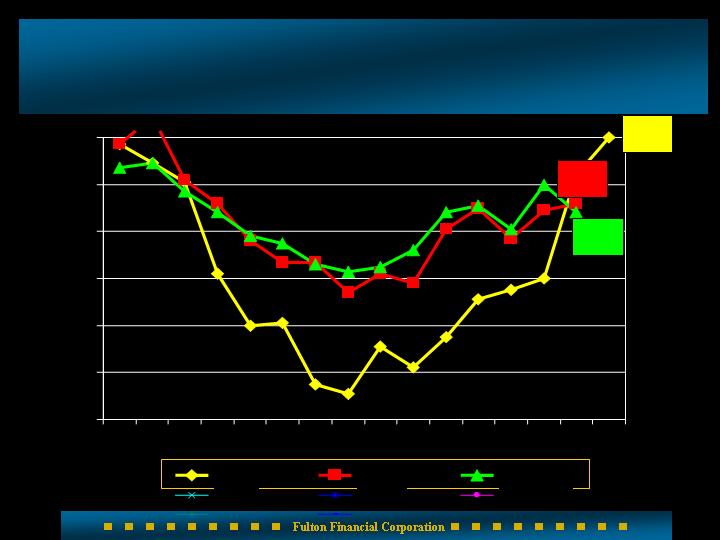
Net Interest Margin
(9/30/07)
3.69
3.61
3.47
3.25
3.50
3.75
4.00
4.25
4.50
4.75
FFC
Peer
Top 50
35
Net Interest Margin Trend
3.50
3.60
3.70
3.80
3.90
4.00
Q1 06
Q2 06
Q3 06
Q4 06
Q1 07
Q2 07
Q3 07
Reported
Core
36

Interest Rate Shocks
(9/30/07)
Rate Change NII Change (Annual) % Change
+300 bp + $ 6.0 million + 1.2%
+200 bp + $ 4.7 million + .9%
+100 bp + $ 2.9 million + .6%
- 100 bp - $ 4.3 million - .8%
- 200 bp - $ 12.6 million - 2.4%
- 300 bp - $ 22.6 million - 4.4%
6 month cumulative gap – 0.90
37

Investment Portfolio
(9/30/2007)
ENDING
MODIFIED
BALANCE
DURATION
CREDIT RATING
(000's)
Mortgage-backed securities
1,334.6
$
3.03
AAA
Municipal bonds
496.0
4.04
AAA
Collateralized mortgage obligations
543.6
3.57
AAA
U.S. Treasuries and agencies
261.7
2.01
AAA
Corporate & trust preferred securities
135.9
8.64
Various
Bank stocks
92.3
NA
Not rated
FHLB stock
102.4
NA
AAA
Other investments
21.5
NA
Unrealized gain - bank stock
(12.9)
Unrealized loss-bonds
(26.8)
Total Investments
2,948.3
$
3.47
38

Average Deposits
(Year to Date September)
2007
2006
$
%
(dollars in millions)
Nonint DDA
1,730
$
1,820
$
(90)
$
-5%
Int DDA
1,690
1,680
10
1%
Savings/MMDA
2,280
2,340
(60)
-3%
CD's
4,540
4,040
500
12%
Cash Mgt
630
490
140
29%
Total Deposits
10,870
$
10,370
$
500
$
5%
39

Average Deposits
Linked Quarter
3rd Q 07
2nd Q 07
$
%
(dollars in millions)
Nonint DDA
1,700
$
1,760
$
(60)
$
-3%
Int DDA
1,730
1,680
50
3%
Savings/MMDA
2,260
2,300
(40)
-2%
CD's
4,630
4,530
100
2%
Cash Mgt
690
630
60
10%
Total Deposits
11,010
$
10,900
$
110
$
1%
40
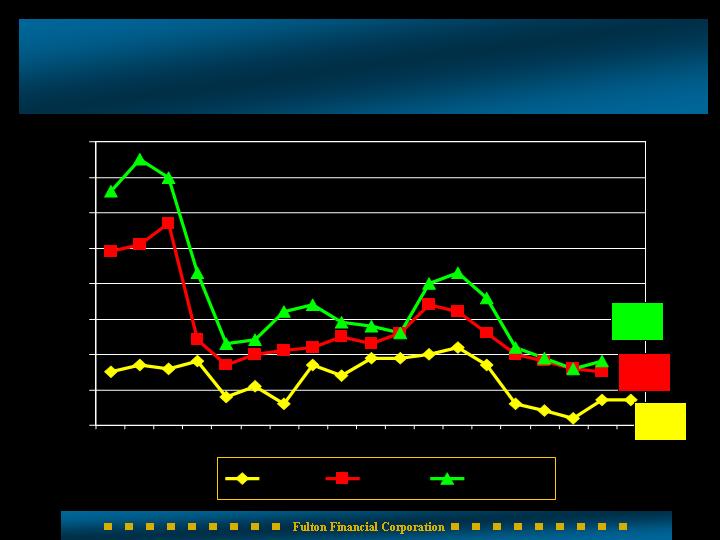
Net Charge-Offs To Loans
(9/30/07)
0.07
0.15
0.18
0.00
0.10
0.20
0.30
0.40
0.50
0.60
0.70
0.80
90
91
92
93
94
95
96
97
98
99
00
01
02
03
04
05
06
6/07
9/07
FFC
Peer
Top 50
41

Other Income
(Year to Date September)
2007
2006
$
%
(dollars in thousands)
Invt Mgt & Trust
29,370
$
27,980
$
1,390
$
5%
Overdraft & NSF Fees
15,260
15,120
140
1%
Mort. Sales Gains
12,110
15,440
(3,330)
-22%
Service Charges
9,450
9,970
(520)
-5%
Cash Mgt Fees
8,430
7,390
1,040
14%
Success Card Fees
6,320
5,490
830
15%
Other
29,590
22,610
6,980
31%
Total
110,530
$
104,000
$
6,530
$
6%
42

Other Income
Linked Quarter
3rd Q 07
2nd Q 07
$
%
(dollars in thousands)
Invt Mgt & Trust
9,290
$
10,270
$
(980)
$
-10%
Overdraft & NSF Fees
5,280
5,210
70
1%
Service Charges
3,150
3,150
-
0%
Cash Mgt Fees
2,870
2,860
10
0%
Mort. Sales Gains
2,530
4,190
(1,660)
-40%
Success Card Fees
2,180
2,220
(40)
-2%
Other
11,570
8,480
3,090
36%
Total
36,870
$
36,380
$
490
$
1%
43
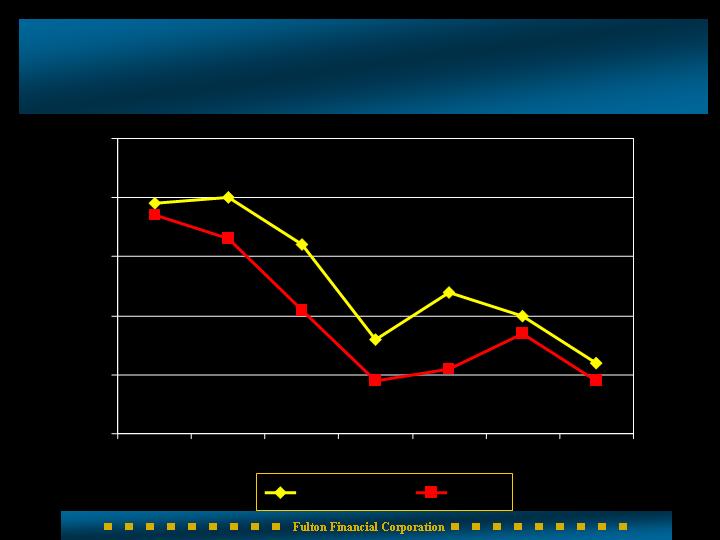
Efficiency Ratio
(9/30/07)
62.0
59.2
58.8
50.0
52.0
54.0
56.0
58.0
60.0
62.0
93
94
95
96
97
98
99
00
01
02
03
04
05
06
6/07
9/07
FFC
Peer
Top 50
44

Other Expense
(Year to Date September)
2007
2006
$
%
(dollars in thousands)
Salaries & Benefits
164,350
$
158,370
$
5,980
$
4%
Occupancy & Equip.
40,550
37,650
2,900
8%
Operating Risk Loss
26,460
3,480
22,980
660%
DP/Software/Telecom
19,420
18,570
850
5%
Amortization
6,180
5,880
300
5%
Other Expenses
50,050
47,290
2,760
6%
Total
307,010
$
271,240
$
35,770
$
13%
45

Other Expense
Linked Quarter
3rd Q 07
2nd Q 07
$
%
(dollars in thousands)
Salaries & Benefits
52,510
$
55,550
$
(3,040)
$
-5%
Occupancy & Equip.
13,250
13,390
(140)
-1%
Operating Risk Loss
16,340
4,200
12,140
289%
DP/Software/Telecom
6,470
6,630
(160)
-2%
Amortization
2,000
2,200
(200)
-9%
Other Expenses
17,420
16,140
1,280
8%
Total
107,990
$
98,110
$
9,880
$
10%
46

Fulton Financial Corporation
One Penn Square
Lancaster, PA 17602
www.fult.com
47
48