
Fulton Financial Corporation
Investor Presentation
September 16, 2008

The following presentation may contain forward-looking statements about
Fulton Financial Corporation’s growth and acquisition strategies, new
products and services, and future financial performance, including earnings
and dividends per share, return on average assets, return on average
equity, efficiency ratio and capital ratio. Forward-looking statements are
encouraged by the Private Securities Litigation Reform Act of 1995.
Such forward-looking information is based upon certain underlying
assumptions, risks and uncertainties. Because of the possibility of change
in the underlying assumptions, actual results could differ materially from
these forward-looking statements. Risks and uncertainties that may affect
future results include: pricing pressures on loans and deposits, actions of
bank and non-bank competitors, changes in local and national economic
conditions, changes in regulatory requirements, actions of the Federal
Reserve Board, the Corporation’s success in merger and acquisition
integration, and customers’ acceptance of the Corporation’s products and
services.
Forward-Looking Statement

Presentation Outline
Corporate Overview
Growth Initiatives
Quarterly Comments
Challenges / Responses
Loan Summary
Financial Performance

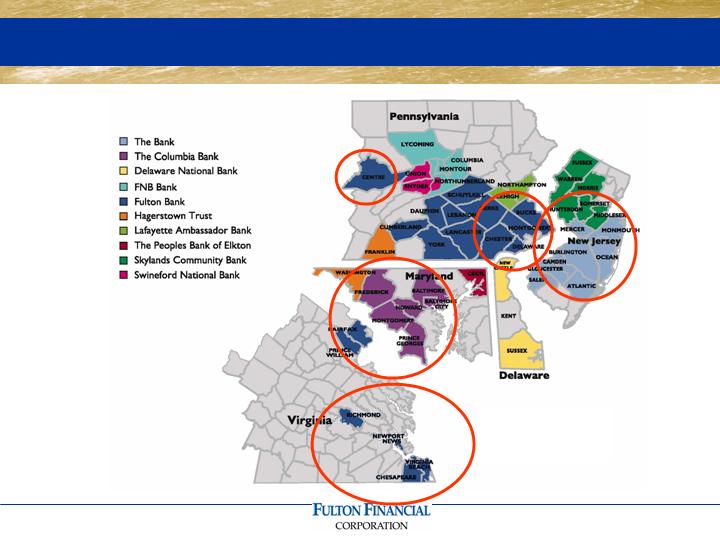
Fulton Financial Profile
Mid-Atlantic regional financial holding company
A family of 10 community banks
Fulton Financial Advisors
Fulton Mortgage Company
Serving strong /stable markets in 5 states
267 community banking offices
Asset size: $16 billion
Market capitalization: $ 2 billion
Book value (6/30/08) : $9.15
Tangible book value (6/30/08): $5.41

34 consecutive years of dividend increases
(1973-2007)
9.8% compounded annual growth rate in
dividends per share (1982 – 2007)
7.3% compounded annual growth rate in
earnings per share (1982 – 2007)
25 bank acquisitions since 1982
Created a valuable geographic franchise
Accomplishments
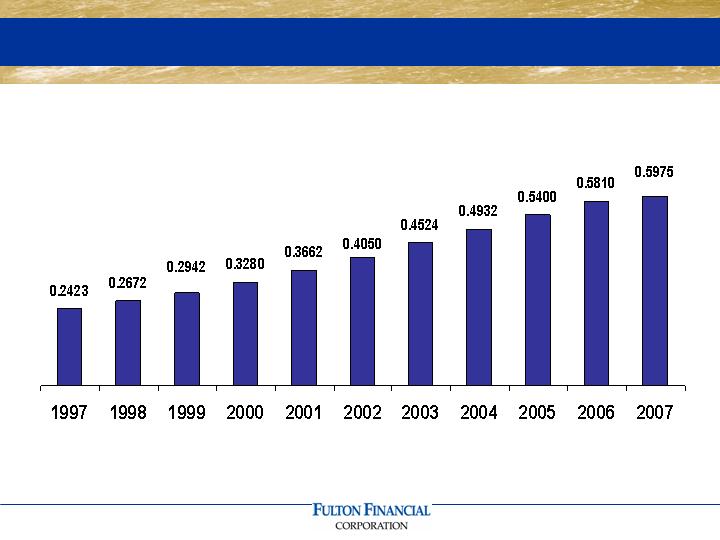
10-year Dividend History

Quarterly Cash Dividend
15 cents
Dividend yield:
approximately 5%

Capital (as of 06/30/08)
Total Capital (GAAP): $1.59 billion
Total Regulatory Capital: $1.46 billion
Regulatory Capital Ratios:
Total Risk-Based Capital 11.70%
Tier 1 Risk-Based Capital 9.10%
Leverage Capital 7.40%
Strategic Plan
Superior
Employee Satisfaction
Superior
Customer Experience
Superior
Operating Efficiency
Superior
Financial Results
Key organic growth markets

Q2/08 Quarterly Comments
Reported EPS of $0.15
Impact of three significant events:
- Sale of credit card portfolio
- Bank stock portfolio write-down
- Auction rate certificates
Excluding above events: EPS of $0.24
Strong capital position
Q3/08 cash dividend declared at current
level

Q2/08 Quarterly Comments
Solid results from core banking operations
Net interest income growth
Expansion of net interest margin
Good loan growth
New loan pipeline stable
Strong growth in select non-interest
income categories
Revenue generation and cost-cutting
initiatives producing meaningful results

Q2/08 Quarterly Comments
Asset quality deterioration
Housing-related businesses continue
to struggle
Little evidence that economic
conditions are improving
Sluggish deposit growth
Bank stock write-down

Two Greatest Challenges
Retail Funding
Credit Quality

Retail Funding - Action Steps
Continued denovo expansion in existing
and new markets
DDA Switch Kit w/cash or gift incentives
Targeted direct mail
Superior customer experience
Relationship banking incentives
Team Advantage Banking (small business)
Appointed Chief Deposit Officer

Credit Quality – Action Steps
Internal emphasis on loan review /
workout
Watching all loan portfolios very
carefully, real estate in particular
Early customer intervention /
remediation as problems arise
New loans underwritten to traditional
conservative standards

Superior Customer Satisfaction
*Retail:
90% extremely/very satisfied
Commercial:
90% extremely/very satisfied
*Compared to national average of 63%
Source: American Banker/Gallup Consumer Survey

46 relationships with commitments to lend
of $20 million or more
Maximum individual commitment of
$33 million
Average commercial lending relationship size is
$417,538
Loans and corresponding relationships are within
Fulton’s geographic market area
Summary of Larger Loans
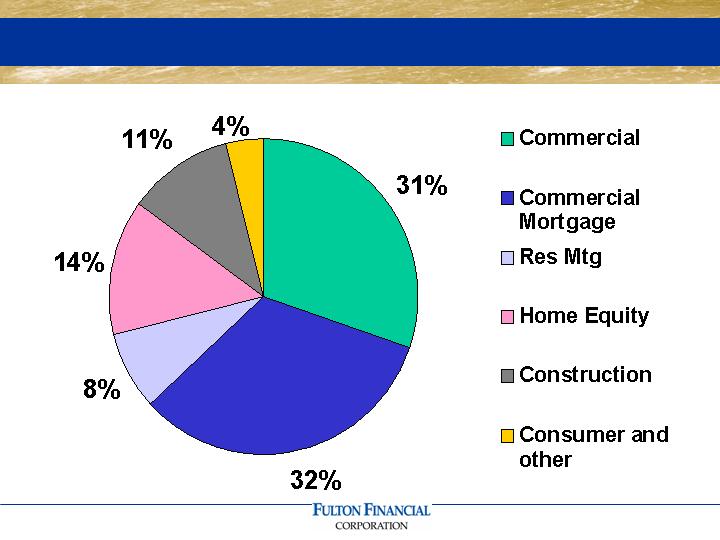
Loan Diversification (as of 06/30/08)

Commercial Loan Concentration By Industry (as of
06/30/08)
Industry
%
Construction
25.9
RE - Investor - Owned
23.6
Services
14.2
Manufacturing
7.0
Retail
6.1
Health Care
5.4
Agriculture
5.0
Wholesale
4.5
Other
3.1
Financial Services
2.0
Arts and Entertainment
2.0
Transportation
1.2
100.0

Long-term rating
Issuer A-2
Lead Bank Deposits A-1
Outlook Negative
Moody’s Investor Services
Short-term rating F-1
Long-term rating A-
Outlook Stable
Fitch Ratings
Dominion Bond Rating Service
Credit rating A
Outlook Negative
Credit Ratings

Financial Performance

Quarter Ended June 30, 2008
$25.7 million Net income
$ 0.15 Net income per share
$ 0.15 Cash dividends per share
0.85% Return on assets
8.40% Return on equity
14.65% Return on tangible equity

International Bancshares Corporation
Old National Bancorp
South Financial Group, Inc.
Susquehanna Bancshares, Inc.
TCF Financial Corporation
Trustmark Corporation
UMB Financial Corporation
United Bankshares, Inc.
Valley National Bancorp
Whitney Holding Corporation
Wilmington Trust Corporation
Associated Banc-Corp
BancorpSouth, Inc.
Bank of Hawaii Corporation
BOK Financial Corporation
Citizens Republic Bancorp
City National Corporation
Colonial BancGroup, Inc.
Commerce Bancshares, Inc.
Cullen/Frost Bankers, Inc.
First Citizens BancShares, Inc.
First Midwest Bancorp, Inc.
First Merit Corporation
Peer Group

Income Statement Summary
(Six Months Ended June 30 th)
2008
2007
$
%
(dollars in thousands)
Net Interest Income
257,790
$
242,680
$
15,110
$
6%
Loan Loss Provision
(27,930)
(3,660)
(24,270)
n/m
Other Income
76,320
73,660
2,660
4%
Credit Card Sale Gain
13,910
-
13,910
n/m
Securities Gains
(20,400)
2,410
(22,810)
n/m
Other Expenses
(206,390)
(199,010)
(7,380)
4%
Income Taxes
(26,130)
(35,110)
8,980
-26%
Net Income
67,170
$
80,970
$
(13,800)
$
-17%

Income Statement Summary
(Linked Quarter)
2nd Q 08
1st Q 08
$
%
(dollars in thousands)
Net Interest Income
131,890
$
125,900
$
5,990
$
5%
Loan Loss Provision
(16,710)
(11,220)
(5,490)
n/m
Other Income
39,890
36,430
3,460
9%
Credit Card Sale Gain
13,910
-
13,910
n/m
Securities Gains
(21,650)
1,250
(22,900)
n/m
Other Expenses
(109,740)
(96,660)
(13,080)
14%
Income Taxes
(11,910)
(14,200)
2,290
-16%
Net Income
25,680
$
41,500
$
(15,820)
$
-38%

Average Loans
(Six Months Ended June 30th)
2008
2007
$
%
(dollars in millions)
Commercial
3,490
$
3,100
$
390
$
13%
Comm'l Mort
3,620
3,260
360
11%
Resid Mort
880
710
170
24%
Home Equity
1,550
1,440
110
8%
Construction
1,310
1,390
(80)
-6%
Cons./Other
510
600
(90)
-15%
Total Loans
11,360
$
10,500
$
860
8%

Average Loans
(Linked Quarter)
2nd Q 08
1st Q 08
$
%
(dollars in millions)
Commercial
3,510
$
3,470
$
40
$
1%
Comm'l Mort
3,700
3,550
150
4%
Resid Mort
890
860
30
3%
Home Equity
1,570
1,530
40
3%
Construction
1,290
1,330
(40)
-3%
Cons./Other
460
560
(100)
-18%
Total Loans
11,420
$
11,300
$
120
1%
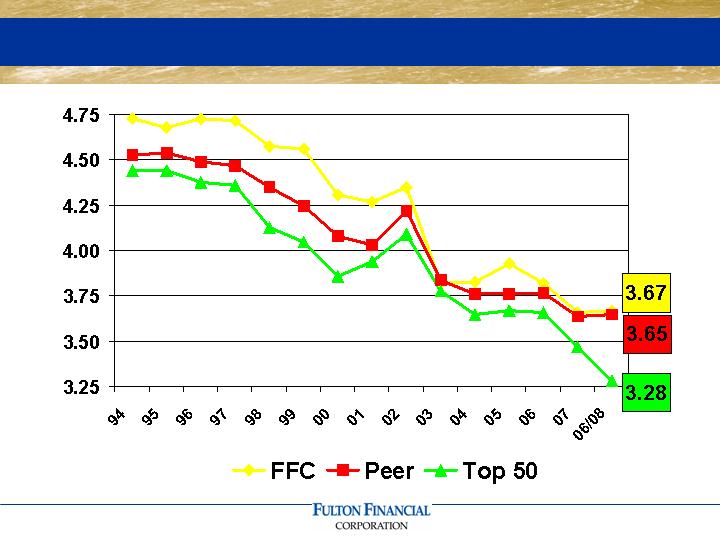
Net Interest Margin
(as of 06/30/08)
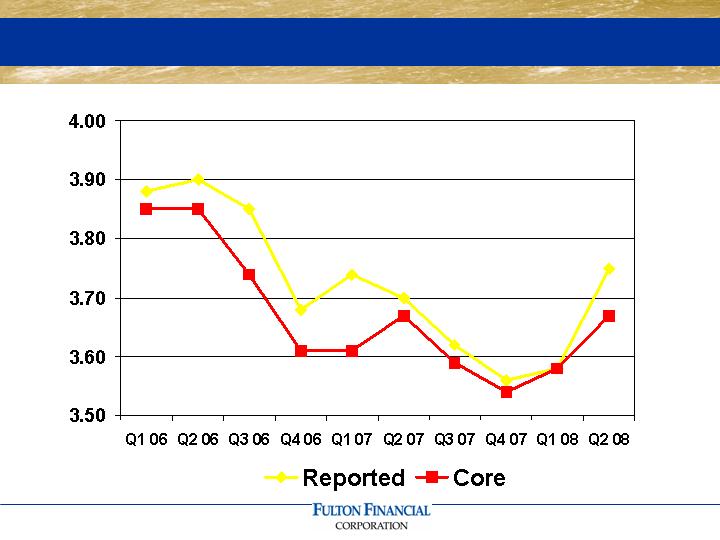
Net Interest Margin Trend

6 month cumulative gap – 0.97
Interest Rate Shocks
(as of 06/30/08)
Rate Change NII Change (Annual) % Change
+300 bp + $ 12.1 million + 2.3%
+200 bp + $ 9.4 million + 1.8%
+100 bp + $ 5.4 million + 1.0%
- 100 bp - $ 6.0 million - 1.1%
- 200 bp - $ 14.3 million - 2.7%

Investment Portfolio
(as of 06/30/08)
ENDING
MODIFIED
BALANCE
DURATION
CREDIT RATING
(in millions)
Mortgage-backed securities
1,238.4
$
3.16
AAA
Municipal bonds
511.3
4.28
AAA
Collateralized mortgage obligations
402.1
3.73
AAA
U.S. Treasuries and agencies
98.0
2.34
AAA
Corporate & trust preferred securities
177.9
9.30
Various
Auction rate securities
125.1
5.71
AA- AAA
Bank stocks
62.3
NA
Not rated
FHLB stock
104.8
NA
AAA
Other investments*
21.1
NA
Unrealized gain - bank stock
(9.0)
Unrealized loss-bonds
(24.9)
Total Investments
2,706.9
$
3.98
*Includes $324,900 in Freddie Mac preferred securities. The Corporation holds no other common or preferred
equity shares in Fannie Mae or Freddie Mac.

Average Deposits
(Six Months Ended June 30th)
2008
2007
$
%
(dollars in millions)
Nonint DDA
1,640
$
1,740
$
(100)
$
-6%
Int DDA
1,700
1,670
30
2%
Savings/MMDA
2,170
2,300
(130)
-6%
CD's
4,430
4,490
(60)
-1%
Cash Mgt
700
600
100
17%
Total Deposits
10,640
$
10,800
$
(160)
$
-1%

Average Deposits
Linked Quarter
2nd Q 08
1st Q 08
$
%
(dollars in millions)
Nonint DDA
1,660
$
1,620
$
40
$
2%
Int DDA
1,710
1,690
20
1%
Savings/MMDA
2,210
2,140
70
3%
CD's
4,360
4,510
(150)
-3%
Cash Mgt
690
700
(10)
-1%
Total Deposits
10,630
$
10,660
$
(30)
$
0%
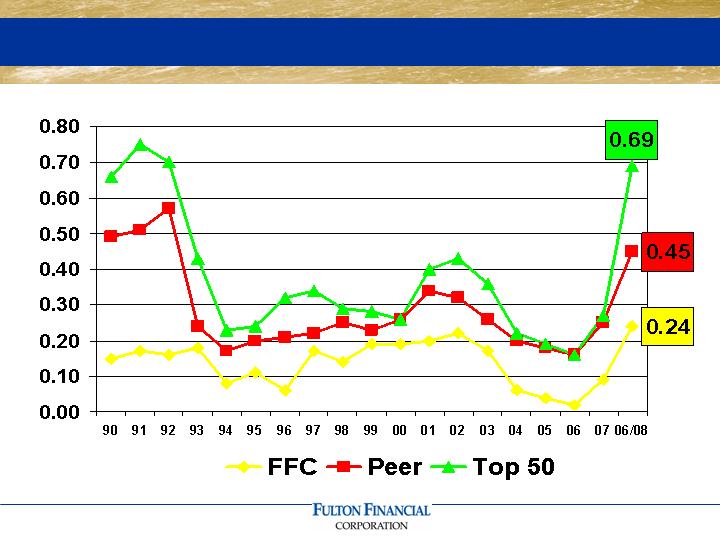
Net Charge-Offs To Loans
(as of 06/30/08)

Other Income
(Six Months Ended June 30th)
2008
2007
$
%
(dollars in thousands)
Invt Mgt & Trust
17,150
$
20,080
$
(2,930)
$
-15%
Overdraft & NSF Fees
16,330
9,980
6,350
64%
Cash Mgt Fees
6,560
5,560
1,000
18%
Service Charges
6,390
6,310
80
1%
Mort. Sales Gains
4,980
9,580
(4,600)
-48%
Success Card Fees
4,820
4,140
680
16%
Merchant Fees
3,850
3,440
410
12%
Foreign Currency
3,320
1,840
1,480
80%
Letters of Credit
2,710
2,640
70
3%
Life Insurance (COLI)
1,760
1,960
(200)
-10%
ATM fees
1,410
1,480
(70)
-5%
Other Income
7,040
6,650
390
6%
Total
76,320
$
73,660
$
2,660
$
4%

Other Income
Linked Quarter
2nd Q 08
1st Q 08
$
%
(dollars in thousands)
Overdraft & NSF Fees
8,640
$
7,690
$
950
$
12%
Invt Mgt & Trust
8,390
8,760
(370)
-4%
Service Charges
3,350
3,040
310
10%
Cash Mgt Fees
3,330
3,230
100
3%
Mort. Sales Gains
2,670
2,310
360
16%
Success Card Fees
2,550
2,260
290
13%
Merchant Fees
1,900
1,950
(50)
-3%
Foreign Currency
1,750
1,570
180
11%
Letters of Credit
1,450
1,260
190
15%
Life Insurance (COLI)
980
780
200
26%
ATM fees
730
680
50
7%
Other Income
4,150
2,900
1,250
43%
Total
39,890
$
36,430
$
3,460
$
9%
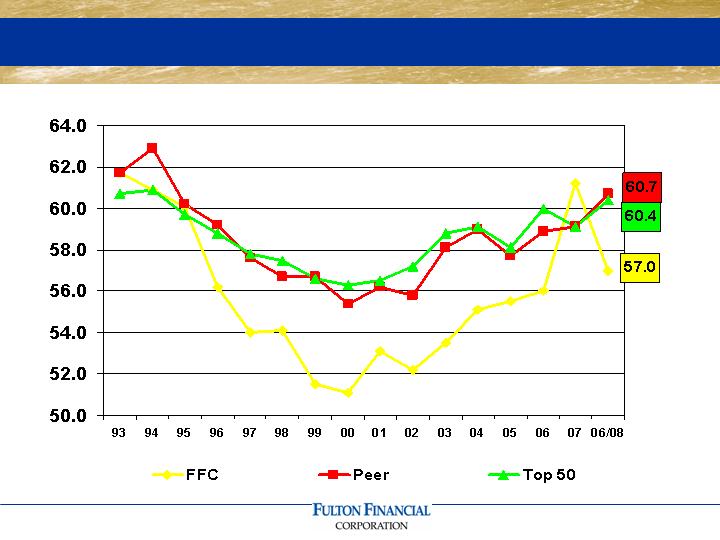
Efficiency Ratio
(as of 06/30/08)

Other Expense
(Six Months Ended June 30st)
2008
2007
$
%
(dollars in thousands)
Salaries & Benefits
109,480
$
111,850
$
(2,370)
$
-2%
Occupancy & Equip.
27,610
27,300
310
1%
Operating Risk Loss
15,630
10,120
5,510
54%
Data Proc. & Software
9,140
8,790
350
4%
Advertising
6,420
5,400
1,020
19%
Supplies & Postage
5,800
5,670
130
2%
Legal & Audit
4,140
2,580
1,560
60%
Telecommunications
3,960
4,170
(210)
-5%
Outside Services
3,960
3,010
950
32%
Amortization
3,660
4,180
(520)
-12%
Travel & Entertain.
2,990
3,120
(130)
-4%
State Tax
1,620
2,960
(1,340)
-45%
Other Expenses
11,980
9,860
2,120
22%
Total
206,390
$
199,010
$
7,380
$
4%

Other Expense
Linked Quarter
2nd Q 08
1st Q 08
$
%
(dollars in thousands)
Salaries & Benefits
54,280
$
55,200
$
(920)
$
-2%
Operating Risk Loss
14,390
1,240
13,150
n/m
Occupancy & Equip.
13,640
13,970
(330)
-2%
Data Proc. & Software
4,480
4,660
(180)
-4%
Advertising
3,520
2,910
610
21%
Supplies & Postage
2,980
2,810
170
6%
Outside Services
2,150
1,810
340
19%
Telecommunications
1,990
1,970
20
1%
Amortization
1,800
1,860
(60)
-3%
Legal & Audit
1,790
2,350
(560)
-24%
Travel & Entertain.
1,560
1,430
130
9%
State Tax
480
1,140
(660)
-58%
Other Expenses
6,680
5,310
1,370
26%
Total
109,740
$
96,660
$
13,080
$
14%

Fulton Financial Corporation
One Penn Square
Lancaster, PA 17602
www.fult.com