
Fulton Financial Corporation
Raymond James and Associates
Institutional Investors Conference
March 8-11, 2009
(Data as of December 31, 2008)

The following presentation may contain forward-looking statements about Fulton Financial Corporation’s
financial condition, business, strategies, products and services. Forward-looking statements are encouraged
by the Private Securities Litigation Reform Act of 1995. Such forward-looking statements reflect the
Corporation’s current views and expectations based largely on information currently available to its
management, and on its current expectations, assumptions, plan, estimates, judgments, and projections about
its business and its industry, and they involve inherent risks, contingencies, uncertainties and other factors.
Although the Corporation believes that these forward-looking statements are based on reasonable estimates
and assumptions, the Corporation is unable to provide any assurance that its expectations will, in fact, occur
or that its estimates or assumptions will be correct and actual results could differ materially from those
expressed or implied by such forward-looking statements and such statements are not guarantees of future
performance. The Corporation undertakes no obligation to update or revise any forward-looking statements.
Accordingly, investors and others are cautioned not to place undue reliance on such forward-looking
statements.
Many factors could affect future financial results including, without limitation, acquisition and growth
strategies; market risk; changes or adverse developments in economic, political or regulatory conditions; a
continuation or worsening of the current disruption in credit and other markets, including the lack of or
reduced access to, and the abnormal functioning of markets for mortgage and other asset-backed securities
and for commercial paper and other short-term borrowings; the effect of competition and interest rates on net
interest margin and net interest income; investment strategy and income growth; investment securities gains;
declines in the value of securities which may result in charges to earnings; changes in rates of deposit and
loan growth; asset quality and the impact on assets from adverse changes in the economy and in credit and
other markets and resulting effects on credit risk and asset values; balances of risk-sensitive assets to risk-
sensitive liabilities; salaries and employee benefits and other expenses; amortization of intangible assets;
goodwill impairment; capital and liquidity strategies; and other financial and business matters for future periods.
For a more complete discussion of certain risks and uncertainties affecting the Corporation, please see the
sections entitled “Risk Factors” and “Management’s Discussion and Analysis of Financial Condition and
Results of Operations” set forth in the Corporation’s filings with the Securities and Exchange Commission.
Forward-Looking Statement

Presentation Outline
Corporate Overview
Franchise and Markets
Capital and Liquidity
Loan Summary
Recent Trends
Financial Performance
Summary

Fulton Financial Profile
Mid-Atlantic regional financial holding company
A family of 10 community banks in 5 states
Fulton Financial Advisors
Fulton Mortgage Co.
267 community banking offices
Asset size: $ 16.2 billion
3900 Team Members
Market capitalization: $ 1 billion
Book value per common share: $ 8.52
Tangible book value per common share: $ 5.33
Shares outstanding: 175 million

Capital
With CPP
Without CPP
GAAP Capital
$1.86 billion
$1.48 billion
Total Risk-Based Capital
$1.85 billion
$1.48 billion
Ratios:
With CPP
Without CPP
Total Risk-Based Capital
14.25%
11.36%
Tier 1 Risk-Based Capital
11.46%
8.57%
Leverage Capital
9.57%
7.16%
Tangible Common Equity
5.97%
5.97%

Liquidity and Borrowing Capacity
Customer funding base: $ 10.6 billion
---------------------------------------------------------
Total available collateral and
borrowing capacity: $ 3.3 billion
Fed Funds capacity: $ 1.4 billion

Superior Customer Experience
Care, Listen, Understand and Deliver

Superior Customer Satisfaction
*Retail:
90% extremely/very satisfied
Commercial:
90% extremely/very satisfied
*Compared to national average of 63%
Source: American Banker/Gallup Consumer Survey

A Valuable Geographic Franchise

*Source: SNL, Median HH Income, 2008 data
Serving PA’s Strongest Markets*
County
Rank
#
Branches
Projected Population
Change 2008-2013 (%)
Median HH
Income 2008 ($)
Projected HH
Income Change
2008-2013 (%)
Chester, PA
1
7
7.96
87,480
22.46
Montgomery, PA
2
3
2.34
79,875
22.45
Bucks, PA
3
5
3.78
79,610
22.28
Delaware, PA
4
1
0.70
66,587
17.73
Cumberland, PA
5
3
4.81
61,897
13.45
Northampton, PA
6
3
7.38
60,429
13.16
Lancaster, PA
8
27
4.08
59,151
12.98
Lehigh, PA
9
3
6.17
59,036
14.67
York, PA
10
15
7.74
58,782
12.58
Berks, PA
11
9
4.74
58,222
12.93
Average
4.97
67,107
16.47
Average of all
other (57)
0.80
44,312
15.54

FFC Affiliates in Affluent Markets*
*Source: SNL Financial, 2008
County
#
Branches
National
Ranking
Ranking in
State
Median HH
Ranking
Hunterdon, NJ
3
#3
#1
$109,245
Morris, NJ
6
#7
#2
$103,406
Somerset, NJ
7
#8
#3
$102,548
Howard, MD
9
#9
#1
$101,251
Montgomery, MD
3
#22
#2
$91,571

Unemployment Rates*
FFC Counties
Unemployment
Rate (%)
State
Unemployment
Rate (%)
United States**
7.6
7.6
Delaware
6.2
5.9
Maryland
5.7
5.6
New Jersey
6.8
6.8
Pennsylvania
6.2
6.4
Virginia
5.3
5.2
*FFC Averages are an average of the unemployment
rates of the counties in which FFC has branches.
*Source: SNL & US Department of Labor
** State Data is as of December 2008, US Data is as of January 2009

US Home Price Index*
*Source: Freddie Mac, Q3 2008 Data
Metropolitan Statistical Area
Annual Change
Q3 2007 - Q3 2008
# Branches
United States
-5.6
Average FFC Regions
-3.5
Harrisburg-Carlisle, PA
1.2
12
Lebanon, PA
1.0
9
York-Hanover, PA
0.2
15
Lancaster, PA
-0.6
27
Philadelphia, PA
-1.8
16
Reading, PA
-2.2
9
Allentown-Bethlehem-Easton, PA
-3.0
24
Wilmington, DE-MD-NJ
-3.2
14
Camden, NJ
-3.7
27
Trenton-Ewing, NJ
-4.3
5
Edison, NJ
-4.7
20
Baltimore-Towson, MD
-4.8
13
Newark-Union, NJ-PA
-6.1
10
Hagerstown-Martinsburg, MD-WV
-6.5
11
Washington-Arlington-Alexandria, DC-VA
-14.1
10

Loan Distribution by Affiliate
2008
% of
08 v. 07
%
Aver Bal
Total
Growth
Growth
(dollars in thousands)
Pennsylvania
6,195,000
$
53.4%
430,000
$
7%
New Jersey
2,379,000
20.5%
228,000
10%
Maryland
1,580,000
13.6%
37,000
2%
Virginia
1,107,000
9.5%
144,000
15%
Delaware
339,000
2.9%
26,000
8%
11,600,000
$

Residential Mortgage and HE Loans
Total
% of
Balance
Total
Pennsylvania
1,383,000
$
51.9%
Maryland
457,000
17.1%
New Jersey
459,000
17.2%
Virginia
206,000
7.7%
Delaware
162,000
6.1%
2,667,000
$
(dollars in thousands)

Commercial Loans by Industry
Industry
%
Services
17.9
RE - Rental and Leasing
12.2
Construction
12.2
Manufacturing
12.2
Agriculture
9.2
Retail
8.8
Wholesale
8.1
Other
6.1
Health Care
6.0
Financial Services
3.1
Transportation
2.5
Arts and Entertainment
1.7
100.0

Commercial Loans by Geography
Total
% of
Balance
Total
Pennsylvania
2,354,000
$
64.7%
Maryland
415,000
11.4%
New Jersey
535,000
14.7%
Virginia
302,000
8.3%
Delaware
30,000
0.8%
3,636,000
$
(dollars in thousands)

Construction Loans
Total
% of
NPL
Specific
Balance
Total
Balance
Allocations
(dollars in thousands)
Pennsylvania
353,000
$
27.8%
6,380
$
1,570
$
Maryland
357,000
28.1%
30,660
13,590
New Jersey
237,000
18.7%
16,260
3,990
Virginia
304,000
24.0%
26,780
12,030
Delaware
18,000
1.4%
-
930
1,269,000
$
80,080
$
32,110
$

Commercial Real Estate Loans
Total
% of
NPL
Specific
Balance
Total
Balance
Allocations
(dollars in thousands)
Pennsylvania
2,045,000
$
50.9%
17,850
$
18,060
$
New Jersey
1,179,000
29.4%
17,450
5,790
Maryland
335,000
8.3%
2,110
1,580
Virginia
326,000
8.1%
3,330
1,300
Delaware
132,000
3.3%
1,000
450
4,017,000
$
41,740
$
27,180
$

Loan Delinquency (Key Sectors)
Category
Total (%)
12/31/07
90-Days
12/31/07
Total (%)
12/31/08
90-Days
12/31/08
Commercial
Loans
1.61
0.80
1.65
1.08
Consumer
Direct
0.85
0.26
1.20
0.45
Commercial
Mortgage
1.17
0.41
1.78
1.03
Residential
Mortgage
6.49
3.52
6.45
2.70
Construction
3.18
2.19
8.21
6.15
Total
Portfolio
1.96
0.98
2.72
1.62

49 relationships with commitments to lend
of $20 million or more
Maximum individual commitment- $33
million
Maximum commitment land development-
$28 million
Average commercial lending relationship
size is $437,548
Loans and corresponding relationships are
within Fulton’s geographic market area
Summary of Larger Loans

Recent Trends
Strong Loan Growth
Growth in Net Interest Income
Accelerating Deposit Growth
Stable Net Interest Margin
Significant Increase in Mortgage
Refinancing Activity
Improved Efficiency
Increased Other Income
Expense Reductions

Financial Performance

2008 Financial Results
2008
2007
Net income (loss)
(5,620,000)
$
152,720,000
$
Cost of preferred stock
(463,000)
$
-
$
Net income (loss) available
to common shareholders
(6,080,000)
$
152,720,000
$
Earnings per share
(0.03)
$
0.88
$
Return on tangible equity
9.29%
18.16%

Income Statement Summary
2008
2007
$
%
(dollars in thousands)
Net Interest Income
524,150
$
488,740
$
35,410
$
7%
Loan Loss Provision
(119,630)
(15,060)
(104,570)
694%
Other Income
155,390
146,280
9,110
6%
Credit Card Sale Gain
13,910
-
13,910
nm
Securities (Losses) Gains
(58,240)
1,740
(59,980)
nm
Goodwill Impairment
(90,000)
-
(90,000)
nm
Other Expenses
(406,630)
(405,450)
(1,180)
0%
Income Taxes
(24,570)
(63,530)
38,960
-61%
Net Income (Loss)
(5,620)
$
152,720
$
(158,340)
$
-104%

International Bancshares Corporation
Old National Bancorp
South Financial Group, Inc.
Susquehanna Bancshares, Inc.
TCF Financial Corporation
Trustmark Corporation
UMB Financial Corporation
United Bankshares, Inc.
Valley National Bancorp
Whitney Holding Corporation
Wilmington Trust Corporation
Associated Banc-Corp
BancorpSouth, Inc.
Bank of Hawaii Corporation
BOK Financial Corporation
Citizens Republic Bancorp
City National Corporation
Colonial BancGroup, Inc.
Commerce Bancshares, Inc.
Cullen/Frost Bankers, Inc.
First Citizens BancShares, Inc.
First Midwest Bancorp, Inc.
First Merit Corporation
Peer Group
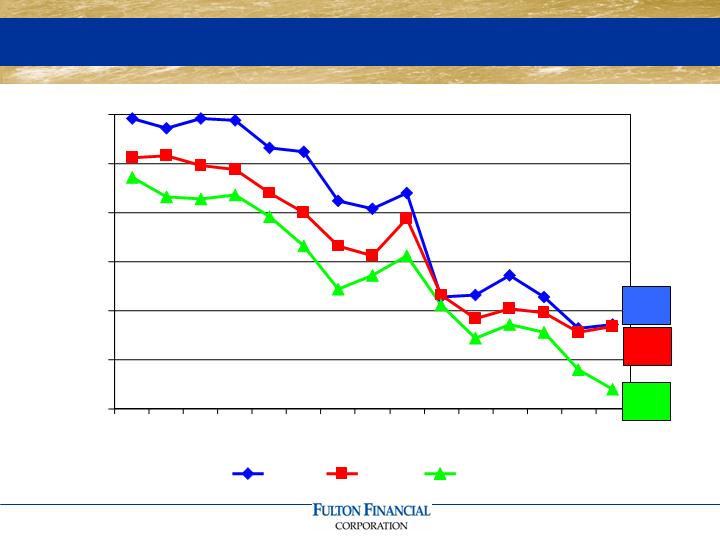
Net Interest Margin
3.68
3.67
3.35
3.25
3.50
3.75
4.00
4.25
4.50
4.75
94
95
96
97
98
99
00
01
02
03
04
05
06
07
08
FFC
Peer
Top 50

Average Loan Growth
$0.0
$0.5
$1.0
$1.5
$2.0
$2.5
$3.0
$3.5
$4.0
Billions
2006
2007
2008
Average Deposit Growth
$0.0
$0.5
$1.0
$1.5
$2.0
$2.5
$3.0
$3.5
$4.0
$4.5
Billions
2006
2007
2008

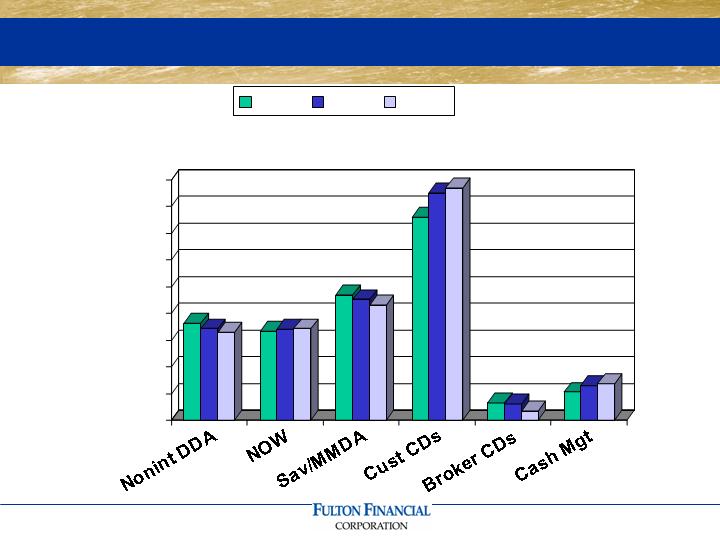
Other Income
$0
$20
$40
$60
$80
$100
$120
$140
$160
Millions

Other Income (Year Ended December 31st)
2008
2007
$
%
(dollars in thousands)
Overdraft & NSF Fees
35,320
$
22,350
$
12,970
$
58%
Invt Mgt & Trust
32,730
38,670
(5,940)
-15%
Cash Mgt Fees
13,270
11,530
1,740
15%
Service Charges
13,040
12,620
420
3%
Mort. Sales Gains
10,330
14,290
(3,960)
-28%
Success Card Fees
9,800
8,720
1,080
12%
Other
40,900
38,100
2,800
7%
Total
155,390
$
146,280
$
9,110
$
6%
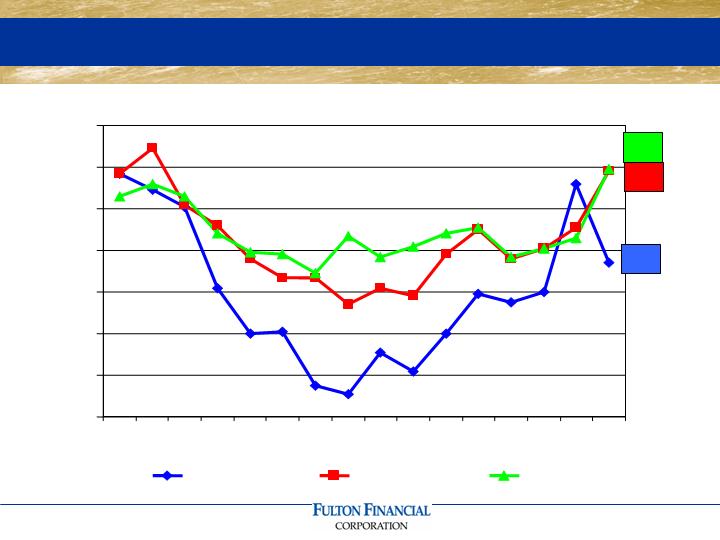
Efficiency Ratio
57.4
61.8
61.9
50.0
52.0
54.0
56.0
58.0
60.0
62.0
64.0
93
94
95
96
97
98
99
00
01
02
03
04
05
06
07
08
FFC
Peer
Top 50

Other Expense (Year Ended December 31st)
2008
2007
$
%
(dollars in thousands)
Salaries & Benefits
213,560
$
217,530
$
(3,970)
$
-2%
Occupancy & Equip.
55,570
53,860
1,710
3%
Operating Risk Loss
24,310
27,230
(2,920)
-11%
Data Proc. & Software
18,550
17,780
770
4%
Marketing
13,270
11,330
1,940
17%
Supplies & Postage
11,250
11,140
110
1%
Other Expenses
70,120
66,580
3,540
5%
Total
406,630
$
405,450
$
1,180
$
0%

Allowance for Credit Losses
2008
2007
(dollars in thousands)
Balance 1-1-08
112,210
$
106,880
$
Loan Loss Provision
119,630
15,060
Net Charge-Offs
(51,700)
(9,740)
Balance 12-31-08
180,140
$
112,200
$
Allowance to Loans
1.50%
1.00%
Nonperforming Assets to Assets
1.35%
0.76%
Net Charge-offs to Loans
0.45%
0.09%
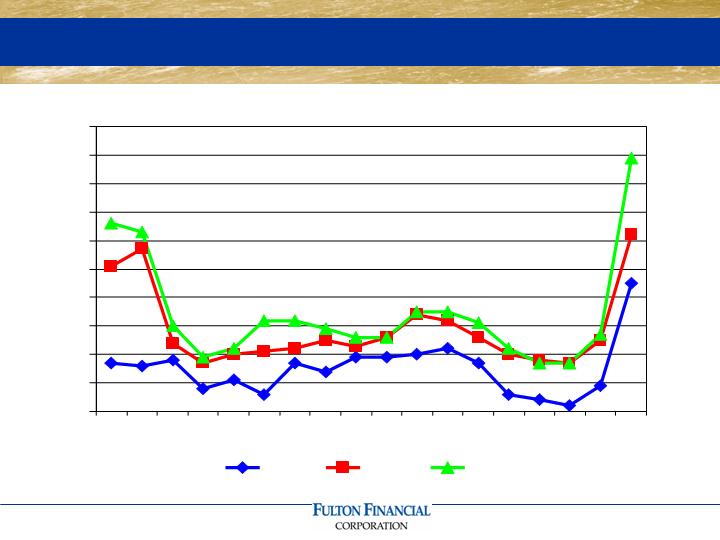
Net Charge-Offs To Loans
0.00
0.10
0.20
0.30
0.40
0.50
0.60
0.70
0.80
0.90
1.00
91
92
93
94
95
96
97
98
99
00
01
02
03
04
05
06
07
08
FFC
Peer
Top 50

Securities Related Charges
Auction Rate Securities - $20 million
contingent loss
Bank Stocks - $43 million other-than –
temporary impairment
Corporate Debt Securities - $21
million other-than-temporary
impairment

Investment Portfolio
ENDING
MODIFIED
BALANCE
DURATION
(in millions)
Agency mortgage-backed securities
1,120.5
$
4.38
Municipal bonds
513.3
4.15
Agency collateralized mortgage obligations
489.7
4.34
Auction rate securities
208.3
5.14
Corporate & trust preferred securities
152.0
9.98
U.S. Treasuries and agencies
87.8
2.28
FHLB & FRB stock
85.2
NA
Bank stocks
43.1
NA
Other investments
28.8
NA
Net unrealized loss
(3.9)
Total Investments
2,724.8
$
4.68

Status of the Corporation
Valuable geographic franchise
Positive market demographics
Strong capital
Deposit trends improving
Continued expense reduction
Positioned for economic rebound

Fulton Financial Corporation
One Penn Square
Lancaster, PA 17602
www.fult.com