
Fulton Financial
Corporation
-------------------------------------------------
August, 2009
Investor Presentation
Data as of June 30, 2009

The following presentation may contain forward-looking statements about Fulton Financial Corporation’s
financial condition, business, strategies, products and services. Forward-looking statements are encouraged
by the Private Securities Litigation Reform Act of 1995. Such forward-looking statements reflect the
Corporation’s current views and expectations based largely on information currently available to its
management, and on its current expectations, assumptions, plan, estimates, judgments, and projections about
its business and its industry, and they involve inherent risks, contingencies, uncertainties and other factors.
Although the Corporation believes that these forward-looking statements are based on reasonable estimates
and assumptions, the Corporation is unable to provide any assurance that its expectations will, in fact, occur
or that its estimates or assumptions will be correct and actual results could differ materially from those
expressed or implied by such forward-looking statements and such statements are not guarantees of future
performance. The Corporation undertakes no obligation to update or revise any forward-looking statements.
Accordingly, investors and others are cautioned not to place undue reliance on such forward-looking
statements.
Many factors could affect future financial results including, without limitation, acquisition and growth
strategies; market risk; changes or adverse developments in economic, political or regulatory conditions; a
continuation or worsening of the current disruption in credit and other markets, including the lack of or
reduced access to, and the abnormal functioning of markets for mortgage and other asset-backed securities
and for commercial paper and other short-term borrowings; the effect of competition and interest rates on net
interest margin and net interest income; investment strategy and income growth; investment securities gains;
declines in the value of securities which may result in charges to earnings; changes in rates of deposit and
loan growth; asset quality and the impact on assets from adverse changes in the economy and in credit and
other markets and resulting effects on credit risk and asset values; balances of risk-sensitive assets to risk-
sensitive liabilities; salaries and employee benefits and other expenses; amortization of intangible assets;
goodwill impairment; capital and liquidity strategies; and other financial and business matters for future
periods.
For a more complete discussion of certain risks and uncertainties affecting the Corporation, please see the
sections entitled “Risk Factors” and “Management’s Discussion and Analysis of Financial Condition and
Results of Operations” set forth in the Corporation’s filings with the Securities and Exchange Commission.
Forward-Looking Statement

Presentation Outline
Corporate Overview
Franchise and Markets
Customer Experience / Satisfaction
Capital
Credit
Second Quarter Performance
Summary

Fulton Financial Profile
Mid-Atlantic regional financial holding company
A family of 8 community banks in 5 states
Fulton Financial Advisors
Fulton Mortgage Company
270 community banking offices
Asset size: $ 16.9 billion
3850 Team Members
Market capitalization: $ 1 billion
Book value per common share: $ 8.56
Tangible book value per common share: $ 5.40
Shares outstanding: 175 million
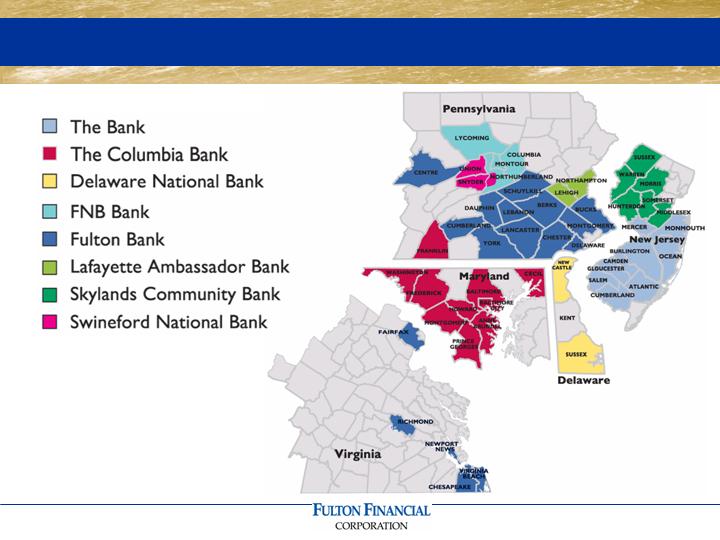
A Valuable Geographic Franchise

*Source: SNL, Median HH Income, 2009 data
Serving PA’s Strongest Markets*
County
Rank
#
Branches
Projected Population
Change 2009-2014 (%)
Median HH
Income 2009 ($)
Projected HH
Income Change
2009-2014 (%)
Chester, PA
1
7
6.64
87,308
7.36
Montgomery, PA
2
3
1.85
80,212
5.01
Bucks, PA
3
6
2.22
79,444
4.95
Delaware, PA
4
1
0.10
66,300
5.25
Cumberland, PA
5
3
4.06
61,622
6.42
Northampton, PA
6
15
5.48
60,207
6.11
Lancaster, PA
8
28
3.46
59,484
5.61
York, PA
9
15
6.36
59,123
3.89
Berks, PA
10
9
3.73
58,885
4.18
Lehigh, PA
11
8
4.76
58,555
4.95
Average
3.87
67,114
5.37
Average of all
other (57)
-0.33
44,560
5.97

FFC Affiliates in Affluent Markets*
*Source: SNL Financial, 2009
County
# FFC
Branches
National
Ranking
Ranking in
State
Median HH
Ranking
Hunterdon, NJ
3
#3
#1
$110,147
Fairfax, VA
1
#4
#1
$109,067
Morris, NJ
6
#6
#2
$104,797
Somerset, NJ
7
#8
#3
$102,357
Howard, MD
12
#9
#1
$101,954

Unemployment Rates*
FFC Counties
Unemployment
Rate (%)**
State
Unemployment
Rate (%)***
United States
9.4
9.4
Delaware
8.4
8.7
Maryland
8.0
7.5
New Jersey
9.1
9.2
Pennsylvania
8.2
8.4
Virginia
7.6
7.3
*FFC Averages are an average of the unemployment
rates of the counties in which FFC has branches.
*Source: SNL & US Department of Labor
** County Data is as of June 2009
***State Data is as of June 2009

US Home Price Index*
*Source: Freddie Mac, Q1 2009 Data
Metropolitan Statistical Area
Annual Change
Q1 2008 - Q1 2009
# Branches
United States
-4.0
Average FFC Regions
-4.6
Harrisburg-Carlisle, PA
-0.6
12
Lebanon, PA
-0.6
9
York-Hanover, PA
-3.4
15
Lancaster, PA
-2.0
27
Philadelphia, PA
-2.6
16
Reading, PA
-2.0
9
Allentown-Bethlehem-Easton, PA
-5.0
24
Wilmington, DE-MD-NJ
-4.0
14
Camden, NJ
-5.1
27
Trenton-Ewing, NJ
-5.3
5
Edison, NJ
-5.2
20
Baltimore-Towson, MD
-7.1
13
Newark-Union, NJ-PA
-5.7
12
Hagerstown-Martinsburg, MD-WV
-10.4
11
Washington-Arlington-Alexandria, DC-VA
-10.5
10

Our Brand
COMMUNITY BANKING
SMALL BUSINESS
HIGH NET WORTH
RETAIL BANKING
LISTENING IS JUST THE BEGINNING.

Superior Customer Experience
Care, Listen, Understand, Deliver

Superior Customer Satisfaction
*Retail:
90% extremely/very satisfied
Commercial:
90% extremely/very satisfied
*Compared to national average of 63%
Source: American Banker/Gallup Consumer Survey

Customer Satisfaction Metrics
Attribute
Q1/2008
Q1/2009
Employees are friendly and helpful
9.6
9.6
Bank seems easy to work with
9.5
9.5
Safety and security of a local bank
NA
9.3
Wait times are brief
9.1
9.3
Wide range of products and services
9.0
9.1
Listens to my needs
9.1
9.1
Convenient branches and ATMs
8.9
8.8
Resolves problems quickly
8.8
9.1
Offers ability to conduct transactions on Internet
8.2
8.4
Fees are generally low
8.0
8.3
Competitive interest rates
8.1
8.8
Bank is involved in the community
7.9
8.4

Capital (6/30/09)
With CPP
Without CPP
GAAP Capital
$1.87 billion
$1.50 billion
Total Risk-Based Capital
$1.87 billion
$1.49 billion
Ratios:
With CPP
Without CPP
Total Risk-Based Capital
13.90%
11.10%
Tier 1 Risk-Based Capital
11.20%
8.40%
Leverage Capital
9.40%
7.00%
Tangible Common Equity
5.80%
5.80%
Tangible Common Equity
to Risk-Weighted Assets
7.10%
7.10%

Loan Distribution by State (Second Quarter)
Average
% of
09 v. 08
%
Balance
Total
Growth
Growth
(dollars in thousands)
Pennsylvania
6,437,000
$
53.8%
380,000
$
6%
New Jersey
2,498,000
20.9%
148,000
6%
Maryland
1,563,000
13.1%
(10,000)
-1%
Virginia
1,117,000
9.3%
7,000
1%
Delaware
345,000
2.9%
12,000
4%
11,960,000
$

Residential Mortgage and HE Loans
Q2 2009
% of
Avg. Bal.
Total
Pennsylvania
1,326,000
$
50.9%
Maryland
459,000
17.6%
New Jersey
458,000
17.6%
Virginia
204,000
7.8%
Delaware
158,000
6.1%
2,605,000
$
(dollars in thousands)

Commercial Loans by Industry
Industry
%
Services
17.1
Manufacturing
14.7
RE - Rental and Leasing
12.2
Construction
11.6
Agriculture
8.5
Retail
8.5
Wholesale
7.7
Other
6.2
Health Care
5.7
Financial Services
3.5
Transportation
2.2
Arts and Entertainment
2.1
100.0

Commercial Loans by State
Q2 2009
% of
Avg. Bal.
Total
Pennsylvania
2,361,000
$
64.6%
Maryland
410,000
11.2%
New Jersey
547,000
15.0%
Virginia
306,000
8.4%
Delaware
31,000
0.8%
3,655,000
$
(dollars in thousands)

Construction Loans (June 30, 2009)
Ending
% of
NPL
Specific
Balance
Total
Balance
Allocations
(dollars in thousands)
Pennsylvania
297,000
$
27.0%
10,270
$
3,670
$
Maryland
286,000
26.0%
37,150
22,640
New Jersey
223,000
20.3%
23,610
4,640
Virginia
278,000
25.3%
31,950
10,380
Delaware
16,000
1.5%
-
130
1,100,000
$
102,980
$
41,460
$

Construction Loans by Type
Ending
% of
Balance
Total
(dollars in thousands)
Commercial
279,000
$
25.3%
Commercial Residential
726,000
66.0%
Other Commercial
24,000
2.2%
Real Estate
71,000
6.5%
1,100,000
$

CRE Loans by State (June 30, 2009)
Ending
% of
NPL
Specific
Balance
Total
Balance
Allocations
(dollars in thousands)
Pennsylvania
2,125,000
$
51.6%
17,140
$
10,600
$
New Jersey
1,193,000
28.9%
26,320
7,410
Maryland
348,000
8.4%
8,440
400
Virginia
323,000
7.8%
3,950
2,520
Delaware
132,000
3.2%
1,940
1,080
4,121,000
$
57,790
$
22,010
$

Loan Delinquency (Key Sectors)
Category
Total (%)
6/30/08
90-Days
6/30/08
Total (%)
6/30/09
90-Days
6/30/09
Commercial
Loans
1.65
1.12
2.24
1.77
Consumer
Direct
.81
.32
1.36
0.52
Commercial
Mortgage
1.62
1.03
1.95
1.22
Residential
Mortgage
5.50
2.58
7.36
3.36
Construction
3.75
2.71
10.36
9.31
Total
Portfolio
2.06
1.25
3.22
2.20

Automotive Related Loans
Ending
Balance
(dollars in thousands)
New Cars
80,853
$
Used Cars
46,430
Floor Plans
67,803
195,086
$
Delinquency Rate .64%

Shared National Credits
Ending
Balance
(dollars in thousands)
Commercial / Industrial
112,035
$
Commercial Real Estate
40,834
Total Outstanding
152,869
$
Delinquency: None

Net Charge-offs (Q2 2009)
Comm'l
Res. Mtg.
Comm'l
Mortgage
Constr.
and HE
Other
Total
(in thousands)
Pennsylvania
1,359
$
1,524
$
1,531
$
164
$
1,975
$
6,553
$
Maryland
583
795
6,362
306
515
8,561
New Jersey
3,923
3,617
1,442
226
546
9,754
Virginia
101
-
1,745
939
1,003
3,788
Delaware
2
-
-
48
403
453
5,968
$
5,936
$
11,080
$
1,683
$
4,442
$
29,109
$
Avg Loans
3,656,000
4,091,000
1,152,000
2,605,000
456,000
11,960,000
NCO %
0.65%
0.58%
3.85%
0.26%
3.90%
0.97%

Net Charge-offs (YTD June 2009)
Comm'l
Res. Mtg.
Comm'l
Mortgage
Constr.
and HE
Other
Total
(in thousands)
Pennsylvania
1,694
$
1,942
$
3,975
$
1,689
$
3,101
$
12,401
$
Maryland
791
2,676
13,768
423
957
18,615
New Jersey
6,257
4,685
2,138
224
1,049
14,353
Virginia
6,883
-
3,329
1,051
1,131
12,394
Delaware
61
583
-
232
544
1,420
15,686
$
9,886
$
23,210
$
3,619
$
6,782
$
59,183
$
Avg Loans
3,656,000
4,070,000
1,191,000
2,630,000
453,000
12,000,000
NCO %
0.86%
0.49%
3.90%
0.28%
2.99%
0.99%

Non-performing Loans* (June 30, 2009)
Comm'l
Res. Mtg.
Comm'l
Mortgage
Constr.
and HE
Other
Total
(in thousands)
Pennsylvania
19,709
$
17,142
$
10,271
$
9,359
$
4,924
$
61,405
$
Maryland
3,979
8,442
37,150
3,612
1,150
54,333
New Jersey
17,522
26,323
23,611
5,926
2,879
76,261
Virginia
16,801
3,947
31,945
16,820
575
70,088
Delaware
422
1,932
-
1,514
1,312
5,180
58,433
$
57,786
$
102,977
$
37,231
$
10,840
$
267,267
$
End Loans
3,614,000
4,121,000
1,096,000
2,578,000
457,000
11,866,000
NPL%
1.62%
1.40%
9.40%
1.44%
2.37%
2.25%
* Includes accruing loans > 90 days past due.

53 relationships with commitments to lend
of $20 million or more
Maximum individual commitment- $33
million
Maximum commitment land development-
$28 million
Average commercial lending relationship
size is $471,587
Loans and corresponding relationships are
within Fulton’s geographic market area
Summary of Larger Loans

Overview of Second Quarter
Strong core deposit growth
Stable net interest margin despite
reduction in total loans outstanding
Continued high level of residential
mortgage activity
Good growth in other income
Core expenses flat

Financial Performance

2009 Financial Results (Second Quarter)
2009
2008
Net income
13,110,000
$
25,680,000
$
Cost of preferred stock
(5,045,000)
-
Net income available
to common shareholders
8,065,000
$
25,680,000
$
Earnings per share
0.05
$
0.15
$
Return on tangible equity
3.83%
11.03%

Income Statement Summary (Second Quarter)
2009
2008
$
%
(dollars in thousands)
Net Interest Income
127,940
$
131,890
$
(3,950)
$
-3%
Loan Loss Provision
(50,000)
(16,710)
(33,290)
199%
Other Income
45,300
39,890
5,410
14%
Credit Card Sale Gain
-
13,910
(13,910)
nm
Securities Gains (Losses)
80
(21,650)
21,730
-100%
Other Expenses
(107,810)
(109,730)
1,920
-2%
Pre-Tax Income
15,510
37,600
(22,090)
-59%
Income Taxes
(2,400)
(11,920)
9,520
-80%
Net Income
13,110
$
25,680
$
(12,570)
$
-49%

Pre-Tax Income Summary (Second Quarter)
2009
2008
$
%
(dollars in thousands)
Net Interest Income
127,940
$
131,890
$
(3,950)
$
-3%
Other Income
45,300
39,890
5,410
14%
Other Expenses
(107,810)
(109,730)
1,920
-2%
Pre-Tax Income Before
Provision, CC Gain
Securities Gains (Losses)
65,430
62,050
3,380
5%
Loan Loss Provision
(50,000)
(16,710)
(33,290)
199%
Credit Card Sale Gain
-
13,910
(13,910)
nm
Securities Gains (Losses)
80
(21,650)
21,730
-100%
Pre-Tax Income
15,510
$
37,600
$
(22,090)
-59%

2009 Financial Results (YTD June)
2009
2008
Net income
26,200,000
$
67,170,000
$
Cost of preferred stock
(10,080,000)
-
Net income available
to common shareholders
16,120,000
$
67,170,000
$
Earnings per share
0.09
$
0.39
$
Return on tangible equity
3.85%
14.65%

Income Statement Summary (YTD June)
2009
2008
$
%
(dollars in thousands)
Net Interest Income
252,060
$
257,790
$
(5,730)
$
-2%
Loan Loss Provision
(100,000)
(27,930)
(72,070)
258%
Other Income
89,300
76,320
12,980
17%
Credit Card Sale Gain
-
13,910
(13,910)
nm
Securities Gains (Losses)
3,000
(20,400)
23,400
-115%
Other Expenses
(214,180)
(206,400)
(7,780)
4%
Pre-Tax Income
30,180
93,290
(63,110)
-68%
Income Taxes
(3,980)
(26,120)
22,140
-85%
Net Income
26,200
$
67,170
$
(40,970)
$
-61%

Pre-Tax Income Summary (YTD June)
2009
2008
$
%
(dollars in thousands)
Net Interest Income
252,060
$
257,790
$
(5,730)
$
-2%
Other Income
89,300
76,320
12,980
17%
Other Expenses
(214,180)
(206,400)
(7,780)
4%
Pre-Tax Income Before
Provision, CC Gain
Securities Gains (Losses)
127,180
127,710
(530)
0%
Loan Loss Provision
(100,000)
(27,930)
(72,070)
258%
Credit Card Sale Gain
-
13,910
(13,910)
nm
Securities Gains (Losses)
3,000
(20,400)
23,400
-115%
Pre-Tax Income
30,180
$
93,290
$
(63,110)
-68%

2009 Financial Results (Q2 vs. Q1 2009)
Q2 2009
Q1 2009
Net income
13,110,000
$
13,085,000
$
Cost of preferred stock
(5,045,000)
(5,030,000)
Net income available
to common shareholders
8,065,000
$
8,055,000
$
Earnings per share
0.05
$
0.05
$
Return on tangible equity
3.83%
3.88%

Income Statement Summary (Q2 vs. Q1 2009)
Q2 2009
Q1 2009
$
%
(dollars in thousands)
Net Interest Income
127,940
$
124,120
$
3,820
$
3%
Loan Loss Provision
(50,000)
(50,000)
-
0%
Other Income
45,300
43,990
1,310
3%
Securities Gains (Losses)
80
2,920
(2,840)
-97%
Other Expenses
(107,810)
(106,370)
(1,440)
1%
Pre-Tax Income
15,510
14,660
850
6%
Income Taxes
(2,400)
(1,575)
(825)
52%
Net Income
13,110
$
13,085
$
25
$
0%

Pre-Tax Income Summary (Q2 vs. Q1 2009)
Q2 2009
Q1 2009
$
%
(dollars in thousands)
Net Interest Income
127,940
$
124,120
$
3,820
$
3%
Other Income
45,300
43,990
1,310
3%
Other Expenses
(107,810)
(106,370)
(1,440)
1%
Pre-Tax Income Before
Provision, CC Gain
Securities Gains (Losses)
65,430
61,740
3,690
6%
Loan Loss Provision
(50,000)
(50,000)
-
0%
Securities Gains (Losses)
80
2,920
(2,840)
-97%
Pre-Tax Income
15,510
$
14,660
$
850
6%

International Bancshares Corporation
Old National Bancorp
South Financial Group, Inc.
Susquehanna Bancshares, Inc.
TCF Financial Corporation
Trustmark Corporation
UMB Financial Corporation
United Bankshares, Inc.
Valley National Bancorp
Whitney Holding Corporation
Wilmington Trust Corporation
* All U.S. Banks from $7.5 to $25
billion in assets
Associated Banc-Corp
BancorpSouth, Inc.
Bank of Hawaii Corporation
BOK Financial Corporation
Citizens Republic Bancorp
City National Corporation
Colonial BancGroup, Inc.
Commerce Bancshares, Inc.
Cullen/Frost Bankers, Inc.
First Citizens BancShares, Inc.
First Midwest Bancorp, Inc.
First Merit Corporation
Peer Group*

Net Interest Margin
3.44
3.54
3.15
3.00
3.50
4.00
4.50
5.00
94
95
96
97
98
99
00
01
02
03
04
05
06
07
08
YTD
6/09
FFC
Peer
Top 50

Average Loans (Q2 vs. Q1 2009)
Q2 2009
Q1 2009
$
%
(dollars in millions)
Commercial
3,660
$
3,660
$
-
$
0%
Comm'l Mort
4,090
4,050
��
40
1%
Resid Mort
940
960
(20)
-2%
Home Equity
1,670
1,700
(30)
-2%
Construction
1,150
1,230
(80)
-7%
Cons./Other
450
440
10
2%
Total Loans
11,960
$
12,040
$
(80)
-1%

Average Loans (Second Quarter)
2009
2008
$
%
(dollars in millions)
Commercial
3,660
$
3,500
$
160
$
5%
Comm'l Mort
4,090
3,680
410
11%
Resid Mort
940
890
50
6%
Home Equity
1,670
1,570
100
6%
Construction
1,150
1,320
(170)
-13%
Cons./Other
450
460
(10)
-2%
Total Loans
11,960
$
11,420
$
540
5%

Average Loans (YTD June)
2009
2008
$
%
(dollars in millions)
Commercial
3,660
$
3,480
$
180
$
5%
Comm'l Mort
4,070
3,610
460
13%
Resid Mort
950
870
80
9%
Home Equity
1,680
1,550
130
8%
Construction
1,190
1,340
(150)
-11%
Cons./Other
450
510
(60)
-12%
Total Loans
12,000
$
11,360
$
640
6%

Average Deposits (Q2 vs. Q1 2009)
Q2 2009
Q1 2009
$
%
(dollars in millions)
Nonint DDA
1,810
$
1,660
$
150
$
9%
Int DDA
1,820
1,750
70
4%
Savings/MMDA
2,310
2,060
250
12%
CD's
5,630
5,440
190
3%
Cash Management
550
580
(30)
-5%
Total Loans
12,120
$
11,490
$
630
5%

Average Deposits (Second Quarter)
2009
2008
$
%
(dollars in millions)
Nonint DDA
1,810
$
1,660
$
150
$
9%
Int DDA
1,820
1,710
110
6%
Savings/MMDA
2,310
2,210
100
5%
CD's
5,630
4,360
1,270
29%
Cash Management
550
690
(140)
-20%
Total Loans
12,120
$
10,630
$
1,490
14%

Average Deposits (YTD June)
2009
2008
$
%
(dollars in millions)
Nonint DDA
1,740
$
1,640
$
100
$
6%
Int DDA
1,790
1,700
90
5%
Savings/MMDA
2,180
2,170
10
0%
CD's
5,520
4,430
1,090
25%
Cash Management
570
700
(130)
-19%
Total Loans
11,800
$
10,640
$
1,160
11%

Other Income
$0
$20
$40
$60
$80
$100
$120
$140
$160
Millions

Other Income (Q2 vs. Q1 2009)
Q2 2009
Q1 2009
$
%
(dollars in thousands)
Overdraft & NSF Fees
8,790
$
8,440
$
350
$
4%
Invt Mgt & Trust
7,880
7,900
(20)
0%
Mort. Sales Gains
7,400
8,590
(1,190)
-14%
Service Charges
3,180
3,250
(70)
-2%
Cash Mgt Fees
3,090
3,200
(110)
-3%
Success Card Fees
2,750
2,440
310
13%
Credit Card Fees
1,360
1,190
170
N/A
Other
10,850
8,990
1,860
21%
Total
45,300
$
44,000
$
1,300
$
3%

Other Income (Second Quarter)
2009
2008
$
%
(dollars in thousands)
Overdraft & NSF Fees
8,790
$
8,640
$
150
$
2%
Invt Mgt & Trust
7,880
8,390
(510)
-6%
Mort. Sales Gains
7,400
2,670
4,730
177%
Service Charges
3,180
3,350
(170)
-5%
Cash Mgt Fees
3,090
3,330
(240)
-7%
Success Card Fees
2,750
2,550
200
8%
Credit Card Fees
1,360
1,090
270
N/A
Other
10,850
9,870
980
10%
Total
45,300
$
39,890
$
5,410
$
14%

Other Income (YTD June)
2009
2008
$
%
(dollars in thousands)
Overdraft & NSF Fees
17,230
$
16,330
$
900
$
6%
Mort. Sales Gains
15,990
4,980
11,010
221%
Invt Mgt & Trust
15,780
17,150
��
(1,370)
-8%
Service Charges
6,430
6,390
40
1%
Cash Mgt Fees
6,290
6,560
(270)
-4%
Success Card Fees
5,190
4,820
370
8%
Credit Card Fees
2,550
1,090
1,460
N/A
Other
19,840
19,000
840
4%
Total
89,300
$
76,320
$
12,980
$
17%
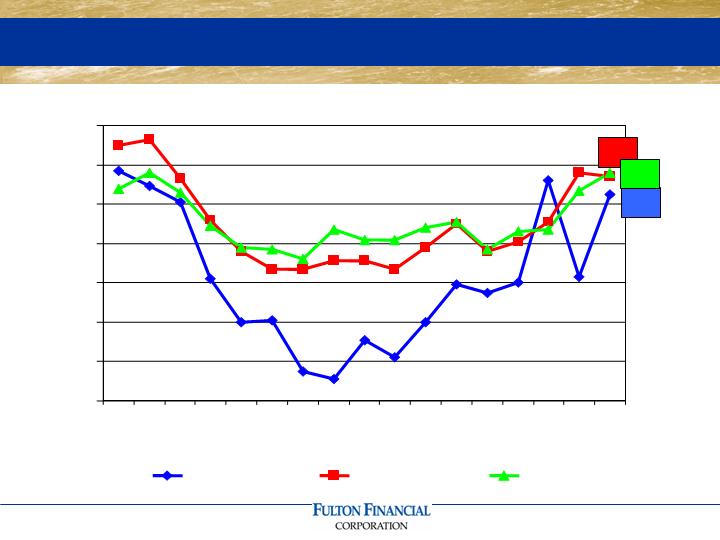
Efficiency Ratio
60.5
61.4
61.6
50.0
52.0
54.0
56.0
58.0
60.0
62.0
64.0
93
94
95
96
97
98
99
00
01
02
03
04
05
06
07
08
YTD
6/09
FFC
Peer
Top 50

Other Expense (Q2 vs. Q1 2009)
Q2 2009
Q1 2009
$
%
(dollars in thousands)
Salaries & Benefits
55,800
$
55,300
$
500
$
1%
Occupancy & Equip.
13,540
14,100
(560)
-4%
FDIC Insurance
12,210
4,290
7,920
185%
Data Proc. & Software
4,610
4,630
(20)
0%
Supplies & Postage
2,700
2,660
40
2%
Marketing
1,720
2,570
(850)
-33%
Operating Risk Loss
140
6,200
(6,060)
-98%
Other Expenses
17,090
16,620
470
3%
Total
107,810
$
106,370
$
1,440
$
1%

Other Expense (Second Quarter)
2009
2008
$
%
(dollars in thousands)
Salaries & Benefits
55,800
$
54,280
$
1,520
$
3%
Occupancy & Equip.
13,540
13,640
(100)
-1%
FDIC Insurance
12,210
680
11,530
nm
Data Proc. & Software
4,610
4,480
130
3%
Supplies & Postage
2,700
2,980
(280)
-9%
Marketing
1,720
3,520
(1,800)
-51%
Operating Risk Loss
140
14,390
(14,250)
-99%
Other Expenses
17,090
15,770
1,320
8%
Total
107,810
$
109,740
$
(1,930)
$
-2%

Other Expense (YTD June)
2009
2008
$
%
(dollars in thousands)
Salaries & Benefits
111,100
$
109,480
$
1,620
$
1%
Occupancy & Equip.
27,640
27,610
30
0%
FDIC Insurance
16,490
1,540
14,950
nm
Data Proc. & Software
9,240
9,140
100
1%
Operating Risk Loss
6,340
15,630
(9,290)
-59%
Supplies & Postage
5,370
5,800
(430)
-7%
Marketing
4,290
6,420
(2,130)
-33%
Other Expenses
33,710
30,780
2,930
10%
Total
214,180
$
206,400
$
7,780
$
4%

Allowance for Credit Losses
Q2 2009
Q1 2009
(dollars in thousands)
Balance at beginning of period
200,060
$
180,140
$
Loan Loss Provision
50,000
50,000
Net Charge-Offs
(29,110)
(30,080)
Balance at end of period
220,950
$
200,060
$
Allowance to Loans
1.86%
1.67%
Nonperforming Assets to Assets
1.73%
1.63%
Net Charge-offs to Loans
0.97%
1.00%

Allowance for Credit Losses (2nd Quarter)
2009
2008
(dollars in thousands)
Balance at beginning of quarter
200,060
$
119,070
$
Loan Loss Provision
50,000
16,710
Net Charge-Offs
(29,110)
(9,560)
Balance at June 30th
220,950
$
126,220
$
Allowance to Loans
1.86%
1.09%
Nonperforming Assets to Assets
1.73%
1.02%
Net Charge-offs to Loans
0.97%
0.33%

Allowance for Credit Losses (YTD June)
2009
2008
(dollars in thousands)
Balance at beginning of year
180,140
$
112,210
$
Loan Loss Provision
100,000
27,930
Net Charge-Offs
(59,190)
(13,920)
Balance at June 30th
220,950
$
126,220
$
Allowance to Loans
1.86%
1.09%
Nonperforming Assets to Assets
1.73%
1.02%
Net Charge-offs to Loans
0.99%
0.24%
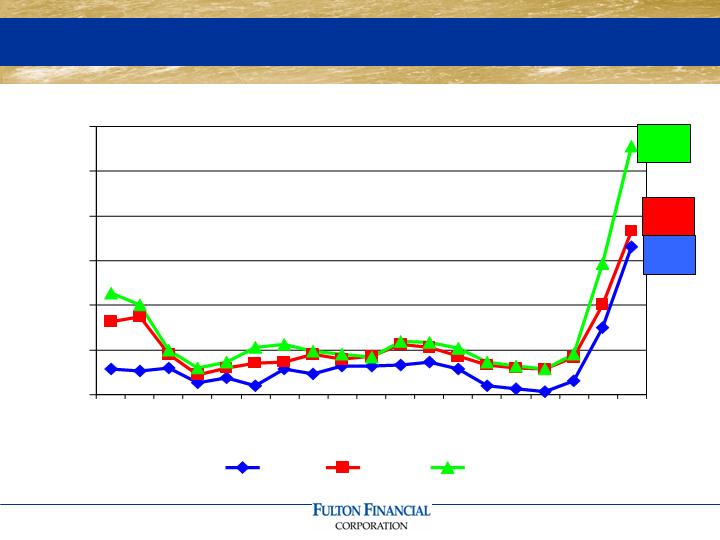
Net Charge-Offs To Average Loans
0.99
1.10
1.67
0.00
0.30
0.60
0.90
1.20
1.50
1.80
91
92
93
94
95
96
97
98
99
00
01
02
03
04
05
06
07
08
YTD
6/09
FFC
Peer
Top 50

Investment Portfolio
ENDING
MODIFIED
BALANCE
DURATION
(in millions)
Agency mortgage-backed securities
1,269.7
$
2.39
Agency collateralized mortgage obligations
881.6
2.15
Municipal bonds
454.4
4.25
Auction rate securities
298.8
4.30
Corporate & trust preferred securities
157.1
10.60
U.S. Treasuries and agencies
141.3
3.51
FHLB & FRB stock
85.6
NA
Bank stocks
38.1
NA
Other investments
26.6
NA
Net unrealized loss
(18.2)
Total Investments
3,335.4
$
3.19

Status of the Corporation
Reliable retail funding base
Good growth in net interest income
and non-interest income
Strong capital position
Residential mortgage activity
Continued expense reduction
Positioned for economic rebound
Valuable 5-state franchise in strong
in-state markets

Fulton Financial Corporation
One Penn Square
Lancaster, PA 17602
www.fult.com