
Fulton Financial
Corporation
-------------------------------------------------
October 2009
Corporate Presentation
Data as of September 30, 2009

The following presentation may contain forward-looking statements about Fulton Financial Corporation’s
financial condition, business, strategies, products and services. Forward-looking statements are encouraged
by the Private Securities Litigation Reform Act of 1995. Such forward-looking statements reflect the
Corporation’s current views and expectations based largely on information currently available to its
management, and on its current expectations, assumptions, plan, estimates, judgments, and projections about
its business and its industry, and they involve inherent risks, contingencies, uncertainties and other factors.
Although the Corporation believes that these forward-looking statements are based on reasonable estimates
and assumptions, the Corporation is unable to provide any assurance that its expectations will, in fact, occur
or that its estimates or assumptions will be correct and actual results could differ materially from those
expressed or implied by such forward-looking statements and such statements are not guarantees of future
performance. The Corporation undertakes no obligation to update or revise any forward-looking statements.
Accordingly, investors and others are cautioned not to place undue reliance on such forward-looking
statements.
Many factors could affect future financial results including, without limitation, acquisition and growth
strategies; market risk; changes or adverse developments in economic, political or regulatory conditions; a
continuation or worsening of the current disruption in credit and other markets, including the lack of or
reduced access to, and the abnormal functioning of markets for mortgage and other asset-backed securities
and for commercial paper and other short-term borrowings; the effect of competition and interest rates on net
interest margin and net interest income; investment strategy and income growth; investment securities gains;
declines in the value of securities which may result in charges to earnings; changes in rates of deposit and
loan growth; asset quality and the impact on assets from adverse changes in the economy and in credit and
other markets and resulting effects on credit risk and asset values; balances of risk-sensitive assets to risk-
sensitive liabilities; salaries and employee benefits and other expenses; amortization of intangible assets;
goodwill impairment; capital and liquidity strategies; and other financial and business matters for future
periods.
For a more complete discussion of certain risks and uncertainties affecting the Corporation, please see the
sections entitled “Risk Factors” and “Management’s Discussion and Analysis of Financial Condition and
Results of Operations” set forth in the Corporation’s filings with the Securities and Exchange Commission.
Forward-Looking Statement

Presentation Outline
Corporate Overview
Franchise and Markets
Customer Experience / Satisfaction
Capital
Credit
Third Quarter Performance
Summary

Fulton Financial Profile
Mid-Atlantic regional financial holding company
A family of 8 community banks in 5 states
Fulton Financial Advisors
Fulton Mortgage Company
270 community banking offices
Asset size: $ 16.5 billion
3850 Team Members
Market capitalization: $ 1.4 billion
Book value per common share: $ 8.82
Tangible book value per common share: $ 5.68
Shares outstanding: 176 million


*Source: SNL, Median HH Income, 2009 data
Serving PA’s Strongest Markets*
County
Rank
#
Branches
Projected Population
Change 2009-2014 (%)
Median HH
Income 2009 ($)
Projected HH
Income Change
2009-2014 (%)
Chester, PA
1
7
6.64
87,308
7.36
Montgomery, PA
2
3
1.85
80,212
5.01
Bucks, PA
3
6
2.22
79,444
4.95
Delaware, PA
4
1
0.10
66,300
5.25
Cumberland, PA
5
3
4.06
61,622
6.42
Northampton, PA
6
15
5.48
60,207
6.11
Lancaster, PA
8
28
3.46
59,484
5.61
York, PA
9
15
6.36
59,123
3.89
Berks, PA
10
9
3.73
58,885
4.18
Lehigh, PA
11
8
4.76
58,555
4.95
Average
3.87
67,114
5.37
Average of all
other (57)
-0.33
44,560
5.97

FFC Affiliates in Affluent Markets*
*Source: SNL Financial, 2009
County
# FFC
Branches
National
Ranking
Ranking in
State
Median HH
Income
Hunterdon, NJ
3
#3
#1
$110,147
Fairfax, VA
1
#4
#1
$109,067
Morris, NJ
6
#6
#2
$104,797
Somerset, NJ
7
#8
#3
$102,357
Howard, MD
12
#9
#1
$101,954

Unemployment Rates*
FFC Counties
Unemployment
Rate (%)**
State
Unemployment
Rate (%)***
United States
9.8
9.8
Delaware
7.7
8.2
Maryland
7.6
7.1
New Jersey
9.3
9.6
Pennsylvania
8.2
8.3
Virginia
6.8
6.6
*FFC Averages are an average of the unemployment
rates of the counties in which FFC has branches.
*Source: SNL & US Department of Labor
** County Data is as of August 2009
***State Data is as of September 2009

US Home Price Index*
*Source: Freddie Mac, Q2 2009 Data
Metropolitan Statistical Area
Annual Change
Q2 2008 - Q2 2009
# Branches
United States
-4.2
Average FFC Regions
-5.5
Harrisburg-Carlisle, PA
-1.4
12
Lebanon, PA
-0.9
9
York-Hanover, PA
-4.0
15
Lancaster, PA
-1.6
27
Philadelphia, PA
-3.3
16
Reading, PA
-3.6
9
Allentown-Bethlehem-Easton, PA
-5.7
24
Wilmington, DE-MD-NJ
-5.6
14
Camden, NJ
-6.3
27
Trenton-Ewing, NJ
-6.9
5
Edison, NJ
-5.8
20
Baltimore-Towson, MD
-8.6
13
Newark-Union, NJ-PA
-6.3
12
Hagerstown-Martinsburg, MD-WV
-13.2
11
Washington-Arlington-Alexandria, DC-VA
-8.5
10

Our Brand
COMMUNITY BANKING
SMALL BUSINESS
HIGH NET WORTH
RETAIL BANKING
LISTENING IS JUST THE BEGINNING.


Superior Customer Satisfaction
*Retail:
90% extremely/very satisfied
Commercial:
90% extremely/very satisfied
*Compared to national average of 63%
Source: American Banker/Gallup Consumer Survey

Customer Satisfaction Metrics
Attribute
Q1/2008
Q1/2009
Employees are friendly and helpful
9.6
9.6
Bank seems easy to work with
9.5
9.5
Safety and security of a local bank
NA
9.3
Wait times are brief
9.1
9.3
Wide range of products and services
9.0
9.1
Listens to my needs
9.1
9.1
Convenient branches and ATMs
8.9
8.8
Resolves problems quickly
8.8
9.1
Offers ability to conduct transactions on Internet
8.2
8.4
Fees are generally low
8.0
8.3
Competitive interest rates
8.1
8.8
Bank is involved in the community
7.9
8.4

Capital (9/30/09 Est.)
With CPP
Without CPP
GAAP Capital
$1.92 billion
$1.55 billion
Total Risk-Based Capital
$1.89 billion
$1.51 billion
Ratios:
With CPP
Without CPP
Total Risk-Based Capital
13.90%
11.10%
Tier 1 Risk-Based Capital
11.20%
8.40%
Leverage Capital
9.50%
7.10%
Tangible Common Equity
6.26%
6.26%
Tangible Common Equity
to Risk-Weighted Assets
7.50%
7.50%

Loan Distribution by State (Third Quarter)
Average
% of
09 v. 08
%
Balance
Total
Growth
Growth
(dollars in thousands)
Pennsylvania
6,442,000
$
54.1%
225,000
$
4%
New Jersey
2,481,000
20.8%
79,000
3%
Maryland
1,529,000
12.8%
(62,000)
-4%
Virginia
1,122,000
9.4%
(22,000)
-2%
Delaware
340,000
2.9%
(3,000)
-1%
11,914,000
$

Residential Mortgage and HE Loans
Q3 2009
% of
Avg. Bal.
Total
Pennsylvania
1,313,000
$
50.8%
New Jersey
453,000
17.5%
Maryland
452,000
17.5%
Virginia
213,000
8.2%
Delaware
154,000
6.0%
2,585,000
$
(dollars in thousands)

Commercial Loans by Industry
Industry
%
Services
18.8
Manufacturing
13.7
RE - Rental and Leasing
12.4
Construction
11.2
Agriculture
8.6
Retail
8.1
Wholesale
7.3
Other
5.8
Health Care
5.7
Financial Services
3.1
Arts and Entertainment
3.0
Transportation
2.3
100.0

Commercial Loans by State
Q3 2009
% of
Avg. Bal.
Total
(dollars in thousands)
Pennsylvania
2,380,000
$
64.9%
New Jersey
556,000
15.2%
Maryland
400,000
10.9%
Virginia
302,000
8.2%
Delaware
30,000
0.8%
3,668,000
$

Construction Loans (September 30, 2009)
Ending
% of
NPL
Specific
Balance
Total
Balance
Allocations
(dollars in thousands)
Pennsylvania
285,000
$
27.7%
14,800
$
2,860
$
Virginia
266,000
25.9%
23,950
9,300
Maryland
260,000
25.3%
47,120
21,360
New Jersey
202,000
19.6%
18,920
3,640
Delaware
16,000
1.6%
-
130
1,029,000
$
104,790
$
37,290
$

Construction Loans by Type
Ending
% of
Balance
Total
(dollars in thousands)
Commercial Residential
690,000
$
67.0%
Commercial
260,000
25.3%
Real Estate
63,000
6.1%
Other Commercial
16,000
1.6%
1,029,000
$

CRE Loans by State (September 30, 2009)
Ending
% of
NPL
Specific
Balance
Total
Balance
Allocations
(dollars in thousands)
Pennsylvania
2,160,000
$
51.6%
19,180
$
10,630
$
New Jersey
1,198,000
28.6%
28,310
5,000
Maryland
372,000
8.9%
1,360
1,180
Virginia
328,000
7.8%
4,100
2,520
Delaware
129,000
3.1%
1,980
1,030
4,187,000
$
54,930
$
20,360
$

Loan Delinquency (Key Sectors)
Category
Total (%)
9/30/08
90-Days
9/30/08
Total (%)
9/30/09
90-Days
9/30/09
Commercial
Loans
1.68
1.14
2.26
1.65
Consumer
Direct
.91
.35
1.69
0.65
Commercial
Mortgage
1.43
.84
1.84
1.31
Residential
Mortgage
5.76
2.81
8.50
4.71
Construction
5.84
4.26
11.37
10.12
Total
Portfolio
2.29
1.39
3.32
2.32

Shared National Credits
Ending
Balance
(dollars in thousands)
Commercial / Industrial
116,849
$
Commercial Real Estate
47,485
Total Outstanding
164,334
$
Delinquency: 6.2%

Net Charge-offs (Q3 2009)
Comm'l
Res. Mtg.
Comm'l
Mortgage
Constr.
and HE
Other
Total
(in thousands)
Pennsylvania
1,326
$
1,383
$
267
$
90
$
1,980
$
5,046
$
Maryland
818
9
2,640
150
419
4,036
New Jersey
2,421
1,668
3,936
-
486
8,511
Virginia
2,545
-
2,487
824
58
5,914
Delaware
233
-
-
-
493
726
7,343
$
3,060
$
9,330
$
1,064
$
3,436
$
24,233
$
Avg Loans
3,668,000
4,159,000
1,050,000
2,585,000
452,000
11,914,000
NCO %
0.80%
0.29%
3.55%
0.16%
3.04%
0.81%

Net Charge-offs (YTD September 2009)
Comm'l
Res. Mtg.
Comm'l
Mortgage
Constr.
and HE
Other
Total
(in thousands)
Pennsylvania
3,020
$
3,327
$
4,242
$
1,778
$
5,084
$
17,451
$
Maryland
1,607
2,683
16,408
572
1,378
22,648
New Jersey
8,680
6,354
6,073
223
1,533
22,863
Virginia
9,428
-
5,816
1,875
1,189
18,308
Delaware
294
583
-
232
1,037
2,146
23,029
$
12,947
$
32,539
$
4,680
$
10,221
$
83,416
$
Avg Loans
3,660,000
4,100,000
1,143,000
2,615,000
453,000
11,971,000
NCO %
0.84%
0.42%
3.80%
0.24%
3.01%
0.93%

Non-performing Loans* (September 30, 2009)
Comm'l
Res. Mtg.
Comm'l
Mortgage
Constr.
and HE
Other
Total
(in thousands)
Pennsylvania
27,398
$
19,177
$
8,638
$
10,109
$
4,805
$
70,127
$
Maryland
7,064
1,356
47,118
4,674
3,123
63,335
New Jersey
14,597
28,312
18,924
7,856
3,187
72,876
Virginia
13,930
4,102
30,109
20,298
270
68,709
Delaware
228
1,983
-
3,255
1,245
6,711
63,217
$
54,930
$
104,789
$
46,192
$
12,630
$
281,758
$
End Loans
3,720,000
4,187,000
1,029,000
2,582,000
450,000
11,968,000
NPL%
1.70%
1.31%
10.18%
1.79%
2.81%
2.35%
* Includes accruing loans > 90 days past due.

53 relationships with commitments to lend
of $20 million or more
Maximum individual commitment- $33
million
Maximum commitment land development-
$28 million
Average commercial lending relationship
size is $466,247
Loans and corresponding relationships are
within Fulton’s geographic market area
Summary of Larger Loans

Overview of Third Quarter
Continued core deposit growth
Improved net interest margin
Slightly lower provision
Reduced construction exposure
Lower net charge-offs
Credit deterioration slowed
Stable other income
Expenses flat


2009 Financial Results (Q3 vs. Q2 2009)
Q3 2009
Q2 2009
Net income
23,345,000
$
13,110,000
$
Cost of preferred stock
(5,045,000)
(5,045,000)
Net income available
to common shareholders
18,300,000
$
8,065,000
$
Earnings per share
0.10
$
0.05
$
Return on tangible equity
7.91%
3.83%

Income Statement Summary (Q3 vs. Q2 2009)
Q3 2009
Q2 2009
$
%
(dollars in thousands)
Net Interest Income
132,800
$
127,940
$
4,860
$
4%
Loan Loss Provision
(45,000)
(50,000)
5,000
-10%
Other Income
41,230
45,300
(4,070)
-9%
Securities Gains (Losses)
(50)
80
(130)
-163%
Other Expenses
(99,810)
(107,810)
8,000
-7%
Pre-Tax Income
29,170
15,510
13,660
88%
Income Taxes
(5,820)
(2,400)
(3,420)
143%
Net Income
23,350
$
13,110
$
10,240
$
78%

Pre-Tax Income Summary (Q3 vs. Q2 2009)
Q3 2009
Q2 2009
$
%
(dollars in thousands)
Net Interest Income
132,800
$
127,940
$
4,860
$
4%
Other Income
41,230
45,300
(4,070)
-9%
Other Expenses
(99,810)
(100,080)
270
0%
Pre-Tax Income Before
LLP, CC Gain, Sec Gains
(Losses), Special FDIC
74,220
73,160
1,060
1%
Loan Loss Provision
(45,000)
(50,000)
5,000
-10%
Securities Gains (Losses)
(50)
80
(130)
-163%
Special FDIC Assessment
-
(7,730)
7,730
-100%
Pre-Tax Income
29,170
$
15,510
$
13,660
88%

2009 Financial Results (YTD September)
2009
2008
Net income
49,540,000
$
96,250,000
$
Cost of preferred stock
(15,120,000)
-
Net income available
to common shareholders
34,420,000
$
96,250,000
$
Earnings per share
0.20
$
0.55
$
Return on tangible equity
5.24%
14.00%

Income Statement Summary (YTD September)
2009
2008
$
%
(dollars in thousands)
Net Interest Income
384,860
$
391,810
$
(6,950)
$
-2%
Loan Loss Provision
(145,000)
(54,630)
(90,370)
165%
Other Income
130,520
116,640
13,880
12%
Credit Card Sale Gain
-
13,910
(13,910)
nm
Securities Gains (Losses)
2,950
(29,900)
32,850
-110%
Other Expenses
(313,990)
(305,750)
(8,240)
3%
Pre-Tax Income
59,340
132,080
(72,740)
-55%
Income Taxes
(9,800)
(35,830)
26,030
-73%
Net Income
49,540
$
96,250
$
(46,710)
$
-49%

Pre-Tax Income Summary (YTD September)
2009
2008
$
%
(dollars in thousands)
Net Interest Income
384,860
$
391,810
$
(6,950)
$
-2%
Other Income
130,520
116,440
14,080
12%
Other Expenses
(300,023)
(289,690)
(10,333)
4%
Pre-Tax Income Before
LLP, CC Gain, Sec Gains
(Losses), FDIC and ARC
215,357
218,560
(3,203)
-1%
Loan Loss Provision
(145,000)
(54,630)
(90,370)
165%
Credit Card Sale Gain
-
13,910
(13,910)
nm
Securities Gains (Losses)
2,950
(29,900)
32,850
-110%
Special FDIC Assessment
(7,730)
-
(7,730)
nm
ARC Losses
(6,237)
(15,860)
9,623
-61%
Pre-Tax Income
59,340
$
132,080
$
(72,740)
-55%

International Bancshares Corporation
Old National Bancorp
South Financial Group, Inc.
Susquehanna Bancshares, Inc.
TCF Financial Corporation
Trustmark Corporation
UMB Financial Corporation
United Bankshares, Inc.
Valley National Bancorp
Whitney Holding Corporation
Wilmington Trust Corporation
*Fulton’s peer group as of September 30, 2009
Associated Banc-Corp
BancorpSouth, Inc.
Bank of Hawaii Corporation
BOK Financial Corporation
Citizens Republic Bancorp
City National Corporation
Commerce Bancshares, Inc.
Cullen/Frost Bankers, Inc.
First Citizens BancShares, Inc.
First Midwest Bancorp, Inc.
First Merit Corporation
Peer Group*


Average Loans (Q3 vs. Q2 2009)
Q3 2009
Q2 2009
$
%
(dollars in millions)
Commercial
3,670
$
3,660
$
10
$
0%
Comm'l Mort
4,160
4,090
70
2%
Resid Mort
930
940
(10)
-1%
Home Equity
1,650
1,670
(20)
-1%
Construction
1,050
1,150
(100)
-9%
Cons./Other
450
450
-
0%
Total Loans
11,910
$
11,960
$
(50)
0%

Ending Loans (Q3 vs. Q2 2009)
Q3 2009
Q2 2009
$
%
(dollars in millions)
Commercial
3,720
$
3,610
$
110
$
3%
Comm'l Mort
4,190
4,120
70
2%
Resid Mort
930
930
-
0%
Home Equity
1,650
1,650
-
0%
Construction
1,030
1,100
(70)
-6%
Cons./Other
450
460
(10)
-2%
Total Loans
11,970
$
11,870
$
100
1%

Average Loans (YTD September)
2009
2008
$
%
(dollars in millions)
Commercial
3,660
$
3,500
$
160
$
5%
Comm'l Mort
4,100
3,670
430
12%
Resid Mort
940
900
40
4%
Home Equity
1,670
1,570
100
6%
Construction
1,140
1,330
(190)
-14%
Cons./Other
460
500
(40)
-8%
Total Loans
11,970
$
11,470
$
500
4%

Average Deposits (Q3 vs. Q2 2009)
Q3 2009
Q2 2009
$
%
(dollars in millions)
Nonint DDA
1,920
$
1,810
$
110
$
6%
Int DDA
1,880
1,820
60
3%
Savings/MMDA
2,560
2,310
250
11%
CD's
5,560
5,630
(70)
-1%
Cash Management
510
550
(40)
-7%
Total Deposits
12,430
$
12,120
$
310
3%

Average Deposits (YTD September)
2009
2008
$
%
(dollars in millions)
Nonint DDA
1,800
$
1,650
$
150
$
9%
Int DDA
1,820
1,710
110
6%
Savings/MMDA
2,310
2,180
130
6%
CD's
5,540
4,390
1,150
26%
Cash Management
550
700
(150)
-21%
Total Deposits
12,020
$
10,630
$
1,390
13%

Other Borrowings (YTD September)
2009
2008
$
%
(dollars in millions)
Federal Funds
570
$
1,300
$
(730)
$
-56%
FHLB Advances
1,370
1,450
(80)
-6%
Other LT Debt
380
380
-
0%
Other ST Borrowings
70
370
(300)
-81%
Total Borrowings
2,390
$
3,500
$
(1,110)
$
-32%
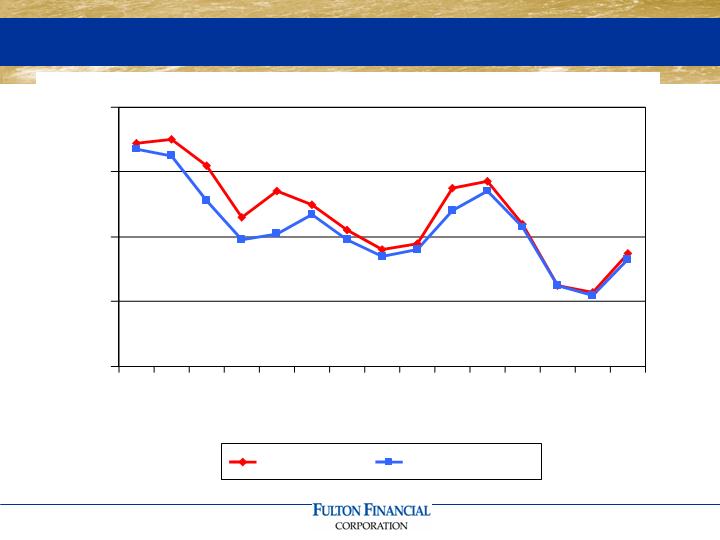
Net Interest Margin Trend
3.70
3.62
3.56
3.58
3.77
3.64
3.45
3.43
3.55
3.67
3.59
3.54
3.56
3.68
3.74
3.63
3.45
3.42
3.53
3.75
3.20
3.40
3.60
3.80
4.00
Q1
06
Q2
06
Q3
06
Q4
06
Q1
07
Q2
07
Q3
07
Q4
07
Q1
08
Q2
08
Q3
08
Q4
08
Q1
09
Q2
09
Q3
09
Reported
Normalized

Other Income (Q3 vs. Q2 2009)
Q3 2009
Q2 2009
$
%
(dollars in thousands)
Overdraft & NSF Fees
9,340
$
8,790
$
550
$
6%
Invt Mgt & Trust
8,190
7,880
310
4%
Service Charges
3,340
3,180
160
5%
Success Card Fees
2,870
2,750
120
4%
Mort. Sales Gains
2,780
7,400
(4,620)
-62%
Cash Mgt Fees
2,650
3,090
(440)
-14%
Merchant Fees
2,150
1,870
280
15%
Foreign Currency
1,940
1,790
150
8%
Letters of Credit
1,740
1,820
(80)
-4%
Credit Card Fees
1,520
1,360
160
12%
Life Insurance (COLI)
710
1,090
(380)
-35%
ATM Fees
630
680
(50)
-7%
Other
3,370
3,600
(230)
-6%
Total
41,230
$
45,300
$
(4,070)
$
-9%

Other Income (YTD September)
2009
2008
$
%
(dollars in thousands)
Overdraft & NSF Fees
26,570
$
25,790
$
780
$
3%
Invt Mgt & Trust
23,970
25,190
(1,220)
-5%
Mort. Sales Gains
18,760
7,250
11,510
159%
Service Charges
9,760
9,740
20
0%
Cash Mgt Fees
8,940
9,930
(990)
-10%
Success Card Fees
8,060
7,340
720
10%
Merchant Fees
5,650
5,860
(210)
-4%
Foreign Currency
5,120
5,360
(240)
-4%
Letters of Credit
5,090
4,360
730
17%
Credit Card Fees
4,070
2,440
1,630
67%
Life Insurance (COLI)
2,700
2,420
280
12%
ATM Fees
1,940
2,130
(190)
-9%
Other
9,890
8,830
1,060
12%
Total
130,520
$
116,640
$
13,880
$
12%

Efficiency Ratio
58.8
61.4
61.6
50.0
52.0
54.0
56.0
58.0
60.0
62.0
64.0
93
94
95
96
97
98
99
00
01
02
03
04
05
06
07
08
YTD
6/09
YTD
6/09
FFC
Peer
Top 50

Other Expense (Q3 vs. Q2 2009)
Q3 2009
Q2 2009
$
%
(dollars in thousands)
Salaries & Benefits
54,090
$
55,800
$
(1,710)
$
-3%
Occupancy & Equip.
13,450
13,540
(90)
-1%
FDIC Insurance
5,240
12,210
(6,970)
-57%
Data Proc. & Software
4,740
4,610
130
3%
Supplies & Postage
2,820
2,700
120
4%
Legal & Audit
2,390
2,090
300
14%
Telecommunications
2,140
2,180
(40)
-2%
Marketing
1,980
1,720
260
15%
Outside Services
1,880
1,830
50
3%
Amortization
1,430
1,430
-
0%
Travel & Entertain.
1,220
1,360
(140)
-10%
OREO Expenses
1,090
1,870
(780)
-42%
State Tax
610
1,050
(440)
-42%
Operating Risk Loss
340
140
200
143%
Other Expenses
6,390
5,280
1,110
21%
Total
99,810
$
107,810
$
(8,000)
$
-7%

Other Expense (YTD September)
2009
2008
$
%
(dollars in thousands)
Salaries & Benefits
165,190
$
164,790
$
400
$
0%
Occupancy & Equip.
41,090
40,910
180
0%
FDIC Insurance
21,740
2,680
19,060
nm
Data Proc. & Software
13,970
13,810
160
1%
Supplies & Postage
8,190
8,520
(330)
-4%
Legal & Audit
6,700
5,720
980
17%
Operating Risk Loss
6,680
19,110
(12,430)
-65%
Telecommunications
6,480
5,960
520
9%
Marketing
6,280
9,520
(3,240)
-34%
Outside Services
5,470
5,870
(400)
-7%
Amortization
4,330
5,390
(1,060)
-20%
OREO Expenses
4,280
3,140
1,140
36%
Travel & Entertain.
4,030
4,620
(590)
-13%
State Tax
2,470
2,050
420
20%
Other Expenses
17,090
13,660
3,430
25%
Total
313,990
$
305,750
$
8,240
$
3%

Allowance for Credit Losses
Q3 2009
Q2 2009
(dollars in thousands)
Balance at beginning of period
220,950
$
200,060
$
Loan Loss Provision
45,000
50,000
Net Charge-Offs
(24,230)
(29,110)
Balance at end of period
241,720
$
220,950
$
Allowance to Loans
2.02%
1.86%
Nonperforming Assets to Assets
1.82%
1.73%
Net Charge-offs to Loans
0.81%
0.97%

Allowance for Credit Losses (YTD Sept.)
2009
2008
(dollars in thousands)
Balance at beginning of year
180,140
$
112,210
$
Loan Loss Provision
145,000
54,630
Net Charge-Offs
(83,420)
(25,010)
Balance at September 30th
241,720
$
141,830
$
Allowance to Loans
2.02%
1.20%
Nonperforming Assets to Assets
1.82%
1.15%
Net Charge-offs to Loans
0.93%
0.29%

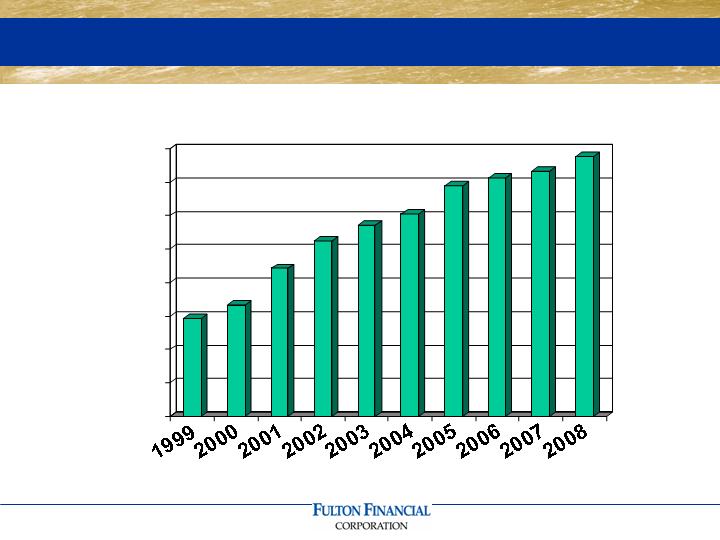
Net Charge-Offs To Average Loans
0.93
1.10
1.67
0.00
0.30
0.60
0.90
1.20
1.50
1.80
91
92
93
94
95
96
97
98
99
00
01
02
03
04
05
06
07
08
YTD
6/09
YTD
9/09
FFC
Peer
Top 50

Investment Portfolio (September 30, 2009)
ENDING
MODIFIED
BALANCE
DURATION
(in millions)
Agency mortgage-backed securities
1,112.0
$
3.40
Agency collateralized mortgage obligations
975.4
2.83
Municipal bonds
415.8
4.44
Auction rate securities
292.3
4.02
Corporate & trust preferred securities
155.3
10.36
U.S. Treasuries and agencies
138.9
3.32
FHLB & FRB stock
85.7
NA
Bank stocks
36.2
NA
Other investments
26.2
NA
Net unrealized gain / (loss)
36.6
Total Investments
3,274.4
$
3.77

Available Funds
Securities Availabile as Collateral:
09/30/09
Total Unpledged Securities
$694,042,360
Less: Corporate / Trups / ARCs
(200,378,078)
Less: SBA / Other
(2,735,978)
Less: Securities included in FHLB MBC
(177,479,610)
Plus: Excess Securities pledged in pools
333,789,350
Total Available for Pledging
647,238,044
Less: Estimated 15% Haircut
(97,085,707)
Total Available for Collateral
$550,152,337
FHLB and Discount Window Borrowing Capacity:
FHLB Borrowing Capacity
1,174,977,911
FRB Discount Window - Securities (net)
19,830,017
FRB Discount Window - Loans (net)
1,736,764,703
Plus: Corporate / Trups pledgeable to FRB
200,378,078
Less: Haircut on securities
(40,075,616)
Less: Outstanding Discount Window Loans
-
Total Borrowing Capacity
$3,091,875,093
Total Available Collateral and Borrowing Capacity
$3,642,027,431
Federal Funds Purchased
$205,000,000
Federal Funds Line Limits
$2,385,000,000

Status of the Corporation
Strong capital position
Focus on profitable organic growth
Positioned for economic rebound
Current loan loss reserve levels believed
to be adequate
Proactive management of problem credits
Valuable 5-state franchise / strong in-state
markets
Disciplined expense control

