
Investor Presentation
Data as of March 31, 2013
(unless otherwise noted)
Ticker Symbol: FULT (NASDAQ)

§ This presentation may contain forward-looking statements with respect to Fulton Financial
Corporation’s financial condition, results of operations and business. Do not unduly rely on
forward-looking statements. Forward-looking statements can be identified by the use of
words such as “may,” “should,” “will,” “could,” “estimates,” “predicts,” “potential,” “continue,”
“anticipates,” “believes,” “plans,” “expects,” “future,” “intends” and similar expressions which
are intended to identify forward-looking statements.
§ Forward-looking statements are not guarantees of future performance and are subject to risks
and uncertainties, some of which are beyond the Corporation’s control and ability to predict,
that could cause actual results to differ materially from those expressed in the forward-looking
statements. The Corporation undertakes no obligation, other than as required by law, to
update or revise any forward-looking statements, whether as a result of new information,
future events or otherwise.
§ In our quarterly earnings releases and other material news releases which are available on
our website at www.fult.com, we include our safe harbor statement on forward-looking
statements; we refer you to that portion of those news releases and the safe harbor
statement is incorporated into this presentation.
our website at www.fult.com, we include our safe harbor statement on forward-looking
statements; we refer you to that portion of those news releases and the safe harbor
statement is incorporated into this presentation.
§ For a more complete discussion of certain risks and uncertainties affecting Fulton, please see
the sections entitled “Risk Factors” and “Management’s Discussion and Analysis of Financial
Condition and Results of Operations” set forth in Fulton’s filings with the Securities and
Exchange Commission.
the sections entitled “Risk Factors” and “Management’s Discussion and Analysis of Financial
Condition and Results of Operations” set forth in Fulton’s filings with the Securities and
Exchange Commission.
Forward-Looking Statements
2

About Us
§ Mid-Atlantic financial holding company
§ 6 community banks / 5 states
§ Fulton Financial Advisors
§ Fulton Mortgage Company
§ 270 community banking offices
§ Asset size as of March 31, 2013: $16.7 billion
§ 3,800 team members as of March 31, 2013 (3,580 FTEs)
§ Shares outstanding as of March 31, 2013: 195.3 million
§ Market capitalization as of March 31, 2013: $ 2.3 billion
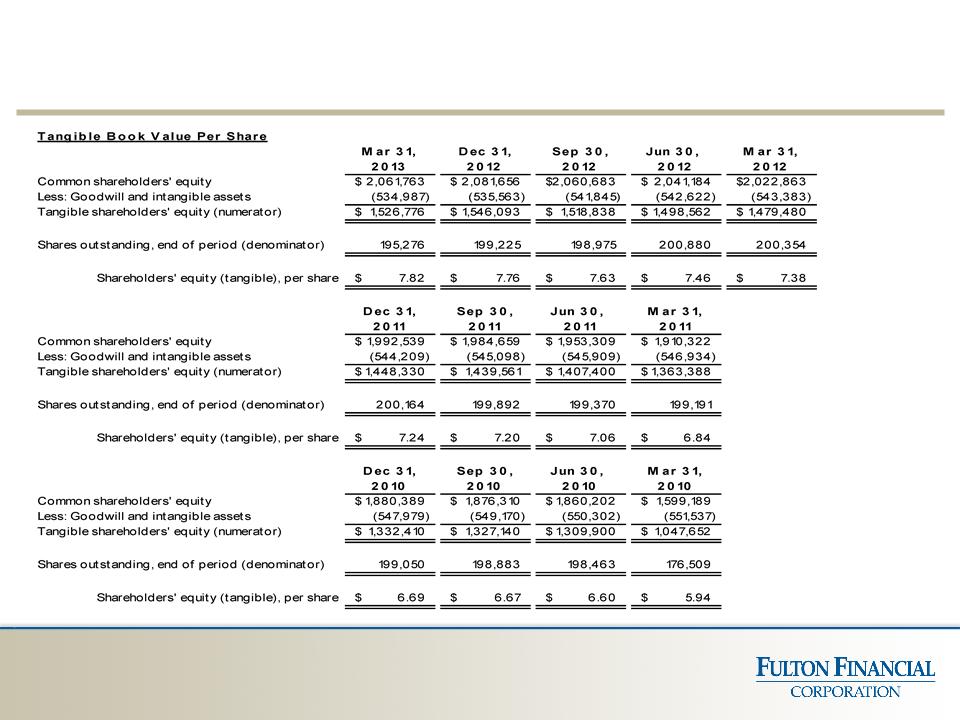
§ Book value per share as of March 31, 2013: $10.56
§ Tangible book value per share as of March 31, 2013(1):
$7.82
$7.82
3
(1) Non-GAAP based financial measure. Please refer to the calculation and management’s reason for using
this measure on the slide titled “Non-GAAP Reconciliation” at the end of this presentation.
this measure on the slide titled “Non-GAAP Reconciliation” at the end of this presentation.
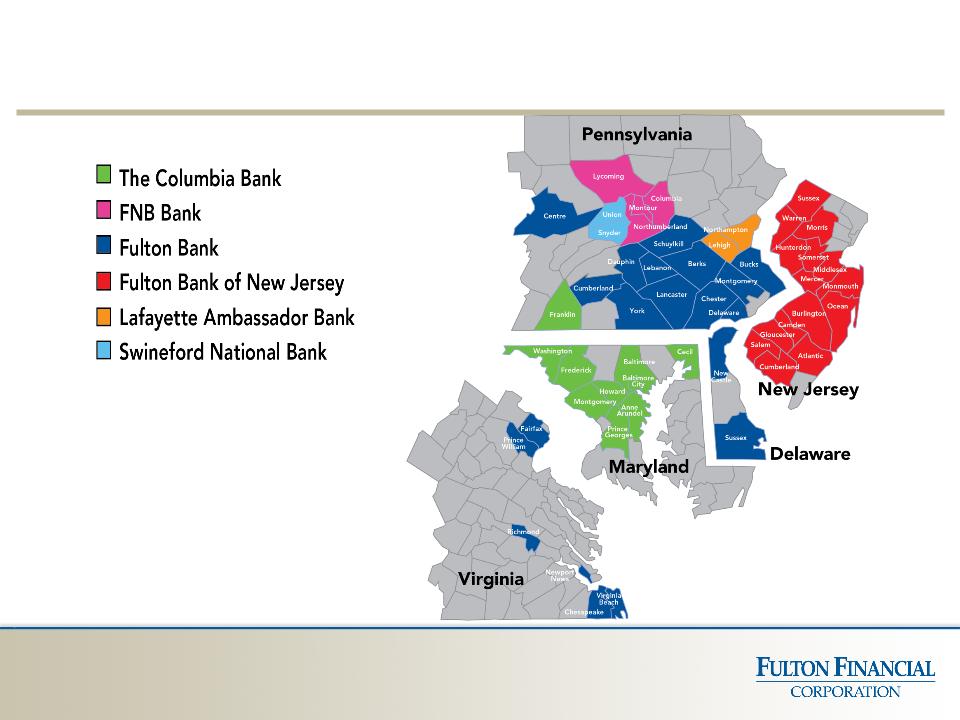
A Valuable Franchise
4

1. Earnings Per Share (EPS) Growth
2. Quality Loan Growth
3. Improve Asset Quality
4. Core Deposit / Household Growth
5. Spread Management / Net Interest Margin
6. Expense Management
7. Increase Return on Average Assets (ROA) &
Return on Average Equity (ROE)
Return on Average Equity (ROE)
Corporate Priorities
5

Priorities: EPS
1. EPS Growth
üQ1 2013 Diluted EPS : 20 cents
Up 5.3% compared to Q1 2012
Flat compared to Q4 2012
6
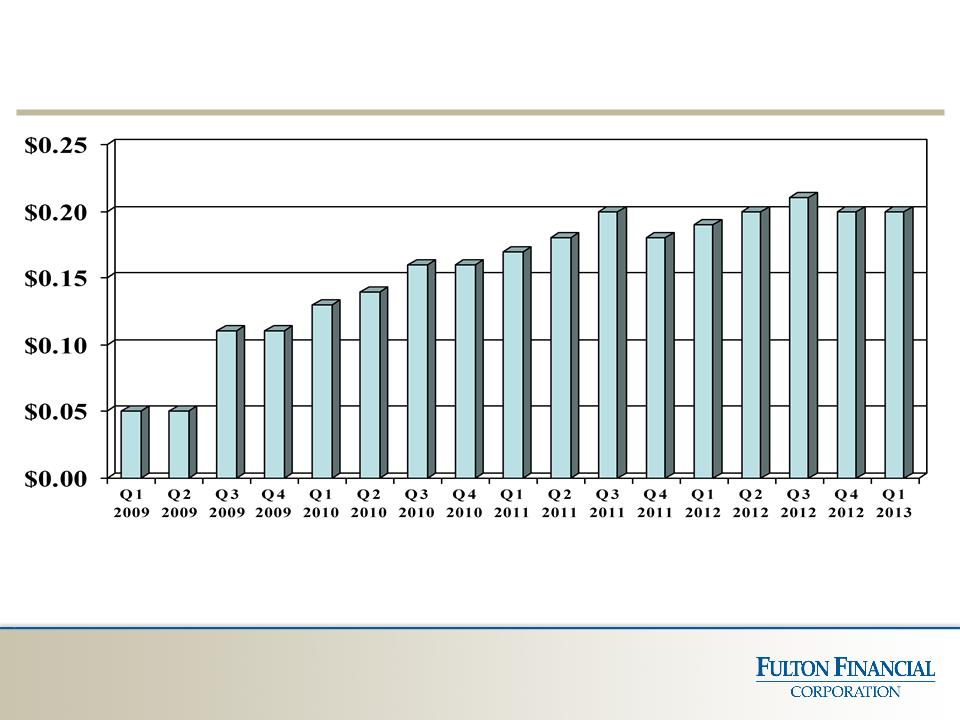
Diluted Earnings Per Share (Quarterly)
7
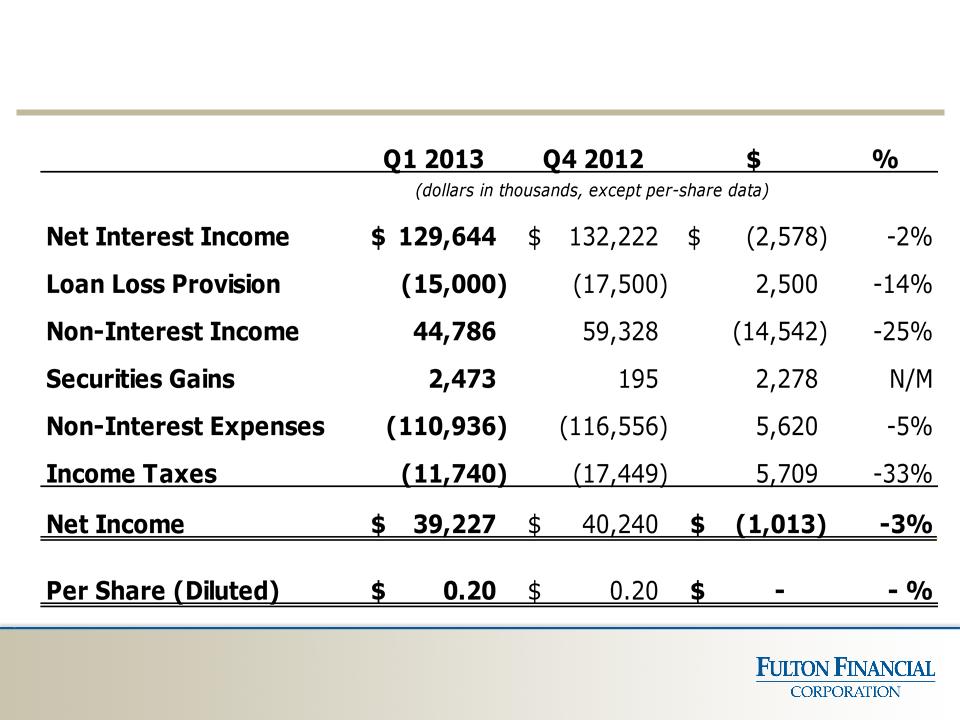
Income Statement Summary
8
N/M- Not meaningful

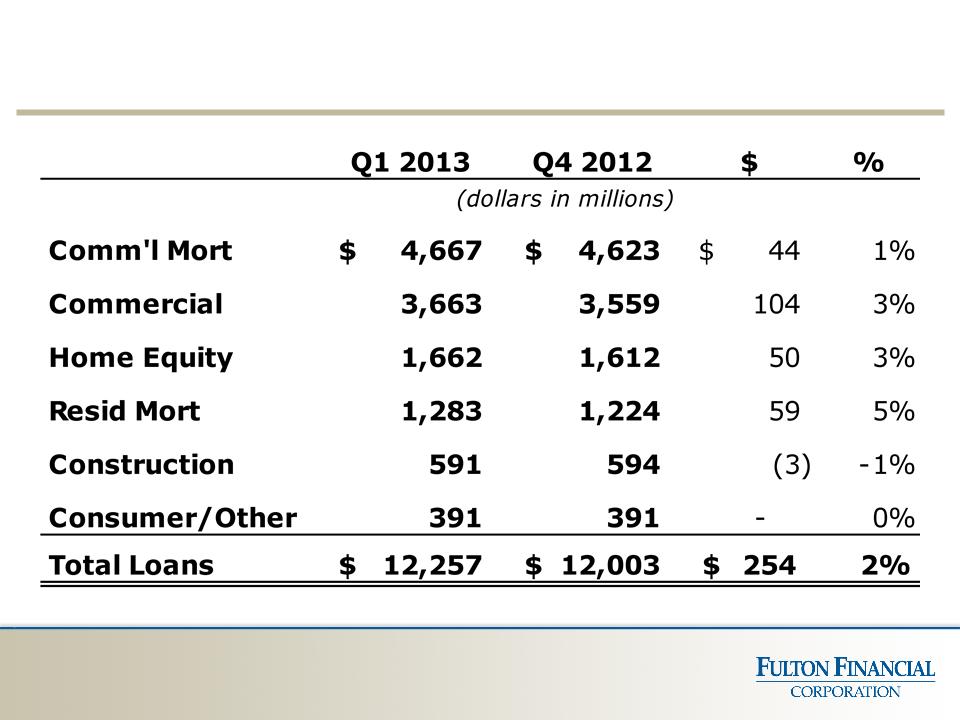
2. Quality Loan Growth
ü Average loans up 2% linked
quarter
quarter
Priorities: Earning Asset Growth
9
Average Loans
10
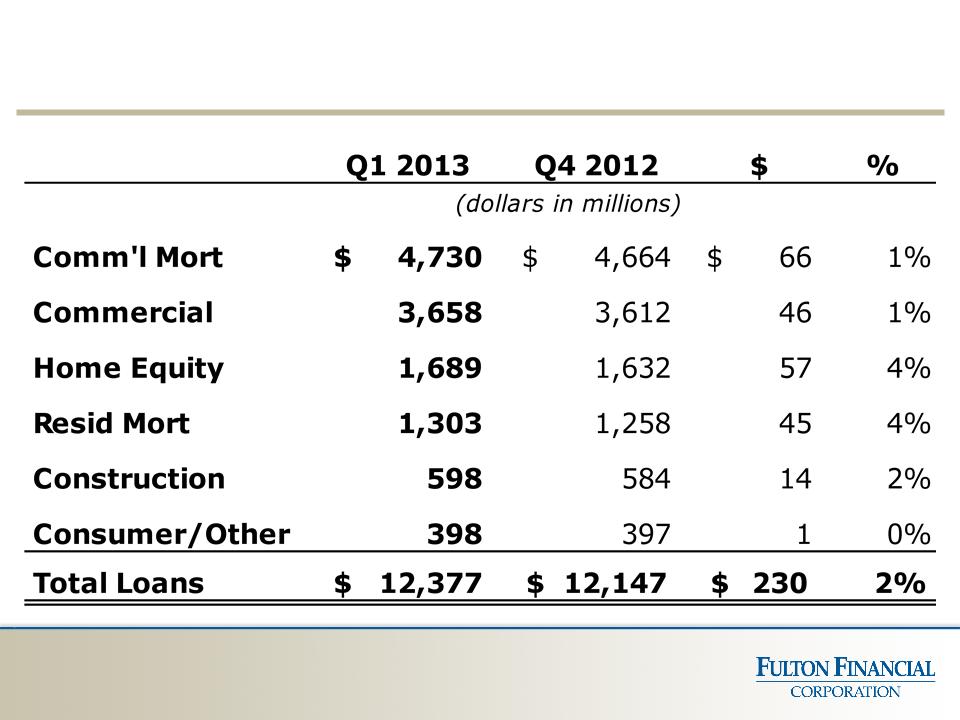
Ending Loans
11

International Bancshares Corp.
People’s United Financial, Inc.
Prosperity Bancshares, Inc.
Susquehanna Bancshares, Inc.
TCF Financial Corporation
UMB Financial Corporation
Umpqua Holdings Corporation
Valley National Bancorp
Webster Financial Corporation
Wintrust Financial Corporation
Associated Banc-Corp
BancorpSouth, Inc.
BOK Financial Corporation
City National Corporation
Commerce Bancshares, Inc.
Cullen/Frost Bankers, Inc.
F.N.B. Corporation
FirstMerit Corporation
Hancock Holding Company
IBERIABANK Corporation
Peer Group*
12
*Fulton’s Peer group as of March 31, 2013
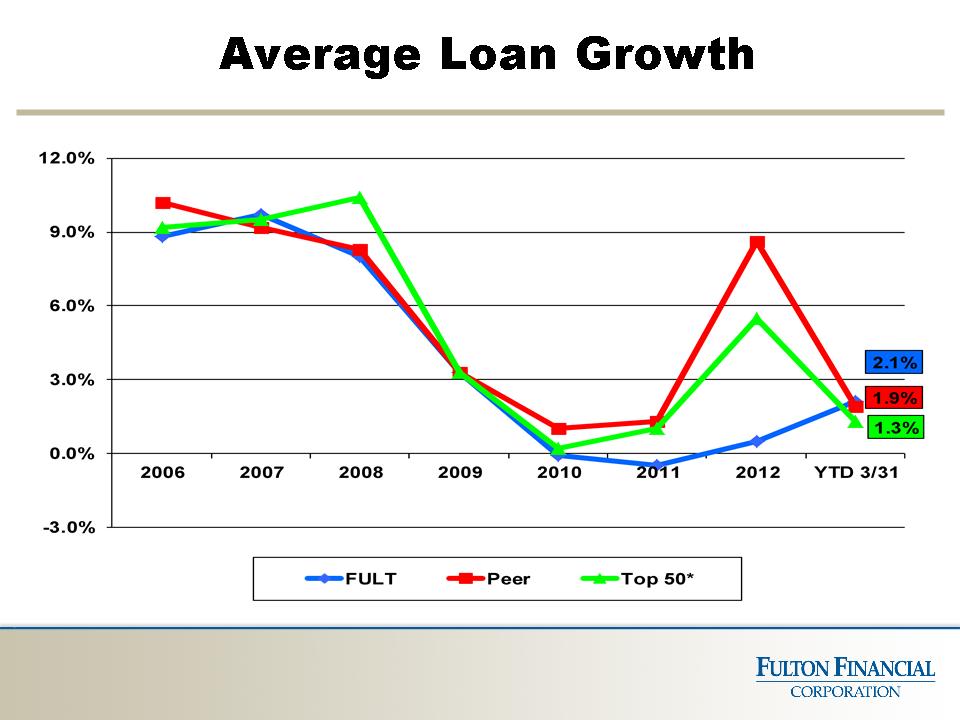
13
Note: 2006 through 2012 represents year-over-year change in average loans. YTD 3/31 represents March 31, 2013 over December 31,
2012 change in average loans.
2012 change in average loans.
*Comprised of the 50 largest publicly traded domestic banks/thrifts in assets size as of December 31,2012. Excludes credit card
companies.
companies.
Source: SNL Financial LC

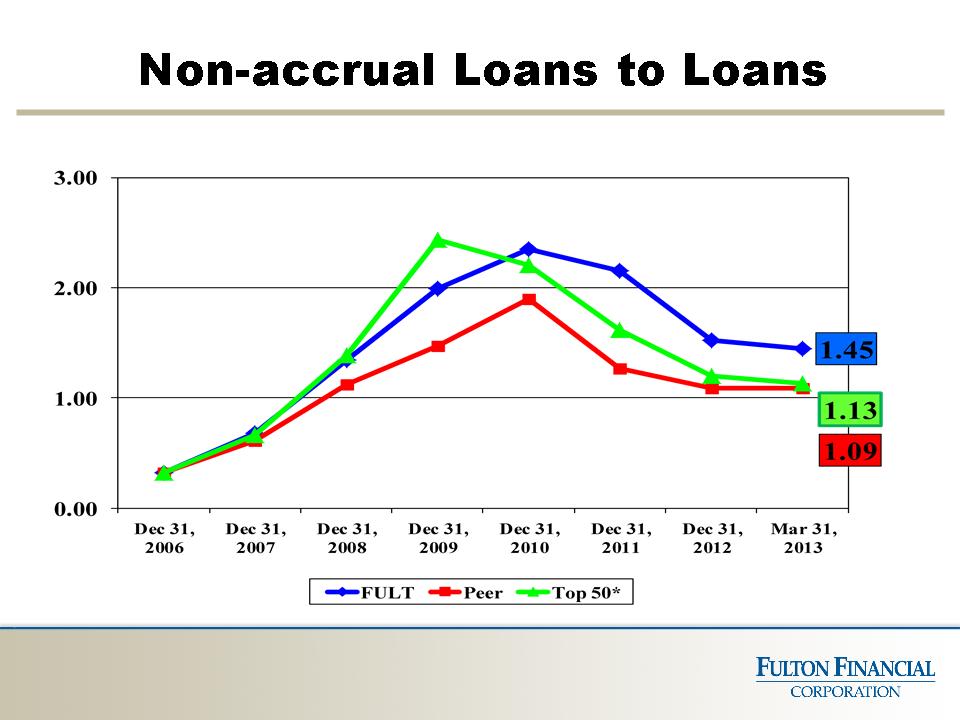
3. Improve Asset Quality
Priorities: Credit Metrics
14
15
* Comprised of the 50 largest publicly traded domestic banks/thrifts in assets size as of December 31,2012.
Excludes credit card companies.
Excludes credit card companies.
Source: SNL Financial LC
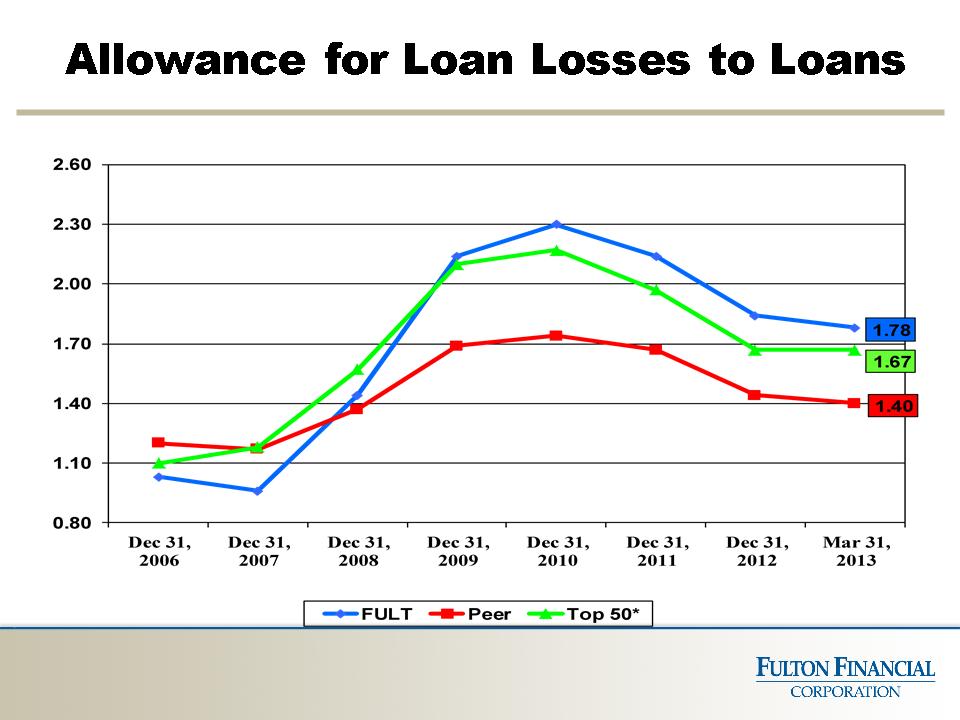
16
* Comprised of the 50 largest publicly traded domestic banks/thrifts in assets size as of December 31,2012.
Excludes credit card companies.
Excludes credit card companies.
Source: SNL Financial LC
Non-performing Loans* (3/31/13)
17
* Includes loans > 90 days past due and accruing and non-accrual loans.
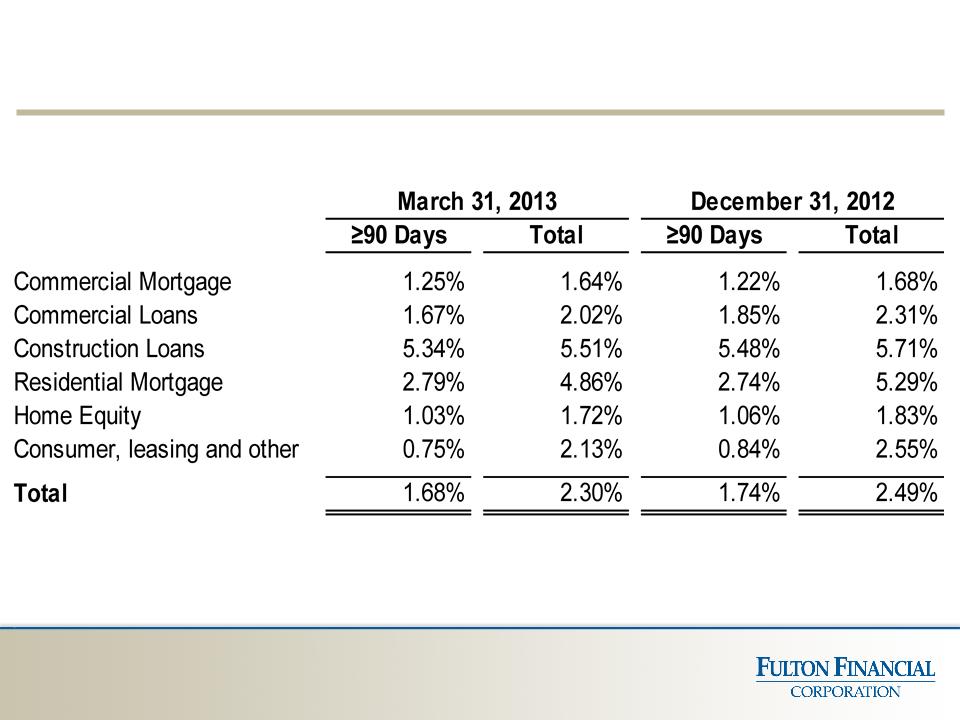
Loan Delinquency
18
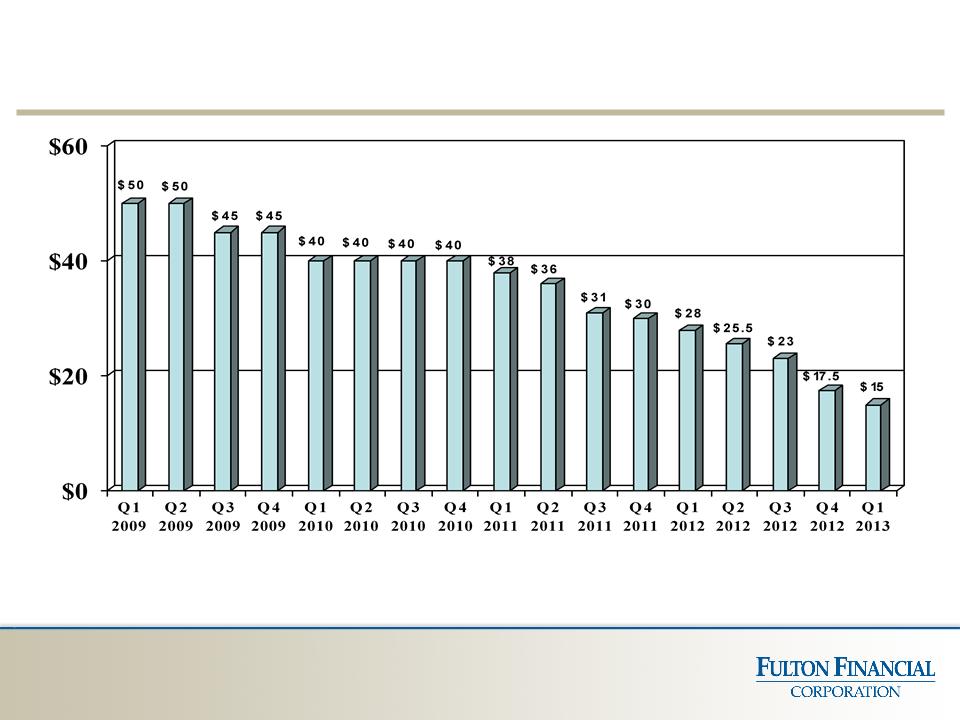
19
Provision for Credit Losses (Quarterly, in Millions of Dollars)

4. Core Deposit / Household
Growth
Growth
2012 Net Account Lift (#): 2.8%
Priorities: Deposits
20
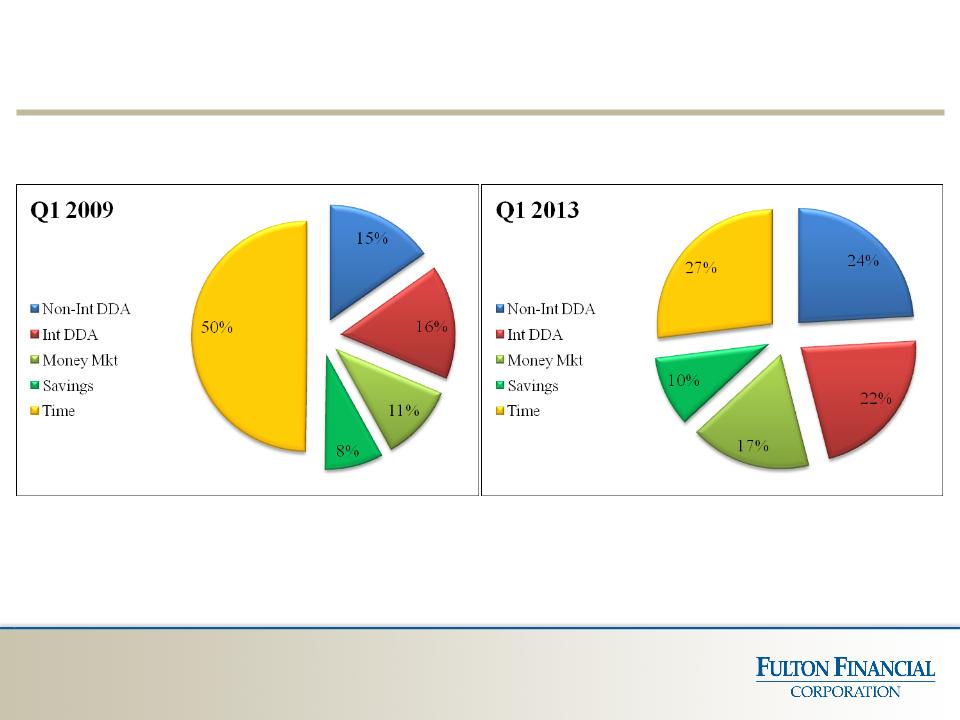
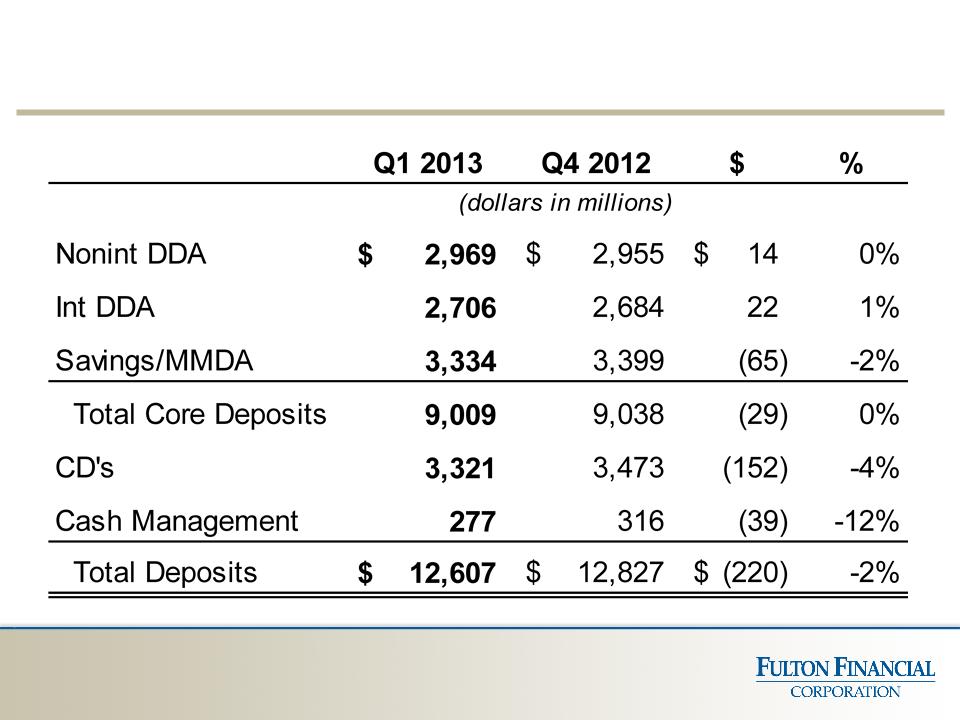
Deposit Composition
21
Note: Deposit composition is based on quarterly average balances for the periods indicated.
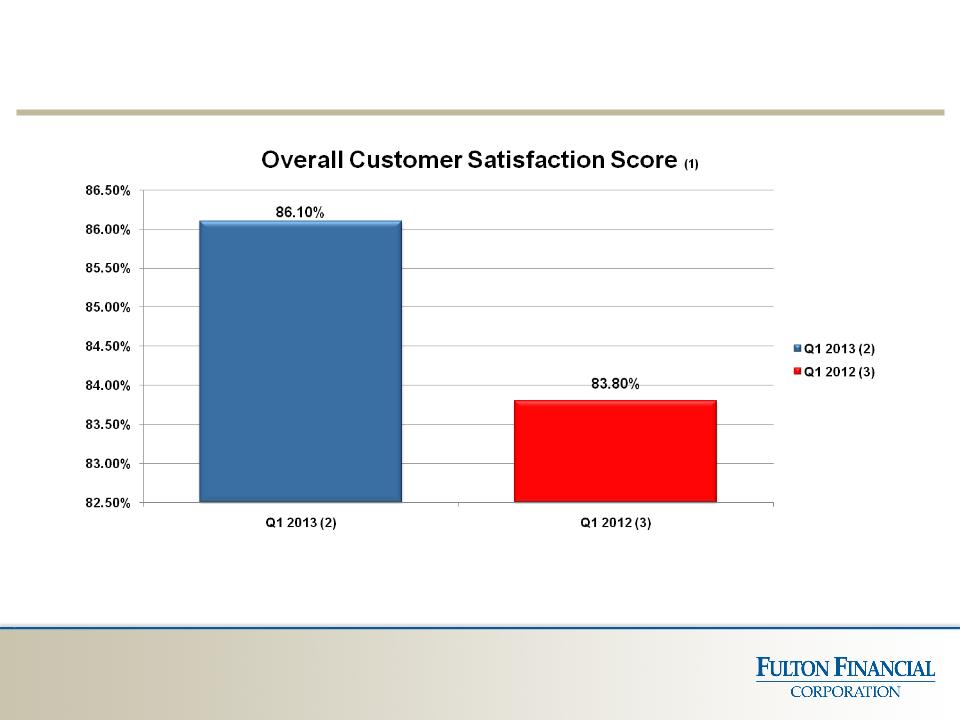
Priorities: Deposits
22
(1) Annual retail customer satisfaction surveys conducted by FFC’s Marketing Research Group. Areas covered: Overall Customer
Satisfaction and likelihood to recommend the bank; Customer experience; Specific issues of problems experience by
customers; Motivating factors to bank with us.
Satisfaction and likelihood to recommend the bank; Customer experience; Specific issues of problems experience by
customers; Motivating factors to bank with us.
(2) Results based on 10,926 completed customer surveys.
(3) Results based on 4,897 completed customer surveys.

5. Spread Management / Net Interest
Margin
Margin
§ Q1 2013 Net Interest Margin (fully-taxable equivalent):
3.55%
3.55%
ü Yield on average interest-earning assets: 4.13%
ü Cost of average interest-bearing liabilities: 0.78%
Priorities: Margin
23
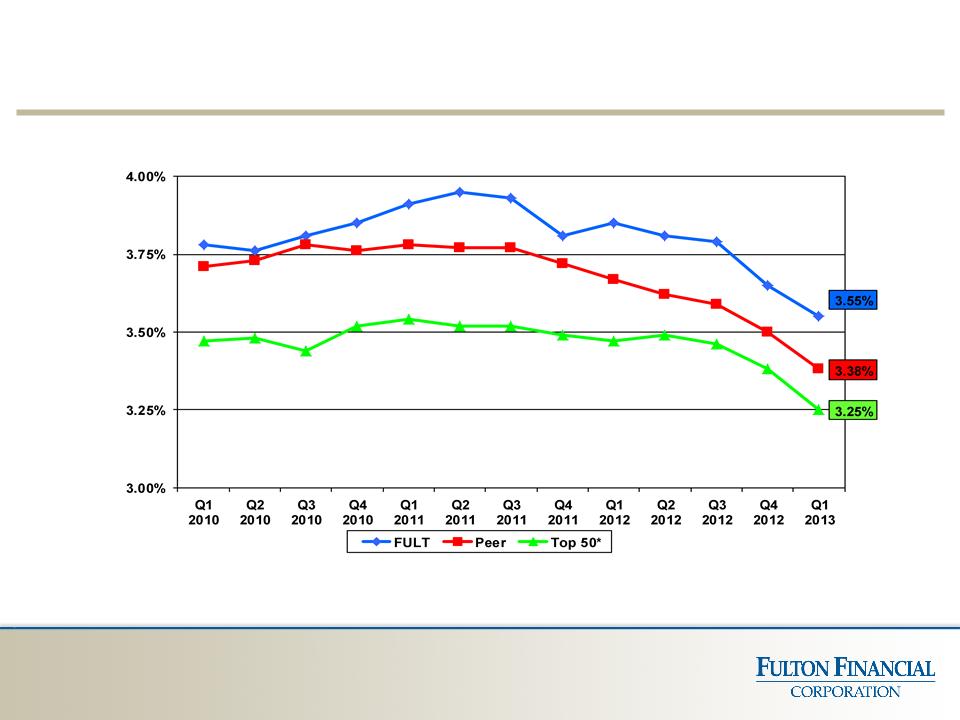
Net Interest Margin (Quarterly)
24
Note: Fully-taxable equivalent
*Comprised of the 50 largest publicly traded domestic banks/thrifts in assets size as of December 31,2012.
Excludes credit card companies.
Excludes credit card companies.
Source: SNL Financial LC

6. Expense Management
Priorities: Efficiency
25
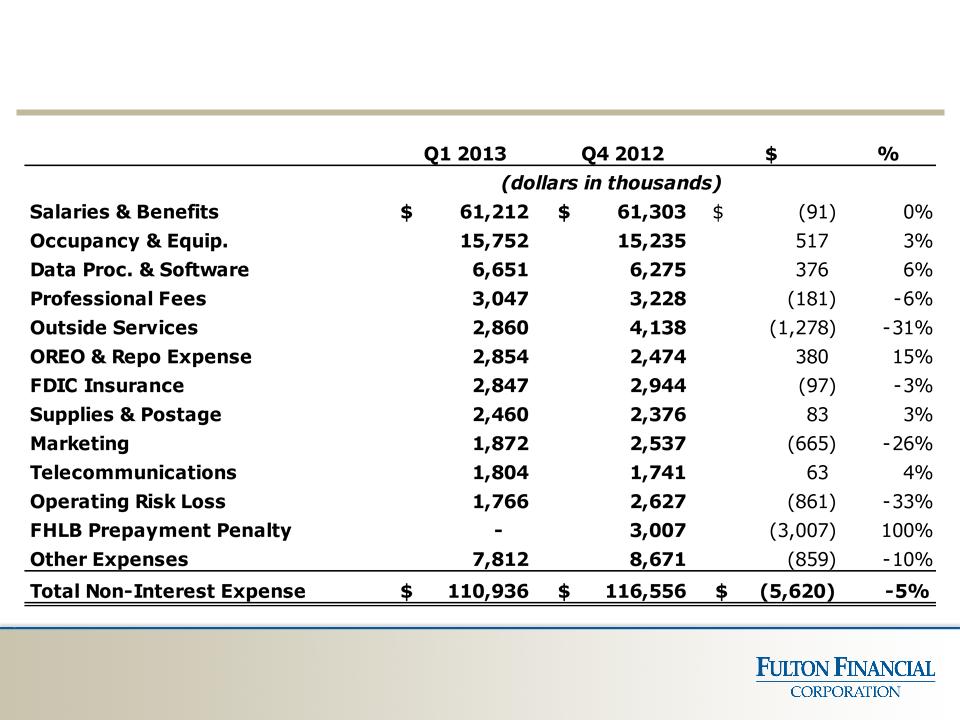
Non-Interest Expenses
26

More Efficient Than Peers (1)
27
(1) Non-GAAP based financial measure. Please refer to the calculation and management’s reasons for using this measure on the slide titled
“Non-GAAP Reconciliation” at the end of this presentation.
“Non-GAAP Reconciliation” at the end of this presentation.
* Comprised of the 50 largest publicly traded domestic banks/thrifts in assets size as of December 31,2012. Excludes credit card
companies.
companies.
Source: SNL Financial LC

ROA
Q1 2013: 0.96%
Q4 2012: 0.99%
Priorities: ROA and ROE
28
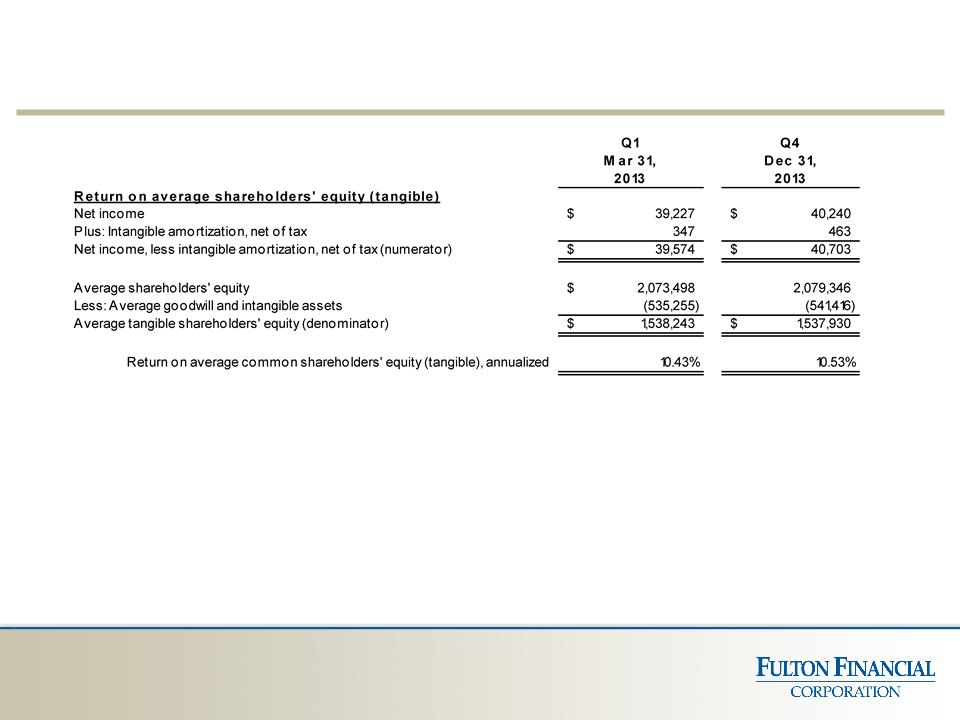
ROE (Tangible) (1)
Q1 2013: 10.43%
Q4 2012: 10.53%
(1) Non-GAAP based financial measure. Please refer to the calculation and management’s reasons for using
this measure on the slide titled “Non-GAAP Reconciliation at the end of this presentation.
this measure on the slide titled “Non-GAAP Reconciliation at the end of this presentation.
7. Increase ROA and ROE
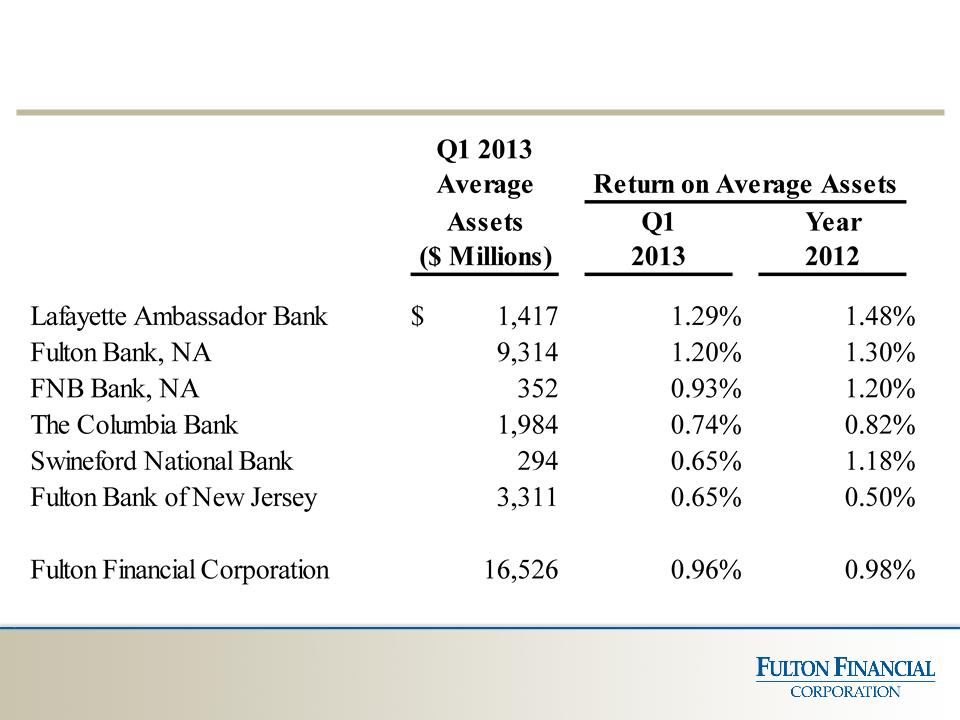
Return on Average Assets
and Average Assets, by Bank
and Average Assets, by Bank
29
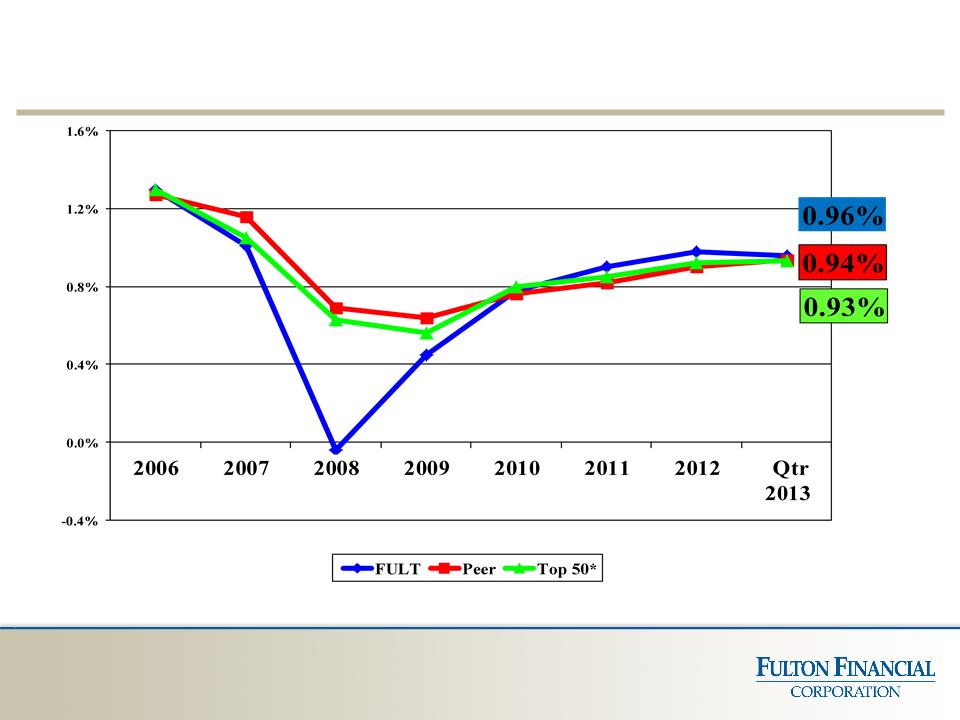
Return on Average Assets (ROA) Growth
30
Note: 2006 through 2012 represents year-over-year ROA growth. YTD 3/31 represents March 31, 2013 over March 31, 2012 ROA growth.
*Comprised of the 50 largest publicly traded domestic banks/thrifts in assets size as of December 31,2012. Excludes credit card companies.
Source: SNL Financial LC
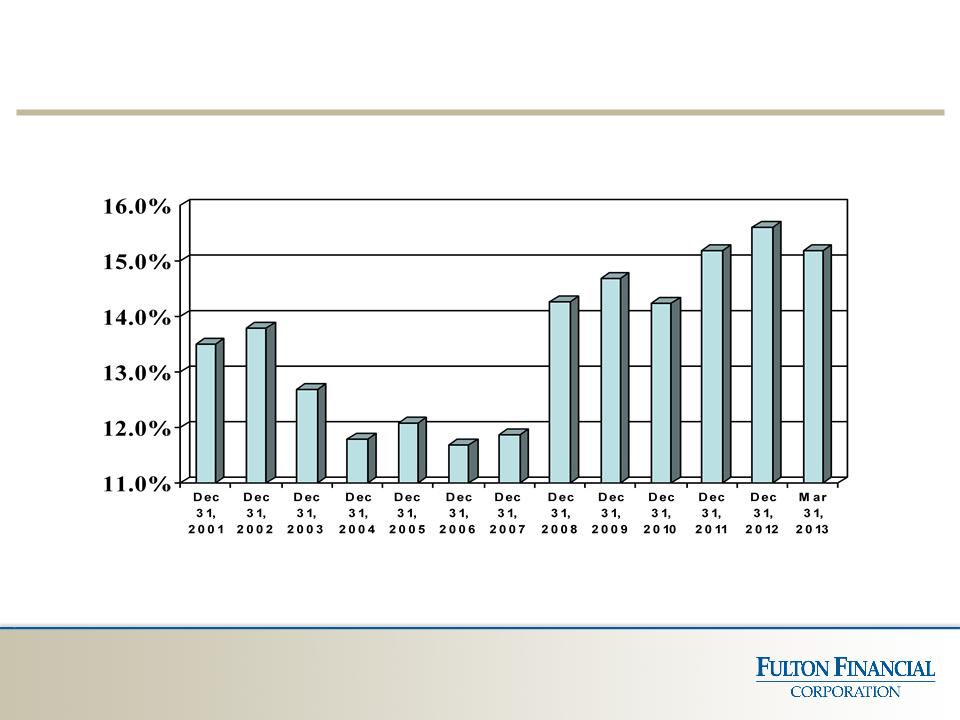
Total Risk-Based Capital Ratio
31
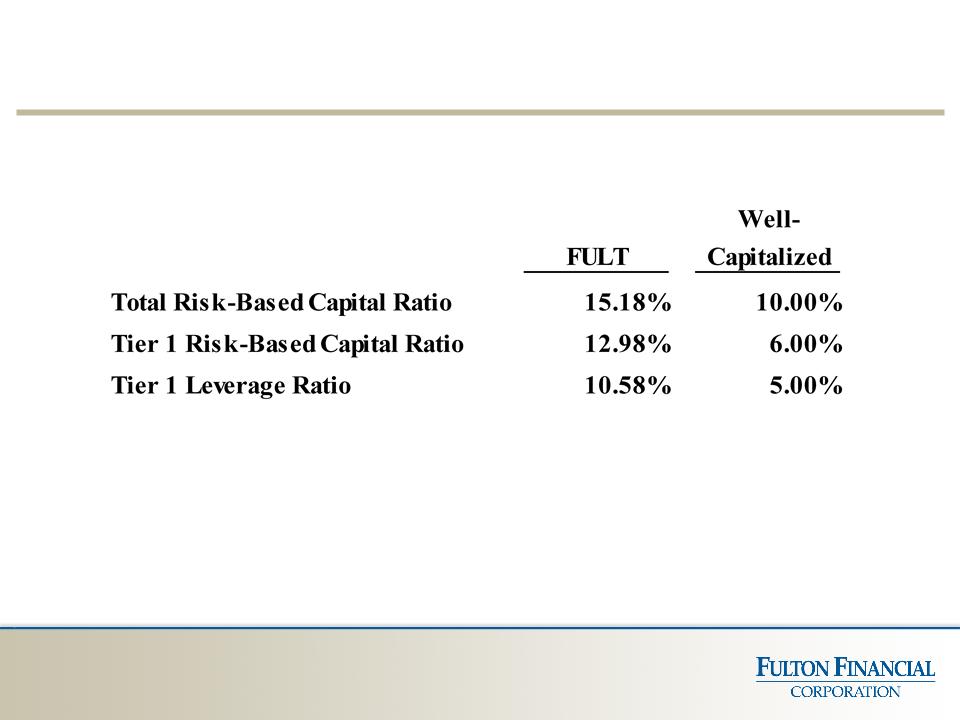
Capital Adequacy (3/31/13)
32
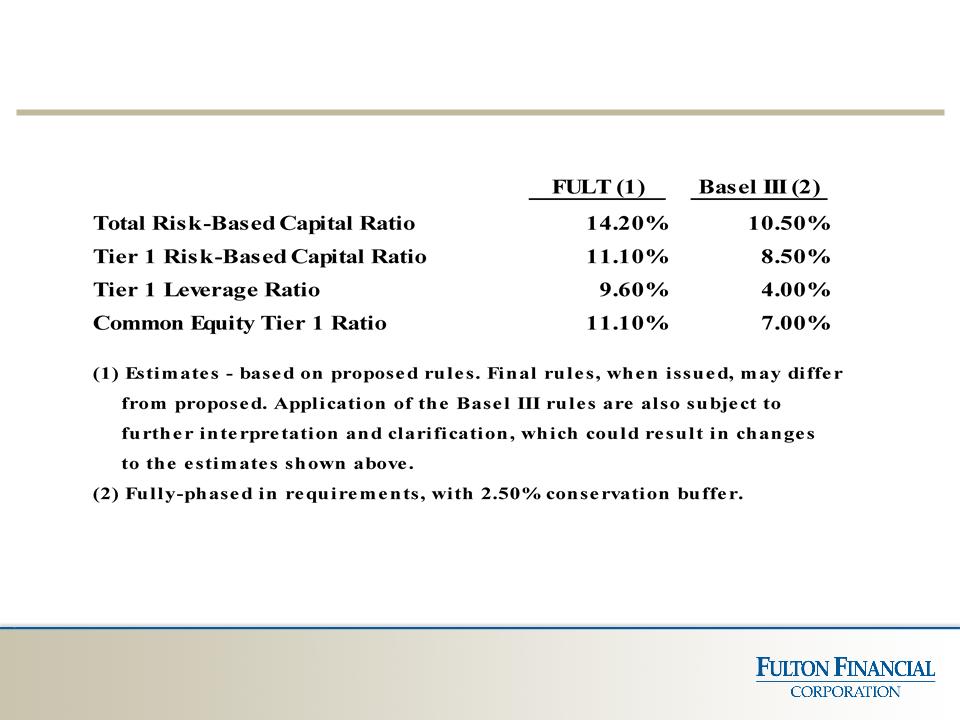
Capital Adequacy vs. Basel III (3/31/13)
33
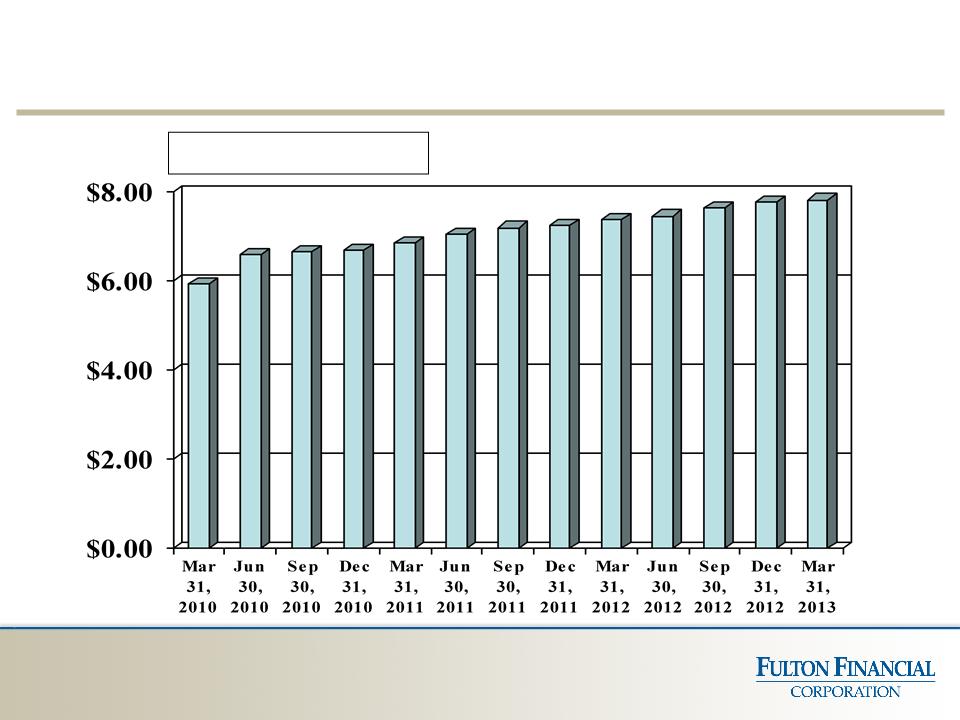
Tangible Book Value Per Share (1)
34
CAGR (2) = 9.6%
(1) Non-GAAP based financial measure. Please refer to the calculation and management’s reasons for using
this measure on the slide titled “Non-GAAP Reconciliation” at the end of this presentation.
this measure on the slide titled “Non-GAAP Reconciliation” at the end of this presentation.
(2) Compounded annual growth rate from March 31, 2010 to March 31, 2013.
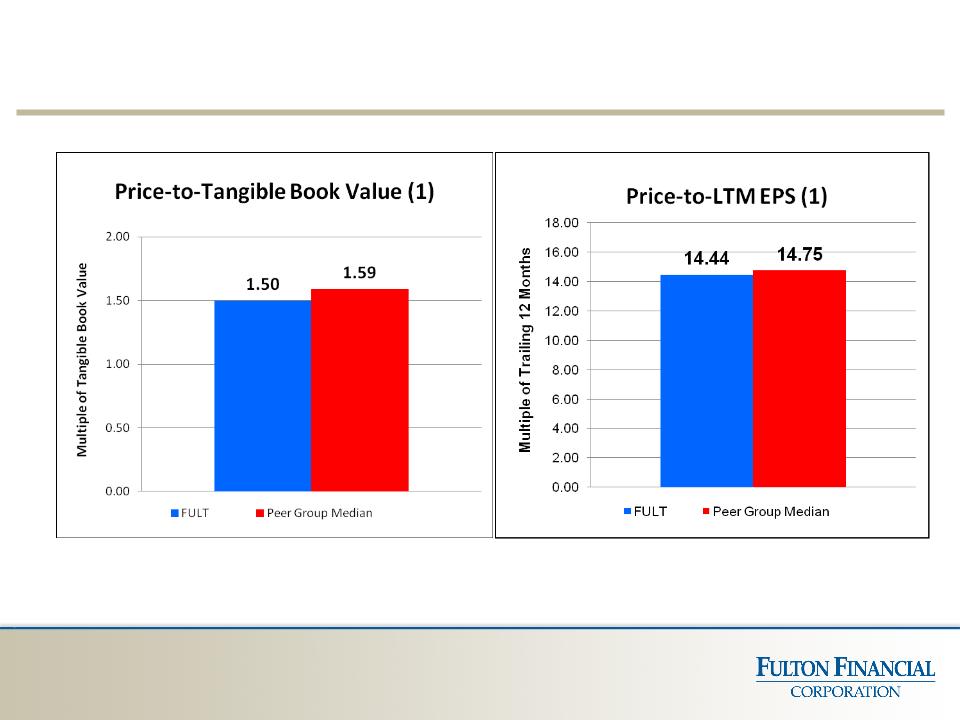
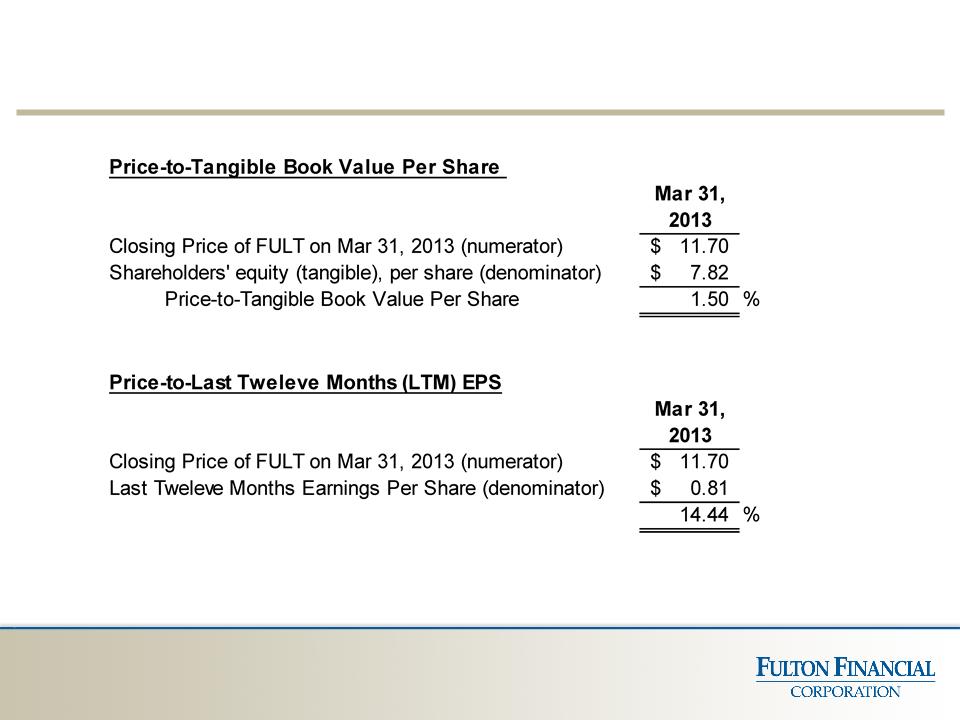
Price Multiple vs. Peer Group
35
Notes: Peer Tangible Book Value and LTM EPS data as of 3/31/2013. Source: SNL Financial LC
FULT Tangible Book Value and LTM EPS data as of 3/31/2013.
(1) Non-GAAP based financial measure. Please refer to the calculation and management’s reasons for using this
measure on the slide titled “Non-GAAP Reconciliation” at the end of this presentation.
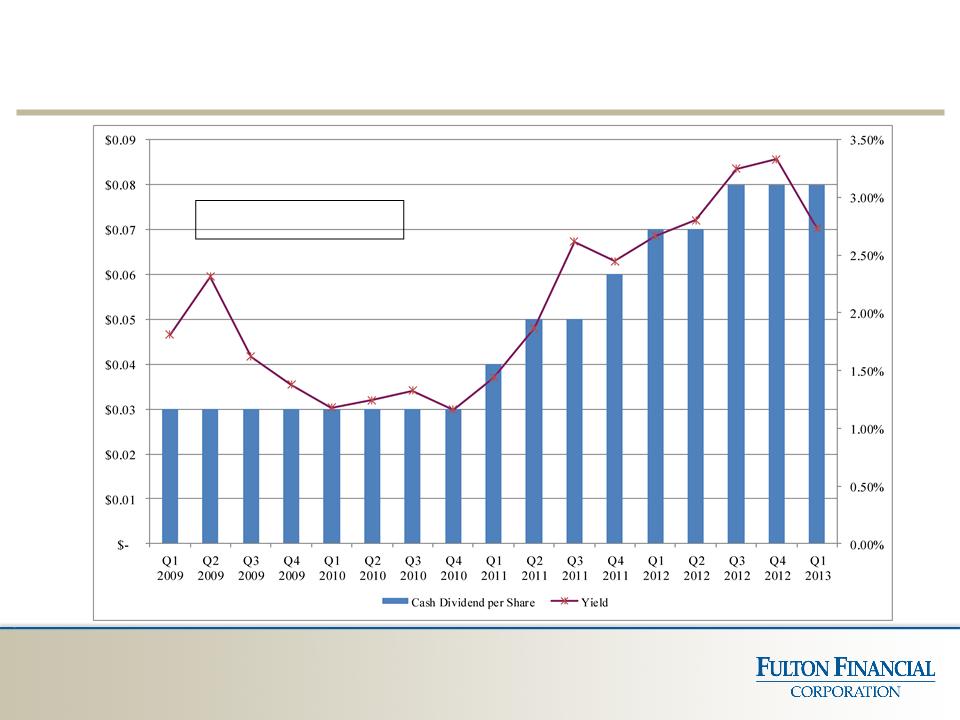
FULT - Cash Dividend and Yield(1)
36
CAGR (2) = 27.8%
(1) Annualized dividend rate per share divided by period-end stock price.
(2) Compounded annual growth rate in cash dividend from March 31, 2009 to March 31, 2013.

§ New program authorized: January, 2013
§ Purchase of up to 8 million shares
through June 30, 2013
through June 30, 2013
§ About 4 % of outstanding shares
§ Shares repurchased through May 13,
2013: 6.0 million
2013: 6.0 million
§ Average purchase price: $ 11.08
Stock Repurchase Program
37

Supplemental Information
Average Deposits
39
40
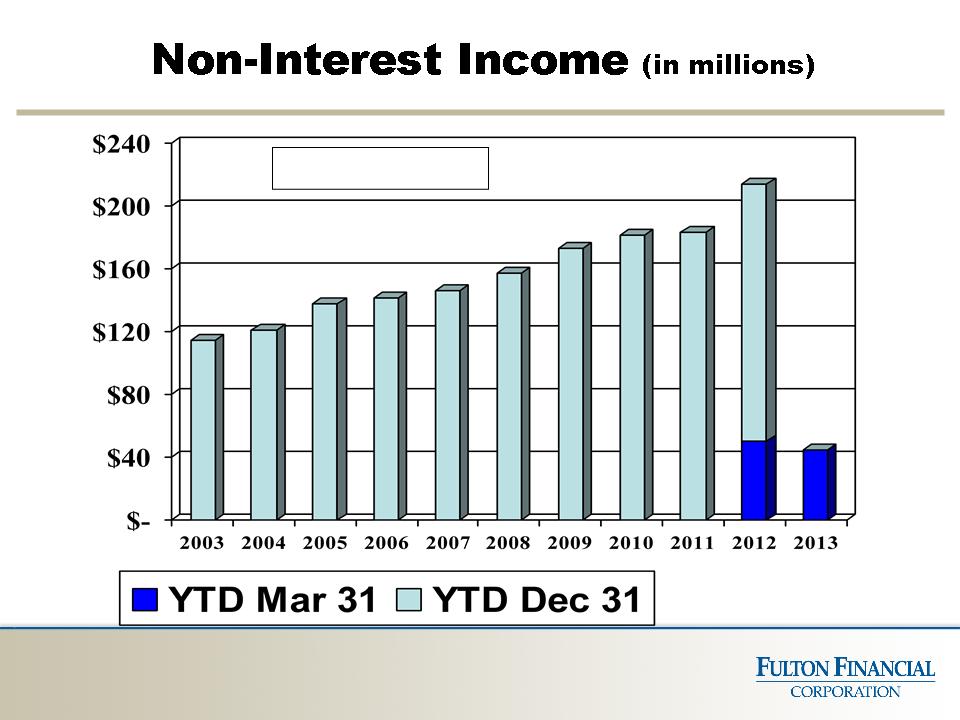
CAGR (1) = 7.2%
(1) Compounded annual growth rate from year-ended December 31, 2003 to year-ended
December 31, 2012.
December 31, 2012.
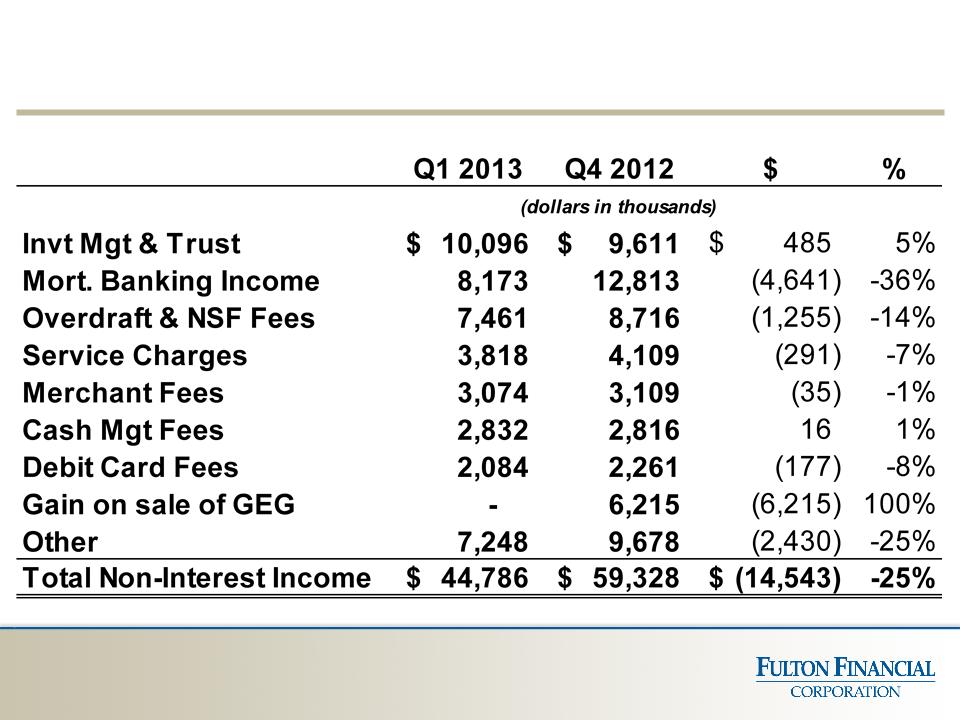
Non-Interest Income
41
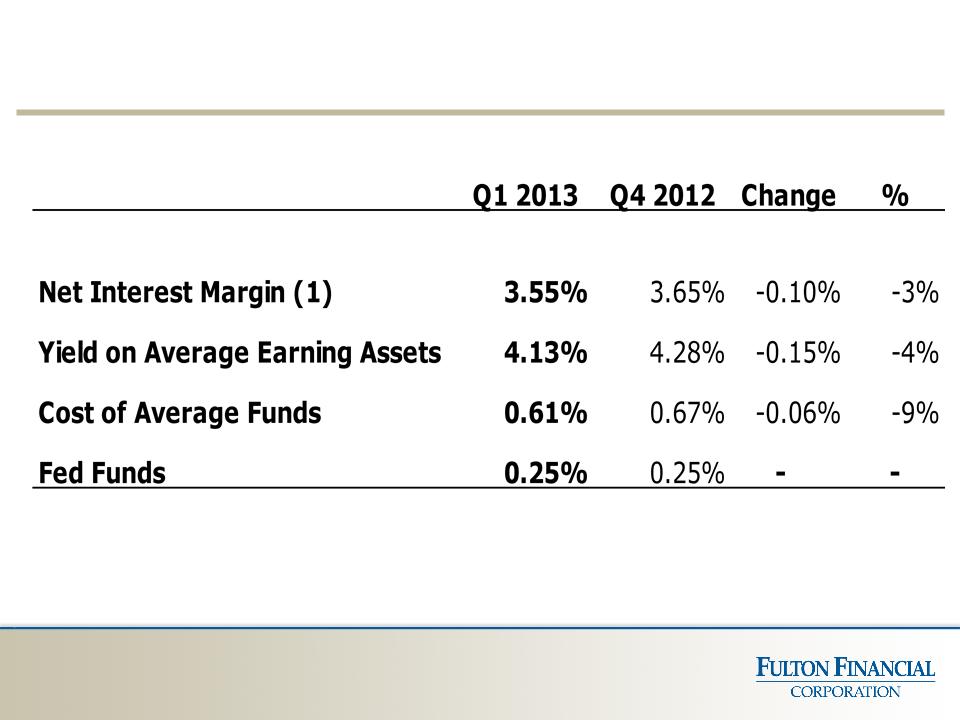
Interest Rates
42
(1) Fully-taxable equivalent

Interest Rate Shocks (3/31/13)
43
Rate Change
% Change
+400 bps
65,850
$
million
12.7%
+300 bps
45,182
$
million
8.7%
+200 bps
27,711
$
million
5.4%
+100 bps
7,322
$
million
1.4%
-100 bps
(18,327)
$
million
-3.5%
1.06
Net Interest Income
Change (annual)
6-Month Cumulative GAP:
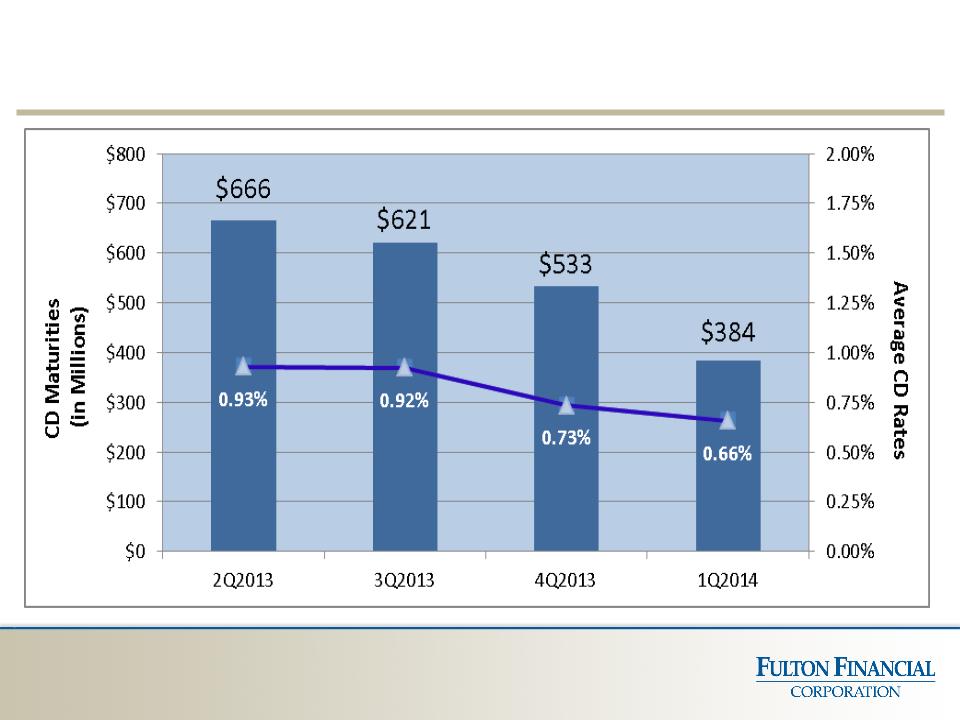
Projected CD Maturities
44

§ 57 relationships with commitments to lend $20
million or more
million or more
§ Maximum individual commitment: $39 million
§ Maximum commitment to any one
builder/developer relationship: $28 million
builder/developer relationship: $28 million
§ Maximum commitment to any one development project:
$15 million
$15 million
§ Loans and corresponding relationships are within
Fulton’s geographic market area
Fulton’s geographic market area
Summary of Larger Loans (3/31/13)
45
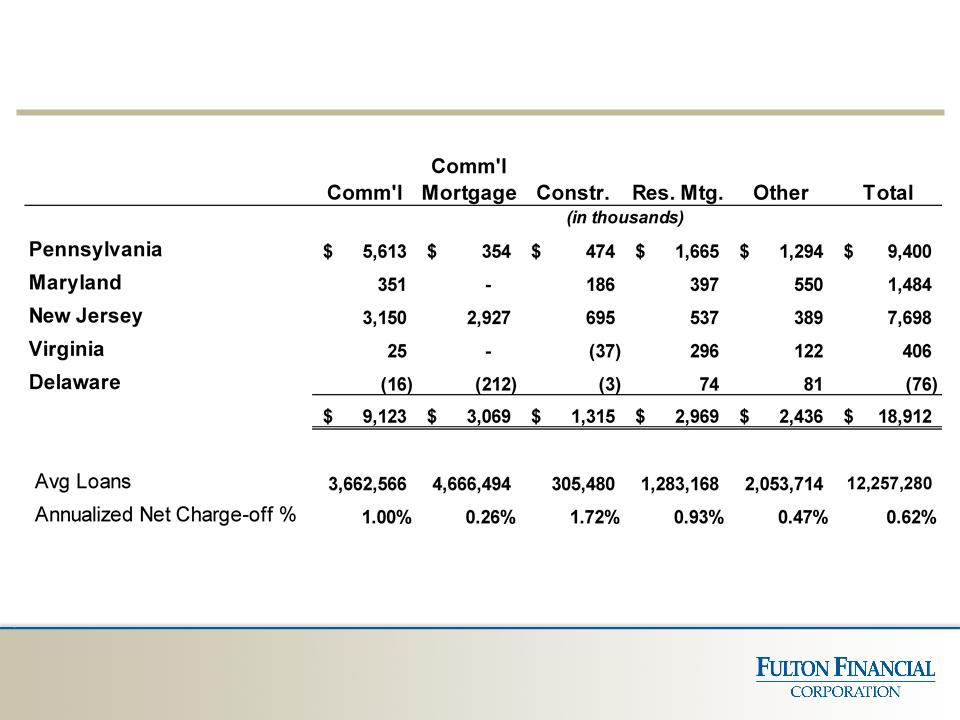
Net Charge-offs (Recoveries) (YTD March 2013)
46
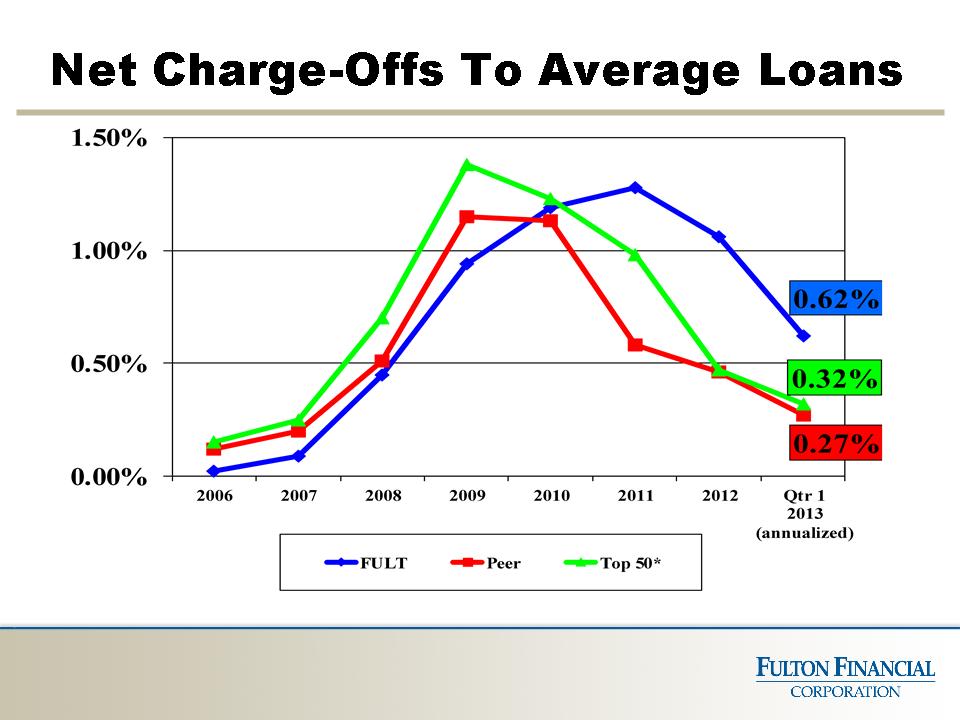
47
* Comprised of the 50 largest publicly traded domestic banks/thrifts in assets size as of December 31,2012.
Excludes credit card companies.
Excludes credit card companies.
Source: SNL Financial LC
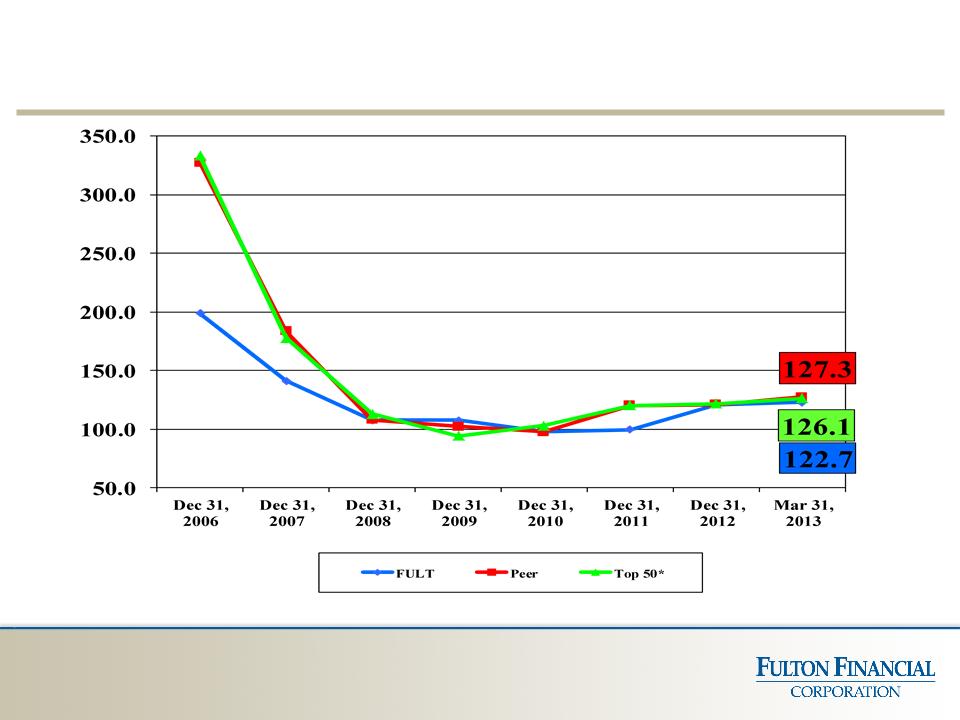
Allowance for Loan Losses to Non-accrual Loans
48
* Comprised of the 50 largest publicly traded domestic banks/thrifts in assets size as of December 31,2012.
Excludes credit card companies.
Excludes credit card companies.
Source: SNL Financial LC
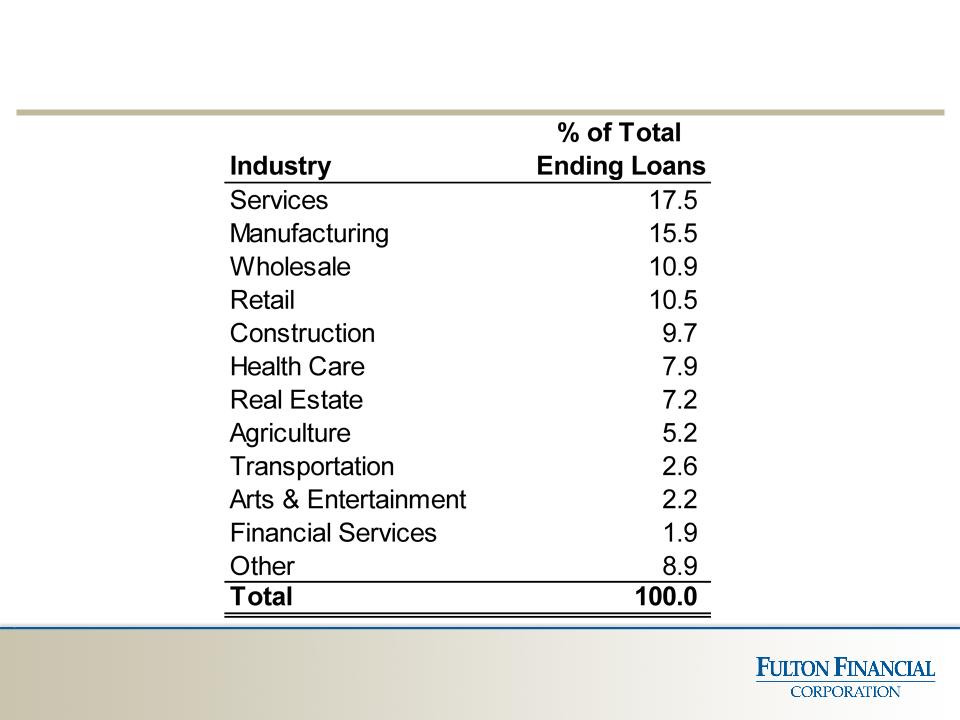
Commercial Loans by Industry (3/31/13)
49
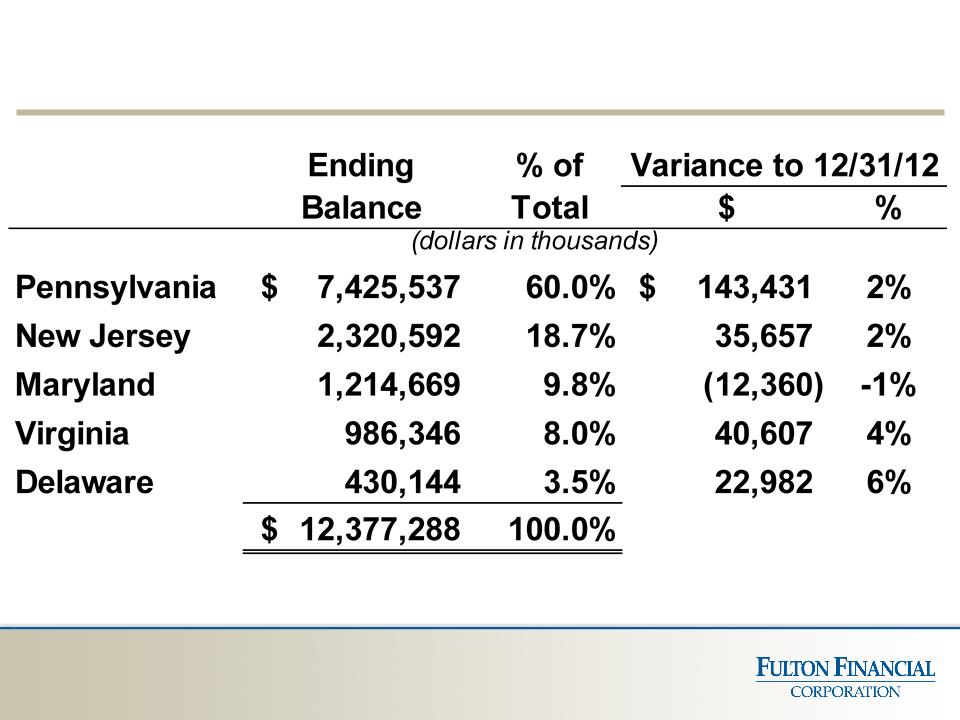
Loan Distribution by State (3/31/13)
50
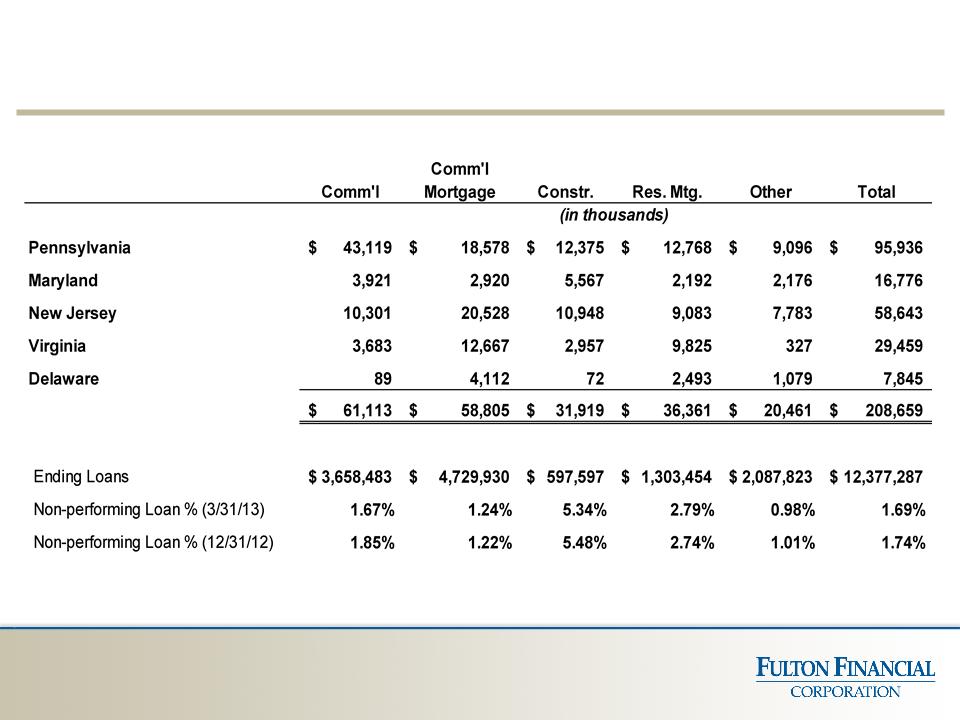
Residential Mortgages (3/31/13)
51
(1) NPL - Non-performing loans. Includes accruing loans > 90 days past due and non-accrual loans.

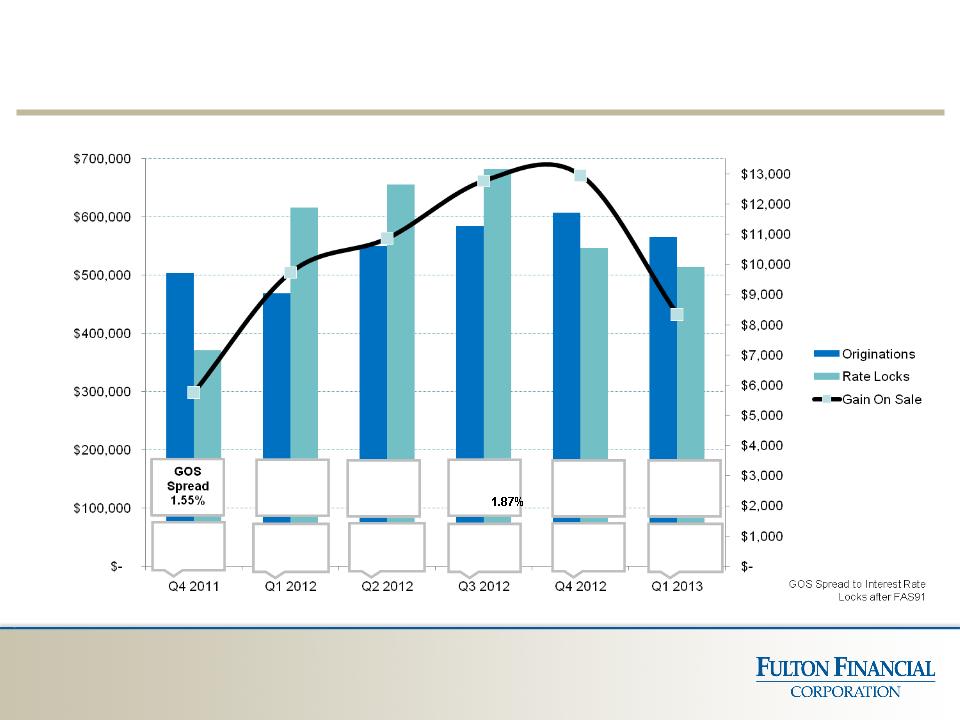
Fulton Mortgage Company
§ Applications $701 million vs. $729
million (End Q1 2013 vs. End Q4 2012)
million (End Q1 2013 vs. End Q4 2012)
§ Pipeline $386 million vs. $463 million
(End Q1 2013 vs. End Q4 2012)
(End Q1 2013 vs. End Q4 2012)
§ 37% purchase / 63% refinancing (Q1
2013)
2013)
52
Fulton Mortgage Company
69%
Available for
Sale
Available for
Sale
GOS
Spread
Spread
1.58%
GOS
Spread
Spread
1.66%
GOS
Spread
Spread
GOS
Spread
Spread
1.62%
70%
Available
for Sale
Available
for Sale
86%
Available
for Sale
Available
for Sale
88%
Available for
Sale
Available for
Sale
82%
Available
for Sale
Available
for Sale
GOS
Spread
Spread
2.37%
81%
Available for
Sale
Available for
Sale
($ in thousands)
53

Residential Mortgage Repurchase Activity
Year to date through March 31, 2013:
§Servicing Retained
§ Repurchased $1,274,000.
§Servicing Released
§ Repurchased $ 0
54
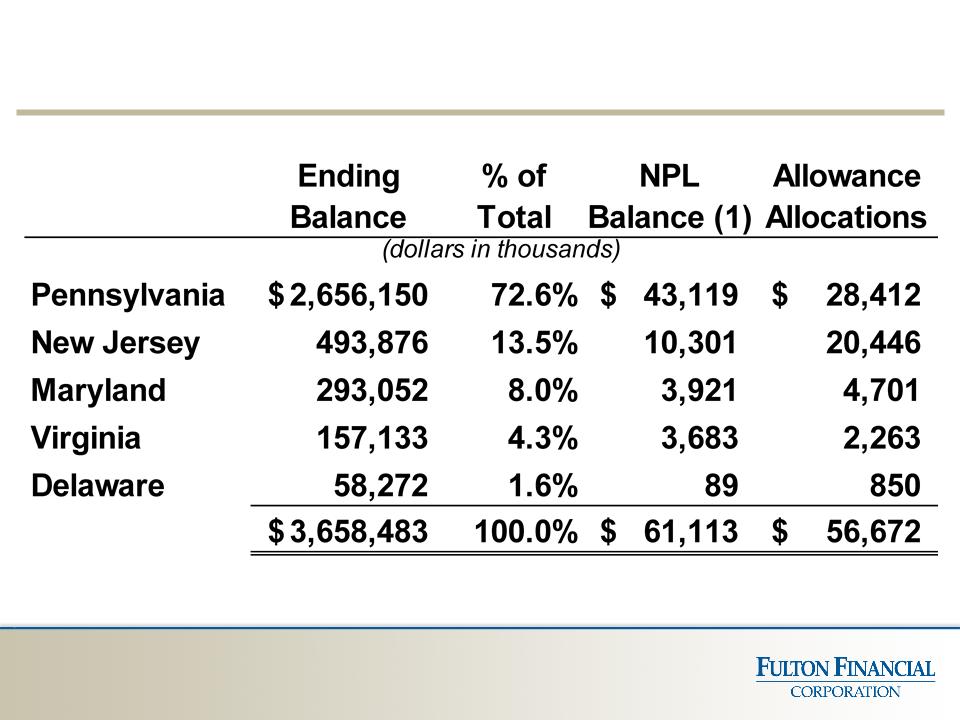
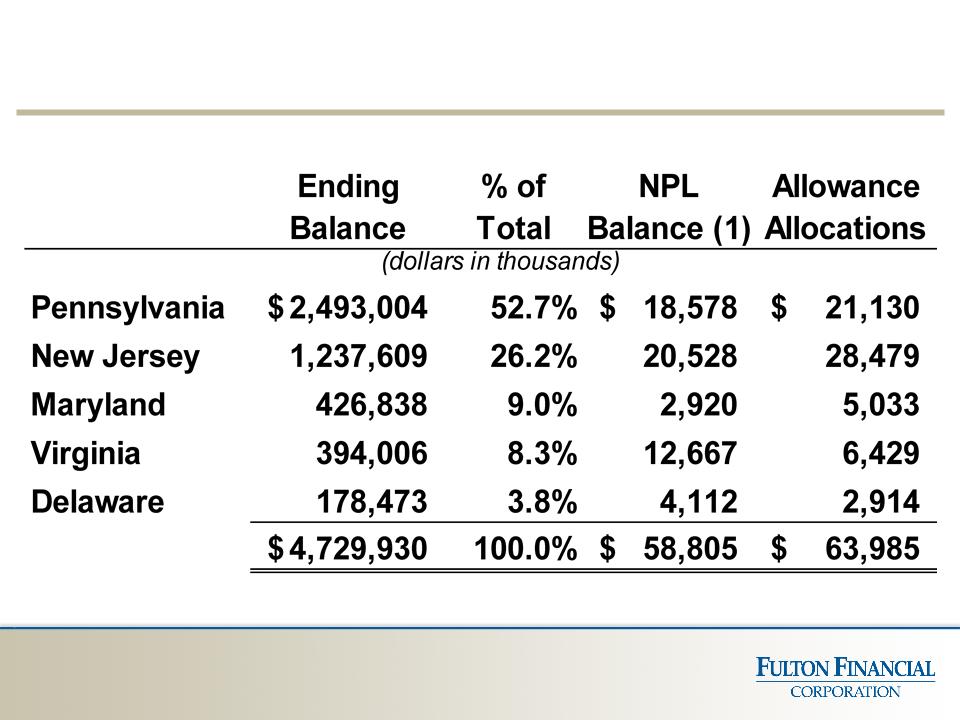
Commercial Loans (3/31/13)
55
(1) NPL - Non-performing loans. Includes accruing loans > 90 days past due and non-accrual loans.
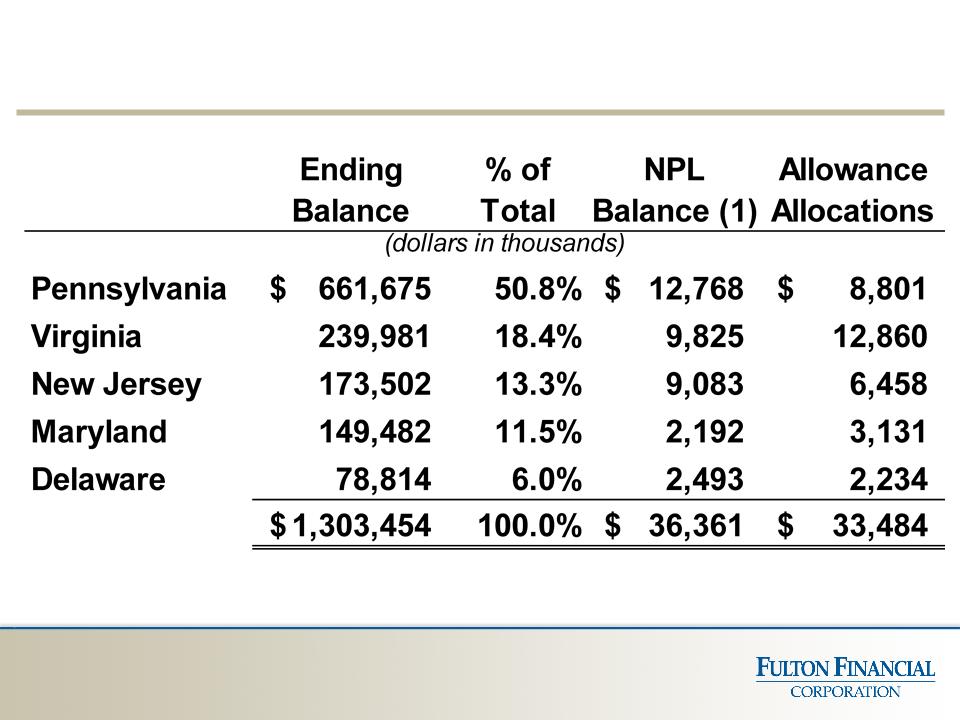
Commercial Mortgages (3/31/13)
56
(1) NPL - Non-performing loans. Includes accruing loans > 90 days past due and non-accrual loans.
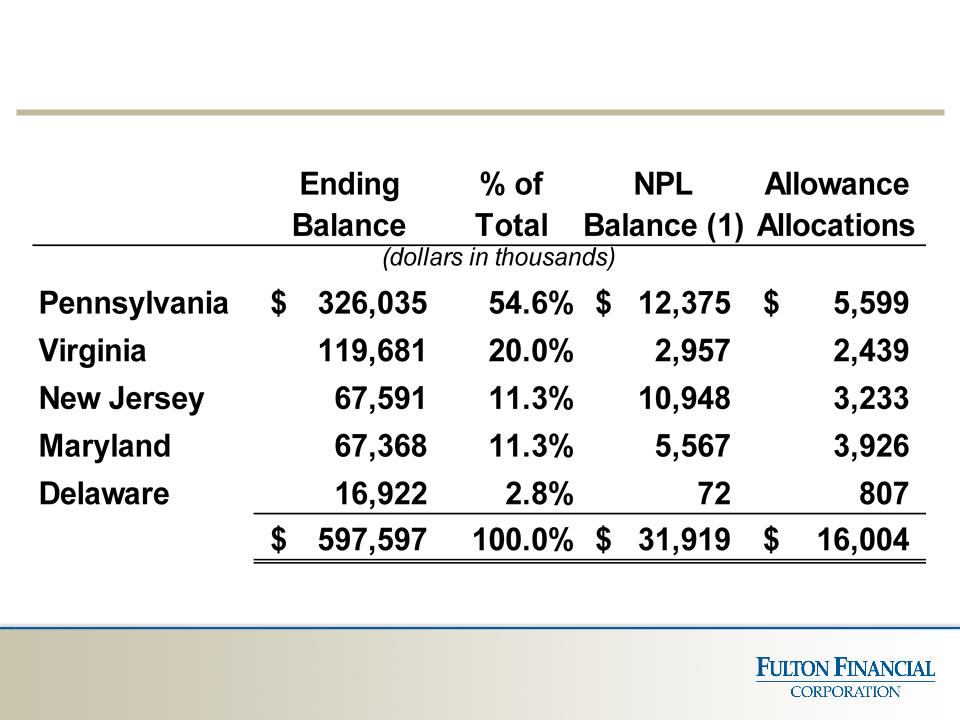
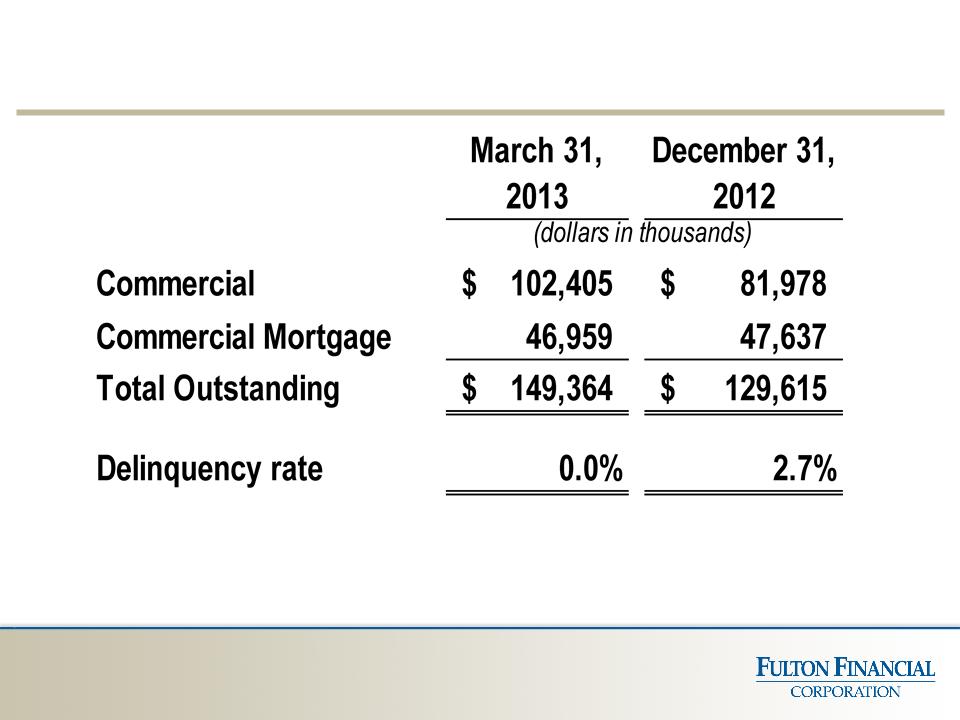
Construction Loans (3/31/13)
57
(1) NPL - Non-performing loans. Includes accruing loans > 90 days past due and non-accrual loans.
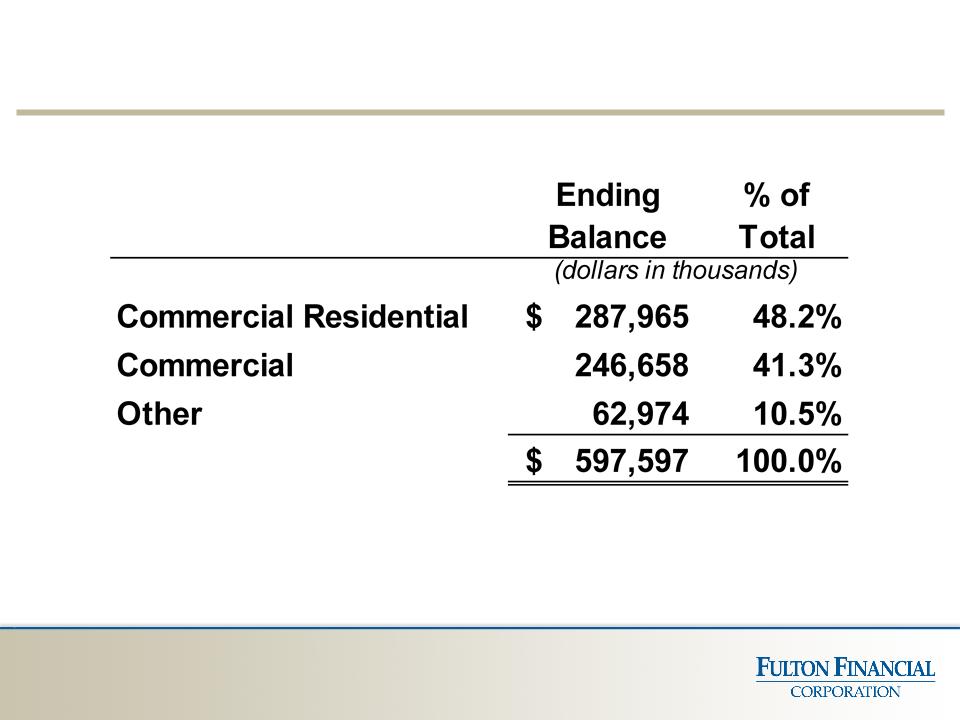
Construction Loans by Type (3/31/13)
58
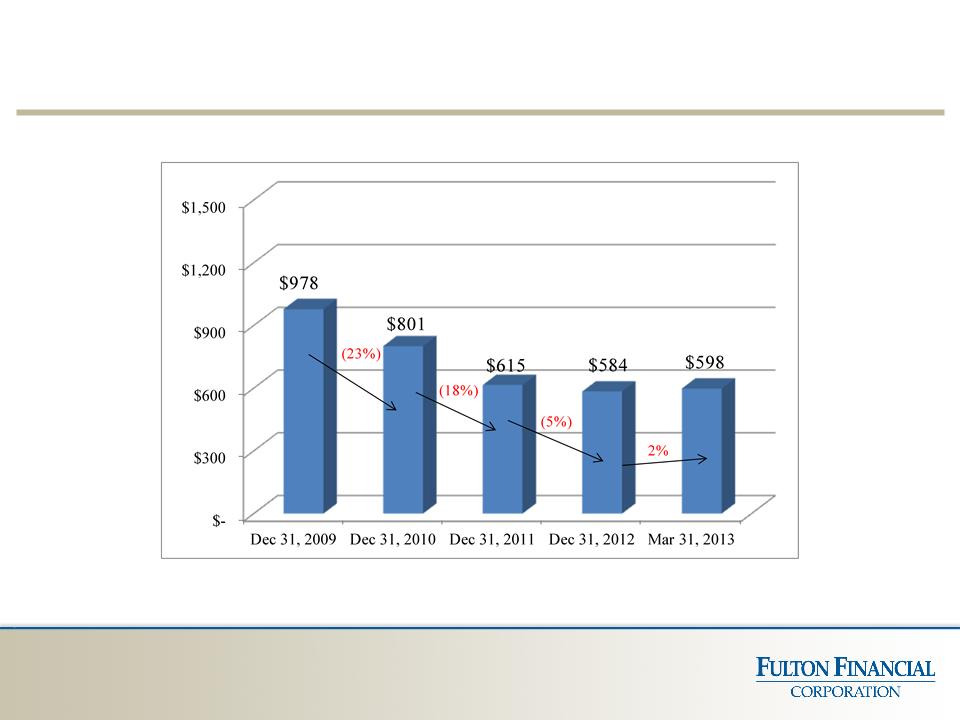
Construction Exposure (in millions, 3/31/13)
Construction Loans /
Total Loans
Total Loans
10.5%
8.2%
6.7%
5.1%
4.8%
59
Shared National Credits
60
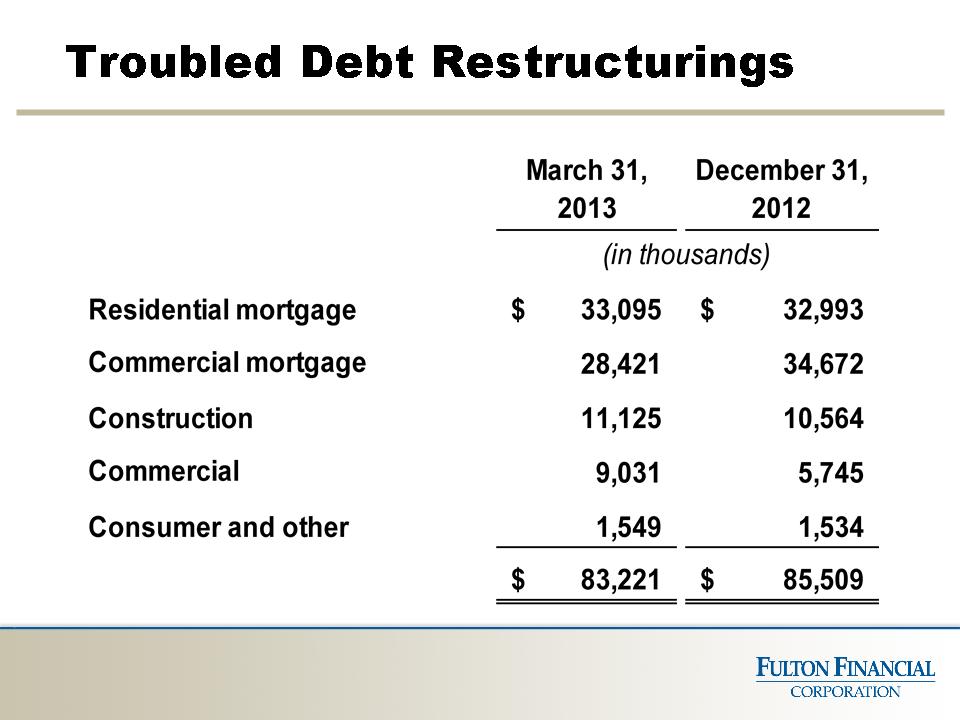
61
Note: Excludes non-accrual troubled debt restructurings.
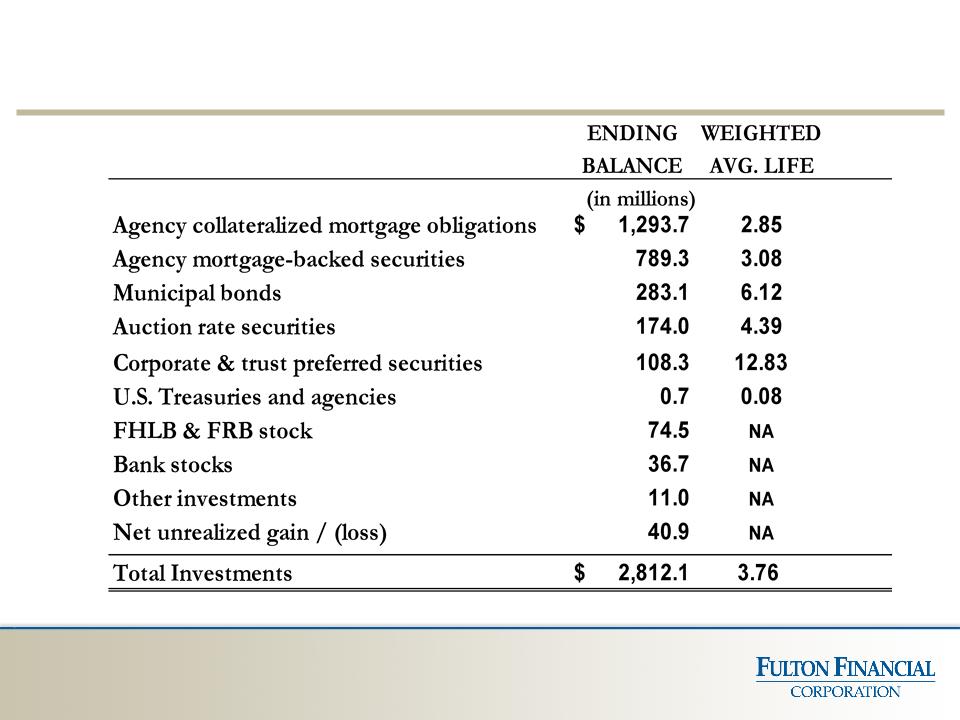
Investment Portfolio (3-31-13)
62
Book Yield (monthly) 2.78%
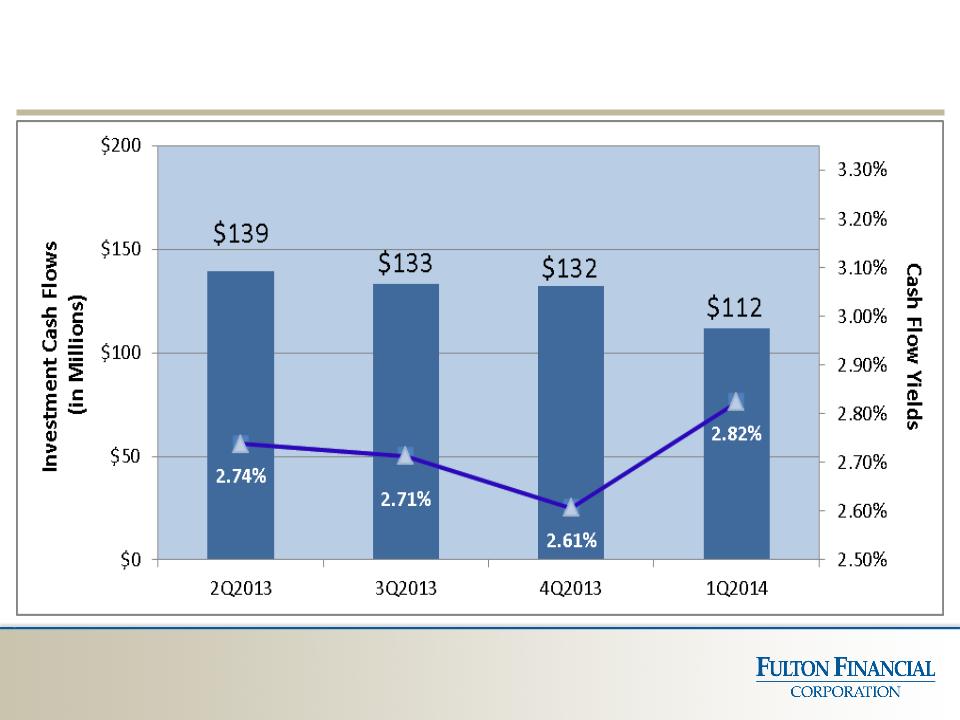
Projected Investment Security Cash Flows
63
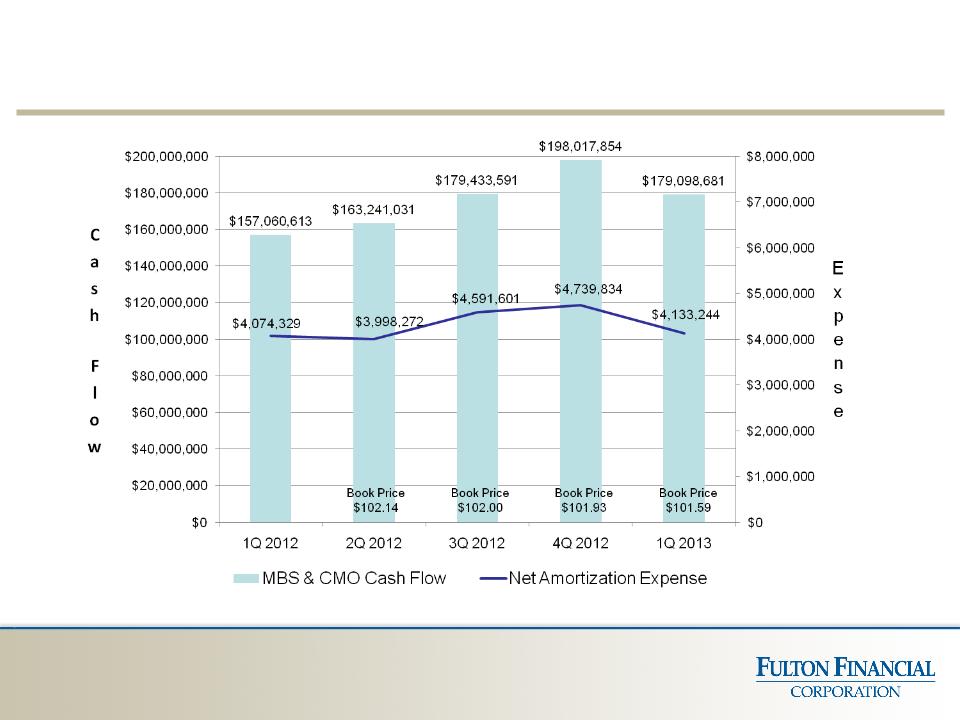
Investment MBS & CMO Cash Flows (2012-2013)
64
Book Price
$102.12
$102.12
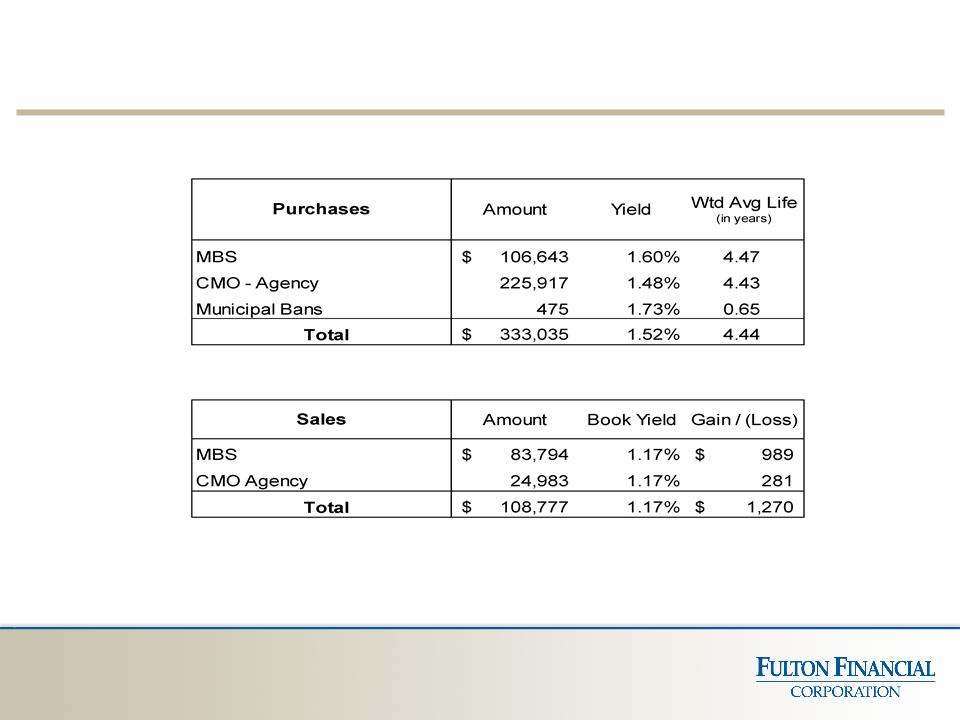
Investment Portfolio - Transactions (1st Quarter 2013)
($ in Thousands)
65
Does not include $1.1 million bank stock gains for the first quarter of 2013 or
$64,000 of gains related to 2012 sales
$64,000 of gains related to 2012 sales
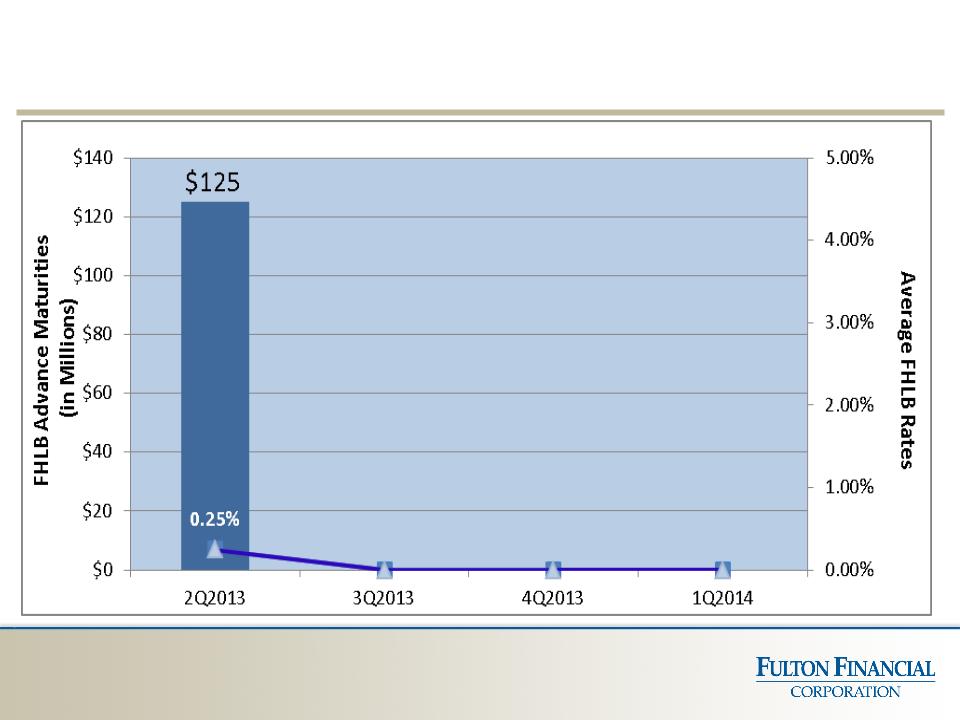
Projected FHLB Advance Maturities
66
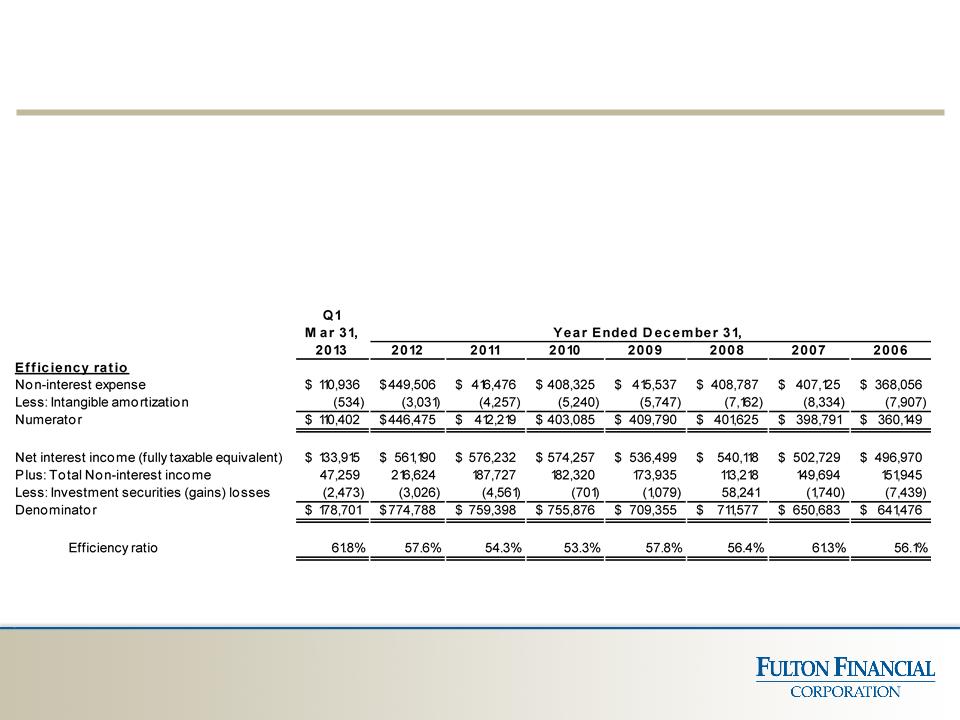
Non-GAAP Reconciliation
67
Note: The Corporation has presented the following non-GAAP (Generally Accepted Accounting Principals) financial measures
because it believes that they provide useful and comparative information to assess trends in the Corporation's quarterly results of
operations. Presentation of the following non-GAAP financial measures is consistent with how the Corporation evaluates its
performance internally and these non-GAAP financial measures are frequently used by securities analysts, investors and other
interested parties in the evaluation of companies in the Corporation's industry. Investors should recognize that the Corporation's
presentation of these non-GAAP financial measures might not be comparable to similarly-titled measures of other companies. These
non-GAAP financial measures should not be considered a substitute for GAAP basis measures and the Corporation strongly
encourages a review of its condensed consolidated financial statements in their entirety.
Non-GAAP Reconciliation (con’t)
68
Non-GAAP Reconciliation (con’t)
69
Non-GAAP Reconciliation (con’t)
70

Fulton Financial Corporation
One Penn Square
Lancaster, PA 17602
www.fult.com