
Investor Presentation
Data as of June 30, 2013
(unless otherwise noted)
Ticker Symbol: FULT (NASDAQ)

§ This presentation may contain forward-looking statements with respect to Fulton Financial
Corporation’s financial condition, results of operations and business. Do not unduly rely on forward-
looking statements. Forward-looking statements can be identified by the use of words such as “may,”
“should,” “will,” “could,” “estimates,” “predicts,” “potential,” “continue,” “anticipates,” “believes,” “plans,”
“expects,” “future,” “intends” and similar expressions which are intended to identify forward-looking
statements.
§ Forward-looking statements are not guarantees of future performance and are subject to risks and
uncertainties, some of which are beyond the Corporation’s control and ability to predict, that could
cause actual results to differ materially from those expressed in the forward-looking statements. The
Corporation undertakes no obligation, other than as required by law, to update or revise any forward-
looking statements, whether as a result of new information, future events or otherwise.
§ A discussion of certain risks and uncertainties affecting the Corporation, and some of the factors that
could cause the Corporation’s actual results to differ materially from those described in the forward-
looking statements, can be found in the sections entitled “Risk Factors” and “Management’s Discussion
and Analysis of Financial Condition and Results of Operations” in the Corporation’s Annual Report on
Form 10-K for the year ended December 31, 2012, and the Quarterly Reports on Form 10-Q for the
quarters ended March 31, 2013 and June 30, 3013, which have been filed with the Securities and
Exchange Commission and are available in the Investor Relations section of the Corporation’s website
(www.fult.com) and on the Securities and Exchange Commission’s website (www.sec.gov).
§ The Corporation uses certain non-GAAP financial measures in this presentation. These non-GAAP
financial measures are reconciled to the most comparable GAAP measures at the end of this
presentation.
financial measures are reconciled to the most comparable GAAP measures at the end of this
presentation.
Forward-Looking Statements
2

About Us
§ Mid-Atlantic financial holding company
§ 6 community banks / 5 states
§ Fulton Financial Advisors
§ Fulton Mortgage Company
§ 270 community banking offices
§ Asset size: $17.0 billion
§ 3,800 team members (3,620 FTEs)
§ Shares outstanding: 193.7 million
§ Market capitalization: $ 2.2 billion
§ Book value per share: $10.48
§ Tangible book value per share (1): $7.72
3
(1) Non-GAAP based financial measure. Please refer to the calculation and management’s reason for using
this measure on the slide titled “Non-GAAP Reconciliation” at the end of this presentation.
this measure on the slide titled “Non-GAAP Reconciliation” at the end of this presentation.

A Valuable Franchise
4

1. Earnings Per Share (EPS) Growth
2. Quality Loan Growth
3. Improve Asset Quality
4. Core Deposit / Household Growth
5. Spread Management / Net Interest Margin
6. Increase Return on Average Assets (ROA)
7. Increase Return on Average Equity (ROE)
8. Expense Management
Corporate Priorities
5

Priorities: EPS
1. EPS Growth
üQ2 2013 Diluted EPS : 21 cents
Up 5.0% compared to Q1 2013 and Q2 2012
6
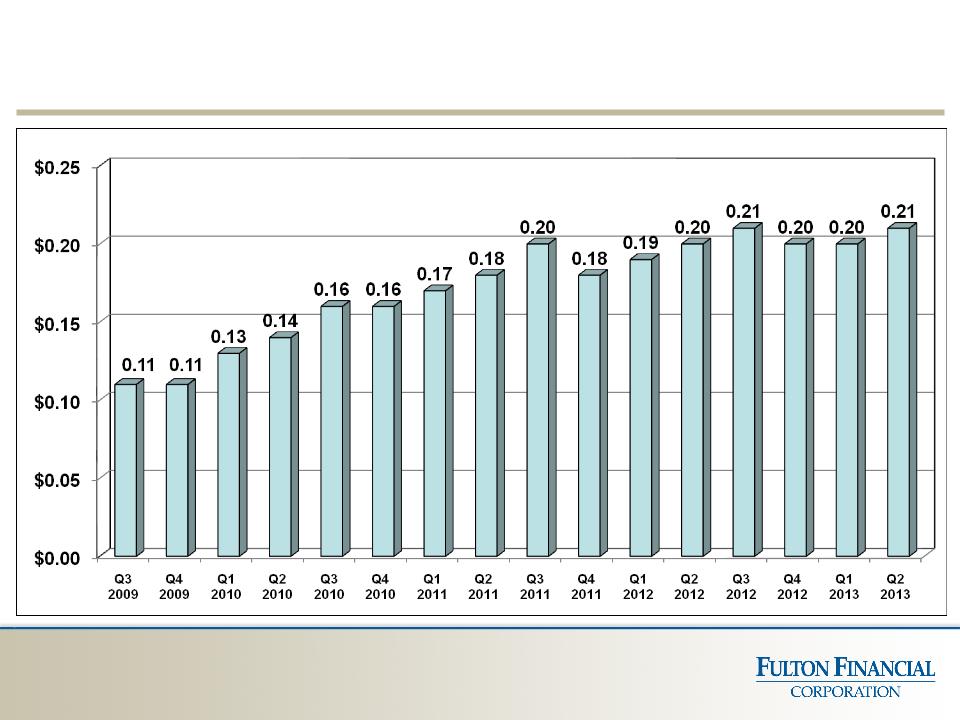
Diluted Earnings Per Share (Quarterly)
7
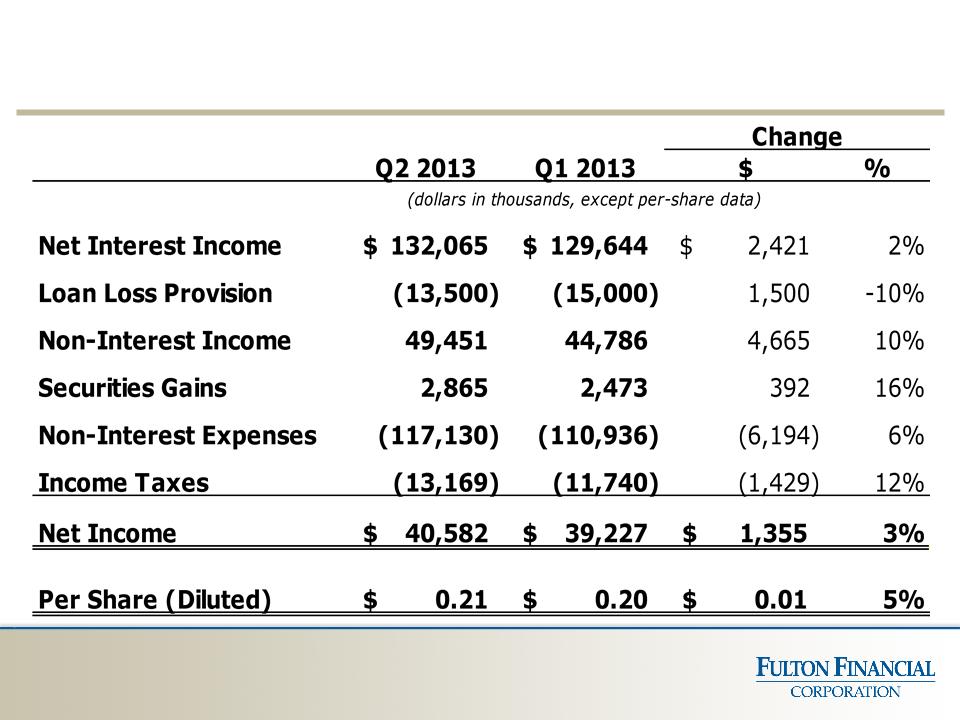
Income Statement Summary
8

2. Quality Loan Growth
ü Average loans up 2.2%
compared to Q1 2013 and up 4.7%
compared to Q2 2012
compared to Q1 2013 and up 4.7%
compared to Q2 2012
üThird consecutive quarter of
solid growth
solid growth
Priorities: Earning Asset Growth
9
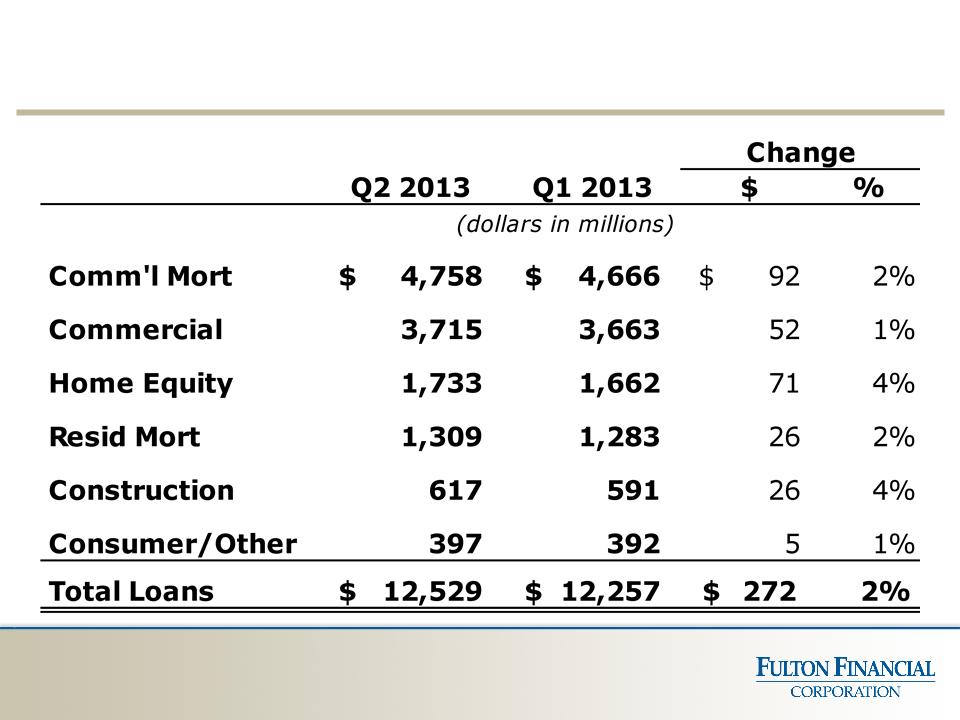
Average Loans
10

International Bancshares Corp.
People’s United Financial, Inc.
Prosperity Bancshares, Inc.
Susquehanna Bancshares, Inc.
TCF Financial Corporation
UMB Financial Corporation
Umpqua Holdings Corporation
Valley National Bancorp
Webster Financial Corporation
Wintrust Financial Corporation
Associated Banc-Corp
BancorpSouth, Inc.
BOK Financial Corporation
City National Corporation
Commerce Bancshares, Inc.
Cullen/Frost Bankers, Inc.
F.N.B. Corporation
FirstMerit Corporation
Hancock Holding Company
IBERIABANK Corporation
Peer Group*
11
*Fulton’s Peer group as of June 30, 2013
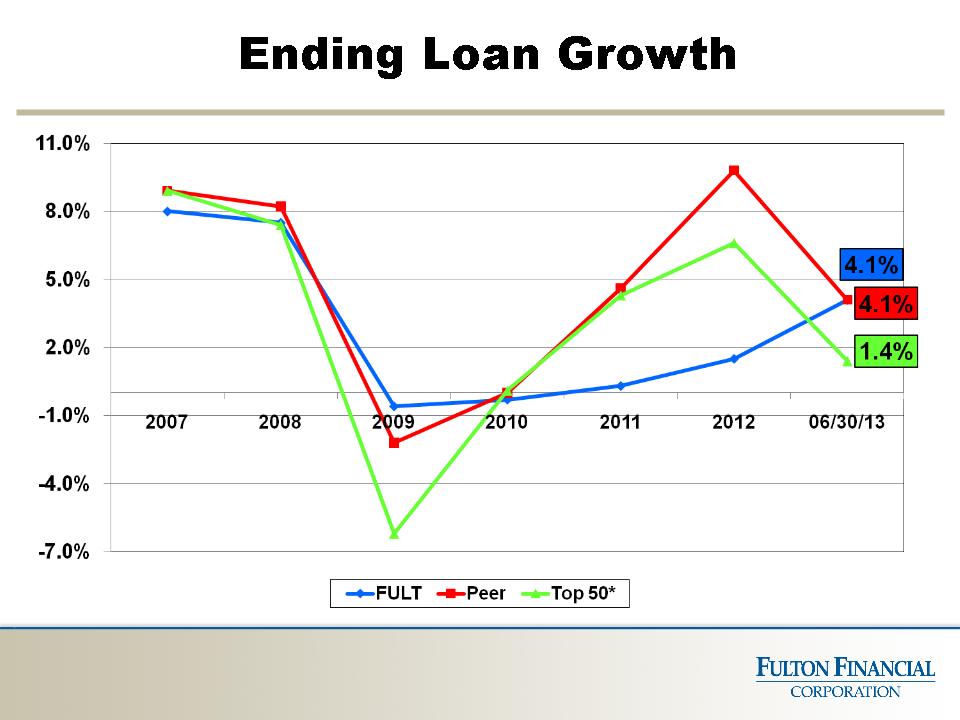
12
Note: 2007 through 2012 represents December year-over-year change in ending loans. 06/30/13 represents June 30, 2013 over December
31, 2012 change in ending loans.
31, 2012 change in ending loans.
*Comprised of the 50 largest publicly traded domestic banks/thrifts in assets size as of December 31,2012. Excludes credit card
companies.
companies.
Source: SNL Financial LC

3. Improve Asset Quality
Priorities: Credit Metrics
13
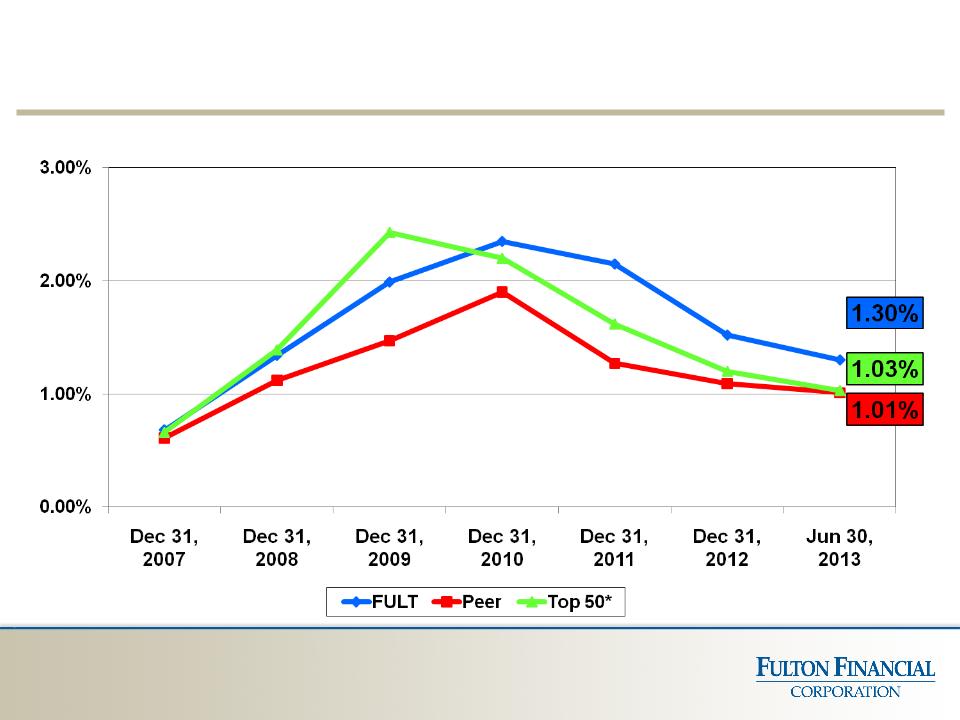
Non-accrual Loans to Loans
14
* Comprised of the 50 largest publicly traded domestic banks/thrifts in assets size as of December 31,2012.
Excludes credit card companies.
Excludes credit card companies.
Source: SNL Financial LC
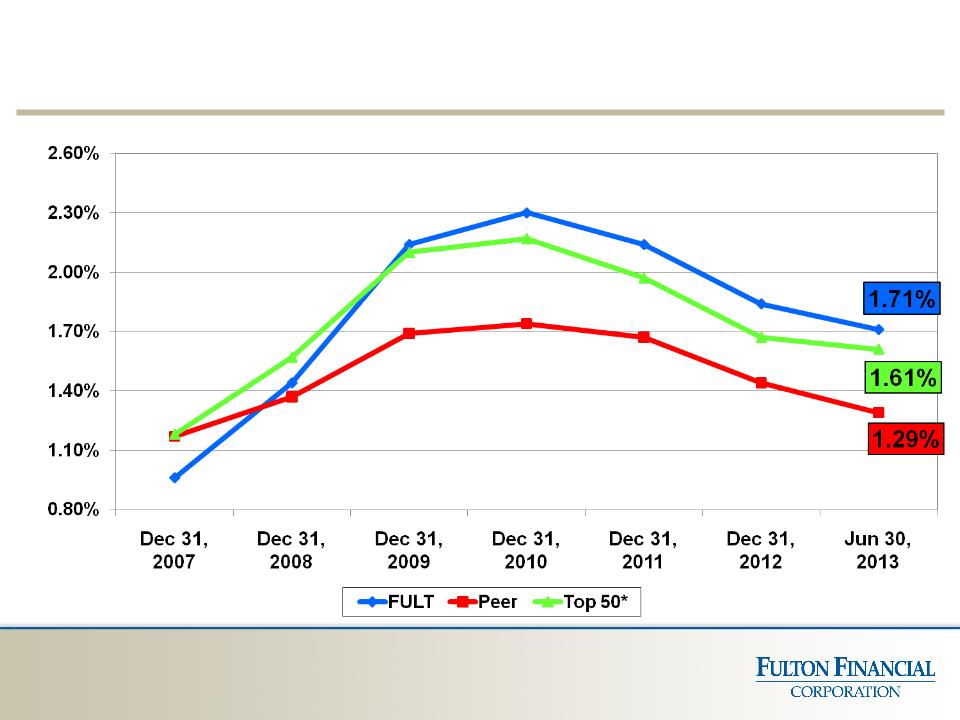
Allowance for Loan Losses to Loans
15
* Comprised of the 50 largest publicly traded domestic banks/thrifts in assets size as of December 31,2012.
Excludes credit card companies.
Excludes credit card companies.
Source: SNL Financial LC
Non-performing Loans* (6/30/13)
16
* Includes loans ≥ 90 days past due and accruing and non-accrual loans.
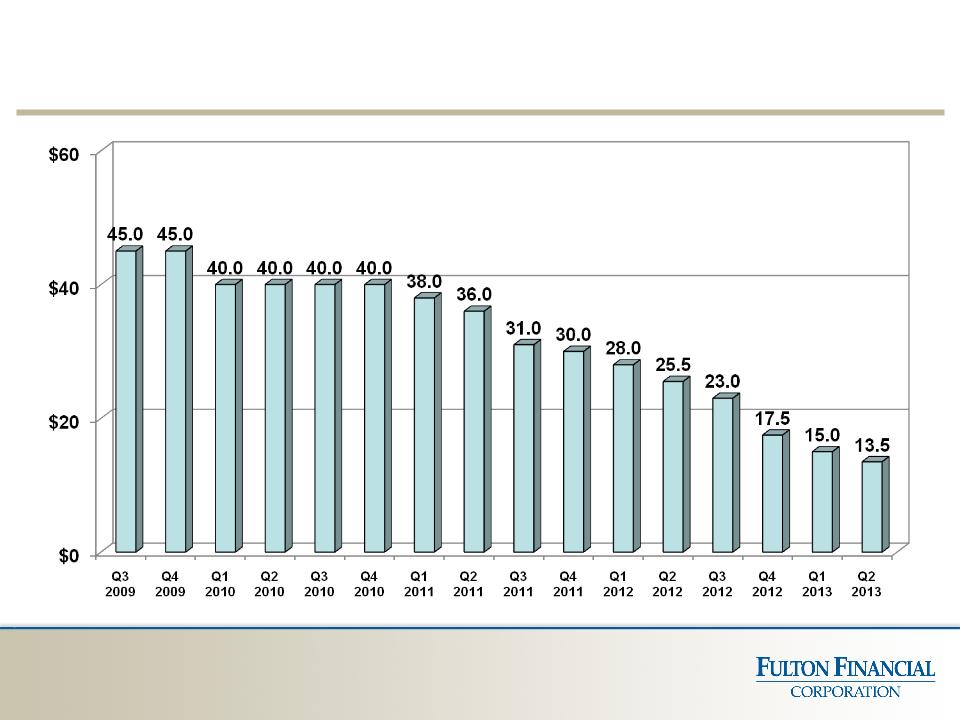
Provision for Credit Losses (Quarterly, in millions of dollars)
17

4. Core Deposit / Household
Growth
Growth
2012 Net Account Lift (#): 2.8%
Priorities: Deposits
18
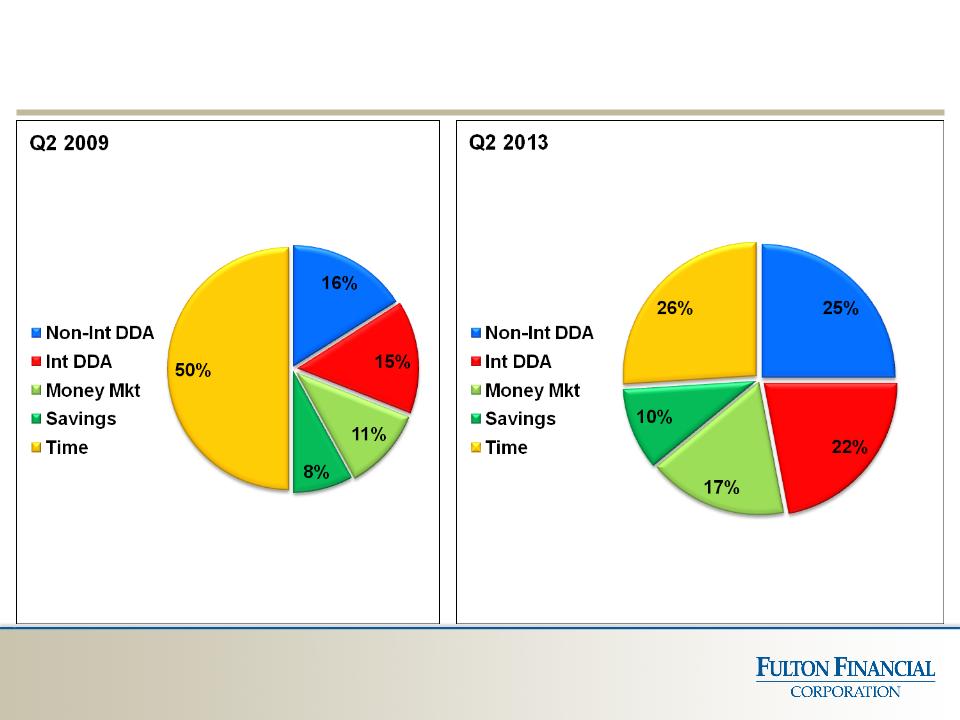
Deposit Composition
19
Note: Deposit composition is based on quarterly average balances for the periods indicated.
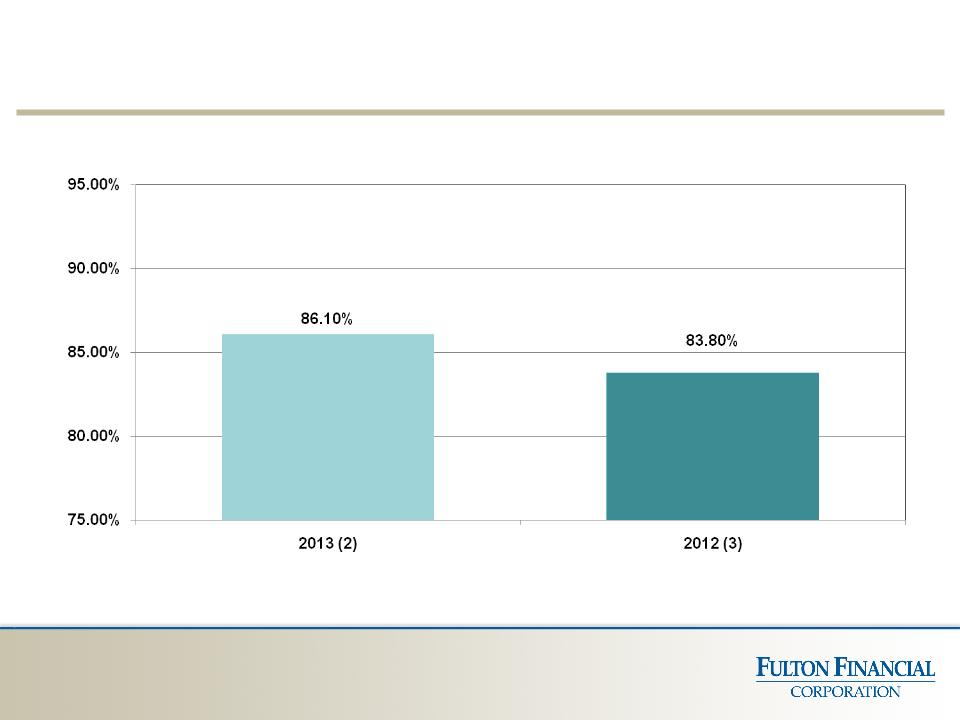
Overall Customer Satisfaction Score (1)
20
(1) Annual retail customer satisfaction surveys conducted by Fulton’s internal Marketing Research Group. Areas covered: Overall
Customer Satisfaction and likelihood to recommend the bank; Customer experience; Specific issues of problems experience by
customers; Motivating factors to bank with us.
Customer Satisfaction and likelihood to recommend the bank; Customer experience; Specific issues of problems experience by
customers; Motivating factors to bank with us.
(2) Results based on 10,926 customer surveys completed in January 2013.
(3) Results based on 4,897 customer surveys completed in January 2012.

5. Spread Management / Net Interest Margin
§ Q2 2013 Net Interest Margin (fully-taxable equivalent):
3.52%
3.52%
ü Yield on average interest-earning assets: 4.07%
ü Cost of average interest-bearing liabilities: 0.74%
Priorities: Margin
21
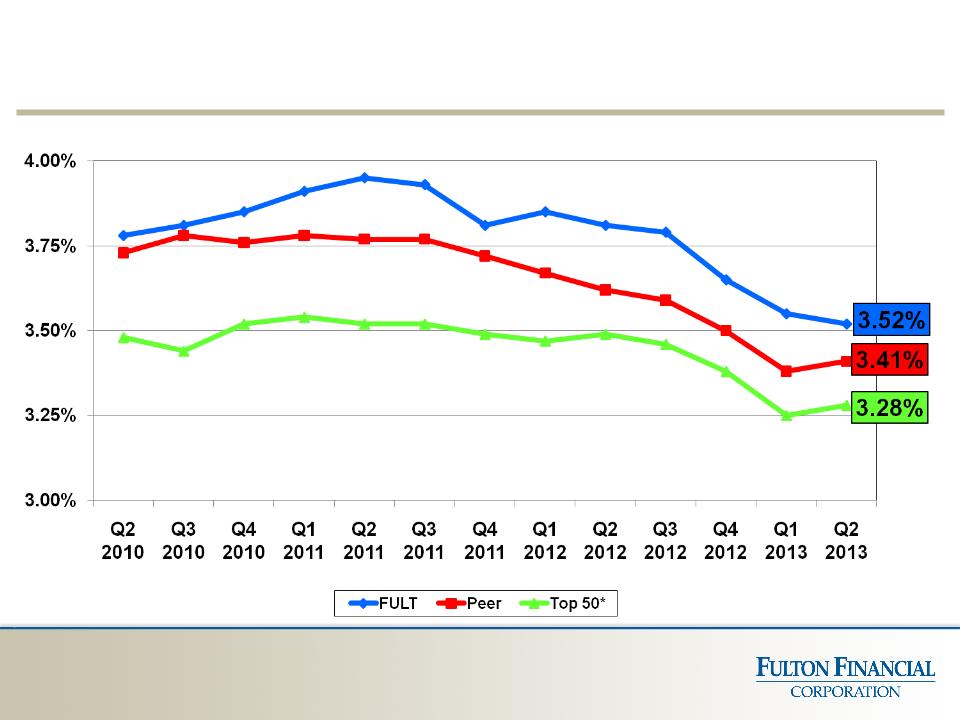
Net Interest Margin (Quarterly)
22
Note: Fully-taxable equivalent
*Comprised of the 50 largest publicly traded domestic banks/thrifts in assets size as of December 31,2012.
Excludes credit card companies.
Excludes credit card companies.
Source: SNL Financial LC
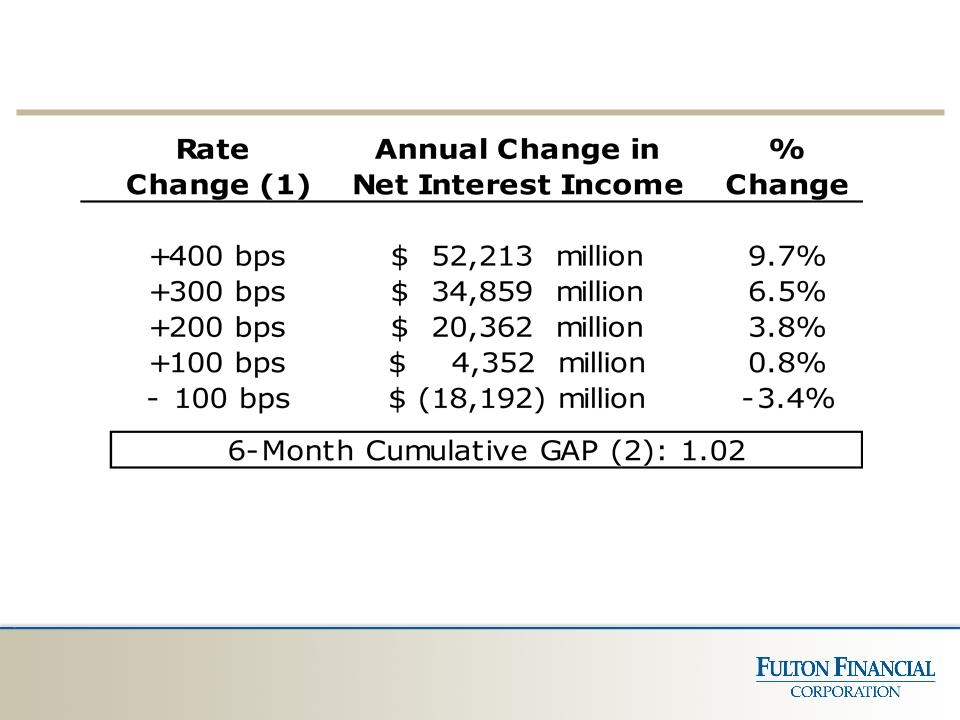
Interest Rate Shocks (6/30/13)
23
1) A variety of interest rate scenarios are used to measure the effects of sudden and gradual movements upward and downward in the yield curve. These
results are compared to the results obtained in a flat or unchanged interest rate scenario. Simulation of earnings is used primarily to measure Fulton’s short-
term earnings exposure to rate movements. A "shock" is an immediate upward or downward movement of interest rates. The shocks do not take into
account changes in customer behavior that could result in changes to mix and/or volumes in the balance sheet, nor do they account for competitive pricing
over the forward 12-month period. These results include the effect of implicit and explicit floors that limit further reduction in interest rates.
2) This measurement is accomplished through stratification of assets and liabilities into repricing periods. The sums of assets and liabilities in each of these
periods are compared for mismatches within that maturity segment. Core deposits having no contractual maturities are placed into repricing periods based
upon historical balance performance. Repricing for mortgage loans, mortgage-backed securities and collateralized mortgage obligations is based upon
industry projections for prepayment speeds.

6. ROA
Q2 2013: 0.97%
Q1 2013: 0.96%
Priorities: ROA and ROE
24
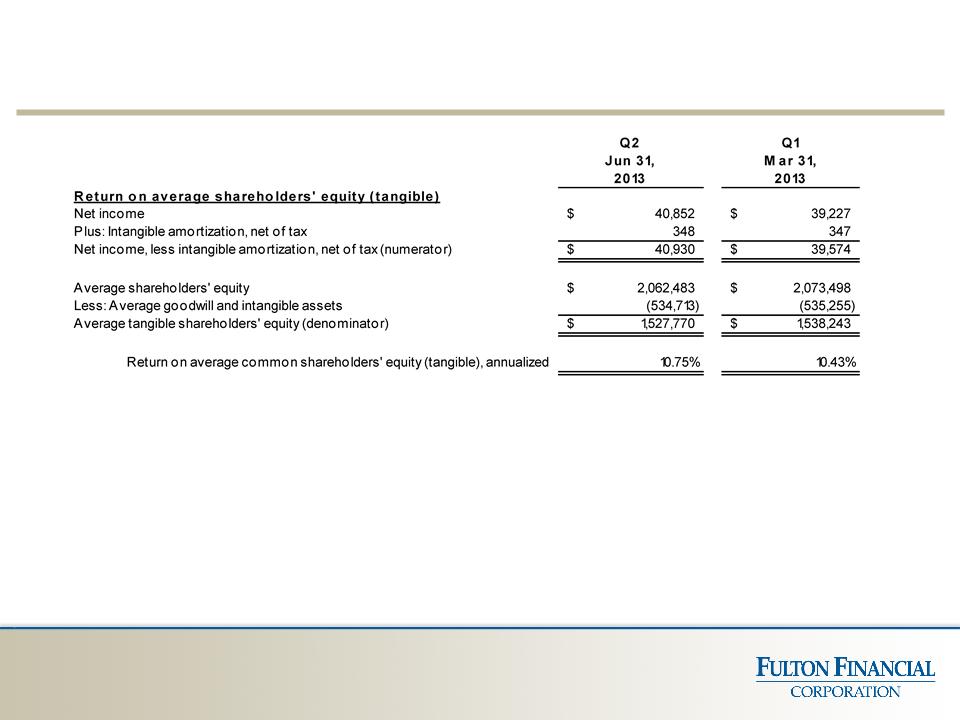
7. ROE (Tangible) (1)
Q2 2013: 10.75%
Q1 2013: 10.43%
Note: ROA is return an average assets determined by dividing net income for the period indicated by average
assets
assets
(1)Non-GAAP based financial measure. Please refer to the calculation and management’s reasons for using
this measure on the slide titled “Non-GAAP Reconciliation” at the end of this presentation.
this measure on the slide titled “Non-GAAP Reconciliation” at the end of this presentation.
Increase ROA and ROE
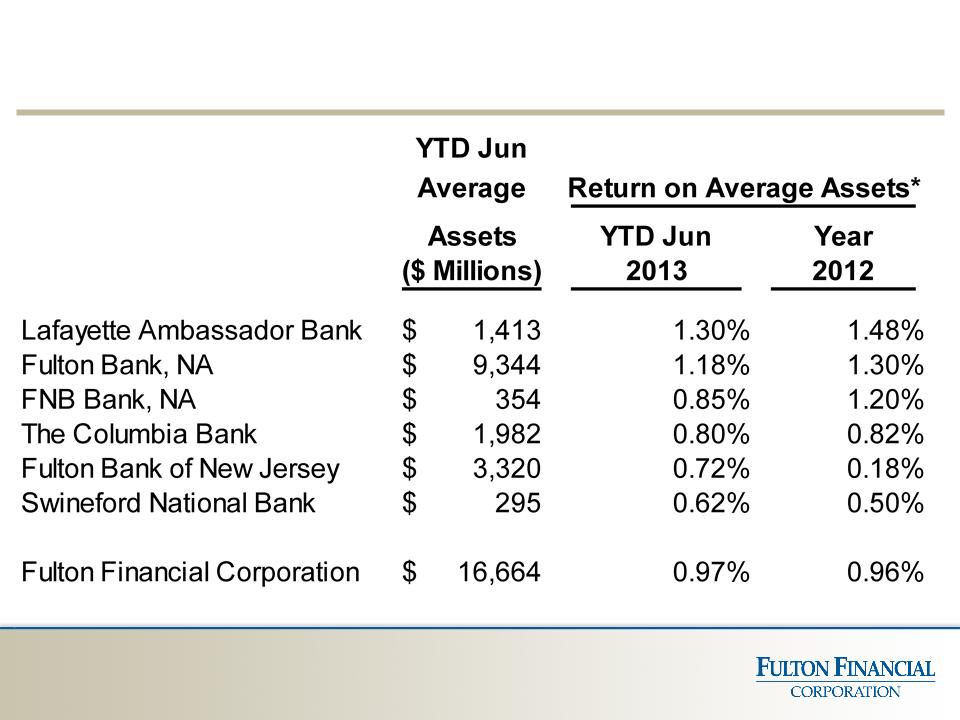
Return on Average Assets
and Average Assets, by Bank
and Average Assets, by Bank
25
*Net Income divided by average assets, annualized.
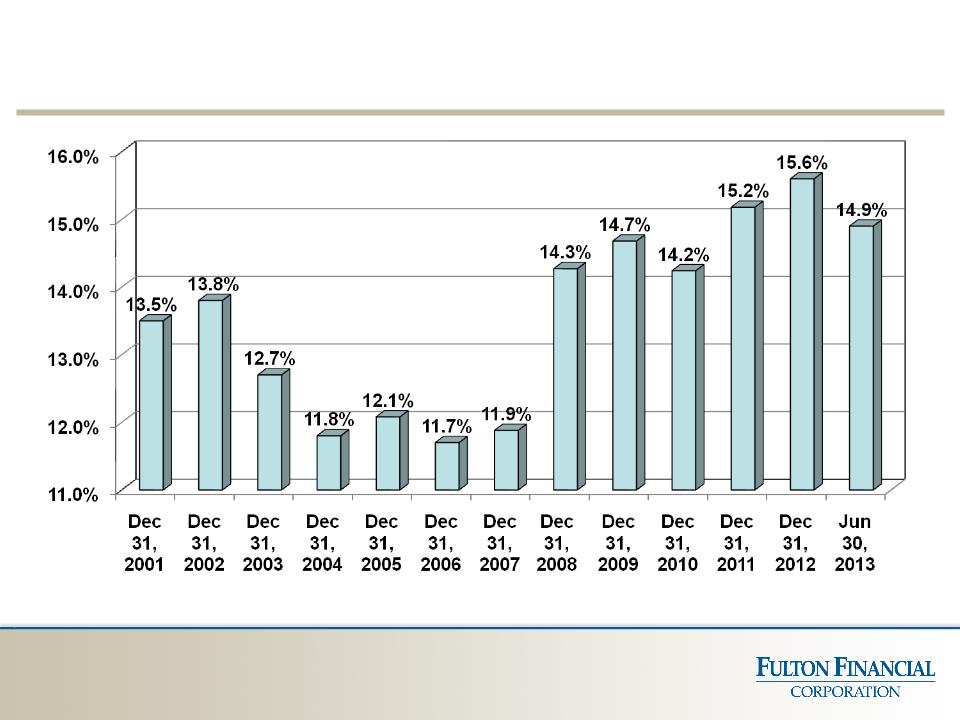
Total Risk-Based Capital Ratio
26
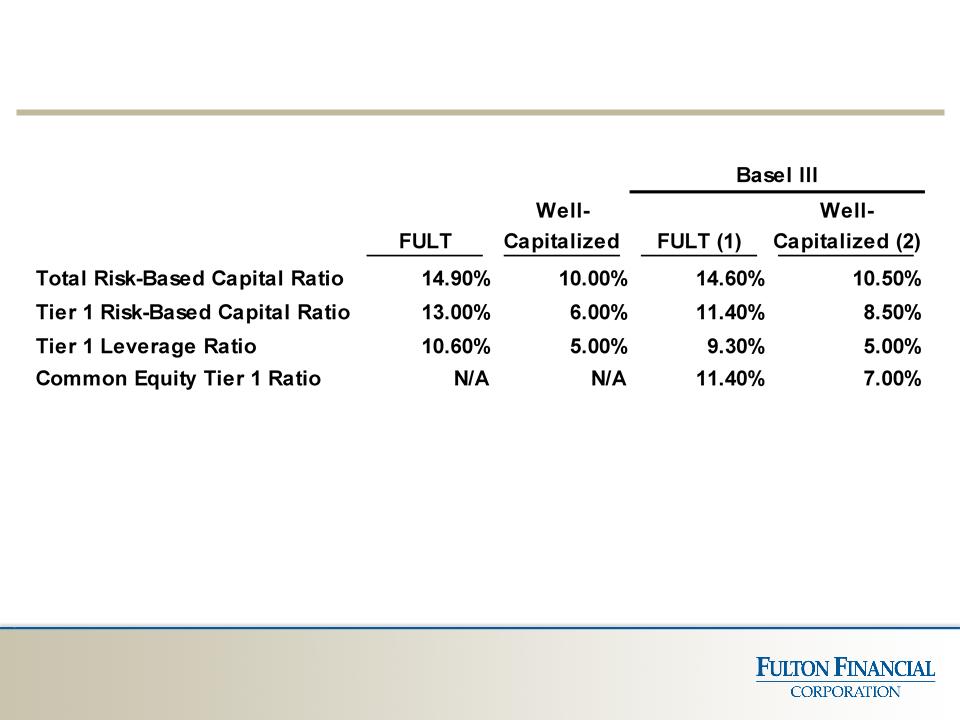
Capital Adequacy (6/30/13)
(1) Estimates - based on final rules. Application of the Basel III rules are also subject to further interpretation, which could
result in changes to the estimates shown above.
result in changes to the estimates shown above.
(2) Fully-phased in requirements, with 2.50% conservation buffer.
27
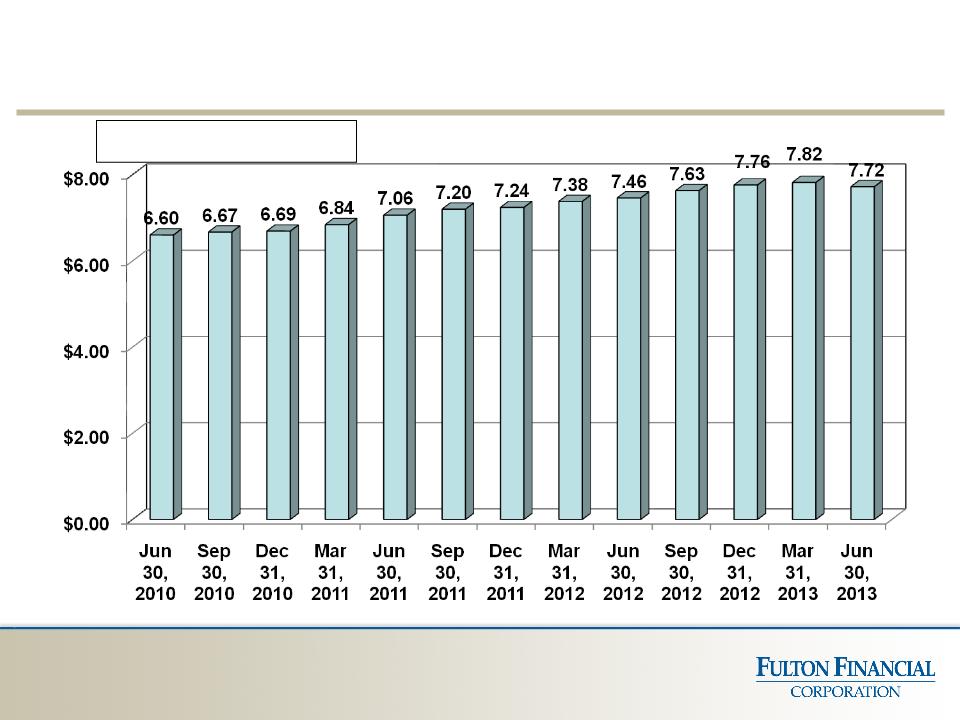
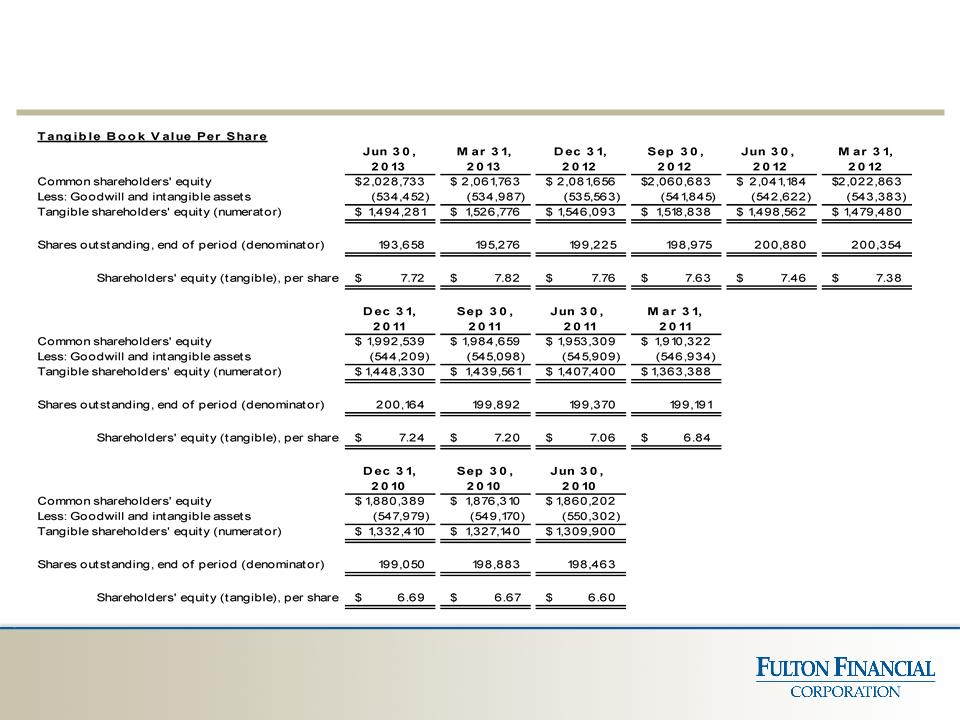
Tangible Book Value Per Share (1)
28
(1) Non-GAAP based financial measure. Please refer to the calculation and management’s reasons for using
this measure on the slide titled “Non-GAAP Reconciliation” at the end of this presentation.
this measure on the slide titled “Non-GAAP Reconciliation” at the end of this presentation.
(2) Compounded annual growth rate from June 30, 2010 to June 30, 2013.
CAGR (2) = 5.4%
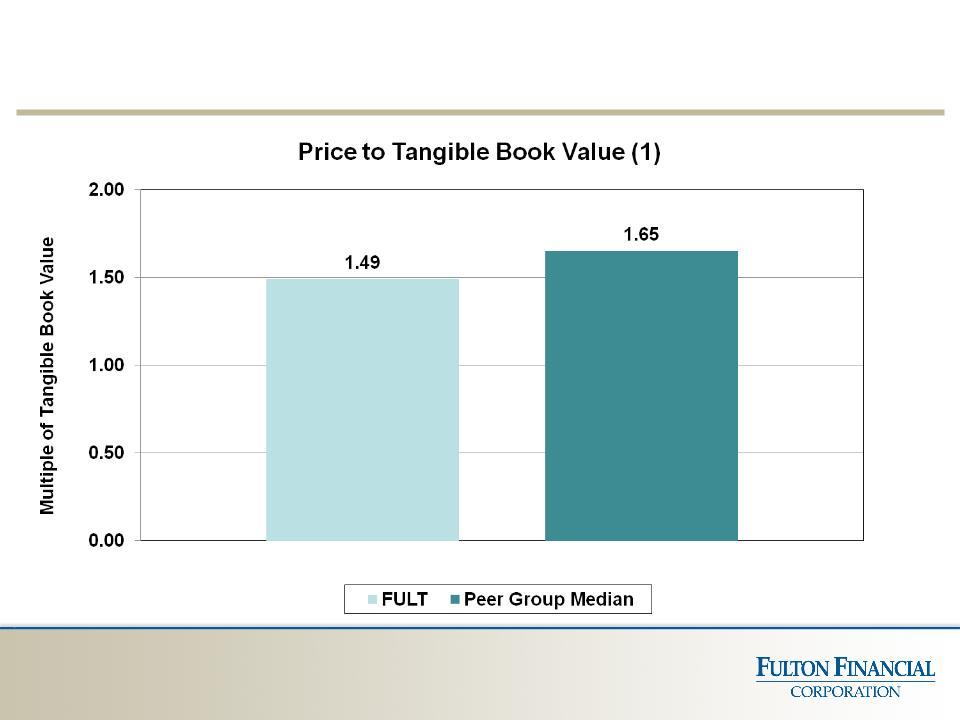
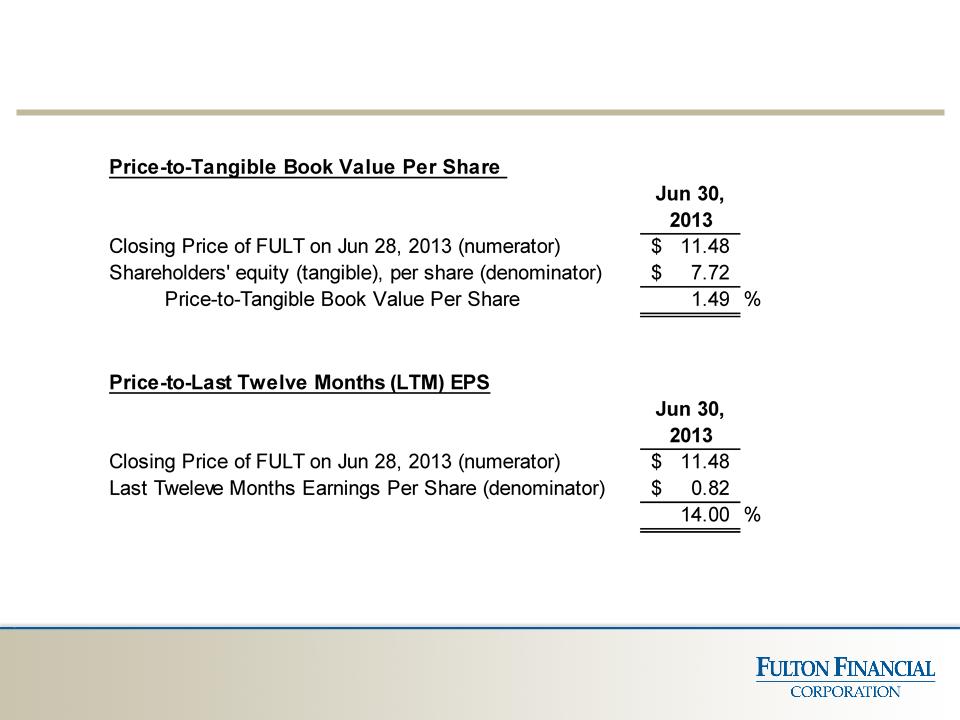
Price Multiple vs. Peer Group
29
Notes: Peer Tangible Book Value as of 6/30/2013. Source: SNL Financial LC
FULT Tangible Book Value as of 6/30/2013.
(1) Non-GAAP based financial measure. Please refer to the calculation and management’s reasons for using this
measure on the slide titled “Non-GAAP Reconciliation” at the end of this presentation.
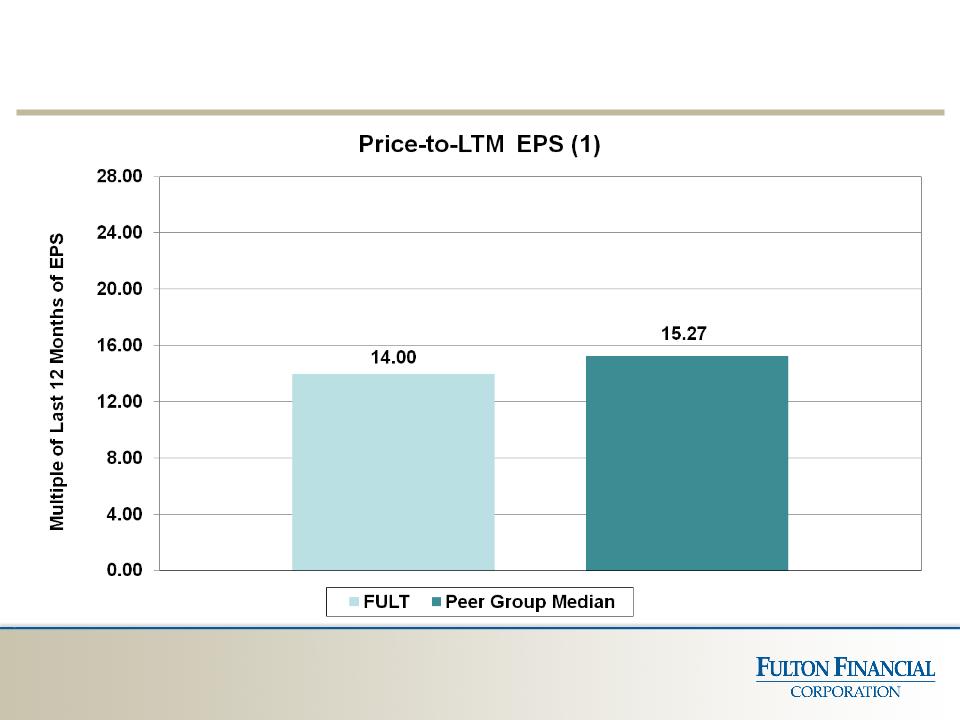
Price Multiple vs. Peer Group
30
Notes: Peer Tangible Book Value as of 6/30/2013. Source: SNL Financial LC
FULT Tangible Book Value as of 6/30/2013.
(1) Non-GAAP based financial measure. Please refer to the calculation and management’s reasons for using this
measure on the slide titled “Non-GAAP Reconciliation” at the end of this presentation.
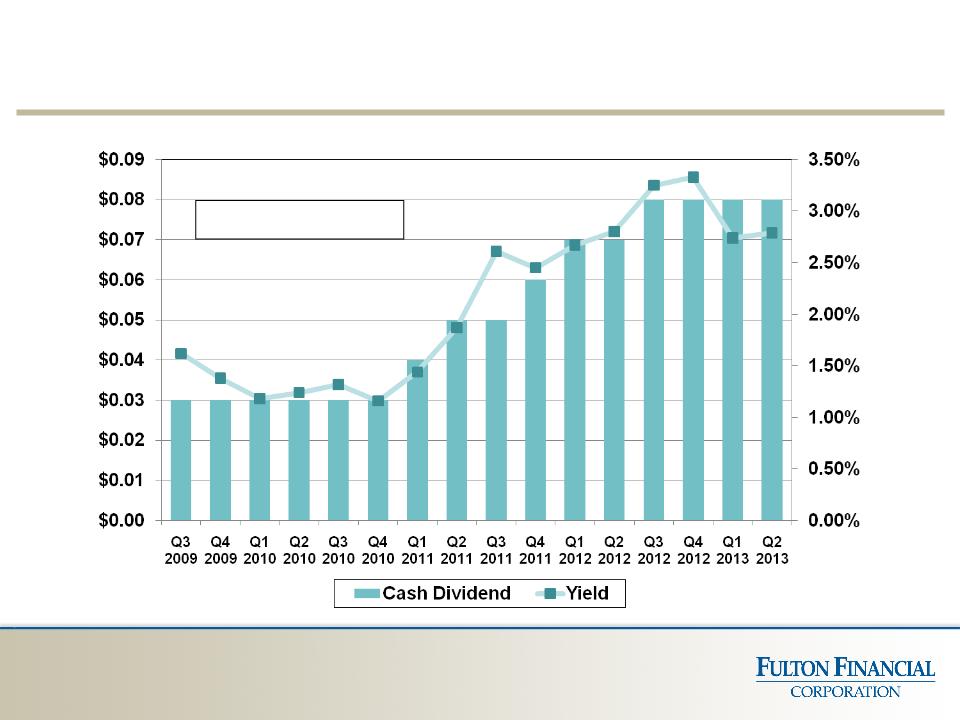
FULT - Cash Dividend and Yield (1)
31
(1) Annualized dividend rate per share divided by period-end stock price.
(2) Compounded annual growth rate in cash dividend from June 30, 2009 to June 30, 2013.
CAGR (2) = 27.8%

§ New program authorized: January 2013
and extended in June 2013
and extended in June 2013
§ Purchase of up to 8 million shares
through September 30, 2013
through September 30, 2013
§ About 4 % of outstanding shares
§ Shares repurchased through June 30,
2013: 6.4 million
2013: 6.4 million
§ Average purchase price: $ 11.11
Stock Repurchase Program
32

8. Expense Management
Priorities: Efficiency
33
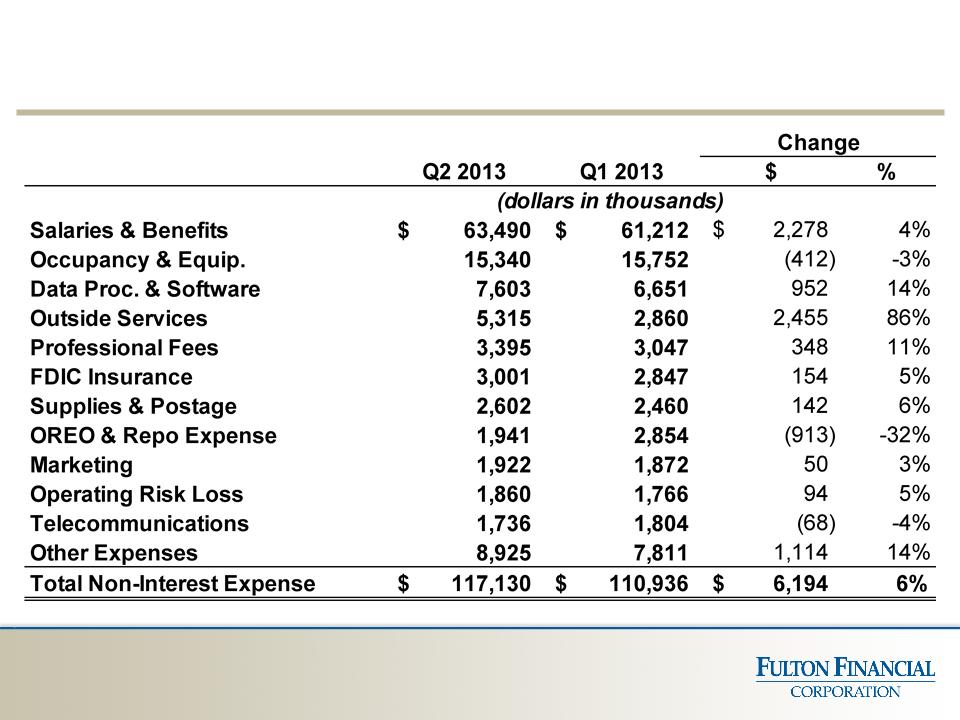
Non-Interest Expenses
34
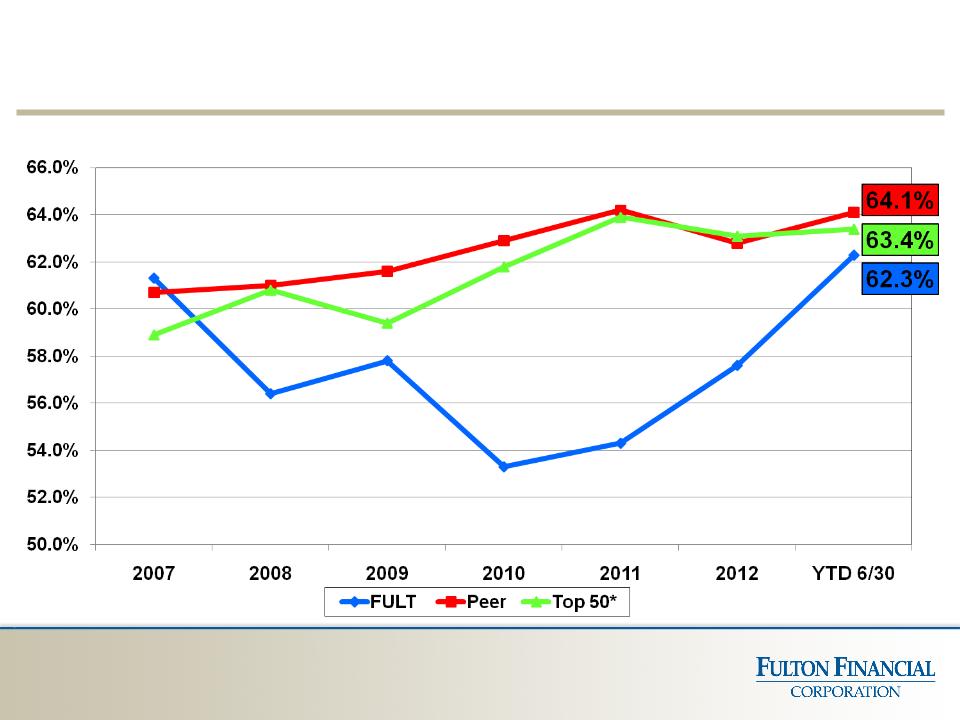
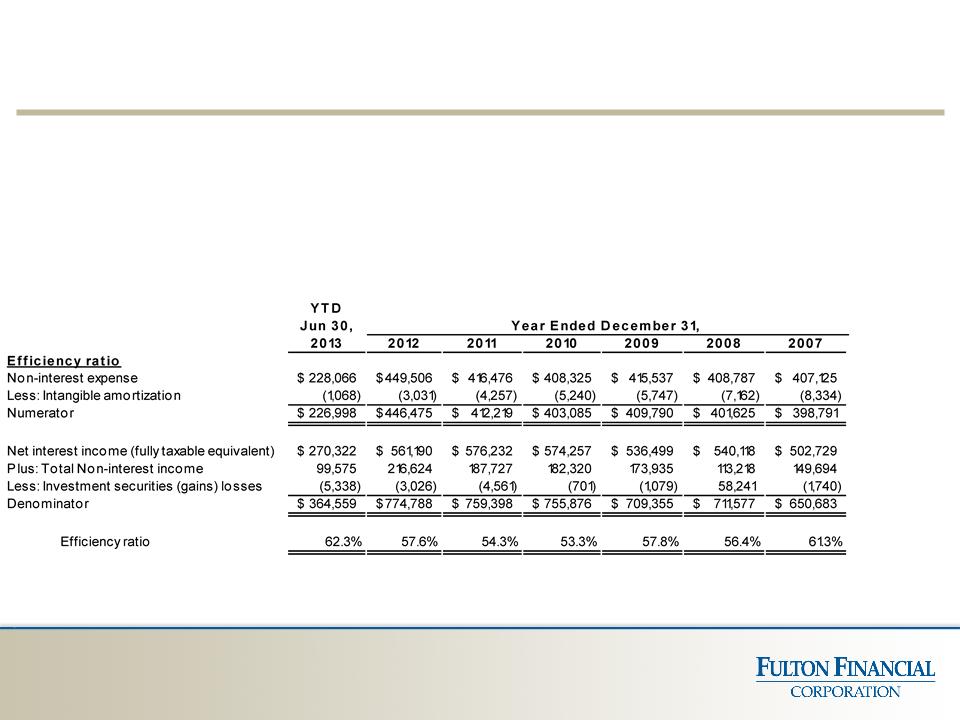
Efficiency Ratio (1)
35
(1) Non-GAAP based financial measure. Please refer to the calculation and management’s reasons for using this measure on the slide titled
“Non-GAAP Reconciliation” at the end of this presentation.
“Non-GAAP Reconciliation” at the end of this presentation.
* Comprised of the 50 largest publicly traded domestic banks/thrifts in assets size as of December 31,2012. Excludes credit card
companies.
companies.
Source: SNL Financial LC

Supplemental Information
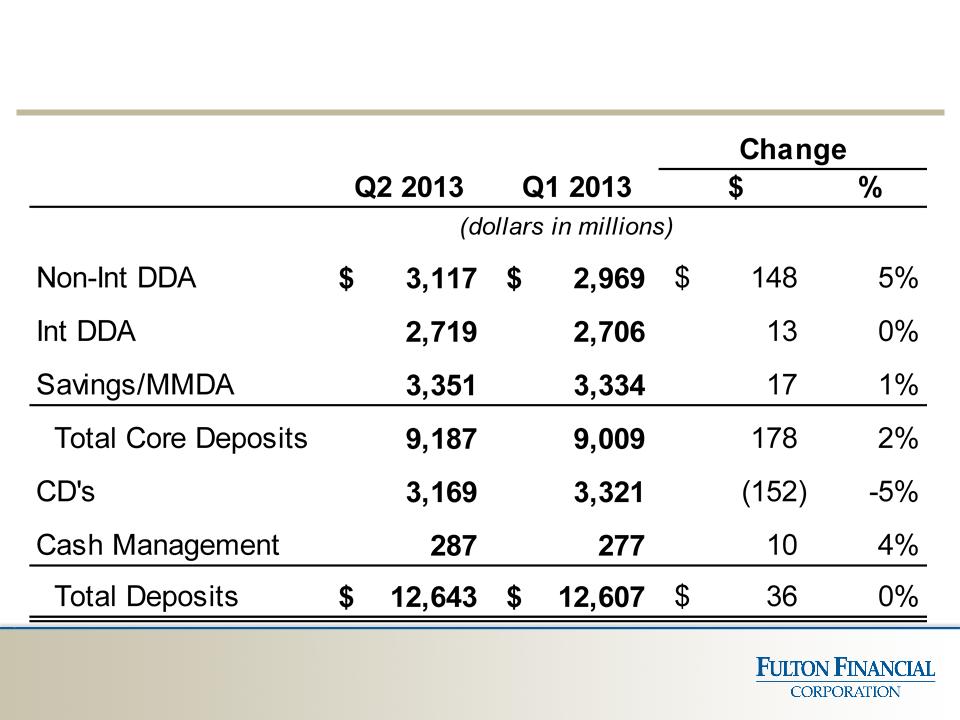
Average Deposits
37
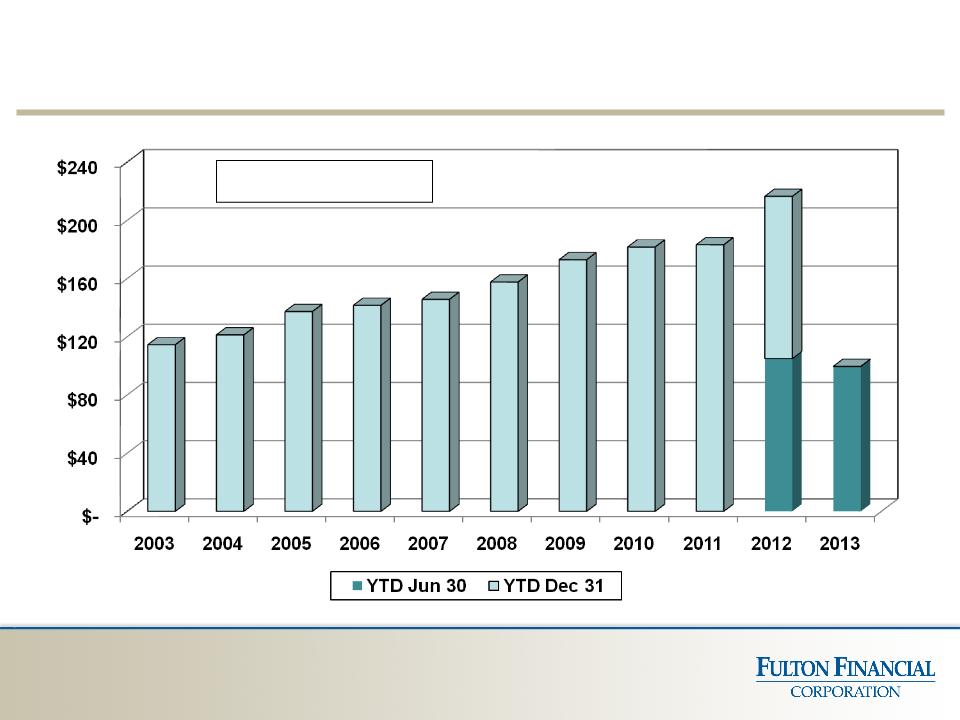
Non-Interest Income (in millions)
38
CAGR (1) = 7.2%
(1) Compounded annual growth rate from year-ended December 31, 2003 to year-ended
December 31, 2012.
December 31, 2012.
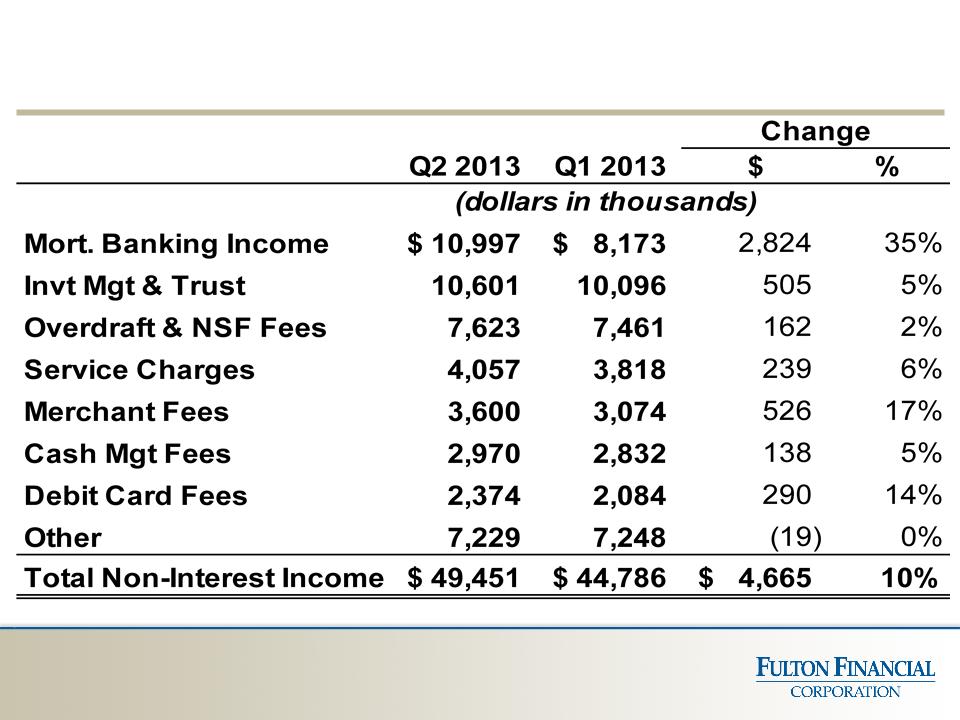
Non-Interest Income
39
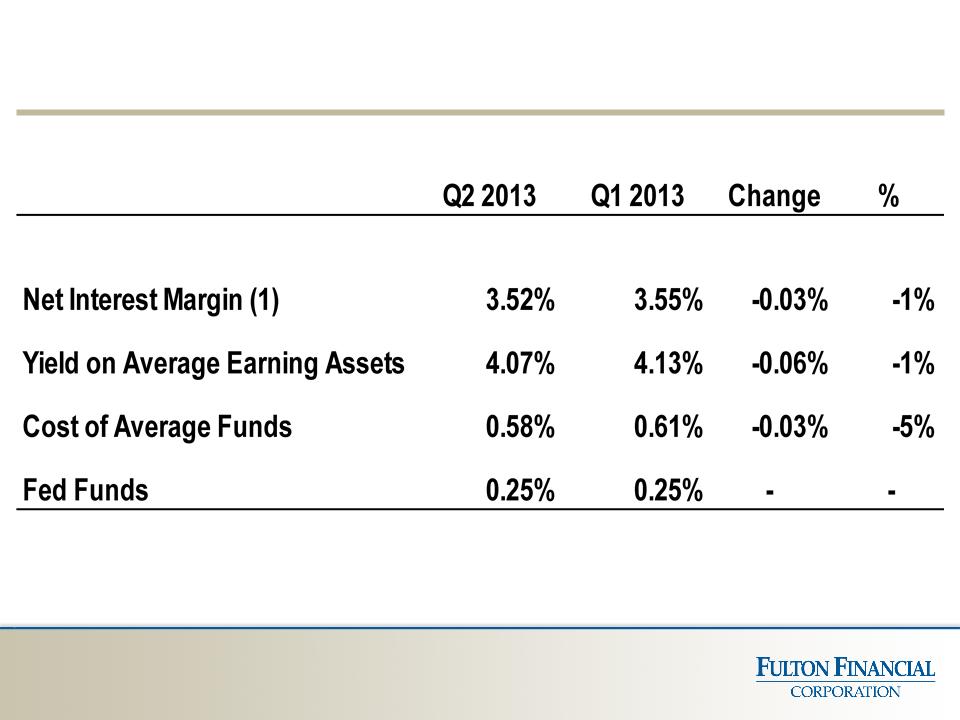
Interest Rates
40
(1) Fully-taxable equivalent
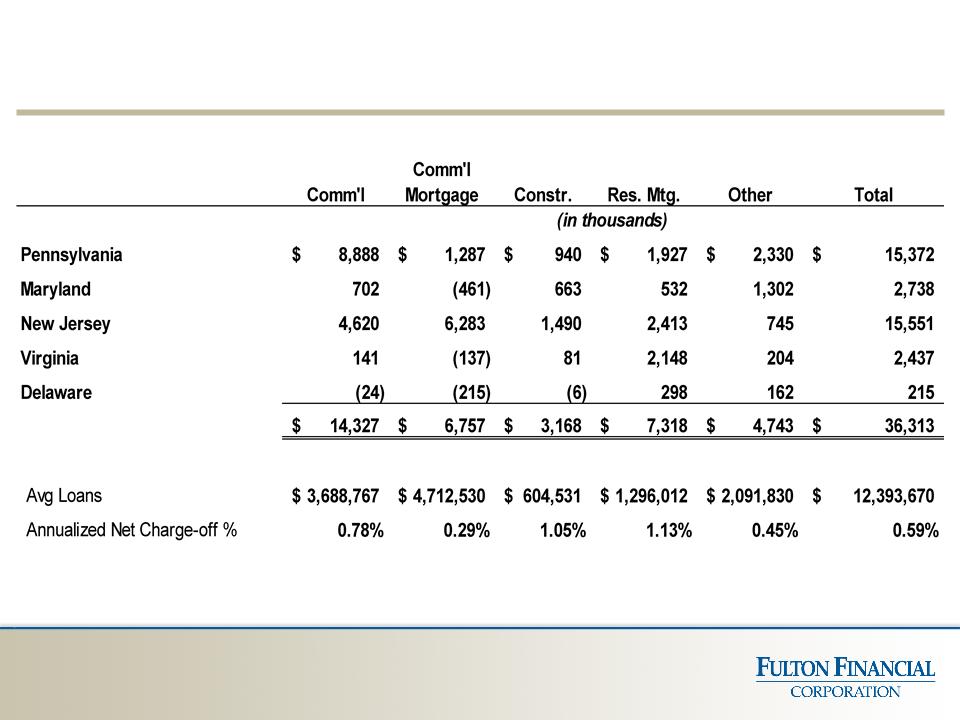
Net Charge-offs (Recoveries) (YTD June 2013)
41
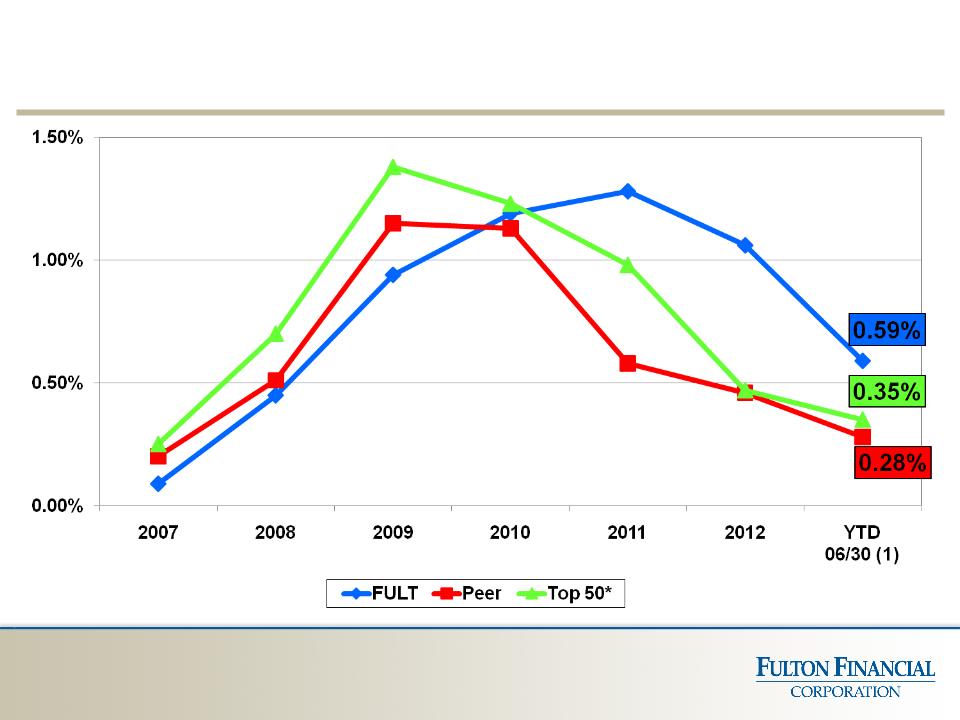
Net Charge-Offs To Average Loans
42
* Comprised of the 50 largest publicly traded domestic banks/thrifts in assets size as of December 31,2012.
Excludes credit card companies.
Excludes credit card companies.
Source: SNL Financial LC
(1) Annualized.
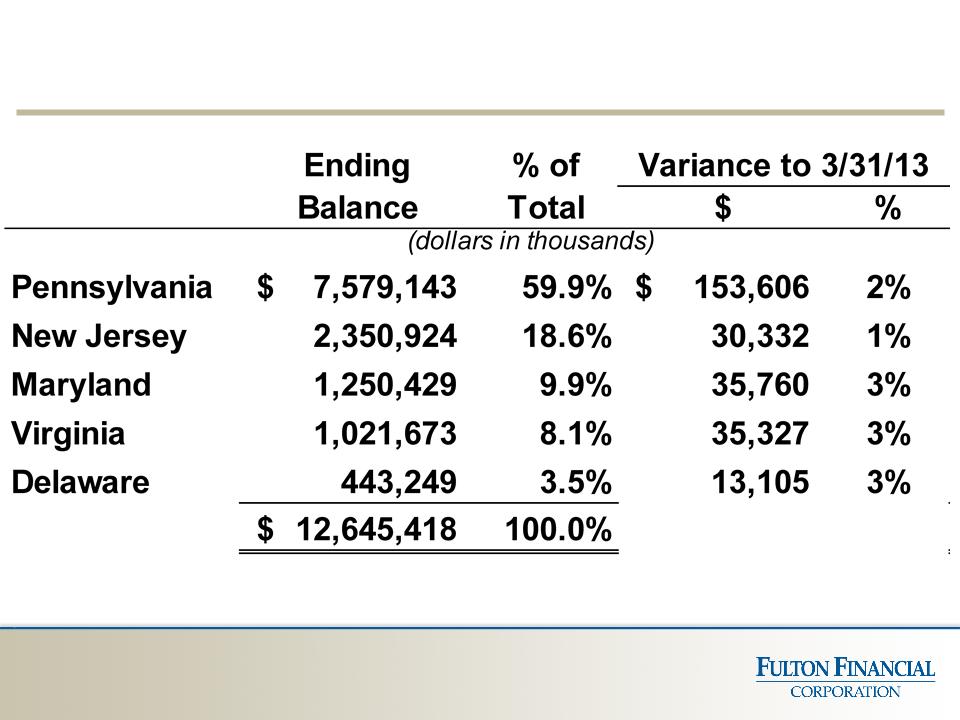
Loan Distribution by State (6/30/13)
43
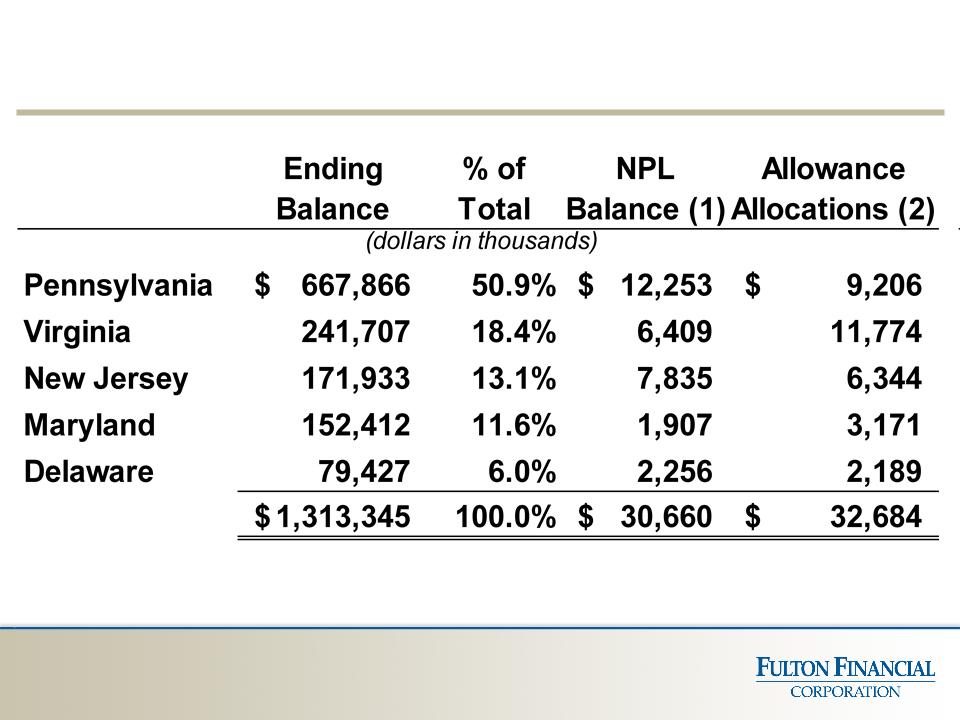
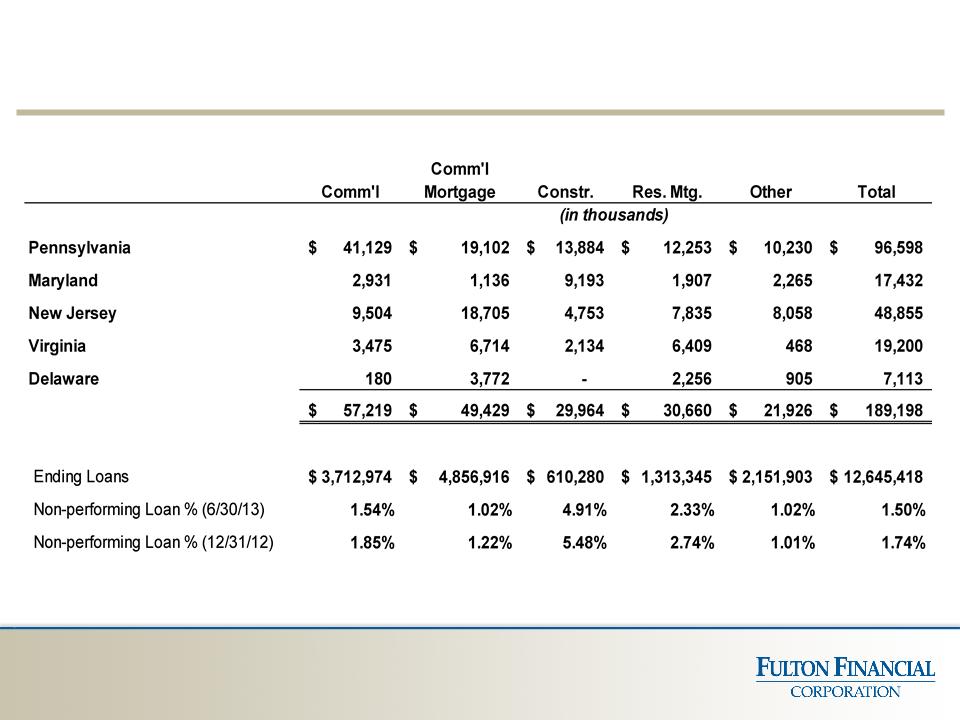
Residential Mortgages (6/30/13)
44
(1) NPL - Non-performing loans. Includes accruing loans ≥ 90 days past due and non-accrual loans.
(2) Related allowance for loan losses allocations.

Fulton Mortgage Company
§ New applications received during Q2 2013 were
$678 million compared to $701 million during Q1
2013
$678 million compared to $701 million during Q1
2013
§ Pipeline* $368 million at June 30, 2013 vs. $386
million at March 31, 2013
million at March 31, 2013
§ The approved loan pipeline at the end of Q2 2013 was
$104 million
$104 million
§ Percentage of the pipeline that has locked in an interest
rate as of June 30, 2013: 86%
rate as of June 30, 2013: 86%
§ 52% purchase / 48% refinancing during Q2 2013
45
* Defined as loans in process not yet closed with an application date prior to the end of the quarter. Loans in
the following stages will be included: application received, pre-underwriting, in processing, in underwriting,
approved, suspended, and pre-closing.
the following stages will be included: application received, pre-underwriting, in processing, in underwriting,
approved, suspended, and pre-closing.
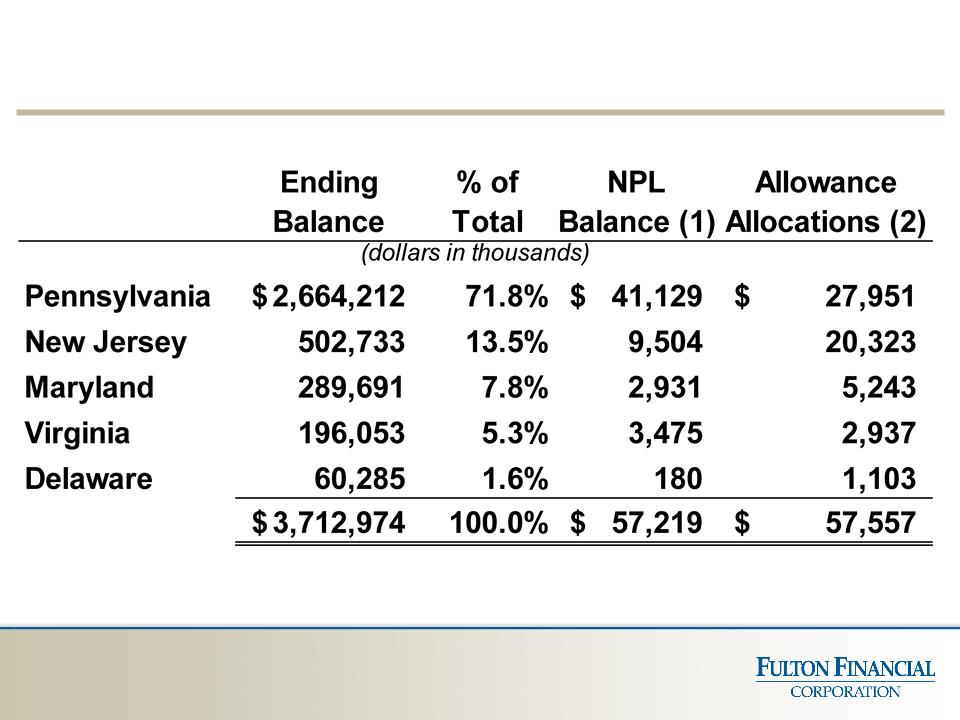
Commercial Loans (6/30/13)
46
(1) NPL - Non-performing loans. Includes accruing loans ≥ 90 days past due and non-accrual loans.
(2) Related allowance for loan losses allocations.
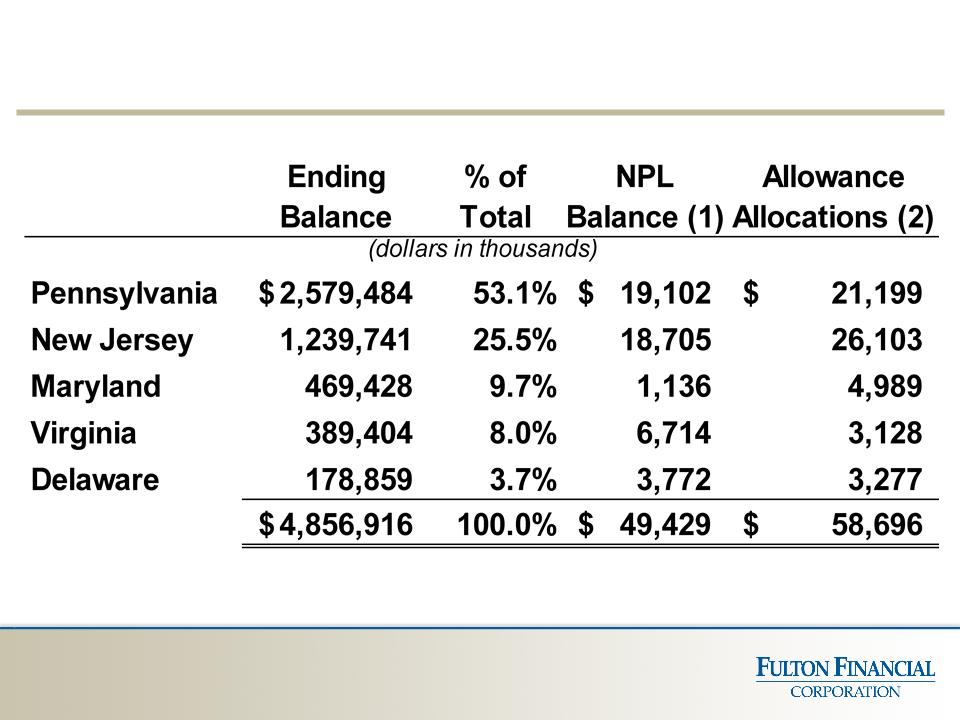
Commercial Mortgages (6/30/13)
47
(1) NPL - Non-performing loans. Includes accruing loans ≥ 90 days past due and non-accrual loans.
(2) Related allowance for loan losses allocations.
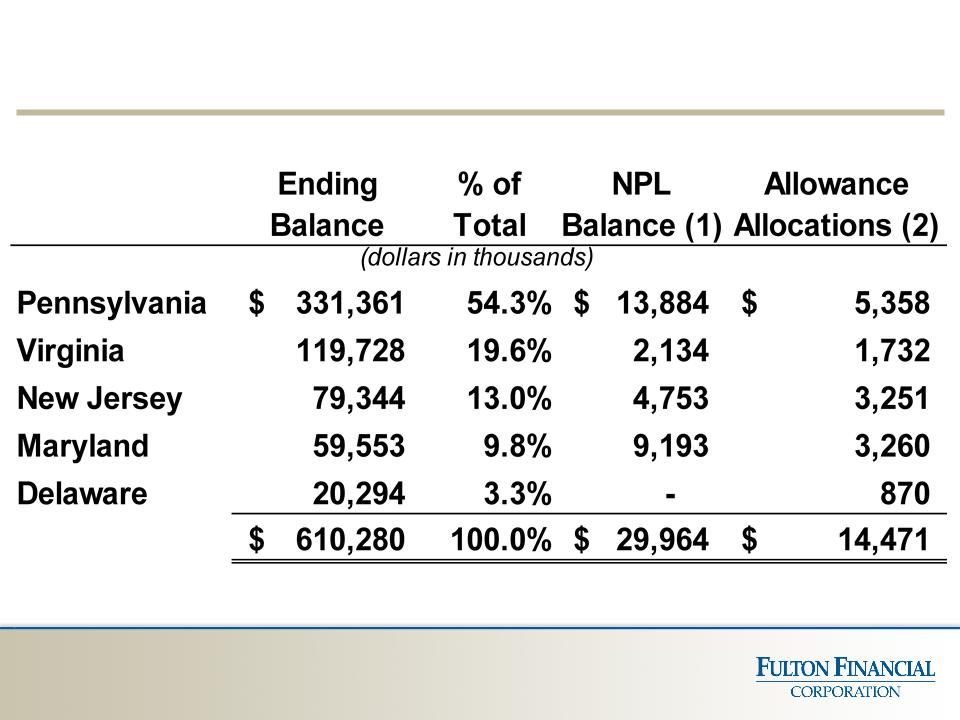
Construction Loans (6/30/13)
48
(1) NPL - Non-performing loans. Includes accruing loans ≥ 90 days past due and non-accrual loans.
(2) Related allowance for loan losses allocations.
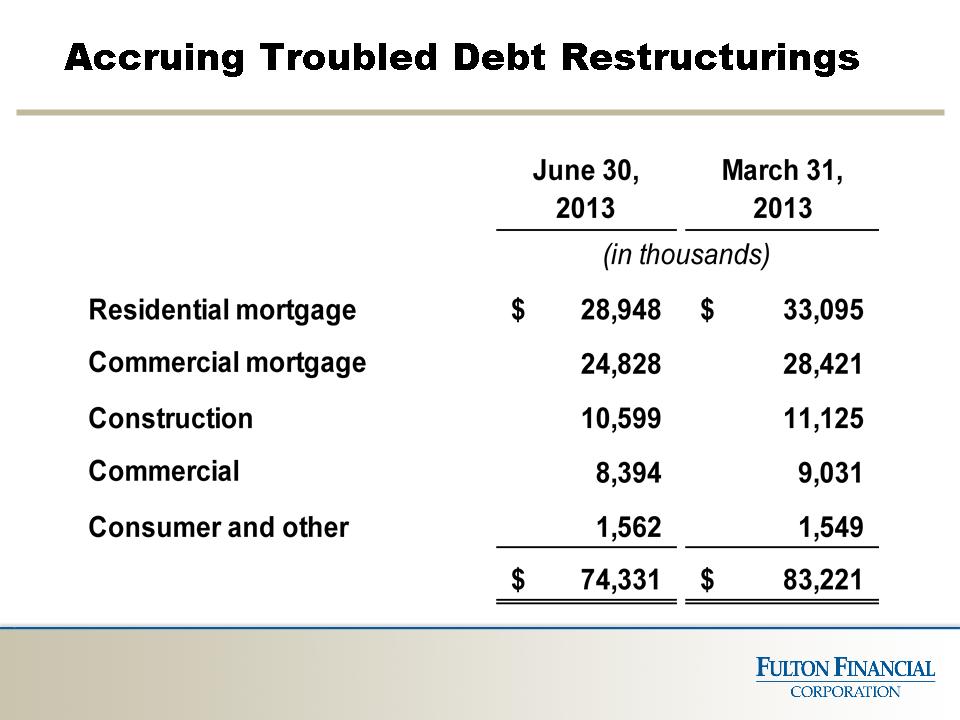
49
Note: Excludes non-accrual troubled debt restructurings.
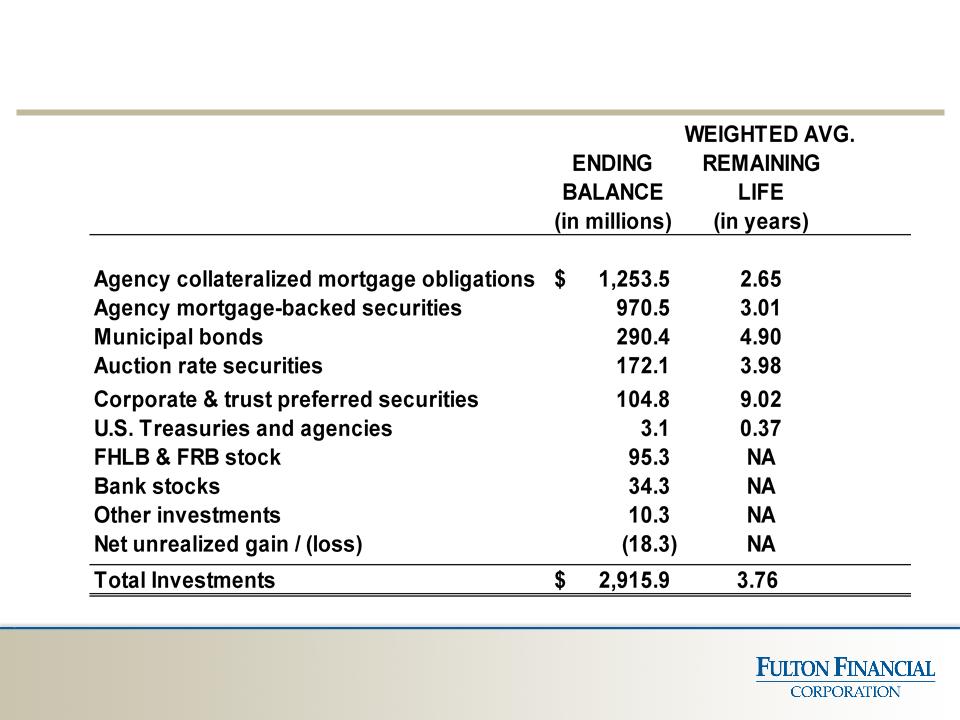
Investment Portfolio (6/30/13)
50
Monthly Investment Yield:2.88%
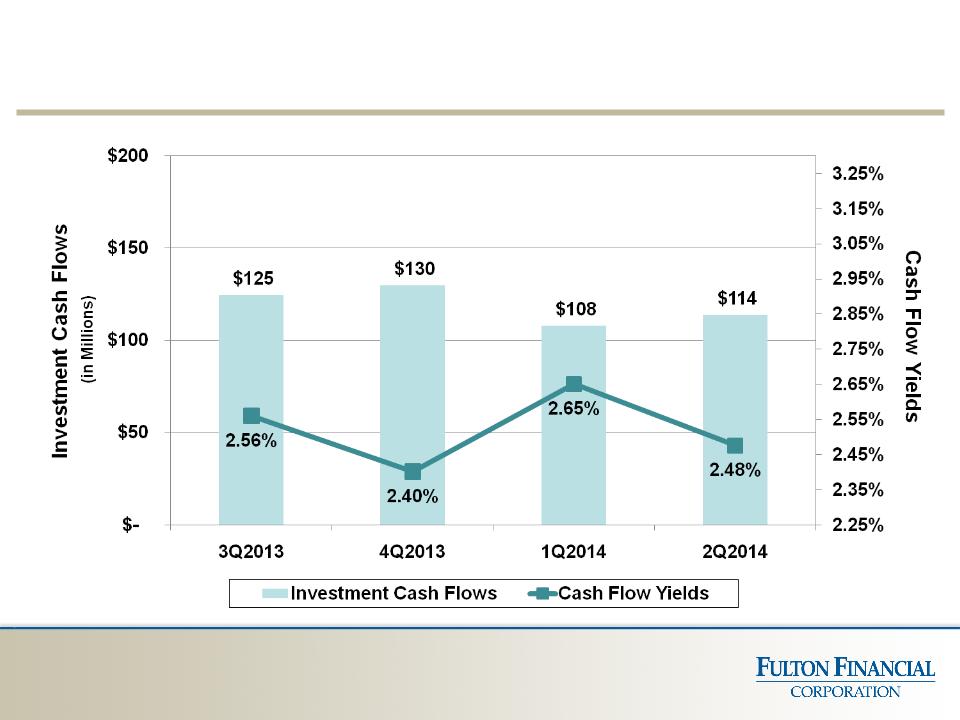
Projected Investment Security Cash Flows
51
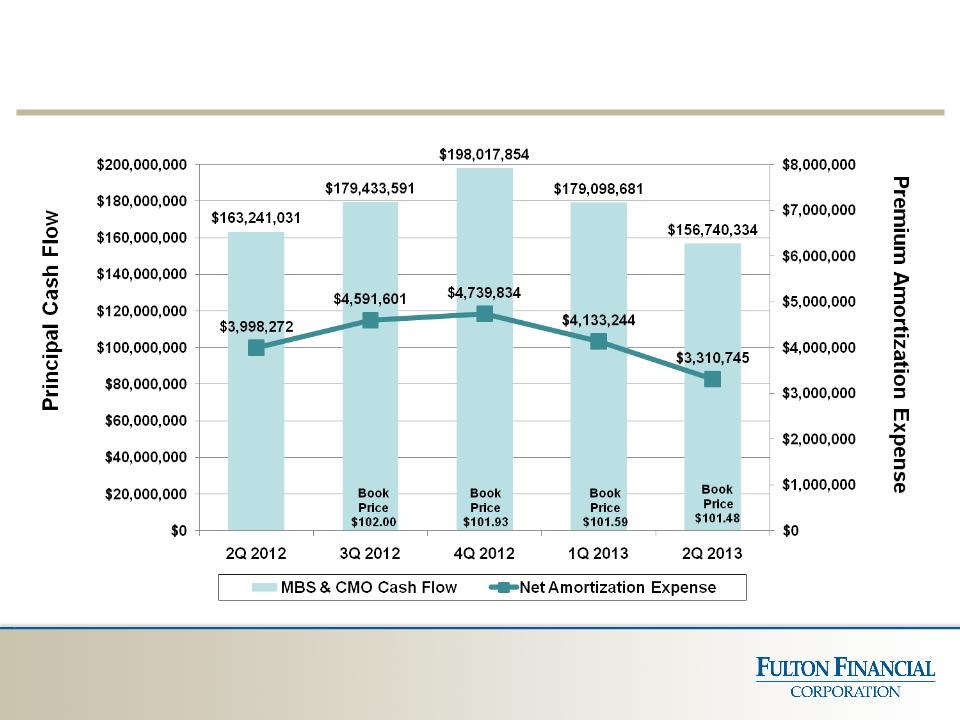
Investment MBS & CMO Cash Flows (2012-2013)
52
Book
Price
$102.14
Price
$102.14
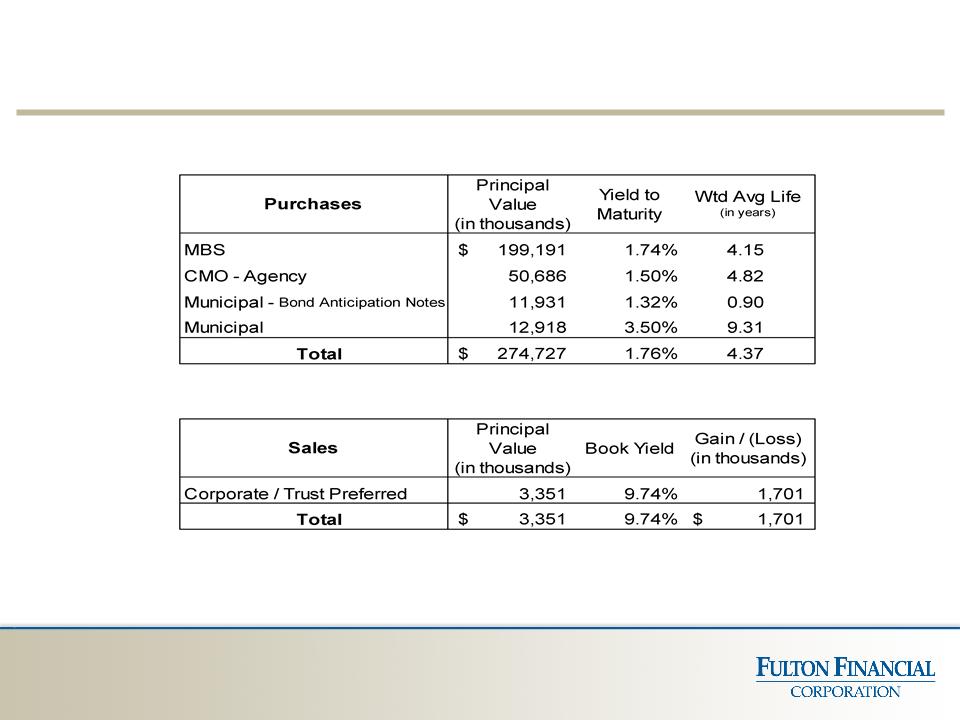
Investment Portfolio - Transactions (2nd Quarter 2013)
53
Does not include $1.0 million bank stock gains for the 2nd quarter of 2013
or $136,000 of gains related to 1Q 2013 sales
or $136,000 of gains related to 1Q 2013 sales
Non-GAAP Reconciliation
54
Note: The Corporation has presented the following non-GAAP (Generally Accepted Accounting Principals) financial measures
because it believes that these measures provide useful and comparative information to assess trends in the Corporation's quarterly
results of operations. Presentation of these non-GAAP financial measures is consistent with how the Corporation evaluates its
performance internally and these non-GAAP financial measures are frequently used by securities analysts, investors and other
interested parties in the evaluation of companies in the Corporation's industry. Investors should recognize that the Corporation's
presentation of these non-GAAP financial measures might not be comparable to similarly-titled measures of other companies. These
non-GAAP financial measures should not be considered a substitute for GAAP basis measures and the Corporation strongly
encourages a review of its condensed consolidated financial statements in their entirety.
Non-GAAP Reconciliation (con’t)
55
Non-GAAP Reconciliation (con’t)
56
Non-GAAP Reconciliation (con’t)
57

Fulton Financial Corporation
One Penn Square
Lancaster, PA 17602
www.fult.com
Version 2013-08-09