Fulton Financial Corporation
Presentation to:
McDonald Investments
June 11, 2003
1
Safe Harbor statement
| · | The following presentation may contain forward-looking statements about Fulton Financial Corporation’s growth and acquisition strategies, new products and services, and future financial performance, including earnings and dividends per share, return on average assets, return on average equity, efficiency ratio and capital ratio. Forward-looking statements are encouraged by the Private Securities Litigation Reform Act of 1995. |
| · | Such forward-looking information is based upon certain underlying assumptions, risks and uncertainties. Because of the possibility of change in the underlying assumptions, actual results could differ materially from these forward-looking statements. Risks and uncertainties that may affect future results include: pricing pressures on loans and deposits, actions of bank and non-bank competitors, changes in local and national economic conditions, changes in regulatory requirements, actions of the Federal Reserve Board, the Corporation’s success in merger and acquisition integration, and customers’ acceptance of the Corporation’s products and services. |
2
Fulton Financial profile
| n | Regional financial holding company (formed in 1982) |
| n | 10 bank subsidiaries; 3 financial services subsidiaries |
| n | $8.4 billion in assets (Rank: 60th as of 3/31/03) |
| n | $1.9 billion in market cap (Rank: 47th as of 3/31/03) |
| n | 2nd largest commercial bank headquartered in Third Federal Reserve District |
| n | Lead bank founded in 1882 |
Fulton Financial Corporation
3
Our top priorities
| n | Sustaining strong earnings growth |
| n | Maintaining high credit quality |
| n | Creating financial success with clients |
| n | Creating career success with our employees |
| n | Enriching the communities we serve |
| n | Growing non-interest income |
Fulton Financial Corporation
4
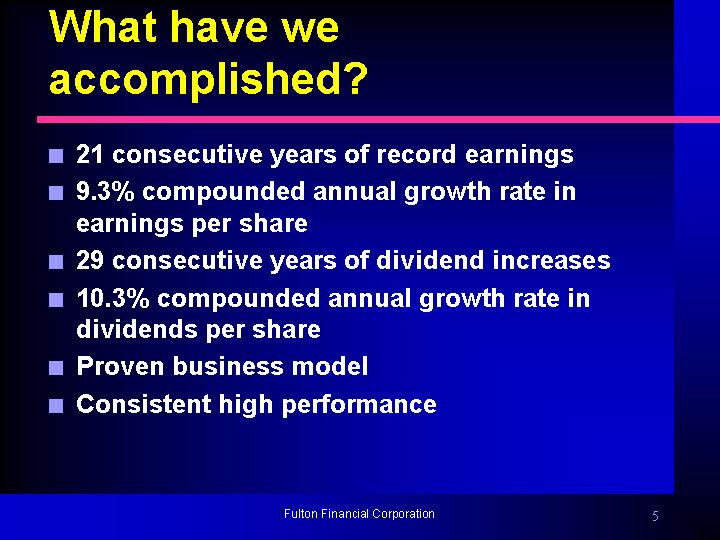
What have we accomplished?
| n | 21 consecutive years of record earnings |
| n | 9.3% compounded annual growth rate in earnings per share |
| n | 29 consecutive years of dividend increases |
| n | 10.3% compounded annual growth rate in dividends per share |
| n | Proven business model |
| n | Consistent high performance |
Fulton Financial Corporation
5
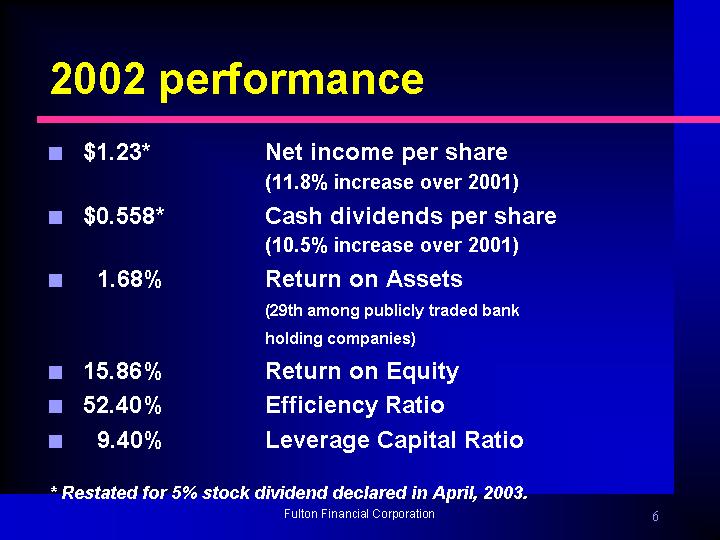
2002 performance
n $1.23* | Net income per share | |||||
| (11.8% increase over 2001) | ||||||
n $0.558* | Cash dividends per share | |||||
| (10.5% increase over 2001) | ||||||
n 1.68% | Return on Assets | |||||
| (29th among publicly traded bank | ||||||
| holding companies) | ||||||
n 15.86% | Return on Equity | |||||
n 52.40% | Efficiency Ratio | |||||
n 9.40% | Leverage Capital Ratio |
* Restated for 5% stock dividend declared in April, 2003.
Fulton Financial Corporation
6
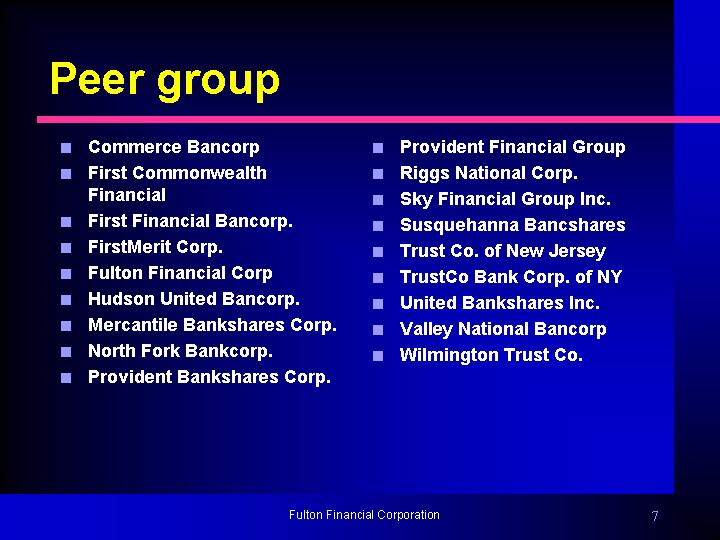
Peer group
n Commerce Bancorp | n Provident Financial Group | |
n First Commonwealth Financial | n Riggs National Corp. | |
n First Financial Bancorp. | n Sky Financial Group Inc. | |
n FirstMerit Corp. | n Susquehanna Bancshares | |
n Fulton Financial Corp | n Trust Co. of New Jersey | |
n Hudson United Bancorp. | n TrustCo Bank Corp. of NY | |
n Mercantile Bankshares Corp. | n United Bankshares Inc. | |
n North Fork Bankcorp. | n Valley National Bancorp | |
n Provident Bankshares Corp. | n Wilmington Trust Co. | |
Fulton Financial Corporation
7
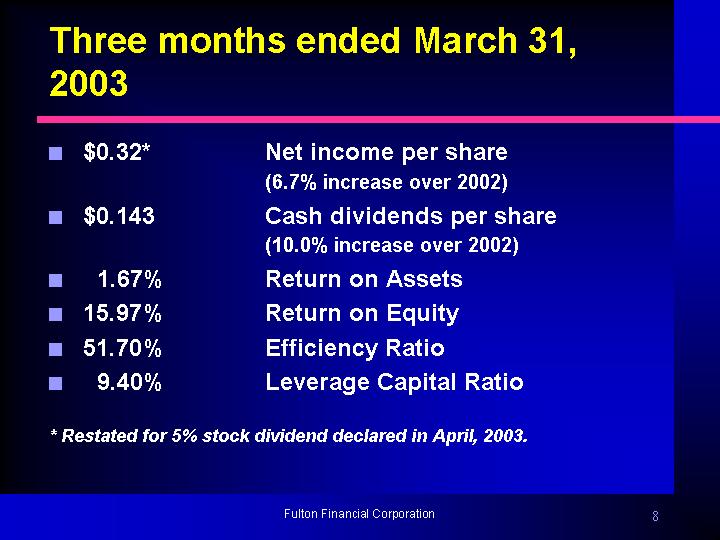
Three months ended March 31, 2003
n $0.32* | Net income per share | |
| (6.7% increase over 2002) | ||
n 0.143 | Cash dividends per share | |
| (10.0% increase over 2002) | ||
n 1.67% | Return on Assets | |
n 15.97% | Return on Equity | |
n 51.70% | Efficiency Ratio | |
n 9.40% | Leverage Capital Ratio | |
* Restated for 5% stock dividend declared in April, 2003.
Fulton Financial Corporation
8
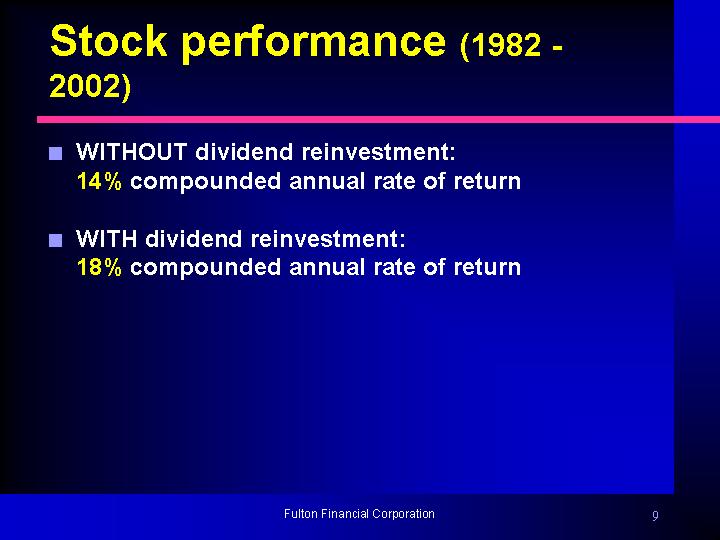
Stock performance (1982 – 2002)
| n | WITHOUT dividend reinvestment: |
14% compounded annual rate of return
| n | WITH dividend reinvestment: |
18% compounded annual rate of return
Fulton Financial Corporation
9
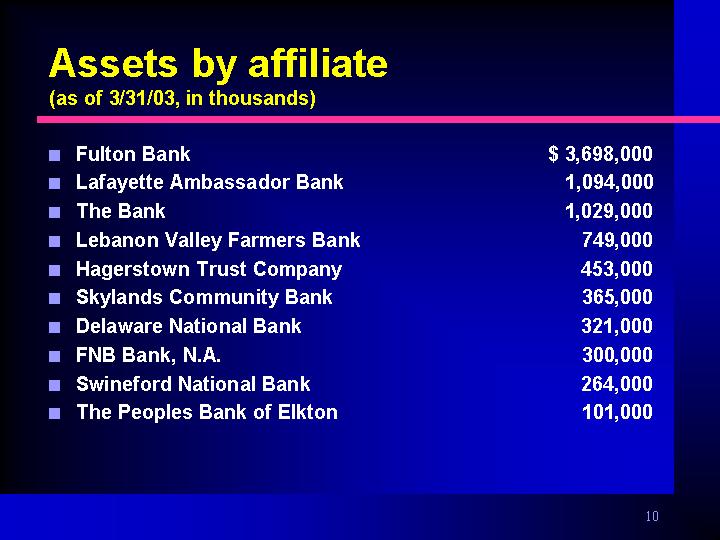
Assets by affiliate
(as of 3/31/03, in thousands)
n Fulton Bank | $ | 3,698,000 | |
n Lafayette Ambassador Bank | 1,094,000 | ||
n The Bank | 1,029,000 | ||
n Lebanon Valley Farmers Bank | 749,000 | ||
n Hagerstown Trust Company | 453,000 | ||
n Skylands Community Bank | 365,000 | ||
n Delaware National Bank | 321,000 | ||
n FNB Bank, N.A. | 300,000 | ||
n Swineford National Bank | 264,000 | ||
n The Peoples Bank of Elkton | 101,000 |
10
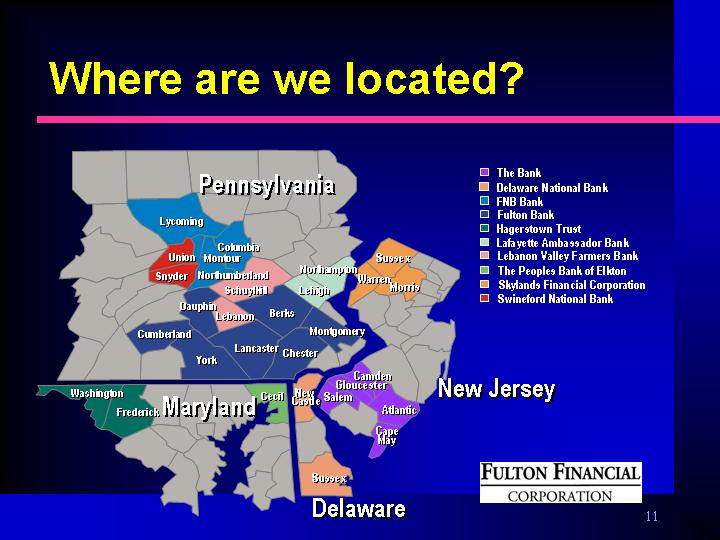
Where are we located?
| n | The Bank |
| n | Delaware National Bank |
| n | FNB Bank |
| n | Fulton Bank |
| n | Hagerstown Trust |
| n | Lafayette Ambassador Bank |
| n | Lebanon Valley Farmers Bank |
| n | The Peoples Bank of Elkton |
| n | Skylands Financial Corporation |
| n | Swineford National Bank |
11
Building on our key strengths
| n | Well-developed acquisition strategy |
| n | Independent network of community banks/ decentralized operating philosophy |
| n | Talented and dedicated employees |
| n | Sound risk management |
| n | Strong capital position |
| n | Coordinated product development process |
| n | Common technology/operations platform and investment/trust services platform |
Fulton Financial Corporation
12

Building on our strengths
n Well-developed acquisition strategy | = | n Continued growth and strong performance |
Fulton Financial Corporation
13
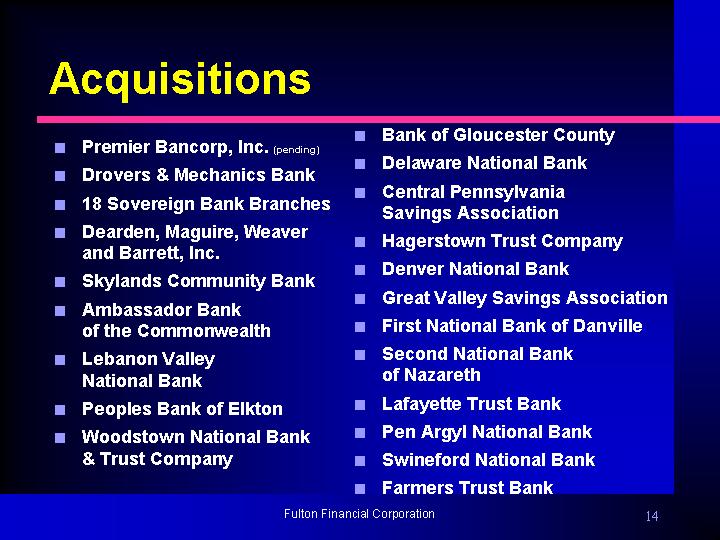
Acquisitions
n Premier Bancorp, Inc. (pending) | n Bank of Gloucester County | |
n Drovers & Mechanics Bank | n Delaware National Bank | |
n 18 Sovereign Bank Branches | n Central Pennsylvania Savings Association | |
n Dearden, Maguire, Weaver and Barrett, Inc. | n Hagerstown Trust Company | |
n Skylands Community Bank | n Denver National Bank | |
n Ambassador Bank of the Commonwealth | n Great Valley Savings Association | |
n Lebanon Valley National Bank | n First National Bank of Danville | |
n Peoples Bank of Elkton | n Second National Bank of Nazareth | |
n Woodstown National Bank & Trust Company | n Lafayette Trust Bank | |
n Pen Argyl National Bank | ||
n Swineford National Bank | ||
n Farmers Trust Bank | ||
Fulton Financial Corporation
14
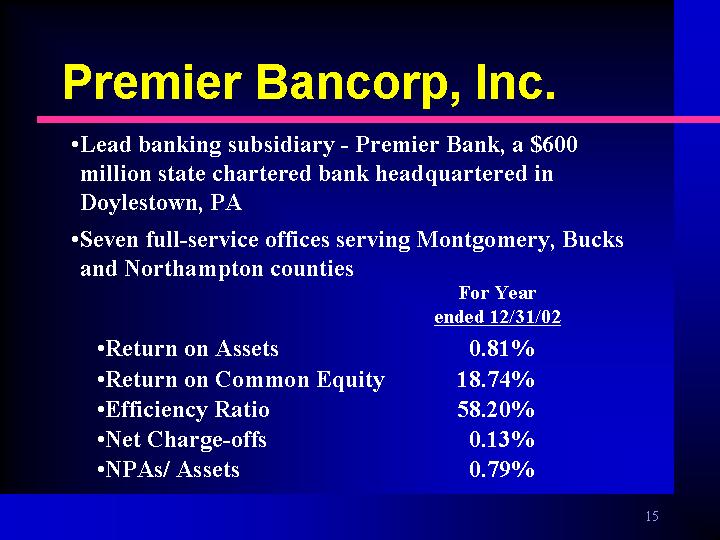
Premier Bancorp, Inc.
| • | Lead banking subsidiary – Premier Bank, a $600 million state chartered bank headquartered in Doylestown, PA |
| • | Seven full-service offices serving Montgomery, Bucks and Northampton counties |
For Year ended 12/31/02 | ||
• Return on Assets | 0.81% | |
• Return on Common Equity | 18.74% | |
• Efficiency Ratio | 58.20% | |
• Net Charge-offs | 0.13% | |
• NPAs/ Assets | 0.79% |
15
Premier Bancorp, Inc.
— An excellent strategic fit
| n | Historical double-digit growth in deposits, loans, fee income and net income |
| n | Strong asset quality |
| n | Premier branches are contiguous to current affiliate bank markets |
16
What do we look for?
| n | High growth areas |
| n | Strong performance |
| n | Asset quality |
| n | Talented people |
Fulton Financial Corporation
17
New acquisitions
What changes?
| n | Replicate strong credit culture |
| n | Loan review |
| n | Investments |
| n | Asset/liability management |
| n | Compliance |
| n | Common operating platform |
| n | Audit |
Fulton Financial Corporation
18

New acquisitions
What stays the same?
| n | Bank name |
| n | Board of Directors |
| n | Management team |
| n | Employees |
Fulton Financial Corporation
19
Benefits to new affiliates
| n | Increased non-interest income due to introduction of new products and services |
| n | Additional capital |
| n | Increased lending capacity |
| n | Reduced expenses |
| n | Management focus on growth, customer service and sales |
| n | Proven merger/conversion expertise |
Fulton Financial Corporation
20
Building on our strengths
n Independent community banks and decentralized operating philosophy | = | n Customer retention |
Fulton Financial Corporation
21
Survey results
| n | 96% of customers are |
| Extremely or Very Satisfied with their Fulton Financial affiliate bank |
22
Building on our strengths
n Talented and dedicated people | = | n Outstanding customer service | ||
n Superior implementation of Strategic Plan |
Fulton Financial Corporation
23

Employee opinion survey(June 2002)
n Customer service | n Training and development | |
n Management team performance | n Sales orientation | |
n Company image and mission | n Work effectiveness | |
n Team orientation | n Pay and benefits | |
n Technology and systems | n Employee Satisfaction | |
(Survey administered by BAI Survey Services)
24
Building on our strengths
n Sound risk management | = | n Limited exposure to loss |
Fulton Financial Corporation
25
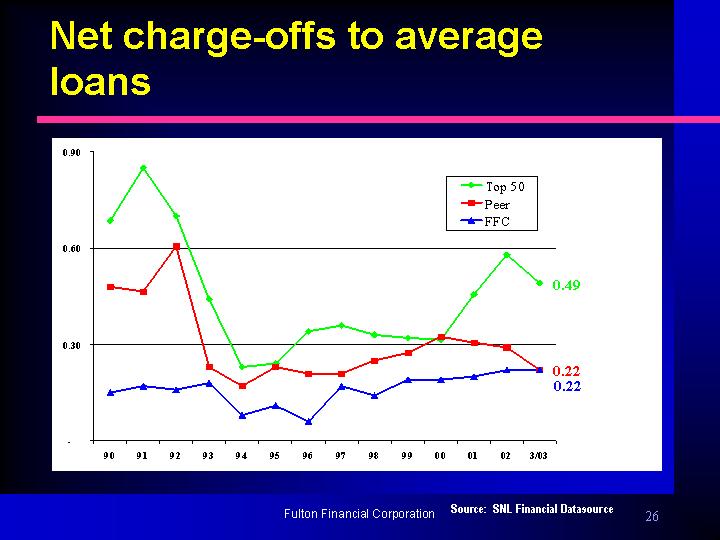
Net charge-offs to average loans
[GRAPH]
Source: SNL Financial Datasource
Fulton Financial Corporation
26
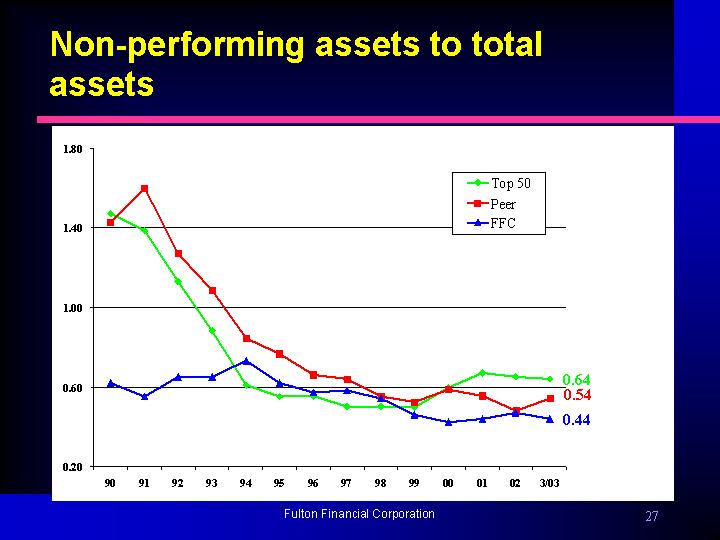
Non-performing assets to total assets
[GRAPH]
Fulton Financial Corporation
27
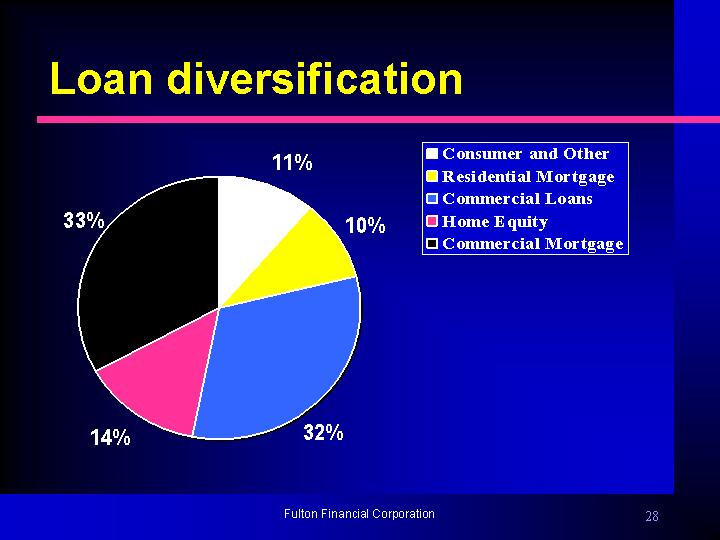
Loan diversification
[PIE CHART]
n Consumer and Other |
n Residential Mortgage |
n Commercial Loans |
n Home Equity |
n Commercial Mortgage |
Fulton Financial Corporation
28

Experience of our lenders
| n | The officers who oversee all lending have each worked in this capacity at Fulton for more than 20 years. |
| n | This consistency should enable Fulton Financial to maintain its high asset quality in the future. |
29
Summary of larger loans
| n | Only 20 relationships with commitments to lend of $20 million or more |
| n | Maximum individual commitment of $30 million |
| n | Average commercial loan commitment is $550,000 |
| n | Loans and corresponding relationships are within Fulton’s geographical market area |
Fulton Financial Corporation
30
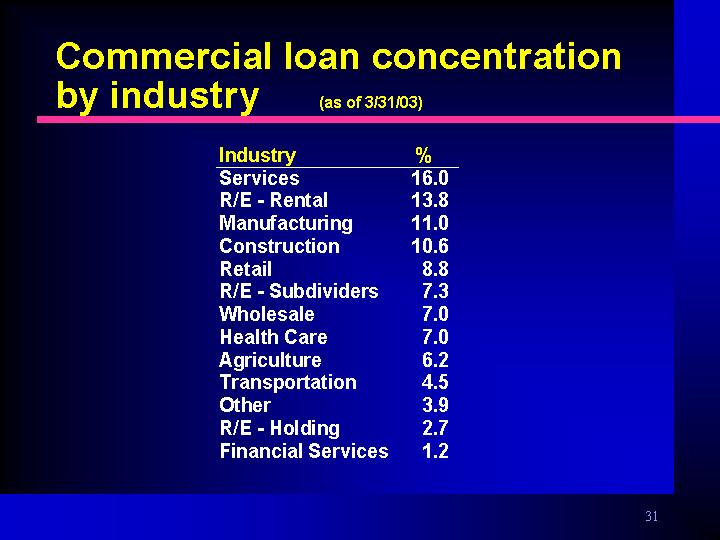
Commercial loan concentration by industry(as of 3/31/03)
Industry | % | |
Services | 16.0 | |
R/E—Rental | 13.8 | |
Manufacturing | 11.0 | |
Construction | 10.6 | |
Retail | 8.8 | |
R/E—Subdividers | 7.3 | |
Wholesale | 7.0 | |
Health Care | 7.0 | |
Agriculture | 6.2 | |
Transportation | 4.5 | |
Other | 3.9 | |
R/E—Holding | 2.7 | |
Financial Services | 1.2 |
Fulton Financial Corporation
31
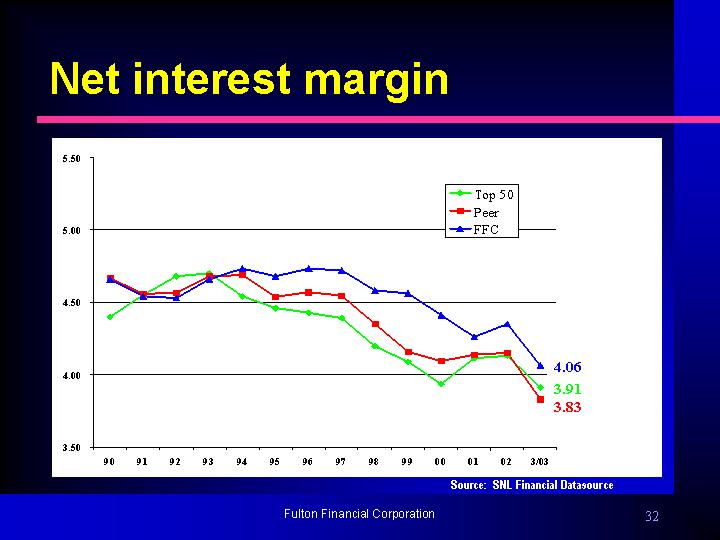
Net interest margin
[CHART]
Fulton Financial Corporation
32
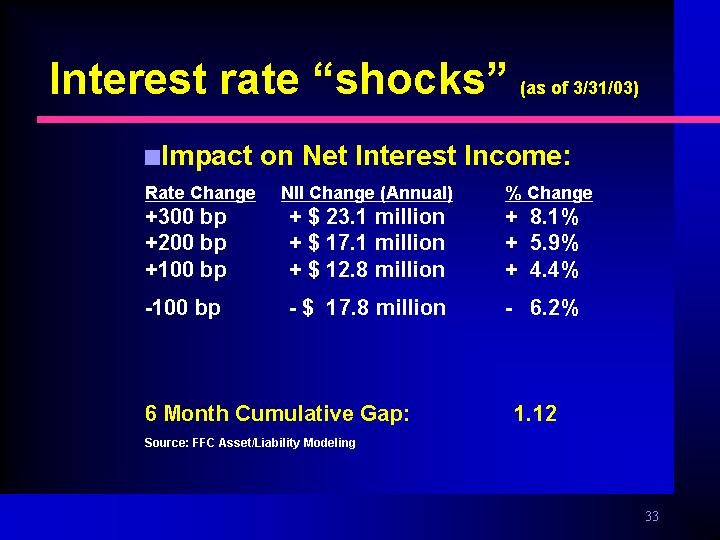
Interest rate “shocks” (as of 3/31/03)
| n | Impact on Net Interest Income: |
Rate Change | NII Change (Annual) | % Change | ||
+300 bp | + $ 23.1 million | + 8.1% | ||
+200 bp | + $ 17.1 million | + 5.9% | ||
+100 bp | + $ 12.8 million | + 4.4% | ||
-100 bp | - $ 17.8 million | - 6.2% | ||
6 Month Cumulative Gap: | 1.12 | |||
Source: FFC Asset/Liability Modeling
33
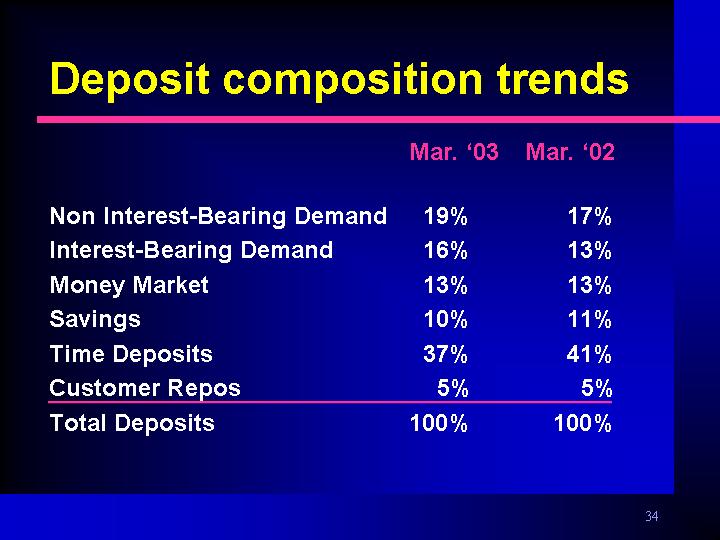
Deposit composition trends
| Mar. ‘03 | Mar. ‘02 | |||||
Non Interest-Bearing Demand | 19 | % | 17 | % | ||
Interest-Bearing Demand | 16 | % | 13 | % | ||
Money Market | 13 | % | 13 | % | ||
Savings | 10 | % | 11 | % | ||
Time Deposits | 37 | % | 41 | % | ||
Customer Repos | 5 | % | 5 | % | ||
Total Deposits | 100 | % | 100 | % |
34
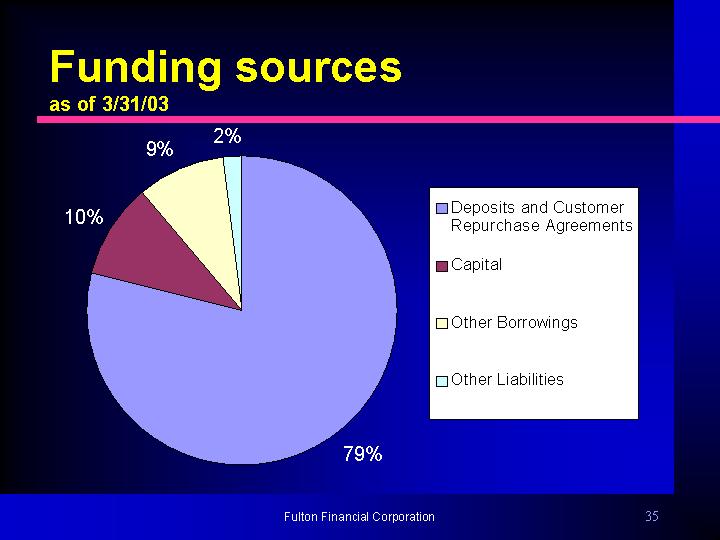
Funding sources
as of 3/31/03
[CHART]
| n | Deposits and Customer Repurchase Agreements |
| n | Capital |
| n | Other Borrowings |
| n | Other Liabilities |
Fulton Financial Corporation
35
Building on our strengths
n Strong Capital Position | = | n Capital for growth, acquisitions, share buyback programs |
Fulton Financial Corporation
36
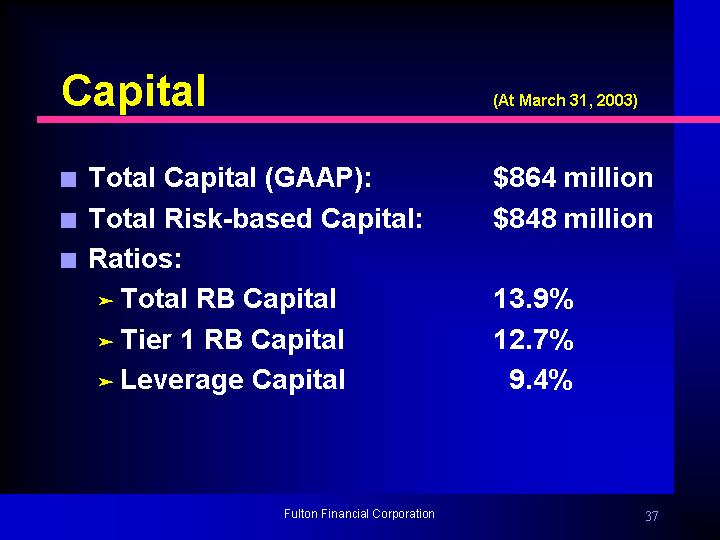
Capital (At March 31, 2003) | ||
n Total Capital (GAAP): | $864 million | |
n Total Risk-based Capital: | $848 million | |
n Ratios: | ||
® Total RB Capital | 13.9% | |
® Tier 1 RB Capital | 12.7% | |
® Leverage Capital | 9.4% | |
Fulton Financial Corporation
37
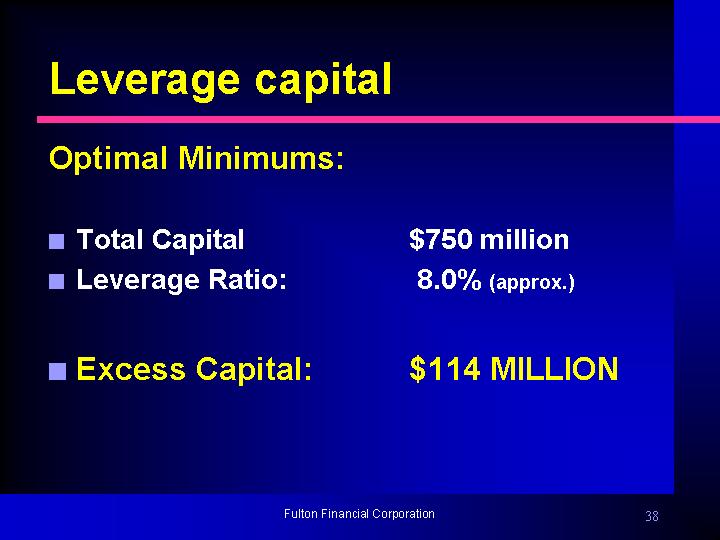
Leverage capital
Optimal Minimums:
n Total Capital | $750 million | |
n Leverage Ratio: | 8.0% (approx.) | |
n Excess Capital: | $114 MILLION | |
Fulton Financial Corporation
38
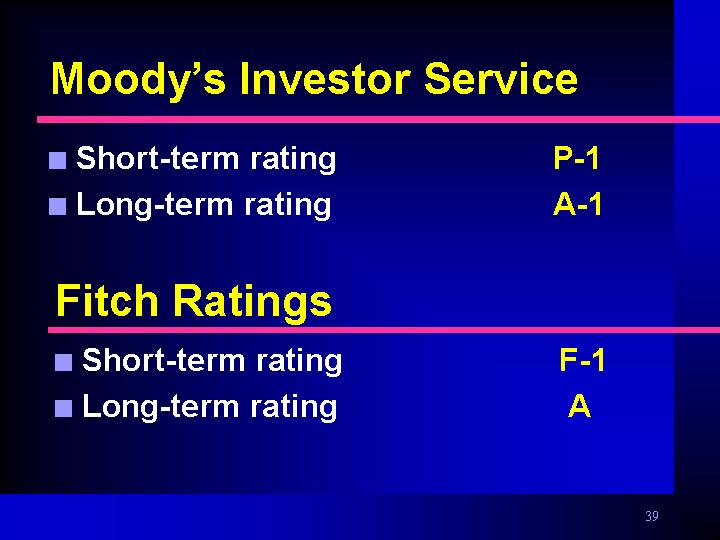
Moody’s Investor Service
n Short-term rating | P-1 | |
n Long-term rating | A-1 |
Fitch Ratings
n Short-term rating | F-1 | |
n Long-term rating | A |
39
Building on our strengths
n Coordinated product development | = | n Continued non-interest income growth |
Fulton Financial Corporation
40
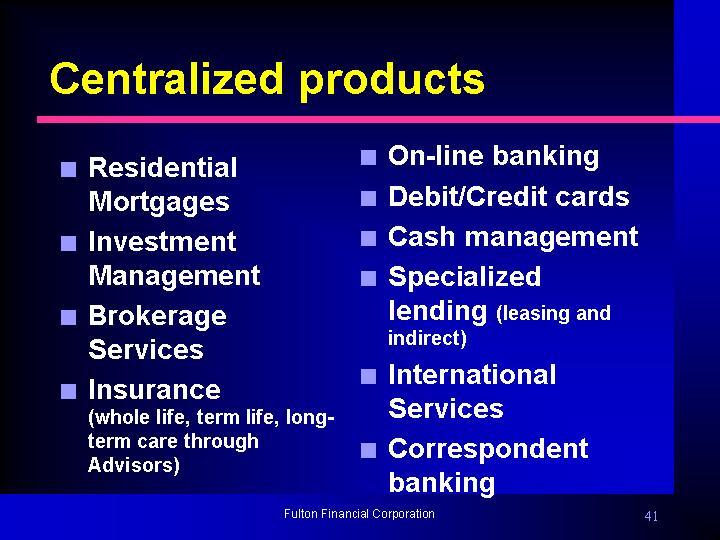
Centralized products
n Residential Mortgages | n On-line banking | |
n Investment Management | n Debit/Credit cards | |
n Brokerage Services | n Cash management | |
n Insurance | n Specialized lending (leasing and indirect) | |
n International Services | ||
n Correspondent banking |
Fulton Financial Corporation
41

Composition of total revenues
[CHART]
Fulton Financial Corporation
42
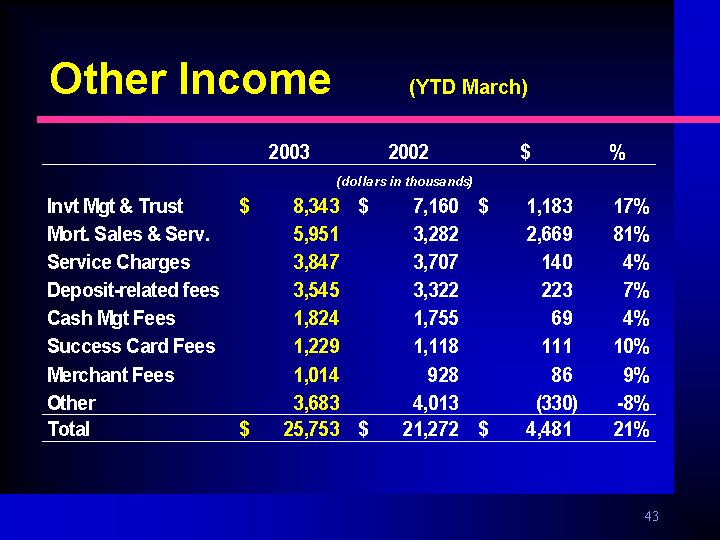
Other Income (YTD March)
| 2003 | 2002 | $ | % | ||||||||||
| (dollars in thousands) | |||||||||||||
Invt Mgt & Trust | $ | 8,343 | $ | 7,160 | $ | 1,183 | 17 | % | |||||
Mort. Sales & Serv. | 5,951 | 3,282 | 2,669 | 81 | % | ||||||||
Service Charges | 3,847 | 3,707 | 140 | 4 | % | ||||||||
Deposit-related fees | 3,545 | 3,322 | 223 | 7 | % | ||||||||
Cash Mgt Fees | 1,824 | 1,755 | 69 | 4 | % | ||||||||
Success Card Fees | 1,229 | 1,118 | 111 | 10 | % | ||||||||
Merchant Fees | 1,014 | 928 | 86 | 9 | % | ||||||||
Other | 3,683 | 4,013 | (330 | ) | -8 | % | |||||||
Total | $ | 25,753 | $ | 21,272 | $ | 4,481 | 21 | % | |||||
Fulton Financial Corporation
43
Fulton Mortgage Company
| n | Established April 2001 |
| n | New entity to coordinate residential mortgage lending throughout FFC |
® Expanded, competitive product line to customers of all affiliates
® In partnership with each affiliate, focused management team on residential mortgages
® Entry into new markets for FFC
44
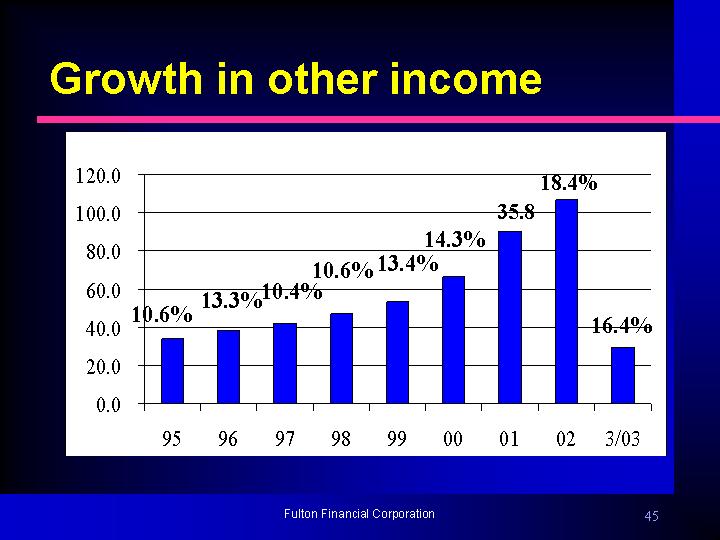
Growth in other income
[CHART]
Fulton Financial Corporation
45
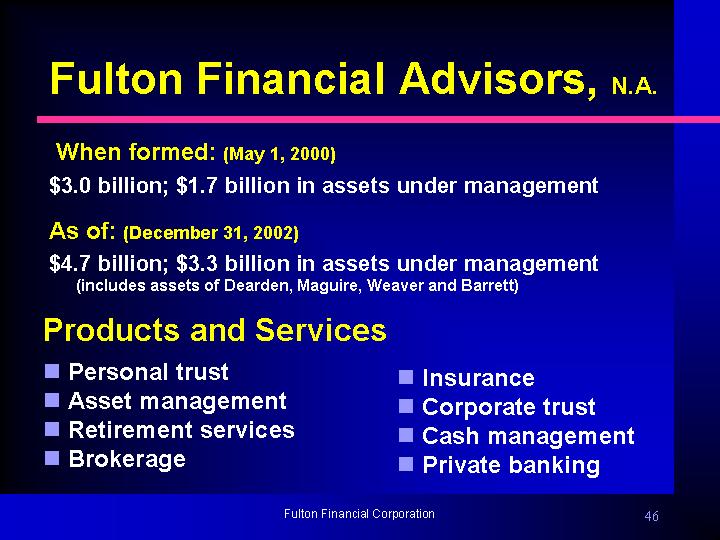
Fulton Financial Advisors, N.A.
When formed: (May 1, 2000)
$3.0 billion; $1.7 billion in assets under management
As of: (December 31, 2002)
$4.7 billion; $3.3 billion in assets under management
(includes assets of Dearden, Maguire, Weaver and Barrett)
Products and Services
n Personal trust | n Insurance | |
n Asset management | n Corporate trust | |
n Retirement services | n Cash management | |
n Brokerage | n Private banking |
Fulton Financial Corporation
46
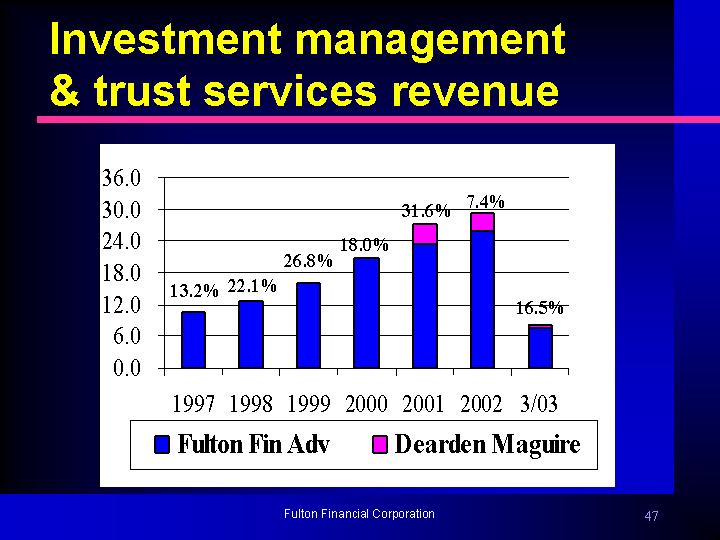
Investment management & trust services revenue
1997 | 1998 | 1999 | 2000 | 2001 | 2002 | 3/03 | ||||||
| 13.2% | 22.1% | 26.8% |
18.0% | 31.6% | 7.4% | 16.5% |
Fulton Financial Corporation
47
Fulton Financial Advisors
| n | Named Community-Based Bank Brokerage Program of the Year In March 2003 by Bank Insurance and Securities Association (BISA) |
| n | Recognition of program excellence |
| n | Award criteria: |
| · | Productivity of registered representatives |
| · | Low employee turnover |
| · | Compliance |
| · | Customer satisfaction |
| · | Reputation in the industry |
48
Building on our strengths
n Bank stock portfolio | = | n Additional income source |
Fulton Financial Corporation
49

Bank stock gains
(percent contribution to EPS)
[CHART]
Fulton Financial Corporation
50
Building on our strengths
n Common technology and operations | = | n Lower costs |
Fulton Financial Corporation
51
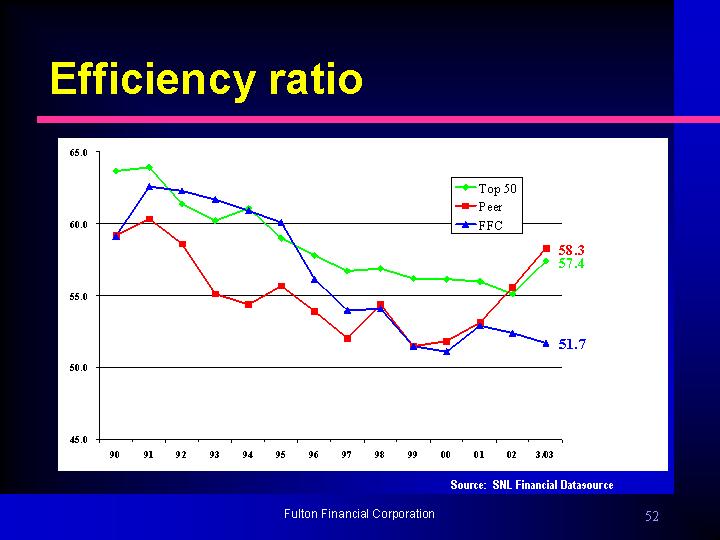
Efficiency ratio
[CHART]
Fulton Financial Corporation
52
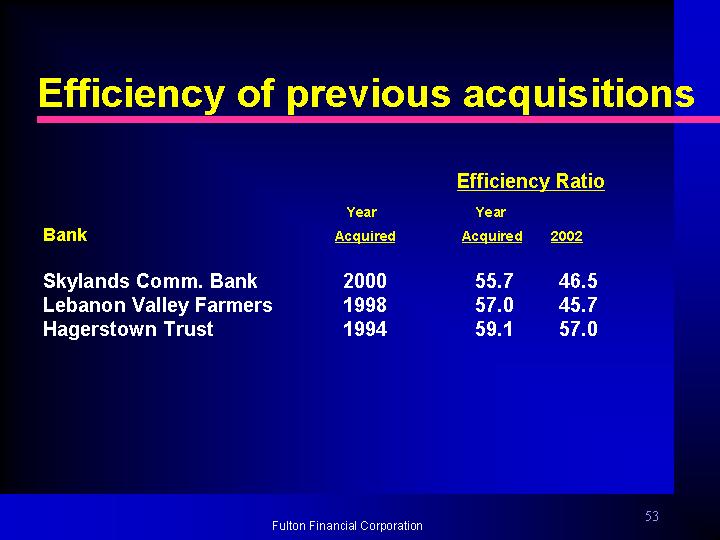
Efficiency of previous acquisitions
| Efficiency Ratio | ||||||
Bank | Year Acquired | Year Acquired | 2002 | |||
Skylands Comm. Bank | 2000 | 55.7 | 46.5 | |||
Lebanon Valley Farmers | 1998 | 57.0 | 45.7 | |||
Hagerstown Trust | 1994 | 59.1 | 57.0 | |||
Fulton Financial Corporation
53
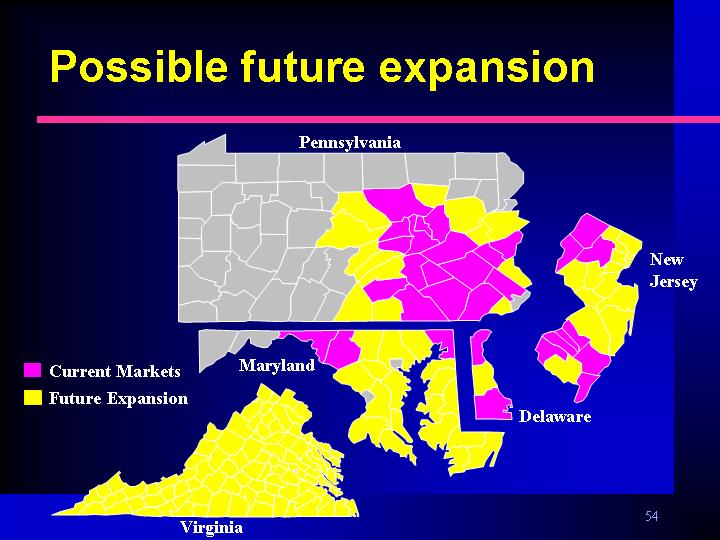
Possible future expansion
| n | Current Markets |
| n | Future Expansion |
Fulton Financial Corporation
54
Looking ahead
| n | Continue to build on our strengths |
| n | Continue to rely on the expertise and skill of our employees |
| n | Stick to banking basics while preparing for the future |
| n | Enhance customer relationship management efforts |
Fulton Financial Corporation
55
Board of directors
| n | Focused on maximizing shareholder value with at least a 10% annual increase in earnings per share |
Fulton Financial Corporation
56
Fulton Financial Corporation
One Penn Square
Lancaster, PA 17602
www.fult.com
57