Fulton Financial Corporation
Investor Presentation
March 2005
1
Forward-looking statement
The following presentation may contain forward-looking statements about Fulton Financial Corporation’s growth and acquisition strategies, new products and services, and future financial performance, including earnings and dividends per share, return on average assets, return on average equity, efficiency ratio and capital ratio. Forward-looking statements are encouraged by the Private Securities Litigation Reform Act of 1995.
Such forward-looking information is based upon certain underlying assumptions, risks and uncertainties. Because of the possibility of change in the underlying assumptions, actual results could differ materially from these forward-looking statements. Risks and uncertainties that may affect future results include: pricing pressures on loans and deposits, actions of bank and non-bank competitors, changes in local and national economic conditions, changes in regulatory requirements, actions of the Federal Reserve Board, the Corporation’s success in merger and acquisition integration, and customers’ acceptance of the Corporation’s products and services.
2
Presentation outline
Corporate profile Strategic initiatives Future direction Financial performance Asset quality
3
Fulton Financial profile
Regional financial holding company (formed in 1982)
13 community banks and 3 financial services affiliates in 5 states Asset size: $11.2 billion Second largest commercial bank headquartered in Third Federal Reserve District Fulton Bank founded in 1882
4
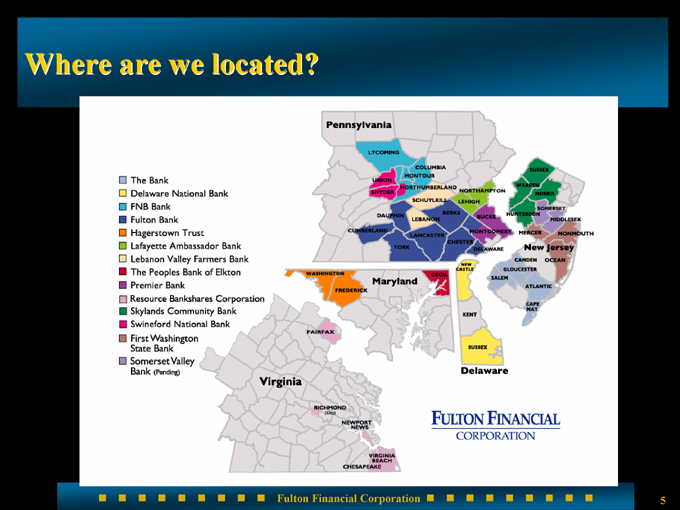
Where are we located?
The Bank
Delaware National Bank
FNB Bank
Fulton Bank
Hagerstown Trust
Lafayette Ambassador Bank
Lebanon Valley Farmers Bank
The Peoples Bank of Elkton
Premier Bank
Resource Bankshares Corporation
Skylands Community Bank
Swineford National Bank
First Washington State Bank
Somerset Valley
Bank (Pending)
5
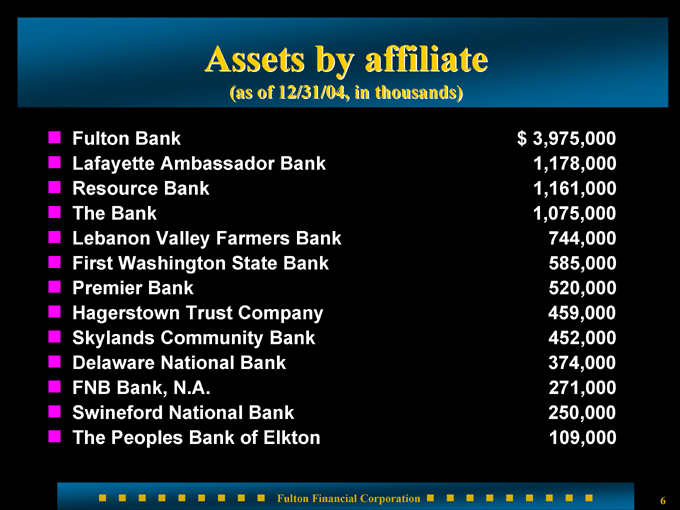
Assets by affiliate
(as of 12/31/04, in thousands)
Fulton Bank $3,975,000
Lafayette Ambassador Bank 1,178,000
Resource Bank 1,161,000
The Bank 1,075,000
Lebanon Valley Farmers Bank 744,000
First Washington State Bank 585,000
Premier Bank 520,000
Hagerstown Trust Company 459,000
Skylands Community Bank 452,000
Delaware National Bank 374,000
FNB Bank, N.A. 271,000
Swineford National Bank 250,000
The Peoples Bank of Elkton 109,000
6
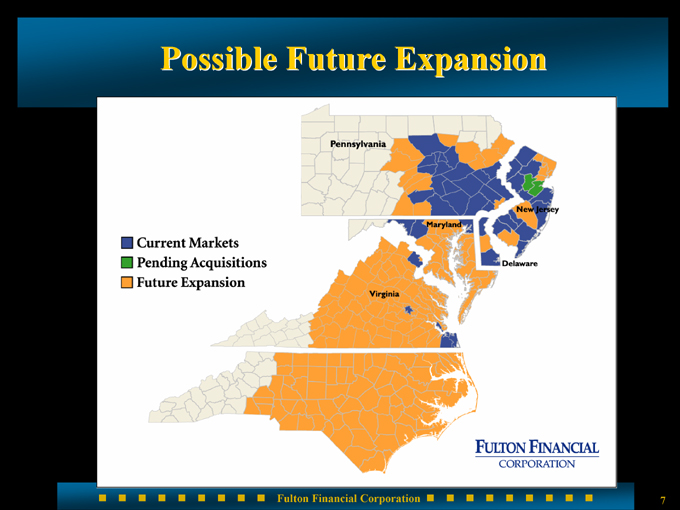
Possible Future Expansion
7
Mission statement
We will increase shareholder value and enrich the communities we serve by creating financial success together with our customers and career success together with our employees.
We will conduct all of our business with honesty and integrity.
8
Corporate ethics
Longstanding written code of conduct No “gray” areas Expectations clearly outlined
9
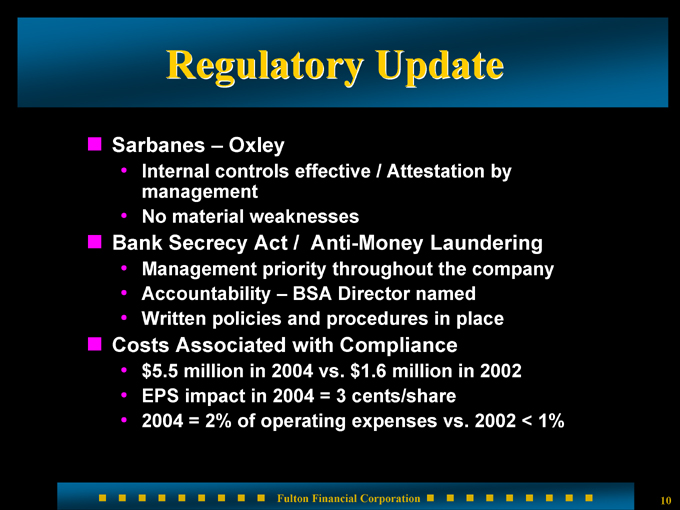
Regulatory Update
Sarbanes – Oxley
Internal controls effective / Attestation by management No material weaknesses
Bank Secrecy Act / Anti-Money Laundering
Management priority throughout the company Accountability – BSA Director named Written policies and procedures in place
Costs Associated with Compliance $5.5 million in 2004 vs. $1.6 million in 2002 EPS impact in 2004 = 3 cents/share 2004 = 2% of operating expenses vs. 2002 < 1%
10
What have we accomplished?
8.8% compounded annual growth rate in earnings per share 23 consecutive years of record earnings 30 consecutive years of dividend increases 10.3% compounded annual growth rate in dividends per share Proven business model Consistent performance
11
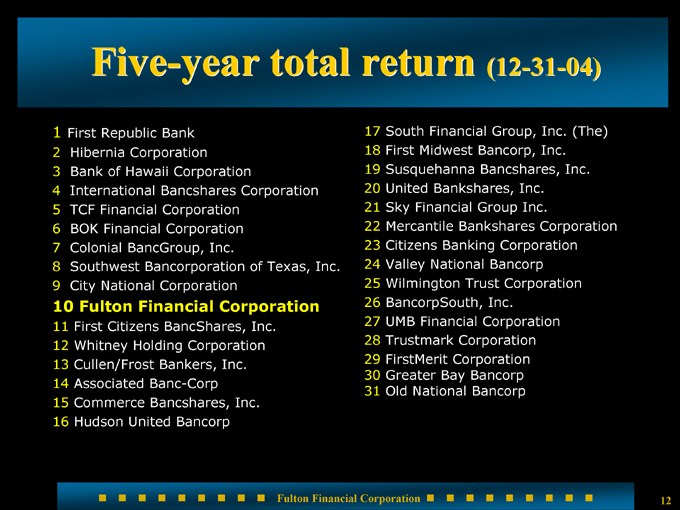
Five-year total return (12-31-04)
1 First Republic Bank
2 Hibernia Corporation
3 Bank of Hawaii Corporation
4 International Bancshares Corporation
5 TCF Financial Corporation
6 BOK Financial Corporation
7 Colonial BancGroup, Inc.
8 Southwest Bancorporation of Texas, Inc.
9 City National Corporation
10 Fulton Financial Corporation
11 First Citizens BancShares, Inc. 12 Whitney Holding Corporation 13 Cullen/Frost Bankers, Inc. 14 Associated Banc-Corp 15 Commerce Bancshares, Inc. 16 Hudson United Bancorp
17 South Financial Group, Inc. (The) 18 First Midwest Bancorp, Inc. 19 Susquehanna Bancshares, Inc. 20 United Bankshares, Inc.
21 Sky Financial Group Inc.
22 Mercantile Bankshares Corporation 23 Citizens Banking Corporation 24 Valley National Bancorp 25 Wilmington Trust Corporation
26 BancorpSouth, Inc.
27 UMB Financial Corporation
28 Trustmark Corporation
29 FirstMerit Corporation 30 Greater Bay Bancorp 31 Old National Bancorp
12
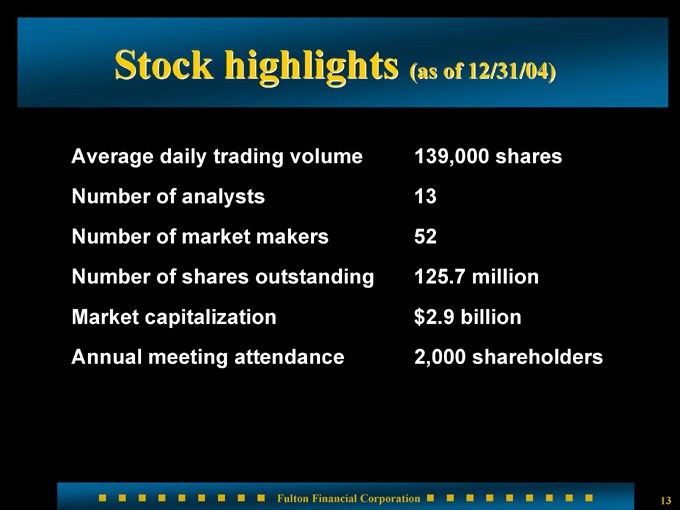
Stock highlights (as of 12/31/04)
Average daily trading volume 139,000 shares
Number of analysts 13
Number of market makers 52
Number of shares outstanding 125.7 million
Market capitalization $2.9 billion
Annual meeting attendance 2,000 shareholders
13
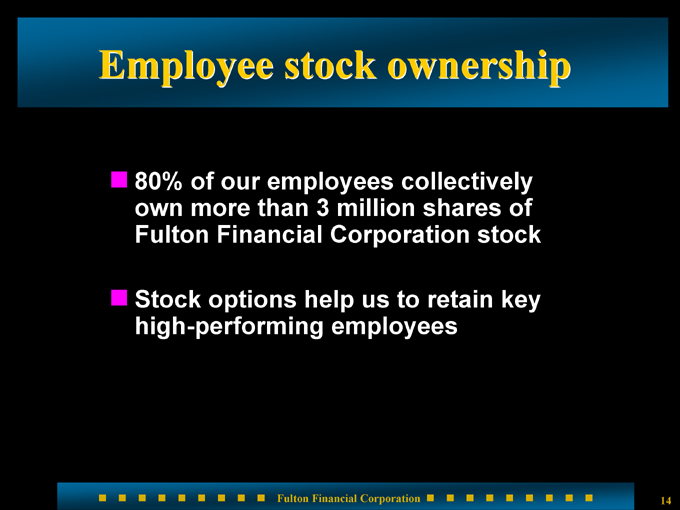
Employee stock ownership
80% of our employees collectively own more than 3 million shares of Fulton Financial Corporation stock
Stock options help us to retain key high-performing employees
14
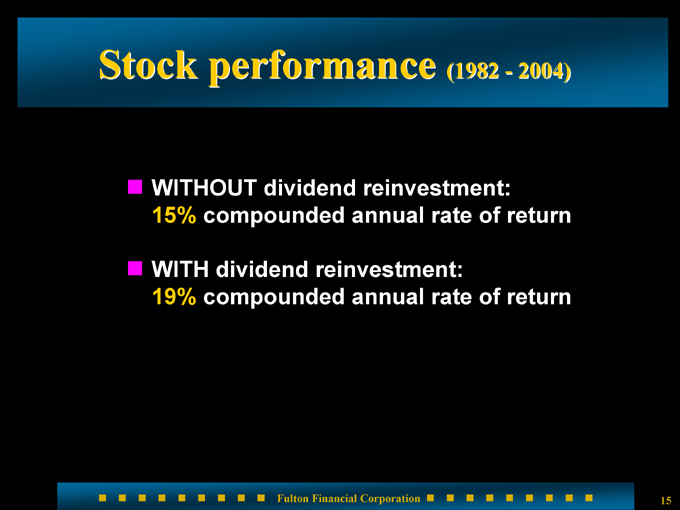
Stock performance (1982 - 2004)
WITHOUT dividend reinvestment: 15% compounded annual rate of return
WITH dividend reinvestment:
19% compounded annual rate of return
15
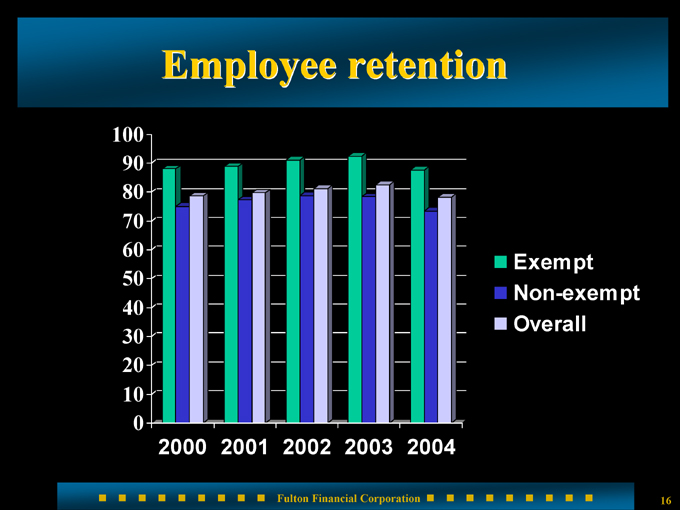
Employee retention
100 90 80 70 60 50 40 30 20 10 0
2000 2001 2002 2003 2004
Exempt Non-exempt Overall
16
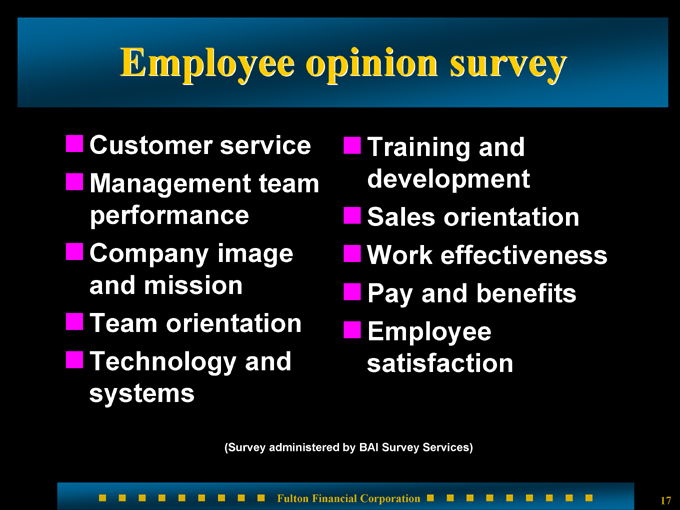
Employee opinion survey
Customer service Management team performance Company image and mission Team orientation Technology and systems
Training and development Sales orientation Work effectiveness Pay and benefits Employee satisfaction
(Survey administered by BAI Survey Services)
17
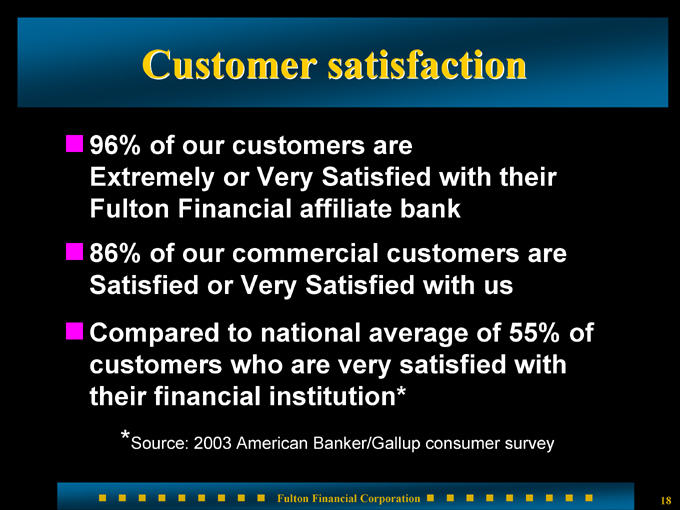
Customer satisfaction
96% of our customers are
Extremely or Very Satisfied with their Fulton Financial affiliate bank 86% of our commercial customers are Satisfied or Very Satisfied with us Compared to national average of 55% of customers who are very satisfied with their financial institution*
* Source: 2003 American Banker/Gallup consumer survey
18
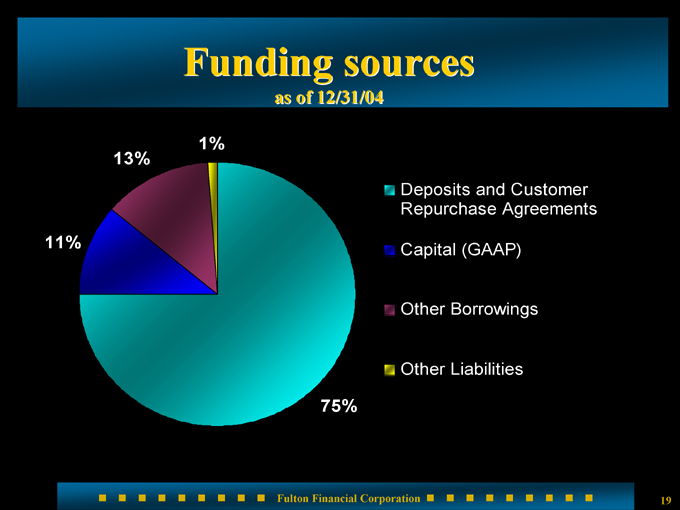
Funding sources
as of 12/31/04
1%
13%
11%
75%
Deposits and Customer Repurchase Agreements
Capital (GAAP) Other Borrowings Other Liabilities
19
Community involvement
Employees are actively involved in their own communities The community benefits from this support The banks receive additional business as a result of the relationships and goodwill that are developed
20
Corporate strategic initiatives
Achieving consistent earnings growth Maintaining high asset quality Expanding the franchise through our well-developed acquisition strategy Diversifying revenue stream by increasing the contribution of non-interest income Managing capital
21
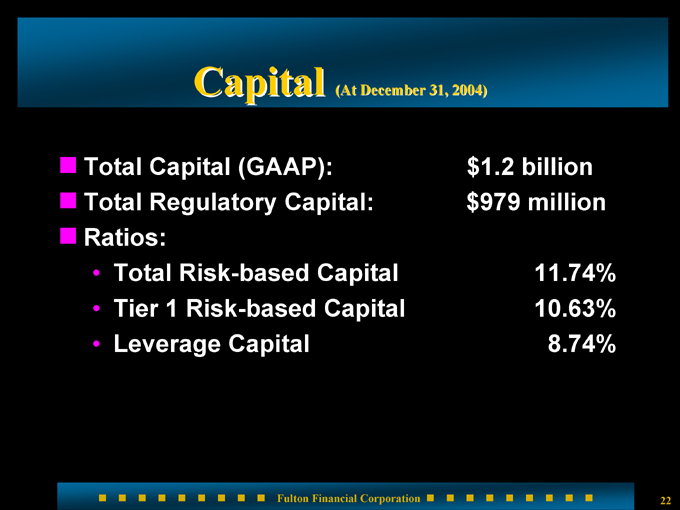
Capital (At December 31, 2004)
Total Capital (GAAP): $1.2 billion
Total Regulatory Capital: $979 million
Ratios:
Total Risk-based Capital 11.74%
Tier 1 Risk-based Capital 10.63%
Leverage Capital 8.74%
22
Progress of Stock Buyback
2.5 million shares repurchased in 2004
Additional 4 million share repurchase program approved December 21, 2004 – program ends June 30, 2005
23
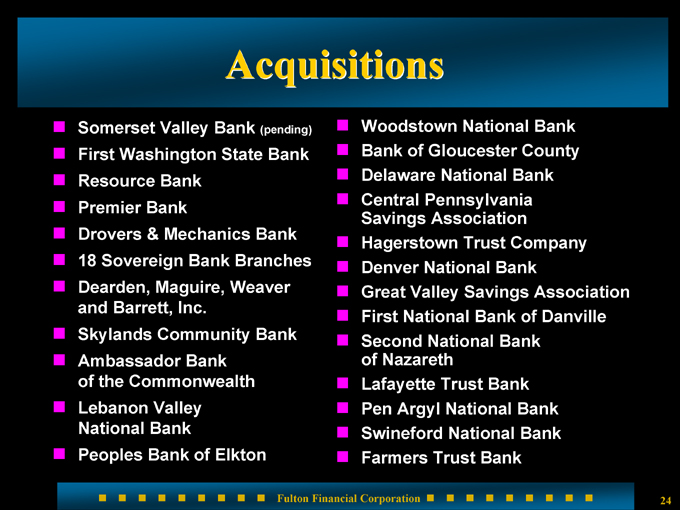
Acquisitions
Somerset Valley Bank (pending) First Washington State Bank Resource Bank Premier Bank Drovers & Mechanics Bank 18 Sovereign Bank Branches Dearden, Maguire, Weaver and Barrett, Inc.
Skylands Community Bank Ambassador Bank of the Commonwealth Lebanon Valley National Bank Peoples Bank of Elkton
Woodstown National Bank Bank of Gloucester County Delaware National Bank Central Pennsylvania Savings Association Hagerstown Trust Company Denver National Bank Great Valley Savings Association First National Bank of Danville Second National Bank of Nazareth Lafayette Trust Bank Pen Argyl National Bank Swineford National Bank Farmers Trust Bank
24
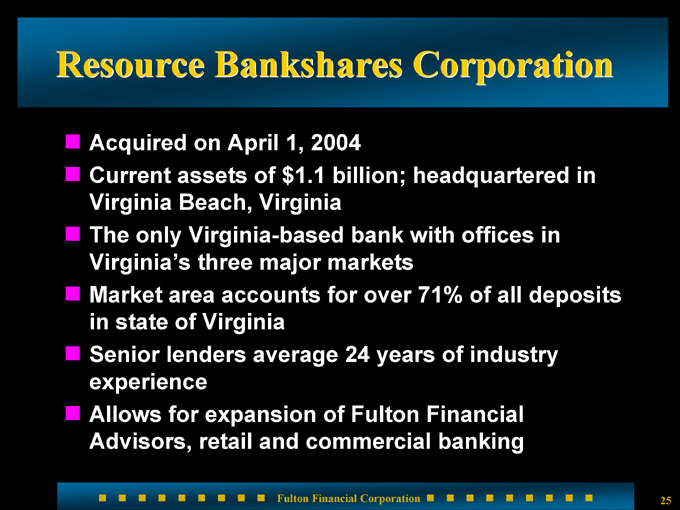
Resource Bankshares Corporation
Acquired on April 1, 2004
Current assets of $1.1 billion; headquartered in Virginia Beach, Virginia The only Virginia-based bank with offices in Virginia’s three major markets Market area accounts for over 71% of all deposits in state of Virginia Senior lenders average 24 years of industry experience Allows for expansion of Fulton Financial Advisors, retail and commercial banking
25
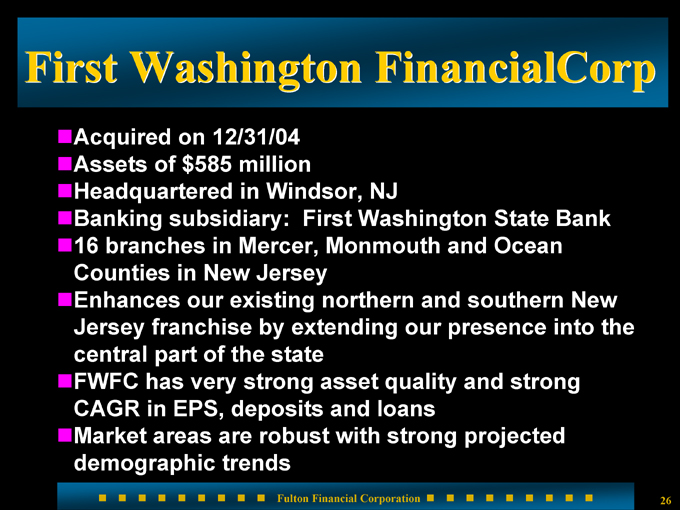
First Washington FinancialCorp
Acquired on 12/31/04 Assets of $585 million Headquartered in Windsor, NJ
Banking subsidiary: First Washington State Bank 16 branches in Mercer, Monmouth and Ocean Counties in New Jersey Enhances our existing northern and southern New Jersey franchise by extending our presence into the central part of the state FWFC has very strong asset quality and strong CAGR in EPS, deposits and loans Market areas are robust with strong projected demographic trends
26
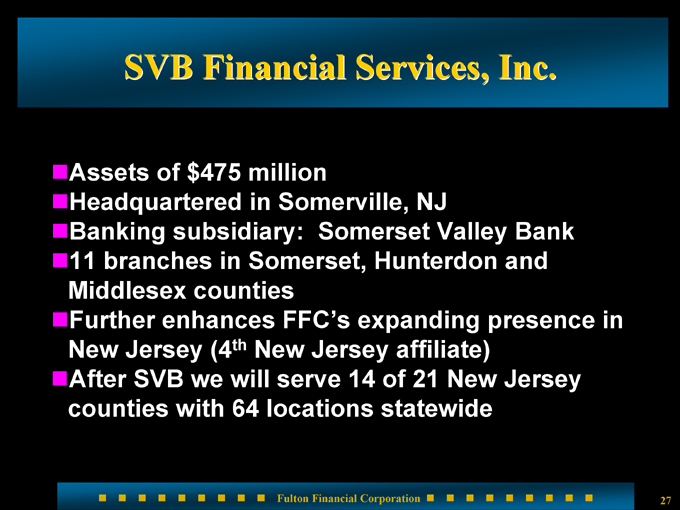
SVB Financial Services, Inc.
Assets of $475 million
Headquartered in Somerville, NJ
Banking subsidiary: Somerset Valley Bank 11 branches in Somerset, Hunterdon and Middlesex counties Further enhances FFC’s expanding presence in New Jersey (4th New Jersey affiliate) After SVB we will serve 14 of 21 New Jersey counties with 64 locations statewide
27
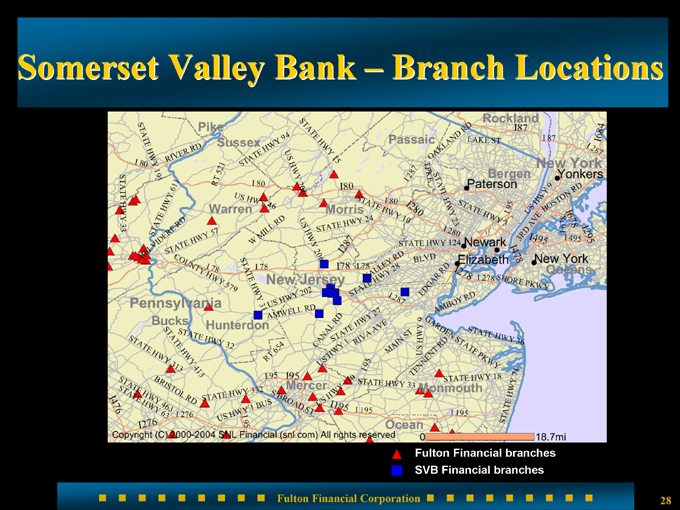
Somerset Valley Bank – Branch Locations
Fulton Financial branches SVB Financial branches
28
What do we look for?
High growth areas
Dynamic market demographics Strong performance Asset quality Talented and dedicated staff Compatible corporate culture
29
In-market consolidation
23 acquisitions since 1982 13 affiliates today Potential consolidation as market coverage increases Lehigh Valley – four prior acquisitions now comprise our second largest affiliate
30
Acquisitions in new markets
What changes?
Loan review Investments
Asset/liability management Compliance Common operating platform Audit
31
Acquisitions in new markets
What stays the same?
Bank name Board of Directors Management team Employees
32
Benefits to new affiliates
Increased non-interest income due to introduction of new products and services Additional capital Increased lending capacity Reduced expenses Proven merger/conversion expertise Continued local autonomy and decision-making
33
Product availability
Investment management Brokerage services Insurance (whole life, term life, long-term care through advisors) Cash management On-line banking
Debit/credit cards Residential mortgages Specialized lending (leasing and indirect) International services Correspondent banking
34
Fulton Financial Advisors, N.A.
Includes Dearden Maguire Weaver and Barrett, LLC and Fulton Insurance Services Group As of December 31, 2004: $4.9 billion; $3.4 billion in assets under management
Products and Services
Personal trust Asset management Retirement services Brokerage
Insurance Corporate trust Cash management Private banking
35
Fulton Mortgage Company
Coordinates residential mortgage lending throughout 12 affiliates
Expanded, competitive product line to customers of all affiliates In partnership with each affiliate, focused management team on residential mortgages Entry into new markets for FFC
Approximately $2 billion in originations in both 2003 and 2004 Residential lending at Resource Bank provided through Resource Mortgage
36
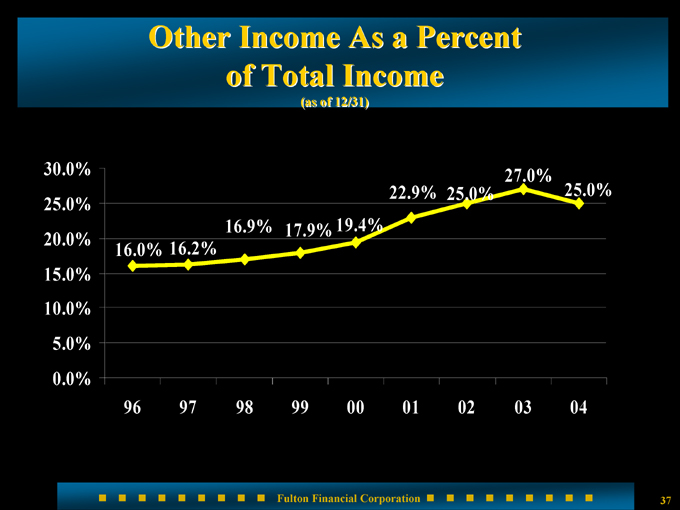
Other Income As a Percent of Total Income
(as of 12/31)
30.0% 25.0% 20.0% 15.0% 10.0% 5.0% 0.0%
16.0%
16.2%
16.9%
17.9%
19.4%
22.9%
25.0%
27.0%
25.0%
96 97 98 99 00 01 02 03 04
37
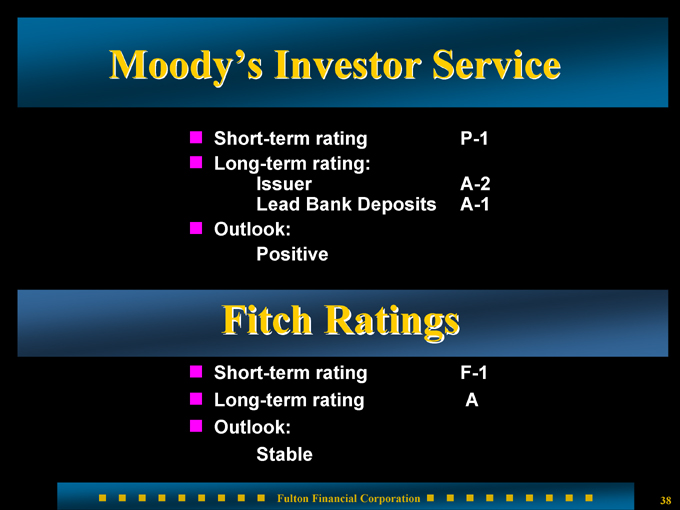
Moody’s Investor Service
Short-term rating P-1
Long-term rating:
Issuer A-2
Lead Bank Deposits A-1
Outlook:
Positive
Fitch Ratings
Short-term rating F-1
Long-term rating A
Outlook:
Stable
38
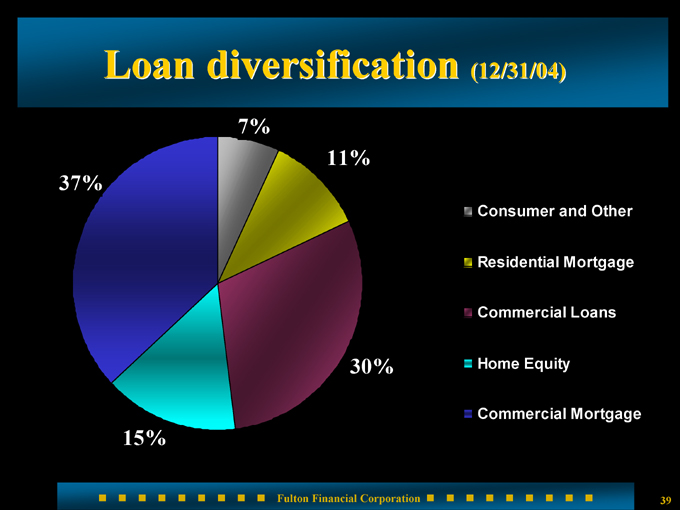
Loan diversification (12/31/04)
37%
15%
30%
11%
7%
Consumer and Other Residential Mortgage Commercial Loans Home Equity Commercial Mortgage
39
Summary of larger loans
26 relationships with commitments to lend of $20 million or more Maximum individual commitment of $30 million Average commercial loan size is $569,000 Loans and corresponding relationships are within Fulton’s geographical market area
40
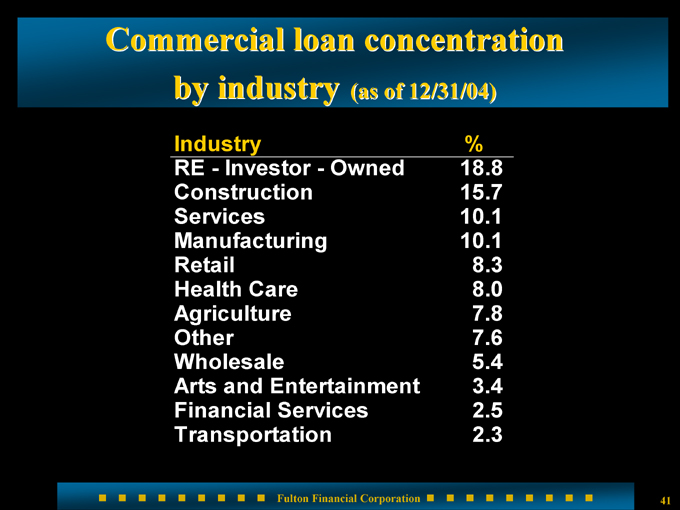
Commercial loan concentration
by industry (as of 12/31/04)
Industry %
RE - Investor - Owned 18.8
Construction 15.7
Services 10.1
Manufacturing 10.1
Retail 8.3
Health Care 8.0
Agriculture 7.8
Other 7.6
Wholesale 5.4
Arts and Entertainment 3.4
Financial Services 2.5
Transportation 2.3
41
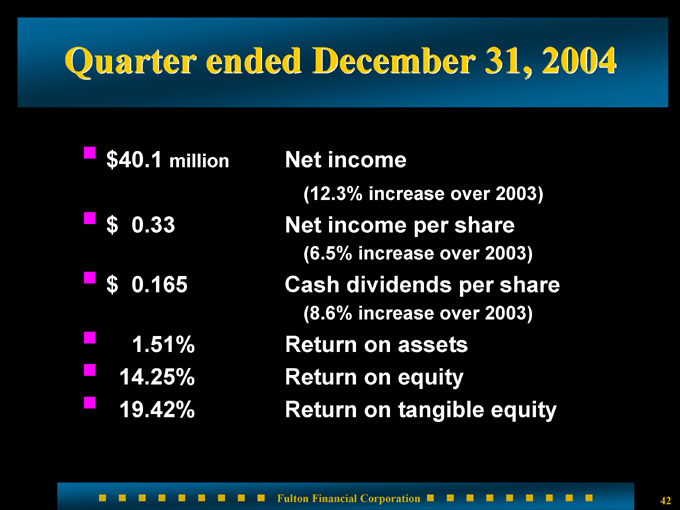
Quarter ended December 31, 2004
$40.1 million Net income
(12.3% increase over 2003)
$0.33 Net income per share
(6.5% increase over 2003)
$0.165 Cash dividends per share
(8.6% increase over 2003)
1.51% Return on assets
14.25% Return on equity
19.42% Return on tangible equity
42
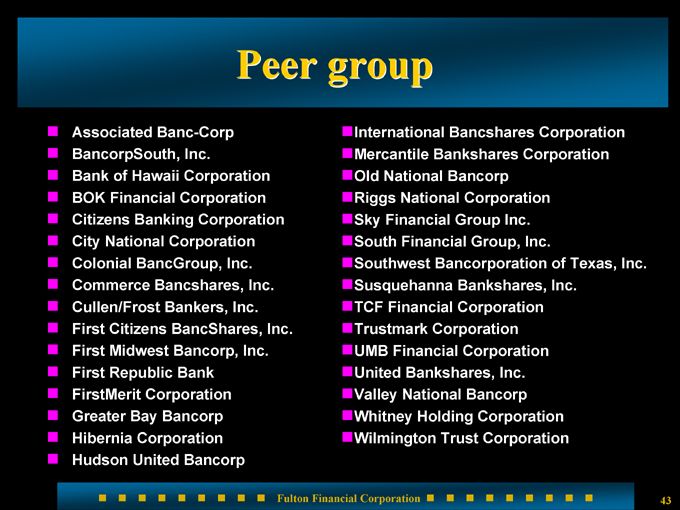
Peer group
Associated Banc-Corp BancorpSouth, Inc. Bank of Hawaii Corporation BOK Financial Corporation Citizens Banking Corporation City National Corporation Colonial BancGroup, Inc. Commerce Bancshares, Inc. Cullen/Frost Bankers, Inc. First Citizens BancShares, Inc. First Midwest Bancorp, Inc. First Republic Bank FirstMerit Corporation Greater Bay Bancorp Hibernia Corporation Hudson United Bancorp
International Bancshares Corporation Mercantile Bankshares Corporation Old National Bancorp Riggs National Corporation Sky Financial Group Inc.
South Financial Group, Inc.
Southwest Bancorporation of Texas, Inc. Susquehanna Bankshares, Inc.
TCF Financial Corporation Trustmark Corporation UMB Financial Corporation United Bankshares, Inc. Valley National Bancorp Whitney Holding Corporation Wilmington Trust Corporation
43
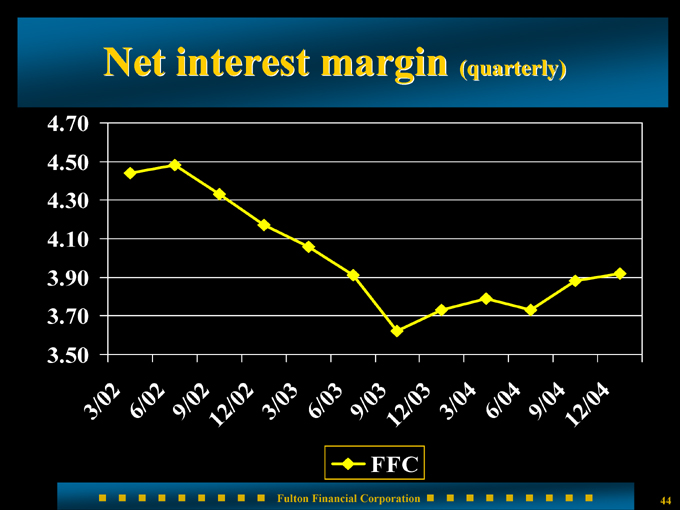
Net interest margin (quarterly)
4.70 4.50 4.30 4.10 3.90 3.70 3.50
3/02 6/02
9/02
12/02
3/03 6/03 9/03 12/
03 3/04 6/04 9/04 12/
04
FFC
44
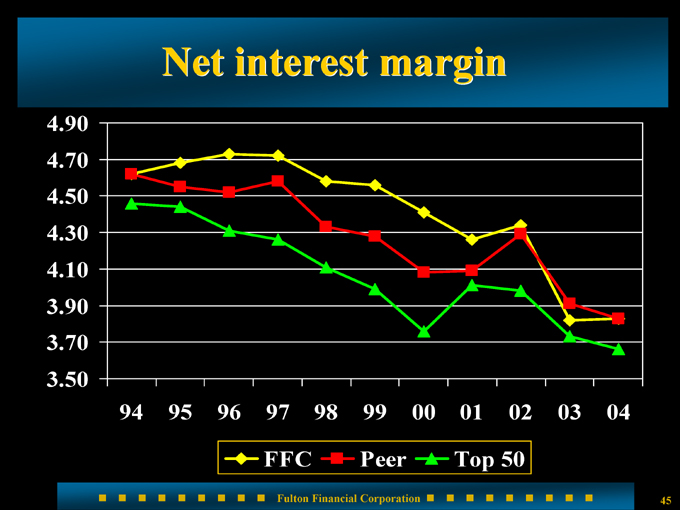
Net interest margin
4.90 4.70 4.50 4.30 4.10 3.90 3.70 3.50
94 95 96 97 98 99 00 01 02 03 04
FFC
Peer
Top 50
45
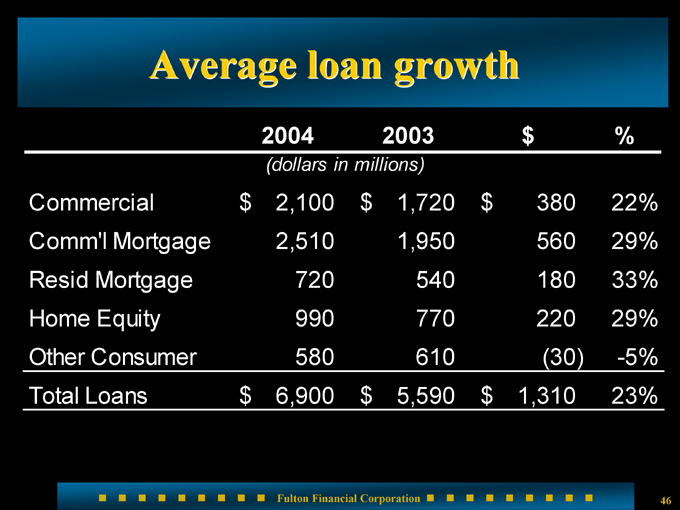
Average loan growth
2004 2003 $ %
(dollars in millions)
Commercial $2,100 $1,720 $380 22%
Comm’l Mortgage 2,510 1,950 560 29%
Resid Mortgage 720 540 180 33%
Home Equity 990 770 220 29%
Other Consumer 580 610 (30) -5%
Total Loans $6,900 $5,590 $1,310 23%
46
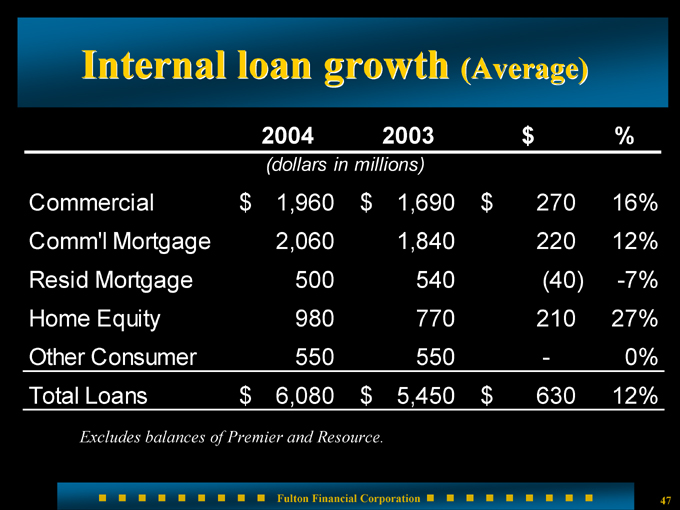
Internal loan growth (Average)
2004 2003 $ %
(dollars in millions)
Commercial $1,960 $1,690 $270 16%
Comm’l Mortgage 2,060 1,840 220 12%
Resid Mortgage 500 540 (40) -7%
Home Equity 980 770 210 27%
Other Consumer 550 550 - 0%
Total Loans $6,080 $5,450 $630 12%
Excludes balances of Premier and Resource.
47
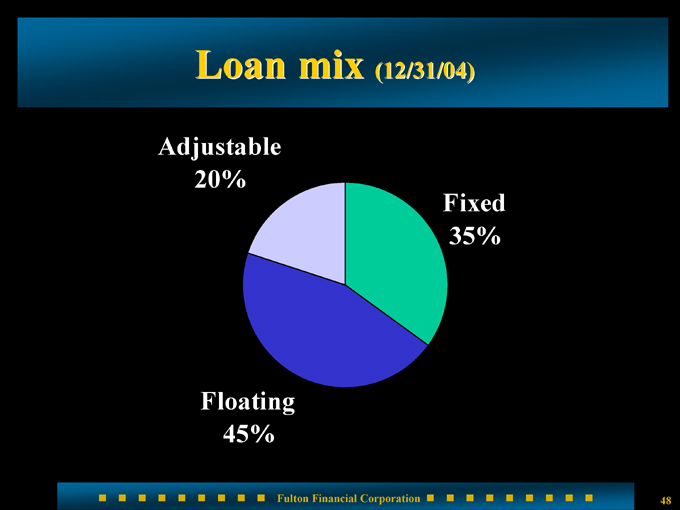
Loan mix (12/31/04)
Adjustable 20%
Floating 45%
Fixed 35%
48
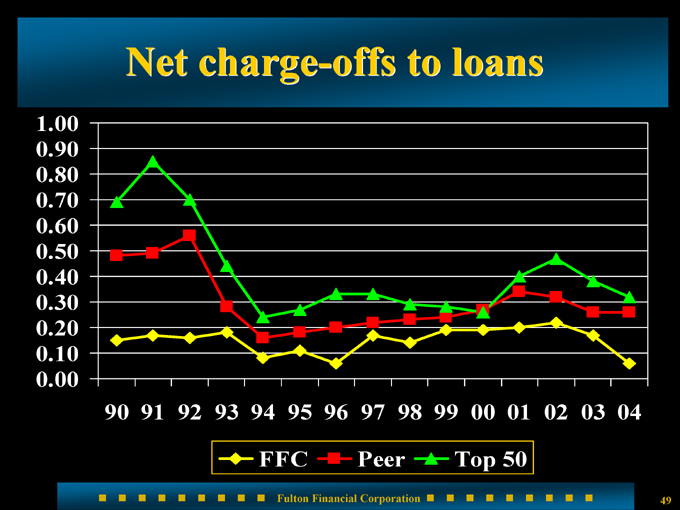
Net charge-offs to loans
1.00 0.90 0.80 0.70 0.60 0.50 0.40 0.30 0.20 0.10 0.00
90 91 92 93 94 95 96 97 98 99 00 01 02 03 04
FFC
Peer
Top 50
49
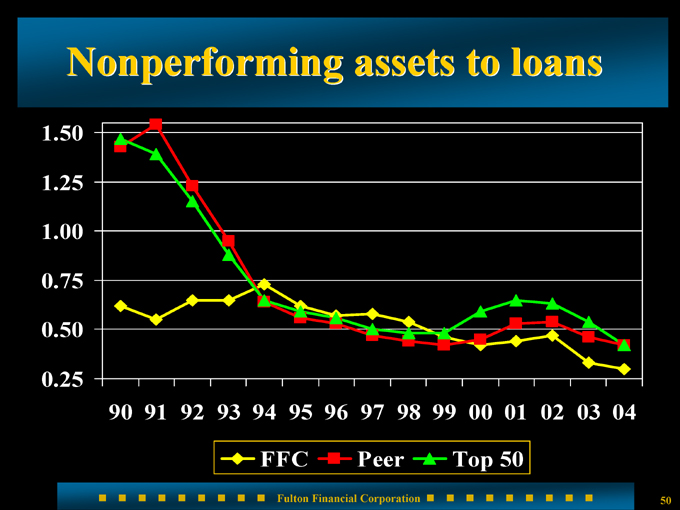
Nonperforming assets to loans
1.50 1.25 1.00 0.75 0.50 0.25
90 91 92 93 94 95 96 97 98 99 00 01 02 03 04
FFC
Peer
Top 50
50
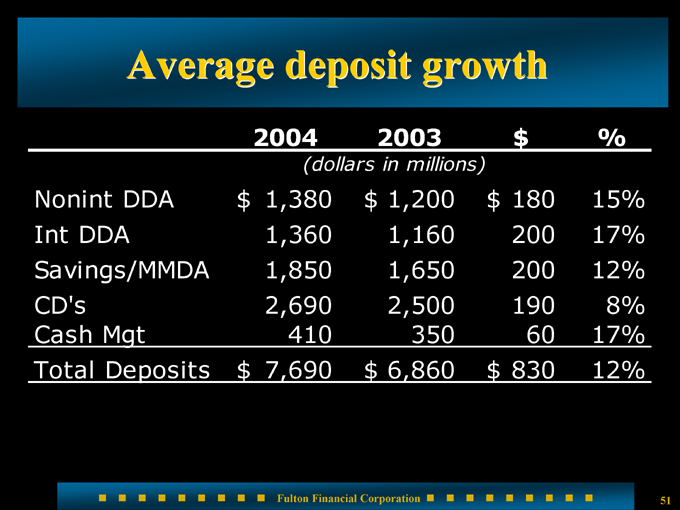
Average deposit growth
2004 2003 $ %
(dollars in millions)
Nonint DDA $1,380 $1,200 $180 15%
Int DDA 1,360 1,160 200 17%
Savings/MMDA 1,850 1,650 200 12%
CD’s 2,690 2,500 190 8%
Cash Mgt 410 350 60 17%
Total Deposits $7,690 $6,860 $830 12%
51
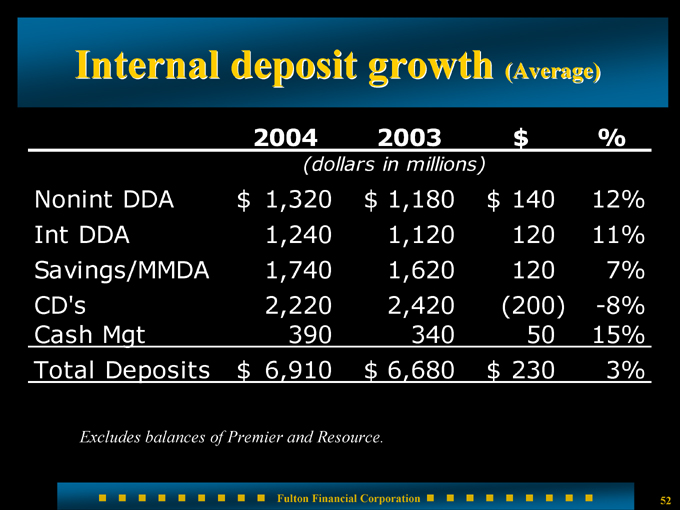
Internal deposit growth (Average)
2004 2003 $ %
(dollars in millions)
Nonint DDA $1,320 $1,180 $140 12%
Int DDA 1,240 1,120 120 11%
Savings/MMDA 1,740 1,620 120 7%
CD’s 2,220 2,420 (200) -8%
Cash Mgt 390 340 50 15%
Total Deposits $6,910 $6,680 $230 3%
Excludes balances of Premier and Resource.
52
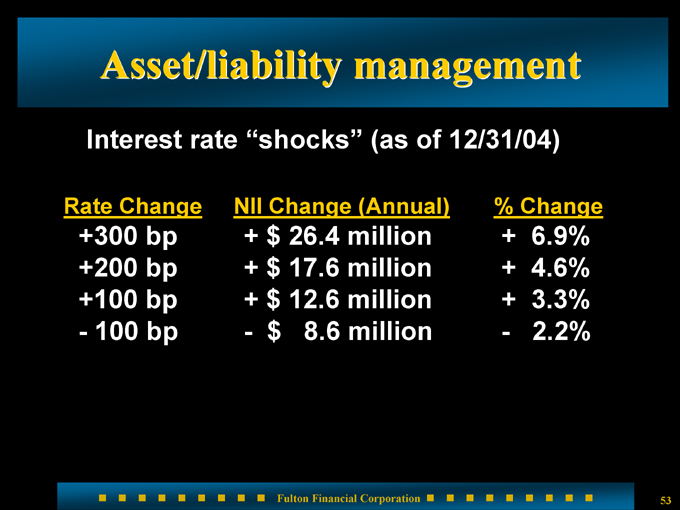
Asset/liability management
Interest rate “shocks” (as of 12/31/04)
Rate Change NII Change (Annual) % Change
+300 bp + $26.4 million + 6.9%
+200 bp + $17.6 million + 4.6%
+100 bp + $12.6 million + 3.3%
- 100 bp - $8.6 million - 2.2%
53
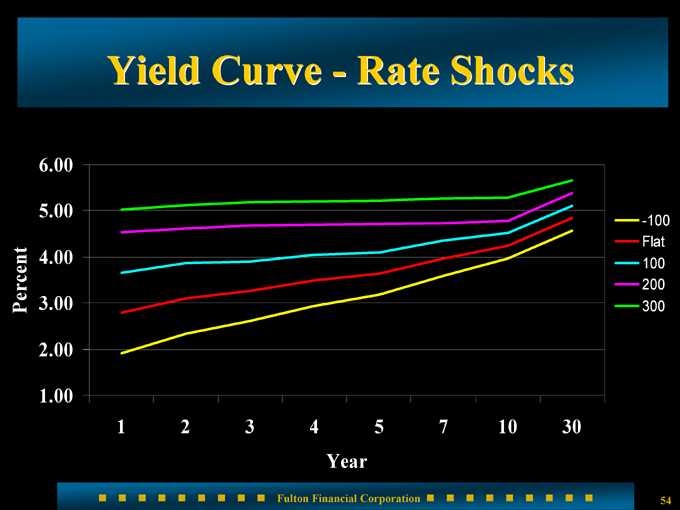
Yield Curve - Rate Shocks
6.00
5.00
Percent 4.00 3.00
2.00
1.00
1 2 3 4 5 7 10 30 Year
-100 Flat 100 200 300
54
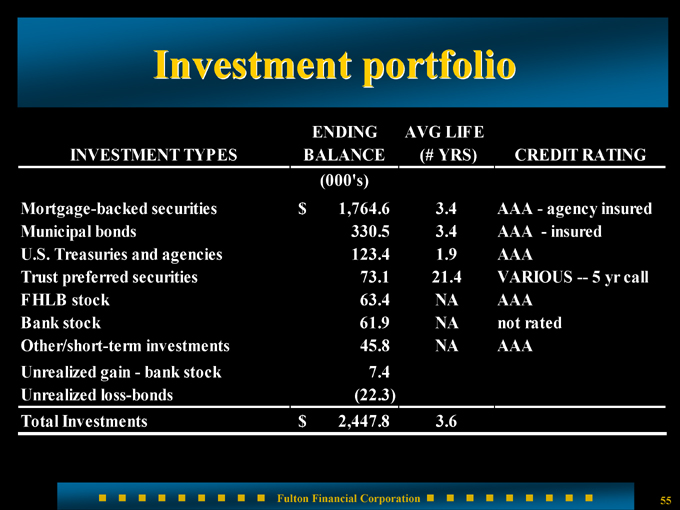
Investment portfolio
INVESTMENT TYPES ENDING BALANCE AVG LIFE (# YRS) CREDIT RATING
(000’s)
Mortgage-backed securities $1,764.6 3.4 AAA - agency insured
Municipal bonds 330.5 3.4 AAA - insured
U.S. Treasuries and agencies 123.4 1.9 AAA
Trust preferred securities 73.1 21.4 VARIOUS — 5 yr call
FHLB stock 63.4 NA AAA
Bank stock 61.9 NA not rated
Other/short-term investments 45.8 NA AAA
Unrealized gain - bank stock 7.4
Unrealized loss-bonds (22.3)
Total Investments $2,447.8 3.6
55
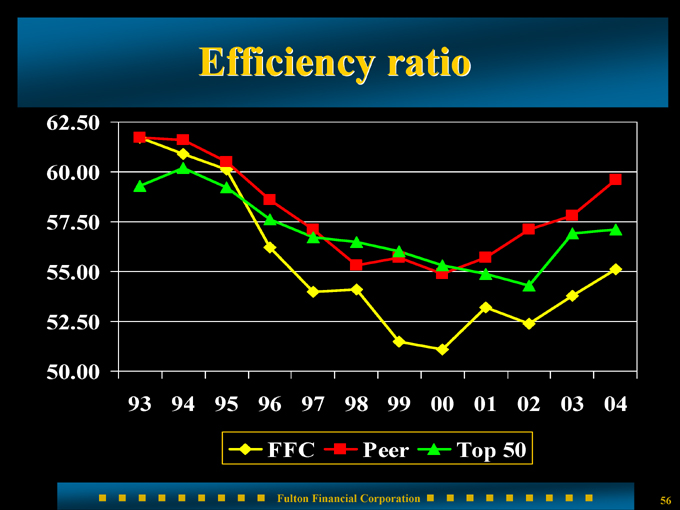
Efficiency ratio
62.50 60.00 57.50 55.00 52.50 50.00
93 94 95 96 97 98 99 00 01 02 03 04
FFC
Peer
Top 50
56

Other Expense Detail
2004 2003 $ %
(dollars in thousands)
Salaries & Benefits $162,130 $136,000 $26,130 19%
Occupancy & Equip. 34,580 30,400 4,180 14%
DP/Software/Telecom 20,340 19,220 1,120 6%
Amortization 4,730 2,060 2,670 130%
Other Expenses 51,820 43,880 7,940 18%
Total $273,600 $231,560 $42,040 18%
57
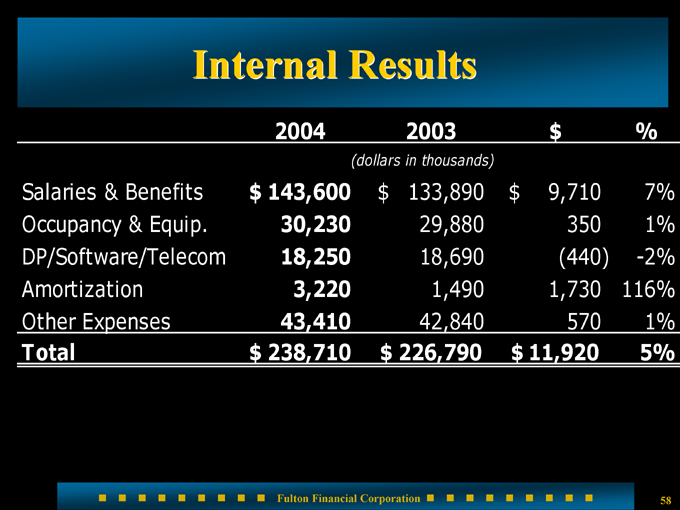
Internal Results
2004 2003 $ %
(dollars in thousands)
Salaries & Benefits $143,600 $133,890 $9,710 7%
Occupancy & Equip. 30,230 29,880 350 1%
DP/Software/Telecom 18,250 18,690 (440) -2%
Amortization 3,220 1,490 1,730 116%
Other Expenses 43,410 42,840 570 1%
Total $238,710 $226,790 $11,920 5%
58
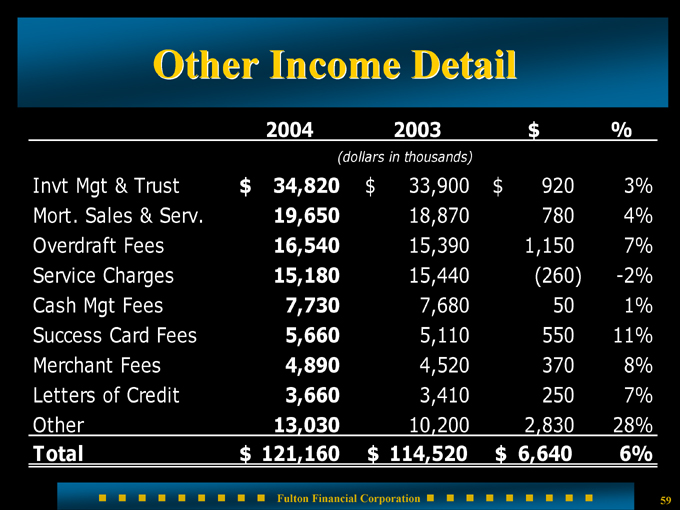
Other Income Detail
2004 2003 $ %
(dollars in thousands)
Invt Mgt & Trust $34,820 $33,900 $920 3%
Mort. Sales & Serv. 19,650 18,870 780 4%
Overdraft Fees 16,540 15,390 1,150 7%
Service Charges 15,180 15,440 (260) - -2%
Cash Mgt Fees 7,730 7,680 50 1%
Success Card Fees 5,660 5,110 550 11%
Merchant Fees 4,890 4,520 370 8%
Letters of Credit 3,660 3,410 250 7%
Other 13,030 10,200 2,830 28%
Total $121,160 $114,520 $6,640 6%
59
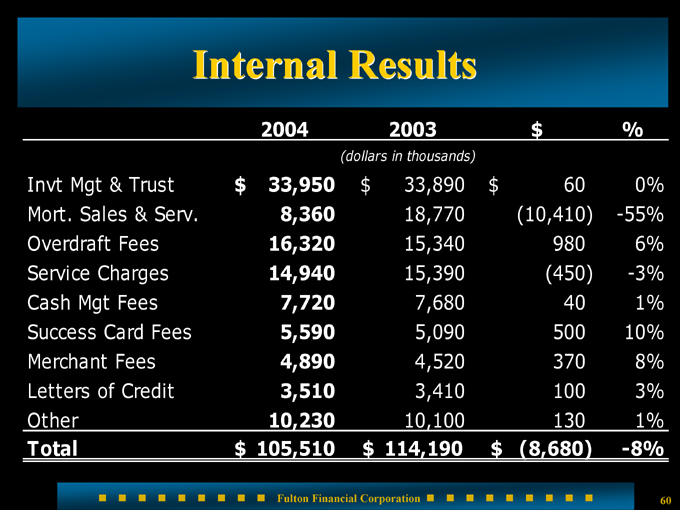
Internal Results
2004 2003 $ %
(dollars in thousands)
Invt Mgt & Trust $33,950 $33,890 $60 0%
Mort. Sales & Serv. 8,360 18,770 (10,410) -55%
Overdraft Fees 16,320 15,340 980 6%
Service Charges 14,940 15,390 (450) -3%
Cash Mgt Fees 7,720 7,680 40 1%
Success Card Fees 5,590 5,090 500 10%
Merchant Fees 4,890 4,520 370 8%
Letters of Credit 3,510 3,410 100 3%
Other 10,230 10,100 130 1%
Total $105,510 $114,190 $(8,680) -8%
60
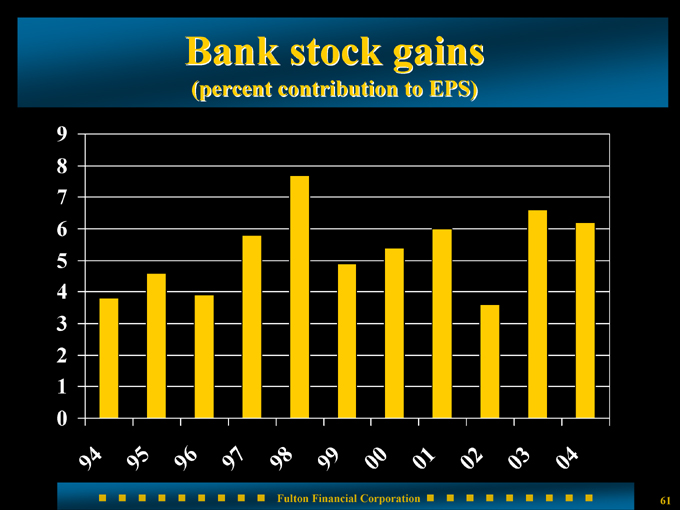
Bank stock gains
(percent contribution to EPS)
9 8 7 6 5 4 3 2 1 0
94 95 96 97 98 99 00 01 02 03 04
61
Looking ahead
Continued focus on:
Strong asset quality
Growth in net interest margin Growth in non-interest income Expansion of franchise geographically Increased loan activity Core deposit growth
62
Overview
Shareholders maximize shareholder value
Customers create financial success
Employees create career success
Communities create prosperity
63
Fulton Financial Corporation
One Penn Square Lancaster, PA 17602
www.fult.com
64